Adsorption of methylene blue dye from aqueous solution by sugar extracted spent rice biomass
9
Carbohydrate Polymers 90 (2012) 1314–1322 Contents lists available at SciVerse ScienceDirect Carbohydrate Polymers j ourna l ho me pag e: www.elsevier.com/locate/carbpol Adsorption of methylene blue dye from aqueous solution by sugar extracted spent rice biomass Muhammad Saif Ur Rehman, Ilgook Kim, Jong-In Han ∗ Department of Civil and Environmental Engineering, Korea Advanced Institute of Science and Technology, Daejeon 305-701, Republic of Korea a r t i c l e i n f o Article history: Received 15 February 2012 Received in revised form 15 June 2012 Accepted 27 June 2012 Available online 4 July 2012 Keywords: Adsorption Methylene blue Sugar extracted biomass a b s t r a c t This study was aimed at using sugar extracted spent rice biomass (SRB) as a potential adsorbent to remove methylene blue (MB) dye from aqueous solution. The SRB was used without any modification. A three factor full factorial experimental design (2 3 ) was employed to investigate the effect of factors (adsor- bent dose, dye concentration, temperature) and their interaction on the adsorption capacity and color removal. Two levels for each factor were used; adsorbent dose (0.25–0.5 g/100 mL), dye concentration (25–50 mg/L), and temperature (25–45 ◦ C). Initial dye concentration and adsorbent dosage were found as significant factors for the adsorption of MB dye. Langmuir isotherm (R 2 > 0.998) best explained the equi- librium of MB adsorption on SRB with monolayer adsorption capacity of 8.13 mg/g. The pseudo-second order model (R 2 > 0.999) was best fitted to explain the adsorption kinetics. Thermodynamic investigation revealed that the adsorption process was spontaneous, endothermic, and was feasible to treat dyeing wastewater. © 2012 Elsevier Ltd. All rights reserved. 1. Introduction Global economy is confronted with the biggest challenges of energy insecurity and the consequences of environmental pollution. Lignocellulosic bioethanol (LCB) has emerged as an environment friendly and sustainable renewable fuel (Alvira, Tomás-Pejó, Ballesteros, & Negro, 2010). Besides its various advan- tages and cheap feedstock, the production of LCB is limited due to many technical and financial obstacles (Agbor, Cicek, Sparling, Berlin, & Levin, 2011; Lynd et al., 2008). The extraction of fer- mentable sugars from lignocellulosic biomass is hindered by its recalcitrant structure and the arrangement of polysaccharides (Geddes, Nieves, & Ingram, 2011). Several pretreatment techniques have been investigated to extract reducing sugars to be fermented into bioethanol. These pretreatments disrupt the biomass structure and make polysaccharides accessible for the subsequent hydrolysis step (Alvira et al., 2010). A substantial amount of biomass, however, is produced as waste after sugar extraction and/or fermentation. These biomass wastes require additional cost for their appropriate disposal. This disposal poses an additional financial liability for LCB industry which already faces market competitiveness against cheap fossil fuels. Thus, it is extremely important for any LCB facility to find out some economical and viable alternatives for the disposal of residual waste. ∗ Corresponding author. Tel.: +82 42 350 3629; fax: +82 42 350 3610. E-mail address: [email protected] (J.-I. Han). Wastewater treatment is a costly yet important task for pro- cess industries due to the straighten regulations in most of the countries. Various process industries use more than 10,000 syn- thetic dyes for different kind of applications (Ahmad & Rahman, 2011). These industries generate a huge volume of colored efflu- ent carrying residual dyes which cannot be released without prior treatment due to its toxicity (Deng, Lu, Li, Zhang, & Wang, 2011). Several treatment approaches involving biological, physio- chemical, membrane filtration, and advanced oxidation (Ma et al., 2011; Madaeni, Jamali, & Islami, 2011; Verma, Dash, & Bhunia, 2012; Whang, Hsieh, & Chen, 2012) have been investigated to treat dye containing wastewater. However, performance of these treatments is constrained due to their operations, cost and pro- duction of sludge (Al-Anber, Al-Anber, Matouq, Al-Ayed, & Omari, 2011). Adsorption process has emerged as a feasible alternative for the treatment of such colored wastewater due to its simplic- ity and performance (Asgher & Bhatti, 2012; Mona, Kaushik, & Kaushik, 2011). Different kinds of adsorbents have already been investigated for their application in colored wastewater treatment. Activated carbon, derived from various renewable and nonrenew- able resources, has been found the most successful material for this task (Pavan, Lima, Dias, & Mazzocato, 2008). Although commercial activated carbon is highly efficient yet it is an expensive technol- ogy. Thus, a lot of studies have been carried out to search for low cost adsorbents especially renewable biomass (Ahmed & Dhedan, 2012; Dutta, Bhattacharyya, Ganguly, Gupta, & Basu, 2011). Ligno- cellulosic biomass is a cheap and frequently available adsorbent; however, it inherits low efficiency when used without any 0144-8617/$ – see front matter © 2012 Elsevier Ltd. All rights reserved. http://dx.doi.org/10.1016/j.carbpol.2012.06.078
Transcript of Adsorption of methylene blue dye from aqueous solution by sugar extracted spent rice biomass
As
MD
a
ARRAA
KAMS
1
opeTttBmr(hiasiTdiffio
0h
Carbohydrate Polymers 90 (2012) 1314– 1322
Contents lists available at SciVerse ScienceDirect
Carbohydrate Polymers
j ourna l ho me pag e: www.elsev ier .com/ locate /carbpol
dsorption of methylene blue dye from aqueous solution by sugar extractedpent rice biomass
uhammad Saif Ur Rehman, Ilgook Kim, Jong-In Han ∗
epartment of Civil and Environmental Engineering, Korea Advanced Institute of Science and Technology, Daejeon 305-701, Republic of Korea
r t i c l e i n f o
rticle history:eceived 15 February 2012eceived in revised form 15 June 2012ccepted 27 June 2012vailable online 4 July 2012
a b s t r a c t
This study was aimed at using sugar extracted spent rice biomass (SRB) as a potential adsorbent to removemethylene blue (MB) dye from aqueous solution. The SRB was used without any modification. A threefactor full factorial experimental design (23) was employed to investigate the effect of factors (adsor-bent dose, dye concentration, temperature) and their interaction on the adsorption capacity and colorremoval. Two levels for each factor were used; adsorbent dose (0.25–0.5 g/100 mL), dye concentration
◦
eywords:dsorptionethylene blueugar extracted biomass
(25–50 mg/L), and temperature (25–45 C). Initial dye concentration and adsorbent dosage were found assignificant factors for the adsorption of MB dye. Langmuir isotherm (R2 > 0.998) best explained the equi-librium of MB adsorption on SRB with monolayer adsorption capacity of 8.13 mg/g. The pseudo-secondorder model (R2 > 0.999) was best fitted to explain the adsorption kinetics. Thermodynamic investigationrevealed that the adsorption process was spontaneous, endothermic, and was feasible to treat dyeingwastewater.
. Introduction
Global economy is confronted with the biggest challengesf energy insecurity and the consequences of environmentalollution. Lignocellulosic bioethanol (LCB) has emerged as annvironment friendly and sustainable renewable fuel (Alvira,omás-Pejó, Ballesteros, & Negro, 2010). Besides its various advan-ages and cheap feedstock, the production of LCB is limited dueo many technical and financial obstacles (Agbor, Cicek, Sparling,erlin, & Levin, 2011; Lynd et al., 2008). The extraction of fer-entable sugars from lignocellulosic biomass is hindered by its
ecalcitrant structure and the arrangement of polysaccharidesGeddes, Nieves, & Ingram, 2011). Several pretreatment techniquesave been investigated to extract reducing sugars to be fermented
nto bioethanol. These pretreatments disrupt the biomass structurend make polysaccharides accessible for the subsequent hydrolysistep (Alvira et al., 2010). A substantial amount of biomass, however,s produced as waste after sugar extraction and/or fermentation.hese biomass wastes require additional cost for their appropriateisposal. This disposal poses an additional financial liability for LCB
ndustry which already faces market competitiveness against cheap
ossil fuels. Thus, it is extremely important for any LCB facility tond out some economical and viable alternatives for the disposalf residual waste.∗ Corresponding author. Tel.: +82 42 350 3629; fax: +82 42 350 3610.E-mail address: [email protected] (J.-I. Han).
144-8617/$ – see front matter © 2012 Elsevier Ltd. All rights reserved.ttp://dx.doi.org/10.1016/j.carbpol.2012.06.078
© 2012 Elsevier Ltd. All rights reserved.
Wastewater treatment is a costly yet important task for pro-cess industries due to the straighten regulations in most of thecountries. Various process industries use more than 10,000 syn-thetic dyes for different kind of applications (Ahmad & Rahman,2011). These industries generate a huge volume of colored efflu-ent carrying residual dyes which cannot be released withoutprior treatment due to its toxicity (Deng, Lu, Li, Zhang, & Wang,2011). Several treatment approaches involving biological, physio-chemical, membrane filtration, and advanced oxidation (Ma et al.,2011; Madaeni, Jamali, & Islami, 2011; Verma, Dash, & Bhunia,2012; Whang, Hsieh, & Chen, 2012) have been investigated totreat dye containing wastewater. However, performance of thesetreatments is constrained due to their operations, cost and pro-duction of sludge (Al-Anber, Al-Anber, Matouq, Al-Ayed, & Omari,2011). Adsorption process has emerged as a feasible alternativefor the treatment of such colored wastewater due to its simplic-ity and performance (Asgher & Bhatti, 2012; Mona, Kaushik, &Kaushik, 2011). Different kinds of adsorbents have already beeninvestigated for their application in colored wastewater treatment.Activated carbon, derived from various renewable and nonrenew-able resources, has been found the most successful material for thistask (Pavan, Lima, Dias, & Mazzocato, 2008). Although commercialactivated carbon is highly efficient yet it is an expensive technol-ogy. Thus, a lot of studies have been carried out to search for low
cost adsorbents especially renewable biomass (Ahmed & Dhedan,2012; Dutta, Bhattacharyya, Ganguly, Gupta, & Basu, 2011). Ligno-cellulosic biomass is a cheap and frequently available adsorbent;however, it inherits low efficiency when used without any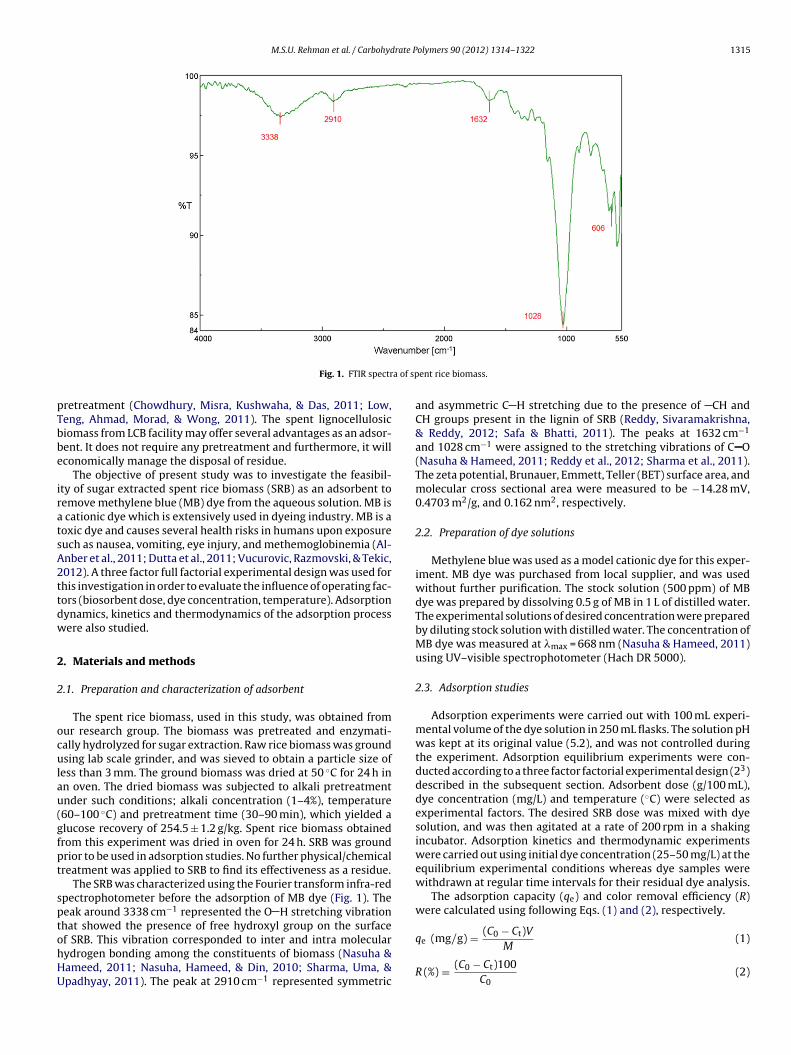
M.S.U. Rehman et al. / Carbohydrate Polymers 90 (2012) 1314– 1322 1315
a of sp
pTbbe
iratsA2ttdw
2
2
oculau(gfpt
sptohHU
Fig. 1. FTIR spectr
retreatment (Chowdhury, Misra, Kushwaha, & Das, 2011; Low,eng, Ahmad, Morad, & Wong, 2011). The spent lignocellulosiciomass from LCB facility may offer several advantages as an adsor-ent. It does not require any pretreatment and furthermore, it willconomically manage the disposal of residue.
The objective of present study was to investigate the feasibil-ty of sugar extracted spent rice biomass (SRB) as an adsorbent toemove methylene blue (MB) dye from the aqueous solution. MB is
cationic dye which is extensively used in dyeing industry. MB is aoxic dye and causes several health risks in humans upon exposureuch as nausea, vomiting, eye injury, and methemoglobinemia (Al-nber et al., 2011; Dutta et al., 2011; Vucurovic, Razmovski, & Tekic,012). A three factor full factorial experimental design was used forhis investigation in order to evaluate the influence of operating fac-ors (biosorbent dose, dye concentration, temperature). Adsorptionynamics, kinetics and thermodynamics of the adsorption processere also studied.
. Materials and methods
.1. Preparation and characterization of adsorbent
The spent rice biomass, used in this study, was obtained fromur research group. The biomass was pretreated and enzymati-ally hydrolyzed for sugar extraction. Raw rice biomass was groundsing lab scale grinder, and was sieved to obtain a particle size of
ess than 3 mm. The ground biomass was dried at 50 ◦C for 24 h inn oven. The dried biomass was subjected to alkali pretreatmentnder such conditions; alkali concentration (1–4%), temperature60–100 ◦C) and pretreatment time (30–90 min), which yielded alucose recovery of 254.5 ± 1.2 g/kg. Spent rice biomass obtainedrom this experiment was dried in oven for 24 h. SRB was groundrior to be used in adsorption studies. No further physical/chemicalreatment was applied to SRB to find its effectiveness as a residue.
The SRB was characterized using the Fourier transform infra-redpectrophotometer before the adsorption of MB dye (Fig. 1). Theeak around 3338 cm−1 represented the O H stretching vibrationhat showed the presence of free hydroxyl group on the surface
f SRB. This vibration corresponded to inter and intra molecularydrogen bonding among the constituents of biomass (Nasuha &ameed, 2011; Nasuha, Hameed, & Din, 2010; Sharma, Uma, &padhyay, 2011). The peak at 2910 cm−1 represented symmetricent rice biomass.
and asymmetric C H stretching due to the presence of CH andCH groups present in the lignin of SRB (Reddy, Sivaramakrishna,& Reddy, 2012; Safa & Bhatti, 2011). The peaks at 1632 cm−1
and 1028 cm−1 were assigned to the stretching vibrations of C O(Nasuha & Hameed, 2011; Reddy et al., 2012; Sharma et al., 2011).The zeta potential, Brunauer, Emmett, Teller (BET) surface area, andmolecular cross sectional area were measured to be −14.28 mV,0.4703 m2/g, and 0.162 nm2, respectively.
2.2. Preparation of dye solutions
Methylene blue was used as a model cationic dye for this exper-iment. MB dye was purchased from local supplier, and was usedwithout further purification. The stock solution (500 ppm) of MBdye was prepared by dissolving 0.5 g of MB in 1 L of distilled water.The experimental solutions of desired concentration were preparedby diluting stock solution with distilled water. The concentration ofMB dye was measured at �max = 668 nm (Nasuha & Hameed, 2011)using UV–visible spectrophotometer (Hach DR 5000).
2.3. Adsorption studies
Adsorption experiments were carried out with 100 mL experi-mental volume of the dye solution in 250 mL flasks. The solution pHwas kept at its original value (5.2), and was not controlled duringthe experiment. Adsorption equilibrium experiments were con-ducted according to a three factor factorial experimental design (23)described in the subsequent section. Adsorbent dose (g/100 mL),dye concentration (mg/L) and temperature (◦C) were selected asexperimental factors. The desired SRB dose was mixed with dyesolution, and was then agitated at a rate of 200 rpm in a shakingincubator. Adsorption kinetics and thermodynamic experimentswere carried out using initial dye concentration (25–50 mg/L) at theequilibrium experimental conditions whereas dye samples werewithdrawn at regular time intervals for their residual dye analysis.
The adsorption capacity (qe) and color removal efficiency (R)were calculated using following Eqs. (1) and (2), respectively.
qe (mg/g) = (C0 − Ct)VM
(1)
R (%) = (C0 − Ct)100C0
(2)
1316 M.S.U. Rehman et al. / Carbohydrate Polymers 90 (2012) 1314– 1322
Table 1Factorial design matrix for investigated factors with actual and predicted response values for adsorption capacity and color removal.
Coded factor Actual factor level qe (mg/g) qe pred R (%) Rpred
A B C Adsorbent dose (g/100 mL) Dye conc. (ppm) Temperature (◦C)
−1 1 −1 0.25 50 25 8.58 8.47 85.8 85.11 1 1 0.5 50 45 8.98 8.86 89.8 89.1
−1 −1 1 0.25 25 45 4.57 4.46 91.4 90.7−1 −1 −1 0.25 25 25 4.64 4.75 92.7 93.4
1 −1 −1 0.5 25 25 4.37 4.27 93.0 92.3
wds
2
ic(tepioUfi
Y
wevt2c
3
3
rglfftnTctfnaccsbTelc
−1 1 1 0.25 50
1 1 −1 0.5 50
1 −1 1 0.5 25
here C0 is the initial dye concentration (mg/L), Ct is the residualye concentration (mg/L) at time t, V is the volume (L) of aqueousolution, and M is the mass of the adsorbent (g).
.4. Experimental design and analysis
A two level (23) full factorial experimental design was employedn this work with three main factors; adsorbent dose (A), dyeoncentration (B) and temperature (C) as suggested in literatureAbdel-Ghani, Hegazy, El-Chaghaby, & Lima, 2009). The inves-igated factor levels are given in Table 1. The demarcation ofxperimental design space for each factor was fixed based upon ourrevious lab studies. The experimental design and statistical signif-
cance of investigated factors and their combinations were carriedut using Design Expert Trial (8.0.1.7, Stat-Ease Inc., Minneapolis,SA). A multiple regression analysis was conducted based on therst-order response function as given in Eq. (3):
= ˇ0 +∑
ˇiXi +∑
ˇiXiXj + ε (3)
here ˇ0, ˇi, ˇij are regression coefficients for the intercept, lin-ar and interactions among factors, respectively, y is the responseector for qe and R, whereas Xi and Xj are the independent fac-ors in coded units, and ε is the error term (Chang, Teng, & Ismail,011). The fitness of regression model was evaluated by calculatingoefficient of determination (R2).
. Results and discussion
.1. Screening factors for decolorization and adsorption
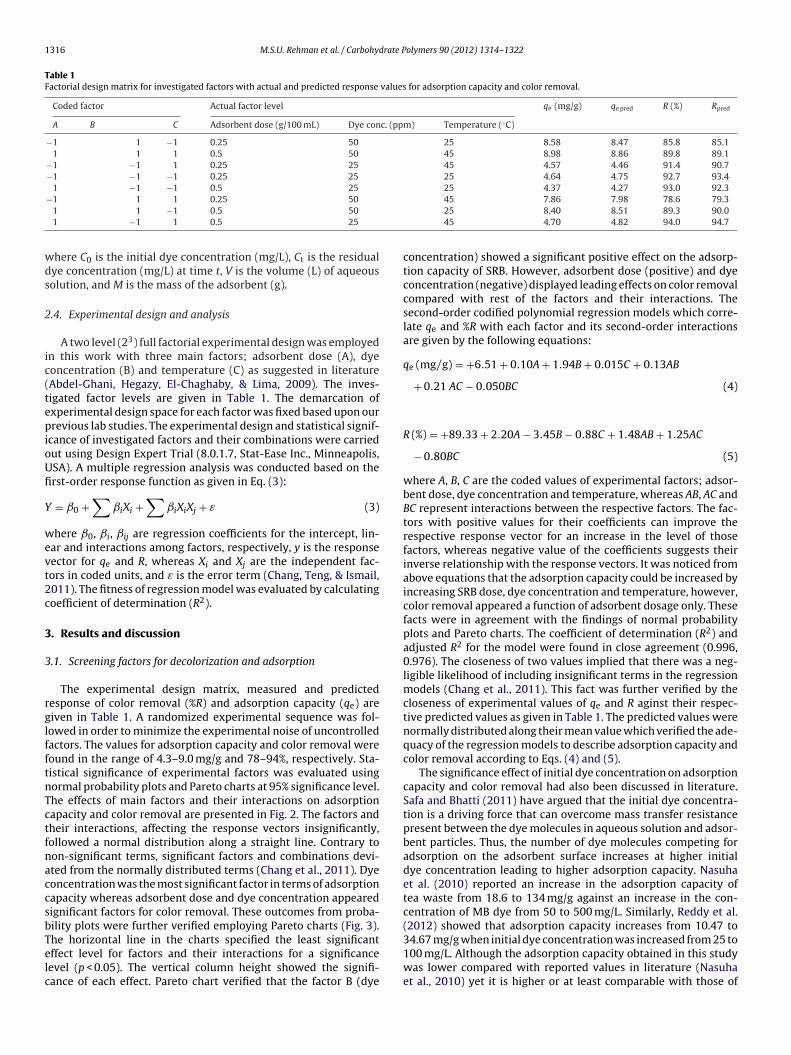
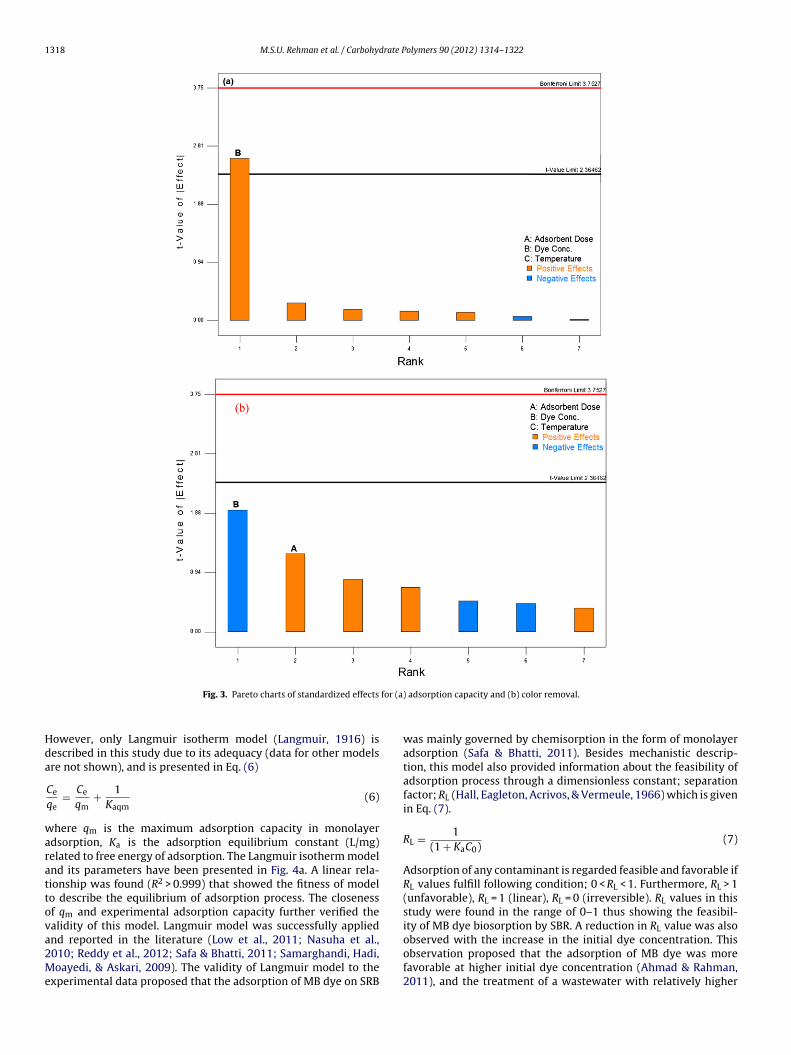
The experimental design matrix, measured and predictedesponse of color removal (%R) and adsorption capacity (qe) areiven in Table 1. A randomized experimental sequence was fol-owed in order to minimize the experimental noise of uncontrolledactors. The values for adsorption capacity and color removal wereound in the range of 4.3–9.0 mg/g and 78–94%, respectively. Sta-istical significance of experimental factors was evaluated usingormal probability plots and Pareto charts at 95% significance level.he effects of main factors and their interactions on adsorptionapacity and color removal are presented in Fig. 2. The factors andheir interactions, affecting the response vectors insignificantly,ollowed a normal distribution along a straight line. Contrary toon-significant terms, significant factors and combinations devi-ted from the normally distributed terms (Chang et al., 2011). Dyeoncentration was the most significant factor in terms of adsorptionapacity whereas adsorbent dose and dye concentration appearedignificant factors for color removal. These outcomes from proba-ility plots were further verified employing Pareto charts (Fig. 3).
he horizontal line in the charts specified the least significantffect level for factors and their interactions for a significanceevel (p < 0.05). The vertical column height showed the signifi-ance of each effect. Pareto chart verified that the factor B (dye45 7.86 7.98 78.6 79.325 8.40 8.51 89.3 90.045 4.70 4.82 94.0 94.7
concentration) showed a significant positive effect on the adsorp-tion capacity of SRB. However, adsorbent dose (positive) and dyeconcentration (negative) displayed leading effects on color removalcompared with rest of the factors and their interactions. Thesecond-order codified polynomial regression models which corre-late qe and %R with each factor and its second-order interactionsare given by the following equations:
qe (mg/g) = +6.51 + 0.10A + 1.94B + 0.015C + 0.13AB
+ 0.21 AC − 0.050BC (4)
R (%) = +89.33 + 2.20A − 3.45B − 0.88C + 1.48AB + 1.25AC
− 0.80BC (5)
where A, B, C are the coded values of experimental factors; adsor-bent dose, dye concentration and temperature, whereas AB, AC andBC represent interactions between the respective factors. The fac-tors with positive values for their coefficients can improve therespective response vector for an increase in the level of thosefactors, whereas negative value of the coefficients suggests theirinverse relationship with the response vectors. It was noticed fromabove equations that the adsorption capacity could be increased byincreasing SRB dose, dye concentration and temperature, however,color removal appeared a function of adsorbent dosage only. Thesefacts were in agreement with the findings of normal probabilityplots and Pareto charts. The coefficient of determination (R2) andadjusted R2 for the model were found in close agreement (0.996,0.976). The closeness of two values implied that there was a neg-ligible likelihood of including insignificant terms in the regressionmodels (Chang et al., 2011). This fact was further verified by thecloseness of experimental values of qe and R aginst their respec-tive predicted values as given in Table 1. The predicted values werenormally distributed along their mean value which verified the ade-quacy of the regression models to describe adsorption capacity andcolor removal according to Eqs. (4) and (5).
The significance effect of initial dye concentration on adsorptioncapacity and color removal had also been discussed in literature.Safa and Bhatti (2011) have argued that the initial dye concentra-tion is a driving force that can overcome mass transfer resistancepresent between the dye molecules in aqueous solution and adsor-bent particles. Thus, the number of dye molecules competing foradsorption on the adsorbent surface increases at higher initialdye concentration leading to higher adsorption capacity. Nasuhaet al. (2010) reported an increase in the adsorption capacity oftea waste from 18.6 to 134 mg/g against an increase in the con-centration of MB dye from 50 to 500 mg/L. Similarly, Reddy et al.(2012) showed that adsorption capacity increases from 10.47 to
34.67 mg/g when initial dye concentration was increased from 25 to100 mg/L. Although the adsorption capacity obtained in this studywas lower compared with reported values in literature (Nasuhaet al., 2010) yet it is higher or at least comparable with those of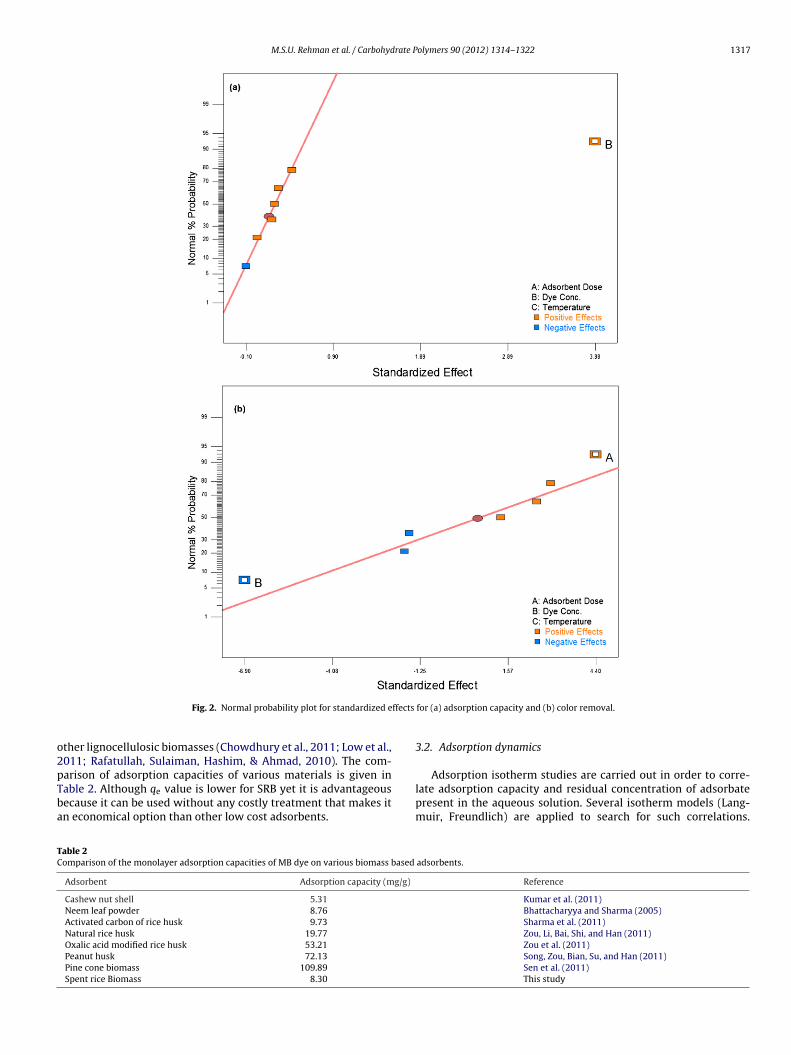
M.S.U. Rehman et al. / Carbohydrate Polymers 90 (2012) 1314– 1322 1317
ffects
o2pTba
TC
Fig. 2. Normal probability plot for standardized e
ther lignocellulosic biomasses (Chowdhury et al., 2011; Low et al.,011; Rafatullah, Sulaiman, Hashim, & Ahmad, 2010). The com-
arison of adsorption capacities of various materials is given inable 2. Although qe value is lower for SRB yet it is advantageousecause it can be used without any costly treatment that makes itn economical option than other low cost adsorbents.able 2omparison of the monolayer adsorption capacities of MB dye on various biomass based
Adsorbent Adsorption capacity (mg/g)
Cashew nut shell 5.31
Neem leaf powder 8.76
Activated carbon of rice husk 9.73
Natural rice husk 19.77
Oxalic acid modified rice husk 53.21
Peanut husk 72.13
Pine cone biomass 109.89
Spent rice Biomass 8.30
for (a) adsorption capacity and (b) color removal.
3.2. Adsorption dynamics
Adsorption isotherm studies are carried out in order to corre-late adsorption capacity and residual concentration of adsorbatepresent in the aqueous solution. Several isotherm models (Lang-muir, Freundlich) are applied to search for such correlations.
adsorbents.
Reference
Kumar et al. (2011)Bhattacharyya and Sharma (2005)Sharma et al. (2011)Zou, Li, Bai, Shi, and Han (2011)Zou et al. (2011)Song, Zou, Bian, Su, and Han (2011)Sen et al. (2011)This study
1318 M.S.U. Rehman et al. / Carbohydrate Polymers 90 (2012) 1314– 1322
for (a)
Hda
warattova2Me
Fig. 3. Pareto charts of standardized effects
owever, only Langmuir isotherm model (Langmuir, 1916) isescribed in this study due to its adequacy (data for other modelsre not shown), and is presented in Eq. (6)
Ce
qe= Ce
qm+ 1
Kaqm(6)
here qm is the maximum adsorption capacity in monolayerdsorption, Ka is the adsorption equilibrium constant (L/mg)elated to free energy of adsorption. The Langmuir isotherm modelnd its parameters have been presented in Fig. 4a. A linear rela-ionship was found (R2 > 0.999) that showed the fitness of modelo describe the equilibrium of adsorption process. The closenessf qm and experimental adsorption capacity further verified thealidity of this model. Langmuir model was successfully applied
nd reported in the literature (Low et al., 2011; Nasuha et al.,010; Reddy et al., 2012; Safa & Bhatti, 2011; Samarghandi, Hadi,oayedi, & Askari, 2009). The validity of Langmuir model to thexperimental data proposed that the adsorption of MB dye on SRB
adsorption capacity and (b) color removal.
was mainly governed by chemisorption in the form of monolayeradsorption (Safa & Bhatti, 2011). Besides mechanistic descrip-tion, this model also provided information about the feasibility ofadsorption process through a dimensionless constant; separationfactor; RL (Hall, Eagleton, Acrivos, & Vermeule, 1966) which is givenin Eq. (7).
RL = 1(1 + KaC0)
(7)
Adsorption of any contaminant is regarded feasible and favorable ifRL values fulfill following condition; 0 < RL < 1. Furthermore, RL > 1(unfavorable), RL = 1 (linear), RL = 0 (irreversible). RL values in thisstudy were found in the range of 0–1 thus showing the feasibil-ity of MB dye biosorption by SBR. A reduction in RL value was also
observed with the increase in the initial dye concentration. Thisobservation proposed that the adsorption of MB dye was morefavorable at higher initial dye concentration (Ahmad & Rahman,2011), and the treatment of a wastewater with relatively higher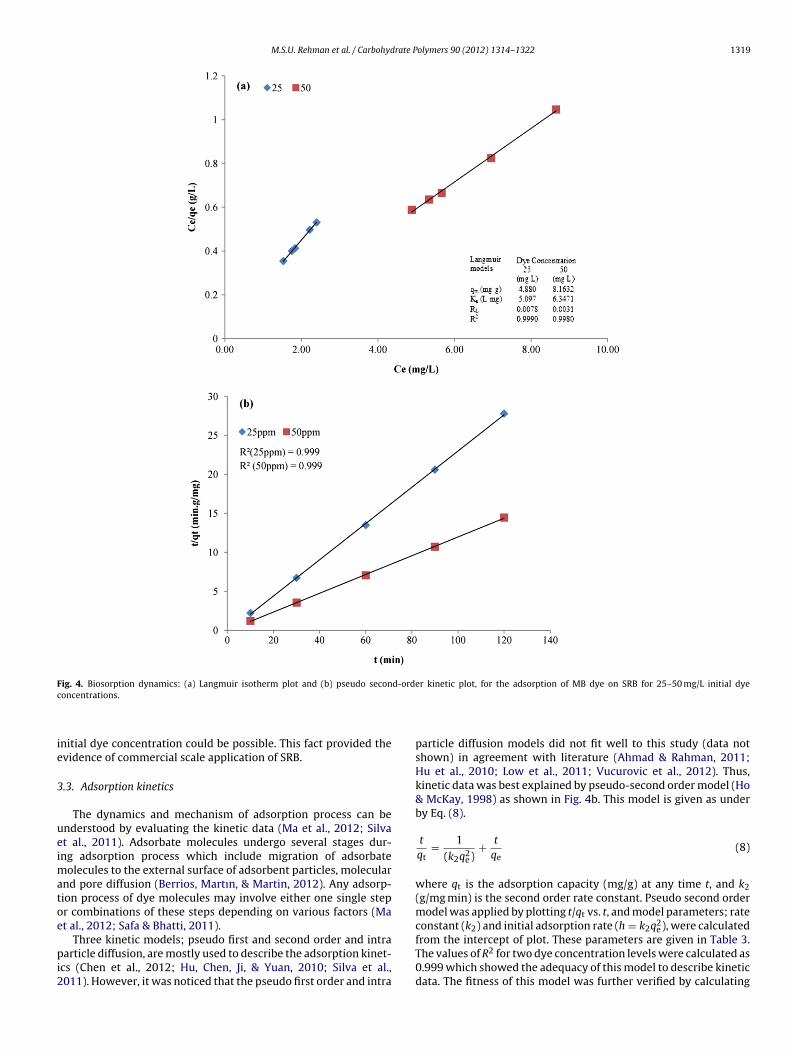
M.S.U. Rehman et al. / Carbohydrate Polymers 90 (2012) 1314– 1322 1319
Fig. 4. Biosorption dynamics: (a) Langmuir isotherm plot and (b) pseudo second-order kinetic plot, for the adsorption of MB dye on SRB for 25–50 mg/L initial dyec
ie
3
ueimatoe
pi2
oncentrations.
nitial dye concentration could be possible. This fact provided thevidence of commercial scale application of SRB.
.3. Adsorption kinetics
The dynamics and mechanism of adsorption process can benderstood by evaluating the kinetic data (Ma et al., 2012; Silvat al., 2011). Adsorbate molecules undergo several stages dur-ng adsorption process which include migration of adsorbate
olecules to the external surface of adsorbent particles, molecularnd pore diffusion (Berrios, Martın, & Martin, 2012). Any adsorp-ion process of dye molecules may involve either one single stepr combinations of these steps depending on various factors (Mat al., 2012; Safa & Bhatti, 2011).
Three kinetic models; pseudo first and second order and intraarticle diffusion, are mostly used to describe the adsorption kinet-
cs (Chen et al., 2012; Hu, Chen, Ji, & Yuan, 2010; Silva et al.,011). However, it was noticed that the pseudo first order and intra
particle diffusion models did not fit well to this study (data notshown) in agreement with literature (Ahmad & Rahman, 2011;Hu et al., 2010; Low et al., 2011; Vucurovic et al., 2012). Thus,kinetic data was best explained by pseudo-second order model (Ho& McKay, 1998) as shown in Fig. 4b. This model is given as underby Eq. (8).
t
qt= 1
(k2q2e)
+ t
qe(8)
where qt is the adsorption capacity (mg/g) at any time t, and k2(g/mg min) is the second order rate constant. Pseudo second ordermodel was applied by plotting t/qt vs. t, and model parameters; rateconstant (k2) and initial adsorption rate (h = k2q2
e), were calculated
from the intercept of plot. These parameters are given in Table 3.The values of R2 for two dye concentration levels were calculated as0.999 which showed the adequacy of this model to describe kineticdata. The fitness of this model was further verified by calculating
1320 M.S.U. Rehman et al. / Carbohydrate Polymers 90 (2012) 1314– 1322
Table 3Pseudo second order kinetic parameters for the biosorption of MB dye onto spentrice biomass.
Dye conc qexp qe calc k2 h (mg/g min) R2 �q (%)
n&
�
wuRBp&&vaiim
q
w(imtpb(artp(ibH2
3
t2es(
�
l
wtConwPow
25 4.32 4.30 0.218 16.83 0.999 3.650 8.30 8.31 0.244 4.04 0.999 1.5
ormalized standard deviation (�q), as used in literature (Nasuha Hameed, 2011; Nasuha et al., 2010) given in Eq. (9).
q (%) =√∑
[(qt, exp −qt, calc)/qt, exp]2
n − 1× 100 (9)
here qt,exp and qt,calc represent experimental and calculated val-es of q and n is the total number of data points. Higher values of2 and lower values of �q suggested the fitness of kinetic model.oth the parameters (R2 = 0.999, �q < 3.6%) exhibited the validity ofseudo second order model for the adsorption of MB dye (Nasuha
Hameed, 2011; Zhang et al., 2011; Dural, Cavas, Papageorgiou, Katsaros, 2011). Vucurovic et al. (2012) have reported that thealidity of pseudo second order model suggests chemisorptions the rate controlling step. Besides pseudo second order model,ntra particle diffusion model (Weber & Morris, 1963) was alsonvestigated (data not shown) to search for possible adsorption
echanism. The model is given as under
t = Kpit1/2 + Ci (10)
here qt (mg/g) is the adsorption capacity at any time t, Kpi
mg/g min1/2) is the intra-particle diffusion rate constant, and Cis the boundary layer thickness. The plot for intra particle diffusion
odel did not pass through the origin implying that the intra par-icle diffusion was not the rate controlling factor. Although intraarticle diffusion model was not fitted well to the kinetic dataut it followed two distinct linear trends as reported in literatureMa et al., 2012). These two trends described two possible mech-nistic phases of adsorption process. The first phase representedapid adsorption due to the mass transfer from the MB dye solu-ion to the external surface of SRB. Rapid adsorption during firsthase was followed by a slower phase of intra-particle diffusionVadivelan & Kumar, 2005). Thus, combination of mechanisms wasnvolved in the adsorption of MB dye on SRB. Similar results haveeen reported in the literature (Gusmão, Gurgel, Melo, & Gil, 2012;ameed, Mahmoud, & Ahmad, 2008; Ma et al., 2012; Safa & Bhatti,011; Vadivelan & Kumar, 2005; Vucurovic et al., 2012).
.4. Adsorption thermodynamics
Temperature presents a notable effect on the adsorption processhat is explained by means of thermodynamic parameters (Hu et al.,010). Thermodynamic parameters such as change in standard freenergy (�G◦), change in standard enthalpy (�H◦), and change intandard entropy (�S◦), are calculated using following equationsSmith and Van Ness, 1987).
G◦ = �H◦ − T�S◦ (11)
n KD = −�H◦
RT+ �S◦
R(12)
here R is the ideal gas constant (8.314 J/mol K), T is the absoluteemperature in Kelvin, KD = Cs/Ce, is the distribution coefficient, ands (mg/L) is the equilibrium concentration of MB dye adsorbedn cattail biomass (Hu et al., 2010). The overall �G◦ values wereegative (−1314, −1508 J/mol) for temperature levels of 25–50 ◦C
hich established that the biosorption process was spontaneous.ositive value of �H◦ (1568 J/mol) indicated endothermic naturef the biosorption process (Nasuha & Hameed, 2011). This factas confirmed by the removal higher dye concentration from
Fig. 5. SEM micrograph of (a) raw rice biomass, (b) sugar extracted rice biomass and(c) MB dye loaded SRB.
the aqueous phase (>45 mg/L) at 45 ◦C. The positive value of �S◦
(9.67 J/mol k) exhibited an increase in the randomness at dye–SRBinterface which could possibly remove some of the adsorbed watermolecules from the rice biomass surface (Malkoc & Nuhoglu, 2007)
leading to higher dye removal. Similar finding has been reportedby Safa and Bhatti (2011) and Nasuha and Hameed (2011) whereMB dye was adsorbed on rice husk and tea waste, respectively.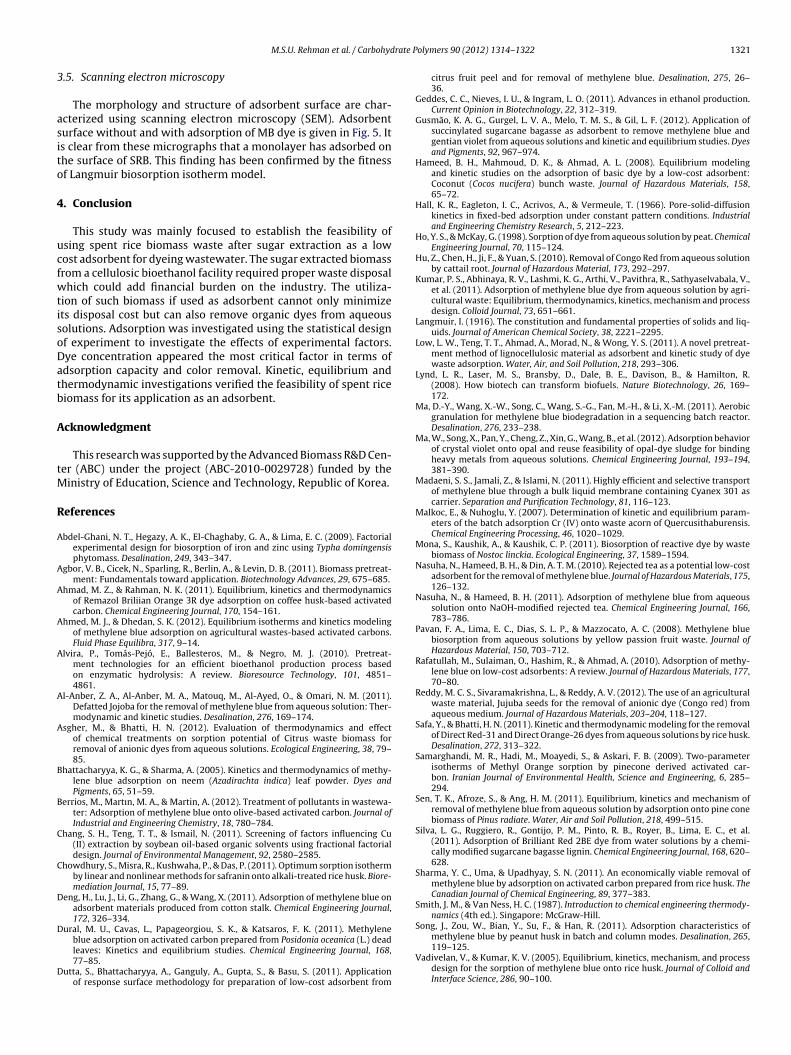
rate P
3
asito
4
ucfwtisoDatb
A
tM
R
A
A
A
A
A
A
A
B
B
C
C
D
D
D
M.S.U. Rehman et al. / Carbohyd
.5. Scanning electron microscopy
The morphology and structure of adsorbent surface are char-cterized using scanning electron microscopy (SEM). Adsorbenturface without and with adsorption of MB dye is given in Fig. 5. Its clear from these micrographs that a monolayer has adsorbed onhe surface of SRB. This finding has been confirmed by the fitnessf Langmuir biosorption isotherm model.
. Conclusion
This study was mainly focused to establish the feasibility ofsing spent rice biomass waste after sugar extraction as a lowost adsorbent for dyeing wastewater. The sugar extracted biomassrom a cellulosic bioethanol facility required proper waste disposalhich could add financial burden on the industry. The utiliza-
ion of such biomass if used as adsorbent cannot only minimizets disposal cost but can also remove organic dyes from aqueousolutions. Adsorption was investigated using the statistical designf experiment to investigate the effects of experimental factors.ye concentration appeared the most critical factor in terms ofdsorption capacity and color removal. Kinetic, equilibrium andhermodynamic investigations verified the feasibility of spent riceiomass for its application as an adsorbent.
cknowledgment
This research was supported by the Advanced Biomass R&D Cen-er (ABC) under the project (ABC-2010-0029728) funded by the
inistry of Education, Science and Technology, Republic of Korea.
eferences
bdel-Ghani, N. T., Hegazy, A. K., El-Chaghaby, G. A., & Lima, E. C. (2009). Factorialexperimental design for biosorption of iron and zinc using Typha domingensisphytomass. Desalination, 249, 343–347.
gbor, V. B., Cicek, N., Sparling, R., Berlin, A., & Levin, D. B. (2011). Biomass pretreat-ment: Fundamentals toward application. Biotechnology Advances, 29, 675–685.
hmad, M. Z., & Rahman, N. K. (2011). Equilibrium, kinetics and thermodynamicsof Remazol Briliian Orange 3R dye adsorption on coffee husk-based activatedcarbon. Chemical Engineering Journal, 170, 154–161.
hmed, M. J., & Dhedan, S. K. (2012). Equilibrium isotherms and kinetics modelingof methylene blue adsorption on agricultural wastes-based activated carbons.Fluid Phase Equilibra, 317, 9–14.
lvira, P., Tomás-Pejó, E., Ballesteros, M., & Negro, M. J. (2010). Pretreat-ment technologies for an efficient bioethanol production process basedon enzymatic hydrolysis: A review. Bioresource Technology, 101, 4851–4861.
l-Anber, Z. A., Al-Anber, M. A., Matouq, M., Al-Ayed, O., & Omari, N. M. (2011).Defatted Jojoba for the removal of methylene blue from aqueous solution: Ther-modynamic and kinetic studies. Desalination, 276, 169–174.
sgher, M., & Bhatti, H. N. (2012). Evaluation of thermodynamics and effectof chemical treatments on sorption potential of Citrus waste biomass forremoval of anionic dyes from aqueous solutions. Ecological Engineering, 38, 79–85.
hattacharyya, K. G., & Sharma, A. (2005). Kinetics and thermodynamics of methy-lene blue adsorption on neem (Azadirachta indica) leaf powder. Dyes andPigments, 65, 51–59.
errios, M., Martın, M. A., & Martin, A. (2012). Treatment of pollutants in wastewa-ter: Adsorption of methylene blue onto olive-based activated carbon. Journal ofIndustrial and Engineering Chemistry, 18, 780–784.
hang, S. H., Teng, T. T., & Ismail, N. (2011). Screening of factors influencing Cu(II) extraction by soybean oil-based organic solvents using fractional factorialdesign. Journal of Environmental Management, 92, 2580–2585.
howdhury, S., Misra, R., Kushwaha, P., & Das, P. (2011). Optimum sorption isothermby linear and nonlinear methods for safranin onto alkali-treated rice husk. Biore-mediation Journal, 15, 77–89.
eng, H., Lu, J., Li, G., Zhang, G., & Wang, X. (2011). Adsorption of methylene blue onadsorbent materials produced from cotton stalk. Chemical Engineering Journal,172, 326–334.
ural, M. U., Cavas, L., Papageorgiou, S. K., & Katsaros, F. K. (2011). Methylene
blue adsorption on activated carbon prepared from Posidonia oceanica (L.) deadleaves: Kinetics and equilibrium studies. Chemical Engineering Journal, 168,77–85.utta, S., Bhattacharyya, A., Ganguly, A., Gupta, S., & Basu, S. (2011). Applicationof response surface methodology for preparation of low-cost adsorbent from
olymers 90 (2012) 1314– 1322 1321
citrus fruit peel and for removal of methylene blue. Desalination, 275, 26–36.
Geddes, C. C., Nieves, I. U., & Ingram, L. O. (2011). Advances in ethanol production.Current Opinion in Biotechnology, 22, 312–319.
Gusmão, K. A. G., Gurgel, L. V. A., Melo, T. M. S., & Gil, L. F. (2012). Application ofsuccinylated sugarcane bagasse as adsorbent to remove methylene blue andgentian violet from aqueous solutions and kinetic and equilibrium studies. Dyesand Pigments, 92, 967–974.
Hameed, B. H., Mahmoud, D. K., & Ahmad, A. L. (2008). Equilibrium modelingand kinetic studies on the adsorption of basic dye by a low-cost adsorbent:Coconut (Cocos nucifera) bunch waste. Journal of Hazardous Materials, 158,65–72.
Hall, K. R., Eagleton, I. C., Acrivos, A., & Vermeule, T. (1966). Pore-solid-diffusionkinetics in fixed-bed adsorption under constant pattern conditions. Industrialand Engineering Chemistry Research, 5, 212–223.
Ho, Y. S., & McKay, G. (1998). Sorption of dye from aqueous solution by peat. ChemicalEngineering Journal, 70, 115–124.
Hu, Z., Chen, H., Ji, F., & Yuan, S. (2010). Removal of Congo Red from aqueous solutionby cattail root. Journal of Hazardous Material, 173, 292–297.
Kumar, P. S., Abhinaya, R. V., Lashmi, K. G., Arthi, V., Pavithra, R., Sathyaselvabala, V.,et al. (2011). Adsorption of methylene blue dye from aqueous solution by agri-cultural waste: Equilibrium, thermodynamics, kinetics, mechanism and processdesign. Colloid Journal, 73, 651–661.
Langmuir, I. (1916). The constitution and fundamental properties of solids and liq-uids. Journal of American Chemical Society, 38, 2221–2295.
Low, L. W., Teng, T. T., Ahmad, A., Morad, N., & Wong, Y. S. (2011). A novel pretreat-ment method of lignocellulosic material as adsorbent and kinetic study of dyewaste adsorption. Water, Air, and Soil Pollution, 218, 293–306.
Lynd, L. R., Laser, M. S., Bransby, D., Dale, B. E., Davison, B., & Hamilton, R.(2008). How biotech can transform biofuels. Nature Biotechnology, 26, 169–172.
Ma, D.-Y., Wang, X.-W., Song, C., Wang, S.-G., Fan, M.-H., & Li, X.-M. (2011). Aerobicgranulation for methylene blue biodegradation in a sequencing batch reactor.Desalination, 276, 233–238.
Ma, W., Song, X., Pan, Y., Cheng, Z., Xin, G., Wang, B., et al. (2012). Adsorption behaviorof crystal violet onto opal and reuse feasibility of opal-dye sludge for bindingheavy metals from aqueous solutions. Chemical Engineering Journal, 193–194,381–390.
Madaeni, S. S., Jamali, Z., & Islami, N. (2011). Highly efficient and selective transportof methylene blue through a bulk liquid membrane containing Cyanex 301 ascarrier. Separation and Purification Technology, 81, 116–123.
Malkoc, E., & Nuhoglu, Y. (2007). Determination of kinetic and equilibrium param-eters of the batch adsorption Cr (IV) onto waste acorn of Quercusithaburensis.Chemical Engineering Processing, 46, 1020–1029.
Mona, S., Kaushik, A., & Kaushik, C. P. (2011). Biosorption of reactive dye by wastebiomass of Nostoc linckia. Ecological Engineering, 37, 1589–1594.
Nasuha, N., Hameed, B. H., & Din, A. T. M. (2010). Rejected tea as a potential low-costadsorbent for the removal of methylene blue. Journal of Hazardous Materials, 175,126–132.
Nasuha, N., & Hameed, B. H. (2011). Adsorption of methylene blue from aqueoussolution onto NaOH-modified rejected tea. Chemical Engineering Journal, 166,783–786.
Pavan, F. A., Lima, E. C., Dias, S. L. P., & Mazzocato, A. C. (2008). Methylene bluebiosorption from aqueous solutions by yellow passion fruit waste. Journal ofHazardous Material, 150, 703–712.
Rafatullah, M., Sulaiman, O., Hashim, R., & Ahmad, A. (2010). Adsorption of methy-lene blue on low-cost adsorbents: A review. Journal of Hazardous Materials, 177,70–80.
Reddy, M. C. S., Sivaramakrishna, L., & Reddy, A. V. (2012). The use of an agriculturalwaste material, Jujuba seeds for the removal of anionic dye (Congo red) fromaqueous medium. Journal of Hazardous Materials, 203–204, 118–127.
Safa, Y., & Bhatti, H. N. (2011). Kinetic and thermodynamic modeling for the removalof Direct Red-31 and Direct Orange-26 dyes from aqueous solutions by rice husk.Desalination, 272, 313–322.
Samarghandi, M. R., Hadi, M., Moayedi, S., & Askari, F. B. (2009). Two-parameterisotherms of Methyl Orange sorption by pinecone derived activated car-bon. Iranian Journal of Environmental Health, Science and Engineering, 6, 285–294.
Sen, T. K., Afroze, S., & Ang, H. M. (2011). Equilibrium, kinetics and mechanism ofremoval of methylene blue from aqueous solution by adsorption onto pine conebiomass of Pinus radiate. Water, Air and Soil Pollution, 218, 499–515.
Silva, L. G., Ruggiero, R., Gontijo, P. M., Pinto, R. B., Royer, B., Lima, E. C., et al.(2011). Adsorption of Brilliant Red 2BE dye from water solutions by a chemi-cally modified sugarcane bagasse lignin. Chemical Engineering Journal, 168, 620–628.
Sharma, Y. C., Uma, & Upadhyay, S. N. (2011). An economically viable removal ofmethylene blue by adsorption on activated carbon prepared from rice husk. TheCanadian Journal of Chemical Engineering, 89, 377–383.
Smith, J. M., & Van Ness, H. C. (1987). Introduction to chemical engineering thermody-namics (4th ed.). Singapore: McGraw-Hill.
Song, J., Zou, W., Bian, Y., Su, F., & Han, R. (2011). Adsorption characteristics of
methylene blue by peanut husk in batch and column modes. Desalination, 265,119–125.Vadivelan, V., & Kumar, K. V. (2005). Equilibrium, kinetics, mechanism, and processdesign for the sorption of methylene blue onto rice husk. Journal of Colloid andInterface Science, 286, 90–100.

1 rate P
V
V
W
322 M.S.U. Rehman et al. / Carbohyd
erma, A. K., Dash, R. R., & Bhunia, P. (2012). A review on chemical coagula-tion/flocculation technologies for removal of colour from textile wastewaters.Journal of Environmental Management, 93, 154–168.
ucurovic, V. M., Razmovski, R. N., & Tekic, M. N. (2012). Methylene blue
(cationic dye) adsorption onto sugar beet pulp: Equilibrium isotherm andkinetic studies. Journal of Taiwan Institute of Chemical Engineers, 43, 108–111.eber, W. J., & Morris, J. C. (1963). Kinetics of adsorption on carbon from solution.Journal of Sanitary Engineering Division, 89, 31–60.
olymers 90 (2012) 1314– 1322
Whang, T. J., Hsieh, M. T., & Chen, H. H. (2012). Visible-light photocatalytic degrada-tion of methylene blue with laser-induced Ag/ZnO nanoparticles. Applied SurfaceScience, 258, 2796–2801.
Zhang, W., Yan, H., Li, H., Jiang, Z., Dong, L., Kan, X., et al. (2011). Removal of dyes
from aqueous solutions by straw based adsorbents: Batch and column studies.Chemical Engineering Journal, 168, 1120–1127.Zou, W., Li, K., Bai, H., Shi, X., & Han, R. (2011). Enhanced cationic dyes removalfrom aqueous solution by oxalic acid modified rice husk. Journal of Chemical andEngineering Data, 56, 1882–1891.