Effective Utilization of Stabilized Spent Wash Bio-Compost for ...
8
Effective Utilization of Stabilized Spent Wash Bio-Compost for Tomato Crop and Comparison of its Yield with Commercial Composts A. S. Byakodi*† and B. T. Suresh Babu** *Research Centre, Department of Civil Engineering, Angadi Institute of Technology & Management, Belagavi, Karnataka, India **Department of Civil Engineering, Angadi Institute of Technology & Management, Belagavi, Karnataka, India †Corresponding author; A. S. Byakodi; [email protected] ABSTRACT India is an agro-based country and in the year 2020, about 1082 lakh hectares of agricultural land have been planted, in turn, consuming 3161 lakh tonnes of fertilizer annually. However, excessive fertilizer usage has a negative impact on the soil quality and is evident by the fact that the crop response ratio has decreased from 12.1 in the 1960s to 5.0 in the 2010s. Hence, organic compost can be used as an alternative to fertilizer, reducing its negative impact on soil quality. The present study is a part of a larger investigation and its scope is confined to the utilization of bio-composts for the growth of tomato crops. Additionally, a comparison of these bio-composts was carried out with commercial composts through assessment of yield and number of fruits. Seeds were sown on prepared land, germination was observed on the 7 th day, and saplings were produced on the 30 th day. The dosage of each compost was fixed at 60ml per plant and was applied on the 31 st and 51 st days of the study period. Commercial composts produced yields of 673 ± 32.01, 830 ± 32.19 and 1560 ± 77.62 g respectively, with 54 ± 4.16, 81 ± 11.50, and 104 ± 13.50 fruits. All the bio-composts outperformed control and commercial composts in terms of yield. With 140 ± 11.50 fruits, BC5 produced a maximum yield of 2938 ± 93.72 g, which is 723 % higher than the control. Hence, it is concluded that the use of bio-compost is more effective than commercial composts and provides a much higher yield. Further studies need to be conducted to evaluate the quality of yield obtained by various bioassay tests. INTRODUCTION India is a developing country with a large proportion of its population depending on agriculture. The use of fertilizer is an important component of providing nutrients to the soil and increasing crop yield. In 1906, Tamil Nadu witnessed the es- tablishment of India’s first fertilizer industry. Since then, there have been significant advances in the types and quantities of fertilizers produced. The Fertilizer Association of India (FAIb 2020) was founded in 1955 and is responsible for overseeing all aspects of fertilizers regulation in India. In 1951-1952, India produced a total of 20.16 lakh tonnes of fertilizers, comprising nitrogen and phosphorus nutrients (FAId 2020). Out of which only 6.38 lakh tonnes were utilized (FAIa 2020) and additional 6000 tonnes of potassium fertilizer was imported due to the unavailability of resources in India. Furthermore, 4275.22 lakh tonnes of fertilizers, comprising straight and complex fertilizers, were produced in 2019-20. Out of which 2896.96 lakh tonne was utilized and additional 264.09 lakh tonnes of potassium fertilizer are met through imports (FAIc 2020). According to current data, India’s agricultural sector has planted 1082 lakh hectares, which is the most in recent years. Chemical fertilizers are often utilized at a rate of 150kg per hectare of land for important crops such as maize, ragi, toor, and wheat (Purashekhara 2020). Demand for food grains has risen manifold as a result of the growing population. Farmers are increasingly opting for intensive farming, in which soil resources are exploited to a greater extent to increase yield, resulting in an imbalance of available nutrients in the soil and a decrease in its fertility. While chemical fertilizers may increase production initially, they degrade the soil’s quality over time. This is demonstrated by the crop response ratio shown in Fig. 1. The crop response ratio refers to the amount of grain produced in relation to the number of fertilizers applied. This has decreased significantly throughout the decades, from 12.1 in 1960 to 5.0 in 2017 (Katyal 2019). Additionally, the usage of chemical fertilizers can result in the leaching of surplus nutrients, resulting in the eutrophi- cation of stagnant water bodies and negatively impacting the ecosystem as well as the surrounding environment. The unavailability of organic manure and increased chemical fertilizer cost have necessitated the development of eco-technology for organic waste recycling in the agri- 2022 pp. 509-516 Vol. 21 p-ISSN: 0972-6268 (Print copies up to 2016) No. 2 Nature Environment and Pollution Technology An International Quarterly Scientific Journal Original Research Paper e-ISSN: 2395-3454 Open Access Journal Nat. Env. & Poll. Tech. Website: www.neptjournal.com Received: 24-07-2021 Revised: 01-09-2021 Accepted: 14-09-2021 Key Words: Bio-compost Pressmud Stabilized spent wash Commercial compost Original Research Paper https://doi.org/10.46488/NEPT.2022.v21i02.009
-
Upload
khangminh22 -
Category
Documents
-
view
3 -
download
0
Transcript of Effective Utilization of Stabilized Spent Wash Bio-Compost for ...

Effective Utilization of Stabilized Spent Wash Bio-Compost for Tomato Crop and Comparison of its Yield with Commercial Composts A. S. Byakodi*† and B. T. Suresh Babu***Research Centre, Department of Civil Engineering, Angadi Institute of Technology & Management, Belagavi, Karnataka, India**Department of Civil Engineering, Angadi Institute of Technology & Management, Belagavi, Karnataka, India†Corresponding author; A. S. Byakodi; [email protected]
ABSTRACT
India is an agro-based country and in the year 2020, about 1082 lakh hectares of agricultural land have been planted, in turn, consuming 3161 lakh tonnes of fertilizer annually. However, excessive fertilizer usage has a negative impact on the soil quality and is evident by the fact that the crop response ratio has decreased from 12.1 in the 1960s to 5.0 in the 2010s. Hence, organic compost can be used as an alternative to fertilizer, reducing its negative impact on soil quality. The present study is a part of a larger investigation and its scope is confined to the utilization of bio-composts for the growth of tomato crops. Additionally, a comparison of these bio-composts was carried out with commercial composts through assessment of yield and number of fruits. Seeds were sown on prepared land, germination was observed on the 7th day, and saplings were produced on the 30th day. The dosage of each compost was fixed at 60ml per plant and was applied on the 31st and 51st days of the study period. Commercial composts produced yields of 673 ± 32.01, 830 ± 32.19 and 1560 ± 77.62 g respectively, with 54 ± 4.16, 81 ± 11.50, and 104 ± 13.50 fruits. All the bio-composts outperformed control and commercial composts in terms of yield. With 140 ± 11.50 fruits, BC5 produced a maximum yield of 2938 ± 93.72 g, which is 723 % higher than the control. Hence, it is concluded that the use of bio-compost is more effective than commercial composts and provides a much higher yield. Further studies need to be conducted to evaluate the quality of yield obtained by various bioassay tests.
INTRODUCTION
India is a developing country with a large proportion of its population depending on agriculture. The use of fertilizer is an important component of providing nutrients to the soil and increasing crop yield. In 1906, Tamil Nadu witnessed the es-tablishment of India’s first fertilizer industry. Since then, there have been significant advances in the types and quantities of fertilizers produced. The Fertilizer Association of India (FAIb 2020) was founded in 1955 and is responsible for overseeing all aspects of fertilizers regulation in India. In 1951-1952, India produced a total of 20.16 lakh tonnes of fertilizers, comprising nitrogen and phosphorus nutrients (FAId 2020). Out of which only 6.38 lakh tonnes were utilized (FAIa 2020) and additional 6000 tonnes of potassium fertilizer was imported due to the unavailability of resources in India. Furthermore, 4275.22 lakh tonnes of fertilizers, comprising straight and complex fertilizers, were produced in 2019-20. Out of which 2896.96 lakh tonne was utilized and additional 264.09 lakh tonnes of potassium fertilizer are met through imports (FAIc 2020).
According to current data, India’s agricultural sector has planted 1082 lakh hectares, which is the most in recent years.
Chemical fertilizers are often utilized at a rate of 150kg per hectare of land for important crops such as maize, ragi, toor, and wheat (Purashekhara 2020). Demand for food grains has risen manifold as a result of the growing population. Farmers are increasingly opting for intensive farming, in which soil resources are exploited to a greater extent to increase yield, resulting in an imbalance of available nutrients in the soil and a decrease in its fertility. While chemical fertilizers may increase production initially, they degrade the soil’s quality over time. This is demonstrated by the crop response ratio shown in Fig. 1. The crop response ratio refers to the amount of grain produced in relation to the number of fertilizers applied. This has decreased significantly throughout the decades, from 12.1 in 1960 to 5.0 in 2017 (Katyal 2019). Additionally, the usage of chemical fertilizers can result in the leaching of surplus nutrients, resulting in the eutrophi-cation of stagnant water bodies and negatively impacting the ecosystem as well as the surrounding environment.
The unavailability of organic manure and increased chemical fertilizer cost have necessitated the development of eco-technology for organic waste recycling in the agri-
2022pp. 509-516 Vol. 21p-ISSN: 0972-6268 (Print copies up to 2016) No. 2 Nature Environment and Pollution Technology
An International Quarterly Scientific Journal
Original Research Paper
e-ISSN: 2395-3454
Open Access Journal
Nat. Env. & Poll. Tech.Website: www.neptjournal.com
Received: 24-07-2021Revised: 01-09-2021Accepted: 14-09-2021
Key Words:Bio-compostPressmudStabilized spent washCommercial compost
Original Research Paperhttps://doi.org/10.46488/NEPT.2022.v21i02.009

510 A.S. Byakodi and B.T. Suresh Babu
Vol. 21, No. 2, 2022 • Nature Environment and Pollution Technology
culture system. Due to the increased need for agricultural yields, it is necessary to maintain a healthy balance of soil health and nutrients. Thus, recycling and reusing renewable organic waste to meet the challenges of the present scenario is of the utmost importance. There are several sources of organic manure, including significant contributions from municipal waste, animal excreta, and industrial waste. Solid waste from agro-industries is one of the finest sources for organic compost generation. This enables the recycling of plant nutrients contained in industrial waste, as well as a disposal method that has a lower impact on the surrounding environment. The sugar industry and distilleries are two of India’s primary agro-based industries.
India is the world’s largest producer of sugar, with a ca-pacity of 290 lakh tonnes. One significant by-product of these industries is pressmud, which is organically rich and accounts for around 3.5–4.0% of the cane crushed (Lokhande 2005). India produces around one lakh tonne of pressmud daily during the sugarcane crushing season. Due to the enormous amount generated and its intrinsic properties, any industry faces significant challenges in safely disposing of the waste. Distilleries, meanwhile are secondary agro-based industries that generate around 22 lakh liters of industrial alcohol daily (Chinimandi.com 2019). Manufacture of industrial alcohol or ethanol, intern generates one of the more complicated liquid wastes known as spent wash. This spent wash is generated at a rate of 10 to 12 liters per liter of ethanol produced, resulting in lakhs of liters of spent wash being generated every day. The distilleries have significant challenges in safely disposing of this massive amount of liquid waste. Hence, the use of these abundantly available waste by-products for the production of organic compost will reduce the dependency on chemical fer-tilizers and make way for a sustainable agricultural practice.
Numerous researchers have investigated the composition of organic compost prepared from pressmud and its influence on crop yields. As Solaimalai et al. (2015) mentioned,
pressmud is a good source of plant nutrients and should be composted before being used as manure. Composted pressmud applied at a rate of 25 tonnes per hectare improved sugarcane production by 7.50 tonnes. Similarly, its application at a rate of 20 tonnes per hectare enhanced maize and wheat crop yields by 129.4 and 65.2 % respectively, illustrating its potential. (Sarangi et al. 2008) have investigated compost made from pressmud and found that when applied at a rate of 25 tonnes/ha, it increased sugarcane production by 6.11%. (Diaz 2016) has proposed that using compost made from pressmud can also be used to manage weeds and insects in the field. This is due to its intrinsic characteristics and chemical composition. (Kumar et al. 2017) advised adding 20 tonnes/ha of composted pressmud, which saved 25% of the necessary fertilizers and showed a substantial increase in the soil’s residual nutrient content. Pressmud compost has also shown an increase in soil texture, water holding capacity, and other physic-chemical properties, enhancing soil quality internally. According to the literature studied thus far, composted pressmud has shown promising results for enhancing crop production. Hence, there is significant scope for production and utilization of organic compost prepared from pressmud and stabilized spent wash.
The current article is part of a broader study, examining the treatment and disposal of two complicated waste by-prod-ucts by aerobic composting. Previous investigations have utilized pressmud as the base material in aerobic composting with treated spent wash, termed as stabilized spent wash. This stabilized spent wash was applied to composting heaps in various proportions of 0, 25, 50, 100, 150, and 200% (v/w). The entire composting process was carried out over 50 days under predefined operating conditions. These bio-composts were compared to the Fertilizer Control Order (FCO) (Min -istry of Agriculture 1985) issued by the Ministry of Agriculb-ture, Government of India. The FCO establishes guidelines for the concentration of nutrients in compost materials. Our
Fig. 1: Trend in crop response ratio for previous decades (Katyal 2019).
The unavailability of organic manure and increased chemical fertilizer cost have necessitated
the development of eco-technology for organic waste recycling in the agriculture system. Due
to the increased need for agricultural yields, it is necessary to maintain a healthy balance of soil
health and nutrients. Thus, recycling and reusing renewable organic waste to meet the
challenges of the present scenario is of the utmost importance. There are several sources of
organic manure, including significant contributions from municipal waste, animal excreta, and
industrial waste. Solid waste from agro-industries is one of the finest sources for organic
compost generation. This enables the recycling of plant nutrients contained in industrial waste,
as well as a disposal method that has a lower impact on the surrounding environment. The
sugar industry and distilleries are two of India's primary agro-based industries.
India is the world's largest producer of sugar, with a capacity of 290 lakh tonnes. One
significant by-product of these industries is pressmud, which is organically rich and accounts
for around 3.5–4.0% of the cane crushed (Lokhande 2005). India produces around one lakh tonne
of pressmud daily during the sugarcane crushing season. Due to the enormous amount
generated and its intrinsic properties, any industry faces significant challenges in safely
disposing of the waste. Distilleries, meanwhile are secondary agro-based industries that
generate around 22 lakh liters of industrial alcohol daily (Chinimandi.com 2019). Manufacture
of industrial alcohol or ethanol, intern generates one of the more complicated liquid wastes
known as spent wash. This spent wash is generated at a rate of 10 to 12 liters per liter of ethanol
produced, resulting in lakhs of liters of spent wash being generated every day. The distilleries
have significant challenges in safely disposing of this massive amount of liquid waste. Hence,
the use of these abundantly available waste by-products for the production of organic compost
12.110.7
9.1 8.8
6.8
5
02468
101214
1960-69 1970-79 1980-89 1990-99 2000-09 2010-17
Cro
p R
espo
nse
Rat
io
Decades
Fig. 1: Trend in crop response ratio for previous decades (Katyal 2019).

511EFFECTIVE UTILIZATION OF STABILIZED SPENT WASH BIO-COMPOST ON TOMATO CROP
Nature Environment and Pollution Technology • Vol. 21, No. 2, 2022
investigations have revealed that all bio-composts had greater nutrient concentration than the specified criteria. The present article is a continuation of the previous investigation carried out. Hence, the scope of this article is confined to the use of BIO-COMPOST on a selected crop and a comparison of yield to commercial composts.
MATERIALS AND METHODS
The Ministry of Agriculture’s Fertilizer Control Order (FCO) regulates the nutritional requirements for organic composts. The FCO recommends a TOC of at least 12.5%, a TKN of at least 0.80%, a Phosphorus and Potassium content of at least 0.40%, and a C/N ratio of less than 20. Previous investigation has revealed that all of the bio-composts had higher nutrient concentrations than the prescribed standards. Representative samples of the bio-compost were collected and analyzed
for physic-chemical properties to determine the nutrient concentration. table 1 indicates the nutrient concentration of various bio-composts prepared.
Additionally, as mentioned previously, the goal of this study is to compare the yield of bio-composts to that of com-mercial composts. the yield performance of bio-composts was compared using cow dung compost, municipal compost, and vermicompost in this study. Table 2 summarizes the nutrient content of these commercial composts.
The entire research was conducted at the Research Centre, Department of Civil Engineering, Angadi Institute of Tech-nology & Management in Belagavi, Karnataka. A suitable location for the cultivation of a tomato crop has been identified near Itagi village in the Belagavi district of Karnataka. Black cotton soil was present at the selected site. Before seed sowing, the land was cleaned and prepared, as shown in Fig. 3. Tomato
Table 1: Physic-chemical characteristics of bio-composts.
Characteristics Stabilized spent wash addition FCO Standards
0%BC1
25%BC2
50%BC3
100%BC4
150%BC5
200%BC6
pH 7.59 7.72 7.67 7.68 7.64 7.81 6.5-7.5
EC [mS.cm-1] 3.53 5.58 7.96 8.32 8.87 8.32 < 4dS.m-1
Moisture Content [%] 49.26 55.34 54.16 52.25 49.52 53.18 25% max
Bulk Density [g.cm-3] 0.550 0.540 0.545 0.530 0.515 0.575 < 1 gm.cm-3
TOC [%] 25.33 23.58 24.84 23.53 25.92 23.73 12% Min
TKN [%] 1.13 1.88 1.62 1.49 2.16 1.16 0.8% Min
C/N Ratio 29.60 12.70 15.35 16.07 12.28 21.73 < 20
Potassium [%] 7.29 7.47 10.86 12.18 15.90 15.12 0.4% Min
Phosphorous [%] 8.56 5.85 6.85 6.93 6.55 5.86 0.4% Min
Table 2: Physic-chemical characteristics of commercial composts.
Characteristics Commercial Compost FCO Standards
Cow dung Compost*
CCMunicipal Compost*
MCVermicompost*
VC
pH 7.68 7.64 7.81 6.5-7.5
EC [mS.cm-] 8.32 8.87 8.32 < 4dS.m-1
Moisture Content (%) 52.25 49.52 53.18 25% max
Bulk Density (gm/BC-3) 0.530 0.515 0.575 < 1 gm.cm-3
TOC [%] 23.53 25.92 23.73 12% Min
TKN [%] 1.49 2.16 1.16 0.8% Min
C/N Ratio 16.07 12.28 21.73 < 20
Potassium [%] 12.18 15.90 15.12 0.4% Min
Phosphorous [%] 6.93 6.55 5.86 0.4% Min
* Physic-chemical characteristics received from respective commercial compost vendors.

512 A.S. Byakodi and B.T. Suresh Babu
Vol. 21, No. 2, 2022 • Nature Environment and Pollution Technology
seeds were obtained commercially from Unisem Agritech Private Limited. The variety of seeds chosen was USM-KA-REENA, which had a minimum genetic purity of 90%.
Commercial composts (cow dung compost, municipal compost, and vermicompost) were obtained from local vendors in Belagavi. At the Research Centre, aerobic com-posting of pressmud and stabilized spent wash resulted in bio-composts. Before application on the field, all of these composts were sieved through a 4mm sieve (Fig. 2) to ensure uniformity in particle size. The present study was carried out in three plots parallelly and continued for a total of 76 days. Throughout the study period, the temperature of the atmosphere varied between 19°C and 38°C.
Initially selected species of tomato seeds were sown in prepared land and covered with soil to produce saplings (Fig. 3). In addition, water was immediately added to the seeds for optimal development. The seed germinated for the first time on the 7th day after sowing and the bulk of seeds germinated until the 11th day (Fig. 4). Watering was done at 6-day intervals during this period. Thirty days were required
to produce tomato saplings, which were then placed in an open field to continue growing.
As shown in Table 1, bio-composts containing 0% (BC1), 25% (BC2), 50% (BC3), 100% (BC4), 150 % (BC5) and 200 % (BC6) stabilized spent wash were used. Additionally, com-mercial composts were utilized to compare yields, including cow dung compost, municipal compost, and vermicompost. Also, the control group of the study was maintained without the addition of any nutrients. Ten rows were made in each plot to investigate the effect of the aforementioned composts, as shown in Fig. 5.
Each row was planted with fifteen saplings and the composts were applied at a rate of 60mL per plant. The first application of these composts was done one day after the saplings were planted, followed by water to facilitate nutrient absorption by the plants. Similarly, the second application was made after twenty days after the first application. Wa-tering was carried out at a 10-day interval during this period.
As the tomato crop continued to grow, flowering was noticed on the 17th day following the initial application of
C/N Ratio 16.07 12.28 21.73 < 20 Potassium [%] 12.18 15.90 15.12 0.4% Min Phosphorous [%]
6.93 6.55 5.86 0.4% Min * Physic-chemical characteristics received from respective commercial compost vendors.
The entire research was conducted at the Research Centre, Department of Civil Engineering,
Angadi Institute of Technology & Management in Belagavi, Karnataka. A suitable location for
the cultivation of a tomato crop has been identified near Itagi village in the Belagavi district of
Karnataka. Black cotton soil was present at the selected site. Before seed sowing, the land was
cleaned and prepared, as shown in Fig. 3. Tomato seeds were obtained commercially from
Unisem Agritech Private Limited. The variety of seeds chosen was USM-KAREENA, which
had a minimum genetic purity of 90%.
Fig. 2: Bio-compost passing through 4mm sieve for uniform particle size.
Commercial composts (cow dung compost, municipal compost, and vermicompost) were
obtained from local vendors in Belagavi. At the Research Centre, aerobic composting of
pressmud and stabilized spent wash resulted in bio-composts. Before application on the field,
all of these composts were sieved through a 4mm sieve (Fig. 2) to ensure uniformity in particle
size. The present study was carried out in three plots parallelly and continued for a total of 76
days. Throughout the study period, the temperature of the atmosphere varied between 19°C
and 38°C.
Fig. 2: Bio-compost passing through 4mm sieve for uniform particle size.
(a) (b)
(c)
Fig. 3: Preparation of land for sowing of tomato seeds. (a) Leveling and cleaning of land (b) Sowing of seeds (c) Watering of sown seeds
Initially selected species of tomato seeds were sown in prepared land and covered with soil to
produce saplings (Fig. 3). In addition, water was immediately added to the seeds for optimal
development. The seed germinated for the first time on the 7th day after sowing and the bulk of
seeds germinated until the 11th day (Fig. 4). Watering was done at 6-day intervals during this
period. Thirty days were required to produce tomato saplings, which were then placed in an
open field to continue growing.
Fig. 4: Germination of tomato seeds.
As shown in Table 1, bio-composts containing 0% (BC1), 25% (BC2), 50% (BC3), 100%
(BC4), 150 % (BC5) and 200 % (BC6) stabilized spent wash were used. Additionally,
commercial composts were utilized to compare yields, including cow dung compost, municipal
Fig. 3: Preparation of land for sowing of tomato seeds. (a) Leveling and cleaning of land (b) Sowing of seeds (c) Watering of sown seeds

513EFFECTIVE UTILIZATION OF STABILIZED SPENT WASH BIO-COMPOST ON TOMATO CROP
Nature Environment and Pollution Technology • Vol. 21, No. 2, 2022
compost. Similarly, the tomato’s initial glimpse was observed after seven days of flowering. The tomato crop was allowed to grow for a total of 76 days from the time of seeding until it was harvested. The harvested crops were collected row-wise and weighed accurately along with the number of tomato fruits. Furthermore, a comparison of these yields was carried out to determine the effectiveness of these composts. The entire methodology of the study is detailed in Fig. 6 for ease of understanding.
RESULTS AND DISCUSSION
The addition of nutrients is an important aspect of farming to gain more yield to meet the increasing demand for food grains. The purpose of this study is to determine the effica-cy of bio-composts on a selected tomato crop. the ground preparation for seed sowing and the planting of saplings on an open field were carried out according to the established methodology. the performance of each of the bio-composts, commercial composts, and control was assessed at the end of
(a) (b)
(c)
Fig. 3: Preparation of land for sowing of tomato seeds. (a) Leveling and cleaning of land (b) Sowing of seeds (c) Watering of sown seeds
Initially selected species of tomato seeds were sown in prepared land and covered with soil to
produce saplings (Fig. 3). In addition, water was immediately added to the seeds for optimal
development. The seed germinated for the first time on the 7th day after sowing and the bulk of
seeds germinated until the 11th day (Fig. 4). Watering was done at 6-day intervals during this
period. Thirty days were required to produce tomato saplings, which were then placed in an
open field to continue growing.
Fig. 4: Germination of tomato seeds.
As shown in Table 1, bio-composts containing 0% (BC1), 25% (BC2), 50% (BC3), 100%
(BC4), 150 % (BC5) and 200 % (BC6) stabilized spent wash were used. Additionally,
commercial composts were utilized to compare yields, including cow dung compost, municipal
Fig. 4: Germination of tomato seeds.
compost, and vermicompost. Also, the control group of the study was maintained without the
addition of any nutrients. Ten rows were made in each plot to investigate the effect of the
aforementioned composts, as shown in Fig. 5.
(a) (b)
(c) (d)
Fig. 5: Tomato crop growth phases. (a) Application of saplings onto the open field (b) Application of compost to each row of crops (c) Intermediate growth phase of tomato
crop (d) Final yield of Tomato crop
Each row was planted with fifteen saplings and the composts were applied at a rate of 60mL
per plant. The first application of these composts was done one day after the saplings were
planted, followed by water to facilitate nutrient absorption by the plants. Similarly, the second
application was made after twenty days after the first application. Watering was carried out at
a 10-day interval during this period.
As the tomato crop continued to grow, flowering was noticed on the 17th day following the
initial application of compost. Similarly, the tomato's initial glimpse was observed after seven
Sowing of Seed
First Germination of Seed
Majority of Seeds Germinated Planting of Saplings
First Application of Compost
Flowering Observed
Second Application of Compost
Tomato Fruit Observed
Harvesting of Crop
0 7 11 30 31 48 51 55 76 Days
Plot 1
Plot 2 Plot 3
Fig. 5: Tomato crop growth phases. (a) Application of saplings onto the open field (b) Application of compost to each row of crops (c) Intermediate growth phase of tomato crop (d) Final yield of tomato crop
514 A.S. Byakodi and B.T. Suresh Babu
Vol. 21, No. 2, 2022 • Nature Environment and Pollution Technology
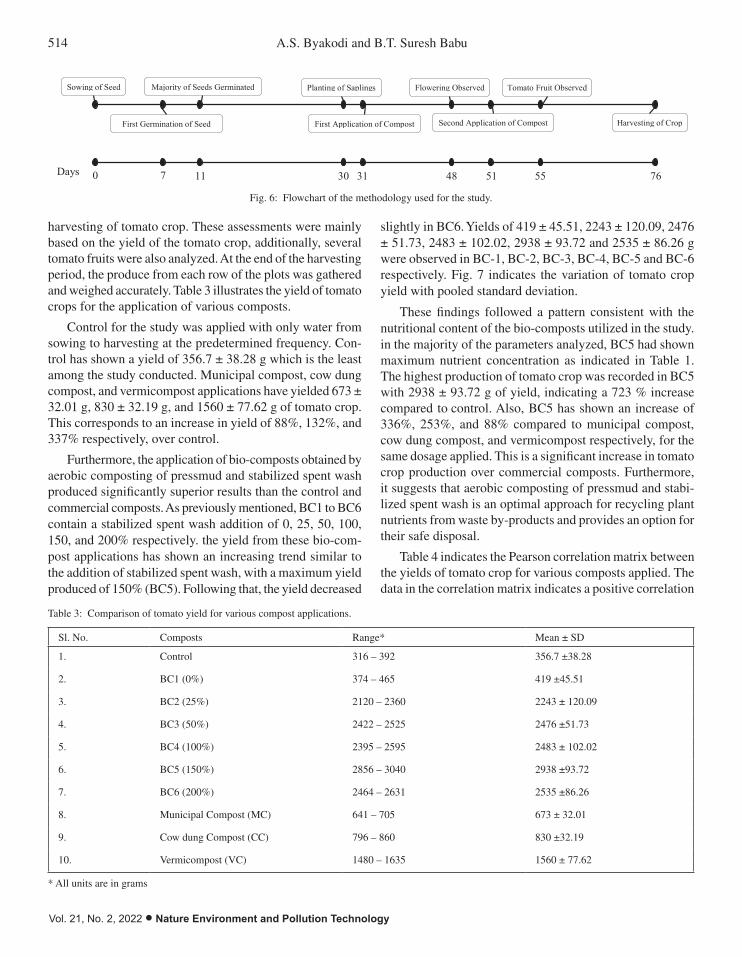
harvesting of tomato crop. These assessments were mainly based on the yield of the tomato crop, additionally, several tomato fruits were also analyzed. At the end of the harvesting period, the produce from each row of the plots was gathered and weighed accurately. Table 3 illustrates the yield of tomato crops for the application of various composts.
Control for the study was applied with only water from sowing to harvesting at the predetermined frequency. Con-trol has shown a yield of 356.7 ± 38.28 g which is the least among the study conducted. Municipal compost, cow dung compost, and vermicompost applications have yielded 673 ± 32.01 g, 830 ± 32.19 g, and 1560 ± 77.62 g of tomato crop. This corresponds to an increase in yield of 88%, 132%, and 337% respectively, over control.
Furthermore, the application of bio-composts obtained by aerobic composting of pressmud and stabilized spent wash produced significantly superior results than the control and commercial composts. As previously mentioned, BC1 to BC6 contain a stabilized spent wash addition of 0, 25, 50, 100, 150, and 200% respectively. the yield from these bio-com-post applications has shown an increasing trend similar to the addition of stabilized spent wash, with a maximum yield produced of 150% (BC5). Following that, the yield decreased
slightly in BC6. Yields of 419 ± 45.51, 2243 ± 120.09, 2476 ± 51.73, 2483 ± 102.02, 2938 ± 93.72 and 2535 ± 86.26 g were observed in BC-1, BC-2, BC-3, BC-4, BC-5 and BC-6 respectively. Fig. 7 indicates the variation of tomato crop yield with pooled standard deviation.
These findings followed a pattern consistent with the nutritional content of the bio-composts utilized in the study. in the majority of the parameters analyzed, BC5 had shown maximum nutrient concentration as indicated in Table 1. The highest production of tomato crop was recorded in BC5 with 2938 ± 93.72 g of yield, indicating a 723 % increase compared to control. Also, BC5 has shown an increase of 336%, 253%, and 88% compared to municipal compost, cow dung compost, and vermicompost respectively, for the same dosage applied. This is a significant increase in tomato crop production over commercial composts. Furthermore, it suggests that aerobic composting of pressmud and stabi-lized spent wash is an optimal approach for recycling plant nutrients from waste by-products and provides an option for their safe disposal.
Table 4 indicates the Pearson correlation matrix between the yields of tomato crop for various composts applied. The data in the correlation matrix indicates a positive correlation
compost, and vermicompost. Also, the control group of the study was maintained without the
addition of any nutrients. Ten rows were made in each plot to investigate the effect of the
aforementioned composts, as shown in Fig. 5.
(a) (b)
(c) (d)
Fig. 5: Tomato crop growth phases. (a) Application of saplings onto the open field (b) Application of compost to each row of crops (c) Intermediate growth phase of tomato
crop (d) Final yield of Tomato crop
Each row was planted with fifteen saplings and the composts were applied at a rate of 60mL
per plant. The first application of these composts was done one day after the saplings were
planted, followed by water to facilitate nutrient absorption by the plants. Similarly, the second
application was made after twenty days after the first application. Watering was carried out at
a 10-day interval during this period.
As the tomato crop continued to grow, flowering was noticed on the 17th day following the
initial application of compost. Similarly, the tomato's initial glimpse was observed after seven
Sowing of Seed
First Germination of Seed
Majority of Seeds Germinated Planting of Saplings
First Application of Compost
Flowering Observed
Second Application of Compost
Tomato Fruit Observed
Harvesting of Crop
0 7 11 30 31 48 51 55 76 Days
Plot 1
Plot 2 Plot 3
Fig. 6: Flowchart of the methodology used for the study.
Table 3: Comparison of tomato yield for various compost applications.
Sl. No. Composts Range* Mean ± SD
1. Control 316 – 392 356.7 ±38.28
2. BC1 (0%) 374 – 465 419 ±45.51
3. BC2 (25%) 2120 – 2360 2243 ± 120.09
4. BC3 (50%) 2422 – 2525 2476 ±51.73
5. BC4 (100%) 2395 – 2595 2483 ± 102.02
6. BC5 (150%) 2856 – 3040 2938 ±93.72
7. BC6 (200%) 2464 – 2631 2535 ±86.26
8. Municipal Compost (MC) 641 – 705 673 ± 32.01
9. Cow dung Compost (CC) 796 – 860 830 ±32.19
10. Vermicompost (VC) 1480 – 1635 1560 ± 77.62
* All units are in grams

515EFFECTIVE UTILIZATION OF STABILIZED SPENT WASH BIO-COMPOST ON TOMATO CROP
Nature Environment and Pollution Technology • Vol. 21, No. 2, 2022
Table 4: Pearson correlation matrix for yields of various composts applied.
Correlation Table
Control MC CC VC BC1 (0%)
BC2 (25%)
BC3 (50%)
BC4 (100%)
BC5 (150%)
BC6 (200%)
Control 1f
MC 0.9947 1e
CC 0.9999 0.9960 1e
VC 0.9979 0.9993 0.9986 1d
BC1 (0%) 0.9902 0.9993 0.9920 0.9972 1f
BC2 (25%) 0.9966 0.9998 0.9976 0.9998 0.9983 1c
BC3 (50%) 0.3028 0.3991 0.3153 0.3642 0.4328 0.3803 1b
BC4 (100%) 0.9491 0.9765 0.9532 0.9676 0.9838 0.9718 0.5875 1b
BC5 (150%) 0.9514 0.9780 0.9553 0.9694 0.9851 0.9735 0.5816 0.9999 1a
BC6 (200%) -0.7822 -0.7141 -0.7740 -0.7400 -0.6877 -0.7283 0.3569 -0.5463 -0.5523 1b
Each cell indicates the Pearson correlation coefficient.Grouping information is based on one-way ANOVA with post hoc Tukey test at p ≤ 0.05
10. Vermicompost (VC) 1480 – 1635 1560 ± 77.62 * All units are in grams
Control for the study was applied with only water from sowing to harvesting at the
predetermined frequency. Control has shown a yield of 356.7 ± 38.28 g which is the least
among the study conducted. Municipal compost, cow dung compost, and vermicompost
applications have yielded 673 ± 32.01 g, 830 ± 32.19 g, and 1560 ± 77.62 g of tomato crop.
This corresponds to an increase in yield of 88%, 132%, and 337% respectively, over control.
Furthermore, the application of bio-composts obtained by aerobic composting of pressmud and
stabilized spent wash produced significantly superior results than the control and commercial
composts. As previously mentioned, BC1 to BC6 contain a stabilized spent wash addition of
0, 25, 50, 100, 150, and 200% respectively. the yield from these bio-compost applications has
shown an increasing trend similar to the addition of stabilized spent wash, with a maximum
yield produced of 150% (BC5). Following that, the yield decreased slightly in BC6. Yields of
419 ± 45.51, 2243 ± 120.09, 2476 ± 51.73, 2483 ± 102.02, 2938 ± 93.72 and 2535 ± 86.26 g
were observed in BC-1, BC-2, BC-3, BC-4, BC-5 and BC-6 respectively. Fig. 7 indicates the
variation of tomato crop yield with pooled standard deviation.
Fig. 7: Mean variations of tomato crop yield for compost applied.
These findings followed a pattern consistent with the nutritional content of the bio-composts
utilized in the study. in the majority of the parameters analyzed, BC5 had shown maximum
nutrient concentration as indicated in Table 1. The highest production of tomato crop was
Fig. 7: Mean variations of tomato crop yield for compost applied.
between all the yields for various composts applied with an exception of BC6. It is indicated by the negative sign, intern interpreting a reduction in yield of the crop compared to other variations. Further, one-way ANOVA analysis was carried out to assess the variance between groups and results indicate there is a significant difference between the yields of various composts applied. As a result, post hoc Tukey tests were used to determine the yield groups that differed significantly, as shown in Table 5 with different alphabets.
In addition, as shown in Table 5, observations were made on several tomato fruits generated for all the study’s
variations. The control group for the study had the least tomato fruits of 35 ± 6.11. Municipal compost, cow dung compost, and vermicompost yielded 54 ± 4.16, 81 ± 11.50, and 104 ± 13.50 fruits respectively, which is consistent with crop yield. BC1 of the prepared compost produced 37 ± 8.02 tomato fruits, which is the lowest number for BIO-COMPOSTs. Whereas BC2, BC3, BC4, BC5 and BC6 each had 137 ± 10.97, 141 ± 6.66, 126 ± 7.55, 140 ± 11.50 and 148 ± 17.50 fruits respectively. When compared to the control, this shows that adding compost increases fruit yield. Furthermore, bio-composts have outperformed

516 A.S. Byakodi and B.T. Suresh Babu
Vol. 21, No. 2, 2022 • Nature Environment and Pollution Technology
commercial composts in a number of ways, indicating their efficacy.
CONCLUSION
India is a predominantly agricultural country, with the bulk of its population dependent on agriculture. Nutrient addition via fertilizers enables agricultural production enhancement. However, frequent use of fertilizers has harmed soil quality, as seen by the decline in crop response ratios. Thus, an alternative to fertilizers may be used in the form of organic compost, which enhances the soil quality and nutrient concentration over time. The present study is a part of a larger investigation and its scope is confined to the utilization of the bio-composts from previous investigations to assess its effect on the tomato crop. Additionally, commercial composts (Municipal compost, Cow dung compost, and Vermicompost) were also utilized, to compare the yield of tomato crop with the bio composts. The performance of each compost was primarily determined by crop yield, as well as the number of tomato fruits. The entire study lasted 76 days from seeding to harvesting. The dosage of each compost was fixed at 60 ml per plant and was applied on the 31st and 51st days of the study. Crop harvesting revealed a minimum yield of 356.7 ±38.28 g with 35 ± 6.11 fruits for control. Commercial composts produced yields of 673 ± 32.01, 830 ±32.19, and 1560 ± 77.62 g respectively, suggesting an increase in yield of 88%, 132%, and 337% over control. Similarly, bio-composts yielded significantly more than commercial composts and control. A maximum yield of 2938 ±93.72 g with 140 ± 11.50 fruits was recorded in BC-5, indicating a 723% increase in yield over control. Additionally, as compared to municipal compost, cow dung compost, and vermicompost, BC-5 yields increased by 336%, 253%, and 88% respectively. The results indicate that bio-composts have a greater concentration of nutrients than commercial composts
and produce a much higher yield. Hence, it can be concluded that the use of these bio-composts from pressmud and stabi-lized spent wash is suitable for the growth of a selected crop. Further studies are to be conducted for assessing the quality of yield produced through various bioassay tests.
REFERENCES
Chinimandi.com 2019. State Wise Molasses Production in India. https://www.chinimandi.com/state-wise-molasses-production/
Diaz, P. 2016. Consequences of compost press mud as fertilizers. DJ Int. J. Adv. Microbiol. Microbiol. Res., 1(1): 28-32. https://doi.org/10.18831/djmicro.org/2016011005
Fertilizer Association of India (FAIa). 2020. Consumption of Fertilizers. https://www.faidelhi.org/general/con-npk.pdf
Fertilizer Association of India (FAIb). 2020. Establishment of FAI. https://www.faidelhi.org/
Fertilizer Association of India (FAIc). 2020. Production, Consumption, and Import of Fertilizers. https://www.faidelhi.org/general/Prodn-imp-cons-fert.pdf
Fertilizer Association of India (FAId). 2020. Production Capacity of Ferti-lizers. https://www.faidelhi.org/general/prodn-np.pdf
Katyal, J.C. 2019. Fertilizers use efficiency research: looking back to move forward. Indian J. Fertilizers, 15(12): 1384-1401.
Kumar, S., Meena, R., Singh Jatav, H., Banjara, T. and Jinger, D. 2017. Use of pressmud compost for improving crop productivity and soil health. Int. J. Chem. Stud., 5(2): 384-389.
Lokhande, M.A. 2005. A study of the Indian sugar industry in the post reforms era. J. Coop. Manag., 40(1): 7-12.
Ministry of Agriculture. 1985. Biofertilizers and Organic Fertilizers in Fertilizer (Control) Order. , Government of India, National Centre of Organic Farming. Government of India Press, New Delhi. pp 1-68.
Purashekhara, S.V. 2020. Could organic city compost reduce production costs in agriculture? Science the Wire. https://science.thewire.in/environment/agriculture-costs-chemical-fertilisers-organic-city-com-post-soil-fertility/
Sarangi, B.K., Mudliar, S.N., Bhatt, P., Kalve, S., Chakrabarti, T. and Pan-dey, R.A. 2008. Compost from sugarmill pressmud and distillery spent wash for sustainable agriculture. Dyna. Soil Dyna. Plant, 2(1): 35-49.
Solaimalai, A., Bhaskar, M., Ramesh, P.T. and Ravishankar N. 2001. The utilization of press mud as a soil amendment and organic manure: A review. Agric. Rev., 22(1): 25-32.
Table 5: Comparison of the number of tomato fruits for various compost applications.
Sl. No. Composts Range* Mean ± SD
1. Control 30-42 35 ± 6.11
2. BC1 (0%) 29-45 37 ± 8.02
3. BC2 (25%) 128-149 137 ± 10.97
4. BC3 (50%) 135-148 141 ± 6.66
5. BC4 (100%) 118-133 126 ± 7.55
6. BC5 (150%) 129-152 140 ± 11.50
7. BC6 (200%) 130-165 148 ± 17.50
8. Municipal Compost (MC) 49-57 54 ± 4.16
9. Cow dung Compost (CC) 70-93 81 ± 11.50
10. Vermicompost (VC) 91-118 104 ± 13.50
* All units are in Nos.