Joint WASH Assessment - UNHCR data portal
23
Joint WASH Assessment In nine official refugee camp settlements across three governorates in the Kurdistan Region of Northern Iraq February 2014 | Kurdistan Regional Government - Iraq
-
Upload
khangminh22 -
Category
Documents
-
view
4 -
download
0
Transcript of Joint WASH Assessment - UNHCR data portal

Joint WASH AssessmentIn nine official refugee camp settlements across threegovernorates in the Kurdistan Region of Northern Iraq
February 2014 | Kurdistan Regional Government - Iraq
- 0 -
Table of Content
Summary ..................................................................................................................................................... i 1 Introduction .......................................................................................................................................... 4
1.1 How to read this report ........................................................................................................................ 4 1.2 Background and Purpose ..................................................................................................................... 4
2 Design ................................................................................................................................................ 5 2.1 Ownership and Accountability ................................................................................................................ 5 2.2 Methods .......................................................................................................................................... 5 2.3 Sampling and selection ........................................................................................................................ 5 2.4 Preparation ...................................................................................................................................... 6
3 Findings A: General Survey Information ........................................................................................................ 6 4 Findings B: Key WASH Themes .................................................................................................................. 7
4.1 Hesper: Perceived Needs ..................................................................................................................... 7 4.2 Problems specific to toilets .................................................................................................................... 8 4.3 Problems specific to bathing facilities ....................................................................................................... 9 4.4 Management of Menstrual Hygiene ......................................................................................................... 9 4.5 Gender and WASH ............................................................................................................................. 9 4.6 Disability and WASH ........................................................................................................................... 9 4.7 Transitional Areas ............................................................................................................................. 10 4.8 Variation between permanent areas ....................................................................................................... 11 4.9 Participation, Access to information and Accountability ................................................................................. 11
5 Findings C: General WASH Indicators ......................................................................................................... 12 5.1 Water Supply ................................................................................................................................... 12 5.2 Toilets ........................................................................................................................................... 13 5.3 Bathing .......................................................................................................................................... 14 5.4 Disposal of Children’s faeces ................................................................................................................ 14 5.5 Grey Water ..................................................................................................................................... 15 5.6 Place for washing hands ..................................................................................................................... 15 5.7 Communication ................................................................................................................................ 16
6 Findings D: WASH in Schools ................................................................................................................... 16 6.1 Views of the pupils ............................................................................................................................ 16 6.2 Hygiene in Schools ............................................................................................................................ 16 6.3 Sanitation in Schools.......................................................................................................................... 17 6.4 Water in Schools .............................................................................................................................. 17
7 Conclusion and Recommendations ............................................................................................................. 18 Annex A – Lessons Learned about the survey ........................................................................................................ A Annex B – English and Arabic Versions of the Questionnaires .................................................................................... B Annex C – All Camp Data (excel workbook)........................................................................................................... B Annex D – WASH in Schools Data (excel workbook) ................................................................................................ B
Participating Organizations
Governmental Ministry of Health Department of Health Dohuk Department of Health Erbil Development and Modification Center – Dohuk Directorate of Surrounding Water (Erbil, Dohuk, Sulaymaniyah) Erbil Refugee Council Kurdistan Region Statistics Office Sulaymaniyah Refugee Council
Other WASH Sector Partners Danish Refugee Council French Red Cross International Rescue Committee Kurdistan Reconstruction and Development Society Norwegian Refugee Council Peace Winds Japan Première Urgence - Aide Médicale Internationale Rescue International United Nations Children’s Fund United Nations High Commission for Refugees United Nations – Central Emergency Response Fund

i
Summary
This report presents the findings of a joint water, sanitation and hygiene (WASH) assessment conducted in nine official refugee camp settlements across three governorates in the Kurdistan Region of Northern Iraq (Dohuk, Erbil and Sulaymaniyah). The Syrian refugee population targeted by this assessment lives in permanent and transitional shelters in the nine camps. They receive various WASH interventions/services from a number of government, non-governmental and UN agencies.
Approximately 1,300 household questionnaires and 80 focus group discussions were conducted with the aim to assess the utilization of WASH services and the perceived WASH needs of the refugee population. The assessment has also looked at accountability, disability, gender and transitional areas in relation to the WASH services. Various governmental and non-governmental sector partners have contributed to the implementation of this joint assessment.
Findings related to Perceived Needs, Equitable Access and Accountability:
Most Serious Problems
For the refugee camp population, they perceive sanitation and bathing facilities as their most serious WASH related problems. Privacy, dignity and security are particular concerns for both men and women. The amount of water received for cooking, drinking and personal hygiene is much less often mentioned as a serious problem. Nevertheless, about half of the respondents would like the total amount of water they receive to increase.
People living with a Disability
The refugee population indicates there are various problems for people living with a disability including ability to access toilets, bathing facilities and in obtaining sufficient water supplies.
Menstrual Hygiene Management
To manage their menses the large majority of women use a pad received in a hygiene kit. An even larger percentage indicates that it is their preferred product. The discrepancy between use and preference shows that about 10% of women do not have access to a pad from a hygiene kit.
Gaps in Transitional Areas
There are considerable differences between various transitional camp areas. Some families receive a lower but adequate level of service, others are dealing with coverage gaps. The most common shortcomings are access to bathing facilities and latrines that can be locked.
Heterogeneity in service levels
Services in permanent areas are not de facto better than in transitional areas. Moreover, there are coverage gaps in permanent areas (again latrines that can lock and bathing facilities). Overall, there is a lot of heterogeneity in the type and level of services between permanent areas.
Accountability
There are some variations between camps suggesting mechanisms are stronger in some camps than in others. In general, the extent to which the population feels informed, consulted and involved in the planning and design of the WASH facilities in their respective camp is medium to low. At the same time, a high percentage of people report knowing how to submit a complaint. Be that as it may, the refugee population indicates that such complaints often do not impact the WASH activities of the responsible organization.
Findings related to general WASH indicators
Water supply
On average:
43% of emergency affected population provided with sustainable access to safe water (piped network)
57% of emergency affected population provided with access to safe water through temporary solutions (trucking)
In permanent areas almost 50% of the families use a piped network compared to 36% in transitional areas
Of all piped household water connections approximately 30% are used in temporary areas
ii
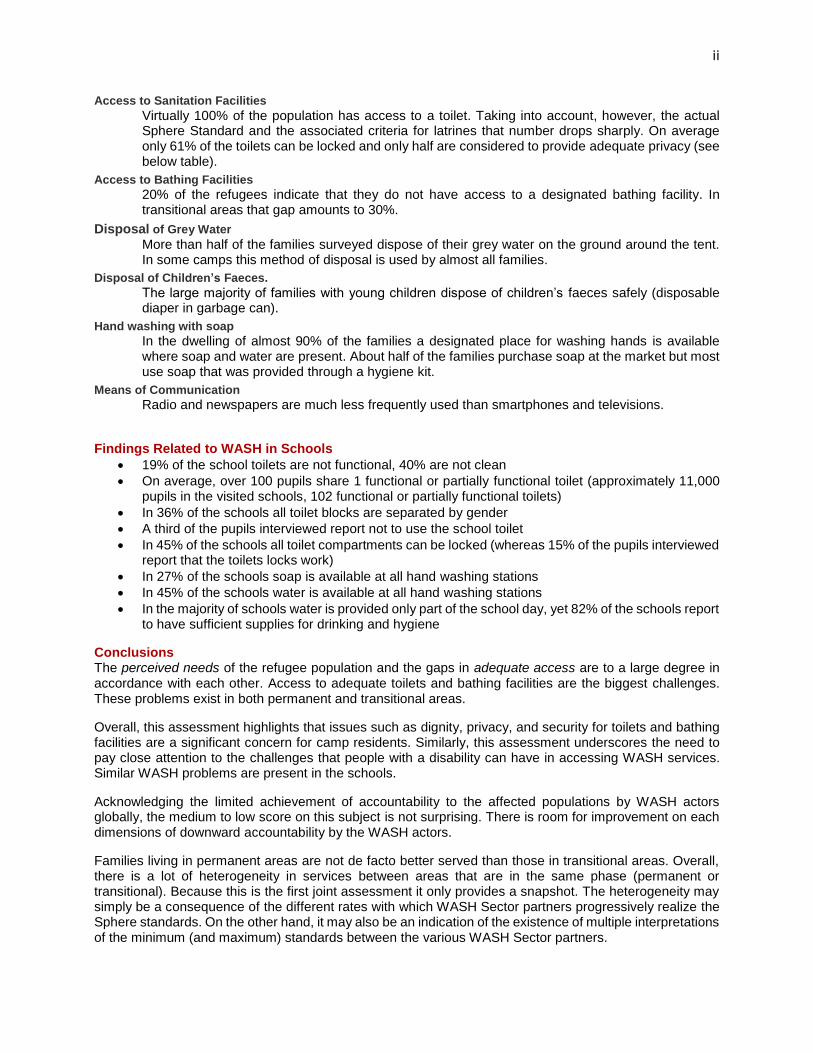
Access to Sanitation Facilities
Virtually 100% of the population has access to a toilet. Taking into account, however, the actual Sphere Standard and the associated criteria for latrines that number drops sharply. On average only 61% of the toilets can be locked and only half are considered to provide adequate privacy (see below table).
Access to Bathing Facilities
20% of the refugees indicate that they do not have access to a designated bathing facility. In transitional areas that gap amounts to 30%.
Disposal of Grey Water
More than half of the families surveyed dispose of their grey water on the ground around the tent. In some camps this method of disposal is used by almost all families.
Disposal of Children’s Faeces.
The large majority of families with young children dispose of children’s faeces safely (disposable diaper in garbage can).
Hand washing with soap
In the dwelling of almost 90% of the families a designated place for washing hands is available where soap and water are present. About half of the families purchase soap at the market but most use soap that was provided through a hygiene kit.
Means of Communication
Radio and newspapers are much less frequently used than smartphones and televisions.
Findings Related to WASH in Schools
19% of the school toilets are not functional, 40% are not clean
On average, over 100 pupils share 1 functional or partially functional toilet (approximately 11,000 pupils in the visited schools, 102 functional or partially functional toilets)
In 36% of the schools all toilet blocks are separated by gender
A third of the pupils interviewed report not to use the school toilet
In 45% of the schools all toilet compartments can be locked (whereas 15% of the pupils interviewed report that the toilets locks work)
In 27% of the schools soap is available at all hand washing stations
In 45% of the schools water is available at all hand washing stations
In the majority of schools water is provided only part of the school day, yet 82% of the schools report to have sufficient supplies for drinking and hygiene
Conclusions The perceived needs of the refugee population and the gaps in adequate access are to a large degree in accordance with each other. Access to adequate toilets and bathing facilities are the biggest challenges. These problems exist in both permanent and transitional areas.
Overall, this assessment highlights that issues such as dignity, privacy, and security for toilets and bathing facilities are a significant concern for camp residents. Similarly, this assessment underscores the need to pay close attention to the challenges that people with a disability can have in accessing WASH services. Similar WASH problems are present in the schools.
Acknowledging the limited achievement of accountability to the affected populations by WASH actors globally, the medium to low score on this subject is not surprising. There is room for improvement on each dimensions of downward accountability by the WASH actors.
Families living in permanent areas are not de facto better served than those in transitional areas. Overall, there is a lot of heterogeneity in services between areas that are in the same phase (permanent or transitional). Because this is the first joint assessment it only provides a snapshot. The heterogeneity may simply be a consequence of the different rates with which WASH Sector partners progressively realize the Sphere standards. On the other hand, it may also be an indication of the existence of multiple interpretations of the minimum (and maximum) standards between the various WASH Sector partners.

iii
Recommendations Along the lines of the principles of the right to water and sanitation in emergencies, the recommendations are structured in two themes: 1) universal access, and 2) participation, the right to information, and accountability.
Universal access
State and non-state actors have an obligation to give priority to the most vulnerable or marginalized population groups in the provision of aid and the distribution and management of water and water facilities1.
The associated recommendations are:
Guarantee there is agreement on the minimum WASH standards which the WASH Sector wants to attain. That also holds for WASH in Schools. In line with the right to water and sanitation, the achievement of universal access means realizing the agreed minimum standard for all is a first priority (augmenting services for populations who already enjoy this minimum level of access is secondary to universal minimum access2).
Consequently, make decisions on how best to address the gaps (particularly concerning adequate sanitation and bathing facilities).
Develop a better understanding of how to address the difficulties which people living with a disability have in accessing WASH facilities. Subsequently implement the consequent WASH services for these groups.
Develop a plan to track the progressively realization of access to a minimum level of WASH services
Participation, the Right to Information and Accountability
All people have the right to participate in decision-making processes that may affect their access and must be given full and equal access to information. Without access to information the beneficiaries cannot hold the WASH Sector to account. The recommendations are accompanied by the benchmarks developed by the Humanitarian Accountability Partnership (2010):
To improve the WASH Sector mechanism in each camp by which the refugee population is informed, consulted and involved.
o Access to Information: The WASH partner ensures that the people it aims to assist and other stakeholders have access to timely, relevant and clear information about the organisation and its activities.
o Participation: The WASH partner listens to the people it aims to assist, incorporating their views and analysis in programme decisions.
To improve the WASH Sector mechanism in each camp by which complaints are handled o Handling complaints: The WASH partner enables the people it aims to assist and other
stakeholders to raise complaints and receive a response through an effective, accessible and safe process.
By Peter van Maanen for the WASH Sector
1 See: ACF 2009. The human right to water and sanitation in emergency situations. The legal framework and a guide
to advocacy. On behalf of the WASH Cluster. p.43 2 Idem p.50

4
1 Introduction
This report presents the findings of a joint water, sanitation and hygiene (WASH) assessment conducted in nine official refugee camp settlements across three governorates in the Kurdistan Region of Northern Iraq (Dohuk, Erbil and Sulaymaniyah). The Syrian refugee population targeted by this assessment lives in permanent and transitional shelters in the nine camps. They receive various WASH interventions/services from a number of government, non-governmental and UN agencies.
1.1 How to read this report
After the introduction and the chapter on the survey design there are four sections with findings: A) General survey information, B) Key WASH Themes, C) General WASH Indicators D) WASH in Schools. The chapter on key WASH themes presents noteworthy findings on equitable access, accountability, privacy & dignity, perceived needs and the management of menstrual hygiene. The part with findings on general WASH indicators contains more typical WASH data. In many camps primary school aged children go to school. The section on WASH in Schools presents findings from an assessment of the WASH facilities in those schools.
There is a very important annex to this report where all the data is disaggregated by camp, location, governorate and gender (Annex C). Most WASH Sector partners will be keen to look at the data by camp. In the main body of this report there isn’t enough space to address and present such findings. Please open the accompanying excel workbook. It contains various sheets with all the data.
1.2 Background and Purpose
The Syrian refugee population receives various WASH services from a large number of actors across a range of camps in three different governorates. The WASH Sector maintains information on the activities of the Sector partners and the resulting WASH service levels. To what extent and in what respect the refugee population utilizes these services is unclear. In addition, the WASH Sector does not know to what extent people the WASH services to be adequate and information on the associated hygiene practices is not available. As a consequence, there is no sector wide understanding of the perceived needs and consequently the sector is unable to perform a gap analysis.
The central objective of the joint assessment therefore is:
To improve and better inform future planning by assessing the utilization of WASH services and perceived WASH needs of the refugee population in all nine camps in Kurdistan.
In addition, there are two sub-objectives, which are to:
To improve and inform future planning by assessing:
Inequitable access among the affected population (gender, disability, location, camp)
Degrees of accountability to the affected population
The information which the assessment produces can inform
a gap analysis
a discussion on equity, WASH standards, accountability
Because this is the first joint assessment the results will function as a baseline against which future evolutions in the provision of services can be compared.

5
2 Design
2.1 Ownership and Accountability
Global evaluations point out that the humanitarian response commonly fails to integrate national and local actors appropriately and thereby undermines national ownership3. In addition, there are usually limitations in the achievement of accountability to the affected populations4.
This joint assessment attempts to address these concerns as follows:
a) Ownership: Public institutions as well as local and international non-governmental organizations have been involved. Among the participating government institutions are MoH, the DoH and the KRSO.
b) Accountability: Besides consulting the camp population on their perceived need the assessment will inquire about degrees of information sharing, participation in decision making, and responsiveness to feedback
2.2 Methods
Two methods are used to capture the views of the refugee population:
1) Structured interviews and observations (household questionnaire) 2) Focus group discussions
The household questionnaire is conducted in the form of a structured interview with an adult member of the household. The questionnaire contains questions and observation that focus on the utilization of WASH services. In addition, a set of specific questions are used to rank the respondent’s perceived needs (based on the WHO Humanitarian Emergency Settings Perceived Needs Scale (HESPER)).
Gender, disability and accountability have been addressed through the focus group discussions. The discussions were conducted in each camp with separate groups of men, women and youth.
The English and Arabic questionnaire and discussion forms are presented in Annex A.
2.3 Sampling and selection
Household Questionnaire
Formula to determine the sample size of the household questionnaire for each camp:
𝑛 =𝑍2𝑝(1 − 𝑝)𝐷
𝑒2 𝑅𝑅
Parameters Z = Risk of error 5% = 1,96 e = level of precision = 0,1 p = Prevalence = 0,5 D = Design Effect = 1,0 Response rate = 90% Sample size per camp = 107
3 IASC 2010. Cluster Approach Evaluation 2 Synthesis Report. Page 60. http://www.gppi.net/fileadmin/gppi/GPPi-
URD_Cluster_II_Evaluation_SYNTHESIS_REPORT_e.pdf 4 GWC 2009. Water, sanitation, and hygiene (wash) cluster coordination handbook. Page 216.
https://clusters.humanitarianresponse.info/document/wash-cluster-coordinator-handbook
6
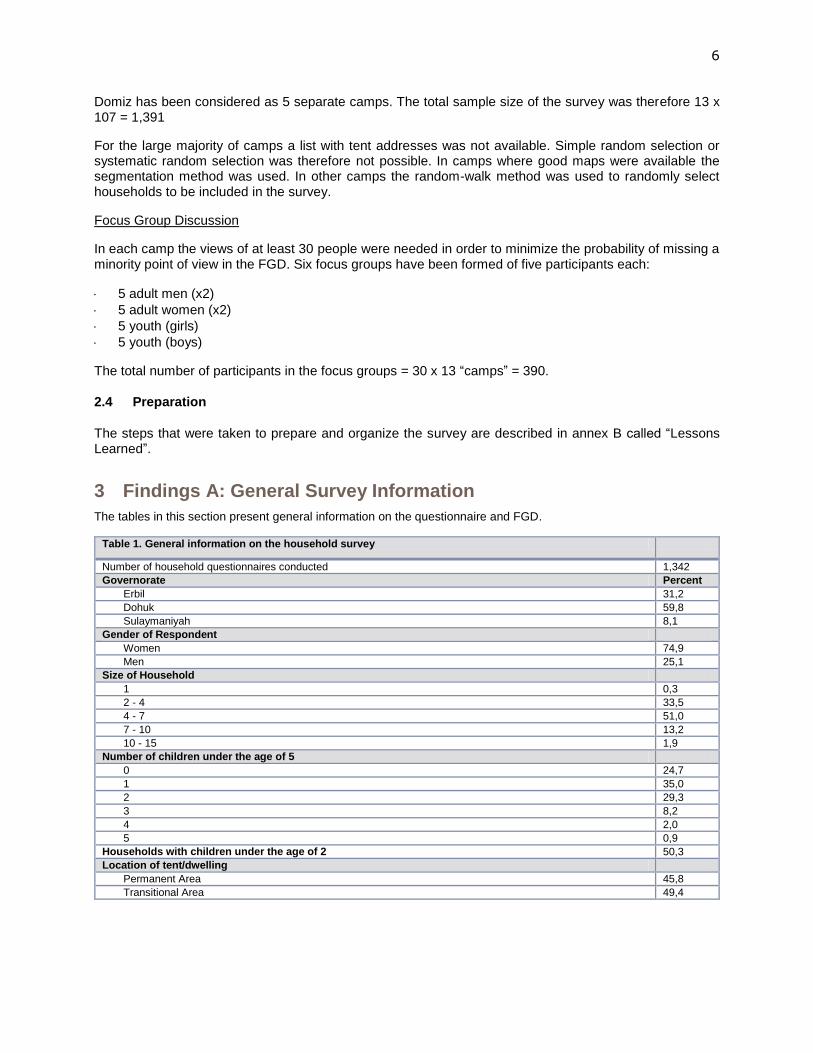
Domiz has been considered as 5 separate camps. The total sample size of the survey was therefore 13 x 107 = 1,391
For the large majority of camps a list with tent addresses was not available. Simple random selection or systematic random selection was therefore not possible. In camps where good maps were available the segmentation method was used. In other camps the random-walk method was used to randomly select households to be included in the survey.
Focus Group Discussion
In each camp the views of at least 30 people were needed in order to minimize the probability of missing a minority point of view in the FGD. Six focus groups have been formed of five participants each:
5 adult men (x2)
5 adult women (x2)
5 youth (girls)
5 youth (boys)
The total number of participants in the focus groups = 30 x 13 “camps” = 390.
2.4 Preparation
The steps that were taken to prepare and organize the survey are described in annex B called “Lessons Learned”.
3 Findings A: General Survey Information
The tables in this section present general information on the questionnaire and FGD.
Table 1. General information on the household survey
Number of household questionnaires conducted 1,342
Governorate Percent
Erbil 31,2
Dohuk 59,8
Sulaymaniyah 8,1
Gender of Respondent
Women 74,9
Men 25,1
Size of Household
1 0,3
2 - 4 33,5
4 - 7 51,0
7 - 10 13,2
10 - 15 1,9
Number of children under the age of 5
0 24,7
1 35,0
2 29,3
3 8,2
4 2,0
5 0,9
Households with children under the age of 2 50,3
Location of tent/dwelling
Permanent Area 45,8
Transitional Area 49,4

7
Table 2. Number of household questionnaires per camp
Camp #
Kawergosk 107
Darashakran 107
Qushtapa 107
Arbat 107
Akre 106
Basirma 102
Gawilan 91
Bajid Kandela 13
Domiz 1 110
Domiz 2 127
Domiz 3 125
Domiz 4 112
Domiz 5 103
Total 1,317
Missing 25
Total 1,342
Table 3. General information on the focus group discussions
Number of focus groups conducted 79
Total number of participants 395
Governorate Percent
Erbil 30,4
Dohuk 62,0
Sulaymaniyah 7,6
Type of focus group Percent
Women 34,2
Men 32,9
Youth (boys 50% girls 50%) 32,9
Table 4. Number of focus group discussions per Camp
Camp #
Kawergosk 6
Darashakran 6
Qushtapa 6
Arbat 6
Akre 9
Basirma 6
Gawilan 6
Bajid Kandela 3
Domiz 1 5
Domiz 2 8
Domiz 3 6
Domiz 4 6
Domiz 5 6
Total 79
4 Findings B: Key WASH Themes
In line with the Sphere Core Standards, this chapter highlights survey results that relate to the themes which are central to the design of a people centred humanitarian response: Perceived Needs, Equitable Access and Accountability.
4.1 Hesper: Perceived Needs
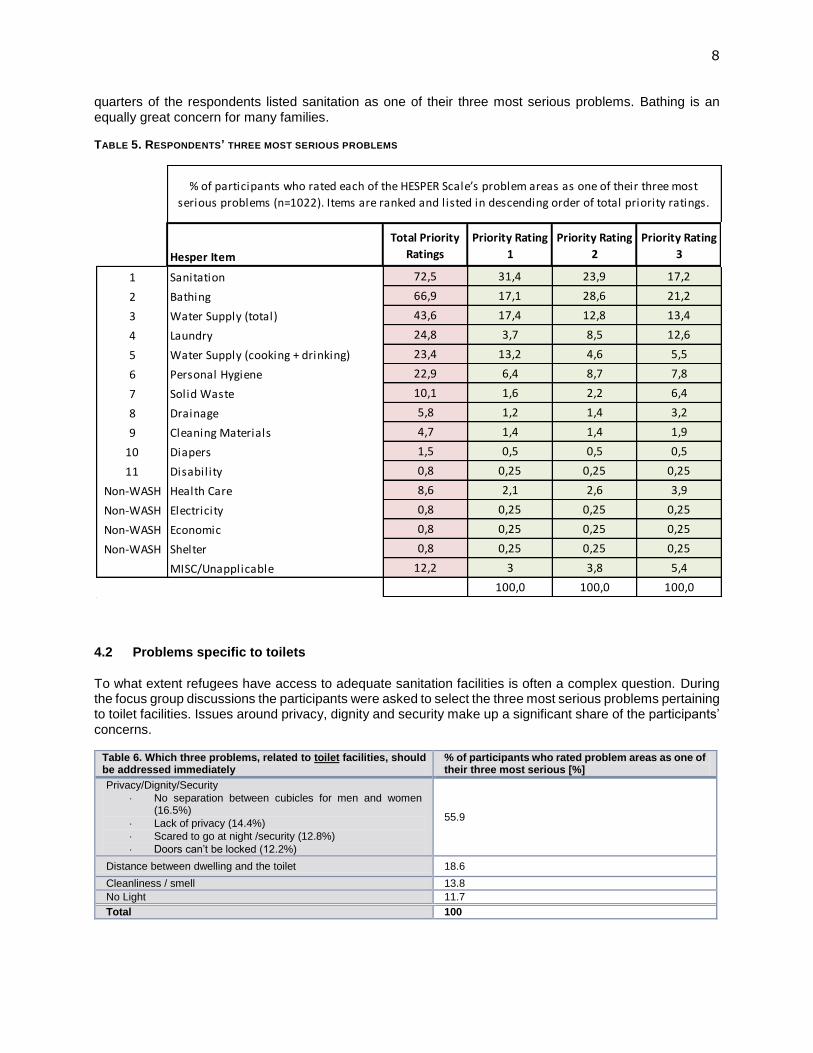
At the end of the household questionnaire the respondents were asked to identify serious WASH problems and rank their three most serious problems. The results are presented in the table below. Almost three
8
quarters of the respondents listed sanitation as one of their three most serious problems. Bathing is an equally great concern for many families.
TABLE 5. RESPONDENTS’ THREE MOST SERIOUS PROBLEMS
4.2 Problems specific to toilets
To what extent refugees have access to adequate sanitation facilities is often a complex question. During the focus group discussions the participants were asked to select the three most serious problems pertaining to toilet facilities. Issues around privacy, dignity and security make up a significant share of the participants’ concerns.
Table 6. Which three problems, related to toilet facilities, should be addressed immediately
% of participants who rated problem areas as one of their three most serious [%]
Privacy/Dignity/Security
No separation between cubicles for men and women (16.5%)
Lack of privacy (14.4%)
Scared to go at night /security (12.8%)
Doors can’t be locked (12.2%)
55.9
Distance between dwelling and the toilet 18.6
Cleanliness / smell 13.8
No Light 11.7
Total 100
Hesper Item
Total Priority
Ratings
Priority Rating
1
Priority Rating
2
Priority Rating
3
1 Sanitation 72,5 31,4 23,9 17,2
2 Bathing 66,9 17,1 28,6 21,2
3 Water Supply (total) 43,6 17,4 12,8 13,4
4 Laundry 24,8 3,7 8,5 12,6
5 Water Supply (cooking + drinking) 23,4 13,2 4,6 5,5
6 Personal Hygiene 22,9 6,4 8,7 7,8
7 Solid Waste 10,1 1,6 2,2 6,4
8 Drainage 5,8 1,2 1,4 3,2
9 Cleaning Materials 4,7 1,4 1,4 1,9
10 Diapers 1,5 0,5 0,5 0,5
11 Disability 0,8 0,25 0,25 0,25
Non-WASH Health Care 8,6 2,1 2,6 3,9
Non-WASH Electricity 0,8 0,25 0,25 0,25
Non-WASH Economic 0,8 0,25 0,25 0,25
Non-WASH Shelter 0,8 0,25 0,25 0,25
MISC/Unapplicable 12,2 3 3,8 5,4
100,0 100,0 100,0
% of participants who rated each of the HESPER Scale’s problem areas as one of their three most
serious problems (n=1022). Items are ranked and listed in descending order of total priority ratings.
9
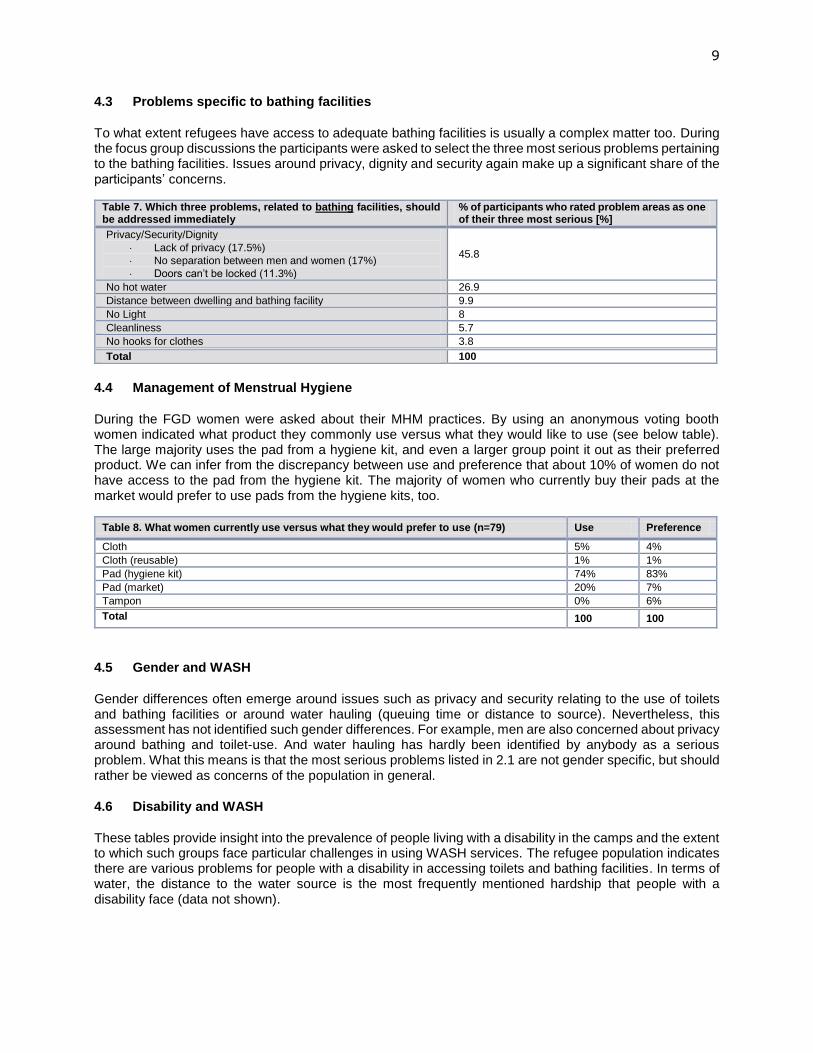
4.3 Problems specific to bathing facilities
To what extent refugees have access to adequate bathing facilities is usually a complex matter too. During the focus group discussions the participants were asked to select the three most serious problems pertaining to the bathing facilities. Issues around privacy, dignity and security again make up a significant share of the participants’ concerns.
Table 7. Which three problems, related to bathing facilities, should be addressed immediately
% of participants who rated problem areas as one of their three most serious [%]
Privacy/Security/Dignity
Lack of privacy (17.5%)
No separation between men and women (17%)
Doors can’t be locked (11.3%)
45.8
No hot water 26.9
Distance between dwelling and bathing facility 9.9
No Light 8
Cleanliness 5.7
No hooks for clothes 3.8
Total 100
4.4 Management of Menstrual Hygiene
During the FGD women were asked about their MHM practices. By using an anonymous voting booth women indicated what product they commonly use versus what they would like to use (see below table). The large majority uses the pad from a hygiene kit, and even a larger group point it out as their preferred product. We can infer from the discrepancy between use and preference that about 10% of women do not have access to the pad from the hygiene kit. The majority of women who currently buy their pads at the market would prefer to use pads from the hygiene kits, too.
Table 8. What women currently use versus what they would prefer to use (n=79) Use Preference
Cloth 5% 4%
Cloth (reusable) 1% 1%
Pad (hygiene kit) 74% 83%
Pad (market) 20% 7%
Tampon 0% 6%
Total 100 100
4.5 Gender and WASH
Gender differences often emerge around issues such as privacy and security relating to the use of toilets and bathing facilities or around water hauling (queuing time or distance to source). Nevertheless, this assessment has not identified such gender differences. For example, men are also concerned about privacy around bathing and toilet-use. And water hauling has hardly been identified by anybody as a serious problem. What this means is that the most serious problems listed in 2.1 are not gender specific, but should rather be viewed as concerns of the population in general.
4.6 Disability and WASH
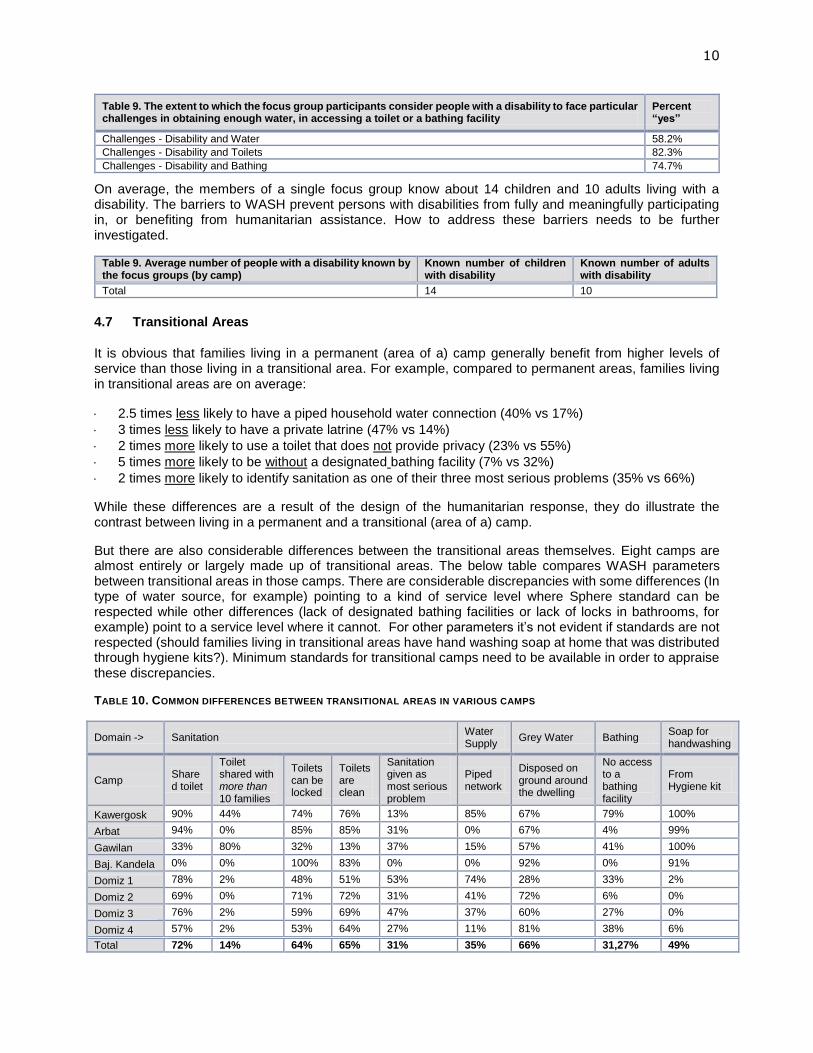
These tables provide insight into the prevalence of people living with a disability in the camps and the extent to which such groups face particular challenges in using WASH services. The refugee population indicates there are various problems for people with a disability in accessing toilets and bathing facilities. In terms of water, the distance to the water source is the most frequently mentioned hardship that people with a disability face (data not shown).
10
Table 9. The extent to which the focus group participants consider people with a disability to face particular challenges in obtaining enough water, in accessing a toilet or a bathing facility
Percent “yes”
Challenges - Disability and Water 58.2%
Challenges - Disability and Toilets 82.3%
Challenges - Disability and Bathing 74.7%
On average, the members of a single focus group know about 14 children and 10 adults living with a disability. The barriers to WASH prevent persons with disabilities from fully and meaningfully participating in, or benefiting from humanitarian assistance. How to address these barriers needs to be further investigated.
Table 9. Average number of people with a disability known by the focus groups (by camp)
Known number of children with disability
Known number of adults with disability
Total 14 10
4.7 Transitional Areas
It is obvious that families living in a permanent (area of a) camp generally benefit from higher levels of service than those living in a transitional area. For example, compared to permanent areas, families living in transitional areas are on average:
2.5 times less likely to have a piped household water connection (40% vs 17%)
3 times less likely to have a private latrine (47% vs 14%)
2 times more likely to use a toilet that does not provide privacy (23% vs 55%)
5 times more likely to be without a designated bathing facility (7% vs 32%)
2 times more likely to identify sanitation as one of their three most serious problems (35% vs 66%)
While these differences are a result of the design of the humanitarian response, they do illustrate the contrast between living in a permanent and a transitional (area of a) camp.
But there are also considerable differences between the transitional areas themselves. Eight camps are almost entirely or largely made up of transitional areas. The below table compares WASH parameters between transitional areas in those camps. There are considerable discrepancies with some differences (In type of water source, for example) pointing to a kind of service level where Sphere standard can be respected while other differences (lack of designated bathing facilities or lack of locks in bathrooms, for example) point to a service level where it cannot. For other parameters it’s not evident if standards are not respected (should families living in transitional areas have hand washing soap at home that was distributed through hygiene kits?). Minimum standards for transitional camps need to be available in order to appraise these discrepancies.
TABLE 10. COMMON DIFFERENCES BETWEEN TRANSITIONAL AREAS IN VARIOUS CAMPS
Domain -> Sanitation Water Supply
Grey Water Bathing Soap for handwashing
Camp Shared toilet
Toilet shared with more than 10 families
Toilets can be locked
Toilets are clean
Sanitation given as most serious problem
Piped network
Disposed on ground around the dwelling
No access to a bathing facility
From Hygiene kit
Kawergosk 90% 44% 74% 76% 13% 85% 67% 79% 100%
Arbat 94% 0% 85% 85% 31% 0% 67% 4% 99%
Gawilan 33% 80% 32% 13% 37% 15% 57% 41% 100%
Baj. Kandela 0% 0% 100% 83% 0% 0% 92% 0% 91%
Domiz 1 78% 2% 48% 51% 53% 74% 28% 33% 2%
Domiz 2 69% 0% 71% 72% 31% 41% 72% 6% 0%
Domiz 3 76% 2% 59% 69% 47% 37% 60% 27% 0%
Domiz 4 57% 2% 53% 64% 27% 11% 81% 38% 6%
Total 72% 14% 64% 65% 31% 35% 66% 31,27% 49%
11
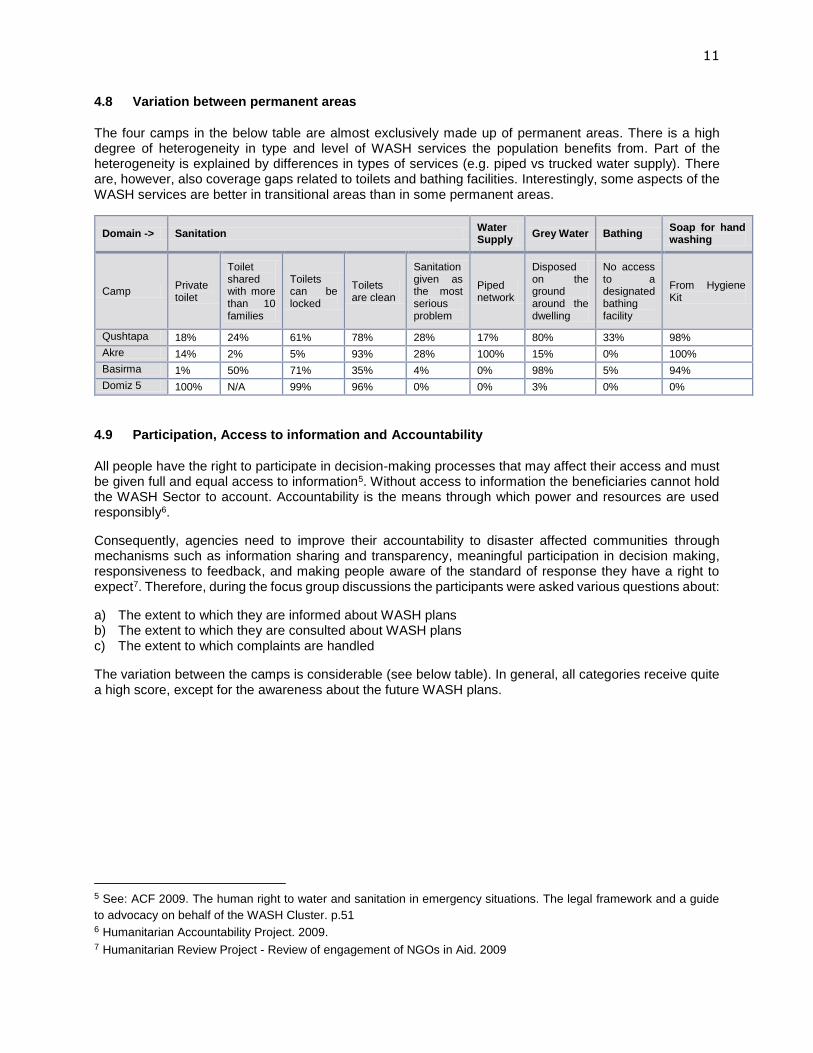
4.8 Variation between permanent areas
The four camps in the below table are almost exclusively made up of permanent areas. There is a high degree of heterogeneity in type and level of WASH services the population benefits from. Part of the heterogeneity is explained by differences in types of services (e.g. piped vs trucked water supply). There are, however, also coverage gaps related to toilets and bathing facilities. Interestingly, some aspects of the WASH services are better in transitional areas than in some permanent areas.
Domain -> Sanitation Water Supply
Grey Water Bathing Soap for hand washing
Camp Private toilet
Toilet shared with more than 10 families
Toilets can be locked
Toilets are clean
Sanitation given as the most serious problem
Piped network
Disposed on the ground around the dwelling
No access to a designated bathing facility
From Hygiene Kit
Qushtapa 18% 24% 61% 78% 28% 17% 80% 33% 98%
Akre 14% 2% 5% 93% 28% 100% 15% 0% 100%
Basirma 1% 50% 71% 35% 4% 0% 98% 5% 94%
Domiz 5 100% N/A 99% 96% 0% 0% 3% 0% 0%
4.9 Participation, Access to information and Accountability
All people have the right to participate in decision-making processes that may affect their access and must be given full and equal access to information5. Without access to information the beneficiaries cannot hold the WASH Sector to account. Accountability is the means through which power and resources are used responsibly6.
Consequently, agencies need to improve their accountability to disaster affected communities through mechanisms such as information sharing and transparency, meaningful participation in decision making, responsiveness to feedback, and making people aware of the standard of response they have a right to expect7. Therefore, during the focus group discussions the participants were asked various questions about:
a) The extent to which they are informed about WASH plans b) The extent to which they are consulted about WASH plans c) The extent to which complaints are handled
The variation between the camps is considerable (see below table). In general, all categories receive quite a high score, except for the awareness about the future WASH plans.
5 See: ACF 2009. The human right to water and sanitation in emergency situations. The legal framework and a guide
to advocacy on behalf of the WASH Cluster. p.51 6 Humanitarian Accountability Project. 2009. 7 Humanitarian Review Project - Review of engagement of NGOs in Aid. 2009
12
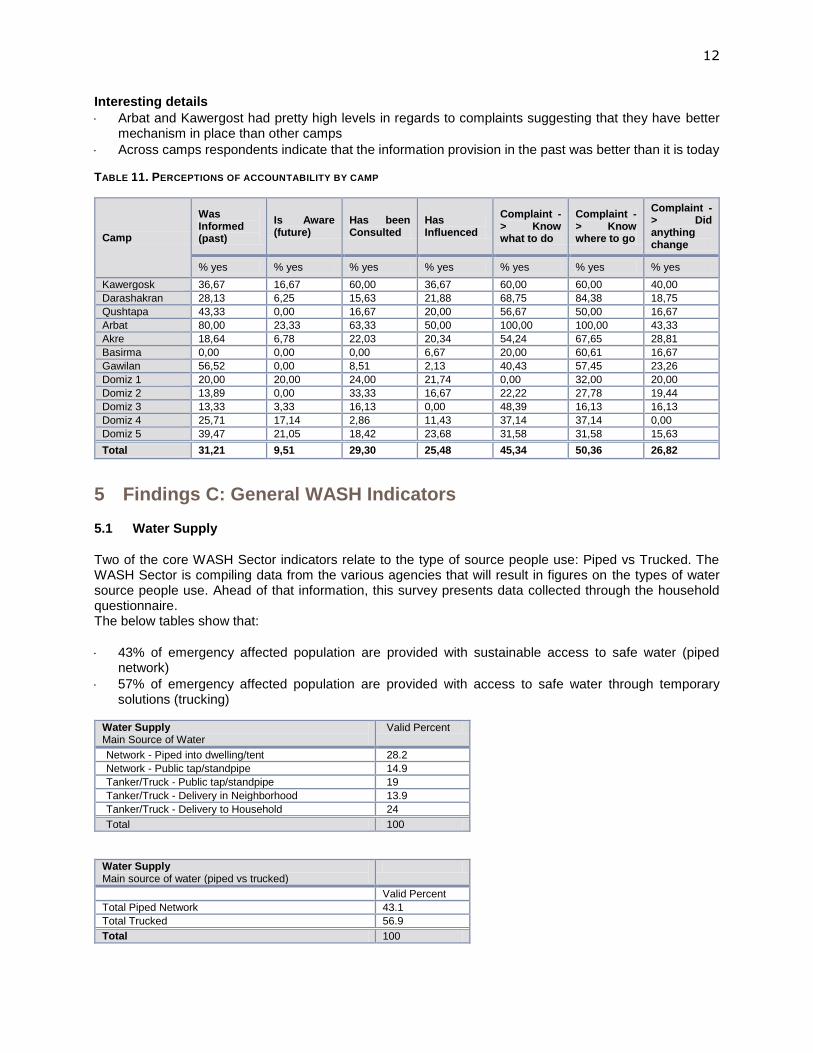
Interesting details
Arbat and Kawergost had pretty high levels in regards to complaints suggesting that they have better mechanism in place than other camps
Across camps respondents indicate that the information provision in the past was better than it is today
TABLE 11. PERCEPTIONS OF ACCOUNTABILITY BY CAMP
Camp
Was Informed (past)
Is Aware (future)
Has been Consulted
Has Influenced
Complaint -> Know what to do
Complaint -> Know where to go
Complaint -> Did anything change
% yes % yes % yes % yes % yes % yes % yes
Kawergosk 36,67 16,67 60,00 36,67 60,00 60,00 40,00
Darashakran 28,13 6,25 15,63 21,88 68,75 84,38 18,75
Qushtapa 43,33 0,00 16,67 20,00 56,67 50,00 16,67
Arbat 80,00 23,33 63,33 50,00 100,00 100,00 43,33
Akre 18,64 6,78 22,03 20,34 54,24 67,65 28,81
Basirma 0,00 0,00 0,00 6,67 20,00 60,61 16,67
Gawilan 56,52 0,00 8,51 2,13 40,43 57,45 23,26
Domiz 1 20,00 20,00 24,00 21,74 0,00 32,00 20,00
Domiz 2 13,89 0,00 33,33 16,67 22,22 27,78 19,44
Domiz 3 13,33 3,33 16,13 0,00 48,39 16,13 16,13
Domiz 4 25,71 17,14 2,86 11,43 37,14 37,14 0,00
Domiz 5 39,47 21,05 18,42 23,68 31,58 31,58 15,63
Total 31,21 9,51 29,30 25,48 45,34 50,36 26,82
5 Findings C: General WASH Indicators
5.1 Water Supply
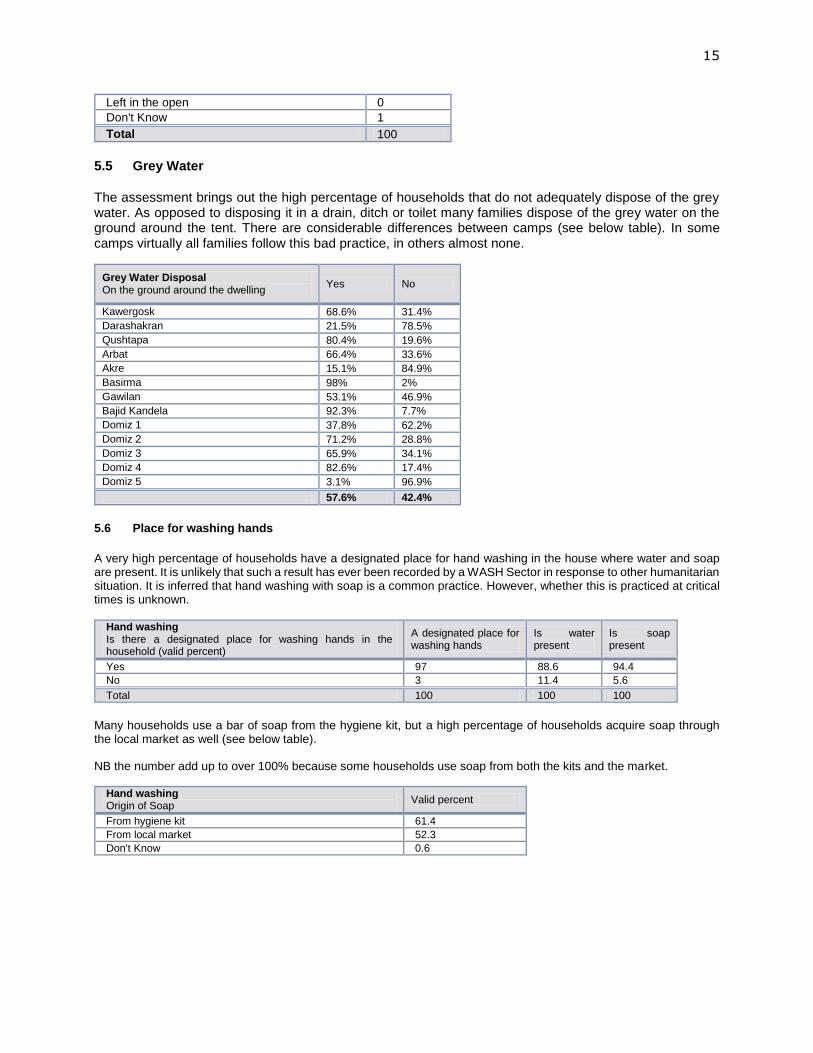
Two of the core WASH Sector indicators relate to the type of source people use: Piped vs Trucked. The WASH Sector is compiling data from the various agencies that will result in figures on the types of water source people use. Ahead of that information, this survey presents data collected through the household questionnaire. The below tables show that:
43% of emergency affected population are provided with sustainable access to safe water (piped network)
57% of emergency affected population are provided with access to safe water through temporary solutions (trucking)
Water Supply Main Source of Water
Valid Percent
Network - Piped into dwelling/tent 28.2
Network - Public tap/standpipe 14.9
Tanker/Truck - Public tap/standpipe 19
Tanker/Truck - Delivery in Neighborhood 13.9
Tanker/Truck - Delivery to Household 24
Total 100
Water Supply Main source of water (piped vs trucked)
Valid Percent
Total Piped Network 43.1
Total Trucked 56.9
Total 100

13
Because of a flaw in the survey regarding the frequency of water distribution there is no accurate data on the quantity of water consumption per person across different camps.
5.2 Toilets
One core indicator relates to sanitation:
% of emergency affected population that has access to a functional toilet.
Toilets Type of toilet used (= functional toilet)
Valid Percent
None (Open defecation) 1.2
Public 14.6
Shared 53.7
Private 30.5
Total 100
Virtually 100% of the population has access to toilets that work. But taking into account the Sphere Standard and the associated latrine criteria that number drops sharply (the Sphere criteria are presented below). The Sphere Standard on Sanitation is:
People should have adequate, appropriate and acceptable toilet facilities, sufficiently close to their dwellings, to allow rapid, safe and secure access at all times, day and night.
Across the camps only 61% of the toilets can be locked and only half are considered to provide privacy (see below table). The access figures on sanitation are strongly dependent on the standard and associated indicator the WASH sector uses to measure access.
Toilets Privacy and Cleanliness
Percent
Toilet door can be locked 61,5
Toilet provides privacy 56,5
Toilet is clean (no visible faeces) 65,3
The household questionnaire did not investigate the number of people using a single public toilet but did look at shared toilets. The target in the Sphere standards is one toilet for a maximum of 20 people. Among the families that share a toilet (in both permanent and transitional areas) around a third shares the facility with 6 other families or more (see below table) that generally exceeds a total of 20 people.
Toilets Number of households that share the same facility
Valid Percent
<3 29.6
3 - 6 38.8
6 - 10 14.6
>10 17
Total 100

14
Toilets SPHERE latrine Criteria
They can be used safely by all sections of the population including children, older people, pregnant women and persons with disabilities
They are sited in such a way as to minimise security threats to users, especially women and girls, throughout the day and through the night
They provide a degree of privacy in line with the norms of the users
They are sufficiently easy to use and kept clean and do not present a health hazard to the environment. Depending on the context the toilets are appropriately provided with water for hand washing and/or for flushing
They allow for the disposal of women’s menstrual hygiene materials and provide women with the necessary privacy for washing and drying menstrual hygiene materials
They minimise fly and mosquito breeding
They are provided with mechanisms for desludging, transport and appropriate disposal in the event that the toilets are sealed or are for long-term use and there is a need to empty them
In high water table or flood situations, the pits or containers for excreta are made watertight in order to minimise contamination of groundwater and the environment
5.3 Bathing
A particularly high percentage of respondents in transitional areas indicate they do not have access to a designated bathing facility (see below table). Because the overwhelming majority of people bathe on a weekly or daily basis (also in transitional areas, data not shown) it means that families bathe at home without the use of a real shower facility.
Bathing Type of bathing facility
Permanent Area
Transitional Area
Total
None 7% 32.1% 20%
Public 4.8% 4.1% 4.5%
Shared 28.1% 11% 19.2%
Private 60.1% 52.8% 56.3%
Total 100% 100% 100%
The use of soap and shampoo for bathing is very common and frequent.
Bathing Frequency of washing hair/body with soap/shampoo
Hair
Body Hair (Child)
Body (Child)
Daily 21.9 16.6 19.8 12.9
Weekly 73.5 81 75.9 85.3
Monthly 2.1 2 1.9 1.6
Less frequently than monthly 2.4 0.4 2.4 0.2
Total 100 100 100 100
5.4 Disposal of Children’s faeces
The safe disposal of children’s faeces in the camps is high. The only “unsafe” category, “left in the open”, is hardly practiced. That is most likely a consequence of the high degree of diaper use (95%, data not shown). To throw diapers into the garbage is a safe practice, provided there is an adequate garbage collection system.
Disposal of children’s faeces
What was done with the stools? Valid Percent
Put / Rinsed into toilet / latrine 1.2
Put / Rinsed into drain or ditch 0.2
Thrown into garbage in plastic bag 85.3
Thrown into garbage without plastic bag 12.3
Buried 0
15
Left in the open 0
Don't Know 1
Total 100
5.5 Grey Water
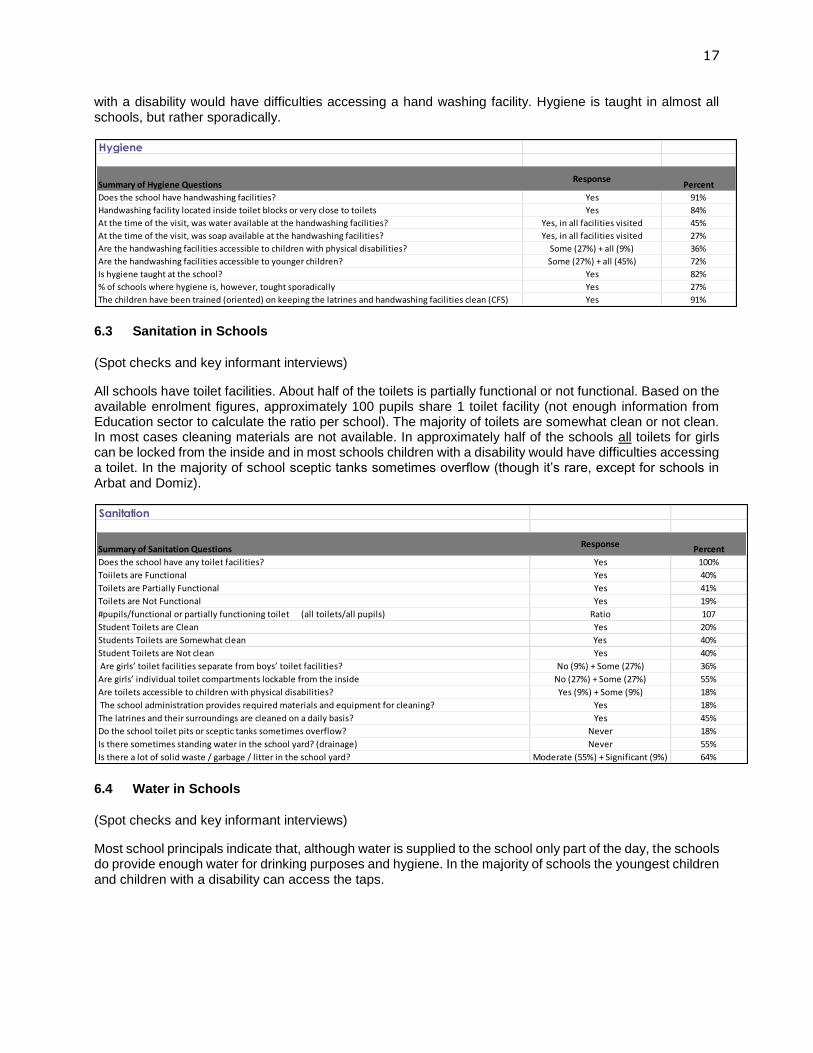
The assessment brings out the high percentage of households that do not adequately dispose of the grey water. As opposed to disposing it in a drain, ditch or toilet many families dispose of the grey water on the ground around the tent. There are considerable differences between camps (see below table). In some camps virtually all families follow this bad practice, in others almost none.
Grey Water Disposal On the ground around the dwelling
Yes No
Kawergosk 68.6% 31.4%
Darashakran 21.5% 78.5%
Qushtapa 80.4% 19.6%
Arbat 66.4% 33.6%
Akre 15.1% 84.9%
Basirma 98% 2%
Gawilan 53.1% 46.9%
Bajid Kandela 92.3% 7.7%
Domiz 1 37.8% 62.2%
Domiz 2 71.2% 28.8%
Domiz 3 65.9% 34.1%
Domiz 4 82.6% 17.4%
Domiz 5 3.1% 96.9%
57.6% 42.4%
5.6 Place for washing hands
A very high percentage of households have a designated place for hand washing in the house where water and soap are present. It is unlikely that such a result has ever been recorded by a WASH Sector in response to other humanitarian situation. It is inferred that hand washing with soap is a common practice. However, whether this is practiced at critical times is unknown.
Hand washing Is there a designated place for washing hands in the household (valid percent)
A designated place for washing hands
Is water present
Is soap present
Yes 97 88.6 94.4
No 3 11.4 5.6
Total 100 100 100
Many households use a bar of soap from the hygiene kit, but a high percentage of households acquire soap through the local market as well (see below table).
NB the number add up to over 100% because some households use soap from both the kits and the market.
Hand washing Origin of Soap
Valid percent
From hygiene kit 61.4
From local market 52.3
Don't Know 0.6

16
5.7 Communication
More than half of the families have access to a smart mobile phone and almost 90% have access to a television. On the contrary, very few people have access to a radio or read newspapers. These results can be used to inform hygiene promotion strategies.
Communication Does anyone in the household have
Valid percent
Radio 6.8
Mobile Phone (Smart) 53.7
Mobile Phone (Not Smart) 67.7
Television 86.6
Access to a newspaper in the last week 9.3
Access to the internet in the last week 8.8
6 Findings D: WASH in Schools
In a number of camps primary school-aged children can attend school. As part of the survey 11 school facilities across 6 camps have been assessed. Five facilities were tented, five were not-tented and one was partially tented. In each of these school buildings the WASH facilities were assessed using spot-checks. Additional information was collected through key-informant interviews with the school principle. A total of 27 focus group discussions were held with separate groups of boys and girls in high and low grades. The focus group discussions were organized in groups of 5 pupils.
In terms of the WASH facilities there are no significant differences between tented and non-tented schools. The below section shortly introduces the key-findings presented in four summary tables. The questionnaires are presented in Annex A and the complete set of findings per school are presented in an excel work book (Annex D).
6.1 Views of the pupils
(Focus group discussions)
The majority of pupils report not using the school toilets. Most feel nervous about using them. They report that most locks do not work, that many toilets are not properly separated by gender and that a large share of toilets is not cleaned. In addition many boys and girls point out that water is often not available inside the toilets (data not shown). Less than half of the pupils report that the school always provides water for drinking purposes though-out the school day.
6.2 Hygiene in Schools
(Spot checks and key informant interviews)
Practically all schools have hand washing facilities and most are near the toilet facilities, although soap and water are often now present. The availability of soap is particularly challenging. In most schools children
Views of the Pupils
Summary of FGD Response Percent
Do you ever use the toilet/ latrine at school yes 37%
Do you ever feel nervous about using the toilets/ latrines yes 59%
Do the locks work? yes 15%
What could be done to improve privacy? Locks that work (33%) + Gender Separation (24%) 57%
Is there water available for drinking at school? yes (44%) + Sometimes (33%) 77%
Who cleans the toilets? Nobody 41%
Do you ever feel nervous about using the toilets/ latrines - IN THE CAMPS Yes (22%) + Sometimes (15%) 37%
Do the locks work? - IN THE CAMPS Yes 70%
17
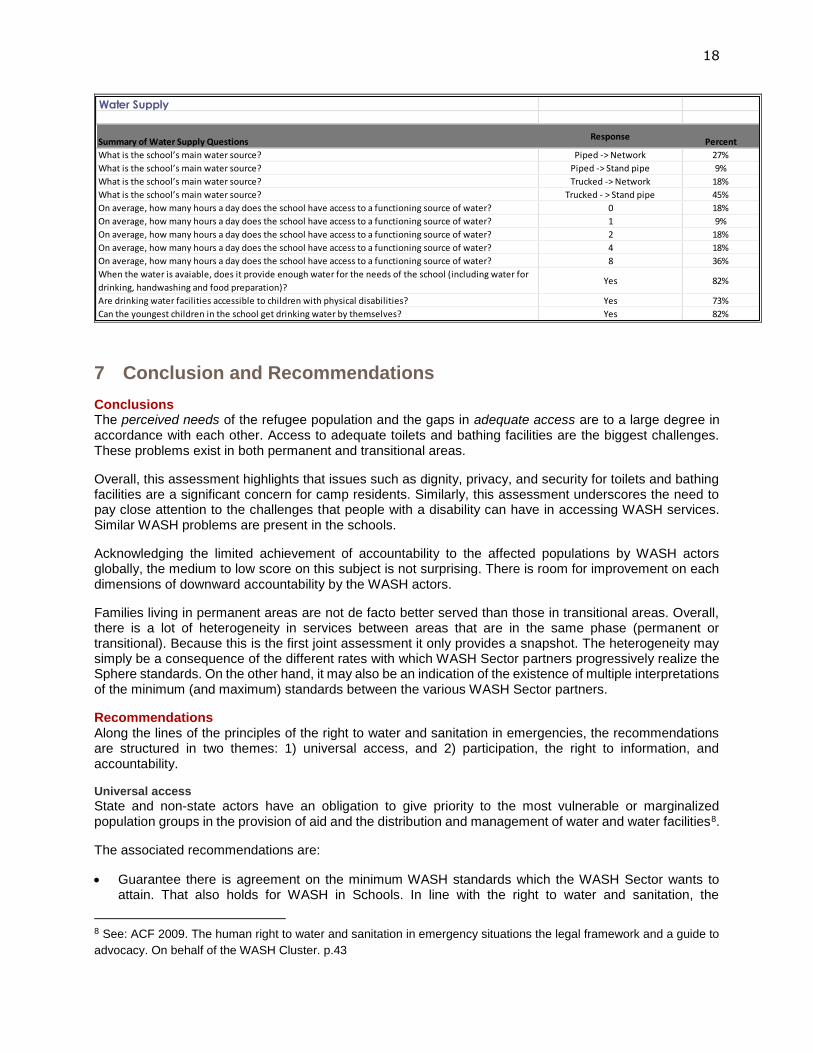
with a disability would have difficulties accessing a hand washing facility. Hygiene is taught in almost all schools, but rather sporadically.
6.3 Sanitation in Schools
(Spot checks and key informant interviews)
All schools have toilet facilities. About half of the toilets is partially functional or not functional. Based on the available enrolment figures, approximately 100 pupils share 1 toilet facility (not enough information from Education sector to calculate the ratio per school). The majority of toilets are somewhat clean or not clean. In most cases cleaning materials are not available. In approximately half of the schools all toilets for girls can be locked from the inside and in most schools children with a disability would have difficulties accessing a toilet. In the majority of school sceptic tanks sometimes overflow (though it’s rare, except for schools in Arbat and Domiz).
6.4 Water in Schools
(Spot checks and key informant interviews)
Most school principals indicate that, although water is supplied to the school only part of the day, the schools do provide enough water for drinking purposes and hygiene. In the majority of schools the youngest children and children with a disability can access the taps.
Hygiene
Summary of Hygiene QuestionsResponse
Percent
Does the school have handwashing facilities? Yes 91%
Handwashing facility located inside toilet blocks or very close to toilets Yes 84%
At the time of the visit, was water available at the handwashing facilities? Yes, in all facilities visited 45%
At the time of the visit, was soap available at the handwashing facilities? Yes, in all facilities visited 27%
Are the handwashing facilities accessible to children with physical disabilities? Some (27%) + all (9%) 36%
Are the handwashing facilities accessible to younger children? Some (27%) + all (45%) 72%
Is hygiene taught at the school? Yes 82%
% of schools where hygiene is, however, tought sporadically Yes 27%
The children have been trained (oriented) on keeping the latrines and handwashing facilities clean (CFS) Yes 91%
Sanitation
Summary of Sanitation QuestionsResponse
Percent
Does the school have any toilet facilities? Yes 100%
Toiilets are Functional Yes 40%
Toilets are Partially Functional Yes 41%
Toilets are Not Functional Yes 19%
#pupils/functional or partially functioning toilet (all toilets/all pupils) Ratio 107
Student Toilets are Clean Yes 20%
Students Toilets are Somewhat clean Yes 40%
Student Toilets are Not clean Yes 40%
Are girls’ toilet facilities separate from boys’ toilet facilities? No (9%) + Some (27%) 36%
Are girls’ individual toilet compartments lockable from the inside No (27%) + Some (27%) 55%
Are toilets accessible to children with physical disabilities? Yes (9%) + Some (9%) 18%
The school administration provides required materials and equipment for cleaning? Yes 18%
The latrines and their surroundings are cleaned on a daily basis? Yes 45%
Do the school toilet pits or sceptic tanks sometimes overflow? Never 18%
Is there sometimes standing water in the school yard? (drainage) Never 55%
Is there a lot of solid waste / garbage / litter in the school yard? Moderate (55%) + Significant (9%) 64%
18
7 Conclusion and Recommendations
Conclusions The perceived needs of the refugee population and the gaps in adequate access are to a large degree in accordance with each other. Access to adequate toilets and bathing facilities are the biggest challenges. These problems exist in both permanent and transitional areas.
Overall, this assessment highlights that issues such as dignity, privacy, and security for toilets and bathing facilities are a significant concern for camp residents. Similarly, this assessment underscores the need to pay close attention to the challenges that people with a disability can have in accessing WASH services. Similar WASH problems are present in the schools.
Acknowledging the limited achievement of accountability to the affected populations by WASH actors globally, the medium to low score on this subject is not surprising. There is room for improvement on each dimensions of downward accountability by the WASH actors.
Families living in permanent areas are not de facto better served than those in transitional areas. Overall, there is a lot of heterogeneity in services between areas that are in the same phase (permanent or transitional). Because this is the first joint assessment it only provides a snapshot. The heterogeneity may simply be a consequence of the different rates with which WASH Sector partners progressively realize the Sphere standards. On the other hand, it may also be an indication of the existence of multiple interpretations of the minimum (and maximum) standards between the various WASH Sector partners.
Recommendations Along the lines of the principles of the right to water and sanitation in emergencies, the recommendations are structured in two themes: 1) universal access, and 2) participation, the right to information, and accountability.
Universal access
State and non-state actors have an obligation to give priority to the most vulnerable or marginalized population groups in the provision of aid and the distribution and management of water and water facilities8.
The associated recommendations are:
Guarantee there is agreement on the minimum WASH standards which the WASH Sector wants to attain. That also holds for WASH in Schools. In line with the right to water and sanitation, the
8 See: ACF 2009. The human right to water and sanitation in emergency situations the legal framework and a guide to
advocacy. On behalf of the WASH Cluster. p.43
Water Supply
Summary of Water Supply QuestionsResponse
Percent
What is the school’s main water source? Piped -> Network 27%
What is the school’s main water source? Piped -> Stand pipe 9%
What is the school’s main water source? Trucked -> Network 18%
What is the school’s main water source? Trucked - > Stand pipe 45%
On average, how many hours a day does the school have access to a functioning source of water? 0 18%
On average, how many hours a day does the school have access to a functioning source of water? 1 9%
On average, how many hours a day does the school have access to a functioning source of water? 2 18%
On average, how many hours a day does the school have access to a functioning source of water? 4 18%
On average, how many hours a day does the school have access to a functioning source of water? 8 36%
When the water is avaiable, does it provide enough water for the needs of the school (including water for
drinking, handwashing and food preparation)?Yes 82%
Are drinking water facilities accessible to children with physical disabilities? Yes 73%
Can the youngest children in the school get drinking water by themselves? Yes 82%

19
achievement of universal access means realizing the agreed minimum standard for all is a first priority (augmenting services for populations who already enjoy this minimum level of access is secondary to universal minimum access9).
Consequently, make decisions on how best to address the gaps (particularly concerning adequate sanitation and bathing facilities).
Develop a better understanding of how to address the difficulties which people living with a disability have in accessing WASH facilities. Subsequently implement the consequent WASH services for these groups.
Develop a plan to track the progressively realization of access to a minimum level of WASH services
Participation, the Right to Information and Accountability
All people have the right to participate in decision-making processes that may affect their access and must be given full and equal access to information. Without access to information the beneficiaries cannot hold the WASH Sector to account. The recommendations are accompanied by the benchmarks developed by the Humanitarian Accountability Partnership (2010):
To improve the WASH Sector mechanism in each camp by which the refugee population is informed, consulted and involved.
o Access to Information: The WASH partner ensures that the people it aims to assist and other stakeholders have access to timely, relevant and clear information about the organisation and its activities.
o Participation: The WASH partner listens to the people it aims to assist, incorporating their views and analysis in programme decisions.
To improve the WASH Sector mechanism in each camp by which complaints are handled o Handling complaints: The WASH partner enables the people it aims to assist and other
stakeholders to raise complaints and receive a response through an effective, accessible and safe process.
9 Idem p.50

A
Annex A – Lessons Learned about the survey
In the preparation of the survey there were challenges in the following four areas:
Prioritization
Translation
Training
Testing
Prioritization Needs assessments must focus on the collection of information that is essential for decision making. In the initial stages the WASH sector aimed to develop a survey that would address approximately 40 indicators. A shortlist with indicators that generate essential information required by WASH Sector to make decisions is a prerequisite for survey design.
Translation Not enough time was taken to check and test the Arabic translation which has rendered the information produced by some questions unusable. The initial Arabic version produced by one of the default translators the UNICEF office uses for short notice translation jobs contained an unreasonable amount of mistakes. Strangely the surveyors from the partners did not sufficiently criticise the poor Arabic translation during their first field test (see testing). A thorough check by a WASH specialist before the second field test was critical.
Training There was insufficient information about the experience of the surveyors the Department of Health so kindly made available. During the workshop it became clear that many had never conducted a questionnaire before and that almost none had ever visited the refugee camps. The problem was overcome by pairing the DoH surveyors with NGO surveyors. Consequently, the questionnaires were conducted in teams. Interestingly, working in pairs was not perceived by the NGO as a burden. Rather they appreciated the participation of the DoH and were satisfied to build the capacity of the DoH staff (in Erbil). In Dohuk a number of DoH surveyors were taken off the survey after the first day. They didn’t appear to be motivated enough to collect accurate information.
Field Testing The biggest challenge during the field tests was the lack of critical feedback from the surveyors about the content and wording of the questions. This has caused the information produced by some questions to become unusable.
Kurdistan Region Statistics Office (KRSO) KRSO in Dohuk and Erbil have taken responsibility for data entry. The KRSO has the expertise to contribute to a better survey design. It’s recommended that they are involved at an earlier stage in the future.

B
Annex B – English and Arabic Versions of the Questionnaires Annex C – All Camp Data (excel workbook) Annex D – WASH in Schools Data (excel workbook)
Note: Annexes B, C and D available upon request. Please Contact: WASH Sector Coordinator, KRG
([email protected]) or UNICEF Iraq, Northern Zone Office.