Isolation and identification of bacteria from spent nuclear fuel pools
Upload
khangminh22Category
view
3download
0
SAFEGUARDS APPROACHES FOR SPENT NUCLEAR FUEL IN DRY CASK STORAGE
By
ALLEN IRA HARKNESS III
A DISSERTATION PRESENTED TO THE GRADUATE SCHOOL OF THE UNIVERSITY OF FLORIDA IN PARTIAL FULFILLMENT
OF THE REQUIREMENTS FOR THE DEGREE OF DOCTOR OF PHILOSOPHY
UNIVERSITY OF FLORIDA
2018

© 2018 Allen Ira Harkness III

To my parents, Ira Harkness and Donna Harkness To my wife, Caroli Harkness, and my son, Allen Ira Harkness IV

4
ACKNOWLEDGMENTS
Firstly, I would like to thank my advisor, Dr. Andreas Enqvist, for the continuous
support of my research, for his patience, motivation, and immense knowledge. I could
not have imagined a better advisor and mentor. Besides my advisor, I would like to
thank the other members of my Ph.D. committee, Dr. Yong Yang, Dr. Assel Aitkaliyeva,
and Dr. Jacob Chung for their insightful questions and comments, which led to a more
developed thesis.
The computational models developed in this research required the use of
HiPerGator at the University of Florida. I would like to thank the entire HiPerGator team
for the assistance provided. I also thank Eric Rauch at Los Alamos National Laboratory
for his assistance with the HI-STORM dry cask geometries in MCNP.
I would like to thank Dr. Gerhard Fuchs and Dr. Anthony Brennan for their
ongoing advice and encouragement since the very beginning of this endeavor. I would
like to thank current and past MSE department chairs, Dr. Michele Manuel, Dr. Jim
Baciak, and Dr. Simon Phillpot for allowing me to participate in the University of Florida
Employee Education program. I also thank fellow students, Chris Greulich, Kelsey
Stadnikia, Noah McFerran, Ryan Kelley, Yuan Gao, Yinong (Erika) Liang, Cat Barker,
Gareth Newman, and many others, for making my experience in the nuclear
engineering program truly rewarding.
Funding for this research was provided by a DOE-NEUP grant (Used Fuel
Storage Monitoring Using Novel 4He Scintillation Fast Neutron Detectors and Neutron
Energy Discrimination Analysis).

5
TABLE OF CONTENTS page
ACKNOWLEDGMENTS .................................................................................................. 4
LIST OF TABLES ............................................................................................................ 7
LIST OF FIGURES .......................................................................................................... 8
LIST OF ABBREVIATIONS ........................................................................................... 11
ABSTRACT ................................................................................................................... 12
CHAPTER
1 INTRODUCTION .................................................................................................... 14
1.1 Motivation ......................................................................................................... 14 1.2 Scope of Study ................................................................................................. 16
2 BACKGROUND AND LITERATURE REVIEW ....................................................... 18
2.1 Spent Nuclear Fuel ........................................................................................... 18 2.1.1 Design Specifications and Operating Parameters ................................... 19 2.1.2 Radioactive Sources in Spent Nuclear Fuel ............................................ 20
2.1.2.1 Neutron sources ............................................................................. 21 2.1.2.2 Other radioactive sources .............................................................. 22
2.1.3 Dry Cask Storage Systems ..................................................................... 23 2.2 Dry Cask Monitoring Methods ........................................................................... 24
2.2.1 Bonner Sphere Spectrometry .................................................................. 25 2.2.2 Dual Slab Verification Detector ................................................................ 25 2.2.3 Cosmic Ray Muon Tomography .............................................................. 26 2.2.4 Other Methods ......................................................................................... 26
2.3 Computational Methods for Spent Fuel Modeling ............................................. 27 2.3.1 Decay Codes ........................................................................................... 27 2.3.2 Radiation Transport Codes ...................................................................... 28
2.3.2.1 Deterministic methods .................................................................... 28 2.3.2.2 Monte Carlo methods ..................................................................... 29
2.3.3 Next Generation Safeguards Initiative ..................................................... 31 2.4 Helium-4 Detectors ........................................................................................... 32
2.4.1 Neutron Interactions ................................................................................ 33 2.4.2 Gamma Ray Interactions ......................................................................... 33 2.4.3 Spectral Response .................................................................................. 34
3 COMPUTATIONAL METHODOLOGY DEVELOPMENT ........................................ 36
3.1 ORIGEN-S ........................................................................................................ 36

6
3.2 MCNP ............................................................................................................... 37 3.3 MATLAB Linkage Code .................................................................................... 38 3.4 Errors and Uncertainties ................................................................................... 39
4 CHARACTERIZATION OF SPENT FUEL RODS AND ASSEMBLIES ................... 43
4.1 Methods ............................................................................................................ 43 4.2 Results and Discussion ..................................................................................... 44
4.2.1 Individual Spent Fuel Rod Characterization ............................................ 44 4.2.2 Applicability to Spent Fuel Assemblies .................................................... 47 4.2.3 Comparison to Other Neutron Source Term Calculations ....................... 48
4.3 Summary .......................................................................................................... 49
5 CHARACTERIZATION OF FAST NEUTRON EMISSIONS FROM SPENT FUEL IN DRY CASK STORAGE ...................................................................................... 59
5.1 HI-STORM 100S Dry Cask System .................................................................. 59 5.2 Methods ............................................................................................................ 60 5.3 Results and Discussions ................................................................................... 63
5.3.1 Spent Fuel Characterization Through Spectral Data ............................... 63 5.3.2 Identification of Diverted Assemblies Using Count Rates ........................ 67
5.4 Summary .......................................................................................................... 69
6 PREDICTING EXTERNAL NEUTRON COUNT RATES USING OPERATOR DECLARED INFORMATION .................................................................................. 81
6.1 Methods ............................................................................................................ 81 6.2 Results and Discussions ................................................................................... 82 6.3 Summary .......................................................................................................... 84
7 CONCLUSIONS ..................................................................................................... 90
LIST OF REFERENCES ............................................................................................... 93
BIOGRAPHICAL SKETCH ............................................................................................ 99

7
LIST OF TABLES
Table page 2-1 IAEA Significant Quantities of Nuclear Material .................................................. 35
3-1 Partial Table 40 from MCNP initialization ........................................................... 41
3-2 Partial Table 50 from MCNP initialization ........................................................... 42
4-1 Available fuel parameter combinations from NGSI Spent Fuel Library ............... 49
4-2 Comparison between spontaneous fission and (α,n) contributions. ................... 50

8
LIST OF FIGURES
Figure page 2-1 The 4He neutron elastic scattering cross section plotted against the 3He
neutron capture cross section............................................................................. 35
3-1 Workflow from NGSI spent fuel library to final transported spectra. ................... 42
4-1 NGSI 17x17 PWR assembly model from MCNP Visual Editor ........................... 50
4-2 Change in total neutron spectra for 4% initial enrichment and 15 GWd/MTU burnup spent fuel rods at various cooling times.................................................. 51
4-3 Change in neutron spectra by source for 4% initial enrichment and 15 GWd/MTU burnup spent fuel rods at various cooling times. ............................... 51
4-4 Change in neutron spectra by source for 4% initial enrichment and 30 GWd/MTU burnup spent fuel rods at various cooling times. ............................... 52
4-5 Change in neutron spectra by source for 4% initial enrichment and 45 GWd/MTU burnup spent fuel rods at various cooling times. ............................... 52
4-6 Change in neutron source strength as a function of cooling time for 4% initial enrichment and 15 GWd/MTU spent fuel rods.................................................... 53
4-7 Change in neutron source strength as a function of cooling time for 4% initial enrichment and 30 GWd/MTU spent fuel rods.................................................... 53
4-8 Change in neutron source strength as a function of cooling time for 4% initial enrichment and 45 GWd/MTU spent fuel rods.................................................... 54
4-9 Change in (α,n) reaction rate by α emitter as a function of cooling time for a 4% initial enrichment and 15 GWd/MTU burnup spent fuel rod. ......................... 54
4-10 Characteristic energy ranges for spontaneous fission and (α,n) neutrons. ......... 55
4-11 Change in neutron flux in characteristic energy ranges as a function of cooling time for 4% initial enrichment and 15 GWd/MTU spent fuel rods. .......... 55
4-12 Change in the (α,n) and spontaneous fission neutron flux ratio as a function of cooling time for 4% initial enrichment and 15 GWd/MTU spent fuel rods. ...... 56
4-13 Change in neutron flux in characteristic energy ranges as a function of cooling time for 4% initial enrichment and 30 GWd/MTU spent fuel rods. .......... 56
4-14 Change in neutron flux in characteristic energy ranges as a function of cooling time for 4% initial enrichment and 45 GWd/MTU spent fuel rods. .......... 57

9
4-15 Comparison of the neutron spectra for a 4% initial enrichment, 15 GWd/MTU, and 5-year cooling time spent fuel rod versus a complete assembly with the same parameters. ............................................................................................... 57
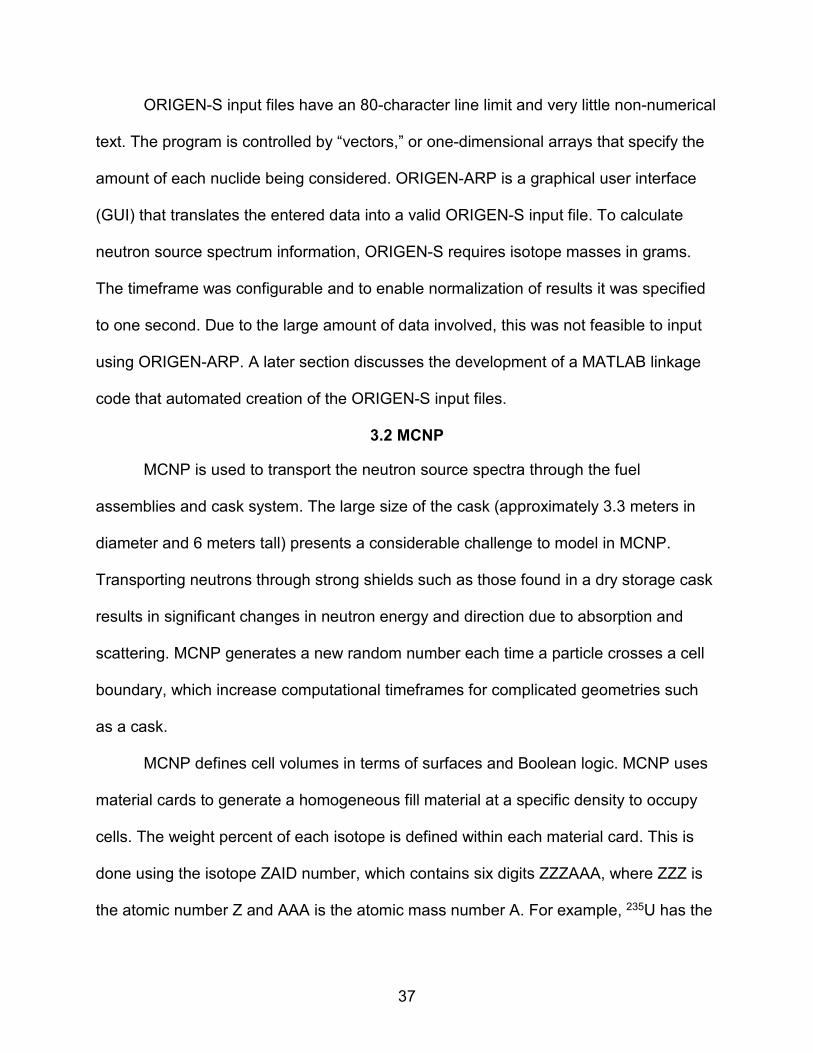
4-16 Comparison of the neutron spectra for a 4% initial enrichment, 15 GWd/MTU burnup PWR assembly at 5-year cooling time and a 40-year cooling time. ........ 58
5-1 Horizontal and vertical cross sections of the MCNP model of the HI-STORM 100S cask system. Helium-4 detectors are spaced equally around the cask. .... 71
5-2 A single Westinghouse 17x17 PWR assembly inside the MPC. ......................... 71
5-3 The loading pattern of 32 spent fuel assemblies in a HI-STORM 100S cask. .... 72
5-4 Surface flux tally (F2) on inside cylindrical surface of MPC. ............................... 72
5-5 Surface flux tally (F2) on outside cylindrical surface of concrete overpack. ........ 73
5-6 Neutron spectra emitted from casks containing spent nuclear fuel assemblies of varying parameters. ........................................................................................ 73
5-7 Change in neutron emissions on the outside cylindrical surface of the cask as a function of cooling time. ................................................................................... 74
5-8 Neutrons emissions using initial characteristic energy ranges for spent fuel assemblies with parameters of 4% initial enrichment and 15 GWd/MTU burnup. ............................................................................................................... 74
5-9 Neutrons emissions using initial characteristic energy ranges for spent fuel assemblies with parameters of 4% initial enrichment and 45 GWd/MTU burnup. ............................................................................................................... 75
5-10 Alpha/SF ratio using initial characteristic energy ranges as a function of cooling time for assemblies of various burnups. ................................................. 75
5-11 Neutrons emissions using revised characteristic energy ranges for spent fuel assemblies with parameters of 4% initial enrichment and 15 GWd/MTU burnup. ............................................................................................................... 76
5-12 Neutrons emissions using revised characteristic energy ranges for spent fuel assemblies with parameters of 4% initial enrichment and 45 GWd/MTU burnup. ............................................................................................................... 76
5-13 Alpha/SF ratio using revised characteristic energy ranges as a function of cooling time for assemblies of various burnups. ................................................. 77
5-14 Fast neutron fluence at each detector from full cask and casks with assemblies removed from 5 different locations................................................... 77

10
5-15 Percentage change in flux for each missing assembly location.. ........................ 78
5-16 Loading pattern and average neutron source terms (n/s) per assembly for three real casks provided by ORNL. ................................................................... 79
5-17 Neutron fluence at each detector for 3 different loadings. .................................. 80
6-1 Assembly numbers in a 17x17 PWR spent fuel assembly. ................................. 85
6-2 Contribution from each assembly to the total neutron flux on the outside cylindrical surface of the cask. ............................................................................ 85
6-3 Contribution from each assembly to a single detector located to the right of the cask. ............................................................................................................. 86
6-4 Contribution from each assembly to a single detector located at the upper right of the cask. ................................................................................................. 86
6-5 Loading pattern and average neutron source terms (n/s) per assembly for three real casks provided by ORNL. ................................................................... 87
6-6 Attenuation from the cask system and assemblies at specific detector locations. ............................................................................................................ 88
6-7 Matrix multiplication needed to calculate the external neutron flux at 100 detector locations around the cask. .................................................................... 88
6-8 Actual versus predicted neutron flux for detectors 64 to 87. ............................... 89

11
LIST OF ABBREVIATIONS
C&S Containment & Surveillance
DSVD Dual Slab Verification Detector
ENDF Evaluated Nuclear Data Files
GUI Graphical User Interface
GWd/MTU Gigawatt-days Per Metric Ton of Uranium
HEU High Enriched Uranium
IAEA International Atomic Energy Association
ISFSI Independent Spent Fuel Storage Installation
LEU Low Enriched Uranium
MC&A Materials Control & Accountability
MCNP Monte Carlo n-Particle
MPC Multipurpose Cannister
MTHM Metric Tons of Heavy Metal
NGSI Next Generation Safeguards Initiative
ORIGEN Oak Ridge Isotope Generation
ORIGEN-ARP Oak Ridge Isotope Generation – Automatic Rapid Processing
PMT Photomultiplier Tube
PWR Pressured Water Reactor
SCALE Standardized Computer Analyses for Licensing Evaluation
SFL Spent Fuel Library
SiPM Silicon Photomultiplier
SQ Significant Quantity

12
Abstract of Dissertation Presented to the Graduate School of the University of Florida in Partial Fulfillment of the Requirements for the Degree of Doctor of Philosophy
SAFEGUARDS APPROACHES FOR SPENT NUCLEAR FUEL IN DRY CASK
STORAGE
By
Allen Ira Harkness III
December 2018
Chair: Andreas Enqvist Major: Nuclear Engineering Sciences
Spent nuclear fuel is currently being stored in dry casks as an interim storage
solution. Demand for this storage method has increased globally and the IAEA has
expressed a need for robust safeguards and verification technologies for ensuring the
continuity of knowledge and integrity of radioactive materials inside dry casks. This
research supports the development of a fast neutron spectroscopy system using
helium-4 gas scintillation fast neutron detectors to convert the neutron spectra into
quantifiable signatures. The goal is to use these signatures to identify diversion/removal
of fuel.
This computational approach combines the Next Generation Safeguards Initiative
(NGSI) spent fuel libraries with a high-fidelity geometry for the HI-STORM 100S dry
cask storage system. This research developed a linkage code which uses ORIGEN-S to
calculate the neutron emissions from the spent fuel rods and MCNP 6.1 to perform the
transport and shielding calculations.
While many neutrons exiting the cask have interacted multiple times, some
higher energy neutrons are emitted with little or no scattering. The cooling time of spent
fuel can be identified using the total and relative contributions from spontaneous fission
13
and (α,n) reaction neutrons. We discovered that this technique is most successful when
examining spent fuel at lower burnups and when the spent fuel is not surrounded by a
concrete overpack.
Various diversion scenarios are analyzed to determine the ability to detect
missing assemblies by comparing the neutron flux fingerprint of a fully loaded cask to a
partially loaded cask. Neutron fluxes outside the cask, but nearby the missing
assemblies are 6% to 8% lower when compared to fluxes from a fully loaded cask. A
novel, computationally efficient method was developed to estimate the neutron flux at
specific locations outside the cask using the geometric effect from the dry cask system
and self-shielding from the assemblies, relative contribution from each assembly for the
specific azimuthal detector location, and the average neutron source term for each
assembly in the specific loading pattern. This work provides one possible solution to the
lack of prior fingerprints for existing casks.

14
CHAPTER 1 INTRODUCTION
The objective of this research is to understand the characteristics of the neutron
spectra emitted from spent fuel in dry cask storage to learn how passive neutron
spectroscopy can be used for safeguards and verification of spent fuel in dry cask
storage. This work supports the development of a fast neutron spectroscopy system
using helium-4 gas scintillation fast neutron detectors to convert the emitted geometry-
specific neutron flux into quantifiable signatures. The goal is to use these signatures to
identify diversion/removal of fuel and predict spent fuel parameters, such as cooling
time and burnup. While current safeguards strategies for interim storage casks focus on
containment and surveillance (C&S) techniques to maintain continuity of knowledge,
this technique offers a method to independently verify the contents inside.
1.1 Motivation
International Atomic Energy Association (IAEA) inspectors have safeguards
techniques and equipment for nuclear materials accountancy at various stages in the
fuel cycle [1]. However, upon reaching the interim storage stage there is not a readily
available method to independently verify the contents of a sealed dry storage cask. The
IAEA has stated that management of spent fuel is a “high priority in assuring the safe
and sustainable use of nuclear power” [2]. Dry cask storage was originally intended as
an interim storage solution, but is expected to be in use for a longer period due to the
current uncertainty regarding a final repository in the United States as of 2018.
According to the Congressional Research Service, there were 62,683 metric tons
of commercial spent fuel in the United States at the end of 2009. Of that total, 48,818
metric tons, about 78 percent, was stored in spent fuel pools. The remaining 13,856

15
metric tons, about 22 percent, was stored in dry storage casks [3]. The continued
accumulation of spent fuel is the largest proliferation risk in terms of amount of material
in the civilian fuel cycle.
The ultimate objective of safeguards is “the timely detection of diversion of
significant quantities of nuclear material from peaceful nuclear activities to the
manufacture of nuclear weapons or of other nuclear explosive devices or for purposes
unknown and deterrence of such diversion by the risk of early detection” [4]. Current
safeguards for dry storage casks rely heavily on containment and surveillance (C&S)
techniques, where seals are placed inside and outside the dry cask. However, if a seal
is broken or missing, the cask must be opened to verify the contents. Transporting and
opening the cask is costly and time consuming. A non-destructive assay (NDA) method
for verifying the operator’s declared contents of the cask is needed. Passive neutron
spectroscopy could meet this need.
Passive NDA methods rely on the detection of radiation emitted from materials.
Even with the significant amount of radiological shielding from the cask, enough
neutrons escape to enable passive neutron measurements outside a dry storage cask
[5]. This research models those escaping neutrons with the overall goal to support
development of a fast neutron detection system to verify spent fuel in dry cask storage.
While helium-4 fast neutron scintillation detectors are the proposed technology, the
results from this research could apply to many non-destructive neutron spectroscopy
technologies. This research could lead to numerous safeguards and materials control
and accountability (MC&A) applications including restoring continuity of knowledge in

16
cases of lapsed security, verifying that spent fuel shipments are as specified, and
deterring material diversions [6].
Computational simulations can investigate cask loading patterns and
discrepancies that are not readily measurable in the real world. These include missing
fuel assemblies and substitutions of fresh fuel for spent fuel. Simulations are also able
to model very diverse measurement scenarios, such as the neutron flux inside the cask
or 100 detectors outside the cask, which are experimentally unfeasible or would involve
exorbitant costs. It is important to note that computational simulations are not intended
to replace actual experiments. This research is intended to explore non-destructive fast
neutron characterization of spent fuel dry storage casks and guide decisions about the
most critical experiments to perform.
1.2 Scope of Study
The simulations presented in this dissertation have been created with the goal to
determine various characteristics of the neutron spectra emitted from spent fuel in dry
storage casks. This research progressed in simulation size and geometrical complexity,
started with an individual spent fuel rod, progressed to a complete assembly, and
finished with a complete dry storage cask containing up to 32 spent fuel assemblies of
different characteristics, mimicking realistic cask loadings. While other research used
simplified models that treated the fuel assemblies as a single homogenized fuel region,
this work used detailed models of each fuel assembly down to individual fuel rods with
cladding. In addition, the cask system geometry was modeled with details including the
baseplate, pedestal, lid top, lid shield and neutron absorbing plates.
Chapter 2 provides background information on specific topics relevant to the
content of the following chapters. Chapter 3 details the development of a methodology

17
to generate a neutron source term from spent fuel rods and transport the spectra.
Specific computational codes and techniques are covered. Chapter 4 describes the
efforts to characterize the neutron spectra of spent fuel rods and assemblies with
respect to parameters, such as cooling time and burnup. Chapter 5 analyzes various
spent fuel loading patterns inside the HI-STORM 100S dry cask system to determine if
the technique applied in Chapter 4 is still applicable. Chapter 6 discusses a novel
method to predict external neutron count rates using operator declared information and
cask simulations. Chapter 7 consists of concluding remarks. Suggestions for future
research and development are provided.

18
CHAPTER 2 BACKGROUND AND LITERATURE REVIEW
This chapter covers background information to better understand the challenges
of safeguarding spent nuclear fuel in dry cask storage. The first topics discussed include
spent nuclear fuel and dry cask storage systems. Safeguards methods, both those in
use and under development, for spent nuclear fuel in dry cask storage are then
examined. Previous computational methods for spent fuel modeling are reviewed to
show how this current work builds upon that foundation. This chapter closes with a
review of 4He gas scintillation detectors as one possible tool for safeguarding spent fuel
in dry cask storage using the techniques developed in this work.
2.1 Spent Nuclear Fuel
The core of a nuclear power reactor contains several hundred fuel assemblies.
The standard fuel assembly is columns of ceramic pellets of uranium oxide sealed
inside zirconium alloy tubes. To maintain efficient reactor performance, these fuel
assemblies are repositioned or replaced with fresh fuel on a 12-month to 24-month
cycle. The spent nuclear fuel (SNF) assemblies are highly radioactive when first
removed from the reactor so they are transferred to spent fuel pools to cool. This begins
the back-end of the fuel cycle.
The back-end of the fuel cycle encompasses on-site pool storage, interim dry
storage and eventual long-term disposal or reprocessing. Approximately 330,000 metric
tons of heavy metal are currently stored either in pools or dry casks with an additional
10,000 MTHM produced each year [7]. In the United States, the Nuclear Waste Policy
Act makes the government responsible for final disposal of spent nuclear fuel. Until
then, the individual utilities are responsible for storage. Other countries, such as

19
Sweden and Finland, are pursuing deep geologic repositories for final disposal based
on the Swedish KBS-3 design [8].
Spent fuel, containing plutonium produced during irradiation in the reactor,
presents a greater proliferation risk than fresh fuel [9]. The plutonium in the spent fuel
could be separated and turned into weapons-grade nuclear materials. The IAEA has
defined a significant quantity (SQ) as “the approximate amount of nuclear material for
which the possibility of manufacturing a nuclear explosive device cannot be excluded”
[10]. Table 2-1 shows the SQ of various nuclear materials. The SQ of plutonium is 8 kg.
For comparison, the SQ of highly enriched uranium (HEU) is 25 kg. For a ton of PWR
spent fuel with a burnup of 50 GWd/MTU, the spent fuel consists of about 93.4%
uranium (~0.8% 235U), 5.2% fission products, 1.2% plutonium and 0.2% minor
transuranic elements [11]. Thus, each ton of PWR spent fuel contains about 1.5 SQs of
plutonium. Overall, there are approximately 20,000 SQs (160,000 kg) of plutonium in
dry storage casks in the United States.
2.1.1 Design Specifications and Operating Parameters
A typical 17 x 17 PWR fuel assembly is a square lattice containing 264 fuel rods
and weighing about 550 kg. The physical dimensions are approximately 210 x 210 mm2.
A typical 9 x 9 BWR fuel assembly is a square lattice containing 74 rods and weighing
approximately 300 kg. The physical dimensions are approximately 140 x 140 mm2.
Spent nuclear fuel is characterized by certain operating parameters: initial enrichment,
burnup, cooling time, and irradiation history.
Initial Enrichment. Fraction of 235U in the fuel before any use in the reactor. For
most commercial light water reactors, the uranium is enriched to 3% to 5% 235U.
20
Burnup. Measurement of how much energy was produced by the fuel. This is
commonly expressed in gigawatt days per ton of uranium (GWd/tU) and routinely
provided by the operator in fuel declarations [12].
Cooling Time. Amount of time since the fuel was last irradiated. Spent fuel
initially spends time in wet storage, commonly a pool of water, before it is moved to dry
storage.
Irradiation History. Duration of irradiation and shutdown time in the reactor can
impact isotope concentrations. This is most noticeable for isotopes with a short half-life
compared to common fuel irradiation times, such as 242Cm with a half-life of about 160
days [13]. Khan and Ahmad have shown that the irradiation history of the fuel affects
fission product inventory even if the fuel reaches the same final burnup [14].
2.1.2 Radioactive Sources in Spent Nuclear Fuel
Over time, the isotopes found in spent nuclear fuel change due to the ongoing
decay process. When radioactive isotopes decay, they can emit neutrons, gamma rays
and other particles. The abundance of an isotope decreases with time, t, according to
Equation 2-1. This is also known as the radioactive decay law.
teNN λ−= 0 (2-1)
The radioactive decay law can also be expressed as the differential equation
shown in Equation 2-2.
tdtdN λ−= (2-2)
The half-life, t1/2, of an isotope is the time taken for a quantity of nuclei of that
isotope to decay to half the original number. It is shown in Equation 2-3.

21
λ
2ln2/1 =t (2-3)
2.1.2.1 Neutron sources
Most of the total neutron emissions from spent fuel are produced from
spontaneous fission of heavy nuclides. Most of the remaining total neutron emissions
are produced from 17O(α,n) and 18O(α,n) reactions in the UO2 in the spent fuel.
Large nuclei with a high neutron to proton ratio can undergo spontaneous fission
in which the nucleus splits into two separate fission products with different atomic
numbers and atomic masses. Spontaneous fission releases large amounts of energy
and usually several neutrons. The energy of spontaneous fission neutrons
approximately follows a Watt spectrum. One example of spontaneous fission is 240Pu is
shown in Equation 2-4.
nYCsPu 10
9639
14055
24094 4++→ (2-4)
Many actinides in spent fuel will undergo spontaneous fission. However, the
neutrons produced from 242Cm and 244Cm make up the majority of the total neutron
source spectra. 242Cm has a half-life of 162.8 days, so it is only relevant at shorter
cooling times. For cooling times greater than a few years, 244Cm, with a half-life of 18.2
years, will be the primary producer of spontaneous fission neutrons, often accounting
for over 90% of the total neutron production. Typical PWR spent fuel contains 20 to 50 g
of curium per 500 kg U (approximately one assembly) which yields a total neutron rate
from spontaneous fission of 3 x 10⁸ to 8 x 10⁸ neutrons per second per assembly [15].
The other source of neutron production in spent fuel is from (α,n) reactions with
17O and 18O as shown in Equations 2-5 and 2-6 respectively.

22
nNeO +→+ 2017α (2-5)
nNeO +→+ 2118α (2-6)
The incident alpha particle can be emitted by alpha emitters present in spent fuel,
such as uranium or plutonium, shown in Equations 2-7 and 2-8 respectively.
α+→ ThU 23490
23892 (2-7)
α+→ UPu 23692
24094 (2-8)
The alpha particle starts with an energy in the range of 4 to 6 MeV. In the case of
uranium oxide, where oxygen is mixed with the alpha emitting material, an alpha particle
can reach the oxygen before it loses all its energy. The (α,n) reaction with oxygen
produces a softer spectrum of neutron energies with a peak between 2.5 and 3.0 MeV
[16]. Due to the kinematics involving alpha particles at maximum energy, the (α,n)
reaction neutrons are limited to 5.96 MeV for 17O interactions and 4.62 MeV for 18O
interactions [17]. Although 16O is plentiful in spent fuel, it needs alpha particles with
energies above 15 MeV for the (α,n) reaction to occur [18].
Spontaneous fission and (α,n) reactions are the primary source of neutrons in
spent fuel. Other reactions such as (γ,n), (n,n’), and (n,2n) may occur, but are only a
minor contribution to the observed count rate.
2.1.2.2 Other radioactive sources
When radioactive isotopes decay, they can also emit gamma rays. The energy of
the gamma rays is specific to the isotopes and emitted as a known fraction of decays.
For spent fuel, these include decays of fission products and actinides. Significant
gamma ray source contributors include 137Cs, 154Eu, 134Cs, 125Sb, 106Rh and 85Kr [19].

23
Other types of radiation, such α and β, are not as relevant for spent fuel due to the low
penetration capability.
2.1.3 Dry Cask Storage Systems
The previous section provided information about spent fuel and the need for
safeguards. This section discusses dry cask storage systems, a common method for
interim storage of spent fuel. Current NRC regulations permit re-racking the spent fuel
pool grid and fuel assembly consolidation. This has allowed significantly more storage in
spent fuel pools than originally designed. However as spent fuel pools near capacity
and no current commercial reprocessing plants available, the spent nuclear fuel is
moved into dry cask storage at independent spent fuel storage installations (ISFSIs),
usually operated by the utility.
Dry cask storage systems are designed to provide radiological shielding, cooling,
and structural protection. All dry cask storage systems undergo a safety review before
certification by the NRC. Licensing or certification for dry casks is for 20-year periods.
Renewals for up to 40 years are possible. The goals of a dry storage cask are to
maintain sub-criticality, remove decay heat, provide safe enclosure of the radioactive
materials, and provide proper shielding of radiation [20].
Most spent fuel casks are designed with heat load and neutron shielding as the
limiting factors from the first day [21]. Dry storage casks must also meet criticality safety
requirements set forth in ANSI/ANS 8.1 and the Code of Federal Regulation, Title 10,
Part 72 which require systems such as storage and transportation casks to be designed
such that the multiplication factor, keff, plus all uncertainty remains below 0.95 [22]. This
provides a 0.05 margin of safety to stay below criticality (keff = 1.0). The criticality safety

24
requirements consider fully flooded conditions. These limitations are imposed from the
first day the spent fuel is put into the cask. Afterwards, heat load and neutron flux both
decrease.
Most dry cask storage systems today are the canister-overpack model. Single
purpose cask systems are licensed to store spent fuel. Dual purpose casks are licensed
for storage and transportation. A true multipurpose cask system would be licensed for
storage, transportation, and final disposal in a geologic repository. There are currently
no finalized specifications from the Department of Energy for acceptable containers for
geologic disposal.
2.2 Dry Cask Monitoring Methods
The ISFSIs have accurate records from when the fuel was originally verified at
the loading facility. However, after fuel has been cooled and stored for decades, details
of these earlier verifications may not be available. This loss of continuity of knowledge
presents a considerable proliferation risk that must be mitigated using safeguards.
International Atomic Energy Association (IAEA) safeguards consider spent fuel
storage an “item facility” as the nuclear materials are counted as either an assembly or
a cask. Safeguards procedures for items include counting, identification, examination of
integrity, non-destructive assay (NDA), and surveillance. While the casks can be
counted, this does not ensure the verification or integrity of the nuclear material inside
the casks due to their sealed nature. NDA methods offer the possibility of independent
verification of cask contents.
NDA techniques can be split into passive and active methods. Passive methods
rely on the detecting radiation emitted by the spent fuel itself. Active NDA methods use
gamma ray or neutron sources to interrogate the spent fuel. Interrogative sources

25
include 252Cf, AmLi, PuBe, DT generators and electron accelerators. Some active NDA
methods are able to vary the energy and intensity of the interrogating radiation to
emphasize the desired properties of the spent fuel [4].
2.2.1 Bonner Sphere Spectrometry
The primary method of cask monitoring uses a Bonner sphere spectrometer. The
Bonner sphere spectrometer uses a thermal neutron detector, commonly 3He or BF3,
inside polyethylene spheres of varying nominal diameters [23]. Smaller polyethylene
spheres allow low energy neutrons to pass through and be detected, while fast neutrons
are not moderated enough to reach thermal energy and are not detected. Thicker
polyethylene spheres capture low energy neutrons and result in no detection, while fast
neutrons are moderated and detected.
The neutron energy spectrum can be estimated by correlating the count rate
detected by each sphere. Bonner spheres are advantageous due to the wide energy
range, however the energy resolution is limited due to the smooth fluence response
functions of any thermal neutron detector [24]. They are more commonly used as a
dosimeter for radiation protection purposes than as true spectrometers.
2.2.2 Dual Slab Verification Detector
The Dual Slab Verification Detector (DSVD) was developed and built by Los
Alamos National Laboratory for safeguarding the spent fuel from the BN-350 sodium-
cooled fast reactor. BN-350 assemblies have a hexagonal cross section with uranium
oxide rods. Storage casks held between four to eight of these assemblies. The DSVD
uses two rows of 3He tubes embedded in a slab of polyethylene. It can fingerprint a
cask and has appropriate sensitivity to both the amount and locations of nuclear
material inside the cask. A preliminary analysis of measurements using the DSVD show

26
the total uncertainty associated with verifying the neutron fingerprint of a dry storage
cask is approximately ± 3% [25]. Past fingerprints can be compared to a current
measurement to detect if spent fuel has been removed. However, it cannot
independently verify the contents of the cask.
2.2.3 Cosmic Ray Muon Tomography
Recently a number of groups have explored muon tomography as a potential
NDA method to produce images of the interior of casks [26]. Muons penetrate cask
shielding and can be used to distinguish between a fully loaded dry cask and one with a
fuel assembly missing [27]. However, measurement times on the order of weeks to
several months is needed. Research in this area is focused on increasing detector
efficiency through gamma rejection and determining whether this technique can detect
more complicated diversion scenarios, such as dummy and partially filled assemblies.
2.2.4 Other Methods
Other methods under development include techniques to create unique
signatures of dry casks based on the radiation sources present in spent fuel and the
neutron absorbers found in a specific cask design [28]. This method requires before and
after measurements for comparison and cannot independently verify the contents of the
cask.
The lack of a readily available method for independently verifying the contents of
the spent fuel casks highlights the need for a new method of cask monitoring. Methods
that rely on an initial fingerprint measurement are not feasible since most casks have
been loaded before that method was identified. Independent verification of the contents
of spent fuel casks using passive neutron spectroscopy requires knowing what the
spectrometer should be measuring. Because of the resources needed for actual

27
measurements, computational methods offer a cost-effective way to determine the
feasibility of a technique and could bridge the gap for existing casks by modeling that
initial fingerprint.
2.3 Computational Methods for Spent Fuel Modeling
Computational methods exist for a wide variety of nuclear engineering fields. This
section focuses on those developed for radioactive decay and radiation transport as
these are most applicable to spent fuel modeling. Examples of prior research are
discussed to show how the current work has built upon the previously available
capabilities.
2.3.1 Decay Codes
Decay codes calculate the amount of any isotope at any given time. This is done
through calculating the buildup and decay of different isotopes. Radioactive decay can
occur multiple ways including alpha decay, beta decay, spontaneous fission, etc. Decay
chains are a series of radioactive decays to different isotopes until a stable isotope is
reached.
The modern ORIGEN-S code was developed from the ORIGEN (Oak Ridge
Isotope GENeration) code in the late 1970s as a depletion and decay analysis code for
SCALE (Standardized Computer Analyses for Licensing Evaluation). The ORIGEN-S
code currently tracks 1119 individual fission products generated in the fuel during
irradiation, 129 actinides and 698 isotopes associated with structural and/or activation
components. Most of the decay data, cross sections, and fission products yields use the
evaluated nuclear data files (ENDF). The primary advantage of ORIGEN-S for spent
fuel safeguards is the ability to accurately and quickly predict neutron emissions from
spent fuel. The neutron source calculation is based on methods from the SOURCES
28
code, using spontaneous fission Watt spectral parameters for 41 actinides and a matrix-
dependent (α,n) source method using (α,n) cross sections and yields for alpha particles
on 19 target nuclides, including 17O and 18O [29].
2.3.2 Radiation Transport Codes
Radiation transport theory is based on the Boltzmann transport equation devised
by Ludwig Boltzmann in 1872. The neutron transport equation has many independent
variables, such as time t, energy E, position r, and direction vector Ω. The neutron
transport equation can be solved by deterministic methods [30], Monte Carlo methods
[31], or a hybrid of both [32].
2.3.2.1 Deterministic methods
The neutron emissions from spent fuel have been studied using computational
methods for over 30 years. In 1982, Bosler et al. used calculated models to predict the
buildup of neutron-producing isotopes and found correlations between characteristics of
the neutron signal and fuel parameters [33].
When given the same input a deterministic method will always produce the same
result. Deterministic methods use a system of linear equations to create a
computational grid. The size of this grid is “the number of angular directions times the
number of spatial grid points times the number of energy groups considered” [34]. For
simple geometries, this can lead to quick approximations. However, this method is not
feasible for complex geometries or spectra.
In 1987, computational models using ORIGEN-2 and ANISN verified a shielding
design of shipping casks for PWR spent fuel assemblies [35]. ORIGEN-2 was used to
calculate the buildup of various fission products, activation products, and higher-order
actinides during irradiation. From this, they were able to generate an 18-group gamma

29
ray source spectrum and a 22-group neutron spectrum. The cask shielding effect was
calculated using the deterministic ANISN code to perform the one-dimensional
multigroup neutron and gamma ray transport calculations for the neutron and gamma
ray source terms.
2.3.2.2 Monte Carlo methods
In contrast, Monte Carlo methods can address any complex geometry or spectra.
The first known reference of using Monte Carlo methods to solve particle transport
problems on computers is a letter from J. von Neumann to R. D. Richtmyer in 1947 [36].
Metropolis and Ulam suggested the use of many computers working in parallel in 1949
[37]. This has now become the standard approach for Monte Carlo calculations.
The Monte Carlo method simulates stochastic processes. Probability distributions
are randomly sampled to track a particle from its source point to its termination point.
Along the way, a particle can undergo scattering, fission, absorption, escape, etc. A
general survey on the numerical methods used in Monte Carlo is available from Kalos
and Whitlock [38]. Monte Carlo N-particle (MCNP) is a popular particle transport code
that uses Monte Carlo methods.
MCNP is a general-purpose code that can be used to calculate continuous
energy, three-dimensional, neutron-photon-electron transport. The continuous energy
cross section data allow linear interpolation between energy points. MCNP includes
multiple source types including fixed sources (SDEF), criticality sources (KCODE), and
surface sources (SSW/SSR). It also offers a flexible tally structure, an extensive cross-
section library, and numerous variance reduction techniques. MCNP and the ENDF
data have been benchmarked against experimental data [39]. Today’s advanced
computational resources offer the ability to perform large, detailed simulations and

30
accumulate massive amounts of data. A thorough primer on MCNP is available from
Shultis and Faw [40].
Spent fuel casks, with thick shielding and large source volumes, present difficulty
for Monte Carlo three-dimensional transport calculations. The thick shielding results in
large attenuation of neutron source intensity between the source and the detector. The
large source volume results in a significant self-shielding effect for the inner source
region [41]. Additionally, the complicated geometry presents challenges since MCNP
calculates a new random number to check for interactions as a particle passes through
each cell. Large numbers of neutrons must be simulated to obtain statistically relevant
results. This is computationally intensive so simulations of spent fuel inside dry casks
often involve compromises to ensure reasonable calculation times.
One option is to simplify the MCNP model by homogenizing the fuel and the
holding basket within the cask. This reduces the number of random number calculations
by reducing the number of cells. However, this represents an enormous simplification as
it eliminates the detailed modeling of each fuel pin and the basket structure. In 2000,
Shultis took this approach to calculate neutron and gamma ray dose rates from a TN-68
cask [42].
In 2008, Smith et al. calculated the distribution of neutron energies through walls
of a TN-32 cask [43]. Components of the spent fuel assemblies and the cask were
modeled with more detail. However, only one assembly loading pattern was modeled,
consisting of assemblies with burnup levels ranging from 35 to 38 GWd/MTU. This work
showed that MCNP was able to transport neutrons through walls of the cask with
general agreement to experimental data.

31
2.3.3 Next Generation Safeguards Initiative
The Next Generation Safeguards Initiative (NGSI) of the U.S. Department of
Energy began a five-year research effort in March 2009. A set of virtual spent fuel
libraries of varying isotopic distributions and parameters were created to allow for a
direct comparison of different NDA techniques. This also allowed analysis of how the
varying isotopic distributions result in different radiation emissions.
The first phase of the NGSI effort resulted in the creation of Spent Fuel Library
number 1 (SFL1) by Fensin et al. using MCNPX burnup capabilities [44]. SFL1 is a
17x17 pressurized water reactor (PWR) fuel bundle with reflective boundary conditions
on all sides and 1/8 assembly symmetry. SFL1 used the MCNPX depletion capability
with about 80 isotopes included. The second phase resulted in the creation of Spent
Fuel Library number 2 (SFL2) which more accurately models the asymmetrical spectral
effects resulting from a fuel shuffling sequence [45]. SFL2 used Monteburns, a linkage
code between MCNP and Cinder90, and treated each rod as a single radial zone with
approximately 130 isotopes [46]. Part of SFL2, referred to as SFL2a, has assemblies
that were shuffled using scheme #1 with initial enrichments of 2%, 3%, 4%, and 5%.
The other part of SFL2, referred to as SFL2c, has assemblies that were shuffled using
fuel shuffling schemes #2 and #3 with an initial enrichment of 4% [47].
Weldon et al. used these spent fuel libraries to develop methodologies for
calculating and characterizing neutron emissions of PWR spent fuel assemblies [48].
While this study provided details regarding the neutron emissions for spent fuel
assemblies of various parameters, it purposefully did not calculate the transport effects
due the complexity involved.

32
Developing passive neutron spectroscopy for safeguards and verification of
spent fuel in dry cask storage requires extensive knowledge about the neutron
emissions from the cask. Characterizing the neutron emissions from a dry cask requires
transporting an accurate neutron source spectrum through the complex geometry of a
variety of spent fuel assembly loading patterns inside of a dry cask system with enough
particle runs to obtain adequate statistics. This work fills gaps in the literature by
examining multiple spent fuel assembly loading patterns, using detailed geometries for
the spent fuel assemblies and dry cask system, and transporting the neutrons from
each individual rod to the outside of the cask.
2.4 Helium-4 Detectors
New safeguards and verification methods require an appropriate detector to
measure the actual neutron emissions and compare to the expected neutron emissions.
Arktis Radiation Detectors manufactures the 4He detectors for the proposed fast
neutron spectroscopy system. There are two versions, one with a photomultiplier tube
(PMT) and one with a silicon photomultiplier (SiPM). The PMT version has a detection
volume with an active length of 20 cm with an inner diameter of 4.4 cm, for a total active
volume of 304 cm3. Inside this volume is 4He gas that is slightly doped with other gases
at a pressure of 150 bar.
There is a vastly abundant supply of 4He, compared to 3He. Although 3He
detectors have a long history in nuclear safeguard efforts due to their high efficiency,
robustness and relatively low costs, the worldwide shortage of 3He has necessitated the
investigation of alternative neutron detectors [49]. This concern along with other benefits
of the 4He detectors has led this to be the chosen detector.

33
2.4.1 Neutron Interactions
The 4He detector functionality works based on elastic scattering of a fast neutron
with the helium gas. The 4He neutron elastic scattering cross section, shown in Figure
2-1, has a peak around 1 MeV which gives the detector a high efficiency for detecting
fission neutrons as compared to the neutron capture cross section of 3He.
As fast neutrons move through the helium fill gas, they undergo elastic scattering
and transfer a fraction of their kinetic energy to the 4He nucleus dependent on the
scattering angle. In elastic scattering, the neutron loses energy and travels in a different
direction as shown in Equation 2-9. The 4He recoil nucleus obtains a large kinetic
energy and leaves the electrons behind. The recoiled alpha particle interactions with
other helium atoms through excitation or ionization. Scintillation light is then emitted
during the de-excitation.
neHHen ′+′→+ 44 (2-9)
4He is a relatively efficient scintillator, producing approximately 15,000
scintillation photons per MeV deposited energy by neutrons [50]. In comparison, liquid
xenon offers between 7000-9000 scintillation photons per MeV deposited by fast
neutrons [51]. The maximum energy transfer in a single scattering interaction is limited
to 64% of the neutron’s energy due to the factor-of-four mass difference between a
neutron and 4He atom.
2.4.2 Gamma Ray Interactions
An additional advantage of 4He detectors is their insensitivity to gamma rays.
This is a significant advantage over liquid scintillators. This is primarily due to the low
atomic number of helium (Z=2) offering a low electron density. The attenuation length of

34
a 1 MeV gamma ray in 150 bar of helium (0.0264 g/cm3) is shown to be approximately
600 cm using Equation 2-10.
11 595 l cmγ
µµ ρρ
−
− = = =
(2-10)
If a gamma ray does interact, the recoil electron travels through the gas and
loses energy through bremsstrahlung interactions. The low density of the gas results in
low rates of energy deposition and further travel, usually all the way to the detector wall.
The 4He detectors can also discriminate gamma radiation versus neutron
radiation through pulse shape discrimination. This feature is especially important for
spent fuel applications as spent fuel has a strong gamma ray background.
2.4.3 Spectral Response
The 4He detectors are also able to provide information on the energy of the
neutrons. Neutron interactions transfer energy to the 4He nucleus as a probabilistic
function of the neutron’s recoil angle [52]. The amount of light emitted through
scintillation is directly related to the energy transferred by the neutron. Thus the 4He
detectors should be able to differentiate between neutrons in the spontaneous fission
energy range and neutrons in the (α,n) energy range.

35
Table 2-1. IAEA Significant Quantities of Nuclear Material [10] Material Quantity of Safeguards
Significance Direct-use nuclear material Pu 8 kg Pu 233U 8 kg 233U High Enriched Uranium (235U ≥ 20%) 25 kg 235U Indirect-use nuclear material Low Enriched Uranium (235U < 20%) 75 kg 235U Th 20 t Th
Figure 2-1. The 4He neutron elastic scattering cross section plotted against the 3He
neutron capture cross section [52].

36
CHAPTER 3 COMPUTATIONAL METHODOLOGY DEVELOPMENT
Computational methods include use of the NGSI Spent Fuel Library, ORIGEN-S,
MCNP, and creation of MATLAB linkage code. The NGSI Spent Fuel Library addresses
the geometry and composition of spent fuel assemblies. ORIGEN-S is used to generate
neutron source terms using decay data. MCNP is used to simulate the neutron transport
through the fuel assemblies and cask system. The MATLAB linkage code is used to
transfer material composition data from the NGSI spent fuel library to ORIGEN-S for
neutron source term generation, and then use MCNP for transport and shielding
calculations.
3.1 ORIGEN-S
The neutron source spectra and intensities are calculated using ORIGEN-S
based on the known compositions of assemblies from the NGSI spent fuel libraries.
ORIGEN-S quickly produces a neutron source term for a given mass and composition
of spent fuel using standardized decay data. The neutron source calculated by
ORIGEN-S includes neutrons produced from both spontaneous fission and (α,n)
reactions originating from the decay of to heavy nuclides. The alpha particle is emitted
from the decay of a heavier element and can initiate a nuclear reaction in lighter
elements, such as the transformation of oxygen to neon, while emitting a neutron. The
neutrons from photofission and photoneutron reactions are excluded since their
intensity is minimal in the case of spent fuel. The typical minimal threshold energy for a
photonuclear reaction, about 8 MeV, is much higher than the typical energy of gamma
rays emitted from radioactive nuclides in spent fuel [53].
37
ORIGEN-S input files have an 80-character line limit and very little non-numerical
text. The program is controlled by “vectors,” or one-dimensional arrays that specify the
amount of each nuclide being considered. ORIGEN-ARP is a graphical user interface
(GUI) that translates the entered data into a valid ORIGEN-S input file. To calculate
neutron source spectrum information, ORIGEN-S requires isotope masses in grams.
The timeframe was configurable and to enable normalization of results it was specified
to one second. Due to the large amount of data involved, this was not feasible to input
using ORIGEN-ARP. A later section discusses the development of a MATLAB linkage
code that automated creation of the ORIGEN-S input files.
3.2 MCNP
MCNP is used to transport the neutron source spectra through the fuel
assemblies and cask system. The large size of the cask (approximately 3.3 meters in
diameter and 6 meters tall) presents a considerable challenge to model in MCNP.
Transporting neutrons through strong shields such as those found in a dry storage cask
results in significant changes in neutron energy and direction due to absorption and
scattering. MCNP generates a new random number each time a particle crosses a cell
boundary, which increase computational timeframes for complicated geometries such
as a cask.
MCNP defines cell volumes in terms of surfaces and Boolean logic. MCNP uses
material cards to generate a homogeneous fill material at a specific density to occupy
cells. The weight percent of each isotope is defined within each material card. This is
done using the isotope ZAID number, which contains six digits ZZZAAA, where ZZZ is
the atomic number Z and AAA is the atomic mass number A. For example, 235U has the

38
ZAID number 092235. This allows MCNP to reference given cross section data for the
isotope in the ENDF/B-VII database.
Various types of tallies are used to track information of interest about the
particles as they pass through the defined geometry. All tallies are normalized to one
source particle. This research utilized the average surface flux tally (F2) and the
average cell flux tally (F4) to track the number and energy of neutrons. Each tally is
separated into different energy bins and recorded with units of particles per square
centimeter. Due to the earlier normalization in ORIGEN-S source term generation to
one second, this was easily converted into a neutron flux.
3.3 MATLAB Linkage Code
One of the goals of this work is to develop accurate transported neutron spectra
for spent fuel inside a dry storage cask. This required creation of a MATLAB linkage
code since ORIGEN-S and MCNP use completely different formats for inputting and
outputting data. Figure 3-1 shows the steps necessary to move between programs and
obtain useful results.
Step 1: NGSI Spent Fuel Library. The NGSI spent fuel libraries are in MCNP
format with detailed geometry for the entire assembly and material compositions for
each fuel rod. To generate a neutron spectrum, this information must be processed into
an ORIGEN-S input file. This was completed using a similar methodology as the
General Automated Transition of Required data for SOURCES (GATORS) [6].
Step 2: Extract Data. Running an MCNP input file in initialization mode with the
table option in the command line prints relevant tables needed. Print table 40 contains
the mass fraction information for each isotope. Table 3-1 shows a partial table 40. Print
table 50 contains the total mass for each cell. Table 3-2 shows a partial table 50.

39
Multiplying the mass fraction and the total mass for each cell computes cell-based
isotope masses in grams, which is required for the ORIGEN-S input file. A bash script
was used to execute MCNP using only the initialization option for all files in the NGSI
spent fuel library to generate the necessary data tables.
Step 3: ORIGEN-S Input File. The MATLAB linkage code was used to read the
MCNP input files that now contained table 40 and 50. This script then built ORIGEN-S
input files using a template and inserting relevant data from each rod. Documentation
on the ORIGEN-S input format is available from Crabbs [54].
Step 4: Execute ORIGEN-S. ORIGEN-S was executed for each rod using a
bash script.
Step 5: Neutron Spectra. The ORIGEN-S output files present details for all
neutron source activity in each rod.
Step 6: MCNP Input File. A MATLAB script converted the neutron source
spectra into MCNP format and built an updated MCNP input file.
Step 7: Execute MCNP. MCNP was executed to transport the neutron spectra
and collect data using tallies.
Step 8 Transported Spectra. The final MCNP output file contains neutron
energy spectral data that is analyzed to provide useful results.
3.4 Errors and Uncertainties
Computer simulation models imply uncertainties from inherent approximations
and from input parameters, such as cross sections [55]. Uncertainty in calculations is
due to the uncertainty in physics data and simplifications in modeling techniques [56].
Uncertainties begin in the initial isotope compositions from the NGSI spent fuel libraries.
Upon carrying these isotopic compositions to ORIGEN-S the next variable is the

40
uncertainties in decay constants and fission spectra. Then MCNP has uncertainties in
the cross sections as the neutrons are transported through the geometry. Uncertainties
in decay constants, cross sections, and fission spectra lead to further uncertainties in
the final neutron flux and neutron energy spectrum measured in the tally results.
Evaluating the propagation and impact of these uncertainties is the subject of ongoing
research [57][58].
Another way to evaluate errors and uncertainties is to make comparisons
between calculations and experimental isotopic measurement data. Radiochemical
isotope assay data for PWR assemblies from the Takahama-3 reactor indicate
agreement within a few percent of code predictions of SCALE 4.4 [59].
The precision of MCNP results depends on the number of histories run. MCNP
tallies are normalized to the number of starting particles and printed with the relative
error. For F2 and F4 tallies, acceptable values of relative error should be less than 10%.
MCNP also performs 10 statistical checks for the estimated answer for the tally
fluctuation chart bin. These statistical checks evaluate aspects of the tally results
including mean behavior, changes in relative error, variance of the variance, figure of
merit, and the probability distribution function’s slope.

41
Table 3-1. Partial Table 40 from MCNP initialization from 4% initial enrichment, 15 GWd/MTU burnup and 5-year cooling time NGSI spent fuel assembly
Material Number
Isotope Mass fraction
51 92234 2.14505E-04 92235 2.26959E-02 92236 2.34057E-03 92238 8.38138E-01 93237 1.28933E-04 94238 1.41305E-05 94239 4.09108E-03 94240 7.30120E-04 94241 2.92078E-04 94242 3.76124E-05 95241 8.23562E-05 95242 3.51934E-08 95243 2.73144E-06 96242 2.60530E-10 96243 2.34838E-09 96244 1.83806E-07 96245 5.48744E-09 96246 1.11210E-10 1001 1.71143E-07 1003 3.16022E-11 2004 2.31292E-05 5010 1.61591E-16 8016 1.18594E-01
This is a partial list of all isotopes in material 51 which corresponds to rod number 101. The complete table 40 provides material compositions for all 264 rods.

42
Figure 3-1. Workflow from NGSI spent fuel library to final transported spectra.
Table 3-2. Partial Table 50 from MCNP initialization from 4% initial enrichment, 15
GWd/MTU burnup and 5 year cooling time NGSI spent fuel assembly Cell Gram density Calculated volume Mass 101 1.04507E+01 1.93158E+02 2.01864E+03 105 1.04501E+01 1.93158E+02 2.01853E+03 109 1.04500E+01 1.93158E+02 2.01851E+03 113 1.04499E+01 1.93158E+02 2.01848E+03 117 1.04497E+01 1.93158E+02 2.01844E+03
Cell numbers 101, 105, 109, 113, and 117 correspond to rod numbers 101, 102, 103, 104, and 105 respectively. The complete table 50 provides this information for all 264 rods.
MAT
LAB
Linka
ge C
ode
MCN
PO
RIGE
N-S
ORIGEN-SInput File
Execute ORIGEN-S
Neutron Spectra
MCNPInput File
Execute MCNP
TransportedSpectra
Extract Data
NGSI Libraries

43
CHAPTER 4 CHARACTERIZATION OF SPENT FUEL RODS AND ASSEMBLIES
This chapter applies the methodologies developed in Chapter 3 to characterize
spent fuel rods and assemblies. The neutron source components, spontaneous fission
and (α,n), vary as a function of the fuel parameters, which include initial enrichment,
burnup, and cooling time [48]. The gamma spectra has been studied through
multivariate analysis to predict spent fuel parameters [60]. This chapter applies similar
techniques to better understand the relationship between the neutron spectra and spent
fuel parameters. These results are compared to previous investigations of neutron
emissions from spent fuel assemblies.
4.1 Methods
The methodology developed in Chapter 3 formed the basis for characterizing
spent fuel rods and assemblies. The NGSI Spent Fuel Library was used to obtain
nuclide masses from individual rods within spent fuel assemblies of varying initial
enrichments, cooling times, and burnups. ORIGEN-S used the nuclide mass data from
these rods to calculate the neutron spectra for both spontaneous fission and (α,n)
reactions. A MCNP geometry of a single spent fuel rod with cladding was created.
Separate MCNP models were built for each rod using each of the following neutron
source term options: total neutrons, spontaneous fission, and (α,n) reaction neutrons.
MCNP transported one hundred million neutrons per source term with average surface
flux (F2) tallies on the top plane, bottom plane, and cylindrical surface of each rod.
Computational simulations were run for a single rod from each of the assemblies
in the NGSI spent fuel library, which included varying initial enrichments, burnups, and
cooling times. The results and discussion below examine rods with an initial enrichment

44
of 4 percent, burnups of 15, 30, and 45 GWd/MTU, and cooling times of 5, 20, 40, and
80 years. The available fuel parameters combinations in NGSI spent fuel library 2a are
shown in Table 4-1.
A similar methodology was applied to complete 17x17 pressurized water reactor
(PWR) assemblies. This was a significant increase in complexity as each assembly
contained 264 rods. Figure 4-1 shows a complete 17x17 PWR assembly from the NGSI
spent fuel library using the MCNPX Visual Editor. Unique source terms were generated
for each rod. A single MCNP run contained complete geometry and materials definitions
for the assembly but only one of the fuel rods as a source. A total of 264 MCNP runs
per assembly were conducted and the tally totals on the outside of the assembly were
added to simulate neutron emissions from an entire assembly.
4.2 Results and Discussion
This section begins with results and discussions from individual spent fuel rod
characterization. The applicability of this technique to entire assemblies is examined.
The results are compared to other spent fuel neutron emission calculations.
4.2.1 Individual Spent Fuel Rod Characterization
For all simulations of individual fuel rods, MCNP tallies passed all ten statistical
checks. In general, the relative error was less than 1% for energy bins less than 8 MeV.
Energy bins at higher energies had a larger relative error due to fewer neutrons at those
energies. For example, relative error often exceeded 10% for energy bins above 13
MeV.
Figure 4-2 shows the total neutron spectra on the outside cylindrical surface of
rods with an initial enrichment of 4 percent, burnup of 15 GWd/MTU and cooling times
of 5, 20, 40, and 80 years. The total neutron flux decreases with increasing cooling time,

45
however the peak around 3.0 MeV persists. Separating the total neutron flux into its
components, as shown in Figure 4-3, shows the total neutron flux, spontaneous fission
neutron flux and (α,n) reaction neutron flux emitted by the rods for each cooling time.
The magnitude of the spectrum from spontaneous fission drops significantly with
increasing cooling time, while the magnitude of the spectrum from (α,n) reactions is
much less affected. Figure 4-4 shows the components of the total neutron flux for spent
fuel rods with an initial enrichment of 4 percent, burnup of 30 GWd/MTU and cooling
times of 5, 20, 40, and 80 years. In this case, the peak around 3.0 MeV starts to appear
at the 40-year cooling time. However at 80 years the contributions from the (α,n)
reactions is significant. Figure 4-5 shows the components of the total neutron flux for
spent fuel rods with an initial enrichment of 4 percent, burnup of 45 GWd/MTU and
cooling times of 5, 20, 40, and 80 years. At this higher burnup, the contribution from
(α,n) reactions is minimal even at the 80-year cooling time.
Integrating the energy spectra from each component of the neutron flux enables
better visualization of the overall trend. Figure 4-6 shows the neutron fluxes separated
into total neutron flux, spontaneous fission neutron flux and (α,n) reaction neutron flux
for the 4% initial enrichment and 15 GWd/MTU burnup spent fuel rods. As cooling time
increases, the total neutron and spontaneous fission neutron fluxes both decrease, but
the neutron flux from the (α,n) reaction increases. In Figure 4-7 and Figure 4-8, which
show 30 GWd/MTU and 45 GWd/MTU burnups, the total neutron and spontaneous
fission neutron fluxes both decrease, while the (α,n) reaction neutron flux only has a
slight comparative increase. The difference in trends between the spontaneous fission

46
and (α,n) reaction neutron fluxes offers a way to predict the cooling time for known fuel
burnup and initial enrichment.
Analysis of ORIGEN-S data shows that at lower cooling times most neutrons are
produced from spontaneous fission of heavy nuclides with 244Cm as the largest
contributor. However, the increase in (α,n) reactions with increasing cooling times is due
to the increase in 241Am which decays from 241Pu. As shown in Figure 4-9, 241Am is the
major contributor to the (α,n) reaction neutron source term in spent fuel. The increase in
alpha emissions from 241Am results from an increase in (α,n) reactions.
There is an important distinction between computational versus experimental
measurements. Separating spontaneous fission neutrons and (α,n) reaction neutrons in
computational models is straightforward. A detector in the field would only be able to
measure neutron counts and energies. Therefore, it was necessary to create a method
to separate these two neutron sources from a detector measurement.
Based on the characteristics of their spectra, the spontaneous fission neutrons
and (α,n) reaction neutrons can be estimated from a total neutron spectrum. The
spontaneous fission neutrons peak between 0.8 to 1 MeV and have a long tail
extending to 12 to 15 MeV. Conversely, the spectrum for (α,n) reaction neutrons has a
softer curve with a maximum between 2.5 and 3.0 MeV [16]. The (α,n) reaction neutron
spectra tail ends at approximately 5 MeV.
Using these characteristics, the results are separated into two integrals. The first
is from 0.1 to 1.6 MeV, covering most of the spontaneous fission neutrons. The second
is from 1.6 MeV to 3.6 MeV, spanning most of the (α,n) reaction neutrons. Figure 4-10
shows the characteristic ranges on a graph of the total neutron spectrum for a spent fuel

47
rod with 4 percent initial enrichment, 15 GWd/MTU burnup and a 40-year cooling time.
These characteristic energy ranges consistently captured about 50% of all spontaneous
fission neutrons and 72% of all (α,n) reaction neutrons. The border at 1.6 MeV was
chosen as this was the energy where the neutron flux from (α,n) reactions began to
increase significantly. This technique requires a neutron detector capable of neutron
spectroscopy at appropriate resolutions.
Figure 4-11 shows the energy regions of interest for spontaneous fission and
(α,n) reactions plotted versus cooling time for spent fuel rods with 4% initial enrichment
and 15 GWd/MTU burnup. The spontaneous fission flux decreases at a faster rate,
which allows for characterizing the cooling time based on the ratio of the two fluxes.
Each of these fluxes is dependent on exponential decay, with the spontaneous fission
neutron flux decaying at a faster rate than the (α,n) reaction neutron flux. This allows
characterizing the cooling times based on the ratio of the two fluxes. The functional form
is expected to be exponential decay as shown in Figure 4-12.
Figure 4-13 shows the energy regions of interest for spontaneous fission and
(α,n) reactions plotted versus cooling time for spent fuel rods with 4% initial enrichment
and 30 GWd/MTU burnup. Figure 4-14 shows the energy regions of interest for
spontaneous fission and (α,n) reactions plotted versus cooling time for spent fuel rods
with 4% initial enrichment and 45 GWd/MTU burnup. For these two burnups, the
characteristic energy ranges both decreased at similar rates, which did not allow
characterizing the cooling time using this technique.
4.2.2 Applicability to Spent Fuel Assemblies
An examination of the neutron source spectra emitted from a complete assembly
is necessary to determine if this method is still applicable. Figure 4-15 shows the

48
comparison of a normalized neutron flux between a 4% initial enrichment, 15 GWd/MTU
burnup individual fuel rod compared to a 17x17 PWR assembly with the same
parameters. The overall qualitative agreement furthered applying the same technique to
complete assemblies. The next step was to compare the neutron source terms for
different cooling times. Figure 4-16 shows that the (α,n) reaction neutrons make up a
larger percentage of the total neutron flux for an assembly with 4% initial enrichment, 15
GWd/MTU burnup, and 40-year cooling time compared to the assembly with 4% initial
enrichment, 15 GWd/MTU burnup, and a 5-year cooling time. Based on these results,
the method was found to be applicable to spent fuel assemblies. However, the
challenge of using this method with spent fuel rods with higher burnups is expected to
occur with spent fuel assemblies with higher burnups. This is due to relatively few (α,n)
reaction neutrons compared to the total neutrons.
4.2.3 Comparison to Other Neutron Source Term Calculations
As discussed in Chapter 2, Richard et al. characterized the neutron source term
using the original GATORS methodology, but did not transport it through the geometry
[6]. Table 4-2 shows the comparison between the GATORS methodology and the
methodology in this work to calculate the spontaneous fission and (α,n) reaction neutron
source term percentages for assemblies with varying spent fuel parameters.
Weldon et al. calculated that for an assembly with 4% initial enrichment and 15
GWd/MTU burnup, the (α,n) emissions are slightly less than the spontaneous fission
emissions at a 40-year cooling time and slightly more than the spontaneous fission
emissions at an 80-year cooling time [48]. The same trend was identified in Figure 4-4
for transported spectra for an individual rod. While their work used NGSI SFL2c and this

49
work used NGSI SFL2a, which had different shuffling schemes, the total neutrons per
second emitted from assemblies of varying parameters was found to be similar.
4.3 Summary
The linkage code developed for ORIGEN-S and MCNP6 allowed analysis of
transported neutron source terms for spent fuel rods and assemblies from the NGSI
spent fuel libraries. The identification of neutron energy spectral characteristics in
individual rods and 17X17 PWR assemblies enables predicting fuel parameters, such
as cooling time, when initial enrichment and burnup are known. This method was most
effective for spent fuel at lower burnups. The method faced difficulty at higher burnups
with fewer (α,n) reaction neutrons compared to spontaneous fission neutrons. It was
found that the transported neutron energy spectrum from an assembly had similar
trends when compared to the non-transported neutron energy spectrum from other
research.

50
Table 4-1. Available fuel parameter combinations from NGSI Spent Fuel Library 2a Initial Enrichment (wt%) Burnups (GWd/MTU) Cooling Times 2% 15, 30 0d, 14d, 1y, 5y, 20y, 40y, 80y 3% 15, 30 0d, 14d, 1y, 5y, 20y, 40y, 80y 4% 15, 30, 45 0d, 14d, 1y, 5y, 20y, 40y, 80y 5% 15, 30. 45, 60 0d, 14d, 1y, 5y, 20y, 40y, 80y
Cases for 2 wt%, 45 and 60 GWd/MTU; 3 wt%, 45 and 60 GWd/MTU; 4wt%, 60GWd/MTU are not included as they are overly burned and not realistic.
Figure 4-1. NGSI 17x17 PWR assembly model from MCNP Visual Editor
Table 4-2. Comparison between spontaneous fission and (α,n) contributions to the neutron source term between Richard et al. and this work.
Initial Enrichment Burnup Cooling Time SF% and alpha% Richard et al.
SF% and alpha% Harkness
2% 15 5 95% and 5% 93.2% and 6.8% 3% 30 5 98% and 2% 97.9% and 2.1% 4% 45 5 99% and 1% 98.5% and 1.5%

51
Figure 4-2. Change in total neutron spectra for 4% initial enrichment and 15 GWd/MTU
burnup spent fuel rods at various cooling times.
Figure 4-3. Change in neutron spectra by source for 4% initial enrichment and 15
GWd/MTU burnup spent fuel rods at various cooling times.
0 2 4 6 8 10
Energy (MeV)
0
0.1
0.2
0.3
0.4
Flux
(neu
trons
/cm
2-s
)
5 years
20 years
40 years
80 years

52
Figure 4-4. Change in neutron spectra by source for 4% initial enrichment and 30
GWd/MTU burnup spent fuel rods at various cooling times.
Figure 4-5. Change in neutron spectra by source for 4% initial enrichment and 45
GWd/MTU burnup spent fuel rods at various cooling times.

53
Figure 4-6. Change in neutron source strength as a function of cooling time for 4% initial
enrichment and 15 GWd/MTU spent fuel rods.
Figure 4-7. Change in neutron source strength as a function of cooling time for 4% initial
enrichment and 30 GWd/MTU spent fuel rods.

54
Figure 4-8. Change in neutron source strength as a function of cooling time for 4% initial
enrichment and 45 GWd/MTU spent fuel rods.
Figure 4-9. Change in (α,n) reaction rate by α emitter as a function of cooling time for a
4% initial enrichment and 15 GWd/MTU burnup spent fuel rod.

55
Figure 4-10. Characteristic energy ranges for spontaneous fission and (α,n) neutrons shown for a 4% initial enrichment, 15 GWd/MTU burnup and 40-year cooling time.
Figure 4-11. Change in neutron flux in characteristic energy ranges as a function of cooling time for 4% initial enrichment and 15 GWd/MTU spent fuel rods.

56
Figure 4-12. Change in the (α,n) and spontaneous fission neutron flux ratio as a function
of cooling time for 4% initial enrichment and 15 GWd/MTU spent fuel rods.
Figure 4-13. Change in neutron flux in characteristic energy ranges as a function of cooling time for 4% initial enrichment and 30 GWd/MTU spent fuel rods.

57
Figure 4-14. Change in neutron flux in characteristic energy ranges as a function of cooling time for 4% initial enrichment and 45 GWd/MTU spent fuel rods.
Figure 4-15. Comparison of the neutron spectra for a 4% initial enrichment, 15 GWd/MTU, and 5-year cooling time spent fuel rod versus a complete assembly with the same parameters.
0 2 4 6 8 10
Energy (MeV)
0
0.01
0.02
0.03
0.04
Nor
mal
ized
Flu
x
Total neutrons from assembly
Total neutrons from rod
(alpha,n) from assembly
(alpha,n) from rod
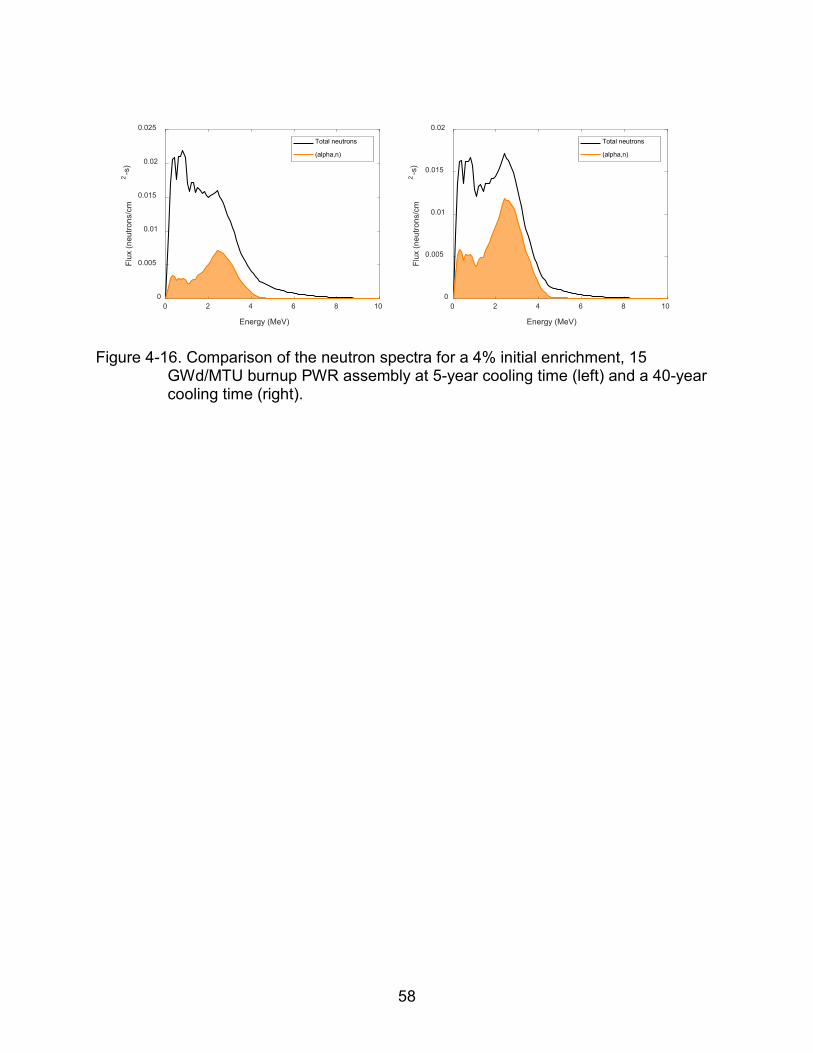
58
Figure 4-16. Comparison of the neutron spectra for a 4% initial enrichment, 15
GWd/MTU burnup PWR assembly at 5-year cooling time (left) and a 40-year cooling time (right).
0 2 4 6 8 10
Energy (MeV)
0
0.005
0.01
0.015
0.02
0.025Fl
ux (n
eutro
ns/c
m2
-s)
Total neutrons
(alpha,n)
0 2 4 6 8 10
Energy (MeV)
0
0.005
0.01
0.015
0.02
Flux
(neu
trons
/cm
2-s
)
Total neutrons
(alpha,n)

59
CHAPTER 5 CHARACTERIZATION OF FAST NEUTRON EMISSIONS FROM SPENT FUEL IN
DRY CASK STORAGE
This chapter describes the characterization of the fast neutron emissions from
spent fuel assemblies in dry cask storage. The structure of the HI-STORM 100S dry
cask system is discussed. The original methodology was expanded to incorporate up to
32 assemblies and the complexity of the cask structure. The final simulations used a
more detailed geometry and neutron source than was found in past research, which
homogenized portions of the fuel assemblies and cask. The previously identified
technique using the differences in energies between spontaneous fission and (α,n)
reaction neutrons was applied to the neutron energy spectra emitted from the cask. Full
cask and partial cask loadings were simulated to determine if it is possible to identify
diverted assemblies using count rate data. Results were compared to prior research on
fingerprinting techniques by others.
5.1 HI-STORM 100S Dry Cask System
Holtec International currently serves 53 nuclear facilities in the United States
(over half of the entire installed base) and 24 international facilities [61]. Due to the
widespread use, the Holtec HI-STORM 100S system was selected for this research. It
accommodates a wide variety of spent nuclear fuel assemblies by utilizing different
multipurpose canisters with identical exterior dimensions inserted into a common
overpack. Detailed drawings and information regarding this system are available in the
Final Safety Analysis Report for the HI-STORM 100 Cask System [62].
All multipurpose canisters (MPCs) have identical external dimensions. The
structural components of the MPC are fabricated from various steels including types
316, 316LN, 304, and 304LN. The fuel basket itself is made of steel. Metamic, a boron

60
carbide metal matrix composite material, is placed on two sides of each assembly to
absorb neutrons. The inside of the canister is filled with helium because it is inert, has
excellent heat transfer capabilities, and allows the use of helium leak-detection methods
to ensure proper sealing [63].
Each MPC consists of a fuel basket, base plate, canister shell, lid, and a closure
ring. The rectilinear grid design of the MPC fuel baskets offer the benefit of uniform
distribution of the metal mass and efficient radiation attenuation [62]. The MPCs have
different internal layouts to accommodate different numbers and types of fuel
assemblies. For example, the MPC-24 contains a maximum of 24 PWR assemblies, the
MPC-32 contains a maximum of 32 PWR fuel assemblies, and the MPC-68 contains a
maximum of 68 BWR assemblies. This research focuses on the MPC-32 due to the
economic savings of higher density storage for PWR assemblies.
The HI-STORM 100S overpack consists of inner and outer cylindrical steel shells
filled with concrete. The primary function of the carbon steel is to provide structural
stability and the primary function of the concrete is to provide shielding against gamma
and neutron radiation [62]. Both steel and concrete have a long history of usage in
nuclear applications. It has a heavy bolted concrete and steel lid. The cask provides
adequate shielding to absorb radiation and structural strength necessary to protect
against natural disasters or accident scenarios.
5.2 Methods
The computational methodology discussed in Chapter 3 was expanded to
incorporate up to 32 assemblies inside a cask system. This detailed modeling was
automated through development of a MATLAB program. For each of the 32 assembly
locations in the MPC-32, the program allowed choosing to insert an assembly from the

61
NGSI spent fuel library or to leave that location empty to mimic a diverted assembly.
The program then referenced ORIGEN-S output files and built a complete MCNP
geometry of assemblies with appropriate neutron sources inside of a cask. The final
simulation had more detailed geometry and neutron sources than past research
methods which homogenized portions of the fuel assemblies and cask.
The MCNP models of the HI-STORM 100S cask system are based on the
geometry developed in the neutron fingerprinting research by Rauch [28]. The MCNP
model included the MPC, baseplate, pedestal, platform, inner shell, concrete shield,
outer shell, lid top plate, lid shield block and radial plates. Assembly details included the
guide/instrument tubes, gaps between fuel and cladding, Metamic, and basket steel.
These assembly details provide a realistic basis for the transport and shielding
calculations in MCNP. Neutron detectors were modeled to obtain realistic detection
system statistics. The models were based on the helium-4 detectors and had stainless-
steel cylinders with an active length of 20 cm and an inner diameter of 4.4 cm for a total
active volume of 304 cm3. Figure 5-1 shows two cross sections of the MCNP geometry.
Figure 5-2 shows a single Westinghouse 17x17 PWR assembly inside the MPC.
Simulations were performed with up to 32 assemblies inside of a HI-STORM
100S dry cask system. All ORIGEN-S calculations were performed on a standard
desktop computer running the Windows operating system. All MCNP simulations were
performed on the University of Florida HiPerGator computing cluster. ORIGEN-S
calculations were almost instantaneous. MCNP calculations took about two days for 10
billion initial neutrons. Chen et al. note that the limiting factors in a complicated shielding
problem are how realistic the calculation model can be [64]. Reliable source term

62
estimation and high-fidelity geometry modeling are critical. ORIGEN-S was used to
calculate a reliable source term estimate. The geometry included appropriate details for
accurate shielding and transport calculations.
Initial cask loadings used assemblies with identical parameters from the NGSI
spent fuel library to create the easiest scenario for detecting a diverted assembly.
Additional loadings were developed based on real loading data from ORNL. Average
surface flux tallies (F2) were used on the inside and outside cylindrical surfaces of the
canister and overpack. Average cell flux tallies (F4) were used for the gas volume of
each of the helium-4 gas scintillation detectors.
Unlike many simulations which homogenize the fuel, the fuel assembly structures
are modeled explicitly in this work. The NGSI spent fuel libraries have each rod as a
single axial fuel region so it was not possible to calculate axial source term variation.
For actual PWR assemblies, the axial burnup is relatively flat in the axial midsection
with under-burned fuel for the top and bottom 30 cm of the assembly [65]. Although the
neutron energy spectra were calculated individually for each rod in the 17x17 PWR
assemblies, there were only minor differences in the spectra due to different localized
burnups. To simplify MCNP input files, the spectra for all 264 rods was averaged and
set as the energy distribution for all rods in that assembly. This approach introduced a
minor approximation for the radiation transport as normally each rod would have a
slightly different energy distribution.
Initial sensitivity analyses started with identical assemblies inside the HI-STORM
100 dry cask system. These had the same materials, neutron source strength, and
neutron spectra emitted. The symmetry allows picking five different assembly diversion

63
locations (1, 2, 6, 7, and 13) that are equivalent to removing any of the 32 assemblies.
The MPC-32 assembly layout with these representative locations are shown in Figure 5-
3. Additional simulations were run with assemblies of varying average neutron source
strengths to approximate real cask loadings. These were used to determine the effect
on the neutron flux measured by the detectors in the same azimuthal area.
5.3 Results and Discussions
The first results discussed are from applying the previously identified spent fuel
characterization technique to neutron energy spectra data emitted from the cask. The
second results discussed are from techniques to identify diverted assemblies using
count rates.
5.3.1 Spent Fuel Characterization Through Spectral Data
As my previous research showed, the (α,n) reaction neutrons have a maximum
between 2.5 and 3.0 MeV. My prior technique estimated the number of spontaneous
fission neutrons and (α,n) reaction neutrons based on the characteristics of their
spectra: spontaneous fission neutrons peaked between 0.8 to 1 MeV and (α,n) reaction
neutrons peaked between 2.5 and 3 MeV. This section discusses the feasibility of
applying this method to spent fuel assemblies in dry cask storage.
The tally on the MPC shows the neutron spectra with self-shielding from the
assemblies but without the attenuation from the concrete overpack. Figure 5-4 shows
the neutron flux as it crosses the inside cylindrical surface of the MPC. The spectrum
inside the cask is affected by self-shielding from the assemblies as it is qualitatively
different than the flux from individual rods. Figure 5-5 shows the neutron flux on the
outside cylindrical surface of the cask. The large peak at approximately 2.3 to 2.4 MeV
was not observed in individual rod fluxes which led to investigating the isotopic

64
composition of the concrete overpack. Concrete is approximately 50 weight percent
oxygen. The total neutron cross section for 16O has a valley at similar energies and that
results in a peak in the emitted neutron spectra. The difference between the internal and
external neutron fluxes is approximately 5 orders of magnitude, illustrating the strong
radiological shielding from the concrete overpack.
In general, the relative error was less than 10% for energy bins less than 5 MeV.
As expected, the relative error increased for higher energy bins with fewer particles.
Relative error often exceeded 20% for energy bins above 8 MeV.
In all cases, over 80% of the neutrons escaping the overpack were below 200
keV. These bins are not shown in figures to enhance visibility of the spectral
characteristics at fast energies. As seen in Figure 5-6, the total flux was strongly linked
to the burnup and cooling time of the spent fuel. Otherwise, the overall shapes of each
neutron spectra otherwise greatly resemble each other. In comparison, the neutron
spectra from individual rods and assemblies had various peaks and valleys depending
on the spent fuel parameters.
This behavior was theorized to be due to neutron attenuation from the cask
system and self-shielding from the surrounding assemblies. In the context of nuclear
engineering, attenuation is measured by cross sections. The total neutron cross-section
(σT) is the likelihood that a neutron of a certain energy will interact with a target nucleus.
These cross-sections can vary greatly with the kinetic energy of the neutron. The
effective removal cross section (ΣR) is the probability that a fast neutron undergoes a
first collision which removes it from the group of uncollided neutrons [66]. The effective
removal cross section (ΣR) of concrete is almost constant for fast neutrons from 2 to 12

65
MeV [67]. Previous research has calculated the fast neutron effective removal cross
section for various concretes and found that hydrogen and oxygen are major
contributors [68]. Self-shielding from the spent fuel assemblies attenuates and scatters
the neutrons resulting in spectra with magnitude as the only distinguishing
characteristic.
The same technique developed in Chapter 4 was applied to the neutron
emissions from a cask. The spent fuel assemblies inside had an initial enrichment of 4
percent, burnup of 15 GWd/MTU and cooling times of 5, 20, 40, and 80 years. Figure 5-
7 shows the tally on the outside cylindrical surface of the overpack separated into total
neutron flux, spontaneous fission neutron flux and (α,n) reaction neutron flux for
different cooling times. As cooling time increases, the total neutron and spontaneous
fission neutron fluxes both decrease, but the neutron flux from the (α,n) reaction
increases. This is the same trend that was seen in individual spent fuel rods in Chapter
4.
The fluxes for the initial characteristic energy ranges (0 to 1.6 MeV and 1.6 to 3.6
MeV) are shown in Figures 5-8 and 5-9 for 15 GWd/MTU and 45 GWd/MTU fuel. Figure
5-10 shows the alpha to SF ratio versus cooling time using the initial characteristic
energy ranges. The initial characteristic energy ranges do not show an identifiable trend
and would not be a reliable method to determine the cooling time of spent fuel. In
contrast, Figure 4-12 shows an identifiable trend for the alpha to SF ratio versus cooling
time for an individual fuel rod. The lack of an identifiable trend for spent fuel inside a
cask was attributed to the high degree of moderation from the HI-STORM 100S cask
system. However, higher energy neutrons may pass through the dry cask without

66
scattering that could provide more useful characteristic energy range data. To test this
theory, the characteristic range for spontaneous fission neutrons was adjusted higher in
energy range from 3.6 MeV to 5.0 MeV. Figure 5-11 and 5-12 show the same 15
GWd/MTU and 45 GWd/MTU burnups with the new energy ranges. The alpha to SF
ratio shows a weak correlation to the cooling time as shown in Figure 5-13. Although an
improvement from the initial energy ranges, the weak correlation would be difficult to
use for characterization purposes due to the precise statistics needed.
Additionally, the technique faces challenges determining the cooling time for fuel
at higher burnups due to the limited (α,n) reaction neutron contribution to the total
neutron source. Average burnup was around 35 GWd/MTU two decades ago and is
over 45 GWd/MTU today [69]. Examination of the MCNP output files shows that
spontaneous fission emissions dominate the total neutron signal at burnups greater
than 30 GWd/MTU and cooling times less than 80 years. These results agree with
conclusion from the study on total neutron emissions for the NGSI spent fuel libraries by
Weldon et al which found 244Cm dominated the spectrum [48].
Based on these results, using the prior technique to determine the cooling time of
spent fuel assemblies inside a cask is not feasible due to the HI-STORM 100S overpack
resulting in qualitatively similar energy spectra. Additionally, utilities using fuel to higher
burnups reduces the number of (α,n) reaction neutrons for measurement worsening the
signal to noise ratio for the comparison of the (α,n)-to-spontaneous fission neutrons.
Thus, efforts were shifted towards methods utilizing total neutron fluxes which do not
rely on energy discrimination.

67
5.3.2 Identification of Diverted Assemblies Using Count Rates
The sensitivity analysis results were completed for each of the diversion
scenarios. Neutron fluxes were normalized per source neutron. Diverting an assembly
results in less self-shielding of neighboring assemblies. Each of the 100 detector
locations measures neutron fluxes around equal azimuthal angles around the cask.
Figure 5-14 shows that outer fuel assemblies obscure the diversion of an inner fuel
assembly. There is a substantial change in symmetry for the Detectors 71 through 80
are located close to the missing assembly locations. Figure 5-15 shows the flux change
compared to a fully loaded cask for these detectors when an assembly is missing from
one of the characteristic locations. These detectors measure approximately 6% lower
flux when an assembly at position 1 is missing and approximately 8% lower flux when
an assembly at position 2 is missing compared to a fully loaded cask. However, when
an assembly at positions 6 or 7 is missing, the change in flux is less than 1%. Detecting
a diverted assembly at positions 6 or 7 is unlikely. When an assembly at position 13 is
missing, the detectors measure approximately 2% higher than flux than a fully loaded
cask. In addition, this is as close to an ideal scenario as possible with identical
assemblies, neutron source strengths, and spectra. A real cask would have varying
source strengths that would lead to more difficult analyses. Based on these results, it is
possible to detect a diverted assembly at positions 1 or 2 due to the flux decrease. It
would be difficult to detect a diverted assembly at the other locations.
The work by Rauch found that a diverted assembly at positions 1 and 6 could be
detected, position 2 might be able to be detected, and positions 7 and 13 cannot be
detected by analyzing signatures through his acceptance criteria [28]. This previous

68
work supports the conclusion that detection of assemblies that have been diverted
around the outside perimeter is easier than detection of diverted inner assemblies.
The next set of simulations compared real cask loading data from ORNL to the
identical assembly loadings. The loading pattern and average neutron source terms are
shown in Figure 5-16. These three loading patterns provided a chance to test the
proposed diversion detection method with real source term values. However, the ORNL
loading patterns did not have isotopic data, so the NGSI spent fuel libraries were still
used as these should have similar isotopic information. The energy spectrum chosen
was that from a 4% initial enrichment, 45 GWd/MTU burnup and 5-year cooling time as
there was no energy spectrum provided for the ORNL data.
The fluence measured by each detector is sensitive to the neutron source
strength of individual assemblies as shown in Figure 5-17. Although the general shape
of the signatures is similar, each loading pattern has a peak in a different quadrant.
While Figure 5-14 showed variations in symmetry for each quadrant that could identify a
diverted outer assembly, the ORNL loadings were fully loaded and there was a lack of
symmetry between quadrants. Therefore, symmetry alone cannot be relied upon to
identify diversions.
Identifying diversions through comparisons of expected to actual flux values at
specific detector locations or sets of locations is a feasible technique. However, there is
a lack of expected flux values for most, if not all, casks today. Measurements are not
taken upon loading and this chapter has described the time-consuming process to
generate MCNP simulations of a cask. Chapter 6 discusses a potential solution that

69
mathematically calculates the expected flux values at specific detector locations using
information about the fuel assemblies and cask.
A simulation of 10 billion initial neutrons represents about 2 seconds of real
activity for a cask containing 32 assemblies with an average burnup of 45 GWd/MTU
and a 5-year cooling time. Although there are 10 billion initial neutrons, due to further
prompt fissions, delayed fissions, and (n,xn) reactions, MCNP tracks approximately 14
billion neutrons. Only about 7 million neutrons actually escape the sides of the cask. It
was not necessary to simulate longer than two seconds as statistical results were
acceptable. Standard errors were less than 10% and the tally fluctuation chart bins
passed all 10 built-in statistical checks.
An appropriate detector would need to have enough neutrons exiting the cask to
measure with reasonable statistics. The total surface area of the outside of the cask
walls is approximately 5.76 x 105 cm2. Ten detectors, each with a 50 cm2 surface area,
would cover 0.09% of the cask. For the highest neutron flux case of a 45 GWd/MTU
burnup with 5 years of cooling time, these detectors would be experiencing 3000 n/s
across the whole energy range. For the lowest neutron flux case of a 15 GWd/MTU
burnup with 80 years of cooling time, these detectors would be experiencing 15 n/s
across the whole energy range. These simulations serve as a proof of concept for
neutron spectroscopy of spent fuel inside a dry cask using an appropriate detector.
5.4 Summary
This study investigated the characterization of neutron emissions from a HI-
STORM 100S dry cask storage system with spent fuel assemblies of varying
parameters inside. Although a significant neutron flux exits the dry cask storage system,
neutrons at lower energies dominate the spectrum. While higher energy neutrons are

70
emitted, the lower source strength presents a challenge for obtaining reasonable
statistics. One set of simulations applied energy discrimination techniques to determine
the cooling time of spent fuel inside a cask. The other set of simulations investigated
using neutron count rates to identify diverted assemblies.
The first simulations examined if it was possible to determine the cooling time of
assemblies inside the cask based on the energy of neutrons emitted from the cask. This
utilized the previous spontaneous fission versus (α,n) reaction neutron technique.
However, all neutron energy spectra measured on the outside of the cask appear
qualitatively similar due to self-shielding from the assemblies and attenuation from the
concrete overpack. Other possible energy ranges were tested. Although they produced
a weak correlation, the reliance on higher energy neutrons would need longer
measurement times to obtain reasonable statistics. This method was determined to not
be feasible for spent fuel in a dry storage cask.
The second simulations investigated the possibility of identifying diverted
assemblies using count rates. By comparing the relative neutron fluxes from a fully
loaded cask to a partially loaded cask, the simulations showed the ability to identify
diverted assemblies on the outside perimeter. However, diversion of interior assemblies
is more difficult to identify due to minimal changes in the neutron flux.
The results were compared to previous research regarding the neutron
emissions from spent fuel. Differences were noted in which specific assembly locations
could be detected if diverted, however the same conclusion was reached: diverted
assemblies are easier to locate when they are on the outside perimeter.

71
Figure 5-1. Horizontal and vertical cross sections of the MCNP model of the HI-STORM
100S cask system. Helium-4 detectors are spaced equally around the cask.
Figure 5-2. A single Westinghouse 17x17 PWR assembly inside the MPC. Neutron
absorbing plates are seen adjacent to the fuel assembly on the top and left sides.

72
Figure 5-3. The loading pattern of 32 spent fuel assemblies in a HI-STORM 100S cask.
Figure 5-4. Surface flux tally (F2) on inside cylindrical surface of MPC.

73
Figure 5-5. Surface flux tally (F2) on outside cylindrical surface of concrete overpack.
Figure 5-6. Neutron spectra emitted from casks containing spent nuclear fuel
assemblies of varying parameters.

74
Figure 5-7. Change in neutron emissions on the outside cylindrical surface of the cask
containing spent fuel assemblies with parameters of 4% initial enrichment and 15 GWd/MTU burnup as a function of cooling time.
Figure 5-8. Neutrons emissions using initial characteristic energy ranges for spent fuel
assemblies with parameters of 4% initial enrichment and 15 GWd/MTU burnup.

75
Figure 5-9. Neutrons emissions using initial characteristic energy ranges for spent fuel
assemblies with parameters of 4% initial enrichment and 45 GWd/MTU burnup.
Figure 5-10. Alpha/SF ratio using initial characteristic energy ranges as a function of cooling time for assemblies of various burnups.

76
Figure 5-11. Neutrons emissions using revised characteristic energy ranges for spent
fuel assemblies with parameters of 4% initial enrichment and 15 GWd/MTU burnup.
Figure 5-12. Neutrons emissions using revised characteristic energy ranges for spent
fuel assemblies with parameters of 4% initial enrichment and 45 GWd/MTU burnup.

77
Figure 5-13. Alpha/SF ratio using revised characteristic energy ranges as a function of
cooling time for assemblies of various burnups.
Figure 5-14. Fast neutron fluence at each detector from full cask and casks with assemblies removed from 5 different locations (left). Data subset zoomed into the area showing the fluence differences (right).
78
Figure 5-15. Percentage change in flux for each missing assembly location. Error bars
are standard error from MCNP.

79
Figure 5-16. Loading pattern and average neutron source terms (n/s) per assembly for
three real casks provided by ORNL [28].

80
Figure 5-17. Neutron fluence at each detector for 3 different loadings.

81
CHAPTER 6 PREDICTING EXTERNAL NEUTRON COUNT RATES USING OPERATOR
DECLARED INFORMATION
This work analyzes a series of typical spent fuel loadings with the goal of
determining the individual contribution of each spent fuel assembly to the neutron flux
measured outside the cask. A method for predicting the flux at specific locations outside
the cask using parameters specific to the cask and assembly loading patterns is also
discussed. This provides a solution to a significant shortcoming of before-and-after
fingerprinting techniques, the requirement of having a before fingerprint for successful
comparison.
6.1 Methods
There were 32 separate simulations with a single assembly contributing to the
neutron source term. This allowed quantitatively determining the relative contribution
from each assembly to the total neutron flux outside the cask that would be measured
by each detector. All 32 assemblies were from the NGSI Spent Fuel Library and had 4%
initial enrichment, 45 GWd/MTU burnup and a 5-year cooling time. Each of the 32
simulations was run for 1 billion neutrons with a surface tally around the outside
cylindrical surface of the cask and cell flux tallies for each of the 100 detectors.
Assemblies will be referred to by the numbering shown in Figure 6-1. The
neutrons emissions from three real cask loadings provided by ORNL were also
simulated [70]. The ORNL data included a loading pattern and average neutron source
terms (n/s) per assembly that was then incorporated into the HI-STORM 100S dry cask
system geometry built in MCNP. The ORNL data also included initial enrichment and
maximum burnup values for each assembly. The closest matching assembly from the
NGSI spent fuel library was inserted into the simulations at that assembly location. For

82
example, an ORNL assembly with 42.69 GWd/MTU burnup and an initial enrichment of
3.65% had a matching NGSI assembly of 45 GWd/MTu and an initial enrichment of 4%.
6.2 Results and Discussions
The difficulty of identifying diverted inner assemblies is due to the self-shielding
from the outer assemblies. Quantifying the contribution of each assembly to the overall
neutron source term is the first step towards determining the sensitivity required to
identify diversions. Figure 6-2 shows the contribution to the overall neutron source term
from each assembly normalized to unity. These results are from an average surface flux
tally (F2) in MCNP. There is a strong symmetry in the expected contribution for each
assembly. Each assembly around the perimeter contribute slightly less than 5% of the
total neutrons with about 2% of the neutrons coming from each assembly in the next
layer inward. The innermost assemblies contribute only about 1% each to the total
neutrons.
A helium-4 detector on the outside of the cask would be receiving neutrons from
all the assemblies inside, however some assemblies would contribute more neutrons
than others. Figure 6-3 shows the contribution from each assembly to a detector located
immediately to the right of the cask. Approximately 67% of the neutrons measured by
the detector come from the four outermost assemblies (10, 16, 22 and 28).
Approximately 24% of the neutrons measured by the detector come from the 6
assemblies in the next column (4, 9, 15, 21, 27 and 32). The remaining 9% of the
neutrons come from the remaining 22 assemblies.
The neutron contributions from each assembly to a detector at the upper right of
the cask is shown in Figure 6-4. Approximately 50% of the neutrons measured by the

83
detector come from the two closest assemblies (28 and 32). The next greatest
contributor is assembly 27, which contributes 13% of the neutrons.
The last analysis compared the predicted flux to the flux calculated by MCNP for
three cask loadings provided by ORNL as shown in Figure 6-5. The neutron flux can be
predicted with three parameters: (1) geometric effect from the dry cask system and self-
shielding from the assemblies; (2) relative contributions from each assembly for the
specific azimuthal detector location; and (3) loading pattern with average neutron
source strength per assembly. The attenuation effect from the dry cask system is the
flux measured by each detector using the cask loaded with identical assemblies. The
attenuation effect has a periodic behavior as shown in Figure 6-6. Flux measurements
from the detectors follow a periodic function as you move around the cask due to self-
shielding from the assemblies and cask attenuation effects.
Figure 6-7 shows the matrix multiplication needed to calculate the external
neutron flux around the cask at 100 specific detector locations. Figure 6-8 shows the
actual (MCNP) flux versus predicted (mathematical) measurements at detectors around
a single quadrant of the cask. The predicted fluxes overestimated the flux from MCNP
for most detector locations, however the relative magnitudes and overall trends are
correct. Since the values are normalized, the diagonal locations were underestimated.
The greatest change in the flux from one detector to the next occurs at the diagonal
locations. Practical application of this technique would require crucial placement of
detectors to ensure they are not placed between two measurement points.
This work provides one possible solution to the lack of a prior fingerprint existing
for casks. While these results are specific to the HI-STORM 100S cask system, the

84
techniques are applicable to any spent fuel storage cask. MCNP models exist for other
dry cask systems, such as the TN-32 cask [43]. If additional sensitivity is desired,
another dimension could be added to the parameters, such as neutron energy or
variations in flux along the z-axis of the cask. Additional dimensions may require more
measurements and would involve more data analysis.
6.3 Summary
This study created a way to mathematically model the fingerprint of a spent fuel
cask using parameters specific to the cask and operator declared information about the
fuel. Computational methods were developed to calculate these parameters using the
HI-STORM 100S dry cask system and the Next Generation Safeguards Initiative Spent
Fuel Libraries. The neutron flux can be predicted with three parameters: (1) geometric
effect from the dry cask system and self-shielding from the assemblies; (2) relative
contributions from each assembly for the specific azimuthal detector location; and (3)
loading pattern with average neutron source strength per assembly
Real assembly loading patterns from Oak Ridge National Lab were used to
compare the quick mathematical model to full MCNP simulations. It was found that the
predicted fluxes had the same relative magnitude and overall trends as full MCNP
simulations. Practical application of this technique would require precise detector
placement to ensure it is not between two measurement points as even a few degrees
off can result in a significantly different neutron flux.
This work provides one possible solution to the lack of a prior fingerprint existing
for casks. In addition, this technique is readily applicable to any spent fuel storage cask.
Further refinements to this technique could include adding neutron energy or z-axis
variations as an additional dimension to the parameters.

85
Figure 6-1. Assembly numbers in a 17x17 PWR spent fuel assembly.
Figure 6-2. Contribution from each assembly to the total neutron flux on the outside cylindrical surface of the cask.

86
Figure 6-3. Contribution from each assembly to a single detector located to the right of the cask.
Figure 6-4. Contribution from each assembly to a single detector located at the upper right of the cask.

87
Figure 6-5. Loading pattern and average neutron source terms (n/s) per assembly for three real casks provided by ORNL [28].

88
Figure 6-6. Attenuation from the cask system and assemblies at specific detector locations.
Figure 6-7. Matrix multiplication needed to calculate the external neutron flux at 100 detector locations around the cask.

89
Figure 6-8. Actual (MCNP) versus predicted (mathematical) neutron flux for detectors 64 to 87.

90
CHAPTER 7 CONCLUSIONS
This work has characterized the fast neutron emissions from spent fuel in dry
cask storage. Specific accomplishments include identifying a method to predict cooling
times of individual spent fuel rods and assemblies, analysis of various spent fuel loading
patterns inside a HI-STORM 100S dry cask system, and development of a method to
predict external neutron fluxes based on operator declared contents. Conclusions and
future work have been discussed at the end of each chapter. This chapter summarizes
the results from the simulations, analysis, and proposed future work.
A computational methodology was developed to simulate spent fuel assemblies
and casks in a more detailed fashion. This methodology modeled individual fuel rods
and assemblies explicitly without the geometric simplifications often found in previous
research. The method to predict cooling times of individual spent fuel rods and
assemblies used characteristics of spontaneous fission and (α,n) neutrons. Using
neutron spectral information, the population of these neutrons can be estimated and
cooling time can be predicted. This technique has the potential to be an independent
method to determine spent fuel parameters. The results shown for lower burnup spent
fuel is promising, however higher burnups may need longer measurements in
applications to achieve usable results.
Various spent fuel loading patterns inside a HI-STORM 100S dry cask system
were investigated. The simulated measurement data indicates that detection of missing
spent fuel assemblies around the perimeter of the cask is feasible. Neutron energy
spectral simulations showed that the previously identified techniques to predict spent
fuel parameters are not applicable to cask measurements due to the self-shielding from

91
the assemblies and the attenuation from the cask system. This is a significant result
since it shows neutron energy spectral analysis is most applicable to individual, bare
spent fuel assemblies. Due to this finding, efforts shifted towards using the proposed
monitoring system to identify diverted assemblies or misloaded casks.
The proposed monitoring system is readily able to gather fast neutron count rates
from different points around the cask. However, the raw count rates are only useful if it
is possible to compare them to a known value. Cask fingerprinting methods compared
this to a previously measured value. The external neutron fluxes were modeled using a
detailed simulation, down to the rod and assembly level, which had not been done in
prior work that simplified the geometry. This produced a valid fingerprint for a
comparison. However, this detailed simulation was resource intensive, which presents
challenges considering the large number of casks in use. As high-performance
computing resources continue to grow, this may become a more feasible method.
This work also developed a mathematical model to predict external neutron
fluxes based on operator declared loading parameters and specific cask characteristics.
The mathematical model receives the input data and produces results in seconds. The
results were compared to a simulation of a similarly loaded cask and the overall trends
were noted to be very consistent with some overestimations of count rate. This is a
significant advantage as this method does not rely on an initial fingerprint that does not
exist or may have been taken from a cask with an existing anomaly. This offers the
ability to identify casks that were misloaded or otherwise compromised at the time of
loading.

92
This work may also be put in a general, long term perspective. Dry storage casks
could be in use for 100 years or even longer if permanent disposal methods remain
undecided. The methods presented here may serve as starting points for new methods
and techniques to verify the integrity of aging dry casks. As computing resources grow,
it is likely that full, detailed simulations of every cask in use could be created. The
results would only be limited by the accuracy of the fuel declarations. Improvements in
machine learning and multivariate analysis may enable further characterization of the
neutron energy spectra from spent fuel.

93
LIST OF REFERENCES
[1] International Atomic Energy Association, “Safeguards Techniques and Equipment: 2011 Edition,” Vienna, Austria, 2011.
[2] International Atomic Energy Association, “Optimization Strategies for Cask Design
and Container Loading in Long Term Spent Fuel Storage,” Vienna, Austria, 2006. [3] M. Holt, “Civilian Nuclear Waste Disposal,” 2015. [4] M. Tarvainen, F. Levai, T. E. Valentine, M. Abhold, and B. Moran, “NDA
techniques for spent fuel verification and radiation monitoring,” Helsinki, Finland, 1997.
[5] A. Rimpler, M. Börst, and D. Seifarth, “Neutron measurements around a TN85-
type storage cask with high-active waste,” Radiat. Meas., vol. 45, pp. 1290–1292, 2010.
[6] J. G. Richard, M. L. Fensin, S. J. Tobin, M. T. Swinhoe, J. Baciak, and H. O.
Menlove, “Characterization of the neutron source term and multiplicity of a spent fuel assembly in support of NDA safeguards of spent nuclear fuel,” in Proceedings of INMM 51st Annual Meeting, 2010.
[7] R. C. Ewing, “Long-term storage of spent nuclear fuel,” Nat. Mater., vol. 14, no. 3,
pp. 252–257, 2015. [8] F. King, L. Ahonen, C. Taxen, U. Vuorinen, and L. Werme, “Copper corrosion
under expected conditions in a deep geologic repository,” Stockholm, Sweden, 2001.
[9] International Atomic Energy Association, “The Present Status of IAEA Safeguards
on Nuclear Fuel Cycle Facilities,” IAEA Bull., vol. 22, no. 3. [10] International Atomic Energy Association, “IAEA Safeguards Glossary,” Vienna,
Austria, 2001. [11] A. Glaser and Z. Mian, “Fissile material stocks and production,” Bull. At. Sci.,
2009. [12] I. C. Gauld, J. E. Banfield, and S. E. Skutnik, “Developing Spent Fuel Assembly
Standards for Advanced NDA Instrument Calibration – NGSI Spent Fuel Project,” Oak Ridge, TN, 2014.
[13] Nuclear Energy Agency, “Spent Nuclear Fuel Assay Data for Isotopic Validation,”
2011.

94
[14] L. A. Khan and N. Ahmad, “Effect of Operating Cycle and Fuel Burnup on Isotopic Composition and Decay Characteristics of Irradiated Mtr-Type Low-Enriched Uranium Fuel,” Nucl. Technol., vol. 119, no. 2, pp. 201–210, 1997.
[15] J. Bruno and R. C. Ewing, “Spent Nuclear Fuel Measurements,” Richland, WA,
2014. [16] N. S. Shimanskaya, “Energy Spectra of Neutron Radiation from Spent Fuel of
VVER Reactor,” At. Energiya, vol. 49, no. 5, pp. 315–316, 1980. [17] R. S. Chandrasekharan, M. V. Hynes, and D. D. Flechtner, “Noble Gas Detection
for Fissile Content Determination,” U.S. Patent Application 13/196,772, 2013. [18] W. Gruhle, T. H. Seligmann, and H. H. Hackenbroich, “Evidence for Boson-Mode
Excitations in the 160(alpha,n) and 20Ne(alpha,n) Excitation Functions,” Z. Phys., vol. 262, pp. 271–278, 1973.
[19] I. Gauld and M. Francis, “Investigation of Passive Gamma Spectroscopy to Verify
Spent Nuclear Fuel Content,” in Proceedings of INMM 51st Annual Meeting, 2010.
[20] International Atomic Energy Association, “Storage of Spent Nuclear Fuel: Specific
Safety Guide,” 2012. [21] C. W. Forsberg and M. J. Haire, “Depleted Uranium Dioxide-Steel Cermets For
Spent-Nuclear-Fuel Multipurpose Casks,” in Proceedings of the American Nuclear Society Fifth Topical Meeting on DOE Spent Nuclear Fuel and Fissile Materials Management, 2002.
[22] Code of Federal Regulations Title 10 Part 72. 2016. [23] K. M. Králí, V. Kulich, J. Studený, and P. Pokorný, “Dosimetry at an interim
storage for spent nuclear fuel,” Radiat. Prot. Dosimetry, vol. 126, no. 1–4, pp. 549–554, 2007.
[24] A. Rimpler, “Bonner sphere neutron spectrometry at spent fuel casks,” Nucl.
Instruments Methods Phys. Res. A, vol. 476, pp. 468–473, 2002. [25] P. A. Santi, M. C. Browne, C. R. Freeman, R. F. Parker, and R. B. Williams,
“Initial Measurements of BN-350 Spent Fuel in Dry Storage Casks using the Dual Slab Verification Detector,” Proc. INMM 51st Annu. Meet., 2010.
[26] G. Jonkmans, V. N. P. Anghel, C. Jewett, and M. Thompson, “Nuclear waste
imaging and spent fuel verification by muon tomography,” Ann. Nucl. Energy, vol. 53, pp. 267–273, 2013.

95
[27] S. Chatzidakis, C. K. Choi, and L. H. Tsoukalas, “Interaction of cosmic ray muons with spent nuclear fuel dry casks and determination of lower detection limit,” Nucl. Instruments Methods Phys. Res. A, vol. 828, pp. 37–45, 2016.
[28] E. Rauch, “Signatures of Extended Storage of Used Nuclear Fuel Comprehensive
Final Report,” 2016. [29] I. C. Gauld, S. M. Bowman, B. D. Murphy, and P. Schwalbach, “Applications of
ORIGEN to Spent Fuel Safeguards and Non-Proliferation.” [30] L. Plagne and A. Ponçot, “Generic programming for deterministic neutron
transport codes,” ANS Top. Meet. Math. Comput., 2005. [31] A. Haghighat, Monte Carlo Methods for Particle Transport. Boca Raton, FL: CRC
Press, 2014. [32] J. C. Wagner, D. E. Peplow, S. W. Mosher, and T. M. Evans, “Review of Hybrid
(Deterministic/Monte Carlo) Radiation Transport Methods, Codes, and Applications at Oak Ridge National Laboratory,” Prog. Nucl. Sci. Technol., vol. 2, pp. 808–814, 2011.
[33] G. E. Bosler, J. R. Phillips, W. B. Wilson, R. J. Labauve, and T. R. England,
“Production of Actinide Isotopes in Simulated PWR Fuel and Their Influence on Inherent Neutron Emission Los Alamos National Laboratory Los Alamos , New Mexico 87545,” Los Alamos, New Mexico, 1982.
[34] P. Vaz, “Neutron transport simulation (selected topics),” Radiat. Phys. Chem., vol.
78, no. 10, pp. 829–842, 2009. [35] H.-Y. Kang, J.-H. Yoon, K.-S. Seo, S.-G. Ro, and B.-I. Choi, “Shielding Design of
Shipping Cask for 4 PWR Spent Fuel Assemblies,” J. Korean Nucl. Soc., vol. 20, no. 1, 1988.
[36] S. Ulam, R. D. Richtmeyer, and J. von Neumann, “Statistical Methods in Neutron
Diffusion,” 1947. [37] N. Metropolis and S. Ulam, “The Monte Carlo Method,” J. Am. Stat. Assoc., vol.
44, no. 247, pp. 335–341, 2008. [38] M. H. Kalos and P. A. Whitlock, Monte Carlo Methods. New York: John Wiley &
Sons, Inc., 1986. [39] S. C. Frankle, “Testing of the ENDF/B-VI Neutron Data Library ENDF60 for use
with MCNP,” Los Alamos, New Mexico, 1995. [40] J. K. Shultis and R. E. Faw, “An MCNP Primer,” 2004.

96
[41] R. J. Sheu, A. Y. Chen, Y. W. Liu, and S. H. Jiang, “Shielding Calculations for a Spent Fuel Storage Cask: A Comparison of Discrete Ordinates, Monte Carlo, and Hybrid Methods,” Nucl. Sci., vol. 159, pp. 23–36, 2008.
[42] J. K. Shultis, “Radiation Analysis of a Spent-Fuel Storage Cask,” 2000. [43] S. E. Smith, X. Sun, C. A. Ford, and A. W. Fentiman, “MCNP simulation of
neutron energy spectra for a TN-32 dry shielded container,” Ann. Nucl. Energy, vol. 35, no. 7, pp. 1296–1300, 2008.
[44] M. L. Fensin, S. J. Tobin, N. P. Sandoval, S. J. Thompson, and M. T. Swinhoe, “A
Monte Carlo linked depletion spent fuel library for assessing varied nondestructive assay technologies for nuclear safeguards,” 2009.
[45] J. G. Richard, J. Tobin, and G. Richard, “Description of Irradiated UO2 Fuel
Compositions Generated for NGSI Spent Fuel Libraries,” 2011. [46] J. D. Galloway, H. R. Trellue, M. L. Fensin, and B. L. Broadhead, “Design and
Description of the NGSI Spent Fuel Library with Emphasis on the Passive Gamma Signal,” J. Nucl. Mater. Manag., vol. XL, no. 3, pp. 25–35, 2012.
[47] T. Martinik et al., “Simulation of differential die-away instrument’s response to
asymmetrically burned spent nuclear fuel,” Nucl. Instruments Methods Phys. Res. Sect. A Accel. Spectrometers, Detect. Assoc. Equip., vol. 788, pp. 79–85, 2015.
[48] R. A. Weldon, M. L. Fensin, and H. R. Trellue, “Total neutron emission generation
and characterization for a Next Generation Safeguards Initiative spent fuel library,” Prog. Nucl. Energy, vol. 80, pp. 45–73, 2015.
[49] P. Peerani et al., “Testing on novel neutron detectors as alternative to3He for
security applications,” Nucl. Instruments Methods Phys. Res. A, vol. 696, pp. 110–120, 2012.
[50] D. Murer et al., “4He detectors for Mixed Oxide (MOX) fuel measurements,” IEEE
Nucl. Sci. Symp. Conf. Rec., pp. 4858–4864, 2012. [51] A. Breskin et al., “A novel liquid-Xenon detector concept for combined fast-
neutrons and gamma imaging and spectroscopy,” J. Instrum., vol. 7, no. 06, pp. C06008–C06008, 2012.
[52] D. Murer, “He-4 Fast Neutron Detectors in Nuclear Security Applications,” ETH
Zurich, 2014. [53] D. Reilly, N. Ensslin, and H. Smith, Passive Nondestructive Assay of Nuclear
Materials. Washington, D.C.: U.S. Government Printing Office, 1991.

97
[54] R. Crabbs, “Origen-S and Origen-Arp : Tips and Tricks,” 2009. [55] D. Rochman et al., “Efficient Use of Monte Carlo: Uncertainty Propagation,” Nucl.
Sci. Eng., vol. 177, no. 3, pp. 337–349, 2014. [56] W. Zwermann et al., “Nuclear data uncertainty and sensitivity analysis with
XSUSA for fuel assembly depletion calculations,” Nucl. Eng. Technol., vol. 46, no. 3, pp. 343–352, 2014.
[57] C. J. Díez, O. Buss, A. Hoefer, D. Porsch, and O. Cabellos, “Comparison of
nuclear data uncertainty propagation methodologies for PWR burn-up simulations,” Ann. Nucl. Energy, vol. 77, pp. 101–114, 2015.
[58] N. García-Herranz, O. Cabellos, J. Sanz, J. Juan, and J. C. Kuijper, “Propagation
of statistical and nuclear data uncertainties in Monte Carlo burn-up calculations,” Ann. Nucl. Energy, vol. 35, no. 4, pp. 714–730, 2008.
[59] M. D. DeHart and O. W. Hermann, “An Extension of the Validation of SCALE
(SAS2H) Isotopic Predictions for PWR Spent Fuel,” Oak Ridge, TN, 1996. [60] C. Hellesen, S. Grape, P. Jansson, S. Jacobsson Svärd, M. Åberg Lindell, and P.
Andersson, “Nuclear spent fuel parameter determination using multivariate analysis of fission product gamma spectra,” Ann. Nucl. Energy, vol. 110, pp. 886–895, 2017.
[61] “Holtec International - Industry Leadership in Dry Storage and Transport of Used
Fuel.” [Online]. Available: https://holtecinternational.com/company/divisions/nuclear-power-division/dry-storage-projects/. [Accessed: 17-Sep-2018].
[62] Holtec International, “Final Safety Analysis Report for the HI-STORM 100 Cask
System,” 2014. [63] C. W. Forsberg, “A Multifunction Cask for At-Reactor Storage of Short-Cooled
Spent Fuel , Transport , and Disposal,” in Proceedings of International Congress on Advances in Nuclear Power Plants, 2004.
[64] Y. Chen, Y. Chiou, S. Chang, S. Jiang, and R. Sheu, “Effects of Source and
Geometry Modeling on the Shielding Calculations for a Spent Nuclear Fuel Dry Storage Cask,” Nucl. Technol., vol. 182, no. May, 2013.
[65] J. C. Wagner and M. D. Dehart, “Review of axial burnup distribution
considerations for burnup credit calculations,” Oak Ridge, TN, 1999. [66] E. P. Blizard and L. S. Abbott, Reactor Handbook, vol. III. New York: John Wiley
& Sons, Inc., 1962.

98
[67] M. F. Kaplan, Concrete Radiation Shielding. New York: John Wiley & Sons, Inc., 1989.
[68] A. El-Sayed Abdo, “Calculation of the cross-sections for fast neutrons and
gamma-rays in concrete shields,” Ann. Nucl. Energy, vol. 29, no. 16, pp. 1977–1988, 2002.
[69] Nuclear Regulatory Commission, “NRC: Backgrounder on High Burnup Spent
Fuel,” 2015. [Online]. Available: https://www.nrc.gov/reading-rm/doc-collections/fact-sheets/bg-high-burnup-spent-fuel.html. [Accessed: 06-Jan-2018].
[70] E. Rauch, “Signatures of Extended Storage of Used Nuclear Fuel in Casks,”
2016.

99
BIOGRAPHICAL SKETCH
A native of Florida, Ira Harkness graduated from the University of Florida in 2007
with a Bachelor of Science degree in materials science and engineering. During the
following years, he was employed as an information technology manager at the
University of Florida. In 2011, he obtained a Master of Science in digital forensics from
the University of Central Florida. In 2018, he obtained a Doctor of Philosophy in nuclear
engineering sciences from the University of Florida.
Copyright © 2022 FDOKUMEN