extracted from technical assessment of the renewable
60
EXTRACTED FROM TECHNICAL ASSESSMENT OF THE RENEWABLE ENERGY NEEDS OF THREE (3) DOWASCO WATER PUMPING STATIONS, DOMINICA by Nathan Hart ABBREVIATIONS AND ACRONYMS ~ - Approximate/Approximately AC – Alternating Current AWG – American Wire Gauge BMS – Battery Management System BOS – Balance of the System Components CARICOM – Caribbean Community CCCCC – Caribbean Community Climate Change Centre CO2 – Carbon Dioxide DC – Direct Current DG – Distribution Generator/Generating DOD – Depth of Discharge DOMLEC - Dominica Electric Power Company DOWASCO – The Dominica Water and Sewage Company Ltd EC$-Eastern Caribbean Dollars EE – Energy Efficiency EEO’s – Energy Efficiency Opportunities EOI – Energy-efficient Options ESO – Energy Saving Opportunities Exchange Rate - 1$USD = $2.70 EC GED – Dominica Electrical Engineering Department GENSET – Generator System GHG – Green House Gas GUI – Graphic User Interface IEC - International Electro-technical Commission IEEE - Institute of Electrical and Electronics Engineers IP – Waterproof and Dustproof rating IP67, IP68
-
Upload
khangminh22 -
Category
Documents
-
view
4 -
download
0
Transcript of extracted from technical assessment of the renewable

EXTRACTED FROM TECHNICAL ASSESSMENT OF THE RENEWABLE
ENERGY NEEDS OF THREE (3) DOWASCO WATER PUMPING STATIONS,
DOMINICA by Nathan Hart
ABBREVIATIONS AND ACRONYMS
~ - Approximate/Approximately
AC – Alternating Current
AWG – American Wire Gauge
BMS – Battery Management System
BOS – Balance of the System Components
CARICOM – Caribbean Community
CCCCC – Caribbean Community Climate Change Centre
CO2 – Carbon Dioxide
DC – Direct Current
DG – Distribution Generator/Generating
DOD – Depth of Discharge
DOMLEC - Dominica Electric Power Company
DOWASCO – The Dominica Water and Sewage Company Ltd
EC$-Eastern Caribbean Dollars
EE – Energy Efficiency
EEO’s – Energy Efficiency Opportunities
EOI – Energy-efficient Options
ESO – Energy Saving Opportunities
Exchange Rate - 1$USD = $2.70 EC
GED – Dominica Electrical Engineering Department
GENSET – Generator System
GHG – Green House Gas
GUI – Graphic User Interface
IEC - International Electro-technical Commission
IEEE - Institute of Electrical and Electronics Engineers
IP – Waterproof and Dustproof rating IP67, IP68

2
IRC –Independent Regulatory Commission of Dominica
KVA – Kilo Variance
kW - Kilowatt
KWh – Kilowatt-hour
KWp – Kilowatt Peak
LCOE – Levelized Cost of Electricity
MDP – Main Distribution Panel
MIGD – Million Imperial Gallons per day
MPPT/MPP – Maximum Power Point Tracking/ Maximum PowerPoint
MTS – Manual Transfer Switch
MWh- Megawatt-hour
NEC – North America Electric Code
NRW- Non-Revenue Water
Ø – Phase
OCPD – Overcurrent Protection Devices
P 1-29 – Valve and Distribution Connection points
PCU – Power Conditioning Unit/Inverter
Pf – Power factor
PS – Pumping Station
PV – Photovoltaic
REO – Renewable Energy Options
RET Screen – Renewable Energy Economic Analysis Tool
STC – Standard test conditions
T&D - Transmission and Distribution
TUV - Technical Inspection Association of Germany
UL - Underwriters Laboratories
USD$ – United States dollar
VFD/VSD – Variable Speed Drives

3
Technical Assessment and electrical/energy audit were conducted at three (3) sites: Jimmit Pump station,
Warner Pumping station and the Tete Morne/Grand Bay Pump station under the supervision of
DOWASCO engineer and the operational guidance of the stations pump operators. To collect the data
the consultant supplied and used Amprobe dm- II plus 1000a power quality analyzer, which measures
all of the electrical characteristics – Kilowatts- KW, Kilo Variance- KVARs, Current – I, Power Factor
– pft, Harmonics, Voltages- V, Kilo Voltage Amperes- KVA and waveform of the Current and voltages.
The Consultant also thought it necessary to analyze PV shading of each site given the topography of the
island of Dominica, this shading analysis was performed using the ‘Solar Pathfinder’ analyzer.
The site visit was conducted during the period of 3rd December 2019 to 8th December 2019. Data
collection and the station’s technical electrical assessment and energy analysis were staggered over this
period because of safety and ground access to the sites. Additionally, data collected from the Chief
Engineer along with information shared from the Finance and Operations Department for the economic
years of 2018 and 2019 revealed that the total cost of energy for the budget for these time periods
amounted to $EC 1.1M and $EC 1.3M respectively.
From the onset of this technical assignment which will generate REO’s more specifically recommended
grid-interactive photovoltaic systems, the Consultant recognized that it was prudent to have detailed
technical discussion(s) with the grid operator DOMLEC, in order to determine the correct protocol,
procedures and technical requirements to ensure successful grid interconnection. Furthermore, the
Consultant noted that grid-interactive systems required licensing from the IRC (Independent Regulatory
Commission); thus, a detailed technical meeting was conducted. This information will be critical to
ensure the process of grid interconnection for DOWASCO.
For the specific purpose of this technical needs assessment for DOWASCO RE options, several energy
economic drivers were extrapolated from DOWASCO power utility data. The following values were
derived:
• Cost of Energy (including fuel surcharge and VAT) = ~ 1.244 EC$/kWh1 or 2USD$0.46/kWh
• KVA Demand Cost = 1.00 EC$/KVA Month3
• Energy Index Tete Morne = 0.65kWh/M3
• Energy Index Jimmit = 0.36kWh/M3
• Energy Index Warner = 0.21kWh/M3
• Monthly energy average for Tete Morne Station = 5366 kWh
• Monthly energy average for Jimmit Station = 8009kWh
• Monthly energy consumption for Warner Station =430.9kWh
The main results are:
1. Jimmit Booster Station
a. The potential area that can be used for PV installations ~ 3250ft2 ± 10%
b. Overall shading is less than 10% for all months
1 This Value is based on calculated averages for year 2018/2019 2 Exchange rate 1$USD = $2.70 EC 3 Consultant noted that KVA for each station was 1 no matter the demand

4
c. Inverter size recommended for the array is any combination 50kWac
d. Gross annual GHG emission reduction of 51.6tons of CO2/yr.
e. Spec. energy yield (approx.) 1305 kWh/kWp
2. Tete Morne Booster Station
a. The potential area that can be used for PV installations ~ 2087 ft2 ±10%
b. Overall shading is less than 10% for all months
c. Inverter size recommended for the array is any combination 50kWac
d. Gross annual GHG emission reduction tons of CO2 approximately 55tons/yr.
e. Spec. energy yield (approx.): 1312 kWh/kWp
f. After expansion Tete Morne facility energy demand will increase from
5366kWh/month to ~ 23,940kWh/month with an estimated average cost of
$EC 29,782/month (current cost is ~ EC$6,670.92)
The results of the recommendations were based on several activities that included:
• Conducting a physical site visit to DOWASCO’s three (3) water pumping stations, namely, an
inspection of each site, Jimmit, Warner and Tete Morne booster Stations and Data Collection
• Interviewing key facility personnel to establish operating characteristics of the facilities,
operating and maintenance procedures, unusual operating constraints, and anticipated future
expansions or changes to the facility, specifically for the Tete Morne facility/station
• Inspecting and observing the facility in order to map energy use flows and operations
• Reviewing all available documentation, including all structural building drawings, mechanical
and electrical drawings
• Analyzing information generated by RetScreen software specific to Clean Energy projects that
provides engineering economic data along with avoided CO2/GHG.
One of the challenges faced during this assignment was the lack of flow meters at the station and access
to the main power cables. Flow meters would be appropriate for engineering analysis to get a clear
indication of each station energy index, which is one of the useful indicators to understand the energy
consumed in the pumping process; thus, an engineering estimated calculation was made based on
operational flow rate and tank sizes. Access to power cables through the facility presented a high
electrical shock risk factor to the Consultant, the current and voltage at the industrial level can result in
death or serious injury.
In summary, the technical assessment and evaluation conducted at the three (3) pumping facilities,
revealed that DOWASCO engineering selection and the use of appropriate pumps to meet demand and
elevations ‘head’ requirements, were well selected and the pumping engineering distribution system
within each station was set up to achieve maximum and efficient operation based on the current electrical

5
infrastructure. Such precise pump engineering and pump selection will continue to integrate well with
DOWASCO’s goal of achieving the best possible energy-efficient operation which will complement the
Company’s renewable energy framework.

6
DOWASCO Energy and Water Sector of Commonwealth of Dominica
Dominica is situated in the eastern Caribbean, south of Guadeloupe and north of Martinique. With an
area of 751 km² (289.5 sq. mi), the island has a coastline of 148 km, its landscape is mountainous and
of volcanic origin, the highest peak is Morne Diablotins, at 1,447 m (4,747 ft.), the dormant volcano is
the second highest mountain in the Lesser Antilles, after La Grande Soufriere in Guadeloupe. The
Windward Islands includes Dominica, Grenada, Martinique, Saint Lucia, and St. Vincent and the
Grenadines. Dominica is the most northern of the Windward Islands has a population of 71,808
inhabitants (2019), with Roseau as its capital and largest city.
The island has significant eco-tourism potential, but poor infrastructure and the absence of an
international airport which has impeded the industry's growth. The country is also vulnerable to
hurricanes, notably Tropical Storm Erika in 2015 and Hurricane Maria 2017, thus climate change has
negatively impacted this island far more significant than some of its neighbouring counterparts. The
Dominica Water and Sewage Company Limited –DOWASCO, a government-owned company provides
100% of the islands potable water supply. Dominica has 2,706 m³/person/year of water per inhabitant
(2017)4. According to the Chief Engineer5 for DOWASCO, water production average about 10MIGD,
where source water is captured at various points of higher elevations from the mountainous regions via
gravity and then boosted via strategically placed PS: Warner, Jimmit and Tete Morne as examples. Also
noted during the engineering interview with the chief engineer, estimates from water production versus
4 https://www.worldometers.info/water/dominica-water/ 5 Mr. Magnus Williams
Figure 1 General Map of Dominica

7
billed water by DOWASCO indicated that unaccounted-for-water or commonly known as NRW is
estimated to be around 58.5%. The Consultant also noted from the interview that the adverse climate
conditions experienced by the country has also directly impacted DOWASCO and has damaged a large
percentage of the distribution network, this has aggravated the NRW condition that exists today;
needless to say, there is no program to counteract this NRW to date.
DOWASCO has installed 97.2kW PV system at its sewage treatment facility in its capital city Roseau,
however, to date it has not been energized because of high harmonic intermittence mentioned by
DOMLEC engineers. Thus prior to the above project, all the energy consumed by DOWASCO is
generated by the Dominica Light & Power Utility Company, which EMERA Caribbean Inc., holds a
52% interest in Dominica Electricity Services Ltd-DOMLEC.
DOMLEC serves approximately 35,300 customers with a peak demand of about 18MWh6on the island
of Dominica. The Independent Regulatory Commission (IRC)7 which regulates the electricity industry
in the Commonwealth of Dominica recently granted two licenses to the Company. The first is a non-
exclusive generation license, and the second is an exclusive license to transmit, distribute and supply
electricity within Dominica. These licenses came into effect on 1st January 2014. As is relates to
DOMLEC generation capacity, the Company operates three run-of-the-river hydro plants on the Roseau
River in the Roseau Valley and two diesel plants; however, noted during the interview process, two of
the hydro plants are currently off-line as a result of the two major hurricanes that have affected the
island, reducing load capacity from a peak of 18MWh to a peak of 14MWh to date. The engineers also
highlighted that the loss of ROSS University, which was DOMLEC largest customers has affected the
peak loading by approximately 30%. The hydro plants are the Laudat plant, the Trafalgar plant and the
Padu plant with installed capacities of 1.24MW, 3.52MW and 1.8MW respectively. These three plants
are automated and controlled from the System Control Center located in Fond Cole. The two diesel
stations: Fond Cole and Sugar Loaf, have installed capacities of 13.3MW and 6.8MW respectively.
However, Low Peak loading demand continues to hamper this utility Company, though, outside the
scope of this consultancy, this has a direct effect on the amount and the quality of renewable penetration
allowed by DOMLEC as the grid operator.
Electricity rates in Dominica are one of the highest, if not the highest, in the Caribbean, approximately
$EC1.244/Kwh or $ US0.46/kWh. The transmission and distribution (T&D) network comprised of 403
kilometres of 11kV and 922 kilometres of 230/400V overhead lines. This current infrastructure serves
a customer base of approximately 35,300 customers or about 98% of the island. All generation sources
are linked via 11kV inter-connectors and, in some instances, via 33kV distribution feeders.
The DOWASCO pump stations that have been audited as result of this technical assessment conducted,
are billed under commercial class by DOMLEC with varying monthly surcharge cost of
EC$0.3499/kWh - $EC 0.3951/kWh, EC$4.32/KVA and commercial Block 1 Charge of EC
$0.733/kWh, bringing the average cost of electricity at a commercial rate of ~EC$ 1.244/kWh.
6 See Initial report for interviewed response from DOMLEC Engineers 7 See Initial report for interviewed response from IRC Engineer

8
DOMLEC Tariffs
Item Residential Commercial Industrial
Fixed KVA Demand $EC/KVA N/A 4.32 4.32
Power/ Energy $EC/kWh 1st bulk 0.578 up
to 50kWh; 0.67
2nd bulk
>50kWh
0.733 6:00am -10pm
@0.633;
10:00pm-
6:00am
@0581
Fuel Surcharge $EC/kWh Variable Variable Variable
Time of Use - TOU N/A Not requested by
DOWASCO
yes
Penalty system Customer/Utility No No No
Figure 2 Table showing DOMELC Tariff
8Figure 3 Chart showing DOMLEC fuel Surcharge 2019 history9
8 For 2019 the average was 0.34$EC/kWh (Max 0.399-May 2019 ; Min 0.33 –October 2019) 9 The rate is calculated monthly. Actual fuel charge depends on the KWHs consumed.
0.30.310.320.330.340.350.360.370.380.39
0.4
DOMLEC Fuel Surcharge $EC/kWh

9
Figure 4 Chart showing Energy Index Comparison

10
Presentation of the DOWASCO Technical Assessment Report of the Renewable
Energy Needs of Tete Morne, Jimmit & Warner Pumps Stations
Organization
DOWASCO is a statutory corporation that has the sole responsibility for the management and control
of Dominica water resources for potable use. It is responsible for managing, allocating and monitoring
the water resources of Dominica with a view to ensuring their best development, utilization,
conservation and protection in the public interest. It is also responsible for the designing, construction,
acquisition, provision, operation and maintenance of water and sewerage works for the purpose of
supplying water for public purposes and the receiving, treating and disposing of sewage, respectively.
As a result, this technical assessment of the renewable energy needs of the DOWASCO pumping station
Warner, Jimmit & Tete Morne under the guidance of the Caribbean Community Climate Change Centre
feeds well into DOWASCO common goal of building a more climate-resilient utility infrastructure
while consciously reducing its carbon footprint.
Energy Audit Methodology for the Technical Assessment
The technical assessment audit methodology used a set of techniques to determine the degree of
electrical characteristics during the normal operational mode of each station with respect power quality
and energy usage; as well as, to a certain degree determine areas of potentially wasted energy. The
assessment will also follow through on the physical site characteristics to determine best REO’s as it
relates to photovoltaic application specific to each site. Conclusions drawn from the technical
assessment audit include the identification and quantification of low-cost measures or profitable
investments for saving energy through new PV installations, which will feed into and make up part of
the project development of DOWASCO renewable energy plan and adds to a comprehensive energy
efficiency project.
Based on the technical assessment of the energy audit at the water booster/pumping stations performance
which relates to pumping and operation efficiency, the Consultant will make the following
recommendations for improvement and REO’s, based on the principle “energy-consuming systems”
within each pump stations, which are:
• Motor and pump assembly, including efficiencies, operating conditions and maintenance aspects
• The Electrical distribution systems, including wires, pumps starters and OCPDs
• Electromotive system, including the transformers, metering units and Feeders
11
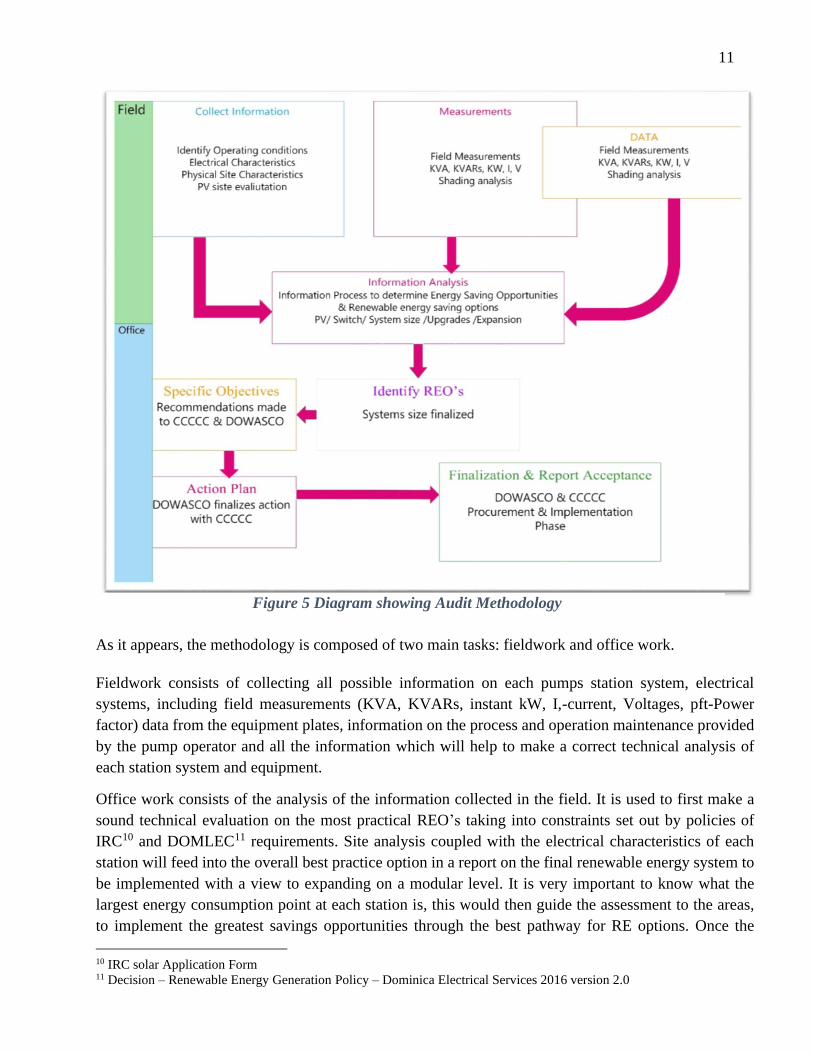
As it appears, the methodology is composed of two main tasks: fieldwork and office work.
Fieldwork consists of collecting all possible information on each pumps station system, electrical
systems, including field measurements (KVA, KVARs, instant kW, I,-current, Voltages, pft-Power
factor) data from the equipment plates, information on the process and operation maintenance provided
by the pump operator and all the information which will help to make a correct technical analysis of
each station system and equipment.
Office work consists of the analysis of the information collected in the field. It is used to first make a
sound technical evaluation on the most practical REO’s taking into constraints set out by policies of
IRC10 and DOMLEC11 requirements. Site analysis coupled with the electrical characteristics of each
station will feed into the overall best practice option in a report on the final renewable energy system to
be implemented with a view to expanding on a modular level. It is very important to know what the
largest energy consumption point at each station is, this would then guide the assessment to the areas,
to implement the greatest savings opportunities through the best pathway for RE options. Once the
10 IRC solar Application Form 11 Decision – Renewable Energy Generation Policy – Dominica Electrical Services 2016 version 2.0
Figure 5 Diagram showing Audit Methodology

12
projects and recommendations are made, the Procurement and Action Plan may be integrated into the
DOWASCO Climate Change Energy Efficiency and Renewable Energy Program.
The proposed methodology is focused on the following typical energy efficiency measures but not
limited to:
• Power factor determination
• Pump characteristics
• Station Voltages, Operational Currents, KVA, KVARs,
• Electrical Waveform performance/characteristics
• Station switch gear orientations and OCPD devices
• Station supply and demand characteristics
• Selection of the optimal size of conductors
Other opportunities for energy savings that can result from this type of analysis may include tariff
adjustments, operating equipment during off-peak hours, generation of onsite energy, during peak
demand hours, application of variable frequency drives.
ENERGY AUDITS FIELDWORK
Fieldwork to audit systems consists of two main surveys to:
• Obtain the equipment characteristics
• Preform PV site Shading analysis
• Record all the field measurements of the equipment
The equipment characteristics are taken in the field by collecting information on the electrical system,
the electrical motor plate, and the pump plates in all of the equipment. Additional data are taken from
the operator that controls on the stations. This information is collected in a field format for all
equipment.

13
Evaluating Technical Assessment of Energy-Saving Opportunities &
Renewable Energy Options
The final step of the methodology proposed is to determinate the energy savings opportunities of each
station specific to photovoltaic technology in order to increase the energy efficiency and reduce power
usage from traditional generation. These savings opportunities include the substitution of existing
electrical equipment that will help determine the new equipment characteristics. Then, with the new
equipment and savings proposals, the expected new energy reduction balance has to be processed to
calculate the expected energy savings. Finally, a calculation of final economic savings, investment costs,
and payback time have to be calculated as the final step of the energy efficiency audit methodology.
(The latter is currently outside the scope of this contract project, however, it will form part of the
recommendation for Monitoring and Evaluation).
Economic Evaluation for Saving Opportunities & Renewable Energy
Options
Direct Economic Savings
The expected savings from reducing energy input from the grid via photovoltaic applications will result
in a more efficient system. The amount of energy savings is obtained by multiplying the energy saved
(kWh saved) by the cost of energy. For the purpose of this audit, a value of $EC1.24412/KWh is assumed.
RESULTS OF ENERGY AUDITS
12 See figure 2 DOMELC Tariff
Figure 7 Showing Amprobe Meter for electrical
measurements
Figure 6 Showing CT & VT around 400v system feeders

14
Audited Systems Process Description Jimmit Pump Station
The Jimmit Pump station is located approximately 30 minutes drive from the main capital Roseau off
the main access road that goes north to Portsmouth’s. Based on an operational interview with
engineering and the operation staff, the station operates for 13 hours per day each day of the week via
set electronic timers, the times are:
• 1 am – 7 am
• 12pm – 3pm
• 7 pm – 11 pm
Jimmit Pump
Station
Figure 8 Location of Jimmit Booster Pump
Station

15
Electrical & Pumping Characteristics of Booster Pump Stations
Figure 9 Schematic of Jimmit Electrical and Pumping arrangement
Jimmit Booster Pump Station
Jimmit booster station gets its supply of water from mains incoming from Mahuat area at a lower
elevation. The station is comprised of four (4) GRUNDFOS13 booster pumps. There are two CRN 15-
16 SF and two CRN 15-12 A-FGJ-G-E HQQE. Figure 9 shows that the current orientation is one 15kW
and one 11kW pumps each arranged in series to achieve relevant operational head14 for DOWASCO
operational needs. Each pair, which are in parallel, are rotated according to operation and maintenance
needs by engineering an operational staff. The pumps operate direct online with LiqTec controls to
prevent operational damage due to low or reduce suction rate.
13 See figure 9 for JIMMIT booster pumps specification 14 Max achievable height/elevation at which a pumps can raise water up
16
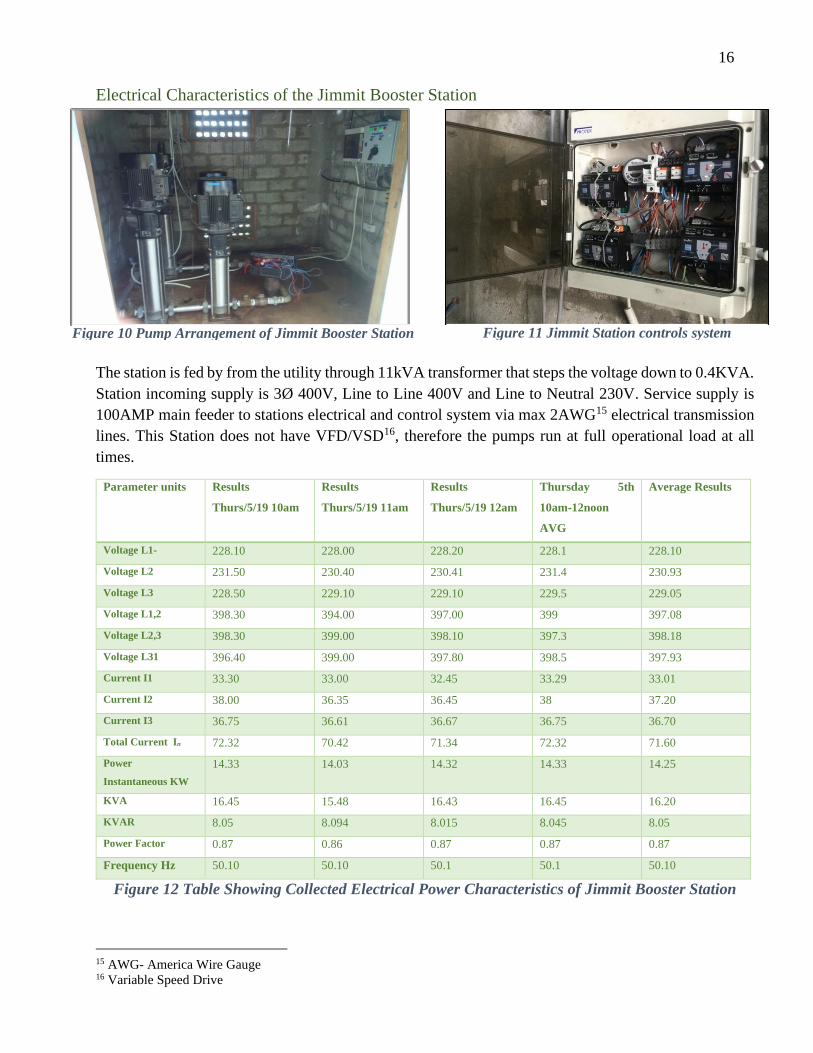
Electrical Characteristics of the Jimmit Booster Station
The station is fed by from the utility through 11kVA transformer that steps the voltage down to 0.4KVA.
Station incoming supply is 3Ø 400V, Line to Line 400V and Line to Neutral 230V. Service supply is
100AMP main feeder to stations electrical and control system via max 2AWG15 electrical transmission
lines. This Station does not have VFD/VSD16, therefore the pumps run at full operational load at all
times.
Parameter units Results
Thurs/5/19 10am
Results
Thurs/5/19 11am
Results
Thurs/5/19 12am
Thursday 5th
10am-12noon
AVG
Average Results
Voltage L1- 228.10 228.00 228.20 228.1 228.10
Voltage L2 231.50 230.40 230.41 231.4 230.93
Voltage L3 228.50 229.10 229.10 229.5 229.05
Voltage L1,2 398.30 394.00 397.00 399 397.08
Voltage L2,3 398.30 399.00 398.10 397.3 398.18
Voltage L31 396.40 399.00 397.80 398.5 397.93
Current I1 33.30 33.00 32.45 33.29 33.01
Current I2 38.00 36.35 36.45 38 37.20
Current I3 36.75 36.61 36.67 36.75 36.70
Total Current In 72.32 70.42 71.34 72.32 71.60
Power
Instantaneous KW
14.33 14.03 14.32 14.33 14.25
KVA 16.45 15.48 16.43 16.45 16.20
KVAR 8.05 8.094 8.015 8.045 8.05
Power Factor 0.87 0.86 0.87 0.87 0.87
Frequency Hz 50.10 50.10 50.1 50.1 50.10
Figure 12 Table Showing Collected Electrical Power Characteristics of Jimmit Booster Station
15 AWG- America Wire Gauge 16 Variable Speed Drive
Figure 11 Jimmit Station controls system Figure 10 Pump Arrangement of Jimmit Booster Station

17
Figure 12 shows the electrical performance characteristics of the Jimmit station, the result will vary little
given the fact that pumps operate at full load during operation. Pumps work direct online through OCPD
devices with LiqTec control flow rate devices that prevent a dry run in the event of loss of suction
pressure. Smart control starters like soft-starts and VSD’s can regulate power usage according to
network demand, pressure and flows of which are outside of the scope of this consultancy.
Figure 13 shows that 66% of the energy consumed by the station is used to deliver water into the
distribution network. Leakage loss, suction/discharge loss and electrical losses are minimal. While
motor and pump losses are within an acceptable range.
Electrcial Losses
3%
Motor & Pump
Losses
30%
suction & discharge
losses
1%
leakage losses
0%Useful Work
66%
AVERAGE POWER USED BY STATION KWH/ MONTH
Figure 13 Chart Showing Energy Balance Jimmit Booster station

18
Comments:
• Electrical, suction & discharge and leakage losses are minimal
• The pump station is operating on the best possible efficiency it can with the current electrical
infrastructure
• Operational power factor is good
• Without flow meters at the station, based on the electrical parameters recorded it can be assumed
that the pumps are operating within pump characteristics
Physical Site Layout
Comments
• Site is relatively small with a large concrete water tank area ~1517ft2
• There are two structures with concrete roofs
• The area has a lot of external vegetation
• The potential area that can be used for PV installations ~ 3250ft2 ± 10%
• PV systems can be mounted almost anywhere however good structural engineering will be
recommended
Figure 14 Physical site layout Jimmit Station

19
PV Site shading analysis Jimmit Station
Figure 15 Jimmit Shading analysis pt. 1

20
Figure 16 Showing Jimmit Station area and solar analysis of site
Figure 17 PV solar site analysis of Jimmit Station Area

21
PV site area analysis- Jimmit
• Months May June July approximately 9% shading due to structures and vegetative growth
• Months April and August approximately 5% shading due to structures and vegetative growth
• Months November, December, January approximately 7% shading due to structures and
vegetative growth
• Months February, March, September, October, approximately 4-5% shading due to structures
and vegetative growth
• Shading occurs from between hours 6 am – 8:30 am & 5 pm – 6 pm
• The topography and geography of Dominica will have shading impact on any PV system
• Overall Shading is less than 10% for all months
• Good design and equipment with high efficiencies will compensate for losses due to shading
issues
Climate data location
Show data
Unit
Climate data
location Project location
Latitude ˚N 15.5 15.5
Longitude ˚E -61.3 -61.3
Elevation m 14 14
Heating design temperature °C 19.7
Cooling design temperature °C 31.7
Earth temperature amplitude °C 1.3
Month Air temperature
Relative
humidity
Daily solar
radiation -
horizontal
Atmospheric
pressure Wind speed
Earth
temperature
Heating
degree-days
Cooling
degree-days
°C % kWh/m²/d kPa m/s °C °C-d °C-d
January 24.9 71.9% 4.08 101.5 7.4 26.7 0 462
February 24.8 72.1% 4.61 101.5 6.9 26.3 0 414
March 25.1 73.2% 5.19 101.4 6.5 26.4 0 468
April 25.8 75.9% 5.61 101.4 5.8 26.9 0 474
May 26.6 77.8% 5.83 101.4 6.0 27.5 0 515
June 27.3 77.9% 5.72 101.5 6.8 27.8 0 519
July 27.4 78.6% 6.17 101.5 7.0 28.0 0 539
August 27.4 79.7% 5.94 101.4 6.2 28.5 0 539
September 27.1 80.2% 5.28 101.3 5.5 28.7 0 513
October 26.1 79.9% 4.86 101.2 5.3 28.6 0 499
November 26.2 77.6% 4.31 101.2 6.0 28.2 0 486
December 25.4 73.1% 4.19 101.4 6.8 27.4 0 477
Annual 26.2 76.5% 5.15 101.4 6.3 27.6 0 5,906
Measured at m 10.0 0.0
Melville Hall A
Site reference conditions Select climate data location
Figure 18 Climate and Solar irradiation data Dominica - RETSCREEN

22
TECHNICAL ASSESSMENT PHOTOVOLTAIC ENERGY SAVING OPPORTUNITIES FOR
THE JIMMIT AUDITED SYSTEMS AND COST EVALUATION
Using all the data procured in the field: site analysis, station energy usage and supplied information as
explained by methodology previously and constrained by budgetary capital the following photovoltaic
saving opportunities are recommended:
• Total useable area for photovoltaic modules at the site assuming that DOWASCO will allow
mounting on structures present on the site is approximately 3250ft2
• Assuming standard module of 5’4 x 3’3 (65” x39”), the site can accommodate approximately
max of 163 modules @ 60 cell technology
• Assuming higher wattage modules ≥ 300watts, PV array system based on 163 modules is
approximately 48,900Wdc or 48.9kWac minimum
• Inverter size recommended for the array is any combination 50kW≤ inverter ≤ 55kW
• Based on average the DOMLEC consumption of ~8,160kW, unless otherwise approved by
DOMLEC, to be eligible to connect and operate in parallel with DOMLEC’s Grid, the DG
renewable must have a maximum aggregate capacity per facility of 1.5 times the Customer’s
current average usage up to a maximum of 150kW. This calculation result in the max size
specified for Jimmit is 81.6kW. However, site analysis, budget and space allocation the
Consultant recommends a system no larger than 55kW
• Number of modules for 30kW recommended assuming 60cell PV module modules≥ 300watts
is 100 modules
• See RETSCREEN analysis in figure 19 for economic engineering analysis
• Assumed 20% Capacity Factor
• Assumed Net Metering effect for calculation
30kW photovoltaic Jimmit Financial viability
Financial viability
• Pre-tax IRR - equity % 57.3%
• Pre-tax IRR - assets % 51.7%
• Simple payback yr 1.9
• Equity payback yr 1.8
• 17Gross annual GHG emission reduction tons of CO2 is approximate 51.6t
17 There no CO2 base case for Dominica. Base case was model after Jamaica CO2 avoided Carbon foot print

23
Incremental initial costs
Technology
Analysis type
Method 1
Method 2
Photovoltaic
Power capacity kW 31.72 117.8% 145,938$
Manufacturer
Model 104 unit(s)
Capacity factor % 20.0%
Electricity delivered to load MWh 56 27.3%
Electricity exported to grid MWh 0.0
Electricity rate - base case $/MWh 1,244.00
Fuel rate - proposed case power system $/MWh 0.00
Electricity export rate $/MWh 1,244.00
Electricity rate - proposed case $/MWh 1,244.00
Electricity delivered to load
Electricity
exported to grid
Remaining
electricity
required
Power
system fuel
Operating
profit (loss) Efficiency
Operating strategy MWh MWh MWh MWh $ %
Full power capacity output 56 0 148 0 69,133 -
Power load following 56 0 148 0 69,133 -
Select operating strategy
Emission Analysis
Base case electricity system (Baseline)
GHG emission
factor
(excl. T&D)
T&D
losses
GHG emission
factor
Country - region Fuel type tCO2/MWh % tCO2/MWh
Dominica All types 0.000
Electricity exported to grid MWh 0 T&D losses
GHG emission
Base case tCO2 0.0
Proposed case tCO2 0.0
Gross annual GHG emission reduction tCO2 0.0
GHG credits transaction fee %
Net annual GHG emission reduction tCO2 0.0 is equivalent to 0.0
GHG reduction income
GHG reduction credit rate $/tCO2
Financial parameters
Inflation rate % 1.0%
Project life yr 25
Debt ratio % 10%
Debt interest rate % 3.00%
Debt term yr 10
Initial costs
Power system $ 145,938 96.7%
Other $ 5,000 3.3%
Total initial costs $ 150,938 100.0%
Incentives and grants $ 0.0%
Annual costs and debt payments
O&M (savings) costs $ 5,000
Fuel cost - proposed case $ 184,163
Debt payments - 10 yrs $ 1,769
$
Total annual costs $ 190,933
Annual savings and income
Fuel cost - base case $ 266,628
$
Total annual savings and income $ 266,628
Financial viability
Pre-tax IRR - equity % 57.3%
Pre-tax IRR - assets % 51.7%
Simple payback yr 1.9
Equity payback yr 1.8
Full power capacity output
mono-Si - SPR-305-WHT
RETScreen Energy Model - Power project
Cumulative cash flows graph
Cu
mu
lati
ve c
ash
flo
ws (
$)
Year
Sunpower
Cars & light trucks not used
See product database
Financial Analysis
Proposed case power system
Show alternative units
Photovoltaic
-500,000
0
500,000
1,000,000
1,500,000
2,000,000
2,500,000
0 1 2 3 4 5 6 7 8 9 10 11 12 13 14 15 16 17 18 19 20 21 22 23 24 25
Figure 19 Financial Analysis for Jimmit Station PV performance

24
30kW Photovoltaic Technical Data recommendation for Jimmit Station
• Total number of PV modules: 102
• PV peak power: 31.11 kWp
• Number of inverters: 3
• Nominal AC power: 30.00 kW
• AC active power: 30.00 kW
• Active power ratio: 96.4 %
• Annual energy yield (approx.) 40586.40 kWh18
• Energy usability factor: 100 %
• Performance ratio (approx.): 82.9 %
• Spec. energy yield (approx.) 1305 kWh/kWp
• Line losses (in % of PV energy): 0.88 %
• Unbalanced load: 0.00 VA
• Self-consumption: 34475.12 kWh
• Self-consumption quota: 84.9 %
• 19Performance and self-consumption data shows 84.9% of the total energy consumed
• Maximum losses due to shading at 6.5% is approximately 2638.116kWh/yr.
18 Important: The yield values displayed are estimates. They are determined mathematically. The Consultant accepts no
responsibility for the real yield value which can deviate from the yield values displayed here. Reasons for deviations are
various outside conditions, such as soiling of the PV Modules or fluctuations in the efficiency of the PV modules. 19 The displayed results are estimated values which are derived mathematically. The Consultant accepts no liability for the
actual self-consumption which may deviate from the values displayed here. The potential self-consumption essentially
depends on individual load patterns, which may deviate from the load profile on which the calculation is based.
Figure 20 Performance & consumption yield of 30kW plant Jimmit Booster Station

25
Final Recommendation for Jimmit Station
• 30kWp Photovoltaic System
• Total number of PV modules: 102
• PV peak power: 31.11 kWp
• Number of inverters: 3
• Nominal AC power: 30.00 kW
• Minimum system Spec. energy yield (approx.) 1305 kWh/kWp
• Procure & Install 3Ø 4wire 4pole IP67 MDP with main spares for expansion
• Medium-term recommendation outside the scope of this project is to install VSDs
Incremental initial costs
Technology
Analysis type
Method 1
Method 2
Photovoltaic
Power capacity kW 30.50 198.8% 54,000$
Manufacturer
Model 100 unit(s)
Capacity factor % 20.0%
Electricity delivered to load MWh 53 46.2%
Electricity exported to grid MWh 0.0
Electricity rate - base case $/MWh 1,244.00
Fuel rate - proposed case power system $/MWh 0.00
Electricity export rate $/MWh 1,200.00
Electricity rate - proposed case $/MWh 1,200.00
Electricity delivered to load
Electricity
exported to grid
Remaining
electricity
required
Power
system fuel
Operating
profit (loss) Efficiency
Operating strategy MWh MWh MWh MWh $ %
Full power capacity output 53 0 62 0 69,207 -
Power load following 53 0 62 0 69,207 -
Select operating strategy
Emission Analysis
Base case electricity system (Baseline)
GHG emission
factor
(excl. T&D)
T&D
losses
GHG emission
factor
Country - region Fuel type tCO2/MWh % tCO2/MWh
Dominica All types 0.000
Electricity exported to grid MWh 0 T&D losses
GHG emission
Base case tCO2 0.0
Proposed case tCO2 0.0
Gross annual GHG emission reduction tCO2 0.0
GHG credits transaction fee %
Net annual GHG emission reduction tCO2 0.0 is equivalent to 0.0
GHG reduction income
GHG reduction credit rate $/tCO2
Financial parameters
Inflation rate % 1.0%
Project life yr 25
Debt ratio % 10%
Debt interest rate % 3.00%
Debt term yr 10
Initial costs
Power system $ 54,000 91.5%
Other $ 5,000 8.5%
Total initial costs $ 59,000 100.0%
Incentives and grants $ 0.0%
Annual costs and debt payments
O&M (savings) costs $ 2,000
Fuel cost - proposed case $ 74,531
Debt payments - 10 yrs $ 692
$
Total annual costs $ 77,223
Annual savings and income
Fuel cost - base case $ 154,557
$
Total annual savings and income $ 154,557
Financial viability
Pre-tax IRR - equity % 148.1%
Pre-tax IRR - assets % 133.4%
Simple payback yr 0.8
Equity payback yr 0.7
Full power capacity output
mono-Si - SPR-305-WHT
RETScreen Energy Model - Power project
Cumulative cash flows graph
Cu
mu
lati
ve c
ash
flo
ws (
$)
Year
Sunpower
Cars & light trucks not used
See product database
Financial Analysis
Proposed case power system
Show alternative units
Photovoltaic
-500,000
0
500,000
1,000,000
1,500,000
2,000,000
2,500,000
0 1 2 3 4 5 6 7 8 9 10 11 12 13 14 15 16 17 18 19 20 21 22 23 24 25
Figure 21 Retscreen showing <1yr payback with Dominica kW/kW Net Metering arrangement

26
AUDITED SYSTEMS PROCESS DESCRIPTION TETE MORNE PUMP STATION
Figure 22 Tete Morne Primary School damage & derelict
after Hurricane Maria with adjoining sub water tank
Tete Morne
Station
Figure 23 Location of Tete Morne Booster
Pump Station

27
The Tete Morne Pump station is located in
the South of the island approximately 40
minutes drive heading south-east from the
capital of Roseau Dominica. The
coordinates of the station are approximately
15°14'12.8"N 61°19'31.6"W. The Station
supplies areas/villages of Tete Morne,
Mortin area and surrounding homes. Tete
Morne/Mortin areas were one of the hard-hit
villages during the passage of Tropical
Storm Erika and Hurricane Maria 2015 &
2017 respectively. Tete Morne station
supplies a high density of existing homes
and new construction for homes for ongoing
residential developments. The Consultant
noticed that this section of the island can be
isolated or cut off from general civilization
due to limited access via the singular
entrance through the Soufriere mountain
path. If this public road access is severed in
the event of a storm, Tete Morne and
Mortin residents will be isolated. The PS is
strategically located to supply the residents
within this area, the station supplies
approximately 2025,000 gallons of water
per day. Tete Morne booster station, as
determined by the pump operator, pumps a
via manual operation for four hours in the
morning, 5 am -10 am, and for two hours in
the evening, 4 pm -6 pm; This operation
runs for 7days/week.
See Figure 36.
20 This figure was mentioned during the interview process with the Pumping Operators
Figure 24 Pierre Charles Secondary School - Tete
Morne
Figure 25 New tank under construction to be supplied
from Tete Morne Station

28
Energy cost at the Tete Morne Facility
Date Consumptio
n kWh
Energy Cost
$EC
KVA
deman
d
Cost of Energy
$EC/kWh
Daily Average
Consumption KWh
February-
12- 2019
3350 EC$4,218.06 1 1.259 111.67
March -13-
2019
6130 EC$7,753.07 1 1.265 204.33
April 12 2019 5790 EC$7,082.29 1 1.223 193.00
May 13 2019 5180 EC$6,605.92 1 1.275 172.67
June 12 2019 5370 EC$6,683.78 1 1.245 179.00
July 12 2019 4890 EC$6,068.98 1 1.241 163.00
August 12
2019
5280 EC$6,515.98 1 1.234 176.00
September
11 2019
6100 EC$7,588.19 1 1.244 203.33

29
The station forms part on the integrated larger network which indirectly supplies the Pierre Charles
Secondary School as highlighted by Chief Engineer, Mr. Magnus Williams. Physical inspection and
mathematical extrapolation by the Consultant indicates that the station will increase its supply and
demand by 3 to 4 times its current supply rate. The existing power demand is around 14kW -26kW
instantaneous load, however, with 250,000gallon tank which is 95% completed at Mortin, which is 10
minutes drive uphill up to an extremely higher elevation, the station power capacity demand will
increase from the existing 26kW max to 116kW when tank construction is completed. Mr. Williams
highlighted that three (3) GRUNDFOS CRN 45-13-2A-F-A-V-HQQV are being prepared to be
installed, with two of the three installed pumps coming online with existing 21GRUNDFOS CRN 15-16
SF & CRN 15-14 A-FGJ-G-E HQQE 15kW and 11KkW respectively.
Increasing the supply at Tete Morne Station to meet the intended demand, will move the current
monthly usage from 5366kWh to approximately 16098kWh. This increase in demand will also be as a
result of the Tete Morne station taking on the demand of the Soufriere pumping station that will go
offline permanently when Tete Morne station capacity increases. Tete Morne will add to its supply-
demand network, the area of Soufriere which has a new hotel development completed and to supply the
residents in the Soufriere area.
Based on pump selection and energy requirements, the table above in Figure 37, gives basic expectations
of economic and power demands that DOWASCO should expect. However, these calculation are based
primarily on pumps running direct online without VSD starter controls, as with the existing case
currently.
21 See Appendix for Pumping Details
October 10
2019
6200 EC$7,462.24 1 1.204 206.67
December 11
2019
5370 EC$6,730.71 1 1.253 179.00
Averages 5366 EC$6,670.92 1 1.244 178.867
Future
Demand 2nd
Quarter 2020
16098 EC$20,025.91
2
1 1.244 536.6
Figure 26 Table Showing Tete Morne current Usage and Future Demand and Consumption. Based on
Mathematical extrapolation

30
Electrical & Pumping Characteristics of Tete Morne Booster Pump Stations
Tete Morne booster station gets its supply water from mains which are gravity-fed sourced from the
mountainous area of Pichelin. The station is comprised of four pumps, two 15kW GRUNDFOS CRN
15-16 SF and two 11kW GRUNDFOS CRN 15-14 A-FGJ-G-E HQQE booster pumps. Each pair set
(which are in parallel) is rotated according to operation and maintenance needs by engineering and the
operational staff. Pumps are controlled by LiqTec for lower suction pressure pump protection and
powered via contactor which is direct online through the OCPD. The station operates within the best
operational efficiencies as seem from data collected. Pumps and motor are performing around 70.4 %
efficiency for actual work done.
Figure 27 Diagram Showing Current Pumping & Electrical Arrangement of Tete Morne Station

31
Electrical Characteristics of Tete Morne Booster Station
The station is fed from the DOMLEC utility through the 11kVA pole-mounted transformer that steps
the voltage down to 0.4KVA. Station incoming supply is 3Ø 400V, Line to Line 400V and Line to
Neutral 230V. Service supply is currently 63AMP, the main feeder to the stations electrical and control
system via max 2AWG electrical transmission lines. This Station does not have VFD/VSD, therefore
the pumps run at full operational load at all times. Unlike the Warner and Jimmit Stations, Tete Morne
station is manually controlled by the pump operator, there are no control timers within the control
switchgear mounted on the walls. See Figure 39 & 40.
Figure 28 Electrical Control Panel Figure 29 showing the station pump and electrical set up

32
Tete Morne Electrical characteristics
Parameter
units
Results
Sat/7/19 10am
Results
Sat/7/19 2 pm
Results
Sat/7/19 5pm
Results
Sat 7th 10am-
5pm
Average
Results
Voltage L1- 224.7 224.50 225.9 225.3 225.10
Voltage L2 231.2 231.30 229.7 229.5 230.43
Voltage L3 238.82 227.90 223.3 222.6 228.16
Voltage L1,2 394.9 394.7 394.5 393.9 394.50
Voltage L2,3 397.9 394.7 392.5 391.6 394.18
Voltage L31 391.2 391.8 392.4 387.9 390.83
Current I1 37.47 37.63 43.48 43.23 40.45
Current I2 39.25 39.29 42.21 42.43 40.80
Current I3 30.56 30.45 33.23 33.43 31.92
Total Current
In
77.01 77 85.1 85.23 81.09
Power
Instantaneous
KW
14.11 14.09 15.09 14.19 14.37
KVA 15.52 15.50 15.52 15.51 15.51
KVAR 6.45 6.43 6.37 6.37 6.40
Power Factor 0.92 0.91 0.91 0.92 0.92
Frequency Hz 50.1 50.10 50.1 50.1 50.10
Harmonics I1
%
5.1 5.1 5.2 5.1 5.13
Harmonics I2
%
3.2 3.2 4 3.9 3.58
Harmonics I3
%
7.3 7.3 7.2 6.9 7.18
Figure 30 Table Showing the Electrical Characteristic of Tete Morne Station
Figure 41 shows the electrical performance characteristics of the Tete Morne station, the result will vary
little given the fact that pumps operate at full load during operation. The pumps work direct online

33
through OCPD devices with LiqTec flow rate devices that prevent a dry run in the event of loss of
suction pressure. The interview process highlighted that with the ongoing construction of the extension
to the pumping facility, VSDs drive will be incorporated as part of the PS upgrade and the introduction
of the three CRN 45-13-2A-F-A-V-HQQV booster pumps. With the increase of power usage expected
at this facility and the cost of electricity to DOWASCO, all energy efficiency opportunities should be
considered.
Tete Morne Energy Balance Parameters Amount or
Percentage/fraction
Average Power
Used by Station
KWh/ Month
Notes
Monthly Energy
Consumption kWh
5366 6,514.20 This result calculated
on energy bill 2nd
result is a power meter
Motor & Pump
Efficiency average
0.704 3,777.66 This result is
concurrent with actual
analysis
Electrical Losses 0.03 160.98 Assumed nominal
wire losses 2-5%
Motor & Pump
Losses
0.26 1,395.16 Data
suction & discharge
losses
0.005 26.83 assumed nominal wire
losses >1%
leakage losses 0.001 5.37 assumed nominal wire
losses >1%
Useful Work 3,777.66 Based on calculations
Total 100% 5,366.00 Energy Balance
Figure 31 Table Showing energy usage within Tete Morne Station

34
Technical Comments on Energy Balance
• Electrical, suction & discharge and leakage losses are minimal
• The pump station is operating on the best possible efficiency it can with current electrical
infrastructure
• Operational power factor is excellent, high-efficiency drives should be installed at this facility
to maintain optimum power factor at Pf ≥ .90
• GRUNDFOS pumps and motors are some of the most efficient and reliable pumps on the market;
DOWASCO needs to continue with this excellent track record of good pump selection and
design, this has ensured that 70% of energy is used for useful work- water delivery.
• Without flow meters at the station, based on the electrical parameters recorded it can be assumed
that the pumps are operating within pump characteristics based on the instantaneous current draw
Figure 32 Showing Energy balance for power used within the Station per Month

35
Physical Layout of Tete Morne Site

36
Figure 33 Diagram Showing Tete Morne Site layout

37
Tete Morne Site Layout Comments
• Site is the largest of the 3 stations investigated with a concrete water tank area ~572ft2
• There are three (3) structures with concrete roofs totaling 515.5ft2
• The area has a lot of external vegetation which will need attention to reduce shading and
obstruction
• The potential area that can be used
for PV installations ~ 2087ft2 ± 10%
• PV systems can be mounted almost
anywhere however good structural
engineering will be recommended
• The site has a lot of scrap metal that
will need to be disposed of before any
construction can occur.
• The site has two distinct elevation
patterns, an upper area close to the
chlorine house and the lower area at
the pump house
• The change in elevation between
these two areas is sharp and will
present a challenge when
constructing at this site.
• Tete Morne site will need an
upgrade to its perimeter security
infrastructure
• With an increase to power
consumption at the station within the
first quarter of 2020, DOWASCO
should consider the leasing and or
purchasing of the land area close to
this station.
• This site has the best potential for
EEO’s an REO’s, giving its demand,
power consumption and the potential
to expand RE options at this site.
Figure 34 Piping network close to the potential area for PV
mounting

38
Figure 36 Shading analysis Test at point 1
Figure 36 Shading analysis results from Tete Morne site

39
Figure 38 Tete Morne 2nd shading analysis on Concrete tank
Figure 38 Climatic Data used for the Tete Morne Site

40
Tete Morne Shading Analysis
• January, February, October, November, and December there is 6%-9% shading at the eastern
section of the site
• April, May, July and August shading is less than 2%
• March & September shading at this eastern point is 3%-4%
• Topography & southern mountainous region of the Soufriere will present shading.
• 2nd Shading analysis west of the site layout showed that the months of the year: January, February
March, September, October, November, and December shading will reduce performance by 4%-
7% area on the site.
• Overall the shading analysis is less than 9% at each point on the site, thus apart from the high
vegetative growth, the PV system performance will be satisfactory and will still result in
favourable kW/kWp.
• Good design and equipment with high efficiencies will compensate for losses due to shading
issues
• Climatic data shows that PV analysis will be based on solar Irradiance of 5.15kWh/m2/d at this
elevation, assuming a minimum elevation of 300 meters above sea level
• Dominica has a relatively constant high humidity of 76.5% or greater therefore at this location
the site will tend to display higher scattered diffusion of sunlight. See Figure 47
TECHNICAL ASSESSMENT PHOTOVOLTAIC ENERGY SAVING
OPPORTUNITIES FOR THE Tete Morne AUDITED SYSTEMS AND COST
EVALUATION Using all the data procured in the field, site analysis, station energy usage and supply information as
explained by methodology previously and constrained by budgetary capital the following photovoltaic
saving opportunities is recommended:
• Total useable area for photovoltaic modules at the site assuming that DOWASCO will allow
mounting on structure present on Tete Morne site is approximately 2087 ft2 ±10%
• Assuming standard module of 5’4 x 3’3 (65” x39”), the site can accommodate approximately
max of 104 modules of 60 cell technology
• Assuming higher wattage modules ≥ 300watts, PV array system based on 104 modules is
approximately 31200Wdc or 31.2kWac
• Inverter size recommended for the array is any combination or 30kW≤ inverter ≤ 50kW
• Based on average DOMLEC consumption of ~ 5366kW, unless otherwise approved by
DOMLEC, to be eligible to connect and operate in parallel with DOMLEC’s Grid, the DG
renewable must have a maximum aggregate capacity per facility of 1.5 times the Customer’s
current average usage up to a maximum of 150kW. This calculation result in the max size
specified for Tete Morne is 53.66kW. However, site analysis, budget and space allocation the

41
Consultant recommends system no larger than 50kW, however, for the scope of this project,
the Consultant recommends 30kWac Photovoltaic system.
• Even though expansion will be completed within 1st quarter of 2020, DOMLEC requirements
are based on 12month full operational schedule of average power consumption, thus, currently
only max of 53.66kW will be allowed on the grid network.
• Number of modules for 30kW recommended assuming 60cell PV module modules≥ 300watts
is 104 modules
• See RETSCREEN analysis in the appendix for economic engineering analysis
• See SMA PV calculation analysis for in-depth technical assessment in appendix
• Assumed 20% Capacity Factor
• Assumed Net Metering effect for calculation
30kW photovoltaic Tete Morne Financial viability
Financial viability
Pre-tax IRR - equity % 57.3%
Pre-tax IRR - assets % 51.7%
Simple payback yr. 1.9
Equity payback yr. 1.8 22Gross annual GHG emission reduction tons of CO2 approximately 55.0t
• Alternatively, for the system expansion, which will result in higher energy demand the
Consultant recommends a minimum 105kW Photovoltaic system to meet the new demand load,
which would require approximately 12,000ft2 – 15,000ft2 of relatively flat surface area for a
ground-mounted application
22 There no CO2 base case for Dominica. Base case was model after Jamaica CO2 avoided Carbon foot print

42
Incremental initial costs
Technology
Analysis type
Method 1
Method 2
Photovoltaic
Power capacity kW 31.72 117.8% 145,938$
Manufacturer
Model 104 unit(s)
Capacity factor % 20.0%
Electricity delivered to load MWh 56 27.3%
Electricity exported to grid MWh 0.0
Electricity rate - base case $/MWh 1,244.00
Fuel rate - proposed case power system $/MWh 0.00
Electricity export rate $/MWh 1,244.00
Electricity rate - proposed case $/MWh 1,244.00
Electricity delivered to load
Electricity
exported to grid
Remaining
electricity
required
Power
system fuel
Operating
profit (loss) Efficiency
Operating strategy MWh MWh MWh MWh $ %
Full power capacity output 56 0 148 0 69,133 -
Power load following 56 0 148 0 69,133 -
Select operating strategy
Emission Analysis
Base case electricity system (Baseline)
GHG emission
factor
(excl. T&D)
T&D
losses
GHG emission
factor
Country - region Fuel type tCO2/MWh % tCO2/MWh
Dominica All types 0.000
Electricity exported to grid MWh 0 T&D losses
GHG emission
Base case tCO2 0.0
Proposed case tCO2 0.0
Gross annual GHG emission reduction tCO2 0.0
GHG credits transaction fee %
Net annual GHG emission reduction tCO2 0.0 is equivalent to 0.0
GHG reduction income
GHG reduction credit rate $/tCO2
Financial parameters
Inflation rate % 1.0%
Project life yr 25
Debt ratio % 10%
Debt interest rate % 3.00%
Debt term yr 10
Initial costs
Power system $ 145,938 96.7%
Other $ 5,000 3.3%
Total initial costs $ 150,938 100.0%
Incentives and grants $ 0.0%
Annual costs and debt payments
O&M (savings) costs $ 5,000
Fuel cost - proposed case $ 184,163
Debt payments - 10 yrs $ 1,769
$
Total annual costs $ 190,933
Annual savings and income
Fuel cost - base case $ 266,628
$
Total annual savings and income $ 266,628
Financial viability
Pre-tax IRR - equity % 57.3%
Pre-tax IRR - assets % 51.7%
Simple payback yr 1.9
Equity payback yr 1.8
Full power capacity output
mono-Si - SPR-305-WHT
RETScreen Energy Model - Power project
Cumulative cash flows graph
Cu
mu
lati
ve c
ash
flo
ws (
$)
Year
Sunpower
Cars & light trucks not used
See product database
Financial Analysis
Proposed case power system
Show alternative units
Photovoltaic
-500,000
0
500,000
1,000,000
1,500,000
2,000,000
2,500,000
0 1 2 3 4 5 6 7 8 9 10 11 12 13 14 15 16 17 18 19 20 21 22 23 24 25
Figure 39 Engineering & Financial Analysis of Tete Morne PV system performance

43
30kW Photovoltaic Technical Data recommendation for Tete Morne Station
• Total number of PV modules: 105
• PV peak power: 32.03 kWp
• Number of inverters: 3
• Nominal AC power: 30.00 kW
• AC active power: 30.00 kW
• Active power ratio: 93.7 %
• Annual energy yield (approx.)*: 42004.30 kWh
• Energy usability factor: 100 %
• Performance ratio (approx.)*: 82.6 %
• Spec. energy yield (approx.)*23: 1312 kWh/kWp
• Line losses (in % of PV energy): ---
• Unbalanced load: 0.00 VA
• Self-consumption: 26237.44 kWh
• Self-consumption quota: 62.5 %
• PV peak power: 32.03 kWp
• Total number of PV modules: 105
• Number of inverters: 3
• Max. DC power (cos φ = 1): 10.20 kW
• Max. AC active power (cos φ = 1): 10.00 kW
• Grid voltage: 230 V
• Nominal power ratio: 96 %
• Displacement power factor cos φ: 1
23 The displayed results are estimated values which are derived mathematically. The consultant accepts no liability for the
actual self-consumption which may deviate from the values displayed here. The potential self-consumption essentially
depends on individual load patterns, which may deviate from the load profile on which the calculation is based.
Figure 40 PV System Performance & Consumption yield of the potential 30kW Plant Tete Morne Booster
Station

44
Recommendations
Photovoltaic clearly makes environmental and economic sense as a renewable energy option for
DOWASCO. Dominica, through the IRC and DOMLEC already have an established path for the
implementation of the commercial-grade interconnection of grid-tied photovoltaic systems. In order to
carry out a successful infrastructural renewable energy option – REO, a fundamental upgrade to current
electrical infrastructure is necessary to ensure proper integration of the PV systems with the electrical
and pump equipment. The following process should be followed to ensure smooth incorporation of
photovoltaic options at each station:
• Jimmit Booster Station recommendation
o Application to IRC for the interconnection of 30kW system
o Application to DOMLEC for the interconnection of 30kW system
o Application of GED
o The installation of 3Ø IP67/68 MDP with 150amp incoming 4 pole breaker, four (4)
60amp to control existing pumps, one 50amp breaker to control the photovoltaic system,
one 150amp breaker for BMS and one spare 50amp breaker for future expansion
o Installation of Manual Transfer Switch rated at 200amp – MTS
o Installation of flow meter at the discharge point
o Installation of perimeter security to protect the investment
o Cleaning and removal of extraneous material from the site
o Proper structural reinforcement for the installation of the mounting brackets for the PV
modules
o The installation of one (1) three-phase 30kW photovoltaic system
o An alternative recommendation will be 20kW Photovoltaic System
• Future recommendation Jimmit Booster Station outside the scope of this assessment
o Installation of Variable Speed Drives to control pumps
o Installation suction and discharge flow meters
o Installation of pressure sensors at the discharge point for the station
o Prepare a comprehensive master plan to guide maintenance of the electrical system
inclusive of any photovoltaic system that is integrated
o Lithium-ion 800kWh Battery Bank assuming 50% DOD and 2days capacity.
Tete Morne Booster Station recommendation
o Application to IRC for the Interconnection of 30kW system

45
o Application to DOMLEC for the interconnection of 30kW system
o Application of GED
o The installation of 3Ø IP67/68 MDP with 400amp incoming 4 pole breaker, four (4)
60amp to control existing pumps, three (3) 100amp breakers for expansion of new pump
system, one (1) 50amp breaker to control the photovoltaic system, one (1) 400amp
breaker for BMS and one spare 100amp breaker for future expansion
o Installation of Manual Transfer Switch rated at 400amp – MTS
o Installation of flow meter at the discharge point
o Installation of perimeter security to protect the investment
o Cleaning and removal of extraneous material from the site
o Proper structural reinforcement for the installation of the mounting brackets for the PV
modules
o The installation of one (1) 3Øphase 30kW photovoltaic system
▪ Future recommendation Tete Morne Booster Station outside the scope of this assessment
o Installation of Variable Speed Drives to control pumps
o Installation suction and discharge flow meters
o Installation of pressure sensors at the discharge point for the station
o Prepare a comprehensive master plan to guide maintenance of the electrical system
inclusive of any photovoltaic system that is integrated
o Lithium-ion 2.394MWh Battery Bank assuming 50% DOD and 2days for current
capacity with expansion (cost may not warrant this capacity). Lithium Nickel Cobalt
Aluminum Oxide or Lithium Titanate more commonly used for grid storage.
Overall the factors that contribute to the critical decision of
system recommendation and size were budgetary constraints,
space allocation and most importantly the policies and
technical requirements set out by the Independent Regulatory
Commission -IRC and DOMLEC will determine successful
grid interconnection. Figure 52 shows the overall linkage of
each component that fed into the final design and Renewable
Energy Opportunities, namely the photovoltaic system, for
each station audited. In conclusion, any step made towards
energy efficiency and clean energy alternative is always the
best decision for the environment, the economy, the
country/citizens and overall this will undoubtedly contribute Figure 41 Diagram Showing linkage of all
Critical data that fed into the final design and
recommendation

46
to the reduction of a Caribbean climate footprint of CO2 as a central eco-environmental goal.

47
Recommendation on System Specifications, Warranties and Required
Electrical Codes
Photovoltaic Modules
2 Photovoltaic (PV) Modules and Arrays
• All PV modules must meet or exceed the requirements of IEEE Standard 1262-1995-
Recommended Practice for Qualification of Photovoltaic (PV) Modules and Underwriters
Laboratories (UL) Standard 1703 Standard for Safety for Flat-Plate Photovoltaic Module, or
equivalent standards.
• Only monocrystalline silicon flat-plate PV modules should be supplied.
• The power output of the PV module must be reported under standard test conditions (STC).
• The use of the highest quality materials in the construction/manufacture/production of its
modules, to ensure a long service life and high energy output over time is highly recommended.
• Efficiency should be ≥ 18%. The panels must have less than two percent (2%) mismatch from
the nameplate data. The PV modules must be made of lightweight cells, resistant to abrasion,
rain, water, saline humid air and environmental pollution. The PV modules must be provided
with the anti-reflection coating and back surface field (BSF) structure to increase conversion
efficiency. The bidder should provide saline mist certificate
• The terminal box on the module must have a provision for an opening for replacing the cable if
required.
• The standard deviation of module power rating for All modules must be less than five percent
(<5%) of the mean value of the module’s power.
• Due to expected high wind loads, and subsequent potential for damage from flying debris, all
PV arrays must be securely installed to the structure as dictated by site conditions.
• PV module interconnects wiring must be sunlight-resistant USE-2 (90°C wet or dry) or
equivalent rated conductor and must be attached to module junction boxes using weather-tight
strain relief. The module wiring interconnections must use a connector device that allows quick
assembly and disassembly of the arrays under no-load conditions. These connectors must be
UL-listed, and be weather-sealed, guarded and polarity protected.
• All series-connected strings of modules (source circuits) must include a series fuse as required
by UL and NEC to prevent excessive reverse current flow through modules in source circuits
under fault conditions, and the diodes must be contained in a listed junction/combiner box.
Parallel connections of modules in individual source circuits are discouraged and are only
allowed as long as the module listing allows for a series fuse with high enough capacity required
for this configuration. All series source circuit fuses must be rated for at (1.56) times the source

48
circuit short-circuits current rating and no greater than that specified on the module listing.
Blocking diodes for array source circuits are optional. If used, these diodes must have voltage
and current ratings (at temperature) at least twice the open-circuit voltage and short-circuit
ratings of the source circuits.
• The PV modules must have a multi-year guarantee/warranty to maintain ninety percent (90%)
of their initial rated output for fifteen years (15 yrs.) and eighty-five percent (85%) of their initial
rated output for twenty-five years (25 yrs.). These performance guarantees/warranties must be
on the DC power rating. The contractor must provide certification from approved bodies, for
example, UL 1741, TUV or internationally recognized equivalent standard.
Inverter - Power Conditioning Unit (PCU)
• Surge suppression on the DC and AC side of the inverter must be provided.
• AC power must be fed to the grid at three-phase four hundred volts (3Ø,400 V) AC bus.
• The output of the inverter must synchronize automatically its AC output to the exact AC voltage
and frequency of the grid.
• The injection of DC power into the grid must be avoided by using an isolation transformer or
Transformerless unit at the output of the inverter. It is proposed to limit DC injection within one
percent (1%) of the rated current of the inverter as per IEC 61727.
• The inverter must continuously monitor the condition of the grid and in the event of grid failure;
the inverter must shut down within two to five seconds (2s -5s). The solar system is
resynchronized with the grid within two minutes or otherwise determined by the grid operator
after the restoration of the grid. This means that the PV system must be provided with
synchronizing equipment having two (2) inputs for comparison, i.e. grid supply vs. solar output
so as to connect it in synchronism with the grid
• The inverter control unit must be so designed so as to operate the PV system near its Maximum
Power Point (MPP), the operating point where the combined values of the current and voltage
of the solar modules result in maximum power output.
• The inverter must be a true sine way inverter for a grid-interactive PV system.
• Typical technical features of the inverter must include at a minimum the following:
• Nominal AC Output Voltage and Frequency: 400V, 3 Phase, 50Hz, Grid Voltage Tolerance: -
20% to +15%, Continuous inverter Output Rating: Equal to the capacity of the PV system. To
be mentioned in kVA, Output Wave Form: Pure Sine Wave Output, Total Harmonic Distortion:
< 3% with resistive load, Total Voltage Harmonic Distortion: 5%, Individual Voltage Harmonic
Distortion: 3%, Total Current Harmonic Distortion: 8%,Output Voltage: 415 ±3% ,Accuracy
of AC Voltage Control: ±1% , Grid Frequency Control Range: ±3Hz

49
• Accuracy of Frequency Control: ±0.5% ,Power Factor Control: 0.95 inductive to 0.95
capacitive, Inverter/PCU efficiency: 96% minimum ,No-Load Losses: < 1% of rated power
• Overload Features: 150% for 1-minute Cooling: Forced Air cooling, with temperature-
controlled cooling fan Ambient temperature: 0 – 40°C
• Relative Humidity: 100% non-condensing (maximum).
• If the inverter is supplied with LED/LCD Display Indications: Display must indicate system
functional parameters and protection functional indicators
• Data monitor and display controls: Ethernet connectivity
• 24Anti Islanding Protection as per the standard. It must comply with UL 1741 and complies with
utility FRT requirements. This standard is in harmony with DOMLEC distributed renewable
energy generation policy 2016 version 2.0 Category I & Category II Type A-3-Inverter must
comply with UL 1741 or equivalent. Photovoltaic inverters must comply with IEEE 929 or
equivalent.
• Enclosure Protection: IP 21(for indoor) as per IEC 529. The inverter must have IP65 (outdoor
mounting) as per the UL 1703 requirements
• Safety -IEC 62103, IEC 62109 Part 1 & 2
• Galvanic Isolation at input & output through a transformer or transformerless topology
• Solar irradiation/isolation – UL/CE/TUV
• The nuts & bolts and the inverter enclosure must be adequately protected taking into
consideration the atmosphere and weather prevailing in the area.
• Night or sleep mode: where the Inverter is almost completely turned off, with just the timer and
control system still in operation, losses must be less than two watts per five kilowatts (2 W per
5 kW).
• Standby mode: where the control system continuously monitors the output of the solar generator
until a pre-set value is exceeded.
24 DOMLEC DISTRIBUTED RENEWABLE ENERGY GENERATION POLICY 2016 VERSION 2.0

50
• Operation of MPP tracking mode: the control system continuously adjusts the voltage of the
generator to optimize the power available. The power conditioner must automatically re-enter
standby mode if the input power reduces below the standby mode threshold. The front panel
must provide a display of the status of the inverter.
• The inverter must have a minimum of Dual MPPT with independent strings as a minimum with
• A fifteen year (15 yr.) guarantee/warranty must be provided for the inverter(s). If an inverter
fails, it must be replaced or repaired within two (2) weeks of notification
Balance of System – BOS
• The system must be adaptable. Materials must be corrosion resistant and have adequate structural
support for the arrays and attachment to the structure, and any attachment points and penetrations
must be properly weather sealed using accepted practice.
• The mechanical structures, electrical works including power conditioners/inverters /maximum
power point tracker units/distribution boards/ digital meters/switchgear, etc. and overall
workmanship of the PV system must be guaranteed or warranted against any
manufacturing/material/design/installation defects for a minimum period of five (5) years.
• Structural Array mounting hardware supplied for this installation must be compatible with the
site considerations and environment. Special attention must be paid to minimizing the risk from
exposed fasteners, sharp edges, and potential damage to the modules or support structure.
Corrosion resistance and durability of the mechanical hardware is emphasized. All materials
must be selected to avoid corrosion and degradation. The use of ferrous metals, contact of
dissimilar metals and the use of any wood or plastic components are strongly discouraged.
Aluminum/Galvanized Iron and stainless steel components and hardware are preferred.
• The array mounting systems and overall installation must meet all applicable local building
codes; and be capable of withstanding from back side of module hurricane-force winds of
Category 3 (one hundred and seventy-five kilometres per hour (175km/hr.) or greater, for all
attachment points, which are consistent with the module manufacturer’s installation instructions,
and the requirements of ANSI/ASCE 7-98. Calculations and certifications from a licensed
professional engineer or test lab verifying that the system can withstand these wind forces must
be provided.
• All materials for the BOS must be new and both workmanship and materials must be of the very
best quality, entirely suitable for the service to which the system is to be subjected and must
conform to all applicable sections of this specification and all other relevant international or
national regulations/specifications/standards. All parts of a duplicate of machines and mounting
structure must be interchangeable without modification.
• The system installation and equipment layout must be considered with respect to the need for
access, maintenance and future expansion of the system as needed by the DOWASCO.

51
System Spares • Spare modules must be provided at a minimum quantity equal to three percent (3%) of the
number of modules installed in the array field.
• All spares (electrical, electronic and mechanical) necessary for the satisfactory operation, routine
maintenance and testing of the equipment for at least three (3) years.
• Spares must be readily interchangeable with the parts they replace and must comply with these
Specifications.
• A complete and detailed spare parts list for all equipment supplied must be submitted.

52
Conclusion
The Dominica Water and Sewage Authority- DOWASCO undertakes the essential tasks of providing
potable water to households and removing wastewater for safe disposal. Despite the impact of severe
hurricanes in recent years, the island of Dominica continues to pursue its strategic goal of achieving
90% renewable energy target by 2029, among others subset goals of reducing the annual cost for diesel
by 94%, tapping into geothermal energy and reduction of the overall cost of electricity generation.
25Very rarely, the link is made between water supply, wastewater treatment and energy as these are
presented to the public as very separate systems. However, like all systems that function to sustain a
nation, these three entities are interrelated and interdependent. However, while DOWASCO is not the
DOMLEC largest customer, no doubt, an energy bill at ~ USD $407,023/yr with an estimated demand
of 884,244kWh/yr via traditional fuel, contributes significantly to the Caribbean Community overall
GHG climate output. Thus, this project, ‘Technical Assessment of Renewable Energy Needs for
DOWASCO’ will lead to the successful installation of two or three photovoltaic systems which will
contribute to the country’s national goal of 90% renewables by 2029.
Despite the current economic and adverse climatic conditions that have impacted the island, energy
efficiency and renewable energy projects will undoubtedly impact positively on the operational cost
DOWASCO making it a more efficient and sustainable Company, while conscientiously reducing its
carbon footprint. Renewable energy has its place within the framework of the water and wastewater
industry. It is imperative that the ad-hoc approach of “slapping a bunch of solar panels on the roof of a
building is not taken, but true engineering is used” to achieve the most efficient results. If a sequential
path is followed, as laid out within the framework of this technical assessment document, along with
due diligence and careful implementation in conjunction with the integration of an improved electrical
switchgear system, this project will lead to a successful installation of the PV systems at the intended
pumping facilities audited.
Stemming from the technical assessment of this assignment, the recommended action plan for
DOWASCO was generated by the Consultant should run concurrently for each pump station as follows:
• The installation of 30kWac Photovoltaic system at Jimmit Booster Station
• The installation of 30kWac Photovoltaic system at Tete Morne Booster Station
Competent procurement with good engineering using the best technology, skilled/trained human
resource, coupled with adhering to an already developed Renewable Energy framework by the IRC,
while following the guidelines set out by Distributed Renewable Energy Generation Policy of
DOMLEC, will ensure that the installation of the potential photovoltaic systems positively affect
DOWASCO strategic RE plans while helping to stabilize its financial cost of operations where clean
energy projects are a viable option in today’s economic climate; now that the technology is more
readily available and cost-effective.
25 Paper submitted by the Consultant CWWA 2015 –‘ The application of renewable energy at the Barbados Water
Authority Facilities’

53
Grant funding projects such as the “Italian/Dominica/CCCCC – Partnership Program” helps
Caribbean countries to achieve goals of generating ‘your own’ power safely and cleanly, with
sustainability as core criterion.

54
Appendices

55
Figure 42 Extract of Jimmit Electrical
Audited Results Figure 43 Warner Electrical and Power Results
Figure 44 Extract of Tete Morne Electrical Results Figure 45 Extract showing Tete Morne
Harmonics Wave Form

56
Tete Morne Facility Energy Cost
Date Consumption
kWh
Energy Cost
$EC
KVA
demand
Cost of Energy
$EC/kWh
Daily Average
Consumption KWh
February-
12- 2019
3350 EC$4,218.06 1 1.259 111.67
March -13-
2019
6130 EC$7,753.07 1 1.265 204.33
April 12
2019
5790 EC$7,082.29 1 1.223 193.00
May 13
2019
5180 EC$6,605.92 1 1.275 172.67
June 12
2019
5370 EC$6,683.78 1 1.245 179.00
July 12
2019
4890 EC$6,068.98 1 1.241 163.00
August 12
2019
5280 EC$6,515.98 1 1.234 176.00
September
11 2019
6100 EC$7,588.19 1 1.244 203.33
October 10
2019
6200 EC$7,462.24 1 1.204 206.67
December
11 2019
5370 EC$6,730.71 1 1.253 179.00
Averages 5366 EC$6,670.92 1 1.244 178.867

57
Jimmit Facility Energy Cost
Date Consumption
kWh
Energy
Cost $EC
KVA
demand
Cost of Energy
$EC/kWh
Daily Average
Consumption KWh
Feb- 12- 2019 8350 10,506.26 1 1.258 278.3
March- 13-
2019
7380 9,333.03 1 1.265 246.0
April - 12-
2019
7250 8,861.91 1 1.222 241.7
May- 13- 2019 9070 11,563.01 1 1.275 302.3
June- 11- 2019 7550 9,395.10 1 1.244 251.7
July- 11- 2019 7520 9,329.24 1 1.241 250.7
August- 12-
2019
8160 10,067.43 1 1.234 272.0
sept - 11- 2019 8200 10,198.20 1 1.244 273.3
Oct- 11- 2019 8110 9,759.55 1 1.203 270.3
Nov- 11- 2019 8620 10,739.76 1 1.246 287.3
Dec 11-2019 7890 9,886.92 1 1.253 263.0
Average 8009 9967.31 1 1.24 266.97

58
Surcharge Rate Fluctuations
DOMLEC
Date $EC/kWh
February- 12- 2019 0.3603
March -13-2019 0.3661
May 13 2019 0.3951
April 12 2019 0.3499
June 12 2019 0.3685
July 12 2019 0.3652
August 12 2019 0.3593
September 11 2019 0.368
October 10 2019 0.3329
December 11 2019 0.3761

59
Glossary of Terms
COMPANY - Corporation or utility responsible for the operation of the pumping system.
CURRENT (I) - Computes the average current in accordance with the measures the current average
imbalance of each phase measurements, and places a description of the imbalances according to the
imbalance calculated between phases.
EFFICIENCY - The manufacturer or new motor efficiency in percentage (%).
ELECTRIC DIAGRAM - It is extremely important to outline the single-line diagram connections of
the electric equipment, intake, cabling, transformer, main switch, and starter, if applicable.
ELECTRICAL LOSES - Energy losses due to electrical items, in this case, due to the conductor’s
energy losses.
ENERGY CONSUMPTION. - The total energy consumed by the electrical system in a year of
operation, calculated as the sum of the average active power at all stages. The result is total energy
consumption in kWh.
EQUIPMENT – Name of Equipment.
HARMONIC DISTORTION - This single parameter can be measured if harmonic analyzer
equipment is available.
HEAD - The pump load due to the physical and topographic elevations; the vertical distance between
the suction and highest point of delivery, expressed in water column meters or feet.
LEAKAGES LOSSES - The estimate of water lost through leaks in the distribution network,
according to previous studies of the network.
MOTOR EFFICIENCY - The real motor efficiency percentage.
MOTOR LOSSES - Energy losses in the motor, according to the real motor efficiency.
NETWORK HEAD LOSSES - Total pumping load losses calculated by the difference between the
net pumping load and the corresponding pressure gap.
POWER (kW) - Computes the average active power, the average active power imbalance and
calculated average and the voltage measured at each phase.
POWER FACTOR - Computes the average power factor according to the measurements of each
phase. It places a description of the imbalances calculated between phases.
POWER SUPPLY - Refers to the provider of electrical service and details of the contract with this
company.
PUMP EFFICIENCY - The pump efficiency percentage.
PUMP EVALUATION -Pump evaluation determines the efficiency of the pump. The total efficiency
of the operating pump is calculated as the ratio between the hydraulic power output and the
mechanical power absorbed.

60
PUMP LOSSES - Energy losses due to the pump inefficiency.
STARTER – Equipment that controls the pump
SUCTION & DISCHARGE PIPE LOSSES - Energy losses caused by friction of the fluid in piping
suction and discharge.
SYSTEM - Hydraulic system to which the pumping system belongs.
TARIFF - The key or name of the fare schedule associated with Utility companies.
TRANSFORMER – An electrical device that converts voltages and currents.
USEFUL WORK - The real work expressed in units of energy actually needed by the pumping
VOLTAGE (V) - Computes the average voltage measured, the imbalance of tension between the
calculated average and the voltage measured at each phase.