corporate - renewable energy - PSR Programme
48
Insights to accelerate corporate renewable energy procurement DECEMBER 2021
-
Upload
khangminh22 -
Category
Documents
-
view
7 -
download
0
Transcript of corporate - renewable energy - PSR Programme

Insights to accelerate
corporaterenewable energyprocurement
DECEMBER 2021
Disclaimer:
Ÿ This report has been prepared on the basis set out in KPMG’s
contract for ‘Service Provider for Supporting Structural Reforms in
the Indian Power Sector’ with the Secretary of State for
International Development at the Foreign, Commonwealth &
Development Office (FCDO) (formerly DFID) (“the Client”).
Ÿ Nothing in this report constitutes a valuation or legal advice.
Ÿ KPMG has not verified the reliability or accuracy of any information
obtained in the course of its work, other than in the limited
circumstances set out in the Services Contract.
Ÿ In connection with the report or any part thereof, KPMG does not
owe duty of care (whether in contract or in tort or under statute or
otherwise) to any person or party to whom the report is circulated
to and KPMG shall not be liable to any party who uses or relies on
this report. KPMG thus disclaims all responsibility or liability for
any costs, damages, losses, liabilities, expenses incurred by such
third party arising out of or in connection with the report or any part
thereof.
Ÿ By reading the report, the reader of the report shall be deemed to
have accepted the terms mentioned hereinabove.

ACKNOWLDGEMENTThe report has been prepared under the UK's Foreign, Commonwealth &
Development Office (FCDO), formerly known as Department of International
Development (DFID), Power Sector Reforms (PSR) Programme in India.
KPMG is the lead service provider of the PSR Programme.
The FCDO's PSR Programme would like to thank Dr. Praveen Saxena, Chief
Executive Officer, Skill Council for Green Jobs, Mr. Chirag Gajjar, Head-
Subnational Climate Action in Climate Program at WRI India and Secretariat for
Corporate Green Leadership Alliance (CGLA) and Mr. Manoj Mathur, Former
Director (Solar), Solar Energy Corporation of India for their guidance and
providing valuable inputs for developing this report.
The FCDO's PSR Programme would also like to express its sincere
appreciation and gratitude to all the corporates who have participated in the
survey and provided the data points.
FCDO Program Managers
Udit Mathur
Adritha Subbiah
PSR Team
Vikas Gaba
Abhishek Shah
Tanmay Bishnoi
Rushikesh Muthyal
Arvind Jamkhedkar
CII Team
Ramesh Kyamal
Ravi Chander Rangavajulla
Sivagurunathan
ContentsExecutive Summary .......................................................................................
Introduction ...................................................................................................
Scope and Methodology ................................................................................
Key Insights and Observations .....................................................................
Corporate RE Frontrunners: Mapping Best Practices ....................................
Conclusion .....................................................................................................
Next Steps .....................................................................................................
Annexure A: List of corporates who participated in thesurvey for primary data collection ................................................................
1
2
3
4
5
6
11
18
21
33
44
45
46
08

List of figuresFigure 1: India’s CO emissions in absolute and per capita terms............................................... 112
Figure 2: India’s fossil fuel CO emissions mix from 1970-2019 (%).......................................... 122
Figure 3: India’s CO equivalent emissions by sector (%)........................................................... 132
Figure 4: India’s total energy emissions (fuel combustion activities) (%)..................................... 13
Figure 5: India industrial processes and product use emissions (%)............................................ 14
Figure 6: India’s consumption of electricity by sectors for 2019-20 (%)...................................... 15
Figure 7: Total installed C&I renewable capacity (MW)................................................................ 15
Figure 8: Sectoral distribution of survey respondents.................................................................. 21
Figure 9: Sectoral distribution of corporates with more than 40% RE target by 2030................... 22
Figure 10: Drivers for RE adoption.............................................................................................. 22
Figure 11: Sector-wise drivers for RE adoption........................................................................... 23
Figure 12: RPO obligation status of surveyed corporates (%)...................................................... 23
Figure 13: Share of RE in overall electricity consumption............................................................ 24
Figure 14. Sector-wise classication of corporates procuring RE as a % of electricity mix........... 24
Figure 15: Sector-wise percentage of corporates showing positive trend in RE procurement....... 25
Figure 16: Sectoral distribution of corporates with dedicated RE budget...................................... 26
Figure 17: Sectoral distribution of corporates having RE champion (%)...................................... 26
Figure 18: RE team strength of corporates................................................................................ 27
Figure 19: Sectoral distribution of corporates with female presence in RE team (%).................... 27
Figure 20: Sectoral distribution of corporates having onsite RE power plants (%)....................... 28
Figure 21: Sectoral distribution of corporates having offsite RE power plants (%)....................... 29
Figure 22: Business models for onsite RE plants in various sectors............................................ 29
Figure 23: Business models for offsite RE procurement.............................................................. 30
Figure 24: RE related applications adopted by corporates........................................................... 31

ABBREVIATIONS
Alternating Current
Asian Development Bank
Build, Own, Operate, Maintain
Build, Own, Operate, Transfer
Commercial and Industrial Sectors
Compound Annual Growth Rate
Capital Expenditure
Central Electricity Authority
Central Electricity Regulatory Commission
Carbon Tetrauoride
Corporate Green Leadership Alliance
Methane
Confederation of Indian Industry
Carbon Dioxide
Corporate Renewable Energy Adoption Index
Direct Current
Distribution Companies
Emissions Database for Global Atmospheric Research
Engineering, Procurement and Construction
Export-Import Bank of India
Foreign, Commonwealth & Development Ofce
Foreign Direct Investment
Gross Domestic Product
Gigawatt
International Finance Corporation
Intergovernmental Panel on Climate Change
AC
ADB
BOOM
BOOT
C&I
CAGR
CAPEX
CEA
CERC
CF4
CGLA
CH4
CII
CO2
CREAI
DC
DISCOMs
EDGAR
EPCs
EXIM
FCDO
FDI
GDP
GW
IFC
IPCC

IT/ITES
KV
KW
MNRE
MW
N₂O
NABARD
NDCs
NSE
PPAs
PSR
PV
RBI
RE
RECs
REDE
RESCO
RPO
RTC
SBI
SCGJ
SERC
SF6
SNA
STOA
t CO2
UK
USA
WBCSD
WWF
Information Technology/Information Technology Enabled Services
Kilovolt
Kilowatt
Ministry of New and Renewable Energy
Megawatt
Nitrous Oxide
National Bank for Agriculture and Rural Development
Nationally Determined Contributions
National Stock Exchange
Power Purchase Agreements
Power Sector Reforms Programme
Photovoltaic
Reserve Bank of India
Renewable Energy
Renewable Energy Certicates
Renewable Energy Demand Enhancement
Renewable Energy Service Company
Renewable Purchase Obligation
Round-the-clock
State Bank of India
Skill Council for Green Jobs
State Electricity Regulatory Commission
Sulphur Hexauoride
State Nodal Agency
Short Term Open Access
Tons of Carbon Dioxide
United Kingdom
United States of America
World Business Council for Sustainable Development
World Wildlife Fund

EXECUTIVE
SUMMARY
8
The global journey towards decarbonisation continues to gather pace, and India has set its own ambitious targets for clean energy
transition. India has taken significant strides forward and can further inculcate valuable lessons from global leaders. The recently
concluded COP 26 conference in Glasgow was indicative of India’s climate change ambitions. The country has committed to achieve
net zero emissions by 2070 and has also made a host of commitments including carbon intensity reduction, emission reduction and
non-fossil fuel energy capacity growth.
A key lever to achieve decarbonisation is the Commercial and Industrial (C&I) sector that consumes a massive amount of energy
(electricity and fuel) for various processes across their value chain. The ability of the corporates to procure renewable energy (RE), by
purchasing through distribution companies, through a third-party, or building their own generation facilities, continues to expand. In a
bid to fulfil their ambitious targets, and to honour their commitments towards emission disclosure under international initiatives,
several corporates have already begun procuring RE.
Despite the progress made by the Indian Corporates towards procurement of RE, several challenges, such as limited information on
initiatives by industry peers and a lack of clarity on available RE options, need to be addressed to further accelerate RE adoption. To
analyse and better understand these challenges, a survey was undertaken to assess the status and progress of Corporate RE
procurement in India. The survey was designed after extensive deliberations and stakeholder consultations with industry experts in
order to identify parameters that would give a comprehensive overview of RE adoption by corporates in India and an understanding of
the barriers faced by them.
Insights to accelerate corporate renewable energy procurement
Consumer Goods
Energy and Natural Resources
Machinery & Equipment
Automotive
Cement
Pharmaceutical
IT/ITES
Others
19%
19%
19%
13%
13%
7%
5%
3%
Sectoral distribution of Corporates
Additionally, the surveyed corporates have listed out the obstacles faced by them when attempting to procure RE, such as policy and
regulatory issues, technological gaps, and economic concerns.
RE adoption has provided multiple benefits to corporates like financial savings and higher energy resilience. With the presence of
multiple technologies, business models, innovations and use cases, the market in India is becoming increasingly supportive for
corporates to adopt RE as per their business needs. A wide variety of corporate RE procurement options have been described in this
report, including recent innovative developments in the space. With the plethora of options available, a suitable RE procurement option
can be found for most corporates in the C&I space. Several accelerators including state and central government policies and availability
of financing options for RE projects exist to help scale up corporate RE adoption.
1 The FCDO supported Power Sector Reforms (PSR) programme aims to facilitate India’s energy transition with interventions in planning tools and frameworks, business model development, financing products and platforms, institutional strengthening, capacity building, grassroots engagements and partnerships. KPMG is the lead implementing agency for the PSR programme. For this specific activity (Insights on Corporate Renewable Energy Adoption), the PSR programme has partnered with CII.
9Insights to accelerate corporate renewable energy procurement
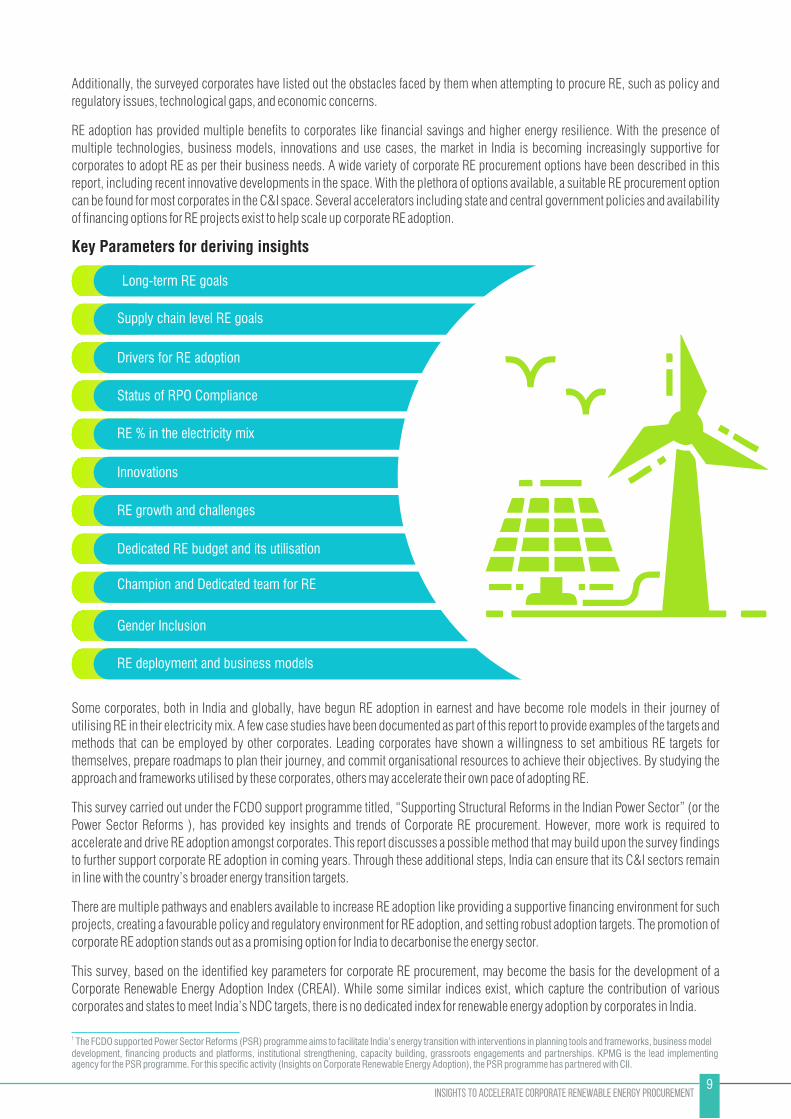
Key Parameters for deriving insights
Long-term RE goals
Supply chain level RE goals
Drivers for RE adoption
Status of RPO Compliance
RE % in the electricity mix
RE growth and challenges
Dedicated RE budget and its utilisation
Champion and Dedicated team for RE
Gender Inclusion
RE deployment and business models
Innovations
Some corporates, both in India and globally, have begun RE adoption in earnest and have become role models in their journey of
utilising RE in their electricity mix. A few case studies have been documented as part of this report to provide examples of the targets and
methods that can be employed by other corporates. Leading corporates have shown a willingness to set ambitious RE targets for
themselves, prepare roadmaps to plan their journey, and commit organisational resources to achieve their objectives. By studying the
approach and frameworks utilised by these corporates, others may accelerate their own pace of adopting RE.
This survey carried out under the FCDO support programme titled, “Supporting Structural Reforms in the Indian Power Sector” (or the
Power Sector Reforms ), has provided key insights and trends of Corporate RE procurement. However, more work is required to
accelerate and drive RE adoption amongst corporates. This report discusses a possible method that may build upon the survey findings
to further support corporate RE adoption in coming years. Through these additional steps, India can ensure that its C&I sectors remain
in line with the country’s broader energy transition targets.
There are multiple pathways and enablers available to increase RE adoption like providing a supportive financing environment for such
projects, creating a favourable policy and regulatory environment for RE adoption, and setting robust adoption targets. The promotion of
corporate RE adoption stands out as a promising option for India to decarbonise the energy sector.
This survey, based on the identified key parameters for corporate RE procurement, may become the basis for the development of a
Corporate Renewable Energy Adoption Index (CREAI). While some similar indices exist, which capture the contribution of various
corporates and states to meet India’s NDC targets, there is no dedicated index for renewable energy adoption by corporates in India.

of the corporates surveyed had a positive trend in RE procurement over the last 3 years
81%
Onsite based RE adoption is comparable to
offsite RE plants; Regulatory barriers pertaining
to open access approvals, long-term clarity on
cross subsidy surcharge is the key ask from
corporates
of the corporates surveyed had a dedicated RE budget in FY20
23%
of the corporates surveyed have a dedicated RE team, only
74%
of these teams have female members, implying there is a need to increase their participation
74%
20%
Over
of the corporates cited Green Image and Cost Reduction as the major drivers for RE adoption.
50%
of surveyed corporates have long term RE goals with intermediate targets, showing an inclination towards adopting high share of RE in their overall energy mix
66%
had a dedicated RE champion assigned within their organisation.
Corporates appear to recognise that a sustainable increase in RE procurement will require active allocation of resources and staff. Of the corporates surveyed,
of the corporates from IT/ITES and 71% of pharmaceutical companies have dedicated RE champions
67%100%
of the corporates surveyed procured RE electricity in FY20
Corporate procurement is well underway as96%
of the corporates surveyed have vendor/supply chain RE targets
There is a need for greening the corporates RE supply chain as only
4% of the corporates who have a long term RE targets are planning to shift to 100% RE
25%
20%

01
2India reported 2.31 Gt of CO emissions during the year 2018, accounting for approximately 7% of global emissions . India’s per capita 2
emissions of 1.7 t CO is currently lower as compared to other countries like the USA (15.03 t CO ) and China (6.84 t CO ). However, 2 2 23with India’s population set to touch the 1.47 billion mark by 2031 , the country’s energy demands, and CO emissions are expected to 2
rise.
1.1 Need for decarbonising India’s energy sector
Figure 1: India’s CO emissions in absolute and per capita terms2
M t CO - Metric tons of Carbon dioxide; t CO2- Tons of Carbon dioxide2
Source: IEA Energy Atlas 2020
INTRODUCTION
11Insights to accelerate corporate renewable energy procurement
Co Emissions (MtCO ) 2 2 Per Capita Co (tCO per Capita)2 2
1975 1980 1985 1990 1995 2000 2005 2010 2015 2016 2017 2018
2500
2000
1500
1000
500
0
0.35 0.38 0.48 0.61 0.73 0.84 0.94 1.27 1.56 1.56 1.64 1.71
217.21 263.39 376.47 530.12 704.34889.83 1007 1570
20402070
21902310
2
1.5
1
0.5
0

The dominance of the energy sector in India’s emission mix is apparent and can be seen with its increasing share in India’s fossil fuel
CO emissions mix. Over the years, power industry’s share in the emissions mix has steadily increased to the point where it stands at 2
almost double than that of the next biggest contributor.
2 http://energyatlas.iea.org/#!/profile/WORLD/IND3 https://thewire.in/government/india-population-growth-government-report-2036-projections-urban-migration4 https://sustainabledevelopment.un.org/partnership/?p=345665 https://cea.nic.in/wp-content/uploads/installed/2021/08/installed_capacity.pdf6 https://cea.nic.in/wp-content/uploads/installed/2021/08/installed_capacity.pdf
Figure 2: India's fossil fuel CO emissions mix from 1970-2019 (%)2
Source: EU Emissions Database for Global Atmospheric Research (EDGAR)
India is moving towards a low carbon future with a target of 500 GW of renewable energy capacity by 2030 to reduce the contribution of
the power sector in the country’s emissions mix. India has also set an interim target of deploying 175 GW of RE, including 100 GW of 4 5solar power, by 2022 . The country has already achieved over 100 GW of installed renewable energy capacity as on 31 August 2021 .
This capacity is dominated by solar and wind power, and also includes biomass power/cogeneration, small hydro power and waste-to-
energy installations.
With the growing scientific consensus on the impact of climate change, as showcased in the United Nations Intergovernmental Panel on
Climate Change (IPCC) report, a global shift towards RE to meet electricity, heat and transportation needs is underway. India has not
shied away from making additional commitments to combat climate change and drive the energy transition. At the 2021 United Nations
Climate Change Conference, India made 5 major commitments:
India’s COP26 commitments:
Ÿ Raise the non-fossil fuel-based energy capacity of the country to 500 GW by 2030; Ÿ Meet 50% of the country’s energy requirements from RE sources by 2030; Ÿ Reduce the total projected carbon emission by one billion tons between now and 2030; Ÿ Reduce the carbon intensity of the economy to less than 45% by 2030; and Ÿ Become carbon neutral and achieve net zero emissions by the year 2070
6Although India achieved ~39% non-fossil fuel-based power generation capacity in 2021, it outperformed the climate target set under
the Paris Agreement by around 8 years. However, additional initiatives will have to be identified and implemented to meet the RE
generation target. India’s commercial and industrial sector accounts for over half of the country’s electricity consumption and utilises a
variety of non-renewable fuels to meet heating and transportation requirements. Increase in the RE adoption by the C&I sector will
become a vital enabler for India to meet its climate goals.
12Insights to accelerate corporate renewable energy procurement
Buildings Non-combustion Other industrial combustion
Power Industry Transport
0%
10%
20%
30%
40%
50%
1970
1972
1974
1976
1978
1980
1982
1984
1986
1988
1990
1992
1994
1996
1998
2000
2002
2004
2006
2008
2010
2012
2014
2016
2018

In 2021, Ministry of Statistics and Programme Implementation (MOSPI) released source-wise subdivision of GHG emissions for the
year 2016. These figures used CO equivalent values to account for other GHGs such as CH , N O, CF , C2F , SF etc. It was found that 2 4 2 4 6 6
the emissions were primarily driven by fuel combustion activities in the energy sector that accounted for approximately 75% of India’s
CO equivalent emissions for the year and this is represented in Figure 3.2
Figure 3: India's CO equivalent emissions by sector (%)2
Source: MOSPI Environmental Statistics 2021
More details are provided below to identify the emissions sources in certain key sectors:
Ÿ Total Energy (Fuel Combustion Activities)
In the fuel combustion activities, energy industries accounted for over half of the overall sectoral emissions, followed by
manufacturing industries, construction, and transport sectors. A detailed breakup of emissions is shown in Figure 4.
Figure 4: India's total energy emissions (fuel combustion activities) (%)
Source: MOSPI Environmental Statistics 2021
Ÿ Industrial Processes and Product Use
Within the industrial processes and product use category, the minerals industry accounted for almost 60% of emissions. The metal
production, chemicals and production of halocarbons and hexafluoride were not far behind. A breakup of the emissions is shown in
the Figure 5.
13Insights to accelerate corporate renewable energy procurement
Energy Industries56%
19%
13%
10%
Manufacturing Industries and Construction
Transport
Other Sectors
01% Fugitive Emissions from Solid Fuels
Total Energy (Fuel Combustion Activities)75%
08%
14%
03%
Agriculture
Industrial Processes and Product Use
Waste

7 https://cea.nic.in/wp-content/uploads/installed/2021/08/installed_capacity.pdf8 MOSPI Energy Statistics India 2021
Figure 5: India industrial processes and product use emissions (%)
Source: MOSPI Environmental Statistics 2021
The primary reason for high emissions in India is its continued reliance on fossil fuels to meet the electricity needs. As on 31 August
2021, as per Central Electricity Authority (CEA) reports, 60.35% of the country’s installed generation capacity was thermal, utilising 7fossil fuels such as coal, lignite, gas and diesel . This thermal capacity usage results in significant carbon dioxide emissions.
The environmental impact of electricity generation is being felt in the C&I sector as it accounted for just over 50% of the total electricity 8usage in 2019-20 .
14Insights to accelerate corporate renewable energy procurement
Minerals60%
18%
11%
01%
Metal Production
Chemicals
Non Energy Product Use
09% Production of Halocarbons and Hexaflouride
01% Others

9 https://economictimes.indiatimes.com/industry/energy/on-the-rise-clean-energy-adoption/articleshow/80103842.cms?from=mdr10 https://www.wwfindia.org/news_facts/?uNewsID=1832111 https://data.bloomberglp.com/professional/sites/24/2020-06-26-Indias-Clean-Power-Revolution_Final.pdf
Figure 6: India’s consumption of electricity by sectors for 2019-20 (%)
Source: Ministry of Statistics and Program Implementation (MOSPI) Energy Statistics India 2021
As the economic activities will continue to grow, the trend of high electricity consumption in the C&I sector is also likely to scale up. The CEA has predicted that 66% of India’s electricity production will be consumed by the
9commercial and industrial consumers by 2030 . Thus, decarbonising the C&I sector is important as it will strongly influence the
country’s carbon footprint in the coming years as India aims to pursue a low-carbon emissions pathway while meeting all its
developmental challenges.
Corporate RE procurement and the commitment to reduce GHG emissions are now common terms for big companies in India. As per 10WWF India, in 2019, 27% of the top 100 NSE companies made GHG emission commitments, while 22% made RE commitments . By
2019, India’s corporates had signed over 5 GW of clean energy procurement deals, making the country the largest 11market in Asia . Figure 7 shows the total renewable installed capacity by C&I consumers, that stands at ~ 17.8 GW as of March 2021.
1.2 Initiatives to accelerate Corporate RE procurement in India
Figure 7: Total installed C&I renewable capacity (MW)
Source: WWF
15Insights to accelerate corporate renewable energy procurement
Industry43%
08% Commercial
01% Traction and Railways
06% Others
24% Domestic
18% Agriculture
7315
4468
6017
Open Access Wind Open Access Solar Rooftop Solar

12 https://www.wbcsd.org/Programs/Climate-and-Energy/Energy/REscale/Resources/Corporate-Renewable-PPAs-in-India-January-202113 https://www.businesstoday.in/latest/economy-politics/story/india-becomes-2nd-largest-market-on-corporate-renewable-power-241943-2020-01-0614 https://www.wbcsd.org/Programs/Climate-and-Energy/Energy/REscale/Resources/Corporate-Renewable-PPAs-in-India-January-2021 15 http://timesofindia.indiatimes.com/articleshow/79072359.cms?utm_source=contentofinterest&utm_medium=text&utm_campaign=cppst16 https://www.there100.org/our-work/news/corporate-renewable-energy-sourcing-way-100-renewable-electricity-india
The corporates can source and utilise RE through several avenues that include Renewable Energy Power Purchase Agreements (PPAs),
Renewable Energy Certificates (RECs) and Captive Renewable Energy power plants.
Several corporates in India have begun utilising RE at various scales through the above mentioned methods. In 2019, India was the
second largest growth market for Corporate Renewable Power Purchase Agreements (PPAs), according to Bloomberg New Energy 12Finance (BNEF), and it added 1.4 GW of capacity . This increased procurement is still being carried out by corporates in diverse
sectors such as information technology (CISCO, Qualcomm, Adobe, Oracle and Mindtree), automotive (Honda, Toyota Kirloskar Motor 13SKF and Volvo), electrical (GE, ABB, Honeywell) and manufacturing (ACC) .
Furthermore, India’s corporate sector should be in sync with Government of India and its global commitments for climate change
mitigation, several steps have been taken in this context to begin the transition. In late 2020, 24 large corporates, including Tata,
Reliance, Mahindra, ITC, ACC, Adani and Dalmia Cement signed a declaration pledging that they will voluntarily move towards carbon
neutrality. Under the declaration, the companies will have to submit an annual report to the environment ministry, providing information 15on their contribution towards reduction of emissions . Many other initiatives to accelerate the RE procurement are as follows:
“Corporate sourcing of renewables has the potential
to drive the energy transformation and increase
the chances of achieving global climate targets”
Corporate renewable PPA capacities declined to 800 MW in 2020 due to the
impact of Covid-19 along with state level restrictions that included limited
banking provisions for power sector, reversing of open access project approvals,
and imposing additional open access charges. Despite this setback, PPAs are
expected to grow in coming years as their economic viability will become less
dependent on government support.
Corporates from various sectors like construction, chemicals, cement and bu i l
ding material production have turned to corporate renewable PPAs for RE
procurement. Some examples include Ultratech Cement, Indian Oil Corporation
Limited, Ambuja Cement, Bharati Cement, ACC, L&T Metro, Grasim Industries, Dalmia 14Cement and Apollo Tyres .
RE100
The RE100 is a global initiative led by the Climate Group, in partnership with CDP. It aims to accelerate the shift towards
100% RE. It has over 300 members of which four companies are headquartered in India i.e. Infosys, Tata Motors, Dalmia
Cement and Mahindra Holidays and Resorts.
There are more than 40 international companies in RE100 list that have presence in India, who are shifting their 16operations to adopt RE .
CDP Disclosures
CDP is an international not for profit organisation that runs the global disclosure system documenting the environmental
impact of various stakeholders like companies, cities, states and regions. The CDPs disclosure system allows
companies to benchmark themselves to industry peers, increase visibility and identify opportunities or risks to
business.
As of 2020, more than 9,600 companies, accounting for over 50% of global market capitalisation, disclosed their
environmental impact through CDP including 220 Indian companies. For the first time, 4 Indian companies made it to
the CDP A list, namely Hindustan Zinc Ltd., IndusInd Bank, Mahindra & Mahindra, and Tech Mahindra.
16Insights to accelerate corporate renewable energy procurement

17 https://sciencebasedtargets.org/companies-taking-action?country=India#table
Science Based Targets Initiative (SBTi)
The Science Based Targets initiative aims to help private sector companies set science-based emissions reduction
targets. It is a partnership between CDP, the United Nations Global Compact, WRI and WWF.
17In this initiative , 56 companies are from India and 24 of them have set specific targets for both Scope 1 and Scope 2
emissions. Six companies have gone further and set a net zero target under the ‘Business Ambition for 1.5° C initiative--
these are Mahindra Heavy Engines Ltd., Dr. Reddy’s Laboratories Ltd., Mahindra & Mahindra Limited, Wipro and Tech
Mahindra.
Renewable Energy Demand Enhancement (REDE) Initiative for Corporate Buyers in India
WWF India and CII partnered to develop the REDE initiative that aims to promote RE demand of C&I consumers. This
provides a national forum to discuss the challenges for large-scale corporate RE procurement and present them to
stakeholders to evolve practical and commercially viable solutions.
Companies that are involved in this initiative include ACC, Ambuja Cement, Marico, ITC, JK Tyre, Pratibha, Siemens,
Yes Bank, Galaxy, Mahindra, Godrej, Amazon, Decathlon, Aditya Birla Grasim, Saint Gobain, Godrej, P&G, AAK,
ABinBev, Avery Dennisson, Dalmia Bharat Cement, Diageo and Infosys.
17Insights to accelerate corporate renewable energy procurement
Under the FCDO’s Power Sector Reforms (PSR) programme, KPMG in India has partnered with the Confederation of Indian Industry’s
Sohrabji Godrej Green Business Centre (hereinafter referred to as “CII-Godrej GBC”) for the development of this report. KPMG provided
support in identifying the key survey parameters and its analysis, while CII-GODREJ GBC had undertaken the data collection and
validation process across various C&I sectors such as consumer goods, cement, IT/ITES, automotive, energy and natural resources,
machinery and equipment, pharmaceuticals, and others.
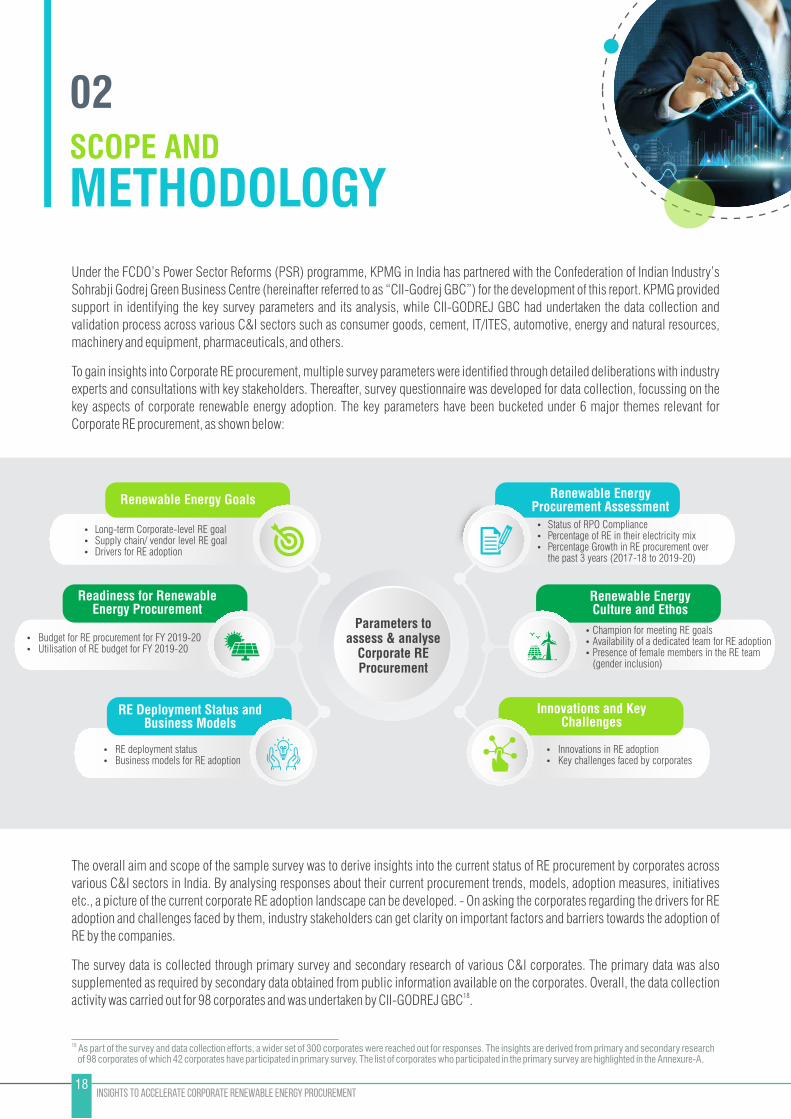
To gain insights into Corporate RE procurement, multiple survey parameters were identified through detailed deliberations with industry
experts and consultations with key stakeholders. Thereafter, survey questionnaire was developed for data collection, focussing on the
key aspects of corporate renewable energy adoption. The key parameters have been bucketed under 6 major themes relevant for
Corporate RE procurement, as shown below:
SCOPE AND
METHODOLOGY
02
18Insights to accelerate corporate renewable energy procurement
Renewable Energy Goals Renewable Energy Procurement Assessment
Readiness for Renewable Energy Procurement
Renewable Energy Culture and Ethos
RE Deployment Status and Business Models
Innovations and Key Challenges
Ÿ Long-term Corporate-level RE goal Ÿ Supply chain/ vendor level RE goal Ÿ Drivers for RE adoption
Ÿ Status of RPO ComplianceŸ Percentage of RE in their electricity mix Ÿ Percentage Growth in RE procurement over
the past 3 years (2017-18 to 2019-20)
Ÿ Budget for RE procurement for FY 2019-20 Ÿ Utilisation of RE budget for FY 2019-20
Ÿ Champion for meeting RE goals Ÿ Availability of a dedicated team for RE adoption Ÿ Presence of female members in the RE team
(gender inclusion)
Ÿ RE deployment status Ÿ Business models for RE adoption
Ÿ Innovations in RE adoption Ÿ Key challenges faced by corporates
Parameters to assess & analyse
Corporate RE Procurement
The overall aim and scope of the sample survey was to derive insights into the current status of RE procurement by corporates across
various C&I sectors in India. By analysing responses about their current procurement trends, models, adoption measures, initiatives
etc., a picture of the current corporate RE adoption landscape can be developed. - On asking the corporates regarding the drivers for RE
adoption and challenges faced by them, industry stakeholders can get clarity on important factors and barriers towards the adoption of
RE by the companies.
The survey data is collected through primary survey and secondary research of various C&I corporates. The primary data was also
supplemented as required by secondary data obtained from public information available on the corporates. Overall, the data collection 18activity was carried out for 98 corporates and was undertaken by CII-GODREJ GBC .
18 As part of the survey and data collection efforts, a wider set of 300 corporates were reached out for responses. The insights are derived from primary and secondary research of 98 corporates of which 42 corporates have participated in primary survey. The list of corporates who participated in the primary survey are highlighted in the Annexure-A.

Long-term Corporate-level renewable energy goal1
The objective of this parameter is to assess whether a corporate has formulated long term goal for its RE target. The parameter
considers the presence of a long-term goal (e.g. 10 year target for renewable energy procurement) as well as intermediate goals
(e.g. a 5 year interim target) to gauge progress and commitment towards the long term goal.
Supply chain/vendor level renewable energy goal2
It assesses whether a corporate’s RE target is also applicable to its supply chain or vendors. With many corporates having an
extensive supply chain in place, determining whether their RE goals extend to their suppliers as well can be a good indicator of the
corporate’s commitment to decarbonisation.
Drivers for corporate renewable energy adoption3
It determines the major reason why corporates have begun RE adoption, if any. Some common drivers include creating a green
image for the company, financial viability, and commitment to RE procurement.
Status of RPO Compliance4
The objective of this parameter is to find out whether a company has a Renewable Purchase Obligation (RPO) requirement (i.e.
whether it is bound to procure a certain amount RE) and whether it is meeting the same. In addition to RPO obligated entities, the
parameter also accounts for corporates that procure RE without any RPO obligations.
Percentage of renewable energy in their electricity mix5
It checks if a corporate has started RE procurement as part of its electricity mix. The parameter considers various ranges of RE share
in electricity mix, peaking at over 50% RE share in the current electricity mix. For example, if a corporate utilises 100 million units of
electricity and procures 25 million units from renewable sources, its RE% stands at 25%.
Percentage growth in renewable energy procurement over the past 3 years (2017-18 to 2019-20)6
It assesses whether a corporate has scaled up its RE procurement in the recent past, showcasing its commitment to meeting relevant
targets and greening its electricity mix. The parameter considers whether the growth percentage trend is negative, maintained at
initial levels, or positive, which assess the commitment towards RE.
Budget for renewable energy procurement in FY 2019-207
It determines if a corporate has earmarked a dedicated budget for RE procurement in FY 2019-20. This parameter helps to assess
the seriousness of corporates towards RE procurement.
Utilisation of renewable energy budget in FY 2019-208
The objective of this parameter is to determine the extent to which a corporate is fully utilising its earmarked budget for RE
procurement. The parameter considers various ranges of utilisation of RE budget.
19Insights to accelerate corporate renewable energy procurement
The parameters of the survey to assess and analyse Corporate RE procurement are explained in detail below:
Champion for meeting renewable energy goals9
This parameter determines whether a corporate has nominated a RE champion to drive their goals. The presence of a RE champion
amongst the company leadership, signals the corporate’s intent and seriousness to decarbonise its energy procurement.
Availability of a dedicated team for renewable energy procurement10
It determines whether a corporate has created a focused team to execute RE adoption for the company. By having a dedicated team,
it helps a corporate to accelerate RE procurement and ensures that its RE adoption targets are met with actionable plans and assists
in course correction where required.

19 Onsite RE procurement is defined as the energy procured from the renewable energy systems which are installed within the premises of the owner. Offsite RE procurement is defined as energy procured from systems which are not installed in the site premises and procured from an offsite plant under open access agreement with electric utility.
Presence of female members in the renewable energy team (gender inclusion)11
It monitors corporate RE teams to ensure gender inclusion with sufficient participation from women. Gender inclusivity is a major
part of sustainability strategy and thus must be considered when planning RE adoption.
Renewable energy deployment status1219The objective is to determine the type of RE procurement being carried out by corporates (onsite or offsite ) and analyse how these
choices vary across various C&I sectors.
Business models for renewable energy adoption13
It determines the specific business models being utilised by corporates adopting RE (CAPEX, group captive, RESCO etc.) and to
identify any sectoral preference for business models that may exist.
Innovations in renewable energy adoption14
This parameter determines which new and innovative technologies/applications such as hybrid renewable solutions, solar and
storage solutions, electric vehicles, hydropower, etc are being utilised by corporates.
Key challenges for corporate renewable energy procurement15
It is to understand the various aspects that are holding corporates back in terms of their RE procurement ambitions. Common
challenges include policy and regulatory challenges, technology challenges and commercial aspects.
20Insights to accelerate corporate renewable energy procurement

In order to have an impactful survey in a broad range category such as the commercial and industrial sector, it was vital to have a large
distribution of corporates across subsectors. The diversity allowed meaningful insights to be derived from the sample set.
20Corporates that participated in the survey were categorised as per NIC 2008 industry classification, which was further bucketed to
represent eight diverse sectors including machinery & equipment, energy & natural resources (comprising energy, metal and
ceramics), consumer goods (comprising FMCG, food & beverages and textile), cement, automotive, IT/ITES, pharmaceuticals and
‘Others’. ‘Others’ include corporates providing hospitality, healthcare and logistics services. Figure 8 represents the sectoral
distribution of survey respondents.
KEY INSIGHTS AND
OBSERVATIONS
03
Figure 8: Sectoral distribution of survey respondents
21It has been observed through the survey that, out of the corporates surveyed, 100% of them have a long term goal and 66%
have long-term goals with intermediate targets, showing their commitment towards RE procurement. It appears that although
corporates have begun to recognise the importance of RE procurement, further knowledge sharing, and guidance would be
required for them to plan intermediate RE targets and to create a clear-cut roadmap for meeting their RE targets.
The survey also indicates that 25% of the corporates who have a long term RE target are planning to shift to 100% RE. These
corporates fall in various sectors like IT/ITES, pharmaceuticals, cement, consumer goods and automotive. These corporates
feel that Government support is necessary for promoting ‘Net Zero Energy (100% RE)’, as achieving this target requires a
combination of both onsite and offsite based RE assets.
3.1 Renewable energy goals
a. Long-term corporate-level renewable energy goal
20 The National Industrial Classification (NIC) is an essential Statistical Standard for developing and maintaining comparable data base according to economic activities developed by Central Statistical Organisation, Ministry of Statistics and Programme Implementation.21 Total response percentage (data available from primary and secondary) for this parameter is 60% and the analysis is based on that
21Insights to accelerate corporate renewable energy procurement
Consumer Goods19%
19%
19%
13%
Energy and Natural Resources
Machinery & Equipment
Automotive
IT/ITES05%
03% Others
13% Cement
07% Pharmaceutical

Figure 9: Sectoral distribution of corporates with more than 40% RE target by 2030
22Of the survey respondents having long-term RE targets, only 4% mentioned that the goal is applicable to their
vendors/supply chain as well.
These corporates were mostly from the ‘Machinery & Equipment’ and ‘Consumer Goods’ sectors. This indicates that there is
a huge untapped potential available for ‘greening the supply chain’. It is important for corporates to take their vendors along in
their RE journey. These corporates should give preference to vendors who are environmentally responsible.
b. Supply chain/vendor level renewable energy goal
The Government of India has committed to achieve 40% of its installed electricity generation capacity from RE by 2030. India
is on its way to achieve this target as part of its ‘Intended Nationally Determined Contributions (INDC)’ towards climate
justice. The role of Indian corporates is significant in meeting this target. The survey indicates that 45% of the corporates who
have a long term RE target have specified the target achievement year as 2030. Further, as per the survey, 32% of these
corporates have targets in excess of the country’s target of 40% renewable energy in the country’s energy mix, which is
encouraging.
The green image and cost reduction have emerged as the major drivers for RE adoption by corporates. This
clearly indicates that corporates are endorsing ‘green makes business sense’. RE adoption by corporates has generally been
voluntary, regardless of the fact that meeting RPO obligation is also one of the drivers.
Corporates have mentioned a number of other drivers for RE adoption. These include reducing carbon emissions, meeting
carbon neutrality goals, meeting corporate sustainability and responsible business commitments, shifting to green
manufacturing/carbon neutral factories etc. Some corporates have also highlighted that they have companywide ESG
initiatives or have made commitments under the Science Based Targets Initiative, that in turn helps drive RE adoption. Figure
10 shows the drivers for RE adoption and Figure 11 represents the sector-wise drivers for RE adoption.
c. Drivers for corporate RE adoption
Figure 10: Drivers for RE adoption
22 Total response percentage (data available from primary and secondary) for this parameter is 58% and the analysis is based on that
22Insights to accelerate corporate renewable energy procurement
Consumer Goods26%
26%
16%
16%
Automotive
IT/ITES
Machinery & Equipment
05% Energy &Natural Resources
05% Cement
Pharmaceuticals05%
91%
55%
25%
15%
Green Image Cost Reduction Meeting RPO Other Drivers

Figure 11: Sector-wise drivers for RE adoption
As per the sample survey, different C&I subsectors provided different reasons for RE adoption. Sectors like
Pharmaceuticals, IT/ITES and Automotive companies surveyed mentioned green image the key reason for RE adoption,
while all surveyed energy intensive sectors like Cement, Energy & Natural Resources and Machinery & Equipment
companies indicated both cost reduction and green image as their drivers. Meeting the RPO obligations is important for the
cement subsector but was not prioritised by other subsectors who were part of the survey.
Renewable Purchase Obligation (RPO) is applicable for certain category of consumers such as those who generate electricity
from captive fossil-fuel based power plants or procure open access power from fossil-fuel based offsite power plants. The
sectors which often have RPO obligated corporates include cement, energy & natural resources, and consumer goods. Of the 23corporates that were part of the survey , 62% did not have applicable RPO obligations. Only 5% of the respondents had not
fully met their obligations, showing that most companies have been successful in complying with the regulations for
procuring RE. Figure 12 shows the RPO obligation status of surveyed corporates.
3.2 Renewable energy procurement assessment
d. Status of RPO compliance
23 Total response percentage (data available from primary and secondary) for this parameter is 74% and the analysis is based on that
23Insights to accelerate corporate renewable energy procurement
0% 20% 40% 60% 80% 100% 120%
Automotive
Cement
Consumer Goods
Energy & Natural Resources
IT/ITES
Machinery & Equipment
Others
Pharmaceuticals
Cost Reduction Meeting RPO Green Image Other Drivers

Figure 12: RPO obligation status of surveyed corporates (%)
There is a rising trend among the corporates to switch towards cleaner forms of energy. Of the corporates participated in the 24survey , 47% had RE share in the range of 0-20%, whereas 53% of the corporates had RE share in excess of 20%. Corporates
having an RE share in excess of 50% accounted for 11% of the survey respondents. This shows that corporates have
started to accept that RE makes business sense. However, there is a significant potential that still remains untapped.
Figure 13 presents the share of RE in overall electricity consumption.
e. Percentage of RE in current total electricity mix
Figure 13: Share of RE in overall electricity consumption
As per the survey, 43% of the surveyed pharmaceutical corporates had more than 20% of RE in their electricity mix. Similarly,
automotive sector had 38% of corporates with more than 20% RE share. The consumer goods sector has 26% of the
companies with more than 50% RE in their electricity mix, followed by machinery and equipment at 11%. Figure 14 projects
the sector-wise classification of corporates procuring RE as part of their electricity mix.
23 Total response percentage (data available from primary and secondary) for this parameter is 50% and the analysis is based on that
24Insights to accelerate corporate renewable energy procurement
Met < 100%33%
62%
05%
Met 100%
Not Applicable
> 50% 40% - 50% 20% - 40% 10% - 20% 0% - 10% 0%
11%
14%
28%
13%
30%
4%
0%
5%
10%
15%
20%
25%
30%
35%
% o
f C
ompa
nies
% RE in overall electricity consumption

Figure 14. Sector-wise classification of corporates procuring RE as a % of electricity mix
As a significant positive, energy intensive industries such as consumer goods and machinery & equipment have multiple
corporates with over 50% RE in their current electricity mix.
Of the corporates, who are currently procuring renewable energy, 81% have shown positive growth in RE share over the
last 3 years from 2017-18 to 2019-20. This shows a growing interest and inclination among the corporates to adopt RE. For
energy intensive sectors like cement, there is growing economic sense to procure from renewable sources due to decreasing
cost of renewable energy technologies and have reached grid parity in the last decade. On the other hand, IT/ITES companies
worldwide have been driving renewable energy procurement and setting emissions targets for their operations. These trends
are reflected in the survey data, with all (100%) the survey participants from IT/ITES sectors showing a positive
trend in RE procurement. Figure 15 shows the sector-wise percentage of corporates showing positive trend in RE
procurement.
f. Percentage growth in RE procurement over the past 3 years
25Insights to accelerate corporate renewable energy procurement
0% 10% 20% 30% 40% 50%
Automotive
Cement
Consumer Goods
Energy & Natural Resources
IT/ITES
Machinery & Equipment
Others
Pharmaceuticals
> 50% RE 40% - 50% RE 20% - 40% RE
10% - 20% RE 0% - 10% RE 0% RE

Figure 15: Sector-wise percentage of corporates showing positive trend in RE procurement
25The survey indicates that corporates are approaching RE adoption with the right intent by assigning teams and leaders to
further their objectives in the field. However, as observed by the survey responses, only 23% of corporates had earmarked a
dedicated budget for RE procurement during 2019-20.
As far as having dedicated RE budget, 80% of the corporates in the IT & engineering sector have a dedicated RE budget.
Inching closer with an allocated RE budget were the automotive sector at 31% and consumer goods sector at 21%. Figure 16
shows sectoral distribution of corporates with dedicated RE budget.
3.3 Readiness for renewable energy procurement
g. Budget for RE procurement for FY 2019-20
25 Total response percentage (data available from primary and secondary) for this parameter is 80% and the analysis is based on that
Figure 16: Sectoral distribution of corporates with dedicated RE budget
26Insights to accelerate corporate renewable energy procurement
100%
62%
46%41% 37% 33%
29%21%
IT/IT
ES
Cemen
t
Autom
otive
Mac
hine
ry &
Equ
ipm
ent
Consu
mer
Goo
ds
Other
s
Pharm
aceu
ticals
Ener
gy &
Nat
ural
Resou
rces
80%
31%21%
16% 14%8% 5%
IT/IT
ES
Autom
otive
Consu
mer
Goo
ds
Mac
hine
ry &
Equ
ipm
ent
Pharm
aceu
tical
Cemen
t
Ener
gy an
d Nat
ural
Resou
rces

3.4 Renewable energy culture and ethos
i. Champion for meeting RE goals
28 Total response percentage (data available from primary and secondary) for this parameter is 82% and the analysis is based on that
Figure 17: Sectoral distribution of corporates having RE Champion (%)
28The companies having a dedicated team for RE adoption accounted for ~74% of the survey respondents. 85% of these
corporates have a strength of 1-5 members, whereas 9% have 6-10 members and 6% have more than 10 members in their
team, showing an increasing commitment to accelerate RE adoption for decarbonising their energy sector. Figure 18 shows
the RE team strength of corporates.
j. Availability of a dedicated team for RE adoption
Figure 18: RE Team Strength of Corporates
27Insights to accelerate corporate renewable energy procurement
100%
71%62%
47% 47% 46% 42%33%
IT/IT
ES
Pharm
aceu
tical
Autom
otive
Consu
mer
Goo
ds
Mac
hine
ry &
Equ
ipm
ent
Cemen
t
Ener
gy an
d Nat
ural
Resou
rces
Other
s
1-5 Members85%
09%
06%
6-10 Members
>10 Members
Of the survey respondents, budget allocated by corporates for RE ranges from less than 1% to around 5% of the turnover. 2645% of these corporates have utilised 100% of the approved budget. This shows that although corporates have begun
allocating budget for RE adoption, focused efforts are required to properly make use of the resources.
h. Utilisation of RE budget for FY 2019-20
Corporates appear to recognise that a sustainable increase in RE procurement will require active allocation of resources and 27staff. Of the corporates surveyed , 67% had a dedicated RE champion assigned within their organisation. It can be noted that
100% of the corporates from IT/ITES and 71% of pharmaceutical companies have RE champions at the corporate level and it
is evident from the survey that these sectors have been in the forefront of adopting RE. The automotive, cement and machinery
& equipment sectors are also ahead in this aspect. Figure 17 highlights the sectoral distribution of companies having RE
Champion.

100% of the corporates from IT/ITES sector have a dedicated team for RE procurement. The consumer goods,
pharmaceuticals, cement, and machinery & equipment sectors are increasing their focus in this sphere.
Among the corporates which have a dedicated team for RE, only 20% have female presence in the RE team. This indicates that
more female members should be encouraged to be part of the RE sector for gender equality and inclusiveness. Hospitality,
Logistics and Healthcare sectors tops the chart in terms of presence of female members in RE teams followed by Machinery &
Equipment and IT/ITES. However, in the consumer goods sector, the figure stands at 14%. Figure 19 represents sectoral
distribution of corporates with female presence in RE team.
29k. Presence of female members in the RE team (gender inclusion)
29 Total response percentage (data available from primary and secondary) for this parameter is 41% and the analysis is based on that30 https://www.mckinsey.com/business-functions/people-and-organizational-performance/our-insights/delivering-through-diversity31 Data pertaining to female participation/female presence is very limited and the analysis is based on the surveys responses and data collected from received from 25% of the corporates
There are proven benefits of having a gender diverse workforce. A strong correlation has been found between gender diversity 30in executive teams and profitability and long-term value creation . The corporates can aim to harness these benefits to
support their RE adoption initiatives.
31Most of the surveyed companies from different sectors have begun cultivating a RE ethos, as can be seen by the reasonably
consistent presence of RE champions and dedicated teams in different corporates across sectors.
28Insights to accelerate corporate renewable energy procurement
Figure 19: Sectoral distribution of corporates with female presence in RE Team (%)
100%
45%40%
20%14%
9%
Others Machinery &
Equipment
IT/ITES Pharmaceuticals Consumer Goods Energy & NaturalResources

32Of the corporates which were surveyed , 80% have onsite RE power plants (for e.g., rooftop solar, biomass/ biogas plants) to
meet their electricity requirement. Surveyed companies in sectors such as automotive (92%), IT/ITES (100%) and machinery
equipment (95%), have high adoption of onsite power plants. This indicates that there is enough roof space/land available in
the premises of these corporates which result in installation of onsite RE power plants. Figure 20 presents the sectoral
distribution of corporates having onsite RE power plants.
3.5 Renewable energy deployment status and business models utilised
l. Renewable energy deployment status
32 Total response percentage (data available from primary and secondary) for this parameter is 100%
Of the surveyed corporates, 82% procure renewable electricity from offsite power plants. For offsite RE procurement,
corporates have indicated, there is a need for single window clearance for various approvals for open access and connectivity
approvals and long-term clarity on additional charges like cross subsidy surcharge, which they incur over and above the RE
tariff under open access route. All corporates surveyed from cement and IT/ITES sectors procure RE from offsite plants,
indicating that onsite RE power may not be always feasible/sufficient for meeting the electricity requirements. For e.g., it may
not be viable to have rooftop plants inside a cement plant considering the dusty environment. In case of IT/ITES sector, day
time electricity requirement is huge, as majority of the requirement is from cooling load in buildings. Available roof space
may not be sufficient in buildings, especially commercial buildings, to install rooftop solar plants for meeting entire
electricity requirement. Figure 21 shows the sectoral distribution of corporate having offsite RE power plants.
Figure 20: Sectoral distribution of corporates having Onsite RE Power Plants (%)
Figure 21: Sectoral distribution of corporates having offsite RE power plants (%)
29Insights to accelerate corporate renewable energy procurement
100%95% 92% 89%
77%68% 67%
29%
IT/IT
ES
Pharm
aceu
ticals
Autom
otive
Consu
mer
Goo
ds
Mac
hine
ry &
Equ
ipm
ent
Cemen
t
Ener
gy an
d Nat
ural
Resou
rces
Other
s
100% 100% 100%89% 86%
77%68% 68%
IT/IT
ES
Pharm
aceu
ticals
Autom
otive
Consu
mer
Goo
ds
Mac
hine
ry &
Equ
ipm
ent
Cemen
t
Ener
gy an
d Nat
ural
Resou
rces
Other
s

As per the survey results, 61% of the corporates utilise a combination of offsite and onsite RE plants to meet their requirement.
This confirms the general trend wherein the onsite resources are utilised to the maximum (for e.g., utilising
available roof area to solarise the buildings/factories).
In case of onsite plants, 89% have been installed through self-investment, 18% through RESCO/OPEX/BOOT model and 12%
have opted for a combination of self-investment & RESCO/OPEX/BOOT model, without accounting for overlap. The CAPEX
model dominates RESCO model in all the sectors except for Pharmaceuticals. It can be inferred that self-investment may be
preferred in the onsite mode, owing to hassle free processes (approvals and clearances), simple nature of rooftop solar plants
(predominantly used technology) which requires less maintenance and also provides better financial returns. Figure 22
highlights the business models for onsite RE plants in various sectors.
m. Business models for renewable energy adoption
Figure 22: Business models for onsite RE plants in various sectors
30Insights to accelerate corporate renewable energy procurement
0%10%20%30%40%50%60%70%80%90%
IT/IT
ES
Pharm
aceu
ticals
Autom
otive
Consu
mer
Goo
ds
Mac
hine
ry &
Equ
ipm
ent
Cemen
t
Ener
gy an
d Nat
ural
Resou
rces
Other
s
CAPEX RESCO

In case of offsite RE plants, OPEX/third party power purchase is the predominant business model adopted by corporates
followed by Renewable Energy Certificates (REC) and group captive. If this trend continues, better financing options and
innovative financial models are required for the RE developers to develop projects. Figure 23 highlights the business models
for offsite RE procurement.
The corporates have begun adoption of new applications which can be integrated with renewable energy technologies. Figure
24 provides comparison of different applications adopted. (Note: A company may have adopted more than one application,
hence there are more application than corporates surveyed).
n. New applications enabling RE adoption by corporates
Figure 23: Business models for offsite RE procurement
Other interesting insights from the survey regarding business models are as follows.
a.
b.
c.
OPEX/third party power purchase is adopted by all sectors that are procuring RE power from offsite power plants
Cement is the only sector that has gone for offsite RE plant under captive mode. Further, cement is the only sector that
has adopted all the business models available for offsite RE procurement.
REC is predominantly purchased by corporates from sectors such as cement, energy & natural resources and IT/ITES.
3.6 Innovations and key challenges
Figure 24: RE related applications adopted by corporates
31Insights to accelerate corporate renewable energy procurement
64%
39%
24%
16%
5%
OPEX/Third PartyPPA
Captive REC Group Captive Others
52%
31%25%
21%17%
6% 4%
Power Purchase
Agreementsasking for
Round-the-Clock
Power fromRE Sources
Others Utilization of CSR
fund for RE based
community activities
Solar-Wind
Hybrid
Usage of Electric Vehicles
Charging Electric
Vehicles with Renewable
Energy Plants
Solar + Energy Storage

33The survey listed some common applications and methods that have been adopted by corporates, including electric
uvehicle usage, solar-wind hybrid systems, solar + storage solutions, RE charging for electric vehicles, round the clock
renewable PPAs and utilisation of CSR funds for RE community projects. In addition to the mentioned applications, several
corporates have adopted other applications and processess such as energy efficiency improvements through waste heat
recovery systems etc.
The companies are thus willing to try different renewable sources, methods and models, allowing them to carry out
procurement in a manner best suited to their organisational and industrial requirements.
Ÿ Implementation gaps: Although policies and
regulations are favourably aligned to promote RE,
there are gaps in their implementation. Some of the
challenges are indicated in the box titled “Major
Challenges highlighted by Corporates”.
Ÿ Policy inconsistency: RE policies may conflict with
each other, thus acting more as a disruptive presence
than a supportive one. Policy differences between
states (such as in net metering or open access
regulations) also make interstate RE projects and
transfers tricky to accomplish.
Policy and regulatory challenges
Major challenges highlighted by Corporates
Ÿ Complex approval processes and lack of single window approvalŸ Restrictions and limitations on open access procurement of REŸ Physical and location specific constraints for RE plantsŸ Interstate transfer issues and variations in net metering and open
access policiesŸ Limitations on approved capacities of RE plants
Infrastructure and technical challenges
Ÿ Storage and balancing: To manage variability in renewable electricity generation, storage and balancing are required. However,
the high costs associated with storage and the difficulty in balancing renewable generation capacity can be concerning for
DISCOMs and may result in increasing tariffs for C&I consumers.
Ÿ Upgradation: Upgradation of the grid network has not always kept up with the rapid growth of RE capacity in India. Lack of
regulatory mechanisms including provisions related to banking and energy storage, and insufficient availability of evacuation
infrastructure are deterrent to adoption of new innovations such as RE integrated with energy storage to provide round the clock
power supply to corporates.
Commercial and bureaucratic challenges
Ÿ PPA tenure: Long agreement tenures for power purchase in a rapidly changing RE landscape can discourage corporate RE
procurement.
Ÿ Administrative issues: Lack of single window approvals and slow, cumbersome approval processes hurt RE adoption by
corporates.
The RE industry in India has grown rapidly in recent years, and corporate interest in
renewable procurement has also increased with the presence of several benefits.
Despite this positive trend, respondents to the survey have pointed out several
challenges that they face to procure RE. Some of these challenges include:
Key challenges for corporate renewable energy procurement highlighted by corporates
32Insights to accelerate corporate renewable energy procurement

CORPORATE REFRONTRUNNERS:
MAPPING BESTPRACTICES
04
RE adoption also brings about a number of benefits to corporates:
4.1 Corporate RE procurement options
Financial benefits
34 https://economictimes.indiatimes.com/industry/energy/on-the-rise-clean-energy-adoption/articleshow/80103842.cms?from=mdr
Ÿ Falling costs of RE in India from a variety of sources. Solar energy in the country is now significantly cheaper than new and existing 34thermal power .
Ÿ High tariffs for commercial and industrial customers make it attractive for firms to procure a part of their electricity from other
sources.
Ÿ State and central policies provide benefits to corporates procuring RE.
Ÿ An increasing number of corporates are adopting corporate sustainability goals, which further drives RE adoption.
Ÿ Utilising RE allows corporates to achieve lower energy costs, by taking advantage of its decreasing costs.
Ÿ Corporates may be able to stabilise energy costs over a period of time.
Ÿ Investing in RE projects can provide tax and financial incentives to corporates, depending on the relevant incentive mechanisms in
place.
33Insights to accelerate corporate renewable energy procurement

Brand benefits35
Ÿ Investor requested corporate disclosures for climate change from Indian corporates grew by 17% between 2019 and 2020 . The
companies can leverage the RE transition to optimise the perception of investors, consumers, and other stakeholders to create a
green image for themselves.
35 CDP India Report 2020
Increased resilience
Ÿ A robust RE sourcing strategy can help corporates minimise the impact of potential carbon taxes that may be levied.
Ÿ Secure access to decentralised, reliable energy sources can reduce corporate dependence on third parties and mitigate grid
stability risks.
There is a clear use-case for corporate RE adoption, and this requirement for RE can be met through a number of procurement options as
detailed below:
a. Greening the supply chains
To truly achieve sustainable operations, corporates can attempt to green their supply chain or supplier network. This greening of the
value chain poses additional challenges due to the potentially large scale of operations as well as lack of direct control over each stage
of the supply chain. To carry out greening of the supply chain vendors, the overall carbon footprint of the supply chain must be
calculated or estimated for each product. Accordingly, a green business model may be developed with various interventions at different
stages. The greening activities may involve process optimisation as well as procurement of RE to offset supply chain emissions.
Although corporates may strive to achieve green supply chains/value chains, the process is more difficult to plan and implement than
just procuring RE for direct company operations. However, successful supply chain greening may result in improved supply chain
economic performance and reduced wastage in addition to the obvious environmental and social benefits.
b. Direct investment in self-production
Direct investment in RE production is commonly done through Captive Renewable Energy Generation. Under this model, the corporate
buyer makes the upfront capital investment, therefore the model is also known as Capital expenditure (CAPEX) model. The corporate
buyer owns, operates and maintains the project throughout its lifespan. Additionally, a group captive model variant may be used. Under
the group captive model, a project is developed for collective usage of one or many corporate buyers. This may provide some additional
open access benefits as long as minimum equity conditions are met to qualify as a group captive arrangement.
A number of technologies can be utilised for captive RE generation, depending on the specific corporate requirements and availability
of various sources. Some common methods are listed below:
Ÿ Rooftop solar plants may be used for corporate buildings, warehouses, offices with space constraints in cities.
Ÿ Ground mounted solar may be used where suitable land area and solar irradiation is available.
Ÿ Biomass power generation methods such as bagasse cogeneration may be utilised to provide both electricity and heat.
Ÿ Solar PV plants combined with storage solutions may be utilised for increased flexibility and specific applications where power
quality is important
c. Corporate Renewable Power Purchase Agreements (PPAs)
Under the Power Purchase Agreement (PPA) approach, corporates opt to enter into long term purchase agreements with a seller. At
utility scale, this is usually a third-party investor who has invested in a project and is selling power to the corporate. The third party may
also use his own funds to set up a plant on the corporate’s premises, such as in the case of a solar rooftop plant. With this model, there is
no upfront investment and no operation and maintenance responsibility for the corporate buyer. However, Open Access charges may be
applicable on the power being wheeled from the generation site to the corporate buyers’ location. Business models used for these PPAs
include BOOT and BOOM models.
34Insights to accelerate corporate renewable energy procurement
36 WBCSD, Corporate Renewable PPAs in India: Market and Policy Update, January 2021
The Indian corporate renewable PPA market has transitioned from predominantly third party PPA models to group captive PPA models,
led by the withdrawal of open access waivers for new third-party PPAs in most states. Other reasons driving this societal change are the
need to have uninterrupted power supply, improving commercial cost of RE (solar), sustainability targets and improved efficiencies of
equipment. Overall, Corporate Renewable PPAs are an increasingly attractive method for corporates to procure RE. Innovative models 36such as virtual PPAs also provide additional benefits to corporates, as detailed in the box above .
Virtual PPAs
Innovative PPA structures have emerged to meet the various needs of corporate buyers. One such structure is the Virtual PPA, where a corporate buyer agrees to purchase renewable power through a corporate PPA, without physical delivery of electricity and therefore without sleeving or transmission fees. Such a structure is more flexible than regular PPAs and may be attractive for buyers seeking shorter term PPAs.
Renewable Energy Certificates (REC)
In India, corporates have a Renewable Purchase Obligation (RPO) imposed by DISCOMs. Renewable Energy Certificates (REC) are
those instruments that allow corporates to buy the environmental aspect of green power without having to buy green power itself. A REC
is essentially a premium that corporates pay, over and above the electricity tariff a DISCOM charges, to convert ‘brown’ power to ‘green’
power to fulfil the RPO target. One REC represents 1 MWh of energy generated from renewable sources. RECs are now positioned as the
currency of RE markets because of its flexibility and the fact that it is not subjected to the physical and geographical limitations of its
underlying commodity, electricity.
The obligated entities purchase RECs through Power Exchanges and submit them to the concerned state nodal agencies (SNAs) or as
specified by respective state electricity regulatory commissions (SERCs) as proof of RPO compliance. The NLDC maintains and
records RECs sold, purchased and redeemed for self-consumption in the REC registry.
The Ministry of Power (MOP) circulated a discussion paper of redesigning the REC mechanism on 4 June 2021. Basis this the MOP has
announced that redesigning of the renewable energy certificates (REC) mechanism will be soon updated by Central Electricity
Regulatory Commission (CERC). In a press note published on 29 September 2021, the MOP mentioned “The proposed changes will
provide some flexibility to the players, additional avenues, rationalisation and also address the RECs validity period uncertainty
issues”.
Green Tariff Plan
India is currently working on a green tariff plan to help power distribution companies supply electricity generated from clean energy projects. Upon implementation, a DISCOM will be able to exclusively purchase green electricity and supply it at the weighted average tariff of green energy that the consumer will pay. This may have positive implications for the C&I sector by providing a new method to procure RE.
35Insights to accelerate corporate renewable energy procurement

37 Infosys ESG 2030 report - https://www.infosys.com/content/dam/infosys-web/en/about/corporate-responsibility/esg-vision-2030/index.html Annual Report 2019-20 - https://www.infosys.com/investors/reports-filings/annual-report/annual/documents/infosys-ar-20.pdf Infosys Sustainability Report 2019-20 - https://www.infosys.com/sustainability/documents/infosys-sustainability-report-2019-20.pdf
Green Term Ahead Market (GTAM)
GTAM was formally launched on 1 September 2020 to provide an alternate avenue for buying and selling RE power at a competitive
price without entering any PPA for the fulfilment of RPO. It allows a corporate electricity consumer or a DISCOM to procure RE from
merchant RE developers or other DISCOMs which have surplus RE generation.
GTAM has four types of contracts, they are:
i. Intra-day contracts
ii. Day-ahead contingency contracts
iii. Daily contracts
iv. Weekly contracts
4.2 Indian case studies
a. IT/ITES - Infosys
Infosys has been accounting and disclosing its carbon emissions since 2008. In 2011, it pledged to become carbon neutral by 2020. 37This target was achieved despite the COVID-19 scenario. It was the first Indian company to join the RE100 list in 2015 . The company
now aims to reduce Scope 1 and 2 GHG emissions by 75% and Scope 3 by 30%, by 2030. Infosys has also participated in the Climate
Pledge, committing to meet the Paris Agreement 10 years early and be net carbon zero by 2040.
36Insights to accelerate corporate renewable energy procurement
Energy Efficiency
Renewable Energy
Sustainable Solutions
CarbonOffsets
Ÿ Energy efficiency infrastructure retrofits
Ÿ 34 green building projects covering 25 million sq. feet.
Ÿ in data centersImproved cooling
Result: 55% drop in monthly per capita energy consumption from 2008 to 2020
Ÿ capacity for captive use60 MW solar PV
Ÿ Pursue from third party green power purchaseproducers
Ÿ Committed to as RE100 100% RE procurementmember
Result: 44.3% RE electricity procurement in India
Ÿ Provides EHS solutions such as energy/asset efficiency and waste management for clients across multiple sectors
Ÿ Promotes new and efficient technologies - robotic solar panel cleaning and IoT implementation
Result: Reduction of climate footprint of clients
Ÿ long term rural Carbon Offset 8projects impacting UN 11 of 17SDGs
Ÿ Work areas are efficient cookstoves, biogas production and rural electrification
Ÿ 1 Mn + tCO e2 to be eliminated over project lifetimes
Result: 347,470 tCO e offset and 2
102,000 families impacted so far
Key takeaways
1 2 3
Key Initiatives to achieve milestones
Infrastructure retrofits and LEED certified green buildings keeps energy consumption low despite increases in scale
Focused on RE procurement and aiming for green power purchase from third party producers.
Utilized Carbon Offset projects in rural areas to meet multiple UN Sustainable Development Goals through a single initiative

38 Heritage Foods Annual Report 2020-2021: https://www.heritagefoods.in/uploads/investors/pdf/16254114888Heritage_Foods_AR_High.pdf Heritage Food CSR activities for FY 2021-2022: https://www.heritagefoods.in/static/images/pdf/CSR%20Activities%20for%20FY%202021-22.pdf
b. Consumer Goods (Food and Beverages) - Heritage Foods
Heritage Foods is a leading supplier of milk and dairy products in India and has operations across 11 states in the country. In addition to
its dairy business, the company has also established a foothold in the RE business vertical, with capacity for captive consumption as
well as sale of RE.
The company has showcased its commitment to RE adoption and other emission mitigating activities in several ways:
38Ÿ The company procured over 50% of its electricity mix in FY2019-20 through RE means. It has established a significant captive
installed capacity for its dairy plants, consisting of 4.09 MW of solar power and 6.3 MW of wind power. These captive wind and solar
power plants are located at 11 different plants and locations across facilities in Andhra Pradesh, Telangana, Maharashtra, and Tamil
Nadu. The company also commissioned two Biomass Fuel Fired Boilers (2 TPH and 4 TPH) for use at its facilities.
Ÿ Heritage Foods has also entered the RE business through supply of power and sale of Renewable Energy Certificates (RECs) to
supplement income from its primary dairy business. The RE vertical generated revenue worth INR 68.83 million in FY2020-21.
Ÿ The Company has designed technologies to enable resource efficient, sustainable manufacturing processes and prioritises energy
conservation measures through adoption of efficient equipment (Compressors/Conditioner systems, LED lighting) to minimise
energy consumption.
Ÿ The company also carries out periodic energy audits at its processing plants to identify areas where energy savings can be made. A
dedicated 'Energy Conservation Cell' focuses on energy management and close monitoring of energy consumption patterns across
all manufacturing sites. The company has also implemented ISO 50001 (Effective Energy Management System) to further reduce
energy wastage.
Ÿ The company develops green belts at its plant locations as part of its CSR activities to further mitigate emissions.
37Insights to accelerate corporate renewable energy procurement

39 IOCL Sustainability Report 2019-20 - https://iocl.com/IOCL-Sustainability-Report-2019-20.pdf IOCL Annual report 2019-20 - https://iocl.com/download/IndianOil-Annual-Report-2019-20.pdf https://economictimes.indiatimes.com/industry/energy/oil-gas/indian-oil-corporation-to-invest-rs-25000-cr-in-green- energy/articleshow/70744980.cms?utm_source=contentofinterest&utm_medium=text&utm_campaign=cppst
c. Energy and Natural Resources: Indian Oil Corporation Limited39Indian Oil has taken several steps to mitigate GHGs across its value chain and adopt RE .
38Insights to accelerate corporate renewable energy procurement
ExplorationandProduction
Ÿ VLCC/Suez Max transports for efficient shipping of imported crude oil
Ÿ for efficient transport14,670+ Km of pipelines
Result: Gas pipeline use mitigates 1.45 MMTCO2e annually as compared to rai
Transport
Ÿ to save energySteam recovery in boilers
Ÿ Promotion of renewable energy as an additional power source
Result: Energy Conservation projects mitigate 0.23 MMTCO2e
Processing
Ÿ Cleaner process fuels and low NOx emission burners in refineries
Ÿ Sulphur recovery units and Continuous Emissions Monitoring Systems (CEMS)
Result: Natural Gas usage in refineries mitigated 1.18 MMTCO2e in FY19-20
Refining
Ÿ 4.44% Ethanol blending in Petrol. Transition from fuel.BS-IV to BS-VI
Ÿ to reduce NOx emissions from vehiclesClearblue DEF
Ÿ LED lighting replacement and tree planting.
Result: LED lighting and tree planting to mitigate 0.07 MMTCO e annually2
Marketing
Ÿ 226 MW Renewable Energy Portfolio.
Ÿ 16,678 Fuel Retail outlets solarized with cumulative capacity of 92 MW.
Ÿ 54 Battery charge/swap facilities at retail outlets
Result: RE portfolio mitigated 0.32 MMTCO2e in 2019-20
RenewableEnergy
Ÿ MoUs with ONGC & OIL India to develop CCS based enhanced oil recovery.
Ÿ 295 LoIs for Compressed Biogas production as CNG alternative under SATAT scheme.
Ÿ 2G and 3G Ethanol fuel research and production and H-CNG demo plant for buses.
Result: Long term platform for alternative fuels and reduced emissions in place
Key takeaways
Must track and mitigate Scope 3 emissions in order to have a true picture of environmental impact.
1
Environmental benchmarking and increased digitization across the value chain are helping mitigate CHG emissions.
2
Although IOCL does not have a stated goal for Net Zero, it plans to invest in Rs. 25,000 croresvarious green energy projects.
3

41 Sustainability Report FY19: https://www.lafargeholcim.com/sustainability-reports KPMG in India ENRich 2020 Thought Leadership Paper- Decarbonising growth: Managing the transition
d. Banking - State Bank of India
As one of the largest financiers of RE, SBI has charted an ambitious carbon neutrality strategy with the intent to be a carbon neutral 40organisation by 2030 .
By 2025, it wants to decrease Scope 2 emissions by at least 40% from baseline GHG emissions quantified in FY 2019-20.
Some of SBI’s major initiatives in their net zero journey are as follows:
Green Funding
Ÿ SBI has issued USD 800 million worth of green bonds since FY18-19 to fund projects in the RE, solar power and sustainable
mobility space, achieving an estimated annual mitigation of over 1.6 MtCO2e from green bond funded projects.
Ÿ The SBI green fund is utilised for undertaking activities such as tree plantation and environmental awareness.
Core Business
Ÿ Installed rooftop solar panels across several offices and aims to power around 10,000 ATMs with solar power.
Ÿ IPM+, a power management software for data centres and computer systems was installed in 2016, saving 10.84 GWh of
electricity in the reporting period. The software has led to the mitigation of 10,833 tonnes of GHGs in 2019-20.
Ÿ Over 20,000 physical servers migrated to a centralised location in a secured virtual environment, reducing energy
requirements.
Assets
Ÿ SBI currently has a captive RE capacity of 35 Mwp.
Ÿ Green car, e-rickshaw and green home loans are provided at attractive terms Sanctioned INR 1,744 crore for 241 projects.
Ÿ Utilised USD 30 million for a solar energy plant under KfW German Development Bank’s line of credit.
Ÿ Fully utilised European Investment Bank’s USD 214.3 million to support 493 MW worth of utility scale greenfield solar
projects.
The key actions driving SBI’s decarbonisation are:
Ÿ Use of captive RE and energy efficiency measures to reduce operational emissions.
Ÿ Utilising international line of credit to support RE projects.
Ÿ Use of green funds and green bonds to support various RE and sustainability measures.
4.3 International case studies
e. Cement: Holcim Group
The Holcim Group is a Swiss multinational manufacturer of building materials. Their products include cement, aggregates, ready mix
concrete and other materials such as precast concrete, asphalt, mortar etc. The Holcim Group is the first global building materials 41company to sign the UNGC’s “Business Ambition for 1.5°C” initiative, with a 2030 SBTi-verified action plan . It has made a number of
commitments on its way to net zero, including-
Ÿ Accelerate the use of low-carbon and carbon-neutral products
Ÿ Recycle 100m tons of waste and by-products for energy and raw materials
Ÿ Scale up use of calcined clay and develop novel cements with new binders
Ÿ Double waste-derived fuels in production from 2018 to reach 37%
Ÿ Reach 475 kg net CO per ton of cementitious material 2
Ÿ Operate its first net zero CO cement production facility2
It is targeting a 17.5% reduction in Scope 1 emissions per ton of cement and 65% reduction in Scope 2 emissions per ton of cement by
2030. It is also targeting a 50% reduction in Scope 3 emissions by 2050.
39Insights to accelerate corporate renewable energy procurement

42 https://www.unilever.com/news/press-releases/2020/ https://www.unilever.com/sustainable-living/reducing-environmental-impact/ Unilever sustainability performance data: 1995 – 2019
f. Consumer Goods: Unilever
Unilever aims to have zero carbon emissions from its own operations, and to halve the GHG footprint of its products across the value
chain, by 2030. Additionally, Unilever has committed to achieve net zero emissions from all its products by 2039, from the sourcing of 42the materials it uses, up to the point of sale of its products in the store .
40Insights to accelerate corporate renewable energy procurement
Carbon capture
Green products
Plants of tomorrow
Renewable energy
Clinker factor andalternative fuels
1990 2050 and beyond
2000 2010 2020 2030 2040
Reduced clinker content to 68%, the primary source of Scope 1 emissions; increased use of waste-derived fuels to 37%
Piloting more than twenty CCUS projects in Europe and North America that could save approximately 4 million tons of CO per year.2
Dedicating over 50% of R&D resources to low-carbon solutions including production of sustainable cement and green concretes.
Use of innovations like artificial intelligence, machine learning, recycling of materials and production of green cement to create connected, smart, carbon neutral and energy efficient sites.
Accelerate purchase of renewable power and generation of renewable energy on own land through solar and wind plants.
Lafarge’s building blocks to Net Zero
Ÿ Investment in such as green cement and net zero cement plantsnew technologyŸ Shift to such as cleaner raw materials. CCUS, RE powersustainable operationsŸ through transport networks, vehicles, routes and loadsOptimization of supply chain
Investing in advanced video
conferencing facilities to reduce
travel for its employees
By 2020, halve the energy purchased per
occupant for the ofces in its top 21
countries versus 2010
Reduce GHG emissions by 15%
by 2012 by reformulating its
products
Accelerate roll-out of freezer cabinets
that use climate-friendly natural
(hydrocarbon) refrigerants.
By 2020, bring CO2 emissions from
its global logistics network at par or
below 2010 levels
By 2020, bring CO2 emissions from
energy from its factories at par or
below 2008 levels
Key targets as a part of Unilever Sustainable Living Plan
Reduce GHG
emissions from
washing clothes
Reduce GHG
emissions from
transport Reduce GHG
emissions from
refrigeration
Reduce energy
consumption in
ofces Reduce
employee
travel
Become carbon
positive in
manufacturing
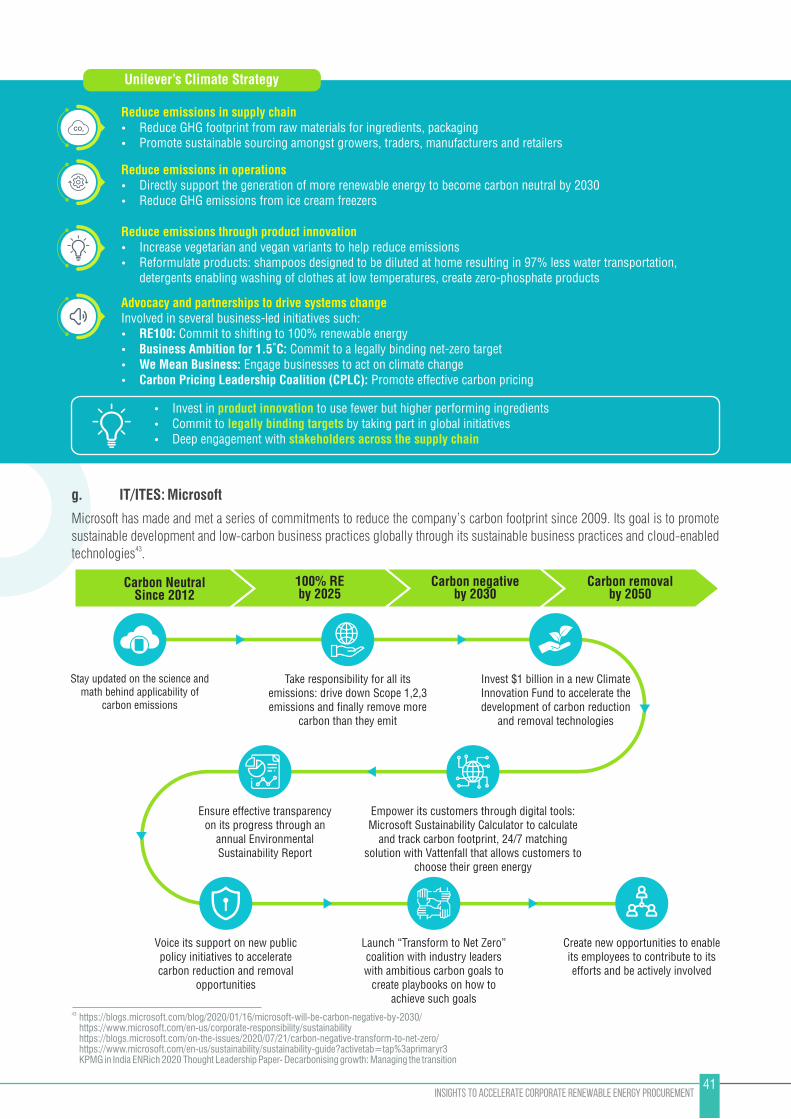
43 https://blogs.microsoft.com/blog/2020/01/16/microsoft-will-be-carbon-negative-by-2030/ https://www.microsoft.com/en-us/corporate-responsibility/sustainability https://blogs.microsoft.com/on-the-issues/2020/07/21/carbon-negative-transform-to-net-zero/ https://www.microsoft.com/en-us/sustainability/sustainability-guide?activetab=tap%3aprimaryr3 KPMG in India ENRich 2020 Thought Leadership Paper- Decarbonising growth: Managing the transition
g. IT/ITES: Microsoft
Microsoft has made and met a series of commitments to reduce the company’s carbon footprint since 2009. Its goal is to promote
sustainable development and low-carbon business practices globally through its sustainable business practices and cloud-enabled 43technologies .
41Insights to accelerate corporate renewable energy procurement
Stay updated on the science and math behind applicability of
carbon emissions
Take responsibility for all its emissions: drive down Scope 1,2,3 emissions and finally remove more
carbon than they emit
Invest $1 billion in a new Climate Innovation Fund to accelerate the development of carbon reduction
and removal technologies
Ensure effective transparency on its progress through an
annual Environmental Sustainability Report
Empower its customers through digital tools: Microsoft Sustainability Calculator to calculate
and track carbon footprint, 24/7 matching solution with Vattenfall that allows customers to
choose their green energy
Voice its support on new public policy initiatives to accelerate carbon reduction and removal
opportunities
Launch “Transform to Net Zero” coalition with industry leaders with ambitious carbon goals to
create playbooks on how to achieve such goals
Create new opportunities to enable its employees to contribute to its efforts and be actively involved
Carbon NeutralSince 2012
100% REby 2025
Carbon negativeby 2030
Carbon removalby 2050
Reduce emissions in supply chainŸ Reduce GHG footprint from raw materials for ingredients, packagingŸ Promote sustainable sourcing amongst growers, traders, manufacturers and retailers
Reduce emissions in operationsŸ Directly support the generation of more renewable energy to become carbon neutral by 2030Ÿ Reduce GHG emissions from ice cream freezers
Reduce emissions through product innovationŸ Increase vegetarian and vegan variants to help reduce emissionsŸ Reformulate products: shampoos designed to be diluted at home resulting in 97% less water transportation,
detergents enabling washing of clothes at low temperatures, create zero-phosphate products
Advocacy and partnerships to drive systems changeInvolved in several business-led initiatives such:Ÿ RE100: Commit to shifting to 100% renewable energyŸ Business Ambition for 1.5�C: Commit to a legally binding net-zero target Ÿ We Mean Business: Engage businesses to act on climate changeŸ Carbon Pricing Leadership Coalition (CPLC): Promote effective carbon pricing
Ÿ Invest in to use fewer but higher performing ingredientsproduct innovation Ÿ Commit to by taking part in global initiativeslegally binding targets Ÿ Deep engagement with stakeholders across the supply chain
Unilever’s Climate Strategy

44 Pfizer Inc. CDP Climate Change Questionnaire 2020 Wednesday, August 26, 2020 Pfizer Annual Report 2019 https://www.pfizer.com/purpose/workplace-responsibility/green-journey/climate-change
Microsoft is taking continuous initiatives to reduce its Scope 1,2 and 3 emissions, such as:
Impact by Numbers (FY 19)
Ÿ Reduced company emissions by 15.6 m tons of CO eq.2
Ÿ Directly purchased more than 1.9 GW of wind and solar energy
Ÿ Every year recycled nearly 10 m kgsof consumer e-waste.
h. Pharmaceuticals: Pfizer
Pfizer, one of the world’s largest pharmaceutical companies, has set ambitious commitments to reduce the company’s carbon footprint
since 2000 and has already achieved more than 60% reduction in GHG emissions (2012 baseline) through more than 4000 energy
conservation projects. Apart from 1.5 MMT CO eq of scope 1 and 2 emissions. Apart from focusing on their own operations, Pfizer is 244equally invested in engaging with suppliers across the value chain to reduce scope 3 emissions .
42Insights to accelerate corporate renewable energy procurement
2017
82%
41%
2019
88%
49%
Ÿ Deploy RE projects
Ÿ Energy efficiency through green buildings and energy management in sites
Ÿ Increase awareness and engagement
Ÿ Green chemistry principles in R&D and manufacturing
Ÿ Reuse, recover, recycle solvents
Ÿ Capitalize waste minimization
2012 2019
2
1.5
GHG emissions(MMT CO eq)2
2012 2019
121.56
102.4
Waste disposed(thousand metric tonnes)
Ÿ Reuse treated wastewater in cooling towers and landscape irrigation
Ÿ Condensate recapture
Ÿ Optimize Boiler O&M
2012 2019
17.82
15.05
Water withdrawal(million cu. m)
Reduce GHG emission by
20%
Reduce waste disposal by
15%
90% suppliers to set reduction
goals
Reduce water use reduction
by 5%
Ÿ Identified leading suppliers who account for largest scope 3 emissions
Ÿ Supplier selection dependent on EHS management skills
Ÿ Support to supplier for reviews on routine basis & trainings
Key Supplier initiatives
%age managing their environmental impacts%age with reduction goals for GHG, waste disposal and water withdrawal
Moved over 2,000 applications to the cloud
Levied internal carbon tax to drive carbon reduction
Largest purchaser of RE in the U.S.
Enabled a remote workforce and reduced
air travel
Built sustainable data centers and devices
Reduced carbon associated with
construction material
Electrify global campus operations vehicle fleet
Incentivize suppliers to reduce with emissions
Invest in carbon monitoring and modeling
projects
Ÿ Drive employee engagement to make them actively contribute to the firm’s target
Ÿ Create digital tools to enable employees and customers to work remotely
Ÿ Invest in own assets such as infrastructure, offices, devices and vehicles to reduce emissions

45 Heineken N.V. Annual Report 2019 https://www.theheinekencompany.com/newsroom/heineken-announces-drop-the-c-programme2 https://www.theheinekencompany.com/our-sustainability-story/our-strategy-and-achievements/drop-c-reducing-our-co2-emissions https://www.theheinekencompany.com/our-sustainability-story/our-progress/case-studies/reducing-our-carbon-footprint-through-driver
Targets set
Ÿ > 50% raw materials from sustainable sourcesŸ >70% power through renewable energy by 2030 for
brewing and productionŸ Reduce CO emission from distribution by 20%2
Ÿ Reduce CO emission from cooling by 50%2
Ÿ Reduce emission from packaging and tackling plasticŸ Aiming for zero waste
i. Consumer goods (Food and Beverages): Heineken
Heineken N.V. is one of the largest brewers by volume in the world
owning over 165 breweries in more than 70 countries. Heineken’s
strategy of ‘Drop the C’ to ‘brew a better world’ aims to reduce their
emissions significantly and systematically across the entire value 45chain by 2030 .
43Insights to accelerate corporate renewable energy procurement
37% 19% (2018)13%
(2010)50%
Agriculture Production Logistics
Processing Packaging
Cooling
Farm level pilot projects in sourcing countries – sustainable farming methods, high yield seeds with fewer inputs
Deployment of renewable energy projects for production - Biomass Boilers, solar rooftop, energy efficient building, RE PPA
Optimising routes, supporting suppliers to adopt low carbon technologies and investing in innovative solutions - Piloting fuel efficient and electric trucks, biofuel use
Deep engagement with suppliers to drive energy efficiency and renewable energy projects
Partnering with suppliers and implementing sustainable packaging strategy - 5R’s (Renew, Reduce, Recycle, Reuse, Rethink) - Light weight bottles, reducing glass use, reduce single use bottles, remove plastic usage
Drive innovation; energy efficient assets - 100% of purchased fridges are energy efficient
from sustainable sources
energy from RE
In 2019, 109 of 165 production sites in scope, spanning 60+ countries, sent Zero Waste to landfill
Ÿ treated as core part of businessSustainability Ÿ across value chainIncremental innovationsŸ Deep focus on deployment for captive useRE projects
Setting of near term and long-term targets
Key strategies of Pfizer's Green Journey
Prioritizing funding for environmental initiatives, even with a low hurdle rate
(~USD 20 Mn annual investment)
Standardization of processes across all sites to increase
operational efciency
Deep engagement with stakeholders across the
value chain
Regular assessment and deployment of new
technologies
Close monitoring of initiatives to assess
effectiveness
Internal awards and recognition to drive
initiatives
Connect
Investment
Technology
ProcessesTarget
Monitoring
Recognition

05
The corporate renewable energy survey has provided key insights and trends into how corporates across various C&I subsectors
approach the opportunities, benefits, and challenges that RE adoption brings. The survey analysis can be categorised as per five major
broad themes are detailed below.
CONCLUSION
Renewable Energy Goals: Of the surveyed corporates, 66% had long term renewable energy targets with intermediate
goals, indicating their intent to procure RE. These targets and the end goal of RE adoption are driven by various factors such as
green image, financial considerations and RPO requirements, which differ across subsectors. However, only 4% of the
corporates had supply chain/vendor level RE targets, and only 23% of the respondents had specified a dedicated RE budget,
implying that corporates need to back their RE intentions with their financial plans.
Renewable Energy Procurement Assessment: 96% of the corporates surveyed already have some degree of renewable
energy in their current electricity mix. 81% of the corporates have shown a positive trend in RE capacity over the last
three years. These are promising signs that RE procurement has been on the rise and has been playing an important role in the
electricity procurement by corporates.
Renewable Energy Culture and Ethos: Corporates have begun to recognise that RE adoption requires an attitude shift, and
hence 74% of the corporates have dedicated RE teams and 67% have dedicated RE Champions to help drive
organisational culture in the correct direction. There is also an opportunity to increase female participation in RE teams within
corporates as only 36% of the companies have female members in their RE teams.
Readiness for Renewable Energy Procurement: Corporates can signal their intent to adopt RE by earmarking a separate
budget for RE procurement and utilising the same efficiently. This is currently missing across most subsectors, with only 23% of
corporates having dedicated RE budgets. Corporates need to come forth voluntarily with dedicated budgets for RE
procurement if RE adoption is to happen seriously amongst Indian corporates.
Renewable Energy Deployment Status and Business Models Utilised: 80% of the surveyed corporates are utilising
onsite RE power plants with 82% using offsite plants. A little over half (61%) of the corporates are utilising both methods to meet
their procurement needs. This combined method of RE deployment and the wide variety of business models adopted shows that
corporates are being flexible in how they procure RE. This flexibility can allow them to meet sectoral and location specific
challenges for RE adoption.
Innovations and Key Challenges: A number of innovative RE technologies such as biomass power, EVs and storage
solutions are already in use, showing that corporates are willing to take some risks and utilise non-standard solutions to
meet their energy needs. However, a number of challenges to RE adoption across policy, financial and administrative areas
remain and must be addressed to increase the ease with which adoption can take place.
Overall, the corporate RE adoption landscape as seen in the sample survey appears positive. Commercial and industrial consumers can
play a pivotal role in helping India achieve its RE targets, but this would require better awareness and data availability to enable them to
make better decisions. Lack of information on the various actions that are being taken by corporate peers as well as industry
leaders reduces the pace of RE procurement. This survey has also brought attention to the gap in information available on RE
adoption by the C&I sector in India.
44Insights to accelerate corporate renewable energy procurement

06
The corporate renewable energy sample survey has provided insights into various aspects of C&I RE procurement. This survey, based
on the identified key parameters for corporate RE procurement, may become the basis for the development of a Corporate Renewable
Energy Adoption Index (CREAI). While some similar indices exist which capture the contribution of various corporates and states to
meet India’s NDC targets, there is no dedicated index for renewable energy adoption by corporates in India.
The Corporate Renewable Energy Adoption Index may be developed through the use of data collection through primary and secondary
research of NSE 1000 companies. The data collected can utilise the same parameters that have been considered for this sample survey.
The proposed index can then rank corporates through scoring on the various relevant parameters to obtain an overall rating of their RE
adoption capabilities.
NEXT STEPS
45Insights to accelerate corporate renewable energy procurement

LIST OF CORPORATES WHOPARTICIPATED IN
THE SURVEY FOR PRIMARYDATA COLLECTION
Annexure A:
S.No. Company Name
ACC Limited
Atul Limited
Bharat Petroleum Corporation Limited
Bosch Limited
Breech Oral Care Private Limited
Clariant Chemicals (India) Limited
Colgate Palmolive (India) Limited
Cummins India Limited
Dalmia Cement Bharat Limited
Dr. Reddy's Laboratories Limited
ELGi Equipments Limited
Godrej Consumer Products Limited
Grindwell Norton Limited
Havells India Limited
HCL Technologies Limited
Heidelberg Cement India Limited
HeidelbergCement India Limited
Heritage Foods Limited
Jindal Stainless (Hisar) Limited
JK Cement Limited
1
2
3
4
5
6
7
8
9
10
11
12
13
14
15
16
17
18
19
20
46Insights to accelerate corporate renewable energy procurement

S.No. Company Name
JK Tyre & Industries Limited
Kajaria Tiles Private Limited
Kirloskar Oil Engines Limited
KSB Limited
Lemon Tree Hotels Limited
Mahindra Logistics Limited
Marico Limited
Minda Industries Limited
Orient Cement Limited
Raymond UCO Denim Private Limited Yavatmal
Schneider Electric India Private Limited
Shakti Pumps (India) Ltd
Syngene International Limited
Tata Consultancy Services Limited
Tata Power Company Limited
Toyota Kirloskar Motor
TVS Srichakra Limited
UltraTech Cement Limited
Vesuvius India Limited
WABCO India Limited
Wipro Limited
Zentiva Private Limited
21
22
23
24
25
26
27
28
29
30
31
32
33
34
35
36
37
38
39
40
41
42
47Insights to accelerate corporate renewable energy procurement

Udit MathurEnergy AdvisorForeign, Commonwealth & Development OfficeEmail: [email protected]
Anish DeProgramme DirectorPower Sector Reforms ProgrammeEmail: [email protected]
DisclaimerThis material has been funded by UK aid from the UK government; however the views expressed do not necessarily reflect the UK government's official policies. The details provided herein are only indicative and subject to approval of the concerned authorities. Images have been sourced from istock/freepik/pexels.
www.linkedin.com/company/psr-indiawww.twitter.com/psr_india www.psrindia.com