Distributed solar renewable generation: Option contracts with renewable energy credit uncertainty
Upload
khangminh22Category
view
1download
0
Technical Assistance Consultant’s Report
This consultant’s report does not necessarily reflect the views of ADB or the Government concerned, and ADB and the Government cannot be held liable for its contents. (For project preparatory technical assistance: All the views expressed herein may not be incorporated into the proposed project’s design.
Project Number: 44016 October 2012
People’s Republic of China: Renewable Energy Development in Qinghai (Co-financed by the Multi–Donor Clean Energy Fund under the Clean Energy Financing Partnership Facility)

RENEWABLE ENERGY DEVELOPMENT IN QINGHAI
PEOPLE’S REPUBLIC OF CHINA
PROJECT NUMBER : TA-7643 (PRC)
FINAL REPORT
Prepared for
Asian Development Bank
By
NEWJEC Inc.
October, 2012

Renewable Energy Development Final Report Contents
- i -
TABLE OF CONTENTS
EXECUTIVE SUMMARY
CHAPTER 1 INTRODUCTION 1.1 Background ............................................................................................................. 1 - 1
1.2 TOR ......................................................................................................................... 1 - 2
1.3 Objectives ................................................................................................................ 1 - 2
1.4 Structure of the Final Report ................................................................................... 1 - 2
CHAPTER 2 ADVANCED TECHNOLOGY FOR GRID-CONNECTED SOLAR PV SYSTEMS 2.1 International Best Practices for Grid Protection Design and System Configuration
for a 10MW-class Grid-connected Solar PV System .............................................. 2 - 1 2.1.1 Principle of Demand and Supply Power Balance ......................................... 2 - 1 2.1.2 Influence of Rapid Expansion of Solar PV Systems and Countermeasures
by PV Power Stations ................................................................................... 2 - 1 2.1.3 Practices in RE-Advanced Countries ............................................................ 2 - 2 2.1.4 Locally Appropriate Countermeasures for Grid Protection in Golmud,
Qinghai Province ........................................................................................... 2 - 5
2.2 Power Conditioner ................................................................................................... 2 - 8 2.2.1 Internationally Advanced Technologies for Power Conditioner
of the 10 MW Class Grid-connected Solar PV System................................. 2 - 8 2.2.2 Locally Appropriate Power Conditioner Technology ..................................... 2 - 11
2.3 MCM ........................................................................................................................ 2 - 18 2.3.1 Latest International Technologies for Master Control and Monitoring
for Grid-connected Solar PV System ............................................................ 2 - 18 2.3.2 Locally Appropriate MCM System in terms of Reliability, Efficiency
and Cost ........................................................................................................ 2 - 25
2.4 Assessment Tools ................................................................................................... 2 - 38 2.4.1 Assessment of Insolation and Estimation of Power Generation ................... 2 - 38 2.4.2 Prediction of Power Generation .................................................................... 2 - 47 2.4.3 Reflection Light from Solar PV System ......................................................... 2 - 52
2.5 Assessment Tools for Solar PV System Economics ............................................... 2 - 54 2.5.1 Outline of RETScreen ................................................................................... 2 - 54 2.5.2 Input of Project Information ........................................................................... 2 - 54 2.5.3 Specifying Energy Model .............................................................................. 2 - 55 2.5.4 Input of Cost Data ......................................................................................... 2 - 56 2.5.5 Financial Analysis ......................................................................................... 2 - 57 2.5.6 Risk Analysis ................................................................................................. 2 - 59
CHAPTER 3 CAPACITY DEVELOPMENT IN THE PLANNING, DESIGN, CONSTRUCTION, AND O&M OF A GRID-CONNECTED SOLAR PV SYSTEM
3.1 Performance Assessment of the Selected Grid-connected Solar PV System ........ 3 - 1 3.1.1 300kW Grid-connected Solar PV System in Xining, Qinghai ....................... 3 - 1 3.1.2 Sakai Mega Solar PV Power Station ............................................................ 3 - 5

Renewable Energy Development Contents Final Report
- ii -
3.2 Capacity Assessment of the Implementation Agency ............................................. 3 - 12 3.2.1 Solar Radiation and Other Resources........................................................... 3 - 12 3.2.2 Evaluation of the Site Analysis ...................................................................... 3 - 13 3.2.3 Design Ability of 10MW Solar PV System ..................................................... 3 - 15 3.2.4 Construction .................................................................................................. 3 - 19 3.2.5 Operation and Maintenance .......................................................................... 3 - 19
3.3 Technical Guidance and a Capacity Enhancement Module .................................... 3 - 19 3.3.1 System Configuration .................................................................................... 3 - 19
3.4 Solar PV Supply Chain ............................................................................................ 3 - 30 3.4.1 Overall Comments ......................................................................................... 3 - 30 3.4.2 Outline of the Ingot Factory ........................................................................... 3 - 31 3.4.3 Manufacturing Process of Solar Cells ........................................................... 3 - 31 3.4.4 Instructions and Suggestions ........................................................................ 3 - 33 3.4.5 Assessment of Capacity and Quality and Provision
of Technical Guidance ................................................................................... 3 - 34
CHAPTER 4 REVIEW OF GRID CONNECTIVITY OF MW CLASS SOLAR PV SYSTEM 4.1 Design of MW Class Solar PV System .................................................................... 4 - 1
4.1.1 System Configuration Design of Substation .................................................. 4 - 1 4.1.2 System Components ..................................................................................... 4 - 3 4.1.3 Inverter .......................................................................................................... 4 - 5 4.1.4 Control ........................................................................................................... 4 - 6 4.1.5 Cost Effectiveness and Efficiency ................................................................. 4 - 9 4.1.6 Proposition of Other Improvement in Design ................................................ 4 - 10
4.2 Power Grid in Golmud Area ..................................................................................... 4 - 12 4.2.1 Overview of Power System in Golmud Area ................................................. 4 - 12 4.2.2 Demand Forecast and Power Balance (Supply-Demand Balance)
in Golmud Area .............................................................................................. 4 - 16 4.2.3 Grid Code ...................................................................................................... 4 - 23 4.2.4 The PV Power Plants .................................................................................... 4 - 23 4.2.5 Detail of Golmud East 110kV Combiner Station ........................................... 4 - 25 4.2.6 FRT Function ................................................................................................. 4 - 27
CHAPTER 5 ECONOMICS OF SOLAR PV POWER PLANT 5.1 Financial Assessment and Financial Options .......................................................... 5 - 1
5.1.1 Financial Analysis .......................................................................................... 5 - 1 5.1.2 Risk Assessment and Lifecycle Analysis ...................................................... 5 - 8 5.1.3 Consideration on Tariff and Financial Needs of Pilot Project ........................ 5 - 12
5.2 Policy Implication ..................................................................................................... 5 - 13
CHAPER 6 POLICY NOTE, KEY FINDINGS, AND RECOMMENDATION 6.1 Outlook of Solar Energy Development in the PRC and the Qinghai Province ........ 6 - 1
6.2 Key Findings and Recommendations for Sustainable Solar PV Development in Qinghai Province .................................................................................................. 6 - 4 6.2.1 Enhancing Grid Connectivity: Stable Solar PV Power Evacuation ............... 6 - 4 6.2.2 Upgrading Grid Code which requires FRT Function: Improving Grid Stability
and Safety ..................................................................................................... 6 - 5

Renewable Energy Development Final Report Contents
- iii -
6.2.3 Solar PV based Micro-grid System Development: Another Pathway for Large-scale Solar PV Application ................................................................. 6 - 6
6.2.4 Stringent Technical Specification Standard and Institutional Strengthening: Enhancing Quality Control of Solar PV Power Plant .................................... 6 - 6
6.2.5 Strengthening Metrological Observatory System: Mitigating Risks in Solar Resource Forecasting ................................................................................... 6 - 7
6.2.6 Credit Enhancement: Improving the Project Financial Performance ............ 6 - 8
APPENDICES Appendix 1 Terms of Reference
Appendix 2 National Development Plan and Provincial Development Plan
Appendix 3 Capacity Development Training
Appendix 4 Presentation Materials Appendix 4-1 : Seminar Appendix 4-2 : Interim Workshop Appendix 4-3 : Final Workshop
Appendix 5 Seminar and Workshops
Appendix 6 Registered Companies and Applied Projects of Qinghai 930 Projects in Haixi Prefecture

Renewable Energy Development List of Tables, Figures and Abbreviations Final Report
- iv -
LIST OF TABLES
Table 2.1-1 Impacts on the Grid and Measures ....................................................................... 2 - 5 Table 2.2-1 Limit on Harmonic Voltage in Public Grid .............................................................. 2 - 13 Table 2.2-2 Permissible Value of Harmonic from PV Power Station ....................................... 2 - 13 Table 2.2-3 Voltage Fluctuation and Flicker of Inverters .......................................................... 2 - 14 Table 2.2-4 Short Time Flicker Pst and Long Time Flicker Plt ................................................. 2 - 14 Table 2.2-5 Required Operation Time for Large or Medium Size PV Power Station
in case of Grid Frequency Anomaly ...................................................................... 2 - 16 Table 2.4-1 Insolation Estimation by Three Different Methods ................................................ 2 - 45 Table 2.4-2 Difference of Estimated Insolation in proportion to QBE’s Estimation .................. 2 - 46 Table 2.4-3 Estimation of Power Generation using Fish-eye Lens (Tilt angle 35°) ................. 2 - 46 Table 2.4-4 Estimation of Power Generation using Fish-eye Lens (Tilt angle 25°) ................. 2 - 47 Table 2.4-5 Prediction Method of Insolation and Quick Demand/Supply Control Method
in Japan ................................................................................................................. 2 - 49 Table 2.4-6 Monthly Probability of Fine Sky ............................................................................. 2 - 52 Table 2.4-7 Monthly Probability of Cloudy Sky ......................................................................... 2 - 52 Table 2.4-8 Monthly Probability of Rainy Sky ........................................................................... 2 - 52 Table 3.1-1 Verification Items ................................................................................................... 3 - 6 Table 3.1-2 Type of Solar Panel and Occupied Area ............................................................... 3 - 6 Table 3.2-1 Insolation at Golmud Site ...................................................................................... 3 - 12 Table 3.2-2 Insolation at Golmud Site (Conversion Megajoule to kWh) .................................. 3 - 13 Table 3.3-1 Test Wave and Current ......................................................................................... 3 - 23 Table 4.1-1 Calculation Result of Short Circuit Level in 2020 for Relevant Substation
Buses .................................................................................................................... 4 - 2 Table 4.1-2 Specifications of DC Convergence Control Box ................................................... 4 - 3 Table 4.1-3 Specifications of Unit Step-up Transformer .......................................................... 4 - 4 Table 4.1-4 Specifications of Circuit Breaker ........................................................................... 4 - 4 Table 4.1-5 Main Electrical Equipment List .............................................................................. 4 - 5 Table 4.1-6 Specifications of Grid-connected Inverter ............................................................. 4 - 5 Table 4.1-7 Maximum Power of Direct Current (DC) Side ....................................................... 4 - 10 Table 4.1-8 Rated Output ......................................................................................................... 4 - 10 Table 4.2-1 Qinghai Grid .......................................................................................................... 4 - 15 Table 4.2-2 Demand Forecast in Golmud Area ........................................................................ 4 - 17 Table 4.2-3 Power Balance in Golmud Area (Summer) ........................................................... 4 - 18 Table 4.2-4 Power Balance in Golmud Area (Winter) .............................................................. 4 - 19 Table 4.2-5 Solar Power Station ............................................................................................... 4 - 22 Table 4.2-6 Grid Owner, Construction and Operation .............................................................. 4 - 24 Table 5.1-1 Cost Estimate of 10 MW Pilot Project ................................................................... 5 - 3 Table 5.1-2 Calculation of WACC ............................................................................................. 5 - 4 Table 5.1-3 Calculation of FIRR ............................................................................................... 5 - 5 Table 5.1-4 Improvement of FIRR/e by Longer Project Life and Additional Income
from CER ............................................................................................................... 5 - 6 Table 5.1-5 FIRR/e with Soft Loan ........................................................................................... 5 - 7 Table 5.1-6 Effect of Smaller Investment Cost on FIRR/e ....................................................... 5 - 7

Renewable Energy Development Final Report List of Tables, Figures and Abbreviations
- v -
Table 5.1-7 Sensitivity Analysis of FIRR/e with Soft Loan Introduced ..................................... 5 - 9 Table 5.1-8 Sensitivity Analysis of FIRR/e with Soft Loan, tariff at CNY 1.0 ........................... 5 - 10 Table 5.1-9 Reduction of CO2 Emission .................................................................................. 5 - 11 Table 6.3-1 Program of the Seminar ........................................................................................ 6 - 8 Table 6.3-2 Program of the Interim Workshop ......................................................................... 6 - 9 Table 6.3-3 Program of Final Workshop .................................................................................. 6 - 11
LIST OF FIGURES Fig. 2.1-1 Description of Grid Stability (taking marching by persons as an example) .......... 2 - 7 Fig. 2.2-1 Required Capability on the FRT Function ............................................................ 2 - 16 Fig. 2.3-1 Demonstrative Research in Ota City, Japan ........................................................ 2 - 20 Fig. 2.3-2 Large-scale PV Power Plant located in Wakkanai City ........................................ 2 - 20 Fig. 2.3-3 Results of Output Fluctuations Preventive Control Testing
(Moving Average Target Control) ......................................................................... 2 - 21 Fig. 2.3-4 Large-scale PV Power Plant located in Wakkanai City ........................................ 2 - 22 Fig. 2.3-5 Demonstrative Microgrid in Los Alamos County ................................................... 2 - 23 Fig. 2.3-6 Residence Area in Los Alamos County ................................................................ 2 - 24 Fig. 2.3-7 Configuration of Microgrid in Albuquerque ........................................................... 2 - 25 Fig. 2.4-1 Southern View from 10MW Pilot Project Site ....................................................... 2 - 39 Fig. 2.4-2 Shadow made by Obstacles of the Surroundings ................................................ 2 - 40 Fig. 2.4-3 Illustrative Picture of Sunlight Orbit Projection ..................................................... 2 - 40 Fig. 2.4-4 Direct Sunlight and Diffused Sunlight ................................................................... 2 - 41 Fig. 2.4-5 Single-lens Reflex Camera and Fish-eye Lens .................................................... 2 - 41 Fig. 2.4-6 View of Fish-eye Lens with Tilt Angle 35° ............................................................ 2 - 42 Fig. 2.4-7 Visible Fields using Fish-eye Lens ....................................................................... 2 - 43 Fig. 2.4-8 Solar Orbit ............................................................................................................. 2 - 43 Fig. 2.4-9 Solar Orbit on Fish-eye Lens ................................................................................ 2 - 44 Fig. 2.4-10 Solar Orbit on Fish-eye Lens at the 10MW Pilot PV System Site ........................ 2 - 45 Fig. 2.4-11 Prediction of Power Generation ............................................................................ 2 - 48 Fig. 2.4-12 Macro Prediction System ...................................................................................... 2 - 50 Fig. 2.4-13 Graphics by the Weather Satellite ........................................................................ 2 - 50 Fig. 2.4-14 Sun Orbit and Movement of Cloud ....................................................................... 2 - 51 Fig. 2.4-15 Method of Getting Reflection Sunlight .................................................................. 2 - 53 Fig. 2.4-16 Reflection Light at 10MW PV Site (Tilt Angle 35°) ................................................ 2 - 53 Fig. 2.5-1 Input of Project Information ................................................................................... 2 - 55 Fig. 2.5-2 Site Data by NASA (downloaded automatically) .................................................. 2 - 55 Fig. 2.5-3 Input of Energy Model ........................................................................................... 2 - 56 Fig. 2.5-4 Input of Cost Data ................................................................................................. 2 - 57 Fig. 2.5-5 Input of Financial Parameters ............................................................................... 2 - 57 Fig. 2.5-6 Input of Annual Income ......................................................................................... 2 - 57 Fig. 2.5-7 Costs & Income Summary .................................................................................... 2 - 58 Fig. 2.5-8 Financial Viability .................................................................................................. 2 - 58 Fig. 2.5-9 Yearly Cash Flow .................................................................................................. 2 - 58 Fig. 2.5-10 Cumulative Cash Flow Graph ............................................................................... 2 - 59

Renewable Energy Development List of Tables, Figures and Abbreviations Final Report
- vi -
Fig. 2.5-11 Sensitivity Analysis ................................................................................................ 2 - 59 Fig. 2.5-12 Impact Analysis (After-tax IRR-equity) .................................................................. 2 - 60 Fig. 2.5-13 Distribution of Key Indicators (After-tax IRR-equity) ............................................. 2 - 61 Fig. 3.1-1 300kW Grid-connected Solar PV System ............................................................. 3 - 2 Fig. 3.1-2 Configuration of Test Circuit for Real Facility Tests .............................................. 3 - 3 Fig. 3.1-3 Results of Tests of EDLC Effect with PV Output forcedly varied
at 1-Hz Frequency (With EDLC not controlled) ..................................................... 3 - 3 Fig. 3.1-4 Results of Tests of EDLC Effect with PV Output forcedly varied
at 1-Hz Frequency (With EDLC controlled) ........................................................... 3 - 4 Fig. 3.1-5 Cost and Efficiency of Solar Panel ........................................................................ 3 - 7 Fig. 3.1-6 Evaluated Value for the Solar PV System Cost .................................................... 3 - 7 Fig. 3.1-7 Countermeasure of Unequal Settlement ............................................................... 3 - 8 Fig. 3.1-8 Installation Condition ............................................................................................. 3 - 8 Fig. 3.1-9 Measured Solar Radiation ..................................................................................... 3 - 9 Fig. 3.1-10 Prediction of PV Output ......................................................................................... 3 - 10 Fig. 3.1-11 Outline of Sakai Mega Solar Power Station .......................................................... 3 - 10 Fig. 3.1-12 Location of Sakai Mega Solar PV Power Station .................................................. 3 - 11 Fig. 3.2-1 10MW PV Sight View ............................................................................................ 3 - 13 Fig. 3.2-2 Main Electric Circuit ............................................................................................... 3 - 15 Fig. 3.2-3 Islanding Phenomena and Possibility of Occurrence ............................................ 3 - 16 Fig. 3.2-4 Configuration of a PV System in 10MW Pilot Project ........................................... 3 - 17 Fig. 3.2-5 Electricity for Station Use at a Pilot 10MW Solar PV System ............................... 3 - 18 Fig. 3.3-1 Overloading Capacity of Transformer ................................................................... 3 - 22 Fig. 3.3-2 Test Wave ............................................................................................................. 3 - 23 Fig. 3.3-3 LPZ Partition .......................................................................................................... 3 - 23 Fig. 3.3-4 Propagation of the impact of Lightning .................................................................. 3 - 24 Fig. 3.3-5 SPD Protecting Lightning Impact to Propagate .................................................... 3 - 24 Fig. 3.3-6 Wiring between Modules ....................................................................................... 3 - 25 Fig. 3.3-7 Solid Angle of Sky by Different Tilt Angle ............................................................. 3 - 26 Fig. 3.3-8 Relation between Diffusion Sunlight and Solid Angle of Cloud ............................ 3 - 26 Fig. 3.3-9 Method of Set Sensor............................................................................................ 3 - 27 Fig. 3.3-10 Direct Fault Current Flow ...................................................................................... 3 - 27 Fig. 3.3-11 Safety Stock .......................................................................................................... 3 - 28 Fig. 3.3-12 I-V Approximation Curve ....................................................................................... 3 - 29 Fig. 3.3-13 Power of Serial Connection ................................................................................... 3 - 30 Fig. 3.4-1 Manufacturing Process of Polycrystalline / Monocrystalline Cells ........................ 3 - 31 Fig. 3.4-2 Photos of Monocrystalline / Polycrystalline Ingots ................................................ 3 - 32 Fig. 3.4-3 Flowchart of Cleaning............................................................................................ 3 - 34 Fig. 3.4-4 Method of Cleaning Material ................................................................................. 3 - 35 Fig. 3.4-5 60 kg Materials previously filled in a Melting Pot .................................................. 3 - 36 Fig. 3.4-6 Using a Vacuum Cleaner ...................................................................................... 3 - 36 Fig. 3.4-7 A Carbon Pot is bundled by a Band ...................................................................... 3 - 37 Fig. 3.4-8 Yield Improvement ................................................................................................ 3 - 37 Fig. 3.4-9 Prevention of Crack ............................................................................................... 3 - 38 Fig. 3.4-10 Confirmation of the Contamination ........................................................................ 3 - 38 Fig. 3.4-11 Confirmation of the Contamination ........................................................................ 3 - 39 Fig. 3.4-12 Issues of Pot Scrap and Deformation ................................................................... 3 - 39

Renewable Energy Development Final Report List of Tables, Figures and Abbreviations
- vii -
Fig. 3.4-13 Condition of a Melting Pot before Deformation (Image) ....................................... 3 - 40 Fig. 3.4-14 Condition of a Melting Pot after Deformation ........................................................ 3 - 40 Fig. 3.4-15 Condition of a Melting Pot after Deformation ........................................................ 3 - 41 Fig. 3.4-16 Structure of Pots ................................................................................................... 3 - 41 Fig. 3.4-17 Steps of Usage of Carbon Pot .............................................................................. 3 - 42 Fig. 3.4-18 Measurement of Carbon Pot Parts, 1 to 10 .......................................................... 3 - 42 Fig. 3.4-19 Method I Confirmation .......................................................................................... 3 - 42 Fig. 3.4-20 Method II Confirmation ......................................................................................... 3 - 43 Fig. 3.4-21 Material in the Pull-up Lab .................................................................................... 3 - 44 Fig. 3.4-22 Type (I), (II) Materials ........................................................................................... 3 - 44 Fig. 3.4-23 .............................................................................................................................. 3 - 45 Fig. 3.4-24 Cristal pulling up Process ..................................................................................... 3 - 45
Fig. 4.1-1 Schematic Diagram of Arrangement of 110kV Outgoing Line Bays in 330kV Golmud Substation ................................................................................ 4 - 2
Fig. 4.1-2 Control System Structure ...................................................................................... 4 - 7 Fig. 4.2-1 Power Balance in Golmud Area ............................................................................ 4 - 17 Fig. 4.2-2 Golmud Location ................................................................................................... 4 - 20 Fig. 4.2-3 PV Power Plant Map ............................................................................................. 4 - 21 Fig. 4.2-4 Owner, Construction and Operation Scheme ....................................................... 4 - 24 Fig. 4.2-5 Requirement on FRT Function (before March, 2017) ........................................... 4 - 28 Fig. 4.2-6 Requirement on FRT Function in Japan (after April, 2017) .................................. 4 - 30 Fig. 4.2-7 Requirement on FRT Function (PRC) .................................................................. 4 - 32 Fig. 4.2-8 Block Diagram of Control System ......................................................................... 4 - 33 Fig. 4.2-9 Result of Factory Test of the FRT Function .......................................................... 4 - 33
Fig. 6.1-1 Solar PV Diffusion Scenario till 2020 .................................................................... 6 - 2 Fig. 6.1-2 Forecasted Solar PV Cost of Energy and Grid Parity ........................................... 6 - 3 Fig. 6.2-1 Proposed FRT Requirement ................................................................................. 6 - 5

Renewable Energy Development List of Tables, Figures and Abbreviations Final Report
- viii -
CURRENCY EQUIVALENTS
Currency Unit – Chinese Yuan (CNY) $1.00 = CNY6.77 (As of November 2011) €1.00 = CNY 8.17 (Average of January 2102 to June 2012)
ABBREVIATIONS
ADB Asia Development Bank AGC Active generation control AVC Active voltage control BIPV Building-integrated photovoltaics CB Circuit breaker CDM Clean Development Mechanism CER Certified Emission Reductions DSP Digital signal processor ECMWF Europe Center of Meteorological Weather Forecast EDLC Electric Double-Layered Capacitors EMS Energy Management System F/S Feasibility Study FIRR Financial Internal Rate of Return FIRR/e Equity Internal Rate of Return FIT Feed-In Tariff FRT Fault Ride Through GHG Greenhouse Gas GPS Global Positioning System GRDP Gross Regional Domestic Product HEMS Home Energy Management System HVDC High Voltage Direct Current IEC International electrical commission IGBT Insulated-gate bipolar transistor IRMOSFET IRMOS Field-effect transistor IRR Internal Rate of Return LCD Liquid crystal display MCM Master Control and Monitoring METI Ministry of Economy, Trade and Industry, Japan MMI Man-Machine interface MPPT Maximum Power Point Tracking NAS Natrium Sulfur NASA National Aeronautics and Space Administration NDRC National Development and Reform Commission NEIQ New Energy Institute of Qinghai NPV Net Present Value O&M Operation and Maintenance PNM Public Service of New Mexico PPA Power Purchase Agreement PPP Public Private Partnership

Renewable Energy Development Final Report List of Tables, Figures and Abbreviations
- ix -
PRC The People’s Republic of China PV Photovoltaic QBE Qinghai Brightness Engineering RE Renewable Energy SCR Silicon-controlled rectifier SOE Sequence of Event SPC Special company management SPD Surge Protect Device(s) TA Technical Assistance TOR Terms of Reference TSO Transmission System Operator VAT Value Added Tax WACC Weighted average cost of capital
USD United States Dollar CNY Chinese Yuan CO2 Carbon Dioxide t-CO2 a tonne of Carbon Dioxide GW Gigawatt(=1,000 MW = 1,000,000 kW) GWh Gigawatt – hour(=1,000 MWh = 1,000,000 kWh) Hz Hertz V Volt kV Kilo Volt kVA Kilo Volt Ampere kW kilowatt kWh Kilowatt - hour km Kilometer km2 square kilometer m meter mm millimeter s second MW Megawatt (= 1,000 kW) MWh Megawatt – hour (= 1,000 kWh)

Renewable Energy Development Final Report Executive Summary
EXECUTIVE SUMMARY

Renewable Energy Development Final Report Executive Summary
- 1 -
EXECUTIVE SUMMARY I. INTRODUCTION
1. The main objective of the TA is to enhance the capacity of grid-connected solar photovoltaic (PV)system development in Qinghai Province by (i) introducing the advanced technology to lower barriers for development, (ii) enhancing local capacity in planning, design, construction, supply chain and Operation and maintenance (O&M) (iii) improving the design of 10 MW class grid-connected solar PV pilot plant and (iv) improving provincial government policy for solar PV development in Qinghai Province.
2. The Peoples’ Republic of China (PRC) is the world largest solar cell producer with
huge production capacity which shares around 50% of 29.5 giga Watt (GW) solar cell productions in the world as of 2011. Although the worldwide solar cell market is estimated to be shrunk from 2012 and onward due to aggressive cut feed-in-tariff (FIT) incentive in European countries, domestic huge production capacity in PRC will continuously contribute to domestic solar PV market expansion. With ambitious long term target in expanding solar energy install capacity, and feed-in-tariff for solar energy project announced in 2011, the PRC has witnessed a significant growth in domestic solar PV market where solar PV installed capacity has surged by 2.9 GW from 0.9 GW in 2010. During the Twelfth Five Year plan (2011 – 2015), the PRC has newly set a target for solar PV install capacity by 20 GW.
3. Qinghai Province, which is located in the northeastern part of the Qinghai-Xizang
plateau in the western part of PRC, has abundant mineral and natural resources, while its Gross Regional Domestic Product (GRDP) is the second lowest of all the provinces in PRC. To enhance economic development by utilizing these resources in environmentally sustainable manner, the Qinghai Provincial Government has set a development agenda for promoting solar energy, which would supply clean electricity to the load centers in the eastern part of PRC, and for developing a solar PV-related supply-chain industry, utilizing more than 20GW of solar power resource potential with around 2,000 kWh/day of solar irradiation resources and the rich silica deposits in the Qinghai Province.
4. The installed capacity of grid-connected solar PV systems in Qinghai Province
reached to 1,010MW by the end of 2011 which was 47.2% of total solar PV installed capacity in PRC, and 1,000 MW additional solar PV power plants will be in operation by the end of 2012. Qinghai provincial government plans to concentrate the grid-connected solar energy power plants in Qaidam basin in Haixi prefecture to add

Renewable Energy Development Executive Summary Final Report
- 2 -
solar energy install capacity by 1,000 MW per year during the twelfth five-year plan (2011-2015) period. By 2015, the planned solar energy install capacity will be 4,000 MW comprised of 3,500 MW of the grid-connected solar PV power plants, 300 MW of the concentrating solar thermal power plants, and 200 MW of distributed solar PV systems. The solar energy install capacity is planned to be expanded by 10,000 MW in 2020 and by 20,000 MW by 2030. By the end of 2011, solar PV installed capacity in Qinghai province reached 1,010 MW which was 47.2% of total solar PV installed capacity in PRC, and 1,000 MW additional solar PV power plants will be in operation by the end of 2012. Qinghai province has been and will continuously be a major driver for solar energy development in PRC. But challenges lie ahead, in view of grid-connectivity and stability, electricity yield risk, financial viability, system quality assurance, and development planning, to realize sizable grid connected MW and GW class solar PV investment as planned in twelfth five-year plan (2011-2015) and onward till 2020.
5. The TA report is composed of (i) advanced technology for grid-connected solar PV
systems; (2) capacity development in planning, design, construction, and operation and maintenance (O&M) of the grid-connected solar PV system; (3) grid connectivity of MW class solar PV system; (4) economics of solar PV power plant; and (5) policy note, key findings and recommendations.
II. ADVANCED TECHNOLOGY FOR GRID-CONNECTED SOLAR PV SYSTEMS
6. Grid Stability and Safety In a power system consisting of many power stations and related network equipment
spreading over wide area, it is essential to control the supply-demand balance and to optimally operate the power system to maintain the stability of power system overall. Penetration of sizable grid-connected solar PV system into the grid in PRC and Qinghai province is raising concern over supply–demand balance control and grid stability. Such supply and demand imbalance due to rapid diffusion of solar PV could cause (i) excessive power supply generation; (ii) frequent heavy and unexpected power flow causing critical grid condition with small margin in N-1 criteria; and (iii) emergency trip at inter-connection lines. The output fluctuation of grid-connected solar PV has to be supplemented by the power plants having peak and middle peak output supply capacity. But, in parallel with enhancing transmission capacity, solar PV power plant in PRC is also required to enhance its own system for grid stability and safety function such as introducing Fault Ride Through (FRT) function, increasing capacity of power conditioner, and improving Mater Control and Monitoring (MCM) system.

Renewable Energy Development Final Report Executive Summary
- 3 -
7. High Voltage Direct Current (HVDC) Transmission HVDC has high speed control system as well as large transmission capacity, and
power flow through the HVDC system can be changed and modulated using the high speed control in timely manner. The power transmission capability and modulation function are useful for recovery from the fluctuation of grid voltage and frequency and disturbance in grid. HVDC as part of smart grid technology will be essential for power system having high grid-connected solar PV and wind power plants.
8. FRT, Power Conditioner, and MCM FRT function as a part of inverter system should be required for MW-class grid
connected solar PV system to keep grid stability. FRT function improves durability of solar PV system during sudden accident in the grid to ensure continuous operation to avoid grid collapse. Power conditioner having maximum power point tracking (MPPT) and two-stage conversion structure with phase separation in inversion section are essential functions for grid connected solar PV system, and enlarging power conditioner capacity up to 500 kW will also be necessary as install capacity of grid connected solar PV increases. MCM having supervisory system software with solar PV power station, substation, and control center monitoring function is another essential function for grid connected solar PV system. MCM with the secondary battery system such as sodium-sulfur (NaS) battery is a cutting-edge technology enabling grid-connected solar PV output stable.
9. Good Practice of Grid-Connected Solar PV System in Qinghai 300 kW Grid-connected solar PV system in Xining, Qinghai province consists of i)
300-kW solar PV system (PV system), ii) 75-kW output power stabilization system (EDLC: Electric Double Layer Capacitor), iii) 300-kW bi-directional inverter (converter) for grid connection, iv) Inverter to supply power to loads, v) Monitor and control system, and vi) Low-voltage incoming panel, as shown below.

Renewable Energy Development Executive Summary Final Report
- 4 -
This pilot grid-connected solar PV power plant testified technology useful in
stabilizing power output to be distributed to the grid system even for a short period of time when solar PV having output fluctuation due to intermittent nature of solar irradiation is increasingly interconnected to the grid system. As conclusion, when solar PV systems are interconnected to the power grid system, the EDLC system can efficiently compensate output of solar PV system and stabilize the grid system.
III. TECHNICAL GUIDANCE FOR PILOT 10 MW GRID-CONNECTED SOLAR PV SYSTEM
10. Solar Resource Assessment, Tilt Angle, and Electricity Yield Fish-eye Lens devise estimating solar irradiation resources is cost efficient approach
to validate both satellite imaginary and site specific based solar irradiation estimates. Solar irradiation forecasting derived from Fish-eye Lens devises has shown good agreement with satellite imaginary and site measurement data. On a basis of solar resource validation, forecasted electricity yield is estimated at 16,822 MWh/year (tilt angle of PV modules at 35°) and 17,083 MWh/year (at 25°), which suggests that tilt
Solar radiation meters/Temperature
indicator
i) PV power generation system (PV system)
300-kW PV
Power collector
Power collector
CHP 400kVA
Electric double-layered capacitor, 1 kWh
Load
High-voltage distribution line Plant control device (including
stabilization control)
Monitor and measuring device
CNV 300kVA
: Power line : Control signal line : Measuring signal line
INV 10kVA
CHP 75kW
DC bus bar (DC unit)
iii) Bidirectional inverter (converter) for grid connection
ii) Output power stabilizing system (EDLC system)
iv) Inverter to supply power to load
v) Monitor and control system
vi) Low-voltage incoming panel

Renewable Energy Development Final Report Executive Summary
- 5 -
angle lower than 35° of longitude and up to 25° are desirable tilt angle capturing the direct and diffused sun-light, thereby maximizing output generation of solar PV system. Due to output fluctuation of solar PV system, precise prediction of solar irradiation is one of the core issues in terms of electricity yield projection and electricity supply and demand control in grid system. Since several kinds of estimation period (every 30 minute, 1 minute to several minutes interval, one-second level interval) are required for appropriate supply and demand control, weather forecast methods for these periods have to be developed.
11. Inverter Capacity Total loss before the inverter is 10%. Then the capacity of inverter is enough to have
90% of the capacity of the solar PV panels. Specifications of inverters may be offered unilaterally by the inverter manufacturer; still it is important here that the user engineers understand each item of the specifications. User’s understanding of the specifications of inverter should be at the same level as manufacturer’s engineers. There are several steps to be taken to improve the knowledge of user engineers: (i) installation conditions based on the specifications; (ii) necessary function for the solar PV system at the site; (iii) specifications of the equipment in detail and specified value gained from testing method; and (iv) appropriate combination of devices, to achieve high efficiency, low cost, long life time, and easy maintenance.
12. Transformer Capacity The life of the transformer is estimated based on the maximum utilization factor and
the load factor and the life measurement method of transformer is established at present. Considering a capacity factor of the solar PV system in the night period is zero, less than 90 % of inverter capacity is good enough for the capacity of the transformer. Generally speaking, a transformer has overloading capacity. It depends on the insulator used in transformer, the load factor and ambient temperature. Load factor of a transformer used for a grid-connected PV system will be less than 0.3. It may be worth considering to downsize transformer capacity which is smaller than solar PV installed capacity, though there is a need to investigate how much the maximum power is, how many hours the continuous operation is, and how often appear in appropriate period. On a basis of these considerations, a transformer with smaller capacity may be introduced to PV system. Using smaller-capacity transformer will reduce, not only installation cost, but also transformer's electric loss.

Renewable Energy Development Executive Summary Final Report
- 6 -
13. Lightning Protection 10 MW Pilot Project has been designed to be installed with SPD (Surge Protective
Device) in each joint box. This is an agreeable design in order to prevent PV arrays from lightning hazards. Some array which was hit by lightning would spread the impact to other arrays. It might happen to flash over between frame and photovoltaic cell of PV arrays. Surge will be passed on to other PV arrays. To avoid damage by lightning, SPD is effective. Function of SPD is to equalize potential between equipment and the ground, which prevent the occurrence of flash over.
14. Reactive Power Absorption For alterative current circuit, there are two kinds of power supply. One is effective
power and the other is reactive power. The PV system of 10MW Pilot Project will supply only effective power, but transmission line needs reactive power because there is line inductance and capacitance to the ground in transmission line. For this reason, it is very appropriate to install SVC (Static Var Compensator) in the substation to compensate the lack of reactive power. For 10MW Pilot case, a SVC should be located at the transmission line's end.
15. Wiring between Modules Wiring is vibrating and rubbing against PV frame because wiring was not firmly fixed.
This condition damages the insolation of wiring. Therefore, wiring needs some more length for setting to absorb vibration and to avoid rubbing against PV frame as below.
SPD

Renewable Energy Development Final Report Executive Summary
- 7 -
16. Direct Current Protection Direct current (DC) circuit generally needs insulation to the ground and some
monitoring and protection might be necessary. When grounding accident happens in the DC circuit of a solar PV system, the DC fault current flows from PV array through transformer. DC fault current flows in the transformer as shown in Fig.3.3-10. In this case the transformer may experience insulation deterioration quickly by DC fault current which is dangerous for maintenance staffs. If someone touches the wiring of DC circuit and the wiring does not have enough insulation, electrical shock may be occurred. Even if the inverter does not have this function, it is possible to set this function outside the inverter, such as DC OVGR (Over Voltage Ground Relay).
17. Short Circuit Current Protection at Substation In the case of short-circuited failure, the fault current will flows from not only
transformer but also other transmission lines that are connected to PV system. Therefore, the capacity of circuit breaker should be designed to have enough endurance of those total current.
PV
PV
PV
PV
A
B
A : Short circuit current from transformer B : Short circuit current from PV system through other transmission
PV
Grounding
270kV/350V Transformer
DC fault current
Transless Inverter

Renewable Energy Development Executive Summary Final Report
- 8 -
18. Spare Parts Stocks for O&M Long term operation and maintenance requires more skill in handling complex
devices such as power conditioners. Generally, a power conditioner has several electronics boards inside and replacing such boards requires specific skills. If replacement of parts is conducted by manufacturer’s engineer, minimum 2 or 3 days have to be given before arrival of engineers at the site. It is desirable for the plant operator to obtain the special training in the guarantee period.
IV. GRID CONNECTIVITY OF MW CLASS SOLAR PV SYSTEM
19. Power Grid in Golmud, Qinghai Current 330 kV transmission capacity is no longer sufficient enough to
accommodate the mushrooming grid-connected solar PV systems. Construction of new substations and transmission lines were ongoing and further expansion being planned in the area. The grid will be reinforced and able to mitigate the impacts of huge solar PV stations connected after these constructions. Especially, 750kV transmission project and 400kV HVDC project should be in place to ensure the stability of grid conditions. In addition to the above, application of smart grid
technology are being studied in PRC. 110kV substation (Golmud East 110kV combiner station) has been constructed to consolidate and step-up (35/110kV) the power from six (6) PV power plants in Golmud solar park and to connect with the 110kV grid.
N
Exchange number / month
Delivery time : month
D
S= a × N × M S: number of spare parts in stock a: coefficient ( >1 ) At first "a" will be desirable 1.5 ~ 2.
Haixi Grid 110kV Lines or Substation
110 kV Substation
(110/35kV Transformer)
d. 110 kV Transmission lines
c. 110kV Substation
PV1 PV2 PV3 PV4 PV5 PV6
b. 35 kV Transmission lines
a. PV power plant
Six (6) PV power plant companies
Renewable Energy Development Final Report Executive Summary
- 9 -
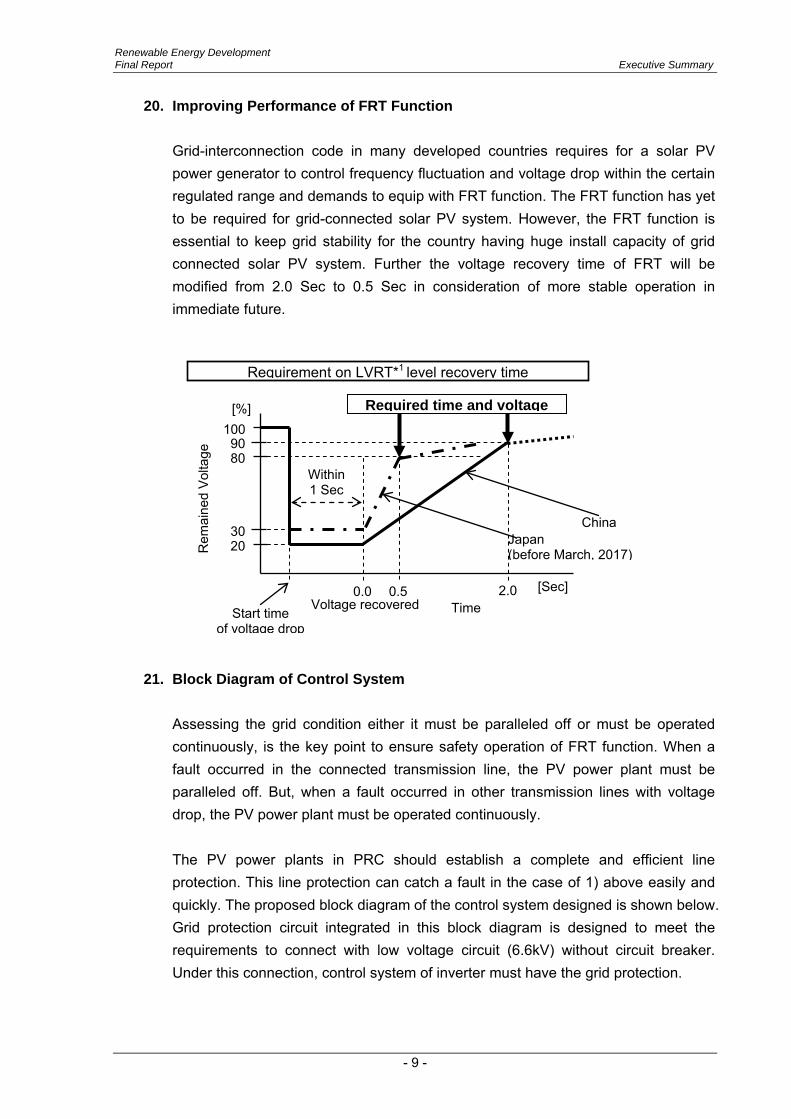
20. Improving Performance of FRT Function Grid-interconnection code in many developed countries requires for a solar PV
power generator to control frequency fluctuation and voltage drop within the certain regulated range and demands to equip with FRT function. The FRT function has yet to be required for grid-connected solar PV system. However, the FRT function is essential to keep grid stability for the country having huge install capacity of grid connected solar PV system. Further the voltage recovery time of FRT will be modified from 2.0 Sec to 0.5 Sec in consideration of more stable operation in immediate future.
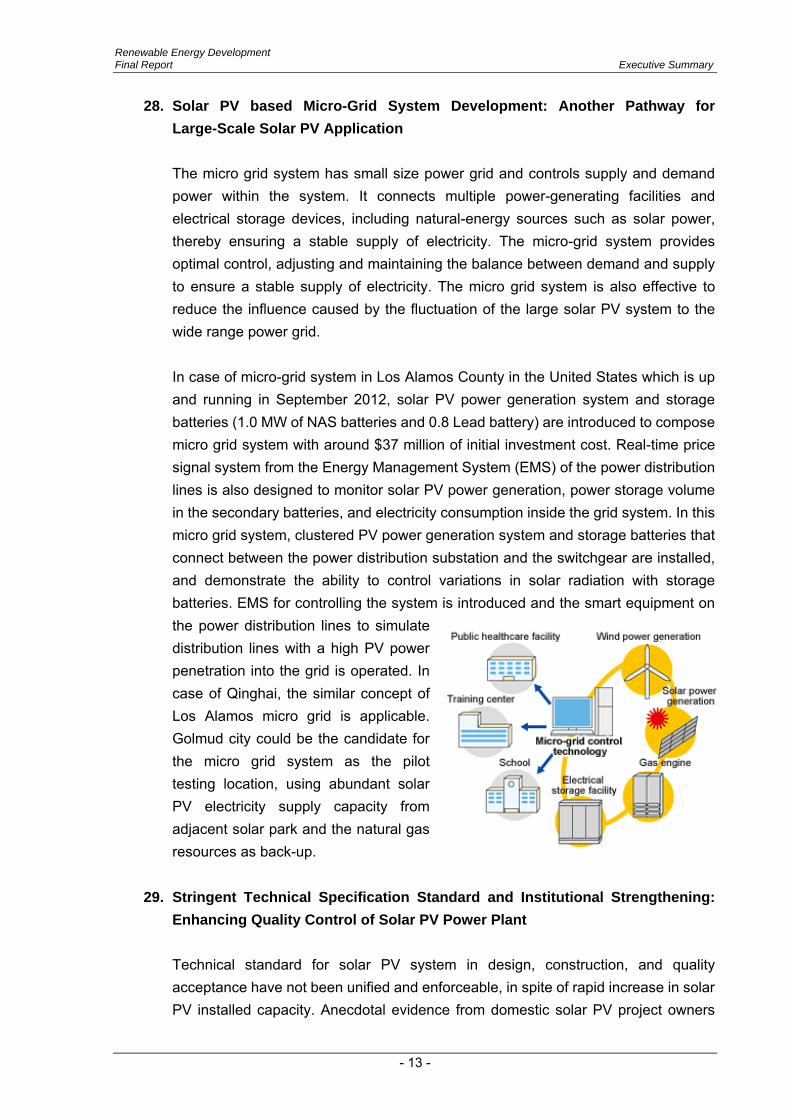
21. Block Diagram of Control System Assessing the grid condition either it must be paralleled off or must be operated
continuously, is the key point to ensure safety operation of FRT function. When a fault occurred in the connected transmission line, the PV power plant must be paralleled off. But, when a fault occurred in other transmission lines with voltage drop, the PV power plant must be operated continuously.
The PV power plants in PRC should establish a complete and efficient line
protection. This line protection can catch a fault in the case of 1) above easily and quickly. The proposed block diagram of the control system designed is shown below. Grid protection circuit integrated in this block diagram is designed to meet the requirements to connect with low voltage circuit (6.6kV) without circuit breaker. Under this connection, control system of inverter must have the grid protection.
[%]
Time
100
Within 1 Sec
[Sec]
Rem
aine
d Vo
ltage
0.0 Start time
of voltage drop
Requirement on LVRT*1 level recovery time
80
0.5 Voltage recovered
Required time and voltage
2.0
90
20 30 Japan
(before March, 2017)
China

Renewable Energy Development Executive Summary Final Report
- 10 -
*1 : Maximum Power Point Tracking
V. ECONOMICS OF 10 MW CLASS GRID-CONNECTED SOLAR PV POWER PLANT
22. Project Financial Rate of Return (FIRR/p) Projection of revenue and cost are laid out for coming twenty years to calculate
Financial Internal Rate of Return (FIRR) (see the table below). FIRR obtained was 4.95%, higher than the calculated WACC 3.42%. Financial Net Present Value (FNPV) calculated using the discount rate 3.42% was CNY 22 million. However, we should not take this result at face value. This analysis method was based on the assumption that the financial projection was valued in real terms: under the inflationary condition, the interest rate of bank loan was converted to real terms when WACC was calculated, and the operation and maintenance cost was considered to be constant in real terms.
23. Equity Internal Rate of Return (FIRR/e) Income and expense projections were made in nominal terms with loan repayment
schedule, and cash flow was calculated to obtain the return on equity. Only operation and maintenance cost was adjusted for the inflation. The resulting IRR (FIRR/e) should be compared with cost of equity in nominal terms. FIRR/e obtained was 4.46%. This is much lower than NDRC Guideline value of 11% or the alternative lower threshold 8%. The project is not likely to be financially attractive in project owner’s point of view.
Inverter
Grid PV-Array
Control for
MPPT*1
Drive Circuit for
Inverter
Detection Circuit of
Vout & Fout
Grid Protection Circuit
Control for
FRT Operation
Control for
Vout & Iout
Vout / Iout / Fout Vdc / Idc

Renewable Energy Development Final Report Executive Summary
- 11 -
24. Project Life Extension and Carbon Revenue To turn this condition around, we considered two ways to improve financial
performance of the Pilot Project. One was to extend the project life and loan tenor from twenty years to twenty five years. The other was to increase the income by acquiring the carbon credit, CER (Certified Emission Reductions). Operation of PV power plant is expected to realize a lifecycle reduction of CO2 emission at a rate of 840g-CO2 per kWh. The Designated National Authority (DNA) of CDM (Clean Development Mechanism) sets its basic price of CER at EUR 7.0 per t-CO2. This price is equivalent to CNY 0.05 per kWh.
25. Credit Enhancement With project life extension and CER revenue, low cost and long term credit will also
impact to improve FIRR/e. Given that financing plan comprised of 40% from equity investment, 10% from domestic bank loan, and 50% of international and/or domestic financial institution having low cost and long term credit (25 years tenor including 5 years grace and 2.60% loan interest) out of total project cost, FIRR/e under current CNY 1.0 per kWh of off-take tariff will be improved significantly but still vulnerable to certain adverse conditions.
Change FIRR/e
20 years 25 years w/o CER w/CER w/o CER w/CER
(a) Base case
5.18% 6.63%
7.59% 8.86%
(b) Capital cost overrun +10% 2.82% 4.24%
5.55% 6.78%
(c) Lower benefit -10% 2.58% 4.00%
5.34% 6.56%
(d) Faster deterioration -1.5% p.a. 3.79% 5.30%
6.31% 7.63%
(e) Delay of Construction 1 year 3.76% 4.88%
5.74% 6.78%
(f) CER income reduced -10% - 6.48%
- 8.73%
(g) Higher Interest Rate +10% 4.76% 6.21%
7.21% 8.48%
(h) All of conditions above
-1.93% -0.64%
0.00% 1.31%
VI. POLICY NOTE, KEY FINDINGS AND RECOMMENDATION
26. Enhancing Grid Connectivity: Stable Solar PV Power Evacuation Given that solar energy power plant will continuously be concentrated in Golmud,
Haixi prefecture, current 330 KV transmissions and substation capacity is no longer sufficient enough to evacuate power from mushrooming solar PV power plants with

Renewable Energy Development Executive Summary Final Report
- 12 -
more than 1,000 MW installed capacity in total which will be surged by 3,500 MW by 2015. Limited grid capacity for power evacuation risks stable power generation and project cash flow, which will be a significant bottleneck of sustainable investment in solar PV development in Qinghai. Thus, the presence of upgraded and expanded transmission lines and substations are essential to evacuate surging power supply from sizable solar PV plants. HVDC system which has high speed control system as well as large transmission capacity, and power flow through the HVDC system can be changed and modulated using the high speed control in timely manner. This power changing and modulation is useful for recovering from the fluctuation of grid voltage and frequency and disturbance of grid. 750 KV transmission line and 400kV HVDC system are currently under construction in Golmud should be in operation to keep pace with solar PV penetration into the grid in accordance with install capacity target in provincial twelfth five-year plan.
27. Upgrading Grid Code which Requires FRT Function: Improving Grid Stability
and Safety When a fault occurs in a grid, the voltage drops and frequency and power flow are
also disturbed. Under this disturbed grid condition, the conventional power plants connected to the grid try to keep sending power to the grid, which helps the grid recover from the disturbed condition. If it drops out of N-1 criteria, the interconnection lines must be disconnected or the whole grid will corrupts at worst. The solar PV systems do not have the modulation capability, and it stops operation (parallel off from grid) when voltage drop and/or disturbed frequency observed. This parallel off is an unexpected trip. When the total capacity of PV plants that have gone parallel off is too large, the gird collapses. To solve this problem there is a technology developed which is called Fault Ride Through (FRT) function. This function enables the inverters to keep operations when an instant voltage drop and/or disturbed frequency encountered. The FRT function is essential to avoid the unexpected trip and to keep the grid stability. Since the grid code to date does not require FRT function for solar PV power plants, upgrading the grid code in which FRT function is compulsory requirement for grid connection is urgently needed. On top of it, as grid-connected solar PV is expected to be sharply increasing even within a couple of years, low voltage recovery time (LVRT) is also suggested to be shortened from 2.0 Sec to 0.5 Sec in immediate future for enhancing grid safety.
Renewable Energy Development Final Report Executive Summary
- 13 -
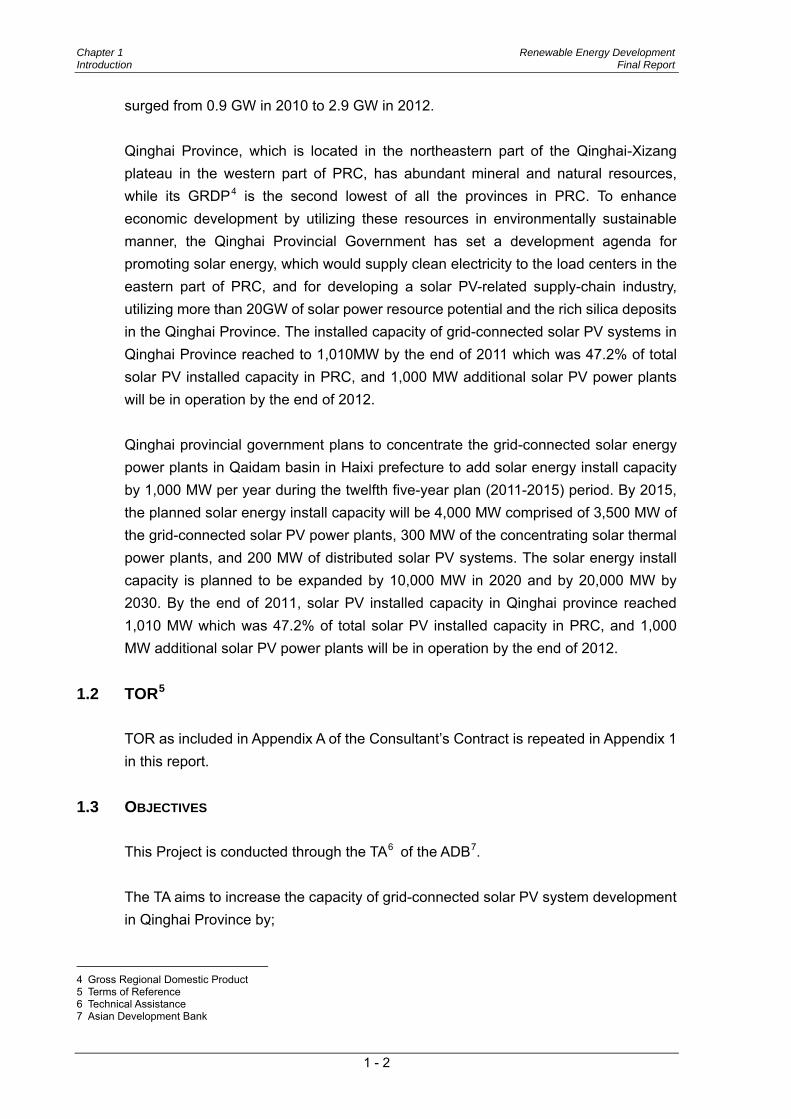
28. Solar PV based Micro-Grid System Development: Another Pathway for Large-Scale Solar PV Application
The micro grid system has small size power grid and controls supply and demand
power within the system. It connects multiple power-generating facilities and electrical storage devices, including natural-energy sources such as solar power, thereby ensuring a stable supply of electricity. The micro-grid system provides optimal control, adjusting and maintaining the balance between demand and supply to ensure a stable supply of electricity. The micro grid system is also effective to reduce the influence caused by the fluctuation of the large solar PV system to the wide range power grid.
In case of micro-grid system in Los Alamos County in the United States which is up
and running in September 2012, solar PV power generation system and storage batteries (1.0 MW of NAS batteries and 0.8 Lead battery) are introduced to compose micro grid system with around $37 million of initial investment cost. Real-time price signal system from the Energy Management System (EMS) of the power distribution lines is also designed to monitor solar PV power generation, power storage volume in the secondary batteries, and electricity consumption inside the grid system. In this micro grid system, clustered PV power generation system and storage batteries that connect between the power distribution substation and the switchgear are installed, and demonstrate the ability to control variations in solar radiation with storage batteries. EMS for controlling the system is introduced and the smart equipment on the power distribution lines to simulate distribution lines with a high PV power penetration into the grid is operated. In case of Qinghai, the similar concept of Los Alamos micro grid is applicable. Golmud city could be the candidate for the micro grid system as the pilot testing location, using abundant solar PV electricity supply capacity from adjacent solar park and the natural gas resources as back-up.
29. Stringent Technical Specification Standard and Institutional Strengthening:
Enhancing Quality Control of Solar PV Power Plant Technical standard for solar PV system in design, construction, and quality
acceptance have not been unified and enforceable, in spite of rapid increase in solar PV installed capacity. Anecdotal evidence from domestic solar PV project owners

Renewable Energy Development Executive Summary Final Report
- 14 -
has raised concern over unpredictable deterioration in solar cell conversion efficiency and inverter loss at DC-AC conversion, which will be resulted in a decline in overall plant efficiency over time. Such possible quality deterioration in grid connected solar PV performance will directly impact on electricity generation and economics of power plant as a whole. Qinghai provincial government authority has made necessary arrangement for grid connection and acceptance, water supply, access road, and peak regulation. But, due to the absence of stringent and enforceable technical specification standard, limited experience of developers, and very narrow construction timeframe, a possible decline in the plant output over the times needs to be anticipated without effective quality control measures.
Developing stringent and unified technical standard is suggested on a basis of
performance evaluation for grid-connected solar PV power plant in operation, and of international technical standard such as the one issued by Technical Committee 82 (TC 82) of the International Electrotechnical Commission (IEC) which covers wide range of solar PV system quality standard from design, construction, commissioning, operation and maintenance, and disposal.
In parallel, building technical guidance and supervision team under the provincial
government authority is also suggested to conduct technical evaluation of whole project cycle including construction and operation, and strengthen supervision and guidance for solar PV owners who fail to attain originally predicted annual power plant output. Moreover, solar energy projects using unique and variety of technology such as various type of concentrating solar thermal power (CSP), concentrating PV (CPV), micro-grid are expected to be emerging in immediate future. As less down 50 MW solar energy project is fallen in provincial government approving authority, continuous capacity enhancement of such the provincial technical team and the local design institute will also be essential to assure quality and performance of solar energy projects in Qinghai.
30. Strengthening Metrological Observatory System: Mitigating Risks in Solar
Resource Forecasting Reliable solar irradiation data is essential to predict electricity yield throughout more
than 20 years of solar PV project life. Project site selection and electricity yield forecasting are always based on historical solar irradiation data and changes in weather patterns from year to year, and long term data are desirable for determining a representative annual data set. Currently, solar irradiation forecasting uses the approach (i) comparing locally measured ground data (at site and at metrological station less than 10 km from the site) to the satellite-derived data for the same time interval, and (ii) correcting any bias in the satellite data to generate the improved

Renewable Energy Development Final Report Executive Summary
- 15 -
solar irradiation data set. In Qinghai, only 3 out of 54 meteorological observatory stations in operation have solar irradiation measurement function. But, in such a case, the solar energy developer is likely to confront a lack of reliable solar irradiation and related weather data sets due to limited number of metrological stations near by the potential site, and short and discontinuous period of times of data sets. Ground measurement data at the site over 12 months would not have good fit with satellite-derived data in general due to short period of data accumulation and measurement error. Relaying upon satellite-derived data is likely to cause more than 20% of high uncertainty in solar irradiation forecasting, which will be resulted in the reduced electricity yield and deteriorated financial performance of the project. Unreliable solar irradiation forecasting will also disturb stable grid operation accordingly.
Considering the provincial government has set 20,000 MW of solar energy install
capacity by 2030 and has planned to concentrate solar energy power plant in Golmud, enhancing metrological observatory system in Qinghai by (i) increasing number of metrological observatory stations (one station in each 10 km mesh is desirable), and (ii) accumulating continuous time series solar irradiation and related weather data set will be a great help to gain developer’s and transmission operator’s confidence in irradiation resource and electricity yield forecasting for sustainable solar PV development in Golmud.
31. Credit Enhancement: Improving the Project Financial Performance Financial assessment for the pilot 10 MW solar PV power plant indicates that
financial rate of return (FIRR) of 4.95% at base case scenario, which is marginally higher than 3.42% of weighted average cost of capital (WACC). Setting appropriate tariff level taking consideration into latest static investment cost trend and leveraged cost of energy (LCOE) will be essential for sustainable solar energy development. But, if credit enhancement support will be in place, the project could become financially viable even with CNY 1.0 per kWh of off-take tariff level.
One approach found effective is to extend loan tenor and project life from 20 to 25
years. Longer loan tenor and project life will not only improve the financial performance of projects, but also contribute to the reduction of carbon dioxide emission for most of carbon dioxide emission from PV power generation comes from production and installation processes of the equipment. Another effective and important approach is an introduction of soft loan in funding plan. For capital intensive, expensive PV projects it is quite important to have such funds having low cost and long term tenor terms. Given that (i) extension of loan tenor and project life from 20 to 25 years, and (ii) 2.6% of interest rate with 25 years tenor (including 5

Renewable Energy Development Executive Summary Final Report
- 16 -
years grace period) are considered, the FIRR/e improves 7.59% from 2.01% in the original case. If certified emission right (CER) is considered, the project IRR further improves 8.86%. Providing that all credit enhancement supports are accommodated (2.5% interest of low cost and 25 years of long term loan with CER revenue), sensitivity analysis shows that the FIRR/e would decrease to (i) 6.78% if there were a capital cost overrun 10%; (ii)
6.56% if revenue decreased by 10%; (iii) 7.63% if deterioration accelerated by -1.5%, (iv) 6.78% if there were 1-year delay in construction; (v) 8.73% if CER price declined by 10%; and (vi) 8.48% if interest rate hiked by 10%. Credit enhancement support will greatly improve the project financial performance.
Provincial government is encouraged to collaborate with domestic and international
financial institutions having low cost and long term credit product for supplying credit enhancement assistance to continuous but large scale solar PV development in Qinghai. But, the project financial performance will be vulnerable if couple of combined adverse scenario occurs, provincial government is also expected to supply risk mitigation support in power evacuation, grid stability and safety, quality control, and solar irradiation forecasting as suggested in previous paragraphs, so that the several risks assumed in adverse scenario can be mitigated.

Renewable Energy Development Chapter 1 Final Report Introduction
CHAPTER 1
INTRODUCTION

Renewable Energy Development Chapter 1 Final Report Introduction
1 - 1
CHAPTER 1 INTRODUCTION 1.1 BACKGROUND
Large-scale grid-connected PV1 power station is an important form of PV power generation. Since the beginning of the 21st century, many grid-connected PV power stations of MW class have been built in various countries over the world, plans to construct 100MW class and even GW class PV power stations are now ready to come out soon, and PRC2
has also worked out many programs to construct MW class grid-connected PV power stations. Large-scale grid-connected PV power stations have become one of the important development orientations for PV power generation in the world today.
In February, 2005, the Renewable Energy Law was enacted in PRC. The Law provides a feed-in tariff for some renewable technologies, and specifies grid-feed as requirements and standard procedures, and establishes incentives and supervisory measures for promoting renewable energy development. In 2007, NDRC3
issued the Medium and Long-Term Development Plan for Renewable Energy in PRC, which aimed to increase the share of renewable energy to 10% by 2010, and to 15% by 2020. Besides, in November 2009, the State Council of PRC announced to reduce carbon dioxide emissions per unit of gross domestic product by 40% to 45% by 2020 compared to 2005 level.
Increasing the share of renewable energy to achieve the targeted energy mix by 2020 will also reduce carbon dioxide emissions. The share of renewable energy of the total primary energy mix has increased steadily, from 7% in 2005 to 9% in 2009, and likely to reach the target of 10% in 2010. However, the growth of all renewable energy sources has not been uniform. While wind power increased rapidly from 1.3GW in 2005 to 25GW in 2009, the growth rate of solar PV power generation was rather slow as the unit cost for power generation stayed at high level. However, the domestic market for solar PV power generation is expected to grow with the government support. The government launched the first concession program for a 10 MW class grid-connected solar PV system in Dunghuang, Gansu Province in 2009, and the nationwide grid-connected solar PV concession program with the total installed capacity of 280MW in 2010. With the ambitious updated target to increase solar energy install capacity up to 21 GW by 2015, installed capacity of solar energy
1 Photovoltaic 2 The People’s Republic of China 3 National Development and Reform Commission
Chapter 1 Renewable Energy Development Introduction Final Report
1 - 2
surged from 0.9 GW in 2010 to 2.9 GW in 2012. Qinghai Province, which is located in the northeastern part of the Qinghai-Xizang plateau in the western part of PRC, has abundant mineral and natural resources, while its GRDP4
is the second lowest of all the provinces in PRC. To enhance economic development by utilizing these resources in environmentally sustainable manner, the Qinghai Provincial Government has set a development agenda for promoting solar energy, which would supply clean electricity to the load centers in the eastern part of PRC, and for developing a solar PV-related supply-chain industry, utilizing more than 20GW of solar power resource potential and the rich silica deposits in the Qinghai Province. The installed capacity of grid-connected solar PV systems in Qinghai Province reached to 1,010MW by the end of 2011 which was 47.2% of total solar PV installed capacity in PRC, and 1,000 MW additional solar PV power plants will be in operation by the end of 2012.
Qinghai provincial government plans to concentrate the grid-connected solar energy power plants in Qaidam basin in Haixi prefecture to add solar energy install capacity by 1,000 MW per year during the twelfth five-year plan (2011-2015) period. By 2015, the planned solar energy install capacity will be 4,000 MW comprised of 3,500 MW of the grid-connected solar PV power plants, 300 MW of the concentrating solar thermal power plants, and 200 MW of distributed solar PV systems. The solar energy install capacity is planned to be expanded by 10,000 MW in 2020 and by 20,000 MW by 2030. By the end of 2011, solar PV installed capacity in Qinghai province reached 1,010 MW which was 47.2% of total solar PV installed capacity in PRC, and 1,000 MW additional solar PV power plants will be in operation by the end of 2012.
1.2 TOR5
TOR as included in Appendix A of the Consultant’s Contract is repeated in Appendix 1 in this report.
1.3 OBJECTIVES This Project is conducted through the TA6 of the ADB7
.
The TA aims to increase the capacity of grid-connected solar PV system development in Qinghai Province by;
4 Gross Regional Domestic Product 5 Terms of Reference 6 Technical Assistance 7 Asian Development Bank

Renewable Energy Development Chapter 1 Final Report Introduction
1 - 3
(i) introducing advanced technologies to lower barriers for development, (ii) enhancing local capacity in planning, design, construction, O&M8
(iii) improving the design of 10MW class grid-connected solar PV power systems,
, and solar PV supply chain,
(iv) improving Provincial Government Policy for solar PV development in Qinghai Province,
(v) knowledge dissemination on grid-connected solar PV system, and (vi) organizing interim and final workshop. To achieve the objective, NEWJEC Inc., a Japanese consulting firm, was employed by ADB through the international competitive bidding.
1.4 STRUCTURE OF THE FINAL REPORT
The Final Report presents the major documents prepared by the Consultant during the course of the TA and organized according to the Table of Contents.
8 Operation & Maintenance

Renewable Energy Development Chapter 2 Final Report Advanced Technology for Grid-Connected Solar PV Systems
CHAPTER 2
ADVANCED TECHNOLOGY FOR GRID-CONNECTED SOLAR PV SYSTEMS

Renewable Energy Development Chapter 2 Final Report Advanced Technology for Grid-Connected Solar PV Systems
2 - 1
CHAPTER 2 ADVANCED TECHNOLOGY FOR GRID-CONNECTED SOLAR PV SYSTEMS
2.1 International Best Practices for Grid Protection Design and System
Configuration for a 10MW-class Grid-connected Solar PV System
2.1.1 Principle of Demand and Supply Power Balance
In a power system consisting of many power stations and related network equipment spreading over wide area, it is essential to control the supply-demand balance and to operate the power system property as to maintain the stability of total power system. The frequency of power system is affected by the balance of power consumption and power generation. The system frequency must be maintained within certain range in order to avoid serious system accidents.
Recently, RE 1
The importance of supply and demand control technologies especially in short period is now given focus as the number and proportion of REs in power systems are being increased.
such as solar, wind, biomass and so on has been increasingly introduced in power system to mitigate the climate change and to reduce air pollution. However, some REs, such as solar and wind have disadvantages of wide fluctuation of output power. The output of solar energy varies greatly according to time of a day, day-to-day weather patterns, and seasons, but also fluctuates sharply by change in the weather.
2.1.2 Influence of Rapid Expansion of Solar PV Systems and Countermeasures
by PV Power Stations
In PRC, power demand has been rapidly increasing. To meet the increasing demand, enhancement of power supply (power generation facilities) and expansion of transmission and substation facilities are planned and implemented. Installation of large-scale solar PV systems is one of the means to secure the power supply to meet the increasing demand. However, power supply enhancement by installation of a large-scale solar PV system brings the following concerns to a power grid. (1) Supply – demand balance control (2) Grid stability
1 Renewable Energy
Chapter 2 Renewable Energy Development Advanced Technology for Grid-Connected Solar PV Systems Final Report
2 - 2
Countermeasures to be taken by solar PV systems to cope with such issues are; (1) transmission of real-time operation data, (2) equipment of FRT2
function.
In Haixi Prefecture where Golmud is located, power supply will exceed the demand and surplus power would be generated when all planned solar PV projects are implemented. Following countermeasures are considered to deal with such surplus power: 1) output control of solar PV systems, 2) expansion of transmission lines in order to send the surplus power to other demand areas. It still remains some issues to realize stable operation of the power grid even through power supply-demand is balanced according to calculation, as it is difficult to estimate and control power output of solar PV systems which are influenced by weather. As countermeasures against this issue, it is required to collect and store the real-time operation data and continuous operation record of the solar PV system. Therefore, the facility that transmits such information is required to be installed in solar PV systems. Besides the power system expansion, countermeasures by the solar PV system are expected for the grid stability. A solar PV system has a possibility of unexpected trip when a power system disturbance (voltage sag, etc.) occurs, which can cause the power system collapse. To prevent such problem in the power system, FRT is equipped, which is essential facility for PV systems.
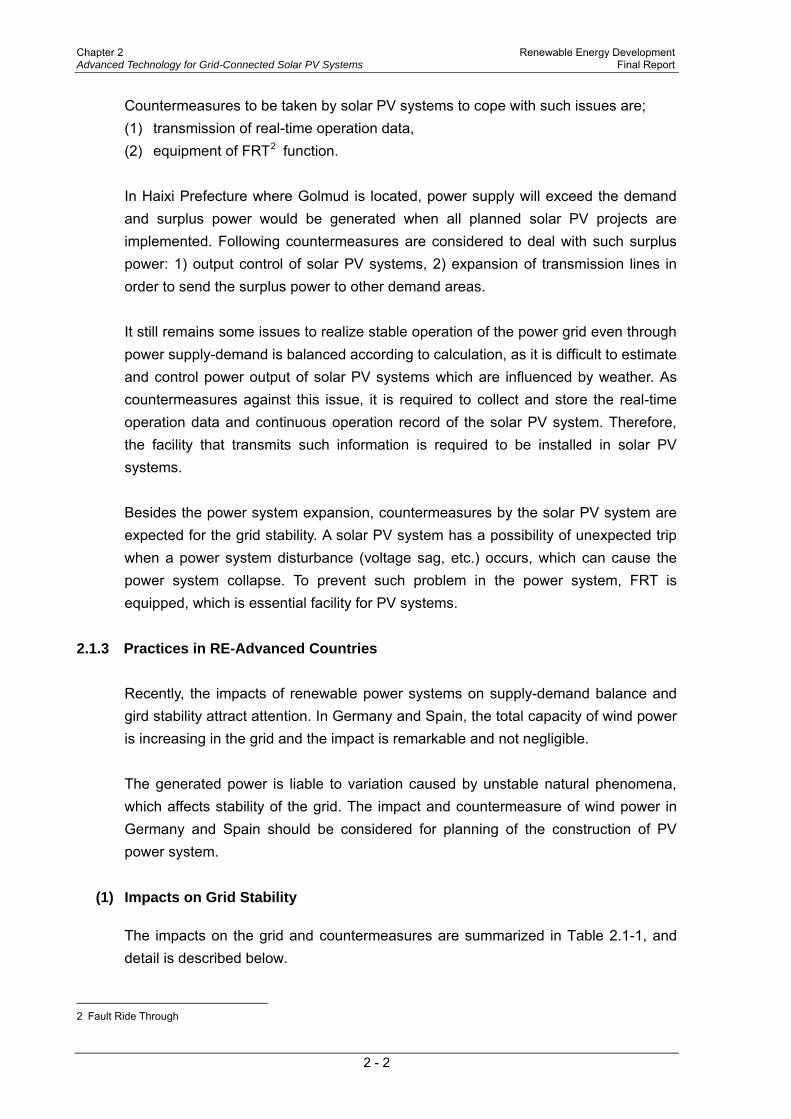
2.1.3 Practices in RE-Advanced Countries Recently, the impacts of renewable power systems on supply-demand balance and gird stability attract attention. In Germany and Spain, the total capacity of wind power is increasing in the grid and the impact is remarkable and not negligible. The generated power is liable to variation caused by unstable natural phenomena, which affects stability of the grid. The impact and countermeasure of wind power in Germany and Spain should be considered for planning of the construction of PV power system.
(1) Impacts on Grid Stability
The impacts on the grid and countermeasures are summarized in Table 2.1-1, and detail is described below.
2 Fault Ride Through

Renewable Energy Development Chapter 2 Final Report Advanced Technology for Grid-Connected Solar PV Systems
2 - 3
1) Impact-1: Excessive supply generated by RE
The power generated by conventional power plants (such as nuclear, thermal and hydro) is reduced to meet the demand, if the power generated by RE is to be consumed in the first place. When the power by RE decreases, the generation of conventional power plants should be increased timely to cope with the demand.
On the other hand, the capacity of thermal and hydro power should be kept above certain level in order to keep the grid stability. If the excessive power is generated by wind/PV power plants, the excess power should be either reduced or stored. In Germany and Spain, the excessive power frequently appears as a number of wind power plants have been installed increasingly.
The countermeasures and outlook for the above impact in both countries are as follows.
- Spain : Power reducing operation of the RE power plants. Required amount of the reducing power of the RE power plants will be increased in proportion to increase of their capacities.
- Germany : Storage the excess generated power by battery, pumped storage power plant, etc., because the generated power by the RE power plants must be supplied as much as possible in line with the government policy.
However, operation of the grid will be more difficult as installation of power storage facilities does not proceed in pace with the growth of renewable power plants.
2) Impact-2: Heavy power flow causes frequent critical grid condition with small margin of N-1 criteria3
The following matters result in heavy power flow and critical grid condition.
.
- Many wind power plants are constructed at the same location and the concentrated power from the plants is transmitted through the same transmission line.
- The long distance transmission lines are required between the wind power plants and demand area because the plants are constructed at the location far from the demand area.
- Generated power by wind power plant is sometimes bigger than the planned 3 N-1 criteria means Criteria on grid condition during shortage of one(1) equipment, such as transmission line or transformer

Chapter 2 Renewable Energy Development Advanced Technology for Grid-Connected Solar PV Systems Final Report
2 - 4
power because the wind forecast is very difficult.
Grid stability must be kept sufficient under single fault (N-1) condition. When the margin between N-1 criteria and actual power flow is not enough, grid operator should execute emergency operation to keep the stability. Power reducing operation of wind power plants is one of the countermeasures in the emergency operation.
In Germany, the frequency of execution of emergency operation is example, 80 times in 2006, 155 times in 2007 and 175 times in 2008. In fact, to solve this problem, the additional transmission lines should be constructed. However, construction of new transmission lines often faces opposition of inhabitants and is difficult to realize. Therefore, the grid condition will be more critical in proportion to increase of RE power plants.
3) Impact-3: Unexpected power flow caused by concentrated wind power plants increases in the Germany’s grid
Unexpected power mentioned in Impact-1 is transmitted to the main grid which is connected with the neighbor grids. As a result, the unexpected power flows appear in places in the connected grids. If the grids go into severe condition by unexpected power, related TSO4
If the TSOs can get data/information of such severe condition in advance, the co-operation will become easier. For grid co-operation to maintain the grid stability, the analyses taking into account of power flow of unexpected power should be carried out by a joint research unit set up by the related TSOs.
s in wide area should engage in cooperation.
4) Impact-4: Emergency trip at interconnection lines caused by unexpected trips of many wind power plants
When a fault occurs in a grid, the voltage drops and frequency and power flow are also disturbed. Under this disturbed grid condition, the conventional power plants connected to the grid try to keep sending power to the grid, which helps the grid recover from the disturbed condition. If it drops out of N-1 criteria, the interconnection lines must be disconnected or the whole grid will corrupts at worst.
The wind/PV systems do not have the modulation capability, and it stops operation (parallel off from grid) when voltage drops and/or disturbed frequency observed. This parallel off means an unexpected trip. When the total capacity of wind/PV plants that have gone parallel off is too large, the gird collapses. To
4 Transmission System Operator

Renewable Energy Development Chapter 2 Final Report Advanced Technology for Grid-Connected Solar PV Systems
2 - 5
solve this problem there is a technology developed which is called FRT function. This function enables the inverters to keep operations when an instant voltage drop and/or disturbed frequency encountered.
The FRT function is essential to avoid the unexpected trip and to keep the grid stability. At present, requirement on FRT function for wind PV system is stipulated in the grid codes in Germany, Spain and other countries.
Table 2.1-1 Impacts on the Grid and Measures
Impact Measures Outlook
Supply - demand balance
Impact-1 Excessive supply generated by the renewable source power plants
Power reducing operation of the renewable source power plants. (Spain)
Required value of the reducing power of the renewable source power plants will be increased in proportion to increase of their capacity.
Storage the generated power by battery, pumped storage power plant, etc., because the generated power by the renewable source power plants must be supplied without power reducing operation comply with government policy. (Germany)
It will go into the severe condition, even though new power storage plant will be constructed.
Grid stability
Impact-2 The heavy power flow causes critical grid condition with small margin of N-1 criteria frequently.
Power flow operation with/without neighboring TSO’s grid operation. At emergency condition, power reducing operation of the renewable source power plants. (Germany)
The additional transmission lines should be constructed as a drastic measure. The construction, however, is considered hard because of strong public opposition. The grid condition will be more critical in proportion to increase of renewable source power plants.
Power reducing operation of the renewable source power plants. (Spain)
Impact-3 Unexpected power flow caused by concentrated wind power increases around Germany’s grid.
Stability analysis studies are carried out by organization set up by the related TSOs. (Germany)
Impact-4 Emergency trip at the inter-connection lines caused by the unexpected trips of a large number of the wind power plants.
Specified organization for renewable source power plants is established to control these plants. (Spain)
A renewable power plant is obligated to equip FRT function. Requirement of FRT function is prescribed in Grid Code.
In Japan, requirement of FRT function has been prescribed in Grid interconnection Code since 2011. FRT function will be required in other countries.
(Source: Research report of study grope presented by METI5
, Japan)
2.1.4 Locally Appropriate Countermeasures for Grid Protection in Golmud, Qinghai
Province
(1) Necessity of FRT
FRT function of inverter should be required for a 10-MW-class solar PV system as grid protection to keep grid stability. Not only the FRT function but also the impacts on a grid by a 10-MW-class solar PV system and the measures to be taken are described
5 Ministry of Economy, Trade and Industry, Japan

Chapter 2 Renewable Energy Development Advanced Technology for Grid-Connected Solar PV Systems Final Report
2 - 6
in this section for introduction of the grid protection. Grid stability and necessity of FRT is described taking “Marching people” as an allegory.
Now, the five (5) persons are marching hand in hand as Fig 2.1-1-a. When person C suddenly slips, the following three (3) cases will be occurred.
- Case 1 : person B and D are very strong (Fig 2.1-1-b1) Person C is quickly helped without falls down, and marching will be quickly restarted.
- Case 2 : person B and D are strong (Fig 2.1-1-b2) Person C falls down but person B and C can be standing with the support of person A and E, and marching will be restarted after person C stands.
- Case 3 : person B and D are weak (Fig 2.1-1-b3) Person C falls down and person B and C also fall down, in worst case, person A and E also fall down, and marching cannot be continued.
If the marching line consists of three (3) persons, strength of marching line is weaker than five (5) persons’ line, and the Case 3 will frequently occur by slipping accident. If it consists of seven (7) persons, the strength is stronger than five (5) persons’ line. Grid stability is as the same as marching line. In case of large number of generators is connected in the grid (many persons in the marching line), the grid stability will be much stronger than in the case of small number of generators is connected.
In addition to the above, the strength of each generator (strength of each person) is also key point to keep grid stability. PV plants without FRT function are weak for keeping grid stability (such as Case 3), even though these have large capacity (MW). When an accident occurs, the PV plants will fall down due to the weakness of the PV plants (such as person B and D in Case 3). If many PV plants fall down by one small accident such as slipping, the grid will go into severe condition and in worst case, the grid will be fully collapsed (Case 3).
FRT function improves the strength of PV plant during accident. The requirement of FRT function is “Continuous Operation” (continuous standing such as person B and D in Case 2) to avoid grid collapse (Case 3), and it is not “Recovery of grid fluctuation” (to help slipped person such as person B and D in Case1). Generally, the recovery of grid fluctuation is one of the tasks of hydro and thermal power plants.
Renewable Energy Development Chapter 2 Final Report Advanced Technology for Grid-Connected Solar PV Systems
2 - 7
Fig. 2.1-1 Description of Grid Stability (taking marching by persons as an example)
Person B&D help C
Person C falls down but person B and C can be standing with person A and E support, and marching will be restarted after person C stands.
Person C is quickly helped without falls down, and marching will be quickly restarted.
Person C falls down and person B and C also fall down, in worst case, person A and E also fall down, and marching cannot be continued.
A B C D E
A B C D E
A B C D E
A B C D E
Fig 2.1-1-a
Fig 2.1-1-b1: Case 1 Person B and D are
very strong
Five (5) persons are marching in line
Person C slips
Fig 2.1-1-b2: Case 2 Person B and D are
strong
Fig 2.1-1-b3: Case 3 Person B and D are
weak
A B C D E

Chapter 2 Renewable Energy Development Advanced Technology for Grid-Connected Solar PV Systems Final Report
2 - 8
(2) Enhancement Plan of Large Capacity Transmission Lines
In view of the total supply-demand balance in PRC grid, the power supply is in short, and the new transmission lines are under construction also in Golmud. HVDC6
On the above situation, the huge power generated by PV power plants in Golmud will be sent to the load center nearby and consumed in the areas. The planned capacity of PV power is too much for demand in Golmud grid and grid operator concerns about the uneasy grid operation because of huge power of PV systems.
system is one of the new transmission lines. Generally, HVDC system has high speed control system as well as large transmission capacity, and power flow through the HVDC system can be changed and modulated using the high speed control in timely manner. This power changing capability and modulation function are useful for recovery from the fluctuation of grid voltage and frequency and disturbance in grid.
The grid operator intends to reduce power generation efforts and to give trip order to the PV power plants without prior announcement. The data/information to be acquired in order to execute the intended operation is required by the grid operator.
2.2 Power Conditioner 2.2.1 Internationally Advanced Technologies for Power Conditioner of the 10 MW
Class Grid-connected Solar PV System 2.2.1.1 Development of Grid-connection Inversion Technology
Research of PV inversion technology was started in the 1950s or 1960s, when SCR7 based sinusoidal wave PV inverters were used; in the 1970s, GTO/BJT was used in PV inverters; in the 1980s, single-board computer technology and VMOSFET/IGBT/ MCT devices provided conditions for development of large capacity PV inverters; in the 1990s, advanced control technologies such as DSP 8
signal processor and multi-level exchange, vector control, fuzzy logic control and neural networks found applications in on-grid PV inversion systems, with inversion efficiency of 91 ~ 94%; since 2000, the development of high performance dedicated on-grid inversion modules increased the performance of on-grid inverters, with inversion efficiency being increased to about 96%.
Insulation with normal shock transformer is the main form of grid-connected solar PV
6 High Voltage Direct Current 7 Silicon-controlled rectifier 8 Digital Signal Processor

Renewable Energy Development Chapter 2 Final Report Advanced Technology for Grid-Connected Solar PV Systems
2 - 9
power generation, as it retains the main advantages of non-insulated single stage conversion without transformer, while eliminating the main disadvantages of no insulation isolation. The SMA Company of Germany developed Sunny Central series inverters with different unit power ranges, SC 1,000MV inverters can directly connect to MV grid (10 kV or 20 kV) without the use of a LV transformer, thus lowering the system cost and increasing power generation efficiency. With the expansion of PV power generation application scope, inconsistent solar radiation, diversified PV assemblies and complicated installation conditions (such as BIPV9
in cities and tree shading on roof in rural areas) have raised higher requirements on grid-connected solar PV systems, now Enphase Energy and Microinverter of the UK and Solarmagic of American Nation Semiconductor are developing micro converters and micro inverters (assembly inverters), to realize modular and distributed power generation with modules. At present, development and production of PV grid-connected inverter products in other countries are mainly concentrated on tracking maximum power and integrated single stage energy conversion in inversion section, digital control is mainly adopted in control circuit, and complete protection circuits are provided emphasizing on system safety, reliability and expandability. PV inverters are developing towards high efficiency and small size, and using no isolating transformer has become a mainstream.
Researches on PV grid-connected inverters in PRC have mainly been done in maximum power tracking and two-stage energy conversion structure with phase separation in inversion section. Now, inverters of small size in PRC are basically have a quality of about the same level as those in other countries, and further improvement is required in inverters of large size. 500kW capacity as maximum inverter has developed as large size inverter.
2.2.1.2 Research Orientation and Development Trend of PV Grid-connected Inverters At present, researches on PV grid-connected inverters are concentrated in the following aspects: (1) Realizing high quality electric energy conversion, strict consistency of current
frequency and phase output from grid-connected inverters with the grid, so that the output power factor is as close to 1 as possible;
(2) Realizing safety protection requirements for system, such as output overload
protection, output short-circuit protection, input reversed connection protection, DC overvoltage protection, AC overvoltage and undervoltage protection, island
9 Building-integrated Photovoltaics
Chapter 2 Renewable Energy Development Advanced Technology for Grid-Connected Solar PV Systems Final Report
2 - 10
operation protection and unit self-protection; (3) Realizing high reliability, now PV grid-connected solar PV systems are installed
mainly in areas with severe natural conditions, therefore inverters should ensure low fault rate in long time operation conditions, with powerful self-diagnosis ability. Therefore, the designed inverters shall have rational circuit structure and elements shall be strictly selected;
(4) Maximum power tracking to make maximum use of PV matrix, so as to increase
the inverter efficiency. There are the following trends in the development of PV grid-connected inversion technologies:
1) Reducing energy loss with inconsistent insolation and increasing the grid-connected inversion efficiency;
2) Increasing system robustness and energy conversion efficiency;
3) Improving reliability and extending service life of power elements, for example, the high power three-level module Easy and Econo4 series, IRMOSFET10 and IGBT11
4) Use of shunting technology, multi-unit coordinated control technology and multi-unit island operation detection technology for large power PV grid-connected inversion systems to detect the insulation status on AC and DC buses, to prevent current leakage in system, avoid generation of loop current between inversion systems and interference of high current to driving signals and sampling signals, performing coordinated control between inversion systems, active and passive anti-island detection and power balance between units, to realize overall energy dispatching for MW class large power distributed PV grid-connected inversion systems.
products can meet the requirements of 25 years of operation in PV power generation systems;
The main principles for requirements on inverters are: large power inverters on the basis of high efficiency and low harmonic content, shall have adjustable power factor, participate in grid dispatching, and also FRT function, able to resist certain grid fault.
10 IROMOS Field-effect Transistor 11 Insulated-gate Bipolar Transistor

Renewable Energy Development Chapter 2 Final Report Advanced Technology for Grid-Connected Solar PV Systems
2 - 11
2.2.2 Locally Appropriate Power Conditioner Technology 2.2.2.1 Specific Technical Requirements and Suggestions for Inverters
(1) Basic Requirements
1) Inverter Functions:
a) Operate automatically, with high level of visualization of operation status.
b) PV MPPT function12
c) DC overvoltage/overcurrent protection, reversed polarity protection, short-circuit protection, grounding protection (with fault detection function), undervoltage/overvoltage protection, overload protection, overheating protection, over/under frequency protection, 3-phase unbalance protection and alarm function.
.
d) FRT function and active and reactive power regulation function.
(2) Inverter Efficiency
a) Maximum efficiency: 98.5%
b) Efficiency at 10% rated AC power: ≥95%
(3) Inverter Input and Output Parameters
a) Max. input voltage: ≥DC 880V
b) MPPT voltage range: 450V ~ 850V (or wider)
c) Output voltage: to be determined by manufacturer (3 phases)
d) Voltage fluctuation: comply with the requirements of “Technical specification for PV power station connection to grid”.
e) Frequency: comply with the requirements of “Technical specification for PV power station connection to grid”.
f) Rated power factor: ≥0.99
12 Maximum Power Point Tracking

Chapter 2 Renewable Energy Development Advanced Technology for Grid-Connected Solar PV Systems Final Report
2 - 12
g) Power factor regulation range: 0.95 (leading) ~ 0.95 (lagging)
h) Total current waveform distortion: <3%
i) The AC output side of inverters shall be provided with power generation metering function, to meet the requirement to measure the power generated by the connected PV module.
(4) Electrical Insulation Performance
a) DC input to ground: 2000VAC/1min, with leak current <20mA.
b) AC output to ground: 2000VAC/1min, with leak current <20mA.
c) Other indicators - Power consumption during night: ≤100W. - Communication interface: RS485 port. - Service ambient temperature: -25°C − +55°C (the inverters shall be able to
work continually and reliably within this temperature range).
d) Cooling: air cooling with air duct connections.
e) Communication protocol: MODBUS communication protocol shall be used, which shall be opened freely to users.
(5) Lightning Protection Ability
Lightning protection devices shall be provided on AC side, with lightning protection and alarm function (nominal discharge current greater than 20kA, with residual voltage not higher than 3.8kV); and anti-surge ability, with the equipment able to withstand 5 impacts with simulated lightning current waveform 8/20μs and amplitude of 20kA, at interval of 1min between lightning and function normally in this condition.
(6) Inverters
Inverters shall have complete function to automatically synchronize with the grid, and have active power and reactive power regulation ability. It also need to have overload ability and able to operate over long time at an overload, and can only conduct current in one direction. Inverters also requires complete protection functions, with comprehensive protection strategies including DC overvoltage/undervoltage, AC overvoltage/undervoltage, AC overcurrent, short-circuit, over/under frequency, and system transient power.

Renewable Energy Development Chapter 2 Final Report Advanced Technology for Grid-Connected Solar PV Systems
2 - 13
(7) Quality of Electric Energy
The quality of electric energy provided from inverters to AC load shall be under control, and it shall be ensured to measure all electric energy quality on inverter AC side (harmonics, voltage deviation, voltage unbalance, DC components, voltage fluctuation and flicker), which shall meet the requirements of national standards, industrial standards, and of State Grid Corporation and local power supply departments.
1) Harmonics and waveform distortion
It is desirable to have low current and voltage harmonic level. High harmonics will increase the possibility of harmful effect to the connected equipment. The permissible level of harmonic voltage and current depends on the power distribution system characteristics, power supply type, the connected loads and equipment, and the current regulation of the grid. Output from a PV system shall have low current distortion, to ensure that no detrimental effect will be caused to other equipment connected to the grid. Harmonics of different orders shall be limited within the percentages listed in the table below.
Table 2.2-1 Limit on Harmonic Voltage in Public Grid
Grid nominal voltage (kV)
Voltage total distortion rate (%)
Content of different harmonic voltage (%) Odd Even
0.38 5.0 4.0 2.0 6
4 3.2 1.6 10 35
3 2.1 1.2 66 110 2 1.6 0.8
The permissible value of harmonic current injected from a PV power station to the grid shall be distributed according to the ratio of the installed capacity of the station to the capacity of power supply equipment at this common connection point.
Table 2.2-2 Permissible Value of Harmonic from PV Power Station
Nominal voltage
(kV)
Reference short-circuit
capacity (MVA)
Harmonic order and permissible value of harmonic current (A)
2 3 4 5 6 7 8 9 10 11 12 13
35 and 12 250 15 12 7.7 12 5.1 8.8 3.8 4.1 3.1 5.6 2.6 4.7

Chapter 2 Renewable Energy Development Advanced Technology for Grid-Connected Solar PV Systems Final Report
2 - 14
(The power supply equipment capacity at the common connection point of the project will be determined later as the connection system has not been determined.)
2) Voltage deviation
To ensure normal working of local AC loads, the output voltage of inverters in PV system shall match that of the grid. During normal operation, the permissible voltage deviation at the connection of PV system with grid shall conform to the provisions in GB/T 12325.
3) Voltage fluctuation and flicker
The voltage fluctuation and flicker of inverters shall meet the provisions in GB/ T12326-2008 “Power quality - Voltage fluctuation and flicker”. The limit values of voltage variation are related to variation frequency and voltage level.
Table 2.2-3 Voltage Fluctuation and Flicker of Inverters
R, h-1 d, % LV, MV HV
R < 1 4 3
1 < r < 10 3 2.5
10 < r < 100 2 1.5
100 < r < 1000 1.25 1
The short time flicker Pst and long time flicker Plt shall meet the limits set forth in the table below.
Table 2.2-4 Short Time Flicker Pst and Long Time Flicker Plt
System voltage level LV MV HV
Pst 1.0 0.9 0.8
Plt 0.8 0.7 0.6
Notes: 1. In this standard, the measuring cycle for Pst and Plt is respectively taken as 10min and 2h;
2. Values in brackets for MV are only applicable to cases that all users connected with PCC are at the same voltage level.
4) Voltage unbalance
When the PV system is operating on grid (only output to 3 phases), the 3-phase voltage unbalance at the grid connection shall not exceed the values specified in GB/T 15534, and the negative sequence voltage unbalance at common

Renewable Energy Development Chapter 2 Final Report Advanced Technology for Grid-Connected Solar PV Systems
2 - 15
connection point shall not exceed 2%, or not exceed 4% for short time. For this, the negative sequence voltage unbalance caused by the PV power station shall not exceed 1.3%, or not exceed 2.6% for short time.
5) DC component
When a PV power station is operating on grid, the DC current component fed by inverters to the grid shall not exceed 0.5% of its rated AC value.
6) Power factor
When the output from the inverters in the PV system is greater than 50% of its rated output, the average power factor shall be no less than 0.9 (leading or lagging). The formula of average power factor for a period of time is:
Power Factor = 2REACTIVE
2REAL
REAL
EE
E
+
Where, EREAL : active electric power (kWh) EREACTIVE : reactive electric power (kvarh)
7) Response characteristics at voltage anomaly
A large or medium sized PV power station shall have some ability to withstand voltage anomaly, to avoid disengagement in case of grid voltage anomaly, causing loss of grid power source. It must be ensured that the PV power station will not interrupt grid-connected operation when the voltage at the connection point is in the area of and above the voltage profile line in Fig. 2.2-1, and the PV power station is permitted to stop supplying power to the grid line when the voltage at the connection point is in the area below the voltage profile line in Fig. 2.2-1. (T1 = 1s, T2 = 3s)

Chapter 2 Renewable Energy Development Advanced Technology for Grid-Connected Solar PV Systems Final Report
2 - 16
Fig. 2.2-1 Required Capability on the FRT Function
8) Response characteristics at frequency anomaly
A large or medium sized PV power station shall have some abilities to withstand frequency anomaly, being able to operate with the frequency deviation in the grid as shown in the table below.
Table 2.2-5 Required Operation Time for Large or Medium Size PV Power Station
in case of Grid Frequency Anomaly Frequency range Operating requirements
below 48Hz To be determined according to the minimum frequency at which the PV power station inverters are permitted to operate or the grid requirements
48Hz-49.5Hz Able to operate at least 10min. when it is below 49.5Hz 49.5 Hz -50.2Hz Continuous operation 50.2 Hz -50.5Hz Each time the frequency is above 50.2 Hz, the PV power station shall be able
to operate continuously for 2min, but also with the ability to stop feeding power to the grid line within 0.2s, with the actual operation time determined by the grid dispatching entity; at this time, PV power station originally in shutdown state is not allowed to be connected to the grid.
above 50.5Hz Stop feeding power to the grid line within 0.2s, and PV power station originally in shutdown state is not allowed to be connected to the grid.
9) Safety and protection
It shall have corresponding grid protection function to ensure safety of equipment and personnel in case of anomaly or fault in the PV system or grid.
1.1
1.0
0.8
0.6
0.4
0.2
0 -1 0 T1 T2
ULO 0.9

Renewable Energy Development Chapter 2 Final Report Advanced Technology for Grid-Connected Solar PV Systems
2 - 17
a) Over current and short-circuit protection
A PV power station shall have certain overcurrent ability, and it shall be able to work continuously and reliably for no less than 1 min. up to 120% rated current, and for no less than 10s within 120%-150% rated current. When short-circuit on grid side is detected, the short-circuit current output from PV power station to grid side shall be no greater than 150% of rated current, and the PV system shall be disconnected from the grid within 0.1s.
b) Anti-island operation
In case of loss of voltage in the PV system tied grid, PV system must be disconnected from the grid within specified time limit, to prevent island operation. At least one active and one passive protection against island operation shall be provided. Active anti-island operation protections mainly include high frequency, variation of active power, variation of reactive power and impedance variation resulted from current pulse injection. Passive anti-island operation protections mainly include voltage and phase jittering, 3rd voltage harmonic variation and frequency variation rate. In case of loss of voltage, the anti-island operation protection shall operate within 2s, to disconnect the PV system from the grid.
c) Restoration of connection to grid
After system disturbance, the PV power station is not allowed to connect to the grid before the grid voltage and frequency are restored to normal range, and after the system voltage and frequency are back to normal, the PV power station will be connected to the grid after an adjustable time delay, which is normally 20s to 5min, depending on local conditions.
d) Lightning protection and grounding
The lightning protection and grounding for PV system and grid connection equipment shall conform to the provisions in SJ/T 11127.
e) Protection against reverse discharge
The system shall have the function to protect the grid from reverse discharge to the DC side.

Chapter 2 Renewable Energy Development Advanced Technology for Grid-Connected Solar PV Systems Final Report
2 - 18
2.3 MCM13
2.3.1 Latest International Technologies for Master Control and Monitoring for Grid-connected Solar PV System
2.3.1.1 Overall Requirements for Supervisory System
It shall perform data acquisition, tapping and analysis, determine the working status and attenuation of assemblies, inverters, bus compartments, transformers and power transmission lines, monitor the station operation conditions in real-time, analyze methods to increase efficiency and power generation, and optimize the operation of the grid-connected PV station, direct assembly matrix cleaning and angle adjustment according to monitoring data, make timely repair and maintenance of bus compartments, inverters, sun tracking devices and electrical facilities, adjust the operation strategy of the station, perform remote intelligent monitoring and rational dispatching, to realize optimized operation of the grid-connected PV power station and maximum electric energy output.
2.3.1.2 Design Principle for Supervisory System The supervisory system software in a PV power station performs overall monitoring and control of the equipment operation status and environment detectors. The system transmits the operation status information via data acquisition and transmission module. In the system deployment for PV power station supervisory system, a three-level pattern is adopted to realize coordinated functioning with a distributed framework of PV power station, data center and monitoring center. Level I, data management: the self-reliance data management in the PV power station, an intelligent data collector is used to acquire and collect PV sensing data in real-time, and the data are transmitted in real-time to a small sized real-time database. It also permits view of data via monitors. Level II, data center: it is the comprehensive management center at substation for all subordinated PV power station data, mainly deployed with large sized real-time database and backup real-time database, and historical data with long time duration are filed into disc matrix. It also performs analysis and statistics of all sampled data, to provide data basis for decision-making and analysis at high level. Meanwhile, video server, mail server and printout server are arranged in the network.
13 Master Control and Monitoring

Renewable Energy Development Chapter 2 Final Report Advanced Technology for Grid-Connected Solar PV Systems
2 - 19
Level III, data monitoring: the monitoring center at control center mainly displays various data, concurrently providing both access modes as customer based and WEB, plotters and integrated computer are provided, and dynamic display of data with rolling play-out on large screen is adopted.
2.3.1.3 Smart Grid Technology
The electric power grids in the world share the same direction of development, appropriate control and stability. In general, an electric power grid includes all types of supply power sources (thermal, hydro, nuclear and renewable). Recently, renewable power is highlighted, because its energy potential is rapidly exploited by recent technology innovation. One of the latest international technologies of MCM for grid-connected solar PV system is called as a smart grid. - In case of a small grid which consists of small, limited demand and dispersed
renewable power source in a small area, and it is controlled efficiently. - The smart grid is highly expected by its efficiently energy use and goes forward to
the practical use. Smart grid technology is expected to be introduced to a power grid with PV power generation with a purpose of improved power quality and this section introduces model cases tested as below.
(1) Ota City - Clustered PV Power Generation Systems
In this research, a PV power generation system was installed on 553 houses, respectively (Total system capacity for 553 houses: 2,129 kW) with lead storage batteries having storable power energy equivalent to approximately 6 kWh attached to each system, thus verifying the voltage control effect of power distribution lines with the lead storage batteries. If generated power flows into the power distribution lines from the PV power generation system side, a voltage on the power distribution line side will rise, however if the voltage exceeds a reference voltage on the power distribution line side, the inverter of the PV power generation system will prevent further voltage rise. Therefore, the system incorporates the voltage rise prevention function that stops distributing power. If the PV power generation systems are interconnected locally in a cluster, this function may cause a drop in the operating rate of PV power generation. In order to avoid the foregoing phenomenon, we conducted verification of avoiding reverse power flow into the grid by charging the storage batteries in this research. Since this clustered interconnection of the systems maintains a balance between generation and demand-supply of power even if the grid stops operation, conventional independent operation detection systems could disable

Chapter 2 Renewable Energy Development Advanced Technology for Grid-Connected Solar PV Systems Final Report
2 - 20
detection of independent operation and cut-off of distributed generation systems. For
this reason, an independent operation detection system capable of coping with the
said problem was developed. (see Fig.2.3-1)
Fig. 2.3-1 Demonstrative Research in Ota City, Japan
It will be required to evaluate the influence of interconnection of large scale PV power
generation to power grid on power quality such as fluctuations in voltage and
frequency, and apply output control technologies using a power storage system for
power grid stabilization. Introduced hereunder is a demonstrative research NEDO has
been carrying out for the foregoing issue.
(2) Wakkanai City - Stabilization of PV Power Generation System for Large-scale
Power Supply
PV power output may involve a large
number of comparatively short-period
fluctuations depending on meteorological
conditions. Consequently, with progress
in the interconnection of large-scale PV
power generation and the introduction of
PV power generation concentrating in a
specific area, influence of the said
fluctuations on grid voltage will
increasingly rise. For this reason,
Japan’s first MW-class power plant was constructed and the technologies for
interconnection of grids at an extra-high voltage level were studied.
On a site located in Wakkanai City, Hokkaido, 5MW PV generation facilities were
interconnected to 33kV transmission line, 1.5MW NAS batteries were installed in
order to prevent voltage fluctuations associated with PV power output fluctuations,
Substation Transformer
Pole Transformer
PV systems installed: 553 units Total PV capacity: 2,129 kW Average system capacity: 3.85 kW
High-voltage Power Distribution Line
Solar Cell Array
Connection BoxHousehold
Load
Outdoor StorageBox
Measuring Instruments Batteries, Power Conditioner Low-voltage Power
Distribution Line
Junction Box (Outdoor)
Developed a technology that avoids output restriction for clustered interconnection of PV power generation systems
Fig. 2.3-2 Large-scale PV Power Plant located in Wakkanai City

Renewable Energy Development Chapter 2 Final Report Advanced Technology for Grid-Connected Solar PV Systems
2 - 21
and then planned operation of the facilities with the objective of stabilizing PV power output was conducted taking countermeasures against the peak power in the system (see Fig. 2.3-3).
Fig. 2.3-3 shows the results of basic output fluctuations preventive control testing with the use of NAS14
batteries (PV power generation: 2 MW, NAS batteries power generation: 0.5 MW). On this site, the preventive control is conducted with the use of NAS batteries by taking the moving average deviation (moving average time frame: 30 minutes) as a target value for output from the PV power plant. A comparison of PV power outputs was done and found that outputs from the power plant were smoothed (the maximum range of fluctuations in PV power outputs of 1,269 kW was reduced to 516 kW in outputs from the PV power plant) and control with NAS batteries was effective.
Fig. 2.3-3 Results of Output Fluctuations Preventive Control Testing
(Moving Average Target Control)
On the site located in Hokuto City, Yamanashi Prefecture, a 2MW PV power plant was constructed and introducing various types of PV modules centering on leading-edge solar cells to operate and evaluate the plant as well as developed and demonstrated technologies contributing to future spread and cost cutting of large-scale PV power generation technologies through the development of a voltage-control, harmonic-resistant large-scale PV inverter (see Fig. 2.3-4). Particularly, this inverter became Japan’s first inverter with built-in FRT function (capability of continuing power generation without disconnecting PV power generation in case of any system disturbance).
14 Natlium Sulfur
-2000
-1000
0
1000
2000
3000
4000
5000
4:00 6:00 8:00 10:00 12:00 14:00 16:00 18:00 20:00
Pow
er o
utpu
t [kW
]
0
20
40
60
80
100
Rem
aini
ng c
apac
ity [%
]
Power plant output
NAS output
Remaining capacity of battery PV output

Chapter 2 Renewable Energy Development Advanced Technology for Grid-Connected Solar PV Systems Final Report
2 - 22
Fig. 2.3-4 Large-scale PV Power Plant located in Wakkanai City
(3) Lessons learned from Demonstrative Research of Ota City and Wakkanai City
regarding the Smart Grid
Result of demonstrative researches in Ota City and Wakkanai City showed that the problem of voltage increase of the residential PV system with grid-connection can be improved economically by installing battery for only limited residents, not for all PV residents. Applying this idea to a large-scale grid which has solar PV systems connected to the Grid, it is effective to install the battery in the substations in the areas that have solar PV systems. Measurement and load control by the smart grid have been shown effective for stabilization of total power system.
If the estimation of PV’s output is possible, "on time tariff" which will change time to time may be possible by the smart meter. The smart meter can realize this dynamic tariff system and demand control.
(4) Demonstrative research on microgrid in Los Alamos County
1MW-scale PV power generation system is introduced and storage batteries are introduced to compose microgrids with different new energy introduction by switching power distribution lines on site for changing the scale, and then it is analyzed that how many storage batteries have to contribute to achieve power distribution at the same time and for the same amount. Real-time price signal system from the EMS15
15 Energy Management System
of the power distribution lines is also designed to comprehend how much PV power is

Renewable Energy Development Chapter 2 Final Report Advanced Technology for Grid-Connected Solar PV Systems
2 - 23
generated, and store power in batteries if necessary. And EMS at households controls the demand side response.
In the demonstrative research, clustered PV power generation system and storage batteries that connect between the power distribution substation and the switchgear are installed, and demonstrate the effect of absorbing variations in solar radiation with storage batteries. Furthermore, smart distribution equipment on two out of six feeders in Los Alamos County is installed and the lines are jointly operated with Los Alamos side. In addition, the storage batteries and PV power generation system are operated and monitored. Microgrid-EMS for controlling the system is introduced and the smart equipment on the power distribution lines to simulate distribution lines with a high PV power generation introduction rate is operated. Various types of experiments with the use of EMS on Los Alamos side in combination will be conducted. A real-time price signal used for demonstration house to assign the role in transmitting the signal to the demonstration house to the smart grid-EMS is also created.
Fig. 2.3-5 Demonstrative Microgrid in Los Alamos County
(5) Demonstrative research on smart house in Los Alamos County
Demonstrative research on smart house is intended to demonstrate superiority in energy utilization efficiency compared to that of general houses. A demonstration house with EMS using 3kW PV power generation system & storage batteries, heat pump/hot water heat storage system, smart meter technology has been constructed, and real-time pricing in combination as well as a home/ external communication
Line Monitoring (µ-EMS) Output Monitoring (Monitoring fluctuations in PV output)
Power Flow Monitoring (Controlling power flow fluctuations at microgrid interconnection points)
PV System 1MW (@100 kW/10 types)
Stationary storage batteries 1MW (NAS & Lead storage cells)
NEDO House HEMS, 3kW PV, 20kWh power & thermal
storage
Controlling Charge & Discharge (Outputting Charge/Discharge command so as to control PV output)
Price Signal (Transmitting real-time price signal interlocking with PV fluctuations)
Substation
Microgrid 5MW
Small Commercial Building
PV System 1MW (US side) General House (with smart meter equipped)
Price Signal Price Signal
Price Signal
(Demonstrating the power storage system interlocking with real-time price signal
and PV output)

Chapter 2 Renewable Energy Development Advanced Technology for Grid-Connected Solar PV Systems Final Report
2 - 24
system has been constructed.
Furthermore, demonstrative experiment
to maximize demand response through
strategic system operation using an
HEMS16 has been conducted.
(6) Demonstrative Research on Power
Distribution Lines and Industrial
Buildings in Albuquerque City
Distributed power generation systems
such as cogeneration system and
thermal equipment in an industrial building in the emerging development area called
Mesa del Son are introduced and ancillary service that absorbs fluctuations in PV
power generation by receiving a signal from the EMS of the distribution line is
provided. In addition, independent operation of the systems using a building as
microgrid and expecting to continue uninterruptible power supply in case of power
failure in the transmission line is performed. Since the site is located on a plateau
1,600 meters above sea level, demonstrative operation of the distributed power
generation systems that cannot be experienced in Japan is performed.
This demonstrative research is implemented in collaboration with PNM17 (a local
electric power company) and Sandia National Laboratories. In the research, at office
building, independent operation system by installing fuel cells in case of line trouble, a
gas engine cogeneration system, a heat storage tank, storage batteries, and a PV
power generation system are constructed.
For normal operation, an urban-type microgrid is composed by installing EMS, and
links it with EMS on the building side via an information line. The microgrid is operated
by receiving from PNM side a signal that monitors the operating conditions of a PV
power generation system to be installed by PNM and a direct control command for
fluctuation absorption amount from EMS. Thus, solution of fluctuations in output from
the PV power generation system which can be absorbed by the equipment on the
building side, including fuel cells, a gas engine cogeneration system, a heat storage
tank, and storage batteries is demonstrated.
16 Home Energy Management System 17 Public Service of New Mexico
Fig. 2.3-6 Residence Area in Los Alamos County

Renewable Energy Development Chapter 2 Final Report Advanced Technology for Grid-Connected Solar PV Systems
2 - 25
Fig. 2.3-7 Configuration of Microgrid in Albuquerque 2.3.2 Locally Appropriate MCM System in terms of Reliability, Efficiency and Cost
2.3.2.1 Scope of Monitoring and Control and Operation Control Mode
(1) Scope of Monitoring
Under normal operation conditions, a PV power station shall provide at least the following signals to the grid dispatching center:
1) Telemetering quantities
- Total active and reactive power of the PV power station - Active power, reactive power, voltage and current of individual inverters - Meteorological information of the PV power station (radiation, air temperature
and air pressure) - Expected turn-on capacity - Active power, reactive power, current and voltage of grid connection line (if
any) - Active power, reactive power and current of interbus, segment and bypasses (if
any) - Voltage and frequency of each bus level
Line Monitoring (µ-EMS)
Power Flow Monitoring (Controlling power flow fluctuations at microgrid interconnection points)
Operation command to Distributed Power Generation Systems and Heat Storage System (Outputting Charge/Discharge command so as to control PV output)
Commercial Building Allowing Independent Operation PV 100kW, Gas engine cogeneration, BEMS, Thermal storage
NEDO House Future option
(Demonstrating the power storage system interlocking with load control signal and PV output)
Substation
Commercial Building
Stationary Storage Batteries (US side) PV System (US side)
Output Monitoring (Monitoring fluctuations in PV output)
General House (with smart meter equipped)
Management on US side
Direct Load Control Signal (Demand ON/OFF signal interlocking with PV fluctuations)
Microgrid 5MW

Chapter 2 Renewable Energy Development Advanced Technology for Grid-Connected Solar PV Systems Final Report
2 - 26
- Active power, reactive power and current of step-up transformer - Reactive power and current of var compensator - Active power, reactive power and current of station transformer
2) Remote signaling quantities
- General accident signal - Inverter operation status and position signals - Main transformer and line protection signals - Status and position signals of circuit breakers, isolating switches and earthing
switches on grid connection lines - Status and position signals of circuit breakers, isolating switches and earthing
switches on interbus, segments and bypasses (if any) - Status and position signals of bus earthing switches and PT switches - Status and position signals of circuit breakers, isolating switches and earthing
switches of lines - Status and position signals of circuit breakers, isolating switches and earthing
switches of var compensator - Status and position signals of circuit breakers, isolating switches and earthing
switches of station transformer
3) Remote control quantities
- AGC18
- Real-time output (active and reactive) of PV power station function enabling
- Permissible AGC control signal of PV power station - Enabling AGC control signal of PV power station - Current output limit of PV power station - Regulation rate (rising and descending) of PV power station - Output increase blocking signal and output reduction blocking signal of PV
power station - Active set point return value of PV power station - AVC19
4) Electric energy quantities
operation status and current control mode, etc.
Bidirectional active power electric energy and bidirectional reactive power electric energy of 10kV line
18 Active Generation Control 19 Active Voltage Control

Renewable Energy Development Chapter 2 Final Report Advanced Technology for Grid-Connected Solar PV Systems
2 - 27
(2) Operation Control Mode
Operation control of the whole PV power station is realized in the central control room and from remote dispatching center. When monitoring and control are normal, the operation of all levels, equipment operation status and breaker status are all under the monitoring by the computer supervisory system. When local operation is performed, operation of station control level should be blocked. In case of a fault in the supervisory system, a signal shall be immediately sent to the dispatching side and the remote control is blocked.
2.3.2.2 System Configuration
The station control level equipment of a solar energy PV power station mainly consists of system host computer and operator stations, engineer management station, printer, GPS20 time calibration device and network system. The bay level of the PV power station is divided as primary cells, where all equipment and devices shall meet the relevant IEC21
standards.
2.3.2.3 System Network Structure The computer supervisory system consists of the station control level, bay level and network equipment. The bay level network structure is in a ring structure. The station control level is the monitoring, measurement, control and management center of equipment in the whole station, it is located in the control center and connected via optical cables with bay level. The bay level is arranged in corresponding switching cabinets in a relatively independent way by different voltage levels and electrical cells, and in case of failure of station control level and network, the bay level can still independently perform monitoring and circuit breaker control functions.
2.3.2.4 System Functions
The computer supervisory system realizes reliable, rational and complete monitoring, measurement and control of the PV power station, and also has all remote functions for telemetering, remote signaling, remote control and remote regulation, able to exchange information with the dispatching communication center. Each substation room is provided with a communication manager computer, the information of bay level equipment is uploaded via optical fiber ring net to the central control room, for communication with the system via communication interface devices.
20 Global Positioning System 21 International Electrical Commission

Chapter 2 Renewable Energy Development Advanced Technology for Grid-Connected Solar PV Systems Final Report
2 - 28
(1) The computer supervisory system shall have the following functions
1) Real-time data acquisition and processing 2) Database establishment and maintenance 3) Control operation 4) Alarm processing 5) SOE22
6) Picture generation and display
recording and accident recall PDR (data records of 30min during power interruption, with time before and after the fault adjustable)
7) Online calculation and tabulation 8) Electric quantity processing and electric quantity integration 9) Remote functions 10) Clock synchronization 11) Man-machine interface 12) System self-diagnosis and self-restoration 13) Remote diagnosis 14) Interface with other equipment 15) Operation management function
(2) Real-time Data Acquisition and Processing
1) Type of acquired signals
Types of acquired signals are in analog and status quantities (digital quantities), and the scope of acquisition is as follows:
a) Analog quantities (communication transmission):
The specific configuration is as follows:
- 10 step-up transformers: LV side current, voltage, active power, reactive power, frequency and transformer temperature
- 10kV bus: voltage - 10kV incoming and outgoing lines: 3-phase voltage, current, frequency,
active power, reactive power, active electric energy, reactive electric energy and harmonic distortion rate
- DC bus: voltage - Inverters (AC side): voltage, current, frequency, power factor and
harmonic distortion rate
22 Sequence of Event

Renewable Energy Development Chapter 2 Final Report Advanced Technology for Grid-Connected Solar PV Systems
2 - 29
b) Status quantities (digital quantities, for communication transmission):
All microcomputer protection, DC system, UPS system and fire alarm system signals.
Electric energy quality analysis: On the 10kV line, measure the harmonic distortion rate of voltage and current, and transmit the relevant data remotely to system background for analysis, calculation and saving; it has fault wave recording function, able to record trend curves and trap waveforms, and also perform 31/63 order odd harmonic analysis.
Electric energy quantities: Electric quantity acquisition points are arranged on 10kV outgoing line and all off-station working power sources, and current transformers will have an accuracy class of 0.2S.
The electric quantity in the whole station is collected by intelligent 0.2S class electronic energy meters, and information is sent to electric quantity collector via RS485 interfaces or by optical fiber communication. The electric quantity collecting device transmits information to the supervisory system via RS485 interfaces or by optical fiber communication.
2) Processing of acquired signals
The computer supervisory system divides the collection of real-time data by electrical equipment cells, and each measuring and control unit is a relatively independent intelligent small system.
a) Acquisition and processing of analog quantities
i) Acquisition at fixed time: data are acquired at fixed time according to scanning cycle, with corresponding conversion, filtration, precision inspection and database refreshing, and the scanning cycle shall meet the requirements of performance indicators.
ii) Overlimit alarm: dead zone determination and overlimit alarm are performed by time period according to the set limits, and the alarm messages shall include alarm text, parameter values and alarm time.
b) Acquisition and processing of status (digital) quantities
i) Acquisition at fixed time: inputs are acquired at rapid scanning cycles, and status check and database refreshing are performed.
ii) Equipment anomaly alarm: in case of change with status of the
Chapter 2 Renewable Energy Development Advanced Technology for Grid-Connected Solar PV Systems Final Report
2 - 30
monitored equipment, equipment change indication or anomaly alarm will appear, and the alarm messages shall include alarm text, event nature and alarm time.
iii) SOE records: for digital quantities such as circuit breaker position signals and relay protection operation signals that require rapid response, SOE recording shall be made according to the time sequence of the changes.
iv) When the breaker accidental trips or opening operations have reached the designated number, an alarm message should be sent to alert the user to make maintenance.
(3) Database Establishment and Maintenance
1) The computer supervisory system shall establish the following databases:
a) Real-time database: it is loaded with real-time data collected by the computer supervisory system, and the values are kept on refreshing according to the real-time changes of operation conditions, to record the current status of the monitored equipment. The refreshing cycle of real-time database and data precision shall meet the project requirements.
b) Historical database: important data for long-term reservation will be stored in the historical database. The recording cycle will be 5 minutes.
2) Maintenance requirements
a) It shall be convenient to expand and maintain the databases, and consistency and safety of data shall be ensured; it shall be possible to online modify or offline generate databases; data entries in the databases can be modified and added or deleted in MMI23
- Numbers of data entries,
mode. Main contents that can be modified are:
- Text description of data entries, - Status description of digital signals, - Definition of input alarm processing, - Limit values for analog quantities, - Acquisition cycle of analog quantities, - Dead zone for analog overlimit processing, - Calculation coefficient for analog quantity conversion,
23 Man-Machine Interface

Renewable Energy Development Chapter 2 Final Report Advanced Technology for Grid-Connected Solar PV Systems
2 - 31
- Definition of normal and abnormal digital quantity status, - Parameters for calculation of electric energy quantities, and - Parameters of output control.
b) Logic operation definition for multiple digital and analog quantities, etc.
c) Convenient interactive inquiry and calling shall be possible, and the response time shall meet the project requirements.
(4) SOE Recording
Fault and short-circuit in primary equipment will result in environmental protection operation and breaker trip, and the SOE recording function shall record, store, display, print out the operation sequence of equipment during the event with time tags, and generate event recording report for inquiry. The system will reserve SOE record text for 1 year. The event resolution shall be ≤ 2ms. The SOE records shall have time tags and be sent to the main dispatching station in a timely manner.
(5) Picture Generation and Display
1) Picture display
a) Electrical system diagram of the whole station b) Power distribution room and substation room wiring diagram c) Real-time and historical curve display d) Bar charts (voltage and load monitoring) e) Cell unit and station alarm display diagram f) Supervisory system configuration and operation condition charts g) DC system diagram h) Report display (including alarms, accidents and conventional operation data) i) Form display (such as equipment operation parameters and various
statements) j) Operation permit display k) Display of calendar, time and number of safe operation days
2) Output mode and requirements
a) The main electrical wiring diagram shall including real-time values of electrical quantities, equipment operation status, load flow direction, positions of breakers, switches and ES, and position of “local/remote” changeover switch.
b) Text on picture display shall be written in Chinese. c) It shall be possible to store and make hard copies for graphs and curves.

Chapter 2 Renewable Energy Development Advanced Technology for Grid-Connected Solar PV Systems Final Report
2 - 32
d) Users can generate, make and modify graphs. A graph made at one workstation can be sent to other workstations.
e) The time scale and sampling cycle of voltage bar chart and curves can be selected by user.
f) Each graph shall be indicated with calendar time. g) Data lacking in the graphs can be manually inserted.
(6) Online Calculation and Tabulation
1) Online calculation
a) Calculate the primary values of electrical quantities I, V, P, Q, f, COSφ and Wh, Varh, and also calculate the maximum and minimum values in a day, month and year with the occurring time
b) Accumulated kWh value and value by time section (time section can be set arbitrarily)
c) Daily, monthly and annual voltage on-spec rate d) Power totaling and electric energy totaling e) Inflow and output load and electric quantity balance rate of PV power station f) Number of normal and accidental trips, outage time and monthly and annual
operation rate of circuit breakers, etc. g) Calculation of house load power consumption h) Total of safe operation days i) Statistics and calculation of integrated electric quantity
2) Report and forms
a) List of real-time values b) List of values at hours c) PV station load operation log d) Electric energy form e) Report to power dispatching f) List of SOE records g) List of alarm records h) List of main equipment parameters i) Self-diagnosis report
3) Output mode and requirements
a) Real-time and fixed time display b) Printout at call and at fixed time c) Forms can be defined, modified and made at main monitoring station

Renewable Energy Development Chapter 2 Final Report Advanced Technology for Grid-Connected Solar PV Systems
2 - 33
d) Various forms e) Forms shall be stored by time sequence, and the storage quantity and time
shall meet user requirements. It shall be 1 day for hourly value reports, 1 day for daily reports and 1 month for monthly reports.
4) Remote functions
The computer supervisory system shall have remote functions, and the remote information, main technical requirements, information transmission mode and channels shall meet the real-time, safety and reliability requirements for grid dispatching.
Remote interface equipment shall have operation and maintenance interfaces, with online self-diagnosis, remote diagnosis, remote configuration and communication monitoring functions.
The inverter shall realize successful joint commissioning with the dispatching side, and simulation test shall be passed before factory acceptance.
(7) Clock Synchronization
The station will be provided with GPS time calibration equipment, and time calibration for all bay level equipment will be based on network.
(8) Man-machine Interface
Man-machine interface is the window for dialogue between people and computer, and dialogue with computer can be done conveniently via mouse or keyboard on the LCD24
- Call, display and copy various graphs, curves and forms, - Send operation control commands, - Database definition and modification, - Definition and modification of parameters in various application programs, - View historical values and set points, - Generation and modification of graphs and forms, - Alarm acknowledgment and exit/restoration of alarm points, - Set date and clock, - Edit and make operation files, and - Any computer can record operations at other computers.
screen. Man-machine interfaces include:
24 Liquid Crystal Display

Chapter 2 Renewable Energy Development Advanced Technology for Grid-Connected Solar PV Systems Final Report
2 - 34
(9) System Self-diagnosis and Self-restoration
The computer supervisory system can perform online diagnosis of operation conditions software and hardware, and alarm messages can be displayed and printed out in a timely manner in case of anomaly or fault, and they will be displayed with different colors on operation condition chart.
Self-diagnosis covers the followings.
- Fault in measuring and control unit and I/O acquisition module - Fault in external equipment - Fault in power supply - System clock synchronization fault - Network communication and interface equipment fault - Software operation anomaly and fault - Fault in data communication with remote dispatching center - Fault in remote channel - Grid control status monitoring - Equipment self-restoration shall cover the following - Automatic restoration to normal operation in case of software operation anomaly - Self start and restoration to normal operation in case of software blocking - Able to automatically switch to backup equipment for operation in case of software
or hardware fault with online equipment when equipment has redundant configuration.
In addition, the system shall have disconnecting points to facilitate testing and fault isolation. Measuring and control units at bay level can be maintained with portable computer.
(10) Operation Management Ability
The computer supervisory system can realize the following management functions according to operation requirements:
1) Running operation guidance: put forth directive processing ideas for typical equipment anomaly/accident, prepare technical statistics form on equipment operation, and provide corresponding operation guidance graphs;
2) Accident analysis retrieval: perform classified retrieval and relevant analysis for large number of alarm signals produced in a sudden event, and an accident guiding graph should be provided directly for typical accidents;
3) Online equipment analysis: analyze operation records and historical record data

Renewable Energy Development Chapter 2 Final Report Advanced Technology for Grid-Connected Solar PV Systems
2 - 35
of main equipment, and put forth equipment safe operation report and repair plan;
4) Simulated operation: provide relevant layout, wiring, operation and maintenance for primary and secondary electrical systems and rehearsal before actual electrical operations, to conduct operation training for operators with corresponding operation graphs.
5) Other daily management of monitoring main station, such as operation log management, equipment operation status, defects, repair record management and rules and regulations.
6) The management functions shall meet user requirements, and be suitable, convenient and can share resources. It shall be possible to store, retrieve, edit, display and print out various files.
(11) Remote Diagnosis Function
It shall have remote diagnosis function and remote diagnosis software shall be provided.
2.3.2.5 Hardware Equipment
The computer supervisory system shall be based on advanced hardware equipment that is in general use in power systems, reliable and complies with industrial standards.
(1) Host and Operator Station and Engineer Station
There will be 2 operator stations, including 1 as engineer station and concurrently operator station and 1 operator station. The twin hosts have the main processor and server functions, being the data collection, processing, storage and sending center at station control level. Operator stations are the main MMI for station computer supervisory system, and are used to display graphs and forms, record events, display and inquire alarm status, inquire equipment status and parameters, guide operations, interpret and issue operation and control commands. Operators on duty can realize operation monitoring and control for equipment in the whole station via the operator stations. The engineer station is mainly designed for system maintenance by computer system manager, and it can perform database definition and modification, system parameter definition and modification, form making and modification, as well as network maintenance and system diagnosis work.

Chapter 2 Renewable Energy Development Advanced Technology for Grid-Connected Solar PV Systems Final Report
2 - 36
(2) Clock Receiving and Clock Synchronization System
The station is provided with a satellite clock synchronization system, to receive the B code standard timing signal from the GPS system, to calibrate clocks in the station computer supervisory system and relevant equipment such as relay protection devices. The time calibration error between units shall be less than 1ms. Combined soft and hard time calibration method will be used, clock expansion will adopt synchronization and active contact mode, providing microcomputer-based protection and fault wave recording for the whole station and pulse time calibration contacts for other intelligent equipment.
(3) Basic Requirements on Hardware
Host and operator station: CPU with main frequency 2.6G or over, memory 2G or over, hard disk 320G or over; monitor: 21’ color LCD monitor (1280 × 1024); and dual network cards. Engineer station: the same configuration as the host and operator station.
(4) Software System
The computer supervisory system shall use internationally prevailing and advanced industrial software with standard version and software license, and it shall be in modular structure, with good openness, reliable and mature, convenient and suitable. It shall be possible for user to install and generate software system.
2.3.2.6 System Software
The workstations at station control level shall use a mature and open multi-task operation system, which shall include operation system, compiling system, diagnosis system and various software maintenance and development tools. The compiling system shall be easy to interface with system supporting software and application software, and support multiple programming languages. A real-time operation system complying with industrial standard shall be used at bay level. The operation system shall be able to prevent data file loss or damage, support system generation and user program loading, support virtual memory and be able to effectively manage a number of peripheral equipment.
(1) Supporting Software
Supporting software mainly includes database software and system configuration software.

Renewable Energy Development Chapter 2 Final Report Advanced Technology for Grid-Connected Solar PV Systems
2 - 37
The database software shall meet the following requirements.
1) Real time performance: it can quickly access to database and also meet the real-time function requirements even in parallel operations.
2) Maintainability: database maintenance tool shall be provided, to enable the user to perform online monitoring and modification of data in the database.
3) Restorability: after the elimination of accident in the computer supervisory system, the contents in database can be quickly restored to the status before the accident.
4) Parallel operation: parallel access to the same data in the database by different programs (tasks) shall be permitted, and completeness of database in parallel mode shall be ensured.
5) Consistency: when data in the database is modified at any workstation, the database system shall modify relevant data in all workstations automatically, to ensure data consistency.
6) Distribution: the intelligent monitoring units at bay level shall be able to independently implement all data required by local control, so that local operation control can be performed when the central control level is put out of operation.
7) Convenience: the database system shall provide two database generation tools for interactive and batch processing, as well as database dumping and loading functions.
8) Safety: operation authority shall be set for modification of database.
9) Openness: the buyer shall be allowed to perform secondary development using the database.
10) The system configuration software is designed for graph programming and data generation. It shall meet requirements of all functions of the system, to provide user with an interactive, object-oriented, convenient and flexible, easy to master and diversified configuration tool, and some programming means similar to macro and multiple practical functions shall be provided, to expand the functions of the configuration software. It shall enable user to generate and modify online graphs, curves, forms and reports with great convenience.
(2) Application Software
Application software shall meet the functional requirements. It shall be in module

Chapter 2 Renewable Energy Development Advanced Technology for Grid-Connected Solar PV Systems Final Report
2 - 38
structure, with good real-time response speed and expandability. It shall have error detection ability. In case of error in any application software, it shall not affect the normal operation of other software, except for prompt error message. Application programs and data shall be mutually independent in structure. System backup disk shall be provided.
(3) Communication Interface Software
The computer supervisory system has much communication interface drive software, mainly:
1) The communication interface software with dispatching center; 2) The communication interface software with electric energy metering system; 3) The communication interface software with protection and safety automatic
devices; 4) The communication interface software with intelligent DC system; 5) The communication interface software with PV system monitoring unit; 6) Interface software with UPS system 7) The communication interface software with 400V system monitoring unit; 8) The communication interface software with fire alarm control system;
2.3.2.7 Technical Requirements for Cabinets
Cabinets (or panels), including all complete set equipment or individual assemblies mounted on them, shall have sufficient mechanical strength and be mounted in a correct manner. It shall be ensured that cabinets (or panels) will not be damaged during lifting, transport, storage and installation. The general technical conditions for relay cabinets and panels in power system shall be satisfied.
2.4 Assessment Tools
2.4.1 Assessment of Insolation and Estimation of Power Generation
Tilt angle of PV array is generally designed to have the same angle as the latitude of the site. When the diffused sunlight is taken into account, optimum tilt angle of PV array may be different from the latitude. In this subsection, an assessment method employing fish eye projection picture taken at the PV site is introduced, and features of diffused sunlight are explained. Assessment of insolation using fish-eye lens is effective in the case that the solar PV

Renewable Energy Development Chapter 2 Final Report Advanced Technology for Grid-Connected Solar PV Systems
2 - 39
system surrounded by the obstacles which disturb direct sunlight to the solar PV system. It is programmed that the solar PV system accepts diffused sunlight and direct sunlight. In general assessment of insolation has three ways shown as below; i) Assessment of insolation data of neighboring meteorological observatory, which
is based on the meteorological observatory data and in Japan there are many observatory points in the narrow area and it is possible to use those data for the assessment.
ii) Assessment of insolation at the specific point by the observation of satellite which
is using data from the satellite and the data from the meteorological observatory are combined and all area insolation can be assessed in the world.
iii) Assessment of insolation by using fish-eye lens which is using fish-eye lens is not
easy to assess insolation but it can assess the natural characteristics of environment. It is necessary to use the three kinds of assessment methods case by case.
2.4.1.1 Measurement of Sunlight in Golmud Site using Fish-eye Lens
(1) Fig. 2.4-1 shows the picture taken at the south west corner of 10MW pilot PV pilot project site, facing the southern direction.
picture : 2011/0713
Fig. 2.4-1 Southern View from 10MW Pilot Project Site
tower

Chapter 2 Renewable Energy Development Advanced Technology for Grid-Connected Solar PV Systems Final Report
2 - 40
There are no mountains near the candidate site, no other PV power stations or any constructions can be seen up to the foot of mountains except a slim tower with the height of more than 100 meters for measuring wind velocity. There is no obstacle to disturb direct sunlight. The land for 10MW pilot PV site is very dry and seems to be the desert. Generally, obstacles to PV arrays are not easy to find because solar orbit is changing day by day through a year and the location of the sun is changing minute by minute. (Fig. 2.4-2)
Fig. 2.4-2 Shadow made by Obstacles of the Surroundings
Fish eye projection picture is drawn by the program developed. A solar orbit is shown on the fish eye lens. An illustrative picture is shown below. Fish eye projection picture is to be considered as the representation of the sunlight orbit. It is the same projection on the PV module. (Fig. 2.4-3)
Fig. 2.4-3 Illustrative Picture of Sunlight Orbit Projection
Obstacles (Building, tree, etc.)
Sunlight Orbit The Horizon

Renewable Energy Development Chapter 2 Final Report Advanced Technology for Grid-Connected Solar PV Systems
2 - 41
(2) PV module generates electric power not only by direct sunlight but also diffused sunlight reflected by objects (building, tree, etc.). Some kind of objects in the atmosphere, especially cloud makes diffused sunlight and it will reach 20 ~ 30% of total intensity. The area of the sky covered by clouds is presented in solid angle (the surface area of a sphere). (Fig. 2.4-4)
Fig. 2.4-4 Direct Sunlight and Diffused Sunlight
Fig. 2.4-6 was taken by the camera using fish-eye lens. Fish eye lens and camera for it is shown as in the Fig. 2.4-5.
Lens is facing the southern direction and tilted at the angle of 35° from the ground. This is the same sky view observed by the PV array with tilt angle 35° set on the ground facing the southern direction.
Diffused Sunlight
Direct SunlightCloud
Fig. 2.4-5 Single-lens Reflex Camera and Fish-eye Lens

Chapter 2 Renewable Energy Development Advanced Technology for Grid-Connected Solar PV Systems Final Report
2 - 42
picture: 2011/07/16
Fig. 2.4-6 View of Fish-eye Lens with Tilt Angle 35° The photo shows the surroundings of the PV array which is to be set and sky and sun at the same time. From Fig. 2.4-6 it is seen that there is nothing to disturb the sunlight orbit passing on PV arrays. The tower seen in Fig. 2.4-1 is too slim to disturb the sunlight reaching PV array in this picture. The visible area of fish-eye lens is wide enough to see all direction from the PV site. As shown in Fig. 2.4-7, the scenery of semi-sphere is covered by one picture.
tower
sun
horizon

Renewable Energy Development Chapter 2 Final Report Advanced Technology for Grid-Connected Solar PV Systems
2 - 43
picture: 2011/07/13
Fig. 2.4-7 Visible Fields using Fish-eye Lens
Using this picture it is possible to estimate insolation not only by direct sunlight, but also diffused sunlight projected on the fish-eye lens (= the PV array). Cloud near the sun is gleaming and this kind of cloud contributes to the diffused sunlight.
2.4.1.2 Solar Orbit
(1) Feature of fish eye lens
The feature of fish eye lens is shown as below.
- 360° visual field - The picture taken by fish eye lens keeps the
information on the celestial sphere. - The fish eye lens is able to express the position of
the sun. Solar orbit is drawn as in Fig. 2.4-8.
North
East West
South
Fig. 2.4-8 Solar Orbit
ΦΦ
Φ
p p p
Picture
Fish eye

Chapter 2 Renewable Energy Development Advanced Technology for Grid-Connected Solar PV Systems Final Report
2 - 44
Dots in the picture show the position of the sun at every hour. The orbit of the sun on 22/03/2011, the day of the spring equinox, is shown in a straight line in Fig. 2.4-9.
Fig. 2.4-9 Solar Orbit on Fish-eye Lens
The picture overlaid on the fish eye lens is Fig. 2.4-10, which shows whether any obstacles for PV power generation are existent or not.
Horizon
1 hour interval
: Winter : Spring : Summer
North
West East
South

Renewable Energy Development Chapter 2 Final Report Advanced Technology for Grid-Connected Solar PV Systems
2 - 45
Fig. 2.4-10 Solar Orbit on Fish-eye Lens at the 10MW Pilot PV System Site
The tower located in the south which will give influence to sunlight orbit is negligible
as the obstacle because the tower is not seen in Fig. 2.4-10. Although the picture was
taken on July 16, 2011, the orbit of the sun from sunrise to sunset in every season can
be shown on the picture. This is the most important factor in the estimation of
generation of solar PV system.
2.4.1.3 Resource Forecasting
Estimation of insolation for the site for 10 MW Pilot Project by QBE25 was presented
in their Feasibility Study Report (see Table 3.1-2 of Section 3.1.1.1). Comparing
their result with NASA26's 25 years average data, and the estimation with fish-eye lens
method shown in Table 2.4-1
Table 2.4-1 Insolation Estimation by Three Different Methods
(kWh/m2for each month and yearly total)
Jan. Feb. Mar. Apr. May Jun. Jul. Aug. Sep. Oct. Nov. Dec. Total
QBE site 145.3 147.2 179.7 201.8 214.5 199.4 201.7 210.1 193.0 195.6 165.2 143.3 2197
NASA 176.7 168.3 196.9 193.8 186.3 167.4 170.5 172.1 168.0 198.4 179.1 169.0 2146
fish-eye 135.2 129.9 169.6 183.6 189.7 173.4 197.8 222.0 221.7 209.3 179.4 147.9 2159
25 Qinghai Brightness Engineering 26 National Aeronautics and Space Administration
: Winter
: Spring
: Summer
North
South
West East
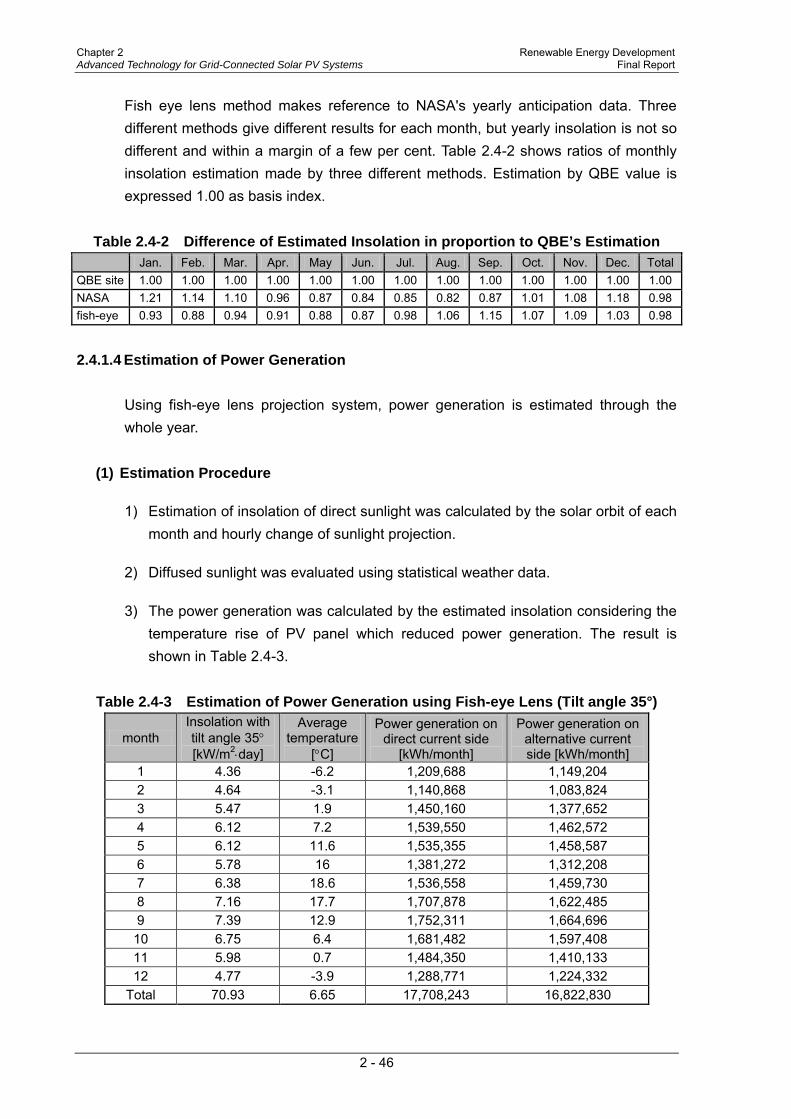
Chapter 2 Renewable Energy Development Advanced Technology for Grid-Connected Solar PV Systems Final Report
2 - 46
Fish eye lens method makes reference to NASA's yearly anticipation data. Three different methods give different results for each month, but yearly insolation is not so different and within a margin of a few per cent. Table 2.4-2 shows ratios of monthly insolation estimation made by three different methods. Estimation by QBE value is expressed 1.00 as basis index.
Table 2.4-2 Difference of Estimated Insolation in proportion to QBE’s Estimation
Jan. Feb. Mar. Apr. May Jun. Jul. Aug. Sep. Oct. Nov. Dec. Total
QBE site 1.00 1.00 1.00 1.00 1.00 1.00 1.00 1.00 1.00 1.00 1.00 1.00 1.00 NASA 1.21 1.14 1.10 0.96 0.87 0.84 0.85 0.82 0.87 1.01 1.08 1.18 0.98 fish-eye 0.93 0.88 0.94 0.91 0.88 0.87 0.98 1.06 1.15 1.07 1.09 1.03 0.98
2.4.1.4 Estimation of Power Generation
Using fish-eye lens projection system, power generation is estimated through the whole year.
(1) Estimation Procedure
1) Estimation of insolation of direct sunlight was calculated by the solar orbit of each month and hourly change of sunlight projection.
2) Diffused sunlight was evaluated using statistical weather data.
3) The power generation was calculated by the estimated insolation considering the temperature rise of PV panel which reduced power generation. The result is shown in Table 2.4-3.
Table 2.4-3 Estimation of Power Generation using Fish-eye Lens (Tilt angle 35°)
month Insolation with tilt angle 35° [kW/m2⋅day]
Average temperature
[°C]
Power generation on direct current side
[kWh/month]
Power generation on alternative current side [kWh/month]
1 4.36 -6.2 1,209,688 1,149,204 2 4.64 -3.1 1,140,868 1,083,824 3 5.47 1.9 1,450,160 1,377,652 4 6.12 7.2 1,539,550 1,462,572 5 6.12 11.6 1,535,355 1,458,587 6 5.78 16 1,381,272 1,312,208 7 6.38 18.6 1,536,558 1,459,730 8 7.16 17.7 1,707,878 1,622,485 9 7.39 12.9 1,752,311 1,664,696 10 6.75 6.4 1,681,482 1,597,408 11 5.98 0.7 1,484,350 1,410,133 12 4.77 -3.9 1,288,771 1,224,332
Total 70.93 6.65 17,708,243 16,822,830

Renewable Energy Development Chapter 2 Final Report Advanced Technology for Grid-Connected Solar PV Systems
2 - 47
Table 2.4-4 Estimation of Power Generation using Fish-eye Lens (Tilt angle 25°)
Estimated energy at the tilt angle 25° was slightly bigger than that of tilt angle 35°. Suggestion that the maximum power generation by the pilot PV system can be attained with tilt angle somewhere between 35° and 25°. Therefore it is recommended to observe the insolation by using test PV panels which are set at different tilt angles between 35° and 25°.
2.4.2 Prediction of Power Generation
The relationship between supply and demand control and prediction factors is shown in Fig. 2.4-11. As output fluctuation is one of the central issues of solar PV systems, prediction of power generation naturally attracts attention. Prediction of power generation means prediction of insolation, or weather in a broader sense, for solar PV systems. The concept of generation prediction and its use in the context of Smart Grid is illustrated in Fig. 2.4-11.
monthIrradiation with tilt
angle 25°[kW/m2・day]
Average temp.[°C]
Power on direct current side [kWh/month]
Power on alternative current side [kWh/month]
1 4.46 -6.2 1,236,729 1,174,893 2 4.72 -3.1 1,159,484 1,101,509 3 5.56 1.9 1,469,995 1,396,495 4 6.20 7.2 1,559,248 1,481,286 5 6.21 11.6 1,554,799 1,477,059 6 5.87 16.0 1,399,562 1,329,584 7 6.47 18.6 1,555,423 1,477,652 8 7.25 17.7 1,727,017 1,640,666 9 7.49 12.9 1,771,441 1,682,869 10 6.86 6.4 1,706,466 1,621,142 11 6.13 0.7 1,519,082 1,443,128 12 4.90 -3.9 1,323,061 1,256,908
Total 72.11 17,982,306 17,083,191

Chapter 2 Renewable Energy Development Advanced Technology for Grid-Connected Solar PV Systems Final Report
2 - 48
Fig. 2.4-11 Prediction of Power Generation
(1) Insolation Prediction by Weather Forecast
Insolation estimation is important for supply and demand control. Since several kinds of estimation period (every 30 minute, 1 minute to several minutes interval, one second level interval) are required for appropriate supply and demand control, weather forecast methods for these periods have to be developed.
As mentioned above, accuracy of prediction of the solar PV system is different depending on which step is applied to and prediction method proposed at present is shown in the Table 2.4-5.
1) As for short interval control (second level interval), the control based on the short period prediction is difficult to apply and the high speed response equipment (the battery and electric double layer capacitor and so on) is developed for this short period fluctuation control.
Input Data Control Interval
Explanation of Control
To make the operation plan of the each power plant based on the input data shown as the left.
Generation plan
(Every 30 minutes)
Past data of the RE power generation
Past data of the electricity demand
- Order of one day generation output of the power plant
- The target generation amount of sending and receiving power
If the data shown as below has big deference among them, re-arrangement of output of the power plant is needed. Between actual output of
the grid-connected solar PV system and planned output of it
Between actual power demand and planned power demand
Long periodic interval control
(1minute to several minutes interval)
Amount of sending and receiving power between outside the smart grid and the smart grid
Output of the RE
- Ordered output of the each power plan (adjustment)
Amount of sending and receiving power between outside the smart grid and the smart grid
Short interval control
(a second level interval)
Following rapid output change of the grid-connected solar PV system, each generation plant controls the output.
Each power plant
- Ordered output of the each power plan (Final order)

Renewable Energy Development Chapter 2 Final Report Advanced Technology for Grid-Connected Solar PV Systems
2 - 49
2) Insolation measurement method respond to long interval control (one minute to several minutes level) is predicted based on the past weather forecast and the area weather forecast.
Table 2.4-5 Prediction Method of Insolation and Quick Demand/Supply Control
Method in Japan Control interval Outline of prediction method and control method Source
Generation Plan
Prediction method that based on the weather data supplied by ECMWF27 IEEEJournalVol.2, No.1,
pp2-10 (2008) , solar PV power output is predicted every one hour.
The insolation data of the next day is predicted every 30 minutes by the territorial data of the Japan Meteorological Agency.
IEEJ Annual Meeting, 2009, No.7-049 (2009)
The insolation data of the specific time is predicted based on the area weather forecast of every three hours of the Japan Meteorological Agency.
IEEJ Trans. PE, Vol. 127, No. 11, pp.1219-1225 (2007)
Long interval control
(1 to several minutes interval)
5 to 15minutes interval insolation prediction is tested based on the data base of the past weather forecast and the area weather forecast in rather short time.
IEEJ Technical Meeting on Power System Engineering, PSE-11-17 (2011-01)
Short interval control
(second level interval)
The power storage system (battery and electric double layer capacitor) which quickly responds to fluctuation of the Grid power for compensation of active power is applied.
IEEJ Trans. PE, Vol. 127, No. 3, pp.451-458 (2007) IEEJ Trans. PE, Vol. 129, No. 12, pp.1553-1559 (2009)
(2) Cloud Prediction
Solar PV system generates electricity by direct and diffused sunlight and the strength of diffused sunlight is 20 ~ 30% of the strength of direct sunlight. When the shadow of cloud is projected on the PV array, power generation is reduced rapidly. This phenomenon is the biggest problem for the power grid administrator in maintaining the stability of the power grid. Therefore it is very important to predict the abrupt change of generation power before it happens. In this subsection prediction of cloud and its impact on power generation is described.
1) Macro Prediction
It is possible to predict the movement of cloud for a few hours or for a few days in a macro view. However, it is impossible to acquire the concrete influence of a small cloud at the PV site even by using satellite imagery.
Fig. 2.4-12 shows illustration of satellite photo. It is possible to predict roughly the
27 Europe Center of Meteorological Weather Forecast

Chapter 2 Renewable Energy Development Advanced Technology for Grid-Connected Solar PV Systems Final Report
2 - 50
amount of power generation by evaluating cloud movement at the PV site by the
prediction of cloud monitored by the satellite.
Fig. 2.4-12 shows rough prediction of the cloud influence by 100 km scale
evaluation and it is applicable to the satellite photos in Golmud.
Fig. 2.4-12 Macro Prediction System Fig. 2.4-13 Graphics by the Weather Satellite
2) Micro Prediction
On the satellite photo of this scale even the large PV power stations is merely a
dot. To predict the shade of cloud it is necessary to measure the shade at the site.
To predict the influence of cloud, the shade of clouds on the ground must be
forecasted for next minute or hour. Fig. 2.4-14 shows a possible way to predict
the shade. To forecast a cloud that interrupts the sunlight it is necessary to locate
clouds continuously and set them on the way of the sun path.
PV site
Cloud
Met-satellite
Control Center
15hour, 04/03/2012
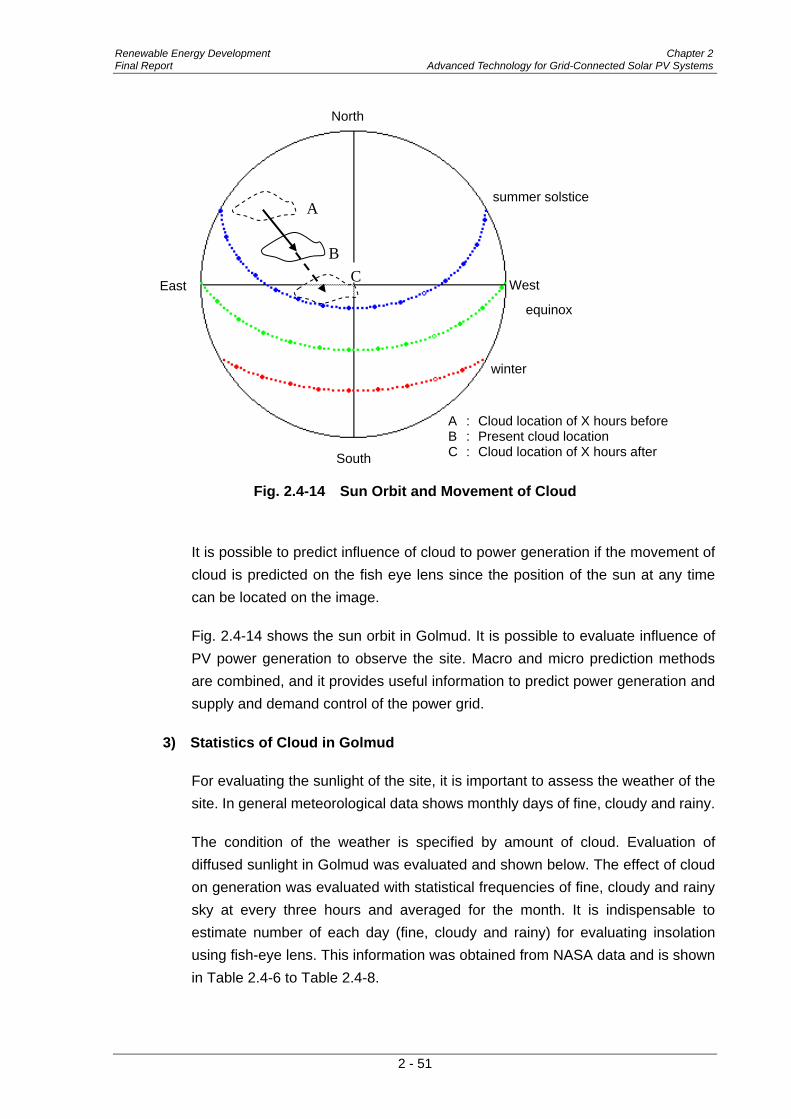
Renewable Energy Development Chapter 2 Final Report Advanced Technology for Grid-Connected Solar PV Systems
2 - 51
Fig. 2.4-14 Sun Orbit and Movement of Cloud
It is possible to predict influence of cloud to power generation if the movement of
cloud is predicted on the fish eye lens since the position of the sun at any time
can be located on the image.
Fig. 2.4-14 shows the sun orbit in Golmud. It is possible to evaluate influence of
PV power generation to observe the site. Macro and micro prediction methods
are combined, and it provides useful information to predict power generation and
supply and demand control of the power grid.
3) Statistics of Cloud in Golmud
For evaluating the sunlight of the site, it is important to assess the weather of the
site. In general meteorological data shows monthly days of fine, cloudy and rainy.
The condition of the weather is specified by amount of cloud. Evaluation of
diffused sunlight in Golmud was evaluated and shown below. The effect of cloud
on generation was evaluated with statistical frequencies of fine, cloudy and rainy
sky at every three hours and averaged for the month. It is indispensable to
estimate number of each day (fine, cloudy and rainy) for evaluating insolation
using fish-eye lens. This information was obtained from NASA data and is shown
in Table 2.4-6 to Table 2.4-8.
A
B
C
A : Cloud location of X hours beforeB : Present cloud location C : Cloud location of X hours after
summer solstice
equinox
winter
North
West
South
East

Chapter 2 Renewable Energy Development Advanced Technology for Grid-Connected Solar PV Systems Final Report
2 - 52
Table 2.4-6 Monthly Probability of Fine Sky Monthly Averaged Frequency of Clear Skies at Indicated GMT Times (%)
Lon 94 Jan. Feb. Mar. Apr. May Jun. Jul. Aug. Sep. Oct. Nov. Dec.
<10%@ 0 * n/a n/a n/a 30.1 24 26.8 30.2 34.4 n/a n/a n/a n/a
<10%@ 3 28.7 16.8 12.7 21 19.3 24.7 27.1 31.6 31.8 26.2 33.4 26.6
<10%@ 6 18 14.4 12.1 17.2 14.6 14.5 18.4 27.1 29.5 29.4 29.5 27.2
<10%@ 9 12 8.03 6.3 9.55 10.4 15.6 16.1 24.1 25 20.8 27.1 18.4
<10%@12 n/a n/a n/a n/a n/a n/a n/a n/a n/a n/a n/a n/a @number: GMT (Greenwich Mean Time), * <10%@ 0: Area in the sky covered by cloud at GMT 0 is less than 10%
Table 2.4-7 Monthly Probability of Cloudy Sky Monthly Averaged Frequency of Broken-Cloud Skies at Indicated GMT Times (%) *
Lon 94 Jan. Feb. Mar. Apr. May Jun. Jul. Aug. Sep. Oct. Nov. Dec.
10-70%@ 0 n/a n/a n/a 30.6 29.3 19.7 20.9 22.6 n/a n/a n/a n/a
10-70%@ 3 43.8 42.6 29.6 24 27.4 16.3 21.4 20.9 20 33.5 43.3 42.2
10-70%@ 6 44.1 36.1 26.5 20.3 19.3 18.9 18.7 21.4 22.8 34.3 42.1 39.1
10-70%@ 9 40.1 32.6 21.7 20.4 15.8 17.7 18.3 20.8 25.9 37.5 37.4 38.5
10-70%@12 n/a n/a n/a n/a n/a n/a n/a n/a n/a n/a n/a n/a * Broken-cloud means the sky is partially covered by clouds
Table 2.4-8 Monthly Probability of Rainy Sky*1
Monthly Averaged Frequency of Cloud overcast Skies at Indicated GMT Times (%) *2
Lon 94 Jan. Feb. Mar. Apr. May Jun. Jul. Aug. Sep. Oct. Nov. Dec.
>= 70%@ 0 n/a n/a n/a 30.6 29.3 19.7 20.9 22.6 n/a n/a n/a n/a
>= 70%@ 3 27.4 40.5 57.6 54.8 53.2 58.9 51.4 47.3 48.1 40.1 23.1 31
>= 70%@ 6 37.8 49.3 61.2 62.4 65.9 66.5 62.7 51.4 47.5 36.2 28.3 33.5
>= 70%@ 9 47.8 59.3 71.9 70 73.7 66.6 65.5 54.9 49 41.6 35.4 42.9
>= 70%@12 n/a n/a n/a n/a n/a n/a n/a n/a n/a n/a n/a n/a *1 : the sky of rainy day
*2 : the sky is mostly covered by clouds or rainy day
Looking at these data, there is higher possibility that the sky is cloudy or rainy than fine at Golmud. Cloud is one of major source of diffusion sunlight and having clouds in the sky may not hinder PV generation that much.
2.4.3 Reflection Light from Solar PV System
It is often said that reflection of sunshine from PV modules disturbs driver who is driving a car or gives uncomfortable feeling to some people in Japan. When such case happened, the azimuth of PV panels is obliged to change. Fish-eye lens is enabled to see whether reflection light of PV modules happens or what time it happens. How to obtain reflection sunlight is shown in Fig. 2.4-15.

Renewable Energy Development Chapter 2 Final Report Advanced Technology for Grid-Connected Solar PV Systems
2 - 53
Fig. 2.4-15 Method of Getting Reflection Sunlight
Fig. 2.4-16 shows that reflection of sunlight projection to which gives the influence to
the objects (cars and/or people) is shown only in the morning and evening at summer
season. Thus, the fish eye lens can evaluate reflection of sunlight which affects
influence to the objects (cars and/or people) through a year.
Fig. 2.4-16 Reflection Light at 10MW PV Site (Tilt Angle 35)
North
West East
South
Reflection sunlight
projection
These parts in summer season give the influence to the objects
incident angle θ1= reflection angle θ2
Picture image
Reflection sunlight is symmetric to incident sunlight with center of picture. L1=L2
Fisheye lens
L1
L2
Center line
Incident sunlight
Reflection sunlight
2 1
Tilt angle
Reflection sunlight
Incident sunlight
center

Chapter 2 Renewable Energy Development Advanced Technology for Grid-Connected Solar PV Systems Final Report
2 - 54
2.5 Assessment Tools for Solar PV System Economics
Generated energy (kWh) of a solar PV system depends on amount of the insolation
and ambient temperature of the site, and it has a direct impact on a project viability.
Therefore it is necessary to have a useful assessment tools in a feasibility study to
check the cost and benefit of a PV project. Free simulation tool named RETScreen28
is an easy to use example for preliminary study, based on downloaded solar PV
generation data of various locations of the world. In this section, the use of
RETScreen is demonstrated. Note that the financial exercise shown in this section is
for demonstration purpose only.
2.5.1 Outline of RETScreen
RETScreen is a tool that makes it easier for planners, decision-makers and industry to
consider energy efficient and RE technologies at the critically important initial planning
stage. This tool provides the following functions:
Enables assessment of possible projects at low cost
Free-of-charge to users around the world via the Internet & CD-ROM
Training & technical support available via an international network of RETScreen
Trainers
Industry products & services accessible via an Internet Marketplace
RETScreen can simplify preliminary evaluations with relatively little user input and
calculate key technical and financial viability indicators automatically. Based on cash
inflows, such as energy sales, fuel savings, incentives and production/GHG29 credits,
and cash outflows, such as equity investment, annual debt payments, O&M payments
and periodic costs, RETScreen shows NPV30, simple payback, IRR31 and etc. as
indicators. It also draws the curve of cumulative cash flow. A demonstration of
RETScreen usage for a PV project is shown below:
2.5.2 Input of Project Information
Basic project information such as project name, location, technology and type are
input as shown in Fig. 2.5-1. A user has to enter information in the yellow cells, but the
blue cells are optional. Here, in the cell of “Analysis type”, "Method 1" is a simplified
single spreadsheet option, and "Method 2" is a more detailed approach. After
specifying “Golmud” for “Climate data location”, and by selecting “select climate data
28 This can be downloaded from RETScreen International. : http://www.retscreen.net/ 29 Greenhouse Gas 30 Net Present Value 31 Internal Rate of Return

Renewable Energy Development Chapter 2 Final Report Advanced Technology for Grid-Connected Solar PV Systems
2 - 55
location”, the Golmud site data is downloaded from the Internet and shown as in Fig.
2.5-232. Fig. 2.5-1 and 2.5-2 are in the “Start” sheet of RETScreen.
Fig. 2.5-1 Input of Project Information
Fig. 2.5-2 Site Data by NASA (downloaded automatically)
2.5.3 Specifying Energy Model
In the “Energy Model” sheet (Fig. 2.5-3), “Dairy solar radiation – tilted (kWh/m2/d)” is
shown and by specifying some technical parameters for PV system and inverter,
monthly “Electricity exported to grid” is calculated. Annual exported electricity to grid is
estimated to be 15,008MWh 33 in this case, a little smaller than the result of
Consultant’s study in this report. And user specifies “Electricity export rate” here.
32 In Fig. 2.5-2, “Heating design temperature” is the minimum temperature that has been measured for a frequency level of at
least 1% over the year, and “Cooling design temperature” is the minimum temperature that has been measured for a frequency level of at least 99% over the year. Both parameters are used to estimate heating/cooling energy demand and are not used in Golmud case.
33 This value is smaller than 16882.8MWh in Table 2.3-1, because latter value is estimated by the analysis with fish-eye lens to take into account diffusion lights.

Chapter 2 Renewable Energy Development Advanced Technology for Grid-Connected Solar PV Systems Final Report
2 - 56
Fig. 2.5-3 Input of Energy Model
2.5.4 Input of Cost Data
Fig. 2.5-4 is the “Cost Analysis” sheet. A user specifies all the initial and operating
costs here. Cost estimation of 10MW Pilot PV system for Golmud is shown in Table
4.2-1. Total of equipment installation, building construction and other construction cost
are entered in “Road construction” cell, and ones of power conditioner, other
equipment and central control in the user specified “Power Conditioner, Other Equip.
& Central Control” cell. O&M cost is 7% of year’s depreciation as shown in the Section
4.2.

Renewable Energy Development Chapter 2 Final Report Advanced Technology for Grid-Connected Solar PV Systems
2 - 57
Fig. 2.5-4 Input of Cost Data
2.5.5 Financial Analysis
In the “Financial Analysis” sheet, a user specifies “Financial parameters” (Fig. 2.5-5)
and “Annual income” (Fig. 2.5-6). In 10MW Pilot Project case, there are not only
income tax but also VAT and additional tax. Unfortunately RETScreen doesn’t have a
cell in which VAT and additional tax are input, so these values are entered in the cells
“Other income (cost)”. In the Section 4.2, annual deterioration of output of the PV
system is assumed at 0.8%. To take this into account, -0.8% is input in the cell
“Escalation rate” in “Electricity export income” and “Other income (cost)”.
Fig. 2.5-5 Input of Financial Parameters Fig. 2.5-6 Input of Annual Income

Chapter 2 Renewable Energy Development Advanced Technology for Grid-Connected Solar PV Systems Final Report
2 - 58
Fig. 2.5-7 shows “Project costs and savings/ income summary”. RETScreen calculates indicators that look at revenues and expenses over the life of the project. The simulation outputs are provided in Fig. 2.5-8 to Fig. 2.5-10. In Fig. 2.5-8, it can be seen after-tax IRR equity is 3.3%, simple payback is 12.3 years and Equity payback is 14.3 years. In comparison with the Section 4.2, this IRR is smaller. The reason for the difference possibly comes from the smaller generated energy estimated with RETScreen than the expected energy used wherever else in this report, the latter of which takes into account the diffusion light effect. In Fig. 2.5-9, cash flows in pre-tax, after tax and cumulative are shown in table, and cumulative cash flow is drawn in a graph as shown in Fig. 2.5-10.
Fig. 2.5-8 Financial Viability Fig. 2.5-9 Yearly Cash Flow
Fig. 2.5-7 Costs & Income
Summary
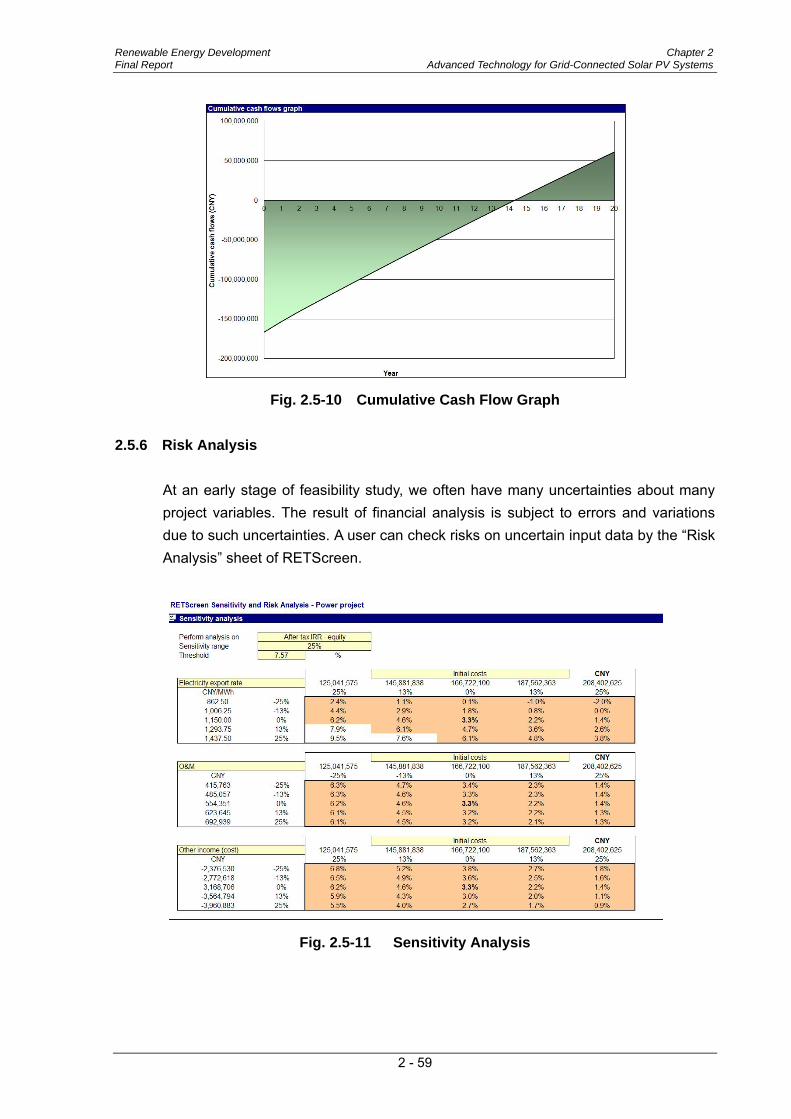
Renewable Energy Development Chapter 2 Final Report Advanced Technology for Grid-Connected Solar PV Systems
2 - 59
Fig. 2.5-10 Cumulative Cash Flow Graph 2.5.6 Risk Analysis
At an early stage of feasibility study, we often have many uncertainties about many project variables. The result of financial analysis is subject to errors and variations due to such uncertainties. A user can check risks on uncertain input data by the “Risk Analysis” sheet of RETScreen.
Fig. 2.5-11 Sensitivity Analysis

Chapter 2 Renewable Energy Development Advanced Technology for Grid-Connected Solar PV Systems Final Report
2 - 60
RETScreen can show how the viability of the project changes when two key input parameters vary simultaneously. Fig. 2.5-11 is an example of such a sensitivity analysis. A user can evaluate the impact on the after-tax IRR-equity of fluctuations of initial cost and electricity export rate, O&M cost and other cost (VAT34 & additional tax) for plus/minus 25% deviation. If we have the higher tariff at CNY35
1,420 per MWh shown in Table 4.2-4, the after-tax IRR-equity can be improved to approx. 6%. To attain IRR more than 9%, initial cost have to be reduced by 25% and electricity export rate shall be raised by 25%.
This kind of exercise can be made without special knowledge with RETScreen.
Fig. 2.5-12 Impact Analysis (After-tax IRR-equity)
Tornado chart” shown in Fig. 2.5-12 is generated by RETScreen as well. It shows which parameters have the most influence and how much the changes in the parameters affect after-tax IRR-equity. In this example, a user can easily identify electricity export rate and initial cost have great impact on after-tax IRR-equity. RETScreen has a Risk Analysis Model based on a “Monte Carlo simulation” which is a method whereby a probability distribution of possible financial indicator outcomes is generated by using randomly selected sets of values as input parameters, within a predetermined range, to simulate possible outcomes. “A predetermined range” is specified as “Level of risk”, the percentage of probability that the values fall outside the confidence interval (e.g., an 80% confidence interval has a 20% level of risk). An example of Monte Carlo simulation result on after-tax IRR-equity is shown in Fig.
34 Value Added Tax 35 Chinese Yuan

Renewable Energy Development Chapter 2 Final Report Advanced Technology for Grid-Connected Solar PV Systems
2 - 61
2.5-1336
. With this result, we can see that the IRR will fall within the range of 3.4±0.4% with approx. 12.5% probability, and there is only a 20% probability that the IRR will fall outside the range between 1.7% and 5.0%.
Fig. 2.5-13 Distribution of Key Indicators (After-tax IRR-equity)
36 In Fig. 2.5-13, vertical axis is Frequency and horizontal axis is After-tax IRR-equity.

Renewable Energy Development Chapter 3 Capacity Development in the Planning, Design, Final Report Construction, and O&M of a Grid-connected Solar PV System
CHAPTER 3
CAPACITY DEVELOPMENT IN THE PLANNING, DESIGN, CONSTRUCTION, AND O&M
OF A GRID-CONNECTED SOLAR PV SYSTEM
Renewable Energy Development Chapter 3 Capacity Development in the Planning, Design, Final Report Construction, and O&M of a Grid-connected Solar PV System
3 - 1
CHAPTER 3 CAPACITY DEVELOPMENT IN THE PLANNING, DESIGN, CONSTRUCTION, AND O&M
OF A GRID-CONNECTED SOLAR PV SYSTEM 3.1 Performance Assessment of the Selected Grid-connected Solar PV System 3.1.1 300kW Grid-connected Solar PV System in Xining, Qinghai
(1) Objective of the Demonstrative Project
There is a concern over a large-scale introduction of solar PV systems to the power grid, as solar PV systems’ inherent fluctuation in output may pose serious problems of power quality of electric power system. The demonstrative project was implemented in Qinghai Province, PRC to assess the effectiveness of stabilization with the integrated control system utilizing EDLC 1
. In this demonstration project, EDLC featuring compact design and high maintainability is used as a system that demonstrates its functionality in reducing short-term output fluctuations.
(2) System Configuration of the Demonstration Project
The system consists of i) 300-kW solar PV system (PV system), ii) 75-kW output power stabilization system (EDLC system), iii) 300-kW bi-directional inverter (converter) for grid connection, iv) Inverter to supply power to loads, v) Monitor and control system, and vi) Low-voltage incoming panel all shown in Fig.3.1-1.
1 Electric Double-Layered Capacitors

Chapter 3 Capacity Development in the Planning, Design, Renewable Energy Development Construction, and O&M of a Grid-connected Solar PV System Final Report
3 - 2
Fig. 3.1-1 300kW Grid-connected Solar PV System
The system shown above is designed to output electric power that is output from the PV system (i) and smoothed by the EDLC system (ii) to the low-voltage power distribution line via the Converter (iii) and the low-voltage incoming panel (vi), and also to supply power from the inverter (iv) to load using the DC bus bar as the powder supply. The monitor and control system (v) is designed to record and make measurement of system protection/control data such as voltages and currents of all sections as well as analysis/assessment data such as the amount of solar radiation and temperatures, and further to control the whole system.
Solar radiation meters/Temperature
indicator
i) PV power generation system (PV system)
300-kW PV
Power collector
Power collector
CHP 400kVA
Electric double-layered capacitor, 1 kWh
Load
High-voltage distribution line Plant control device (including
stabilization control)
Monitor and measuring device
CNV 300kVA
: Power line : Control signal line : Measuring signal line
INV 10kVA
CHP 75kW
DC bus bar (DC unit)
iii) Bidirectional inverter (converter) for grid connection
ii) Output power stabilizing system (EDLC system)
iv) Inverter to supply power to load
v) Monitor and control system
vi) Low-voltage incoming panel

Renewable Energy Development Chapter 3 Capacity Development in the Planning, Design, Final Report Construction, and O&M of a Grid-connected Solar PV System
3 - 3
Fig. 3.1-2 Configuration of Test Circuit for Real Facility Tests
Fig. 3.1-3 Results of Tests of EDLC Effect with PV Output forcedly varied
at 1-Hz Frequency (With EDLC not controlled)
Pow
er (
kW)
Elapsed time (sec)

Chapter 3 Capacity Development in the Planning, Design, Renewable Energy Development Construction, and O&M of a Grid-connected Solar PV System Final Report
3 - 4
Fig. 3.1-4 Results of Tests of EDLC Effect with PV Output forcedly varied
at 1-Hz Frequency (With EDLC controlled)
(3) Lessons learned from this Demonstrative Project
The technical knowledge obtained in this demonstrative research is a technology
useful in stabilizing power output to be distributed to the grid system even for a short
period of time when RE with unstable output such as solar PV system power
generation is increasingly interconnected to the grid system.
The achievements of this demonstrative research are as follows.
1) With regard to compensation of output fluctuation, output power stabilization and
control system using the EDLC were developed and verified that the system
could stabilize a short period fluctuation of the output of the solar PV system. In
addition, measurement of efficiency of the EDLC was made and it was proved
that no changes were observed during this demonstrative operation period.
2) With regard to integrated control, it was verified by analyzing data on
demonstrative operation over one year that fluctuation in DC bus voltage and
output-point voltage on the inverter (converter) AC side is within the given range
(DC bus voltage: 10% of reference voltage / Output-point voltage on the
converter AC side: 7% of reference voltage).
3) It was verified that the inverter started up in a period of 1.14 seconds for the
targeted value of the order of 2 seconds. As conclusion, when the RE, such as
solar PV system is increasingly interconnected to the power grid system, the
EDLC equipment combining the solar PV system is very efficient to compensate
output of solar PV system and stability the grid system.
Pow
er (
kW)
Elapsed time (sec)

Renewable Energy Development Chapter 3 Capacity Development in the Planning, Design, Final Report Construction, and O&M of a Grid-connected Solar PV System
3 - 5
As condition, when the RE, such as solar PV systems are increasingly interconnected to the power grid system, EDLC equipment combining solar PV system is very efficient to compensate output of solar PV system and stabilize the power grid.
3.1.2 Sakai Mega Solar PV Power Station
(1) Premise
To supply electricity to the customers is most important obligation of the electric power company. Quality of electricity is explained as follows;
- Frequency: appropriate frequency - Voltage: appropriate voltage - Reliability: sustainable electricity supply
On the other hands features of solar PV system are
- Fluctuation: power generation depends on the weather condition. As it is impossible to store generated capacity output control of solar PV system is difficult.
- Surplus: As power generation depends on the weather condition, large scale introduction of solar power generation may lead to excess electricity through the entire power system.
- Reverse power flow: Excess electricity flow back into the power system.
(2) Verification Items for Sakai Mega Solar Power Station
The KANSAI Electric Power Co., Inc. constructed a 10 MW solar PV system in Sakai City, Osaka Prefecture, Japan (“Sakai Mega Solar PV Power Station”).

Chapter 3 Capacity Development in the Planning, Design, Renewable Energy Development Construction, and O&M of a Grid-connected Solar PV System Final Report
3 - 6
Table 3.1-1 Verification Items
Item Verification
Facility Construction - Reduction of construction cost - Decision of plant specification as an industrial use facility (Japan’s first
industrial-use solar power generation plant)
Operation - Reduction of maintenance and management cost
System Fluctuation in frequencies
- Analysis of output fluctuations at a mega solar power generation
Fluctuation in voltages
- Analysis of normal system voltage fluctuations at a mega solar power generation plant
- Verification of effectiveness of the countermeasures against normal system voltage fluctuations, operating method of power conditioners, etc.
High Harmonic - Verification of high harmonic occurrence level due to the interconnection of multiple inverters
Drop out of all generators
- Verification of voltage decline rate due to a failure at the upper voltage system and the range of continuous operation of power conditioner
(3) Reduction of Construction Cost
Different types of solar panels have different conversion ratios. The area required to install a 10MW solar panels depend on the type of panel. Even if the cost of solar panel is lower, high land cost and high construction cost may result in rather expensive total cost. Table 3.1-2 shows the relationship between type of solar panel and occupied area for 10 MW and Fig. 3.1-5 shows relationship between cost and efficiency of solar panel.
Table 3.1-2 Type of Solar Panel and Occupied Area
Type of solar battery Conversion ratio Occupied area for 10MW
Crystalline system Approx.15% Approx.70,000m2
Thin-film system Approx.8% Approx.130,000m2

Renewable Energy Development Chapter 3 Capacity Development in the Planning, Design, Final Report Construction, and O&M of a Grid-connected Solar PV System
3 - 7
Fig. 3.1-5 Cost and Efficiency of Solar Panel
(4) Comprehensive Evaluation in Selecting the Type of Solar PV System
The value of solar PV system is comprehensively evaluated taking into account the bid price and degradation ratio of PV panel in addition to predetermined system cost and annual production.
Evaluated value (yen/kWh) =
Solar Panel Cost Manufacturer’s bid
price +
System cost Unambiguously determined
considering the conversion ratio and panels of solar battery
+ Cumulative total of
land cost and property tax
Annual energy
production x
Degradation ratio Manufacturer's declared value
(20-year guarantee equivalent to Western countries)
x 20 years
Fig. 3.1-6 Evaluated Value for the Solar PV System Cost
(5) Development of Mounting Hardware which can accommodate Unequal Settlement
There is unequal sinking at the basement of the solar PV system and special mounting hardware was developed for its countermeasure.
Conversion ratio
Power output (energy)
Incidence energy (consistent per unit area)
Total cost
Cost of solar batteries(as more expensive as higher efficiency)
Land and construction work cost(As less expensive as higher efficiency)
Cost
Low efficiency High efficiency
Conversion ratio
Power output (energy)
Incidence energy (consistent per unit area)
Total cost
Cost of solar batteries(as more expensive as higher efficiency)
Land and construction work cost(As less expensive as higher efficiency)
Cost
Low efficiency High efficiency
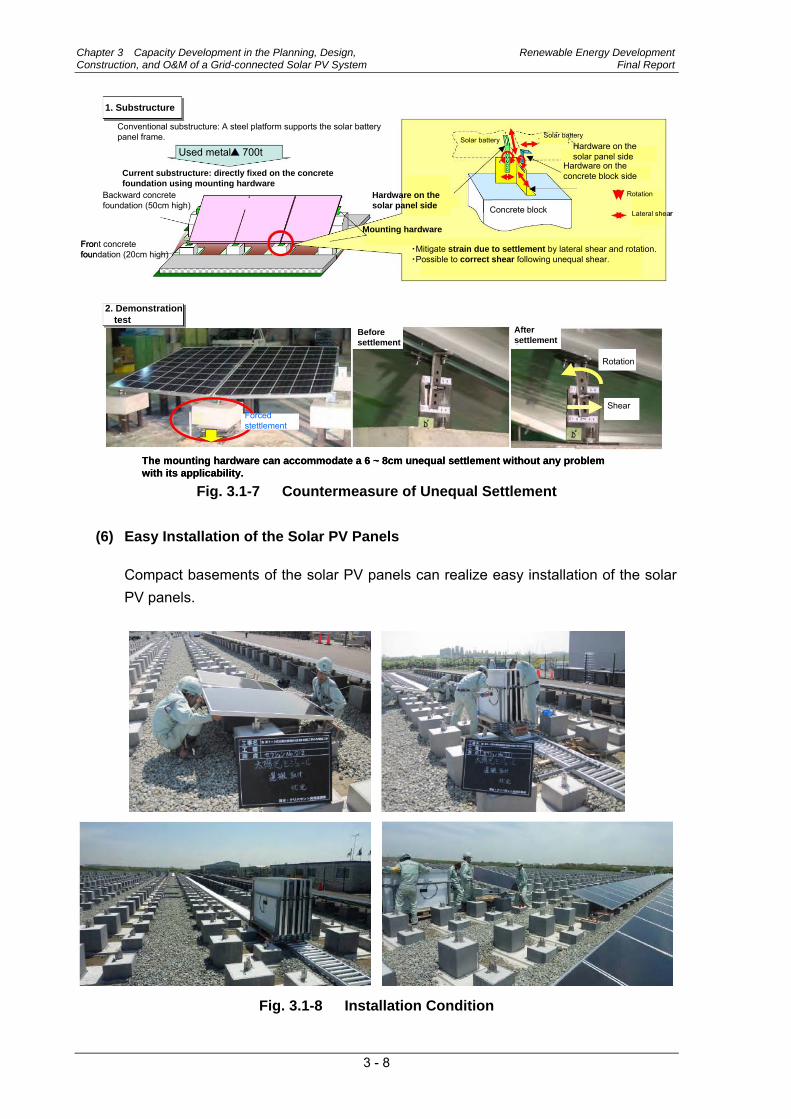
Chapter 3 Capacity Development in the Planning, Design, Renewable Energy Development Construction, and O&M of a Grid-connected Solar PV System Final Report
3 - 8
Fig. 3.1-7 Countermeasure of Unequal Settlement
(6) Easy Installation of the Solar PV Panels
Compact basements of the solar PV panels can realize easy installation of the solar PV panels.
Fig. 3.1-8 Installation Condition
2. Demonstration test
1. Substructure
Conventional substructure: A steel platform supports the solar battery panel frame.
Used metal 700t
Current substructure: directly fixed on the concrete foundation using mounting hardware
Backward concrete foundation (50cm high)
Front concrete foundation (20cm high)
Mounting hardware
・Mitigate strain due to settlement by lateral shear and rotation.・Possible to correct shear following unequal shear.
Hardware on the solar panel side
Hardware on the solar panel side
Hardware on the concrete block side
Concrete block
Solar batterySolar battery
Rotation
Lateral shear
Before settlement
After settlement
Rotation
ShearForced stettlement
The mounting hardware can accommodate a 6 ~ 8cm unequal settlement without any problem with its applicability.

Renewable Energy Development Chapter 3 Capacity Development in the Planning, Design, Final Report Construction, and O&M of a Grid-connected Solar PV System
3 - 9
(7) Improvement of Fluctuation Ratio
Although the fluctuation ratio of solar insolation at individual location points is rather high, the averaged fluctuation becomes smaller due to off-setting effect. It is planned to analyze the data to development of supply and demand control system.
Fig. 3.1-9 Measured Solar Radiation
(8) Technology to predict Amount of Insolation (Prediction of PV Output)
The measured solar radiation will be utilized to verify and improve the accuracy of the method of prediction of PV output. Research programs are under progress on the prediction of insolation by means of the weather forecasting system. With a high level of errors in the prediction, it is necessary to develop new technologies to improve the accuracy of prediction.
Locations of pyranometersin Kansai Electric supply area
Toyooka Office Hikone Office
Kobe Substation HigashisumiyoshiOffice
Fluctuation ratio averaged over 60 points *Assuming 1000W/m2 solar radiation as 100%
Decreasing fluctuation ratio
Fluctuation ratioFluctuation ratio
Fluctuationratio
Fluctuation ratio
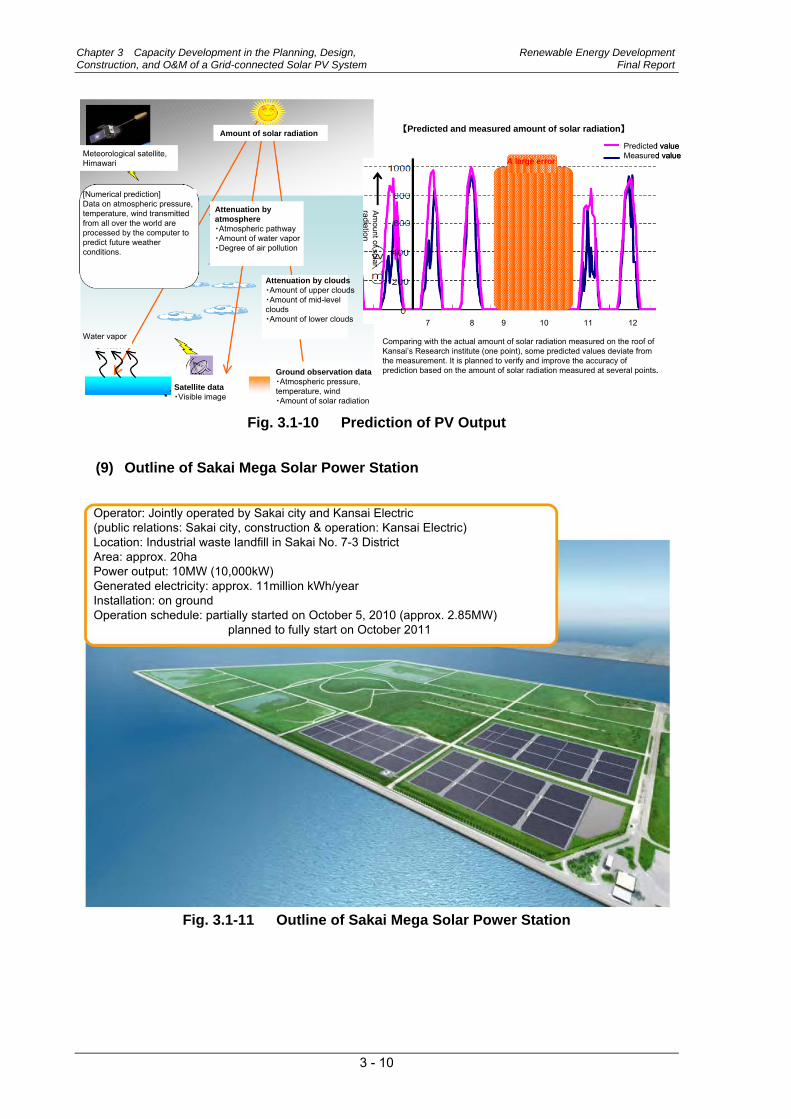
Chapter 3 Capacity Development in the Planning, Design, Renewable Energy Development Construction, and O&M of a Grid-connected Solar PV System Final Report
3 - 10
Fig. 3.1-10 Prediction of PV Output
(9) Outline of Sakai Mega Solar Power Station
Fig. 3.1-11 Outline of Sakai Mega Solar Power Station
Meteorological satellite, Himawari
Amount of solar radiation
[Numerical prediction]Data on atmospheric pressure, temperature, wind transmitted from all over the world are processed by the computer to predict future weather conditions.
Attenuation by atmosphere・Atmospheric pathway・Amount of water vapor・Degree of air pollution
Ground observation data・Atmospheric pressure, temperature, wind・Amount of solar radiation
Satellite data・Visible image
Water vapor
【Predicted and measured amount of solar radiation】
Predicted valueMeasured value
Comparing with the actual amount of solar radiation measured on the roof of Kansai’s Research institute (one point), some predicted values deviate from the measurement. It is planned to verify and improve the accuracy of prediction based on the amount of solar radiation measured at several points.
Attenuation by clouds・Amount of upper clouds・Amount of mid-level clouds・Amount of lower clouds
Am
ount of solar radiation
A large error
7 8 9 10 11 12
Operator: Jointly operated by Sakai city and Kansai Electric(public relations: Sakai city, construction & operation: Kansai Electric)Location: Industrial waste landfill in Sakai No. 7-3 DistrictArea: approx. 20haPower output: 10MW (10,000kW)Generated electricity: approx. 11million kWh/yearInstallation: on groundOperation schedule: partially started on October 5, 2010 (approx. 2.85MW)
planned to fully start on October 2011

Renewable Energy Development Chapter 3 Capacity Development in the Planning, Design, Final Report Construction, and O&M of a Grid-connected Solar PV System
3 - 11
(10) Location of Sakai Mega Solar PV Power Station
Fig. 3.1-12 Location of Sakai Mega Solar PV Power Station
(11) Lessons Learned
Sakai Mega Solar PV Power Station in the Demonstration project of KANSAI Electric Power and there are several items to be verified shown in Table 3.1-1.
1) Construction cost is consist of several elements (solar panel cost, land cost, etc.) Therefore to integrate those element costs and to evaluate total cost is essential.
2) Installation method which is variable due to the site condition also give influence to the total construction cost. In Sakai case, special hardware which can fix the PV panel easily to the concrete foundation and compact foundation were developed.
3) Geographically spread PV systems make their total output fluctuation smaller than each output fluctuation due to off-setting effect. For Qinghai Province, which has vast area, geographical smoothing effect can possibly be an interesting option for stabilization of total output of PV systems connected to the grid.
4) Insolation forecast by means of the weather forecast is under research and it is necessary to improve the weather forecast system.
Sakai Mega Solar Power Generation Plant
Sakai No.7-3 District
Forest of co-existing
Windmill square
Minato Sakai Green Square
Sakai No.7-3 District
Eco town

Chapter 3 Capacity Development in the Planning, Design, Renewable Energy Development Construction, and O&M of a Grid-connected Solar PV System Final Report
3 - 12
3.2 Capacity Assessment of the Implementation Agency 3.2.1 Solar Radiation and Other Resources
Insolation Estimation Insolation is automatically estimated using computer program of QBE. The input data is gotten from meteorological neighboring observatories. Input items are shown as below. a) Longitude of the site b) Latitude of the site c) Altitude of the site d) Reflection rate from the ground e) Monthly direct irradiation The result is shown in Table 3.2-1.
Table 3.2-1 Insolation at Golmud Site (MJ/m2)
tilt angle 36° tilt angle 36°
Jan. 523.113 Sep. 694.949
Feb. 530.068 Oct. 704.14
Mar. 647.011 Nov. 594.694
Apr. 726.419 Dec. 515.868
May 772.344 Winter half year 3514.894
Jun. 717.901 summer half year 4394.102
Jul. 726.001 total year 7908.996
Aug. 756.488
This estimation way seems to be standard in PRC. Therefore, it is converted to kWh as Table 3.2-2.

Renewable Energy Development Chapter 3 Capacity Development in the Planning, Design, Final Report Construction, and O&M of a Grid-connected Solar PV System
3 - 13
Table 3.2-2 Insolation at Golmud Site (Conversion Megajoule to kWh) (kWh/m2)
tilt angle 36° tilt angle 36°
Jan. 145.31 Sep. 193.04
Feb. 147.24 Oct. 195.59
Mar. 179.73 Nov. 165.19
Apr. 201.78 Dec. 143.30
May 214.54 Winter half year 976.36
Jun. 199.42 summer half year 1220.58
Jul. 201.67 total year 2196.94
Aug. 210.14
Insolation value is very good, and if it is compared with other area’s insolation, Golmud site will be one of the best places to get insolation in the world. Best tilt angel 36° is calculated by QBE.
3.2.2 Evaluation of the Site Analysis
(1) Site Selection
Joint site reconnaissance of Golmud 10 MW Pilot Project Site was conducted with QBE engineers and the Consultant in July 2011. Golmud is a vast barren area and there seems to have little rain throughout the year by the data of neighboring observatories. There is also NASA’s data available for the region but the precipitation is not known from satellite-image based on NASA’s data.
(a) Eastern view (b) Southern view (c) Western view Fig. 3.2-1 10MW PV Sight View
Generally speaking, appropriate site conditions for PV power generation are listed below;
1) Good insolation, 2) Sufficient flat land to install PV modules,

Chapter 3 Capacity Development in the Planning, Design, Renewable Energy Development Construction, and O&M of a Grid-connected Solar PV System Final Report
3 - 14
3) Existence of no obstacles that cast shadow on PV modules throughout a year, 4) Proximity of electric grid with sufficient capacity to send the generation power to
the demand, 5) Access to the site to transport equipment and construction machines, 6) Availability of water for installation and maintenance, 7) Appropriate climatic conditions, mild wind in particular, 8) Existence of less sandy dust.
Golmud site satisfies conditions 1) to 3) mentioned above. For the condition 4) a solar PV system developer has to construct transmission line to the nearest substation at his own responsibility. This is a standard procedure in PRC. For the condition 5) there are no big rivers or high mountains on the way from main road to site that may hinder the transportation of equipment, etc. For the condition 6) although there is no water supply available at the site, some alternative measures, such as using water tank to transport water to the site, is exist. For the condition 7) the meteorological data shows that there is relatively strong wind from west. According to the design engineer of QBE, there has not been reported that PV arrays of the existing solar PV power stations were damaged by strong western wind in the past at the site. For the condition 8), sandy wind at the site can be a matter of concern. In the maintenance of solar PV power station, cleaning the accumulation of sandy dust on PV modules can be a problematic issue.
Although there are some conditions at the site that are not favorable to solar PV power generation, Golmud site is considered as very suitable site for solar PV power generation.
(2) Tilt Angle of Solar PV Panel
(i) It is well known that solar PV system generates power not only by the direct sunlight but also diffused sunlight from surroundings. However there is no standard evaluation method of diffuse sunlight. There are many solar PV systems which tilt angle of the solar panels is the same as the latitude of the site but the diffused sunlight should be considered for power generation of the solar PV system. If defused sunlight effect is counted into power generation of solar PV system, it is better that the tilt angle of the solar panels is lower than the latitude.
(ii) Recommendation Therefore it is recommended to have lower tilt angle of the solar panel for the Golmud PV system to increase of power generation of the solar PV system. Further, lower tilt angle of solar panel reduces the cost of support structure and makes maintenance of solar panels easy. The lower tilt angle of solar panel helps cleaning the surface of the solar panels.

Renewable Energy Development Chapter 3 Capacity Development in the Planning, Design, Final Report Construction, and O&M of a Grid-connected Solar PV System
3 - 15
3.2.3 Design Ability of 10MW Solar PV System
QBE has obtained a necessary license to be an operator of 10 MW solar PV system.
There are engineers in QBE who are licensed to provide consulting services by the
Government. Also, QBE has many experiences of installing isolated solar PV systems
over 100 sites already.
(1) PV System Configuration
QBE provided the Consultant some drawings from their F/S report of 10MW Pilot
Project. The system configuration is shown Fig.3.2-2.
From operation and maintenance point of view, this configuration is clear and will not
cause misunderstanding, which is an important element in designing solar PV system
configuration.
Fig. 3.2-2 Main Electric Circuit
(2) Island Operation
QBE engineers designed island operation protective function in the inverter.
However, there needs an argument, in terms of economy, whether one set of

Chapter 3 Capacity Development in the Planning, Design, Renewable Energy Development Construction, and O&M of a Grid-connected Solar PV System Final Report
3 - 16
protection relay is placed at secondary side of the main transformer or each inverter has one set of protection relay inside the inverter. The Consultant found that they need to discuss with power utility company whether the islanding detector is necessary or not, but there was no chance available to do so. The Consultant is of the opinion that islanding phenomena would not happen in this solar PV system configuration, because there are no loads between the solar PV system and the substation which receive power from the solar PV system.
Fig. 3.2-3 illustrates a possible condition of occurrence of islanding phenomena. Fig. 3-2-3 (b) shows islanding phenomena can happen under the condition such as P = D1 + D2 + D3. In the Golmud case (c), there is no demand power of consumer between PV site and substation. PV-generated power, P, has no chance to be equal to the size of demanded power. Therefore, islanding phenomena would not occur. Of course, this judgment should be supported by the power utility and the authority.
S/S
D1
D2
D3 P
(a) normal condition
(c) 10MW solar PV system in Golmud case
S/S
P
P: PV generation power D: Demand power by consumer
(b) islanding condition
Islanding condition P ≒ D1+D2+D3
D2
D1 D3
S/S
P
Fig. 3.2-3 Islanding Phenomena and Possibility of Occurrence

Renewable Energy Development Chapter 3 Capacity Development in the Planning, Design, Final Report Construction, and O&M of a Grid-connected Solar PV System
3 - 17
(3) Structural Design
According to QBE engineers’ experience, the largest of PV system installed by them was 300 kW. PV array diagram was not provided to the Consultant to evaluate. The reason given was that PV module manufacturer had not been decided. Apart from main equipment, basic data in Golmud such as wind pressure, earthing resistance, etc. to have been considered in QBE’s design which was shown to the Consultant for review.
10MW Pilot Project was designed to withstand the wind load of 0.45N/m2. This design factor comes from the technical standard of PRC. Wind load was evaluated with reference to the load code for the design of building structure. Design wind in the code is for the extreme wind with recurrence period of 100 years.
PV system of 10 MW Pilot Project was divided into 10 sets of 1MW subsystems. This setting gives more reliable as the whole system continues to be operated even when some subsystems are broken. (Fig. 3.2-4)
Fig. 3.2-4 Configuration of a PV System in 10MW Pilot Project
PV array
Switch board
Switch board
Power conditioner Lower voltage
panel
Transformer
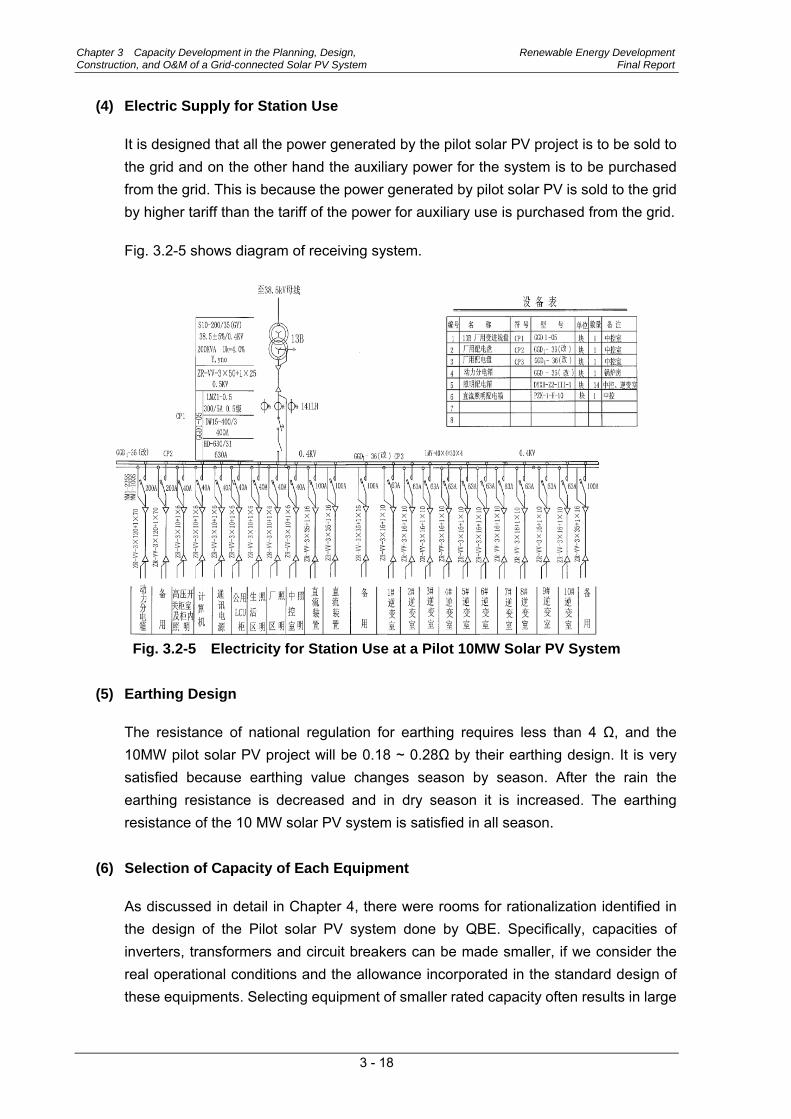
Chapter 3 Capacity Development in the Planning, Design, Renewable Energy Development Construction, and O&M of a Grid-connected Solar PV System Final Report
3 - 18
(4) Electric Supply for Station Use
It is designed that all the power generated by the pilot solar PV project is to be sold to the grid and on the other hand the auxiliary power for the system is to be purchased from the grid. This is because the power generated by pilot solar PV is sold to the grid by higher tariff than the tariff of the power for auxiliary use is purchased from the grid.
Fig. 3.2-5 shows diagram of receiving system.
Fig. 3.2-5 Electricity for Station Use at a Pilot 10MW Solar PV System
(5) Earthing Design
The resistance of national regulation for earthing requires less than 4 Ω, and the 10MW pilot solar PV project will be 0.18 ~ 0.28Ω by their earthing design. It is very satisfied because earthing value changes season by season. After the rain the earthing resistance is decreased and in dry season it is increased. The earthing resistance of the 10 MW solar PV system is satisfied in all season.
(6) Selection of Capacity of Each Equipment
As discussed in detail in Chapter 4, there were rooms for rationalization identified in the design of the Pilot solar PV system done by QBE. Specifically, capacities of inverters, transformers and circuit breakers can be made smaller, if we consider the real operational conditions and the allowance incorporated in the standard design of these equipments. Selecting equipment of smaller rated capacity often results in large

Renewable Energy Development Chapter 3 Capacity Development in the Planning, Design, Final Report Construction, and O&M of a Grid-connected Solar PV System
3 - 19
reduction of procurement costs. This kind of knowledge is important in efficient design of electrical systems including PV systems, but is not widely available outside the organizations deeply engaged in the use of electric equipment, such as electric utilities.
3.2.4 Construction
The construction of 10 MW Pilot Solar Project had to be finished by the end of December 2011. There has been no information given to the Consultant concerning this project and its construction. Therefore, the Consultant had no chance to discuss about construction work of a solar PV system.
3.2.5 Operation and Maintenance Although the information on the organization for operation and maintenance of 10MW Pilot PV Project has not been disclosed, the Consultant assumed that QBE acquired sufficient operation and maintenance experiences and knowledge with their own 300 kW installation. Their experience and knowledge of operation and maintenance with 300kW plant were enough to operate and maintain a 10 MW pilot solar PV system. A 10MW pilot solar PV system demands more sustainability and efficiency. The Consultant expects QBE accumulate more experience with larger solar PV system and verify the performance of 10 MW Pilot Solar PV Project.
3.3 Technical Guidance and a Capacity Enhancement Module 3.3.1 System Configuration
(1) Inverter Capacity
Design total loss before the inverter was 10%. Then the capacity of inverter could be enough to have 90% of the capacity of the solar PV panels. Specifications of inverters may be offered unilaterally by the inverter manufacturer; still it is important here that the user engineers understand each item of the specifications. User’s understanding of the specifications of inverter should be at the same level as manufacturer’s engineers. There are several steps to be taken to improve the knowledge of user engineers.
a) The first step Introduce installation conditions based on the specifications

Chapter 3 Capacity Development in the Planning, Design, Renewable Energy Development Construction, and O&M of a Grid-connected Solar PV System Final Report
3 - 20
b) The second step Introduce necessary function for the solar PV system at the site.
c) The third step Understand specifications of the equipment in detail understand specified value gained from testing method
d) The fourth step Consider appropriate combination of devices, to achieve high efficiency, low cost, long life time, easy maintenance, etc.
(2) Transformer Capacity
The life of a transformer is estimated based on the maximum utilization factor and the load factor and the life measurement method of transformer is established at present.
Considering the fact that the utilization factor of the solar PV system in the night period is zero, less than 90% of inverter capacity is good enough for the capacity of the transformer. Generally speaking, a transformer has overloading capacity. It depends on the insulator used in transformer, the load factor and ambient temperature. Load factor of a transformer used for a grid-connected PV system will be less than 0.3, and air temperature is not high in Golmud compared with Japan’s case. It may be worth considering transformer capacity with smaller capacity than PV system capacity. Of course there is a need to investigate how much the maximum power is, how many hours the continuous operation is, and how often appear in appropriate period.
After these process, a transformer with smaller capacity may be introduced to PV system. Using smaller-capacity transformer will reduce, not only installation cost, but also transformer's electric loss. QBE engineers seem to have sufficient experiences and knowledge to design large-scale PV systems. However, it is necessary to consider the items below.
A life time of dry-type transformer is expressed as below. Y = ae-bθH
Where, θH : maximum temperature of winding wire a : constant b : constant that depends on the insulation class
Example of class F insulation
Half life time period of Class F insulation transformer depends on every +8°C rise.
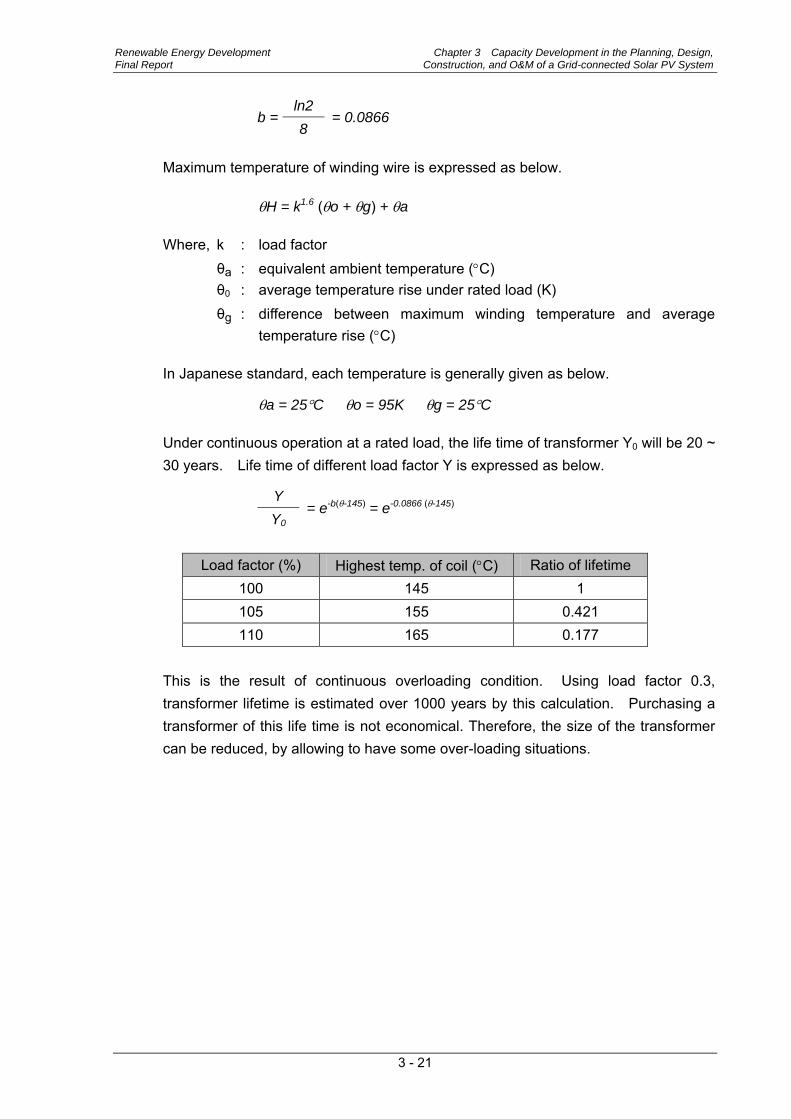
Renewable Energy Development Chapter 3 Capacity Development in the Planning, Design, Final Report Construction, and O&M of a Grid-connected Solar PV System
3 - 21
b = ln2
= 0.0866 8
Maximum temperature of winding wire is expressed as below.
θH = k1.6 (θo + θg) + θa
Where, k : load factor θa : equivalent ambient temperature (°C) θ0 : average temperature rise under rated load (K) θg : difference between maximum winding temperature and average
temperature rise (°C)
In Japanese standard, each temperature is generally given as below.
θa = 25°C θo = 95K θg = 25°C
Under continuous operation at a rated load, the life time of transformer Y0 will be 20 ~ 30 years. Life time of different load factor Y is expressed as below.
Y = e-b(θ-145) = e-0.0866 (θ-145)
Y0
Load factor (%) Highest temp. of coil (°C) Ratio of lifetime 100 145 1 105 155 0.421 110 165 0.177
This is the result of continuous overloading condition. Using load factor 0.3, transformer lifetime is estimated over 1000 years by this calculation. Purchasing a transformer of this life time is not economical. Therefore, the size of the transformer can be reduced, by allowing to have some over-loading situations.

Chapter 3 Capacity Development in the Planning, Design, Renewable Energy Development Construction, and O&M of a Grid-connected Solar PV System Final Report
3 - 22
< Reference > The case of oil filled transformer overloading operation is shown in Fig.3.3-1.
Fig. 3.3-1 Overloading Capacity of Transformer
(3) Circuit Breaker Capacity
In case of fault occurred, the fault current is flown into the circuit breaker from not only upper side of the power grid but also from other solar PV systems. It is necessary to discuss with the reasonable power company about the short circuit capacity as the short circuit current depends on the impedance of transmission lines.
(4) Lightning Protection
The consultant considers that the lightning protection of 10MW Pilot Project has been designed well. However, arresters should be carefully chosen. Fig. 3.3-2 and Table 3.3-1 show the wave shapes of the test current which represent direct lightning current and induced surge current.
Ove
rload
ing
Sca
le F
acto
r

Renewable Energy Development Chapter 3 Capacity Development in the Planning, Design, Final Report Construction, and O&M of a Grid-connected Solar PV System
3 - 23
Fig. 3.3-2 Test Wave
Table 3.3-1 Test Wave and Current
Wave shape 10 × 350μs 8 × 20μs
Imax kA *100 ~ 200kA *5 ~ 20kA
Standard IEC 62305-1 IEC 62305-2
The type of wave shape depends on design of LPZ2 as follows.
Fig. 3.3-3 LPZ Partition
2 Lightning Protection Zone
LPZ 0 LPZ 1
LPZ 2LPZ 3
Home applianceWiring Precision Instrument
10μs t (μs)
100kA
I
8/20μs
10/350μs
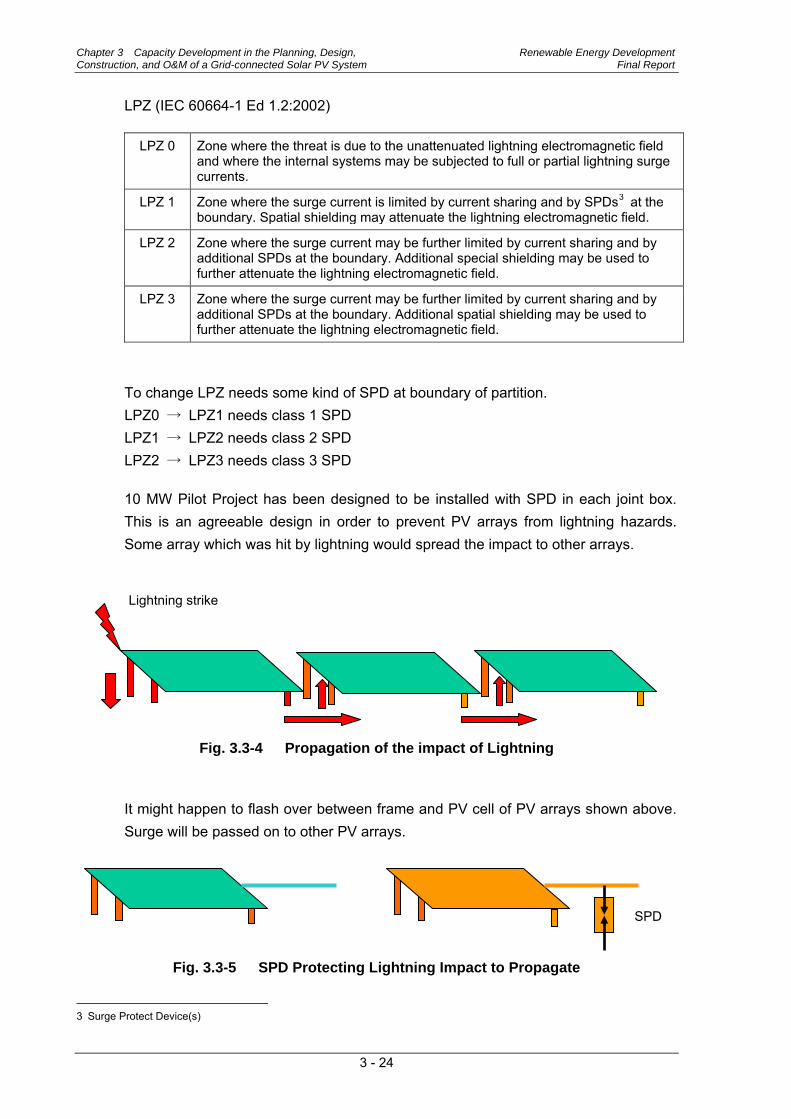
Chapter 3 Capacity Development in the Planning, Design, Renewable Energy Development Construction, and O&M of a Grid-connected Solar PV System Final Report
3 - 24
LPZ (IEC 60664-1 Ed 1.2:2002)
LPZ 0 Zone where the threat is due to the unattenuated lightning electromagnetic field and where the internal systems may be subjected to full or partial lightning surge currents.
LPZ 1 Zone where the surge current is limited by current sharing and by SPDs3
LPZ 2
at the boundary. Spatial shielding may attenuate the lightning electromagnetic field.
Zone where the surge current may be further limited by current sharing and by additional SPDs at the boundary. Additional special shielding may be used to further attenuate the lightning electromagnetic field.
LPZ 3 Zone where the surge current may be further limited by current sharing and by additional SPDs at the boundary. Additional spatial shielding may be used to further attenuate the lightning electromagnetic field.
To change LPZ needs some kind of SPD at boundary of partition. LPZ0 → LPZ1 needs class 1 SPD LPZ1 → LPZ2 needs class 2 SPD LPZ2 → LPZ3 needs class 3 SPD
10 MW Pilot Project has been designed to be installed with SPD in each joint box. This is an agreeable design in order to prevent PV arrays from lightning hazards. Some array which was hit by lightning would spread the impact to other arrays.
Fig. 3.3-4 Propagation of the impact of Lightning
It might happen to flash over between frame and PV cell of PV arrays shown above. Surge will be passed on to other PV arrays.
Fig. 3.3-5 SPD Protecting Lightning Impact to Propagate
3 Surge Protect Device(s)
SPD
Lightning strike

Renewable Energy Development Chapter 3 Capacity Development in the Planning, Design, Final Report Construction, and O&M of a Grid-connected Solar PV System
3 - 25
To avoid damage by lightning, SPD is effective. Function of SPD is to equalize potential between equipment and the ground, which prevent the occurrence of flash over.
(5) Reactive Power Absorption
For alterative current circuit, there are two kinds of power supply. One is effective power and the other is reactive power. The PV system of 10MW Pilot Project will supply only effective power, but transmission line needs reactive power because there is line inductance and capacitance to the ground in transmission line. For this reason, it is very appropriate to install SVC4
in the substation to compensate the lack of reactive power. For 10MW Pilot case, a SVC should be located at the transmission line's end.
(6) Wiring between PV Modules
When the Consultant visited several solar PV plants in Golmud, wiring between modules were not in good condition. Wiring is vibrating and rubbing against PV frame because wiring was not firmly fixed. This condition damages the insolation of wiring. Therefore, wiring needs some more length for setting to absorb vibration and to avoid rubbing against PV frames..
Fig. 3.3-6 Wiring between Modules
Wiring would be set over safety regulation of IP45.
(7) Tilt Angel of PV Arrays
PV system generates electric power with the total intensity of the sun light. Total intensity consists of direct sun light and diffused light. The source of diffused light is everywhere on the earth. Cloud is one of the major sources of diffused light. Fish eye lens projection image can estimates cloud amount as solid angle of sky.
4 Static Var Compensator

Chapter 3 Capacity Development in the Planning, Design, Renewable Energy Development Construction, and O&M of a Grid-connected Solar PV System Final Report
3 - 26
(a) Tilt angle 35° (b) Tilt angle 25° solid angle of sky 4.67 steradian solid angle of sky 5.12 steradian
Fig. 3.3-7 Solid Angle of Sky by Different Tilt Angle
Tilt angle of PV array was set at the same angle as site latitude for the 10MW Pilot Project. This counts for direct sunlight only. But, to harness the total intensity of sunlight which includes diffused light, the tilt angle may be set a little flatter. As shown in Fig.3.3-7, solid angle of sky becomes larger as the tilt angle becomes smaller, meaning PV modules catch more of diffused light. This design method was developed in Japan about 10 years ago. In Fig.3.3-8, the relationship between radiation of diffused sunlight and solid angle of cloud is shown.
The relationship between diffused light and other objects was investigated and there is clear relation. Total radiation on PV modules is the sum of direct sunlight from the sun and diffused sunlight from the sky. Diffused sunlight intensity is not so small to be negligible as on a cloudy day PV system generates reasonable power.
Fig. 3.3-8 Relation between Diffusion Sunlight and Solid Angle of Cloud
solid angle of cloud
diffu
sion
ligh
t

Renewable Energy Development Chapter 3 Capacity Development in the Planning, Design, Final Report Construction, and O&M of a Grid-connected Solar PV System
3 - 27
The Consultant suggests that observation of insolation should be conducted at Golmud site.
The method is as follows.
Observation of insolation with a few PV modules with different tilt angles, other things be in equal. This observation should be continued for at least one year to obtain reliable results.
Fig. 3.3-9 Method of Set Sensor
(8) DC Protection.
DC circuit generally needs insulation to the ground and some monitoring and protection might be necessary. However for PV system it is not clear how to apply insulation system because there is no regulation in guidelines for solar PV system in Japan and in PRC as well.
Fig. 3.3-10 Direct Fault Current Flow
When grounding accident happens in the DC circuit of a solar PV system, the DC fault current flows from PV array through transformer to the ground. DC fault current flows in the transformer as shown in Fig.3.3-10. In this case the transformer may experience insulation deterioration quickly by DC fault current which is dangerous for maintenance people or other people working for solar PV systems. If someone touches the wiring of DC circuit and the wiring does not have enough insulation, electrical shock may happen to this person. Although there is no regulation in Japan,
PV
Grounding
270kV/350V Transformer
DC fault current
Transless Inverter
tilt angle 25°
tilt angle 30°
tilt angle 35°
senso

Chapter 3 Capacity Development in the Planning, Design, Renewable Energy Development Construction, and O&M of a Grid-connected Solar PV System Final Report
3 - 28
some manufacturers install detection relay inside the inverter.
Even if the inverter does not have this function, it is possible to set this function outside the inverter, such as DC OVGR5
.
(9) Short Circuit Current Protection at Substation
In the case of short-circuited failure, the fault current will flows from not only transformer but also other transmission lines that are connected to PV system. Therefore, the capacity of circuit breaker should be designed to be large enough tp handle the total current.
(10) Spare Parts
For maintenance of PV system, some stock of spare parts is necessary.
Fig. 3.3-11 Safety Stock
5 Over Voltage Ground Relay
N
Exchange number / month
Delivery time : month
D
S= a × N × M S: number of spare parts in stock a: coefficient ( >1 ) At first "a" will be desirable 1.5 ~ 2.
A : Short circuit current from transformer B : Short circuit current from PV system through other transmission
A
B
PV System PV System PV System PV System

Renewable Energy Development Chapter 3 Capacity Development in the Planning, Design, Final Report Construction, and O&M of a Grid-connected Solar PV System
3 - 29
Long term operation and maintenance requires not only human resources but also spare parts, especially PV module and inverter parts. Long term maintenance requires more skill in handling complex devices such as power conditioners. Generally, a power conditioner has several electronics boards inside and replacing such boards requires specific skills. If replacement of parts is conducted by manufacturer’s engineer, we will have to allow for 2 or 3 days minimum before arrival of engineers at the site. Unfortunately the skill of manufacturer’s engineer is a fruit of special training, it would be the good chance to obtain the special training in the guarantee period. Through the repeated discussions held between the Consultant and QBE’s engineers about operation and maintenance methods of PV systems, the Consultant confirmed that the knowledge of engineers of QBE were significantly increased.
(11) Further Consideration
When many PV modules with individual characteristics are connected in series, total generation output becomes smaller than the output calculated in theory. This fact is explained using the figures below.
Fig. 3.3-12 I-V Approximation Curve
Using characteristic of PV modules shown in Fig.3.3-12, total power of serial connection is calculated. Even if the standard of characteristics is the same among PV modules, there are some differences. For example, there are three modules that have the same Pmax 2800W but three modules have their own characteristic shown as below and Fig. 3.3-13.
- Module1: Vop is 70V, and Iop is 40A ( Standard) - Module2: Vop is 5% higher than 70V - Module3: Iop is 5% higher than 40A
0
10
20
30
40
50
-10 10 30 50 70 90
Voltage
Curr
ent
Voc=90 VVop=70 V Isc=50A Iop=40 A Pmax=2800 W FF=0.62

Chapter 3 Capacity Development in the Planning, Design, Renewable Energy Development Construction, and O&M of a Grid-connected Solar PV System Final Report
3 - 30
Series connection of different Iops and Vops decrease total power generation shown as the black curve in Fig. 3.3-13.
Fig. 3.3-13 Power of Serial Connection
This means that a PV array should consist of the modules with the same Vop and Iop values. As a solar PV system is expected to be in operation for long time, we should be careful when replacing PV modules with different model.
3.4 Solar PV Supply Chain 3.4.1 Overall Comments
The quality of upstream manufacturing process of solar cell impacts upon its conversion efficiency and long term reliability. The consultant team assessed the upstream local manufacturing process and observed opportunity for further improvement in its quality. It is difficult to avoid the yellow sand flies into the factory by the nature of the locality in Qinghai, PRC. Therefore, appropriate countermeasure is devised to prevent the yellow sand getting into the building, especially the cleaning lab of materials and the pull-up lab of mono-crystalline silicon, and to keep the factories as a whole cleaner. Required quality of mono-crystalline silicon necessary for IC semiconductor and solar cell is different, but converting measure of poly-crystalline silicon into mono-crystalline silicon is the same. It is important to get more reliability of products and also to pay more attention to the cleaner conditions of workers, equipment, facilities, etc. to improve the reliability of the products.
1200
1400
1600
1800
2000
2200
2400
2600
2800
3000
CURRENT
PO
WE
R
STADARDVop + 5 %Iop +5 %SERIES

Renewable Energy Development Chapter 3 Capacity Development in the Planning, Design, Final Report Construction, and O&M of a Grid-connected Solar PV System
3 - 31
3.4.2 Outline of the Ingot Factory
Pull-up Pot 64 pots (32 pots each in Factory 1 and 2)
Production Capacity
45t/month is produced with yield of 70% by full operation of 64 pots.
45t is planned for φ165mm ingot only.
Sizes of pulled-up ingot are 0.5~3.0Ωcm and 3.0~6.0 Ωcm. (but 0.5~3.0Ωcm is major size)
Number of batch (Bt) pulled up per month is 1,071Bts judging from consumption of melting pots
Production capacity per pot: 1,071Bt/64 pots = 16.7Bt/month/pot Since material consumption is 60kg per ingot, 60kg × 70% × 16.7Bt = 701.4kg / month/pot Cycle time is 43hr/Bt
Employee Since one employee takes charge of 2 pots, one group to take charge of whole pots consists of 64÷2 = 32 employees/group. Therefore, number of employees for pulling-up can be estimated as 64 employees for 2 groups, and 96 employees for 3 groups. It seems that there are too many employees because process from “material” to “cleaning” except for pull-up is conducted manually (by MAN POWER).
3.4.3 Manufacturing Process of Solar Cells
(1) Manufacturing Process of Polycrystalline / Monocrystalline Cells
Fig. 3.4-1 Manufacturing Process of Polycrystalline / Monocrystalline Cells
Pull up with rotating
Ingot
Ingot Wafer
Wafer
Solid Polycrystalline
Silicon
Polycrystalline Silicon
Mono- Crystalline
Cell
Poly- Crystalline
Cell

Chapter 3 Capacity Development in the Planning, Design, Renewable Energy Development Construction, and O&M of a Grid-connected Solar PV System Final Report
3 - 32
In manufacturing process of monocrystalline cells, seed crystalline silicon is thrown
into melted polycrystalline silicon to pull up a monocrystalline ingot. Then the ingot is
thinly sliced (0.3 ~ 0.4mm) to be monocrystalline cells. On the other hands,
polycrystalline cells are manufactured by slicing polycrystalline ingot.
MONOCRYSTALLINE INGOT POLYCRYSTALLINE INGOT
Fig. 3.4-2 Photos of Monocrystalline / Polycrystalline Ingots
(2) Solar Cells
Phosphorus is diffused for photoelectric effect. Electrode is put on the manufactured
cell to make electric outlet.
Electro
Diffuse phosphorus
to form N-type layer
Formation of PN Junction
Formation of Electrode Junction
Produce electrodes on
front and back
surfaces of a solar cell
Electro
P-type
N-typeN-type
P-type

Renewable Energy Development Chapter 3 Capacity Development in the Planning, Design, Final Report Construction, and O&M of a Grid-connected Solar PV System
3 - 33
(3) PV Module
Power generation capacity of a 10 cm square solar cell is approximately DC 0.5V, 3A.
Solar cells are connected in series to form a PV module.
3.4.4 Instructions and Suggestions
Following instructions and suggestions were provided to improve the production yield
of monocrystalline silicon.
(1) Material Cleaning
- It is suggested that outside air is blocked to avoid the material contamination.
- Cleaning process should be improved to remove acid or foreign substances on the
materials easier. Consequently, quality of the materials will be improved.
(2) Pull-up Lab
- It is recommended to take countermeasures such as blocking outside air, installing
air shower at the entrance, wearing a dustproof clothing, etc., in order to keep the
working room clean. Consequently, production yield of monocrystalline silicon will
be improved.
(3) Improvement of Production Process
- It is suggested that residual quantity of melted polycrystalline silicon in a pot is
decreased in order to extend the length of pulled-up silicon.
- It is suggested that pull-up speed of monocrystalline silicon is decreased and the
temperature of melted polycrystalline silicon is increased in order to extend the
length of pulled-up silicon.
Solar Cell PV Module

Chapter 3 Capacity Development in the Planning, Design, Renewable Energy Development Construction, and O&M of a Grid-connected Solar PV System Final Report
3 - 34
(4) Melting Pot
- It is recommended to conduct an inspection when melting pots are delivered so that a low quantity pot is excluded. Consequently, the possibility of deformation of a pot can be decreased.
(5) Instructions for Manufacturing Semiconductor Crystal in the Future
Currently, Qinghai China Silicon Energy manufactures monocrystalline silicon for solar cells.
- It is required to remodel the laboratories such as material lab., drying lab, packaging lab., filling lab., and pull-up lab. into clean rooms. It is also required to replace the working wear in the laboratories with dustproof clothing.
3.4.5 Assessment of Capacity and Quality and Provision of Technical Guidance 3.4.5.1 Cleaning Lab
(1) Flowchart of Cleaning
Fig. 3.4-3 Flowchart of Cleaning
(2) Instructions and Proposal
Re-cleaning can be avoided by management of discharge of pure water (ℓ/min) and time for cleaning according to type of material in order to obtain PH7. Proposal for discharging pure water appropriately is shown as figure below.
<Current situation> Pure water is discharged from above, so it is difficult to remove acid attached to materials at the bottom.
<Proposal> Pure water is discharged from below, so it enables to remove not only acid but other contamination by overflow. (This method is adopted in Japan)
Material delivered
・Virgin Polysilicon
・Recycle Polysilicon
・Pot Scrap
Acid Cleaning
HNO₃+HFfor 1 minute
Pure Water
CleaningPH Check Dry
OKPH6~7NG
PH≦6As for pot scrap, it is subject to 24 hours
later after HF cleaning
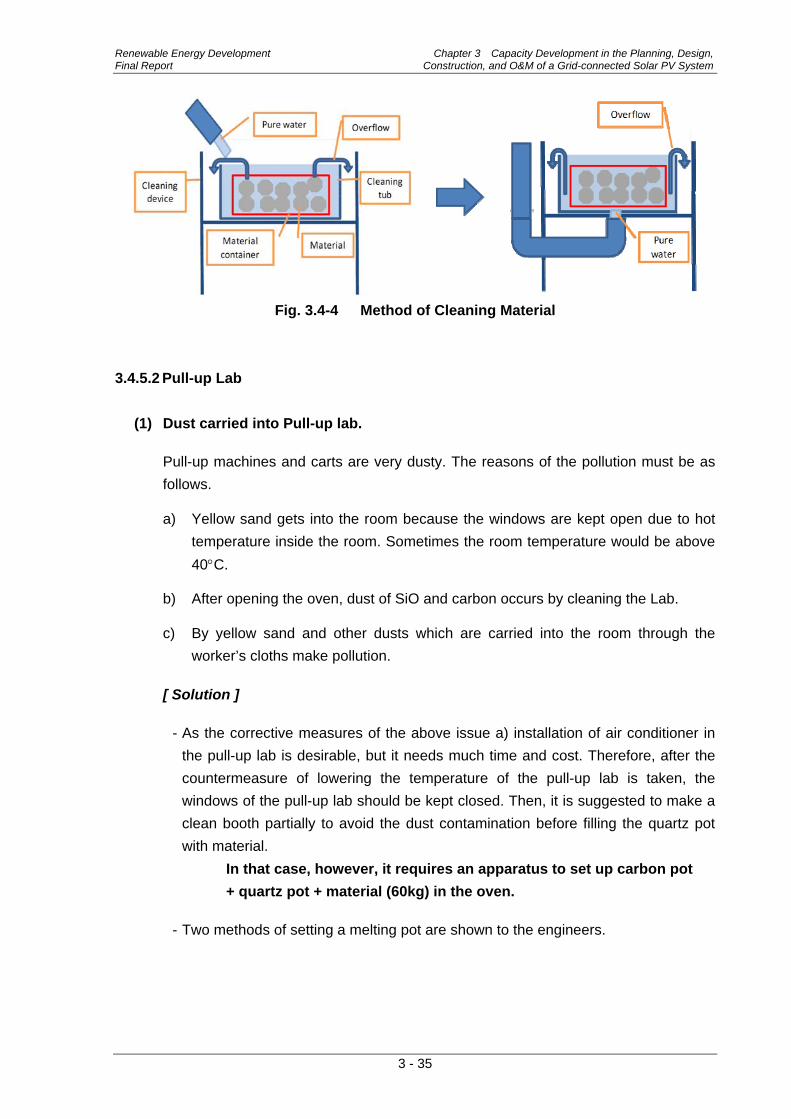
Renewable Energy Development Chapter 3 Capacity Development in the Planning, Design, Final Report Construction, and O&M of a Grid-connected Solar PV System
3 - 35
Fig. 3.4-4 Method of Cleaning Material
3.4.5.2 Pull-up Lab
(1) Dust carried into Pull-up lab.
Pull-up machines and carts are very dusty. The reasons of the pollution must be as
follows.
a) Yellow sand gets into the room because the windows are kept open due to hot
temperature inside the room. Sometimes the room temperature would be above
40C.
b) After opening the oven, dust of SiO and carbon occurs by cleaning the Lab.
c) By yellow sand and other dusts which are carried into the room through the
worker’s cloths make pollution.
[ Solution ]
- As the corrective measures of the above issue a) installation of air conditioner in
the pull-up lab is desirable, but it needs much time and cost. Therefore, after the
countermeasure of lowering the temperature of the pull-up lab is taken, the
windows of the pull-up lab should be kept closed. Then, it is suggested to make a
clean booth partially to avoid the dust contamination before filling the quartz pot
with material.
In that case, however, it requires an apparatus to set up carbon pot
+ quartz pot + material (60kg) in the oven.
- Two methods of setting a melting pot are shown to the engineers.

Chapter 3 Capacity Development in the Planning, Design, Renewable Energy Development Construction, and O&M of a Grid-connected Solar PV System Final Report
3 - 36
Fig. 3.4-5 60 kg Materials previously filled in a Melting Pot
- Method 1. Using a vacuum cleaner Suction pads are attached at 3 places on a carbon pot by a vacuum cleaner to hang and set up by a crane or wire of pull-up pot.
Plane Figure
Fig. 3.4-6 Using a Vacuum Cleaner
- Method 2. A carbon pot is bundled by a band with a taper covering R-curve and straight line to hang and set up by a crane or wire of pull-up pot.
Carbon pot
Melting pot
Material
Carbon potMelting pot
Suction pad
Wire hook for hanging by crane

Renewable Energy Development Chapter 3 Capacity Development in the Planning, Design, Final Report Construction, and O&M of a Grid-connected Solar PV System
3 - 37
Plane Figure
Fig. 3.4-7 A Carbon Pot is bundled by a Band
- As for the issue b) it would be much improved by removing the carbon parts and
cleaning in another room after they cool down.
- The issue c) would be solved by installation of an air shower at the entrance to
remove dusts on the worker’s cloths or putting on a clean wear. In the case of the
latter, the workers will complain about the heat unless the issue a) is solved.
The Consultant concerned about the current situation of the factory that the products
and small silicon crystals which become products are placed directly on the floor, and
heated carbon parts taken out of the oven are put on a steel plate. The reason why
clean environment throughout the process from the materials to mono-crystalline
silicon pulled-up must largely affects the yield of mono-crystalline silicon. In fact, the
ratio of mono-crystallization is lower and loss time is longer due to contamination
which is visible in melted silicon.
3.4.5.3 Guidance for Corrective Measures Applicable Immediately
(1) Yield Improvement
1) Residue in a pot
If residue in a pot is decreased
from 3kg to 1kg, ingot length
(product length) will be extended to
2kgs and the yield will be improved
2kg / 60kg = 3.33%.
Carbon pot
Melting pot
Band
Carbon pot
Band
Wire hook for hanging by crane
Fig. 3.4-8 Yield Improvement
Residue 3kg Residue 1kg

Chapter 3 Capacity Development in the Planning, Design, Renewable Energy Development Construction, and O&M of a Grid-connected Solar PV System Final Report
3 - 38
2) Crack occurred at the mono- crystalline silicon
For example; there was a trouble shown as below.
In the case that mono-crystalline silicon ingot is cut off at the point of 600mm during pull-up at the speed of 1.2mm/min, they increase the pull-up speed into 3.0mm/min to separate from the silicon melted. Then a crack occurs at mono- crystalline silicon ingot.
This is up to the weight of monocrystalline silicon to be pulled up. It would be discussed at the next visit, but please confirm it if this measure is effective. It is suggested that not increasing the raising pull-up speed but raising temperature of the pot, and separating the monocrystalline silicon ingot from silicon melted (until a certain length is pulled up). (until silicon ingot becomes a certain length)
(2) Cleaning Inside of the Oven
It should be conducted to confirm the validity of the current cleaning method and occurrence of contamination from the equipment. The method of check out is as follows. After usual cleaning, place a mirror glass inside of the quartz pot without filling the material.
1) To vacuum the oven and confirm the contamination on the mirror glass
Check out whether the current method of cleaning is appropriate.
Fig. 3.4-10 Confirmation of the Contamination
Vacuum Confirm・Conditions of
usual cleaning・Contaminations
Mirror glass or Wafer
Fig. 3.4-9 Prevention of Crack
Silicon

Renewable Energy Development Chapter 3 Capacity Development in the Planning, Design, Final Report Construction, and O&M of a Grid-connected Solar PV System
3 - 39
2) Rising and falling the wire of the ingot and confirm the contamination on
the mirror glass
Check out whether metal particles fall on the mirror glass on wafer
Fig. 3.4-11 Confirmation of the Contamination
This checking method has been already explained to the factory employees.
The route of contamination into the oven can be found by this checking method.
3.4.5.4 Issues of Pot Scrap, Deformation of Ingot
(1) As for the issues of pot scrap, deformation of ingot, and crack occurred when
ingot is detached, the engineer consulted about deformation of the pot since
June.
Fig. 3.4-12 Issues of Pot Scrap and Deformation
The cause of deformation is not found because the Consultant has not
experienced this before. The presumption of the cause is shown as below;
Vacuum Rise and fall the wire of the
ingot to confirm
Mirror glass or Wafer

Chapter 3 Capacity Development in the Planning, Design, Renewable Energy Development Construction, and O&M of a Grid-connected Solar PV System Final Report
3 - 40
Ba is applied on the surface of the pot thinly (≦0.5mm) inside and thickly (≧
2mm) outside. (≧5mm at the bottom). Ba was applied inside for the purpose of
preventing direct contact between quartz and contamination in the pot and also
applied outside.
(2) Refer to the following figures about the cause of deformation the Consultant
presumed. Thickness of Ba inside and outside of the pot shown in Fig. 3.4-13
was not measured accurately. Deformation in both of Fig. 3.4-13 and Fig. 3.4-14
does not occur throughout inside of a melting pot. It can be considered that air
hole shown in the Figures below occurred because of 90kW power. Outside of
the pot where heat-resistant material Ba was applied thickly, was not deformed.
For reference, comparison with solvent power in Japan is shown below.
60kg/Bt (Qinghai China Silicon Energy)>80kg/Bt (Japan) = 1 > 0.78
Fig. 3.4-13 Condition of a Melting Pot before Deformation (Image)
Fig. 3.4-14 Condition of a Melting Pot after Deformation
Transparent layer
t2
Translucent layer
t8
Ba layer
Ba layer
Transparent layer
Translucent layer
Thickness of Ba≦0.5
Air holeIt was caused probably because Ba wasnot completely bonded on quartz.

Renewable Energy Development Chapter 3 Capacity Development in the Planning, Design, Final Report Construction, and O&M of a Grid-connected Solar PV System
3 - 41
Fig. 3.4-15 Condition of a Melting Pot after Deformation
(3) Deformed Outline Inside of a Melting Pot with a Engineering Person
a) The gap was happened at strainer part of both pots (carbon pot and melting pot) and direction was circular direction.
b) Some different reaction occurred at the corners of both pots On the drawing, inside diameter of a carbon pot is equal to outside diameter of a melting pot. However, even if the pot with the conditions of R > R1 or R < R1 are purchased, the factory could not prevent it because there was no inspection when they were delivered. That is to be the cause of deformation this time.
(4) The deformation occurred in 50% out of whole Bts (1,071 Bt = 1,071 pcs) in June,
and furthermore, deformation throughout circumference occurred in half of Bts. In July, deformation was decreased but still occurred. Some of the pot did not fit
carbon pots at the corner, and it depends on manufacturers and Ba application. It is assumed that his estimation is correct. Factory uses a carbon pot divided into 3 parts and thickness of the inside becomes thinner gradually during the usage. Therefore, gap occurs accordingly at the place of contacting outside of the carbon pot.
Transparent layer
Translucent layer
Ba layer
Ba layer
Air holeIt can be caused byexpansion of air bubble
Thick ness of Ba≧2
Thickness of Ba4~5
Fig. 3.4-16 Structure of Pots
R(Outside diameter of a melting pot)
R1 (Inside diameter of a carbon pot)

Chapter 3 Capacity Development in the Planning, Design, Renewable Energy Development Construction, and O&M of a Grid-connected Solar PV System Final Report
3 - 42
Fig. 3.4-17 Steps of Usage of Carbon Pot
(5) Factory should examine if usage count of carbon pots affect deformation of
melting pots or not. Therefore, the Consultant suggested that Factory prepare a
model of carbon pot for inspection when
they are delivered.
(6) Proposed method of inspection for
carbon pots and melting pots when they
are delivered.
- Method 1: Confirmation of inside
diameter of a carbon pot (Carbon pot is
fixed)
1) 10 measurement points are set out
for examples as shown in the left
Figure. Length of these 10 lines
should correspond to the drawing.
2) If length of a new carbon pot
corresponds to the drawing at all 10
measurement points when it is
delivered or before used, it can be
judged that R-curve angle of the
carbon pot is correct.
3) Half-shaped model of a melting pot is
prepared with a material with 5mm
thickness correspond to inside
Melting pot
Carbon pot
A New carbon pot
Low usage count
Carbon pot
Melting pot
Thickness begins to be smaller than that of A
B Medium usage count
Carbon pot
Melting pot
Thickness begins to be smaller than that of B
C High usage count
About to be changedHigh usage to be changed
Fig. 3.4-18 Measurement of
Carbon Pot Parts, 1 to 10
Fig. 3.4-19 Method I Confirmation
ModelFull‐shape
Half‐shape
Carbon pot

Renewable Energy Development Chapter 3 Capacity Development in the Planning, Design, Final Report Construction, and O&M of a Grid-connected Solar PV System
3 - 43
diameter of a carbon pot, which keeps its shape without being deformed by some influence.
4) If there is no gap between outline of the model and inside diameter of a carbon pot, the carbon pot will pass the inspection.
- Method II: Confirmation of outside
diameter of a melting pot (Melting pot is fixed)
1) Carbon pot model of full-shaped in height and half-shaped in width is prepared with a material with 5mm thickness correspond to outside diameter of a melting pot, which keeps its shape without being deformed by some influence.
2) If there is no gap between inside diameter of the model and outside diameter of a carbon pot, the melting pot will pass the inspection.
3.4.5.5 What is required for Manufacturing Seed at their Own Factory in the Future?
(1) To utilize the existing factory is impossible to improve the quality of silicon ingot
because the present ingot production must not be stopped and it is necessary to construct a new factory.
(2) At least the conditions mentioned below are necessary to construct the clean
factory.
• To construct clean rooms for - Raw material cleaning Lab. - Raw material dry-up Lab. - Raw material stock Lab. - Raw material packing Lab. - Raw material fill up Lab. - Pull-up Lab.
• Worker in the clean rooms must wear dust protection cap, dust protection wears and shoes and when workers enter the clean room they need to have air shower to eliminate the dust from the outside.
• Raw material which is carried into the clean also needed to have air shower.
Fig. 3.4-20 Method II Confirmation
Melting pot
Model
Full-shape

Chapter 3 Capacity Development in the Planning, Design, Renewable Energy Development Construction, and O&M of a Grid-connected Solar PV System Final Report
3 - 44
3.4.5.6 Material Lab. ~ Pull-up Lab
(1) Types of Material
1) New material purchased
from a manufacturer
2) Recycled material of
mono- crystal (A, B, C,
E)
3) Pot scrap (D)
These material (D) is divided
into 60kg material.
Material (A) ~ (E) is classified and controlled by resistance value.
There are 2 types of pull-up specification for 0.5 ~ 3.0Ωcm and 3~6Ωcm.
Fig. 3.4-22 Type (I), (II) Materials
When the Consultant asked the engineer if they have had two types of material, which
resistance was out of criteria, he replied engineers have never experienced that
resistance was out of criteria for 4 years since they started the operation. if the
engineer considers manufacturing IC semiconductors in the future the Consultant
suggests that they must improve process capability of resistance value by SPC6
management.
6 Special Purpose Company
Type (I) 0.5 ~ 3.0 Ωcm Type
Target value of resistance: 2
Ωcm
Actual performance: 2.1 ~ 3
Ωcm
Type (II) 3 ~ 6 Ω cm Type
Target value of resistance: 4±0.2
Ωcm (3.8~4.2 Ω cm)
When actual performance is 3.8
Ωcm, there is a large possibility
that resistance at “A” part will be
≦3 Ω cm.
In that case, resistance between
A ~ B is out of target, but it will
not be a loss because it can be
used as type (I).
NG line
Left part of wafer
Fig. 3.4-21 Material in the Pull-up Lab
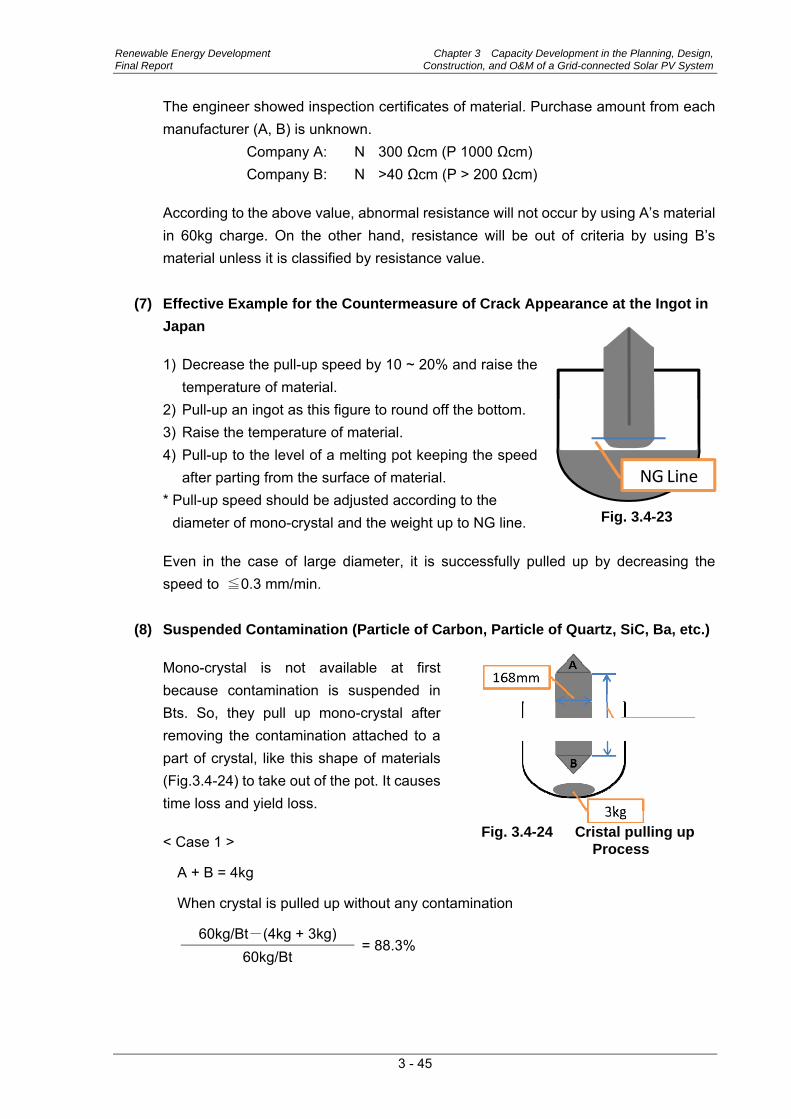
Renewable Energy Development Chapter 3 Capacity Development in the Planning, Design, Final Report Construction, and O&M of a Grid-connected Solar PV System
3 - 45
The engineer showed inspection certificates of material. Purchase amount from each
manufacturer (A, B) is unknown.
Company A: N 300 Ωcm (P 1000 Ωcm)
Company B: N >40 Ωcm (P > 200 Ωcm)
According to the above value, abnormal resistance will not occur by using A’s material
in 60kg charge. On the other hand, resistance will be out of criteria by using B’s
material unless it is classified by resistance value.
(7) Effective Example for the Countermeasure of Crack Appearance at the Ingot in
Japan
1) Decrease the pull-up speed by 10 ~ 20% and raise the
temperature of material.
2) Pull-up an ingot as this figure to round off the bottom.
3) Raise the temperature of material.
4) Pull-up to the level of a melting pot keeping the speed
after parting from the surface of material.
* Pull-up speed should be adjusted according to the
diameter of mono-crystal and the weight up to NG line.
Even in the case of large diameter, it is successfully pulled up by decreasing the
speed to ≦0.3 mm/min.
(8) Suspended Contamination (Particle of Carbon, Particle of Quartz, SiC, Ba, etc.)
Mono-crystal is not available at first
because contamination is suspended in
Bts. So, they pull up mono-crystal after
removing the contamination attached to a
part of crystal, like this shape of materials
(Fig.3.4-24) to take out of the pot. It causes
time loss and yield loss.
< Case 1 >
A + B = 4kg
When crystal is pulled up without any contamination
60kg/Bt-(4kg + 3kg) = 88.3%
60kg/Bt
Fig. 3.4-23
NG Line
Fig. 3.4-24 Cristal pulling up
Process

Chapter 3 Capacity Development in the Planning, Design, Renewable Energy Development Construction, and O&M of a Grid-connected Solar PV System Final Report
3 - 46
< Case 2 >
A+B=4kg
When crystal is pulled up after a part of crystal (6kg) which has contamination like this is taken out of a pot
60kg/Bt-(4kg + 3kg + 6kg) = 78.3%
60kg/Bt
In both ways, "10%" yield loss will occur even when crystal can be pulled up to the end as this figure. As for time loss, the employees make a calculation themselves to understand about the impact on production by contamination, and work seriously to look for the route that such contamination get into the pot.

Renewable Energy Development Chapter 4 Final Report Review of Grid Connectivity of MW Class Solar PV System
CHAPTER 4
REVIEW OF GRID CONNECTIVITY OF MW CLASS SOLAR PV SYSTEM
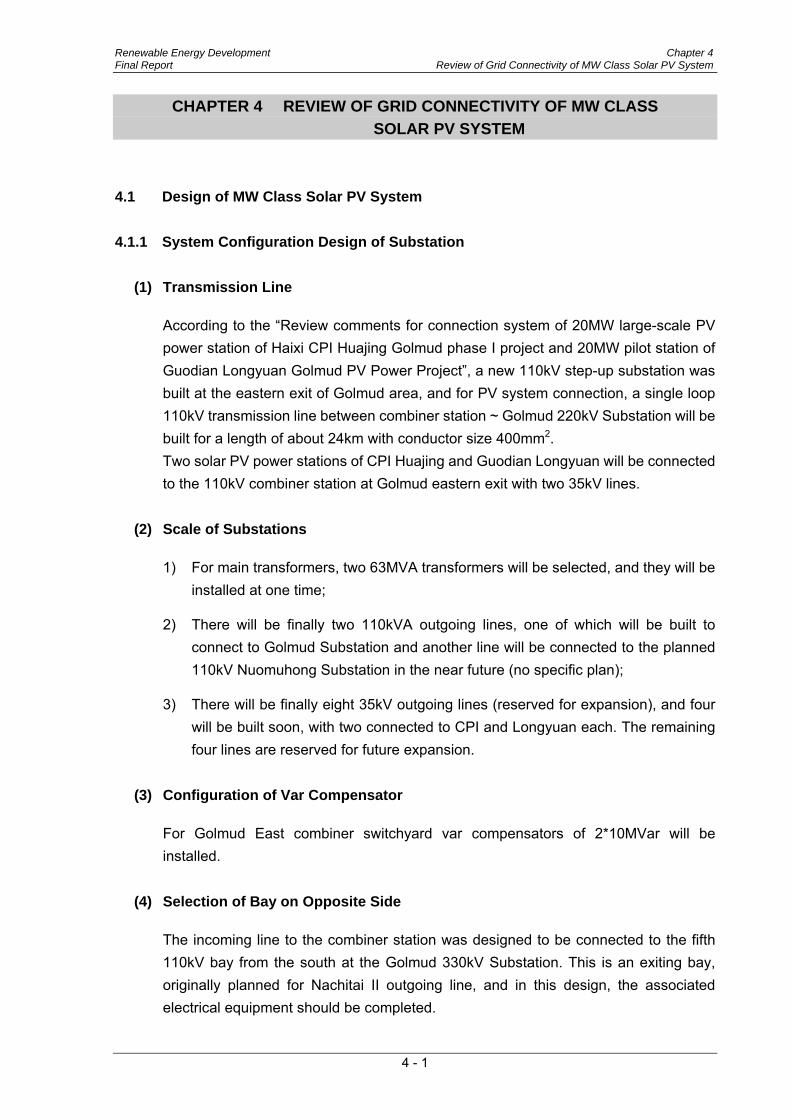
Renewable Energy Development Chapter 4 Final Report Review of Grid Connectivity of MW Class Solar PV System
4 - 1
CHAPTER 4 REVIEW OF GRID CONNECTIVITY OF MW CLASS SOLAR PV SYSTEM
4.1 Design of MW Class Solar PV System 4.1.1 System Configuration Design of Substation
(1) Transmission Line
According to the “Review comments for connection system of 20MW large-scale PV power station of Haixi CPI Huajing Golmud phase I project and 20MW pilot station of Guodian Longyuan Golmud PV Power Project”, a new 110kV step-up substation was built at the eastern exit of Golmud area, and for PV system connection, a single loop 110kV transmission line between combiner station ~ Golmud 220kV Substation will be built for a length of about 24km with conductor size 400mm2. Two solar PV power stations of CPI Huajing and Guodian Longyuan will be connected to the 110kV combiner station at Golmud eastern exit with two 35kV lines.
(2) Scale of Substations
1) For main transformers, two 63MVA transformers will be selected, and they will be installed at one time;
2) There will be finally two 110kVA outgoing lines, one of which will be built to connect to Golmud Substation and another line will be connected to the planned 110kV Nuomuhong Substation in the near future (no specific plan);
3) There will be finally eight 35kV outgoing lines (reserved for expansion), and four will be built soon, with two connected to CPI and Longyuan each. The remaining four lines are reserved for future expansion.
(3) Configuration of Var Compensator
For Golmud East combiner switchyard var compensators of 2*10MVar will be installed.
(4) Selection of Bay on Opposite Side
The incoming line to the combiner station was designed to be connected to the fifth 110kV bay from the south at the Golmud 330kV Substation. This is an exiting bay, originally planned for Nachitai II outgoing line, and in this design, the associated electrical equipment should be completed.

Chapter 4 Renewable Energy Development Review of Grid Connectivity of MW Class Solar PV System Final Report
4 - 2
Fig. 4.1-1 Schematic Diagram of Arrangement of 110kV Outgoing Line Bays in 330kV
Golmud Substation
(5) Short Circuit Capacity
1) Calculation principles and conditions
a. The reference year for calculation is 2020; b. The rated voltage is average voltage, and the rated capacity is 100MVA; c. The short-circuit value of Golmud Substation at 110kV bus system in 2020
based on the short-circuit calculation for the whole Qinghai grid was completed recently.
2) Calculation result
The short-circuit capacity and short-circuit current of the system to relevant substation buses in 2020 calculated are as shown in Table 4.1-1.
Table 4.1-1 Calculation Result of Short Circuit Level in 2020
for Relevant Substation Buses
Substation name Bus
voltage (kV)
3-phase short-circuit Single phase Short-circuit
capacity (MVA) Short-circuit current (kA)
Short-circuit current (kA)
330kV Golmud Substation 110 2262.9 11.36 11.38
Golmud East Combiner Station 110 941.7 4.94 3.68
35 316.3 4.94 -
The breaking capacity of the existing circuit breaker in the area grid can meet the requirements of safety operation of the system. As no short-circuit level of various bus voltage levels in new substations will exceed the existing equipment level, they can be selected from conventional equipment.
Res
erve
d fo
r Dia
ntie
110kV N R
eser
ved
for D
iant
ie
Res
erve
d fo
r Xiy
u
Xiy
u
Gol
mud
-Qar
ham
II
Gol
mud
-Qar
ham
I
Gol
mud
-Yus
huih
e
Gol
mud
Pla
nt
Gol
mud
-Bai
yang
I
Gol
mud
Gas
-fire
d I
Gol
mud
Gas
-fire
d II
PV
Sta
tion
orig
inal
Nac
hita
i II
Res
erve
d fo
r G
olm
ud R
efin
ery
II
Res
erve
d fo
r G
olm
ud-B
aiya
ng II
Gol
mud
Ref
iner
y
Gol
mud
-Nac
hita
i

Renewable Energy Development Chapter 4 Final Report Review of Grid Connectivity of MW Class Solar PV System
4 - 3
(6) Selection of Conductor Size
A single loop 110kV power transmission line of Combiner Station ~ Golmud 220kV Substation will be built, with a length of about 24km and conductor size 400mm2.
(7) PV System Configuration of a Pilot Solar PV System
System configuration of the 10 MW Pilot Solar PV System was well designed in terms of safety, reliability and cost effectiveness.
- One unit consists of two PV arrays and each unit has one transformer and one circuit breaker,
- DC goes into one bus and after converted into AC, is stepped up to 31.5 kV. The power is fed to 3.15 kV/220 kV substation.
4.1.2 System Components
One of the most important components of PV system is PV module, but manufacturer had not been selected yet. It is very important that the voltage of PV array interface is in balance with the input voltage of inverter for effective power generation. Although there is no information about PV module, it is possible to design the rest of the system as it is possible to arrange PV array interface on the basis of the specifications of the inverters. The specifications of other components are as shown below. (1) The specifications of DC convergence control box are shown in Table 4.1-2.
Table 4.1-2 Specifications of DC Convergence Control Box
No. Specifications Values 1 Voltage range of entering PV array 200-1000V 2 Largest PV array of inputs in parallel 16 3 maximum current of every PV array 10A 4 Protection class IP65 5 Ambient temperature -25°C ~ +55°C 6 Humidity 0 ~ 99% 7 The total output of the DC Air Switch yes 8 Photovoltaic module dedicated mine yes 9 Series Current Monitoring yes 10 Failure to monitor mine yes 11 Communication Interface RS485 12 Volume 600 × 500 × 800 13 Weight 27kg

Chapter 4 Renewable Energy Development Review of Grid Connectivity of MW Class Solar PV System Final Report
4 - 4
(2) The specifications of step-up transformer are shown in Table 4.1-3. In these specifications the rated capacity of transformer seems too large, because it is lager than PV array capacity (1000kW).
Table 4.1-3 Specifications of Unit Step-up Transformer
No. Specifications Values 1 Equipment Type Vacuum casting dry-type transformers 2 Model SCB-1100/38.5/0.27/0.27 3 Rated Capacity 1100kVA 4 Rated input voltage 0.27/0.27kV 5 Rated output voltage 38.5±2.5% kV 6 Voltage mode Sub-connector of no-load decomposition on high voltage side 7 Impedance voltage 6% 8 Connection Group Y,D,D 9 Frequency 50HZ
(3) The specifications of circuit breaker are shown in Table 4.1-4. These specifications are adequate considering the local conditions of the substation. Short circuit current on the primary side will not be as small as the secondary short circuit current of substation transformer.
Table 4.1-4 Specifications of Circuit Breaker
No. Specifications Values
1 Rated voltage 40.5kV
2 Rated current of 35kV Circuit breaker switchgear 630A
3 Rated short-circuit breaking current 25kA (RMS)
4 Rated short circuit current peak 63kA
5 4S 25kA
6 Rated peak withstand short-circuit current 63kA
(4) Quantities of electric equipment are listed in Table 4.1-5. Lightning protection was designed, and SPD seems to be very well chosen.

Renewable Energy Development Chapter 4 Final Report Review of Grid Connectivity of MW Class Solar PV System
4 - 5
Table 4.1-5 Main Electrical Equipment List
No. Name Model and specification Quantity 1 DC Lightning convergence box 16 output 1 input 220 2 Grid-connected inverter 500kW 20 3 DC Lightning distribution cabinet 500kW 20 4 Low Voltage Distribution Cabinet 1000kW 10 5 Plant transformer S10-220/35/0.4 200KVA 1 6 Unit transformer SCB-1100/38.5/0.27/0.27KV 10 7 High Voltage Switchgear JYN-35-04(GY) 12 8 High Voltage Switchgear JYN-35-71(GY) 1 9 High Voltage Switchgear JYN-35-91(GY) 1 10 Low Voltage Switchgear GGD1-05(GY) 1 11 Low Voltage Switchgear GGD1-36(GY) 2 12 Monitoring system
1
13 Integrated Device IPAS2000 1 14 DC panel 100Ah 2
4.1.3 Inverter
(1) The specifications of inverter in the feasibility study are shown in Table 4.1-6.
Inverter is as important a component as a PV module for grid connected PV system.
Table 4.1-6 Specifications of Grid-connected Inverter
No. Specifications Values 1 Power 500kW 2 Maximum DC input power 580kWp 3 MPPT 450-820V 4 Maximum DC input voltage 900V 5 Maximum array input current 2×591A 6 DC over-voltage protection yes 7 Protection class IP20 (Indoor) 8 Maximum efficiency 98.50% 9 Current harmonics <3% 10 Allowable voltage operating range 3×270± 10% 11 Allowable frequency operating range 47-51.5HZ 12 Power factor 0.99 13 Volume 2800×2120×850 14 Weight 1800kg 15 Over/under-voltage protection yes 16 Over/under- frequency protection yes 17 Anti-islanding function yes 18 Power restored and network functions yes 19 Short Circuit Protection yes 20 Reverse power protection yes 21 Communication yes 22 Operating temperature -25°C ~ +55°C

Chapter 4 Renewable Energy Development Review of Grid Connectivity of MW Class Solar PV System Final Report
4 - 6
(2) For No.10 item of the table above, the operating range (270 ± 10%) is too low for 10MW system. Inverters manufactured in PRC produce output voltage either at 380V or 270V. 270V type inverter does not have insulation between DC and AC, while 380V type does. It is necessary to raise the output voltage above 270V.
(3) There are some specifications difficult to comment. - Max DC input power. - Max efficiency. (4) Inverter input voltage should be carefully checked and balanced with PV array
voltage. 4.1.4 Control
Control system is one of the most important elements for the pilot solar PV system. There should be two types of communication lines. One is to connect the system with the electric utility by optic fiber, and the other is to connect the system to internet. Electric utility has the authority to open or close the circuit breaker at the grid connecting point. There are many PV projects in Golmud and the total output will reportedly reach 2 GW. Therefore the stability of the grid will be the largest concern of the utility, and there will have to be a means to control solar PV power stations in the area. It will be necessary for the electric power utility to establish an absolute control over the power stations in the area. Fig. 4.1-2 is the total control system for the pilot solar PV system.
(1) System Structure
Diagram of monitoring system structure designed by QBE for the pilot solar PV system is shown in Fig. 4.1-2.

Renewable Energy Development Chapter 4 Final Report Review of Grid Connectivity of MW Class Solar PV System
4 - 7
Fig. 4.1-2 Control System Structure
In order to realize monitoring work economically and effectively, the whole monitoring
system was designed to be made of three layers:
1) Station-level control layer
Station-level control layer is the center of monitoring, measurement, control and
management, the network transmission, receiving power measurement
information and environmental parameters which are needed to be acquired at
the site. This layer needs primary and secondary servers to monitor and operate,
then to complete online maintenance and modification of system software and
database. Using Ethernet switch to connect with other equipments, a solid
foundation of information, resource sharing and online, real-time monitoring
operation are necessary.
2) Network communication layer
The second layer of the system is for data acquisition, communications and
networking. Network system was designed on the ISO model in which
transmission rate is 100M bps. Monitoring host is connected with spacer
equipment in order to achieve resource sharing. System backbone uses Fast
Ethernet: communication management unit, monitoring host, terminal server and
network printer are connected together by a network integrator.

Chapter 4 Renewable Energy Development Review of Grid Connectivity of MW Class Solar PV System Final Report
4 - 8
3) Field control layer
All equipment needs space for configuration of the interval unit monitoring device, environment detectors, metering equipments, grid inverters, intelligent convergence boxes and other intelligent devices, which are transmitted to the main networks, located in the central control room, among protection and monitoring devices, measuring and other intelligent devices. Substation automation technology is being developed rapidly. Intelligent devices are used extensively. Data exchange between intelligent devices and systems is becoming more and more important. Data communication equipment, which connects equipment and systems and their management are necessary in substation automation system.
Through a communication manager, serial servers, intelligent monitoring unit, grid-connected inverter concentrator optical switches are connected with other intelligent devices. RS485 is used for the interface. In monitoring, each unit has its responsibility as follows: - signal acquisition of AC current and voltage by intelligent meter, - signal of switch position and work status of the Intelligent Circuit Breaker, - alternating current, voltage, power and operation status can be under the
control of the Inverter control unit.
Parameters of DC voltage and current can be received after monitoring convergence box.
(2) System Function
Data acquisition
1) In this monitoring system, information to be collected are as follows:
- Signal indicator: including integrated device signal of distribution panel, other signal monitoring equipment, smart device signal, switch lights of universal circuit breaker and so on,
- Environmental parameters: Indoor and outdoor temperature, wind speed, light, humidity etc.,
- Data of convergence box: input information of every DC current, voltage, temperature; alarm signal and fault information,
- Data of inverter: DC input current, voltage and power, three phase output current change and voltage, AC input power, Frequency, Running, etc.

Renewable Energy Development Chapter 4 Final Report Review of Grid Connectivity of MW Class Solar PV System
4 - 9
2) Information necessary managing the pilot solar PV system will be collected and analyzed.
The information items to be analyzed are shown below: a) kWh value b) system monitoring record c) operation record d) maintenance record e) efficiency
4.1.5 Cost Effectiveness and Efficiency
For designing a solar PV system, cost effectiveness and efficiency of equipment (PV module, inverters, circuit breaker, etc.) should be considered. Loss of electric power at wiring and efficiency decrease due to temperature rise are small, but must be considered to evaluate the cost effectiveness and efficiency of the design of a solar PV system.
(1) Wiring
Voltage drop between PV array and inverter is designed to be 3% or less. This requirement is commonplace, but if this value is changed to 2%, its impact on the system efficiency is large. Rough estimation of this impact on yearly sales of the electricity to the utility company is shown below. Yearly power generation has been estimated to be about 17 million kWh in the FS report of QBE.
17,000,000 × (0.03-0.02) = 170,000 kWh per year Tariff assumed is 1.15 CNY 170,000 × 1.15 = 195,500 CNY per year
This amount can be an avoidable loss, and it continues over 20 years. Of course wiring cost will be higher than the case of voltage drop 3%.
(2) Temperature of PV Module Surface
Local temperature of the site of the pilot solar PV system has large variation in a year. The effect of temperature on generation efficiency of PV module is not negligible. It should be carefully considered in the design.

Chapter 4 Renewable Energy Development Review of Grid Connectivity of MW Class Solar PV System Final Report
4 - 10
4.1.6 Proposition of Other Improvement in Design
(1) DC Power Generation
Rated output power of PV module was estimated in QBE’s F/S Report under the standard condition. Here, monthly peak generation is reconsidered.
Assumptions for recalculation are as follows.
- Insolation is 1.1 kW/m2
- Daily peak power appears when the ambient air temperature is at its peak,
- Temperature of PV module is 30 degree higher than the ambient temperature (From the Consultant experience),
- Temperature coefficient of PV power is -0.5% for + 1 degree of PV module in terms of generation efficiency,
- Combination loss of PV modules is 5%. There are some differences of efficiency due to the individual PV module characteristics.
- Wiring loss is 3%. From the QBE’s design of 10MW Pilot Project.
The calculation result is shown in Table 4.1-7. It is also assumed that the maximum PV power is to be equal to the rated power.
Table 4.1-7 Maximum Power of Direct Current (DC) Side
PV : 1000kW Base Month 1 2 3 4 5 6
Ambient Temp. (°C) -1 2 9 15 18 22
Module Temp. (°C) 29 32 39 45 48 52
Max. Power (kW) 993 978 943 912 897 877
Month 7 8 9 10 11 12
Ambient Temp. 25 23 20 12 5 0
Module Temp. 55 53 50 42 35 30
Max. Power (kW) 862 872 887 927 963 988
A.M.T. : Average Maximum Temperature
(2) Inverter Capacity
Inverter specifications in QBE’s design are shown in Table 4.1-8.
500 kW inverter means 500kW output power at alternate current side. There is loss inside
Table 4.1-8 Rated Output AC 500kW
Maximum DC input power 580kW
Maximum DC input voltage 900V
Maximum efficiency 98.5%

Renewable Energy Development Chapter 4 Final Report Review of Grid Connectivity of MW Class Solar PV System
4 - 11
the inverter, as in 10 MW solar PV system case, input voltage is higher than output voltage.
The capacity of the inverter is designed equal to the capacity of the solar PV panels. In case of Golmud, maximum insolation appears from March to September and the temperature of solar PV panel surface becomes 40 degree Celsius.
Loss of PV panel by temperature effect : - 0.5%/°C : power reduction/ current (A) by °C - 25°C : rated temperature of solar panel - 0.5%/°C ×(40°C – 25°C) = 7.5%
Wire loss between PV panel and inverter = 3 %
Therefore total loss before the inverter is 10 %
Then the capacity of inverter is enough to have 90 % of the capacity of the solar PV panels. However over load is to be considered for the inverter but the inverter has input restriction function to avoid over load for input power. In operational condition, the inverter efficiency would be 90% or a little larger. The capacity of inverter can be a little smaller than the rated output of PV modules connected to the inverter.
(3) Transformer Capacity
In most of cases the capacity of the transformer is designed as the same capacity of the solar PV panels but it is too big capacity. In general transformer is designed to resist against the short time over load capacity and it is standardized. Its capacity is able to be reduced less than the capacity of the inverter. The life span of the transformer is estimated based on the maximum utilization factor and the load factor and the life measurement method of transformer is established at present. Considering the utilization factor of the solar PV system in the night period is zero, less than 90% of inverter capacity is good enough for the capacity of the transformer.
10 MW solar PV system produces power of about 0.9 × 10 MW on AC side, and the transformer capacity can be smaller than 10 MW. In addition, transformer can be operated under overloading condition.
(4) Circuit Breaker Capacity
Then regarding breaking capacity of the circuit breaker, it should be considered much more than the transformer. In case of fault occurred, the fault current is flown into the circuit breaker from not only upper side of the power grid but also from other solar PV systems. It is necessary to discuss with the area power company about the short circuit capacity because the short circuit current is depends on the impedance of

Chapter 4 Renewable Energy Development Review of Grid Connectivity of MW Class Solar PV System Final Report
4 - 12
transmission lines.
(5) Proposition on Inverter Capacity and Transformer Capacity
The Consultant identified other areas of improvement in the design of 10MW Pilot Project.
a) Inverter capacity: can be made smaller b) Transformer capacity: can be made smaller
a) and b) requires analysis on the operation data. The data collection interval should be 10 minutes or less. a) can be measured at input point of inverter, and b) can be measured at output of inverter.
- AC output of PV system is not as large as DC input generated by PV modules. - Inverter’s output does not exceed the power at DC side. - Transformer has some overloading capacity.
When these factors are considered, simple inequality formula is made as follows. DC generation > Inverter output > Transformer capacity
Meanwhile, the design of 10MW Pilot Project is as follows. DC generation = Inverter output < Transformer capacity
This kind of system arrangement is not peculiar, as the price of transformer is not that high compared with that of other equipment. However, transformer loss is not negligible, especially when the capacity of the transformer is large. There is also iron loss even the system is not in operation and only charged by electricity.
4.2 Power Grid in Golmud Area
4.2.1 Overview of Power System in Golmud Area
The overview of the power system in Golmud, such as substations and transmission lines, is described below. Construction of new substations and transmission lines were ongoing and further expansion being planned in the area. The grid will be reinforced and able to mitigate the impacts of huge solar PV stations connected after these constructions. Especially, 750kV transmission project and 400kV HVDC project should be in place to ensure the stability of grid conditions. In addition to the above, application of smart Grid Technology are envisaged being studied in PRC. The state grid companies are

Renewable Energy Development Chapter 4 Final Report Review of Grid Connectivity of MW Class Solar PV System
4 - 13
the hub authority of its development. The information is described in the website of the state grid (http://www.sgcc.com.cn/ ztzl/newzndw/). According to the website, the enhancement and accelerated construction of transmission systems to carry the huge power is one of the main pillars of the smart grid development. And the studies of grid control/protection and peak shift are included in the increase of proportion of clean energy. Preferable areas for the wind/PV power stations are identified in the western regions of PRC as well as resources of thermal/hydro power. Therefore, the construction of transmission lines is of top priority. The power grid in Haixi is divided into central, eastern and western parts. The central and eastern grid are supplied mainly by four 330kV substations at Ulan, Bayin, Yanhu and Golmud, also by some local small hydropower and thermal power stations. The western grid is further divided into three isolated supply grids, with power sources mainly of local oil (gas) fired power stations, which are built, managed and used by the enterprises themselves. In the central part, Golmud area was connected with the main grid of Qinghai in 2001, with 330kV Golmud substation as the main supply source. At present, the grid in the area is connected with the main grid via the following 330kV transmission lines. - Longyangxia-Ulan-Golmud - Huangyuan-Mingzhu -Ulan-Bayin-Yanhu-Golmud In 2009, the maximum power consumption in Haixi grid was 265.1MW, and it supplied energy of 1,583 GWh, with sold electric energy of 1,524 GWh. The grid associated with the pilot solar PV system is the Golmud grid in the central part of Haixi. The Golmud grid was connected with the main grid of Qinghai at the end of 2001, with 330kV Golmud substation as the main supply source, and assisted with some local gas-fired power plants and small hydropower stations. Substations and transmission lines associated with this project are described below.
1) Golmud 330kV Substation (existing)
- Transformers : 2 × 150MVA (final and current)
- Busbar : 1 and 1/2 configuration (330kV), double configuration (110kV)
- 330kV feeder : 2 outgoing lines (to Ulan substation and Yanhu substation) (final: 6 outgoing lines)
- 110kV feeder : 9 outgoing lines (to Nachitai substation, Refinery substation,

Chapter 4 Renewable Energy Development Review of Grid Connectivity of MW Class Solar PV System Final Report
4 - 14
Gas fired power plant II, Gas fired power plant I, Baiyang substation, Qinghai Potassium Fertilizer power plant, Yushuihe substation, Qarham I-II Ulan substation and Yanhu substation) (final: 12 outgoing lines)
2) Baiyang 110kV Substation (existing)
- Transformers : 2 × 50MVA (final and current)
- Busbar : single configuration (110kV)
- 110kV feeder : 4 outgoing lines (to Golmud substation, Guangming substation, Xiaogangou substation and Golmud Refinery substation) (final: 6 outgoing lines)
3) 750kV Transmission Line to Qinghai (under construction)
4) DC 400kV HVDC System to Tibet (under construction)
According to the grid development plan of Qinghai Province, it was planned to construct around 2010 to transmit the huge power supply in Golmud area to eastern regions of PRC through Qinghai (750kV) and to Tibet (HVDC).
5) Yakou 330kV Transmission Project (planning)
To meet the load growth in Kunlun Development Zone and Metallurgical Industrial Park, it is planned to build Yakou 330kV substation in 2013. As most load in the park will be heavy ones demanding high energy consumption, according to the industrial layout of the park, a location for a 330KV substation is reserved, and Yakou substation will be built within the metallurgical zone. The main transformer capacity should be 2 × 360MVA, and the 330kV double circuit line will be installed from 750kV Golmud substation.
6) 110kV Transmission Project for Golmud Kunlun Development Zone (planning)
To supply power to the high purity magnesium oxide project and other planned industrial projects in Kunlun Development Zone, it was planned to construct Kunlun Development Zone 110kV substation (2 × 50MVA) in 2010, and one main transformer will be installed in the initial period. The dedicated two transmission lines will be installed from the 330kV Golmud substation.
7) 110kV Golmud Central Transmission Line (planning)
According to the development plan of Qinghai Province, the focus of

Renewable Energy Development Chapter 4 Final Report Review of Grid Connectivity of MW Class Solar PV System
4 - 15
development will be placed on construction of Golmud City, therefore the power consumption in the urban area will increase substantially. So it was planned to construct Central 110KV substation (2 × 40MVA) in 2011, with one main transformer in the initial phase. For the system connection, connected substation of the Guangming - Yushuihe lines will be changed from Yushuihe substation to 330kV Golmud substation (Yushuihe side), and opposite side (Guangming side) will be connected to the Central substation. In addition to this, a new line Kunlun Development Zone - Center will be installed.
8) 110kV Nachitai ~ Wudaoliang ~ Tuotuohe Line II (planning)
To meet the power demand along Golmud - Tuotuohe section of the Qinghai - Tibet Railway and improve power supply reliability, it is planned to construct the 110kV Nachitai - Wudaoliang - Tuotuohe line II in 2012.
9) 110kV Nuomuhong Transmission Project (planning)
At present, Nuomuhong area is supplied by stages I and II hydro stations in Nuomuhong. Because of unbalanced economic and social development and restriction by historical and natural geographic conditions, Nuomuhong area has not been connected to the main grid today. This situation has seriously restricted the social and economic development and improvement of people's living standard in the area. To solve the power imbalance in this area, it is planned to construct Nuomuhong 110kV substation during the “Twelfth Five-year Plan” period, for the system connection, a new Golmud - Nuomuhong single loop 110kV line will be installed in the initial phase, and in future, it will be connected to the planned Yakou 330kV substation.
The overview of the Qinghai Grid is as follows.
Table 4.2-1 Qinghai Grid Items Outline
Transmission Grid Voltage: 750/330/110 kV Transformer capacity: 18,370 MVA Transmission line: 13,541 km (at end of 2008)
Peak Load (Demand) 6,654 MW (at 2011.06) Rate of increase: 19 % (2011.06/2010.06)
Consumption 3887 GWh (at 2011.06) Power Trade between provinces
Export: 933 GWh Import: 284 GWh (at 2011.06)
Generator Capacity Total 12,660 MW (Source: Qinghai power company Web site)

Chapter 4 Renewable Energy Development Review of Grid Connectivity of MW Class Solar PV System Final Report
4 - 16
4.2.2 Demand Forecast and Power Balance (Supply-Demand Balance) in Golmud Area Studies on demand forecast and power balance were carried out to check the necessity of the PV power stations. The results of the studies are shown in Fig. 4.2-1, Table 4.2-2, Table 4.2-3. Demand will increase rapidly with construction of factories under the endorsement by the government policy. The supply will be on the short side in near future if PV power plants will not be installed even though some new hydro/thermal power plants will be constructed. Therefore, the PV power plants should be constructed while power balance is being kept. The following matters were taken into account in the study;
1) Construction plan of industrial projects in Golmud,
2) The general demand in the area was forecast according to its development of national economy with a certain growth rate,
3) Power consumption in industrial projects was directly added to the loads,
4) A 600 kt/year methanol project is about 1km away from Baiyang substation, and it will be supplied by this substation,
5) A 300 kt/year methanol project will be supplied by the substation at Golmud Refinery,
6) According to the regional grid plan, the 110KV Center substation and Kunlun Development Zone substation will be constructed in the urban area of Golmud around 2012, and by when completed, some load can be transferred from Baiyang and Guangming substations to these new substation,
7) The PV power stations at the eastern and southern areas of Golmud are incorporated to the 330kV Golmud grid. These PV stations as well as hydropower and thermal power stations, which are under construction and planning, were taken into account in this power balance,
8) The winter season has a peak demand period and the demand decreases during summer season. On this situation, the forecast maximum demand is applied to winter season and demand for summer season is decreased using the ratio previously observed,
9) In summer season, generated power by all small hydro power plants is assumed almost at rated capacity, and the number of operating generators of Golmud Gas-fired power plant is decreased from two (2) to one (1) for economical
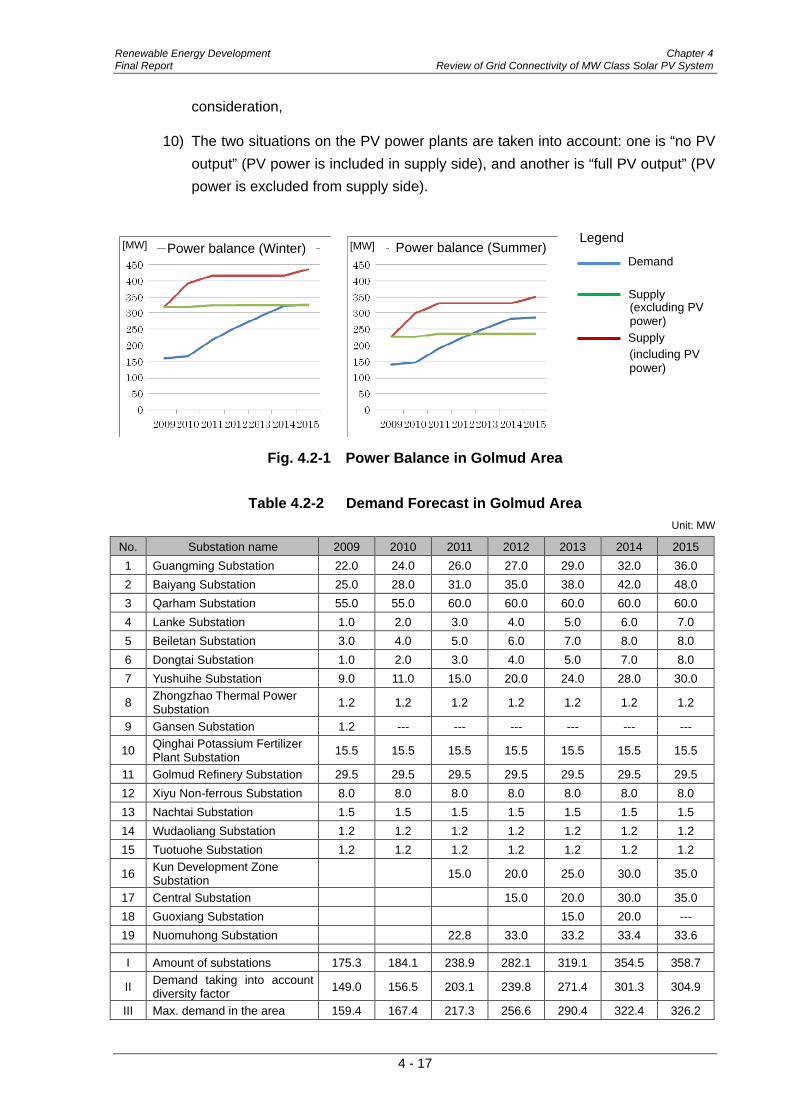
Renewable Energy Development Chapter 4 Final Report Review of Grid Connectivity of MW Class Solar PV System
4 - 17
consideration,
10) The two situations on the PV power plants are taken into account: one is “no PV
output” (PV power is included in supply side), and another is “full PV output” (PV
power is excluded from supply side).
Fig. 4.2-1 Power Balance in Golmud Area
Table 4.2-2 Demand Forecast in Golmud Area
Unit: MW
No. Substation name 2009 2010 2011 2012 2013 2014 2015
1 Guangming Substation 22.0 24.0 26.0 27.0 29.0 32.0 36.0
2 Baiyang Substation 25.0 28.0 31.0 35.0 38.0 42.0 48.0
3 Qarham Substation 55.0 55.0 60.0 60.0 60.0 60.0 60.0
4 Lanke Substation 1.0 2.0 3.0 4.0 5.0 6.0 7.0
5 Beiletan Substation 3.0 4.0 5.0 6.0 7.0 8.0 8.0
6 Dongtai Substation 1.0 2.0 3.0 4.0 5.0 7.0 8.0
7 Yushuihe Substation 9.0 11.0 15.0 20.0 24.0 28.0 30.0
8 Zhongzhao Thermal Power Substation
1.2 1.2 1.2 1.2 1.2 1.2 1.2
9 Gansen Substation 1.2 --- --- --- --- --- ---
10 Qinghai Potassium Fertilizer Plant Substation
15.5 15.5 15.5 15.5 15.5 15.5 15.5
11 Golmud Refinery Substation 29.5 29.5 29.5 29.5 29.5 29.5 29.5
12 Xiyu Non-ferrous Substation 8.0 8.0 8.0 8.0 8.0 8.0 8.0
13 Nachtai Substation 1.5 1.5 1.5 1.5 1.5 1.5 1.5
14 Wudaoliang Substation 1.2 1.2 1.2 1.2 1.2 1.2 1.2
15 Tuotuohe Substation 1.2 1.2 1.2 1.2 1.2 1.2 1.2
16 Kun Development Zone Substation
15.0 20.0 25.0 30.0 35.0
17 Central Substation 15.0 20.0 30.0 35.0
18 Guoxiang Substation 15.0 20.0 ---
19 Nuomuhong Substation 22.8 33.0 33.2 33.4 33.6
I Amount of substations 175.3 184.1 238.9 282.1 319.1 354.5 358.7
II Demand taking into account diversity factor
149.0 156.5 203.1 239.8 271.4 301.3 304.9
III Max. demand in the area 159.4 167.4 217.3 256.6 290.4 322.4 326.2
Demand
Supply
Legend
(including PV power)
(excluding PV power) Supply
Power balance (Winter) [MW] Power balance (Summer)[MW]

Chapter 4 Renewable Energy Development Review of Grid Connectivity of MW Class Solar PV System Final Report
4 - 18
Table 4.2-3 Power Balance in Golmud Area (Summer) Unit: MW
No. Project name 2009 2010 2011 2012 2013 2014 2015
I Max. power supply load in area 140.3 147.3 191.2 225.8 255.6 283.7 287.1
II Output from power plants in area 227.3 300.3 330.3 330.3 330.3 330.3 350.3 (I) Output from hydropower plants in area 92.3 92.3 102.3 102.3 102.3 102.3 102.3
1 Naijili Power Station 12.0 12.0 12.0 12.0 12.0 12.0 12.0 2 Dagangou Power Station 20.0 20.0 20.0 20.0 20.0 20.0 20.0 3 Xiaogangou Power Station 32.0 32.0 32.0 32.0 32.0 32.0 32.0 4 Yixiantian Stage I Power Station 7.5 7.5 7.5 7.5 7.5 7.5 7.5 5 Yixiantian Stage II Power Station 8.0 8.0 8.0 8.0 8.0 8.0 8.0 6 Nanshankou Stage I Power Station 12.0 12.0 12.0 12.0 12.0 12.0 12.0 7 Nanshankou Stage II Power Station 10.0 10.0 10.0 10.0 10.0
8 Nuomuhong Stages I and II Power Stations 0.8 0.8 0.8 0.8 0.8 0.8 0.8
(II) Output from PV Station in area 73.0 93.0 93.0 93.0 93.0 113.0 1 Qinghai New Energy PV Station 10.0 10.0 10.0 10.0 10.0 30.0 2 Guodian Longyuan PV Station 10.0 20.0 20.0 20.0 20.0 20.0 3 Junshi Energy PV Station 10.0 10.0 10.0 10.0 10.0 10.0 4 Huaneng PV Station 10.0 10.0 10.0 10.0 10.0 10.0 5 CPI PV Station 10.0 20.0 20.0 20.0 20.0 20.0 6 QDI (Datang) PV Station 5.0 5.0 5.0 5.0 5.0 5.0
7 Yellow River Upstream Company PV Station 5.0 5.0 5.0 5.0 5.0 5.0
8 Shenguang New Energy PV Station 3.0 3.0 3.0 3.0 3.0 3.0 9 Qinghai Baike 10.0 10.0 10.0 10.0 10.0 10.0
(III) Output from gas-fired station 135.0 135.0 135.0 135.0 135.0 135.0 135.0 1 Golmud Gas-fired Station 135.0 135.0 135.0 135.0 135.0 135.0 135.0
III
Power balance (no PV output) surplus (+) short (-) 87.0 80.0 46.1 11.5 -18.3 -46.4 -49.8
Power balance (full PV output) surplus (+) short (-) 87.0 153.0 139.1 104.5 74.7 46.6 63.2
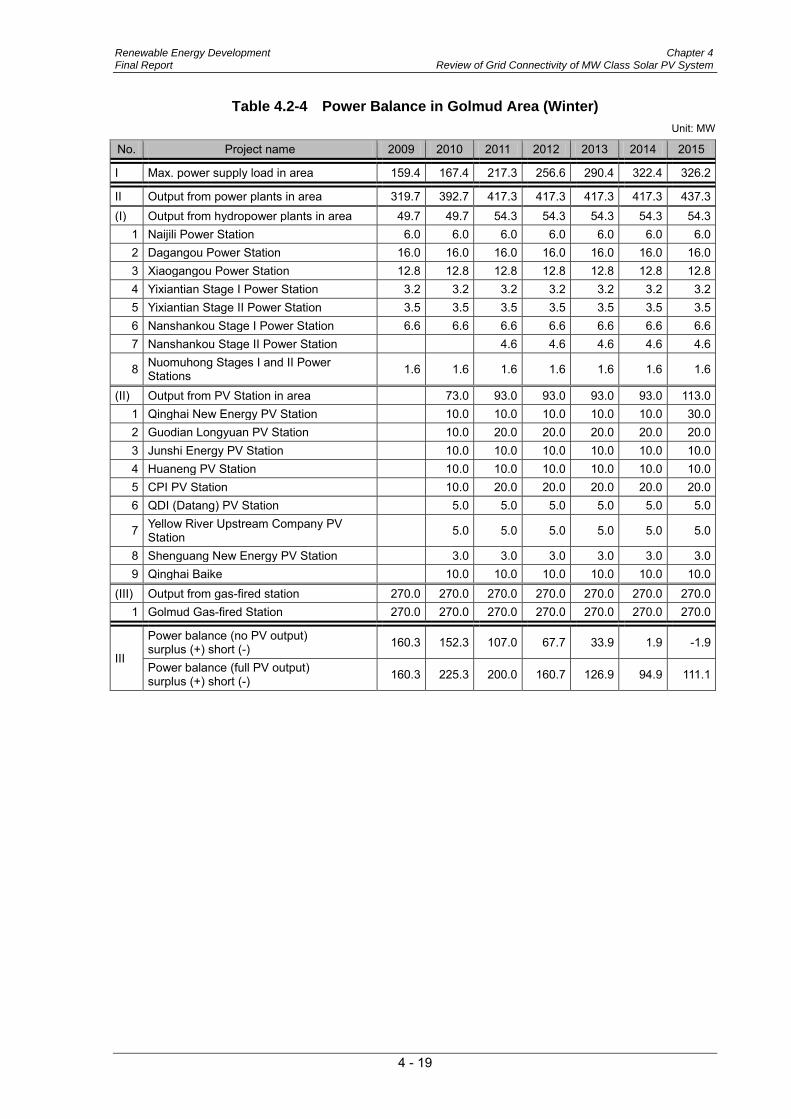
Renewable Energy Development Chapter 4 Final Report Review of Grid Connectivity of MW Class Solar PV System
4 - 19
Table 4.2-4 Power Balance in Golmud Area (Winter) Unit: MW
No. Project name 2009 2010 2011 2012 2013 2014 2015
I Max. power supply load in area 159.4 167.4 217.3 256.6 290.4 322.4 326.2
II Output from power plants in area 319.7 392.7 417.3 417.3 417.3 417.3 437.3 (I) Output from hydropower plants in area 49.7 49.7 54.3 54.3 54.3 54.3 54.3
1 Naijili Power Station 6.0 6.0 6.0 6.0 6.0 6.0 6.0 2 Dagangou Power Station 16.0 16.0 16.0 16.0 16.0 16.0 16.0 3 Xiaogangou Power Station 12.8 12.8 12.8 12.8 12.8 12.8 12.8 4 Yixiantian Stage I Power Station 3.2 3.2 3.2 3.2 3.2 3.2 3.2 5 Yixiantian Stage II Power Station 3.5 3.5 3.5 3.5 3.5 3.5 3.5 6 Nanshankou Stage I Power Station 6.6 6.6 6.6 6.6 6.6 6.6 6.6 7 Nanshankou Stage II Power Station 4.6 4.6 4.6 4.6 4.6
8 Nuomuhong Stages I and II Power Stations 1.6 1.6 1.6 1.6 1.6 1.6 1.6
(II) Output from PV Station in area 73.0 93.0 93.0 93.0 93.0 113.0 1 Qinghai New Energy PV Station 10.0 10.0 10.0 10.0 10.0 30.0 2 Guodian Longyuan PV Station 10.0 20.0 20.0 20.0 20.0 20.0 3 Junshi Energy PV Station 10.0 10.0 10.0 10.0 10.0 10.0 4 Huaneng PV Station 10.0 10.0 10.0 10.0 10.0 10.0 5 CPI PV Station 10.0 20.0 20.0 20.0 20.0 20.0 6 QDI (Datang) PV Station 5.0 5.0 5.0 5.0 5.0 5.0
7 Yellow River Upstream Company PV Station 5.0 5.0 5.0 5.0 5.0 5.0
8 Shenguang New Energy PV Station 3.0 3.0 3.0 3.0 3.0 3.0 9 Qinghai Baike 10.0 10.0 10.0 10.0 10.0 10.0
(III) Output from gas-fired station 270.0 270.0 270.0 270.0 270.0 270.0 270.0 1 Golmud Gas-fired Station 270.0 270.0 270.0 270.0 270.0 270.0 270.0
III
Power balance (no PV output) surplus (+) short (-) 160.3 152.3 107.0 67.7 33.9 1.9 -1.9
Power balance (full PV output) surplus (+) short (-) 160.3 225.3 200.0 160.7 126.9 94.9 111.1

Chapter 4 Renewable Energy Development Review of Grid Connectivity of MW Class Solar PV System Final Report
4 - 20
Fig.
4.2
-2
Gol
mud
Loc
atio
n
Onl
y pa
ssed
thro
ugh
Gol
mud
Map
: G
oogl
e

Renewable Energy Development Chapter 4 Final Report Review of Grid Connectivity of MW Class Solar PV System
4 - 21
Site
1: Q
ingh
ai N
ew E
nerg
y, a
nd Q
ingh
ai J
unsh
i Ene
rgy
(Jun
shi E
nerg
y)S
ite 2
: Bai
ke S
olar
Pow
er (B
aike
SP
) - C
hina
Sci
ence
and
Tec
hnol
ogy
PV
Pow
erS
ite 3
: Chi
na L
ongy
uan
Gol
mud
New
Ene
rgy
Dev
elop
men
t (G
uodi
an N
ED
)S
ite 4
: SD
IC G
olm
ud S
olar
Pow
er (S
DIC
) - C
PI H
uajin
g P
ower
Hol
ding
Site
5: X
ingu
ang
New
Ene
rgy
Ser
vice
(Xin
guan
g N
ES
)S
ubst
atio
n: E
ast G
olm
ud 1
10kV
Col
lect
ed S
tep-
up S
ubst
atio
n (1
10kV
Sub
stat
ion)
Hua
neng
Inte
rnat
iona
l Pow
er D
evel
opm
ent
Site
1
Site
2Su
bsta
tion
Site
3
Site
4
Site
5
AC
750k
V Su
bsta
tion
DC
400k
V C
onve
rter
Sta
tion
Map
: G
oogl
e M
ap
Fig.
4.2
-3
PV
Pow
er P
lant
Map

Chapter 4 Renewable Energy Development Review of Grid Connectivity of MW Class Solar PV System Final Report
4 - 22
Site
1Ju
nshi
Ene
rgy
Site
2B
aike
SP
Site
3G
uodi
an N
ED
Site
4S
DIC
Site
5Xi
ngua
ng N
ES
Firs
t Sta
ge [M
W]
510
020
(201
1.05
)20
(201
0.04
)3=
(0.9
+2.1
)(2
011.
06)
Fina
l Sta
tge
[MW
]50
200
5020
0N
onTy
peTh
in F
ilmTh
in F
ilmC
ryst
al (1
8.5M
)C
ryst
alC
ryst
alAn
gle
Fixe
d (3
6 de
gree
)Fi
xed
(36
degr
ee)
Fixe
d (3
0 de
gree
)Fi
xed
(36
degr
ee)
Two
(2) A
xis
Rat
ed M
ax. P
ower
[W]
50 ±
5 %
50 ±
5 %
230.
0 ±
3 %
230
± 3%
440
± 5
%Vm
[V]
4343
29.5
29.2
41.1
Im [A
]1.
171.
177.
807.
8710
.7M
ax. S
yste
m V
olta
ge [V
]1,
000
1,00
01,
000
1,00
060
0
Man
ufac
ture
rG
S-S
OLA
R [*
1](M
ade
in C
hina
)G
S-S
OLA
R [*
1](M
ade
in C
hina
)YI
NG
LI S
OLA
R[*
2](M
ade
in C
hina
)S
Dso
lar [
*3]
(Mad
e in
Chi
na)
Rem
arks
Thin
Film
(1.5
M)
Two
(2) A
xis
One
(1) A
xis
Rat
ed P
ower
[kW
]N
ot O
pera
teN
ot O
pera
te50
050
0-
Man
ufac
ture
r阳
光电
源股
份有
限公
司 [
*4]
Em
erso
n N
etw
ork
Pow
er,S
SL0
500
[*5]
(Mad
e in
Chi
na)
-
Type
Not
Ope
rate
Not
Ope
rate
Oil
Dyn
11-d
yn11
5 Ta
p
Dry
Dy1
1y11
5 ta
pR
ated
Pow
er [W
]1,
000(
500+
500)
1,25
0R
ated
Vol
tage
[V]
38,5
00/3
80-3
8035
,000
/270
-270
110k
V S
ubst
aion
Mai
n Tr
ansf
orm
er11
0kV
Bay
35kV
Bay
SVC
*1ht
tp://
ww
w.g
s-so
lar.c
om/fr
eefie
ldso
larfa
rm.h
tml
*2ht
tp://
ww
w.y
ingl
isol
ar.c
om/
*3ht
tp://
ww
w.g
dsol
ar.c
om/
*4ht
tp://
b2b.
bjx.
com
.cn/
8434
505/
prod
uct-1
9969
0.ht
ml
*5ht
tp://
ww
w.e
mer
sonn
etw
ork.
com
.cn/
Pag
es/D
efau
lt.as
px
Inve
rter
2 un
its, 1
0,00
0kVa
r/1un
it
Tran
sfor
mer
for P
V
2 un
its, (
110/
38.5
kV, 6
3,00
0kW
, YN
d11,
17t
ap)/1
unit
4 B
ays
(2 L
ine,
2 T
rans
form
ers)
17 B
ays
(10
Line
s in
clud
ing
2 sp
ear,
2 Tr
ansf
orm
ers,
2 S
VCs,
1 B
us s
ectio
n, 2
PTs
)
Tota
l Out
put P
ower
Rat
ing
of P
V P
anel
(Mai
n)
PV
Mod
ule(
Mai
n)
Tabl
e 4.
2-5
So
lar P
ower
Sta
tion

Renewable Energy Development Chapter 4 Final Report Review of Grid Connectivity of MW Class Solar PV System
4 - 23
4.2.3 Grid Code “The grid operation code (DL/T 1040 - 2007)” and related regulations and standards are applied to the PV power plants to be connected with the grids. There is no stipulation and description on a PV power plant in the Grid Code while those of hydro/thermal power plant are stated. For this reason, some technical stipulation on hydro/thermal power plants was applied to PV power plants.
4.2.4 The PV Power Plants The following six (6) PV power plants are under planning or already operating in the eastern area of Golmud City. 1) China Science and Technology Photovoltaic Power Holding Co., Ltd., 10MW 2) CPI Huajing Power Holding Co., Ltd., 20MW 3) Guodian Longyuan Golmud New Energy Development Company, 20MW 4) Qinghai New Energy Group Corporation, 10MW 5) Huaneng International Power Development Company, 10MW 6) Qinghai Junshi Energy Co., Ltd., 10MW The 110kV substation, called Golmud East 110kV combiner station, has been constructed to consolidate and step-up (35/110kV) the power from six (6) PV power plants and to connect with the 110kV grid. The owners, construction and operation scheme of the PV power plants and the 110kV combiner station are shown in Fig. 4.2-4. The site of Qinghai New Energy Group (10MW) is on broad plain covered with dry sand. There is no obstruction at the site. (The photos are shown in the Site Visit Report.) Main load from the center of Golmud city to the construction site of the PV power plant is large enough to transport the equipment. Access road from the main load to the site has been constructed by neighbor PV power plants although its surface is rough. A well with pumping equipment is necessary for construction work and living. The authority surveyed and studied the availability of water in Golmud to invite the PV power plants. They confirmed the large scale ground water flow to be found as deep as 100 - 180 m. The electricity for construction work will be provided from the 35 kV substation near the site as the same manner as other PV power plants. The Grid Code is applied at the connection point of the 110 kV lines and the combiner station. The design of the combiner station was carried out by PV power companies and it was reviewed and approved by the grid company. The monitoring and control

Chapter 4 Renewable Energy Development Review of Grid Connectivity of MW Class Solar PV System Final Report
4 - 24
are implemented from the dispatch center of grid company, so only guardsman is located at the substation. The operating information/data is transmitted to the dispatch center via the substation using the optical fiber line. The 35 kV switchgears are also operated by the grid company, and the grid company informs switchgears’ operation to PV power plant by telephone before operation except for emergency situation.
Table 4.2-6 Grid Owner, Construction and Operation
Equipment Owner Construction Operation
a. 110 kV Transition lines Power Grid Company Power Grid Company Power Grid Company
b. 110 kV Substation Six (6) PV power plant companies Power Grid Company*1 Power Grid Company*1
c. 35 kV Transition lines Six (6) PV power plant companies
Six (6) PV power plant companies
Six (6) PV power plant companies
d. PV power plant Six (6) PV power plant companies
Six (6) PV power plant companies
Six (6) PV power plant companies
*1 : Six (6) PV power plant companies entrust construction work and operation of the substation to the grid power company.
Fig. 4.2-4 Owner, Construction and Operation Scheme
Haixi Grid 110kV Lines or Substation
110 kV Substation
(110/35kV Transformer)
a. 110 kV Transition lines
b. 110 kV Substation
PV1 PV2 PV3 PV4 PV5 PV6
c. 35 kV Transition lines
d. PV power plant
Six (6) PV power plant companies

Renewable Energy Development Chapter 4 Final Report Review of Grid Connectivity of MW Class Solar PV System
4 - 25
4.2.5 Detail of Golmud East 110kV Combiner Station
(1) Main Circuit
Golmud East 110kV combiner station is connected with 330kV Golmud substation through two 110kV transmission lines, and the configuration is as follows.
- Transformer : 2 units, (110/38.5kV, 63,000kW, YNd11, 17tap)/1unit
- Busbar : Single configuration (110kV and 35kV)
- 110kV Bay : 4 Bays (2 Line, 2 Transformers)
- 35kV Bay : 17 Bays (10 Lines including 2 spears, 2 Transformers, 2 SVCs, 1 Bus section, 2 PTs)
- SVC : 2 units, 10,000kVar/1unit
(2) Protection System including Associated Equipment
The major facilities for the grid protection and operation, such as line protection relays, recording facilities and remote automation facilities, are described in this item.
All facilities are designed in compliance with the Grid Code, Technical Code and requirement of the grid operating company. For example, the protection system is designed in compliance with GB14285-2006 “Technical code for relaying protection and security automatic equipment”.
1) 110kV line protection
Microcomputer-based optical fiber pilot differential line protection is applied as the main relay and the dedicated optical fiber core is used for the protection channel. As the backup relays, three-segment inter-phase distance protection, three- segment grounding distance protection, four-segment zero sequence current and direction protection, three-phase primary reclosing (with synchronization or no-voltage detection) are installed.
2) 35kV line protection
Microcomputer-based optical fiber pilot differential line protection is applied as the main relay and dedicated optical fiber core is used for the protection channel. As the backup relays, three-segment inter-phase distance protection and three-segment direction and overcurrent protection, and three-phase primary reclosing (with synchronization or no-voltage detection) are installed. Reasonably, the above relay is required to the PV power plants because the plants are connected with the 110kV combiner station using the 35kV lines. And low

Chapter 4 Renewable Energy Development Review of Grid Connectivity of MW Class Solar PV System Final Report
4 - 26
frequency and low voltage disconnection device is also installed at the Guodian Longyuan and CPI (both PV power plants are already operated).
3) Microcomputer fault wave recording device
The station will be provided with a microcomputer fault wave recording device, to record the faults of the 110kV line and the main transformer. It is required to have the fault analysis, remote transmission and GPS satellite time calibration functions.
4) Remote automation
The requirement for the remote automation is as follows.
a) Dispatching management
The dispatching management of the 110kV combiner station is operated by the provincial dispatching center.
b) Acquisition of remote information
Remote information for the combiner station is designed according to the relevant provisions in DL5002-2005 “Technical specification for dispatching automation design of regional grid” and DL5003-2005 “Technical specification for dispatching automation design in electric power systems”.
Microcomputer integrated automation system is applied for the secondary control, and the acquisition of substation remote information is taken into account in conjunction with the integrated automation.
c) Remote information transmission method and channel
According to the requirements on remote information transmission, the remote transmission method for the combiner station is determined as via power data net channel.
The remote operation host is connected to the power data net via data net connection equipment, to send remote information to the provincial dispatching center, with transmission rate no less than 2Mbps, and error code rate not exceeding 10-7. The application level protocol is based on the ministry issued standard DL476-92 and IEC60870-5-104, and TCP/IP be adopted for network level protocol.
d) Miscellaneous
To ensure safe and reliable operation of the computer real-time systems at the provincial and regional dispatching centers, a pilot authentication

Renewable Energy Development Chapter 4 Final Report Review of Grid Connectivity of MW Class Solar PV System
4 - 27
encryption device, a fire wall and corresponding software should be considered for the secondary system of the combiner station. The pilot authentication encryption device shall have the functions of status indication, self-check at powering-on, fault alarm, plain and encrypted text communication, and selective encryption for encrypted network management; support 10/100M self-adapting Ethernet port; accept remote monitoring and management and support software upgrading.
5) Communication facilities
Optical fiber communication is applied between the combiner station and 330kV Golmud substation, a 16-core OPGW optical cable and corresponding communication equipment is used. The information from the combiner station is transmitted via this channel to the Golmud substation, and then connected to the existing power optical fiber net and then it is transmitted to the Qinghai Provincial dispatching center and Haixi regional dispatching center.
4.2.6 FRT Function
The grid condition including power system and equipment of the 110kV combiner station is in beside consideration mentioned above Section 4.1.2.5, items 1) to 5). The FRT function which has already regulated in PRC (the voltage recover time is 2.0 Sec, remained voltage is 20 %) is not yet applied to the RE (wind, solar PV). However, FRT function is essential to keep grid stability and it is to be applied to the wind/PV power plant in other countries which have huge scale of wind/PV power plants, and the grid operator in Qinghai also intends to do so.
(1) Requirement on FRT Function
Grid-interconnection code in many developed countries including Japan requires for a solar PV power generator to control frequency fluctuation and voltage drop within the certain regulated range, and demands to equip with FRT function. Fig. 4.2-5 and Fig. 4.2-6 below is illustrated requirement in Japan, which will also be stringent after 2017.

Chapter 4 Renewable Energy Development Review of Grid Connectivity of MW Class Solar PV System Final Report
4 - 28
Fig. 4.2-5(a) Requirement on FRT Function (before March, 2017)
[%]
Time
100
30
UVR*1 setting value
0.0
*1: UVR: Under Voltage Relay
[Sec]
Rem
aine
d Vo
ltage
1.0 Start time of voltage drop
Continuous operation is required
Requirement on voltage drop
[%]
Time
100
Within 1 Sec
[Sec]
Rem
aine
d Vo
ltage
0.0
Start time of voltage drop
Requirement on recovery time (remained voltage: over 30%)
80
0.5 Voltage recovered
Required time and voltage
[%]
Time
100
Within 1 Sec
[Sec]
Rem
aine
d Vo
ltage
0.0 Start time of voltage drop
Requirement on recovery time (remained voltage: under 30%)
80
1.0 Voltage recovered
Required time and voltage

Renewable Energy Development Chapter 4 Final Report Review of Grid Connectivity of MW Class Solar PV System
4 - 29
Fig. 4.2-5 (b) Requirement on FRT Function (before March, 2017)
[Hz]
Time
50.8
[Sec]
Freq
uenc
y
0.06 (3 cycles)
Start time of frequency rise
Requirement on Frequency (In case of step rise) [50Hz bass]
Continuous operation is required
50.0
[Hz]
Time
51.5
[Sec]
Freq
uenc
y
Start time of frequency rise
Requirement on Frequency (In case of ramp rise) [50Hz bass]
Continuous operation is required
50.0
47.5
Change rate of frequency: 2Hz/Sec

Chapter 4 Renewable Energy Development Review of Grid Connectivity of MW Class Solar PV System Final Report
4 - 30
Fig. 4.2-6 (a) Requirement on FRT Function in Japan (after April, 2017)
[%]
Time
100
20
UVR*1 setting value
0.0
*1: UVR: Under Voltage Relay
[Sec]
Rem
aine
d Vo
ltage
1.0 Start time
of voltage drop
Continuous operation is required Requirement on voltage drop
remark
remark [%]
Time
100
Within 1 Sec
[Sec]
Rem
ained Voltage
0.0 Start time
of voltage drop
Requirement on recovery time (remained voltage: over 20%)
80
0.1
Voltage recovered
Required time and voltage
remark
remark [%]
Time
100
Within 1 Sec
[Sec]
Rem
aine
d Vo
ltage
0.0
Start time of voltage drop
Requirement on recovery time (remained voltage: under 20%)
80
1.0 Voltage recovered
Required time and voltage

Renewable Energy Development Chapter 4 Final Report Review of Grid Connectivity of MW Class Solar PV System
4 - 31
Fig.4.2-6 (b) Requirement on FRT Function (after April, 2017)
The requirement on FRT function in PRC technical standard is shown in Fig. 4.2-7. The differences of the requirements between PRC and Japan are stated in the above Fig. 4.2-7 and shown below.
1) LVRT1
1 Low Voltage Ride Through. Value of remained voltage to be continuous operation.
level : PRC (20%) < Japan (30%) 2) Recovery time : PRC (2.0Sec at 90%) < Japan (0.5Sec at 80%)
[Hz]
Time
50.8
[Sec]
Freq
uenc
y
0.06 (3 cycles)
Start time of frequency rise
Requirement on Frequency (In case of step rise) [50Hz bass]
Continuous operation is required
50.0
Same as before March, 2017
[Hz]
Time
51.5
[Sec]
Freq
uenc
y
Start time of frequency rise
Requirement on Frequency (In case of ramp rise) [50Hz bass]
Continuous operation is required
50.0
47.5
Change rate of frequency: 2Hz/Sec
Same as before March, 2017

Chapter 4 Renewable Energy Development Review of Grid Connectivity of MW Class Solar PV System Final Report
4 - 32
Although the requirement in PRC is appropriate, Further the voltage recovery time of FRT will be modified from 2.0 Sec to 0.5 Sec in consideration of more stable operation in immediate future.
(2) Block Diagram of Control System
Assessing the grid condition either it must be paralleled off or must be operated continuously, is the key point to ensure safety operation of FRT function.
1) When a fault occurred in the connected transmission line, the PV power plant must be paralleled off.
2) When a fault occurred in other transmission lines with voltage drop, the PV power plant must be operated continuously.
The PV power plants in PRC should have a complete and efficient line protection in compliance with the relevant Code and requirement by a grid company. This line protection can catch a fault in the case of 1) above easily and quickly. The proposed block diagram of the control system designed is shown in Fig. 4.2-8 and the result of factory test is shown in Fig. 4.2-9. Grid protection circuit integrated in this block diagram is designed to meet the requirements to connect with low voltage circuit (6.6kV) without circuit breaker. Under this connection, control system of inverter must have the grid protection.
[%]
Time
100
Within 1 Sec
[Sec]
Rem
aine
d Vo
ltage
0.0 Start time
of voltage drop
Requirement on LVRT*1 level recovery time
80
0.5 Voltage recovered
Required time and voltage
2.0
90
20 30 Japan
(before March, 2017)
China
Fig. 4.2-7 Requirement on FRT Function (PRC)

Renewable Energy Development Chapter 4 Final Report Review of Grid Connectivity of MW Class Solar PV System
4 - 33
*1 : Maximum Power Point Tracking
Fig. 4.2-8 Block Diagram of Control System
Fig. 4.2-9 Result of Factory Test of the FRT Function
Grid voltage
Output current of inverter
Continuous operation by FRT function
Recovery operation
Usual operation
Keep the stable output current
Inverter
Grid PV-Array
Control for
MPPT*1
Drive Circuit for
Inverter
Detection Circuit of
Vout & Fout
Grid Protection Circuit
Control for
FRT Operation
Control for
Vout & Iout
Vout / Iout / Fout Vdc / Idc

Renewable Energy Development Chapter 5 Final Report Economics of Solar PV Power Plant
CHAPTER 5
ECONOMICS OF SOLAR PV POWER PLANT

Renewable Energy Development Chapter 5 Final Report Economics of Solar PV Power Plant
5 - 1
CHAPTER 5 ECONOMICS OF SOLAR PV POWER PLANT 5.1 Financial Assessment and Financial Options
Financial assessment of the 10MW Pilot Project had been done by the project proponent, QBE, in the feasibility study. The Consultant followed some of its basic assumptions of analysis, while the Consultant also referred to a set of conditions instructed by NDRC, to build a financial model.
5.1.1 Financial Analysis
(1) Framework of Analysis
As mentioned above, there had been a study carried out by QBE whose conditions do not completely agree with the set of conditions shown by NDRC as a guideline for prospective PV project investors. The settings of two methods are shown below.
1) QBE's preliminary feasibility study
QBE's feasibility study adopted financial conditions shown below.
Proportion of loan to total investment 61.29% Repayment Period 10 years Interest of Loan 5.346% Operation period 25 years Depreciation 10 years for electric facilities and 30 years for buildings, etc. Residual value of fixed assets 5% Operation cost 0.2% of total investment cost VAT 8.5% Income Tax 25% Additional tax city construction tax 7%, education tax 3%
2) Guideline of NDRC
NDRC published a set of conditions of financial analysis for those who wish to apply for a license of PV projects as shown below.
Proportion of loan to total investment 60% Repayment Period 15 years Interest of Loan 6.12% Operation period 20 years

Chapter 5 Renewable Energy Development Economics of Solar PV Power Plant Final Report
5 - 2
Depreciation 20 years Residual value of fixed assets 5% Operation cost 7% of year's depreciation VAT 17% Income Tax 25% Additional tax 8% IRR of profit after tax 11 – 12%
Although QBE’s feasibility study report does not specifically mention, their profit and loss calculation includes "subsidy" in income, equivalent to CNY 0.09 per kWh, limited for the period from the commencement of operation to the end of 12th year into operation. Aside from that, QBE's conditions are different from Guideline's in many ways. Significant differences are; operation period, loan conditions (repayment period, interest rate), depreciation period, etc.
In the following analysis, conditions set out by NDRC were used as they presented tougher conditions on financial prospect of the project, except interest rate of domestic commercial bank loan, which was revised upward in the analyses here, at 6.55% per annum, referring to People’s Bank of China’s long-term loan interest rate. Also, an alternative reference value for IRR on equity, 8% per annum, was considered as an alternative, lower threshold in the following analyses.
The base year of the analyses was set at 2011.
(2) Project Cost
1) Investment cost
Estimation of investment cost was based on QBE’s study results as follows;
Major equipment quotations of manufacturers of PV modules and inverters Installation work Qinghai Province Construction Work Unit Cost 2004 Transmission line wok rural power grid works track records Building cost unit cost of similar works Land acquisition CNY 3 per square meter Cost of materials, equipment and etc. price level of the first quarter in 2010
The result of the estimation is summarized in the table below.

Renewable Energy Development Chapter 5 Final Report Economics of Solar PV Power Plant
5 - 3
Table 5.1-1 Cost Estimate of 10 MW Pilot Project
Description Amount CNY Remark
1 PV module cost 95,000,000 CNY 9.5 per Wp
2 Power Conditioner 17,000,000 CNY 850,000.0 per 500kW unit
3 Other Equipment 6,802,000
4 Substation related 5,346,100
5 Central Control 375,000
6 Equipment Installation 3,789,700
7 Building Construction 18,368,800
8 Standard Spare Parts 4,856,000
9 Transmission 540,000
10 Other Construction Cost 12,844,500 Include land acquisition cost
11 Grid Connection 1,800,000
Total 166,722,100
Figures in CNY
This investment cost estimate may not be quite up-to-date for the base year of the analysis, 2011. The total CNY 166,722,100 is equivalent to US$24.6 million and, in term of per-kW unit cost, US$ 2,460 per kW. This is quite low even when compared with the international market price for the year 20121
2) O&M cost
. However, in PRC the price level of PV equipment has been falling drastically, and there is a possibility that the investment cost for the Pilot Project could be lower than this estimate. The effect of such a possibility was discussed in the later section.
O&M cost of this project are based on the instruction of NDRC. Each cost is calculated as follows:
O&M cost is calculated at 7% of year's depreciation. The components of the operation cost are not specifically explained by NDRC Guideline. However, 7% of year's depreciation gives almost the same value as what QBE assumed in his preliminary feasibility study where the operation cost consists of asset-related fixed cost, generated energy-related variable cost, and human-resource cost. Depreciation is calculated with the straight-line method for twenty years with five per cent residual value. The interest rate of domestic commercial bank loan, 6.55% per annum, was used to express a cost of loan in calculating WACC2
Taxes are VAT on sales 17%, sales additional tax 8% on VAT, and income tax 25%.
.
1 For example, National Renewable Energy Laboratory of the US reports in July 2012 that the average unit installation cost
($/kW) of PV projects with the size range of 1 to 10 MW is $3,383, while QBE’s estimate in 2010 was $2,463. 2 Weighted Average Cost of Capital

Chapter 5 Renewable Energy Development Economics of Solar PV Power Plant Final Report
5 - 4
(3) Generated Power and Revenue
Power generation was estimated in the study by QBE. Annual generated energy for the first year is 17.85 GWh, subject to an annual deterioration of output at 0.8% for years onward. The first year output corresponds to the capacity factor of the plant 20.4%. Annual decrease of output at the rate of 0.8% amounts to 8% in ten years and 15 % in twenty years.
On the other hand, the Consultant’s estimate of annual generated energy was a little smaller than this, at 16.82 GWh annually, as shown in Chapter 2, Table 2.3-1. For the purpose of the following analyses, the Consultant’s estimate was used.
Generated power is assumed to be sold to the provincial utility at CNY 1.15 per kWh, which is a concession rate offered by the provincial government of Qinghai in July 2011 for those prospective PV power plant operators who would start power generation by the end of 2011.
(4) Financial Sources
According to PRC's relevant laws for domestic power projects, equity to capital ratio must be over 20%. NDRC also instructs to PV power plant proponents that the equity has to be at least 40% of total capital requirement. Therefore, 40% of capital is assumed to come from the proponent’s own finance (equity). The remaining finance comes from domestic bank loan, whose conditions are as mentioned earlier.
(5) WACC
The WACC was calculated using the conditions mentioned above. The cost of equity is assumed at 11.0%, interest rate of domestic bank loan 6.55%, income tax rate 25%, all as instructed by NDRC except the interest rate. Inflation rate is assumed at 3.8%. Thus WACC of 3.42% was obtained.
Table 5.1-2 Calculation of WACC
Financial Component Domestic Loan Equity
Weighting 60% 40%
Nominal Cost 6.55% 11.00%
Income Tax Rate 25.00%
Tax-adjusted Nominal Cost 4.91% 11.00%
Inflation Rate 3.80% 3.80%
Real Cost 1.07% 6.94%
Weighted component of WACC 0.64% 2.77%
WACC 3.42%

Renewable Energy Development Chapter 5 Final Report Economics of Solar PV Power Plant
5 - 5
(6) FIRR3
Projection of revenue and cost are laid out for coming twenty years to calculate FIRR (see the table below). FIRR obtained was 4.95%, higher than the calculated WACC 3.42%. Financial NPV calculated using the discount rate 3.42% was CNY 22 million. However, we should not take this result at face value. This analysis method was based on the assumption that the financial projection was valued in real terms: under the inflationary condition, the interest rate of bank loan was converted to real terms when WACC was calculated, and the O&M cost was considered to be constant in real terms. One factor that does not go along is the income. The concession rate of power purchase, CNY 1.15 per kWh, is likely to be inflexible upward in nominal terms, even under very high inflation. Therefore, applying a constant concession rate in the analysis for the whole project life may lead to overestimate of the income. One simple approximation to avoid overvaluing of the result is to remove the inflation adjustment in WACC, which leads to the WACC 7.35%. FIRR obtained, 4.95%, was much lower than this, and Financial NPV would fall negative. Under the inflationary environment with upward-inflexible price of main product, judgement on the result of the analysis is not quite straightforward.
Table 5.1-3 Calculation of FIRR
year Electricity Generated
(GWh)
Capital Cost
O&M cost Sales & Other Tax
Income Tax
Total Revenue
Net Revenue (after tax)
2011 (166.722) (166.722) 2012 16.823 0.552 3.036 1.969 19.346 13.789 2013 16.688 0.552 3.012 1.937 19.192 13.692 2014 16.555 0.552 2.988 1.905 19.038 13.594 2015 16.422 0.552 2.964 1.872 18.886 13.498 2016 16.291 0.552 2.940 1.841 18.735 13.403 2017 16.161 0.552 2.916 1.809 18.585 13.308 2018 16.031 0.552 2.893 1.778 18.436 13.214 2019 15.903 0.552 2.870 1.747 18.289 13.121 2020 15.776 0.552 2.847 1.716 18.142 13.028 2021 15.650 0.000 0.552 2.824 1.685 17.997 12.936 2022 15.525 0.552 2.802 1.655 17.853 12.845 2023 15.400 0.552 2.779 1.625 17.710 12.755 2024 15.277 0.552 2.757 1.595 17.569 12.665 2025 15.155 0.552 2.735 1.565 17.428 12.576 2026 15.034 0.552 2.713 1.536 17.289 12.488 2027 14.913 0.552 2.691 1.507 17.150 12.401 2028 14.794 0.552 2.670 1.478 17.013 12.314 2029 14.676 0.552 2.648 1.449 16.877 12.228 2030 14.558 0.552 2.627 1.421 16.742 12.143 2031 14.442 9.103 0.552 2.606 1.392 16.608 21.161 (figures in Million CNY) FIRR= 4.95%
3 Financial Internal Rate of Return
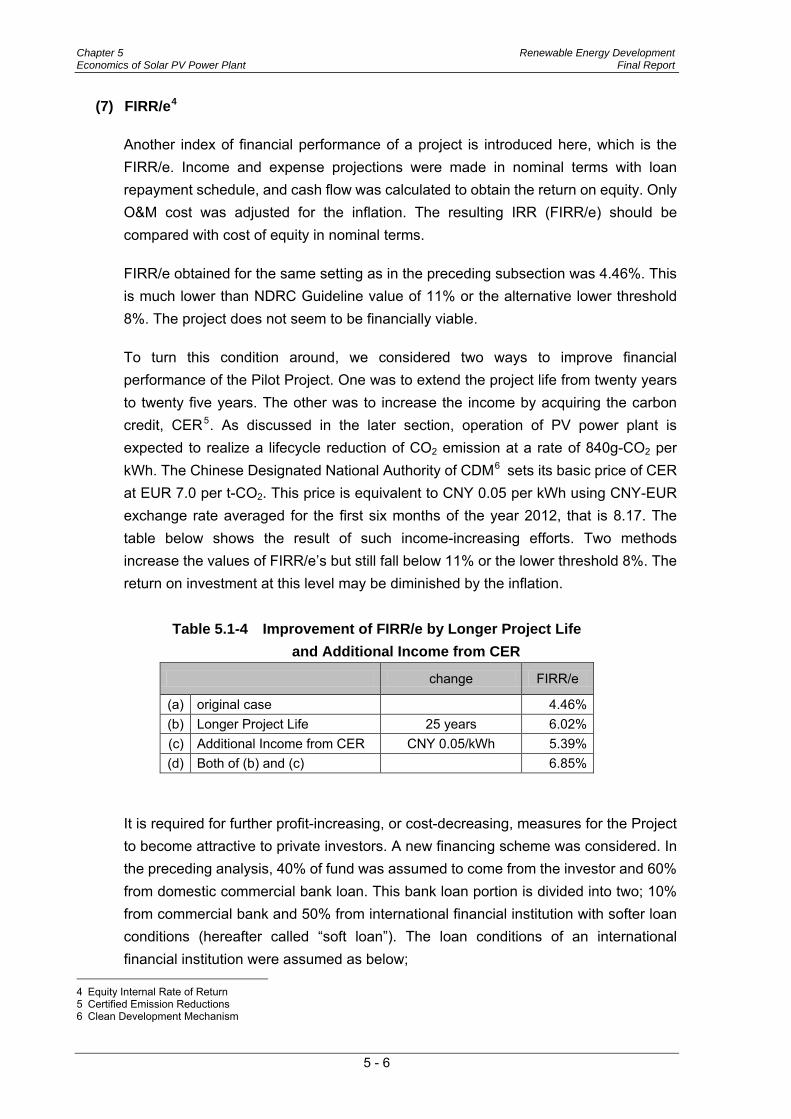
Chapter 5 Renewable Energy Development Economics of Solar PV Power Plant Final Report
5 - 6
(7) FIRR/e4
Another index of financial performance of a project is introduced here, which is the FIRR/e. Income and expense projections were made in nominal terms with loan repayment schedule, and cash flow was calculated to obtain the return on equity. Only O&M cost was adjusted for the inflation. The resulting IRR (FIRR/e) should be compared with cost of equity in nominal terms.
FIRR/e obtained for the same setting as in the preceding subsection was 4.46%. This is much lower than NDRC Guideline value of 11% or the alternative lower threshold 8%. The project does not seem to be financially viable.
To turn this condition around, we considered two ways to improve financial performance of the Pilot Project. One was to extend the project life from twenty years to twenty five years. The other was to increase the income by acquiring the carbon credit, CER5. As discussed in the later section, operation of PV power plant is expected to realize a lifecycle reduction of CO2 emission at a rate of 840g-CO2 per kWh. The Chinese Designated National Authority of CDM6
sets its basic price of CER at EUR 7.0 per t-CO2. This price is equivalent to CNY 0.05 per kWh using CNY-EUR exchange rate averaged for the first six months of the year 2012, that is 8.17. The table below shows the result of such income-increasing efforts. Two methods increase the values of FIRR/e’s but still fall below 11% or the lower threshold 8%. The return on investment at this level may be diminished by the inflation.
Table 5.1-4 Improvement of FIRR/e by Longer Project Life and Additional Income from CER
change FIRR/e
(a) original case 4.46% (b) Longer Project Life 25 years 6.02% (c) Additional Income from CER CNY 0.05/kWh 5.39% (d) Both of (b) and (c) 6.85%
It is required for further profit-increasing, or cost-decreasing, measures for the Project to become attractive to private investors. A new financing scheme was considered. In the preceding analysis, 40% of fund was assumed to come from the investor and 60% from domestic commercial bank loan. This bank loan portion is divided into two; 10% from commercial bank and 50% from international financial institution with softer loan conditions (hereafter called “soft loan”). The loan conditions of an international financial institution were assumed as below;
4 Equity Internal Rate of Return 5 Certified Emission Reductions 6 Clean Development Mechanism

Renewable Energy Development Chapter 5 Final Report Economics of Solar PV Power Plant
5 - 7
Interest of Loan 2.60% Repayment Period 20 to 25 years including Grace Period of 5 years
The conditions of commercial bank loan were the same as before except that the amount is now reduced to 10% of initial investment.
The result of the introduction of soft loan is shown below along with that for cases with longer project life and additional income from CER.
Introduction of soft loan increases FIRR/e above the lower threshold value of 8%. Extension of operation period for five years further improves FIRR/e. Combined with the effect of additional income from CER, the Project will attain FIRR/e above 11%.
Table 5.1-5 FIRR/e with Soft Loan
change FIRR/e
(a) With Soft Loan 50% of investment cost 8.73%
(b) + Longer Project Life 25 years 10.72%
(c) + Additional Income from CER CNY 0.05/kWh 10.05%
(d) + Both of (b) and (c) 11.89%
(8) Effect of Smaller Investment Cost
Preceding analyses were all based on the initial investment cost estimated by QBE in 2010. In a fast changing market environment of PV industry in PRC, this estimate may no longer be relevant and the current cost level of PV equipment in PRC can be lower, although QBE’s estimate is much lower than the latest international market price level. Examination was made to find the effect of smaller investment cost on project financial performance, without resorting to such measures as introducing soft loans.
FIRR/e’s calculated for cases with lowered initial investment cost are shown below. The additional income from CER was not considered here.
Table 5.1-6 Effect of Smaller Investment Cost on FIRR/e
Reduction in Investment Cost 0% -5% -10% -15%
Unit Investment Cost ($/kW) 2,463 2,340 2,216 2,093
FIRR/e for 20 year project 4.46% 5.41% 6.46% 7.62%
FIRR/e for 25 year project 6.02% 6.86% 7.80% 8.84%
There are a few cases where FIRR/e is close enough to or exceeding the lower threshold 8%. If the initial investment cost were 10 to 15% lower than QBE’s estimate,

Chapter 5 Renewable Energy Development Economics of Solar PV Power Plant Final Report
5 - 8
we may have the Pilot Project financially viable without the additional CER income, although at least the project life would have to be extended to twenty-five years.
5.1.2 Risk Assessment and Lifecycle Analysis
(1) Sensitivity Analysis
In the preceding section, the financial performance of the Pilot Project was assessed with equity IRRs (FIRR/e’s) in nominal terms. The Pilot Project was found to give the return lower than private investors’ expectations. Some measures for improvement were considered; extending the project life to twenty-five years, securing additional income from CER, and finally introducing softer loan in initial investment funding. Each measure increases FIRR/e. But for the Pilot Project to attain FIRR/e larger than 11%, all of these measures should be employed.
In this subsection the result of the sensitivity analysis conducted for cases with conditions shifting to adverse side. The base case is the case shown in Table 4.2-5, using QBE’s investment cost, with 50% of fund comes from a soft loan. Income-increasing measures as an extension of the project life and additional income from CER were handled as options.
Cases were considered for; (a) base case, (b) capital cost overrun by 10%, (c) benefit (total revenue) lowered by 10%, (d) output of PV system deteriorate at faster rate at 1.5% per annum, (e) project implementation delayed for one year, (f) the CER income reduced by 10%, (g) interest rates of loans increased by 10%, (h) combination of all aforementioned conditions, (i) power conditioners needed an unscheduled whole replacement (re-purchase) in 10th year, and (j) combination of d and i.
The most adverse conditions are represented by case (h), where FIRR/e’s in four options fall to the lowest level but keep positive values. In case (e), the project implementation was assumed delayed for one year, and the operation period shortened. The second largest impact on FIRR/e’s was seen in the case.
Developing PV power station is a capital intensive project with still-expensive technologies. Therefore, time is needed to recover heavy investment concentrated in the beginning of the project. The longer the operation period is, the better the financial performance of the project becomes. In the 10MW Pilot Project case, twenty years instructed by NDRC does not seem to be long enough to recover the investment and the longer operation is very much desired.

Renewable Energy Development Chapter 5 Final Report Economics of Solar PV Power Plant
5 - 9
Table 5.1-7 Sensitivity Analysis of FIRR/e with Soft Loan Introduced
Change FIRR/e
20 years 25 years w/o CER w/CER w/o CER w/CER
(a) Base case
8.73% 10.05%
10.72% 11.89%
(b) Capital cost overrun +10% 6.30% 7.57%
8.57% 9.69%
(c) Lower benefit -10% 6.04% 7.31%
8.34% 9.46%
(d) Faster deterioration -1.5% p.a. 7.48% 8.84%
9.56% 10.77%
(e) Delay of Construction 1 year 6.51% 7.53%
8.29% 9.22%
(f) CER income reduced -10% - 9.92%
- 11.78%
(g) Higher Interest Rate +10% 8.32% 9.64%
10.35% 11.52%
(h) All of conditions above
1.11% 2.01%
3.11% 3.97%
(i) Renew power conditioners
6.85% 8.28%
9.36% 10.62%
(j) Combination of (d) and (i)
5.37% 6.86%
8.03% 9.34%
Having longer operation period surely increases the chance of better return. Problem is that the Consultant do not know what may happen to Mega PV power plants after ten to twenty years into operation, as the Consultant do not yet have many of such cases. Such an option would bear extra risks related to time. Majority of such risks may be attributable to deterioration of output and/or unexpected breakdown of equipment. In base case the output of PV modules is assumed to fall by 0.8% every year, corresponding to output falling to 92% in ten years and 85% in twenty years. Considering the recent industrial standard of PV module manufacturers’ guarantee of 90% output for 10 years and 80% for twenty years, this assumption seems reasonable but leaves some possibility of falling under more difficult situations. Such case was considered in (d) where deterioration rate was set almost twice as fast. With 1.5% deterioration rate, output will fall to 86% in ten years and 74% in twenty years, the level that entitles the project owners to claim manufacturers’ guarantee. Further, unexpected replacement of power conditioners in 10th year was considered in (i). Combining (d) and (i), that is the case (j), FIRR/e’s in four options were shown to stay above the level that seem not be very attractive, but not discouragingly low either, to private investors.
Longer operation period may also raise a question of continuity of policy measures. Qinghai Province’s July 2011 offer of CNY 1.15 per kWh is, although drastically lower than offers for PV projects in the past few years, much more expensive than a reference price for thermal power, CNY 0.35 per kWh in the country. The main purpose of the high concession price for power purchase is to stimulate the market and lower the cost of investment. Once this target is achieved, what would happen to the policy measures while they are putting heavy burden on the budgets of the
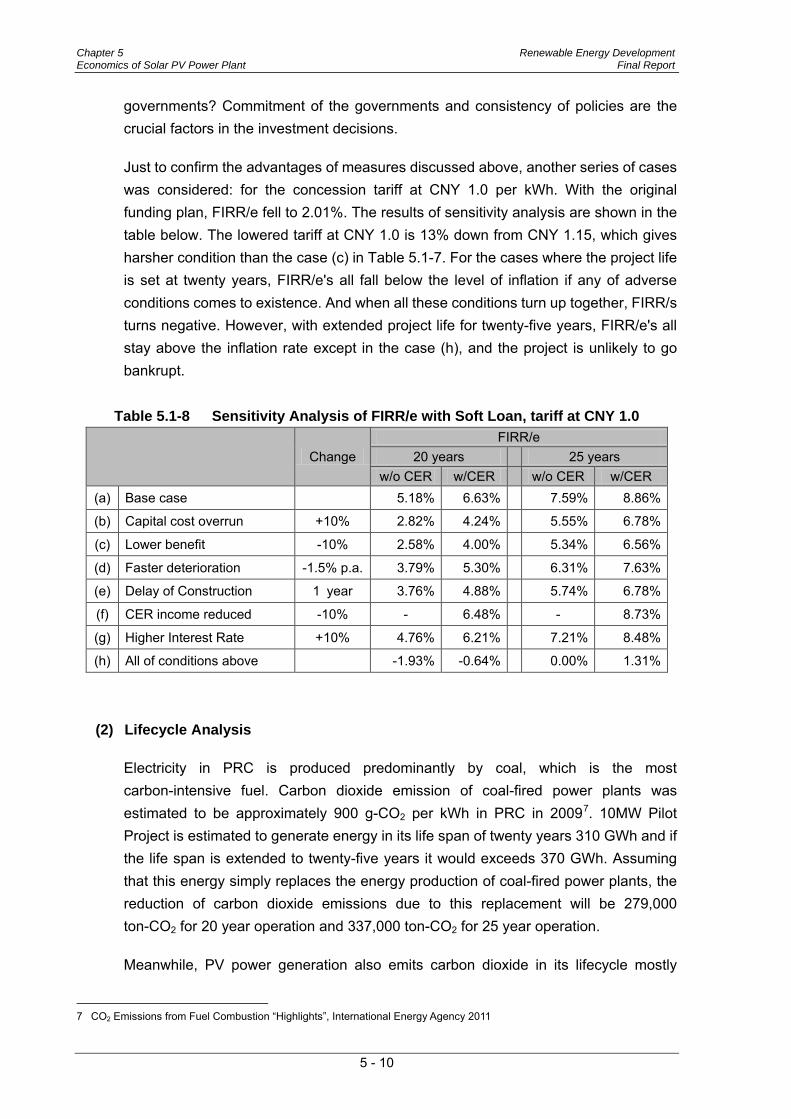
Chapter 5 Renewable Energy Development Economics of Solar PV Power Plant Final Report
5 - 10
governments? Commitment of the governments and consistency of policies are the crucial factors in the investment decisions.
Just to confirm the advantages of measures discussed above, another series of cases was considered: for the concession tariff at CNY 1.0 per kWh. With the original funding plan, FIRR/e fell to 2.01%. The results of sensitivity analysis are shown in the table below. The lowered tariff at CNY 1.0 is 13% down from CNY 1.15, which gives harsher condition than the case (c) in Table 5.1-7. For the cases where the project life is set at twenty years, FIRR/e's all fall below the level of inflation if any of adverse conditions comes to existence. And when all these conditions turn up together, FIRR/s turns negative. However, with extended project life for twenty-five years, FIRR/e's all stay above the inflation rate except in the case (h), and the project is unlikely to go bankrupt.
Table 5.1-8 Sensitivity Analysis of FIRR/e with Soft Loan, tariff at CNY 1.0
Change FIRR/e
20 years 25 years w/o CER w/CER w/o CER w/CER
(a) Base case
5.18% 6.63%
7.59% 8.86%
(b) Capital cost overrun +10% 2.82% 4.24%
5.55% 6.78%
(c) Lower benefit -10% 2.58% 4.00%
5.34% 6.56%
(d) Faster deterioration -1.5% p.a. 3.79% 5.30%
6.31% 7.63%
(e) Delay of Construction 1 year 3.76% 4.88%
5.74% 6.78%
(f) CER income reduced -10% - 6.48%
- 8.73%
(g) Higher Interest Rate +10% 4.76% 6.21%
7.21% 8.48%
(h) All of conditions above
-1.93% -0.64%
0.00% 1.31%
(2) Lifecycle Analysis
Electricity in PRC is produced predominantly by coal, which is the most carbon-intensive fuel. Carbon dioxide emission of coal-fired power plants was estimated to be approximately 900 g-CO2 per kWh in PRC in 20097
Meanwhile, PV power generation also emits carbon dioxide in its lifecycle mostly
. 10MW Pilot Project is estimated to generate energy in its life span of twenty years 310 GWh and if the life span is extended to twenty-five years it would exceeds 370 GWh. Assuming that this energy simply replaces the energy production of coal-fired power plants, the reduction of carbon dioxide emissions due to this replacement will be 279,000 ton-CO2 for 20 year operation and 337,000 ton-CO2 for 25 year operation.
7 CO2 Emissions from Fuel Combustion “Highlights”, International Energy Agency 2011

Renewable Energy Development Chapter 5 Final Report Economics of Solar PV Power Plant
5 - 11
attributable to PV cell production process. This emission is estimated to be around 50 to 60 g-CO2/kWh8
for crystalline PV cells, approximately 6% of coal-fired thermal power plant emissions.
Table 5.1-9 Reduction of CO2 Emission Unit 20 year 25 year
Generated energy by Pilot Project GWh 310 374
Saved emission from coal plants9 t-CO2 279,404 337,024
Lifecycle PV plant own emission t-CO2 16,764 20,221
Lifecycle reduction of emission t-CO2 262,639 316,803
From the discussion above, we obtain a lifecycle reduction of CO2 emission due to PV power plant operation to be 840 g-CO2 per kWh of generation.
Emissions of carbon dioxide and resulting climate change are considered to bring about positive and/or negative changes to our lives and economic activities depending on the regions and climate. And their net effect on global average is considered to be negative. There are many efforts to evaluate the effect in monetary term, and IPCC10
As 10MW Pilot Project is just financially feasible at power selling rate of CNY 1.15 per kWh, and this price is higher than the reference power production cost of CNY 0.35, it is considered to pay CNY 0.8 extra cost to realize social benefit of CNY 0.068, which is obviously very inefficient.
reported its finding from many researches’ estimates; the average of social cost of CO2 emissions estimates to be US$ 12 per t-CO2 (the range from 100 estimates is large (-$3 to $95/tCO2), and the net damage costs of climate change are projected to be significant and to increase over time). Lifecycle reduction of social cost, in other word social benefit, due to PV power plant operation is calculated to be 1.01 cent per kWh of generation, that is CNY 0.068 per kWh.
Whether the estimate of social cost of CO2 emission US$ 12 per t-CO2 is correct or not, its magnitude will be larger in the future. The cost of fossil fuel and fossil fuel-fired power production will be increasing as well. With decreasing PV generation cost, the gap between expenditure on, and gain from the reduction of CO2 emissions will be closing. For the time being, we could also narrow the gap, by choosing and investing in better planned/designed PV projects, more efficiently operate and manage, and extending life spans of working PV plants.
8 A guide to life-cycle greenhouse gas (GHG) emissions from electric supply Technologies, IAEA 9 As most of lifecycle emission of CO2 from PV power generation originates in PV cell production, the emission volumes should
be almost the same for 20 and 25 year operation. In this table, 6% of unit emission of coal-fired thermal power plant emissions, that is 54 g-CO2/kWh, was used in both cases.
10 Fourth Assessment Report (AR4) of Intergovernmental Panel on Climate Change (IPCC), 2007

Chapter 5 Renewable Energy Development Economics of Solar PV Power Plant Final Report
5 - 12
5.1.3 Consideration on Tariff and Financial Needs of Pilot Project
(1) Appropriate Tariff and its Affordability
As discussed in the preceding sections, envisaged income and expenses of 10MW Pilot Project is not quite well balanced. The Consultant cannot be sure exactly whether it was because of too high the estimate of the initial investment cost or too low the concession tariff of CNY 1.15 per kWh. QBE’s estimate of the initial investment cost is not quite up-to-date, but still much lower than current investment cost seen in other countries. The analyses above showed that if QBE’s estimate was overvalued for more than 10% than the actual cost, the Pilot Project can be financially viable at the concession tariff of CNY 1.15. If not, the investor would receive the dividend which may be diminished by the inflation unless he took up on some income-increasing, or expense-decreasing, measures.
Now we look, from administrative perspective, at the adequacy of the concession tariff CNY 1.15 per kWh for the PV projects connected to the grid by the end of 2011in Qinghai Province. In order to support the concession tariffs for RE power development, the Government has set an electricity price surtax of CNY 0.004 per kWh. The gap between the reference power production cost of coal-thermal power plant (CNY 0.35 per kWh) and the concession tariff is approximately CNY 0.8 per kWh. This means that to fill this gap, the power production and sales from coal-thermal power plants connected to the Qinghai grid should be more than 200 times larger than the energy sold by PV projects connected to the grid in 2011. In other words, PV produced energy should be less than 0.5% of total energy consumption. The total electric energy consumed in the Qinghai grid in twelve months from July 2010 to June 2011 was 47,944GWh. The expected annual production of energy by the Pilot Project is 16.8GWh, and assuming the same efficiency, PV projects of 2GW capacity in total may produce 3,360GWh, which is 7% of energy consumed in the Qinghai grid. This amount is 14 times larger than the level supportable (0.5%) by the collection of the surtax. According to this simple calculation, the surtax will have to be raised to CNY 0.056 per kWh just to support the concession tariff for PV projects whose total capacity is said to reach 2MW by the end of 2012.
(2) Financial Needs
Promotion of PV power generation requires active participation of private sector. And the private sector requires appropriate returns on their investment. As discussed above, proponents of 10MW Pilot Project or any other similar projects may face financial difficulties under the current price level of equipment and the tariff level. There will be positive return on investment expected even under some adverse conditions, but at a level that may be diminished by the inflation. But it was shown that

Renewable Energy Development Chapter 5 Final Report Economics of Solar PV Power Plant
5 - 13
there were some measures to turn this around. Such measures shown effective include; extending the project operation period from twenty years to twenty five years, seeking additional income from CER, and as the most effective one, securing soft loan for the fund for initial investment. For capital intensive PV projects, relieving the burden of funding is crucial for the better financial performance. Investors will benefit from access to foreign fund offering lower interest rates, longer repayment period and grace period. At the moment, PV projects being promoted seem to have too many uncertainties. For those new concession projects to prove themselves to be creditworthy and bankable, disclosure of financial performance of preceding ongoing projects can be effective and even necessary.
5.2 Policy Implication
We see today a rapid development of PV power generation in Qinghai Province. Despite the fact, we have almost no information on how these projects were planned and how they have been financially performing so far. The financial exercises in this section suggest that, for a PV project to be financially viable, or the investors can sit comfortable when faced with adverse conditions, there should be some measures taken to improve the cash flow for a concession tariff even with CNY 1.0 per kWh.
One measure found effective is to extend project life. Longer project life will not only improve the financial performance of projects, but also contribute to the reduction of carbon dioxide emission for most of carbon dioxide emission from PV power generation comes from production and installation processes of the equipment.
Another effective and important measure is an introduction of soft loan in funding. For capital intensive, expensive PV projects it is quite important to have funds available at favourable, softer conditions. However, the financial conditions of ongoing PV projects are not quite visible to outsiders, and international financial institutions may not see them bankable. As these concession projects have been given tariffs way above the tariffs for conventional power plants, by the fund collected from general users of electricity, their basic financial position should be disclosed to public. The authorities in charge of awarding concessions to projects may also benefit from monitoring the financial performance of concession projects. Research on financial structures of current PV projects will surely help formulate promotion policy for coming years.
Promotion policy may have to be revised as PV projects are expanding very rapidly. The discussion is above points to a possibility of shortage of funds for concession tariff. Although funds can be made available inter-province, the imbalance in Qinghai Province is too large and may become unsustainable even nation-wide.

Renewable Energy Development Chapter 6 Final Report Policy Note, Key Findings, and Recommendation
CHAPTER 6
POLICY NOTE, KEY FINDINGS, AND RECOMMENDATION

Renewable Energy Development Chapter 6 Final Report Policy Note, Key Findings, and Recommendation
6 - 1
CHAPTER 6 POLICY NOTE, KEY FINDINGS, AND RECOMMENDATION 6.1 Outlook of Solar Energy Development in the PRC and the Qinghai Province
The government direction for the decarbonized power sector. The power sector in the PRC has grown rapidly in tandem with the economic growth. Installed power capacity has expanded by about 70% in the past five years alone.1 Since the power sector relies heavily on coal-fired power generation which accounts for more than 75% of total power,2 the rapid expansion in capacity has caused large increase in Carbon Dioxide (CO2), the major greenhouse gas (GHG) responsible for climate change.3 Promoting more diversified energy mix with higher share of renewable energy is the core priority to decarbonize the country’s power sector to meet its carbon intensity reduction target which is set at 40%-45% reduction by 2020 compared with 2005 levels. In 2005, the Renewable Energy Law of the PRC enacted to kick start large scale renewable energy development in the country. It provides a set of incentives to promote renewable technologies, specifies grid-feed in requirements and standard procedures, and establishes supervisory measures. In 2007, the National Development and Reform Commission (NDRC) issued the Medium and Long-Term Development Plan for Renewable Energy in the PRC, which aims to increase the share of renewable energy in the total primary energy consumption to 15% by 2020.4
The Twelfth Five-Year Plan, 2011-2015, has set an intermediate targets to increase share of renewable energy to 11.4% in 2015, and to decrease carbon intensity by 17% by 2015 compared with 2005 levels to meet the larger 2020 targets.
Huge solar PV production capacity and growing domestic market. The PRC is the world largest solar cell producer with huge production capacity which shares around 50% of 29.5 GW solar cell productions in the world as of 2011. Although the worldwide solar cell market is estimated to be shrunk from 2012 and onward due to aggressive cut feed-in-tariff (FIT) incentive in European countries, domestic huge production capacity in PRC will continuously contribute to domestic solar PV market expansion. With ambitious long term target in expanding solar energy install capacity, and feed-in-tariff for solar energy project announced in 2011, the PRC has witnessed a significant growth in domestic solar photovoltaic (PV) market where solar photovoltaic (PV) installed capacity has surged by 2.9 GW from 0.9 GW in 2010. During the Twelfth Five Year plan (2011 – 2015), the PRC has newly set a target for
1 National Energy Administration (2011) Report on China’s Energy Development for 2011, Economic Science Press, Beijing. 2 National Energy Administration (2011) Report on China’s Energy Development for 2011, Economic Science Press, Beijing. 3 GHG emission from energy sector in PRC accounts for 46.9% (or 3,376.7 MtCO2e) of total GHG emission. 4 Current installed capacity of renewable energy is 261 GW, which is 27% of total installed capacity or 18% of total power
generation in 2010. Targets of renewable energy install capacity by 2020 for wind, solar, hydro, and biomass are more than 150 GW, 20 GW, 380GW, and 30 GW respectively.
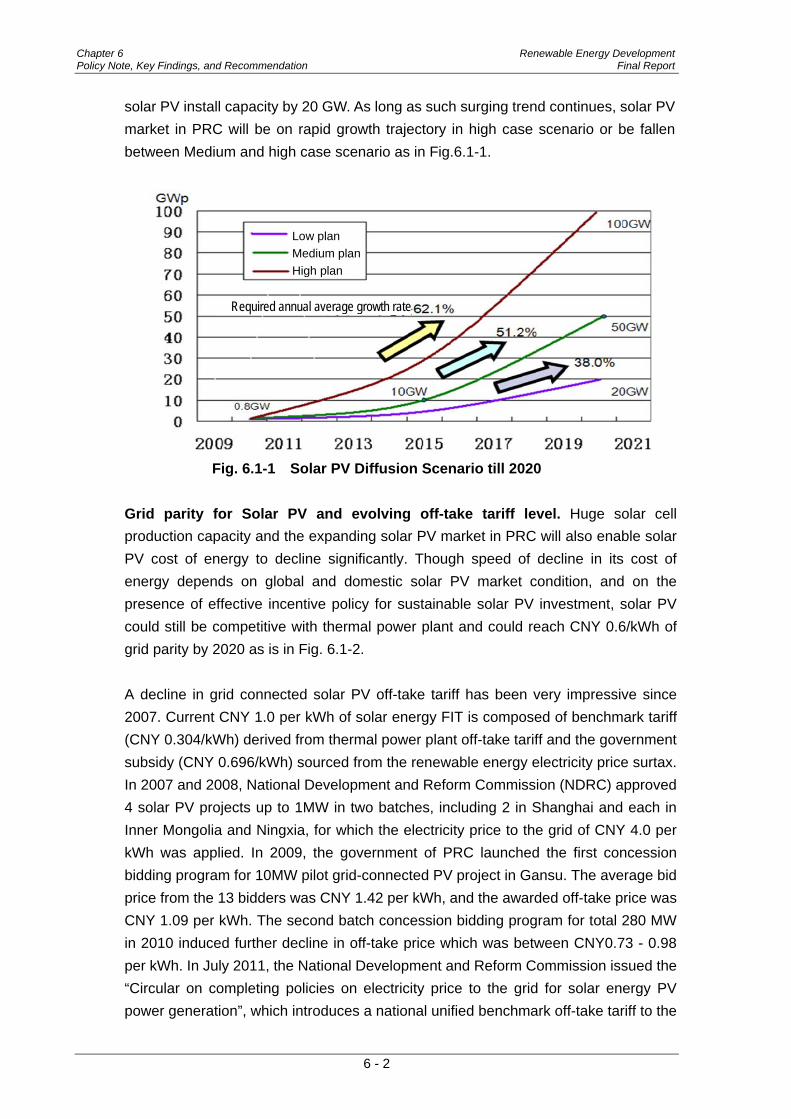
Chapter 6 Renewable Energy Development Policy Note, Key Findings, and Recommendation Final Report
6 - 2
solar PV install capacity by 20 GW. As long as such surging trend continues, solar PV
market in PRC will be on rapid growth trajectory in high case scenario or be fallen
between Medium and high case scenario as in Fig.6.1-1.
Fig. 6.1-1 Solar PV Diffusion Scenario till 2020
Grid parity for Solar PV and evolving off-take tariff level. Huge solar cell
production capacity and the expanding solar PV market in PRC will also enable solar
PV cost of energy to decline significantly. Though speed of decline in its cost of
energy depends on global and domestic solar PV market condition, and on the
presence of effective incentive policy for sustainable solar PV investment, solar PV
could still be competitive with thermal power plant and could reach CNY 0.6/kWh of
grid parity by 2020 as is in Fig. 6.1-2.
A decline in grid connected solar PV off-take tariff has been very impressive since
2007. Current CNY 1.0 per kWh of solar energy FIT is composed of benchmark tariff
(CNY 0.304/kWh) derived from thermal power plant off-take tariff and the government
subsidy (CNY 0.696/kWh) sourced from the renewable energy electricity price surtax.
In 2007 and 2008, National Development and Reform Commission (NDRC) approved
4 solar PV projects up to 1MW in two batches, including 2 in Shanghai and each in
Inner Mongolia and Ningxia, for which the electricity price to the grid of CNY 4.0 per
kWh was applied. In 2009, the government of PRC launched the first concession
bidding program for 10MW pilot grid-connected PV project in Gansu. The average bid
price from the 13 bidders was CNY 1.42 per kWh, and the awarded off-take price was
CNY 1.09 per kWh. The second batch concession bidding program for total 280 MW
in 2010 induced further decline in off-take price which was between CNY0.73 - 0.98
per kWh. In July 2011, the National Development and Reform Commission issued the
“Circular on completing policies on electricity price to the grid for solar energy PV
power generation”, which introduces a national unified benchmark off-take tariff to the
Required annual average growth rate
Low plan
Medium plan
High plan
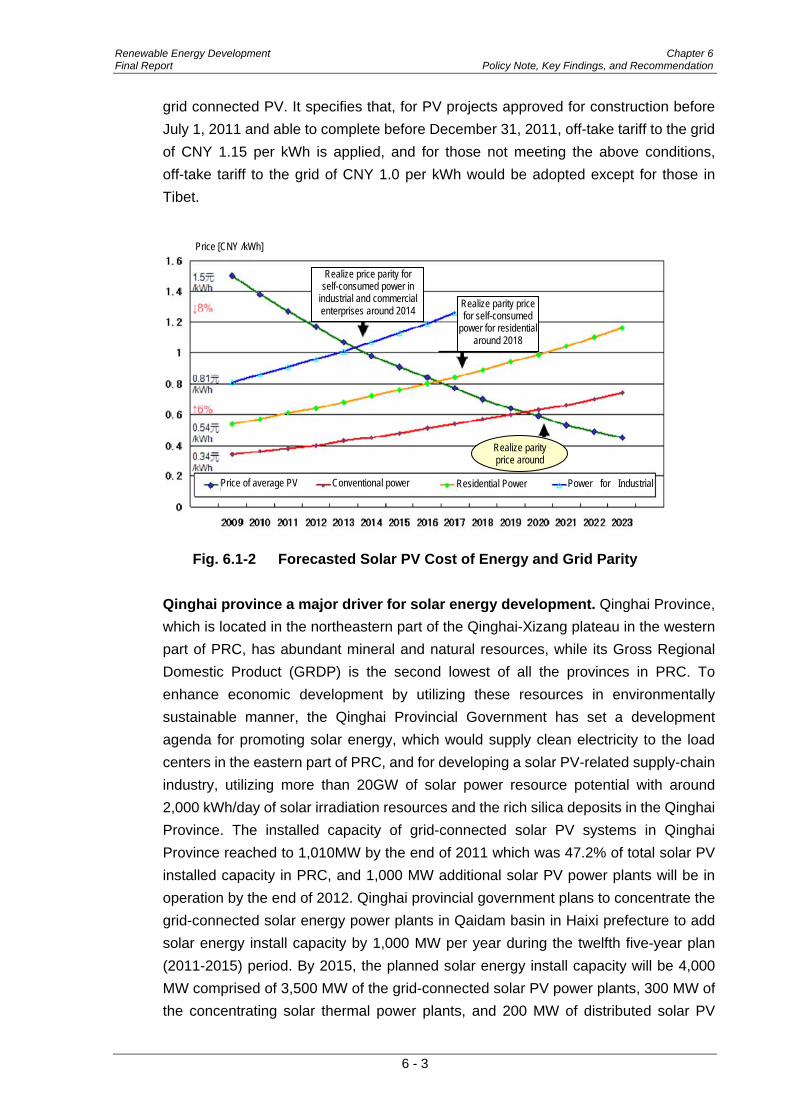
Renewable Energy Development Chapter 6 Final Report Policy Note, Key Findings, and Recommendation
6 - 3
grid connected PV. It specifies that, for PV projects approved for construction before
July 1, 2011 and able to complete before December 31, 2011, off-take tariff to the grid
of CNY 1.15 per kWh is applied, and for those not meeting the above conditions,
off-take tariff to the grid of CNY 1.0 per kWh would be adopted except for those in
Tibet.
Fig. 6.1-2 Forecasted Solar PV Cost of Energy and Grid Parity
Qinghai province a major driver for solar energy development. Qinghai Province,
which is located in the northeastern part of the Qinghai-Xizang plateau in the western
part of PRC, has abundant mineral and natural resources, while its Gross Regional
Domestic Product (GRDP) is the second lowest of all the provinces in PRC. To
enhance economic development by utilizing these resources in environmentally
sustainable manner, the Qinghai Provincial Government has set a development
agenda for promoting solar energy, which would supply clean electricity to the load
centers in the eastern part of PRC, and for developing a solar PV-related supply-chain
industry, utilizing more than 20GW of solar power resource potential with around
2,000 kWh/day of solar irradiation resources and the rich silica deposits in the Qinghai
Province. The installed capacity of grid-connected solar PV systems in Qinghai
Province reached to 1,010MW by the end of 2011 which was 47.2% of total solar PV
installed capacity in PRC, and 1,000 MW additional solar PV power plants will be in
operation by the end of 2012. Qinghai provincial government plans to concentrate the
grid-connected solar energy power plants in Qaidam basin in Haixi prefecture to add
solar energy install capacity by 1,000 MW per year during the twelfth five-year plan
(2011-2015) period. By 2015, the planned solar energy install capacity will be 4,000
MW comprised of 3,500 MW of the grid-connected solar PV power plants, 300 MW of
the concentrating solar thermal power plants, and 200 MW of distributed solar PV
Realize price parity for self-consumed power in
industrial and commercial enterprises around 2014
Realize parity price for self-consumed
power for residential around 2018
Realize parity price around
Price of average PV Conventional power Residential Power Power for Industrial
Price [CNY /kWh]

Chapter 6 Renewable Energy Development Policy Note, Key Findings, and Recommendation Final Report
6 - 4
systems. The solar energy install capacity is planned to be expanded by 10,000 MW in 2020 and by 20,000 MW by 2030. By the end of 2011, solar PV installed capacity in Qinghai province reached 1,010 MW which was 47.2% of total solar PV installed capacity in PRC, and 1,000 MW additional solar PV power plants will be in operation by the end of 2012. Qinghai province has been and will continuously be a major driver for solar energy development in PRC. But challenges lie ahead, in view of grid-connectivity and stability, electricity yield risk, financial viability, system quality assurance, and development planning, to realize sizable grid connected MW and GW class solar PV investment as planned in twelfth five-year plan (2011-2015) and onward till 2020.
6.2 Key Findings and Recommendations for Sustainable Solar PV Development
in Qinghai Province 6.2.1 Enhancing Grid Connectivity: Stable Solar PV Power Evacuation
Given that solar energy power plant will continuously be concentrated in Golmud, Haixi prefecture, current 330 KV transmissions and substation capacity is no longer sufficient enough to evacuate power from mushrooming solar PV power plants with more than 1,000 MW installed capacity in total which will be surged by 3,500 MW by 2015. Limited grid capacity for power evacuation risks stable power generation and project cash flow, which will be a significant bottleneck of sustainable investment in solar PV development in Qinghai. Thus, the presence of upgraded and expanded transmission lines and substations are essential to evacuate surging power supply from sizable solar PV plants. HVDC system which has high speed control system as well as large transmission capacity, and power flow through the HVDC system can be changed and modulated using the high speed control in timely manner. This power changing and modulation is useful for recovering from the fluctuation of grid voltage and frequency and disturbance of grid. 750 KV transmission line and 400kV HVDC system are currently under construction in Golmud should be in operation to keep pace with solar PV penetration into the grid in accordance with install capacity target in provincial twelfth five-year plan.

Renewable Energy Development Chapter 6 Final Report Policy Note, Key Findings, and Recommendation
6 - 5
6.2.2 Upgrading Grid Code which requires FRT Function: Improving Grid Stability and Safety When a fault occurs in a grid, the voltage drops and frequency and power flow are also disturbed. Under this disturbed grid condition, the conventional power plants connected to the grid try to keep sending power to the grid, which helps the grid recover from the disturbed condition. If it drops out of N-1 criteria, the interconnection lines must be disconnected or the whole grid will corrupts at worst. The solar PV systems do not have the modulation capability, and it stops operation (parallel off from grid) when voltage drop and/or disturbed frequency observed. This parallel off is an unexpected trip. When the total capacity of PV plants that have gone parallel off is too large, the gird collapses. To solve this problem there is a technology developed which is called Fault Ride Through (FRT) function. This function enables the inverters to keep operations when an instant voltage drop and/or disturbed frequency encountered. The FRT function is essential to avoid the unexpected trip and to keep the grid stability. Since the grid code to date does not require FRT function for solar PV power plants, upgrading the grid code in which FRT function is compulsory requirement for grid connection is urgently needed. On top of it, as grid-connected solar PV is expected to be sharply increasing even within a couple of years, low voltage recovery time (LVRT) is also suggested to be shortened from 2.0 Sec to 0.5 Sec in immediate future for enhancing grid safety.
Fig. 6.2-1 Proposed FRT Requirement
[%]
Time
100
Within 1 Sec
[Sec]
Rem
ained Voltage
0.0 Start time
of voltage drop
Requirement on LVRT level recovery time
80
0.5 Voltage recovered
Required time and voltage
2.0
90
20 30 Japan
(before March, 2017)
China

Chapter 6 Renewable Energy Development Policy Note, Key Findings, and Recommendation Final Report
6 - 6
6.2.3 Solar PV based Micro-grid System Development: Another Pathway for Large-scale Solar PV Application The micro grid system has small size power grid and controls supply and demand power within the system. It connects multiple power-generating facilities and electrical storage devices, including natural-energy sources such as solar power, thereby ensuring a stable supply of electricity. The micro-grid system provides optimal control, adjusting and maintaining the balance between demand and supply to ensure a stable supply of electricity. The micro grid system is also effective to reduce the influence caused by the fluctuation of the large solar PV system to the wide range power grid. In case of micro-grid system in Los Alamos County in the United States which is up and running in September 2012, solar PV power generation system and storage batteries (1 MW of NAS batteries and 0.8 MW of lead batteries) are introduced to compose micro grid system with around $37 million of initial investment cost. Real-time price signal system from the Energy Management System (EMS) of the power distribution lines is also designed to monitor solar PV power generation, power storage volume in the secondary batteries, and electricity consumption inside the grid system. In this micro grid system, clustered PV power generation system and storage batteries that connect between the power distribution substation and the switchgear are installed, and demonstrate the ability to control variations in solar radiation with storage batteries. EMS for controlling the system is introduced and the smart equipment on the power distribution lines to simulate distribution lines with a high PV power penetration into the grid is operated. In case of Qinghai, the similar concept of Los Alamos micro grid is applicable. Golmud city could be the candidate for the micro grid system as the pilot testing location, using abundant solar PV electricity supply capacity from adjacent solar park and the natural gas resources as back-up.
6.2.4 Stringent Technical Specification Standard and Institutional Strengthening: Enhancing Quality Control of Solar PV Power Plant Technical standard for solar PV system in design, construction, and quality acceptance have not been unified and enforceable, in spite of rapid increase in solar PV installed capacity. Anecdotal evidence from domestic solar PV project owners has raised concern over unpredictable deterioration in solar cell conversion efficiency and

Renewable Energy Development Chapter 6 Final Report Policy Note, Key Findings, and Recommendation
6 - 7
inverter loss at DC-AC conversion, which will be resulted in a decline in overall plant efficiency over time. Such possible quality deterioration in grid connected solar PV performance will directly impact on electricity generation and economics of power plant as a whole. Qinghai provincial government authority has made necessary arrangement for grid connection and acceptance, water supply, access road, and peak regulation. But, due to the absence of stringent and enforceable technical specification standard, limited experience of developers, and very narrow construction timeframe, a possible decline in the plant output over the times needs to be anticipated without effective quality control measures. Developing stringent and unified technical standard is suggested on a basis of performance evaluation for grid-connected solar PV power plant in operation, and of international technical standard such as the one issued by Technical Committee 82 (TC 82) of the International Electrotechnical Commission (IEC) which covers wide range of solar PV system quality standard from design, construction, commissioning, operation and maintenance, and disposal. In parallel, building technical guidance and supervision team under the provincial government authority is also suggested to conduct technical evaluation of whole project cycle including construction and operation, and strengthen supervision and guidance for solar PV owners who fail to attain originally predicted annual power plant output. Moreover, solar energy projects using unique and variety of technology such as various type of concentrating solar thermal power (CSP), concentrating PV (CPV), micro-grid are expected to be emerging in immediate future. As less down 50 MW solar energy project is fallen in provincial government approving authority, continuous capacity enhancement of such the provincial technical team and the local design institute will also be essential to assure quality and performance of solar energy projects in Qinghai.
6.2.5 Strengthening Metrological Observatory System: Mitigating Risks in Solar Resource Forecasting Reliable solar irradiation data is essential to predict electricity yield throughout more than 20 years of solar PV project life. Project site selection and electricity yield forecasting are always based on historical solar irradiation data and changes in weather patterns from year to year, and long term data are desirable for determining a representative annual data set. Currently, solar irradiation forecasting uses the approach (i) comparing locally measured ground data (at site and at metrological station less than 10 km from the site) to the satellite-derived data for the same time interval, and (ii) correcting any bias in the satellite data to generate the improved solar irradiation data set. In Qinghai, only 3 out of 54 meteorological observatory stations in

Chapter 6 Renewable Energy Development Policy Note, Key Findings, and Recommendation Final Report
6 - 8
operation have solar irradiation measurement function. But, in such a case, the solar energy developer is likely to confront a lack of reliable solar irradiation and related weather data sets due to limited number of metrological stations near by the potential site, and short and discontinuous period of times of data sets. Ground measurement data at the site over 12 months would not have good fit with satellite-derived data in general due to short period of data accumulation and measurement error. Relaying upon satellite-derived data is likely to cause more than 20% of high uncertainty in solar irradiation forecasting, which will be resulted in the reduced electricity yield and deteriorated financial performance of the project. Unreliable solar irradiation forecasting will also disturb stable grid operation accordingly. Considering the provincial government has set 20,000 MW of solar energy install capacity by 2030 and has planned to concentrate solar energy power plant in Golmud, enhancing metrological observatory system in Qinghai by (i) increasing number of metrological observatory stations (one station in each 10 km mesh is desirable), and (ii) accumulating continuous time series solar irradiation and related weather data set will be a great help to gain developer’s and transmission operator’s confidence in irradiation resource and electricity yield forecasting for sustainable solar PV development in Golmud.
6.2.6 Credit Enhancement: Improving the Project Financial Performance
Financial assessment for the pilot 10 MW solar PV power plant indicates that financial rate of return (FIRR) of 4.95% at base case scenario, which is higher than 3.42% of weighted average cost of capital (WACC). Setting appropriate tariff level taking into consideration latest static investment cost trend and leveraged cost of energy (LCOE) will be essential for sustainable solar energy development. But, if credit enhancement support will be in place, the project could become financially viable even with CNY 1.0 per kWh of off-take tariff level. One approach found effective is to extend loan tenor and project life from 20 to 25 years. Longer loan tenor and project life will not only improve the financial performance of projects, but also contribute to the reduction of carbon dioxide emission for most of carbon dioxide emission from PV power generation comes from production and installation processes of the equipment. Another effective and important approach is an introduction of soft loan in funding plan. For capital intensive, expensive PV projects it is quite important to have such funds having low

Renewable Energy Development Chapter 6 Final Report Policy Note, Key Findings, and Recommendation
6 - 9
cost and long term tenor terms. Given that (i) extension of loan tenor and project life from 20 to 25 years, and (ii) 2.6% of interest rate with 25 years tenor (including 5 years grace period) are considered, the equity IRR improves to 7.59% from 2.01% in the original case. If certified emission right (CER) is considered, the equity IRR further improves 8.86%. Providing that all credit enhancement supports are accommodated (2.6% interest of low cost and 25 years of long term loan with CER revenue), sensitivity analysis shows that the equity IRR of the project would decrease to (i) 6.78% if there were a capital cost overrun 10%; (ii) 6.56% if revenue decreased by 10%; (iii) 7.63% if deterioration accelerated by -1.5%, (iv) 6.78% if there were 1-year delay in construction; (v) 8.73% if CER price declined by 10%; and (vi) 8.48% if interest rate hiked by 10%. The project is considered financially viable and sustainable under various adverse scenarios. Credit enhancement support will greatly improve the project financial performance. Provincial government is encouraged to collaborate with domestic and international financial institutions having low cost and long term credit product for supplying credit enhancement assistance to continuous but large scale solar PV development in Qinghai. But, since the project FIRR will be close or below 3.42% of WACC if couple of adverse scenario combined, provincial government is also expected to supply risk mitigation support in power evacuation, grid stability and safety, quality control, and solar irradiation forecasting as suggested in previous paragraphs, so that the several risks assumed in adverse scenario can be controllable or foreseeable.

Renewable Energy Development Final Report Appendices
APPENDICES

Renewable Energy Development Appendix 1 Final Report Terms of Reference
APPENDIX 1
TERMS OF REFERENCE

Renewable Energy Development Appendix 1 Final Report Terms of Reference
A1 - 1
TERMS OF REFERENCE 1. The technical assistance (TA) will be implemented over 14 months. The TA will require
the services of 16 person-months of international and 16 person-months of national consultants.
2. Asian Development Bank (ADB) will recruit the consulting firm (including international
and national consultants) in accordance with its Guidelines on the Use of Consultants (2010, as amended from time to time) through a quality- and cost-based selection method to provide the services for implementation, management, and progress monitoring of the TA. The terms of reference of the consulting services will include:
A. International Consultants 3. Solar Photovoltaic (PV) Planner (Team Leader) (international, 4 person-months). The
expert should have a postgraduate degree in engineering or a related field, and at least 15 years of experience in solar PV development, preferably in planning a 10-MW-class grid integrate solar PV system. The expert will:
(i) demonstrate assessment tools to estimate solar radiation, including cloud
prediction; draw sun path diagrams; and determine tilt and azimuth angles of solar array;
(ii) demonstrate simulation tools to evaluate various options and to determine the optimal system configuration of grid-connected solar PV in terms of technical and economic feasibility;
(iii) prepare recommendations for development planning, funding, and investment incentives for solar PV development in Qinghai Province;
(iv) conduct a comprehensive pre-feasibility assessment of the priority solar PV system;
(v) prepare brief technical guidance notes and a capacity enhancement module, and conduct capacity development training for relevant counterpart staff, in consultation with the implementing agency (IA); and
(vi) prepare a policy note, including key findings and recommendations on the basis of activities conducted under the TA, and organize workshops with potential investors, grid operators, and provincial (including other provinces) and central government officials to disseminate information.
4. Solar PV Engineer (international, 3 person-months). The expert should have a
postgraduate degree in engineering or a related field, and at least 10 years of experience in solar PV system design, preferably in the planning, design, and operation of a grid-connected solar PV system. The expert will:
(i) conduct a performance assessment of the selected grid-connected solar PV
systems in Qinghai, and a capacity assessment of the IA on (a) solar radiation estimation and cloud prediction, including local meteorological data management, analysis, and resource forecasting; and (b) site analysis, including sun path assessment and tilt and azimuth angles of solar array, to identify the core capacity needed for the development of a 10-MW-class grid-connected solar PV system;
(ii) conduct a capacity assessment of the IA on (a) grid-connected solar PV system configuration design, including solar module, power conditioner, and monitoring systems; (b) grid-connected solar PV plant design and construction; and (c)

Appendix 1 Renewable Energy Development Terms of Reference Final Report
A1 - 2
operation and maintenance (O&M) of a grid-connected solar PV system, to identify the core capacity needed for the development of a 10-MW-class grid connected solar PV system;
(iii) develop benchmark standards and criteria for selection of priority PV solar investment projects, evaluate priority investment projects, and undertake a Comprehensive pre-feasibility assessment of the priority solar PV system;
(iv) coordinate with the team leader to prepare technical guidance notes and a capacity enhancement module, and to conduct capacity development training for relevant counterpart staff, in consultation with the IA; and
(v) coordinate with the team leader to prepare a policy note, including key findings and recommendations based on activities under the TA.
5. Solar PV System Designer (international, 4 person-months). The expert should have a
postgraduate degree in engineering or a related field, and at least 10 years of experience in solar PV system design, preferably in the planning and design of a 10-MW-class grid-connected solar PV system. The expert will:
(i) introduce internationally advanced power conditioner technologies for the
10-MW-class grid-connected solar PV system, and propose locally appropriate power conditioner technologies in terms of capacity, durability, cost, and performance;
(ii) introduce internationally advanced technology for the Master Control and Monitoring (MCM) system for operating and monitoring the 10-MW-class grid connected solar PV system, and propose locally appropriate MCM system design in terms of reliability, efficiency, and cost;
(iii) review the detailed design of the pilot 10-MW-class grid-connected solar PV system, and provide technical guidance, including (a) resource forecasting and site selection; (b) system configuration design; (c) applied inverter technology, including a Maximum Power Point Tracking control design; (d) applied power conditioner technology; (e) applied MCM system design; and (f) cost effectiveness and efficiency;
(iv) coordinate with the team leader to prepare technical guidance notes and a capacity enhancement module, and to conduct capacity development training for relevant counterpart staff, in consultation with the IA; and
(v) coordinate with the team leader to prepare a policy note, including key findings and recommendations based on activities under the TA.
6. Solar PV Supply-Chain Specialist (international, 2 person-months). The expert should
have a postgraduate degree in engineering or a related field, and at least 10 years of experience in solar PV supply-chain development. The expert will:
(i) assess the capacity and quality of the solar PV supply chain, including silicon solar
wafer and solar cell production;
(ii) provide technical guidance to develop a feasible solar PV supply chain for a 10-MW-class grid-connected solar PV system in Qinghai Province;
(iii) coordinate with the team leader to prepare technical guidance notes and a capacity enhancement module, and to conduct capacity development training for relevant counterpart staff, in consultation with the IA; and
(iv) coordinate with the team leader to prepare a policy note, including key findings and recommendations based on activities under the TA.

Renewable Energy Development Appendix 1 Final Report Terms of Reference
A1 - 3
7. Transmission Engineer (international, 2 person-months). The expert should have a postgraduate degree in engineering or a related field, and at least 10 years of experience in grid connection and protection, preferably for a 10-MW-class grid-connected solar PV system. The expert will:
(i) introduce international best practices for grid protection design and system
configuration for a 10-MW-class grid-connected solar PV system;
(ii) assist the IA with liaising and discussing grid codes with grid operators, and with identifying the required grid protection system design;
(iii) review the detailed design of the pilot 10-MW-class grid-connected solar PV system, and provide technical guidance on grid protection system configuration and design;
(iv) coordinate with the team leader to prepare technical guidance notes and a capacity enhancement module, and to conduct capacity development training for relevant counterpart staff, in consultation with the IA; and
(v) coordinate with the team leader to prepare a policy note, including key findings and recommendations based on the activities under the TA.
8. Financial Analyst (international, 1 person-month). The expert should have a
postgraduate degree in economics or a related field, and at least 10 years of experience in energy sector assessment and analysis, preferably in analytical work on renewable energy development. The expert will:
(i) conduct a financial analysis of the pilot 10-MW-class grid-connected solar PV
system, including a pre-feasibility assessment for a priority solar PV system, incorporating a cost effectiveness and efficiency assessment, commercial and resource risk assessment, and lifecycle analysis;
(ii) identify an appropriate off-take electricity tariff, including affordability, and risk mitigation measures for the pilot 10-MW-class grid-connected solar PV system, and assess financing needs and types of financing to lower cost barriers of the pilot 10-MW-class grid-connected solar PV system;
(iii) review a provincial development plan for renewable energy, focusing on solar PV, and identify performance gaps, challenges, and opportunities; and prepare a policy note on development planning, funding, and investment incentives to develop renewable energies, focusing on solar PV in Qinghai Province; and
(iv) coordinate with the team leader to prepare a policy note, including key findings and recommendations based on activities under the TA.
B. National Consultants 9. The national consultants will comprise (i) a deputy team leader and solar PV planner (4
person-months), (ii) a solar PV engineer (3 person-months), (iii) a solar PV system designer (4 person-months), (iv) a solar PV supply-chain specialist (2 person-months), (v) a transmission engineer (2 person-months), and (vi) a financial analyst (1 person-month). They will work with the corresponding international consultants. They will also assist the international consultants in reviewing relevant reports, data, policies, and regulations, and will translate relevant documents into English.
C. Reports 10. The consultant shall submit the following reports to ADB (in English) and to the EA and
IA (in Chinese):

Appendix 1 Renewable Energy Development Terms of Reference Final Report
A1 - 4
(i) Inception Report. It will be submitted within 4 weeks after commencement of services. The report includes a detailed work program plus any major inconsistencies in the terms of reference, staffing problems, or deficiencies in the IA’s assistance.
(ii) Interim Report. It will be submitted within 7 months after commencement of services. The report includes a preliminary result of activities, updated work program, and any issues and concerns.
(iii) Draft Final Report. It will be submitted within 12 months after commencement of services. Upon submission of the draft final report, a final workshop will be held, attended by relevant stakeholders, to get feedback on the report.
(iv) Final Report. It will be submitted within 1 month after receipt of comments from ADB and the government on the draft final report. The final report shall take into consideration the comments of ADB, EA, and IA. A summary report, of a maximum of 10 pages, should be included in the final report.

Renewable Energy Development Appendix 2 Final Report National Development Plan and Provincial Development Plan
APPENDIX 2
NATIONAL DEVELOPMENT PLAN AND PROVINCIAL DEVELOPMENT PLAN

Renewable Energy Development Appendix 2 Final Report National Development Plan and Provincial Development Plan
A2 - 1
NATIONAL DEVELOPMENT PLAN AND PROVINCIAL DEVELOPMENT PLAN
1. National Development Plan Large-scale centralized grid-connected photovoltaic power station (PV power station) is an important form of photovoltaic power generation. Since the beginning of the 21st century, many centralized grid-connected PV power stations of MW class have been built in various countries over the world, and the plans to construct 100MW class and even GW class PV power stations are now ready to be implemented. China has also worked out many programs to construct MW class centralized grid-connected PV power stations. Large-scale grid-connected PV power stations have become one of the important development policy pillars for photovoltaic power generation in the world today.
1.1 Renewable Energy Law and its Revision
The “Renewable Energy Law of China” coming into effect on January 1, 2006 clearly indicates the strategic significance of developing renewable energy, and put it clearly that “This law has been formulated with the purpose to promote the development and utilization of renewable energy resources, increase energy supplies, improve energy structure, safeguard energy security, protect the environment and realize the sustainable development of economy and society”. The “Renewable Energy Law” mainly establishes the basic system framework, and the fundamental method to support the development of renewable energy is “compulsory supply to the grid, purchasing in total amount, implementing categorized electricity price and distribute their costs over the whole grid". After practice for a certain period of time, in December 2009, the NPC revised the “Renewable Energy Law”, which mainly responds to some questions about operability in local areas, in addition to its further completion. The revised version clearly set forth the centralization of formulation of plan, review and approval authority: the department in charge of energy under the State Council shall, in conjunction with the national power regulatory authority and finance authority, determine the proportion of renewable energy power generation in the total power generated that should be introduced in the planned period according to the national program to develop and utilize renewable energy resource, and also work out the specific methods to dispatch in priority and purchase in total amount of the power generated utilizing renewable energy by enterprises in the grid, and the department in charge of energy under the State Council will supervise its implementation during the year in conjunction with the national power regulatory authority. The people’s committees at all localities shall prepare their own programs based on the national plan and the medium and

Appendix 2 Renewable Energy Development National Development Plan and Provincial Development Plan Final Report
A2 - 2
long-term targets in the regions, and submit them to the department in charge of energy management under the State Council and the national power regulatory authority for filing, and organize their implementation. Technological development has been emphasized and capital sources were specified. The state will set up renewable energy development fund as governmental foundation, which will come from earmarked funds arranged by the national finance for the year and the surtax for renewable energy electricity price collected, and purchasing in full amount will be modified as “guaranteed purchasing in full amount”. By guarantee, it specifies clearly the responsibilities and obligations of the three parties of grid enterprises, power generation enterprises and the government. The government shall formulate programs and make administrative permission, the power generation enterprises will obtain permission or make filing and supply electric energy complying with standard according to the program and also ensure the safety for grids. Grid enterprises purchase the power in full amount according to program, and permit and strengthen grid construction. Therefore, the “Renewable Energy Law” and its revised version have established the basic system framework for renewable energy in China, including the total quantity target system. The government is required to formulate development programs and put forth total quantity targets, the fixed electricity price and cost amortizing system. It is required to combine governmental pricing with electricity price determined by bidding, and the extra cost be shared by all users; financial allowance system: allowance can be granted by finance at both central and local levels, the central government can establish renewable energy development fund and some local governments can also set up their renewable energy development funds, and tax preferential system: preferential conditions for VAT and income tax.
1.2 Specific Supporting Policies for PV Power Generation
As the cost of photovoltaic power generation is far above the present purchasing price at grid for hydropower and thermal power in China (CNY 0.35 -0.45 per kWh), and also higher than the wind power generation cost (CNY 0.5-0.6 per kWh), after the implementation of the “Renewable Energy Law”, the formulation and implementation of specific policies on PV power generation in China now lags behind wind power and biomass power, and is in the conditions of “consultation on case by case basis”. The National Development and Reform Commission (NDRC) issued document Fagai Jiage [2007] No. 44 “Tentative measures for allocation of renewable energy electricity price surtax income” on January 17, 2007, which specifies that the allowance for renewable energy electricity price will be paid from the renewable energy electricity price surtax, which will be levied at CNY 0.002 per kWh in the whole country since June 2008

Renewable Energy Development Appendix 2 Final Report National Development Plan and Provincial Development Plan
A2 - 3
(now it has been raised to CNY 0.004 per kWh). It is specified in the document that the later period operation and maintenance expenses for off-grid power generation system constructed with state investment will also be paid from the renewable energy power surtax. The concept of quota transaction was also put forth. The document defined the bid electricity prices or government-determined prices for wind power (about CNY 0.4-0.6 per kWh), the benchmark electricity price for biomass will be increased by CNY 0.25 per kWh, slightly higher than that of wind power (CNY 0.5-0.7 per kWh), but the document did not specify the electricity price for grid-connected PV power generation. On August 31, 2007, document Fagai Nengyuan [2007] No. 2174 “Medium and long-term development program for renewable energy” was issued, in which the planned accumulated installed capacity of PV power generation was to be only 300MWp in 2010 and 1.6GWp in 2020. Now it is known that these targets were too low. On November 22, 2007, document Fagai Nengyuan [2007] No. 2898 “Circular on relevant requirements on construction of large-scale grid-connected pilot PV power stations” was issued to 8 provinces and autonomous regions, which required that power stations shall be constructed on non-cultivated land such as desert and Gobi, and their size shall be no less than 5MW. The document specifies that electricity price to the grid will be determined through bidding, and the cost exceeding the price can be shared nationwide via the income of renewable energy electricity price surtax. This circular started the prelude of constructing large-scale PV power stations in desert areas. In 2007 and 2008, NDRC approved four PV power station projects up to 1MW in two batches, including 2 in Shanghai and one each in Inner Mongolia and Ningxia, for which the electricity price to the grid of CNY 4 per kWh would be applied, and the part above the benchmark electricity price of local desulfurization coal-fired units will be shared nationwide. . At the end of 2008, the National Energy Administration issued Zong Han [2008] No. 70 documents “Reply letter from National Energy Administration for the construction of 10MW pilot grid-connected PV power generation project in June 2009 at Gansu Dunhuan”, launching the bid invitation for the project. The average price from the 13 bidders was CNY 1.42 per kWh, and the awarded electricity price to the grid for the two 10MW PV power stations approved in June 2009 was CNY 1.0928 per kWh. In August 2010, bids were called for the concession right for the second batch of thirteen ground PV power station projects totaling 280MWp, and the awarded electricity price to the grid was between CNY0.7288 and 0.9791 per kWh. During the same period, the electricity price to the grid of other administratively licensed

Appendix 2 Renewable Energy Development National Development Plan and Provincial Development Plan Final Report
A2 - 4
projects in northern China was CNY1.12 -1.15 per kWh. In April 2011, in the circular for “930 Projects” in Qinghai, the electricity price to the grid of CNY 1.15 per kWh was adopted. In July 2011, the NDRC issued the “Circular on completing policies on electricity price to the grid for solar energy PV power generation”, deciding to adopt a national unified benchmark electricity price to the grid for PV power generation, and it specifies that, for PV power generation projects approved for construction before July 1, 2011 and able to complete before December 31, 2011, an electricity price to the grid of CNY 1.15 per kWh would be adopted, and for those not meeting the above conditions, an electricity price to the grid of CNY 1 per kWh would be adopted except for those in Tibet, and this circular also specifies that PV power generation projects for which owners are determined by competitive bid for concession right would be given the bid awarding electricity price, which shall not be higher than the above-mentioned benchmark electricity price. Concurrently, to support pilot PV power generation projects, incentive measures with financial subsidy to the initial investment have also been launched in China, including: on March 23, 2009, the Ministry of Finance issued “Tentative measures for management of financial support funds for constructing PV generation facilities”, which specified that the central finance would provide a part of project funds from earmarked funds for renewable energy, to support the pilot projects and to disseminate PV generation facilities in the urban and rural areas. On July 16, 2009, the Ministry of Finance, Ministry of Science and Technology and National Energy Administration jointly issued “Circular on implementing Golden Sun Pilot Program”, making clear that the central finance can provide some project funds from earmarked funds for renewable energy, to support the pilot application of PV power generation technologies in various fields and the industrialization of key technologies.

Renewable Energy Development Appendix 2 Final Report National Development Plan and Provincial Development Plan
A2 - 5
Table 1-1 Bid Prices for Large-scale Desert PV Power Stations in 2010 Construction
location
Installed capacity (MWp)
Bidder Lowest price
offer (CNY//kWh)
Next lowest price offer
(CNY//kWh)
Highest price offer
(CNY//kWh)
Average price offer
(CNY//kWh)
Qinghai Gonghe 30 Yellow River Upper Reaches Hydropower Development Co., Ltd.
0.7288 0.8595 1.2100 1.0227
Qinghai Henan 20 Yellow River Upper Reaches Hydropower Development Co., Ltd.
0.8286 0.8377 1.2000 1.0092
Gansu Baiyin 20 China Power International New Energy 0.8265 0.8812 1.2000 1.0484
Gansu Jinchang 20 Huaneng New Energy Industry 0.7803 0.8010 1.0900 0.9128
Gansu Wuwei 20 China Power International New Energy 0.8099 0.9089 1.5100 1.0388
Shaanxi Yulin 20 Guohua Energy Investment 0.8687 1.0765 1.4000 1.1380
Inner Mongolia Alxa 20 Inner Mongolia Guodian Energy 0.8847 0.8899 1.0600 0.9588
Inner Mongolia Baotou 20 Baotou Luneng Bayan Obo Wind
Power 0.7978 0.8539 1.1545 1.0016
Inner Mongolia Bayan Nur 20 Inner Mongolia Guodian Energy 0.8444 0.8950 1.1040 0.9920
Xinjiang Hamid 20 CPI Xinjiang Energy 0.7388 0.7950 1.1600 0.9769
Xinjiang Turpan 20 CPI Xinjiang Energy 0.9317 0.9576 1.2800 1.0642
Xinjiang Hotan 20 CPI Xinjiang Energy 0.9907 1.1100 1.2950 1.1508
Ningxia Qingtongxia 30 Huaneng New Energy Industry 0.9791 1.0745 1.3500 1.1417
1.3 Planning for Renewable Energy during “Twelfth Five-Year Plan” Period
The year of 2011 is the first year to implement the "Twelfth Five-Year Plan for Economic and Social Development in China”. Although the Twelfth Five-Year Plan for renewable energy has not yet been officially published, the total quantitative target of PV power generation has been basically determined, i.e. the total installed capacity of PV power generation in China will be 10GW by the end of 2015, and for long term, the planned target is 50GW for the year 2020. These will be minimum figures. In the photovoltaic development projection map of China prepared by some institutions, higher targets were set as 15-20GW in 2015 and 100GW in 2020, which are realistic targets.

Appendix 2 Renewable Energy Development National Development Plan and Provincial Development Plan Final Report
A2 - 6
Fig. 1-1 Development of PV Power Generation in China with Three Scenarios
There are many reasons to make such estimation. First, the base quantity of installed
capacity on photovoltaic market in China is quite low, but the development momentum in
recent years has been strong. If an annual average growth rate of 62% can be
maintained, the target of high scenario among the plans above can be realized. As a
comparison, the global annual average growth rate of installed capacity of PV power
generation is 55.5% during the past decade, and is about 68% during the last 5 years.
Secondly, China has fairly good commercialized development experience for the off-grid
PV power generation, thus in the coming decade, the era of “parity price to grid” for PV
power generation will come, and marketization will progress rapidly.
Fig. 1-2 Line Map for Parity Price to Grid for PV Power Generation in China
Realize price parity for self-consumed power in
industrial and commercial enterprises around 2014
Realize parity price for self-consumed power for residential around
2018
Realize parity price around 2021
Price of average PV Conventional power Residential Power Power for Industrial etc.
Price [CNY /kWh]
Required annual average growth rate
Low plan
Medium plan
High plan

Renewable Energy Development Appendix 2 Final Report National Development Plan and Provincial Development Plan
A2 - 7
The above figure shows that, in China realization of parity price to grid can be expected in around 2014 for industrial and commercial power (user side), around 2018 for residents power (user side) and around 2021 for selling power to the grid (power generation side).
1.4 Status of PV Power Generation Development
(1) Historical Conditions in the Development of PV Market in China
The application of PV power generation technologies on ground in China was started in 1973, but the growth was very slow due to restriction by high cost. And it was mainly used in special places where power supply was not available and as independent systems with very small installed capacity. Since 2000, due to investment by the government in power supply projects to areas previously without power supply and the public support to commercialized development of photovoltaic products in rural and pasturing areas, China has achieved fairly substantial results in supplying power to such areas with PV technologies. The specific practice includes government purchasing PV systems to supply power to counties and townships without electricity, implementing pilot off-grid PV projects via international aid and cooperation, and supporting with subsidy PV enterprises in pilot operation of commercial projects to disseminate PV interchangeable power supply systems to scattered users, farmer and pasturing households lacking power supply, to make available basic human needs of power for residents in the border and remote areas. According to the statistics at the end of 2008, at least 850,000 solar home systems were installed in total, at nearly 1000 village as independent power stations, benefiting at least 1.15 million households.
Since the implementation of “Renewable Energy Law” in 2006, as no specific measures on PV power generation have been issued, the capacity of PV systems installed in China in 2007 was about 20MWp, only accounting for 1.84% of the domestic solar cell production in the same year, i.e. over 98% of PV module products were exported. Starting from 2008, some projects were approved to adopt electricity price to the grid, and preparation was made to launch the concession right tendering, driving up the incentive of some enterprises to invest in PV power generation projects, and the installed PV system in China reached 40.3MWp, an increase of 102% over the previous year. However, it also only accounted for 1.54% of the solar cell production in the year, with proportion of export still remaining over 98%. By the end of 2008, the total installed capacity of PV systems in China reached 140.3 MWp, less than 1% of the share in the world. As the base was low, the market size was still quite small. And most of these projects were commercial off-grid systems for special applications, only including some grid-connected PV projects

Appendix 2 Renewable Energy Development National Development Plan and Provincial Development Plan Final Report
A2 - 8
constructed for research and pilot purposes by some PV enterprises or existing large-scale power enterprises. Therefore before 2008, PV systems in China were mostly scattered small sized off-grid systems. Toward the end of 2008, only several dozens of grid-connected power generation systems were built, with installed capacity of several kW, and the 1.5MWp as the largest. Most of them were PV power generation systems in conjunction with buildings. These systems mostly were connected to grid at low voltage side, for self-consumption. Relevant policies of the state were expected for large-scale installation and selling power to the grid. At the end of 2008, the total market share of those grid-connected was only 17.8% of the total installed capacity.
The year 2009 was the start of large scale application in the PV development in China. Good achievements were obtained for PV technologies in power supply in rural areas and commercial application in special fields, with fair market foundation, the detailed rules for implementation for “Renewable Energy Law” were issued before the end of 2008, and policy environment was basically established. In 2008, four PV grid-connected projects obtained electricity price subsidy. The concession right tendering for the first 10MWp PV power station in China was conducted at the beginning of 2009, the “photovoltaic building pilot program” and “Golden Sun pilot program” of the state were started in succession in 2009. In November 2009, the surtax for renewable energy power was increased from 0.2 fen/kWh to 0.4 fen/kWh, and many local governments issued various preferential policies and prepared the PV industry development plans for the areas, promoting the PV application in larger scale in China. Although most of the above-mentioned national programs were not completed in 2009, apparent heat could be felt in PV market in 2009.
The installed capacity in 2009 in China reached 160.2 MWp, four times larger than that of the previous year, and exceeding the total of previous years, bringing the total installed capacity to 300MWp by the end of the year, and PV systems developed were for grid-connected operation and large-scale ones. In 2009, large PV power stations sized at 5MWp, 10MWp and 20MWp were completed starting its generation.
The implementation of specific policies such as pilot of PV electricity price to the grid and “Golden Sun pilot program” gave rise to expectation for larger scale PV applications. In 2010, the added installed capacity reached 530MWp, including the two 10MWp desert PV stations completed for operation as the first batch of concession right tendering by the National Energy Administration and some PV systems completed with national project support for initial investment, plus the PV projects supported by local policies and the marketized PV applications.

Renewable Energy Development Appendix 2 Final Report National Development Plan and Provincial Development Plan
A2 - 9
Table 1-2 Development of PV Industry in China during Past Years Year 2005 2006 2007 2008 2009 2010
Annual production (MWp) 200 400 1088 2600 4011 8000
Export (MWp) 195 390 1068 2560 3851 7500
Proportion of export (%) 97.5 97.5 98.2 98.5 96.0 93.7
New capacity installed (MWp) 5 10 20 40 160 530
Annual growth rate 100% 100% 102% 297.5 231.3
Accumulated installed capacity (MWp) 70 80 100 140 300 830
In 2011, the initiative of many enterprises in China to construct PV power generation systems under the incentive policy environment continued to rise, especially in areas with specific supportive policies from local governments. In July, after the issuance of the benchmark electricity price to grid of the state, investing enterprises changed their original probing and wait-and-see attitude, and have become active in the investment and construction, so that large-scale PV power stations can be constructed in a centralized manner in the western region of China with rich solar energy radiation resources. It is expected that large-scale PV power stations with capacity of 1.2 - 1.5GW are to be constructed and put into operation by the end of the year.
Meanwhile, for the national pilot PV project in the form of subsidy for initial investment, about 1030 MW was approved for construction during 2009-2010 and about 800MW in 2011, as the specific final completion time was determined for projects launched in batches, it is estimated that the installed capacity completed in 2011 will be about 800-900MW.
Table 1-3 National Projects with Subsidy for Initial Investment
Year 2009 2010 2011
Project No. of projects
Installed capacity (MWp)
No. of projects
Installed capacity (MWp)
No. of projects
Installed capacity (MWp)
Photovoltaic building pilot program 111 90 99 90 118 110
Golden Sun pilot program 236 578 272 690
When other local projects and commercial projects are added, the increased PV installed capacity in China in 2011 will at least exceed 1.5GWp, with high probability to reach 2GWp.
As the state started to implement concession right tendering of PV generation,
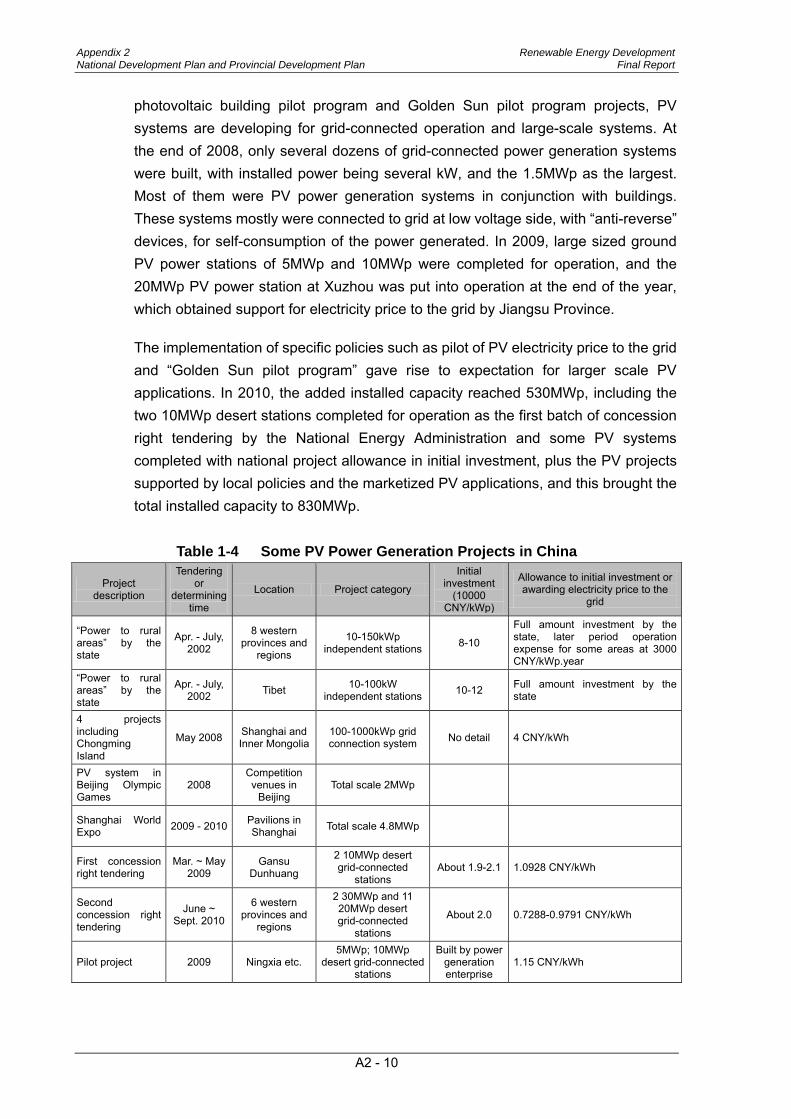
Appendix 2 Renewable Energy Development National Development Plan and Provincial Development Plan Final Report
A2 - 10
photovoltaic building pilot program and Golden Sun pilot program projects, PV systems are developing for grid-connected operation and large-scale systems. At the end of 2008, only several dozens of grid-connected power generation systems were built, with installed power being several kW, and the 1.5MWp as the largest. Most of them were PV power generation systems in conjunction with buildings. These systems mostly were connected to grid at low voltage side, with “anti-reverse” devices, for self-consumption of the power generated. In 2009, large sized ground PV power stations of 5MWp and 10MWp were completed for operation, and the 20MWp PV power station at Xuzhou was put into operation at the end of the year, which obtained support for electricity price to the grid by Jiangsu Province.
The implementation of specific policies such as pilot of PV electricity price to the grid and “Golden Sun pilot program” gave rise to expectation for larger scale PV applications. In 2010, the added installed capacity reached 530MWp, including the two 10MWp desert stations completed for operation as the first batch of concession right tendering by the National Energy Administration and some PV systems completed with national project allowance in initial investment, plus the PV projects supported by local policies and the marketized PV applications, and this brought the total installed capacity to 830MWp.
Table 1-4 Some PV Power Generation Projects in China
Project description
Tendering or
determining time
Location Project category
Initial investment
(10000 CNY/kWp)
Allowance to initial investment or awarding electricity price to the
grid
“Power to rural areas” by the state
Apr. - July, 2002
8 western provinces and
regions
10-150kWp independent stations 8-10
Full amount investment by the state, later period operation expense for some areas at 3000 CNY/kWp.year
“Power to rural areas” by the state
Apr. - July, 2002 Tibet 10-100kW
independent stations 10-12 Full amount investment by the state
4 projects including Chongming Island
May 2008 Shanghai and Inner Mongolia
100-1000kWp grid connection system No detail 4 CNY/kWh
PV system in Beijing Olympic Games
2008 Competition venues in
Beijing Total scale 2MWp
Shanghai World Expo 2009 - 2010 Pavilions in
Shanghai Total scale 4.8MWp
First concession right tendering
Mar. ~ May 2009
Gansu Dunhuang
2 10MWp desert grid-connected
stations About 1.9-2.1 1.0928 CNY/kWh
Second concession right tendering
June ~ Sept. 2010
6 western provinces and
regions
2 30MWp and 11 20MWp desert grid-connected
stations
About 2.0 0.7288-0.9791 CNY/kWh
Pilot project 2009 Ningxia etc. 5MWp; 10MWp
desert grid-connected stations
Built by power generation enterprise
1.15 CNY/kWh

Renewable Energy Development Appendix 2 Final Report National Development Plan and Provincial Development Plan
A2 - 11
(2) Proportion of Grid-connected Power Generation
With the continuous increase of capacity of PV systems, the PV market in China has been transiting gradually from off-grid systems to grid-connected systems as the main. In 2008, although the electricity price to the grid and grid purchasing price were basically not opened, installed capacity of PV grid-connected systems increased substantially, with the proportion rising from 10% in previous year to about 47%. The share of accumulated installed capacity also reached 17.8%, and in 2009, grid-connected systems accounted for about 85% of the annual total, with accumulated share exceeding 50%. In 2011, grid-connected systems have become further dominated.
Fig.1-4 Market Distribution of Off-grid and Grid-connected PV Systems during Past
Years
(3) Substantial Decrease of Initial Investment Cost and Power Generation Cost
The electricity price to the grid for the four PV systems for connection to grid approved by the state in 2008 was CNY 4 per kWh. Affected by the financial crisis originated in the USA, the prices of PV products dropped substantially at the end of 2008 and beginning of 2009, greatly reducing the initial investment cost for constructing PV power stations. According to estimation at the time, in some areas with good radiation and land conditions in western China, the unit initial investment cost for constructing PV power stations could be about CNY 20000~25000 per kWp, and the reasonable electricity price to the grid should be in the range of RM 1.2-1.6 per kWh.
In March 2009, in the concession right tendering launched by the National Energy Administration, a bidding electricity price to the grid of CNY 1.0928 per kWh was
8.8 7.4 9.0 17.8 19.0 18.01.2 1.5 1.0 2.2
142.0
21.0
0.0
50.0
100.0
150.0
2004 2005 2006 2007 2008 2009
公历年 Year
装机
Insta
llatio
n (M
W)
离网 Off-grid 并网 Grid-tied

Appendix 2 Renewable Energy Development National Development Plan and Provincial Development Plan Final Report
A2 - 12
appeared. No matter how this price really reflected the original intention for sustainable development “reasonable cost plus reasonable profit”, the fact that the unit investment cost for PV systems and power generation cost have decreased substantially is worth to be noted. The two 10MWp projects in Dunhuang were connected to grid for power generation in 2010.
After the financial crisis, the global PV market restored quickly, and the market price of PV products rose slightly. Although PV modules have been in short supply for demand since mid 2009 as driven by the international market, their prices remained at the level slightly above the price that at the beginning of 2009 (for which expanded production and technological progress played major roles, and if the tight supply of silicon materials could be lessened, the price of PV modules would decrease further). In the ground PV power stations subsequently approved with “consultation case by case”, electricity price to the grid of CNY 1.15 or 1.12 per kWh was given, and in some provinces with relatively inferior resources conditions, electricity price to the grid of about CNY 1.7 per kWh was offered. In 2010, in the 13 projects sized 20-30MWp in western provinces and regions in the second batch of concession right tendering launched by National Energy Administration, electricity price of CNY 0.7288-0.9791 per kWh was awarded under the principle of “awarding with lowest price”.
In general, calculation is required on how to determine the “reasonable electricity price to the grid” for specific projects, however, during 2009-2011, the power generation cost on PV market in China dropped substantially with the incentive policies. The initial investment of grid-connected PV systems installed on the ground and PV systems installed on the roofs of buildings have decreased to CNY 10000~15000 per kWp, and in areas with good resources conditions, electricity price to the grid has approached to CNY 1 per kWh. The initial investment for off-grid systems has also dropped to about CNY 20000~25000 per kW.
(4) Economy of Scale
Since the state launched the concession right tendering for construction of large-scale PV power stations, state and local power companies and energy investment groups including the five major power groups all show great attention to the realistic and potential market of PV power generation and are actively participate in it. The concession right tendering results and the investment and construction of large-scale desert PV power stations show that these large-scale state-owned enterprises have absolute adavantage. Large-scale power enterprises not having been awarded with contract are in active work to build bases in areas with good resources conditions, and most power enterprises have formed specialized solar energy companies to construct pilot and research projects of different sizes, to pave

Renewable Energy Development Appendix 2 Final Report National Development Plan and Provincial Development Plan
A2 - 13
the way for future development. Before the national benchmark electricity price was issued, a number of large-scale projects have been completed. For example, the Solar Energy Company of CGNPC has built a 10MWp PV power station at Gansu Dunhuang (with concession right bidding) and Qinghai Xitieshan, and it also has projects of 70MWp under construction. Ningdian Group also built some 5MWp and 10MWp PV power stations at Shizuishan and Taiyangshan, and is building upstream industries. Guodian Longyuan, Huaneng, Huadian and Datang Power have also constructed some 5-40MW PV power stations, which are now in trial operation.
Investment in PV power generation is becoming diversified. Local finances are obviously increasing investment to PV projects, and some real estate developers have started caring the application of PV systems on commodity houses, and there is continuous increase of PV systems in combination with buildings with state program support or by self-investment.
(5) Application of PV Power Generation Technologies and its Diversification
In the newly built PV systems, application of various PV modules and PV systems with different installation methods are demonstrated, laying a good technical foundation for further development of PV market in the future.
Crystal silicon solar cells remain the mainstream product in market application, and in addition to the traditional fixed inclined mounting method which is still being widely adopted, plate tracking systems with double shafts, flat single shaft and inclined single shaft are also been applied in many projects. Due to gradual improvement of sun tracking technology, tracking precision and reliability indicators have been improved, high multiple concentrating photovoltaic system (CPV) is been gradually marketed, and in some enterprises, gallium arsenide high multiple (available in 300, 500 and 1000X) concentrating modules and systems are being made and installed.
Great progress was also achieved for the market application of film solar cells in 2009, and silicon based film cells and CIGS cells have gained more applications in building integrated PV (BIPV). Some practical BIPV projects with different features have been completed by some companies.
(6) PV Application Market Size
Although the PV application market growing speed has accelerated, in comparison with international development, it is still small in total quantities and fails to match the growth rate of PV manufacturing industry in China. Solar cells made in China were exported over 96% in five consecutive years during 2005-2009, with less than 2-4%

Appendix 2 Renewable Energy Development National Development Plan and Provincial Development Plan Final Report
A2 - 14
installed in the country. In 2010, PV modules exported exceeded 8GWp, while about
0.53GWp were installed in the country, accounting for only about 6%. In 2011, the
PV export will possibly reach 10GWp, and proportion of domestic installation will
possibly increase to 15%-20%, with installed capacity of 1.5 - 2GWp during the year.
Fig. 1-4 Gradually Shaping PV Market with Policy Incentive
2. Provincial Development Plan
Qinghai Province is located in the western China, with very rich solar energy and land
resources, and ready conditions to build large-scale PV power stations. In the design and
construction of large-scale photovoltaic power generation projects, the power generation
efficiency is low in many projects in China in general. With the power generation cost
higher than that of traditional forms of power generation, increasing the efficiency of the
whole system will be the main issue to cut power generation cost. In this research
subject, the local policies and grid conditions will be expounded in conjunction with the
actual local conditions, and policy notes and suggestions on design of photovoltaic
system are proposed.
2.1 Comparison of Development in Domestic Regions in China
Over a long time, due to investment by the state in power supply projects to areas
previously no access to electricity and the support to commercialized development of
photovoltaic products in rural and pasture areas, China has achieved fairly substantial
China PV market gradually shaped with policy incentives
Support by scientific and technological programs
and international program
Current Year [MWp] Accumulated capacity [MWp]
Implementation of “Renewable energy
Law”
Launching concession right tendering and Golden Sun pilot
program
Implementation of state “power to rural
areas” program

Renewable Energy Development Appendix 2 Final Report National Development Plan and Provincial Development Plan
A2 - 15
results in supplying power to such areas with PV technologies. The PV systems disseminated are mainly distributed in nine western provinces and regions of China, and Qinghai Province was the most concentrated area of PV system production, marketing and installation in early years. In 2009, work in this aspect was further pushed forward in Tibet, Qinghai, Xinjiang and performance, including financial subsidy of CNY 4000 per kWp per year as later period operation expense for rural PV power stations built in the early “electric power to township program”, and further disseminating solar energy PV interactive power systems in rural and households in pasture area with no or lacking in power supply in border and remote areas, and mainstream model of about 100Wp-120Wp per household, to provide basic power for their life and meet their daily increasing demand for electricity. According to the statistics at the end of 2008, at least 850,000 solar home systems were installed in total, with nearly 1000 village independent power stations, benefiting at least 1.15 million households, and nearly 1 million households use independent PV power supply for domestic electricity use in lighting, radio and TV. Since 2009, the work has been mainly focused to expand the popularity and upgrade or expand systems, so that the power consumption level by rural and households in pasture area in the border and remote areas has been somewhat raised. Before the national unified benchmark electricity price was issued, some provinces and regions formulated policies to encourage PV application projects, to push the implementation of PV projects in local areas. Among them, Jiangsu, Zhejiang and Shandong with good economic conditions and concentrated PV enterprises formulated specific policies on PV electricity price to the grid, therefore, some PV power stations connected to the grid were constructed during 2009 to 2011 in these provinces, with the maximum single station size being 20GWp. However, not many projects were approved due to the limitation of available subsidy for capital requirements offered by local governments. Ningxia Hui Autonomous Region obtained the approval of “specially licensed temporary electricity price to the grid” from the NDRC in 2009, and built a number of PV power stations, with total installed capacity of 50MWp. Projects of Golden Sun pilot program and photovoltaic building pilot program that encourage connection to grid on user side (low voltage side) and self-consumption are distributed throughout the country. As there are richer solar energy and land resources in the western part of China, more electric power can be obtained in these areas with PV systems with the same size, therefore investors for large-scale PV power stations started to concentrate their attention to the west. The state selected Dunhuang of Gansu Province for the first concession right tendering for construction of PV power stations, and selected 6

Appendix 2 Renewable Energy Development National Development Plan and Provincial Development Plan Final Report
A2 - 16
provinces and regions of Qinghai, Gansu, Shaanxi, Inner Mongolia, Xinjiang and Ningxia for the second concession right tendering.
Table 2-1 Comparison of PV Electricity Price to the Grid by Provinces and Regions
with State Electricity Price Policy
Region Year Electricity price to the grid
(CNY/kWh) Target
installed capacity
Remarks Ground Roof BIPV
Concession electricity price
2007 - 2008 4.0 Shanghai, Inner Mongolia,
Ningxia, etc. Jiangsu 2009 2.15 3.7 4.3 400MWp
2010 1.7 3 3.5 2011 1.4 2.4 2.9
Zhejiang 2010 1.16 50MWp 2011 - 2012 1.43
Shandong 2010 1.7 10/Wp 150MWp 2011 1.4 2012 1.2
Ningxia autonomous region
2009 - 2010 1.15 50MWp
Concession temporary electricity price to the grid
Qinghai 2011 1.15
900MWp already
approved
To be completed before 2011 Dec.31 (previously scheduled to complete before 2011 Sep.30)
Concession right tendering 1 2009 1.0928 20MWp Gansu Dunhuang
Concession right tendering 2 2010 0.7288 -
0.9791 280MWp 13 projects in Gansu, Qinghai, Ningxia and Inner Mongolia
National unified benchmark electricity price
2011 1.15 Those approved before 2011.07. 01 and completed before Dec 31 Electricity price of 1.15 CNY/kWh will still be applied in Tibet 2012 1.0
2.2 PV Development Policy and Status in Qinghai Province
Starting in 2008, many PV power station investors saw the good prospects of solar energy and land resources for construction and the grid and power transmission and transformation conditions of Qinghai Province, believing that it is the best area in comprehensive conditions to construct large-scale PV power stations in China. They came one after another to Haixi Prefecture and other areas with good conditions in Qinghai to sign letter of intent for cooperation, and started registering power generation companies and securing land for construction, to start construction of PV power stations at appropriate time.

Renewable Energy Development Appendix 2 Final Report National Development Plan and Provincial Development Plan
A2 - 17
Fig. 2-1 Solar Energy Resources Distribution in Qinghai Province
Relevant departments of Qinghai Provincial Government also actively prepared PV industry development plans and formulated relevant policies, to be prepared for receiving investment, launching large-scale construction of PV projects in Qinghai Province and to promote local economic development. They have completed nearly 10 development plans at the provincial and prefectural levels related to PV.
Table 2-2 Preparation of PV Related Plans in Qinghai Province
Description of plan Prepared by Main target Issuance date
Outline of Twelfth Five-year Plan for national economy and social development in Qinghai Province
Qinghai Provincial People’s Government
Overall plan for comprehensive utilization of solar energy in Qinghai Province
Application plan for development and popularization of solar energy industry in Qinghai Province
Issued by Qinghai Provincial People’s Government Economic Relations and Trade Commission of Qinghai Province
Plan report for 10GW PV power generation base in Tsaidam Basin of Qinghai Province
Plan for Tsaidam Basin pilot PV power generation base in Qinghai Province
Development and Reform Commission of Qinghai Province
Plan for Golmud in Qinghai Province as a new energy pilot city
Development and Reform Commission of Qinghai Province
Grid planning for "Twelfth Five-year Plan" for Haixi Prefecture
PV development plan for Haibei Prefecture in Qinghai Province
In review
Plan for comprehensive energy system in Tibetan areas of Qinghai Province
2000
2000
1900 1800
1700

Appendix 2 Renewable Energy Development National Development Plan and Provincial Development Plan Final Report
A2 - 18
Though the government has not issued supporting policies for electricity price to the grid for PV power generation, investing enterprises were active in preparing for start of works. However, large-scale construction action could not be started, and only some companies started research projects. In May 2011 when Qinghai Province notified project companies locally registered and approved that projects completed before September 30, 2011 could enjoy the electricity price to the grid of CNY 1.15 per kWh, 26 (now 27) enterprises submitted applications and obtained approval. These projects were the Qinghai 930 projects as referred to by outsiders.
Table 2-3 Registered Companies and Applied Projects of Qinghai 930 Projects
in Haixi Prefecture
No. Project owner New capacity
Planned total
capacity
Project for 1.15 electricity price Location
1 Longyuan Golmud New Energy Development Co., Ltd. 30 200 20 + 30 = 50 Golmud 2 Yellow River Upper Reaches Hydropower
Development Co., Ltd. 200 1000 200 Golmud
3 Guodian Power Qinghai New Energy Project Preparatory Office 10 200 10 Golmud
4 China Three-gorge New Energy 5 10 5 Golmud 5 Beijing Beikong Green Science and Technology
Industrial Co., Ltd. 20 50 20 Golmud
6 Qinghai Water Conservation and Hydropower Group 10 20 10 Golmud 7 CPI Golmud Photovoltaic Power Generation Co., Ltd. 30 200 20 + 30 = 50 Golmud 8 Jinzhou Sunshine Energy 20 20 20 Golmud 9 Qinghai Project Preparatory Office of Datang
Shandong Branch 20 20 20 Golmud
10 Huaneng Golmud Photovoltaic Power Generation Co., Ltd. 30 200 30 Golmud
11 Qinghai Baike Photoelectrical Co., Ltd. 8 10 2 + 8 = 10 Golmud 12 China Huadian Photovoltaic Power Generation Co.,
Ltd. 10 10 10 Golmud
13 Zhejiang Zhengtai Solar Energy Science and Technology Co., Ltd. 20 20 20 Golmud
14 Qinghai Jingneng Construction Investment Co., Ltd. 20 100 20 Golmud 15 Shengguang New Energy Co., Ltd. 2 20 1 + 2 = 3 Golmud 16 Qinghai Datang International Energy Project
Preparatory Office 20 20 20 Golmud
17 Qinghai New Energy Group Corporation 10 10 10 Golmud 18 Qinghai Junshi Energy Co., Ltd. 8 10 2 + 8 = 10 Golmud 19 Qinghai Provincial Development and Investment Co.,
Ltd. 2 2 2 Golmud
20 Yellow River Upper Reaches Hydropower Development Co., Ltd. 30 50 30 Ulan
21 CEC Solar Energy Co., Ltd. 10 10 10 Da Qaidam
22 Guodian Qinghai Branch 20 20 20 Delingha 23 Qinghai Linuo Solar Energy Power Co., Ltd. 30 30 30 Delingha 24 China Wind Power Group 30 50 30 Delingha 25 CEC Solar Energy 20 200 20 Xitieshan 26 CGNPC Solar Energy Development Co., Ltd. 90 100 10 + 90 = 100 Xitieshan
Total 705 2582
760 (including 45MW at
Golmud and 10MW at Xitieshan already connected to grid)

Renewable Energy Development Appendix 2 Final Report National Development Plan and Provincial Development Plan
A2 - 19
In fact, after NDRC issued the national unified PV benchmark electricity price in Aug. 2011, all Qinghai 930 projects were covered, and their completion date was naturally extended to Dec. 31, 2011. Because they were started early, Qinghai Province got the first priority in the construction of this round of PV projects, becoming the area with most concentrated PV power stations being constructed in China. On September 16, 2011 at the PV development conference called for by the Qinghai Provincial Government, officials of the provincial government declared that in 2011, it would be ensured that PV power generation systems of 0.9GW should be completed for production by the end of the year, and further efforts would be made to realize a higher target of 1GW.
3. PV Policy Note Development Plan and Status in Qinghai Province
In early July 2011 when statistics were started for this study, PV power stations of Longyuan with 20MW, CPI Golmud with 20MW, Baike with 2MW and Shenguang (CPV) with 1MW at Golmud had been connected to grid, with 45MW already connected to grid in Golmud, and the 10MW project at Xitieshan was also connected to grid. If the new projects of 705MW could be completed on schedule, the installed capacity in Haixi Prefecture during the year will be 760MW. With projects in other places of Qinghai Province, the applied installed capacity of 930 projects in the province will be about 900MW. However, as investing enterprises doubted whether Qinghai Province would finally make good the promise of CNY 1.15 per kWh electricity price to the grid, and also the schedule to complete by September 30, 2011 was too tight, we estimate that only about 500MW can be completed out of 930 projects. The issuance of the state benchmark electricity price eliminated the doubt of investors and granted additional 3 months as construction schedule, so large-scale construction of PV power stations immediately went into full swing in Qinghai Province. In the present progress of construction, there is a high possibility that PV power stations completed and connected to grid for power generation by the end of the year reach 0.9GW in Qinghai Province. Although the electricity price to the grid in 2012 will possibly decrease to CNY 1 per kWh (if no extra subsidy is provided by local governments), investing enterprises are still at high initiative for subsequent construction. By now, Qinghai Provincial Energy Bureau has received project application reports for a total of 4GW, and it plans to approve projects of about 1GW out of 4GW to be constructed in 2012. Therefore, the installed capacity of PV power station in Qinghai Province will reach 2GW by the end of 2012.

Appendix 2 Renewable Energy Development National Development Plan and Provincial Development Plan Final Report
A2 - 20
Table 3-1 Summary of Projects under Construction and Proposed in Qinghai Province
Description of project Installed capacity (MWp)
Origin of project Owner
PV power station in Gonghe County of Hainan Prefecture 30 Concession right tendering Yellow River Upper Reaches
Hydropower Group
PV power station in Henan County of Huangnan Prefecture 20 Concession right tendering Yellow River Upper Reaches
Hydropower Group
2011 benchmark electricity price 900 Approved by Qinghai Provincial Energy Bureau Investing enterprises
2012 benchmark electricity price
1,000 To be approved by Qinghai Provincial Energy Bureau Investing enterprises
Photoelectrical building pilot program
Golden Sun pilot program
Total 1,950
4. Recommendation for Development Planning, Funding and Investment Incentives
Rapid development of PV power generation construction in Qinghai Province will greatly spur the PV industry development in China, also with important significance to improve energy structure, energy conservation and emission reduction, environmental protection and to promote local economic development. The international background of European financial crisis, made freeze of PV market in Europe and some US enterprises launching “Double Counter Investigation” has also brought opportunities for the PV manufacturing industry of China to expand domestic market. However, too rapid growth is also accompanied with some problems deserving our attention. First, to concurrently implement many projects in a short period of time with tight schedule and heavy work tasks, investing enterprises will subject to pressure from aspects of materials procurement, transport, supply of labor, construction organization and cost control. Second, as construction standards, project specifications and quality acceptance standards have not been unified, some projects were started in haste to catch up with schedule, and working in winter, there will be some hidden perils to project quality. Although Qinghai Province has make arrangement on preparation for connection, grid acceptance ability, peak regulation method and total quantity target control, due to tight schedule, large amount of work and insufficient experience, unexpected problems will possibly occur when large number of power stations are connected to the grid almost at the same time. Therefore, countermeasures have to be worked out in advance.

Renewable Energy Development Appendix 2 Final Report National Development Plan and Provincial Development Plan
A2 - 21
At present, all existing technical plans, installation methods and PV modules can be found in the projects in Qinghai. As prior tests and evaluation data are lacking, it should be verified if the expected technical and economic indicators can be reached. If they can be operated reliably for long time after completion, this will bring some risks to investing enterprises. Therefore, it is suggested that department in charge in Qinghai Province organize technical teams in a timely manner, to conduct technical evaluation for projects during implementation, strengthen the supervision requirements on construction, strengthen the safety education in construction enterprises, and provide better service for investing enterprises, to ensure the healthy development of the whole program.
5. Promotion of Large-Scale Grid connected Solar PV Development in Qinghai
Province 5.1 Gap between Policies and Reality, Opportunities and Possibilities
In early July, 2011 when statistics were started for this research program, PV power stations of Longyuan with 20MW, CPI Golmud with 20MW, Baike with 2MW and Shenguang (CPV) with 1MW at Golmud had been connected to grid, with 45MW already connected to grid in Golmud, and the 10MW project at Xitieshan was also connected to grid. If the new projects of 705MW can be completed on schedule, the installed capacity in Haixi Prefecture during the year will be 760MW. With projects in other places of Qinghai Province, the applied installed capacity of 930 projects in the province will be about 900MW. However, as investing enterprises doubted whether Qinghai Province would finally make good the promise of 1.15 yuan/kWh electricity price to the grid, and also the schedule to complete by Sept. 30 was too tight, we estimate that only about 500MW can be completed in 930 projects. The issuance of the state benchmark electricity price eliminated the doubt of investors and granted additional 3 months as construction schedule, so large-scale construction of PV power stations immediately went into full swing in Qinghai Province. In the present progress of construction, there is a high possibility that PV power stations completed and connected to grid for power generation by the end of the year 2011 reach 0.9GW in Qinghai Province. Although the electricity price to the grid in 2012 will possibly decrease to 1 CNY/kWh (if no extra allowance is provided by local governments), investing enterprises are still at high initiative for subsequent construction. By now, Qinghai Provincial Energy Bureau has received project application reports for a total of 4GW, and it plans to approve project of about 1GW out of 4GW to be constructed in 2012. So, the installed capacity of PV power station in Qinghai Province will reach 2GW by the end of 2012.

Appendix 2 Renewable Energy Development National Development Plan and Provincial Development Plan Final Report
A2 - 22
Table 5-1 Summary of Projects under Construction and Proposed in Qinghai Province
Description of project Installed capacity (MWp) Origin of project Owner
PV power station in Gonghe County of Hainan Prefecture
30 Concession right tendering Yellow River Upper Reaches Hydropower Group
PV power station in Henan County of Huangnan Prefecture
20 Concession right tendering Yellow River Upper Reaches Hydropower Group
2011 benchmark electricity price
900 Approved by Qinghai Provincial Energy Bureau
Investing enterprises
2012 benchmark electricity price
1000 To be approved by Qinghai Provincial Energy Bureau
Investing enterprises
Photoelectrical building pilot program
Golden Sun pilot program Total

Renewable Energy Development Appendix 3 Final Report Capacity Development Training
APPENDIX 3
CAPACITY DEVELOPMENT TRAINING
Renewable Energy Development Appendix 3 Final Report Capacity Development Training
A3 - 1
Capacity Development Training 1. Schedule
(1) The First Training
Date : April 25 to 28, 2011, (4 days)
(2) The Second Training
Date : July 04 to 30, 2011, (27 days)
(3) Overseas Training in Japan
Date : October 24 to 30, 2011, (7 days) 2. Contents of the Training
(1) The First Training
1) Capacity development training for planning, design, construction, operation and maintenance (O &M) of solar PV system. Solar photovoltaic (PV) planner, solar PV engineer, solar PV system designer. Transmission engineer and Financial analyst were trained regarding planning and construction of solar PV system, and were provided technical guidance on their 10 MW class grid-connected solar PV system.
2) Capacity development training for solar PV supply-chain Solar PV supply-chain specialists provided assessment of the capacity and quality of the solar supply chain and gave technical guidance on their solar PV supply chain.
3) Financial analyst made economic analysis on a 10 MW class grid-connected solar PV system and identified appropriate off take electric tariff level and assessed financing needs and type of financing. Then he gave advice to the QBE based on the result of analysis.
(2) The Second Training
1) Solar Photovoltaic (PV) Planner, Solar PV engineer, Solar PV system designer and Transmission engineer visited Golmud where QBE was going to construct a 10 MW class grid-connected solar PV system and had the site survey.

Appendix 3 Renewable Energy Development Capacity Development Training Final Report
A3 - 2
Then they gave technical assistant to QBE regarding planning, construction and O&M of a solar PV system, and gave technical guidance on their 10 MW class grid-connected solar PV system.
2) Capacity development training for solar PV supply-chain Solar PV supply-chain specialists gave assessment of the capacity and quality of the solar supply chain of the Qinghai China Silicon Energy (QCSE) and provided technical guidance to develop a feasible solar PV supply chain to QCSE.
3) Financial analyst gave economic analysis on a 10 MW class grid-connected solar PV system and identify identified off take electric tariff level and assessed financing needs and type of financing. Then he gave advice to the QBE based on the result of analysis.
(3) Overseas Training in Japan
1) EA(Qinghai Provincial Finance Department) and IA( Qinghai Brightness Engineering) members came to Japan and visited the PV manufactures which had the latest technology for the Power conditioner (including inverter) and PV panel production and Electric Power Company (KANSAI Electric Power Company) in Kansai area, Japan which had already installed a 10 MW grid-connected solar PV system. Then they had fruitful discussion about solar PV grid-connected system with engineers who were working at those firms and the Electric power company.
3. Overseas Training Schedule and Members
(1) Overseas training schedule is shown in the Table 3-1.
1) Duration: October 24 – October 30, 2011, (7days) 2) Schedule

Renewable Energy Development Appendix 3 Final Report Capacity Development Training
A3 - 3
Table 3-1 Overseas Training Schedule Itinerary in Japan
Day Schedule Lodging Place
Oct. 24 (Mon) Arrival of engineers in Japan (OSAKA) OSAKA
Oct. 25 (Tue) - Briefing on the Project and Schedule of inspection visit - Inverter Manufacturer Factory Visit
OSAKA KYOTO
Oct. 26 (Wed) - SAKAI MEGA Solar PV P/S Visit (KANSAI) - SAKAI KO Power Station Visit (KANSAI)
OSAKA
Oct. 27 (Thur) - Central Control Center (KANSAI) - Technical discussion of Mega PV P/S with KANSAI
OSAKA
Oct. 28 (Fri) Solar Module Manufacture Factory Visit OSAKA
Oct. 29 (Sat) Internal Wrap Up Meeting OSAKA
Oct. 30 (Sun) Departure of trainees from Japan(KANSAI) -
KANSAI: THE KANSAI ELECTRIC POWER CO., INC.
(2) Member table is shown in Table 3-2
Table 3-2 Nominated Member for Overseas Training

Renewable Energy Development Appendix 4 Final Report Presentation Materials
APPENDIX 4
PRESENTATION MATERIALS
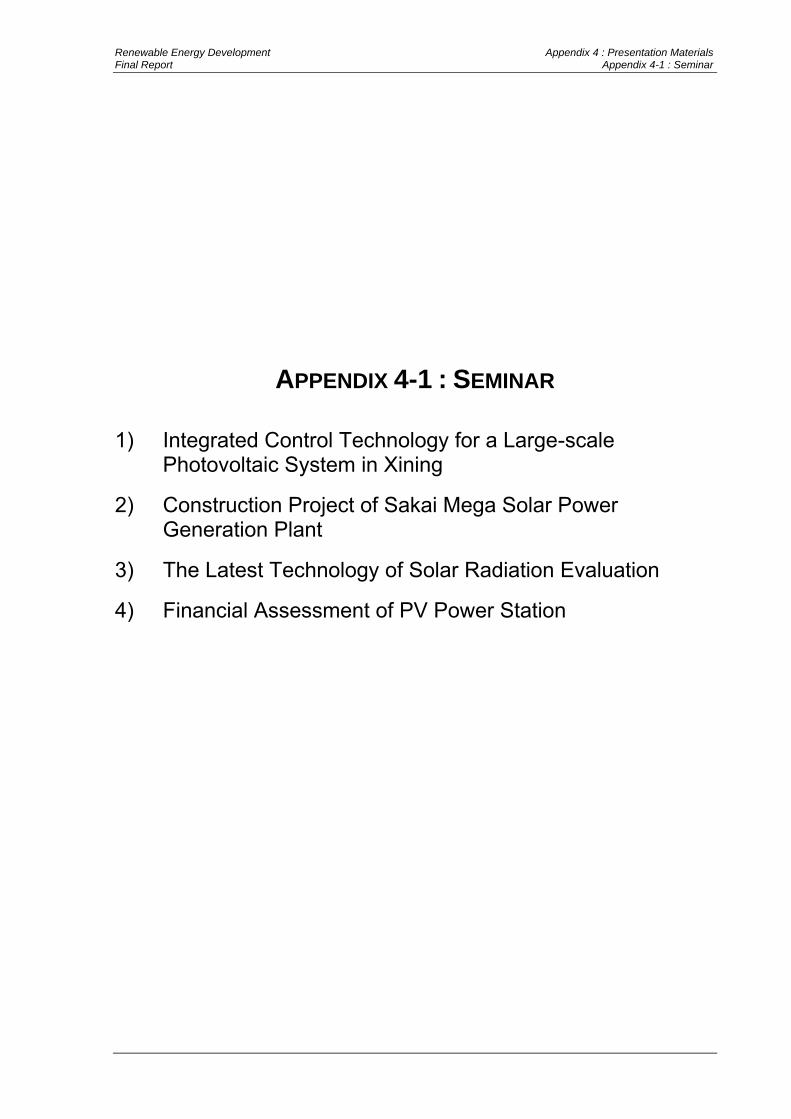
Renewable Energy Development Appendix 4 : Presentation Materials Final Report Appendix 4-1 : Seminar
APPENDIX 4-1 : SEMINAR
1) Integrated Control Technology for a Large-scale Photovoltaic System in Xining
2) Construction Project of Sakai Mega Solar Power Generation Plant
3) The Latest Technology of Solar Radiation Evaluation
4) Financial Assessment of PV Power Station

Integrated Control Technology Integrated Control Technology for a Largefor a Large--scale scale
Photovoltaic System in XiningPhotovoltaic System in XiningPhotovoltaic System in Xining Photovoltaic System in Xining
April 27,2011
Yukao TANAKA
NEWJEC Inc.NEWJEC Inc.
Today’s Topic1
1.1. Background of the ProjectBackground of the Project
22 Outline of SystemOutline of System2.2. Outline of SystemOutline of System
3.3. Project ScheduleProject Schedule
4.4. Site Layout/System LayoutSite Layout/System Layout
5.5. Configuration of Major EquipmentConfiguration of Major Equipment
6.6. Typical Daily Operation PatternTypical Daily Operation Pattern
7.7. Compensation by CapacitorCompensation by Capacitor7.7. Compensation by CapacitorCompensation by Capacitor
8.8. Fast Operation of PV SystemFast Operation of PV System
9.9. AchievementsAchievements
10.10. Training for Operation and MaintenanceTraining for Operation and Maintenance
A4-1 - 1

Background of the Project
•• Promotion of renewable energy Promotion of renewable energy
2
for the environmental problemsfor the environmental problems
•• Reducing the affection to the power system Reducing the affection to the power system
from the photovoltaic (PV) generationfrom the photovoltaic (PV) generation
A rationalized power supplying system A rationalized power supplying system making good use of renewal energymaking good use of renewal energy
Compensating the PV Power Fluctuation by Capacitorwith Rationalized PV system
-- Outline of system --
Purpose of the ProjectPurpose of the Project・・Indicator of power frustration:Indicator of power frustration:380V380V±±7%7%
3
Compensation of PVCompensation of PV Power fluctuationPower fluctuationFaster interconnection of PV systemFaster interconnection of PV system
10kV Line
High Speed Stabilizing Control
CHP300kW
Summarized control equipment
INV10kVA
DC Bus Adaptation of Capacitor for
compensation of PV power
fluctuation
Adaptation of Capacitor for
compensation of PV power
fluctuation
Character
Project System
CHP75kW
CNV300kW
Faster interconnection of PV systemFaster interconnection of PV system
PV300kW
Junction Box
Junction Box
EDLC1kWh
Load
Rationalized system with
connections in DC side
High Speed connection after
out of service
Rationalized system with
connections in DC side
High Speed connection after
out of serviceLarge PV system EDLC:Electric Double Layer Capacitor
A4-1 - 2

Project ScheduleProject Schedule4
2007 2008 20092010(up to
March)
Production and transportation of PV panels
Production and installation of like the indoor equipment
Feasibility Study
Site survey and Specification study
Demonstrative Operation
like the indoor equipment
Completion Ceremony Workshop
Training of Operation and Maintenance
Reverse Power Flow to 10kV Distribution LineReverse Power Flow to 10kV Distribution Line5
XEDTAControl House
-- Site Layout/ System Layout --
300kW PV Plant
10kV Distribution line
Site Layout
60m166m
T Branch from 10kV distribution line
A4-1 - 3

Photovoltaic Module / 14 series and 108 circuitsPhotovoltaic Module / 14 series and 108 circuits6
166m Demonstration System Transformer 10kV/0.4kV
-- Site Layout/ System Layout --
60m
10kV Line
Number of PV moduleNumber of PV module::1 512 pcs1 512 pcs
:P.C.BOX:Low voltage:High voltage
Sub-Array
回路A回路B
回路C回路D
PV Sub Array
Number of PV moduleNumber of PV module::1,512 pcs.1,512 pcs.Component of circuit:Component of circuit:14 module (series)/circuit14 module (series)/circuit
> Num. of Circuit:108 circuit> Num. of Circuit:108 circuitComponent of sub array :4(2)circuit/sub arrayComponent of sub array :4(2)circuit/sub array
> Num. of Sub array:28 sub array> Num. of Sub array:28 sub arrayComponent of P.C.BOX:4Component of P.C.BOX:4--5 sub array / P.C.BOX(165 sub array / P.C.BOX(16~~20 20 circuit/P.B.BOX) >circuit/P.B.BOX) > Num. of P.B.BOX: 6 unitsNum. of P.B.BOX: 6 unitsCapacity of PV system: about 300kWCapacity of PV system: about 300kW
Component of sub Component of sub arrayarray
回路A 回路C
7
DC/DC Converter for PV System
P.C.BOX 1-6
-- Configuration of major equipment --
Photovoltaic Generation SystemPhotovoltaic Generation System(PV modules is composed of 14 series and 108 (PV modules is composed of 14 series and 108 Circuits. )Circuits. )
Item SpecificationModule Total
Maximum power 200W 302 4kW
Specification of PV moduleSpecification of PV module Specification of Specification of DC/DC Converter for PV SystemDC/DC Converter for PV SystemItems Specification
Rated power(DC bus side) 400 kW
PV modules is composed of 14 series PV modules is composed of 14 series
108 Circuits108 Circuits
+
+
-
-
Maximum power 200W 302.4kWMaximum power voltage 26.3V 368.2V
Maximum power current 7.61A 821.88A
Open circuit current 32.9V 460V
Short circuit current 8.21A 886.68A
(DC bus side)
DC input(PV side)
Rated voltage 400VVoltage range for
rated output 280V~460V
Voltage range forinterconnection 280V~600V
DC output(DC bus side) 280V
Type of control Step-down chopper control applying IGBT
A4-1 - 4

8
To DC/DC Converter for EDLC Panel+ -
-- Configuration of major equipment --
Electric Double Layer Capacitor (EDLC) SystemElectric Double Layer Capacitor (EDLC) System(( EDLC modules is composed of 5 series 5 parallels, 2 setsEDLC modules is composed of 5 series 5 parallels, 2 sets))
Item Specification
Connection 5 series 5 parallels, 2 sets
Specification of Electric DoubleSpecification of Electric DoubleLayer Capacitor (EDLC)Layer Capacitor (EDLC)
Item SpecificationSpecification of DC/DC Converter for EDLC SystemSpecification of DC/DC Converter for EDLC System
60F 54V module5 series 5 parallels
60F 54V module5 series 5 parallels
Maximum charge voltage(Module rating )
54V
Maximum voltage of EDLC system 270V
Maximum current of EDLC system 600A
Capacity 120F/1.215kWh
Item SpecificationRated power (DC bus side) 75kW
DC input(EDLC side)
Maximum voltage 270VVoltage range for
rated output 90V~260V
DC output(DC bus side) 280V
Type of control Step-up chopper control applying IGBT
9
Specification of ConverterSpecification of Converterfor Interconnectionfor Interconnection
Item Specification
-- Configuration of major equipment --
Converter for InterconnectionConverter for Interconnection
AC rated voltage Three-phase, three-wire380Vrms
Rated frequency 50Hz
AC rated power ±342kVA
DC rated voltage DC280V
Conversion Not less than 90% (DCConversion efficiency
Not less than 90% (DC 280V/ AC300kW, power
factor =1)
••Control functionsControl functionsa) Constant-voltage control (DC 280V) and power factor 1 controlb) Constant reactive power control
A4-1 - 5
FrequencyFrequencyOutput of PV GenerationOutput of PV Generation
Freq
Typical Daily Operation PatternTypical Daily Operation Pattern-- Small change in PV output (on a fine day) Small change in PV output (on a fine day) --
10
Time(H)
VoltageVoltageV
oltage
(V)
quency(F)
PV
OU
TP
UT
(kW)
TIME (H) Time(H)
Date:13 July,2009
Min. Max. Ave.
PV generation (kW) 0 79 251
Frequency (Hz) 49.93 50.01 50.08
Low voltage on AC side (V) 378.8 381.6 384.9
Summary of Maximum and Minimum Averages
Typical Daily Operation Pattern Typical Daily Operation Pattern -- Sharp Changed in PV Generation Sharp Changed in PV Generation --
11
FrequencyFrequencyOutput of PV GenerationOutput of PV Generation
Fre
TIME (H)
VoltageVoltageVoltage
(V)
equency(F)
PV
OU
TP
UT
(kW)
Date:1 July, 2009
TIME (H) TIME (H)
Min. Max. Ave.
PV generation (kW) 0 79 303
Frequency (Hz) 49.94 50.01 50.06
Low voltage on AC side (V) 378.7 383.2 388.8
Summary of Maximum and Minimum Averages
A4-1 - 6

Typical Daily Operation Pattern Typical Daily Operation Pattern -- Cloudy Day Cloudy Day --
12
FrequencyFrequencyOutput of PV GenerationOutput of PV Generation
Fre
TIME (H)VoltageVoltage
Voltage
(V)
equency(F)
PV
OU
TP
UT
(kW)
Date:10 July,2009
TIME (H) TIME (H)
Min. Max. Ave.
PV generation (kW) 0 15.15 112
Frequency (Hz) 49.93 50.00 50.05
Low voltage on AC side (V) 375.7 380.6 384.7
Summary of Maximum and Minimum Averages
Development of Power Stabilization ControlDevelopment of Power Stabilization Control-- Compensation by Capacitor -- 13
Output to PowerPV Power Output
Control for stabilization as follows1. Detection of PV power(①)2 EDLC Power out put for compensation(②)
①
③
Output to Power system
PV Power Output2. EDLC Power out put for compensation(②)3. Out put Power to the power system(③)
Power SystemStabilizing Control
Equipment
Pow
er
②EDLC Power out put
EDLCEDLCSystemSystemPV SystemPV System
② Time
Image of Compensation control for PV Power fluctuation
Stabilizing power fluctuation under a few seconds using EDLCStabilizing power fluctuation under a few seconds using EDLC
A4-1 - 7

-- Fast Operation of PV System -- 14
Image for Restart of PV Power GenerationDistribution System
Conventional Control System
Development of Inventor Control Method Development of Inventor Control Method for Faster Restarting of PV Operationfor Faster Restarting of PV Operation
Test Equipment
Inverter for Connection
Voltage
Accident
Voltage
Developed Control System
Start of generation
Clear of Accident
Clear of Accident
Usually around Usually around 10seconds10seconds
Junction Box
Junction Box
Load
Faster Deviation Detection of Voltage and PhaseFaster Deviation Detection of Voltage and Phase→→ Development for fast restart of PVDevelopment for fast restart of PV OperationOperation
Around 2 secondAround 2 second
Clear of Accident
Accident
Development of Power Development of Power SStabilization tabilization CControlontrol((Case: 1Hz Case: 1Hz fluctuationfluctuation of DC/DCof DC/DC Converter for PV SystemConverter for PV System))
15
In In USEUSE NoNo USE USE
150
200[CNV] AC P
[CNV] DC P
[PV] DC bus P
[EDLC] DC bus P
100
150
200 [CNV] AC P
[PV] DC bus P
[EDLC] DC bus P
PV CNV PVStabilizationStabilization Control using EDLCControl using EDLC
-- AchievementsAchievements--
-100
-50
0
50
100
0.0 0.5 1.0 1.5 2.0 2.5 3.0 3.5 4.0 4.5 5.0
経過時間(sec)
電力
(kW
)
-100
-50
0
50
100
0.0 0.5 1.0 1.5 2.0 2.5 3.0 3.5 4.0 4.5 5.0
経過時間(sec)
電力
(kW)
EDLCEDLCCNV
EDLC Effect with PV output forcedly varied at 1-Hz frequency (using FFT)
Am
p EDLC:DC/DC Converter for
Time (sec)Time (sec)
Pow
er (kW)
Pow
er (kW)
Output power variations per second (1 Hz) were reduced to 1/10 forthe capacity of the output power stabilization system
Frequency (Hz)
plitude
EDLC:DC/DC Converter forEDLC System
PV :DC/DC Converter for PV SystemCNV :Converter for Interconnection
(AC SIDE)
A4-1 - 8

Development of Power Development of Power SStabilization tabilization CControlontrol(Case: PV output makes a sharp change (270 kW to 0 kW))(Case: PV output makes a sharp change (270 kW to 0 kW))
16
PV Output DC Voltage
PV Output
-- AchievementsAchievements--
DC Voltage
Enlarge
During the demonstrative operation period. As a result, we could verify that DC bus voltage show within the given power quality objectives and good integrated control was achieved.
17-- AchievementsAchievements--
Development of Inventor Control Method Development of Inventor Control Method for Faster Restarting of PV Operationfor Faster Restarting of PV Operation
Time axis: 50 ms/div. Restart time: 1.14s
We could achieve the target with the fastest time of 1.14 seconds.
CH1 (red): Converter for Interconnection Output Voltage U-V 200V/div.
CH2 (green): DC Bus Bar Voltage P-N 50C/div.
CH3 (blue): Converter for Interconnection Gate Block Signal (H: Gate Block occurrence / L: Gate Block cancel)
A4-1 - 9

Training for Operation and MaintenanceTraining for Operation and Maintenance18
Training to operatorTraining to operatorPreparation of operation manual (Chinese versionChinese version)On the Job training using real equipment at siteReport system to Japan when trouble happenedMaking daily repot by operatorsWorkshopWorkshopWorkshopWorkshopEnlightenment of Photovoltaic
generation technology
Operation Manual(Chinese versionChinese version)
Training for Operation and MaintenanceTraining for Operation and Maintenance(On the Job training using real equipment at site)(On the Job training using real equipment at site)
19
Explanation of display/ meter Explanation of display/ meter on the panelon the panel
Explanation of parts of panel Explanation of parts of panel insideinside
Explanation of method of sucking Explanation of method of sucking up the detailed dataup the detailed data(For troubleshooting)(For troubleshooting)
Explanation of operationExplanation of operation(using touch panel)(using touch panel)
A4-1 - 10

20
THETHE ENDEND
A4-1 - 11
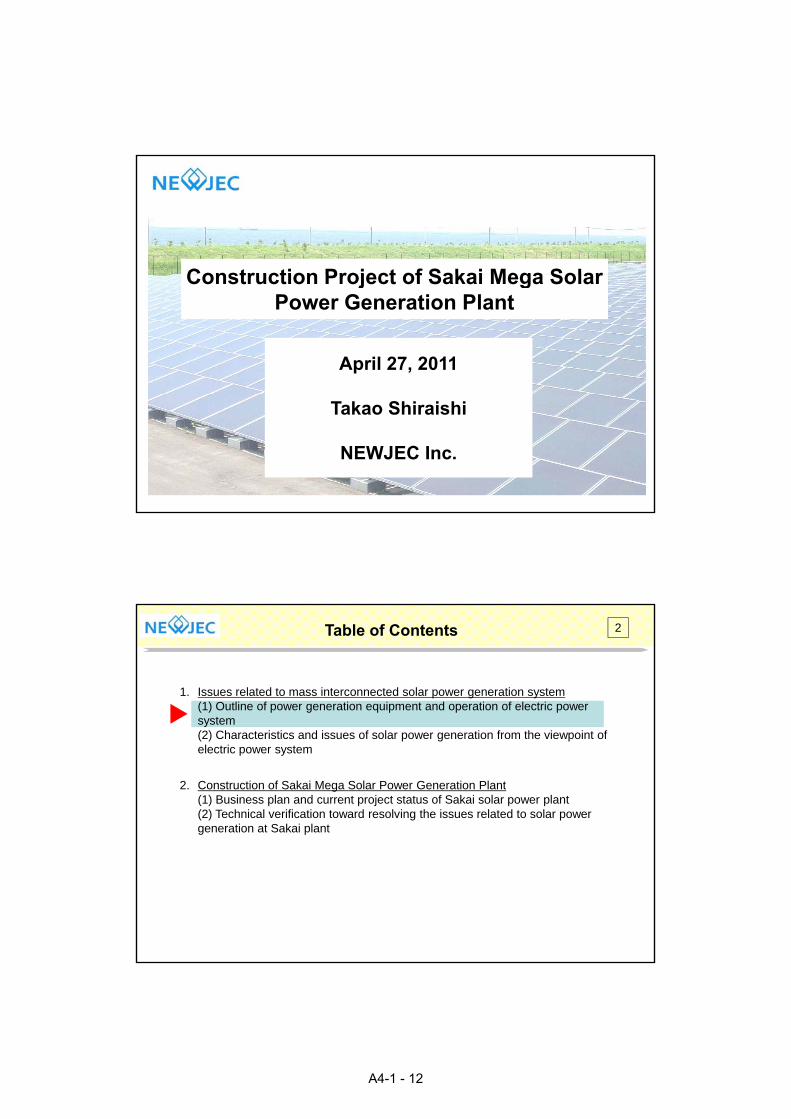
Construction Project of Sakai Mega SolarConstruction Project of Sakai Mega Solar Power Generation Plant
April 27, 2011
Takao Shiraishi
NEWJEC Inc.
2
1. Issues related to mass interconnected solar power generation system(1) Outline of power generation equipment and operation of electric power system
Table of Contents
system(2) Characteristics and issues of solar power generation from the viewpoint of electric power system
2. Construction of Sakai Mega Solar Power Generation Plant(1) Business plan and current project status of Sakai solar power plant(2) Technical verification toward resolving the issues related to solar power generation at Sakai plant
A4-1 - 12

3
Electricity generated by a power plant is distributed via intermediate/distributing substations after being fed through transmission lines to ultrahigh voltage/primary substations where its voltage is gradually reduced. Before being supplied to customers, the voltage is furthermore reduced to 100~200V by pole transformers.
Outline of Electric Power Facilities
Hydropower station Mega factory Mega factory Small factory
Nuclear power stationUltrahigh voltage substation Primary substation Intermediate substation Distributing substation Pole transformer
Thermal power station
Rail substation
Building, mid-scale factoryHousing
Reference: FEPC website
4Mission of Operating Electric Power System
To deliver quality electricity by;① Maintaining appropriate frequencies
Implementation rules of Electricity Business Act (METI order)
Maintain frequencies equivalent to the standard frequency of electricity being supplied
Internal reference frequencies
59.9Hz~60.1Hz (residence ratio: 95% or more)
② Maintaining appropriate voltages
Implementation rules of Electricity Business Act (METI order)
100V: no more than 101±6 V100V: no more than 101±6 V
200V: no more than 202±20 V
Internal reference voltages
As same as the above
③Ensure the reliability(sustainable supply of electricity)
A4-1 - 13

5
1. Issues related to mass interconnected solar power generation system(1) Outline of power generation equipment and operation of electric power system
Table of Contents
system(2) Characteristics and issues of solar power generation from the viewpoint of electric power system
2. Construction of Sakai mega solar power generation plant(1) Business plan and current project status of Sakai solar power plant(2) Technical verification toward resolving the issues related to solar power generation at Sakai plant
6Characteristics of Solar Power Generation from the Viewpoint of Power System
Fluctuation
Power generation depends on the weather condition. As it is impossible to store the generated electricity, output adjustment is difficult.
Sunny
Occasionally cloudy
Rainy
Hidaka Energy park
Period of heavy loading
Period of light loading
Excess electricity is generated.
Surplus
As power generation depends on the weather condition, large scale introduction of solar power generation may lead to excess electricity through the entire power system.
Pumped hydropower electricity
Nuclear power
Wind power
Thermal power
Pumped hydropower
Hydropower
Solar power
DemandMinimum thermal power
DemandMinimum thermal power
Pumped hydropower electricity
Pumped hydropower
Thermal power
Wind power
Hydropower
Nuclear power
Solar power
Reverse power flow
Excess electricity will flow back into the power system.
Electricity
Reverse power flow
Solar panel
Excess electricity
Consumption Generated electricity
A4-1 - 14

7Fluctuation in Solar Power Generation
As it depends on the weather condition, the adjustment of power output is difficult.
Sunny (November 4)
Occasionally cloudy (November 23)
Occasionally rainy (November 22)
Reference: Data from Sakai Solar Power Generation Plant
Power output (kW)
Solar power generation can provide stable power on sunny days. However, on cloudy or rainy days, a high level or stable output cannot be expected.
Clock time
8Influence of Power Fluctuation
Fluctuations in solar power generation are compensated by increasing/decreasing the power output of adjustable electric sources (thermal power generation, etc.). Large-scale introduction of solar power generation may lead to an extended fluctuation, resulting in lack of frequency balance.
I i
Reducing power output by adjustable power sourcesOn sunny days
Increase in frequency
Increasing power output by adjustable power sources
Electricity generated by solar power
Existing electricity
Power generation
Demand Supply
Demand
Supply
SupplyDemand
Decrease in frequency
sources Adjustable power sources (thermal power, etc.)
Supply
SupplyDemand
DemandOn rainy days
A4-1 - 15
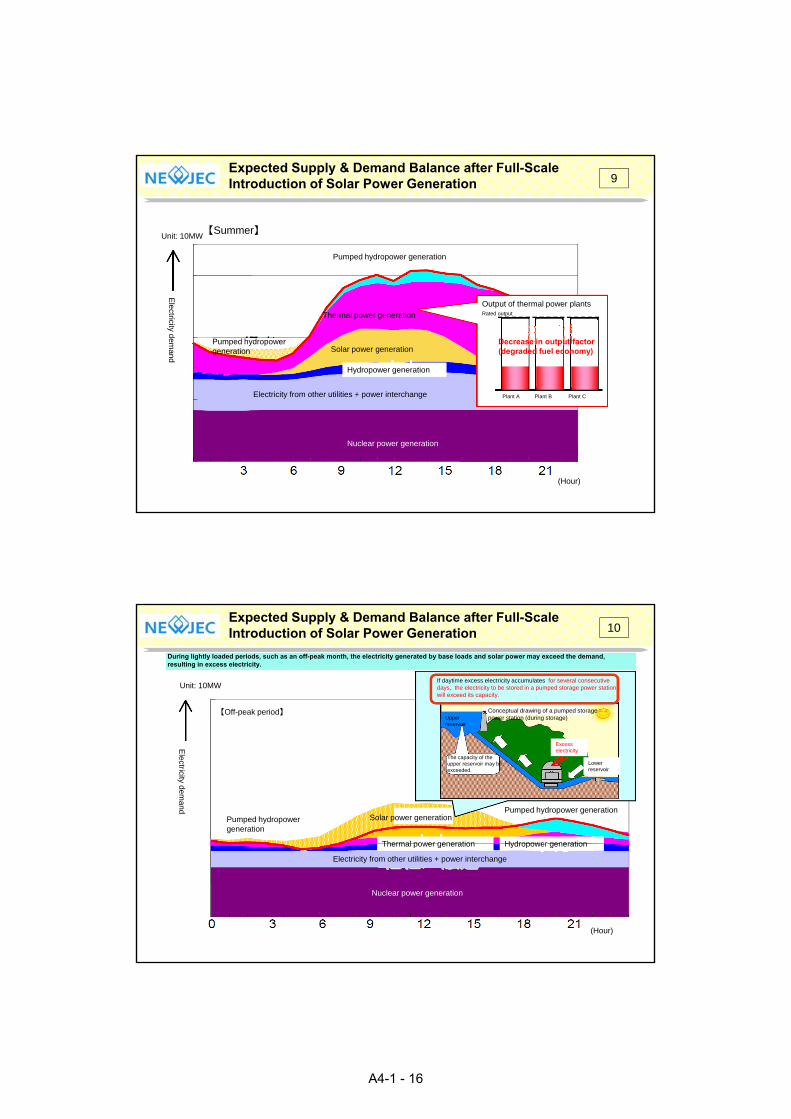
9Expected Supply & Demand Balance after Full-Scale Introduction of Solar Power Generation
Pumped hydropower generation
【Summer】Unit: 10MW
Electricity from other utilities + power interchange
Hydropower generation
Solar power generation
Thermal power generation
Pumped hydropower generation
Output of thermal power plants
Decrease in output factor (degraded fuel economy)
Rated output
Ele
ctricity de
ma
nd
Nuclear power generation
Electricity from other utilities + power interchange Plant A Plant B Plant C
(Hour)
10Expected Supply & Demand Balance after Full-Scale Introduction of Solar Power Generation
During lightly loaded periods, such as an off-peak month, the electricity generated by base loads and solar power may exceed the demand, resulting in excess electricity.
If daytime excess electricity accumulates for several consecutive days, the electricity to be stored in a pumped storage power station will exceed its capacity.
Conceptual drawing of a pumped storage power station (during storage)Upper
reservoir
【Off-peak period】
Unit: 10MW
reservoir
Lower reservoir
Excess electricity
The capacity of the upper reservoir may be exceeded.
Ele
ctricity de
ma
nd
Solar power generation
Thermal power generation Hydropower generation
Pumped hydropower generation
Pumped hydropower generation
(Hour)
Thermal power generation Hydropower generation
Electricity from other utilities + power interchange
Nuclear power generation
A4-1 - 16

11Increase in Distribution Voltage
As the distribution voltage increases due to a reverse flow of solar power, output control of solar power generation occurs.
Reverse flow of solar power Flow of electricity
T fDistributing substation
Transformer
Solar panel
Not allowed to generate power even if it is sunny.
Exceeds 107V.
With a reverse power flow
Ra
ng
e o
f ap
p
Power control
With a reverse power flow
Without a reverse power flow
pro
pria
te vo
ltag
es
As the distribution voltage increases due to a reverse flow of solar power, output control of solar power generation occurs.
As solar power generation increases, the frequency of controlling reverse power flow increases, which results in an increase in claims from customers.
12
1. Issues related to mass interconnected solar power generation system(1) Outline of power generation equipment and operation of electric power system
Contents
system(2) Characteristics and issues of solar power generation from the viewpoint of electric power system
2. Construction of Sakai mega solar power generation plant(1) Business plan and current project status of Sakai solar power plant(2) Technical verification toward resolving the issues related to solar power generation at Sakai plant
A4-1 - 17

13
Operator: Jointly operated by Sakai city and Kansai Electric (public relations: Sakai city, construction & operation: Kansai Electric)Location: Industrial waste landfill in Sakai No. 7-3 DistrictArea: approx. 20haPower output: 10MW (10,000kW)Generated electricity: approx. 11million kWh/yearInstallation: on ground
Outline of Sakai Mega Solar Power Generation Plant
Installation: on groundOperation schedule: partially started on October 5, 2010 (approx. 2.85MW)
planned to fully start on October 2011
14Location of Sakai Mega Solar Power Generation Plant
Sakai Mega Solar Power Generation Plant
Sakai No.7-3 District
Forest of co-existing
Windmill square Eco town
Minato Sakai Green Square
Sakai No.7-3 District
A4-1 - 18
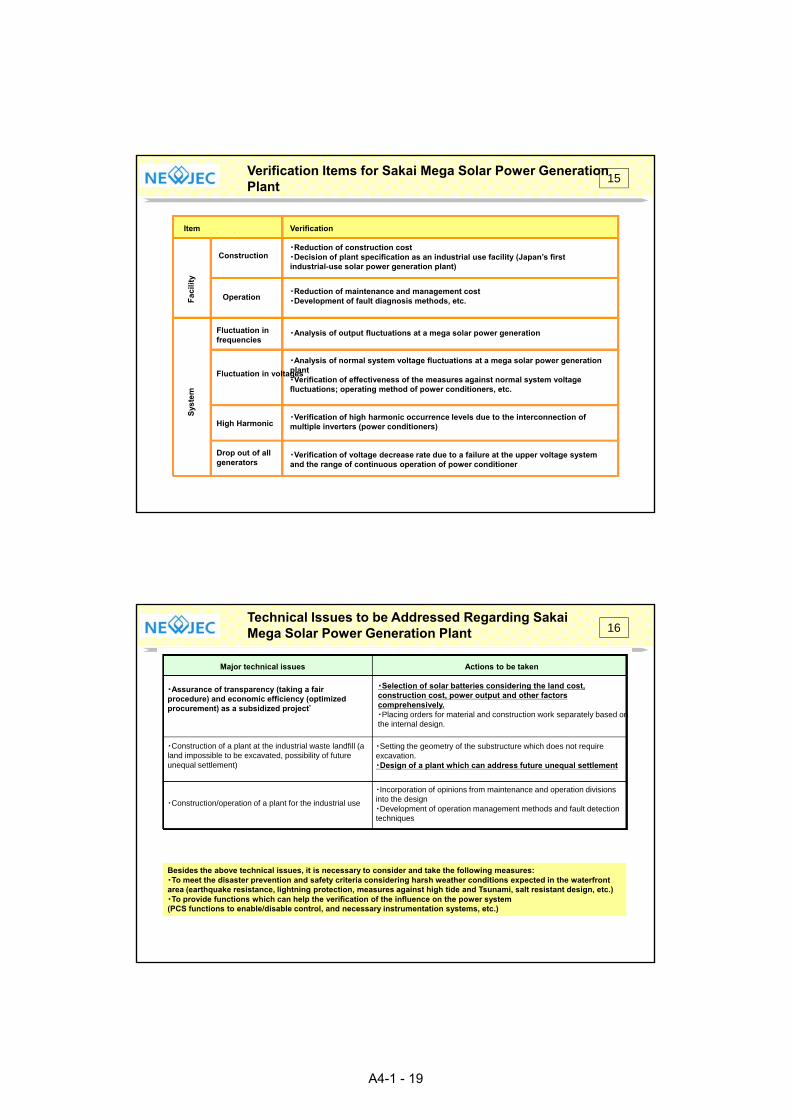
15Verification Items for Sakai Mega Solar Power Generation Plant
Item Verification
Construction・Reduction of construction cost・Decision of plant specification as an industrial use facility (Japan’s first industrial-use solar power generation plant)
Operation
Fluctuation in frequencies
Fluctuation in voltages
Fa
cil
ity
m
・Reduction of maintenance and management cost・Development of fault diagnosis methods, etc.
・Analysis of output fluctuations at a mega solar power generation
・Analysis of normal system voltage fluctuations at a mega solar power generation plant・Verification of effectiveness of the measures against normal system voltage fluctuations; operating method of power conditioners, etc.
High Harmonic
Drop out of all generators
Sys
tem
・Verification of high harmonic occurrence levels due to the interconnection of multiple inverters (power conditioners)
・Verification of voltage decrease rate due to a failure at the upper voltage system and the range of continuous operation of power conditioner
16Technical Issues to be Addressed Regarding Sakai Mega Solar Power Generation Plant
Major technical issues
・Assurance of transparency (taking a fair procedure) and economic efficiency (optimized procurement) as a subsidized project*
Actions to be taken
・Selection of solar batteries considering the land cost, construction cost, power output and other factors comprehensively.・Placing orders for material and construction work separately based on the internal design
・Construction of a plant at the industrial waste landfill (a land impossible to be excavated, possibility of future unequal settlement)
・Construction/operation of a plant for the industrial use
the internal design.
・Setting the geometry of the substructure which does not require excavation.・Design of a plant which can address future unequal settlement
・Incorporation of opinions from maintenance and operation divisions into the design・Development of operation management methods and fault detection techniques
Besides the above technical issues, it is necessary to consider and take the following measures:・To meet the disaster prevention and safety criteria considering harsh weather conditions expected in the waterfront area (earthquake resistance, lightning protection, measures against high tide and Tsunami, salt resistant design, etc.)・To provide functions which can help the verification of the influence on the power system(PCS functions to enable/disable control, and necessary instrumentation systems, etc.)
A4-1 - 19

17Structure of Sakai Mega Solar Power Generation Plant Facilities
Direct current 440 V alternate current
6kV alternate current 22kV alternate current
Solar battery Power conditioner Substation of power system interconnectionSolar battery y
Approx. 70,000 panels
250kW × 41 units A single substation
interconnection
18Structure of Sakai Mega Solar Power Generation Plant Facilities
Different types of solar batteries have different conversion ratios.The area required to install a 10MW solar panel depends on the type of battery.
Conversion Power output (energy)
ratio Incidence energy (consistent per unit area)
Total cost
Cost of solar batteries(as more expensive as higher efficiency)
Land and construction work cost(As less expensive as higher efficiency)
Cost<Example>
Type of solar battery
Conversion ratio Occupied area for 10MW
Crystal system Approx. 15% Approx. 70,000m2
Thin-film system Approx 8% Approx 130 000m2 efficiency)
Low efficiency High efficiency
Thin-film system Approx. 8% Approx. 130,000m
Even if the cost of solar batteries is lower, a lower conversion ratio will lead to a high land and construction work cost, which may result in a rather expensive total cost.
A4-1 - 20

19
The value of solar battery is comprehensively evaluated taking into account the bid price and degradation ratio in addition to the predetermined system cost and annual energy production.
Comprehensive Evaluation in Selecting the Type of Solar Battery
Solar battery cost System cost
Manufacturer’s bid price
Unambiguously determined considering the conversion ratio and panels of solar battery
Cumulative total of land cost and property tax
Annual energyDegradation ratio
Manufacturer's declared value
Evaluated value(yen/kWh)
20Annual energy production
Manufacturer s declared value (20-year guarantee equivalent to Western countries)
20 years
20Installation of Solar Battery Panels at Sakai Plant
<Installation method considering local limitations>・As it is the industrial waste landfill, excavation below the surface cover soil (50cm deep) is now allowed. →The substructure is laid directly on the ground without excavation.
Fixing bracket
① Concrete placement using formwork
② Installing formwork after positioning using the fixing bracket.
③ Mounting solar battery panels on the substructure using the mounting hardware.
A test installation was conducted prior to the actual construction work in order to improve the work quality and efficiency.
A4-1 - 21

21
1. Substructure
Conventional substructure: A steel platform supports the solar battery panel frame.
Used metal 700t
Current substructure: directly fixed on the concrete foundation using mounting hardware
Development of Mounting Hardware Which Can Accommodate Unequal Settlement
Hardware on the solar panel side
Hardware on the concrete block side
Solar batterySolar battery
g gBackward concrete foundation (50cm high)
Front concrete foundation (20cm high)
Mounting hardware
・Mitigate strain due to settlement by lateral shear and rotation.・Possible to correct shear following unequal shear.
Hardware on the solar panel side Concrete block
Rotation
Lateral shear
2. Demonstration test
Before settlement
After settlementsettlement settlement
Rotation
ShearForced stettlement
The mounting hardware can accommodate a 6~8cm unequal settlement without any problem with its applicability.
22Groundwork of Sakai Mega Solar Power Generation Plant
Pouring concrete from the 4 corners simultaneously
Concrete placer
It is difficult to use a concrete mixer truck to place the concrete foundation because of a small formwork.
A new construction method was developed: concrete mixture equivalent to four foundations (approx. 1m3) is casted into the concrete placer and it is poured from the four corners simultaneously.
Formwork
Casting concrete mixture into the concrete placer
Steel FormworkSteel Formwork
Formwork fixing hardware
A4-1 - 22

23Installation of Solar Battery Panels
August 2010
24Substation
August 2010
A4-1 - 23

25
August 2010
Arrayed Solar Battery Panels
26Current Status of Sakai Mega Solar Power Generation Plant
January 20, 2011
【No 2 zone】【No.2 zone】Approx. 3,450kW(planned to start operation this
spring)
【No.3 zone】Under construction (approx. 3,700kW)(planned to start operation this fall)
【No.1 zone】Started operation on October 5, 2010 (output: approx. 2,850kW)
A4-1 - 24

27Visitor Center
Visitor center building
Observation deck Output display and four explanatory
lpanels
28Arrayed Solar Battery Panels
Model solar battery panels (mounted on the observation deck)
Output display
Looking at the plant site from above the observation deck
Looking at the plant site from underneath the observation deck
A4-1 - 25

29
1. Issues related to mass interconnected solar power generation system(1) Outline of power generation equipment and operation of electric power
t
Table of Contents
system(2) Characteristics and issues of solar power generation from the viewpoint of electric power system
2. Construction of Sakai mega solar power generation plant(1) Business plan and current project status of Sakai solar power plant(2) Technical verification toward resolving the issues related to solar power generation at Sakai plant
30Power Generation Records at Sakai Solar Power Generation Plant
November 7~13, 2010
Sunday, 7th Monday, 8th Tuesday, 9th Wednesday, 10th Thursday, 11th Friday, 12th Saturday, 13th
Cloudy, temporarily fine later
Cloudy, occasionally fine later
Fine with intermittent rain
Fine Clear and sunny Cloudy with intermittent rain, fine later
CloudyWea
ther
So
lar ra
dia
tion
Po
wwe
r ou
tpu
t
Reference: Weather condition in Osaka daytime, Japan Meteorological Agency website
It is planned to accumulate data to evaluate the influence of solar power generation on the power generation system.
A4-1 - 26

31Verification of Influence on Power Systems
Sakai Mega Solar Power Generation Plant
Ishizugawa S/SActive power
LoadP/C built-in instrumentation
Reactive power
Voltage
Harmonic
Current
System parameter
Solar power from Sakai Plant
Solar radiation
parameter recorder
Function to adjust reactive power
Measurement according to the power conditioner
Frequency fluctuation
Voltage fluctuation
Harmonic
Analysis of output fluctuations of mega solar power generation
Analysis of voltage fluctuations in the normal system at a mega solar power generation
Verification of effectiveness of the measures against normal system voltage fluctuations・ Control of reactive power by means of power conditioners, etc.
Verification of harmonic (waveform strain) occurrence levels due to the interconnection of multiple inverters (power conditioners)
32Measurement of Solar Radiation to Predict Output Fluctuation
Total 60 solar radiation meters are installed in the Kansai Electric supply area.
Locations of pyranometers
【Measurement】
Measured item Frequency
Amount of global solar radiation (level surface)Thermal type pyranometer
・One second sampling, averaged over 10 secondsyp py
(ISO9060 first class)・With time synchronization
Atmospheric temperature
The amount of solar radiation on the inclined surface and the electricity generated by solar power are locally measured.
Pyranometer installed on the roof of Kansai Electric Human Resource Development Center
A4-1 - 27

33Measured Solar Radiation (Example)
Locations of pyranometers in Kansai Electric supply area
Toyooka Office Hikone Office
Flu
ctua
tion
ra
Flu
ctua
tion
ratio
Kobe Substation Higashisumiyoshi Office
Fluctuation ratio averaged over 60 points*Assuming 1000W/m2 solar radiation as 100%
Decreasing fluctuation ratio
atio
Flu
ctua
tion
ratio
nF
luctu
atio
n
ratio
Although the fluctuation ratio of solar radiation* at individual points is rather high, the averaged fluctuation ration becomes smaller due to off-setting effect.
It is planned to accumulate and analyze data to contribute to the development of supply and demand control system.
34Technologies to Predict the Amount of Solar Radiation (Prediction of Photovoltaic Output)
The measured solar radiation will be utilized to verify and improve the accuracy of the method to predict photovoltaic output.
Meteorological satellite, Hi i
Amount of solar radiation 【Predicted and measured amount of solar radiation】
Predicted valueMeasured value
A large error
Himawari
[Numerical prediction]Data on atmospheric pressure, temperature, wind transmitted from all over the world are processed by the computer to predict future weather conditions.
Attenuation by atmosphere・Atmospheric pathway・Amount of water vapor・Degree of air pollution
Attenuation by clouds・Amount of upper clouds・Amount of mid-level clouds・Amount of lower clouds
Am
ou
nt o
f sola
r ra
dia
tion
Ground observation data・Atmospheric pressure, temperature, wind・Amount of solar radiation
Satellite data・Visible image
Water vaporComparing with the actual amount of solar radiation measured on the roof of Kansai’s Research institute (one point), some predicted values deviate from the measurement. It is planned to verify and improve the accuracy of prediction based on the amount of solar radiation measured at several points.
Research programs are under progress on the prediction of solar radiation by means of the weather forecasting system. With a high level of errors in the prediction, it is necessary to develop new technologies to improve the accuracy of prediction.
A4-1 - 28

35Research on Power Supply & Demand Control System Utilizing Batteries
A research is being conducted on the possibility of connecting nickel hydride batteries to the power system at Ishizugawa substation to which Sakai Mega Power Generation Plant is interconnected.
Interconnection with batteries at Ishizugawa substation Ordering the batteries for input/output power according to the output fluctuation of mega solar power generation
Kansai Electric Headquarters
power generation
Active power Active power
Inverter
Nickel hydride battery
Houses Offices and factories
Sakai Mega Solar Power Generation Plant
Sakai Mega Solar Power Generation Plant
Ishizugawa substation
Specification of nickel hydride battery
77 kV power system
22 kV power system 6.6kV power system
Specification of nickel hydride battery
Nickel hydride battery stack【Research subjects】・Supply & demand control system which allows mass introduction of solar power generation・Service life evaluation and applicability assessment of batteries as the supply and demand control tool.
Number of stacks
Rated voltage
Rated capacity
Energy capacity
Power output
*Power output as the supply and demand control system being interconnected to inverters
36
Promotion of electrified societySupply of low carbon emitting power
Realization of a low-carbon emitting society
Promoting diffusion of high-efficiency equipment utilizing
Stable operation and improvement of
Measures against global warming taken worldwide
Development of innovative technologies
y q p gheat pup technologies
improvement of hydropower stations
Promotion of renewable energies
Safe and stable operation of nuclear power plants
Improvement of thermal efficiency of thermal plants
Promoting diffusion of electric vehicles
taken worldwide technologies
Prevention of global warming
Thank you for your kind attention.
A4-1 - 29

The Latest Technology of The Latest Technology of Solar Radiation EvaluationSolar Radiation Evaluation
-- Estimate of Generation by PV System Estimate of Generation by PV System --
1
y yy y
April 27,2011p ,Takashi NAKAZAWA
NEWJEC Inc.NEWJEC Inc.
1. Basis of Sunlight
1-1 Solar Constant
1 2 A h i i
3. Power Increase Method
4. Fish eye lens and camera
Today’s TopicToday’s Topic2
1-2 Atmospheric transmittance
1-3 Air mass
1-4 Solar Spectrum
1-5 Spectral Characteristic of PV
1-6 Direct light and scattered light
1-7 Solar radiation intensity
y4-1The feature of using fisheye lens
4-2 The difference
4-3 Solar orbit image
4-4 Layering solar orbit image
over picture
4-5 Estimation of obstacles
1-8 Daily Solar Radiation Intensity Curve
2. 2-1 V-I Characteristic of PV2-2 Generation-Radiation Intensity
Characteristic2-3 Temperature Characteristic
and the scattered light
4-6 Estimation of generation by
PV system
A4-1 - 30
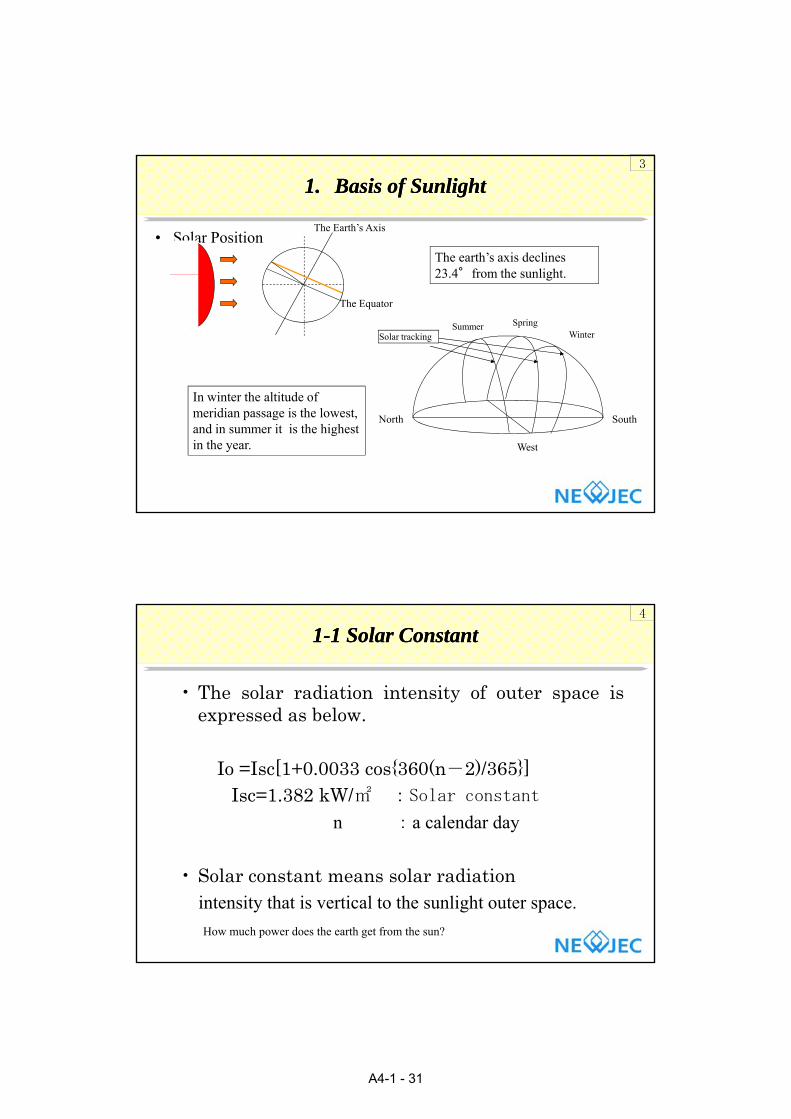
1.1. Basis of SunlightBasis of Sunlight
• Solar PositionThe Earth’s Axis
The earth’s axis declines 23 4°from the sunlight
3
WinterSummer Spring
The Equator
23.4 from the sunlight.
Solar tracking
I i t th ltit d f
SouthNorth
West
In winter the altitude of meridian passage is the lowest, and in summer it is the highest in the year.
11--1 Solar Constant1 Solar Constant
• The solar radiation intensity of outer space isexpressed as below.
4
p
Io =Isc[1+0.0033 cos360(n-2)/365]Isc=1.382 kW/ :Solar constant
n : a calendar day
• Solar constant means solar radiationintensity that is vertical to the sunlight outer space.
How much power does the earth get from the sun?
A4-1 - 31
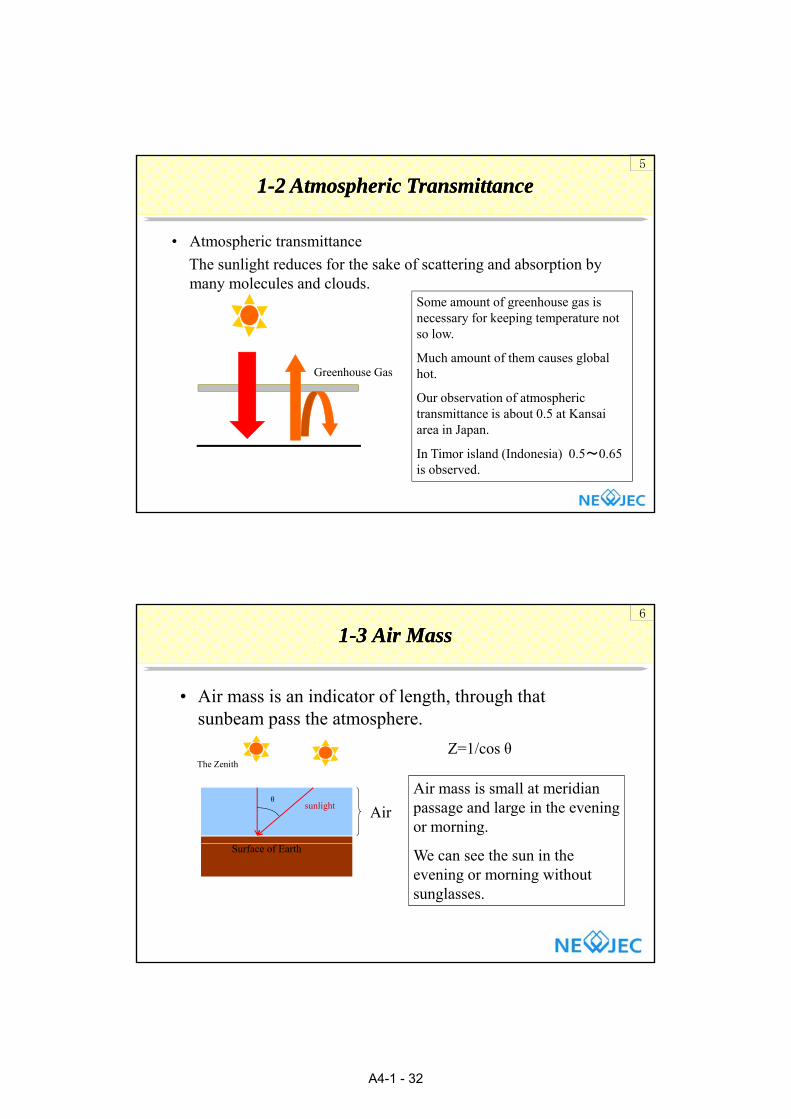
11--2 Atmospheric Transmittance2 Atmospheric Transmittance
• Atmospheric transmittance
The sunlight reduces for the sake of scattering and absorption by
5
many molecules and clouds.
Greenhouse Gas
Some amount of greenhouse gas is necessary for keeping temperature not so low.
Much amount of them causes global hot.
O b i f h iOur observation of atmospheric transmittance is about 0.5 at Kansai area in Japan.
In Timor island (Indonesia) 0.5~0.65 is observed.
11--33 AirAir MassMass
• Air mass is an indicator of length, through that sunbeam pass the atmosphere.
6
sunbeam pass the atmosphere.
θ
Z=1/cos θ
Air
Air mass is small at meridian passage and large in the evening or morning.
The Zenith
sunlight
Surface of Earth We can see the sun in the evening or morning without sunglasses.
A4-1 - 32

11--44 SolarSolar SpectrumSpectrum
1.38kW/
outside atmosphere
The sunbeam is partially
7
1kW/
at sea level (AM=1.5)
blocked by molecules and debris.
Molecules such as H2O, CO2, O2, etc. absorb energy and scatter the light.
11--55 SpectralSpectral CharacteristicCharacteristic ofof PVPV
Solar spectrum (AM=1.5)
8
c-Si
a-Si
blue green red infra-red
A4-1 - 33
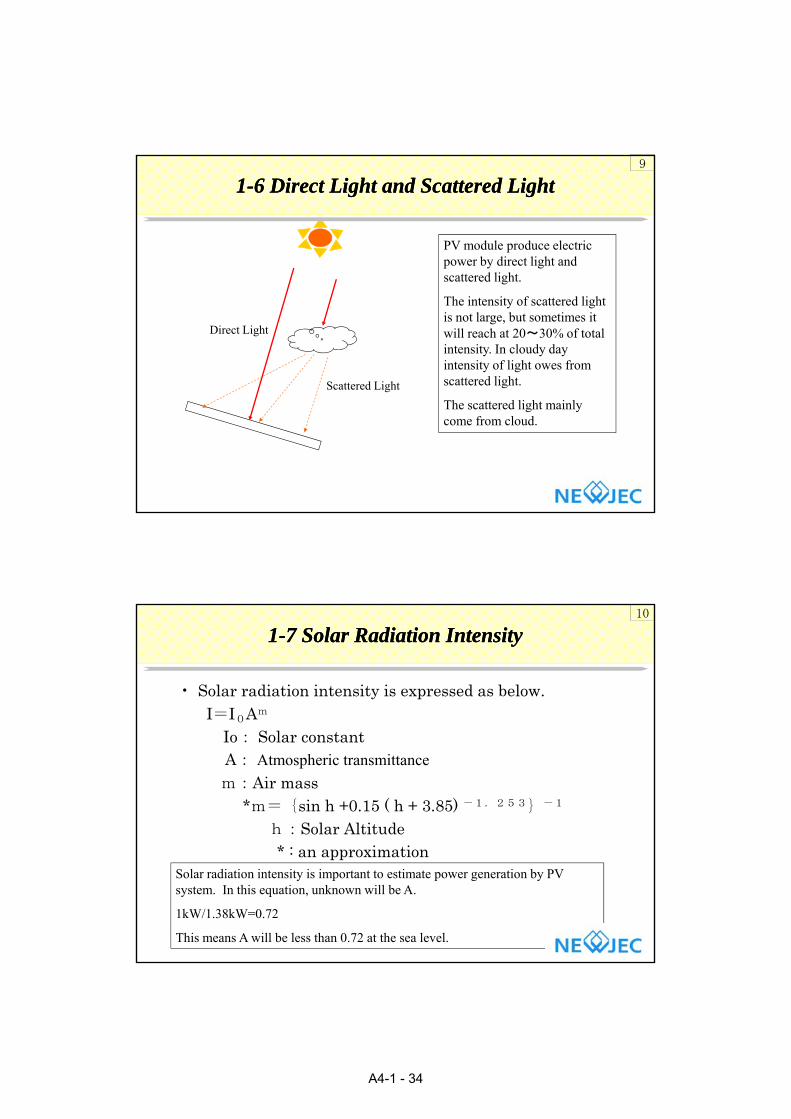
11--6 Direct Light and Scattered Light6 Direct Light and Scattered Light
PV module produce electric power by direct light and
tt d li ht
9
Scattered Light
Direct Light
scattered light.
The intensity of scattered light is not large, but sometimes it will reach at 20~30% of total intensity. In cloudy day intensity of light owes from scattered light.
The scattered light mainly come from cloud.
11--7 Solar Radiation Intensity7 Solar Radiation Intensity
• Solar radiation intensity is expressed as below. I=I0Am
10
Io: Solar constantA: Atmospheric transmittance
m:Air mass*m={sin h +0.15 ( h + 3.85) -1.253}-1
h:Solar Altitude* : an approximation
Solar radiation intensity is important to estimate power generation by PV system. In this equation, unknown will be A.
1kW/1.38kW=0.72
This means A will be less than 0.72 at the sea level.
A4-1 - 34

11--8 Daily Solar Radiation Intensity Curve8 Daily Solar Radiation Intensity Curve
Solar Radiation Intensity
1.00
11
0.50
INT
EN
SIT
Y(k
W/
) Fine
Cloudy
Rainy0.00
6 12 18
TIME
Rainy
In case of grid connected PV system the power conditioner will operate more than 0.05kW/. So the system will not operate in rainy days efficiently. In cloudy day power conditioner will repeat start and shut down.
V-I Characteristic of PV
Isc is a little larger than
• V-I Characteristic
22--11 VV--II CharacteristicCharacteristic ofof PV PV 12
Volt.
Am
p.
Isc
Ipm
Pm
Vpm Voc
gIpm, so PV module is not broken in the case of short circuit accident.
Which one is the hottest on a PV surfase?
Case 1: short circuitIsc : short circuit current
Ipm : current for maximum power
Voc : open circuit voltage
Vpm: voltage for maximum power
Pm : maximum power
Case 1: short circuit
Case 2: open circuit
Case 3: power supply
power to some
A4-1 - 35

22--22 GenerationGeneration--RadiationRadiation IntensityIntensity CharacteristicCharacteristic
As radiation intensity increase, power output
13
, p pincrease.
At the same temperature PV power is linear to intensity.
PV module is tested under the condition as b lbelow.
Irradiation: 1kW/temperature: 25AM: 1.5
22--33 TemperatureTemperature CharacteristicCharacteristic
• Power and Voltage depend on temperature of PV.Power Generation-Temperarture Characteristic
14
Voltage
Pow
er Pm(25)
Pm(75)
It is said decreasing rate of power will be about -0.4%/, and voltage will be about -0.5% /.
Increasing rate of current will be about +0.1%/.
A4-1 - 36

3. Power Increase Method3. Power Increase Method
• Weather conditionStrong solar radiation intensityLow air temperature
15
Low air temperature• PV array
High efficiency PV moduleArray should be installed by same characteristics PV modules.High voltage PV array and low loss wiring
• Power conditionerHigh efficiencyMPPT control (with PV array)MPPT control (with PV array)Lower loss of transformer
• CircumstanceNo shadow
4. Fish Eye Lens and Camera4. Fish Eye Lens and Camera16
Single-lens reflex camera and Fish-eye lens
A4-1 - 37

44--1 Feature of Using Fisheye Lens1 Feature of Using Fisheye Lens
The feature of fisheye lens
① 360°visual fieldΦ
17
① 360 visual field.
② The picture taken by fisheye
keep the information on
the celestial sphere.
③ The position in circle
picture is able to be
ΦΦ
Φ
Fish eye
p
expressed mathematically.
(poplar coordinates)
p=f(φ)
p p p
Picture
44--2 Difference 2 Difference 18
northeast
south
west
east west
south
A4-1 - 38

44--3 Solar Orbit Image3 Solar Orbit Image
North Solar orbit is expressed as polar coordinates in the circle.
19
summer
spring, autumn
winter
NorthEast
X’=[Lθ]X
Xpv=[Rα][Rβ]X’
X: coordinates at
the Equator
X’: coordinates at
h θ l i dbelow the horizon
South
the θ latitude
α: direct angle of PV
β: tilt angle
[Rx]: rotation matrix
44--4 Layering Solar Orbit Image Over Picture4 Layering Solar Orbit Image Over Picture20
fish eye picture solar orbit image
+
=
obstacles
A4-1 - 39

44--5 Estimation of Obstacles5 Estimation of Obstaclesand the Scattered Lightand the Scattered Light
NorthIn summer direct light will reach for 12 hours.
21
East West
In spring and autumn direct light will reach for 10 hours.
In winter direct light will reach for 8 hours.
Scattered light from cloud
South
gis estimated as solid angle of the sky.
44--6 Estimation of Generation by PV System6 Estimation of Generation by PV System
th
radiation
intensity[k
W/ d ]
average
air temp.
[]
monthly DC
energy[kWh
/ ]
monthly DC
energy[kWh
/ ]
monthly AC
energy[kWh
/ ]
monthly AC
energy[kWh
/ ] th
radiation
intensity[kW
/ d ]
average
air temp.
[]
22
1 2.7 5.5 7,339 6,899 7 4.46 27 10,639 10,0002 3.28 5.8 7,927 7,451 8 4.69 28.2 11,048 10,3853 4.35 8.6 11,371 10,689 9 4.16 24.2 9,818 9,2284 4.91 14.6 12,129 11,401 10 4.01 18.3 9,985 9,3865 4.95 19.2 12,179 11,448 11 3.24 12.9 8,065 7,5816 4.38 23 10,339 9,719 12 2.76 7.9 7,378 6,935
month W/・day] [] /mon.] /mon.] /mon.]/mon.] month /・day] []
Condition
Capacity: 100kWCapacity: 100kW,
Location: Osaka Japan
Air temp.: data from Osaka Meteorological Observatory
A4-1 - 40

23
THETHE ENDEND
A4-1 - 41
Financial Assessment of Financial Assessment of PV Power StationPV Power Station
April 2009Masaru NISHIDANEWJEC Inc.NEWJEC Inc.
Contents1
1.1. Purpose of Financial AssessmentPurpose of Financial Assessment
22 What is "Financial Viability"?What is "Financial Viability"?2.2. What is "Financial Viability"?What is "Financial Viability"?
3.3. Economic Assessment vs Financial AssessmentEconomic Assessment vs Financial Assessment
4.4. Procedure of Financial Assessment of ProjectProcedure of Financial Assessment of Project
5.5. Elements of Costs and Benefits to be considered Elements of Costs and Benefits to be considered
6.6. Source of Financing InvestmentSource of Financing Investment
7.7. Other Factors related to Costs and BenefitsOther Factors related to Costs and Benefits7.7. Other Factors related to Costs and BenefitsOther Factors related to Costs and Benefits
8.8. Method of AssessmentMethod of Assessment
9.9. Uncertainty = RisksUncertainty = Risks
A4-1 - 42
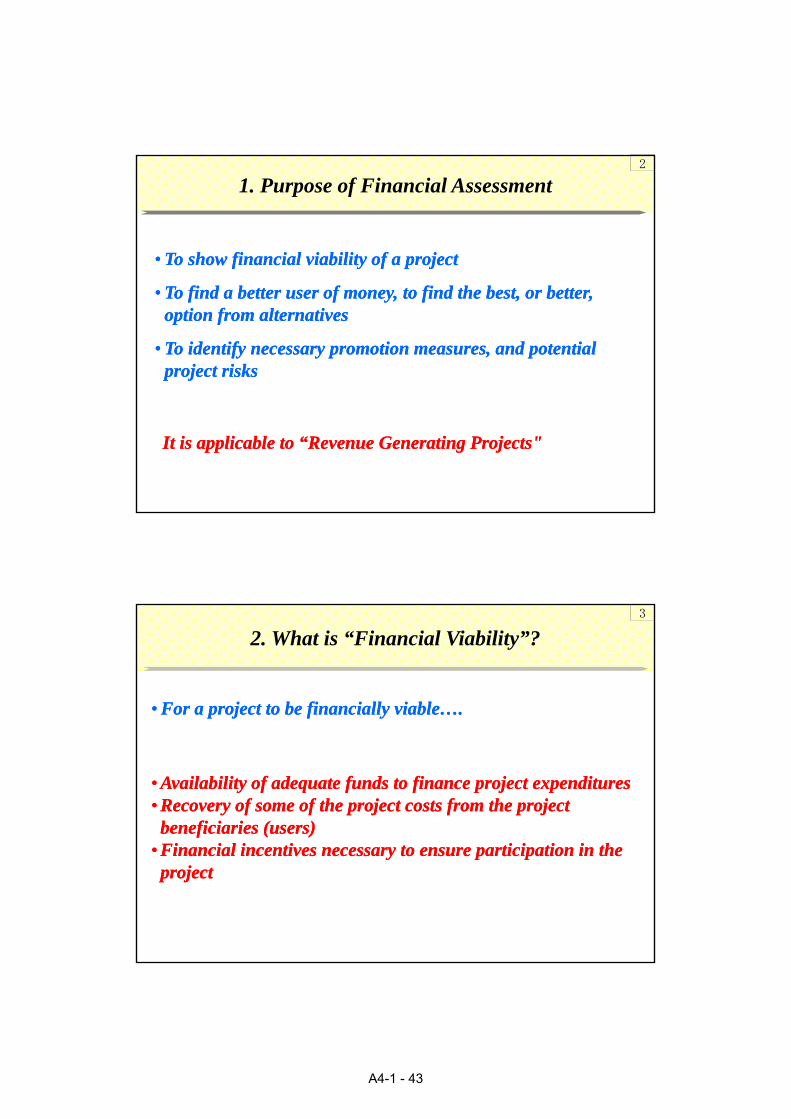
1. Purpose of Financial Assessment
•• To show financial viability of a projectTo show financial viability of a project
2
•• To find a better user of money, to find the best, or better, To find a better user of money, to find the best, or better, option from alternativesoption from alternatives
•• To identify necessary promotion measures, and potential To identify necessary promotion measures, and potential project risksproject risks
It is applicable to “Revenue Generating Projects"It is applicable to “Revenue Generating Projects"
2. What is “Financial Viability”?3
•• For a project to be financially viable….For a project to be financially viable….
•• Availability of adequate funds to finance project expendituresAvailability of adequate funds to finance project expenditures•• Recovery of some of the project costs from the project Recovery of some of the project costs from the project beneficiaries (users)beneficiaries (users)
i i l i i i i i i hi i l i i i i i i h•• Financial incentives necessary to ensure participation in the Financial incentives necessary to ensure participation in the projectproject
A4-1 - 43

3. Economic Assessment vs Financial Assessment4
•• Financial assessment: Financial assessment: estimating the profits (revenue minus expenditures) accruing estimating the profits (revenue minus expenditures) accruing to project owner (implementing/operating to project owner (implementing/operating agencies/companies)agencies/companies)
•• Economic assessment: Economic assessment: estimating the effects of the project on the national economyestimating the effects of the project on the national economy
3. Economic Assessment vs Financial Assessment5
•• Financial assessment: subject is the project owner (or Financial assessment: subject is the project owner (or investors)investors)costscosts = money that goes out of his wallet= money that goes out of his walletbenefitsbenefits = money that comes into his wallet= money that comes into his wallet
•• Economic assessment: subject is the nation/societyEconomic assessment: subject is the nation/societycostscosts = value that is consumed within the society= value that is consumed within the societybenefitsbenefits = value that is generated within the society= value that is generated within the society
A4-1 - 44

3. Economic Assessment vs Financial Assessment6
•• Financial assessment: subject is project owner (investors)Financial assessment: subject is project owner (investors)ex. Taxex. Tax
= the cost that the investor has to pay= the cost that the investor has to pay= the money that he lost= the money that he lost
•• Economic assessment: subject is the nation/societyEconomic assessment: subject is the nation/societyTaxTax
= the money that is transferred within the society = the money that is transferred within the society (between the investor and the government)(between the investor and the government)
= no cost to the society= no cost to the society
3. Economic Assessment vs Financial Assessment7
•• Financial assessment: subject is project owner (investors)Financial assessment: subject is project owner (investors)ex. Sales of Electricityex. Sales of Electricity
= the money that the investor has gained= the money that the investor has gained= the money that the users paid= the money that the users paid
•• Economic assessment: subject is the nation/societyEconomic assessment: subject is the nation/societySales of ElectricitySales of Electricity
= the money that is transferred within the society = the money that is transferred within the society (between the investor and the users)(between the investor and the users)
= no cost to the society= no cost to the society
A4-1 - 45

3. Economic Assessment vs Financial Assessment8
•• Economic Value of Solar PowerEconomic Value of Solar Power•• Economic Value of Solar PowerEconomic Value of Solar Power= Electricity + = Electricity + lower Carbon Dioxide Emission lower Carbon Dioxide Emission
Mechanism such as - CDM, - Carbon Credit Market, etc.
Additional Income Additional Income (Financial Value)(Financial Value)
4. Procedure of Financial Assessment of Project9
•• Identify projectIdentify project
•• Define services to be provided by the projectDefine services to be provided by the project
•• Find demand and prices for the servicesFind demand and prices for the services
•• Design physical and organizational components of the projectDesign physical and organizational components of the project
•• Schedule construction and operation and maintenance of the projectSchedule construction and operation and maintenance of the project
•• Estimate project costs in financial terms with the level of detail required Estimate project costs in financial terms with the level of detail required for financial analysis.for financial analysis.
•• Define financial resources (own fund, equities, loans, etc.) available and Define financial resources (own fund, equities, loans, etc.) available and their conditionstheir conditions
•• Calculate streams of expenditures and incomes Calculate streams of expenditures and incomes
•• Calculate indicators of financial viabilitiesCalculate indicators of financial viabilities
A4-1 - 46

5. Elements of costs and benefits to be considered10
•• COST (= loss for the project owner)COST (= loss for the project owner)
a) Investment Costs (initial costs, capital costs)a) Investment Costs (initial costs, capital costs)
•• purchase of landpurchase of land • procurement of equipment• procurement of equipment
•• civil workscivil works • electrical works• electrical works
•• mechanical worksmechanical works
•• engineering and other professional servicesengineering and other professional servicesg g p fg g p f
•• startstart--up costsup costs • vehicles and equipment• vehicles and equipment
•• laborlabor • others• others
•• taxes and dutiestaxes and duties
5. Elements of costs and benefits to be considered11
b) Recurrent Costsb) Recurrent Costs
•• COSTCOST))
• operation and maintenance costs (salaries of OM staff, fuel, consumables)• operation and maintenance costs (salaries of OM staff, fuel, consumables)
• replacement costs of worn• replacement costs of worn--out partsout parts
• others• others
c) Financial chargesc) Financial charges) g) g
• bank charges, interest during construction• bank charges, interest during construction
d) Income taxd) Income tax
e) Contingencies (for budgetary purpose)e) Contingencies (for budgetary purpose)
• provisions for uncertainties • provisions for uncertainties
A4-1 - 47
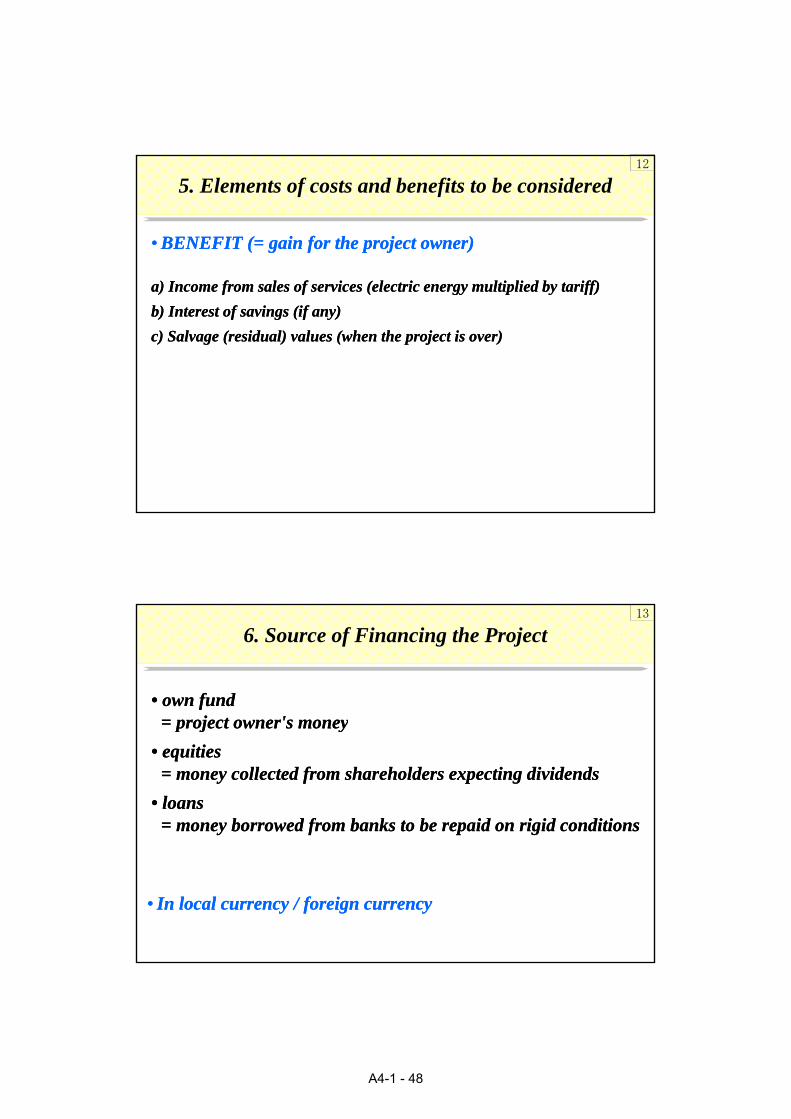
5. Elements of costs and benefits to be considered12
•• BENEFIT (= gain for the project owner)BENEFIT (= gain for the project owner)
a) Income from sales of services (electric energy multiplied by tariff)a) Income from sales of services (electric energy multiplied by tariff)
b) Interest of savings (if any)b) Interest of savings (if any)
c) Salvage (residual) values (when the project is over)c) Salvage (residual) values (when the project is over)
6. Source of Financing the Project13
• own fund • own fund = project owner's money= project owner's money= project owner s money= project owner s money
• equities • equities = money collected from shareholders expecting dividends= money collected from shareholders expecting dividends
• loans • loans = money borrowed from banks to be repaid on rigid conditions= money borrowed from banks to be repaid on rigid conditions
•• In local currency / foreign currencyIn local currency / foreign currency
A4-1 - 48
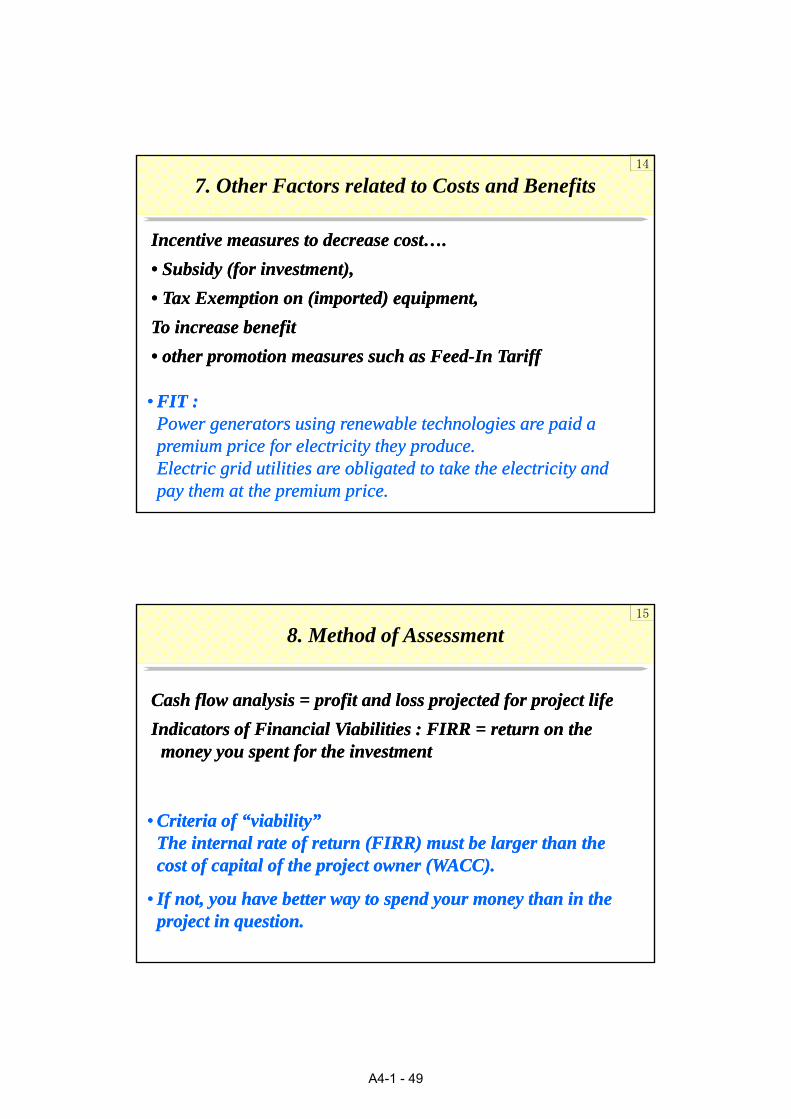
7. Other Factors related to Costs and Benefits14
Incentive measures to decrease cost….Incentive measures to decrease cost….
• Subsidy (for investment),• Subsidy (for investment), Subsidy (for investment), Subsidy (for investment),
• Tax Exemption on (imported) equipment, • Tax Exemption on (imported) equipment,
To increase benefitTo increase benefit
• other promotion measures such as Feed• other promotion measures such as Feed--In TariffIn Tariff
•• FIT : FIT : Power generators using renewable technologies are paid a Power generators using renewable technologies are paid a premium price for electricity they produce. premium price for electricity they produce. Electric grid utilities are obligated to take the electricity and Electric grid utilities are obligated to take the electricity and pay them at the premium price.pay them at the premium price.
8. Method of Assessment15
Cash flow analysis = profit and loss projected for project lifeCash flow analysis = profit and loss projected for project life
I di f Fi i l Vi bili i FIRR hI di f Fi i l Vi bili i FIRR hIndicators of Financial Viabilities : FIRR = return on the Indicators of Financial Viabilities : FIRR = return on the money you spent for the investmentmoney you spent for the investment
•• Criteria of “viability”Criteria of “viability”The internal rate of return (FIRR) must be larger than theThe internal rate of return (FIRR) must be larger than theThe internal rate of return (FIRR) must be larger than the The internal rate of return (FIRR) must be larger than the cost of capital of the project owner (WACC).cost of capital of the project owner (WACC).
•• If not, you have better way to spend your money than in the If not, you have better way to spend your money than in the project in question.project in question.
A4-1 - 49

8. Method of Assessment16
Other indicators, such as Other indicators, such as DSCR (Debt Service Coverage Ratio) DSCR (Debt Service Coverage Ratio) = surplus of the year divided by repayment obligation of the = surplus of the year divided by repayment obligation of the yearyear
•• Must be larger than one, typically required to be larger than Must be larger than one, typically required to be larger than 1 4 to 1 61 4 to 1 61.4 to 1.61.4 to 1.6
8. Method of Assessment17
Sample of Cashflow AnalysisSample of Cashflow Analysis
unit 2012 2013 2014 2015 2016 2017 2018 2019 2020 2021 2022 2023 2024 2025 2026 2027
Investment M.US$ -57.40 -62.80 0.00 0.00 0.00 0 0 0 0 0 0 0 0 0 0 0
Gross Generation GWh 0.00 0.00 0.00 659.40 659.40 659.4 659.4 659.4 659.4 659.4 659.4 659.4 659.4 659.4 659.4 659.4
Salable Energy GWh 0.00 0.00 0.00 587.50 587.50 587.5 587.5 587.5 587.5 587.5 587.5 587.5 587.5 587.5 587.5 587.5
Power Tariff c/kWh 8.26 8.35 8.43 8.51 8.60 8.684 8.771 8.859 8.947 9.037 9.127 9.219 9.311 9.404 9.498 9.593
Sales Revenue M.US$ 0.00 0.00 0.00 50.00 50.50 51 51.5 52 52.6 53.1 53.6 54.2 54.7 55.2 55.8 56.4
Fuel Cost M.US$ 0.00 0.00 0.00 -37.20 -37.20 -37.2 -37.2 -37.2 -37.2 -37.2 -37.2 -37.2 -37.2 -37.2 -37.2 -37.2
Fixed O/M Cost M.US$ 0.00 0.00 0.00 -0.68 -0.68 -0.68 -0.68 -0.68 -0.68 -0.68 -0.68 -0.68 -0.68 -0.68 -0.68 -0.68
Variable O/M Cost M.US$ 0.00 0.00 0.00 -1.00 -1.00 -1 -1 -1 -1 -1 -1 -1 -1 -1 -1 -1
Earning after operation M.US$ 0.00 0.00 0.00 11.12 11.62 12.12 12.62 13.12 13.72 14.22 14.72 15.32 15.82 16.32 16.92 17.52
Depreciation M.US$ 0.00 0.00 0.00 -6.10 -6.10 -6.1 -6.1 -6.1 -6.1 -6.1 -6.1 -6.1 -6.1 -6.1 -6.1 -6.1
Interest Payment M.US$ 0.00 0.00 0.00 -2.00 -2.00 -2 -2 -2 -2 -2 -1.9 -1.8 -1.8 -1.7 -1.6 -1.6
Principal Repayment M.US$ 0.00 0.00 0.00 0.00 0.00 0 0 0 0 3.4 3.4 3.4 3.4 3.4 3.4 3.4
Earning before Tax M.US$ 0.00 0.00 0.00 3.02 3.52 4.02 4.52 5.02 5.62 6.12 6.72 7.42 7.92 8.52 9.22 9.82
Corporative Income Tax M.US$ 0.0 0.0 0.0 -2.2 -2.3 -2.4 -2.5 -2.6 -2.7 -2.8 -2.9 -3.1 -3.2 -3.3 -3.4 -3.5
Project Cash flow M.US$ -57.4 -62.8 0.0 8.9 9.3 9.7 10.1 10.5 11.0 11.4 11.8 12.2 12.6 13.0 13.5 14.0
A4-1 - 50

9. Uncertainty = Risks and Sensitivity Analysis18
•• Project variablesProject variablesDemand (volume, price), Costs of inputs, construction, etcDemand (volume, price), Costs of inputs, construction, etc
"What if" analysis testing which variables are important to project "What if" analysis testing which variables are important to project outcomes (FIRR)outcomes (FIRR)
• applies to all projects with quantified benefits and costs• applies to all projects with quantified benefits and costs
• involves recalculating project outcomes (FIRR) for different values • involves recalculating project outcomes (FIRR) for different values of major variables and combinations of variablesof major variables and combinations of variables
• when benefits are not valued, may use sensitivity analysis to assess • when benefits are not valued, may use sensitivity analysis to assess impact of changed assumptions on unit costs onlyimpact of changed assumptions on unit costs only
19
THETHE ENDEND
A4-1 - 51

Renewable Energy Development Appendix 4 : Presentation Materials Final Report Appendix 4-2 : Interim Workshop
APPENDIX 4-2 : INTERIM WORKSHOP 1) Interim Progress Made, Results and Existing Issues
2) PV Industry’s Trend and Market Prospective in China
3) Design of Large Scale Integrated PV Plants in Qinghai Province Evaluation of PV System in Golmud
4) Financial Study of PV Development
5) Grid Protection and Low Voltage Ride Through Technology in Japan
6) Inverter Technology in China

Interim Progress made, results and
1Workshop in Xinning, Qinghai province, China
Interim Progress made, results and existing issues
December 7, 2011
R bl E D l t i Qi h iRenewable Energy Development in Qinghai, People’s Republic of China
Project Director Yukao Tanaka
NorthPV site in Golmud will be one of the most suitable
l f PV ti
2Estimation of PV site in Golmud
WestEast
place for PV generation system.
There is no obstacles to obstruct the sun shine.
South Golmud is highland, and seems to have little rain.
A4-2 - 1

10 MW PV system consists of 10×1MW systems- From the view point of reliability and O&M as well
3Estimation of PV system design
p y
[Less impact on power system in case of accident]
Each equipment is specified in detail.
Grid system is constructed for large scale of PV systems
Lightning protection system will be installed as a best design.g g p y g
Some specifications seems to be penetrated into detail. Transformer capacity is lager than PV array capacity.
Islanding protective function is installed in each inverter.
Some protection seems necessary on DC side for safety.
Insolation sensor
Each sensor’s tilt angle
4Proposal to observe insolation
25°, 30°, 35°
PV arrays will be installed having tilt angle as the same as latitude of Golmud
This method will count on direct sun light mainly.
PV system generates power not only direct light but also diffusion light.
Diffusion light intensity will be larger in smaller tilt angle.
It will be worth to measure insolation by different tilt angle to generate more power.
A4-2 - 2

Haixi Grid 110kV Lines or Substation
a. 110 kV Transition lines
b 110 kV S b i
5Owner, Construction and Operation Scheme
110 kV Substation
(110/35kV Transformer)
b. 110 kV Substation
PV1 PV2 PV3 PV4 PV5 PV6
c. 35 kV Transition lines
d. PV power plant
Six (6) PV companies
Equipment Owner Construction Operationa. 110 kV Transition lines Power Grid Company Power Grid Company Power Grid Companyb. 110 kV Substation Six (6) PV companies Power Grid Company *1 Power Grid Company *1c. 35 kV Transition lines Six (6) PV companies Six (6) PV companies Six (6) PV companiesd. PV power plant Six (6) PV companies Six (6) PV companies Six (6) PV companies
*1: Six (6) PV companies entrust construction work and operation of the substation to the grid power company.
North
-110kV Line x 2Feeders
-110/35kV, 63MVA Transformer x 2 units
-35kV Income Line x 8 Feeders
110kV 10MV SVC 2 i
6Outline of 110/35kV Substation
Distant View of 110kV Substation
35kV Lines
110kV Lines
From Baika SPFrom Guodian NED
-110kV, 10MVar SVC x 2 units
35kV Side of The Substation
35kV Outdoor Type Switchgears (Total :17 Bays)
A4-2 - 3

Generated Power by PV and other power plants is transmitted to Tibet and East area through DC 400kV and AC 750kV System
7Outline of 110/35kV Substation
-110kV, 10MVar SVC x 2 units
AC 750kV Lines
Direction : East (Wulan - Riyue, Qinghai) DC 400kV Area
AC 750kV Area
Distant View of AC 750kV & DC 400kV Stations (from North side)(undrer constructing)
AC 750kV Area
The following technical maters are concerned and studied by Gird company to keep stability of the grid and to enhance the development of clear energy.
8Information on the Electric Grid
- Fault Ride Through (FRT) function on inverter(This function will be required by grid company to the PV power plant in future)
- Harmonic distortion caused by PV power plants
To submit generation power forecast of the PV power plants(It will be required to plan dispatch operation in future)
- Grid control/protection and peak shift
Especially, grid company has a deep interest in FRT function
A4-2 - 4

Brightness Engineering’s Feasibility Study (10MW F/S) i l di t ti t d
9Financial Study — Framework
(10MW-preF/S), including cost estimates and financial analysis,
NDRC’s Instruction to PV Concession Bidders
Qinghai Government’s Invitationoffering power purchase at ¥1.15 /kWh for PV operators started generation by E/2011
- For Base case, Project is just good enough with financial return
(FIRR) slightly over the requirement (WACC)
10Financial Study - Results & Sensitivity Analysis
(FIRR) slightly over the requirement (WACC)
- Project is vulnerable to adverse conditions; initial cost overrun, lower
benefit, faster deterioration of output(equipment), etc.
Extending operation period (20→25yrs) improves FIRR:Extending operation period (20→25yrs) improves FIRR:
-25yr Project achieves FIRR>WACC under various conditions
25yr Project may be more susceptible to problems arise in the long run:
-equipment problems, policy change, etc.
A4-2 - 5

- Pre-FS level 10MW Pilot Project can be financially viable at
power purchase rate ¥1.15 / kWh, but vulnerable to adverse
2Financial Study — Tentative Conclusions
conditions. (Would like to discuss more in Final Report)
- PV Power Station is a capital-intensive project with low O&M
costs → Extending operation period is effective.What will happen to PV equipment in the long term?
What do we do about the purchase rate ¥1.15 / kWh ?
- Social Benefit of PV Electricity (CO2 reduction only) =
¥0.068 /kWh, less than 1/10 of its cost ¥0.8 /kWh
The gap can be, and will be closer in the future.
11PV Technology in Japan- for Reference -
Current Status of Photovoltaic Power Generation
Technology Development in Japanp
A4-2 - 6

12NEDO PV2030+ Roadmap(Introduction of Inexpensive PV System)
Pow
e
Advancing technology development assuming
the period of mass-production
¥30/kWh
~¥50/kWh
Target period (Completion of development)
2010 or later 2020 (2017) 2030 (2025) 2050
er generation cost
Establishing the mass-production system of crystal
silicon, thin silicon, CSS system and other materials, and improving their quality
Achieving high performance and low cost by introducing the
next generation technology
Improving the grid performance by introducing ultra-thin, multi-junction or hetero-junction cells
¥14/kWh
PV power generation cost level by introducing cadmium tellurium cell: approx $1/1W cell (equal to ¥6/kWh in 10 years)
¥7/kWhTechnology innovation
for introducing advanced performance, such as new materials
Introducing super-efficient (improved by 40%) PV cells
Accommodating various applications while coexisting with
conventional large size cells
¥7/kWhPV cells made of new material and of new structure
¥23/kWh
Generation costEquivalent to home electric
power (¥23/kWh)Equivalent to office electric
power (¥14/kWh)Equivalent to industrial electric power (¥7/kWh)
Utilization as general-purpose electricity ¥7/kWH or less)
Module conversion efficiency (research level)
Practical module: 16%
(Research cell: 20%)
Practical module: 20%
(Research cell: 250%)
Practical module: 25%
(Research cell: 30%)Super efficient module: 40%
For domestic market (GW/year) 0.5~1 2~3 6~12 25~35
For overseas market (GW/year) ~1 ~3 30~35 ~300
Principal use Houses, public facilitiesHouses, apartments, public
facilities, offices
Houses, apartments, public facilities, private sector
business, electric vehicles, etc.
Commercial purpose, industrial use, for transportation, agriculture, and
independent power source
Mass Introduction of New Energy Dispersed Power Sources and Smart Grid Concept
• Fusion between power system and information technologyBackground
・Diversification of electricity market
・Mass introduction of new energy dispersed power sources, such as PV
13
Electric power system in Japan
Before 2000Development of power system interconnection technologies on an assumption of introducing new energy on a single-unit basis
2000~2010Research and demonstration of power system interconnection technologies for mass new energy p y g gyon a multiple-unit basis
2010 and laterDemonstration of smart community incorporating needs of social system
A4-2 - 7
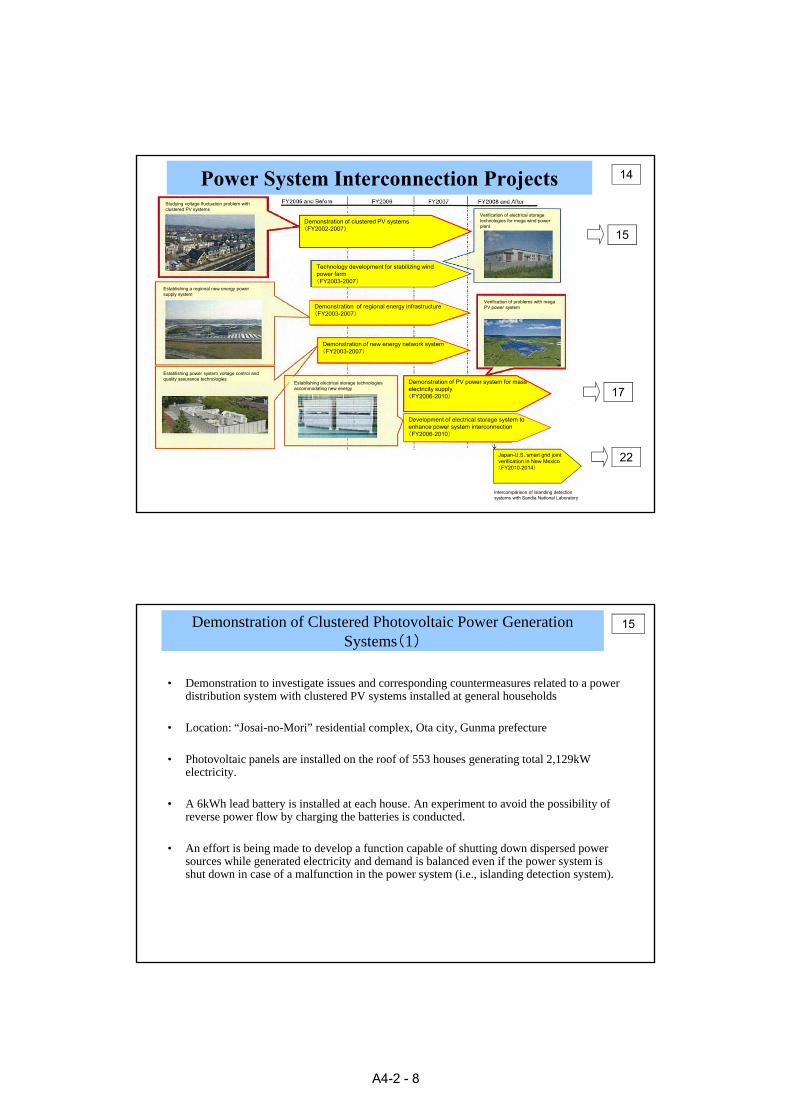
14
15
Power System Interconnection ProjectsStudying voltage fluctuation problem with clustered PV systems
Demonstration of clustered PV systems (FY2002-2007)
Technology development for stabilizing wind power farm
Verification of electrical storage technologies for mega wind power plant
17
Establishing a regional new energy power supply system
Establishing power system voltage control and quality assurance technologies
power farm (FY2003-2007)
Demonstration of regional energy infrastructure (FY2003-2007)
Demonstration of new energy network system (FY2003-2007)
Verification of problems with mega PV power system
Establishing electrical storage technologies accommodating new energy
Demonstration of PV power system for mass electricity supply ( ) 17
22
(FY2006-2010)
Development of electrical storage system to enhance power system interconnection (FY2006-2010)
Japan-U.S. smart grid joint verification in New Mexico (FY2010-2014)
Intercomparison of islanding detection systems with Sandia National Laboratory
Demonstration of Clustered Photovoltaic Power Generation Systems(1)
• Demonstration to investigate issues and corresponding countermeasures related to a power distribution system with clustered PV systems installed at general households
L i “J i M i” id i l l O i G f
15
• Location: “Josai-no-Mori” residential complex, Ota city, Gunma prefecture
• Photovoltaic panels are installed on the roof of 553 houses generating total 2,129kW electricity.
• A 6kWh lead battery is installed at each house. An experiment to avoid the possibility of reverse power flow by charging the batteries is conducted.
• An effort is being made to develop a function capable of shutting down dispersed power sources while generated electricity and demand is balanced even if the power system is shut down in case of a malfunction in the power system (i.e., islanding detection system).
A4-2 - 8

16Demonstration of Clustered Photovoltaic Power Generation Systems(2)
Ota city “Josai-no-Mori” residential area
Islanding detection system in the initial stage of development
PCS for PV PCS for battery
Advanced islanding detection system
Atomic clack
External battery box installed at each house
BatteryIslanding detection system
17Demonstration for Stabilized PV Power System for Mega Power Supply
For the verification of the measures to be taken in connecting PV system of a megawatt class to a special high voltage power system.
① Wakkanai city, Hokkaido・A solar power generation plant with an approx. 5MW capacity is connected to a 33kV transmission liline.
・A 1.5MW NAS battery is installed to control the voltage fluctuation caused by power fluctuation.
Verify the possibility of planned power operation to achieve stabilized PV power output and power system accommodating peak power output.
② Hokuto city, Yamanashi prefecture・Solar power generation plant with an approx 2MW capacity is constructed.Trial operation is being conducted by introducing various types of PV modules mainly・Trial operation is being conducted by introducing various types of PV modules mainly consisting of advanced PV cells.
Technology development and demonstration for introduction of mega PV power generation and cost reduction→The power conditioning system has a fault ride through function.
A4-2 - 9

18Demonstration of Stabilized PV Power System for Mega Electricity Supply
Wakkanai site
Wakkanai City Hokuto City
Plant capacity Approx. 5MW Approx. 2MW
Module type 10 types of modules mainly consisting of crystal system cells
26 types of modules mainly consisting of advanced cells (including 2 types of tracking cells)
P t N S b tt 1 5MW 11 8MWh
Hokuto site
Power storage system
NaS battery: 1.5MW-11.8MWh -
Power conditioning system
250kW (commercial type)
Introducing a large PCS with a 1000MW capacity
400kW (newly developed PC: reactive power compensation, fault ride through function, harmonic power control function)
Power system interconnection
33kV transmission line 66kV transmission line
Projection of power generation
Based on solar radiation prediction
The terms beginning with “Smart”
• Smart gridThe smart grid is an interconnected system of electricity generation by introducing instrumentation
and control based on information and communication technologies. Generally, it means making the system between a utility’s power generation plant and a customer’s meter “smart”. It may include the
19Situation of Smart Grid Technology Demonstration in Japan
demand side management, electric vehicle battery charging and control of customer’s PV system from the utility.
• Smart communityThe smart community covers a wide range of public infrastructures including heat supply, water
supply and sewerage system, transportation, communication system as well as electricity. The community means a specified range of area.
• Smart cityThe smart city has a similar meaning to the smart community. The smart city is a sort of smart y g y y
community as a unit of municipality.
• Smart societyThe smart society is an extended concept of smart community. As it applies to a wide range, various
types of technologies in different generations will co-exist in the smart society.
A4-2 - 10

20Concept of Smart Grid
21Overseas NEDO Projects for Photovoltaic Power Generation and Smart Grid
EuropeLyon, France
Malaga Spain (already Chi
8
Malaga, Spain (already adopted)
Germany and UK: under investigation
ChinaGongqīngcheng : under public
invitationYanqing, Beijing : basic survey
Middle East and IndiaDelhi, Mumbai: feasibility study
Turk: basic survey adopted
U.S.New Mexico: under progress
Hawaii: adopted
Turk: basic survey adoptedMorocco: basic survey Southeast Asia
Indonesia: basic surveyVietnam, Malaysia: mission dispatched
A4-2 - 11
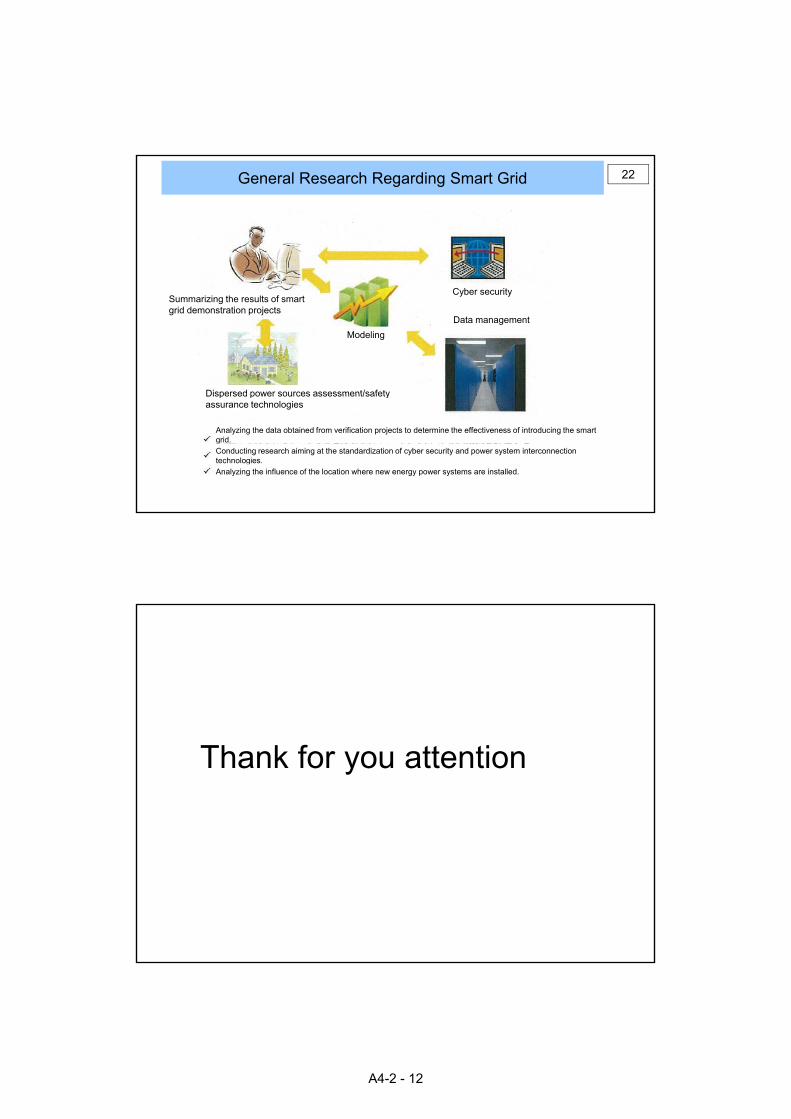
22General Research Regarding Smart Grid
Summarizing the results of smart grid demonstration projects
Cyber security
Data management
Modeling
Dispersed power sources assessment/safety
Analyzing the data obtained from verification projects to determine the effectiveness of introducing the smart grid.
Dispersed power sources assessment/safety assurance technologies
Conducting research aiming at the standardization of cyber security and power system interconnection technologies.
Analyzing the influence of the location where new energy power systems are installed.
Thank for you attention
A4-2 - 12

PV Industry’s Trend and Market Prospective in China
China Photovoltaic Societyy
Wu Dacheng
07/12/2011 QINGHAI
ContentsContents
1. Development of China's PV products manufacturing
2. China's PV incentives
3. PV market development in China3. PV market development in China
A4-2 - 13

1 Development of China's PV products1. Development of China s PV products
manufacturing
The status of crystalline silicon industry chain
Multi-crystal silicon
Solar wafer Solar cells PV modules power generation system
中国晶体硅光伏产业链发展尚不平衡,呈两端小、中间大
Manufacturing equipment Auxiliary material Balance material
A4-2 - 14

pro
du
c
The manufacturing capacity of PV products expanded quickly
Polysilicon
ctio
n cap
acity of 2011 p
rod
uct
Polysilicon
PV Modules
SolarBattery
Solar Wafer
China
Asia
%
tion
capacity o
f 2009
0 20 40 60 80 100
PV Modules
SolarBattery
Solar WaferGlobal
The investments of large enterprise tend to the both ends of industry chain
Industry Chain: Main Products Secondary Products Manufacturing
Company Polysilicon Ingots wafer Battery Module Power System
Yingli
Suntech
Trina
LDK
Hanwha
Jinko
CSI
DAQO
GCL
Renesola
JA SOLAR
CSUN
A4-2 - 15

The output of Solar cell production is high but the domestic installation is low in China
YearYear
Shipments (MWp)Shipments (MWp)
ExportExport
Installed capacityInstalled capacity
Export proportionExport proportion
Domestic InstallationDomestic Installation
Domestic ExportDomestic Export
49%of global shipments in 2010
49%of global shipments in 2010
2.8%of global installation in 2010
2.8%of global installation in 2010
The main features of the Chinese PV industry
PV module production accounts for about 50% of global PV market and the market continues to expanding but the volumes is small compared to the world.
The investment in photovoltaic module and solar cells maintain boom and the solar design capacity is more than 20GW at the end of 2011.
Equipment manufacturing, auxiliary materials localization and new thin-film battery production have made great progress.
Chinese manufacturer of photovoltaic products was affected by the turbulent ofEuropean PV market. Price reduction demand is transferred to the upstream of i d t h iindustry chain.
Large-scale PV market began to start.
A4-2 - 16

Sunrise industry attracted substantial investment
Applications market rose less than expected
Capacity expansion is greater than the market growth rate
The contradiction between the volatility of Market expansion and productivity growth
Demands of the price reduction make the profit of industry chain reduced
Significant fluctuations of profit margins in industry chain
20%
30%
40%
50%
ss Margin %
2011 Margin Stack
0%
10%
Polysilico
n
Wafer Cell
Mod
ule
Inverte
r
BoS
EPC/De
velope
r
Integrated
Gro s
摘自isuppli的2011年10月3日市场研究报告
2、China's PV incentives
A4-2 - 17

China's PV incentives
Incentives Methods and Characteristics The Instance Result and Problem
Policies in "China's Renewable
Development planning, implementation of administrative licensing, Internet agreements
Franchise biddingLocal development of the electricity price
Good evaluation on Investment return project operation, capital efficiency and
Energy Law"
China Feed-In-Tariff (FIT)
g, gsigned with the grid, price difference subsidies according to the actual acquisition of power company
y pNational benchmark price
p , p ythe actual effect
the project is relatively small, the financial subsidies is limited
The initial investment subsidies
one-time subsidies In the construction; provided the investor with capital subsidy that doesn’t exceed 50% of initial investment
"Golden Sun Demonstration Project"
"BIPVDemonstration
P j t"
A great promotion to the demonstration of distributed power generation. But the quality and long-term power generation effectiveness is difficult to assess There areProject" difficult to assess. There are policy barriers to grid access.
purchase subsidy in Commercial marketing
Photovoltaic products manufacturing enterprises, international organizations, donor agencies and government departments to provide partial funding for the purchase
World Bank / GEF REDP projectNetherlands' Silk Road Bright Project "Electricity Supportingprojects
Solve more than one million families’ electricity supplying living in remote areas without power. But there is no continuous policy
Province Year Price (RMB元/kWh) Installation capacity target
Remark
Ground Roof BIPV
Franchise price 2007-2008 4.0 Shanghai, Inner Mongolia and Ningxia
Jiangsu 2009 2 15 3 7 4 3 400MWp
The status of China PV power tariff
Jiangsu 2009 2.15 3.7 4.3 400MWp
2010 1.7 3 3.5
2011 1.4 2.4 2.9
Zhejiang 2010 1.16 50MWp
2011-2012 1.43
Shangdong 2010 1.7 10/Wp 150MWp
2011 1.4
2012 1.2
Ningxia 2009-2010 1.15 50MWp Franchise price
Qinghai 2011 1 15 Under Plan to finish on 2011 09 30Qinghai 2011 1.15 Under construction 900MWp
Plan to finish on 2011.09.30 (Plan to Finish before 2011.12.31)
Franchise bidding1 2009 1.0928 20MWp Dunhuang in Gansu Province
Franchise bidding 2 2010 0.7288-0.9791 13 projects in Gansu, Ningxia and Qinghai province total in 280MWp
National benchmarking price
2011 1.15 Approved before 2011.07. 01 and finished on12.31
2012 1.0 Tibet price:1.15 RMB/kWh
A4-2 - 18

China photovoltaic system initial investment subsidies
Year 2009 2010 2011
Project Number Installed capacity
(MWp)
Number Installed capacity
(MWp)
Number Installed capacity
(MWp)
BIPV Demonstration
Project
111 90 99 90 118 110
Project
Golden Sun Demonstration Project
236 578 272 600
三年共约1.74GWp
PV installed capacity of China and policy implications
2500
3000
当年装机(MWp) 累计装机(MWp)Annual Installed capacity (MWp)
Annual Installed capacity (MWp)
Accumulated Installed capacity (MWp)
Accumulated Installed capacity (MWp)
1000
1500
2000
Golden Sun
demonstrationfranchise biding
China Renewable
Send Electricity to the Village project implementation
After the Benchmarking electricity price
Technology
Chinese PV market Inspired by the evolving policy!
0
500
2000 2001 2002 2003 2004 2005 2006 2007 2008 2009 2010 2011E
China Renewable
Energy LawimplementationTechnology
Projects and International
support
A4-2 - 19

3 PV market development in China3. PV market development in China
The Solar Market will Reach 23.8GW in 2011
By iSuppli
A4-2 - 20

Installed capacity in Europe will decline in 2012?
Analysis and forecasting according to iSuppli
China PV Grid Parity Analysis
1.4
1.6
Commercial and industrial electricity
parity in 2014
1.5元/kWh
↓8%
人民币元/kWh
0.4
0.6
0.8
1
1.2parity in 2014
Residential consumption
electricity parity by 2018
Sales of electricity to
the grid parity in 2021
0.81元/kWh
↑6%
0.54元/kWh
0.34元
0
0.2
2009 2010 2011 2012 2013 2014 2015 2016 2017 2018 2019 2020 2021 2022 2023
PV平均上网电价 常规发电上网电价 生活用平均电价 工商业平均电价
the grid parity in 20210.34元/kWh
According to China PV Grid Parity Roadmap
Conventional power
average price
Conventional power
average price
PV on-grid power average tariffs
PV on-grid power average tariffs
Residential power average
price
Residential power average
price
Industrial power average
price
Industrial power average
price
A4-2 - 21
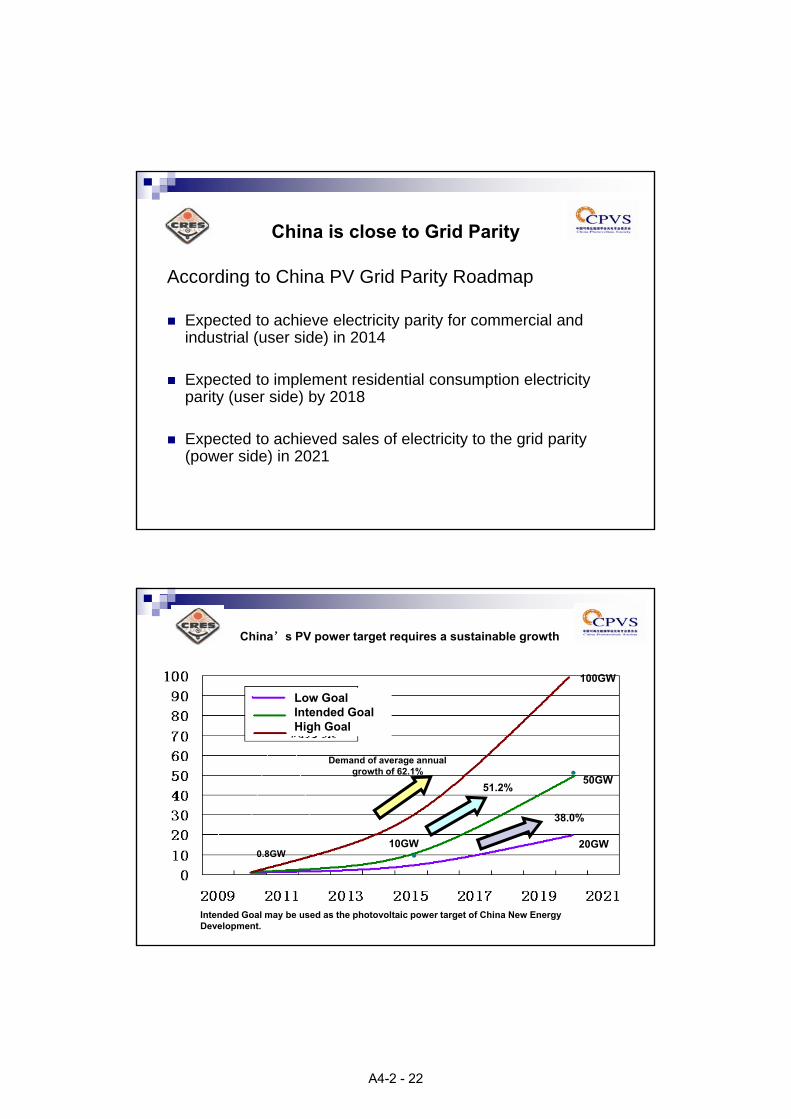
China is close to Grid Parity
According to China PV Grid Parity Roadmap
Expected to achieve electricity parity for commercial and industrial (user side) in 2014
Expected to implement residential consumption electricity parity (user side) by 2018
Expected to achieved sales of electricity to the grid parity (power side) in 2021
China’s PV power target requires a sustainable growth
GWp
100GW
Low Goal
Demand of average annual growth of 62.1%
51.2%
38.0%
50GW
Intended Goal High Goal
0.8GW20GW10GW
Intended Goal may be used as the photovoltaic power target of China New Energy Development.
A4-2 - 22

The photovoltaic market trend of China
The growth of China solar power will mainly be affected by policy and
subsidies The large-scale PV power plants onshore will develop rapidly after the introduction
of benchmark on-grid tariff.
Distributed power generation will take the lead in "grid parity" although it’s difficult to achieve the feed-in tariff tentatively.
China's PV market has great potential, but there are huge disparity compared with Europe, America, Japan and other developed countries.
The development of solar industry will stimulate both the commercial market and the projects with national capital subsidy. With the narrow of price difference, China PV system installation in next five years is expected to be more than the total above the target .
Thank You!
wu dacheng@163 [email protected]
A4-2 - 23

Design of Large Scale Integrated PV Plants in Qinghai Province Evaluation
fof PV System in Golmud
December 7, 2011
Renewable Energy Development in Qinghai,gy p Q g ,
People’s Republic of China
Project Engineer
Takashi Nakazawa
1. Golmud site visit and investigation
• Site visit of PV power site and several investigation is done.
• Surrounding of PV site seems vest place for PV generation.
• If there is something to worry about it will be sand and there• If there is something to worry about, it will be sand and there needs some maintenance.
• Site picture taken by digital camera mounted fish eye lens, to estimate sun orbit and surroundings.
• Large scale of PV system needs large capacity of transmission line to grid connect and substation transformer, so those location and of grid connected point are investigatedand of grid connected point are investigated.
A4-2 - 24

1-1 Golmud site still picture
tower
There is a tower
which distancetower which distance
will be over 100m.
And there is
mountains far
Away, from PV
sitesite.
Picture was taken at south-west corner of site.
2011/07/12
1-2 Picture taken through fish eye lens
• Picture was taken using fish eye lens which direction is south and tilt angle is 35 degree.
This picture is rated as the sight from PV modules. Direct light from the sun and diffusion light to PV modules can be seen.
2011/07/16
White-tinged seems to be origin of diffusion light.
A4-2 - 25

1-3 Solar orbit
Solar orbit at PV site is shown as left figure.
Day length in winter, spring and summer are 8, 12, 12 hours.
In summer day length is 14 hours or so, but sunrise and sunset time direct light from the sun will irradiate backside of module because of its tilt angle.
Sun is under horizon.
1-4 (1) Estimation of Golmud site
Golmud site is vest place for a aspect of irradiation. There is nothing to obstacle sun light over all season..
When many arrays are y yinstalled this part will be projected back side of PV arrays.
A4-2 - 26

1-4 (2) Estimation of Golmud site
• Golmud site might be one of the best place for PV generation.
• Power supply by PV system is effective power• Power supply by PV system is effective power only. Although AC circuit needs reactive power to stabilize circuit, SVC in substation is to supply or absorb reactive power by electric utility company control. This concept is very good.
• After completion of every PV site, problem of sand will be conquered.
1-5 Diffusion light and tilt angle
Direct light
Diffusion light
Tilt angle=latitude
Tilt angle<latitude
A4-2 - 27

Solid angle of sky by the difference of tilt angle
Tilt angle : 35°Solid angle Tilt angle : 25°Solid angle
Pictures of difference of tilt angle are shown.
1-6 Cloud amount in Golmud
Lon 94< 10% @0 n/a n/a n/a 30.1 24 26.8 30.2 34.4 n/a n/a n/a n/a< 10% @3 28.7 16.8 12.7 21 19.3 24.7 27.1 31.6 31.8 26.2 33.4 26.6< 10% @6 18 14.4 12.1 17.2 14.6 14.5 18.4 27.1 29.5 29.4 29.5 27.2< 10% @9 12 8 03 6 3 9 55 10 4 15 6 16 1 24 1 25 20 8 27 1 18 4
Oct Nov Dec
Month ly Averaged Frequency Of Clear Skies At Indicated GMT Times (%)
Jan Feb Mar Apr May Jun Jul Aug Sep
< 10% @9 12 8.03 6.3 9.55 10.4 15.6 16.1 24.1 25 20.8 27.1 18.4< 10% @12 n/a n/a n/a n/a n/a n/a n/a n/a n/a n/a n/a n/a
Lon 9410 - 70% @0 n/a n/a n/a 30.6 29.3 19.7 20.9 22.6 n/a n/a n/a n/a10 - 70% @3 43.8 42.6 29.6 24 27.4 16.3 21.4 20.9 20 33.5 43.3 42.210 - 70% @6 44.1 36.1 26.5 20.3 19.3 18.9 18.7 21.4 22.8 34.3 42.1 39.110 - 70% @9 40.1 32.6 21.7 20.4 15.8 17.7 18.3 20.8 25.9 37.5 37.4 38.510 - 70% @12 n/a n/a n/a n/a n/a n/a n/a n/a n/a n/a n/a n/a
Sep Oct Nov DecMay Jun Jul AugJan Feb Mar Apr
Month ly Averaged Frequency Of Broken-cloud Skies At Indicated GMT Times (%)
Lon 94>= 70% @0 n/a n/a n/a 39.2 46.6 53.4 48.8 42.9 n/a n/a n/a n/a>= 70% @3 27.4 40.5 57.6 54.8 53.2 58.9 51.4 47.3 48.1 40.1 23.1 31>= 70% @6 37.8 49.3 61.2 62.4 65.9 66.5 62.7 51.4 47.5 36.2 28.3 33.5>= 70% @9 47.8 59.3 71.9 70 73.7 66.6 65.5 54.9 49 41.6 35.4 42.9>= 70% @12 n/a n/a n/a n/a n/a n/a n/a n/a n/a n/a n/a n/a
Oct Nov Dec
Monthly Averaged Frequency Of Near-overcast Skies At Indicated GMT Times (%)
Jan Feb Mar Apr May Jun Jul Aug Sep
A4-2 - 28

1-7 Diffusion light in Golmud
Cloud amount in Golmud is not so low according to NASAaccording to NASA data. Actually left picture shows much cloud in the sky. This seems tilt angle of PV array should b b tt t i t llbe better to install smaller than latitude.This is noting but oneassumption.
2011/07/12
1-8 Proposal to observe insolation
Insolation sensor
Each sensor’s tilt angle
25°, 30°, 35°
Sensors will be installed prevent the interference of others.
Observation is desirable to continue over one year.
A4-2 - 29

1-6 Generation by weather condition
Estimation of daily insolation by weather condition (kWh/m2・day)
Month 1 2 3 4 5 6 7 8 9 10 11 12Fine 12 18 12 61 13 06 12 34 11 42 10 79 11 08 11 9 12 72 12 8 12 19 11 98Fine 12.18 12.61 13.06 12.34 11.42 10.79 11.08 11.9 12.72 12.8 12.19 11.98
Cloudy 2.64 3.52 4.45 5.04 5.17 5.13 5.13 5.07 4.67 3.82 2.87 2.36Rainy 1.41 2.17 2.98 3.56 3.73 3.73 3.71 3.61 3.21 2.43 1.6 1.2
Estimation of daily generation by weather condition (kWh/day: 100kW base)
Month 1 2 3 4 5 6 7 8 9 10 11 12Fine 933 941 961 907 793 731 776 796 887 891 862 888
Cloudy 231 300 367 408 404 393 387 385 366 308 240 204Rainy 231 300 367 408 404 393 387 385 366 308 240 204
It is demonstrated to estimate daily insolation and AC generation by weather condition. This numeric value is not calculated by standard method. These data should be deal with tendency of insolation and generation.
1-9 Others
• Inspection of other site
Module Module
Wiring
Wiring between modules is not fixed and wobbles. In long time insulation of wiring or connecting terminal would be damaged.
A4-2 - 30

2. Design of PV system
• 10 MW PV system consists of 10×1MW systems. From the view point of reliability, when some trouble happens total PV system have a little impact on generation.
• Each equipment is specified in detail.
• Grid system is constructed for large scale of PV systems.
• Lightning protection system will be installed as a vest design.
• Some specifications seems to be penetrated into detail.
① Transformer capacity is lager than PV array capacity.
② Irelanding protective function is installed in each
inverter.
③ Some protection seems necessary on DC side for safety.
2-1 Lightning protection• External and internal lightning
LPZ 1
Lightning protection standard is authorized
100kA
LPZ 0 LPZ 1
LPZ 2LPZ 3
Home appl ianseWir ing Prec ision Inst rument
in IEC62305-1~4.
External lightning wave and internal lightning wave is defined.
Lightning protection
10μst(μs)
I(kA)
8/20μs
10/350μs
Fig. Test Wave
should be designed and executed as design.
A4-2 - 31

Lightning protection in PV system
• External and internal protection method
SPD
Protecting equipment from lightning surge is to equi-potentialize between equipment wiring and ground potential.
2-2 Transformer capacity• Energy conversion to AC electricity
100% ≒12%
Module Array Wiring PowerConditioner
GridConnection
IrradiationSpectrumTemperature
ConnectionLoss of PV Module
Wiring Loss Wiring LossInverter LossTransformer Loss
A4-2 - 32

2-2 (2)Transformer capacity
• AC generation by PV system might not so large.• Inverter does not convey over rated power continuously.• Transformer has some overloading ability.
From these consideration transformer capacity might be smaller than PV module capacity.
DC generation > Inverter output > Transformer capacity
Transformer life depends on its load factor, and transformerfor grid connected PV system will be less than 0.3. Transformer life time is considered over 20 years at load factor 1.0.
2-3 Irelanding protection
• Every power conditioner is to install irelanding detection.
It seems that one system will be enough, because among of irelanding detection function they might interfere each other.
Irelanding detection
Irelanding detection
Irelanding detection
Power conditioner
Power conditioner
Power conditioner
I. D.
Power conditioner
Power conditioner
Power conditioner
And that there is not necessary case, when active power and
reactive are not balance between supply and receive side.
A4-2 - 33

2-4 DC circuit protection
• Recent power conditioner will be designed to protect DC current flow into AC circuit.
Over current flows in transformer.
If someone touched another wire of
Over current
H
B
DC wiring
DC circuit, electric shock will happen.
DC OVGR or some protection function will be necessary.
A4-2 - 34

Financial Study of PV Developmentil j- A case of 10MW Pilot Project -
December 7, 2011
Renewable Energy Development in QinghaiRenewable Energy Development in Qinghai,
People’s Republic of China
Economist
Masaru NISHIDA
NEWJEC
Contents1
1. Purpose of Financial Study1. Purpose of Financial Studyp yp y
2. Method of Financial Analysis2. Method of Financial Analysis
3. Results and Sensitivity Analysis3. Results and Sensitivity Analysis
4. Lifecycle analysis and Cost effectiveness4. Lifecycle analysis and Cost effectiveness
5. Tentative Conclusions5. Tentative Conclusions
A4-2 - 35
1. Purpose of Financial Study
•• To show financial viability of a projectTo show financial viability of a project
2
•• To find a better use of money, to find the best, or better option To find a better use of money, to find the best, or better option from alternativesfrom alternatives
•• To identify necessary promotion measures, and potential project To identify necessary promotion measures, and potential project risks (Policy Maker’s Point of View)risks (Policy Maker’s Point of View)
It is applicable to “Revenue Generating Projects"It is applicable to “Revenue Generating Projects"
2. Method of Financial Analysis — Procedure3
•• Identify projectIdentify project
•• Define services to be provided by the projectDefine services to be provided by the project
•• Find demand and prices for the servicesFind demand and prices for the services
•• Design physical and organizational components of the projectDesign physical and organizational components of the project
•• Schedule construction and operation and maintenance of the projectSchedule construction and operation and maintenance of the project
•• Estimate project costs in financial terms with the level of detail required Estimate project costs in financial terms with the level of detail required for financial analysis.for financial analysis.
•• Define financial resources (own fund, equities, loans, etc.) available and Define financial resources (own fund, equities, loans, etc.) available and their conditionstheir conditions
•• Calculate streams of expenditures and incomes Calculate streams of expenditures and incomes
•• Calculate indicators of financial viabilitiesCalculate indicators of financial viabilities
A4-2 - 36

2. Method of Financial Analysis — Indicators4
R f R h h iR f R h h i
•• FIRR FIRR FFinancial inancial IInternal nternal RRate of ate of RReturneturn
-- Rate of Return on the money spent on the investmentRate of Return on the money spent on the investment
-- Various methods to obtain FIRR → various definitionsVarious methods to obtain FIRR → various definitions
-- ADB’s Standard Method used in this studyADB’s Standard Method used in this study
•• (F)NPV(F)NPV ((FFinancial) inancial) NNet et PPresent resent VValuealue
-- Total of discounted income and discounted expensesTotal of discounted income and discounted expenses
-- Discount rate to be applied can be an issue.Discount rate to be applied can be an issue.
Criteria of financial viability:Criteria of financial viability: FIRR > WACC, NPV > 0FIRR > WACC, NPV > 0
2. Method of Financial Analysis — Indicators5
•• WACC Weighted Average Cost of CapitalWACC Weighted Average Cost of Capital
Bank Loans Equity
Lower risks Higher risks
Lower return (Possibly ) Higher return
Interest Rates Expected Returns
Different sources of financeDifferent sources of finance
<<
Averaged with weights (proportion)Averaged with weights (proportion)
WACCWACC= Returns that Project has to achieve to satisfy financiers= Returns that Project has to achieve to satisfy financiers
A4-2 - 37

2. Method of Financial Analysis — Framework6
••Brightness Engineering’s Feasibility Study Brightness Engineering’s Feasibility Study ((10MW10MW--preF/SpreF/S)) including cost estimates andincluding cost estimates and((10MW10MW preF/SpreF/S)), including cost estimates and , including cost estimates and financial study,financial study,
••NDRC’s Instruction to PV Concession BiddersNDRC’s Instruction to PV Concession Bidders
••Qinghai Government’s InvitationQinghai Government’s Invitationoffering power purchase at offering power purchase at ¥¥1.15 /kWh 1.15 /kWh for PV operators started generation by E/2011for PV operators started generation by E/2011
2. Method of Financial Analysis — Conditions7
NDRC Instruction
Loan Proportion 60%p
Repayment Period 15 years
Interest of Loan 6.12%
Operation period 20 years
Depreciation 20 years, 5% Residual value
Operation cost 7% of depreciationOperation cost 7% of depreciation
Value added tax 17%
Income Tax 25%
Additional tax 8%
IRR of profit after tax 11 – 12%
A4-2 - 38

2. Method of Financial Analysis — Calculation8
year Electricity Generated
(GWH)
Capital Cost O&M and Sales Tax
Income Tax Total Revenue Net Revenue (after tax)
2011 (166.722) (166.722)
2012 17.851 4.292 2.089 20.529 14.148
2013 1 08 266 2 0 20 36 1 02013 17.708 4.266 2.054 20.365 14.044
2014 17.567 4.241 2.020 20.202 13.941
2015 17.426 4.216 1.986 20.040 13.839
2016 17.287 4.190 1.952 19.880 13.737
2017 17.148 4.165 1.919 19.721 13.637
2018 17.011 4.141 1.885 19.563 13.537
2019 16.875 4.116 1.852 19.406 13.438
2020 16.740 4.092 1.820 19.251 13.340
2021 16.606 4.068 1.787 19.097 13.242
2022 16.473 4.044 1.755 18.944 13.146
2023 16 342 4 020 1 723 18 793 13 0502023 16.342 4.020 1.723 18.793 13.050
2024 16.211 3.996 1.691 18.643 12.955
2025 16.081 3.973 1.660 18.493 12.861
2026 15.953 3.950 1.629 18.345 12.767
2027 15.825 3.927 1.598 18.199 12.674
2028 15.698 3.904 1.567 18.053 12.582
2029 15.573 3.881 1.537 17.909 12.491
2030 15.448 3.859 1.506 17.765 12.400
2031 15.325 3.836 1.477 17.623 12.311
(figures in Million CNY) FIRR= 4.99%
3. Results and Sensitivity Analysis — Results9
FIRR
change 20 years 25 years
(a) Base case 4.99% 5.97%
(b) Capital cost overrun 10% 3.99% 5.04%
(c) Lower benefit -10% 3.86% 4.91%
(d) Faster deterioration -1.5% p.a. 4.39% 5.33%
( ) R diti 4 21% 5 32%(e) Renew power conditioners 4.21% 5.32%
(f) Combination of (b) and (c) 2.93% 4.03%
(g) Combination of (d) and (e) 3.57% 4.64%
WACC = 4.44%WACC = 4.44%
A4-2 - 39

3. Result and Sensitivity Analysis — Sensitivity10
-- Extend operation period (20→25yrs) improves FIRRExtend operation period (20→25yrs) improves FIRR
-- 20yr Project is vulnerable to adverse conditions20yr Project is vulnerable to adverse conditions
-- 25yr Project achieves FIRR>WACC in most cases25yr Project achieves FIRR>WACC in most cases
-- 25yr Project may be more susceptible to equipment problems25yr Project may be more susceptible to equipment problems
→ FIRR still exceeds WACC in case (g)→ FIRR still exceeds WACC in case (g)
What do we know about PV project in 20 yrs,What do we know about PV project in 20 yrs,function of equipment, incentive policy, etc ?function of equipment, incentive policy, etc ?
4. Lifecycle analysis and Cost effectiveness11
Although PV is a clean energy it still emits CO2 in its lifecycleAlthough PV is a clean energy it still emits CO2 in its lifecycle
(1) Lifecycle Emission of CO2 by Pilot Project(1) Lifecycle Emission of CO2 by Pilot Project
Although PV is a clean energy, it still emits CO2 in its lifecycle.Although PV is a clean energy, it still emits CO2 in its lifecycle.
Emission is mostly due to production process of materials;Emission is mostly due to production process of materials;
-- Extraction, transportation of silicon and other materials,Extraction, transportation of silicon and other materials,
-- Production of PV modules,Production of PV modules,
-- Construction, etc.Construction, etc.
Estimate is around 50 to 60 gEstimate is around 50 to 60 g--CO2/kWh for crystalline PV cells.CO2/kWh for crystalline PV cells.
A4-2 - 40

Lifecycle analysis and Cost effectiveness12
Electricity in China is produced predominantly by coal which is theElectricity in China is produced predominantly by coal which is the
(2) Emission of CO2 by Electricity Production(2) Emission of CO2 by Electricity Production
Electricity in China is produced predominantly by coal, which is the Electricity in China is produced predominantly by coal, which is the most carbonmost carbon--intensive fuel.intensive fuel.
Estimate is approximately 900 gEstimate is approximately 900 g--CO2 per kWh.CO2 per kWh.
Electricity production by PV substitutes coal power, reducing CO2 Electricity production by PV substitutes coal power, reducing CO2 emission. emission.
-- Unit Emission from Coal Power Plant Unit Emission from Coal Power Plant = 900 g= 900 g--CO2 /kWhCO2 /kWh
-- Unit Emission from PV Power Plant Unit Emission from PV Power Plant = 50= 50--60 g60 g--CO2 /kWh 840 gCO2 /kWh 840 g--
CO2 is reduced by 1 kWh power generated by PV.CO2 is reduced by 1 kWh power generated by PV.
Lifecycle analysis and Cost effectiveness13
(3) Lifecycle Reduction of CO2 Emission by Pilot Project(3) Lifecycle Reduction of CO2 Emission by Pilot Project
Unit 20 year 25 year
Generated energy by Pilot Project GWh 310 374
Saved emission from coal plants t-CO2 279,404 337,024
Lifecycle PV plant own emission t-CO2 16,764 20,221
Lifecycle reduction of emission t-CO2 262,639 316,803
As most of lifecycle emission of CO2 from PV power generation originates in PV cell production, the emission volumes in reality should be almost the same for 20 and 25 year operation.
A4-2 - 41
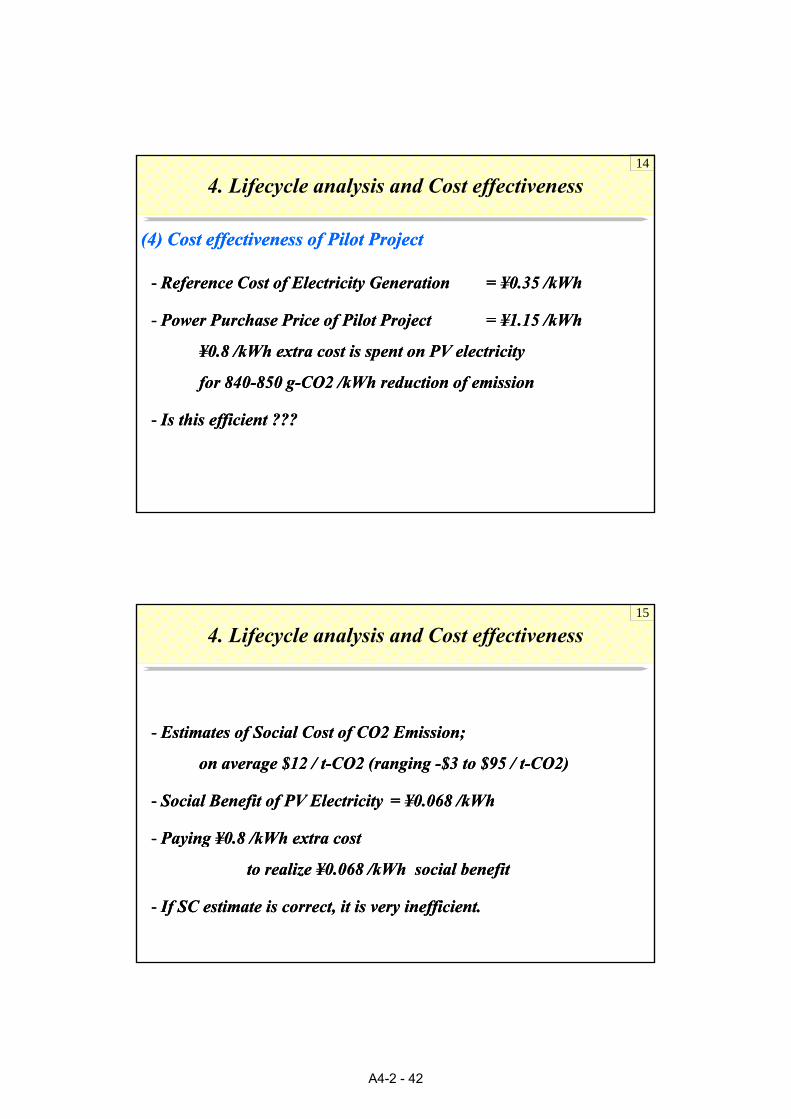
4. Lifecycle analysis and Cost effectiveness14
(4) Cost effectiveness of Pilot Project (4) Cost effectiveness of Pilot Project
-- Reference Cost of Electricity GenerationReference Cost of Electricity Generation = = ¥¥0.35 /kWh0.35 /kWh
-- Power Purchase Price of Pilot ProjectPower Purchase Price of Pilot Project = = ¥¥1.15 /kWh1.15 /kWh
¥¥0.8 /kWh extra cost is spent on PV electricity0.8 /kWh extra cost is spent on PV electricity
for 840for 840--850 g850 g--CO2 /kWh reduction of emissionCO2 /kWh reduction of emission
-- Is this efficient ???Is this efficient ???
4. Lifecycle analysis and Cost effectiveness15
-- Estimates of Social Cost of CO2 Emission;Estimates of Social Cost of CO2 Emission;
on average $12 / ton average $12 / t--CO2 (ranging CO2 (ranging --$3 to $95 / t$3 to $95 / t--CO2)CO2)
-- Social Benefit of PV Electricity Social Benefit of PV Electricity = = ¥¥0.068 /kWh0.068 /kWh
-- PayingPaying ¥¥0.8 /kWh extra cost0.8 /kWh extra costPaying Paying ¥¥0.8 /kWh extra cost 0.8 /kWh extra cost
to realize to realize ¥¥0.068 /kWh social benefit0.068 /kWh social benefit
-- If SC estimate is correct, it is very inefficient.If SC estimate is correct, it is very inefficient.
A4-2 - 42

4. Lifecycle analysis and Cost effectiveness16
-- Estimates of Social Cost of CO2 Emission;Estimates of Social Cost of CO2 Emission;
on average $12 / ton average $12 / t--CO2 (ranging CO2 (ranging --$3 to $95 / t$3 to $95 / t--CO2)CO2)
-- Social Benefit of PV Electricity Social Benefit of PV Electricity = = ¥¥0.068 /kWh0.068 /kWh
-- Paying Paying ¥¥0.8 /kWh extra cost 0.8 /kWh extra cost
t lit li ¥¥0 068 /kWh i l b fit0 068 /kWh i l b fitto realize to realize ¥¥0.068 /kWh social benefit0.068 /kWh social benefit
-- If SC estimate is correct, it is very inefficient.If SC estimate is correct, it is very inefficient.
-- However, this gap will be closing: higher fuel cost, higher SCHowever, this gap will be closing: higher fuel cost, higher SC
5. Tentative Conclusions17
-- PrePre--FS level 10MW Pilot Project can be financially viable at power FS level 10MW Pilot Project can be financially viable at power
purchase rate purchase rate ¥¥1.15 / kWh, but vulnerable to adverse conditions. 1.15 / kWh, but vulnerable to adverse conditions. pp
(Would like to discuss more in Final Report)(Would like to discuss more in Final Report)
-- PV Power Station is a capitalPV Power Station is a capital--intensive project with low O&M costs intensive project with low O&M costs
→ Extending operation period is effective.→ Extending operation period is effective.
What will happen to PV equipment in the long term?What will happen to PV equipment in the long term?
What do we do about the purchase rate What do we do about the purchase rate ¥¥1.15 / kWh ?1.15 / kWh ?
-- Social Benefit of PV Electricity Social Benefit of PV Electricity (CO2 reduction only) = (CO2 reduction only) =
¥¥0.068 /kWh, less than 1/10 of its cost 0.068 /kWh, less than 1/10 of its cost ¥¥0.8 /kWh. 0.8 /kWh.
The gap can be, and will be closer in the future.The gap can be, and will be closer in the future.
A4-2 - 43

18
THETHE ENDEND
A4-2 - 44

开创人类和技术的未来科技推动社会
未来触手可及
兆瓦级光伏发电用逆变器(逆变器装置)
96.5%以上(包含变压器)的顶级变换率,得以实现!
最大输出功率跟随范围广,适用于各种各样特性的太阳能电池板!
可并列多层运行,对应大规模“兆瓦级光伏发电系统” !
基于250kW单元模块,可制造单机容量为500kW的逆变器装置!
面向日本某电力公司的2MW兆瓦级光伏系统2012年计划运行开始・250kW逆变器装置×10台并列运行・内置系统稳压功能(SVC功能)・集成本公司独有的FRT功能
A4-2 - 45
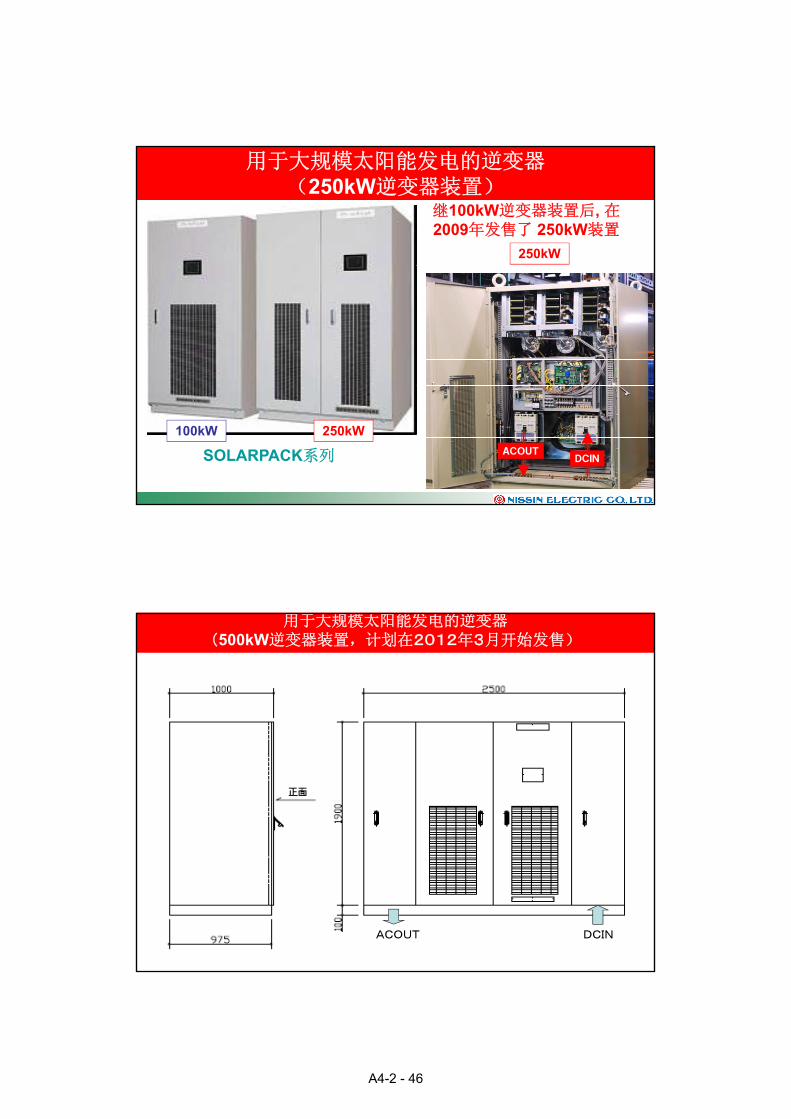
继100kW逆变器装置后, 在2009年发售了 250kW装置
用于大规模太阳能发电的逆变器(250kW逆变器装置)
250kW
100kW 250kW
SOLARPACK系列 DCINACOUT
用于大规模太阳能发电的逆变器(500kW逆变器装置,计划在2012年3月开始发售)
DCINACOUT
A4-2 - 46

用于大规模太阳能发电的逆变器(>250kW)(基本回路構成)
日新太阳能发电的逆变器的规格低输入电压型 高输入电压型
额定输出容量
运转电压输入范围 320~600 Vdc 440~880 Vdc
100kW, 250kW
日本规格 国外规格
输出电压
转换效率
通过绝缘变压器与系统电压调和
96.8%(于100%输出)96.9%(于 70%输出)96.5%(于 30%输出)97 8% (不含変圧器
绝缘方式 输出侧装有绝缘变压器
94.5%(于100%输出)95.3%(于 70%输出)94.0%(于 30%输出)97 0% (不含変圧器) 97.8% (不含変圧器)
输出电流高频波
97.0% (不含変圧器)
周围温度-10~40,湿度90%以下,室内规格
综合4%以下,每次2.5%以下
控制功能PWM逆变器电流控制
太阳能电池的最大功率跟踪控制
安装环境
A4-2 - 47

日新产逆变器装置效率
97.00
98.00
海外向け
国内向け(含変圧器)无变压器高输入电压型(推测)
91.00
92.00
93.00
94.00
95.00
96.00
効率
(%
)
有変圧器低输入电压型
有変圧器高输入电压型
88.00
89.00
90.00
0 20 40 60 80 100
出力(%)
光伏发电用逆变器装置(TUV認証取得:2011.3)
A4-2 - 48

面向国外的兆瓦级光伏系统的基本构成
电网接线箱
TR,3φ,550kVA
270V11kV
LBS LBS VCB DS PAS
MCCB MCCBMCTT250kWPV
250kW×2输入=500kW型
3φ3W50Hz,11kV
接线箱
250kWPV
RY
500kW×1输入=500KW型
对应输入DC1000V
电网
接线箱
PAS
3φ3W50Hz,11kV
500kWPV
TR,3φ,550kVA
270V11kV
LBS LBS VCB DSMCCB MCCBMCTT
RY
500kWPCS
PCS
270Vac
450-900Vdc Transless PCS
日新电机提供的日新电机提供的面向中国的大规模太阳能发电系统面向中国的大规模太阳能发电系统
高压受电设备
互联保护装置
送配电线路
除功率调节器外,日新电机还拥有大容量太阳能发电系统所必需的系统互联保护装置、高压受变电系统和测量监控控制系统。
270Vac 11kVac可并联15台
路
500kWPCS
500kWPCS
2MWSolar System Basic Skeleton
4 sets of 500kWPCS High Voltage Power Grid
A4-2 - 49

500kW
Top view
Out Door Packaging Image for Out Door Packaging Image for 1MW System1MW System
550kVATr
Tentative Plan
500kW
CS
AirConditioner
AirConditioner
Depth:2400mm Width:6500mm
Front viewSide view
550kVATr
CS
2700mm
(Outdoor unit)Air conditioner
Height
Door
日本系统连网条件概要日本系统连网条件概要为什么需要系统连网条件
1.1.协调保护协调保护、、安全运行安全运行
・・・「・・・「防止分散电源的内部异波及电网防止分散电源的内部异波及电网」、「」、「电网故障时分散电源的解列电网故障时分散电源的解列」、「」、「短路容量的限制短路容量的限制」」<<具体对策具体对策>>
电压电压 频率频率 电流电流 落地等检测的继电保护和整定值的合理化落地等检测的继电保护和整定值的合理化・・电压电压、、频率频率、、电流电流﹑﹑落地等检测的继电保护和整定值的合理化落地等检测的继电保护和整定值的合理化
・・短路容量对策短路容量对策((限流电抗等限流电抗等))
2.2.保证电力品质保证电力品质・・・「・・・「通常电压变动限制通常电压变动限制」、「」、「瞬间电压变动限制瞬间电压变动限制」、「」、「高次谐波对策高次谐波对策」、「」、「功率因数限制功率因数限制」」<<具体对策具体对策>>
・・功率因数控制功率因数控制、、负荷控制负荷控制・・逆变器高次谐波控制逆变器高次谐波控制
33 确保安全确保安全・・保全设备保全设备连网用短路器闭合状态
3.3.确保安全确保安全 保全设备保全设备・・・「・・・「防止单独运行防止单独运行」」<<具体对策具体对策>>
・・设置电机允许检测装置设置电机允许检测装置・・设置通信短路器设置通信短路器
单独运行状态单独运行状态
配电短路器断开
一般家庭负荷
家用发电机
家庭负荷
向其他用户供电
设置家用发电机的用户
A4-2 - 50

发电设备的种类 同步发电机 感应发电机 逆变装置
有无向电网输电
保护项目
系统连网条件系统连网条件1:1:保护项目保护项目
连网条件中规定的保护项目(和高压配电连网时)连网条件中规定的保护项目(和高压配电连网时)
保护项目 有 无 有 无 有 无
发电设备故障时的系统保护 OVR,UVR
系统短路时的保护 DSR UVR
系统母线落地时的保护 OVGR
OFR - - -
UFR 防止单独允许
UFR
RPR - - -
通信短路器或单独运行检测功能
- - -
再次投入时事故防止 母线无电压检测装置
系统连网条件系统连网条件2:2:电力品质电力品质保证电力品质
1.1.电源变动电源变动<<通常电压允许变动范围通常电压允许变动范围>>
• • 低压配电系统低压配电系统照明负荷照明负荷(100V):101(100V):101±±6V6V照明负荷照明负荷(100V):101(100V):101±±6V6V动力负荷动力负荷(200V):202(200V):202±±20V20V
• • 高压配电系统高压配电系统保证低压配点系统的电压范围保证低压配点系统的电压范围
• • 特别高压系统特别高压系统保证适当的通常电压范围保证适当的通常电压范围(1~2%)(1~2%)
<<瞬间电压允许变动范围瞬间电压允许变动范围>>• • 低压配电系统低压配电系统、、高压配电系统高压配电系统通常电压的通常电压的10%10%以内基准以内基准
•• 特别高压系统特别高压系统
母线电压(低压换算)
分散电源发电时
分散电源解列时
母线送电节点 分散电源连网节点 特别高压系统特别高压系统通常电压的通常电压的2%2%以下基准以下基准
2.2.抑制高次谐波抑制高次谐波<<高次谐波输出电流允许值高次谐波输出电流允许值>>
・・总电流的谐波率总电流的谐波率 5%5%以下以下・・各次电流谐波率各次电流谐波率 3%3%以下以下
3.力率制限3.力率制限<<功率因数限制功率因数限制>>
・・受点节点的功率因数为受点节点的功率因数为85%85%以上以上、、并且从系统侧看功率因数不要超前并且从系统侧看功率因数不要超前。。
分散电源发电时分散电源发电时母线电压上升印象母线电压上升印象
A4-2 - 51

系统连网条件系统连网条件3:3:防止单独允许防止单独允许单独运行的防止对策
1.1.设置通信短路器设置通信短路器・・・・・・根据电力公司的通信进行控制根据电力公司的通信进行控制
22 设置单独运行检测装置设置单独运行检测装置2.2.设置单独运行检测装置设置单独运行检测装置・・・・・・在发电设备侧设置单独运行检测装置在发电设备侧设置单独运行检测装置
大容量电源(电力公司的
电力系统)
事故 单独运行
母线
单独运行状态单独运行状态
电力系统)
断开发电设备 负荷设备
关于日新逆变器装置的高度控制技术关于日新逆变器装置的高度控制技术
效率性能效率性能::运行范围广,效率高运行范围广,效率高
系统品质改善技术系统品质改善技术::抑制电压上升技术抑制电压上升技术系统品质改善技术系统品质改善技术::抑制电压上升技术抑制电压上升技术抑制电压变动技术抑制电压变动技术FRTFRT控制技术控制技术
监视控制技术监视控制技术::通过通信,全面监视技术通过通信,全面监视技术
P4P3
监视控制技术监视控制技术 通过通信 全面监视技术通过通信 全面监视技术
系统解析技术系统解析技术::根据电网的信息,可事前根据电网的信息,可事前解决逆变系统是否联网的问题解决逆变系统是否联网的问题
A4-2 - 52

日新产逆变器装置效率
97.00
98.00
海外向け
国内向け(含変圧器)变压器无高输入电压型(推测)
91.00
92.00
93.00
94.00
95.00
96.00
効率
(%
)
低输入电压型
高输入电压型
88.00
89.00
90.00
0 20 40 60 80 100
出力(%)
系统品质改善技术系统品质改善技术11::抑制电压上升技术抑制电压上升技术
Q(パ
Mode①从功率因数1开始运行 维持可视功率不变
Solution1
Problem:发电时发生系统电压上升
(パワコンが発生する進相無効電力
Mode②Mode③
パワコン出力限界曲線
力率限界Cosθ=0 85
从功率因数1开始运行,维持可视功率不变,使相位超前,产生无功功率。
Problem継続
Solution2
Mode②增加无功功率,有功功率下降。在功率因数0 85~1进行控制。
P(パワコンが発生する有効電力kW)
力kVar
)
Cosθ=0.85Mode①
0.85~1进行控制。
Problem継続
Mode③功率因数0.85的情况下,逆变器有功功率最低。
Solution3
A4-2 - 53

系统品质改善技术系统品质改善技术22::抑制电压变动技术抑制电压变动技术
パワコンパワコン
Vs+ΔVs
x rP,Q
系統Vs
太陽電池
負
ΔVs
負荷
Problem光伏发电随日照的变化而变化,式(1)为变动电压ΔVs≒r・P-x・Q ・・・・・(1)
Solution(1)式的 使电压变动ΔVs=0 逆变
コンピュータシミュレーション
(1)式的、使电压变动ΔVs=0、逆变器装置需产生Q=(r/x)・P ・・・・・(2)
的无功功率。
Result
系统品质改善技术系统品质改善技术33:FRT:FRT控制技术控制技术
Fault Ride Through的简称。也就是运行接续性对系统的扰动。随分散式发电规模的壮大,大量分散系统的扰动。随分散式发电规模的壮大,大量分散发电联网时,同时投入或分离会对电网品质产生很大的影响。为了防止同时投入或分离的问题发生,运行接续性成了一个重要问题。
当今关于“为确保电力品质系统扰乱时分散发电的运行接续性能的必要条件”(被称为FRT要事)的的运行接续性能的必要条件”(被称为FRT要事)的扩充正在处于探讨阶段。
A4-2 - 54

FRTFRT的必要性的必要性
电网 电网
无FRT功能 有FRT功能
落雷
断路器CB
PCS
落雷
断路器CB
用户 用户
PCS
发生落雷
电压v、发电p波形
Δt
瞬间低压检测出后停止发电
断路器CB断开
瞬间低压检测出后停止发电
电压V
发电P
发生落雷
电压v、发电p波形
Δt
断路器CB断开
电压V
发电P 继续运行
PCS
66kV 6.6 kV 変電所
PV パネル
~
受電点
系统品质改善技术系统品质改善技术33:FRT:FRT控制技术控制技术
出力電力
2016年随法制化的发展瞬间电压低下规格
1.0p.u.
電圧
運転継続範囲V recovery (0.8 p.u.)
功率
Precover(0.8pu)
电压
日新的逆变器装置
2016年随法制化的发展将成为必备技术
V min
T1 時刻T20
Vmin=0.2pu,T1=1秒,T2-T1=0.1秒(Vmin>0.2pu),0.2秒(Vmin<0.2pu)
P4P3
已经导入了此功能日新的逆变器装置已经导入了此功能
A4-2 - 55

通过并联运行,也构建兆瓦级的大容量系统。
通过通信功能(RS-485),可集中进行数据测量和监控。
通过通信全面监视技术通过通信全面监视技术::采用了高信赖的采用了高信赖的RS485RS485通信通信
集中监控装置
通信线(RS-485)
系统
配电线路
集中监控装置(数据收集)
测量(直流电压、直流电流、系统电压、系统电流、
系统电力、频率、积累电量、日照强度、气温……)
重大信息(异常、故障信息)
装置状态(运行/停止)
各设定值(系统互联保护)
综合管理
所有信息
系统电源(275kV系统) 3LS(0.2Ω)事件地点 66kV系统 6.6kV系统(高压配电系统) 1台10kWPV-PCS装置的低圧电站,有10kW负荷
高压配电线2kmPV-PCS装置
系统解析技术系统解析技术::关于典型系统的关于典型系统的FRTFRT性能解析示例性能解析示例
配电高压电线2km ,5线(汇集为并列电路)。
测量点测量点 测量点
测量点
高压配电站为3MVar C无L
③ ④
高压配电站中PV总共不到1MW
负荷(假定为轻负荷)
在有10kW PV-PCS的线路中,存在另一个相当500kW的PV-PCS(输出和本PCS同样增加)和500kW的负荷
A4-2 - 56

连接点电压
(シミュレーション全体波形)
0.2sec
系统解析技术系统解析技术::关于典型系统的关于典型系统的FRTFRT性能解析示例性能解析示例
压
PCS输出电流
电网电压(连接点电压)的共振电压立刻衰减。
PV输出(日照)增加,电流也随之增加。
Output current is stable
(参考)
PCS输出
P、Q
上位系で3LSの瞬低発生 上位系瞬低解除
即使瞬间低压电流的基本波形没有变化。
PV输出(日照)增加,P也随之增加(功率因数100%控制模拟)
4-2 系統電圧(瞬低前後) ③ 采用业绩采用业绩
BenesseBenesse有限公司有限公司 BLBL中心中心
在在中中四国地区的民间企业中建立起最大规模,在同一建筑上设四国地区的民间企业中建立起最大规模,在同一建筑上设立发电容量最大,被美誉为立发电容量最大,被美誉为 国国 11。(。(截至为截至为20102010年年22立发电容量最大,被美誉为立发电容量最大,被美誉为中四国地区中四国地区 o.1o.1。(。(截至为截至为20102010年年22月月))
冈山冈山县濑户市长船町县濑户市长船町720kW720kW多多结晶硅太阳能电池结晶硅太阳能电池 34563456面面光伏逆变器设备光伏逆变器设备 100kW100kW××77台台高压联网高压联网 向电网输出电力向电网输出电力目的为发电事业目的为发电事业
A4-2 - 57

4-2 系統電圧(瞬低前後) ③
系统施工事例(日新电机总公110kW)
100kW 多结晶 10kW 但结晶
100kW PCS
日新电机总公司日新电机总公司 新电力电容工厂新电力电容工厂
100kW100kW多多结晶硅太阳能电池结晶硅太阳能电池 480480面面10kW10kW但结晶硅太阳能电池但结晶硅太阳能电池 5555面面光伏逆变器装置光伏逆变器装置 100kW100kW××11台台、、10kW10kW××11台台特别高压联网特别高压联网 不向电网输出电力不向电网输出电力
10kW PCS
4-2 系統電圧(瞬低前後) ③ 其他的采用业绩其他的采用业绩アモルファスハイブリッドシリコン太陽電池道路斜坡设置
アモルファスハイブリッド大容量设置可减轻楼下的冷气空调用电
CIS太阳能电池大容量设置实际发电量比结晶硅还要高5%左右
常盘车道 山元インター 100kW
地面设置
墙面设置遮光、PR效果
积雪地域设置倾斜角45°、高架抬高
三甲有限公司 关东第5工厂 498kW
不二电机工业有限公司 南草津工厂100kW
关西电力有限公司日高港能源公园 80kW 甲南大学ポーアイ校区 20kW
北海道 旭川合同厅舍 20kW
アモルファスハイブリッド硅太阳能电池
A4-2 - 58

日新电机不断提高功率调节器的制造能力日新电机不断提高功率调节器的制造能力2012年 500台・75MW/年计划
↑2011年 300台・60MW/年计划
↑20102010年年 110000台台・・13MW13MW//年业绩年业绩
↑↑
日本京都工厂
↑↑20092009年年 2020台台・・3MW3MW//年业绩年业绩
20132013年年 年产年产10001000台・5台・500MW00MW计划计划↑↑
20122012年年 年产年产720720台・台・300MW300MW计划计划↑↑
20112011年年 年产年产220000台・台・20MW20MW生产开始生产开始
东莞工厂
A4-2 - 59

光伏发电系统并网逆变
及低压侧电网接入技术
张海波 高级工程师
中国·青海·2011
目目 录录
一、目前市场上光伏逆变器的技术状况
二、孤岛效应及MPPT
三、低电压穿越
四、并网逆变器可靠性设计和技术指标
五、光伏发电系统低压侧并网
六、南京冠亚电源公司及产品介绍
A4-2 - 60

一、目前市场上光伏逆变器的技术状况
• 光伏并网逆变器将光伏电池发出的直流电变换
为与电网同步的交流电并馈送电网
光伏方阵 逆变器 计量装置汇流装置
为与 步 流 并馈
• 并网逆变器是连接光伏方阵和电网的关键部件,
它完成控制光伏方阵最大功率点运行和向电网
注入正弦电流两大主要任务
A4-2 - 61

从专业的角度看逆变器需要满足以下要求:
1. 合理的电路结构
2. 严格筛选的元器件
3. 具备输入直流极性反接、交流输出短路、过热过载等各种保护功能
4. 具有可靠的孤岛检测和很高的MPPT精度控制
5. 具有较宽的直流输入电压适应范围。由于光伏方阵的端压以及最大功率点随日
照强度温度等因素而变化,因此逆变器必须能在较宽的直流输入电压范围内正
常工作,且保证交流输出电压的稳定
6. 尽量减少中间环节 ( 如蓄电池等 ) 的使用,以节约成本、提高效率
目前市场上的逆变器技术大至分为以下七种拓扑:
(1)先升压 再逆变
图1-1
图1-1前级为单boost升压电路,后级为全桥逆变结构。由于升压部分受升压倍数
和功率限制 此拓扑结构逆变电路特别适合小型 单相并网逆变器 而且适合直和功率限制,此拓扑结构逆变电路特别适合小型、单相并网逆变器,而且适合直
流电压较低系统
优点:效率较高,可高达98%,成本低,结构简单,体积小,质量轻
缺点:由于输入输出不隔离,对系统的绝缘、系统接地及人员安全造成不利
增加对输出直流分量的检测,防止直流分量注入电网
另外,前级有的为双boost升压电路
A4-2 - 62
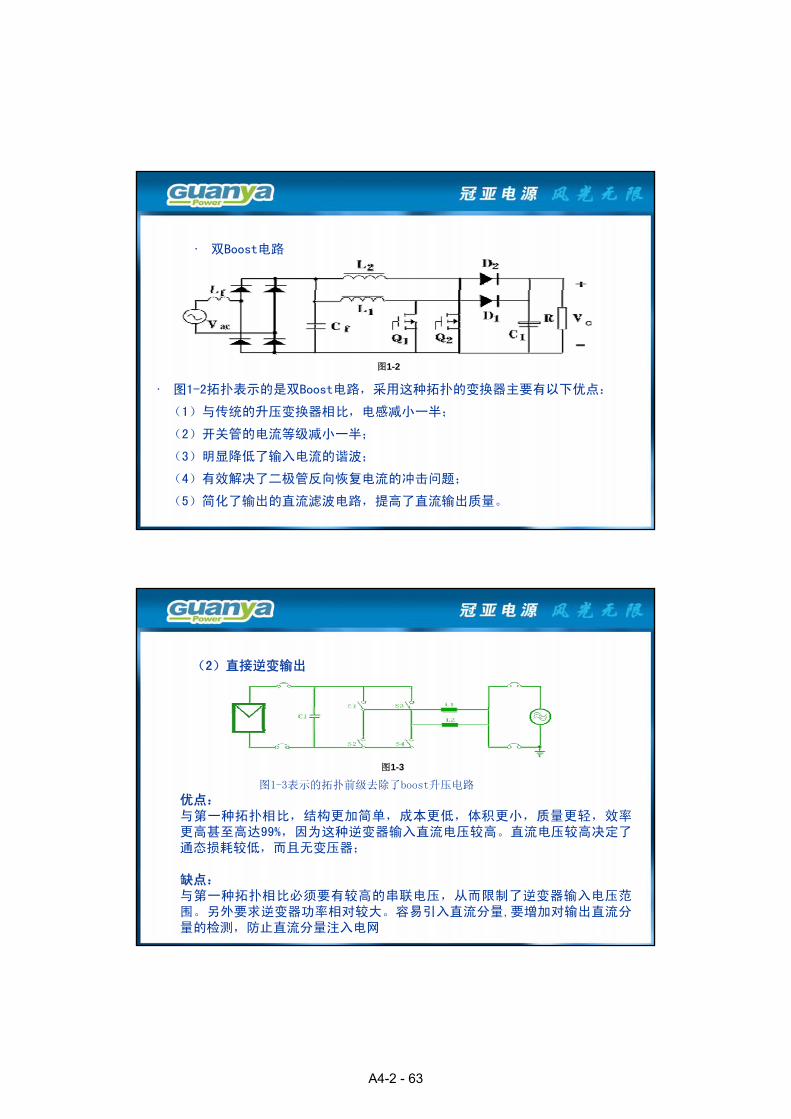
• 双Boost电路
图1-2
• 图1-2拓扑表示的是双Boost电路,采用这种拓扑的变换器主要有以下优点:
(1)与传统的升压变换器相比 电感减小 半(1)与传统的升压变换器相比,电感减小一半;
(2)开关管的电流等级减小一半;
(3)明显降低了输入电流的谐波;
(4)有效解决了二极管反向恢复电流的冲击问题;
(5)简化了输出的直流滤波电路,提高了直流输出质量。
(2)直接逆变输出
图1-3
图1-3表示的拓扑前级去除了boost升压电路
优点:与第一种拓扑相比,结构更加简单,成本更低,体积更小,质量更轻,效率更高甚至高达 因为这种逆变器输入直流电压较高 直流电压较高决定了更高甚至高达99%,因为这种逆变器输入直流电压较高。直流电压较高决定了通态损耗较低,而且无变压器;
缺点:与第一种拓扑相比必须要有较高的串联电压,从而限制了逆变器输入电压范围。另外要求逆变器功率相对较大。容易引入直流分量,要增加对输出直流分量的检测,防止直流分量注入电网
A4-2 - 63

(3)带高频变压器隔离 先逆变升压整流再逆变输出
图1-4拓扑结构先逆变升压整流,在较高直流下再逆变输出
图1-4
优点:
具有较高的效率 可达96%,体积小,质量轻,成本较低,不影响系统接地
缺点:
输出要加直流分量检测,控制直流分量以避免注入电网,由于受高频变压器磁芯
等影响只能用于小型逆变器的使用
(4)先逆变再升压隔离输出
图1-5
图1-5表示的拓扑在并网逆变器中使用较广
优点:不影响系统接地、系统绝缘、不需要交流输出侧的直流分量检测与控制
缺点:由于在相对较低直流电压下逆变,开关损耗以及通态损耗较高,加之工频变压器的损耗使得逆变器整体效率较低,最高约为96%
A4-2 - 64

(5)直接逆变输出 经电力变压器升压馈入高压电网
图-1-6
图1-6表示的拓扑在大型并网系统中有较多应用
如 大型并网逆变器直流输入为440V ~ 900V 440×0 612 ≈ 270V如:大型并网逆变器直流输入为440V ~ 900V 440×0.612 ≈ 270V
电力变压器匝比可做成270V/10KV等
优点:
可大大提高并网效率和节约成本 同时便于用于当地选择适合电网要求的变压器。
(6)多路MPPT输入逆变器
• 优点:由于具有多个DC-DC电路即具有不同的MPPT 输入回路,适合多个不同倾斜面优点:由于具有多个DC DC电路即具有不同的MPPT 输入回路,适合多个不同倾斜面
方阵或不同组件接入, 克服了由于太阳电池组件参数的离散性或太阳辐射条件的
差异会造成太阳电池组件并联情况下能量损失,可以增加系统的发电量在3%-10%。
十分适合应用于光伏建筑项目
• 缺点:由于输入输出不隔离,对系统的绝缘、系统接地及人员安全造成不利
• 增加对输出直流分量的检测,防止直流分量注入电网
A4-2 - 65

(7)主从逆变单元结构的逆变系统
优点:
提高系统运行效率,空载损耗较小。根据光照强弱,群控器自动逐台投切,控
制投入运行电源的数量,使每台电源在较高的负载率下运行,有效提高系统的
效率。
提高系统的寿命可根据光照情况,合理选择某台(某部分)投入运行,系统的
单台可进行轮休(循环工作)。
缺点:
该系统通过直流母线将整个方阵并在 起 太阳电池组件参数的离散性或太阳该系统通过直流母线将整个方阵并在一起,太阳电池组件参数的离散性或太阳
辐射条件的差异会造成方阵在并联情况下能量的损失。这种差异在太阳能光伏
电站刚建好时可能不大,随着使用时间的延长,差异会越来越大。这种损失在
大型太阳能光伏电站,特别是在BIPV项目中可能达到5%左右。
A4-2 - 66

• 逆变器的输入和输出之间采用电气隔离装置(隔离变压器)作用:
1、人员安全隐患:
方阵一端不能够做接地保护,操作安全隐患很大;
2、设备安全隐患:
直流电可能窜入交流电网,交流电也可能窜入方阵;
3、方阵的对地电容无法释放,存在隐患。
• 一个让人来使用的工业产品,从来都不是效率第一,而应该是安全第一。
• 在当前器件材料没有重大突破情况下,当标示的光伏并网逆变电源效率高达
97%~98%时,一定是以下两种情况:
输入与输出没有电气隔离装置;
在计算效率时,把输出到电网的无功功率也计入分析,从而得到的数值很高。
二、孤岛效应及MPPT
A4-2 - 67
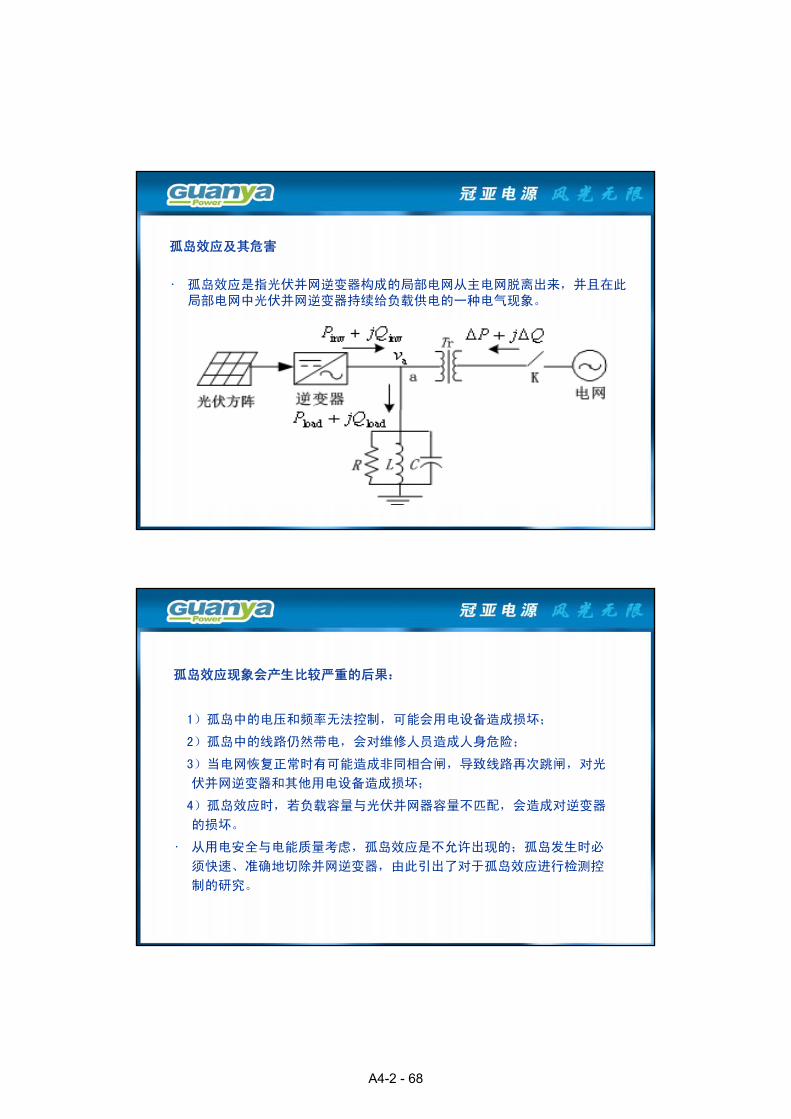
孤岛效应及其危害
• 孤岛效应是指光伏并网逆变器构成的局部电网从主电网脱离出来,并且在此局部电网中光伏并网逆变器持续给负载供电的一种电气现象。
孤岛效应现象会产生比较严重的后果:
1)孤岛中的电压和频率无法控制,可能会用电设备造成损坏;
2)孤岛中的线路仍然带电,会对维修人员造成人身危险;
3)当电网恢复正常时有可能造成非同相合闸,导致线路再次跳闸,对光
伏并网逆变器和其他用电设备造成损坏;
4)孤岛效应时,若负载容量与光伏并网器容量不匹配,会造成对逆变器
的损坏。的损坏。
• 从用电安全与电能质量考虑,孤岛效应是不允许出现的;孤岛发生时必
须快速、准确地切除并网逆变器,由此引出了对于孤岛效应进行检测控
制的研究。
A4-2 - 68

孤岛效应的检测一般分成被动式与主动式。
1)被动式检测是利用电网监测状态 ( 如电压、频率、相位等 ) 作为判
断电网是否故障的依据 。如果电网中负载正好与逆变器输出匹配,被动
法将无法检测到 孤岛的发生。
2)主动检测法则是通过电力逆变器定时产生干扰信号,以观察电网是否
受到影响作为判断依据 ,如脉冲电流注入法 、输出功率变化检测法、
主动频率偏移法和滑模频率偏移法等。
3)它们在实际并网逆变器中都有所应用,但也存在着各自的不足。当电
压幅值和频率变化范围小于某一值时,频率偏移法无法检测到孤岛效应,压幅值 频率变 范围小 某 值时 频率偏移法无法检测到 岛效应
即存在“检测盲区。
4)电网阻抗检测法,当电网的阻抗发生突变或变得比较大时,则认为发
生了孤岛。但要结合被动式和主动式检测。
5)研究多逆变器的并网通信、协同控制已成为其孤岛效应检测与控制的
研究趋势。
图2-2 MPPT寻优曲线
• 由于光伏方阵的最大功率点是一个变量,因而采用自寻优算法进行最大功率
点跟踪(MPPT)。这种算法对方阵当前输出电压与电流的检测,得到当前方阵
的输出功率,再与已被存储的前一时刻方阵功率相比较,舍小取大,不断检测,
比较,寻优,如图2-2所示。
A4-2 - 69

最大功率跟踪点(MPPT)
图2-1 硅电池伏安特性曲线图
• 光伏方阵是有多个太阳能电池组合而成,硅太阳电池方阵具有图2-1所示光伏方阵是有多个太阳能电池组合而成,硅太阳电池方阵具有图 所示
的伏安特性。可是光伏方阵具有类似于“电流源”特性。在不同的日射强度
下,它与负载特性L的交点,如a、b、c、d、e等为当前的工作点。然而这些
工作点并不正好落在方阵可能提供的最大功率点上,如a′、b ′ 、c ′ 、
d ′ 、e ′上,这就不能充分利用在当前日射下方阵所能提供的最大功率。
• 如果我们采用控制的方法,使光伏方阵一直工作在最大功率点上,这时光
伏方阵能量利用率将最大 研究表明影响最大功率点的主要因素除材料工艺伏方阵能量利用率将最大。研究表明影响最大功率点的主要因素除材料工艺
外,还有环境温度,以常规单晶硅太阳能电池为例,当环境温度每升高1摄
氏度时,其开路电压下降率约为0.35% ~ 0.45%。
A4-2 - 70

基于导纳最优法的MPPT系统
• 由于光伏电池在不同的工作条件下其输出电能具有不同的伏安特性,呈非线
性特征 因而需要对光伏电池的输出最大功率点进行跟踪 使其输出电能始性特征,因而需要对光伏电池的输出最大功率点进行跟踪,使其输出电能始
终工作在最大功率上,以最大限度地利用太阳能,这对光伏系统的稳定高效
工作起到至关重要的作用。MPPT(Max Power Pointer Tracking)是当前采
用较为广泛的一种光伏阵列功率点控制方式。这种方式实时调整发电系统的
输出电流,来跟踪最大功率点。
• 由于太阳能光伏组件U-I强烈的非线性和受温度的影响很大,这样就使得实
现MPPT变得非常复杂 而目前日本 美国和欧洲主要采用电导增量法现MPPT变得非常复杂,而目前日本、美国和欧洲主要采用电导增量法
(Incremental Conductance Algorithms),国内主要采用的是扰动观察法
P&O(Perturb&Observe Algorithms)、模糊逻辑控制和最优梯度法,但是
上述方法在控制精度、稳定性和运算难度方面均有不足,在实际运用中,要
么对硬件要求高,要么出现程序失序现象,不能保证MPPT系统的正常运行。
• 我们结合电导增量法,和模糊控制法的优点,自主研发了导纳最优法,
建立模糊化的传递函数和反模糊化判决。通过光伏阵列P-U曲线求出光伏方
阵Pmax,快速跟随电压电平变化,不要求很复杂化的算法,能够快速追踪太
阳能电池最大功率,并可以很好地适应各种场合对光伏系统MPPT控制的要求,
试验证明此方法,较电导增量法具有更好的兼容不同系统和快速等效果。经
过大量的实验与测试,显示其实时性和动态性能非常好,而且跟踪稳定,不
会出现误判现象,跟踪精度高达99%。
• 在大型光伏电站系统设计应用中应采用分布式MPPT技术
A4-2 - 71

三、低电压穿越
什么是光伏系统的低电压穿越
Low Voltage Ride Through
低电压穿越(LVRT)最早是在风力发电系统中提出的,对于光伏发电系统是指当光伏电站并网点电压跌落的时候,光伏电站能够保持并网,甚至向电网提供一定的无功功率,支持电网恢复,直到电网电压恢复正常。从而“穿越”这个低电压时间。
A4-2 - 72

• LVRT是对并网光伏电站在电网出现电压跌落时仍保持并网的一
种特定的运行功能要求。
• 一般情况下,对于小规模的分布式光伏发电系统来说,如果电
网发生故障导致电压跌落时,光伏电站立即从电网切除,而不
考虑故障持续时间和严重程度。这在光伏发电在电网的渗透率
较低时是可以接受的。
• 随着并网光伏系统在电网中所占比重越来越大,低电压穿越能
力显得尤为重要力显得尤为重要。
• 当光伏系统大规模集中式并网时,若光伏电站扔采取被动保护
式解列则会导致有功出力大量较少,增加整个系统的恢复难度,
甚至可能加剧故障,引起其他机组的解列,导致大规模停电。
在这种情况下 低电压穿越能力就是必须的在这种情况下,低电压穿越能力就是必须的。
A4-2 - 73

• 风能、太阳能等新能源发电由于受自然条件影响较大,具有波
动性的特点。电站大规模并网发电时,如果其不具备LVRT能力,
将会对电网的安全稳定运行带来极大的隐患,我们国家风电产
业发展过程中已经有过这样的教训,光伏行业不能步其后尘
2008.4 吉林白城的四个风电场风机跳闸。 2011.2.24,中电酒泉风电公司桥西第一风电场出现电缆头故障,导
致16个风电场598台风电机组拖网。国家电监会认为此次事故是近几年中国风电“对电网影响最大的一起事故”
2011.4.25,酒泉风电基地再次发生事故,上千台风机脱网。
调查了几次风机脱网事故之后认为:当前已投入运营的风
电机组多数不具备低电压穿越能力,在电网出现故障导致
系统电压降低时容易脱网。
A4-2 - 74

CGC/GS004:2011 对低电压穿越的要求
5.5.1.2 低电压穿越
对专门适用于大型光伏电站的中高压型逆变器应具备一定的耐受异常电
• 对电力系统故障期间没有切出的逆变器,其有功功率在故障清除后应快速恢复,自故障清除时刻开始,以至少10%额定功率/秒的功率变化率恢复至故障前的值。
对专门适用于大型光伏电站的中高压型逆变器应具备 定的耐受异常电压的能力,避免在电网电压异常时脱离,引起电网电源的不稳定。
低电压穿越过程中逆变器宜提供动态无功支撑。•
• 当并网点电压在图中电压轮廓线及以上的区域内时,该类逆变器必须保证不间断并网运行;并网点电压在图中电压轮廓线以下时,允许停止向电网线路送电。
低电压穿越过程中逆变器宜提供动态无功支撑。
A4-2 - 75

CGC/GS004:2011中,当并网逆变器在低中,当并网逆变器在低
电压穿越时,并未对逆变器的输出电流做出明确强制的规定,也没有对有功无功做出明确的要求。仅仅是保证不间断运行。是比较宽松的。
德国低电压穿越的要求
A4-2 - 76
• 有功输出在故障切除后应立即恢复并且每秒至少增加额定功率
的20%。阴影区域中,有功功率每秒钟可以增加额定功率的5%、
• 网络故障时,机组应能够提供电压支持,如果电压降落幅度大
于机端电压均方根的10%,机组应切换至支持电压。机组必须在
故障识别后20ms内通过提供机端无功功率进行电压支持,无功
功率的提供必须保证电压每降落1%的同时无功电流增加2%。
德国的低电压穿越要求最为严格,也是我国低电压穿越要求的发展趋势。
冠亚电源的低电压穿越技术
A4-2 - 77

四、并网逆变器可靠性设计和技术指标
1、并网逆变器原理( 500KW 为例)
A4-2 - 78

2、可靠性设计
1) 元器件1) 元器件
1.1 IGBT模块具有较低的开关损耗和通态损耗,其饱和压降要低
德国infineon(英飞凌)、西门康和日本三菱
1.2 接触器
由于光伏并网逆变器随太阳起落每天至少开通关断一次,所以对接触器
开关次数有较高要求,而且还需要接触器具有灭弧功能,防止开起关断时起
电弧,影响寿命和安全性。采用品牌接触器。
A4-2 - 79

1.3 空开
由于大功率光伏并网逆变器直流侧电压较高,而且电流较大,在合闸和分断
时会产生电弧,直流系列空气开关应具有较高的耐压和灭弧功能。
1.4 电抗器
电抗器主要起滤波和与电网匹配作用,设计时要充分考虑漏抗绕阻电容,
峰值磁通密度,直流绕阻电阻,高频交流电阻,交流与直流铜损、铁损和温
升,可有效抑制直流分量和电流谐波。
A4-2 - 80

1.5 母线电容
光伏并网逆变器寿命和可靠性很大一方面在于电解电容,应采用品牌电容,
且具有充放电次数高,工作寿命可达10万小时以上。
1.6 散热风机
逆变器在工作过程中功率IGBT会产生开关损耗和通态损耗,最终以热能
传输到散热器,不能及时散热对逆变器的寿命和效率危害较大(高温产生元
器件老化加快,且功率器件是负温度特性,PN结温度越高饱和压降越大,产
生的损耗功率越大),所以及时可靠散热非常重要。滚筒风机具有风量大、
寿命长、低噪声等优点。
A4-2 - 81

1.7 防雷器
防雷器可有效防止雷电及线路产生的浪涌,确保设备不受损坏。可热插防雷器可有效防止雷电及线路产生的浪涌,确保设备不受损坏。可热插
拔式防雷器件,可在不断电、不影响设备正常运行的情况下进行检修和更换 。
1.8 DSP芯片
采用32为数字信号处理器作为控制CPU(DSP数字技术),运用SPWM调制策
略,经过优化的最大功率点跟踪技术保证设备的高效输出最大功率点跟踪
(MPPT)效率>99.99% 。
A4-2 - 82

五、光伏发电系统低压侧并网
1 光伏发电系统直接接入400V及以下电网
光伏发电系统低压侧并网概念
1、光伏发电系统直接接入400V及以下电网
2、即发即用直接和低压侧电网及负载发生联系
3、节约了中高压配电成本及中高压电力变压器成本
4、和中高压系统相比,节省了升压变压器损耗及远程距离传输损耗
5、利用现有配电变压器,分摊了变压器损耗
6 可节省光伏并网发电系统设计施工时间6、可节省光伏并网发电系统设计施工时间
7、可分为逆流系统和不可逆流系统
A4-2 - 83

由 低 侧并 或 户侧并 设 低 侧并 接入的光伏
光伏发电系统低压侧并网特点及要求
• 由于低压侧并网(或用户侧并网),所以设计运用低压侧并网接入的光伏
发电系统应充分考虑人的安全、分布式负载的安全、电网的安全、低压配
电系统的安全、光伏发电系统的安全。
A4-2 - 84

1)电磁兼容
• 传导干扰,辐射干扰:
• 电网对逆变器产生传导干扰:反灌杂音、电压闪变,电气噪声,浪涌电压、
高频分量等。要求逆变器高性能正常工作。
• 逆变器对于电网产生的传导干扰: 电流谐波,电压闪变、直流分量、高
频分量、无功功率等。要求逆变器具有严格的技术参数指标,必须达到权
威机构的检测和认证威机构的检测和认证。
• 逆变器对于空间的辐射干扰: 要求逆变器内部电路结构、PCB板及屏蔽结
构设计严密,必须符合相关标准。
2)绝缘和隔离
• 尽可能选择有输出隔离变压器的逆变设备
• 直流、交流侧配有分断开关
• 具有较高绝缘电压和绝缘电阻
A4-2 - 85

3)并网接入点选择和接入容量设计
• 就近并网(节约电缆及配电设备)
• 接入点配电变压器容量尽可能的大
• 光伏容量选取在总配电变压器容量的30%以内
• 接入点负载要能足以消化光伏电力
• 众多光伏发电接入时,要考虑孤岛保护
4)对配电侧网压稳定及逆流措施
• 采用有载调压型变压器,可使光伏发电站功率与原配电变压器容量接近
• 采用适当的储能设备和是否逆流措施实现电站的收益最大化
• 光伏发电接入容量尽可能在总配电变压器容量的30%以内
A4-2 - 86

5)电能质量
• 电流谐波≤3%
• 功率因数
• 不平衡电流
• 网压跟踪动态响应时间和范围
6)低压侧并网是光伏并网电站最经济的接入方案
• 光伏发电容量选取在总配电变压器容量的30%以内
• 接入点负载要能足以消化光伏电力
• 尽可能的应用低压侧光伏并网电站接入方案
A4-2 - 87

光伏发电系统低压侧接入方案
(一)可逆流系统
光伏系统即发即用,多余电力馈入低压电网
光伏系统即发即用,逆流前将蓄电池充满具有一定的调峰和电网的稳定性
A4-2 - 88

(二)不可逆流系统
1 逆流直接断开发电方案1、逆流直接断开发电方案
2、不可逆流限发电量方案
A4-2 - 89

3、不可逆流时的增加分布负载方案
4、不可逆流时的贮能运行方案
A4-2 - 90

• 微网技术
六、冠亚电源公司及产品介绍
A4-2 - 91
南京冠亚电源我公司自2001年成立以来,经过11年的打拼,已经
发展成为国内技术水平最高、品种最齐全、单机功率
最大的光伏逆变器生产企业之一 公司资产由初创时最大的光伏逆变器生产企业之 。公司资产由初创时
的50万元积累到目前的1.5亿元,职工发展到290人,
拥有各类专业技术人员90多人,其中博士、硕士11人
并有科技部863计划评审专家3人,具有相当强的新产
品研发能力。
公司2011年产能为500MW,2012年800MW,2013
年2GW,2014年3.5GW,2015年5GW。
在突破产能的瓶颈之后,2011年公司将实现4亿元
销售额,将实现利税7000万元,人均年产值约为130
万元。2012年实现销售额7亿元。
公司将在2012年申请江苏省太阳能电源工程中心和
博士工作站。
产、学、研一体化
合作院校
承担项目
国家科技部科技创新项目
国家863计划项目
国家发改委CGF项目
江苏省科技厅重大科技成果转化等重大科研项目。
A4-2 - 92

发展历程
2011年 兴建8万多平米二
2006年 江苏省高科技投资
2007年 兴建了15000平米一
期工厂
2009年 第一台500KW并网电源下线;入围中国“金太阳工程”
2010年 美国麦顿投资公司注资
期工厂
2001年4月 公司成立
2002年 被评定为高新技术企业
2006年 江苏省高科技投资集团注资
小功率并网逆变器系列
主营产品
1.5kW~5kW高频无变压器机型 1.5kW~5kW工频隔离机型
A4-2 - 93

中功率并网逆变器系列
12KW、17KW、22.5 KW三电平无变压器机型
大功率并网逆变器系列:50KW-1000KW
GSG-50KTT-TV GSG-100KTT-TV GSG-250KTT-TV
A4-2 - 94

500kW机型
GSG-500KTT-LV
630kW机型
GSG-630KTT-LV
A4-2 - 95
1MW机型
GSG-1000KTT-LV
主营产品
离网系统 离网逆变器
户用电源
光伏控制器
中小型风机控制器
电力UPS
铁路交直交电源
A4-2 - 96
研发团队
一流的研发中心
每年10%的研发投入
东南大学、南航产学研合作
高层次的技术队伍:博士3人,硕士8人,本科37人
技术说明
— 11年的光伏逆变器研发经验;
— 专业的技术团队,致力于为客户提供最优的技术方案;
— 贴心的售后服务团队,他们总会在你需要的时候为您服务。
A4-2 - 97

质量保证
ISO9001:2008质量管理体系贯穿整个管理过程;
符合RoHs标准;
严格执行6S管理;
建立QCC品质圈,持续改进。
销售发展
A4-2 - 98

青海格尔木200MWp光伏并网电站(一期30MW)
江苏省洪泽县仁和镇陈向村白马湖20MWp光伏电站工程
江苏建湖县建阳镇中电投建湖建阳20MWp光伏电站工程
公司业绩
宁夏大唐国际青铜峡光伏电站二期20MWp工程
宁夏发电集团红寺堡10MWp并网示范电站
青海海南州共和县10MWp光伏并网项目
新疆阿克苏10MWp并网项目
中节能江苏东台一期30MWP滩涂光伏并网电站项目
内蒙古霍林郭勒工业园区立中霍煤车轮7.5MWp金太阳光伏并网发电示范项目
常熟沙家浜9.8MWp屋顶电站项目
上海张江高科技园区10MW金太阳光伏并网发电示范项目
宁夏太阳山二期10MW项目 宁夏太阳山二期10MW项目
南京中电研究院南京南站10MW项目
宁夏固原10MWp光伏并网电站项目
北京经济技术开发区9.3MW金太阳光伏并网发电示范项目
微山新城/山东理工职业学院7.5MWp项目
宁夏发电集团太阳山5MWp项目
河南方孔实业有限公司3.37MWp光伏并网项目
神光新能源3MW光伏并网发电项目……
业绩展示
宁夏红寺堡10MW光伏并网电站 山东微山新城30MW,一期6MW项目
南京南站10MW项目 江西天能0.5MW屋顶电站项目
A4-2 - 99

业绩
青海格尔木200MWp光伏并网电站(一期30MW)
江苏东台60MW光伏并网电站江西天能0.5MW屋顶电站项目
公司于2011年预计新建厂房80788平方米
未来五年 新厂房规划
其中:
生产车间 61162 平方米
研发楼 6094 平方米办公楼 6094 平方米辅助楼 7438 平方米
A4-2 - 100

未来五年
研制/开发大功率产业化项目
研制/开发大功率(单机1000KW以上)光伏并网逆变器的产业化项目,推动大
型光伏并网示范电站的建设,3年内产能达到5GW,成为世界领先的专业光伏逆变器
设备供应商。
行业认可
技术企
业资信等级证书
术进步优秀项目奖
高新技术企业认定证书
高新技术产品认定证书
太阳能电源控制器
高新技术产品认定证书
光伏并网逆变器
A4-2 - 101

中国可再生能源学会产业工作委员会 副主任委员单位
中国电源学会会员
江苏省风电产业技术创新联盟
骨干单位
江苏省光伏产业协会
理事单位
中国低碳经济发展促进会
常务理事单位
国内外相关认证
金太阳认证 TUV认证 AS4777认证
A4-2 - 102

知识产权
18项专利正在申请中
谢 谢!
冠亚电源欢迎您莅临指导!
A4-2 - 103

Renewable Energy Development Appendix 4 : Presentation Materials Final Report Appendix 4-3 : Final Workshop
APPENDIX 4-3 : FINAL WORKSHOP
1) Final Report
2) 10MW Integrated PV Station of Golmud City
3) Speech on the Final Workshop and Outcome Extension ADB TA Qinghai Renewable Energy Development Project
4) Prospect of ADB TA Haixi Renewable Energy Development Project

RRENEWABLEENEWABLE EENERGYNERGY DDEVELOPMENTEVELOPMENT ININ QQINGHAIINGHAI
PPEOPLEEOPLE’’SS RREPUBLICEPUBLIC OFOF CCHINAHINA
PREPAREDPREPARED FORFOR
AASIANSIAN DDEVELOPMENTEVELOPMENT BBANKANK
BYBY
NEWJEC INEWJEC INCNC..
SSEPTEMBEREPTEMBER, 2012, 20121
Purpose of the Project
The proposed TA aims to increase the capacity of grid-
connected solar PV system development in Qinghai Province,
by (i) introducing advanced technologies to lower barriers for
development; (ii) enhancing local capacity in planning, design,
construction, supply chain, and operation and maintenance
(O&M); (iii) improving the design of 10 MW class grid-connected
solar PV pilot plants; and (iv) improving provincial government
policy for solar PV development in Qinghai Province.
2
A4-3 - 1

History of Technical Assistance
1. Training
(1) The First Training April 25 to April 28, 2011 4 days
(2) The Second Training(2) The Second TrainingJuly 04 to July 30, 2011 27 days
(3) Overseas Training in JapanOctober 24 to October 30, 2011 7 days
2. Seminar and Workshop
(1) Seminar April 27, 2011 and April 28, 2011 Xining
(2) Interim Workshop December 12, 2011 Xining
(3) Final Workshop September 11, 2012 Xining
3
Contents of Final Report
1. Background
2 Advanced Technology for Grid-connected Solar PV2. Advanced Technology for Grid connected Solar PVSystem
3. Capacity Development
4. Review Design of a Pilot Grid-connected Solar PVSystem
5. Knowledge Dissemination on Grid-connected SolarPV Systems
4
A4-3 - 2

1. Background
Since the beginning of the 21st century, many grid-connected PVpower stations of MW class have been built in various countriesover the world, and the People’s Republic of China (PRC) has alsoworked out many programs to construct MW class grid-connectedPV power stations.
The Qinghai Provincial Government has set a development agendafor promoting solar energy. The installed capacity of grid-connectedsolar PV systems in Qinghai Province will be increased to 920MWby the end of 2011 and 20 GW whole in China.by the end of 2011 and 20 GW whole in China.
5
2. Advanced Technology for Grid-connected Solar PV System
2.1 International Best Practices for Grid Protection Design and System Configuration for a 10MW-class Grid-connected Solar PV System
2.1.1 Principal of Demand and Supply Power Balance
The system frequency refracts the balance between powerconsumption and power generation and it is essential to maintainthe system frequency fluctuation within certain level for avoidingserious system accident.
6
A4-3 - 3

Renewable Energy (RE) such as solar, wind, biomass and so on,has being introduced rapidly into the power system towardsenvironmental protection for the production of gases such as SOx,NOx and carbon dioxide.
On the other hand, disadvantage for RE also exists.Most issue is wide fluctuation of the output power generated byRE.
Under these situation mentioned, it should be required advancedgrid- connection technology of Mass PV generation especiallyg gy g p ycontrolling supply-demand balance during the short and longperiods for supplying stable energy into the power system.
7
In PRC, power demand has been rapidly increasing as rapid social development in thecountry. Installation of large-scale solar PV systems is one of the projects to secure thepower supply to meet the increasing demand. However, power supply enhancement by
2.1.2 Influence on a Power Grid due to Rapid Expansionof Solar PV Systems and Countermeasures by PV Power Stations
installation of a large-scale solar PV system in a certain place brings about followingconcerns to a power grid.
(1) Supply – demand balance(2) Grid stability
Countermeasures to be taken by solar PV power systems against such issues aredescribed below.
(1) Transmission of real-time operation data(2) Equipment of fault ride through (FRT) function
In Golmud district of PRC, power supply would exceed the demand and surplus powerwould be generated when a solar PV system is installed. Following measures can beconsidered;
1) Output control of the solar PV power system,2) Expansion of transmission lines
8
A4-3 - 4

It still remains some issues to realize stable operation of the powergrid. As countermeasures against this issue, it is required to collectand store the real-time operation data and continuous operationrecord of the solar PV power system. Therefore, the facility thattransmits such information is required to be installed in the solar PVtransmits such information is required to be installed in the solar PVsystem.
Countermeasures by the solar PV power system are expected forthe grid stability. A solar PV power system has a possibility ofunexpected trip when a power system disturbance (voltage sag,etc.) occurs, which can cause the power system collapse at worst.) , p y pTo prevent such problem in a power system, FRT is equipped,which is essential facility as increasing PV power system. FRT isnot requested by the electric power company at present, but itseems to be requested in future.
9
[ Common characteristic between wind power and PV power ]1) The generated power is liable to variation caused by using unstable natural
source.2) N bilit t k id t bilit d b i i t t t
2.1.3 Impact on a Grid by Renewable Source Power Plant with Large Capacity
2) Non capability to keep grid stability caused by using inverter system to connect with the grid.
The above characteristics give negative impact on a grid to keep supply-demand balance and stability.
(1) Supply Capacity and Demand
Table 2-1 Supply Capacity and Demand in Germany and SpainGermany
(Area operated by VE-T*1)Spain
(Area operated by REE*2)Demand [MW] 1,100 (at 2007) 4,500 (at 2007)
Supply Capacity
[MW]
Wind Power 897 (at 2007) 1,560 (at 2008)PV Power N.A. (at 2007) 310 (at 2009)
Others 2,290 (at 2007) 7,140 (at 2007)
Table 2 1 Supply Capacity and Demand in Germany and Spain
*1: Vattenfall Europe Transmission, One of TSO (Transmission System Operator) in Germany*2: RED Electrica de Espana, TSO in Spain (Souse: Research report of study grope presented by METI, Japan) 10
A4-3 - 5

(2) Impacts on Grid Stability and Measures
Table 2-2 Impacts on the Grid and Measures
Impact Measures
Supply -demand balance
Impact-1Excessive supply generated by therenewable source power plants
Power reducing operation of the renewable source power plants.(Spain)
Storage the generated power by battery, pumped storage powerplant, etc., because the generated power by the renewable sourcep , , g p ypower plants must be supplied without power reducing operationcomply with government policy. (Germany)
Grid stability
Impact-2The heavy power flow causes criticalgrid condition with small margin of N-1criteria frequently.
Power flow operation with/without neighbor TSO’s grid operation.At emergency condition, power reducing operation of therenewable source power plants. (Germany)
Power reducing operation of the renewable source power plants.(Spain)
Impact-3Unexpected power flow caused byconcentrated wind power plants
Stability analysis studies are carried out by organization set up bythe related TSOs.(Germany)p p
increases around Germany’s grid.( y)
Impact-4Misgiving of emergency trip at theinter-connection lines caused by theunexpected trips of a large number ofthe wind power plants.
Specified organization for renewable source power plants isestablished to control these plants. (Spain)
A renewable power plant is obligated to equip FRT function.Requirement of FRT function is prescribed in Grid Code.
(Source : Research report of study grope presented by METI, Japan)11
2.1.4 Impacts and Measures to be taken into account for Grid Protection
The impact to be taken account for solar PV systems which
are to be installed in Qinghai Province is “Impact-4:
Misgiving of emergency trip at the inter-connection lines
caused by the unexpected trips of a large number of the
wind power plants”, and FRT function is required to keep
grid stability.
12
A4-3 - 6

PV grid-connected inverters are concentrated in the followingaspects:
2.2 Power Conditioner
- High quality electric energy conversion,- Safety protection requirements for system,- High reliability,- Maximum power tracking.
The main principles for requirements on inverters are: large powerp p q g pinverters, on the basis of high efficiency and low harmonic content,to have regulated power factor, to participate in grid dispatching,and also to have fault ride through (FRT) function which is able toresist certain grid fault.
13
In the system deployment for PV power station supervisory system, a three-level patternis adopted, to realize coordinated functioning with a distributed framework of PV powerstation data center and monitoring center
2.3 Master Control and Monitoring
2.3.1 Design Principle for Supervisory System
station, data center and monitoring center.
Level I, data management:the self-reliance data management in the PV power station, an intelligent datacollector, the data are transmitted in real-time to a small sized real-time database.
Level II, data center:it is the comprehensive management center for all subordinated PV power stationdata, mainly deployed with large sized real-time database and backup real-time, y p y g pdatabase, and historical data with. Meanwhile, video server, mail server and printoutserver are arranged in the network.
Level III, data monitoring:the monitoring center mainly displays various data, dynamic display of data withrolling play-out on large screen is adopted.
14
A4-3 - 7

2.3.2 Smart Grid Technology
One of the latest international technologies of MCM for grid-connectedsolar PV system is the smart grid.
- In case of a small grid which is consist of small, limited demand anddispersed renewable power source in a small area, and it is controlledefficiently, it is called smart grid.
- The Smart grid is highly expected by its efficiently energy use andgoes forward to the practical use.
The smart grid technology is expected to be introduced for the effectiveoperation of PV power generation and the stabilization of power qualityoperation of PV power generation and the stabilization of power quality.
New Energy and Industrial Technology Development Organization, Japan(NEDO) has been conducting demonstrative researches andtechnological development.
15
In this research, a PV power generation system was installed on 553 houses,respectively (Total system capacity for 553 houses: 2,129 kW) with lead storagebatteries having storable power energy equivalent to approximately 6 kWhattached to each system
(1) Demonstrative Research on Clustered PV Power Generation Systems
Substation Transformer
Pole Transformer
High-voltage Power Distribution Line
Solar Cell Array
Connection BoxHousehold
Load Distribution Line
Junction Box
PV systems installed: 553 units Total PV capacity: 2,129 kW Average system capacity: 3.85 kW
Outdoor StorageBox
Measuring Instruments Batteries, Power Conditioner Low-voltage Power
Junction Box (Outdoor)
Developed a technology that avoids outputrestriction for clustered interconnection ofPV power generation systems
Fig.2-1 Demonstrative Research in Ota City, Japan16
A4-3 - 8

(2) Verification of Grid Stabilization with Large-scale PV Power Generation Systems
It will be required to evaluate the influence of interconnection of large scalePV power generation to power grid on power quality such as fluctuations involtage and frequency, and apply output control technologies using a powerstorage system for power grid stabilization.
(3) Demonstrative Research on Stabilization of PV Power Generation System for Large-scale Power Supply
A site located in Wakkanai CityFig 2.2 shows the results of basic output fluctuations preventive controltesting ith the se of NAS batteries (PV po er generation 2 MW NAStesting with the use of NAS batteries (PV power generation: 2 MW, NASbatteries power generation: 0.5 MW). We made a comparison of PV poweroutputs and found that outputs from the power plant were smoothed.
17
4000
5000
W]
80
100
y [%
]
Remaining capacity of battery PV output
-1000
0
1000
2000
3000
Pow
er o
utpu
t [k
W
20
40
60
Rem
aini
ng c
apac
ity
Power plant output
NAS output
Fig.2-2 Results of Output Fluctuations Preventive Control Testing(Moving Average Target Control)
-20004:00 6:00 8:00 10:00 12:00 14:00 16:00 18:00 20:00
0
18
A4-3 - 9

Tilt angle of PV array is in many cases designed to have thesame angle as the latitude of the site. When the diffused
2.4 Assessment Tools
2.4.1 Insolation and Estimation of Generated Energy
same angle as the latitude of the site. When the diffusedsunlight is taken into account, optimum tilt angle of PV array maybe different from the latitude.
With the assessment method introduced here, a fish eyeprojection method, a picture taken with a still camera with fish-eye lens is used to evaluate the insolation including diffusedsunlight.
19
Table 2-3 Estimation of Power Generation using Fish-eye Lens(Tilt angle 35)
monthIrradiation with tilt
angle 35[kW/m2day]
Average temperature
[C]
Power generation on direct current side
[kWh/month]
Power generation on alternative current side
[kWh/month]1 4.36 -6.2 1,209,688 1,149,2042 4.64 -3.1 1,140,868 1,083,8243 5.47 1.9 1,450,160 1,377,6524 6 12 7 2 1 539 550 1 462 5724 6.12 7.2 1,539,550 1,462,5725 6.12 11.6 1,535,355 1,458,5876 5.78 16 1,381,272 1,312,2087 6.38 18.6 1,536,558 1,459,7308 7.16 17.7 1,707,878 1,622,4859 7.39 12.9 1,752,311 1,664,69610 6.75 6.4 1,681,482 1,597,40811 5.98 0.7 1,484,350 1,410,13312 4.77 -3.9 1,288,771 1,224,332
Total 70.93 6.65 17,708,243 16,822,830
Fish Eye lens and Camera20
A4-3 - 10

This estimation was compared with that derived with other methods, one was NASA’s and the other is QBE’s Feasibility Study results. Estimation of insolation for the site for 10 MW Pilot Project by QBE was presented in their Feasibility Study Report whose excerpts were provided to the Consultant.p
Table 2-4 Insolation Estimation by Three Different Models
Jan. Feb. Mar. Apr. May Jun. Jul. Aug. Sep. Oct. Nov. Dec. Total
QBE site 145.3 147.2 179.7 201.8 214.5 199.4 201.7 210.1 193.0 195.6 165.2 143.3 2197
(kWh/m2for each month and yearly total)
NASA 176.7 168.3 196.9 193.8 186.3 167.4 170.5 172.1 168.0 198.4 179.1 169.0 2146
fish-eye 135.2 129.9 169.6 183.6 189.7 173.4 197.8 222.0 221.7 209.3 179.4 147.9 2159
21
Table 2-5 Estimation of Power Generation using Fish-eye Lens(Tilt angle 25)
monthIrradiation with tilt
angle 25[kW/m2・day]
Average temp.[C]
Power on direct current side [kWh/month]
Power on alternative current side [kWh/month]
1 4 46 -6 2 1 236 729 1 174 8931 4.46 6.2 1,236,729 1,174,893 2 4.72 -3.1 1,159,484 1,101,509 3 5.56 1.9 1,469,995 1,396,495 4 6.20 7.2 1,559,248 1,481,286 5 6.21 11.6 1,554,799 1,477,059 6 5.87 16.0 1,399,562 1,329,584 7 6.47 18.6 1,555,423 1,477,652 8 7.25 17.7 1,727,017 1,640,666 9 7.49 12.9 1,771,441 1,682,869 10 6.86 6.4 1,706,466 1,621,142 11 6.13 0.7 1,519,082 1,443,128 12 4.90 -3.9 1,323,061 1,256,908
Total 72.11 17,982,306 17,083,191
22
A4-3 - 11

2.4.2 Technical Application of the large Capacity Solar PV System connected to the Power Grid
(1) Task of Grid-connected Solar PV System
There are two issues by the fluctuation for the grid-connected solar PVsystem as follows;
- Fluctuation of the power grid voltage caused by the reverse powerflow to the power grid from the solar PV system
- Supply and demand control to regulate the frequency of the gridconnected to the solar PV systemsconnected to the solar PV systems.
23
1) Restrain of fluctuation voltageFor restrain of fluctuation voltage it is effective to control the voltage fluctuation at the connection point to the power grid and fix the grid voltage within specified value according to control reactive power and install SVC (Static Var Compensator) at the connection point to the
id
(2) Countermeasures
power grid.2) Supply and demand power control
It is necessary to keep the frequency stability at the appropriate level for supply and demand power control of the power grid connected to the large solar PV system. As the counter measure of this difficulty, micro grid technology is being developed.In case of the solar PV system, insolation prediction is related to theIn case of the solar PV system, insolation prediction is related to the prediction of the solar PV system and it is also necessary to consider the prediction of power generation which changes every hour.
(3) Insolation Prediction by Weather ForecastInsolation estimation is important for supply and demand control.
24
A4-3 - 12

Table 2-6 Prediction Method of Insolation and Quick Demand/Supply Control Method in Japan
Control interval
Outline of prediction method and control method Source
Prediction method that based on the weather datasupplied by Europe Center of Meteorological WeatherForecast (ECMWF), solar PV power output is predicted
IEEEJournalVol.2, No.1, pp2-10 (2008)
Generation Plan
( ), p p pevery one hour.
( )
The insolation data of the next day is predicted every30 minutes by the territorial data of the JapanMeteorological Agency.
IEEJ Annual Meeting, 2009,No.7-049 (2009)
The insolation data of the specific time is predictedbased on the area weather forecast of every threehours of the Japan Meteorological Agency.
IEEJ Trans. PE, Vol. 127, No.11, pp.1219-1225 (2007)
Long interval control
(1 t l5 to 15minutes interval insolation prediction is testedb d th d t b f th t th f t
IEEJ Technical Meeting onP S t E i i(1 to several
minutes interval)
based on the data base of the past weather forecastand the area weather forecast in rather short time.
Power System Engineering,PSE-11-17 (2011-01)
Short interval control
(second level interval)
The power storage system which quickly responds tofluctuation of the Grid power for compensation of activepower is applied.
IEEJ Trans. PE, Vol. 127, No.3, pp.451-458 (2007)IEEJ Trans. PE, Vol. 129, No.12, pp.1553-1559 (2009)
25
2.4.3 Weather Forecast
(1) Cloud Prediction
Solar PV system generates electricity by direct and diffused sunlight and thestrength of direct sunlight is several times stronger than the diffused sunlightg g g g
1) Macro Predictionfor a few hours or for a few days in a macro view
2) Micro Predictionon the satellite photo
As Golmud site is forming a gigantic conglomerate of PV power stationsAs Golmud site is forming a gigantic conglomerate of PV power stations,establishing such kind of service for the area will be highly valued by both PVpower station operators located in Golmud and the grid operator of Qinghaiprovince as well.
26
A4-3 - 13

2.4.4 Simulation Tools
Generation amount (kWh) of the solar PV system dependson amount of the insolation and ambient temperature ofthe site and it has a direct impact on a project viabilitythe site, and it has a direct impact on a project viability.Therefore it is necessary to have a feasibility study bysimulation tools to check cost and benefit of a PV project.Free simulation tool named RETScreen is an easy to useexample for preliminary study. This can be downloadedfrom RETScreen International. : http://www.retscreen.net/
27
2.4.5 Outline of RETScreen
This tool provides the following functions:
E bl t f ibl j t t l t Enables assessment of possible projects at low cost
Free-of-charge to users around the world via the Internet &CD-ROM
Training & technical support available via an internationalnetwork of RETScreen Trainers
I d t d t & i ibl i I t t Industry products & services accessible via an InternetMarketplace
28
A4-3 - 14

3. Capacity Development3.1 Performance Assessment of the Selected Grid-connected
Solar PV System
(1) Insolation Estimation
QBE’s engineers estimated insolation for 10MW Pilot Project Site with acomputer program authorized in the PRC.
Table 3-1 Estimated Insolation at Golmud Site
tilt angle 36 tilt angle 36Jan. 145.31 Aug. 210.14F b 147 24 S 193 04
(kWh/m2)
Feb. 147.24 Sep. 193.04Mar. 179.73 Oct. 195.59Apr. 201.78 Nov. 165.19May 214.54 Dec. 143.30Jun. 199.42 Winter half year 976.36Jul. 201.67 Summer half year 1220.58
total year 2196.94
29
(2) Evaluation of Site Analysis
Generally speaking, appropriate site conditions for PV power generation are as below;
1) Good insolation,
2) Sufficient flat land to install PV modules,
3) Existence of no obstacles that cast shadows on PV modules throughout a year,
4) Proximity of electric grid enough with sufficient capacity to send the generated power,
5) Access to the site to transport equipment and construction machines5) Access to the site to transport equipment and construction machines,
6) Availability of water for installation and maintenance,
7) Appropriate climatic conditions, mild wind in particular,
8) Existence of less sandy dust.
30
A4-3 - 15

(3) Evaluation of Site Analysis
1) Tilt Angle of Solar PV PanelIt is recommended to have lower tilt angle of the solar panel for the Golmud PV system for increase of power generation of the solar PV system.
2) Sample of Mega Solar PV system in JapanSakai Mega Solar PV Power Station, KANSAI Electric Power Co., construct 10 MWsolar PV system in Sakai city, Osaka prefecture, Japan and it is the test plant forelectric power company.
Item VerificationFacility Construction - Reduction of construction cost
- Decision of plant specification as an industrial use facility (Japan’s first industrial-use solar power generation plant)
Operation - Reduction of maintenance and management costSystem Fluctuation in - Analysis of output fluctuations at a mega solar power generation
Table 3-2 Verification Items
System Fluctuation in frequencies
Analysis of output fluctuations at a mega solar power generation
Fluctuation in voltages
- Analysis of normal system voltage fluctuations at a mega solar power generationplant
- Verification of effectiveness of the measures against normal system voltagefluctuations; operating method of power conditioners, etc.
High Harmonic - Verification of high harmonic occurrence levels due to the interconnection ofmultiple inverters (power conditioners)
Drop out of all generators
- Verification of voltage decrease rate due to a failure at the upper voltage systemand the range of continuous operation of power conditioner
31
Operator: Jointly operated by Sakai city and Kansai Electric(public relations: Sakai city, construction & operation: Kansai Electric)Location: Industrial waste landfill in Sakai No. 7-3 DistrictArea: approx. 20haPower output: 10MW (10,000kW)Generated electricity: approx. 11million kWh/yearInstallation: on groundOperation schedule: partially started on October 5, 2010 (approx. 2.85MW)p p y , ( pp )
planned to fully start on October 2011
32
A4-3 - 16

3.2 Capacity Assessment of 10MW PV System
QBE has many experiences of having installed isolated PVsystems over 100 sites already.
- The PV system configuration was well considered to generatesolar power, and main power circuit was well arranged in theform of unit arrangement.
33
3.3 Solar Supply Chain
The Consultant visited the ingot factory of Qinghai China Silicon EnergyCo. several times and received brief explanations on how the productionprocess was managed.
- It is considered very difficult to avoid the yellow sand intrusion into thefactory by the nature of the locality in Qinghai, China. Therefore,appropriate countermeasure is required to prevent the yellow sandgetting into the building.
- Required quality of mono-crystalline silicon necessary for ICsemiconductor and solar cell is different, but converting measure of
l t lli ili i t t lli ili i thpoly-crystalline silicon into mono-crystalline silicon is the same.
- It is important to improve the quality of products, which requires payingmore attention to the cleaner conditions of workers, equipment,facilities.
34
A4-3 - 17

3.4 Technical Guidance Note and Capacity Enhancement Module
(1) Reactive Power
A PV plant supplies only effective power to the power grid. However, to
stabilize the power grid reactive power is needed Grid systems in the PRCstabilize the power grid, reactive power is needed. Grid systems in the PRC
seem to have been designed with consideration to this issue as there are
SVCs (Static Var Compensators) installed in the grid, which supply reactive
power.
(2) Lightning Protection
The lightning protection of 10MW Pilot Project has been designed well. 10g g p j g
MW Pilot Project has been designed to be installed with SPD (Surge
Protective Device) in each joint box.
35
(3) Overloading Operation of Transformer
The result of continuous overloading condition is shown in the Table 3.3. If theload factor is assumed to be around 0.3, the expected transformer lifetime for themodel chosen by QBE engineers would be over 1000 years. The size of thetransformer can be reduced, by allowing to have some over-loading situations.
Table 3-3 Transformer Life Timeload factor
(%)highest temp. of coil
(C)ratio of lifetime
100 145 1
105 155 0.42105 55 0
110 165 0.177
36
A4-3 - 18

(4) Wiring between Modules
Wiring needs more length for setting to absorb vibration and to avoidrubbing against PV frame.
Fig.3-1 Wiring between Modules
37
(5) Tilt Angle of PV Array
Tilt angle of PV array was set at the same angle as site latitude for the 10MWPilot Project. This counts for direct sunlight only. As shown in Fig.3.2, solid angleof sky becomes larger as the tilt angle becomes smaller, meaning PV modulescatch more of diffused light.
(a) Tilt angle 35solid angle of sky 4.67 steradian
(b) Tilt angle 25solid angle of sky 5.12 steradian
Fig.3-2 Solid Angle of Sky by Different Tilt Angle38
A4-3 - 19

(6) Direct Current Protection
When grounding accident happens in the DC circuit of a solar PV system, the DC fault current flows from PV array through transformer to the ground. DC fault current flows in the transformer as shown in Fig. 3.3. Some manufacturers install detection rely inside the inverter. It is possible to set this function outside the inverter, such as DC OVGR (Over Voltage Ground Relay)., ( g y)
PV
Grounding
270kV/350V Transformer
Transless Inverter
DC fault current
Fig.3-3 Direct Fault Current Flow
39
(7) Short Circuit Current Protection at the Substation
In the case of short-circuited failure, the fault current will flows from not onlytransformer but also other transmission lines that are connected PV system.Therefore, the capacity of circuit breaker should be designed to have enoughendurance of those total current.
A
B
A : Short circuit current from transformer B : Short circuit current from PV system through other transmission
PV System PV System PV System PV SystemFig.3-4Short Circuit Current
and Circuit Breaker40
A4-3 - 20
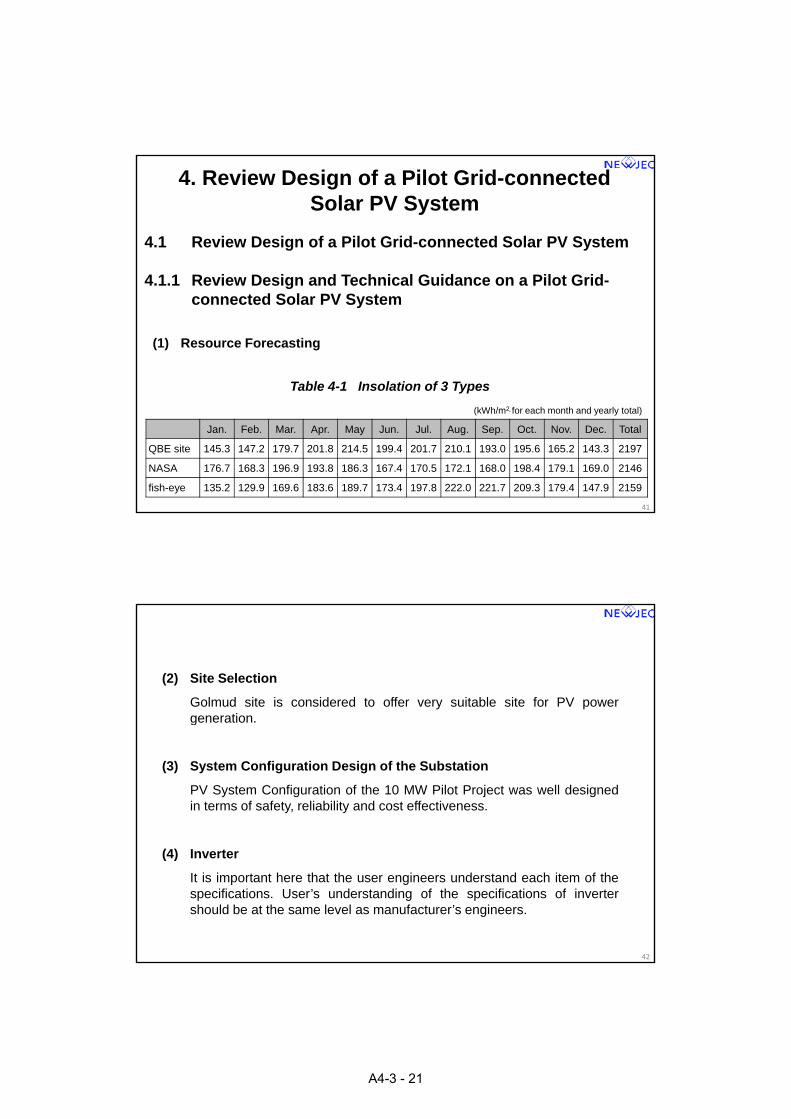
4. Review Design of a Pilot Grid-connected Solar PV System
4.1 Review Design of a Pilot Grid-connected Solar PV System
4 1 1 R i D i d T h i l G id Pil G id4.1.1 Review Design and Technical Guidance on a Pilot Grid-connected Solar PV System
(1) Resource Forecasting
Table 4-1 Insolation of 3 Types
Jan. Feb. Mar. Apr. May Jun. Jul. Aug. Sep. Oct. Nov. Dec. Total
QBE site 145.3 147.2 179.7 201.8 214.5 199.4 201.7 210.1 193.0 195.6 165.2 143.3 2197
NASA 176.7 168.3 196.9 193.8 186.3 167.4 170.5 172.1 168.0 198.4 179.1 169.0 2146
fish-eye 135.2 129.9 169.6 183.6 189.7 173.4 197.8 222.0 221.7 209.3 179.4 147.9 2159
(kWh/m2for each month and yearly total)
41
(2) Site Selection
Golmud site is considered to offer very suitable site for PV powergeneration.g
(3) System Configuration Design of the Substation
PV System Configuration of the 10 MW Pilot Project was well designedin terms of safety, reliability and cost effectiveness.
(4) Inverter
It is important here that the user engineers understand each item of thespecifications. User’s understanding of the specifications of invertershould be at the same level as manufacturer’s engineers.
42
A4-3 - 21

(5) Control
There are many PV projects in Golmud and the total output willreported to reach 200 MW. Therefore the stability of the grid will be thelargest concern of the utility and there will have to be a means tolargest concern of the utility, and there will have to be a means tocontrol solar PV power plants in the area.
(6) Cost Effectiveness and Efficiency
For designing a solar PV system, cost effectiveness and efficiency ofequipment (PV panel, power condition, circuit breaker) should beq p ( p p )considered.
43
4.1.2 Power Grid in Golmud and Technical Guidance on Grid Protection
(1) Demand Forecast and Power Balance in Golmud AreaThe supply will be on the short side in near future if PV power plants will notbe installed although some new hydro/thermal power plants will beconstructed. Therefore, the PV power plants should be constructed whilepower balance is being kept.
Demand
Supply
Legend
(excluding PV power)
Supply
Power balance [MW] Power balance [MW]
Winte Summer
(including PV power)
Fig.4-1 Power Balance in Golmud Area44
A4-3 - 22

(2) PV Power Plant
1) China Science and Technology Photovoltaic Power Holding Co., Ltd., 10MW2) CPI Huajing Power Holding Co., Ltd., 20MW3) Guodian Longyuan Golmud New Energy Development Company, 20MW4) Qinghai New Energy Group Corporation, 10MW5) Huaneng International Power Development Company, 10MW 6) Qinghai Junshi Energy Co., Ltd., 10MW) Q g gy , ,
Haixi Grid 110kV Lines or Substation
110 kV Substation
(110/35kV T f )
a. 110 kV Transition lines
b. 110 kV Substation Fig.4-2
Owner, Construction and Operation Scheme
(110/35kV Transformer)
PV1 PV2 PV3 PV4 PV5 PV6
c. 35 kV Transition lines
d. PV power plant
Six (6) PV power plant companies 45
(5) Fault Ride Through (FRT) Function
FRT function isessential to keep thegrid stability and it isapplied to the wind/PV
[%]
100 R
Requirement on LVRT*1 level recovery time
Required time and voltage
90pppower plant in thecountries, which havehuge scale of wind/PVpower plants, and gridoperator in Qinghaialso intends to do so.
Within 1 Sec
[Sec]
Rem
ained Voltage
0 0
80
0 5 2.0
90
20 30
Japan (before March, 2017)
China
Time 0.0
Start time of voltage drop
0.5 Voltage recovered
2.0
*1 LVRT: Low Voltage Ride Though = Fault Ride Through,
Value of remained voltage to be continuous operation
Fig.4-3 Requirement on FRT Function in China
46
A4-3 - 23

Continuous operation by FRT function
Recovery operation
Usual operation
Grid voltage
Output current of inverter
Fig.4-4 Result of Factory Test of the FRT Function(designed by Japan Manufacture)
Keep the stable output current
47
4.2 Financial Study of 10 MW Pilot Project
Framework of the Study
1) Subject of the study 10MW Pilot Project
2) Cost information QBEC’s F/S Report2) Cost information QBEC s F/S Report
3) Conditions NRDC’s Instruction for PV Project Proponents
Method of the Study
1) Project FIRR vs WACC not adopted
2) Equity IRR with Sensitivity Analysis
3) Income increasing measures considered
48
A4-3 - 24

Result of Analysis financially unviable (FIRR/e=4.46%)income-increasing/expense decreasing measures required
Measures considered (and desirable)
1) expanding project life from 20yrs to 25 yrs
2) additional income from CDM CNY 0.05/kWh
3) introduction of soft loan Loan Period max 25yrs3) introduction of soft loan Loan Period max 25yrs(50% of Investment Cost) grace period 5yrs
Interest Rate 2.60%
49
Result after measures introduced
change FIRR/e
(a) With Soft Loan 50% of investment 8.73%
(b) + Longer Project Life 25 years 10.72%
(c) + Additional Income from CER CNY 0.05/kWh 10.05%
(d) + Both of (b) and (c) 11.89%
Other implicationsOther implications
1) Concessional Tariff may not be sustainable.
2) Projects need access to foreign funds.
3) Disclosure of information is desirable.
50
A4-3 - 25

5. Knowledge Dissemination on Grid-connected Solar PV Systems
5 1 N ti l D l t Pl5.1 National Development Plan
(1) Specific Supporting Policy for PV Power Generation
In July 2011, the National Development and Reform Commission issuedthe “Circular on completing policies on electricity price to the grid for solarenergy PV power generation”, deciding to adopt a national unifiedb h k l t i it i t th id f PV ti itbenchmark electricity price to the grid for PV power generation, itspecified that, for PV power generation projects approved for constructionbefore July 1, 2011 and able to complete before December 31, 2011, anelectricity price to the grid of CNY 1.15 per kWh would be adopted.
51
(2) Twelfth Five-year Plan Period
The total installed capacity of PV power generation in China will be 10GW by theend of 2015, 50GW for the year 2020 higher targets were set as 15-20GW in2015 and 100GW in 2020, which are not impossible to realize.
Required annual average growth rate
Low plan
Medium plan
High plan
Fig.5-1 Development of PV Power Generation in Chinawith Three Scenarios 52
A4-3 - 26

(3) Production of Grid-connected Power Generation
142.0150.0
W)
离网 Off-grid 并网 Grid-tied
8.8 7.4 9.017.8 19.0 18.0
1.2 1.5 1.0 2.2
21.0
0.0
50.0
100.0
2004 2005 2006 2007 2008 2009
装机
Ins
talla
tion (
MW
Fig.5-2 Market Distribution of Off-grid and Grid-connectedPV Systems during Past Years
公历年 Year
53
5.2 PV Development Policy and Status in Qinghai Province
Qinghai Province is the best area in comprehensive conditions toconstruct large-scale ground PV power stations in Chinaconstruct large-scale ground PV power stations in China.
These projects were the Qinghai 930 projects as referred to byoutsiders. Details of such projects are shown in Table 5-3.
So, the installed capacity of solar PV power station in QinghaiProvince will reach 2GW by the end of 2012.y
54
A4-3 - 27

Table 5-3 Registered Companies and Applied Projects of Qinghai930 Projects in Haixi Prefecture
No. Project owner New capacityPlanned total
capacityProject for 1.15 electricity price Location
1 Longyuan Golmud New Energy Development Co., Ltd. 30 200 20 + 30 = 50 Golmud2 Yellow River Upper Reaches Hydropower Development Co., Ltd. 200 1000 200 Golmud3 Guodian Power Qinghai New Energy Project Preparatory Office 10 200 10 Golmud4 China Three-gorge New Energy 5 10 5 Golmud5 Beijing Beikong Green Science and Technology Industrial Co., Ltd. 20 50 20 Golmud6 Qinghai Water Conservation and Hydropower Group 10 20 10 Golmud7 CPI Golmud Photovoltaic Power Generation Co., Ltd. 30 200 20 + 30 = 50 Golmud8 Jinzhou Sunshine Energy 20 20 20 Golmud9 Qinghai Project Preparatory Office of Datang Shandong Branch 20 20 20 Golmud
10 Huaneng Golmud Photovoltaic Power Generation Co., Ltd. 30 200 30 Golmud11 Qinghai Baike Photoelectrical Co., Ltd. 8 10 2 + 8 = 10 Golmud12 China Huadian Photovoltaic Power Generation Co., Ltd. 10 10 10 Golmud13 Zhejiang Zhengtai Solar Energy Science and Technology Co., Ltd. 20 20 20 Golmud14 Qinghai Jingneng Construction Investment Co., Ltd. 20 100 20 Golmud15 Shengguang New Energy Co., Ltd. 2 20 1 + 2 = 3 Golmud16 Qinghai Datang International Energy Project Preparatory Office 20 20 20 Golmud17 Qinghai New Energy Group Corporation 10 10 10 Golmud18 Qinghai Junshi Energy Co., Ltd. 8 10 2 + 8 = 10 Golmud19 Qinghai Provincial Development and Investment Co., Ltd. 2 2 2 Golmud20 Y ll Ri U R h H d D l t C Ltd 30 50 30 Ul20 Yellow River Upper Reaches Hydropower Development Co., Ltd. 30 50 30 Ulan21 CEC Solar Energy Co., Ltd. 10 10 10 Da Qaidam22 Guodian Qinghai Branch 20 20 20 Delingha23 Qinghai Linuo Solar Energy Power Co., Ltd. 30 30 30 Delingha24 China Wind Power Group 30 50 30 Delingha25 CEC Solar Energy 20 200 20 Xitieshan26 CGNPC Solar Energy Development Co., Ltd. 90 100 10 + 90 = 100 Xitieshan
Total 705 2582
760(including 45MW at Golmud
and 10MW at Xitieshan already connected to grid)
55
5.3 Recommendation for Development Planning, Funding and Investment Incentives
Rapid development of PV power generation construction in Qinghai Province willgreatly spur the PV industry development in China.First, to implement many projects in a short period of time with short will beFirst, to implement many projects in a short period of time with short will besubjected to pressure from aspects of materials procurement, transport, etc.Second, as construction standards, project specifications and quality acceptancestandards have not been unified.
1) Therefore, it is suggested that department in charge in Qinghai Provinceorganize technical teams in a timely manner, to conduct technical evaluationfor projects during implementation, strengthen the supervision requirements on
t ti t th th f t d ti i t ti t i dconstruction, strengthen the safety education in construction enterprises, andprovide better service for investing enterprises, to ensure the healthydevelopment of the whole program.
56
A4-3 - 28

2) The financial exercises in Chapter 4 suggest that, for a PV project to befinancially viable, or the investors can sit comfortable when faced with adverseconditions, there should be some measures taken to improve the cash flow fora concession tariff of CNY 1.15 per kWh.
3) One measure found effective is to extend project life. Longer project life will notl i th fi i l f f j t b t l t ib t t thonly improve the financial performance of projects, but also contribute to the
reduction of carbon dioxide emission for most of carbon dioxide emission fromPV power generation comes from production and installation processes of theequipment.
4) Another effective and important measure is an introduction of soft loan infunding. The authorities in charge of awarding concessions to projects mayalso benefit from monitoring the financial performance of concession projects.Research on financial structures of current PV projects will surely helpformulate promotion policy for coming years.
6) Promotion policy may have to be revised as PV projects are expanding veryrapidly.
57
5.4 Technical Recommendations on Problemof Grid-connected Solar PV System and its Countermeasures
(1) Main Issues
There are two main issues encountered shown as below;
- Fluctuation of the grid voltage caused by the reverse power flow to thepower grid from the solar PV system
- Supply and demand control to regulate the system frequency againstSupply and demand control to regulate the system frequency againstgeneration power fluctuation of the solar PV system
58
A4-3 - 29

(2) Countermeasures
1) Reactive power control of the power conditioner for the grid connectedsolar PV system and SVC (Statistic Var Compensator) installed at theconnection point of the solar PV system for reactive power control areeffectiveeffective.
2) Micro grid technology, namely to construct small size power grid and tocontrol supply and demand power of that power grid is essential toreduce the influence caused by the fluctuation of the large solar PVsystem to the wide range power grid.
3) On the other hands, installation of the electric power storage system(large capacity of the battery) can compensate the fluctuation ofgeneration power of the solar PV system.
4) The FRT function is also essential to keep the grid stability.
59
(3) Recommendation
It is recommended to construct the micro grid by existing solar PVsystems and the solar PV systems which will be constructed in thefuture in Golmud area, and which control supply and demand of themicro grid area and to restrain influence of the wide range grid system.
60
A4-3 - 30

5.5 Optimal System Configuration
(1) Design Key PointIt is necessary to design the solar PV systems which meets itslocation conditionlocation condition.
(2) Tilt Angle of Solar PV PanelIt is recommended to have lower tilt angle of the solar panel forthe Golmud PV system.
(3) Inverter Capacity( ) p yThe capacity of inverter is enough to have 90% of the capacityof the solar PV panels.
61
(4) Transformer CapacityConsidering the utilization factor of the solar PV system in thenight period is zero, less than 90% of inverter capacity is goodenough for the capacity of the transformerenough for the capacity of the transformer.
(5) Circuit Breaker CapacityIn case of fault occurred, the fault current is flown into thecircuit breaker from not only upper side of the power grid butalso from other solar PV systems.It is necessary to discuss with the area power company abouty p p ythe short circuit capacity as the short circuit current is dependson the impedance of transmission lines.
62
A4-3 - 31

10MW Integrated PV Stationof Golmud City
Introduction
Qinghai New Energy Group Co., Ltd
ContentsContents
Chapter 1Chapter 1 OutlineOutline
Chapter 2 General PlanChapter 2 General Plan
Chapter 3 Electrical DesignChapter 3 Electrical Design
Chapter 4 Civil engineerChapter 4 Civil engineer
Chapter 5 Fire protectionChapter 5 Fire protection
Chapter 6 Environmental ProtectionChapter 6 Environmental Protection
A4-3 - 32

Chapter 1 OutlineChapter 1 Outline
1. Summary1. Summary
10WMp integrated PV station is built up in Golmud city with the10WMp integrated PV station is built up in Golmud city with the10WMp integrated PV station is built up in Golmud city with the 10WMp integrated PV station is built up in Golmud city with the installation capacity of 10MWp. It took 4 months for the construction. installation capacity of 10MWp. It took 4 months for the construction. The operation period is 25 years. It will be integrated with 110KV The operation period is 25 years. It will be integrated with 110KV collection station from 35 KV wire system.collection station from 35 KV wire system.
In September, 2011, Qinghai New Energy Group Co., Ltd finished In September, 2011, Qinghai New Energy Group Co., Ltd finished working drawings of civil engineer, electrical engineer and monitoring working drawings of civil engineer, electrical engineer and monitoring systems, and finished integration in December of 2011.systems, and finished integration in December of 2011.y , gy , g
1.1 The engineering design is mainly based on1.1 The engineering design is mainly based on::1.1.1 Policies, rules and law, regulation of China1.1.1 Policies, rules and law, regulation of China1.1.2 Engineering designing standards of the industry1.1.2 Engineering designing standards of the industry1.1.3 Designing document of 1.1.3 Designing document of 110 KV Transformer Substation of 110 KV Transformer Substation of East Collection Station of Golmud CityEast Collection Station of Golmud CityEast Collection Station of Golmud CityEast Collection Station of Golmud City
1.1.4 1.1.4 Integration System Plan of PV Station in Haixi RegionIntegration System Plan of PV Station in Haixi Region by by Qinghai Provincial Power Designing Institute, June of 2011Qinghai Provincial Power Designing Institute, June of 2011
1.1.51.1.5Notice of Printing about Review Comments of 10MWp PV Notice of Printing about Review Comments of 10MWp PV Station integration system of Qinghai Saiwei New Energy Co., LtdStation integration system of Qinghai Saiwei New Energy Co., Ltdby Qinghai Power Co., Ltd. No. 1160 by Qinghai Power Co., Ltd. No. 1160 【【20112011】】11601160
A4-3 - 33
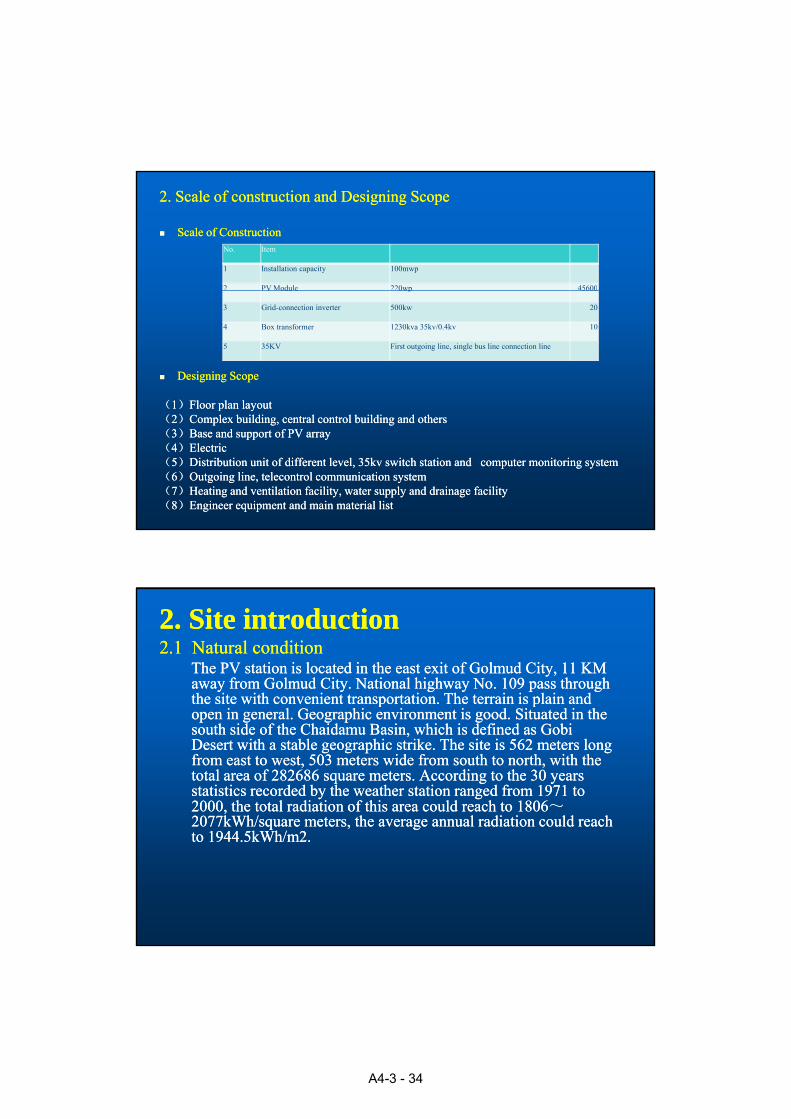
2. Scale of construction and Designing Scope2. Scale of construction and Designing Scope
Scale of ConstructionScale of ConstructionNo. Item
1 Installation capacity 100mwp
2 PV Module 220wp 45600
Designing ScopeDesigning Scope
((11))Floor plan layoutFloor plan layout
V odu e 0wp 5600
3 Grid-connection inverter 500kw 20
4 Box transformer 1230kva 35kv/0.4kv 10
5 35KV First outgoing line, single bus line connection line
p yp y((22))Complex building, central control building and othersComplex building, central control building and others((33))Base and support of PV arrayBase and support of PV array((44))ElectricElectric((55))Distribution unit of different level, 35kv switch station and computer monitoring systemDistribution unit of different level, 35kv switch station and computer monitoring system((66))Outgoing line, telecontrol communication systemOutgoing line, telecontrol communication system((77))Heating and ventilation facility, water supply and drainage facilityHeating and ventilation facility, water supply and drainage facility((88))Engineer equipment and main material listEngineer equipment and main material list
2. Site introduction2. Site introduction2.1 Natural condition2.1 Natural condition
The PV station is located in the east exit of Golmud City, 11 KM The PV station is located in the east exit of Golmud City, 11 KM away from Golmud City. National highway No. 109 pass through away from Golmud City. National highway No. 109 pass through the site with convenient transportation. The terrain is plain and the site with convenient transportation. The terrain is plain and p pp popen in general.open in general. Geographic environment is good.Geographic environment is good. Situated in the Situated in the south side of the Chaidamu Basin, which is defined as Gobi south side of the Chaidamu Basin, which is defined as Gobi Desert with a stable geographic strike. The site is 562 meters long Desert with a stable geographic strike. The site is 562 meters long from east to west, 503 meters wide from south to north, with the from east to west, 503 meters wide from south to north, with the total area of 282686 square meters.total area of 282686 square meters. According to the 30 years According to the 30 years statistics recorded by the weather station ranged from 1971 to statistics recorded by the weather station ranged from 1971 to 2000, the total radiation of this area could reach to 18062000, the total radiation of this area could reach to 1806~~2077kWh/square meters, the average annual radiation could reach 2077kWh/square meters, the average annual radiation could reach q , gq , gto 1944.5kWh/m2.to 1944.5kWh/m2.
A4-3 - 34

2.2 Engineering geology 2.2 Engineering geology The site is located in the flood alluvial plain of Kunlun Mountain. The ground elevation is 2862.19The site is located in the flood alluvial plain of Kunlun Mountain. The ground elevation is 2862.19~~2874.47m, relative elevation is 12.28m,high in west and low in east.2874.47m, relative elevation is 12.28m,high in west and low in east.
2.2.1 Above the site 0.3~0.5m, it is the loose eolian2.2.1 Above the site 0.3~0.5m, it is the loose eolian--sand which should be removed.sand which should be removed.2.2.2 sand soil spread in the site with good mechanic property, could be used as the bearing layer. And 2.2.2 sand soil spread in the site with good mechanic property, could be used as the bearing layer. And
around No. 78, 112,113around No. 78, 112,113、、144 holes, the round sand could be used as the bearing layer.144 holes, the round sand could be used as the bearing layer. We suggest the We suggest the base of the facility should use the independent base . The associated equipment house could use strip base of the facility should use the independent base . The associated equipment house could use strip shaped base.shaped base.
2.2.3 Due to the pretty deep location of the underground water , the impact could be neglected. 2.2.3 Due to the pretty deep location of the underground water , the impact could be neglected. 2.2.4 The seismic resistance is 7 degree, categorized to group 3.2.2.4 The seismic resistance is 7 degree, categorized to group 3. The designed basic seismic added value The designed basic seismic added value
is 0.10g, categorized to groupis 0.10g, categorized to groupⅡⅡ, the designed characteristic cycle value is 0.45s. No earthquake in the , the designed characteristic cycle value is 0.45s. No earthquake in the site happened. Breaking and factors influence the stability of the rock exists, belonging to ordinary site site happened. Breaking and factors influence the stability of the rock exists, belonging to ordinary site for the construction.for the construction.
2.2.5 The standard freezing depth in Golmud area is 1.05m, according to the result of analysis to the soil 2.2.5 The standard freezing depth in Golmud area is 1.05m, according to the result of analysis to the soil sample taken from the site, the moisture content is 4.7~6.1%, averagely 5.4%. The minimum distance sample taken from the site, the moisture content is 4.7~6.1%, averagely 5.4%. The minimum distance between underground water to freezing ground isbetween underground water to freezing ground is>>1.50m, average frozen heave factor isη≤1, belong 1.50m, average frozen heave factor isη≤1, belong to the grade 1 as nonto the grade 1 as non--froze layerfroze layer
2.2.6 Resistivity of the site soil is 58~163Ω·m2.2.6 Resistivity of the site soil is 58~163Ω·m。。2 2 7 Sand storm happens in the site which need the active protection from wind storm and sand storm2 2 7 Sand storm happens in the site which need the active protection from wind storm and sand storm2.2.7 Sand storm happens in the site, which need the active protection from wind storm and sand storm.2.2.7 Sand storm happens in the site, which need the active protection from wind storm and sand storm.
A4-3 - 35

2.3 Solar energy2.3 Solar energy
Golmud City is a center city of west Qinghai Province, located in Golmud City is a center city of west Qinghai Province, located in the east longitude of 91the east longitude of 91°°25′25′~~9595°°12′ northern latitude of12′ northern latitude ofthe east longitude of 91the east longitude of 91 2525 9595 12 , northern latitude of 12 , northern latitude of 3535°°10′10′~~3737°°45′. Golmud is 338 km away from the capital city of 45′. Golmud is 338 km away from the capital city of Haixi Prefecture, 710 km away from capital city of Qinghai Haixi Prefecture, 710 km away from capital city of Qinghai Province.Province. Golmud has a high atmospheric transparency and less Golmud has a high atmospheric transparency and less rainfall, which belongs to the plateau continental climate. rainfall, which belongs to the plateau continental climate. The site is 20 km away from weather station of Golmud, share the The site is 20 km away from weather station of Golmud, share the same solar radiation resources. The weather station is the typical same solar radiation resources. The weather station is the typical t ti f i di ti l it ti f i di ti l istation for engineer radiation analysis.station for engineer radiation analysis.
The solar radiation is strong in the site with long and stable day The solar radiation is strong in the site with long and stable day length.length. For the past few years, the total radiation is between6500 For the past few years, the total radiation is between6500 MJ/MJ/--7400 MJ/7400 MJ/, the annual average radiation is 6923.42MJ/, the annual average radiation is 6923.42MJ/, , the day length is 2550the day length is 2550--3350h, the sunshine percentage is more 3350h, the sunshine percentage is more than70%. It is suitable for the utilization of the solar energy. than70%. It is suitable for the utilization of the solar energy.
Table 1-3 Main meteorological elements table of Golmud City (normal value of accumulated year)
Meteorological element Value of Golmud City
Sunshine duration( hour) 3096.3Normal radiation value of accumulated year(MJ/m2·a) 6923.42
Average value of temperature of accumulated year() 5.3
Average value of rainfall of accumulated year(mm) 42.8
Average days of storm of accumulated year(day) 2.9
Average value of barometric pressure of accumulated year(hpa) 724.7
Average value of water barometric pressure of accumulated year(hpa) 3.2
Average value of relative humidity of accumulated year(%) 32
Average value of wind velocity of accumulated year(m/s) 2.8
Average days of dust of accumulated year(day) 13.2
Average cloud of accumulated year(%) 60
Maximum wind velocity of accumulated year(m/s) 25
Years maximum permafrost depth (cm) 105
Years maximum snow depth (cm) 6
The historical extreme maximum temperature () 35.4(Aug.1999)
Historical extreme minimum temperature() -29.3(In 1961)
A4-3 - 36

Chapter 2 General PlanChapter 2 General Plan1. Briefing of the site 1. Briefing of the site
The site is located in Golmud City, 11 km away from the east toll gate, and 2 km away from the The site is located in Golmud City, 11 km away from the east toll gate, and 2 km away from the national road with a convenient transportation. The total capacity is 10MWp. Generally, it is a matrix national road with a convenient transportation. The total capacity is 10MWp. Generally, it is a matrix layout. The station is composed with two parts of production area and management area. The entrance layout. The station is composed with two parts of production area and management area. The entrance and exit of the station is designed at the west and south side of the station, and connected with the road and exit of the station is designed at the west and south side of the station, and connected with the road outside.outside. The management area is in the southwest. The total area of the station is 0.283kThe management area is in the southwest. The total area of the station is 0.283k, the area , the area gg ,,for the management area is15824for the management area is15824。。
2. General layout2. General layoutOn the basis of full consideration of the site and condition, newly built comprehensive building is On the basis of full consideration of the site and condition, newly built comprehensive building is located in the southwest of the site, adjacent to the distribution central control room in the west. The located in the southwest of the site, adjacent to the distribution central control room in the west. The comprehensive building is linked with the distribution central control room by the corridor.comprehensive building is linked with the distribution central control room by the corridor. The The comprehensivecomprehensive
3. Vertical design3. Vertical designThe superficial standard height is 2862.19The superficial standard height is 2862.19~~2874.47m, relative height is 12.28m, high in west and 2874.47m, relative height is 12.28m, high in west and low in east. Generally , the site is plain and broad. There are rise and fall in part of the area. On the low in east. Generally , the site is plain and broad. There are rise and fall in part of the area. On the basis of the, road standard height refers to the current standard height of the site. The newly built basis of the, road standard height refers to the current standard height of the site. The newly built comprehensive building is 450mm higher than the surface outside of the buildingcomprehensive building is 450mm higher than the surface outside of the buildingcomprehensive building is 450mm higher than the surface outside of the building. comprehensive building is 450mm higher than the surface outside of the building.
4. Transportation4. TransportationThe transportation system is a loop line with the array as the main part, connected with all buildings. The transportation system is a loop line with the array as the main part, connected with all buildings. The average width of the road is 4 m, the minimum turning radius is 6 m.. It is a complete traffic The average width of the road is 4 m, the minimum turning radius is 6 m.. It is a complete traffic network with fire ring. network with fire ring.
General Arrangement PlanThe main technical and economic indexes
Item Unit Value
Total land area M2 282661
Total building area M2 1215.72
Office buildingCentral control distribution room
M2 873.0
Inverter room, box transformer room
M2 267.61transformer roomArea of guard entrance
M2 22.38
Area of water pump house
M2 52.73
Plot ratio / 0.004
Building density / 0.4%
Greening rate / 4.6%
Parking lot Cars 10
Road surface construction of parking lot refers to: Qing 02J01-7-Road 4Paving method of the square refers to: Qing General layout 1:1000Paving method of the square refers to: Qing 02J01-9-road 11Road surface construction method refers to: Qing02J01-6-Road 1Curbstone refers to: Qing02J06-67-1
General layout 1:1000
A4-3 - 37

Chapter 3 Electrical DesignChapter 3 Electrical Design
1. PV site design1. PV site design
1.1 Electrical design of the PV site 1.1 Electrical design of the PV site ggThe total installation capacity is 10MWp with the way of separate generation and The total installation capacity is 10MWp with the way of separate generation and grid connection. The solar energy modules is composed with the 220 wp grid connection. The solar energy modules is composed with the 220 wp polysilicon solar cell module.polysilicon solar cell module. The single capacity of the grid connection inverter The single capacity of the grid connection inverter is 500KW. The whole array consists 570 pieces of is 500KW. The whole array consists 570 pieces of 。。 PV square array of PV square array of 17.6KWp, each PV square array consists 20 columns and 4 squares of solar cell 17.6KWp, each PV square array consists 20 columns and 4 squares of solar cell module with 220Wp.module with 220Wp.
Every 1MWp PV generation unit is composed with solar cell column, Bus devices, Every 1MWp PV generation unit is composed with solar cell column, Bus devices, inverter facility and pressure boosting facilities. The integrated PV station is inverter facility and pressure boosting facilities. The integrated PV station is composed with 10 generation unit of 1MWpcomposed with 10 generation unit of 1MWpcomposed with 10 generation unit of 1MWp.composed with 10 generation unit of 1MWp.
Each generation unit is composed with PV array of 1MWp, 2 grid connection Each generation unit is composed with PV array of 1MWp, 2 grid connection inverters of 500kW, 1 booster transformer of 35kV.inverters of 500kW, 1 booster transformer of 35kV.
The output voltage of the integration inverter is 0.The output voltage of the integration inverter is 0.44kV, after boosting to 35kv by kV, after boosting to 35kv by boosting transformer, deliver to the switch, where the 35kv output will be boosting transformer, deliver to the switch, where the 35kv output will be conveyed to 110 kv integration new energy 35 KV intervals. conveyed to 110 kv integration new energy 35 KV intervals.
DC System Connection Diagram of PV SiteDC System Connection Diagram of PV Site
※①
※②
③
※⑤
※③
※④
A4-3 - 38

1.2 PV array framework1.2 PV array framework Fixed support.Fixed support. The bearing angle of the array is south with the best The bearing angle of the array is south with the best
angle roll of 33 degreeangle roll of 33 degree
1 3 PV array design1 3 PV array design1.3 PV array design1.3 PV array design 2 groups of solar energy group string (20 pieces of each string), 2 groups of solar energy group string (20 pieces of each string),
vertically settled and form them to 2 lines and 20 columns, i. e. 40 vertically settled and form them to 2 lines and 20 columns, i. e. 40 pieces of solar cell module is formed as an array. pieces of solar cell module is formed as an array.
1.4 The design of PV array distance1.4 The design of PV array distance The principle: reduce the area, to improve the utilization of the land The principle: reduce the area, to improve the utilization of the land p p , pp p , p
and try not to shelter from each other.and try not to shelter from each other. On winter solstice , the solar On winter solstice , the solar angle of altitude is the lowest in the whole year. We took the period angle of altitude is the lowest in the whole year. We took the period from 9AM to 16:38 PM as , no shelter from each other as the from 9AM to 16:38 PM as , no shelter from each other as the designing evidence. According to the landform of the site, the designing evidence. According to the landform of the site, the distance between the arrays is designed to 6.1m.distance between the arrays is designed to 6.1m.
Diagrammatic Sketch of Subarray Module InstallationDiagrammatic Sketch of Subarray Module Installation
Technical requirement1. Module type BEST-220P-20, 40 pieces for each subarry
A4-3 - 39

Installation Diagram of PV Array FrameworkInstallation Diagram of PV Array Framework
Installation requirement:Straightening the connecting rod before installationAll connecting parts need to be well ready and connection needs to be reliable.;The back up plates will be requirement between the connection points for any necessary moment. The material listed in the sheet are for one subarray (40 modules form for one subarray) Strengthening brace is installed in the first shelves and sixth shelve, and fastened by the M16 bolt.The beam is formed with the 6 C type steel numbered as I、II、III、IV、V、VI, Connection need to be carried out orderly.
1.5 Annual output of PV Station1.5 Annual output of PV Station
Table 2-1 Basic data of PV array
PV module Amount 45600 pieces
Total installation capacity 10.032 mwp
Effective area of PV module Size of module 1642*994*40mm
Effective area of each module 1.63m2
Effective area of each PV subarray 130.6m2
Effective area of PV module of the station 74426m2
A4-3 - 40

AccordingAccording toto thethe calculation,calculation, thethe powerpower generationgeneration ofof thethe firstfirst yearyear couldcould reachreach toto 1717,,86588658millionmillion kWh,kWh, 2020%% decliningdeclining forfor 2525 useuse ofof thethe system,system, thethe totaltotal outputoutput ofof 2525 yearsyears couldcouldreachreach toto 406406,,285285 millionmillion kWh,kWh, thethe averageaverage outputoutput eacheach yearyear isis 1616,,25142514 millionmillion kWh,kWh, thetheoutputoutput ofof 2525 yearsyears isis asas followingfollowing::
Table 2-2 25 each year Grid electricity generation(Ten thousand kwh)
Year Annual i
Year Annual generation i
Year Annual igeneration
capacity(Ten thousand
kwh)
capacity(Ten thousand kwh)
generation capacity
(Ten thousandkwh)
1 1786.58 10 1661.99 19 1546.082 1772.29 11 1648.69 20 1533.71
3 1758.11 12 1635.50 21 1521.44
4 1744.04 13 1622.42 22 1509.27
5 1730.09 14 1609.44 23 1497.20
6 1716.25 15 1596.56 24 1485.227 1702.52 16 1583.79 25 1473.348 1688.90 17 1571.128 1688.90 17 1571.12
9 1675.39 18 1558.55
25years Total generating capacity
40628.5 Ten thousand kwh
An annual generating capacity
1625.14 Ten thousand kwh
2. 2. 35KV35KV switch stationswitch station2.1 Electrical2.1 Electrical2.1.1 Designing evidence2.1.1 Designing evidence11)) Technical Regulation on PV Station Integration SystemTechnical Regulation on PV Station Integration System GB/Z19964GB/Z19964--2005200522)) Guiding for the Power TransformerGuiding for the Power Transformer GB/T17468GB/T17468--2008200833)) Insulation Coordination for High Voltage Transmission and DistributionInsulation Coordination for High Voltage Transmission and Distribution GB311.1GB311.1--1997199744)) D i i S d d f P S l d Di ib iD i i S d d f P S l d Di ib i GB50052GB50052 1995199544)) Designing Standard for Power Supply and DistributionDesigning Standard for Power Supply and Distribution GB50052GB50052--1995199555)) Grounding for AC Electrical FacilityGrounding for AC Electrical Facility DL/T621DL/T621--1997199766)) Technical Regulation on General Layout of Transformer SubstationTechnical Regulation on General Layout of Transformer Substation DL/T 5056DL/T 5056--2007200777)) Technical Regulation on Designing of High Voltage Distribution FacilityTechnical Regulation on Designing of High Voltage Distribution Facility DL/T 5352DL/T 5352--2006200688)) Technical Regulation on Designing of Conductor and Electrical FacilityTechnical Regulation on Designing of Conductor and Electrical Facility DL/T 5222DL/T 5222--2005200599)) Designing Standard of 35Designing Standard of 35~~110kV Substation110kV Substation GB50059GB50059--92921010))Designing Standard of 3Designing Standard of 3~~110kV High Voltage Distribution Facility 110kV High Voltage Distribution Facility 》》GB50060GB50060--929211) 11) Designing Standard of 10kV and Below SubstationDesigning Standard of 10kV and Below Substation GB50053GB50053--94941212))Designing Standard of Electrical Engineer CableDesigning Standard of Electrical Engineer Cable GB50217GB50217--200720071313))Designing Standard of Electrical SystemDesigning Standard of Electrical System DL/T5429DL/T5429--200920091313))Designing Standard of Electrical SystemDesigning Standard of Electrical System DL/T5429DL/T5429 200920091414))Designing Standard of Parallel Connection Coupling Capacitor Designing Standard of Parallel Connection Coupling Capacitor GB50227GB50227--200820081515)) Technical Regulation on PV Station Integration of State Grid Company ( Trial Use)Technical Regulation on PV Station Integration of State Grid Company ( Trial Use) State Grid No. State Grid No.
747747((20092009))1616))18 Countermeasures to Accidents of State Grid (Trial Use)18 Countermeasures to Accidents of State Grid (Trial Use) State Grid No. 400State Grid No. 400((20052005))1717)) Document of Quality /Professional Health/Environmental ManagementDocument of Quality /Professional Health/Environmental Management Northwest Survey and Northwest Survey and
Design Institute 2007Design Institute 2007
A4-3 - 41

2.1.2 Choice of Booster Station Site2.1.2 Choice of Booster Station Site
The switch station is going to be built in the southwest of the site.The switch station is going to be built in the southwest of the site.
2.1.3 Main Electrical Scheme of the Booster Station2.1.3 Main Electrical Scheme of the Booster StationThere are totally 10 power unit of 1 Mwp, each of them is equipped with 1 transformer of There are totally 10 power unit of 1 Mwp, each of them is equipped with 1 transformer of 1250kVA 0.4kV /35KV, five of them will be connected in parallel to 1 joint line unit . 2 1250kVA 0.4kV /35KV, five of them will be connected in parallel to 1 joint line unit . 2 V . V / V, ve o e w be co ec ed p e o jo e u .V . V / V, ve o e w be co ec ed p e o jo e u .joint line units switches into switch station of 35kVjoint line units switches into switch station of 35kV separately, the 35KV will adopt single separately, the 35KV will adopt single busbar, and switch into 110 kv collection new energy 35 kv interval located in the east of busbar, and switch into 110 kv collection new energy 35 kv interval located in the east of Golmud City.Golmud City.
2.1.4 Reactive Compensation2.1.4 Reactive CompensationOn the basis of On the basis of Technical Regulation on PV Station Access Network of State Grid CompanyTechnical Regulation on PV Station Access Network of State Grid Company, , the power station needs certain adjustment range excepts the needs for the reactive power the power station needs certain adjustment range excepts the needs for the reactive power loss. The compensation will be taken place on the side of the busbar of 35kv with the loss. The compensation will be taken place on the side of the busbar of 35kv with the capacity of 2500kVar, in the way of SVC. The power factor will be no less than 0.9 after capacity of 2500kVar, in the way of SVC. The power factor will be no less than 0.9 after compensationcompensationcompensation.compensation.
2.1.5 Layout of the electric equipment2.1.5 Layout of the electric equipmentThe 35kV distribution unit will use the removal switch cabinet and being settled in high The 35kV distribution unit will use the removal switch cabinet and being settled in high pressure cabinet of central control building. Outline of 35kV will be led by the cable to pressure cabinet of central control building. Outline of 35kV will be led by the cable to terminal pole, and output by the air wire. terminal pole, and output by the air wire.
Main Connection Diagram of Electric EquipmentMain Connection Diagram of Electric Equipment
A4-3 - 42

Floor Plan of Booster StationFloor Plan of Booster Station
((66)) Main electric equipmentMain electric equipment11))Calculation of Short Cut Circuit CurrentCalculation of Short Cut Circuit Current According to the Closing Report on Preliminary Designing of 110kv Substation According to the Closing Report on Preliminary Designing of 110kv Substation
Engineering in the East Collection Station of Golmud City, the calculation result Engineering in the East Collection Station of Golmud City, the calculation result is as following: is as following:
22))Parameter of main electric apparatusParameter of main electric apparatusThe site is located on the altitude of 2900m, considering the influence of high altitude to The site is located on the altitude of 2900m, considering the influence of high altitude to the insulation discharge voltage so this construction adjust the electric equipment on thethe insulation discharge voltage so this construction adjust the electric equipment on the
Table 2-3 Short-circuit current calculation resultShort circuitpoint bus level(KV)
Average voltageof short circuitpoint(KV)
three-phase short-circuit current(KA)
Three phase short circuit capacity(MVA)
Initial value of Cycle component Of short circuit current (KA)
Impact currentpeak(KA)
the insulation discharge voltage, so this construction adjust the electric equipment on the the insulation discharge voltage, so this construction adjust the electric equipment on the level of 3000m.level of 3000m.
A4-3 - 43

①① Unit TransformerUnit Transformer
American box transformer substation, outdoor installation. American box transformer substation, outdoor installation.
②② 35kV Switchboard35kV Switchboard②② 35kV Switchboard35kV Switchboard
35kV switchboard takes KYN6135kV switchboard takes KYN61--40.5GY Armoured removal AC closed high 40.5GY Armoured removal AC closed high tension switchgear. ZN85GY(VEM)tension switchgear. ZN85GY(VEM)--40.5 vacuum cutout switch is inside with 25 40.5 vacuum cutout switch is inside with 25 ka dropka drop--out current.out current. Metering point is settled in 35 kv metering cabinet of the Metering point is settled in 35 kv metering cabinet of the newly built 35 kv high tension switchgear. The metering point of the pass is newly built 35 kv high tension switchgear. The metering point of the pass is settled on the end of the line side. 2 inlet wire switch cabinets, 1 incoming cabinet, settled on the end of the line side. 2 inlet wire switch cabinets, 1 incoming cabinet, 1 capacitor box1 capacitor box 1 voltage transformer cabinet will be1 voltage transformer cabinet will be
2. Secondary Electrical Equipment2. Secondary Electrical Equipment2.1 Computer Supervisory Control System2.1 Computer Supervisory Control System11))Designing PrincipleDesigning Principle The control system is designed unattended. The distributed computer supervisory system is adopted to collect, The control system is designed unattended. The distributed computer supervisory system is adopted to collect,
supervise, monitor, meter, protect, control and power etc. The computer supervisory system and telemechanical will supervise, monitor, meter, protect, control and power etc. The computer supervisory system and telemechanical will be combined and share the same data in an alternative collection. be combined and share the same data in an alternative collection.
Clock synchronization system will be adopted for the station, which could synchronize according to theClock synchronization system will be adopted for the station, which could synchronize according to thesatellite, and the signal uses directly the IRIGsatellite, and the signal uses directly the IRIG--B interface mode.B interface mode.
The computer supervisory system use distributed open network. The net system is Ethernet, which is accordant with The computer supervisory system use distributed open network. The net system is Ethernet, which is accordant with the international standard of OSIthe international standard of OSI modemode and TCP/IPand TCP/IPthe international standard of OSIthe international standard of OSI modemode and TCP/IP.and TCP/IP.
The function like telemetering, teleindication, remote control, remote regulation, remote viewing, manThe function like telemetering, teleindication, remote control, remote regulation, remote viewing, man--computer computer intercourse, telecommunication , signaling, self diagnosis and management etc. intercourse, telecommunication , signaling, self diagnosis and management etc.
Data collection and processing, read analogue input and pulse input are on basis of Data collection and processing, read analogue input and pulse input are on basis of Technical Regulation on Technical Regulation on Designing of Electrical Measurement and Electric Energy Metering DevicesDesigning of Electrical Measurement and Electric Energy Metering Devices DL/T5137DL/T5137--2001 and 2001 and Technical Technical Regulation on Regional Grid Adjustment AutomationRegulation on Regional Grid Adjustment Automation DL5002DL5002--2005. The switching value is on the basis of 2005. The switching value is on the basis of Technical Technical Regulation on Secondary Input of Thermal Plant, SubsationRegulation on Secondary Input of Thermal Plant, Subsation DL/T5136DL/T5136--2001 and 2001 and Technical Regulation on Regional Technical Regulation on Regional Grid Adjustment Automation Grid Adjustment Automation DL5002DL5002--2005.2005.
Information collection management: categorized collection , deliver level by level. Information collection management: categorized collection , deliver level by level. Collection equipment of electricity and electric power: 11 sets of collection terminals will be designed in this station. Collection equipment of electricity and electric power: 11 sets of collection terminals will be designed in this station.
The power quantity measurement system supportIEC60870The power quantity measurement system supportIEC60870--55--102; and signed the protocol with local supervision 102; and signed the protocol with local supervision system MOBUS.system MOBUS.
On the basis of Technical Regulation of Power Quantity Measurement System Power Collection Terminals ofOn the basis of Technical Regulation of Power Quantity Measurement System Power Collection Terminals of On the basis of Technical Regulation of Power Quantity Measurement System Power Collection Terminals of On the basis of Technical Regulation of Power Quantity Measurement System Power Collection Terminals of Qinghai Province, intelligent and high accuracy with pressure loss timing power measurement meters will be adopted Qinghai Province, intelligent and high accuracy with pressure loss timing power measurement meters will be adopted to improve the level of power measurement and information exchange. to improve the level of power measurement and information exchange.
A4-3 - 44
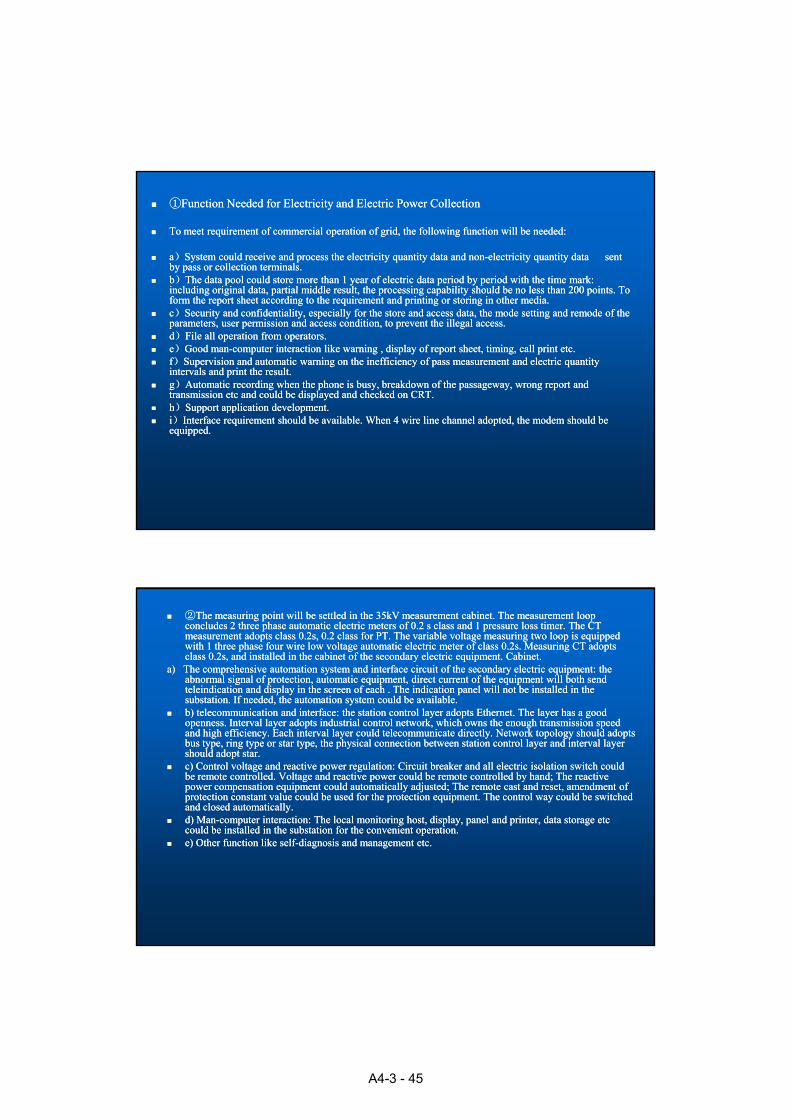
①①Function Needed for Electricity and Electric Power CollectionFunction Needed for Electricity and Electric Power Collection
To meet requirement of commercial operation of grid, the following function will be needed:To meet requirement of commercial operation of grid, the following function will be needed:
aa))System could receive and process the electricity quantity data and nonSystem could receive and process the electricity quantity data and non--electricity quantity data sent electricity quantity data sent by pass or collection terminals. by pass or collection terminals.
bb))The data pool could store more than 1 year of electric data period by period with the time mark: The data pool could store more than 1 year of electric data period by period with the time mark: including original data partial middle result the processing capability should be no less than 200 points Toincluding original data partial middle result the processing capability should be no less than 200 points Toincluding original data, partial middle result, the processing capability should be no less than 200 points. To including original data, partial middle result, the processing capability should be no less than 200 points. To form the report sheet according to the requirement and printing or storing in other media. form the report sheet according to the requirement and printing or storing in other media.
cc))Security and confidentiality, especially for the store and access data, the mode setting and remode of the Security and confidentiality, especially for the store and access data, the mode setting and remode of the parameters, user permission and access condition, to prevent the illegal access. parameters, user permission and access condition, to prevent the illegal access.
dd))File all operation from operators. File all operation from operators. ee))Good manGood man--computer interaction like warning , display of report sheet, timing, call print etc. computer interaction like warning , display of report sheet, timing, call print etc. ff))Supervision and automatic warning on the inefficiency of pass measurement and electric quantity Supervision and automatic warning on the inefficiency of pass measurement and electric quantity
intervals and print the result. intervals and print the result. gg))Automatic recording when the phone is busy, breakdown of the passageway, wrong report and Automatic recording when the phone is busy, breakdown of the passageway, wrong report and
transmission etc and could be displayed and checked on CRT.transmission etc and could be displayed and checked on CRT. hh))Support application development.Support application development.hh))Support application development. Support application development. ii))Interface requirement should be available. When 4 wire line channel adopted, the modem should be Interface requirement should be available. When 4 wire line channel adopted, the modem should be
equipped. equipped.
②②The measuring point will be settled in the 35kV measurement cabinet.The measuring point will be settled in the 35kV measurement cabinet. The measurement loop The measurement loop concludes 2 three phase automatic electric meters of 0.2 s class and 1 pressure loss timer. The CT concludes 2 three phase automatic electric meters of 0.2 s class and 1 pressure loss timer. The CT measurement adopts class 0.2s, 0.2 class for PT.measurement adopts class 0.2s, 0.2 class for PT. The variable voltage measuring two loop is equipped The variable voltage measuring two loop is equipped with 1 three phase four wire low voltage automatic electric meter of class 0.2s. Measuring CT adopts with 1 three phase four wire low voltage automatic electric meter of class 0.2s. Measuring CT adopts class 0.2s, and installed in the cabinet of the secondary electric equipment. Cabinet.class 0.2s, and installed in the cabinet of the secondary electric equipment. Cabinet.
a) The comprehensive automation system and interface circuit of the secondary electric equipment: the a) The comprehensive automation system and interface circuit of the secondary electric equipment: the abnormal signal of protection, automatic equipment, direct current of the equipment will both send abnormal signal of protection, automatic equipment, direct current of the equipment will both send teleindication and display in the screen of each . The indication panel will not be installed in the teleindication and display in the screen of each . The indication panel will not be installed in the substation. If needed, the automation system could be available.substation. If needed, the automation system could be available.
b) telecommunication and interface: the station control layer adopts Ethernet. The layer has a good b) telecommunication and interface: the station control layer adopts Ethernet. The layer has a good openness. Interval layer adopts industrial control network, which owns the enough transmission speed openness. Interval layer adopts industrial control network, which owns the enough transmission speed and high efficiency. Each interval layer could telecommunicate directly. Network topology should adopts and high efficiency. Each interval layer could telecommunicate directly. Network topology should adopts bus type, ring type or star type, the physical connection between station control layer and interval layer bus type, ring type or star type, the physical connection between station control layer and interval layer should adopt star. should adopt star.
c) Control voltage and reactive power regulation: Circuit breaker and all electric isolation switch could c) Control voltage and reactive power regulation: Circuit breaker and all electric isolation switch could be remote controlled. Voltage and reactive power could be remote controlled by hand; The reactive be remote controlled. Voltage and reactive power could be remote controlled by hand; The reactive power compensation equipment could automatically adjusted; The remote cast and reset, amendment of power compensation equipment could automatically adjusted; The remote cast and reset, amendment of protection constant value could be used for the protection equipment. The control way could be switched protection constant value could be used for the protection equipment. The control way could be switched and closed automatically. and closed automatically.
d) Mand) Man--computer interaction: The local monitoring host, display, panel and printer, data storage etc computer interaction: The local monitoring host, display, panel and printer, data storage etc ld b i ll d i h b i f h i ild b i ll d i h b i f h i icould be installed in the substation for the convenient operation. could be installed in the substation for the convenient operation.
e) Other function like selfe) Other function like self--diagnosis and management etc. diagnosis and management etc.
A4-3 - 45
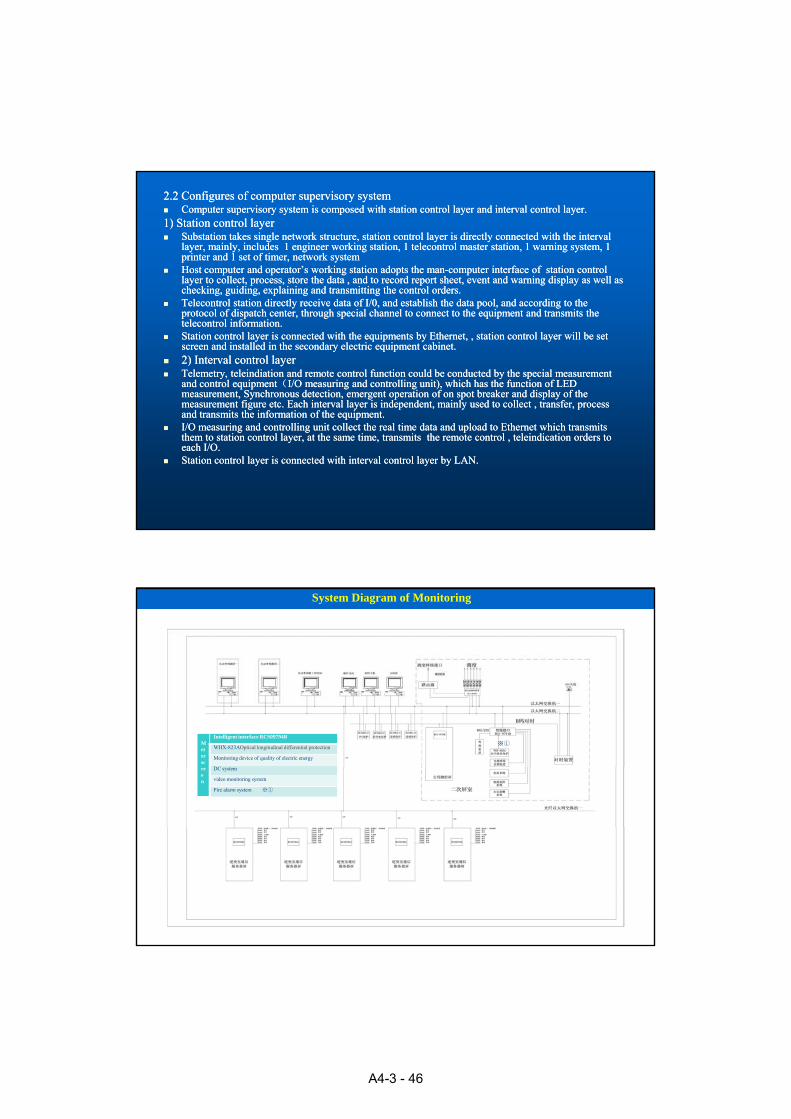
2.2 Configures of computer supervisory system2.2 Configures of computer supervisory system Computer supervisory system is composed with station control layer and interval control layer. Computer supervisory system is composed with station control layer and interval control layer. 1) Station control layer 1) Station control layer Substation takes single network structure, station control layer is directly connected with the interval Substation takes single network structure, station control layer is directly connected with the interval
layer, mainly, includes 1 engineer working station, 1 telecontrol master station, 1 warning system, 1 layer, mainly, includes 1 engineer working station, 1 telecontrol master station, 1 warning system, 1 printer and 1 set of timer, network systemprinter and 1 set of timer, network system
Host computer and operator’s working station adopts the manHost computer and operator’s working station adopts the man--computer interface of station control computer interface of station control layer to collect, process, store the data , and to record report sheet, event and warning display as well as layer to collect, process, store the data , and to record report sheet, event and warning display as well as checking guiding explaining and transmitting the control orderschecking guiding explaining and transmitting the control orderschecking, guiding, explaining and transmitting the control orders. checking, guiding, explaining and transmitting the control orders.
Telecontrol station directly receive data of I/0, and establish the data pool, and according to the Telecontrol station directly receive data of I/0, and establish the data pool, and according to the protocol of dispatch center, through special channel to connect to the equipment and transmits the protocol of dispatch center, through special channel to connect to the equipment and transmits the telecontrol information. telecontrol information.
Station control layer is connected with the equipments by Ethernet, , station control layer will be set Station control layer is connected with the equipments by Ethernet, , station control layer will be set screen and installed in the secondary electric equipment cabinet. screen and installed in the secondary electric equipment cabinet.
2) Interval control layer2) Interval control layer Telemetry, teleindiation and remote control function could be conducted by the special measurement Telemetry, teleindiation and remote control function could be conducted by the special measurement
and control equipmentand control equipment((I/O measuring and controlling unit), which has the function of LED I/O measuring and controlling unit), which has the function of LED measurement, Synchronous detection, emergent operation of on spot breaker and display of the measurement, Synchronous detection, emergent operation of on spot breaker and display of the measurement figure etc. Each interval layer is independent, mainly used to collect , transfer, process measurement figure etc. Each interval layer is independent, mainly used to collect , transfer, process
d i h i f i f h id i h i f i f h iand transmits the information of the equipment. and transmits the information of the equipment. I/O measuring and controlling unit collect the real time data and upload to Ethernet which transmits I/O measuring and controlling unit collect the real time data and upload to Ethernet which transmits
them to station control layer, at the same time, transmits the remote control , teleindication orders to them to station control layer, at the same time, transmits the remote control , teleindication orders to each I/O.each I/O.
Station control layer is connected with interval control layer by LAN.Station control layer is connected with interval control layer by LAN.
System Diagram of Monitoring
Meter screen
Intelligent interface RCS09794B
WHX-823AOptical longitudinal differential protection
Monitoring device of quality of electric energy
DC system
video monitoring system
Fire alarm system ※①
※①
A4-3 - 46

2.3 Relay Protection and Automatic Device2.3 Relay Protection and Automatic Device2.3.1 Designing principle 2.3.1 Designing principle
On the basis of On the basis of Technical Regulation of Relay Protection and Automatic DevicesTechnical Regulation of Relay Protection and Automatic DevicesGB14285GB14285--2006, with micro2006, with micro--computercomputer
2.3.2 Deploy of relay protection and safety automatic device2.3.2 Deploy of relay protection and safety automatic device
aa 35kV35kV line protectionline protection
b Unit transformer protectionb Unit transformer protection
c SVGc SVG outline protectionoutline protection
d Stability control systemd Stability control system
ee wave recorder of breakdown of microwave recorder of breakdown of micro--computercomputer
f inverter protectionf inverter protection
2.4 Environment monitoring system2.4 Environment monitoring systemThe environment monitoring system will conduct a realThe environment monitoring system will conduct a real--time time supervision for illumination intensity, wind speed, wind direction, supervision for illumination intensity, wind speed, wind direction, t t t Th d t ill b d d i th tt t t Th d t ill b d d i th ttemperature etc. The data will be recorded in the computer temperature etc. The data will be recorded in the computer monitoring system. monitoring system.
2.5 Deploy secondary electric equipment2.5 Deploy secondary electric equipment The DC control supply panel, upper monitor host computer cabinet The DC control supply panel, upper monitor host computer cabinet
of the computer monitoring system, network cabinet, ground control, of the computer monitoring system, network cabinet, ground control, SVC t l t ti h t t ’ t kiSVC t l t ti h t t ’ t kiSVC control protection screen, host computer’s operator working SVC control protection screen, host computer’s operator working station will be deployed in the central control room of the station. station will be deployed in the central control room of the station. 35kVmeasuring and protection device will be deployed in the 35kVmeasuring and protection device will be deployed in the equivalent switching cabinet. equivalent switching cabinet.
A4-3 - 47

33、、 Station powerStation power
Load of the station includes the life power, lighting electricity of the Load of the station includes the life power, lighting electricity of the control room, operational power of all devices. According to the control room, operational power of all devices. According to the statistics of the PV power loading, the transformer of the station is statistics of the PV power loading, the transformer of the station is 250kVA, which is supplied with 0.4kV, which could meet the 250kVA, which is supplied with 0.4kV, which could meet the requirement of the technical regulation. Duplicate supply will be requirement of the technical regulation. Duplicate supply will be adopted for the power station, the main power supply is from T adopted for the power station, the main power supply is from T connection of 35 KV line nearby, the backup power supply is from connection of 35 KV line nearby, the backup power supply is from 35 KV generating line of the PV station35 KV generating line of the PV station35 KV generating line of the PV station. 35 KV generating line of the PV station.
44、、Cable and laying modeCable and laying mode4.1 line and cable4.1 line and cable
Flame retardant Armoured and PE sheathed power cable (ZRFlame retardant Armoured and PE sheathed power cable (ZR--YJLV)YJLV) is adopted. is adopted. 4.2 Laying mode 4.2 Laying mode
Angle bracket is adopted for layout the duct entrance for unit inverter cabinet, Angle bracket is adopted for layout the duct entrance for unit inverter cabinet, distribution and central control cabinet.distribution and central control cabinet.
The cable from module to combiner box is deployed along the steel bracket. The The cable from module to combiner box is deployed along the steel bracket. The cable from combiner box to unit inverter cabinet is directly buried underground. cable from combiner box to unit inverter cabinet is directly buried underground. y gy g
Fire resisting partition between cables from different distribution device and Fire resisting partition between cables from different distribution device and different duct entrance of the cable is set up. different duct entrance of the cable is set up.
The bottom hole of switching cabinet, control protection screen, distribution The bottom hole of switching cabinet, control protection screen, distribution screen will be plugged after cable layout .screen will be plugged after cable layout .
Fire resistive material will be painted within 1.5 m of both sides of the fire Fire resistive material will be painted within 1.5 m of both sides of the fire resisting partition of the duct entrance. resisting partition of the duct entrance.
The both ends of the cable pipe will be plugged after layout. The both ends of the cable pipe will be plugged after layout. Flame spreading counter measurement will be set up in the cable channel Flame spreading counter measurement will be set up in the cable channel
di h d l i lik i h fi i i i idi h d l i lik i h fi i i i iaccording to the concerned regulation, like setting up the fire resisting partition , according to the concerned regulation, like setting up the fire resisting partition , plugging all the holes of pothole, wall hole, holes of the switching control plugging all the holes of pothole, wall hole, holes of the switching control protection cabinet etc. protection cabinet etc.
A4-3 - 48

5. Lightening protection grounding5. Lightening protection grounding
5.1 PV array5.1 PV array
5.2 Booster overvoltage protection5.2 Booster overvoltage protection
5.3 Grounding system5.3 Grounding system
Chapter 4 Civil EngineerChapter 4 Civil Engineer1. Architectural Designing1. Architectural Designing1.1 Designing principle 1.1 Designing principle ((11))Letter of authorization of the designing from construction unitLetter of authorization of the designing from construction unit ((22))Original topographic map provided by construction unitOriginal topographic map provided by construction unit ((33))Fire Code of Architectural DesigningFire Code of Architectural Designing GB50016GB50016--2006 2006 f g gf g g ((44))Mandatory Provisions of Engineer Construction StandardMandatory Provisions of Engineer Construction Standard((20102010)) ((55))General Principle for Designing of Civil BuildingGeneral Principle for Designing of Civil Building GB50352GB50352--20052005 ((66))Technical Regulation of Roofing EngineeringTechnical Regulation of Roofing Engineering GB50345GB50345--2004)2004);; ((77))Barrier Free Designing Code for Road and Building JGJ50Barrier Free Designing Code for Road and Building JGJ50--2001)2001);; ((88))Designing Requirement from Construction UnitDesigning Requirement from Construction Unit ((99))Implementation Rules of Energy Saving of Public BuildingImplementation Rules of Energy Saving of Public Building DB63/617DB63/617--20072007 ((1010))Thermotechnical Designing Regulation of Civil BuildingThermotechnical Designing Regulation of Civil Building GB50176GB50176——9393
((1111))R l ti K i W th E i i f E t i W llR l ti K i W th E i i f E t i W ll JGJ144JGJ144 ((1111))Regulation on Keeping Warmth Engineering of Exterior WallRegulation on Keeping Warmth Engineering of Exterior Wall JGJ144JGJ144--20042004
((1212))Environmental Protection Regulation of ChinaEnvironmental Protection Regulation of China ((1313))OthersOthers
A4-3 - 49

2. General layout2. General layoutIn general, the building is integrated with the surrounding and coherent with other buildings, with the In general, the building is integrated with the surrounding and coherent with other buildings, with the
main building facing a good direction. main building facing a good direction. 3. Single building designing3. Single building designing((11))Office: Office: 460m square460m square The office is located in the southwest of site, east of central control cabinet with one floor. F6 The office is located in the southwest of site, east of central control cabinet with one floor. F6
dormitories, 3 offices, lobby, anteroom, corridor, dining room, operation room, storage room and dormitories, 3 offices, lobby, anteroom, corridor, dining room, operation room, storage room and bathroom.bathroom.
((22))Central Control Room: Central Control Room: 413413 m squarem squareqq The central control room is located in the southwest of the site, west side of the office with one floor. The central control room is located in the southwest of the site, west side of the office with one floor.
SGV compensation room, 35 kv switching room, transformer room, central control room and passage. SGV compensation room, 35 kv switching room, transformer room, central control room and passage. 4. Architectural section4. Architectural section((11))Office : Story height Office : Story height is 3.3 metersis 3.3 meters First FloorFirst Floor:: 3.3 meters 3.3 meters Height dispersion between inside and outside room: 0.45 metersHeight dispersion between inside and outside room: 0.45 meters Total height: 3.75metersTotal height: 3.75meters((22))Central control room: story height is Central control room: story height is 4.84.8 meters (eaves height)meters (eaves height) First floor: 4.8First floor: 4.8 meters (eaves height)meters (eaves height)
Height dispersion is 0 30 metersHeight dispersion is 0 30 meters Height dispersion is 0.30 metersHeight dispersion is 0.30 meters Total height is 5.10Total height is 5.10 metersmeters (eaves height)(eaves height)5. Energy saving 5. Energy saving ((11))60 layer of e60 layer of extrusion molding xtrusion molding warmth keeping boards is put on the exterior wall above the floor. warmth keeping boards is put on the exterior wall above the floor. ((22))Good air tightness energy saving hollow glass is adopted in the exterior wall. Good air tightness energy saving hollow glass is adopted in the exterior wall. ((33))Natural illumination is adopted for the main buildings. Natural illumination is adopted for the main buildings. ((44))Door bucket is adopted for the main entranceDoor bucket is adopted for the main entrance
Plane Graph of First Floor of the Comprehensive BuildingPlane Graph of First Floor of the Comprehensive Building
A4-3 - 50

Floor Plan of First Floor of Central Control Room and Distribution RoomFloor Plan of First Floor of Central Control Room and Distribution Room
3. Structure designing 3. Structure designing
3.1 Briefing of central control transformer 3.1 Briefing of central control transformer Steel structured, 413 m square with a distribution room and central control room, is located Steel structured, 413 m square with a distribution room and central control room, is located in Golmud City. in Golmud City.
((11))Security level of the building structure and service lifeSecurity level of the building structure and service lifeTable 3-1 security level of building and designed service life
((22))Natural condition Natural condition
Security level of structure
Grade 2 Foundation designed level
Grade C
Designed service life 50 years Earthquake fortification category
Category C
Table 3-2 Parametric loading of wind and snow
Basic wind pressure Toughness of ground surface Basic snow pressure
Wo=0.40kN/m² Category B So=0.20kN/m²
T bl 3 3 E th k f tifi ti t
Standard freezing depth: 1.05m.Standard freezing depth: 1.05m. Analysis and suggestion about foundationAnalysis and suggestion about foundation
The base should be on the composite foundation with the independence form. The base should be on the composite foundation with the independence form. SoilSoil±±0.000 is measured on spot by the construction unit. 0.000 is measured on spot by the construction unit.
Table 3-3 Earthquake fortification parameter
Intensity of earthquakefortification
Designed basic Earthquakeacceleration Magnitude
Designed Earthquake Category
SPER of site Site category
Grade 7 0.10g Category 3 0.45(s) Category 2
A4-3 - 51

((33))Designing evidence and requirementDesigning evidence and requirement
Table 3-4 Standard, rules, regulations and procedures of the designing of the site
No. Item Code number
1 Unity standard of reliability design of building GB50068-2001
2 Category standard of earthquake fortification of building GB50223-2008
3 Rule of load of building structure GB50009-2001
4 Regulation of concrete structure GB50010-2010
5 Rule of foundation designing of building Gb50007-2002
6 Regulation of earthquake fortification of building GB50011-2010
7 Rule of anti-corrosion designing of building GB50046-2008
8 Technical rule of foundation of building JGJ79-2001¥J200-2002
9 Standard of drawing of building structure GB/T50105-2001
Table 3-5 Uniformly distributed live load standard value
Load category Value
Wall Roof 0.5
Note: using or constructing load could not surpass designed value
((44))Structure typeStructure type①① Vertical structure system: single story building with the steel structure. The exterior wall is coal gangue Vertical structure system: single story building with the steel structure. The exterior wall is coal gangue
porous brick masonryporous brick masonry②② Roofing systemRoofing system::sandwich steel panelsandwich steel panel③③ Structure analysis Structure analysis AA overall analysis overall analysis Calculation and Drawing on Steel Concrete frame, Bent and Continuous Beam of Calculation and Drawing on Steel Concrete frame, Bent and Continuous Beam of Architecture Architecture
Science Institute of China is adopted. Science Institute of China is adopted. ((20102010)) BB Calculation of the foundation Calculation of the foundation JCCAD Software on Foundation Strip Foundation Steel and Concrete Foundation Beam PileJCCAD Software on Foundation Strip Foundation Steel and Concrete Foundation Beam Pile JCCAD Software on Foundation, Strip Foundation, Steel and Concrete Foundation Beam, Pile JCCAD Software on Foundation, Strip Foundation, Steel and Concrete Foundation Beam, Pile
Foundation and Raft FoundationFoundation and Raft Foundation of Architecture Science Institute of China is adopted. of Architecture Science Institute of China is adopted. ((55))Main structure material Main structure material ①①Concrete earthConcrete earth Table 3-6 Density level of concrete component
No.
Name and range of component Density level of concrete Note
1 Independent foundation C30
2 Foundation beam C30
3 Steel pillar, main beam, tie beam Q235B
Environment categoryEnvironment category::Under earth belongs to category B; the rest belongs to Category A. Under earth belongs to category B; the rest belongs to Category A. ②② Steel: Steel: AA、、Steel for concrete structureSteel for concrete structure Concrete iron: фis HPB300Concrete iron: фis HPB300 concrete iron ,Фis HRB335concrete iron ,Фis HRB335 concrete ironconcrete iron Steel: Q235BSteel: Q235B。。③③ Wall material: MU10coal gangue porous brick , mortar is M5 fixed mortarWall material: MU10coal gangue porous brick , mortar is M5 fixed mortar
p , , Q
A4-3 - 52
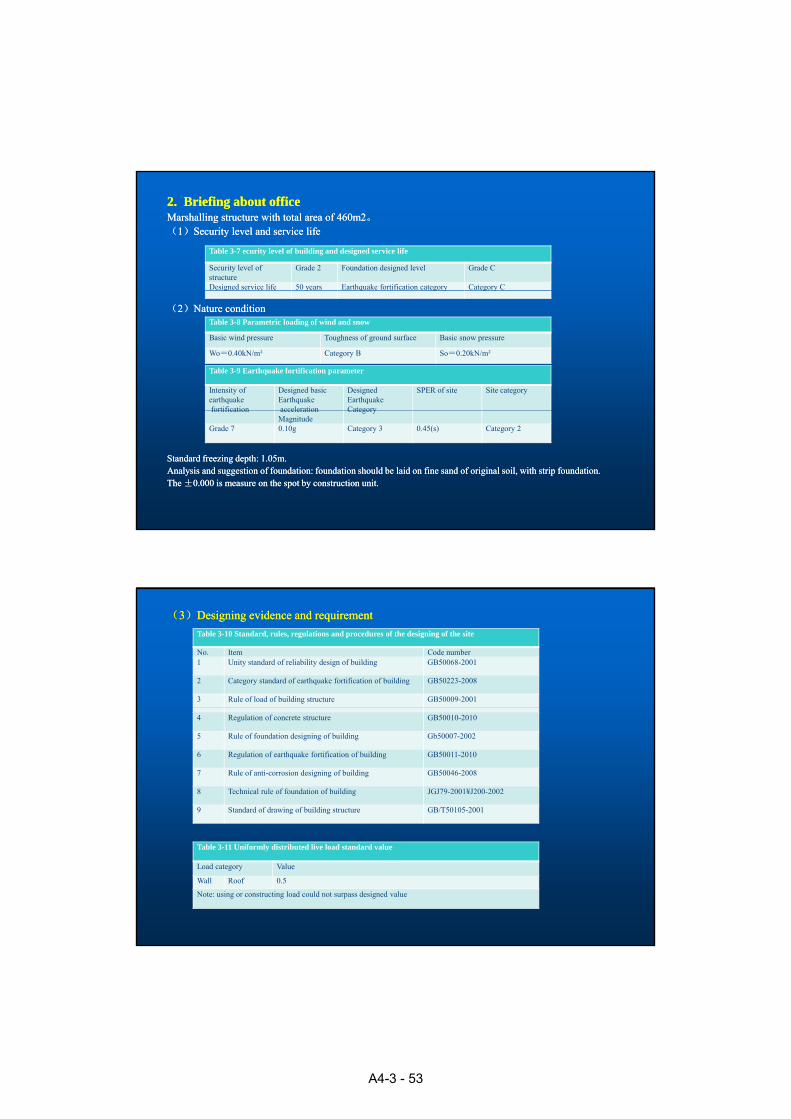
2. Briefing about office 2. Briefing about office Marshalling structure with total area of 460m2Marshalling structure with total area of 460m2。。((11))Security level and service lifeSecurity level and service life
Table 3-7 ecurity level of building and designed service life
Security level of structure
Grade 2 Foundation designed level Grade C
Designed service life 50 years Earthquake fortification category Category C
((22))Nature condition Nature condition
g y q g y g y
Table 3-8 Parametric loading of wind and snow
Basic wind pressure Toughness of ground surface Basic snow pressure
Wo=0.40kN/m² Category B So=0.20kN/m²
Table 3-9 Earthquake fortification parameter
Intensity of earthquakefortification
Designed basic Earthquakeacceleration
Designed Earthquake Category
SPER of site Site category
Standard freezing depth: 1.05m.Standard freezing depth: 1.05m.Analysis and suggestion of foundation: foundation should be laid on fine sand of original soil, with strip foundation. Analysis and suggestion of foundation: foundation should be laid on fine sand of original soil, with strip foundation. The The ±±0.000 is measure on the spot by construction unit. 0.000 is measure on the spot by construction unit.
fortification acceleration Magnitude
Category
Grade 7 0.10g Category 3 0.45(s) Category 2
((33))Designing evidence and requirementDesigning evidence and requirement
Table 3-10 Standard, rules, regulations and procedures of the designing of the site
No. Item Code number 1 Unity standard of reliability design of building GB50068-2001
2 Category standard of earthquake fortification of building GB50223-2008
3 Rule of load of building structure GB50009-2001
4 Regulation of concrete structure GB50010-2010
5 Rule of foundation designing of building Gb50007-2002
6 Regulation of earthquake fortification of building GB50011-2010
7 Rule of anti-corrosion designing of building GB50046-2008
8 Technical rule of foundation of building JGJ79-2001¥J200-2002
9 Standard of drawing of building structure GB/T50105-2001
Table 3-11 Uniformly distributed live load standard value
Load category Value
Wall Roof 0.5
Note: using or constructing load could not surpass designed value
A4-3 - 53

((44)) Structure typeStructure type ①① vertical structure system:vertical structure system: single story building with marshalling structuresingle story building with marshalling structure ②② roofing system: The castroofing system: The cast--inin--place reinforced concrete roofing systemplace reinforced concrete roofing system ③③ structure analysis structure analysis A. overall analysis A. overall analysis Based on Software of Calculation and Drawing of Steel Reinforced Concrete Frame, Bent, and Based on Software of Calculation and Drawing of Steel Reinforced Concrete Frame, Bent, and
Continuous BeamContinuous Beam of PK. PMCAD Engineering Department of China Architecture Science Institute of PK. PMCAD Engineering Department of China Architecture Science Institute (2010)(2010)
B Calculation of the foundationB Calculation of the foundationJCCAD Software on Foundation, Strip Foundation, Steel and Concrete Foundation Beam, Pile JCCAD Software on Foundation, Strip Foundation, Steel and Concrete Foundation Beam, Pile Foundation and Raft FoundationFoundation and Raft Foundation of Architecture Science Institute of China is adoptedof Architecture Science Institute of China is adopted
((55))Main structure materialMain structure material ①① concreteconcrete
A. Intensity level of concrete memberA. Intensity level of concrete memberNo Name and range of component Density level of concrete Note
1 Stripping foundation C25
2 Component pillar, ring beam C25
B. Durability category of concreteB. Durability category of concrete Environment categoryEnvironment category::Under earth belongs to category B; the rest belongs to Category A. Under earth belongs to category B; the rest belongs to Category A.
②② Steel: Steel: AA、、Steel for concrete structureSteel for concrete structure Concrete iron: фis HPB300Concrete iron: фis HPB300 contrete iron ,Фis HRB335contrete iron ,Фis HRB335 concrete ironconcrete iron
③③ Wall material: below Wall material: below ±±0.000, Coal gangue brick, above0.000, Coal gangue brick, above±±0.000, The coal gangue porous with the 0.000, The coal gangue porous with the intensity of MU10. Mortar: below intensity of MU10. Mortar: below ±±0.00, M100.00, M10 cement mortar, abovecement mortar, above±±0.000M5.0 mixed mortar0.000M5.0 mixed mortar
4.4 Water supply and drainage4.4 Water supply and drainage
4.4.1 Designed evidence4.4.1 Designed evidence((11))Designing Regulation of Water Supply and Drainage of BuildingDesigning Regulation of Water Supply and Drainage of Building ( GB50015( GB50015--
2009)2009)((22))Designing Regulation of Fire Proof of BuildingDesigning Regulation of Fire Proof of Building (GB50016(GB50016--2006)2006)((22))Designing Regulation of Fire Proof of Building Designing Regulation of Fire Proof of Building (GB50016(GB50016 2006)2006)( 3) ( 3) Designing Regulation of Extinguisher of BuildingDesigning Regulation of Extinguisher of Building((GB50084GB50084--20052005))( 4) ( 4) Technical Measurement of Civil Building (Water Supply and Drainage)Technical Measurement of Civil Building (Water Supply and Drainage)((GB50084GB50084--20092009););
( 5) Information drawings and designing material concerned( 5) Information drawings and designing material concerned
4.4.2 Building 4.4.2 Building ((11)) Office: Office: 460460 m squire m squire
Located in the southwest of the site east of central control room one floor mortar systemLocated in the southwest of the site east of central control room one floor mortar systemLocated in the southwest of the site, east of central control room, one floor, mortar system. Located in the southwest of the site, east of central control room, one floor, mortar system. There are 6 dormitories, 3 office rooms, 1 lobby, 1 anteroom, passage, dining room, There are 6 dormitories, 3 office rooms, 1 lobby, 1 anteroom, passage, dining room, operation room, storage room and bathroomoperation room, storage room and bathroom
((22))Central control distribution room: Central control distribution room: 413m squire 413m squire Located in the southwest of the site, west of the office building, one floor, steel structure. Located in the southwest of the site, west of the office building, one floor, steel structure. There are SVG room, 35 kv switching cabinet room, transformer room, central control There are SVG room, 35 kv switching cabinet room, transformer room, central control room and passage. room and passage.
A4-3 - 54

4.4.3 Designing Scope4.4.3 Designing Scope The designing includes: water supply and drainage system, indoor fire hydrant system, The designing includes: water supply and drainage system, indoor fire hydrant system,
outdoor hydrant system, extinguisher system of buildingoutdoor hydrant system, extinguisher system of building Drainage system is diversion of rain and sewageDrainage system is diversion of rain and sewage((11))sewage: after processing in the digestion tank, it will be led to the absorbing well sewage: after processing in the digestion tank, it will be led to the absorbing well
which owns the diameter of DN300which owns the diameter of DN300。。 Pipe material and interface: indoor pipe is UPVC spiral silent drainage pipe. The outdoor Pipe material and interface: indoor pipe is UPVC spiral silent drainage pipe. The outdoor
drainage pipe is double wall corrupted pipe with rubber interface.drainage pipe is double wall corrupted pipe with rubber interface.((22))Rain: The rain will be drained to outdoor manhole, together with the rain outside , flow Rain: The rain will be drained to outdoor manhole, together with the rain outside , flow
to rain pipe network of the site. to rain pipe network of the site. ((3) Pipe deployment: The geology is Grade 2 self weight collapsibility loess. The pipe 3) Pipe deployment: The geology is Grade 2 self weight collapsibility loess. The pipe
within 6 meters of prevention distance will be deployed in the leak detection pipe ditch within 6 meters of prevention distance will be deployed in the leak detection pipe ditch which is mortared with the type C brick. which is mortared with the type C brick.
4.4.4 Measurements of water and energy saving4.4.4 Measurements of water and energy saving ((11))Measures of water saving Measures of water saving The water closet adopts 6L two gear water tank. The urinal adopts automatic flushing The water closet adopts 6L two gear water tank. The urinal adopts automatic flushing
system. The tap is sealed with the ceramic plate. system. The tap is sealed with the ceramic plate. ((22))Measures of energy saving Measures of energy saving High quality and energy saving product will be adopted. High quality and energy saving product will be adopted.
4.5 Heating and ventilation system 4.5 Heating and ventilation system
4.5.1 Designing evidence4.5.1 Designing evidence ((11))Designing Regulation of Heating Ventilation and Air AdjustmentDesigning Regulation of Heating Ventilation and Air Adjustment GB50019GB50019--20032003;; ((22))Regulation of Fire Proof of BuildingRegulation of Fire Proof of Building ((GB50016GB50016--20062006);); ((33))Rules of Qinghai Province of Energy Saving Standard of Public BuildingRules of Qinghai Province of Energy Saving Standard of Public Building DB63/617DB63/617--20072007;; ((44))Designing Rules of Heating System of Civil BuildingDesigning Rules of Heating System of Civil Building ((GB50176GB50176--9393););
4.5.2 Designing scope4.5.2 Designing scopeg g pg g p If is for 10 MWP projectIf is for 10 MWP project4.5.3 Designing parameter 4.5.3 Designing parameter ((11))outdoor designing parameter (Location: Golmud City)outdoor designing parameter (Location: Golmud City) Heating in winter, the outdoor temperature: Heating in winter, the outdoor temperature: --15 15 Ventilation in winter, the outdoor temperature: Ventilation in winter, the outdoor temperature: --11 11 Ventilation in summer, the outdoor temperature: 22 Ventilation in summer, the outdoor temperature: 22 Extreme lowest temperature: Extreme lowest temperature: --33.6 33.6 Extreme highest temperature: 35.4 Extreme highest temperature: 35.4 Atmosphere in summer: 724.0 PaAtmosphere in summer: 724.0 Pa Atmosphere in winter:Atmosphere in winter: 723.5 Pa723.5 Pa ((22))Indoor temperature in the heating roomIndoor temperature in the heating room ①① Indoor temperature in winter: office, dormitory, central control room, dining room: 18Indoor temperature in winter: office, dormitory, central control room, dining room: 18;;kitchen kitchen
and facility : 10and facility : 10。。 ②② Indoor temperature in summer for ventilation: facility room: 10Indoor temperature in summer for ventilation: facility room: 10。。
A4-3 - 55

4.5.4 Designing of heating and ventilation 4.5.4 Designing of heating and ventilation ((11))Heat radiatorHeat radiator We adopt antiseptic LXGLWe adopt antiseptic LXGL--X/202X/202--600Steel aluminum composite radiator. (Under the 600Steel aluminum composite radiator. (Under the
standard condition, the heating radiation is 130W/piece)standard condition, the heating radiation is 130W/piece) ((22))Heating pipe Heating pipe Welded steel pipe with the diameter of Welded steel pipe with the diameter of ≥≥DN32, connected with flange, when diameter is DN32, connected with flange, when diameter is <<p pp p gg
DN32, connected with wire. DN32, connected with wire. ((33))Mechanical recycling heating radiation systemMechanical recycling heating radiation system ((44))Mechanical exhaust for deficiency of natural exhaustMechanical exhaust for deficiency of natural exhaust ((55))Mechanical ventilation system for deficiency of natural exhaust Mechanical ventilation system for deficiency of natural exhaust ((66))Mechanical ventilation for the bathroomMechanical ventilation for the bathroom
4.5.4 Energy saving 4.5.4 Energy saving ((11))Heat metering will be installed on outlet of heating pipe network and entrance of Heat metering will be installed on outlet of heating pipe network and entrance of
building heat for good of separate chargebuilding heat for good of separate chargebuilding heat, for good of separate charge building heat, for good of separate charge ((22))indoor heating system adopts energy saving radiator which could adjust air condition indoor heating system adopts energy saving radiator which could adjust air condition
in the separate room. in the separate room. ((33))Less noise, low consumption of electricity ventilation system will be adopted for Less noise, low consumption of electricity ventilation system will be adopted for
reduction of the operation cost. reduction of the operation cost.
4.6 Electric equipment of building4.6 Electric equipment of building
4.6.1 Designing evidence :4.6.1 Designing evidence : ((11))Outline of buildingOutline of building::newly built office , central control distribution roomnewly built office , central control distribution room
((22)) i i i l di i i l d ((22))Designing material concernedDesigning material concerned
((33))Designing requirement of construction unitDesigning requirement of construction unit
((44))Regulations and standards for this engineerRegulations and standards for this engineer
Designing Regulation of Electric Equipment of Civil BuildingDesigning Regulation of Electric Equipment of Civil Building JGJ16JGJ16--20082008;;
Designing Regulation of Distribution SystemDesigning Regulation of Distribution System GB50052GB50052--9595;;
Designing Regulation of Transformer Station of 10KVDesigning Regulation of Transformer Station of 10KV GB50053GB50053--9494;;
Designing Standard of Illumination of Civil BuildingDesigning Standard of Illumination of Civil Building GB50034GB50034--20042004;;
Fire Proof Rules of Civil BuildingFire Proof Rules of Civil Building GB50015GB50015--20062006;;
Designing Regulation of Lightening Protection of BuildingDesigning Regulation of Lightening Protection of Building GB50057GB50057--9494((20002000););
other rules, regulations and standards concerned. other rules, regulations and standards concerned.
((55))Review comments of designing of the project. Review comments of designing of the project.
A4-3 - 56

4.6.24.6.2 Designing scope: the following electric equipment is included: Designing scope: the following electric equipment is included: 10/0.4kv distribution system, low voltage distribution system, illumination system, telephone, TV, 10/0.4kv distribution system, low voltage distribution system, illumination system, telephone, TV, network, lightening protection, grounding system and other safety measurements. network, lightening protection, grounding system and other safety measurements.
4.6.3 Distribution system:4.6.3 Distribution system: ((11))Load rating: the illumination load is rate 3. Emergency lighting and escape lighting use storage Load rating: the illumination load is rate 3. Emergency lighting and escape lighting use storage
battery, the emergency hours is no less than 30 mins.battery, the emergency hours is no less than 30 mins. ((22))Energy measurement: total measurement will be deployed at the side of high voltageEnergy measurement: total measurement will be deployed at the side of high voltage ((22))Energy measurement: total measurement will be deployed at the side of high voltage Energy measurement: total measurement will be deployed at the side of high voltage
distribution system, meters set will be deployed at the side of high voltage system to measure the distribution system, meters set will be deployed at the side of high voltage system to measure the power. power.
((33)) Cable of 0.4kvCable of 0.4kv line led the power source to building is YJV22line led the power source to building is YJV22--1kv. Cable for low voltage is 1kv. Cable for low voltage is directly buried underground. directly buried underground.
4.6.4 Low voltage distribution system4.6.4 Low voltage distribution system :: ((11))Power source of the building are all connected by the AC screen of distribution cabinet of Power source of the building are all connected by the AC screen of distribution cabinet of
central control office , in the way of radiation or trunk type , and lead to distribution closet of floor or central control office , in the way of radiation or trunk type , and lead to distribution closet of floor or end distribution closet. Return circuit of lighting is protected by the circuit breaker. Outlet circuit is end distribution closet. Return circuit of lighting is protected by the circuit breaker. Outlet circuit is protected by the leaking circuit breaker. protected by the leaking circuit breaker.
((22))Distribution system inside of the building adopts BVDistribution system inside of the building adopts BV--0.5kv type cable0.5kv type cable。。(( ((3) Panel switch, outlet adopt 86 series product. The wall is concealed installed. Distribution closet, 3) Panel switch, outlet adopt 86 series product. The wall is concealed installed. Distribution closet, control closet, outlet closet all adopt ZJPR type or PZ30 type product. The wall is concealed installed. control closet, outlet closet all adopt ZJPR type or PZ30 type product. The wall is concealed installed.
4.6.5 Illumination system4.6.5 Illumination system ((11))Ordinary lighting indoor. The luminance and power density is accordant with national standard. The Ordinary lighting indoor. The luminance and power density is accordant with national standard. The
lighting is high reflectivity dome lighting fitting or grid type. lighting is high reflectivity dome lighting fitting or grid type. ((22))Indoor lighting line adopts BVIndoor lighting line adopts BV--0.5kv and ZR PVC. Outdoor lighting line adopts0.5kv and ZR PVC. Outdoor lighting line adoptsYJVYJV--1kv and polygene plastic pipe. Indoor lighting grounding adopts1kv and polygene plastic pipe. Indoor lighting grounding adopts--CC--S.S. ((33))Indoor lighting adopts on spot switch control. Indoor lighting adopts on spot switch control.
4 6 6 Telephone TV and computer network system4 6 6 Telephone TV and computer network system4.6.6 Telephone, TV and computer network system4.6.6 Telephone, TV and computer network system Telephone circuit is connected with the public telephone, and distributed to single machine by telephone cable Telephone circuit is connected with the public telephone, and distributed to single machine by telephone cable
box set .box set . Signal line of TV is connected with regional cable television network, and transfer, distribute to terminal users. Signal line of TV is connected with regional cable television network, and transfer, distribute to terminal users. LAN system is set up in the office building, and is connected with the civil network. Network interface LAN system is set up in the office building, and is connected with the civil network. Network interface
according to the requirement of the clients is deployed in the office. Backbone network is optical one, the according to the requirement of the clients is deployed in the office. Backbone network is optical one, the branch uses 4 pairs of twisted copper cable of super category 5. branch uses 4 pairs of twisted copper cable of super category 5.
The weak line is all led to through the cement pipe outdoor, and KBG metal pipe indoor. The weak line is all led to through the cement pipe outdoor, and KBG metal pipe indoor. 4.6.7 Lightening prevention, grounding and safety measurement4.6.7 Lightening prevention, grounding and safety measurement ((11))Category 3 lightening prevention and protection of the building. Category 3 lightening prevention and protection of the building. ((22))Integrative grounding of lightening prevention and protection for all single buildingIntegrative grounding of lightening prevention and protection for all single building ((22))Integrative grounding of lightening prevention and protection for all single buildingIntegrative grounding of lightening prevention and protection for all single building ((33))General equipotential connection is set up in all single building, including all metal protective cover, General equipotential connection is set up in all single building, including all metal protective cover,
metal cuticle, heating pipe, underground line etc. metal cuticle, heating pipe, underground line etc. ((44))All kinds of strong or weak line led to the building will be set up a SPD at the end of the line. All kinds of strong or weak line led to the building will be set up a SPD at the end of the line.
A4-3 - 57

Chapter 5 Fire ProtectionChapter 5 Fire Protection5.1 Designing evidence 5.1 Designing evidence Typical Fire Protection Rules of Electric EquipmentTypical Fire Protection Rules of Electric Equipment DL5027DL5027--9393 Fire Protection of Thermal Power Plant and Substation DesigningFire Protection of Thermal Power Plant and Substation Designing GB50229GB50229--20102010 Regulation on Fire Protection of BuildingRegulation on Fire Protection of Building GB50016GB50016--20102010 Designing Rules of Extinguisher of BuildingDesigning Rules of Extinguisher of Building GBJ140GBJ140--9090
5.2 Measurement of fire protection 5.2 Measurement of fire protection In each room of the central control building, we had deployed the certain amount of portable powered In each room of the central control building, we had deployed the certain amount of portable powered fire extinguisher, totally 12. We adopt the self carried storage battery as the emergency lighting, fire extinguisher, totally 12. We adopt the self carried storage battery as the emergency lighting, which could last no less than 30 minutes when emergency occurred. which could last no less than 30 minutes when emergency occurred.
There are certain amount of portable powder fire extinguisher in the office, totally 6. The lighting There are certain amount of portable powder fire extinguisher in the office, totally 6. The lighting system is also set up in the corridor for the emergency. system is also set up in the corridor for the emergency.
2 portable powder fire extinguishers are deployed in every inverter cabinet and transfer box cabinet, 2 portable powder fire extinguishers are deployed in every inverter cabinet and transfer box cabinet, totally 20.totally 20.
Portable powder fire extinguisher: 4Kg, MF/ABC4, fire rating is 2APortable powder fire extinguisher: 4Kg, MF/ABC4, fire rating is 2A The holes is sealed with the cable deployment finished. The fire proof paint will be used within the The holes is sealed with the cable deployment finished. The fire proof paint will be used within the
di t f 1 5 b th id f th bl d tdi t f 1 5 b th id f th bl d tdistance of 1.5 m both sides of the cable duct. distance of 1.5 m both sides of the cable duct. 5.3 Automatic alarm system5.3 Automatic alarm system The automatic alarm system has a concentrated alarm mode. The controller could indicate the alarm The automatic alarm system has a concentrated alarm mode. The controller could indicate the alarm
area and detected area, and control the fire jointly. area and detected area, and control the fire jointly. No specific fire protection control room, instead, the it is deployed in the central control room. No specific fire protection control room, instead, the it is deployed in the central control room.
Chapter 6 Environment ProtectionChapter 6 Environment Protection
6.1 Land 6.1 Land We had planted the trees in the spaces of the site for the beauty and green.We had planted the trees in the spaces of the site for the beauty and green.
6.2 Water6.2 Water
We take water from the well, the amount of the life water is very less, so it will not We take water from the well, the amount of the life water is very less, so it will not bring any negative impact to the underground water.bring any negative impact to the underground water.The sewage amount is 0.6m³/d( 219m³/a), the floor dust, together with the waste will The sewage amount is 0.6m³/d( 219m³/a), the floor dust, together with the waste will be disposed and filled in the landfill site regularly. The panel will be cleaned by the be disposed and filled in the landfill site regularly. The panel will be cleaned by the wet cloth without and addictives once every month, except in winter. The cleaning wet cloth without and addictives once every month, except in winter. The cleaning water is 60 m3/a, which could be used for the plants and floor. water is 60 m3/a, which could be used for the plants and floor.
6.3 Noise6.3 Noise
The noise level of the site is 60The noise level of the site is 60~~65dB(A), mainly from inverter and substation etc. 65dB(A), mainly from inverter and substation etc. The equipment could be installed outdoor, in this way, the noise level could be The equipment could be installed outdoor, in this way, the noise level could be declined. declined.
A4-3 - 58
Thank YouThank You!!
联系我们
Address: No. 22, Wusi West Street, Xining City, Qinghai ProvincePost Code: 810008TEL: 0086 97 6306884FAX: 0086 971 6304741Web Site: www.qhsolar.com
A4-3 - 59

Speech on the Final Workshop and Outcome Extension of ADB TAOutcome Extension of ADB TA
Qinghai Renewable Energy Development Project
Energy Bureau, Qinghai Provincial Development and Reform
Commission
Distinguished guests, Ladies and gentlemen,
I am delighted to be here and address the Final Workshop and Outcome Extension of ADB TA Qinghai Renewable Energy Development Project. First of all, I would like to extend my gratitude to ADB for its support and concern forgratitude to ADB for its support and concern for the development of renewable energy in Qinghai.
A4-3 - 60

In recent years, in the face of international financial crisis, euro crisis and high fossil fuel energy price all nations are adjusting theirenergy price, all nations are adjusting their energy development strategies. We should step up the efforts on renewable energy development, vigorously promote energy conservation and pollution reduction, increase energy efficiency,
d h i t ti l tiand enhance international energy cooperation for a green and low-carbon development.
Since the Renewable Energy Law of the People’s Republic of China was promulgated in 2005, National Development and Reform Commission, Ministry of Finance and other authorities have introduced a series of promoting and supporting policies. In 2010, the State Council made the decision to expedite the development of seven strategic new industries, including solar photovoltaic power generation industry. Supported by relevant policies, China’s renewable energy industry has witnessed great progress with a gy y g p gcontinuously expanding market size, remarkable technology advances and improvement of industrial strength.
A4-3 - 61

Qinghai is the best place for solar powerQinghai is the best place for solar power generation in the world. Qaidam region has a large amount of desertified land and plenty of sunshine for solar power generation, good grid connection and transmission conditions and con enient transportationconvenient transportation.
We plan that by the end of the 12th Five Year Plan period, the solar power generating capacity will reach over 4,000 MW, among which PV power generating capacity is above 3 500 MW photo-thermal powercapacity is above 3,500 MW, photo thermal power generating capacity is 300 MW, and the distributed PV power generating capacity is 200 MW. By the end of 2011, the installed capacity of on-grid PV power projects in Qinghai was 1,010 MW, accounting for 47.2% of the total installed capacity of China and making Qinghai the province with the largest installed capacity in China. In 2012, we plan to generate another 1,000 MW of PV power.
A4-3 - 62
In light of present development, we can summarize the characteristics of solar PV generation as follows: 1, diversified technology and developing trends. Different technologies are competing with each other and this will help drop the cost. 2, growing economic advantages.
At present, solar power generation is still in the early phases of development with fast cost drop and technology advances. As the market size grows, the cost of power generation will drop continuously and the competitiveness will increase markedlyincrease markedly.
A4-3 - 63

3, solar power generation will gradually change its role from supplementary energy to alternativeits role from supplementary energy to alternative energy. With its growing economic and technological advantages, solar power generation will enter the phase of large-scale development and become another important
f ti ft h dway of power generation after hydropower, thermal power and wind power generation.
ADB provides technical assistance to the renewable energy development in Qinghai Thisrenewable energy development in Qinghai. This is an important step Qinghai has made in its international cooperation on solar power generation. Qinghai has great potential in renewable energy development and great
i f i t ti l tipromises for international cooperation.
A4-3 - 64
At present, solar power generation is faced with the problems of large-scale grid connection and operation. Technology and standards on grid connection of new gy genergy power still need further study. We hope that ADB will give us concern and support as always and Chinese enterprises will actively participate in the R&D and cooperation on international energy technology to promote the sound and sustainable development of
bl A d fi ll I i h th t th k hrenewable energy. And finally, I wish that the workshop can attain the results expected.
Thank you!
A4-3 - 65

Prospect of ADB TA Prospect of ADB TA HaixiHaixi Renewable Renewable Energy Development ProjectEnergy Development Project
Bureau of Energy, Bureau of Energy, HaixiHaixi PrefecturePrefectureAugust, 2010August, 2010
ContentsContentsContentsContents
I. Overview of Haixi Prefecture
II. Overview of Renewable Energy in Haixi Prefecture
III. Current Status of Renewable Energy in Haixi
Prefecture
I. Overview of Haixi Prefecture
II. Overview of Renewable Energy in Haixi Prefecture
III. Current Status of Renewable Energy in Haixi
Prefecture
IV. Prospect of ADB TA Haixi Renewable Energy
Development Project
IV. Prospect of ADB TA Haixi Renewable Energy
Development Project
A4-3 - 66
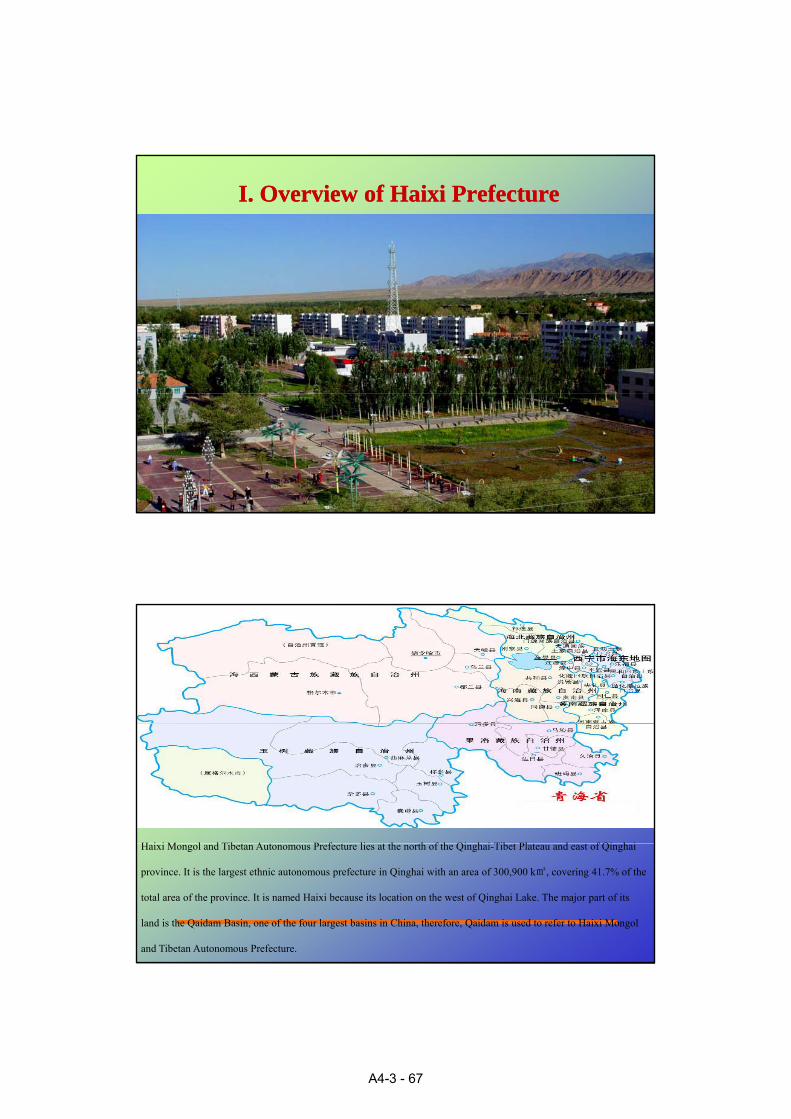
I. Overview of I. Overview of HaixiHaixi PrefecturePrefecture
H i i M l d Tib t A t P f t li t th th f th Qi h i Tib t Pl t d t f Qi h iHaixi Mongol and Tibetan Autonomous Prefecture lies at the north of the Qinghai-Tibet Plateau and east of Qinghai
province. It is the largest ethnic autonomous prefecture in Qinghai with an area of 300,900 k, covering 41.7% of the
total area of the province. It is named Haixi because its location on the west of Qinghai Lake. The major part of its
land is the Qaidam Basin, one of the four largest basins in China, therefore, Qaidam is used to refer to Haixi Mongol
and Tibetan Autonomous Prefecture.
A4-3 - 67

f i i Qi i i
Haixi Prefecture is important for the economic development of Qinghai province. Supported by
the circular economic pilot zone and its superior resources, Haixi strives for the leap-forward
development of economic and social transformation and greater contribution to the development
of Qinghai by achieving “three-leads” and “three-breakthroughs” in the province.
Map of Key Function Zones in Qinghai Province
HaixiHaixi prefecture governs two countryprefecture governs two country--level cities: Delhi and level cities: Delhi and GolmudGolmud; three ; three counties: counties: DulanDulan, Ulan and , Ulan and TianjunTianjun; three ; three administrative committees: Da administrative committees: Da QaidamQaidam, , LenghuLenghu, and , and MagnnaiMagnnai. It has a total of 35 . It has a total of 35 townships, 8 street offices, 304 townships, 8 street offices, 304 administrative villages 77 districtadministrative villages 77 districtadministrative villages, 77 district administrative villages, 77 district neighborhood committees and a neighborhood committees and a population of 639,000.population of 639,000.
A4-3 - 68

Qaidam circular economy pilot zone is the largest among the first 13 circular economy pilot industrial parks in China. It is the key area in Qinghai’s strategy of promoting new type of industrialization, the characteristic and competitivethe characteristic and competitive industrial base for the Great Western Development and one of the national sustainable development experimental zones.In the first half of 2012, the prefecture has achieved a total economic output of 25.79 billion yuan with a year-on-year growth of 16.3%. In the first 7 months, it has achieved an industrial added value of 24.04 billion yuan with a growth of 17.6%, and a total investment in fixed assets of 25.64 billion yuan with a growth of 100%.
II. Overview of Renewable Energy in II. Overview of Renewable Energy in HaixiHaixi PrefecturePrefecture
Haixi prefecture has rich energy resources, including hydro power, wind power, and solar power resources. Its average altitude is about 3,000 m and it has an unique climate with not distinct four seasons, strong insolation , dramatic daily temperature swings and perennial drousght, wind and small rainfall. It belongs to the typical plateau continental climate with its annual average temperature of -5.6~5.2, annual average rainfall 16.7~487.7 mm and annual average evaporation 1353.9~3526.1 mm.
A4-3 - 69

Hydro powerHaixi has a total of over 160 rivers that cover about 500k and about 40 rivers have water throughout the year. Th l f t
Wind power
The volume of water resources is 11.655 billion m³, among which 5.269 m³ comes from the pilot zone.
Haixi has relatively rich wind power. Influenced by land forms and altitudes, the average wind speed inside the basin is 3m/s~4m/s, and the average wind speed in hilly area is above 4m/s. There are 12-168 days that have high wind above level 6.
Solar Power
Haixi prefecture has strong insolation and long sunshine duration with an annual average sunshine duration in Qaidam of over 3,000 hours, 3,200 hours in the west of the basin, about 2,900 hours in the hilly areas. The month with the longest sunshine duration is May, and the shortest are from December to next January. The percentage of sunshine is over 70%, except in Ulan, Xiangride and other areas that are blocked by hills and trees, and it reaches 74%in the highest Lenghu
sunshine duration total solar radiationTibet 3100~3400 No.1 in ChinaQinghai 2500~3650 No.2 in China
The total amount of annual solar radiationResource Abundance
Unit: kWh/m2 Unit: MJ/m2
≥1750 ≥6300 Most abundant
reaches 74%in the highest Lenghuarea. The annual sunshine radiation is 6618.3MJ/m2~7356.9MJ/m2.
1400~1750 5040~6300 Quite abundant
1050~1400 3780~5040 Abundant
<1050 <3780 Not so abundant
A4-3 - 70

Qaidam basin is the area with the richest solar resources in Qinghai province and Lenghu, Magnnai and Golmud
are the areas with the richest resources in Haixi prefecture.
Solar energy resources increase from east to west in Haixi prefecture.
III. Current Status of Renewable Energy in III. Current Status of Renewable Energy in HaixiHaixiPrefecturePrefecture
A4-3 - 71

In 2011, 44 new energy projects with a total installed capacity of 1118.5 MW were under construction in Haixi prefecture, among which 40 were PV projects, 3 wind power projects, and 1 photo-thermal project. 40 PV power generation projects were completed with an installed capacity of p g p j p p y913 MW and a fixed investment of 12.6 billion yuan. The estimated annual average power generation is 1.5 billion KWHs, saving 525,000 tons of standard coals that are equivalent to reducing 15.3 million tons of CO₂ and 58.8 tons of SO₂.
Within only one year, Haixi claimed the title of “five first” in the world: the area with the most concentrated solar PV installed capacity, the largest PV power station under construction, the largest installed capacity of PV power stations within a short period in the same area, the largest on-grid PV system under construction and the first million KW class on-grid PV power station in the world.
By the end of Jul, 2012, the constructed PV projects have generated 667 million KWHs of electricity.
In 2012, 31 PV power generation projects are under construction In 2012, 31 PV power generation projects are under construction in the prefecture with a total installed capacity of 829 MW, among which 2 are continued wind power projects, 2 newly started projects, 1 continued photo-thermal project, 1 newly started science and technology demonstration photo-thermal project. The total installed capacity of PV power projects in the prefecture is 720 MW, accounting for 72% of that of Qinghai province. It is estimated that these PV projects can have an
i f 1 08 i i i 3 8 000annual power generation of 1.08 billion KWHs, saving 378,000 tons of standard coals that are equivalent to reducing 11.01 million tons of CO₂ and 42.33 million tons of SO₂.
A4-3 - 72
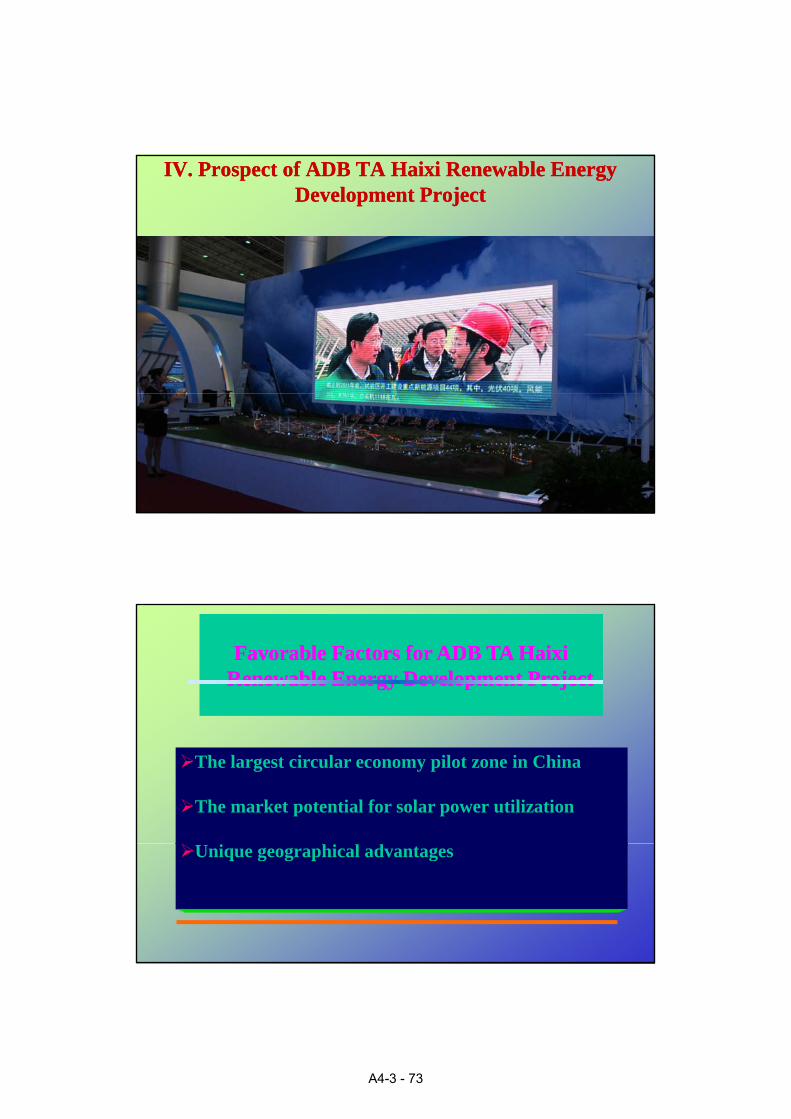
IV. IV. Prospect of ADB TA Prospect of ADB TA HaixiHaixi Renewable Energy Renewable Energy Development ProjectDevelopment Project
Favorable Factors for ADB TA Favorable Factors for ADB TA HaixiHaixiRenewable Energy Development Project Renewable Energy Development Project
The largest circular economy pilot zone in China
The market potential for solar power utilization
Unique geographical advantages
A4-3 - 73

Program for Program for HaixiHaixi Renewable Energy Renewable Energy DevelopmentDevelopment
((20102010--20202020))Solar Power
According to the principles of overall planning and all-round consideration, appropriate concentration, reasonable distribution, step implementation and conduciveness to the long-term development and in accordance with the National Renewable Energy Law, National Program for the Medium and Long Term Development of Renewable Energy, Report of the Planning of the Ten Million Kilowatts Class PV Power Base in Qaidam Basin of Qinghai Province, and the Planning of the Solar Power Generation Base in Qaidam Basin of Qinghai Province 31 on-grid PV power stations are planned to be built with a fixedProvince, 31 on-grid PV power stations are planned to be built with a fixed investment of 62 billion yuan and a total installed capacity of 20,000 MW, accounting for 7‰ of the theoretically explorable installed capacity in Qaidambasin and covering 1,817 k. It is planned the total installed capacity of solar power generation base in Qaidam basin will reach 4,000 MW by 2015, 10,000 MW by 2020, and 20,000 MW by 2030.
Wind Power
Program for Program for HaixiHaixi Renewable Energy Renewable Energy DevelopmentDevelopment((20102010--20202020))
According to the Report of the Engineering Planning of the Wind Power Plants in Qinghai Province, 21 wind power plants are planned to be built in Haixi with a total installed capacity of 7,700 MW and a total investment of 77 billion yuan. It is planned that the installed capacity will reach 350 MW by 2015 and 650 MW by 2020. The Engineering Planning of the Wind Power Plant in Qinghai Province is now underPlanning of the Wind Power Plant in Qinghai Province is now under revision to expand the wind power plants in Haixi to 24 and the installed capacity to 650 MW by 2015 and 2,000 MW by 2020.
A4-3 - 74

Objectives of Development of Renewable Energy in Objectives of Development of Renewable Energy in HaixiHaixi PrefecturePrefecture
During the “12th Five Year Plan” period, Haixi prefecture will g p , pcontinue to depend on its rich solar energy and land resources, seize the opportunity to develop new energy with national and provincial support, and speed up the construction of solar power projects to build Qaidam into the largest solar power generation base in China with a total installed capacity of 4,000 MW by the end of the “12th Five Year Plan” period.During this period, Haixi will continue to speed up the utilization of wind power, seize the opportunity to develop new energy with national and
i i l t d t dil t th t ti f i dprovincial support and steadily promote the construction of wind power projects to achieve a total installed capacity of 650 MW of wind power projects by the end of the period.
ConclusionConclusion
New energy industry is one of the six pillar industries in Haixi prefecture and the driving force for Haixi’ssustainable development. By making the best of international loan, subsidy and carbon reduction funds, we can better promote the renewable energy industry and increase the scientific and technological level of the region
New energy industry is one of the six pillar industries in Haixi prefecture and the driving force for Haixi’ssustainable development. By making the best of international loan, subsidy and carbon reduction funds, we can better promote the renewable energy industry and increase the scientific and technological level of the regionincrease the scientific and technological level of the region.
Finally, we believe that with our concerted efforts, the renewable energy in Haixi will embrace a promising future!
increase the scientific and technological level of the region.
Finally, we believe that with our concerted efforts, the renewable energy in Haixi will embrace a promising future!
A4-3 - 75
Thank you!
A4-3 - 76

Renewable Energy Development Appendix 5 Final Report Seminar and Workshops
APPENDIX 5
SEMINAR AND WORKSHOPS

Renewable Energy Development Appendix 5 Final Report Seminar and Workshops
A5 - 1
SEMINAR AND WORKSHOPS 1. Seminar
(1) Schedule
April 27, 2011 and April 28, 2011, in Xining, Qinghai Province, PRC.
(2) Program
Table 1-1 Program of the Seminar Time Details Speaker
09:00 - 09:30 The Opening Remarks Qinghai Prov. ADB (Mr.Yamama)
NEWJEC 09:30 - 09:45 Tea Break - 09:45 - 10:45 Integrated Control Technology for a Large-scale Photovoltaic
System in Xining NEWJEC (Mr.Tanaka)
10:45 - 11:45 Introduction of the Mega Solar grid connected NEWJEC (Mr.Shiraishi) 11:45 - 13:30 Lunch - 13:30 - 14:30 The Latest Technology of Solar Radiation Evaluation NEWJEC (Mr.Nakazawa) 14:30 - 15:30 The Financial Assessment of PV Power Station NEWJEC (Mr.Nishida) 15:30 - 15:45 Tea Break - 15:45 - 16:45 Q & A and Today’s Review NEWJEC (Mr.Shiraishi) 16:45 - 17:00 The Closing Remarks and Information of the Site Visit NEWJEC
28 April, 2011
Time Details Speaker 09:00 - 09:30 Transportation to the Site - 09:30 - 11:30 Site Visit (300kW PV System) NEWJEC (Mr.Tanaka/Mr.Yagi) 11:30 - 12:00 Transportation - 12:00 - 13:00 Closing and Lunch -

Appendix 5 Renewable Energy Development Seminar and Workshops Final Report
A5 - 2
(3) Presentation Material
Seminar presentation papers were attached in the Appendix.
1) Integrated Control Technology for a Large-scale Photovoltaic System in Xining, Presented by
2) Introduction of the Mega Solar grid connected 3) The Latest Technology of Solar Radiation Evaluation 4) The Financial Assessment of PV Power Station
2. Interim Workshop
(1) Schedule
December 12, 2011, in Xining, Qinghai Province, PRC.
(2) Program
Table 2-1 Program of the Interim Workshop Time Contents Speakers
09:30 - 10:00 Seminar Commencement Representative Introduction Aims of the Meeting Opening Speech Group Picture
Mr. Liu Feng Mr. Liu Feng Mr.YukaoTanaka, Project Director Director of Financial Bureau in Qinghai Province Mr.Zhang Zhimin-Managing Director of Qinghai New Energy Group
10:00 - 10:20 Tea Break All Participants 10:20 - 11:20 Interim Progress made, Results and existing issues NEWJEC (Mr. Tanaka) 11:20 - 12:00 Making Comments referring to above situation Officials from Energy Bureau of Qinghai
Province 12:00 - 13:40 Lunch All Participants 13:40 - 14:20 PV Industry’s Trend and Market Prospective in China Mr. Wu Dacheng
-Secretary General from China Renewable Energy Committee
14:20 - 15:00 Designs of Large-Scale Integrated PV Plants in Qinghai Province Evaluations on PV Systems in Golmud
NEWJEC (Mr.Nakazawa)
15:00 - 15:20 Tea Break 15:20 -16:00 Financial Study of PV Industry NEWJEC (Mr Nishida) 16:00 - 16:40 Grid Protection and Low Voltage Ride Through
Technology in Japan NEWJEC (Mr.Matsukawa)
16:40 - 17:20 Inverter Technology in China NEWJEC (Guanya Power Equipment) 17:20 - 17:50 Exchange in China-Japanese Grid-connected
Technology and Devices Applications All Participants
17:50 - 18:00 Conclusions and Closing Remarks Mr. Liu Feng 18:00 - 19:30 Dinner All Participants

Renewable Energy Development Appendix 5 Final Report Seminar and Workshops
A5 - 3
(3) Presentation Material
Workshop presentation papers were attached in the Appendix.
1) Interim Progress made, Results and existing issues 2) PV Industry’s Trend and Market Prospective in China 3) Designs of Large-Scale Integrated PV Plants in Qinghai Province 4) Evaluations on PV Systems in Golmud 5) Financial Study of PV Industry 6) Grid Protection and Low Voltage Ride Through Technology in Japan 7) Inverter Technology in China
3. Final Workshop
(1) Schedule
June 14, 2012, in Xining, Qinghai Province, PRC

Appendix 5 Renewable Energy Development Seminar and Workshops Final Report
A5 - 4
(2) Program
Concerning the Panel Discussion, the speakers and panelists will consist of two moderators, two experts from ADB, one panelist from Energy Bureau, one panelist from Electric Company, one panelist from EA, one panelist from IA and two panelists from the Consultant.
Totally 10 persons will join the Panel Discussion and speaks.
Table 3-1 Program of Final Workshop
Time Contents Speakers
9:30-10:00
Director Liu Feng announces the opening Director Liu Feng introduces the guests of China and delivers a speech Project Team Leader of the Consultant introduces the consultant experts and delivers a speech Energy Expert of ADB delivers a speech Department Head Wang or Director Liu Feng deliver a speech
Mr. Liu Feng Mr. Liu Feng Mr. Shiraishi Mr. Yamamura Mr. Mr. Liu
10:00-10:20 tea break and photo session
10:20-11:00 Project expert (the Consultant) state the research history and achievements The Consultant
11:00-11:40 Q & A regarding above session 11:40-12:20 Presentation from IA (QBE) about the QBE's 10 MW Pilot PV Project QBE 12:20-14:00 Lunch
14:00-14:30 Lecture about policies ,direction and outlook of RE from the Energy
Bureau of QHPDRC Energy Bureau of QHPDRC
14:30-15:00 Presentation on situation and problems of Haixi prefecture RE by Haixi Energy Bureau Haixi Energy Bureau
15:00-15:30 tea break
15:30-17:00 Panel Discussion on actual problems and solation of PV industries
17:00-17:30 Communication between Panelists and Audience, and release a press
17:30-17:50 Evaluation and summary of the project
17:50-18:00 Conclusions and deliver a closing speech Mr. Liu Feng 18:00-19:30 Dinner
(3) Presentation Material
Workshop presentation papers were attached in the Appendix.
1) PPT Presentation of the Final Report 2) 10MW Integrated PV Station of Golmud City 3) Speech on the Final Workshop and Outcome Extension TA Qinghai Renewable
Energy Development Project 4) Prospect of ADB TA Haixi Renewable Energy Development Project

Renewable Energy Development Appendix 6 Registered Companies and Applied Projects of Final Report Qinghai 930 Projects in Haixi Prefecture
APPENDIX 6
REGISTERED COMPANIES AND APPLIED PROJECTS OF QINGHAI 930 PROJECTS
IN HAIXI PREFECTURE

Renewable Energy Development Appendix 6 Registered Companies and Applied Projects of Final Report Qinghai 930 Projects in Haixi Prefecture
A6 - 1
No.
Pro
ject
ow
ner
New
cap
acity
Pla
nned
tota
l ca
paci
tyP
roje
ct fo
r 1.1
5 el
ectri
city
pric
eLo
catio
n
1Lo
ngyu
anG
olm
udN
ewE
nerg
yD
evel
opm
entC
o.,L
td.
3020
020
+ 3
0 =
50G
olm
ud2
Yello
wR
iver
Upp
erR
each
esH
ydro
pow
erD
evel
opm
entC
o.,L
td.
200
1000
200
Gol
mud
3G
uodi
anP
ower
Qin
ghai
New
Ene
rgy
Pro
ject
Pre
para
tory
Off
ice
1020
010
Gol
mud
4C
hina
Thre
e-go
rge
New
Ene
rgy
510
5G
olm
ud5
Bei
jing
Bei
kong
Gre
enS
cien
cean
dTe
chno
logy
Indu
stria
lCo.
,Ltd
.20
5020
Gol
mud
6Q
ingh
aiW
ater
Con
serv
atio
nan
dH
ydro
pow
erG
roup
1020
10G
olm
ud7
CP
IGol
mud
Pho
tovo
ltaic
Pow
erG
ener
atio
nC
o.,L
td.
3020
020
+ 3
0 =
50G
olm
ud8
Jinz
hou
Sun
shin
eE
nerg
y20
2020
Gol
mud
9Q
ingh
aiP
roje
ctP
repa
rato
ryO
ffic
eof
Dat
ang
Sha
ndon
gB
ranc
h20
2020
Gol
mud
10H
uane
ngG
olm
udP
hoto
volta
icP
ower
Gen
erat
ion
Co.
,Ltd
.30
200
30G
olm
ud11
Qin
ghai
Bai
keP
hoto
elec
trica
lCo.
,Ltd
.8
102
+ 8
= 10
Gol
mud
12C
hina
Hua
dian
Pho
tovo
ltaic
Pow
erG
ener
atio
nC
o.,L
td.
1010
10G
olm
ud13
Zhej
iang
Zhen
gtai
Sol
arE
nerg
yS
cien
cean
dTe
chno
logy
Co.
,Ltd
.20
2020
Gol
mud
14Q
ingh
aiJi
ngne
ngC
onst
ruct
ion
Inve
stm
entC
o.,L
td.
2010
020
Gol
mud
15S
heng
guan
gN
ewE
nerg
yC
o.,L
td.
220
1 +
2 =
3G
olm
ud16
Qin
ghai
Dat
ang
Inte
rnat
iona
lEne
rgy
Pro
ject
Pre
para
tory
Off
ice
2020
20G
olm
ud17
Qin
ghai
New
Ene
rgy
Gro
upC
orpo
ratio
n10
1010
Gol
mud
18Q
ingh
aiJu
nshi
Ene
rgy
Co.
,Ltd
.8
102
+ 8
= 10
Gol
mud
19Q
ingh
aiP
rovi
ncia
lDev
elop
men
tand
Inve
stm
ent
Co.
,Ltd
.2
22
Gol
mud
20Ye
llow
Riv
erU
pper
Rea
ches
Hyd
ropo
wer
Dev
elop
men
tCo.
,Ltd
.30
5030
Ula
n21
CE
CS
olar
Ene
rgy
Co.
,Ltd
.10
1010
Da
Qai
dam
22G
uodi
anQ
ingh
aiB
ranc
h20
2020
Del
ingh
a23
Qin
ghai
Linu
oS
olar
Ene
rgy
Pow
erC
o.,L
td.
3030
30D
elin
gha
24C
hina
Win
dP
ower
Gro
up30
5030
Del
ingh
a25
CE
CS
olar
Ene
rgy
2020
020
Xiti
esha
n26
CG
NP
CS
olar
Ene
rgy
Dev
elop
men
tCo.
,Ltd
.90
100
10 +
90
= 10
0X
ities
han
Tota
l70
525
82
760
(incl
udin
g 45
MW
at G
olm
ud
and
10M
W a
t Xiti
esha
n al
read
y co
nnec
ted
to g
rid)
Reg
iste
red
Com
pani
es a
nd A
pplie
d Pr
ojec
ts o
f Qin
ghai
930
Proj
ects
in H
aixi
Pref
ectu
re

Prepared by NewJec, Inc., Japan
For Qinghai Provincial Financial Bureau Qinghai Brightness Engineering Co., Ltd
Copyright © 2022 FDOKUMEN