
Nelson City Renewable Energy Study
87
Renewable Energy Assessment for Nelson City Final Report Report compiled for Nelson City Council – 26 June 2013 P 2 P
-
Upload
khangminh22 -
Category
Documents
-
view
1 -
download
0
Transcript of Nelson City Renewable Energy Study
Renewable Energy Assessmentfor Nelson City
Final Report
Report compiled for Nelson City Council – 26 June 2013
P2P
paulth
Typewritten Text
paulth
Typewritten Text
1542305
paulth
Typewritten Text
lindaca
Typewritten Text
Attachment 1 to report 1535154
lindaca
Typewritten Text

Nelson City Renewable Energy Assessment
| 2
P 2P
Renewable Energy Assessmentfor Nelson City
Version Internal Reference Date Comments
1 NCC-REA001-v1 5 Apr 2013 Draft for Discussion
2 NCC-REA001-v2 15 June 2013 Final Draft
3 NCC-REA001-v3 26 June 2013 Final
Authors:
Peter Apperley, Paenergy Consultants Ltd, [email protected]
David Reid, P2P Energy Services Ltd, [email protected]
Acknowledgements:
The authors would like to acknowledge the help and support of the following people in completing this report: Paul Harrington, Policy Adviser, Nelson City Council Sarah Yarrow, Policy Adviser, Nelson City Council David Jackson, Principal Adviser – City Development, Nelson City Council Matt Heale, Principal Adviser - Resource Management Planning, Nelson City Council Phil Ruffell, Principal Adviser Utilities, Nelson City Council Richard Frizzell, Team Leader Environmental Services, Nelson City Council Richard Popenhagen, Eco Design Adviser, Nelson City Council Murray Hendrickson, Network Manager, Network Tasman Ltd Jo Rainey, Customer Manager, New Zealand Trade & Enterprise Dr Grant Jones, Chief Executive, Nelson Environment Centre Carolyn Hughes, Manager – Climate Change & Clean Energy, Nelson Environment Centre Philip Wilson, Research & Environment Manager, Nelson Pine Industries Ltd James Cameron, Process Engineer, Nelson Pine Industries Ltd Stu Reed, Assets Manager, Nelson Electricity Ltd Micah Sherman, Photovoltaics Manager, Righthouse Ltd Dr Murray Poulter, Chief Scientist, NIWA James Sturman, Scientist – Climate GIS Applications, NIWA Paul Dorrington, Chief Technical Officer, Aquaflow Richard Oswald, Director, GreenXchange Johan Thairt, Advisor, Nelson Region Sewerage Business Unit David Francis, Facilities Manager, Nelson Marlborough District Health Board
We gratefully acknowledge the support of NIWA in supplying the energy resource maps included in this report.
Copyright: © All rights reserved. This publication may not be reproduced or copied in any form without the permission of the client. Such permissionis to be given only in accordance with the terms of the client's contract with Paenergy Consultants. This copyright extends to all forms of copying andany storage of material in any kind of information retrieval system.
Limitation: This report has been prepared on behalf of and for the exclusive use of Nelson City Council and is subject to and issued in connection withthe provisions of the agreement between Paenergy Consultants and Nelson City Council. Paenergy Consultants and P2P Energy Services accept noliability or responsibility for or in respect of any use of or reliance upon this report by any third party.

Nelson City Renewable Energy Assessment
| 3
P 2P
CONTENTS
1 Executive Summary 6
1.1 Energy Demand, Supply and Cost 6
1.2 Renewable Energy Opportunities 6
1.3 Increasing Uptake 8
1.4 National Policy Statement on Renewable Electricity Generation 8
2 Introduction 9
2.1 Background 9
2.2 Scope and Objectives 9
2.3 Nelson City Profile 10
2.4 Approach 10
2.5 Information Sources 11
3 Review of Drivers 12
3.1 Current Energy Demand in the Region 12
3.1.1 Electricity Demand 12
3.1.2 Total Energy Demand 12
3.1.3 Future Growth 13
3.2 Current Energy Supply in the Region 14
3.2.1 Renewable Generation 14
3.2.2 Transport Fuels 14
3.2.3 Heating 15
3.3 Security of Supply 16
3.4 Long Run Cost of Electricity 16
4 Renewable Energy Potential in Nelson 19
4.1 Generic Barriers to Renewable Energy 19
4.2 Wind 20
4.2.1 Technology Review 20
4.2.2 Economics of Wind 22
4.2.3 Wind Resource in Nelson 24
4.2.4 Potential Electricity Generation from Wind 25
4.2.5 Viability/Barriers to Development 25

Nelson City Renewable Energy Assessment
| 4
P 2P
4.3 Solar 26
4.3.1 Technology Review 26
4.3.2 Solar Resource in Nelson 33
4.3.3 Economics of Solar 34
4.3.4 Energy Potential for Solar 38
4.3.5 Viability/Barriers to Development 39
4.4 Hydro 41
4.4.1 Technology Review 41
4.4.2 Economics of Hydro 42
4.4.3 Review of Hydropower Capacity Studies 43
4.4.4 Hydro Resources 43
4.4.5 Potential for Hydropower in Nelson 44
4.4.6 Viability/Barriers to Development 44
4.5 Bioenergy 45
4.5.1 Summary of Potential 45
4.5.2 Biomass Resource in Nelson 46
4.5.3 Economics of Biomass 49
4.5.4 Bioenergy Applications 50
4.5.5 Emerging Technologies 53
4.5.6 Viability/Barriers to Development 54
4.6 Transport Fuels 55
4.6.1 Conservation and Efficiency 55
4.6.2 Comparison of the Renewable Options 55
4.6.3 Electric Vehicles 56
4.6.4 Biofuels 57
4.6.5 Biofuel Development Opportunities for Nelson 59
4.7 Marine Energy 60
4.7.1 Technology Review 60
4.7.2 Economics of Marine Energy 62
4.7.3 Ocean Current Resource 64
4.7.4 Wave Resource 64
4.7.5 Viability/Barriers to Development 65
4.8 Summary of Renewable Energy Sources 66
5 Influences on the Uptake of Renewable Energy 68
5.1 Economics 68
5.1.1 Specific Project Factors 68

Nelson City Renewable Energy Assessment
| 5
P 2P
5.1.2 Cost of GHG Emissions 68
5.1.3 Financial Incentives 69
5.1.4 Solid Waste Disposal Costs 69
5.2 Policy and Regulation 70
5.3 National Policy Statement on Renewable Electricity Generation 70
5.4 Social and Environmental Factors 71
6 Road Map for Renewable Energy in Nelson 72
6.1 Key Renewable Energy Opportunities in Nelson 72
6.2 Meeting the Requirements of NPS REG 72
6.3 Scenario for Setting Regional Goals 73
6.4 Role for Nelson City Council 74
6.4.1 General 74
6.4.2 Solar PV and Hot Water 75
6.4.3 Wind 75
6.4.4 Hydro 75
6.4.5 Bioenergy 75
6.4.6 Transport 75
7 Glossary of Terms 76
8 References 78

Nelson City Renewable Energy Assessment
| 6
P 2P
1 Executive SummaryThe purpose of this report is to identify what renewable energy opportunities exist within Nelson City Council’sjurisdiction and outline the potential for these opportunities to be realised. This report will be used to inform theNelson Development Strategy and Nelson City Council’s work to give effect to the National Policy Statement forRenewable Electricity Generation.
1.1 Energy Demand, Supply and Cost
Nelson City currently consumes 4.1 PJ of energy per annum, which includes 1.2 PJ (340 GWh) of electricity from theNational Grid and half in the form of transport fuels. Existing embedded renewable generation consists of thirty four1.7 kW to 11kW rooftop solar photovoltaic (PV) systems and a 90kW micro hydro plant on the water treatment plant.
Nelson City’s energy use per head of population is similar to the national average but renewable energy makes up asignificantly lower proportion of the total city usage; at 29% compared with the national average of 43%.
In assessing the likelihood of future development of renewable generation in Nelson City it is important to take intoaccount the forward wholesale electricity price in the region and to a lesser extent the retail electricity price.Wholesale electricity prices are currently averaging around $110/MWh in Nelson and projected to rise to between $120and $142/MWh in real terms by 2030. Any utility scale electricity generation developed in the region will need to havea levelised cost of electricity (LCOE) at or lower than this range to be economically viable.
Average residential retail electricity prices in Nelson are around 24 c/kWh (excl. GST) and commercial prices range from10c-20 c/kWh depending on the size of the customer. These tariffs are also expected to rise in line with the wholesalerates over the next 20 years. Embedded small-scale renewable energy sources such as rooftop solar PV, solar hot watersystems and energy efficiency can be economic when reducing customer load at these high tariffs.
For direct heating, with a demand of 0.8 PJ per annum, woody fuels can be competitive with coal and are typicallymuch cheaper than liquid fossil fuels. Increasing demand for wood fuel for heating can be met from forest resourceswithin the wider upper South Island region.
1.2 Renewable Energy Opportunities
Gross electricity demand in Nelson City is expected to grow from about 340 GWh in 2012 to 405 GWh in the next 25years – an overall increase of 65 GWh (about 20%). At this growth rate, peak demand is expected to stay within theelectrical capacity of the Stoke grid exit point and Nelson Electricity’s 33kV network assets. The overall increase couldfeasibly be met from an increase in electricity generation from outside of the region, however this could result inoverall increases in wholesale / retail electricity prices due to increased losses in transmission. These potential priceincreases can be reduced by improving efficiency in electricity usage and the development of commercially competitiverenewable generation within the region.
This demand growth can potentially be met by the following renewable energy sources which may be commerciallydeveloped in Nelson City over the next 25 years:
Residential solar water heating – good solar resource at 4.0 kWh/m2/day resulting in between 40-50 GWhpotential of which up to 12 GWh might be commercially developed at costs of 19-23 c/kWh;
Residential rooftop solar photovoltaics – 30 GWh potential (in addition to solar water heating) of which 6 to26 GWh may be commercially developed at costs of 15 - 27c/kWh;

Nelson City Renewable Energy Assessment
| 7
P 2P
Commercial-scale rooftop photovoltaics and possibly small-scale <100 kW commercial solar PV arrays –between 65 and 75 GWh of potential of which 2 to 7 GWh may be commercially developed at costs of 12 –19 c/kWh;
Niche micro hydro at NCC Maitai Dam (<1 GWh) and biogas plant at WWTP facility (2-6 GWh);
Embedded energy efficiency through encouraging passive solar design in new housing and retrofittinginsulation and double glazing in existing housing stock during refurbishment – 4 to 12 GWh in future energysavings;
Small-scale wind turbines and run-of-river micro hydro - <1 GWh potential at 30-50 c/kWh may be economicin niche remote rural off-grid scenarios if avoiding an expensive network connection;
Direct conversion from fossil fuel heating to wood fuel heating - 0.3 - 0.6 PJ of which up to 50% may becommercially viable;
Niche biodiesel and wood pellet manufacture – approximately 0.1 PJ plus large scale pellet export potential;and
Substitution of transport fuels with electricity via electric and hybrid-electric vehicles – approximately 2 PJ oftransport fuel potential of which 10% (0.2 PJ) may be substituted with 0.04 PJ (11 GWh) of grid electricity inthe time frame.
Based on currently available information on the available Nelson City renewable resources and projected technologyeconomics relative to alternative energy sources, the following renewable energy technologies are not expected to becommercially developed in Nelson City in the next 25 years:
Large scale woody biomass electricity generation / biofuel facilities – nearly 600 kt of biomass in the widerregion but much of which is already accounted for in higher value processes such as MDF manufacture;
Utility scale wind turbines / wind farms – potentially 150 GWh of wind resource but at low average windspeeds <6 m/s, resulting in high costs of wind generation in excess of $150/GWh;
Wave energy converters / wave farms – potentially 100-150 GWh of wave energy resource but at low waveenergy density of <10 kW/m and wave energy converters are at early pre-commercial stage (>$600/MWh);
Solar PV farms (>500 kW) – solar resource of 4.0 kWh/m2/day insufficient to make utility scale solar economicin NZ at $310-350/MWh at current equipment costs, possibly reducing to $180-200/MWh in the next 25 years;and
Next generation liquid biofuels - based on future surplus low grade woody biomass of 0.5m t would be unlikelyto be commercial due to insufficient scale and infrastructure (compared to establishing a facility elsewhere inNZ).
However, while the above list is not anticipated to be economic within the timeframe, this may not prevent earlydevelopers seeking to consent these facilities well ahead of the anticipated commercial timeframe.
Overall, Nelson City has a total technically feasible renewable energy resource of between 665 GWh – 760 GWh (2.7 PJ)per annum that could be utilised for electricity production. However there are significant commercial barriers that willprevent the development of these resources in the next 25 years. The commercially viable renewable resource thatmay be developed over the next 25 years could be between 20 GWh and 63 GWh per annum i.e. between 30% and100% of predicted electricity demand growth to 2036.
There is also technical potential for between 1.1 and 1.4 PJ of heating and transport fuel substitution to renewableenergy and electricity sources in Nelson City. Up to 0.4 PJ of substitution to clean woody biomass for heating is likely tobe commercially viable in the next 25 years. In the near term the relative affordability of electric vehicles will likely limitinitial widespread uptake of this technology. However the emergence of plug-in hybrid vehicles and increasing cost

Nelson City Renewable Energy Assessment
| 8
P 2P
competitiveness could see an increase in fuel substitution in the order of 0.2 PJ (about 20% of personal vehicles) withinthe 25 year time frame. Note this would increase annual electricity demand in Nelson by around 0.04 PJ (11 GWh).
1.3 Increasing Uptake
NCC already appears to have a progressive policy for encouraging sustainability and renewable energy. However morecan be done by Nelson City Council to help facilitate renewable energy development in its district, including:
Ensuring that the Resource Management Plan is updated to meet the objectives of the National PolicyStatement on Renewable Energy Generation 2011 – see Section 6.2;
Setting clear and achievable goals for renewable energy uptake – see Section 6.3;
Supporting measures to reduce the costs and barriers to renewable energy development. For example byreducing the associated consenting fees, creating opportunities for economies of scale in the wider region andby influencing Nelson Electricity and Network Tasman to proactively encourage locally embedded generationopportunities;
Leading by example, by ensuring that renewable energy opportunities within NCC’s operations are fullyinvestigated and undertaken if commercially viable;
Continuing to promote sustainability and public education: collaborating with interested parties such as EECA,Nelson Environment Centre, Tasman District Council and industry associations;
Encouraging private sector investment in renewable energy supply and technology development within thecity; and
Actioning specific measures to advance current renewable energy opportunities in the Nelson/Tasman Region– see section 6.4.
1.4 National Policy Statement on Renewable Electricity Generation
It should be noted that if all of the commercially viable renewable electricity generation potential were developedwithin the next 25 years, Nelson City would only meet 10% of its electricity demand (~40 GWh) from local renewableresources and contribute about 0.1% to the national energy target.
It would not be practical to expect Nelson City to generate 90% of its electricity supply from uneconomic renewableresources within its district when there are more economic renewable resources that can be developed in neighbouringregions and transmitted to Nelson at a lower overall cost.

Nelson City Renewable Energy Assessment
| 9
P 2P
2 Introduction2.1 Background
The purpose of this report is to identify what renewable energy opportunities exist within Nelson City Council’sjurisdiction (as shown in Figure A below) and outline the potential for these opportunities to be realised.
This report will be used to inform the Nelson Development Strategy and Nelson City Council’s work to give effect to theNational Policy Statement for Renewable Electricity Generation.
Figure A - Nelson City Council - Area of Responsibility (Nelson City Council, 2008)
2.2 Scope and Objectives
This assessment considers the options for increasing the supply and use of renewable energy in the Nelson CityCouncil’s (NCC) territorial area. While the focus is on the Nelson City area, the assessment takes account of the widerregional context.

Nelson City Renewable Energy Assessment
| 10
P 2P
The assessment is not intended to provide a national perspective and it excludes consideration of demand reduction byreducing consumption (except for opportunities to reduce household heating requirements through passive solardesign principles) and improving efficient use of fossil fuels.
The assessment has a 25 year outlook, with a strong 10 year practical focus.
The objectives of the assessment are to:
Identify the opportunities for renewable energy in Nelson City and outline the potential for these to be realised.The assessment focuses on renewable electricity generation, with a secondary focus on renewable heating andtransport biofuels;
Inform NCC so that it can give effect to the National Policy Statement (NPS) for Renewable Electricity Generation.The NPS for Renewable Electricity Generation’s primary objective is to increase the generation of electricity in NewZealand from renewable energy sources from the current level of around 70% to 90% by 2025; and
Support NCC’s long term sustainability strategy, as set out in “Nelson 2060” (Nelson City Council, Feb 2013) and inparticular its goal of moving from fossil fuel to renewable energy sources. To support this goal NCC will: use cityplanning and design to encourage a low carbon economy, creating economic opportunities around renewableenergy and lead by example.
2.3 Nelson City Profile
NCC’s territorial area has a population of around 43,000 ranking it as New Zealand’s 9th most populous city, but with aland area of only 422 square kilometres. NCC is a unitary authority, having the combined responsibilities of local andregional governance and functions.
The city borders on the Tasman District which has a similar population base and includes the town of Richmond. This islocated on NCC’s boundary and is the region’s second-largest urban area with a population of around 13,000 residents.
Nelson City is the economic and business centre of the wider region. The Nelson regional economy is based onseafood, horticulture, tourism and forestry. Port Nelson is the biggest fishing port in Australasia.
Nelson has one of the sunniest climates of all major New Zealand centres, with an annual average total of over 2,400hours of sunshine. It is also sheltered from prevailing winds.
2.4 Approach
The following assessment methodology has been used:
Characterisation of existing energy supply and use in Nelson City and the anticipated future costs based on MBIEforecasts, regional influences and the authors’ collective expertise in the energy sector;
Characterisation of other non-financial influences on future options for energy supply in the city;
Characterisation of primary renewable resources in the NCC region or nearby;
For each renewable energy option, characterisation of the technology, its maturity and risks, potential scaleoptions, current and future economics, and special considerations;
Assessment of the merit order for options to maintain and increase renewable energy supply in the area and theirrelative economic sensitivities; and
Identification of ways for NCC to encourage and facilitate increased renewable energy supply.

Nelson City Renewable Energy Assessment
| 11
P 2P
2.5 Information Sources
The assessment relies on previously published detailed assessments for energy demand and renewable energyopportunities in the Nelson / Tasman Region and/or nationally, providing local context and analysis from the authors’own knowledge and experience in the renewable development industry.. References are provided for the importantsources of background information.
Resource size and quality estimates are of first order indications of magnitude and should not be relied upon forcommercial purposes, likewise energy demand and electricity price projections. Potential renewable energy developersseeking to establish projects in the region are encouraged to undertake site specific measurements and seekindependent advice on future electricity demand and price projections.
All costs in this report are indicative and GST exclusive. Actual costs can vary significantly due to economic conditions,point of use and demand pattern. Future costs are in $2013, i.e. real, ignoring underlying inflation.

Nelson City Renewable Energy Assessment
| 12
P 2P
3 Review of Drivers3.1 Current Energy Demand in the Region
3.1.1 Electricity Demand
Nelson City is supplied by two distribution companies: Nelson Electricity and Network Tasman. Nelson Electricity’snetwork supplies Nelson’s central business district and is connected to the National Grid at Transpower’s 33kV Stokegrid exit point (GXP).
Network Tasman also supplies the urban and rural areas of Nelson City from the Stoke GXP at its Founders, Annesbrookand Songer St zone substations. However it also supplies the Richmond, Hope and Appleby areas of Tasman districtfrom the same GXP (Network Tasman Ltd, 2012).
The total annual electricity demand at Stoke increased from 535 GWh in 2000 to 632 GWh in 2007, but subsequentlydropped by about 10% in the following years before recovering to 625 GWh in 2012. (Electricity Authority, 2013).
Based on Network Tasman’s peak demand information at each of its zone substations, it is estimated that Nelson Citytakes about 54.5% of the electricity supply i.e. 340 GWh per annum in 2012.
3.1.2 Total Energy Demand
Nelson City’s current energy usage and greenhouse gas (GHG) emissions are estimated to be as follows:
Consumer energytype
Current annualusage1
GHG emissionfactor
Total GHGemissions
(per annum)
Source of estimate
Electricity fromGrid2
340,000 MWh1.2 PJ
143 kgCO2e/MWh40 ktCO2e/PJ
49 ktCO2e Network Tasman and Ministry forEnvironment (MfE)
EmbeddedRenewable Gen.
167 MWh0.001 PJ
0 ktCO2e/PJ 0 ktCO2e Solar PV: Network Tasman, NelsonElectricity, Hydro: NCC
Transport fuels3 56m litres2.1 PJ
2.5 kgCO2e/l68 ktCO2e/PJ
141 ktCO2e NCC data: 360mV km/y plus 30% off roadusage assumedAssume 12 litres/100 km average
Energy for direct heatCoal 0.2 PJ 92 ktCO2e/PJ 20 ktCO2e NCC data and estimates from usersDiesel/Fuel Oil 0.2 PJ 70 ktCO2e/PJ 16 ktCO2e NCC data and estimates from users
LPG 0.1 PJ 60 ktCO2e/PJ 6 ktCO2e prorated from MED dataSolar Water Heating 0.003 PJ 0 ktCO2e/PJ 0 ktCO2e NCC Consents data for past four yearsBioenergy 0.3 PJ 1.4 ktCO2e/PJ 0.4 ktCO2e Allowing for 24,000t/y
Total4 4.1 PJ 233 ktCO2e
Notes:1. Based on best available information or pro-rated based on national averages2. Electricity supplied from the Grid is approximately 75% from renewable energy supply (hydro, geothermal, wind and biomass) but this varies
from year to year.3. Excludes shipping and aircraft fuel.4. Excludes indirect and embodied emissions. Includes diesel use in stationary engines
Based on these estimates, Nelson City’s energy use per head of population is similar to the national average butrenewable energy makes up a significantly lower proportion of the total city usage; at 29% compared with the nationalaverage of 43% (MBIE, 2012).

Nelson City Renewable Energy Assessment
| 13
P 2P
The current energy use and GHG emissions balances are illustrated below:
Figure B – Nelson City Energy and GHG Emissions Balance
3.1.3 Future Growth
Nelson Electricity’s peak load is forecast to grow from 33 MVA to just above 40 MVA in the next 20 years, at a rate ofabout 1% per annum – this is expected to be well within the 50 MVA capacity of its 33kV network. Network Tasman’speak demand growth is around 2% per annum for the next ten years – noting that the Tasman District has greater areafor population and industry growth than Nelson City. The Council estimates that Nelson City will increase from about19,200 households in 2011 to around 23,050 households in 2036 (a growth rate of about 0.8% per annum).
This report estimates that annual electricity demand growth at the Stoke GXP will be around 1.3% per annum - basedon a growth rate of about 2% per annum in the Tasman District and 0.8% per annum in Nelson City (limited byhousehold growth rate). Assuming no significant embedded generation is built in this period, Nelson City’s annualelectricity demand could grow from around 340 GWh in 2012 to about 405 GWh by 2036. This also does not assumeany end use improvement in electricity efficiency and should be seen as a maximum growth scenario.
Figure C - Historical and Projected Electricity Demand for Stoke GXP and Nelson City
Embedded distributed generation such as rooftop solar photovoltaics, energy efficiency improvements to existing andnew buildings (including use of passive solar design) and solar hot water heating could have significant impact on thisfuture electricity growth and are discussed further in the next section.

Nelson City Renewable Energy Assessment
| 14
P 2P
Energy demand for transport fuels and heating is also expected to increase broadly in line with household growth,resulting in a 10% to 20% increase by 2036. During this period, there is also likely to be some conversion from liquidfuels to electric vehicles which could add to the electricity demand projections above.
3.2 Current Energy Supply in the Region
3.2.1 Renewable Generation
As at September 2012, there were no existing small to large scale renewable (or thermal) power stations in Nelson City.(Electricity Authority, 2012)
In the wider Nelson / Marlborough region there are seven small to medium sized hydro power stations and two smallscale wind farms, generating a total of 262 GWh per annum on average. About 72% of this energy is supplied byTrustPower’s 32MW Cobb hydro scheme. The two small wind farms (Weld Cone and Lulworth) were built on the eastcoast of the Marlborough region by Energy3 in 2010 and 2011, consisting of second hand wind 250 kW wind turbinesimported from Denmark (New Zealand Wind Energy Association, 2011).
Network Tasman currently has 21 solar photovoltaic (PV) installations connected to their network within Nelson Citywith a total capacity of 93.6kWp (Hendrickson, 2013) – the largest of which is the 11kWp system installed at NelsonAirport. Nelson Electricity has 13 embedded PV installations totalling 37kWp (Nelson Electricity Ltd, 2013). The totalestimated annual generation from these PV systems is about 164 MWh – approximately 0.05% of total electricitydemand in Nelson City.
Figure D - 11 kW Solar PV Array at Nelson Airport
Both companies anticipate continued growth of embedded solar photovoltaic systems in their networks - which willslow the growth of energy consumption but is not expected to have a significant impact on network peak demand(which generally occurs in winter evenings).
A small 90kW hydro generator is installed on Nelson City Council’s water supply pipe from Roding waterworks at theWater Treatment Plant, supplying an estimated 3 MWh p.a.
Based on NCC building consent records, in the past four years 447 solar hot water systems have been installed inNelson City. Based on an average system size it is estimated that these reduce Nelson City’s electricity demand byabout 970 MWh per annum.
3.2.2 Transport Fuels
Transport fuels used in the region include diesel, petrol and Liquefied Petroleum Gas (LPG) supplies. Diesel and petrolis normally shipped to Nelson port from the Marsden Point Refinery. LPG is shipped, railed or trucked from Taranakisources or, at times, is from imported supply.

Nelson City Renewable Energy Assessment
| 15
P 2P
Current indicative retail prices are as follows:
Fuel GCV Energy price Sales tax Total pump price1
Diesel 38MJ/l 132c/l 0.4c/l 132c/l $35/GJPetrol 35MJ/l 130c/l 61c/l 191c/l $54/GJLPG 27MJ/l 114c/l 10.4c/l 124c/l $42/GJ
Notes1. Prices exclude GST. RUC for diesel vehicles excluded.
The price of transport fuels is driven largely by the international crude oil price and the NZ currency exchange rate.Both of these are volatile and cyclic and long term price forecasting is speculative. However it is inevitable that the costof liquid transport fuels will rise faster than inflation. It is a global commodity that is increasingly expensive and energyintensive to extract, and it is being extracted at an unsustainable rate. Future oil shocks similar to several that haveoccurred in recent decades are also likely to be repeated.
There is very little production of biofuels in NZ. Gull blends small volumes of ethanol into petrol and biodiesel isproduced by several niche businesses. The biodiesel industry was supported by a grants scheme operated from June2009 until June 2012. This provided a grant of 42 c/litre biodiesel, but the scheme has now ended.
3.2.3 Heating
For heating, apart from electricity, the other important sources of primary energy in the Nelson /Tasman Region aresub-bituminous coal, diesel/fuel oil, LPG, biomass, and landfill gas (LFG).
For the fuels where markets prices are in the public domain, the typical costs of the fuel and delivered heat (fuel costonly) are as follows.
Primary energy Currentprice1
Conversionefficiency2
Delivered heatcost3
Electricity - residential $67/GJ 100% $67/GJElectricity + heat pump $67/GJ 400% $17/GJCoal – industrial commercial scale $8/GJ 75% $11/GJ
Diesel – all segments $35/GJ 80% $44/GJLPG – bulk supply excluding delivery $36/GJ 80% $45/GJWood chip fuel (seasoned) – bulk supply4 $11/GJ 70% $16/GJ
Wood pellets – 20kg bags $27/GJ 80% $34/GJ
Notes1. Retail prices excluding GST2. Average gross efficiencies for modern best of class appliance3. Fuel cost only, excluding non-fuel operating costs and capital plant cost4. Assumed 30% moisture content (wet basis). Domestic firewood is excluded as price and conversion efficiency is highly variable.
Coal is normally sourced from the West Coast, and its usage in Nelson City is estimated to be approximately 12,000tonnes per year (NCC Consents). Coal combustion is only permitted in specific industrial and commercial applicationscovered by resource consents. The largest users are the Nelson Hospital, South Pine and the Stoke Brewery.
Diesel, Fuel Oil and LPG are sourced from transport fuel suppliers. Diesel/Fuel for heating is used mainly in smallindustrial and commercial applications. ENZA Foods and Sealords are the largest users. LPG is also used for domesticheating and cooking.
In total, approximately 24,000 t/y biomass for bioenergy is used in Nelson City, with significantly more used in theTasman District. Most of this is generated by local wood processors from wood processing and directly used on theirown sites as boiler fuel. The major biomass users are the Nelson Pine MDF and LVL mill, the CHH Eaves Valley Sawmill(both in the Tasman District), Waimea Sawmill and South Pine Sawmills. The balance of approximately 8,000 t/y solidwood is used in domestic wood fires.

Nelson City Renewable Energy Assessment
| 16
P 2P
Wood pellets for domestic and small commercial scale heating are manufactured locally (in Tasman District) by AZWood. These are also distributed throughout New Zealand.
LFG from the York Valley landfill is used for heating at the Nelson Hospital. Approximately 30,000 GJ/y LFG is used withthe balance of heat for the hospital supplied by coal boilers.
3.3 Security of Supply
Security of energy supply issues facing Nelson City are similar to many parts of New Zealand.
For Nelson, the major risks include:
Risks Potential impacts Mitigation through Renewable Energyuptake
Transport FuelsCrude oil price shocks due to internationalcrude oil market supply/demandimbalances
Large transport fuel cost increases maycause serious long term detrimentaleconomic and social impacts
Reduce dependence on liquid fossil fuels.Note however that biofuels are likely to bepriced at the avoided costs of fossil fuelalternatives.See section 4.6
Oil supply interruption. For example due totemporary disruption to imports, theoperation of Marsden Point Refinery orNelson Port
Short term supply disruption
ElectricityElectricity price shock: for example causedby a dry year
Temporary large cost rises possible. Increase use of regional distributedrenewable energy alternatives such as solar,wind and hydro power generation canreduce price volatility, but limited ability tomaintain power supply during outage e.g.solar PV systems must disconnect from gridwhen power supply is lost.
Natural disaster interrupting NZ supplychain: for example earthquake damagingindividual hydro power plants ortransmission lines
Load shedding or complete loss ofsupply.Disruption to supply should be limitedto relatively short term period
Short term loss of one or more transmissionlines supplying the Upper SI region due toweather, slip or system fault
Load shedding or complete loss ofsupply.Disruption to supply should be limitedto relatively short term period
Depends on availability of “firm”renewables in the region and extent ofpower outage.
HeatingOil price shocks Use of Diesel, fuel oil and LPG may
become uneconomic.Convert to locally available biomass fuels
Having additional renewable generation established within Nelson City and the wider Nelson / Tasman Region wouldhave a number of beneficial effects, particularly in reducing average line losses and electricity wholesale prices in theregion. However, the role that renewable generation can take in improving security of supply is limited by thevariability of the renewable energy source. The loss of a power line supplying the region might occur when the sun isshining or the wind is blowing, but it may not. Without significant storage (such as a hydro dam or biomass storage),the development of renewable generation in the region will not provide significant benefits for security of supply.
3.4 Long Run Cost of Electricity
The delivered cost of electricity for residential customers in Nelson is currently around 24 cents/kWh (typical householdexcluding GST and including prompt payment discount). Larger commercial and industrial customers may paysignificantly less, depending on their scale of usage, load profile, the time of use and location on the network.
The residential cost of electricity in Nelson has four main components, namely wholesale electricity costs, transmissioncharges, network charges and retail / metering costs as illustrated below and discussed in the following sub-sections.

Nelson City Renewable Energy Assessment
| 17
P 2P
Figure E – Retail Electricity Cost Components
3.4.1.1 Wholesale Electricity Costs
Wholesale electricity prices are affected by both spot market and hedge costs, which are currently averaging around11 c/kWh ($110/MWh) at Nelson. This cost is expected to rise in real terms (i.e. above the inflation rate) on averagebetween 0.5% and 1.5% per year. The rate of increase will be most influenced by demand growth and the need formore expensive generation, domestic natural gas costs, GHG emission costs and the NZ currency exchange rate.
The Ministry of Business, Innovation and Employment (MBIE, 2011) produce forecasts for the average wholesaleelectricity price ($2010) at Haywards based on a range of scenarios. For Nelson the wholesale price (ignoring variationsdepending on the time of use) is typically approximately 24% higher (than MBIE’s model) allowing for the Nelson gridlocation factor, inflation since 2010 and hedge risk margin.
Hedged wholesale prices at Nelson can therefore be forecast using the MBIE reference, highest path (low GDP) andlowest path (low currency) scenarios as shown below.
Figure F - Historical and Projected Wholesale Electricity Prices at Nelson
In the shorter term, the electricity price will be influenced year to year by hydrology and the economic growth cycle.Currently economic conditions (low demand growth and over build of generation) suggest prices are likely to be weakerthan forecast for the next few years. Beyond that, renewed energy scarcity could resume.

Nelson City Renewable Energy Assessment
| 18
P 2P
3.4.1.2 Transmission Charges
Transmission charges relate to the National Grid owned by Transpower, and are currently averaging around 2 c/kWh.They are expected to rise in real terms to around 3 c/kWh once recent major Grid upgrades are completed. Once theseupgrades are priced into the market, the real cost of transmission should then remain relatively stable becauseTranspower is a regulated monopoly.
3.4.1.3 Network Charges
Network charges relate to the distribution lines owned by the local network company (i.e. Nelson Electricity andNetwork Tasman), and are typically in the order of 8 c/kWh for residential users. These costs are also regulated by theCommerce Commission and, in real terms, should also remain relatively stable.
3.4.1.4 Retail / Metering
Retail and metering costs relate to the electricity retailers margin and costs of meter reading, and are in the order of3 c/kWh for residential users.

Nelson City Renewable Energy Assessment
| 19
P 2P
4 Renewable Energy Potential in Nelson4.1 Generic Barriers to Renewable Energy
Barriers that are specific to different types of renewable energy are discussed in the relevant sections below. Howeverthere are a number of generic barriers that impact renewable energy supply to a greater or lesser extent. Theseinclude:
Capital cost – renewable projects have a higher upfront capital cost per MW than conventional thermalgeneration. This increases the risk profile of renewable projects compared to thermal despite the fact thattheir operating costs are normally a lot lower.
Certainty around resource potential – to have confidence in the expected annual output from the project, longterm quality site-specific data needs to be collected on the resource (e.g. wind speed, solar irradiation, riverflows, biomass quantity and specific energy).
Variability of output –renewable resources such as wind, solar and run-of-river hydro are variable over varioustime scales, resulting in variable generation outputs from year to year, month to month and in real-timedispatch. This variability can create challenges for integrating renewable resources into local networks andalso creates additional uncertainty around project revenues.
Location relative to load and transmission network – good quality renewable resources are often locateddistant from where the electricity is used, requiring the construction of transmission lines to connect therenewable generation to the nearest network connection point of sufficient capacity. Depending on the size ofthe generation facility, the transmission lines may be 11kV or 33kV (connecting into the local lines companylines) or need to be as large as 110kV or 220kV to connect to Transpower’s grid. The challenges for thegeneration developer therefore include finding a suitable line route, negotiating easements with additionalland owners and consenting of the transmission line.
Revenue certainty – there is limited ability for developers to secure competitive long term power purchaseagreements from retailers for intermittent renewable generation and reduce their exposure to wholesale pricevolatility.
Variability of retail feed in tariffs for embedded generation – there is a wide range of rates that retailers arewilling to pay for any electricity that is fed back into the grid by customers with on-site generation. Thesefeed-in rates are generally a lot lower than the offtake rates that customers pay for electricity drawn from thegrid (which includes variabilised charges for transmission and distribution). This means that distributedgeneration is most economic if it sized so that it results in a reduction in load at the offtake rate (particularly atresidential tariffs which are higher than commercial tariffs).

Nelson City Renewable Energy Assessment
| 20
P 2P
4.2 Wind
4.2.1 Technology Review4.2.1.1 Utility Scale Wind Turbines
Wind turbines are a mature renewable energy technology. Utility scale wind turbines have undergone considerabledevelopment and market growth since the early 1980s. At around this time, the industry had converged on the 3-bladed horizontal-axis upwind design that is most commonly used in wind farms today1. Over the course of 30 yearsutility scale land-based wind turbines have grown from 25 kW turbines with 10m diameter rotors to 3MW turbines with112m diameter rotors, and the worldwide wind energy market has grown from less than 10MW in 1980 to 282,000 MWin 2012. (Global Wind Energy Council, 2013)
New Zealand’s utility scale wind development history has followed a similar growth pattern, starting with the 225kWBrooklyn turbine installed in Wellington in 1993 as a research project by ECNZ. This was followed by the Hau Nui windfarm developed by Scan Power in the Wairarapa in 1996, comprising of seven 550kW turbines. By 2013, New Zealandhas 13 wind farms (and 3 standalone wind turbines) totalling 623MW contributing 4% of the country’s annual electricitydemand. (New Zealand Wind Energy Association, 2013)
Figure G - Three of the 2.3MW Wind Turbines at West Wind, Wellington
While the size of wind turbines has grown with materials and manufacturing advances, the power conversiontechnologies have improved over recent years as well. Many wind turbine manufacturers are moving from gear boxesto direct drive machines to reduce complexity and improve reliability. Likewise the power off take of wind turbineshave evolved from fixed speed controlled turbines with squirrel cage induction generators to variable speed turbineswith full-scale power converter. This improves the integration of wind farms into the National Grid and wind farmsbased on this technology can provide voltage support to the system even when the wind is not blowing.
1 Other wind turbine designs are still being developed and utilised such as New Zealand’s two-bladed Wind Flow 500kW turbine, as well as variousvertical axis designs. However their share of the global wind turbine market is very small.

Nelson City Renewable Energy Assessment
| 21
P 2P
4.2.1.2 Wind Farm Characteristics
Wind farms are based on a number of wind turbines connected to a common grid connection point. Some keycharacteristics of wind farms include:
Location Wind turbines are best located on the top of smooth hills or ridgelines to maximise the speed upeffect on wind. Cliff tops are not suitable sites as these create turbulence which increases the wearand tear on wind turbines.
Spacing Wind turbines need to be spaced out to reduce wake effects from upwind turbines from thosedownstream. Spacing between turbines is typically 6 to 10 times the rotor diameter e.g. 500 to800m for large wind turbines
Site Roads Earlier wind farms required the construction of 10m wide roads on site due to the track width of thelarge cranes required for erecting turbines. With the development of narrow track cranes, on siteroad widths now vary between 4.5m and 6m.
Transformers Some wind turbines have medium voltage transformers in the tower or the nacelle of the windturbine. Others require that the transformer and its associated switchgear are sited outside the windturbine, typically in a unitised substation
Substation The power from each wind turbine is collected via medium voltage cables laid along the site roadsback to an on-site substation. At this point there is typically one or two high voltage transformersand associated switchgear to connect the wind farm to the electricity network.
Transmission New overhead high voltage transmission lines may need to be built to connect the substation to thenearest network connection point. The voltage depends on the size of the wind farm – wind farmsup to 60 MW may connect at 33kV or 66kV, whereas wind farms of 100MW or more require 110kVor 220kV lines. These lines are typically built and owned by the local lines company or Transpoweraccording to national standards and under a long term lease with the wind farm.
Noise Modern wind turbines are quiet when they operate – however they must comply with strict resourceconsent conditions to ensure that while wind turbines may be audible at times, the level of soundheard at a nearby house must not be out of place with other sounds in the environment. NZStandard NZS6808:2010 sets out the recommended noise limits from wind farms and is expected tobe the basis of newly consented wind farms in NZ (New Zealand Wind Energy Association, 2010).Because there are a number of site specific and technology factors that govern the level of windfarm sound, there is no specified minimum set back distance from neighbouring houses. Dependingon the site this set back may be around 700m to 1km.
4.2.1.3 Distributed Generation Scale Wind Turbines
Small scale wind turbines typically range from 1kW to 20kW and like utility-scale wind turbines, the most commondesign is the 3 bladed horizontal axis wind turbine. However, there are a number of on-going innovations in the designof small scale wind turbines, including the one-bladed 2kW Thinair wind turbine being developed by Powerhouse Windin Dunedin.
Small scale wind turbines need to be elevated and tower heights can be between 10m and 20m. Rotor dimensions varyin size from about 3.5m diameter for a 2kW wind turbine to 12m diameter for a 20kW wind turbine.

Nelson City Renewable Energy Assessment
| 22
P 2P
Figure H – 1.8kW Skystream Wind Turbine Being Installed
Because they are lower to the ground than utility scale turbines, small scale wind turbines experience lower averagewind speeds, and therefore have a lower capacity factor (typically 20 – 30%). The turbines also spin much faster thanlarge scale turbines which results in higher pitched aerodynamic noise.
4.2.2 Economics of Wind
The primary drivers of the economics of wind farms in a New Zealand context are discussed below.
4.2.2.1 Wind Speed
The energy generated from wind turbines is proportional to the cubic power of wind speed and the swept area of theblades, as per the following equation. = 12 3
Where ρ is the air density in kg/m3, A is the swept area (πr2) of the blades in m2, ν is the wind speed (m/s) at hub height and Cp is the powercoefficient (typically between 0.35 and 0.45 at rated output). (RWE npower renewables, 2012)
The power coefficient is not a constant and varies with respect to the tip speed ratio (the blade tip speed divided by thewind speed). Wind turbines therefore have a power curve similar to the one shown below with a cut in speed ofaround 3 to 3.5 m/s, with power output increasing according to the equation above until the rated output speed of theturbine is reached after which the power output from the turbine remains constant until wind speed reaches the cut-out speed (typically around 25 m/s).
Figure I - Typical Power Curve for a Wind Turbine

Nelson City Renewable Energy Assessment
| 23
P 2P
Therefore the mean wind speed at hub height2 over the course of a year is critical to the power generated from a windturbine. The lower the mean wind speed, the more time the wind turbine is operating at a fraction of its rated power,greatly decreasing the electricity and revenue generated from the turbine.
As mean wind speeds vary significantly around the world, wind turbine manufacturers develop different classes of windturbines with power curves optimised to different wind regimes. The average wind speeds that each of these IECclasses are designed for are as follows:
Class I (High wind) – 10 m/s
Class II (Medium wind) – 8.5 m/s
Class III (Low wind) – 7.5 m/s
Wind turbines optimised for lower wind speeds typically have longer blade lengths and higher hub heights. Forexample, the wind turbines installed at West Wind (Class Ia wind farm) are rated at 2.3MW and have a rotor diameterof 82m and hub height of 68m, whereas the wind turbines at Te Uku wind farm (Class II wind farm) are also rated at2.3MW but have a rotor diameter of 101m and hub height of 80m.
New Zealand is characterised by high quality wind resources compared to most other countries around the world. Mostof the wind farms that have been constructed to date in New Zealand have been in Class I wind speed sites (i.e.Manawatu, Wairarapa and Wellington regions) reflecting the importance of wind speed on wind farm economics. Thecapacity factors of wind farms developed in these wind resources have capacity factors of between 42% and 48%.
The Te Uku wind farm near Raglan is the first to be built out of a large number of Class II wind farms that have beenconsented or are in the development process. New Zealand Class II sites are expected to have capacity factors ofbetween 35% and 43% depending on the average wind speed and the turbine selected for the site.
4.2.2.2 Capital Cost
The overall capital cost of a wind farm is the other key determinant of the economics of a wind farm. This is affected bya number of factors, including:
Wind turbine costs – about 70% of the capital cost of a wind farm and impacted by macroeconomic factors(e.g. international turbine demand vs. supply, steel prices, exchange rate) and site specific factors (wind speedclass, turbulence, distance from suitable port);
Civil and foundation costs – New Zealand wind farms are generally on elevated sites and civil costs aredetermined by ground conditions, steepness of slopes (for onsite roads) and road access to the site (ability totransport oversized components to site without having to widen roads or bridges);
Transmission – good wind farm sites can be distant from a transmission system of sufficient capacity toaccommodate the connection of a wind farm, requiring the construction of many kilometres of high voltagepower lines across private land. The cost of these lines and the electrical equipment (transformers, switchgearetc) required to connect the wind farm to the grid are also affected by macroeconomic factors.
Depending on the site, New Zealand wind farm capital costs range from between $2 m/MW and $3.2 m/MW. (Deloitte,2011). Small scale wind turbine prices range from $10,000 to $15,000 per kW of rated capacity including installation(i.e. five times that of large scale wind farms per kW). (EECA, 2009)
Wind turbine costs will continue to reduce over time as global demand for wind turbines is growing at a rate of around40 GW per annum, and Chinese wind turbine manufacturers emerge to compete with the dominant European
2 Hub height varies depending on the size of the turbine. Modern multi-MW wind turbines have hub heights of 70m to 80m off the ground, sub-MWturbines have hub heights of 30m to 50m. Due to friction effects of the terrain on wind flows, the average wind speed generally increases withrespect to height above the ground.

Nelson City Renewable Energy Assessment
| 24
P 2P
manufacturers such as Vestas and Siemens (CleanTechnica, 2012). Wind power costs are expected to fall by a further12% over the next five years. (New Zealand Wind Energy Association, 2012)
4.2.2.3 Operating Cost
Wind farms have no fuel cost but have the following on-going operating costs:
Land rental – most wind farms are developed on privately owned land (e.g. farms, ex-forestry land) witheasements and associated annual rental fees. The nature of these fees can vary from site to site (e.g.minimum rents, rents linked to annual output and/or electricity market prices) and due to the level ofcompetition by wind developers for good wind sites these rents have generally increased over the years.
Service, maintenance and repair costs – these are affected by the wind conditions of the site (e.g. turbulence),the technology incorporated in the turbines (e.g. gearboxes vs. direct drive), the cost of long term O&Mcontracts from the wind turbine suppliers, the size of the wind farm and the number of the wind turbines perMW3. Repair costs are generally low early in the life of the wind farm (especially if covered under warranty)and increase over the wind farm’s lifetime.
Transmission charges – sometimes the transmission connection is paid for by the local network company orTranspower and recovered under an annual charge to the wind farm owner. Large wind farms in the SouthIsland also incur HVDC charges which impose an additional cost of up to $10/MWh compared to wind farms inthe North Island. (Meridian Energy, 2006).
Insurance and management overheads.
Depending on the above factors, operating costs for NZ wind farms vary from $10/MWh to $22/MWh. (Deloitte, 2011)
4.2.2.4 Levelised Cost of Energy
Based on the drivers above, the LCOE of large scale wind farms in New Zealand range from $80 - 95/MWh for Class Isites and $90 - $105/MWh for Class II sites. (Deloitte, 2011) (Meridian Energy, 2006)
These LCOE ranges mean that Class I and Class II wind farms are expected to be increasingly economic against otherforms of renewable and thermal generation in New Zealand over the next decade, especially if wind turbine pricescontinue to improve.
The LCOE ranges for small scale wind vary from $250/MWh (or 25c/kWh) for 20kW wind turbines in good windconditions to over $500/MWh for 2kW wind turbines in lower wind conditions4. (Meridian Energy, 2006).
4.2.3 Wind Resource in Nelson
Nelson City is relatively sheltered from the prevailing westerly winds compared to other coastal areas of New Zealand.High level wind mapping undertaken by NIWA (see Appendix A) shows that average wind speeds in Nelson City arebetween 4 – 6 m/s, which would be categorised as IEC Class III or below. The energy density from wind is around2 W/m2 compared to areas such as Wellington where it is in excess of 9 W/m2. (NIWA et al., 2009)
Class III wind turbines are now being developed by wind turbine manufacturers to optimise performance at low windspeeds – such as the Vestas V126-3MW (126m diameter rotor) which can produce 10-20% more energy in Class IIIwinds compared to the Vestas V112-3MW (Class II machine) in the same wind conditions (Vestas, 2012). However, theywill always be more costly (due to size) and less productive than Class I and II wind farms, which means their LCOE willalways be higher and will be uneconomic until such time as New Zealand runs out of Class I and II wind speed sites todevelop.
3 Wind farms utilising larger turbines have less gearboxes etc to maintain than those utilising small turbines for the same capacity wind farm4 At 6% discount rate, 25 year turbine life and 25-30% capacity factor range.

Nelson City Renewable Energy Assessment
| 25
P 2P
The large number of Class I and Class II wind sites currently under investigation along the west and east coasts of theNorth Island and east coast of the South Island, are sufficient to contribute up to 20% of New Zealand’s electricitydemand by 2030 (New Zealand Wind Energy Association, 2012).
It is therefore highly unlikely that wind farm developers will develop utility scale wind farms in the limited elevatedspace available in Nelson City in the next 25 years.
Small scale wind turbines can be installed “behind the load” so they have the effect of reducing the electricity offtake(at the full retail tariff), rather than injecting into the grid. However, the LCOE range for small scale wind indicatedabove are much higher than commercial and residential electricity tariffs, so installing small scale wind does not stackup economically except potentially in off grid applications with battery backup systems where the owner is avoidingsignificant upfront network connection costs.
4.2.4 Potential Electricity Generation from Wind
The Nelson City land area is 422 km2. Without taking into account economics, existing land usage and potentialenvironmental limitations, there is about 2% of elevated land area that is potentially technically viable for windgeneration (excluding Department of Conservation protected areas). Based on NIWA’s energy density for Nelson ofapproximately 2 W/m2 would indicate an average annual wind energy potential of about 150 GWh (0.5 PJ pa). Basedon a Vestas V126-3MW machine, this would indicate the potential for up to 19 wind turbines, spread across 14km ofridgelines (at 750m spacing).
However, given the economic and technical issues discussed above, it is not anticipated that a commercial wind farm orwind farms will be established in Nelson City in the next 25 years. If any wind generation is established in that period itis most likely to be limited to a few small scale wind turbines for off grid purposes.
4.2.5 Viability/Barriers to Development
The primary barriers to development of large scale wind in Nelson City are as follows:
Low average wind speeds compared to the rest of the country, putting wind energy in Nelson well down theeconomic merit order for renewable generation;
Limited suitable elevated land not currently being used for forestry.
The above is based on high level wind modelling undertaken by NIWA. There may be ridge lines that are exposed tohigher wind speeds than estimated. To determine this would require the establishment of wind monitoring masts –firstly at 10m over a period of a year or more, then at hub height (e.g. 70-80 m) should any promising sites be found. Ifthe NCC wished to attract wind developers to the region it might consider incentives to encourage them to establish10m masts to begin the data collection process, or establish its own masts.

Nelson City Renewable Energy Assessment
| 26
P 2P
4.3 Solar
4.3.1 Technology Review4.3.1.1 Solar Water Heating Systems
Solar hot water (SHW) systems involve harnessing the energy from the sun to heat up water which is then stored in aninsulated hot water tank, significantly reducing the requirement for electricity or gas to heat up the water. Thecomponents of a SHW system typically include:
Solar hot water collectors – either flat panels or evacuated tubes located on the roof;
Hot water tank – either located on the roof or on the ground (split system);
Pump and heating loop – required in split systems to circulate water from the cylinder to the collector on theroof, to be heated up and returned to the cylinder5. Thermo-siphon systems are more efficient in this regardas they utilise natural convection flow, but these require that the storage cylinder be located above thecollector panel outside on the roof or inside the roof structure; (NIWA et al., 2009)
Controller / Timer – designed to ensure hot water remains above a minimum temperature level by triggeringan electric or gas boost either when temperatures fall below a set level, or at a specific time of day.
Figure J - Example of Flat Panel and Evacuated Tube SHW Systems
A well designed and appropriately sized SHW system in a good solar environment like Nelson should generate 100% ofa household’s hot water requirements in summer, but can drop down to as low as 50% during winter. Overall this canreduce household water heating bills by up to 75% (Righthouse, 2013). About 29% of a household’s electricity usage isfor hot water heating (i.e. 2,900 kWh per annum) so a SHW system can reduce electricity usage by about 2,200 kWh perannum in an average house (BRANZ, 2010).
Given the different SHW system approaches available, the cost of installation for a SHW system can vary widely.Complete systems, including the storage cylinder and installation, start at around $5,000 and depending on quality andsize can be as much as $10,000. Retrofitting a solar collector to an existing hot water cylinder can cost as little as$3,000 but depends on the location and type of cylinder. It also requires a building consent (up to $500 depending onthe council) to be obtained, due to the additional loading on the roof structure and as these systems potentiallyinteract with drinking water supplies (Righthouse, 2013). Nelson City Council has offered free building consents forsolar hot water heaters since 2008.
As part of the Government’s Warm Up NZ: Heat Smart programme, EECA subsidies of up to $1,000 were previouslyavailable to support the installation of SHW systems on eligible homes. However in the 2012 Budget, these subsidieswere discontinued in favour of an information-based programme. (EECA, 2012)
5 Closed loop systems circulate a heat conducting fluid (typically glycol) in a closed loop from the collector to the cylinder, with the heated fluidheating the water in the cylinder through a heat exchange system. This is more expensive than an open loop system, but has benefits of frostprotection in colder climates.

Nelson City Renewable Energy Assessment
| 27
P 2P
Larger SHW systems are also available for commercial purposes (e.g. public pool heating). In Nelson, the CityFitnessgym has installed 32 SHW collector panels utilising a glycol closed-loop with four 1000 litre cylinders and a gas boosterto provide hot water for the gym showers and taps (Nelson City Fitness, 2013). Likewise in 2010, the Nelson YHAinstalled a 117m2 solar water heating system with gas back up on the northern roof of the hostel.
4.3.1.2 Passive Solar Design
Passive solar construction is a building design philosophy that seeks to maximise the utilisation of free energy and lightfrom the sun to provide warmth and light in buildings during the day. Done well it can result in significant energysavings, reduce dampness and condensation and provide a comfortable living or working environment, withconsequential benefits for health and well-being.
There are a number of elements which need to be considered holistically, including the site’s microclimate, orientation,landscaping, external shading and the design of the building’s windows, room layout, thermal storage and insulation(EECA EnergyWise Renewables, 2007). Some the key design principles include:
Site planning and orientation – ideally the site will have a northerly aspect and the house elongated along thewest-east axis, with winter sun unobstructed and summer sun restricted by exterior shading. Main living areasshould be on the north side of the house, with rooms used in the morning orientated the east and thoseoccupied in the evening to the west. Lesser used rooms such as storage, laundry, bathrooms and garagesshould be on the south.
Collecting solar heat – the key mechanism for allowing solar heat into a building is through its windows.Generally glazing on the north should be larger, with a minimum of glazing on the south side of the building.Windows on the east side of the building can generally be larger than those on the west, to help with warmingthe house in the morning and minimising overheating in the afternoon. However, it is a careful balancing actbetween the amount of solar heat allowed into the building through glazing and the amount of thermal massavailable to absorb that heat.
Storing solar heat – materials such as concrete, terracotta or ceramic tiles can absorb heat during the daywhen exposed to direct sunlight, and then release that stored heat at night when the internal temperaturedrops. This means that flooring utilising these materials are best located in the northern side of the buildingand textile floor coverings should be restricted to parts of the building that are not used for thermal storage.
Conserving solar heat – insulation reduces the loss of interior heat in the winter and heat gain in the summer.Insulation rated appropriately for the region (Nelson is Zone 3) should be correctly installed under floors, inthe ceiling and wall cavities. The use of double glazing (mandatory in Zone 3 since October 2007) reduces heatloss in winter from windows by nearly 50% and heat gain in summer by 10% - as well as having other benefitssuch as eliminating condensation and noise intrusion6. Heavy curtains (preferably thermal lined) are anothereffective mechanism for insulating windows.
Avoiding overheating –the windows that provide so much useful heat in the winter can generate excessiveheat in summer. Designing the building with appropriately sized eaves reduces direct sun in the summer andallows more in during winter, as the sun is lower in the northern sky during winter. Also external plantingssuch as deciduous trees can have a similar shading effect, although bare trees can shade 20-40% of the sun inwinter7. Good ventilation can be achieved with doors, windows or roof vents open in the direction of theprevailing summer breeze and another opening on the opposite side of the house to bring cooling breezesthrough the house.
6 . The heat loss savings of double glazing over single glazing in standard aluminium frames is 40% (for window areas only, not the whole house heatloss).7 It should be noted that planting can cause potential over-shading and conflict with solar gain. The south west corner of the house is the best placeto plant in Nelson.

Nelson City Renewable Energy Assessment
| 28
P 2P
The effectiveness and cost of passive solar heating is highly variable given the range of factors that need to bebalanced. Anecdotally there can be a number of challenges in adhering to passive solar design principles as these cancome into conflict with aesthetic or other considerations. For example, the desire to have living rooms and entertainingon the south side of the house with large windows due to southern coastal views. Inevitably compromises betweenenergy efficiency and these factors are made and the potential energy savings benefits are reduced.
The passive solar fraction (PSF) is a measure of the percentage of the building’s heat load met by passive solar heatingi.e. the potential reduction in heating from electricity, gas or biomass sources. Reported PSF figures range from 5-25%for modest systems, 40% for highly optimised systems and up to 75% for very intense systems.
About 34% of average household energy consumption in New Zealand is for space heating - about 3,400 kWh perannum (BRANZ, 2010). A well designed new house in Nelson utilising passive solar design principles above, withoutincorporating excessively costly design features (e.g. triple glazing) is likely to have a PSF of around 30%, reducingheating energy by around 1,000 kWh pa (or 10% of average household energy requirements). This is consistent with astudy undertaken by Sustainable Energy Authority of Ireland that estimated typical energy savings from passive solarhouses of between 8 and 10% (SEAI, 1997).
4.3.1.3 Solar Photovoltaic Modules
Solar photovoltaic (PV) modules convert solar radiation into direct current (DC) electricity using semiconductors thatexhibit the photovoltaic effect8. The DC electricity produced in an individual module is then combined with the outputof other modules connected in parallel to an inverter which converts the electricity into alternating current (AC) beforebeing stepped up in voltage and connected to the grid.
The main solar PV technologies include:
Crystalline silicon – the most common and mature form of PV, available in either monocrystalline orpolycrystalline form. Monocrystalline is a dark black colour, is more expensive due to the manufacturingprocess but has high efficiencies9 – ranging from 16.9% to 20.4%. Polycrystalline is typically light to dark bluewith a non-uniform appearance, is lower in cost and has lower module efficiencies – ranging from 15% to 16%.
Thin film – these technologies reduce the amount of semi-conductor material required in creating the solarcell and are typically sandwiched between two panes of glass to create a solar module. There are a number ofthin-film technologies available: cadmium telluride (CdTe), amorphous silicon (a-Si), copper indium (gallium)diselenide (CIGS / CIS). The manufacturing process for thin film is lower than crystalline silicon reducing thecost per Watt, however module efficiencies are much lower; from 7-9.5% for a-Si, up to 13% for CIS and up to14.4% for CdTe.
Other third generation - there are many emerging new materials under development to create thephotovoltaic effect, such as light absorbing dyes, flexible polymers and organic/synthetic polymers.
8 The photovoltaic effect is the creation of voltage or a corresponding electric current in a material, upon its exposure to light9 The module efficiency is a measure of how much of the solar energy is converted into electricity. The higher the efficiency, the lower the surfacearea required to be covered with solar modules to generate the same output.

Nelson City Renewable Energy Assessment
| 29
P 2P
Figure K - Types of Solar PV Modules (Monocrystalline Si, Polycrystalline Si and CIS)
Each of the PV technologies have different performance characteristics and cost versus efficiency trade-offs. Forexample CIS solar modules are more efficient than silicon in overcast conditions, and CdTe are more efficient in highertemperatures.
Solar photovoltaic technology is a mature and proven technology and in the past ten years has undergone considerableimprovement in costs and efficiency. Global markets for PV have grown from 1 GW installed in 2004 to nearly 31 GWinstalled in 2012, with a total of 100 GW of solar PV installed worldwide reached in February 2013 (Renewable EnergyWorld, 2013).
Solar PV is extremely scalable – i.e. solar PV systems can be sized to suit residential usage (typically 2-5kW), commercial(10 – 100kW), industrial (100 kW to 1MW) to utility scale (500kW to 500 MW). Residential to industrial scale PV istypically installed on rooftops and sized to generate a portion of the building load. Utility scale PV systems are mostoften designed as solar farms (i.e. built in array structures on land) and connect into the grid like other renewablepower stations. The different types of system are discussed below.
4.3.1.4 Rooftop Solar
Rooftop solar PV systems are commonplace around the world and generally consist of solar modules installed on roofseither directly on rails or on pitched frames (particularly on flat roofs). Each of the modules is connected together withDC cables which are collected back to a central point where one or more inverters are located.

Nelson City Renewable Energy Assessment
| 30
P 2P
Figure L - Rooftop PV System Examples - Commercial, Residential and University of Queensland 1.2MW10
Solar PV panels perform best when receiving direct sunlight. The angle of sun moves from east to west during eachday, and is higher in the sky during summer and lower in winter. This means that solar PV panels that are fixed inposition will achieve up to 71% of the annual output that could be achieved by solar panels that are mounted on a 2-axis tracker (Landau, 2012).
To achieve the optimal daily generation with fixed rooftop solar panels, accounting for the east to west movement,solar panels should be facing true north (in the Southern Hemisphere). The optimal tilt to account for seasonalmovement depends on whether the system is being designed for maximum annual generation or for more generationin the winter or summer. The shallower the tilt, generation will be greater in the summer to the detriment of wintergeneration - the steeper the tilt, the reverse will be true. The overall annual generation will be less in either case, but ifthe site has variable time of day / time of year electricity tariffs, it may be more economical to sacrifice overall annualgeneration to maximise generation during high price periods.
To maximise annual generation for a fixed system, there are a number of rules of thumb – some solar calculators advisetilting at the angle of latitude i.e. 41o in Nelson. A formula from Macs Lab improves on this which advises that if latitudeis between 25o and 50o to tilt the solar panels at 0.76 times the latitude plus 3.1o (Landau, 2012). For Nelson this wouldsuggest 34o is the optimum angle. In the absence of solar modelling tools, this is a reasonable approach – however, it isadvisable to use solar modelling software such as PVSyst or the freely available SMA Sunny Design – the latter showsthat optimal generation in Nelson occurs at a tilt between 28o and 30o.
While this is useful information, for many residences and buildings with sloping roofs, the orientation and tilt is morelikely to be determined by the pitch and orientation of the roof. If the orientation of the roof is not true north thenoverall generation will be reduced, and generation will be greater in the morning for roofs that are more easterly facingand greater in the afternoon for roofs that are more westerly facing. The other important consideration is whetherthere are neighbouring buildings, trees or hills that will cast shadows on the solar panels during the day.
10 Courtesy of http://solardawn.com.au/e-newsletter/investing-in-research-and-development-for-global-benefit/

Nelson City Renewable Energy Assessment
| 31
P 2P
Costs of rooftop PV systems vary based on:
Size of system – economies of scale can come into play in pricing of modules and inverters. Systems greaterthan 10kW generally incur modest charges from network companies to undertake studies to confirm that thesystem is compatible with the network without required additional reinforcing;
Type and source of PV modules – i.e. crystalline silicon vs. thin film, European vs. Chinese manufacturers. Inthe past 3 years, with massive growth of world solar markets and solar module manufacturing in China, solarmodule prices have dropped from over $US2/W to under $US1/W;
Inverters – like PV modules these have continued to improve in cost and efficiency, and prices depend oncountry of origin and functionality (e.g. inclusion of Wi-Fi and web-based monitoring);
Rooftop mounting configuration – tilted mounting systems are more expensive than mounting rails forstandard tin roofs. The distributed weight of the solar modules (typically 18-20kg per module) also needs tobe considered with respect to the capability of the current roof to support the additional load.
Depending on supplier, grid-connected residential 3kW solar PV systems (complete with installation) are now availablein New Zealand from between $10,700 and $13,500 including GST ($3.10 to $3.90/W excluding GST), with solar PVmodules comprising 35-50% of the overall cost.
A 95kW rooftop PV system proposed for the Palmerston North City Council is expected to cost $240,000 ($2.50/W excl.GST) (Manawatu Standard, 2013).
With continued cost reductions in the cost of solar modules internationally this will continue to flow through to NewZealand pricing, and residential system prices of around NZ $2/W may be possible within the next five years (TheGuardian, 2013). This is a marked improvement over the costs of PV of between $13 – 20/W reported in the 2006Tasman Renewable Energy Assessment report (Sinclair Knight Merz, 2006).
4.3.1.5 Solar Farms
Solar PV farms differ from rooftop solar in that they are typically situated on unutilised low grade land and are usually(but not always) designed to export power directly into the grid like a conventional power station, rather than supply alocal load.
Some of the key differences between solar farms and rooftop solar systems include:
Scale – solar farms can range from 500 kW to 1MW to 10MW to 100MW+ depending on land available and thecapacity of the transmission system that they are connecting into;
Mounting – the solar modules are typically fixed in long arrays of solar frames which are either mounted onpiles driven/screwed into the ground or on concrete foundations. The mounting systems may also involveautomated single-axis (i.e. daily sun tracking) or dual-axis (i.e. daily / seasonal sun tracking) tracking systems;
Inverters – like large commercial/industrial rooftop PV systems, smaller solar farms typically combine theoutput of module “strings” to distributed small scale inverters (up to 20kW capacity) whereas larger solarfarms combine the output of many strings to large central inverters (500kW to 1.5MW each);
Grid connection – the larger size necessitates high voltage connections to the grid with associatedtransformers, switchgear, protection, SCADA and control systems. They are also treated as power stationswithin the rules and regulations of the relevant electricity market i.e. rules around grid compliance, operationand market offers.

Nelson City Renewable Energy Assessment
| 32
P 2P
Figure M - Examples of Solar Farm Mounting Systems – Fixed (Concrete Slab)11, Single Axis Tracker12 and Dual Axis Tracker13
Depending on the type of modules used, row spacing and mounting system, solar farms typically require between 2 Haand 3 Ha of land per MW – with dual-axis tracking systems requiring the greatest amount of land. Ideally land is flat aspossible to reduce civil costs, but solar farms can be built on moderate slopes up to about 10% gradient (less for singleaxis tracking systems).
Due to their ground coverage ratios solar farms are not normally built on productive agricultural land. In countries suchas the US and Australia where large solar farms are being installed, the land being used is typically desert or low valuedegraded / marginal agricultural land. Weed and grass control is still usually required between rows of solar panels,and some solar farm operators contract with local sheep farmers to graze their sites – a mutually beneficialarrangement.
Figure N - Sheep Grazing at CalRENEW-1 Solar Farm (Meridian Energy USA, 2013)
Maintenance requirements for solar farms are very low relative to other power stations and typically consist of panelwashing, ground maintenance and annual inspections / maintenance of electrical equipment. Solar farms with trackershave higher maintenance costs associated with the electro-mechanical tracking systems.
The costs of solar farms depend on the scale and location, transmission connection and mounting system and can rangefrom between $US2m and 4m per MW ($NZ 2.5 – 5m per MW). Over the next ten years with on-going cost andefficiency improvements in PV modules, installation techniques and balance of plant it is estimated that the cost forutility scale solar farms could reduce to $US1.44m ($NZ 1.8m) (Bloomberg New Energy Finance, 2012).
Depending on the location the annual average capacity factor of fixed mount solar farms can range from between 15%and 23% (highly dependent on solar insolation levels and ambient temperatures). Single axis tracking systems canincrease capacity factor by around 3% and dual axis by a further 2%. The additional revenue gained from trackingneeds to be weighed up against the additional capital and maintenance costs, and land constraints (since trackingsystems require more land per MW than fixed systems).
11 1.25MW Maama Mai Solar Farm, Tonga built by Meridian, Courtesy of http://www.meridianenergy.co.nz/what-we-do/our-power-stations/solar/maama-mai/12 Courtesy of Screwpile Technologies, Australia, http://www.screwpile.com.au/app_images/249Solar%20Farm%201.jpg13 Kings Mountain solar farm, North Carolina, Courtesy of http://biofuelschat.com/topics/solar-farm-opens-kings-mountain

Nelson City Renewable Energy Assessment
| 33
P 2P
4.3.1.6 Concentrated Solar Power
Concentrated Solar Power (CSP) refers to technologies that focus solar irradiation onto a focal point using mirrors.Within CSP, there are two technology categories, Concentrated Solar Thermal (CST) and Concentrated Photovoltaic(CPV).
CST involves concentrating solar energy to heat a fluid (typically oil), which in turn is used to create steam anddrive a traditional steam turbine. There are three main concentrated solar thermal technologies: ParabolicTrough, Heliostat (or Power Tower) and Linear Fresnel Reflectors
CPV utilises mirrors to concentrate light on to a small high efficiency PV module or cell.
The vast majority of CSP projects installed globally are using a CST technology. However, while solar thermal has anumber of potential advantages relative to solar PV farms such as the ability to store energy, the risks and costs aremuch higher and in a number of cases in the US developers have cancelled plans for a large solar thermal facility infavour of a large PV farm.
Unlike conventional PV, CSP requires uninterrupted direct sunlight to operate and is best suited to high insolationdesert environments. With New Zealand’s lower insolation levels and cloud cover, CSP is not considered a viable futuretechnology for the country, and given Nelson City’s limited flat land area is highly unlikely to feature in the next 25-30years.
Figure O - CSP Technologies – Power Tower with Heliostat Mirrors14, Linear Fresnel Reflector15, Concentrated PV16
4.3.2 Solar Resource in Nelson
Nelson is well known for its solar resource and typically has the highest annual number of clear sky days in the country.This does not however necessarily equate to the highest insolation (kWh per square metre per day) as its lower latituderesults in less annual daylight hours and a lower angle of solar incidence than Northland.
As shown in Appendix A, the solar power density or global irradiance (tilted to degrees of latitude) in Nelson City is>170 W/m2 (4.08 kWh/m2/day) (NIWA et al., 2009). Other long term estimates of Nelson’s global radiation levels onthe horizontal plane range from between 4.0 kWh/m2/day (RETScreen International, 2013) and 4.06 kWh/m2/day(Meteonorm, 2013). As can be seen in the Meteonorm graph below, Nelson receives around 5 times the solar energyin peak summer months than it does in mid-winter.
14 Courtesy of http://inhabitat.com/the-las-vegas-strip-could-soon-be-powered-by-a-solar-tower/15 Courtesy of http://shaikmohasin.wordpress.com/2012/02/16 Courtesy of http://newenergyportal.wordpress.com/category/solar-energy/

Nelson City Renewable Energy Assessment
| 34
P 2P
Figure P - Nelson Monthly Solar Diffuse and Global Radiation17 (Meteonorm, 2013)
A comparison of daily average global radiation figures for Nelson relative to other locations is shown in the table below:
Location Daily Global Radiation(kWh/m2/day)
Nelson, NZ 4.06
Auckland, NZ 4.25Napier, NZ 4.20Christchurch, NZ 3.72
Invercargill, NZ 3.39Melbourne, VIC, Australia 4.19
Sydney, NSW, Australia 4.59Brisbane, QLD, Australia 5.25Darwin, NT, Australia 5.54
Tongatapu, Tonga 4.64
While the solar resource in Nelson and wider New Zealand looks relative modest compared to Australia, it should benoted that Germany, which has over 22GW of solar PV installed, has global solar radiation levels of between 2.86 and3.08 kWh/m2/day. Also because higher ambient temperatures reduce the efficiency of photovoltaic conversion of solarenergy into electricity, the difference between in global radiation between Auckland and Nelson does not translatedirectly to difference in electrical output as the latter has average ambient temperatures of around 2oC lower thanAuckland.
A fixed PV system installed in Nelson (at an optimal tilt and orientation) will have an average annual capacity factor ofbetween 14 and 15%. For example, the 10.4kW system on the NIWA building in Nelson generates an estimated13.2 MWh per annum which is a capacity factor of 14.5% (PowerSmart Solar, 2012).
4.3.3 Economics of Solar4.3.3.1 Solar Hot Water
The economics of solar hot water for residential consumers is driven by four main factors:
Cost of the system;
Homeowner’s cost of borrowing;
17 Global radiation is the total amount of solar energy falling on a horizontal surface. Diffuse radiation is the proportion of global radiation that fallson a horizontal surface from all parts of the sky apart from the direct sun, and is usually highest during cloudy conditions and lowest during clear skydays.

Nelson City Renewable Energy Assessment
| 35
P 2P
Amount of customer electrical load is reduced;
Electricity tariff.
Assuming an average home in Nelson, a SWH system would reduce annual electricity usage by 2,175 kWh, saving about$450 per annum (based on a controlled tariff of 20.6c/kWh including GST). It should be noted that in Nelson hot watercylinders are often connected to a separate meter and incur lower variable charges than the rest of the householdsupply because the electricity supply to the cylinder can be controlled by the lines company (hence the savings fromSWH are not as high as one might expect)18.
At a long term lending rate of 6% and assuming electricity tariffs rise at the rate of inflation over the long term, therates of return for different cost SWH systems are as follows:
System Cost1
(incl. GST)System Cost
($/kWh)IRR at
20.6 c/kWhSimple
PaybackDisc. Payback(@ 6% DCF)
BreakevenTariff (incl. GST)
$5,000 $2.30 6.6% 13 yrs 23 yrs 19.8 c/kWh$6,000 $2.75 4.8% 16 yrs >25 yrs 22.8 c/kWh$7,500 $3.45 2.9% 19 yrs >25 yrs 27.2 c/kWh
$10,000 $4.60 0.6% 24 yrs >25 yrs 34.7 c/kWh
Notes:
1. Assumes hot water system is saving the same amount of electricity in each case and the cost difference is due to sitespecific factors e.g. new hot water cylinder required, more pipework. In some cases a SWH system costing $10,000 mightbe designed for a higher water heating load and save more electricity than the example above. It is important to look atthe system cost over expected annual savings ($/MWh) when comparing to the above table, rather than system cost alone.
The above shows that for an average sized SWH system if the installed cost is $2.75/kWh or less then it may makefinancial sense for the home owner to invest in solar hot water heating by extending their home loan or investingsavings (a 5-6% after tax return is substantially better than current interest rates less tax).
Kiwibank is currently providing Sustainable Energy Loans to customers who have a mortgage with the bank, whichenable them to add the cost of a solar hot water or PV system to their home loan without charging a top up fee. Forcustomers borrowing over $5,000 for a system, Kiwibank will also pay $800 on the loan at the end of the first year, and$400 for each of the subsequent three years – to a total of $2,000 (Kiwibank, 2013). This improves the rate of return by2.4% and significantly improves the payback periods.
The Nelson City Council currently waives the council consent fee for a solar hot water system. Other councils charge fora building consent (sometimes partially subsidised) ranging from $220 to $600. The value of a $500 consent fee beingwaived is an improvement in rate of return by about 0.5% and reduction of payback period by about a year.
For larger commercial solar hot water systems such as the one installed at the CityFitness Gym in Nelson, the costs andbenefits are specific to the heating requirements of the commercial building. Larger systems should have improvedeconomies of scale – however the variable electricity tariffs for larger customers can range from about 9 c/kWh19 to20c/kWh (excluding GST), so for a system that costs, say, $2,000/MWh (excluding GST), the IRR can range from about2% for the low tariff to 9% for the higher tariff.
18 There has also been a problem, both locally and nationally, where installers of SWH systems have changed the supplementary water heatingelement from the cheaper ripple controlled economy electricity supply, to the dearer uncontrolled “Anytime” supply. This costs customers roughly29% more for any non-solar energy top up than it should, plus supply companies lose load control ability.19 For large commercial and industrial customers, the lines component is either a fixed daily or kW capacity based charge, hence a significantly lowerper kWh tariff applies compared to smaller commercial and residential customers where the network charges are apportioned based on kWh usage.

Nelson City Renewable Energy Assessment
| 36
P 2P
4.3.3.2 Rooftop Solar PV
Like rooftop solar hot water, the economics of rooftop PV is dependent on the cost of the system; the owner’sborrowing costs; electricity tariff and how much electricity the system can generate given the solar resource andorientation of the system on the roof.
In many overseas countries rooftop solar has seen significant growth due to government subsidies and feed in tariffs.Many of these are being substantially reduced as the solar industry has established itself and the costs of solar havecome down. In the space of 3 years, over 1GW of rooftop solar PV has been installed in Australia due to State levelfeed in tariffs. Successive New Zealand governments have not deemed it necessary to subsidise solar PV due to thecountry’s abundance of low cost renewables.
Not surprisingly the take up of solar PV in New Zealand has been very low historically with only 1.4MW installed at theend of 2004 (NIWA et al., 2009) and mostly associated with off-grid applications in the first instance. However, inrecent years pricing of solar PV systems in New Zealand has benefited from the rapid global growth of solar PV andmore locally the flow-on pricing effects from the growth of Australia’s solar industry.
For grid-connected rooftop solar PV, the primary economic benefit for the customer comes from reducing thehousehold load at the retail price of electricity. However, depending on the size of the system and the profile of thecustomer’s load there may be times when the property becomes a net exporter of power to the grid. New Zealand’selectricity governance rules do not allow for net metering (i.e. allowing meters to run backwards) and all distributedgeneration connected to the grid must have separate import / export meters.
This means that when the output from the solar panels exceeds the site demand, the excess power will be exported tothe grid and recorded on the export meter. The export tariff that retailers will pay for exported power variessignificantly between retailers20, but is generally lower than the retail offtake rate, reflecting that this containsvariabilised fixed distribution and transmission costs which are not avoided by intermittent distributed generation.
Residential Systems
Given the current residential system pricing of between $3.10/W to $3.80/W excluding GST, the economics ofresidential rooftop PV in Nelson is given below for a 3kW system, assuming minimal generation is exported to the gridand the consumer’s long term cost of borrowing is 6%.
System Cost(incl. GST)
System Cost($/Wp)
IRR at27.6 c/kWh
SimplePayback
Disc. Payback(@ 6% DCF)
BreakevenTariff (incl. GST)
$10,730 $3.58 8.8% 11 yrs 17 yrs 22.0 c/kWh
$12,150 $4.05 7.5% 12 yrs 20 yrs 24.4 c/kWh$13,400 $4.47 6.4% 14 yrs 24 yrs 26.6 c/kWh
The above shows that at the current range of pricing an optimally sized and oriented rooftop PV system in Nelson is aneconomic proposition for residential customers. The effect of the $2,000 cash back under the Kiwibank SustainableEnergy Loan would improve the above IRRs by nearly 2% and reduce the breakeven tariffs by up to nearly 3c/kWh. Thiswould enable some export to the grid during the day at a lower export tariff rate while still being a good investment at6% discount rate (e.g. up to 50% of total output at the lower end of the system costs above, assuming a 12c/kWh feedin tariff and the Kiwibank credits).
In the long run it is possible that the continued reduction in cost and improvement in efficiency of solar modules couldresult in residential rooftop PV systems costing as little as $2/W (with the module making up about 25% of this cost). Atthis cost the breakeven tariff for a Nelson based residential PV system would be around 15c/kWh. This would make itan extremely attractive investment for home owners should retail tariffs continue to include per-kWh transmission and
20 Until late 2012 Meridian Energy had a 1:1 feed-in rate for residential generation equivalent to its offtake rate – however this was a function of theirbilling system which previously did not have the ability to have two separate tariffs per customer. This has since been rectified and Meridian nowoffers energy only rates for electricity exported to the grid.

Nelson City Renewable Energy Assessment
| 37
P 2P
distribution costs. However, it is quite possible that should a high uptake of distributed generation occur, linescompanies would need to move to capacity or peak-demand based charging to ensure they were able to recoversufficient revenue to maintain the networks, resulting in a much lower variable offtake charge for residentialcustomers.
Commercial Systems
The economics for commercial roof top PV differs from residential systems in that businesses can claim GST anddepreciation on the assets. Also the commercial variable tariffs tend to be a lot lower than residential, particularly forlarger businesses as network charges are typically fixed monthly charges based on capacity or peak demand.
The cost of commercial scale rooftop PV systems are likely to be lower than those for residential given economies ofscale. Based on the reported Palmerston North City Council 95kW system cost of $240,000 ($2.50/W), the commercialviability of commercial rooftop PV in Nelson at a range of commercial tariffs and at a commercial cost of capital of 9% isgiven below.
Tariff(excl. GST)
IRR(at $2.50/W)
BreakevenSystem Cost
(at 9% WACC)
9 c/kWh 1.6% $1.04/W
12 c/kWh 3.9% $1.42/W15 c/kWh 5.8% $1.80/W18 c/kWh 7.6% $2.19/W
21 c/kWh 9.2% $2.57/W
The table above shows that at the current system prices installing rooftop solar is unlikely to be commercial for largerbusinesses (i.e. those with tariffs which are closer to the wholesale rate). To be fully commercial for businesses inNelson to install rooftop PV systems, overall system prices would need to fall by around 30 – 50% - noting that PVmodules only make up around 40-50% of the total system cost21.
While this is currently the case, some businesses are choosing to install smaller commercial systems (e.g. 10 kW) forother reasons such as research, brand or sustainability.
4.3.3.3 Solar PV Farms
Utility scale solar farms have different cost structures to commercial roof top systems. Due to their multi MW size, theycan benefit from economies of scale for purchasing modules, inverters, racking systems – however, they havesignificant grid connection costs and civil costs. Additionally as they are on land rather than un-used roof space theywill normally need to pay annual land lease fees which will be set on the next best use for the land e.g. subdivision,agriculture etc.
The cost per MW varies by project and region. The 10MW Greenhough River solar farm built in Western Australia inlate 2012 was reportedly $A50m (NZ$6.25m/MW) (Power Technology, 2012). This was utilizing low cost CdTe solarmodules, driven piles and the latest installation technologies from First Solar – although it is likely to have had relativelyhigh labour costs given the Australian environment and possibly had a higher than usual grid connection cost. Theproject was supported by State Government grants.
By comparison the installed cost of large scale solar PV farms in the US is reported to be between $US2.10m -2.40m/MW ($NZ2.6m – 3m/MW) (Bloomberg New Energy Finance, 2012). This reflects significant scale (100MW +) andexperience in solar farm construction in that country compared to Australia and NZ.
21 i.e. if PV modules prices halved the system cost would drop by 20-25%. Other cost components of PV systems, particularly installation and designare much less likely to drop significantly.

Nelson City Renewable Energy Assessment
| 38
P 2P
Assuming an ideal site exists for a small multi-MW solar farm in Nelson such as unused Airport land the capital costbased on current solar farm equipment costs is likely to be between $3.50m and $4.00m/MW for a fixed mount system.This is consistent with the cost of a 68kW ground mounted array built in Drury by South Auckland Forging Engineering(SAFE) for $270,000 ($3.97/W).
Given Nelson’s solar resource (4.08 kWh/m2/day) and assuming annual operating and maintenance costs of $30,000per MW, a land lease of around $5,000 per Ha ($10,000 per MW), the LCOE for a utility scale solar farm at the abovecost range would be between $310/MWh and $350/MWh.
Bloomberg forecast that solar farm costs could drop to around $US1.44m/MW ($NZ1.80m/MW) in ten years based oncurrent technology cost and efficiency projects (Bloomberg New Energy Finance, 2012). Even at this cost, the LCOE of afixed array solar farm in Nelson would be around $180/MWh – i.e. not cost competitive with average wholesaleelectricity prices22. A small improvement in LCOE might be gained from using tracking systems; however the additionalcapital and operating costs will somewhat offset the additional electricity generated.
4.3.4 Energy Potential for Solar4.3.4.1 Solar Hot Water
In the past four years, consents have been granted for nearly 450 solar hot water systems, nearly half of which weregranted in 2010. Assuming these were predominantly residential systems and the remaining 18,790 houses in thedistrict have the technical potential to install SWH systems, then the energy savings potential for residential solar hotwater in Nelson City is about 41 GWh per annum increasing to 49 GWh per annum in 25 years.
However, the average rate of install in Nelson is 112 systems per year (0.24 GWh), indicating that if systems continue atthe present rate, in 25 years an additional 2,800 SWH systems could be installed in Nelson City, saving 6.1 GWh perannum.
4.3.4.2 Rooftop Solar PV
There are approximately 19,200 houses in the district which currently do not have rooftop solar PV systems installed,and 3,800 additional houses expected to be built in the next 25 years. Assuming a best case scenario that all hadsuitable roof angles and orientations for solar PV, the theoretical potential for residential rooftop solar PV in NelsonCity based on an average 3kW system is 68 GWh per annum increasing to 81 GWh in 25 years. Based on the currentinstallation of 0.13 GWh and compound annual growth rates between 10 and 20%, installed residential capacity in 25years could be between 6 GWh and 26 GWh.
However it should be noted that SWH and solar PV are likely to be mutually exclusive from an economic point of view.If a house has an SWH system to provide the hot water heating load, then it is more likely that a PV system on the samehouse will be exporting to the grid during the day time and receiving a lower feed-in-tariff than if it was supplyinghousehold loads at the avoided retail offtake rate.
Also, due to the geography of the district, many of the roads run from south-west to north-east and cross-roads fromnorth-west to south-east, with houses oriented in parallel. This means that many houses have roofs oriented to about40o east of north, reducing the annual yield by about 3%, or 50o west of north reducing annual yield by 6%.
Commercial Systems
As at 2006, there were about 5,300 businesses in Nelson City. These vary in size from small-medium commercialenterprises to large meat and seafood processing firms. Many of these businesses are in large factory buildings whichcould accommodate solar PV systems on their rooftops. No data is available on the number of these buildings inNelson City or associated rooftop area. Utilising Google Earth we have estimated that Nelson City has approximately
22 In overseas locations such as California, solar farms with high LCOEs can be economic because their output is aligned with very high summerdaytime wholesale prices driven by air conditioning loads and limited peak generating capacity. In NZ we have excess generation in summer due tohydro inflows and peak loads / higher wholesale prices normally occur in winter evenings.

Nelson City Renewable Energy Assessment
| 39
P 2P
3.6 km2 of land area utilised by commercial or industrial buildings e.g. CBD, Port Nelson, Nelson Airport, Annesbrook,Wakatu Industrial Estate, ENZA, CHH Packaging and Nelson Hospital. Based on a visual estimate of building coveragepercentage for each area and assuming that two-thirds of the northerly facing rooftops can be covered by solar PVpanels gives an approximate PV area of 380,000 m2.
With standard 250W solar PV panels this would give a total potential cumulative installed capacity of 59.2MW with amaximum annual yield of 65 to 75 GWh per annum. This equates to approximately a 10-11kWp PV system for everybusiness in Nelson City. The technically feasible installed capacity will be dependent on a number of factors such as thestrength of the commercial building rooftops, and capacity of the network to integrate significant amounts ofdistributed PV systems. However the commercial considerations above are likely to limit the development ofcommercial scale rooftop solar to a fraction of the above for the next 25 years. Based on the current installation of0.03 GWh and compound annual growth rates between 10 and 20%, installed residential capacity in 25 years could bebetween 1.6 GWh and 7 GWh.
4.3.4.3 Solar PV Farms
A Nelson developer is anecdotally considering the potential for two 5MW solar farms at the Nelson Airport. If thesewere successfully commercialised in the next 30 years, the annual energy potential could be between 12.7 GWh and13.1 GWh.
4.3.4.4 Passive Solar Building Design
Nelson City Council estimate that the number of households in Nelson City will increase by 3,810 over the next 25 years(Nelson City Council, 2012). If all of these new houses were designed according to passive solar design principles thenthe potential energy savings would be in the order of 3.8 GWh (0.014 PJ) per annum.
The existing stock of 19,240 houses in the City is likely to be refurbished by their owners over the next 50 years. Manyare likely to have already benefited from the EECA Warm-up subsidy and fitted under-floor and ceiling insulation in thepast 5 years (contributing to the slowing of demand growth in the region). However, savings in the order of 8 GWh(0.03PJ) per annum might be possible within 25 years assuming half the existing housing stock is retrofitted with doubleglazing and wall insulation during renovations23.
4.3.5 Viability/Barriers to Development4.3.5.1 Solar Hot Water Heating
Not all houses are going to be suitable for solar hot water heating due to roof structure and direction, neighbouringobstacles (e.g. large buildings, trees or hills) that cut out the sun or the houses are rental properties.
For those that are suitable, the biggest barriers to solar hot water heating are affordability and payback. In many cases,SHW should be a good investment and enabling factors such as the council waiving consent fees and Kiwibank’ssustainable energy loan should make it a no-brainer. That said, the payback period for a SWH system is greater than 10years, which may be longer than people expect to stay in the same house. This should not matter, as the value of thehouse should be higher with a SWH system, but it is difficult to determine the tangible value of this uplift. This is adifficult rationale for the solar water heating industry to overcome and is a reflection of complex human nature inrelation to perception of value – e.g. the same people who might decide not to invest in a SHW system due to payback,might happily pay several thousand dollars for an entertainment system that will be obsolete in 5 years with nopayback at all.
Another factor that can be a barrier is the impact of poor publicity and lack of knowledge. Negative perceptions ofSWH can be created by poor quality installations, systems not delivering on promised savings and resulting in coldshowers, or lack of service. Not all SWH systems are created equal and people can find the choices of systemsoverwhelming.
23 Assuming 10% PSF (870 kWh p.a. savings)

Nelson City Renewable Energy Assessment
| 40
P 2P
4.3.5.2 Rooftop Solar PV
The barriers for rooftop solar PV are very similar to solar hot water heating discussed above.
The economics have greatly improved in the past three years to the point where the rate of return for residential PV issimilar to solar hot water heating – provided the bulk of the electricity generated by the PV system is utilised by loads inthe house at the time it is generated i.e. the household has sufficient daytime loads. For many households this will notbe the case, increasing the likelihood that the exported power will be larger and receive a much lower feed in tariffcompared to the offtake rate.
In the near term the lack of a 1:1 feed in tariff will be a major barrier, or at least a limiting factor on the size of PVsystems installed by people. As the cost of PV systems continue to decline this will become less of an issue. The impactcan also be limited with automated load management e.g. use of timers on dishwashers, washing machines or dryers torun during the day while the homeowner is at work.
Another minor barrier that has recently been raised on feed-in-tariffs is that the Inland Revenue may require thehomeowner to pass on the GST component paid by the retailer to the IRD – reducing the feed in tariff rate by a further13%.
4.3.5.3 Solar PV Farms
It is highly unlikely that utility scale PV facilities will be developed in Nelson due to the following barriers:
Relatively high capital costs and solar energy resource around 30-35% lower than the desert locations inCalifornia and Australian deserts where large scale solar farms are being built;
Solar farms are therefore not expected to be commercially competitive against alternative renewables in NZfor another 15 years (unless average summer daytime prices increase significantly);
The need for relatively flat land for solar farms, limited flat land area in Nelson City and the high productivevalue of land for agricultural and subdivision purposes;
The need for economies of scale (i.e. 10MW or greater) to improve the economics and exacerbating the aboveland requirements.
Small scale ground mounted solar PV arrays such as the 68kW system installed at the SAFE Engineering site in Drury in2012 may be possible provided they are installed behind a commercial load e.g. at the Nelson Airport.

Nelson City Renewable Energy Assessment
| 41
P 2P
4.4 Hydro
4.4.1 Technology Review
Hydro power is the most mature renewable energy source for producing electricity, and has been the backbone of NewZealand’s electricity industry since the first hydro-electric plant was built in Reefton in 1888. Today hydro powersupplies about 60% of New Zealand’s electricity demand.
Hydroelectric power schemes generate electricity from the gravitational energy potential between the power plant’swater source and the plant’s outflow. The power generated is governed by the following equation:= ℎWhere η is the efficiency of the turbine, ρ is the density of water (998 kg/m3), g is gravity (9.81m/s2), Q is the flow (m3/s) and h is the net head (heightdifferential between inflow and outflow less frictional losses).
Figure Q below shows a basic schematic of a typical hydroelectric scheme with water being drawn from an upstreamreservoir (e.g. dam, lake or head pond), passed through one or more turbines which are connected to electricalgenerators, and the outflow discharged into the river at a lower level.
Figure Q - Schematic of Typical Hydroelectric Power Station (Wikipedia, 2007)
There are two main types of hydro power schemes in New Zealand:
Conventional dams – involves building a dam across a river to build a storage reservoir or lake upstream andcreate the head for the power scheme;
Run of River – involves diversion of water from a river through a pipe or canal to a small head pond which thenleads to the hydro plant, with the water being returned to the river downstream.
Depending on their size, dams provide a greater level of water storage and flexibility in hydro power operation, makingthe plant less vulnerable to short term river flow variability and more valuable from the perspective of the electricitymarket. However, they do have a greater impact on the environment, requiring large areas of land upstream to beflooded and can have potentially adverse impacts on the pre-existing environment (e.g. constraining fish and eelmigration).
Run of river hydro schemes have a lower impact on the existing river, except for the reduction of flows in the stretch ofthe river between the intake and outflow. Because they have little or no storage, the output from run of river hydro ismore variable, reducing the ability of the operator to optimise generation to meet electricity demand peaks. Some runof river schemes are based on a chain of power stations linked by canals or tunnels, with the water from the last powerstation returning the water to the river, well downstream from the initial intake.

Nelson City Renewable Energy Assessment
| 42
P 2P
The size of hydro schemes can range from micro hydro (less than 100kW), small (typically up to 10MW) to large (whichin a New Zealand context is less than 1000MW24).
4.4.2 Economics of Hydro
The cost of hydro power is highly specific to the river resource and the topography. From the equation above the keyfactors driving economic viability of hydro is the topographical potential to create significant head and river flows (themore consistent the better). The former might be generated by a valley formation which could be dammed to create alake, a tightly winding river with a steep slope, or a nearby river or sea at a lower level.
A significant portion (e.g. 50-70%) of the overall capital cost of a hydro power station is associated with the civilstructures (e.g. tunnels, canals) and earthworks (e.g. dams). This means that hydro has a higher risk profile and time forconstruction than other renewables such as wind and solar where civil works are a much smaller proportion of the cost.It also means that hydro tends to benefit more from economies of scale.
The sizing of hydro turbines and electrical plant are optimised around the most efficient utilisation of the availablewater resources based on the overall scheme design. The design of the turbines is dependent on the scheme’s specifichead and flow regime, and these are manufactured to suit.
Hydro power stations are very long lived assets. The civil works can last in excess of 70 years, with mechanical andelectrical plant being refurbished or replaced at around 35 years.
Depending on storage capability and how the scheme has been sized, the capacity factors of hydro schemes can varybetween 40% and 70%.
The following graph in Figure R shows the LCOE cost ranges for generic hydro schemes in New Zealand, based on ananalysis undertaken in 2006 by Meridian Energy, updated to 2013 dollars (Meridian Energy, 2006).
Figure R - Levelised Cost of Energy for Hydro
The key takeaway points are:
The most economic hydro options are those where existing infrastructure such as a dam already exists ($60-85/MWh);
24 New Zealand’s largest hydro power station is Manapouri which has a peak capacity of 860 MW.

Nelson City Renewable Energy Assessment
| 43
P 2P
Larger schemes (100MW+) tend to be more economic ($70 – 105/MWh) than smaller schemes ($85 -$125/MWh) due to economies of scale, particularly those involving storage;
Hydro schemes built in the South Island have an additional LCOE burden of up to $10/MWh due toTranspower’s HVDC pricing regime (although small hydro projects embedded within distribution networks donot face this charge).
Another key point is that over the past 80 years the Government and electricity industry have successfully developedthe most economic large hydro projects (the low hanging fruit) to the point where there are few remaining economichydro projects. Most of these have been fully or partially consented in recent years (e.g. North Bank Hydro, Arnold,Wairau) and some have been unsuccessful either at the consenting stage or put on the shelf (e.g. Mokihinui, Mohaka,Clutha options).
4.4.3 Review of Hydropower Capacity Studies
In 2004, East Harbour Management Services was engaged by the Ministry of Economic Development to review NewZealand’s hydroelectricity opportunities where there is a possibility that they might be considered for developmentwithin the next 20 years. The report scope was focused on opportunities with a high to medium confidence level ofproceeding. (East Harbour Management Services, 2004)
In the Nelson-Marlborough Region the report found that there were 5 potential hydro projects totalling 141 MW(678 GWh per annum) that had a medium to high confidence level. The bulk of this potential was from a 100MWscheme on the Wairau River in Marlborough (a 72 MW scheme has since consented by TrustPower). Three of the otherschemes were in the Marlborough region including the Pelorus River, lower Waihopai River and Middle Awatere River.
4.4.3.1 Wairoa Gorge
The fifth scheme in the list was a potential 16MW (70 GWh pa) scheme at the Wairoa Gorge in Tasman District. Thescheme would involve damming the Wairoa River immediately downstream of the Lee River confluence to create a 90mhead to supply flood mitigation, irrigation water, town water supply, recreational facilities and electricity generation.The project is located within the region supplied by the Stoke GXP, so while the scheme would not be within NelsonCity, the power output and associated beneficial impacts on security of supply and wholesale price would benefitNelson City.
4.4.3.2 Others in the Region
Three other hydro opportunities in the Tasman region were indicated in the East Harbour report – a 39MW scheme inMotueka, 5MW supplement to the Cobb scheme and a 13MW scheme on the Anatoki River. No further informationwas supplied on these schemes but presumably these had been investigated previously by the old Ministry of Works orNZ Electricity Department. No developer is currently investigating the potential of these schemes and they are notexpected to be developed within the 25 year outlook.
4.4.4 Hydro Resources
Nelson City has three main river catchments – the Maitai River catchment, Wakapuaka River catchment and theWhangamoa River catchment. These feed into various streams around the district.
River flows are recorded by the council for the Maitai River at the Forks and Avon Terrace, Wakapuaka at Hira Rd,Roding at Caretakers and Orphanage at Ngawhatu Rd. (Tasman District Council, 2013)
4.4.4.1 Maitai Dam – Nelson City
In 1987, an earth dam was built on the Maitai River to store water and supply potable water to the district. The Maitaidam is 36m high and has a storage volume of 4 million m3. The scheme is designed to supply a peak demand of40,000 m3 per day, and its resource consents require that minimum flows in the Maitai River are 300 litres per secondfrom April to October, and 175 litres per second from November to March. (The Prow, 2009)

Nelson City Renewable Energy Assessment
| 44
P 2P
4.4.4.2 Waimea Community Dam (Lee River) – Tasman District
Since the East Harbour report was commissioned a partnership (Waimea Water Augmentation Committee) betweenlocal industry and Councils was created to develop a 52m high dam within the Lee Valley (approximately 300mupstream of the confluence of Anslow Creek and the Lee River). The scheme would supply irrigation water for 1800 Hain the Waimea Plains, Wairoa and Wai-iti. The feasibility study has included an assessment by Network Tasman of a1.2MW hydro plant added to the scheme which would produce about 6.4 GWh pa. (John Cook & Associates et al, 2011)
It is assumed that this project supersedes the Wairoa Gorge proposal and that the two projects are mutually exclusive.As per above, the proposed scheme would likely feed into the Stoke GXP which also supplies Nelson City. However itslesser size would significantly decrease the security of supply and nodal pricing benefits at the GXP.
4.4.4.3 Roding Valley Waterworks – Nelson City
The other water supply to Nelson City and Richmond comes from the Roding Waterworks scheme, built in 1941. Thescheme consists of an 11m high dam which supplies a peak demand of 13,000 m3 per day via a 2.7km pipeline (TheProw, 2008). The storage capacity of the dam has reduced from 40,000m3 to 3,000m3 due to build-up of gravel andsand in major floods and the water supply intake has since been moved to below the weir. A small 90kW hydro powergenerator was installed in 2009 at the Water Treatment Plant to capture some of the energy in the water supply systemthat otherwise would have been lost through a pressure reducing valve. (Nelson City Council, 2012)
4.4.5 Potential for Hydropower in Nelson
The Maitai Dam appears to be the largest single opportunity for hydro power in Nelson City, given that the storageinfrastructure has already been built. In 1990, Citipower undertook a prefeasibility study for a hydro scheme utilisingresidual flows after town water supply is withdrawn from the dam. The report estimated a potential scheme size of130 kW generating an annual electricity supply of between 485 MWh and 675 MWh (0.0024 PJ). (Citipower, 1990)
The study needs to be updated, based on modern efficient hydro turbines (the 1990 study assumed 70% efficiency) andutilising any flow data that has been recorded over the past 20+ years (and taking into account changes in town waterdemand). A 150kW hydro plant may be quite economic – however its lack of scale does mean that development andconsenting costs (assuming resource consent is required) do have a bigger impact on the viability.
Outside of Nelson City, the proposed Waimea Community Dam with the added hydro option is likely to be beneficial inproviding a small reduction in net demand at the Stoke GXP, which will marginally improve wholesale electricity pricesin the region.
It is unlikely that the other rivers and streams in Nelson City represent viable opportunities for hydro from a technicaland economic perspective. Some niche micro-hydro opportunities may exist for some land owners to generate powerfor their houses but the energy potential from such opportunities is likely to several orders of magnitude lower thansolar energy potential in Nelson City.
4.4.6 Viability/Barriers to Development
The key barriers to development of hydro in Nelson City are:
Lack of significant water resources not otherwise being used for town water supply;
Competing / conflicting demands for water resources between recreational uses (e.g. fishing, rafting), watersupply for potable water and irrigation – makes consenting hydro projects challenging and expensive;
Potential for silt and gravel build up behind dam structures during flood events, reducing storage capacity.

Nelson City Renewable Energy Assessment
| 45
P 2P
4.5 Bioenergy
This section covers bioenergy opportunities that are already technically and commercially proven and can be adoptedwithin the 10 year focus period. These include:
Combustion of woody biomass for heat and/or electricity supply using boilers and steam turbine technology; and
Digestion of putrescent wastes to produce biogas for use in boilers for heat or reciprocating engines for combinedheat and power (CHP).
CHP, also commonly known as cogeneration, is the generation of both heat and electricity in a single plant.
This section also discusses emerging technologies that might be developed sufficiently to be adopted in a longer 25-30year time frame. There are many competing bio-energy conversion processes under development and it is uncertainwhich of these will develop into technically and commercially viability options. Only technologies that are already at anearly stage of commercial operation are considered to have potential for Nelson City during this focus period.
Applicable technologies for each utilisation option are discussed in the relevant subsection. Further details can befound by reference to research undertaken by Scion, the Forestry Crown Research Institute (Scion, 2007).
Liquid biofuels options are discussed in section 4.6: Transport Fuels.
4.5.1 Summary of Potential
Bioenergy opportunities in Nelson City are summarised in the table below and discussed in more detail in subsequentsubsections.
Biomasscategories
Clean woody biomass Contaminated woodybiomass and
combustible waste
Putrescent waste
Current sources Waste stem wood from forestry skid
sites Pulp logs Urban tree removal Sawmill chip, sawdust and shavings
Forest residue recovery Bark Recovery from urban waste Woody agricultural residues
Municipal waste water plant sludge Urban food wastes Food processing wastes
Future sources Purpose grown forest and woody
crops Increase forest residue
recovery Animal wastes General MSW
Current useoptions
Heat and electricity using boilers andsteam turbines
Pellet manufacture
Heat and electricity usingspecialised boilers andsteam turbines
Landfilling producing LFG Anaerobic digestion producing
biogas
Growth potentialin Nelson
Wide-spread growth in use for heat Niche - limited Heat and electricity for
industrial developments.
Niche – limited Bell Island WWTP option
Drivers Potential cost savings Sustainability Lower exposure to international oil
prices and NZ currency value
Potential cost saving Sustainability Avoided waste disposal
costs
Sustainability Improved waste water treatment Avoided solid waste disposal costs By-products - fertilisers
Barriers Cost competitiveness Planning rules Established and reliable wood fuel
supply chain
Cost competitiveness Better disposal alternative uses such as composting and mulching Effect on removal of nutrients from land
Emergingtechnologyoptions
Gasification for CHP Liquid fuels using
pyrolysis/gasification orhydrolysis/fermentation
Liquid fuels using niche thermal and chemical processes

Nelson City Renewable Energy Assessment
| 46
P 2P
4.5.2 Biomass Resource in Nelson
The assessment covers the biomass resource in and around Nelson City. In the right circumstances, it may be practicaland economic to transport raw biomass up to 150 km from its source, so biomass from the Tasman and MarlboroughDistricts may be used to supplement local supply.
The available biomass resource can be classified in three broad categories:
4.5.2.1 Clean Woody Biomass
Clean woody biomass is generally sourced from solid tree stem and branch wood. Consequently it should be free fromsignificant soil contamination, heavy metals and other man-made chemicals. This makes it suitable for use as a boilerfuel either green (approximately 50% moisture content), seasoned (approximately 30% moisture content) or dry. It issuitable for chipping and burning in standard commercially available packaged boilers and is the preferred feedstock forwood pellet manufacture and biofuels.
In Nelson the main sources of this type of biomass are:
Urban tree removal and clean woody biomass recovered from the urban waste stream. Urban wood can be usedprovided that it is not a wood composite, treated or painted. This is a limited resource in Nelson and a minorpercentage of the overall supply;
Sawmill residue streams: sawmill chip, sawdust and shavings that can be green or dried. There are severalsignificant sawmills in or near Nelson and together they produce approximately 150,000 t/y chip, 50,000 t/ysawdust and smaller quantities of shavings. The sawdust and shavings are generally burnt at the sawmill site toproduce the heat for kiln drying. Sawmill chip could be available for bioenergy applications, but most of it iscurrently purchased by Nelson Pine (in the Tasman District) as feed stock for their MDF mill. Nelson Pine alsoimport chip and pulp logs from the Marlborough District;
Stem wood recovered from forestry skid sites. With log harvests of approximately 2.3m t/y in the top of the SouthIsland, there is potential to recover approximately 100,000 t/y stem wood from skid sites, subject to theeconomics. Some of this material is already recovered for Nelson Pine’s fuel supply and for domestic firewood.Further recovery depends on the economics, and the relative cost of alternatives such as pulp grade logs;
Whole trees removed from rural land and pulp logs from existing exotic forests. This is by far the largest bioenergyresource near Nelson. Harvested pulp logs in the upper South Island are currently used to supply Nelson Pine orare exported. Overall the pulp log supply in the Top of the South Island is approximately in balance, with a surplusforecast to develop in the next few years and continue until at least 2030. This is illustrated by the followinginformation sourced from National Exotic Forest Description (Ministry of Primary Industries, 2012), and NelsonMarlborough Forest Industry and Wood Availability Report (Ministry of Agriculture and Fisheries, 2006).
The location of the exotic forest estate in the region, and its ownership is shown in the resource map in AppendixA. Forest areas and pulp log availability forecasts for the top of the South Island are as follows:
Nelson City Tasman District Marlborough
Forest area1 9,000 Ha 86,000 Ha 74,000 Ha
Total annual log harvest 160,000t/y 1,500,000t/y 650,000t/yForecast pulp log harvestNow included 250,000 t/y 140,000 t/y
2020 included 380,000 t/y 240,000 t/y2030 included 520,000 t/y 260,000 t/y
Notes1. 90% of exotic forest are Pinus Radiata, 9% are Douglas Fir and the balance mostly Eucalypts

Nelson City Renewable Energy Assessment
| 47
P 2P
The age class of un-pruned forest plantations in the top of the South Island are as follows:
Figure S - Age Class of Forest Plantations in the Top of South Island
Nelson Pine is the sole processor of pulp wood in the Nelson-Tasman region. They require approximately850,000 t/y and use a mix of wood chip and pulp logs. As there is currently a shortage of pulp wood or chip in theNelson area the shortfall is imported from Marlborough. In the future this shortfall should ease and by 2020 thereshould be a local surplus for bioenergy applications; and
Potentially, in the future, purpose grown trees or woody plants such as Willow/Salix and Miscanthus grass. Theseplants are grown commercially overseas, but their suitability for the NZ environment and their commercial viabilityhere is uncertain. Even if proven in NZ, they are unlikely to be a supply option for Nelson within the 30 yeartimeframe due to the lack of suitable production land near Nelson, and the time needed to prove their viability inNZ and to develop an efficient supply chain.
Figure T - Pulp log seasoning/ chipping operation and forest skid site residues.
Wood pellets are normally manufactured from sawdust. These are best suited to domestic heating applications wheretheir higher energy density and convenience is preferred. The main supplier in NZ, the Nature’s Flame business inTaupo, produces up to 60,000 t/y but small quantities are also produced locally by AZ Wood.
0
5 000
10 000
15 000
20 000
25 000
1-5 6-10 11-15 16-20 21-25 26-30 31-35 >35
Fore
st a
rea
(hec
tare
s)
Marlbrough District
Tasman District
Nelson City

Nelson City Renewable Energy Assessment
| 48
P 2P
4.5.2.2 Contaminated Woody Biomass
This type of biomass is typically contaminated with soil, green matter or sourced from other residues (such as straw)that are corrosive or abrasive when burnt. However it should be free of heavy metals, plastic and other man-madechemicals. This material is best suited to larger industrial or horticultural heat applications because they require morespecialised custom designed boilers. In Nelson the main sources of this type of biomass are:
Forest residues contaminated with soil. For the Nelson Tasman area up to 100,000 t/y of these low grade residuesmay be recoverable;
Bark residues from sawmills. With modern harvesting techniques most bark is removed from the log in the forestand this is now a minor waste stream; and
Woody horticultural wastes and vine prunings from the surrounding Tasman region. The volume of this materialhas not been quantified, but could be a significant biomass resource. It is said to be currently dumped or burnt insitu.
These types of woody fuel can be burnt in conventional boilers, with appropriate technology, and the economics can bepositive because the project may attract gate fee revenue from avoided landfill charges.
On a larger scale, there is also an opportunity to use MSW or biosolids as a fuel for electricity generation orcogeneration as part of a regional solution. NZ currently does not use MSW or biosolids as a fuel, even though theseare used overseas in Europe and America. In NZ there are major barriers to this option as follows:
Burning MSW and biosolids is currently not permitted under the National Environmental Standards (NES);
Public perception is negative and there is legitimate concerns over the potential for harmful air emissions; and
Landfill disposal is still relatively cheap.
This fuel resource option is therefore very unlikely to be an option for the top of the South Island.
4.5.2.3 Putrescent Waste Material
Some types of wet biomass can be suitable for anaerobic digestion to produce biogas. This material is normally too wetto burn, but can be converted to biogas, and a residual sludge stream. Feed stock with a carbon/nitrogen ratio of 20:1to 30:1 is desirable. Gas yields from suitable material are in the order of 8 GJ/ tonne dry matter.
In Nelson the main sources of this type of biomass are:
Municipal Waste Water sludge. The Bell Island Waste Water Treatment Plant produces approximately 1,500 t (drymatter)/y of this material;
Food processing wastes such as from meat processing sludge (Alliance), apple pomice (ENZA Foods) and grapemarc, or in the future from aquaculture. A report by Waste Solutions (Waste Solutions , 2007) suggested there waspotential to collect up to 8,000t (wet basis)/y of this type of biomass in the Nelson-Tasman region;
Animal manure, potentially in the future if a large scale piggery was established (for example); and
Municipal Solid Waste decomposing anaerobically in the landfill to produce LFG or as feed stock from putrescentwaste diversion.
Biogas can be used for generating electricity, with the option for heat recovery, or for heat only applications as per theNelson Hospital project.

Nelson City Renewable Energy Assessment
| 49
P 2P
4.5.3 Economics of Biomass4.5.3.1 Cost of Biomass
As previously discussed, the major bioenergy resources near Nelson are pulp logs, sawmill chip and residues, and forestresidues. Some of the residues are low cost, but as the use of bioenergy in Nelson increases, the cost of pulp logs islikely to set the cost of the fuel. This is effect is illustrated below.
Figure U - Wood Fuel Price Curve
The cost of pulp logs delivered to Nelson has been relatively stable for many years and is currently around $50/t($5/GJ). The cost to season, store and chip pulp wood and deliver it as a seasoned chip fuel to a customer would addapproximately $6/GJ, meaning that the delivered cost of seasoned chip in Nelson should be approximately $11/GJ. Inthe future, the real cost of this fuel may rise as demand for wood energy increases.
4.5.3.2 Combustion Efficiency
The combustion efficiency of burning woody biomass increases as the fuel moisture content reduces. It is thereforeimportant to minimise the moisture content of the wood through seasoning or drying the material.
The effect of the moisture content (with all other parameters constant) is illustrated below:
Figure V - Effect of Moisture Content on Gross Thermal Efficiency of Biomass
40%45%50%55%60%65%70%75%80%85%
0% 10% 20% 30% 40% 50% 60% 70%
Gro
ss th
erm
al e
ffici
ency
Moisure content of the biomass (wet basis)

Nelson City Renewable Energy Assessment
| 50
P 2P
4.5.4 Bioenergy Applications4.5.4.1 Electricity Generation Using Woody Biomass, Including Cogeneration
The convention technology used to generate electricity from woody biomass is fully mature, relatively simple andreliable. With optimal design, it can be nearly as efficient as next generation technologies such as bio-gasificationcombined with combined cycle plant.
The basis process flow is shown below:
Boiler technology can be standard packaged domestic and smaller commercial industrial units suitable for good qualitywood fuel, or bespoke designs for larger applications or for more difficult fuels.
To illustrate the application: a 140 MWth steam boiler would use 400,000 t/y green biomass to produce 2.6 PJ steamand this steam would be supplied to a 40 MWe condensing steam turbine to produce 320 GWh/y electricity, enough tosupply the entire Nelson City (ignoring peaks). This type of electricity generation may approach commercial viability ifthe cost of the biomass fuel was around $50/t and the value of the electricity was around $140/MWh.
This option is therefore technically feasible for a location in the Nelson City region. However, within the period to 2030,it is not likely to be economically competitive with other forms of renewable generation (mostly in other regions) suchas wind, geothermal or hydro-power.
A variation on this option would be cogeneration, where the steam turbine exhausts steam at a higher pressure tomatch a process heat demand. In the above example, if the steam was discharged at 10 bar g, the power output woulddrop to around 14 MWe and 126 MWth steam would be available for process heating. There are no industries in Nelsonthat could suit this option, even at a much smaller scale.
4.5.4.2 Heating Opportunities Using Woody Biomass
Heating using wood chip or pellet fuel is the most promising short term bioenergy option for increasing sustainability inNelson City. There is potential to convert many of the remaining heat demands in the city that are still using fossilfuels.
Hot flue gas from the combustor can be used directly (for space heating or drying) or indirectly to heat a fluid (water oroil) so that the heat can be transported to the end user.
This is a fully mature technology in widespread use in NZ, including Nelson. The most common technology applicable toNelson is packaged space heaters and boilers (made both in NZ and imported).
Biomasspreparation
Boiler combustionproducing high
presure superheatsteam
Electricitygeneration using
steam turbine
Electricity exportwith residual heatto process use or
condensor

Nelson City Renewable Energy Assessment
| 51
P 2P
Figure W - Domestic and commercial pellet heaters
For larger applications, wood chip is a more cost effective fuel and a hot water or steam boiler is normally used. Theseunits typically require more sophisticated fuel handling, combustion and flue gas filtering systems.
Figure X - Packaged wood chip boiler and combustion system
As illustrated in section 3, the cost of heat from wood fuel is similar to heat using a coal fuel or from heat pumps, andmuch cheaper than using liquid fossil fuels. This is before other drivers are considered such as emissions to air,sustainability, and security of supply of liquid fossil fuels.
Wood pellets will also be a competitive fuel option where it is a substitute for liquid fossil fuels or electric resistanceheating.
Examples where wood to heat options may be commercially viable in Nelson include:
Private homes and commercial buildings;
Community facilities such as hospitals, rest homes, schools, swimming pools and public buildings; and
Industries that currently use fossil fuels.
All of these applications are subject to Nelson City’s Air Quality Plan which is intended to improve the city air quality tomeet the National Environmental Standard for air quality. The plan generally permits the installation of domestic scale(up to 40kW) approved “ultra-low emission” pellet heaters. It also facilitates the installation of industrial-size (40kW to200kW) wood pellet burning units in situations where they are replacing existing coal or solid wood boilers.
Nelson does not have the scale, urban density or climate for a district heating scheme, as are common in Europe.However, it may be possible to establish industrial or commercial hubs where one heat plant can service a cluster ofusers. This approach may provide economies of scale and lower the capital establishment costs for new business.

Nelson City Renewable Energy Assessment
| 52
P 2P
Specific examples of the larger opportunities to increase biomass to heat uptake in Nelson are as follows:
Heat user Owner Current fuel Fuel usage
Juice concentrator ENZA Foods LFO 1.6m l/y; 0.07 PJ/y
Fish processor Sealords LFO 1,400 t/y; 0.06 PJ/yBrewery McCashins Coal 400 t/y; 0.01 PJ/y
Nelson Hospital and laundry Crown Coal 1,500 t/y; 0.04 PJ/ySawmill Waimea Part coal 5,000 t/y; 0.1 PJ/yNMIT Crown Diesel 90,000l/y; 0.003PJ/y
NCC is already heating many of its buildings with electricity (direct resistance and heat pumps), but there is potential toconsider wood energy for base load heating in its high occupancy buildings and for heating the Nayland pool. There isalso potential to convert schools and rest homes in the city. To be consistent with the Air Quality Plan theseconversions would need to replace fossil fuel and reduce particulate emissions to air.
4.5.4.3 Biogas Opportunities, Including LFG
Anaerobic digestion uses microbes to produce a biogas by digesting biomass slurry. The biogas produced is typicallyaround 60% methane. With suitable treatment and stable gas properties, this gas can be used as a boiler or enginefuel.
The basis process flow is shown below:
This technology is most commonly used in NZ at municipal waste water treatment plants (MWWTP) for electricitygeneration, where sludge digestion is part of the water treatment process. There are currently biogas CHP installationsat the Mangere, Bromley and Hamilton MWWTPs. There is also potential to use this technology at the Bell IslandWWTP, if it is to be upgraded to include anaerobic digestion. A recent feasibility study (Waste Solutions , 2007)suggested this could generate up to 350 kW electricity or up to 1,100 kW if additional putrescent wastes were added tothe MWWTP sludge. This option may be viable as an add-on project if NCC decided to convert the Bell Island toanaerobic digestion based on other waste water treatment drivers.
In NZ, outside the MWWTP application, there is limited potential for this technology. Potential applications include:
Diversion of putrescent food wastes from landfill for digestion. A scheme of this type considered forChristchurch would have required 20,000 t/y waste and produced enough gas for 600 kW of generation. Thismaterial can be mixed with sewerage sludge and processed at an existing MWWTP.
Digestion of concentrated animal wastes, particularly from pig farming. Large scale pig farming requiressophisticated waste water treatment and digestion is a suitable add-on to this process. It is possible that thistype of option could be commercially viable because of the avoided gate fees.
LFG from the York Valley Landfill is already used for heat at Nelson Hospital, displacing coal fuel. LFG is drawn out ofthe landfill, treated and compressed and piped to the Hospital. It may be possible to increase LFG recovery at theLandfill (albeit with some risk to gas quality and reliability) for use at the Hospital or by other nearby heat users.
Biomasspreparation tosuitable slurry
Anerobic digestionwith heating to suit
Gas treatment toremove H2S and/or
moisture
CHPDirect heat
Pipeline distribution

Nelson City Renewable Energy Assessment
| 53
P 2P
Figure Y - Nelson Hospital Landfill Gas Plant
4.5.4.4 Pellet or Briquette Manufacture
There is potential for biomass and pulp wood to be processed into fuel pellets or briquettes. These could be used fordomestic and commercial heating in Nelson or exported to Japan and other Asian countries that are increasing the useof these fuels. This is a credible scenario for Nelson within the next 20 years.
This type of operation is best suited to regions where large volumes of sawdust are generated. The sawdust ispulverised, dried and pelletised, usually with a binder. For Nelson City, the current use of sawdust for process heat atsawmills could be substituted with other woody biomass to enable this option.
For commercial viability, this type development would need a secure export market prepared to pay up to equivalentliquid fuel prices. Technology is being developed to manufacture torrified wood pellets and these have a higher energydensity. This should improve the economics for pellet export.
4.5.5 Emerging Technologies4.5.5.1 Technology Status
Beyond the 10 year focus of this study, there are other emerging bioenergy technologies that could develop intocommercial proven options for Nelson. The most promising of these and their current development stage aresummarised below:
Research and development todemonstration stage
Early commercial stage
Biomass integrated gasification and combined cycle(BIGCC) power generation
Gasification for CHP with reciprocating engines
Pyrolysis for bio–crude oil for refining for transport fuels Gasification for direct fired kilnsWood to ethanol using hydrolysis and fermentation Combustion with ORC for power generationWood to ethanol using gasification and fermentation
Hydrothermal treatment of MSW
For Nelson, wood gasification (discussed below) and wood to biofuels technologies (discussed in section 4.6.4) couldadvance during the next 20 years to the fully commercial stage.
4.5.5.2 Gasification
This base technology is very mature and relatively simple, but the downstream gas treatment is much more challengingand, for most bioenergy applications, it is not fully mature.
When heating biomass in an oxygen deficient environment, combustion is prevented and volatile gases such as CarbonMonoxide, Hydrogen, and methane are generated. This syn-gas can be used in a similar way to biogas.

Nelson City Renewable Energy Assessment
| 54
P 2P
The basis process flow is shown below:
Heat is used to dry the feedstock or support gasification. Steam can be injected into the gasifier to increase gas calorificvalue so that it is suitable for reciprocating engines.
The difficulties with gasification are:
Low gas heating value and variable consistency. The gasification process produces a relatively low grade rawgas that is of marginal quality as engine fuel. If air is used for the gasification process the gas calorific value(CV) will be around 4 to 6 MJ/m3 and if oxygen is used the CV can be increased to 10 to 15 MJ/m3;
Gas treatment. The raw gas contains particulates and condensable contaminants, as well as potentially heavymetals if these are found in the biomass feedstock. For use in engines, the raw gas needs to be cooled andthese contaminants need to be removed. This technology is not yet technically or commercially mature.
While there are a lot of enthusiastic technology developers in this space, commercially proven technology is rare. Thebest example overseas is in Austria where an early industrial scale plant has now been in operation for over five years;however this is a subsidised operation.
Figure Z - Güssing 2MWe gasification and CHP plant
Once commercially proven, this technology could start to displace combustion/heat-only applications with CHP plantsprovided that the overall energy efficiency is superior to the current approach of using combustion for heat andimporting grid electricity.
In the future this technology may also be the precursor for producing liquid fuels used with the Fischer-Tropschprocess.
4.5.6 Viability/Barriers to Development
The key barriers to the further uptake of bioenergy in Nelson City include:
For heating, it is not necessarily as cost competitive as coal and it is not as convenient as grid electricity usedwith a heat pump;
There is a higher value utilisation option (MDF manufacture) for much of the currently available clean woodybiomass in the region;
The wood fuel supply sector in the region currently has limited scale and competitiveness; and
There are Air Quality Plan rules that limit the increased use of wood fuels for heating in the urban area whereit may adversely impacts on air quality.
Biomasspreparation
Gasifier withlimited oxygen
Gas CoolingTar removal
Particulate removal
CHPDirect heat
Pipeline distribution

Nelson City Renewable Energy Assessment
| 55
P 2P
4.6 Transport Fuels
4.6.1 Conservation and Efficiency
While out of the scope of this assessment, it is important to note that the most immediate way to reduce the use offossil fuels for transport is through conservation and efficiency gains.
Conservation can be achieved by avoiding unnecessary vehicle use, increasing the use of public transport, car-poolingand by walking or cycling instead of driving. These changes can be assisted by encouragement, pricing incentives,planning policy and urban design.
Efficiency gains can be achieved through the use of smaller and more efficient vehicles (including electric hybrids),improved road design and driving skills. These changes can be assisted by encouragement, national regulation, caremission standards, pricing incentives such as through vehicle registration fees and other public policy measures.
If liquid fuel use in Nelson was reduced by 15% through these measures, 0.3 PJ/y of fuel savings and 21,000 tCO2e/yemission reductions would be achieved.
4.6.2 Comparison of the Renewable Options
If Nelson City is to significantly reduce its reliance on liquid fossil fuels during the next 25 years, it is most likely to be asa result of one or more of the following options:
Electric vehicles using grid electricity assuming that the additional electricity will be generated from a similarmix of renewable and fossil fuels as is presently used;
Internal combustion engine (ICE) driven vehicles using biofuels produced with woody biomass; and
Electric vehicles using grid electricity generated from North Island natural gas in a CCGT power plant, or awood fuelled power plant if it became economic.
It is important to note that biofuels are not carbon zero, and in fact some consume significant quantities of fossil fuel intheir production. For example woody residue fuels are reported (AEA Group, 2009) to result in indirect emission ofapproximately 5kg CO2e/GJ. Indirect emissions from corn ethanol produced in the USA are estimated to equal orexceed the replaced fossil fuels.
The overall fuel running cost and GHG emissions (tank to wheel) of the above options are illustrated by the simplecomparison below:
Petrol +ICE Grid + BEV1 CCGT +BEV Bioethanol +ICE2
Cost comparison per GJ
Fuel cost to tank or battery charge $54/GJ $67/GJ $67/GJ $54/GJFuel to wheels efficiency 17% 80% 17% 17%Delivered energy at wheels $317/GJ $84/GJ $394/GJ $317/GJEmissions comparison per GJ
For fuel or electricity only 70kgCO2e/GJ 45kgCO2e/GJ 125kgCO2e/GJ 15kgCO2e/GJFor delivered energy at wheels 410kgCO2e/GJ 56kgCO2e/GJ 735kgCO2e/GJ 90kgCO2e/GJ
Notes:1. Charging using off peak electricity could reduce this by around 50%;2. Wood to ethanol conversion efficiency of 50%, wood feedstock emission of 5kgCO2e/GJ plus 5kgCO2e/GJ processing emission
assumed.
This simple comparison shows that:
The Grid + BEV option is by far the cheapest fuel option and results in by far the lowest GHG emission; and

Nelson City Renewable Energy Assessment
| 56
P 2P
The Bioethanol + ICE option (once the technology meets assumed performance levels) may be competitivewith the current Petrol + ICE option and would also significantly reduce GHG emissions.
4.6.3 Electric Vehicles
The use of NZ grid electricity and Battery Electric Vehicles (BEV) is a promising and emerging renewable energyopportunity for Nelson.
Hybrid vehicles such as the Toyota Prius are well established in the NZ market and vehicle manufacturers are nowramping up production of BEVs. Electric motor bikes are already in widespread use in China to combat city airpollution. World-wide production of battery electric cars is now around 100,000/y and forecast to grow to aroundthree million vehicles per year by 2015. While these vehicles are relatively expensive now, their cost should comedown as mass production increases. For example, Nissan is reported to have reduced the cost of its Nissan Leaf in theUS market for 2013 by 18% (Cleantech News, 2013).
The overall fuel running cost and GHG emissions (tank to wheel) for a BEV are far superior (compared to a conventionalcar driven by an internal combustion engine) as previously illustrated.
The present challenges for electric vehicles versus conventional petrol / diesel vehicles include (EECA, 2013):
Higher cost – BEVs cost significantly more to buy than the equivalent conventional vehicle. For example abrand new 5-door Nissan Leaf BEV costs about $70,000 whereas a new Nissan Micra ST (ICE) costs about$23,000. The savings in running costs for BEVs is insufficient at present to make the BEV an economic choice;however as fuel prices increase and BEV pricing decreases this will change.
Shorter Range – BEVs do not travel as far on a full charge as conventional vehicles can on a full tank, with BEVsranging from 100-150 km. Recharging times range from six to eight hours on a standard 230V 15ampconnection (although some vehicles have fast charge capability which enable them to be charged to 80% full in30 minutes when connected to a fast charge station – typically direct current). While this may be a concern tosome people, about 90% of vehicles in NZ drive less than 40km per day, well within the current range of BEVs.
Charging During Peak Hours – this is a common challenge faced by the electricity industry around the world –the potential for large numbers of BEVs being connected to the grid after work causing network overloadingand causing power price spikes. This can be managed with smart charging equipment that can controlcharging levels depending on pricing and control signals from the electricity retailer and distributer.
Noise and Safety – BEVs make very little noise, giving little warning to pedestrians and other road users whenapproaching.
Figure AA - Nissan Leaf and Mitsubishi iMiEV Electric Vehicles
Some of the above issues may well be addressed with the emergence of plug in hybrids. Toyota is currently triallingplug-in electric Prius vehicles, which are anticipated to become commercially available in New Zealand in 2015. These

Nelson City Renewable Energy Assessment
| 57
P 2P
will have smaller battery capacities than full electric vehicles, resulting in a shorter range on battery power (18km) butmore importantly will have a lower up front cost.
With its relatively compact size, Nelson City is well suited to the use of BEVs and hybrid BEVs for local commuter travel.If 10% of local journeys were in BEVs, 0.2 PJ/y of petrol and diesel would be saved and 14,000t CO2e/y emissionavoided.
4.6.4 Biofuels4.6.4.1 Ethanol production from woody biomass
While there are many competing technologies under development for using wood to produce ethanol, this sectionconsiders the most well-known option using hydrolysis and fermentation. This technology is expected to be suitable forNZ’s Pinus Radiata wood resource.
The fermentation technology to produce ethanol from sugars is well proven. Sugar from sugar cane or sugar beet areconverted by microbial fermentation to a “beer” and then distilled to produce the grade of ethanol required. Largescale production of ethanol from sugars and corn starch, particularly in Brazil and USA, is now widespread.
To use this process in other regions, research and development is now focusing on producing sugars from woodybiomass in a cost effective way. In simple terms there are two new conversion steps needed to do this:
Firstly, pre-treatment to break up the rigid structure of the biomass by physical and chemical means so as tomake the lignocellulose available for conversion; and
Secondly, the conversion of the free cellulose to sugar using either chemical or enzymatic hydrolysis. Thisbreaks down the larger cellulose molecules into smaller sugar chains.
This produces C5 and C6 sugar molecules that are harder to ferment than natural sugars, so there is also a need todevelop more efficient microbes for the fermentation process.
The overall process flow for the wood to ethanol process is shown below:
Using this process, wood can be converted to ethanol and lignin. Lignin can be used as a fuel or chemical feedstock.
Several recent private feasibility studies (not in the public domain) for using this technology in NZ are understood toconclude that ethanol could be produced for less than $1/litre (ex-refinery), theoretically making it already close toeconomic viability. However these studies are based on assumptions about the performance of the technology thathave not yet been realised. Note that, by volume, ethanol has only 66% of the energy content of petrol.
When the technology performance targets are reached, a commercial scale bioethanol plant could be built, for example(Scion, 2007), to use 700k t/y green wood, with an energy conversion efficiency of around 35%, producing in the orderof 85m litres/y ethanol, enough to satisfy Nelson City’s entire transport fuel demand. The plant would costapproximately $300m (25% less if built as part of an existing pulp and paper plant conversion) and, at current pulp logcosts, produce ethanol at a cost (ex-refinery) in the order of $1/litre (GCV of 23 MJ/l and $43/GJ). This would equate toa pump price of order $2/litre petrol equivalent excluding the existing sales tax of 61c/litre.
Once the technology is technically and commercially proven, NZ should have sufficient low value land to grow suitableforests or woody biomass crops to support large scale bio-refineries.
Biomasspreparation and
pretreatmentHydrolysis Fermentation Distillation and
blending
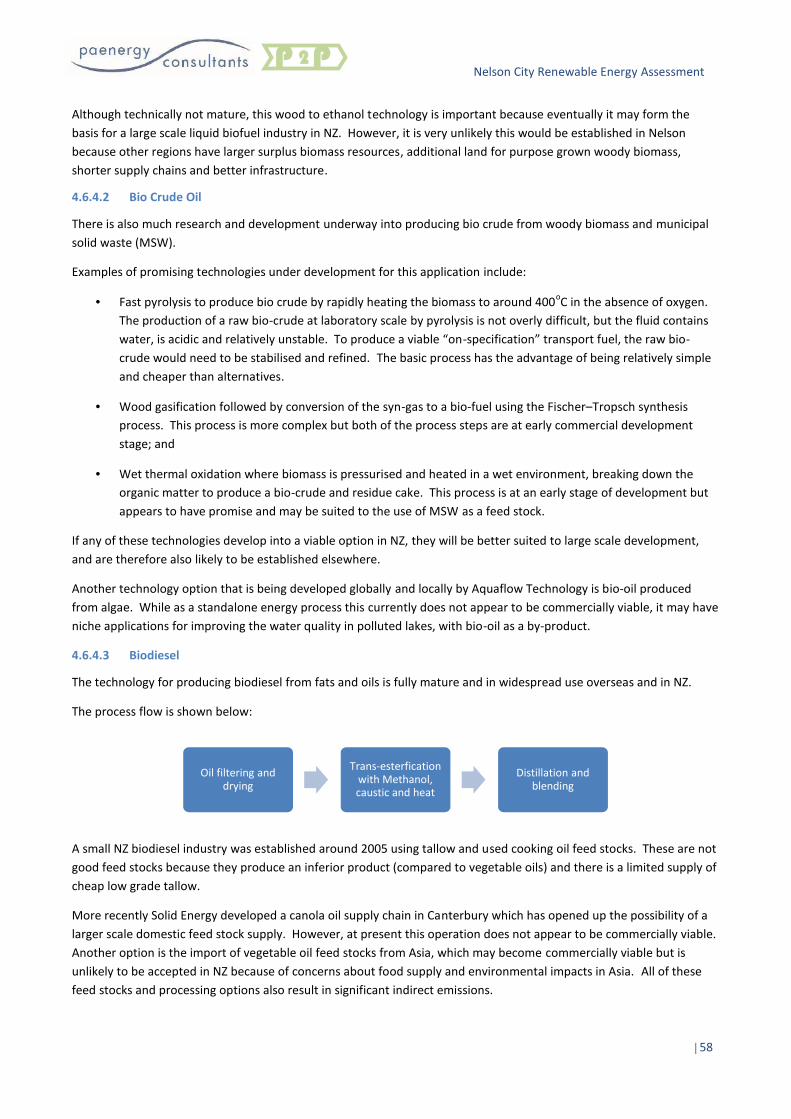
Nelson City Renewable Energy Assessment
| 58
P 2P
Although technically not mature, this wood to ethanol technology is important because eventually it may form thebasis for a large scale liquid biofuel industry in NZ. However, it is very unlikely this would be established in Nelsonbecause other regions have larger surplus biomass resources, additional land for purpose grown woody biomass,shorter supply chains and better infrastructure.
4.6.4.2 Bio Crude Oil
There is also much research and development underway into producing bio crude from woody biomass and municipalsolid waste (MSW).
Examples of promising technologies under development for this application include:
Fast pyrolysis to produce bio crude by rapidly heating the biomass to around 400oC in the absence of oxygen.The production of a raw bio-crude at laboratory scale by pyrolysis is not overly difficult, but the fluid containswater, is acidic and relatively unstable. To produce a viable “on-specification” transport fuel, the raw bio-crude would need to be stabilised and refined. The basic process has the advantage of being relatively simpleand cheaper than alternatives.
Wood gasification followed by conversion of the syn-gas to a bio-fuel using the Fischer–Tropsch synthesisprocess. This process is more complex but both of the process steps are at early commercial developmentstage; and
Wet thermal oxidation where biomass is pressurised and heated in a wet environment, breaking down theorganic matter to produce a bio-crude and residue cake. This process is at an early stage of development butappears to have promise and may be suited to the use of MSW as a feed stock.
If any of these technologies develop into a viable option in NZ, they will be better suited to large scale development,and are therefore also likely to be established elsewhere.
Another technology option that is being developed globally and locally by Aquaflow Technology is bio-oil producedfrom algae. While as a standalone energy process this currently does not appear to be commercially viable, it may haveniche applications for improving the water quality in polluted lakes, with bio-oil as a by-product.
4.6.4.3 Biodiesel
The technology for producing biodiesel from fats and oils is fully mature and in widespread use overseas and in NZ.
The process flow is shown below:
A small NZ biodiesel industry was established around 2005 using tallow and used cooking oil feed stocks. These are notgood feed stocks because they produce an inferior product (compared to vegetable oils) and there is a limited supply ofcheap low grade tallow.
More recently Solid Energy developed a canola oil supply chain in Canterbury which has opened up the possibility of alarger scale domestic feed stock supply. However, at present this operation does not appear to be commercially viable.Another option is the import of vegetable oil feed stocks from Asia, which may become commercially viable but isunlikely to be accepted in NZ because of concerns about food supply and environmental impacts in Asia. All of thesefeed stocks and processing options also result in significant indirect emissions.
Oil filtering anddrying
Trans-esterficationwith Methanol,caustic and heat
Distillation andblending
Nelson City Renewable Energy Assessment
| 59
P 2P
In Nelson there may in the future be niche opportunities for biodiesel production from waste cooking oil/fats, tallow, orimported “sustainably produced” imported vegetable oils. These are unlikely to have a material effect on Nelson City’soverall sustainability.
4.6.5 Biofuel Development Opportunities for Nelson
The only current opportunity is for niche biodiesel production using waste oil and low grade tallow. Other productionoptions may develop and be commercially viable for Nelson within the 30 year outlook.
Opportunities to develop biofuels technology in Nelson may emerge in the coming years. Research and developmentof biofuel technologies is increasing, with very significant public and private sector funding available overseas. Even inAustralia, there are significant financial grants available to biofuel technology developers. NZ is therefore not likely tobe at the forefront of the major technology developments, but may have a role in niche applications. While publicfunding options in NZ are currently limited, they may improve over time as the potential and importance of the sector isrecognised by Government.
As an example, Scion and the Rotorua City Council have partnered to undertake a pilot plant development of a wetthermal oxidation process for sewerage sludge, branded as the “Waste to Gold” process. Funding of $4.7m isunderstood to have been secured from the Waste Minimisation Fund for this programme. This type of technologydevelopment approach could be used in Nelson, if niche bioenergy technology developers can secure the fundingsupport for its development. Currently local company, Aquaflow Technology, is understood to be active in this sector.

Nelson City Renewable Energy Assessment
| 60
P 2P
4.7 Marine Energy
4.7.1 Technology Review
Marine or ocean energy is an emerging area of renewable generation and refers to a range of technologies andtechniques for extracting energy from the ocean. These include:
Tidal barrages –involves creating a dam like structure across a bay or river that allows sea water to flow induring high tide and then releasing the water back during low tides through conventional low head hydroturbines;
Wave power –harnessing the energy potential in the rise and fall (heave), pitch and rotational motions (surge)of ocean waves via a floating, sea-bed mounted or shore based wave energy converter;
Ocean current25 – capturing the energy from the flow of ocean currents in channels, typically utilisingsubmerged floating or fixed turbines (similar to wind turbines);
Ocean thermal energy conversion – uses the temperature differential between cooler deep water and warmshallow water to drive a heat engine and create electricity.
Tidal barrages are a fairly well established and proven marine energy technology. However they require tidal ranges ofaround 5-12m to be economic, whereas New Zealand’s tidal range is around 2-3m (Meridian Energy, 2006).
Ocean thermal energy conversion is very early in its technical development and most likely to be suitable in waters thathave a large (>20oC) temperature difference between the surface and 1 km depths i.e. the Tropics.
The primary marine energy technologies that have potential for future development in New Zealand are wave powerand to a lesser extent ocean current. These are described below.
4.7.1.1 Wave Power
Wave power refers to a number of techniques for converting wave energy into electricity (and in some cases potablewater). Considerable R&D investment has been occurring in the UK, Europe and US in the last decade to developeconomically viable wave energy converters that will ultimately be able to compete with other renewable energytechnologies. The wave energy industry is at a similar stage of development as the wind energy industry was in the late1970s – there are a large number of different techniques and approaches that are currently being developed to turnwave energy into electricity i.e. there is a lack of technology convergence.
Some of the key wave energy converter (WEC) approaches are summarised below along with some of the leadingexamples that are under development:
Technology Approach Description / Examples (EMEC, 2012) Pros / Cons
Shore BasedOscillating WaterColumn (OWC)
Involves channelling waves into a chamber where the rise and fallof the waves drives air through two-directional air turbines (e.g.Wells turbine) to create electricity.E.g. Voith Hydro Wavegen Limpet (Islay, Mutriku), Pico IslandOWC (Azores, Portugal)
Proven technology + Does not require subsea cabling + Expensive due to civil infrastructure - Lower wave energy potential at shore - Environmental impact (visual, noise) -
Floating OWCSimilar approach to shore based OWCs, but based on a floating ornear shore structure.E.g. Oceanlinx Greenwave (Pt. Kembla, NSW), OceanEnergy OEBuoy
Proven power offtake + Near shore so higher wave energy and lower
environmental impact (than on shore)+ Relatively large and expensive structure – Subsea cabling costs -
25 Sometimes referred to as marine current, tidal current or tidal flow.

Nelson City Renewable Energy Assessment
| 61
P 2P
Technology Approach Description / Examples (EMEC, 2012) Pros / Cons
Floating PointAbsorbers
Typically a floating buoy-like structure which absorbs energy fromall directions through its movements at or near the water surface.It converts the motion of a buoyant floating section relative to aheavier semi-submerged section. Power off take may vary, butmost commonly based on hydraulic rams / motorsE.g. WET-NZ (Wellington NZ), OPT Powerbuoy, Columbia PowerTechnologies Manta, Wavebob, Fred Olsen Bolt
Typically located offshore in 50-100m depths(highest wave energy, lowest impact)+
Some devices can absorb wave energy fromall three wave motions (heave, surge, pitch)+
Lower expected cost / MWh + Power offtake more challenging and more
subsea cabling -
Platform MountedPoint Absorbers
Typically involves mounting point absorbers connected to abreakwater or sea platform (e.g. oil rig, offshore wind turbine)with the rotating arms driving hydraulic pistons / motors.E.g. COPPE Pecem wave plant (Brazil), Wave Star C5 (Hanstholm,Denmark)
Relatively low cost when connected toexisting infrastructure +
Energy offtake limited to wave heave only – Breakwaters and sea platforms tend to be in
lower wave energy environments -
AttenuatorsA long (100m+) floating absorber which operates parallel to thewave direction and extracts energy from the relative motion ofmultiple segments via hydraulics.E.g. Pelamis P2 (EMEC, UK)
Typically located offshore in 50-100m depths(highest wave energy, lowest impact)+
Power offtake more challenging and moresubsea cabling -
PendulumsSeabed mounted WEC that extracts energy from wave surges –typically with a broad paddle like structure mounted on a pivotedjoint that oscillates as a pendulum in response to wavemovement. Power offtake is typically (but not always) based onpumping pressurised sea water to an onshore hydro turbineE.g. AW-Energy WaveRoller (Portugal), Aquamarine Oyster 800(EMEC UK), Carnegie Wave Energy CETO 5
Where on shore hydro is used, reduced costand complexity of transmission connection +
Wave devices are submerged / not visible + Mounted near shore and energy capture
based only on surge (lower wave energy) -
OvertoppingEither a shore mounted or floating structure that captures waterinto a storage reservoir as waves overtop the device. The water isthen returned to the sea through a conventional low head hydroturbine.E.g. Wave Dragon, WavePlane
Proven power conversion technology + Large floating structure is expensive and
difficult to moor (both examples broke theirmoorings in storms) -
Figure BB - Examples of Wave Energy Converters26
4.7.1.2 Ocean Current
As with wave energy converters, ocean current technology development has seen considerable investment occur overthe past decade, particularly in the UK. While there are a few unique approaches to harnessing ocean currents beingconsidered, many of the leading technology developers have converged on a horizontal axis turbine design, like anunderwater wind turbine (such as the Marine Current Turbines Seagen shown in Figure CC below).
26 Limpet OWC at Islay, WET-NZ 1:2 scale WEC at Oregon, USA, WaveStar C5 Demonstration Plant at Hanstholm, Oyster 800 and Pelamis P2

Nelson City Renewable Energy Assessment
| 62
P 2P
Figure CC - Artist Impression of Array of Seagen Ocean Current Turbines (Marine Current Turbines, 2013) and OpenHydro
There are a range of methods to fix ocean current turbines to the seabed including:
Seabed mounted / gravity base – physically attached to the sea bed or fixed by virtue of its weight;
Pile mounted – similar to the mounting of large wind turbines where the device is attached to a polepenetrating the sea bed. Horizontal axis turbines can yaw about this structure. In some cases such as the MCTdesign above, the turbines can be raised above the water level to allow for maintenance;
Floating – the device is buoyant and floats in-stream via flexible or rigid moorings attached to the seabed. Formaintenance purposes the moorings can be loosened to allow the device to be floated to the surface (EMEC,2011).
Piling is expensive and time consuming, so companies like MCT are moving towards gravity bases for future designs.
4.7.2 Economics of Marine Energy
To be commercially viable in New Zealand, the LCOE for future wave farms and ocean current farms will need tocompetitive with the LCOEs of alternative forms of electricity generation in the markets.
4.7.2.1 Wave Power
The LCOE for a given wave energy technology will be affected by:
The strength and consistency of the wave energy resource (typically measured in kW/m of wave front) and theefficiency of the WEC’s operating principles to convert the three primary wave motions into energy;
The amount and type of materials incorporated in the device construction (including mooring or mountingsystems) and the efficiency of the power take off mechanism;
The size of the WEC and the array of WECS i.e. economies of scale;
The distance to shore based transmission infrastructure, and approach to transmitting energy to shore (i.e.subsea cabling or pressurised water pipes);
Ease of maintenance;
Macroeconomic factors such as depreciation, interest rates and renewable energy support mechanisms andincentives.
4.7.2.2 Ocean Current
The key drivers of LCOE for ocean current devices are the same as wave energy devices. Ocean current turbines followthe same generation principles as wind turbines, and therefore their power output is also proportional to velocity

Nelson City Renewable Energy Assessment
| 63
P 2P
cubed. However, since the density of water is about 800 times that of air, the size of the ocean current turbine rotorsare significantly smaller (i.e. between 10 and 20m diameter) than wind turbine rotors to produce the same poweroutput.
4.7.2.3 Carbon Trust Study
Information on LCOE for wave energy converters and tidal current devices in general is fairly sparse given the earlystate of industry development. These technologies are not yet available off the shelf, so cost and performanceinformation is tightly held. The leading analysis to date was undertaken by the UK Carbon Trust in 2011 (Carbon Trust,2011) with information obtained from the leading wave and ocean current device developers and experienced marineengineering companies.
As shown in Figure DD, the Carbon Trust assessment of the LCOE of the first ocean current farms is expected to bebetween 25 p/kWh and 40 p/kWh (NZ $450/MWh to $720/MWh) and the first wave farms between 38 p/kWh and48 p/kWh (NZ $660/MWh to $870/MWh). This was based on available information at the time on a handful of full scaleocean current and WEC device costs, and assumed a discount rate of 15% and an operating life of 20 years. The rangeof the dark band was dependent on the strength of the ocean current or wave energy resource that the array wasoperating in and the lighter bands indicated optimistic and pessimistic cost and technical assumptions.
Figure DD - Baseline costs for benchmark first farms of wave and tidal devices (Carbon Trust, 2011)
Carbon Trust looked at the impact on the LCOE of wave energy and ocean current devices from “learning by doing” asthe cumulative installed capacity increases; economies of scale effects as the size of arrays increases; and innovation. Itfound that on its own “learning by doing” would not have a sufficient cost reduction impact to result in a LCOE below20 p/kWh (NZ $360/MWh), unless several GW of devices were installed, which at these high costs would not beeconomically feasible.
The report concluded that an innovation-led scenario will be required to deliver step change reductions in devicestructure, operations and maintenance costs, and improvements to energy yield. These are likely to make significantcontributions to reducing the overall cost of energy from wave and ocean current devices.
This can be seen in Figure EE below which shows that under the innovation scenario, the LCOE for wave energy devicescould drop to around 15 p/kWh (NZ $270/MWh) by 2025 and ocean current devices by 2020 – equivalent to the cost ofoffshore wind. The long run cost for both wave and tidal current devices could drop below 10 p/kWh (NZ $150/MWh)by the time 14 GW of wave power and 6 GW of tidal devices have been deployed respectively – around 2040.

Nelson City Renewable Energy Assessment
| 64
P 2P
Figure EE - Possible cost reduction pathways for wave (left) and tidal energy (right) under “business as usual” and innovationscenarios (Carbon Trust, 2011)
The key takeout from the above analysis is that without significant incentive mechanisms to support their developmentand construction (or unanticipated technology breakthroughs), it is unlikely that either form of marine energytechnology will be cost competitive against alternative renewables in mainland New Zealand in the next 25 - 30 years.At the point in time when they do reach grid parity, this will primarily be in regions where the ocean current resource ishigh (i.e. mean speeds >2m/s) or wave energy potential is high (mean wave energy flux of 20 kW/m or greater).
4.7.3 Ocean Current Resource
New Zealand’s primary ocean current resources are the Cook Strait, Foveaux Strait, Cape Reinga, and confined harbourinlets and channels (e.g. Kaipara Harbour, Manukau Harbour, French Pass and Tory Channel). The most significant ofthese tidal currents are in the Cook Strait around Terawhiti Head, Wellington with mean spring tide flows of up to 3m/s. (MetOcean Solutions Ltd, 2008).
A map showing the power density of tidal resources is included in Appendix A (NIWA et al., 2009).
As Tasman Bay has an unrestricted entrance, the flow of water in and out of the bay due to tides would be too low togenerate useful energy from a tidal current turbine.
4.7.4 Wave Resource
New Zealand’s primary wave resources are on its west coast, particularly in the south west of the South Island withmean energy flux in excess of 50 kW/m – however this resource is remote from population centres and transmissioninfrastructure. There are significant areas of greater than 20 kW/m wave energy resource near the upper South Island(Westport), and the west coast of the North Island from New Plymouth to Northland. The east coast has lowerresources with an annual average wave power of 13.7 kW/m near Wairarapa and 10.8 kW/m near Gisborne, East Cape(MetOcean Solutions Ltd, 2008).
A map showing the mean wave energy flux magnitude around New Zealand is included in Appendix A (NIWA et al.,2009). A close up of the Tasman Bay region shows that wave energy resources of 10-15 kW/m within the outer bay andtoward Motueka, with resources of around 5-10 kW/m within Nelson City Council’s territory. This is due to theprotection provided by Farewell Spit from the predominantly westerly wave fronts.
The inner portion of Tasman Bay is also extremely shallow at around 36m with the outer portion reaching 90m (Te Ara,1966). Depending on how quickly the bay drops to these depths, this may favour near shore sub-surface wave energydevices rather than floating point absorbers which are typically designed for 50m+ depths.

Nelson City Renewable Energy Assessment
| 65
P 2P
The total gross annual wave energy resource in Nelson City is estimated to be between 1750 GWh and 3500 GWh (12.6PJ) per annum27. The technically feasible energy potential would be an order of magnitude lower due to constraintsfrom device spacing, conflicting water uses, distance to transmission and the Horoirangi Marine Reserve. For example anotional 5 km long array of wave energy devices (e.g. 50 x 33m wide 800kW Oyster WEC devices28) in Nelson City’sterritorial domain of Tasman Bay could have a technical energy potential of around 100 GWh per annum.
As will be the case with wind energy in Nelson City, there will be a long list of higher wave energy sites around thecountry (particularly on the West Coast) that will be more economic first and ahead in the national merit order than asite in Nelson. It is therefore highly unlikely that wave energy will be economically viable in Nelson within the next 25-30 years.
4.7.5 Viability/Barriers to Development
Nelson City has no ocean current resources in its territorial waters so this technology will not play a future role in itsenergy mix.
While Nelson City does have wave resources there are a number of factors that will prevent wave energy being acontributor to Nelson’s energy mix in the next 25 years. These are:
Comparatively low wave energy resources in Tasman Bay, particularly in the Nelson City territory;
Wave energy technology is still in its infancy and not expected to be economic in mainland NZ in the next 25years without significant government support and incentives.
27 Based on 5 – 10 kW/m x ~40km x 8760 hours.28 Note this is an illustrative example only. The current Aquamarine Oyster devices are being designed for the much higher wave energyenvironments of Scotland. Whether future Oyster devices will be optimised and suitable for lower wave energy environments such as Nelson is notknown.

Nelson City Renewable Energy Assessment
| 66
P 2P
4.8 Summary of Renewable Energy Sources
The table below summarises the renewable energy resources (and associated technologies for conversion intoelectricity) in Nelson City, the primary barriers to their development in the region. It provides the total technicalresource potential and levelised cost of energy based on currently technologies, and an assessment of commercialpotential in the next 25 years based on the anticipated future levelised cost for technologies within that time frame.
Renewable Technology Primary Barriers to Development Resource Qualityin NCC
Technical ResourcePotential in NCC
(future commercial)
Current LCOE inNCC
(future LCOE29)
Wind Farms Lack of wind resource in district, limitedavailable elevated land, visual impact andnoise concerns
Poor - <6 m/s 150 GWh(highly unlikely)
$150-180/MWh($125-150/MWh)
Wind turbines – smallscale
Lack of wind resource in district, cost of smallscale wind turbines, visual and noise impacts
Poor - <5 m/s As above(possibly <0.1GWh)
~50 c/kWh(30-50 c/kWh)
Hydroelectricity Lack of high mean flow / significant heightdifferential rivers in district, silt, topography
Low <1 GWh(possible)
$95-135/MWh(same)
Solar Hot Water Cost and affordability, many roof orientationsin NCC not optimal, affecting LCOE
Good - 4kWh/m2/d 40 – 50 GWh(6 - 12 GWh)
19-34c/kWh(same)
Solar PV – Rooftop(Residential scale)
Cost and affordability, low FITs for exportedpower, many roof orientations in NCC notoptimal
As above SWH + 28 – 31 GWh(6 – 26 GWh)
22–27c/kWh(15–21c/kWh)
Solar PV – Rooftop(Commercial scale)
LCOE relative to lower commercial tariffs. As above 65 – 75 GWh(1.6 – 7 GWh)
18-19c/kWh(12-15c/kWh)
Passive Solar Design Limited ability to improve existing housingstock. Trade-offs between PSD and aestheticdesign.
As above 4 – 12 GWh(4 – 12 GWh)
Not applicable
Solar PV Farms Land requirements. Economics in NZ due to~30% lower solar resource compared toQueensland / California.
As above 6 - 13 GWh(unlikely)
$310-350/MWh($180-200/MWh)
Solar Thermal Require direct insolation, low cloud and largeland area. Significantly higher cost that solarPV farms.
As above Nil Not applicable
Putrescent Waste Biogas– Electricity at MWWTP
Cost competitiveness. Niche - ~9kt pa 2-5 GWh(2-5 GWh)
$100-140/MWh(same)
Clean Woody Biomass –Electricity Co-Generation
Cost competitiveness, established and reliablewood fuel supply chain. Alternative local uses
Good – 460kt pa(limited surplus)
<320 GWh(unlikely)
$140/MWh (at$50/t)
Ocean Current Lack of resource in region, technology notcommercial and 15-25 years from beingeconomic in NZ
Very poor - <0.1m/s Nil Not applicable
Wave power Relatively low resource in region, technologynot commercial and 15-25 years from beingeconomic in NZ
Poor 5-10kW/m 50 - 100 GWh(highly unlikely)
$660-870/MWh($150-200/MWh)
Total 665–760 GWh (~2.7PJ)(20 -63 GWh – 0.23PJ)
29 In $2013

Nelson City Renewable Energy Assessment
| 67
P 2P
The following table shows renewable energy resources in Nelson City that could potentially be substituted for existingfossil fuels used for heating and transport.
Renewable Resourcefor Fuel Substitution
Primary Barriers to Development ResourceQuantity in NCC
Technical ResourcePotential in NCC
(future commercial)
Current cost inNCC
(future cost30)
Clean Woody Biomass –Heating
Cost competitiveness, established and reliablewood fuel supply chain. Alternative local uses
Good – 460kt pa(limited surplus)
0.3-0.6PJ(0.15-0.3PJ)
$16-34/GJ 31
(same)Clean Woody Biomass –Pellets for Heating
As above As above Included above(0.1PJ + exports)
$20-30/GJ(same)
Residue Woody Biomass -Heating
Cost competitiveness, better alternative uses,effect on removal of nutrients from land
Niche – ~100kt pa Incl. above $10-16/GJ 26
(same)
Biofuels - Wood Ethanol from wood at early commercial stage Good but limitedsurplus
Limited surplus Pre-commercial($2-3/litre32)
Biofuels – Biodiesel Utilising waste cooking oil/fats, tallow etc –inferior to vegetable oil. Limited supply andindirect emissions
Poor Minimal Not applicable
Fuel substitution –Electric Vehicles
Upfront vehicle cost relative to conventionaland limited range. Charging infrastructure
Not applicable 0.8 PJnet33
(0.16PJnet)Pre-commercial34
Total 1.1-1.4PJ(0.15-0.6PJ)
30 In $201331 Excluding non-fuel operating and capital plant cost32 Petrol equivalent cost at pump33 Net PJ figure as conversion from liquid fuels to electric vehicles would result in an increase in electricity usage of around 20% of the fossil fuelenergy saved34 Running costs of BEVs currently about 25% of ICEs, but vehicle cost 2-3x higher so is not economic, but will improve as fuel costs increase and BEVprices reduce
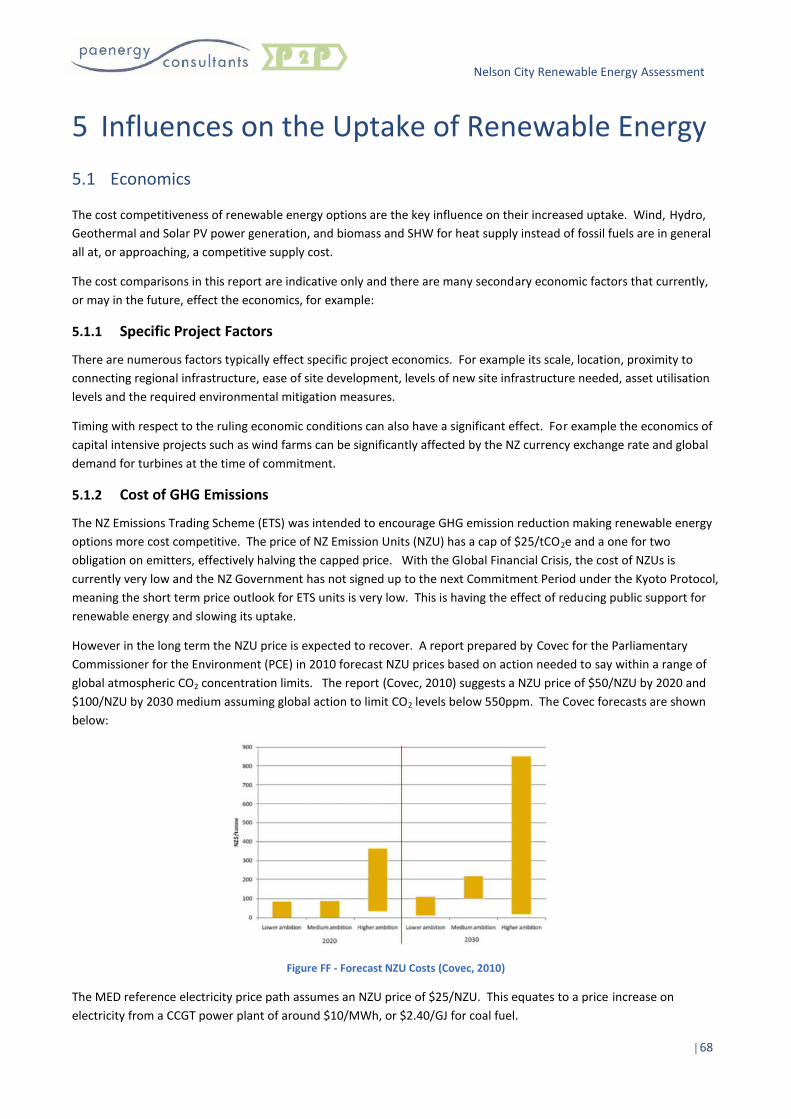
Nelson City Renewable Energy Assessment
| 68
P 2P
5 Influences on the Uptake of Renewable Energy5.1 Economics
The cost competitiveness of renewable energy options are the key influence on their increased uptake. Wind, Hydro,Geothermal and Solar PV power generation, and biomass and SHW for heat supply instead of fossil fuels are in generalall at, or approaching, a competitive supply cost.
The cost comparisons in this report are indicative only and there are many secondary economic factors that currently,or may in the future, effect the economics, for example:
5.1.1 Specific Project Factors
There are numerous factors typically effect specific project economics. For example its scale, location, proximity toconnecting regional infrastructure, ease of site development, levels of new site infrastructure needed, asset utilisationlevels and the required environmental mitigation measures.
Timing with respect to the ruling economic conditions can also have a significant effect. For example the economics ofcapital intensive projects such as wind farms can be significantly affected by the NZ currency exchange rate and globaldemand for turbines at the time of commitment.
5.1.2 Cost of GHG Emissions
The NZ Emissions Trading Scheme (ETS) was intended to encourage GHG emission reduction making renewable energyoptions more cost competitive. The price of NZ Emission Units (NZU) has a cap of $25/tCO2e and a one for twoobligation on emitters, effectively halving the capped price. With the Global Financial Crisis, the cost of NZUs iscurrently very low and the NZ Government has not signed up to the next Commitment Period under the Kyoto Protocol,meaning the short term price outlook for ETS units is very low. This is having the effect of reducing public support forrenewable energy and slowing its uptake.
However in the long term the NZU price is expected to recover. A report prepared by Covec for the ParliamentaryCommissioner for the Environment (PCE) in 2010 forecast NZU prices based on action needed to say within a range ofglobal atmospheric CO2 concentration limits. The report (Covec, 2010) suggests a NZU price of $50/NZU by 2020 and$100/NZU by 2030 medium assuming global action to limit CO2 levels below 550ppm. The Covec forecasts are shownbelow:
Figure FF - Forecast NZU Costs (Covec, 2010)
The MED reference electricity price path assumes an NZU price of $25/NZU. This equates to a price increase onelectricity from a CCGT power plant of around $10/MWh, or $2.40/GJ for coal fuel.
Nelson City Renewable Energy Assessment
| 69
P 2P
At this stage the current uncertainty with the Kyoto protocol and any replacement treaty remains a major uncertaintyrisk to the value of renewable energy opportunities.
5.1.3 Financial Incentives
Because of NZ’s already high percentage of renewable power generation and political aversion to subsidies comparedto overseas, there are only limited financial incentives available to support renewable energy uptake in NZ. Supportoptions include:
EECA crown loan scheme operated by EECA: a small fund available only to public sector institutions. It couldbe used by NCC for its own renewable energy initiatives or purchase of EVs. Effective interest rates arearound 2-4% per annum;
EECA renewable energy programmes. These include grants for feasibility studies and capital grants of up to40% but capped at $100,000 per project;
Waste levy and associated waste minimisation grant scheme is administered by MfE: these are allocated toencourage waste minimisation, recycling and beneficial reuse. The grant pool is currently around $10m perannum, and grants have been made to support biosolids treatment R&D;
Primary Growth Programme fund administered by MPI: this is a substantial grant fund and offers dollar fordollar support to approved projects. Funding is currently around $70m per annum. It is possible that this fundcould support the development of a new wood energy supply chain, or the introduction of new methods forbiomass forest recovery;
NZTE, support for technology development on an ad-hoc basis where they believe there is potential forsignificant economic benefit;
MBIE, Technology Development Grants – up to 50% co-funding to support R&D with the administration of thisunderstood to soon be moving to the Callaghan Institute;
Biodiesel industry Grants Scheme mechanism administered by EECA: supporting existing producers. Thescheme was intended to distribute $36m over three years to existing producers at a rate of $0.42/litrebiodiesel produced. It has now been discontinued; and
Marine Energy Deployment Fund administered by EECA. Originally budgeted for $8m over four years from2007, this scheme has now ended with less than half the funds allocated due to a number of projects beingcancelled.
NZ does not have a support scheme within the ETS framework to incentivise marginally economic renewable energyprojects where they would reduce the NZ Government’s Kyoto obligations. A scheme of this type (Projects to ReduceEmissions) was trialled in NZ around 2004-6, and NZUs were allocated under this scheme for the Nelson LFG UtilisationProject.
Nor does NZ have Feed-in Tariffs (FITs) or renewable energy obligations as are common overseas. These are unlikely tobe introduced here within the 10 year focus. However tax incentives such as accelerated depreciation could bepolitically acceptable.
Elsewhere in NZ, another avenue for support is from community owned Energy Trusts. The Network Tasman Trust isunderstood not to make grants of this type but this might be possible with a change of policy.
5.1.4 Solid Waste Disposal Costs
Historically bio-wastes and biomass have been landfilled, however the cost of this has risen significantly and there isstrong regulatory pressure to divert organic matter to other more beneficial uses. Landfill charges in Nelson arecurrently $93/t (exclusive of GST) including the $10/t Waste Levy. The Waste Levy can be increased by regulation.

Nelson City Renewable Energy Assessment
| 70
P 2P
In addition under the ETS, from 2013, an emission charge will apply as a gate fee to organic matter that is landfilled.This will add to the gate fee ($12/t general waste to the York Valley landfill at $25/NZU) and will also incentivise landfilloperators to maximise the recovery of LFG.
5.2 Policy and Regulation
At a national level there are a number of policies and regulations in place to encourage the uptake of renewableenergy. These include the:
NZ Energy Strategy 2011-2021 and National Policy Statement for Renewable Electricity Generation 2011 withthe goal to increase renewable electricity generation to 90% by 2025;
National Energy Efficiency and Conservation Strategy (NEECS) which seeks to reduce energy intensity andincrease the use of renewable energy, particularly from woody biomass;
National Environmental Standard (NES) for air quality which is mandatory and seeks to improve the air quality,particularly in urban areas to meet the National standards. It also prohibits incineration of certain wastes;
Distributed Generation Regulations – Part 6 of the Electricity Industry Participation Code, 2010 coveringconnection of distributed generation;
The New Zealand Waste Strategy sets out the Government’s long-term priorities for waste management andminimisation and established the Waste Levy; and
Nelson Air Quality Plan which places controls on certain activities in Nelson. While it limits growth in thenumber of conventional domestic wood burners within the urban area, it does allow for growth in the numberof approved “ultra-low emission” pellet burners. For industrial scale uses, the plan provides regulatoryincentives for replacement of existing coal burning appliances with wood fuel.
While aspirational national renewable energy goals are in place there is a lack of supporting policy and programmes.Government support is waning and NCC has recently discontinued its Solar Saver Programme.
There are also political and policy barriers, including:
The Resource Management Act which has been blamed for preventing the consenting of some renewableenergy projects. The Government is in the process of changing the RMA to reduce this barrier;
Water ownership and rights with respect to Maori;
Protection of rivers under Water Conservation Orders (WCOs) which are the major RMA tool for riverprotection; and
Access to public land for development of hydro and wind projects, including land control by DOC.
5.3 National Policy Statement on Renewable Electricity Generation
The National Policy Statement on Renewable Energy Generation 2011 (NPS REG) applies to renewable electricitygeneration activities at any scale, and covers the construction, operation, maintenance and upgrading of new andexisting structures associated with renewable electricity generation. This includes small and community-scalerenewable generation activities, systems to convey electricity to the distribution network and/or the national grid, andelectricity storage technologies associated with renewable electricity storage. It also covers all renewable generationtypes – hydro, wind, geothermal, solar, biomass, and marine – along with associated investigation activities, such aswind masts and geothermal test bores (Ministry for the Environment, 2011).

Nelson City Renewable Energy Assessment
| 71
P 2P
The NPS REG confirms that:
Renewable electricity generation, regardless of scale, makes a crucial contribution to the well-being of NewZealand, its people and the environment, and any reductions in existing REG will compromise achievement ofthe Government’s renewable electricity target of 90% of electricity from renewable sources by 2025; and
The development, operation, maintenance and upgrading of new and existing REG activities throughout NewZealand, and the associated benefits of REG, are matters of national significance.
The key expectations for local authorities to meet the objectives of the NPS REG include:
Local authorities are required to adopt a positive and proactive policy response to REG activities in policystatements and plans that applies at national, regional and local levels;
In developing policy and plan provisions, and assessing resource consent applications, heritage orders andnotices of requirement, decision-makers are required to recognise and provide for the cumulative national,regional and local benefits of REG activities;
In developing policy and plan provisions, and assessing resource consent applications, heritage orders andnotices of requirement, decision-makers are required to have particular regard to the practical implications ofachieving New Zealand’s renewable electricity target and the constraints associated with developing,operating, maintaining and upgrading new, existing and consented REG activities;
The NPS REG has immediate effect in considering and determining resource consent applications, heritageorders and notices of requirement; and
Local authorities are encouraged to engage early with electricity generators to understand the issuesassociated with developing, operating, maintaining and upgrading new and existing REG activities, and indeveloping regional and district policies to give effect to the NPS REG.
5.4 Social and Environmental Factors
Public acceptance of the need to reduce the use of fossil fuels is gradually growing and this is reflected in the regulatoryframework detailed in section 5.2 above. However, except for the not insignificant number of early adopters, this doesnot necessarily translate into a willingness to pay a premium for renewable energy.
Arguably, Nelson has more than the national average numbers of early adopters as well as active community groupspromoting sustainable living, such as the Nelson Environmental Centre.
There are a range of sector groups that promote and advocate for renewable energy such as the NZ Wind EnergyAssociation, AWATEA, SEANZ and the Bioenergy Association of NZ. These associations advocate for their sector,disseminate information on the benefits of renewable energy, promote quality standards and provide support to theirmembers.
Security of supply is a concern for the region. Local renewable energy options for Nelson have the potential to lessenthe local impacts of volatile international fossil fuel prices and interruptions to their delivery to the region.
Local renewable energy developments also provide local economic benefits to the community; bring investment,reforestation, skills and jobs to the community.
Renewable energy also has the potential to improve Nelson’s air quality which does not yet fully comply with the NES,despite recent improvement. Solar PV, solar hot water heating and low emission wood fuelled heating systems all havethe potential to further improve the air quality.

Nelson City Renewable Energy Assessment
| 72
P 2P
6 Road Map for Renewable Energy in Nelson6.1 Key Renewable Energy Opportunities in Nelson
The key commercial renewable energy opportunities that could be commercially developed in Nelson City over the next25 years are:
Residential rooftop solar photovoltaics;
Residential solar water heating;
Commercial-scale rooftop photovoltaics and possibly small-scale <100kW commercial solar PV arrays;
Niche micro hydro and biogas at NCC Maitai Dam and Bell Island WWTP facilities;
Embedded energy efficiency through encouraging passive solar design in new housing and retrofittinginsulation and double glazing in existing housing stock during refurbishment;
Small-scale wind turbines and run of river micro-hydro in niche rural off-grid scenarios;
Direct conversion from fossil fuel heating to low-emission wood fuel heating systems;
Niche biodiesel and wood pellet manufacture; and
Limited substitution of transport fuels with electricity via electric and hybrid electric vehicles (via earlyadopters).
Based on currently available information on the available Nelson City renewable resources and projected technologyeconomics relative to alternative energy sources, the following renewable energy technologies are not expected to becommercially developed in Nelson City in the next 25 years:
Large scale woody biomass electricity generation / biofuel facilities;
Utility scale wind turbines / wind farms;
Wave energy converters / wave farms;
Solar PV farms (>500 kW); and
Next generation liquid biofuels based on future surplus low grade woody biomass.
However, while the above list is not anticipated to be economic within the timeframe, this may not prevent earlydevelopers seeking to consent these facilities well ahead of the anticipated commercial timeframe – as has been thecase with some large scale marine energy developments seeking resource consent around the country.
6.2 Meeting the Requirements of NPS REG
The following table summarises the key renewable electricity generation resources in Nelson City and their applicabilityto the city with respect to the NPS REG. While the NPS REG requires that councils provide for small and community-scale renewable electricity generation, it should be noted that, with the exception of solar photovoltaics (which aremost likely to be small-scale and owned by residents or businesses), it is not possible to predict what proportion ofother renewable resources in the City are likely to be developed and owned by the community.
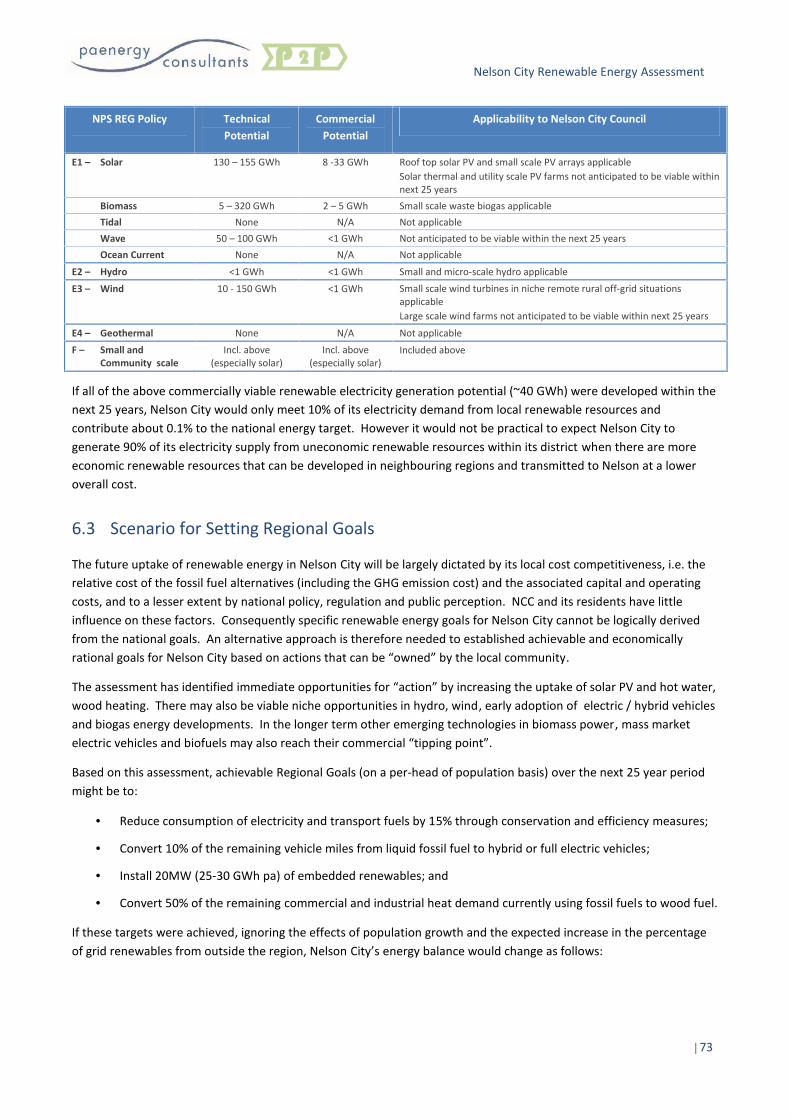
Nelson City Renewable Energy Assessment
| 73
P 2P
NPS REG Policy TechnicalPotential
CommercialPotential
Applicability to Nelson City Council
E1 – Solar 130 – 155 GWh 8 -33 GWh Roof top solar PV and small scale PV arrays applicableSolar thermal and utility scale PV farms not anticipated to be viable withinnext 25 years
Biomass 5 – 320 GWh 2 – 5 GWh Small scale waste biogas applicableTidal None N/A Not applicableWave 50 – 100 GWh <1 GWh Not anticipated to be viable within the next 25 yearsOcean Current None N/A Not applicable
E2 – Hydro <1 GWh <1 GWh Small and micro-scale hydro applicableE3 – Wind 10 - 150 GWh <1 GWh Small scale wind turbines in niche remote rural off-grid situations
applicableLarge scale wind farms not anticipated to be viable within next 25 years
E4 – Geothermal None N/A Not applicableF – Small and
Community scaleIncl. above
(especially solar)Incl. above
(especially solar)Included above
If all of the above commercially viable renewable electricity generation potential (~40 GWh) were developed within thenext 25 years, Nelson City would only meet 10% of its electricity demand from local renewable resources andcontribute about 0.1% to the national energy target. However it would not be practical to expect Nelson City togenerate 90% of its electricity supply from uneconomic renewable resources within its district when there are moreeconomic renewable resources that can be developed in neighbouring regions and transmitted to Nelson at a loweroverall cost.
6.3 Scenario for Setting Regional Goals
The future uptake of renewable energy in Nelson City will be largely dictated by its local cost competitiveness, i.e. therelative cost of the fossil fuel alternatives (including the GHG emission cost) and the associated capital and operatingcosts, and to a lesser extent by national policy, regulation and public perception. NCC and its residents have littleinfluence on these factors. Consequently specific renewable energy goals for Nelson City cannot be logically derivedfrom the national goals. An alternative approach is therefore needed to established achievable and economicallyrational goals for Nelson City based on actions that can be “owned” by the local community.
The assessment has identified immediate opportunities for “action” by increasing the uptake of solar PV and hot water,wood heating. There may also be viable niche opportunities in hydro, wind, early adoption of electric / hybrid vehiclesand biogas energy developments. In the longer term other emerging technologies in biomass power, mass marketelectric vehicles and biofuels may also reach their commercial “tipping point”.
Based on this assessment, achievable Regional Goals (on a per-head of population basis) over the next 25 year periodmight be to:
Reduce consumption of electricity and transport fuels by 15% through conservation and efficiency measures;
Convert 10% of the remaining vehicle miles from liquid fossil fuel to hybrid or full electric vehicles;
Install 20MW (25-30 GWh pa) of embedded renewables; and
Convert 50% of the remaining commercial and industrial heat demand currently using fossil fuels to wood fuel.
If these targets were achieved, ignoring the effects of population growth and the expected increase in the percentageof grid renewables from outside the region, Nelson City’s energy balance would change as follows:

Nelson City Renewable Energy Assessment
| 74
P 2P
Figure GG - Impact on Nelson City Energy Use from Possible 2030 Targets
Overall the sustainability indicators for Nelson would be improved as follows:
KPI Units Current By 20331 Change
Overall energy use PJ/y 4.1 3.5 16% reductionOverall GHG emissions kt CO2e/y 233 167 28% reduction
Renewable energy share 29% 40% 11% increase1. With illustrative targets achieved.
The above scenario is intended to promote discussion on possible targets that could be adopted by NCC and itsresidents. The targets used for the scenario comparison are not recommendations, rather chosen to illustrate whatmight be possible with a concerted action plan.
6.4 Role for Nelson City Council
NCC already appears to have a progressive policy for encouraging sustainability and renewable energy. However morecan be done in the city, for example:
6.4.1 General Setting clear and achievable goals for renewable energy uptake;
Waiving or reducing building or resource consenting fees for small-scale renewable energy installations wherethe activity is not a permitted use under the Nelson Resource Management Plan (e.g. micro scale windturbines)35;
Leading by example, by ensuring that renewable energy opportunities within NCC’s operations are fullyinvestigated and undertaken if commercially viable;
Facilitating buyer clusters (e.g. schools, business groups) to achieve economies of scale for standard PVsolutions or physical clusters of wood to heat users;
Encouraging better and more efficient residential and commercial building design;
Influencing Nelson Electricity and Network Tasman to minimise the barriers for connection of embeddedgeneration and to proactively encourage these opportunities, including potentially providing financial support;
35 NCC already waives building consent fees for SHW and rooftop PV does not normally require a building or resource consent

Nelson City Renewable Energy Assessment
| 75
P 2P
Continuing to promote sustainability and public education: collaborating with interested parties such as EECA,NEC, Tasman District and industry associations; and
Encouraging private sector investment in renewable energy supply and technology development within thecity.
6.4.2 Solar PV and Hot Water Investigation opportunities to install Solar PV on council facilities and remote stations where the technology is
approaching the grid supply costs; and
Encourage private sector low interest financing of residential solar PV and solar hot water system e.g. KiwibankSustainable Energy Loans.
6.4.3 Wind Support the establishment of 10m wind masts at elevated sites to build up long term wind data and make
provisions relating to erection of 10 to 80m masts for wind monitoring;
Ensure that any noise restrictions for large and small scale wind turbines in the Plan are consistent with thenew NZS 6808:2010 standard for assessing noise; and
Determine whether any ridgelines and hilltops in the district should have restrictions on wind turbines tomanage visual effects on local community and mark on District Plan.
6.4.4 Hydro Update the pre-feasibility study for Maitai hydro dam;
Support the development of the Waimea Community Dam in the Tasman District; and
Encourage / support the responsible development of hydro in the top of the South and West coast thatimprove security of supply and reduce regional wholesale electricity prices.
6.4.5 Bioenergy Actively promote wood to heat uptake as a priority sustainability measure (subject to meeting air quality goals
within the urban area);
Revise the Air Quality Plan to accommodate new generation domestic wood burning appliances, if and whenthese become commercially available, and where these are shown to meeting acceptable emissionsperformance standards in “real life situations”: i.e. similar or superior to ultra-low emission pellet burners;
Consider treating the use of seasoned wood chip as similar to wood pellets, if air emissions are demonstratedas equivalent or better;
Encouraging the development of a reliable wood fuel (seasoned wood chip and pellets) supply chain in theNelson Tasman region; and
Update the pre-feasibility study for the biogas power generation options associated with the Bell IslandWWTP.
6.4.6 Transport Planning for and promoting the future use of electric vehicles (including plug-in hybrids and electric
motorbikes) and establishing facilities for their road use, parking and recharging; and
Consider demonstration electric (or hybrid-electric) vehicles as part of NCC operations (assuming these couldbe funded / sponsored by third parties such as EV manufacturers or energy companies whilst the cost is stillrelatively expensive).

Nelson City Renewable Energy Assessment
| 76
P 2P
7 Glossary of TermsGeneral
AC Alternating Current
BIGCC Biomass integrated gasification and combined cycle power generation
CapacityFactor
The amount of electricity generated by a facility over the course of a year divided by the totalamount it could potentially generate if it ran continuously at full capacity
CHPCombined heat and power - also commonly known as cogeneration, is the generation of bothheat and electricity in a single plant
DC / HVDC
Direct current / high voltage direct current transmission. Used for the bulk transmission ofelectricity from point to point. In New Zealand, the HVDC transmission network links the SouthIsland (at Benmore power station) to the North Island (at Haywards substation), and typicallyflows from south to north.
GCVGross Calorific Value - the amount of heat produced by the complete combustion of a material orfuel measured in units of energy per amount of material
GHGemissions
Greenhouse Gas emissions– referring to emissions of greenhouse gases produced from humanactivity including carbon dioxide, methane, nitrous oxide and some synthetic industrial gases
GXPGrid exit point – the interconnection point between local electricity lines companies (e.g. NelsonElectricity, Network Tasman) and the national grid (Transpower)
ICE Internal combustion engine
LCOELevelised Cost of Energy ($/kWh) - the price at which electricity must be generated from aspecific source to break even over the lifetime of the project
LFG Landfill gas – a complex mix of gases (including methane) produced by the action of micro-organisms on organic material in a landfill
LPG Liquefied petroleum gas – typically propane or butane derived from refining petroleum ornatural gas
MfE Ministry for the Environment
MBIE Ministry of Business, Innovation and Employment – incorporates former agencies of Ministry ofEconomic Development (MED), Ministry of Science and Innovation, Department of Building andHousing, and Department of Labour
MSW Municipal Solid Waste – commonly referred to as trash or garbage (everyday items discarded bythe public)
Nelson City The territorial area under control of Nelson City Council
Nelson /TasmanRegion
The region including Nelson City and Tasman District
ORC Organic Rankine Cycle – uses an organic fluid with a lower boiling point than water-steam to

Nelson City Renewable Energy Assessment
| 77
P 2P
recover heat from lower temperature sources such as biomass combustion, industrial waste heatand low temperature geothermal
PV Photovoltaic – photovoltaic solar panels convert light energy (photons) from the sun to electricityutilising the photovoltaic effect (creation of voltage or electric current in a material uponexposure to light)
SHW Solar hot water system
ThermalGeneration
In the context of this report, refers to conventional power generation sources that rely on fossilfuels such as coal, oil or natural gas.
Transpower State owned enterprise that owns and operates the National Grid
Power Units
kW Kilowatt - unit of power equivalent to 1,000 Watts
MW Megawatt - unit of power equivalent to 1,000,000 Watts
MVA Mega Volt Ampere – unit of apparent power equivalent to 1,000,000 volt amperes (the unit usedfor the apparent power in an alternating current electrical circuit, equal to the product of root-mean-square (RMS) voltage and RMS current). In alternating current systems when voltage andcurrent are in phase (i.e. unity power factor), the apparent power (MVA) will be equal to the realor active power (MW)
Energy Units
kWh Kilowatt hour – unit of energy equal to the energy converted or consumed at the rate of 1,000Watts in one hour
MWh Megawatt hour - unit of energy equal to the energy converted or consumed at the rate of1,000,000 Watts in one hour
GWh Gigawatt hour - unit of energy equal to the energy converted or consumed at the rate of 1 x 10⁹
Watts in one hour
TWh Terawatt hour - unit of energy equal to the energy converted or consumed at the rate of 1 x 10¹²
Watts in one hour
GJ Gigajoules – measure of energy equal to 1 x 10⁹ Joules, and also equal to 277.8 MWh
PJ Petajoules – measure of energy equal to 1 x 10¹⁵ Joules

Nelson City Renewable Energy Assessment
| 78
P 2P
8 ReferencesAEA Group. (2009). Carbon Factors for Wood Fuels for the Supply Obligation. UK: DEFRA.
Bloomberg New Energy Finance. (2012). PV Market Outlook Q1 2012 (6 Feb 2012).
Bloomberg New Energy Finance. (2012). Q1 2012 Australia REC Market Outlook (12 Apr 2012). Bloomberg.
BRANZ. (2010). Energy Use in New Zealand Households - Final Report on the Household Energy End-use Project (HEEP). RetrievedMarch 13, 2013, from BRANZ:http://www.branz.co.nz/cms_show_download.php?id=a9f5f2812c5d7d3d53fdaba15f2c14d591749353
Carbon Trust. (2011, July). Accelerating Marine Energy - The Potential for Cost Reduction - Insights from the Carbon Trust MarineEnergy Accelerator. Retrieved March 12, 2013, from Carbon Trust: http://www.carbontrust.com/media/5675/ctc797.pdf
Citipower. (1990). Maitai Hydro Project - Feasibility Study.
Cleantech News. (2013, January). Online article. Retrieved from www.cleantechnia.com.
CleanTechnica. (2012, February 8). Installed Wind Power Capacity Up 21% Globally in 2011. Retrieved March 5, 2013, fromCleanTechnica: http://cleantechnica.com/2012/02/08/installed-wind-power-capacity-world/
Covec. (2010, May). Carbon Price Forecasts - Prepared for Parliamentary Commissioner for the Environment. Retrieved Mar 3, 2013,from Parliamentary Commissioner for the Environment: http://www.pce.parliament.nz/assets/Uploads/Covec-Final-Report-19-07-10.pdf
Deloitte. (2011). Economics of wind development in New Zealand. Retrieved March 5, 2013, from NZ Wind Energy Association:http://www.windenergy.org.nz/documents/economicsnz.pdf
East Harbour Management Services. (2004, January). Waters of National Importance - Identification of Potential HydroelectricResources. Retrieved March 7, 2013, from East Harbour Energy: http://www.eastharbour.co.nz/assets/pdfs/Waters-of-National-importance-identification-of-Hydroelec-resources.pdf
EECA. (2009). Small Wind Turbines. Retrieved March 6, 2013, from EECA Energywise: http://www.energywise.govt.nz/your-home/generating-your-own-energy/wind
EECA. (2012, May 24). Phil Heatley: Thousands more NZ homes to be insulated. Retrieved March 13, 2013, from EECA:http://www.eeca.govt.nz/news/phil-heatley-thousands-more-nz-homes-be-insulated
EECA. (2013). Electric vehicles. Retrieved March 31, 2013, from EECA EnergyWise: http://www.energywise.govt.nz/your-vehicle/new-technologies/electric-vehicles
EECA EnergyWise Renewables. (2007, October). Passive Solar Design for New Zealand Homes. Retrieved March 13, 2013, fromEcotect: http://www.ecotect.co.nz/PDF/eecapsfs.pdf (no longer available on EECA website)
Electricity Authority. (2012, September). Supplementary Material - Generating Station List. Retrieved February 25, 2013, fromElectricity Authority - Centralised Data Set: http://www.ea.govt.nz/dmsdocument/8621
Electricity Authority. (2013). Electricity Demand by GXP. Retrieved February 25, 2013, from Electricity Authority - Centralised DataSet: http://www.ea.govt.nz/industry/monitoring/cds/centralised-dataset-web-interface/electricity-demand-by-gxp/
EMEC. (2011). Tidal Devices. Retrieved March 12, 2013, from European Marine Energy Centre: http://www.emec.org.uk/marine-energy/tidal-devices/
EMEC. (2012). Wave Devices. Retrieved March 11, 2013, from European Marine Energy Centre: http://www.emec.org.uk/marine-energy/wave-devices/
Global Wind Energy Council. (2013, Feb 11). Global installed wind power capacity in 2012 - Regional Distribution. Retrieved March 6,2013, from Global Wind Energy Council: http://www.gwec.net/global-figures/graphs/
Hendrickson, M. (2013, Mar 4). Email Correspondence (Network Tasman).
Nelson City Renewable Energy Assessment
| 79
P 2P
John Cook & Associates et al. (2011, June). Waimea Community Dam Economic Impact Analysis. Retrieved March 7, 2013, fromNelson Region Economic Development Agency: http://www.eda.co.nz/reports-produced-nreda#WaimeaDam_Analysis_Report
Kiwibank. (2013). Sustainable Energy Loan. Retrieved March 22, 2013, from Kiwibank: http://www.kiwibank.co.nz/personal-banking/home-loans/home-loan-options/sustainable-energy-loan.asp
Landau, C. (2012, July 18). Optimum Tilt of Solar Panels. Retrieved 3 14, 2013, from MacsLab:http://www.macslab.com/optsolar.html
Manawatu Standard. (2013, March 5). $240,000 solar farm for city hall. Retrieved March 6, 2013, from Stuff.co.nz:http://www.stuff.co.nz/manawatu-standard/news/8382391/240-000-solar-farm-for-city-hall
Marine Current Turbines. (2013). Technology Development. Retrieved March 8, 2013, from Marine Current Turbines:http://www.marineturbines.com/SeaGen-Products
MBIE. (2011). NZ Energy Outlook 2011. Wellington: Ministry of Business Innovation and Employment.
MBIE. (2012). NZ Energy Data File 2011. Wellington: Ministry of Business, Innovation and Employment.
Meridian Energy. (2006). Options Choices Decisions - Understanding the Options for Making Decisions about New Zealand's ElectricityFuture. Retrieved March 5, 2013, from Meridian Energy:http://www.meridianenergy.co.nz/assets/PDF/Company/Investors/Reports-and-presentations/Other-reports-and-documents/optionschoicesdecisions_210152_1.PDF
Meridian Energy USA. (2013, March 11). Sheep Grazing at CalRENEW-1 (courtesy of Jake Rudisill, VP Operations). Mendota,California, USA.
Meteonorm. (2013). Meteonorm 7.0 Software. Retrieved March 14, 2013, from Meteonorm: http://meteonorm.com/
MetOcean Solutions Ltd. (2008, May). Marine Energy Resources - Ocean wave and tidal current resources in New Zealand. RetrievedMar 8, 2013, from MetOcean: http://www.metocean.co.nz/wp-content/uploads/2011/09/NZ-Marine-Energy-Resources-2008-Rev1.pdf
Ministry for the Environment. (2011, Nov). National Policy Statement for Renewable Electricity Generation 2011 - ImplementationGuide. Retrieved May 28, 2013, from http://www.mfe.govt.nz/publications/rma/nps-renewable-electricity-generation-guide-2011/
Ministry of Agriculture and Fisheries. (2006). Nelson Marlborough Forest Industry and Wood Availability Report. Wellington.
Ministry of Agriculture and Forestry. (2008). 2008 Exotic Forest Ownership/Management Nelson/Marlborough Wood Supply Region.Retrieved March 1, 2013, from Ministry of Primary Industries:http://www.mpi.govt.nz/portals/0/documents/forestry/forestry-nz/forest-mapping/forestOwn_nelsonMarl.pdf
Ministry of Primary Industries. (2012). National Exotic Forest Description . Wellington.
Nelson City Council. (2008, Nov 3). Nelson Air Quality Plan - Chapter 1. Retrieved from Nelson City Council:http://www.nelsoncitycouncil.co.nz/assets/Our-council/Downloads/air-quality-plan/A1%20About%20this%20Document.pdf
Nelson City Council. (2012). Nelson - Demographics and Population Projections - November 2012. Nelson: Nelson City Council.
Nelson City Council. (2012, August). Water Supply Asset Management Plan 2012-2022. Retrieved March 8, 2013, from Nelson CityCouncil: http://www.nelsoncitycouncil.co.nz/assets/Our-council/Downloads/2013-AMPs/RADn1380555v1WaterSupplyAssetManagementPlan2012-2022-Adopted20Sept2012.pdf
Nelson City Council. (Feb 2013). Nelson 2060 - Framing our Future. Nelson: Draft.
Nelson City Fitness. (2013). Nelson City Fitness - System. Retrieved March 13, 2013, from Splash Monitoring:http://www.splashmonitoring.com/system/Nelson-City-Fitness
Nelson Electricity Ltd. (2013, March 12). Email correspondence with Stu Reed, Asset Manager.

Nelson City Renewable Energy Assessment
| 80
P 2P
Network Tasman Ltd. (2012, Apr 1). Asset Management Plan (1 Apr 2012 to 31 Mar 2022). Retrieved February 19, 2013, fromNetwork Tasman: http://www.networktasman.co.nz/Disclosures/AMP%202012-2022.pdf
New Zealand Wind Energy Association. (2010, February). The New Zealand Wind Farm Noise Standard - Fact Sheet. Retrieved March6, 2013, from New Zealand Wind Energy Association: http://www.windenergy.org.nz/documents/factsheets/nzs6808.pdf
New Zealand Wind Energy Association. (2011, January). Lulworth wind farm. Retrieved February 26, 2013, from NZWEA:http://windenergy.org.nz/nz-wind-farms/operating-wind-farms/lulworth
New Zealand Wind Energy Association. (2012, April). Wind Energy 2030 - The Growing Role for Wind Energy in New Zealand'sElectricity System. Retrieved March 5, 2013, from NZ Wind Energy Association:http://windenergy.org.nz/images/stories/wind-energy/Wind_Energy_2030_Document_Web.pdf
New Zealand Wind Energy Association. (2013). Wind farms operating and under construction. Retrieved March 6, 2013, from NewZealand Wind Energy Association: http://windenergy.org.nz/nz-wind-farms/operating-wind-farms
NIWA et al. (2009, June). New Zealand's EnergyScape - Section 2 Renewable Resources. Retrieved March 4, 2013, from Energy Scape -Outputs Analysis: http://www.niwa.co.nz/sites/default/files/imported/__data/assets/pdf_file/0006/95523/EnergyScape-Basis-Review-Section-2-_Renewables__E.pdf#Renewable%20resources
Power Technology. (2012). Greenough River Solar Farm, Western Australia, Australia. Retrieved March 28, 2013, from PowerTechnology: http://www.power-technology.com/projects/greenough-river-solar-farm-western-australia/
PowerSmart Solar. (2012). Project Info - NIWA - Nelson, New Zealand. Retrieved March 14, 2013, from PowerSmart Solar:http://powersmartsolar.co.nz/our_projects/id/187/NIWA%20-%20NELSON%20NEW%20ZEALAND
Renewable Energy World. (2013, February 12). 100 GW of Solar PV Now Installed in the World Today. Retrieved March 14, 2013,from Renewable Energy World: http://www.renewableenergyworld.com/rea/news/article/2013/02/100-gw-of-solar-pv-now-installed-in-the-world-today
RETScreen International. (2013). RETScreen 4 Software. Retrieved from http://www.retscreen.net/ang/home.php
Righthouse. (2013). Solar Water Heating. Retrieved March 13, 2013, from Righthouse: http://www.righthouse.co.nz/products/hot-water/solar
RWE npower renewables. (2012, July). Wind Turbine Power Calculations. Retrieved March 5, 2013, from The Royal Academy ofEngineering: http://www.raeng.org.uk/education/diploma/maths/pdf/exemplars_advanced/23_wind_turbine.pdf
Scion, P. H. (2007). Bioenergy Options for New Zealand - Situation Analysis. Rotorua: Scion.
SEAI. (1997, Feb). General Information Report - Passive Solar Estate Layout. Retrieved March 13, 2013, from Sustainable EnergyAuthority of Ireland:http://www.seai.ie/Archive1/Low_Carbon_Homes_Programme/Best_Practice_Guides/GIR027_Passive_solar_estate_layout_Feb_1997_.pdf
Sinclair Knight Merz. (2006). Renewable Energy Assessment - Tasman District. Tasman: EECA.
Tasman District Council. (2013). River Flow. Retrieved March 7, 2013, from Tasman District Council:http://www.tasman.govt.nz/environment/water/rivers/river-flow/
Te Ara. (1966). Tasman Bay. (A. H. McLintock, Editor) Retrieved March 12, 2013, from An Encyclopedia of New Zealand 1966:http://www.teara.govt.nz/en/1966/tasman-bay
The Guardian. (2013, March 13). Surge in renewable energy as solar panel prices plummet. Retrieved March 14, 2013, from TheGuardian: http://www.guardian.co.uk/environment/2013/mar/13/surge-renewable-energy-solar-panel
The Prow. (2008). Roding Valley Waterworks. Retrieved March 7, 2013, from The Prow: http://www.theprow.org.nz/roding-valley-waterworks/#.UTgD7TBqk20
The Prow. (2009). Maitai Dam. Retrieved March 7, 2013, from The Prow - : http://www.theprow.org.nz/maitai-dam/#.UTfDiDBqk21

Nelson City Renewable Energy Assessment
| 81
P 2P
Vestas. (2012, September 17). Vestas launches new V126-3.0 MW turbine with structural shell blade design. Retrieved March 5,2013, from Vestas: http://www.vestas.com/en/media/news/news-display.aspx?action=3&NewsID=3153
Waste Solutions . (2007). Preliminary Assessment of Anaerobic Digestion for Bell Island WWTP. NRSBU.
Wikipedia. (2007, December 30). Hydroelectric dam. Retrieved Mar 7, 2013, from Wikipedia:http://en.wikipedia.org/wiki/File:Hydroelectric_dam.svg

Appendix A Resource Maps

Nelson City Renewable Energy Assessment
| 83
P 2P
SOLAR
Figure HH – Potential Solar Power Density (NIWA et al., 2009)

Nelson City Renewable Energy Assessment
| 84
P 2P
BIOMASS
Figure II – 2008 Exotic Forest Ownership / Management in Nelson / Marlborough Region (Ministry of Agriculture and Forestry, 2008)
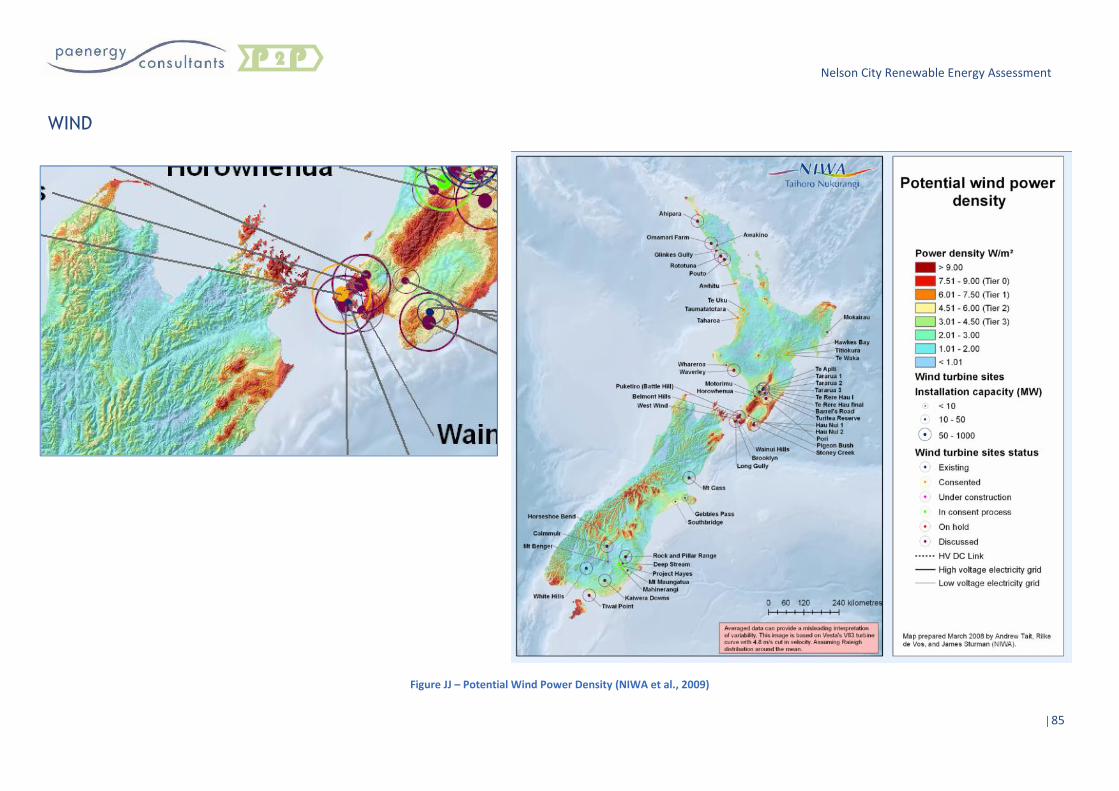
Nelson City Renewable Energy Assessment
| 85
P 2P
WIND
Figure JJ – Potential Wind Power Density (NIWA et al., 2009)

Nelson City Renewable Energy Assessment
| 86
P 2P
WAVE ENERGY
Figure KK – Potential Wave Energy – Peak Flux Magnitude (kW/m) (NIWA et al., 2009)

Nelson City Renewable Energy Assessment
| 87
P 2P
OCEAN CURRENT
Figure LL – Potential Tidal Power Density (NIWA et al., 2009)