SolarFarmer User Guide - Renewable Energy Software
77
DNV GL Headquarters, Veritasveien 1, P.O.Box 300, 1322 Høvik, Norway. Tel: +47 67 57 99 00. www.dnvgl.com SolarFarmer User Guide Document Version: 1.9 Document Date: 22nd October 2019 DISCLAIMER Acceptance of this document by the client is on the basis that Garrad Hassan & Partners Ltd is not in any way to be held responsible for the application or use made of the findings of the results from the analysis and that such responsibility remains with the client. COPYRIGHT All rights reserved. Duplications of this document in any form are not allowed unless agreed in writing by Garrad Hassan & Partners Ltd. © 2019 Garrad Hassan & Partners Ltd. DNV GL One Linear Park, Avon Street, Temple Quay, Bristol, BS2 0PS, UK www.dnvgl.com
-
Upload
khangminh22 -
Category
Documents
-
view
2 -
download
0
Transcript of SolarFarmer User Guide - Renewable Energy Software

DNV GL Headquarters, Veritasveien 1, P.O.Box 300, 1322 Høvik, Norway. Tel: +47 67 57 99 00. www.dnvgl.com
SolarFarmer User Guide
Document Version: 1.9
Document Date: 22nd October 2019 DISCLAIMER
Acceptance of this document by the client is on the basis that Garrad Hassan & Partners Ltd is not in any way to be held responsible for the application or use made of the findings of the results from the analysis and that such responsibility remains with the client. COPYRIGHT
All rights reserved. Duplications of this document in any form are not allowed unless agreed in writing by Garrad Hassan & Partners Ltd.
© 2019 Garrad Hassan & Partners Ltd.
DNV GL One Linear Park, Avon Street, Temple Quay, Bristol, BS2 0PS, UK www.dnvgl.com
SolarFarmer User Guide Page 2 of 77
1 INTRODUCTION .............................................................................................................. 4
1.1 Installation 4 1.1.1 System Requirements 4
1.2 Licensing 4
1.3 General User Interface Principles 5 1.3.1 Workbook 6 1.3.2 Working with the Map 6
2 SETUP SITE ................................................................................................................... 7
2.1 Site Location 7
2.2 Map Backgrounds/Terrain 7 2.2.1 Map Backgrounds 7 2.2.2 Terrain 8
2.3 Horizon Line 8 2.3.1 Generating a Horizon 8
3 DEFINE CLIMATE .......................................................................................................... 10
3.1 Solar Resources 10
3.2 Albedo 10
4 DEFINE SHADING OBSTACLES ....................................................................................... 11
4.1 Shading Obstacles 11 4.1.1 Add Pre-defined 3D Objects 11 4.1.2 Define Simple Boundary-Based Shading Objects 11
5 DEFINE COMPONENTS ................................................................................................... 13
5.1 PV Modules 13 5.1.1 Import from a PAN File 13 5.1.2 Defining the Properties 13
5.2 Inverters 14 5.2.1 Importing Inverter Specifications 14 5.2.2 Defining the Properties 14 5.2.3 Exporting Inverter Specifications 14
5.3 String Length 14
5.4 Racks 14 5.4.1 Rack System Properties 15 5.4.2 Rack Specifications 15
5.5 Trackers 15 5.5.1 Tracker System Properties 15 5.5.2 Tracker Specifications 16
5.6 Inverter Blocks 16 5.6.1 Adding Inverter Blocks 16
5.7 Transformers 18
6 LAY OUT PLANT ............................................................................................................ 19
6.1 Design Layout 19 6.1.1 Site Layouts 19 6.1.2 Layout Regions 20 6.1.3 Adding Transformers 25 6.1.4 Adding Central Inverters 25 6.1.5 Assigning Strings to Central Inverters 26 6.1.6 Adding String Inverters 27 6.1.7 Formatting Inverter Blocks 29 6.1.8 Adding Inverter Blocks to a Layout Region 32 6.1.9 Site Statistics Dialog 35 6.1.10 Generic Layout 35
6.2 Electrical Configuration 40
SolarFarmer User Guide Page 3 of 77
6.3 Review Trackers 40
6.4 Review Shading 41
7 CALCULATE ENERGY ..................................................................................................... 43
7.1 Setup Yield Calculation 43 7.1.1 Simple Model vs Full Model 44 7.1.2 Performance Statistics 44
7.2 Yield Results 44
7.3 Effects Diagram 45
8 CREATE REPORT ........................................................................................................... 46
8.1 Create Report 46
9 MISCELLANEOUS .......................................................................................................... 47
9.1 Scripting 47 9.1.1 ‘Workbook’ for accessing the workbook settings 47 9.1.2 ‘Toolbox’ for accessing the calculation toolbox 48 9.1.3 Scripting in Future 48
9.2 Automatic results export 48
10 USEFUL HINTS AND TIPS ............................................................................................... 49
10.1 Working with the Map 49 10.1.1 Map Toolbar 49 10.1.2 Map Layers 49 10.1.3 3D Mode 50 10.1.4 Elevation Profile Tool 52
10.2 Export to PVsyst 54 10.2.1 Important things to note before laying out a site 54 10.2.2 Using the UI Dialog 55 10.2.3 Using Scripting 56 10.2.4 Importing the Project into PVsyst 57
11 HELP AND SUPPORT ...................................................................................................... 62
11.1 Support Email 62
11.2 User Portal Page 62
11.3 Log Files 62
11.4 System Information Page 63
11.5 About Box 63
APPENDIX A GLOSSARY AND DEFINITIONS ............................................................................... 64
APPENDIX B TRANSFERRING A SOFTWARE LICENSE .................................................................. 69
APPENDIX C RUN SOLARFARMER FROM THE COMMAND LINE ...................................................... 70
APPENDIX D SPECIFIC SCRIPTING EXAMPLES ............................................................................ 71

SolarFarmer User Guide Page 4 of 77
1 INTRODUCTION
SolarFarmer is DNV GL’s Solar PV modelling software. It combines thoroughly-validated PV simulation
algorithms with a modern, attractive and efficient user interface allowing quick configuration of designs
and detailed simulation of PV layouts.
We will be publishing validation papers to demonstrate the accuracy of the simulations to the industry as
we work towards industry acceptance of the software.
This is a user guide to help you get started with using the SolarFarmer application.
1.1 Installation
The installer contains everything you need to install and run SolarFarmer on your machine.
You can download the latest SolarFarmer installer from the portal web site:
1. Request SolarFarmer Portal access by emailing [email protected].
2. Once they’ve replied, access the DNV GL Renewable Energy Software portal page here:
https://renewableenergysoftwareportal.dnvgl.com/
3. Click on the SolarFarmer icon on the portal’s home page to take you to the SolarFarmer page.
4. Download the installer and double-click to install (Administrator permissions will be needed).
1.1.1 System Requirements
SolarFarmer is designed to run on a PC with the following specifications:
Minimum System Requirements:
OS Windows 7 or Windows 10
Processor 2GHz processor or above
RAM 8GB
Graphics card DirectX 9 or later (NOT on-board graphics)
Resolution 1280 x 1024
Mouse Mouse with mouse wheel
Recommended System Requirements:
OS Windows 10
Processor 3GHz processor or above
RAM 16GB (or more)
Graphics card NVIDIA Quadro K600 equivalent or above
Resolution 1920 x 1200
1.2 Licensing
SolarFarmer requires that you have a valid Product Key in order to run the software.
1. Install SolarFarmer on your machine (the machine on which you’ll use it).
2. Request a Product Key via the SolarFarmer support email address [email protected].
3. Once you get emailed a Product Key, open the Software License Activation Utility (in the
SolarFarmer program folder in the Windows Start Menu).
4. Paste your unique Product Key into the appropriate text box and click the ‘Activate License’
button (make sure you’re connected to the Internet).
5. After a few seconds SolarFarmer will be licensed to run on that machine.

SolarFarmer User Guide Page 5 of 77
6. Launch SolarFarmer.
See Appendix A for more information on how to transfer a software license to another machine once you
have already installed it.
1.3 General User Interface Principles
The SolarFarmer user interface is designed to step the user through the process of configuring a site
model in a logical and intuitive order whilst allowing easy access to any part of the model at any time.
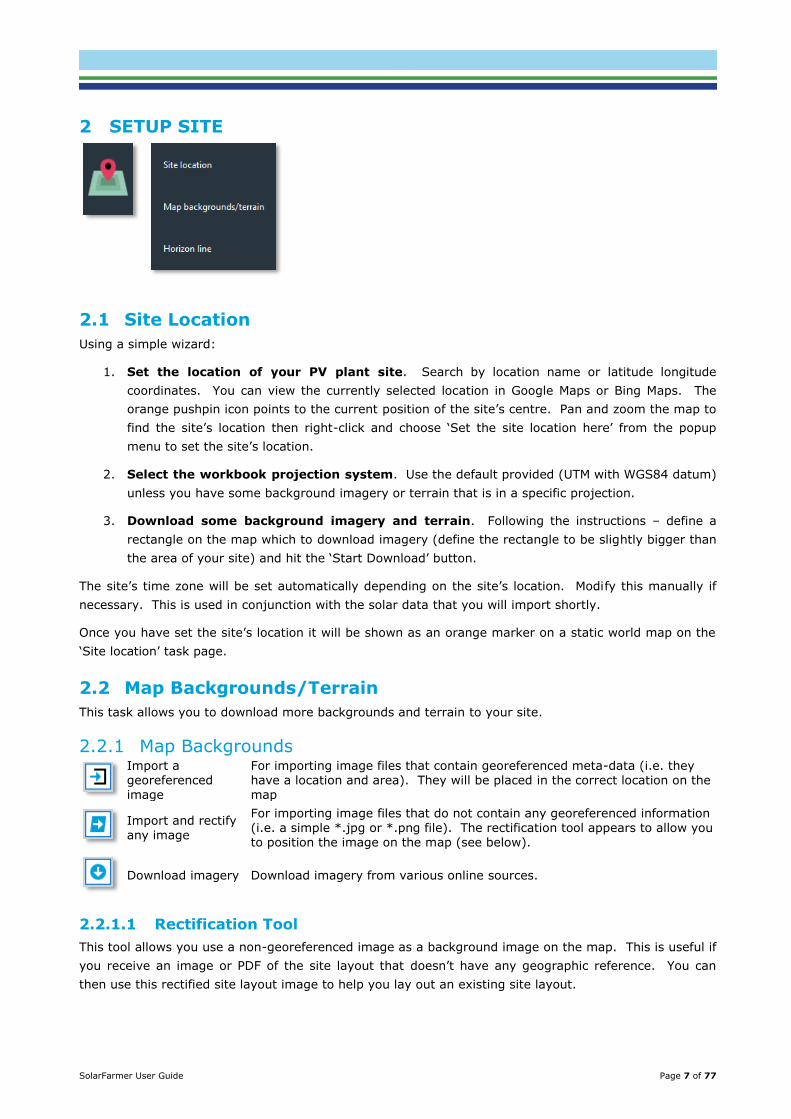
The process is organised into ‘chapters’ symbolized by the large icons on the left of the SolarFarmer
window (highlighted in red below). Each chapter is broken down into ‘tasks’ that appear to the right of
the chapter icons when the chapter is selected highlighted (in green below).
Figure 1 - Chapter and Tasks in the SolarFarmer user interface
Typically, the user will run through the chapters and the task sections within them from top to bottom.
Here’s a quick overview of the functionality available in each chapter:
Setup Site • Set the site’s location and time zone
• Download/import map backgrounds and terrain
• Choose or generate a horizon line for the site
Define Climate • Import solar data to use in the calculation
• Specify albedo values

SolarFarmer User Guide Page 6 of 77
Define Shading
Obstacles
• Import 3D Sketchup objects (Collada format) to use for shading
• Create simple 3D regions that provide shading
Define
Components
• Specify the components that will be used in the PV site: PV Modules, inverters, racks, trackers, inverter blocks, transformers
• Set default string lengths used in the layout
Lay Out Plant • Lay out the racks/trackers in your site
• Add inverters and transformers and lay out strings of modules
• Connect inverters to transformers
• Review shading and tracker behaviour throughout a typical year
Calculate
Energy
• Configure and run the energy yield calculation
• Review the results of the energy yield calculation using tables and
the effects diagram
Create Report • Create XML and Microsoft Word reports of the site data and energy
yield results
1.3.1 Workbook
When choosing the site location, defining components and laying out the site, you can save the current
state in what we call a workbook. This is the equivalent of a project or document in other software
packages; files are saved with a *.sfw extension (SolarFarmer Workbook).
1.3.2 Working with the Map
See Section 10.1 for more details and tips on working with the map in SolarFarmer.
SolarFarmer User Guide Page 7 of 77
2 SETUP SITE
2.1 Site Location
Using a simple wizard:
1. Set the location of your PV plant site. Search by location name or latitude longitude
coordinates. You can view the currently selected location in Google Maps or Bing Maps. The
orange pushpin icon points to the current position of the site’s centre. Pan and zoom the map to
find the site’s location then right-click and choose ‘Set the site location here’ from the popup
menu to set the site’s location.
2. Select the workbook projection system. Use the default provided (UTM with WGS84 datum)
unless you have some background imagery or terrain that is in a specific projection.
3. Download some background imagery and terrain. Following the instructions – define a
rectangle on the map which to download imagery (define the rectangle to be slightly bigger than
the area of your site) and hit the ‘Start Download’ button.
The site’s time zone will be set automatically depending on the site’s location. Modify this manually if
necessary. This is used in conjunction with the solar data that you will import shortly.
Once you have set the site’s location it will be shown as an orange marker on a static world map on the
‘Site location’ task page.
2.2 Map Backgrounds/Terrain
This task allows you to download more backgrounds and terrain to your site.
2.2.1 Map Backgrounds
Import a georeferenced image
For importing image files that contain georeferenced meta-data (i.e. they have a location and area). They will be placed in the correct location on the map
Import and rectify
any image
For importing image files that do not contain any georeferenced information
(i.e. a simple *.jpg or *.png file). The rectification tool appears to allow you to position the image on the map (see below).
Download imagery Download imagery from various online sources.
2.2.1.1 Rectification Tool
This tool allows you use a non-georeferenced image as a background image on the map. This is useful if
you receive an image or PDF of the site layout that doesn’t have any geographic reference. You can
then use this rectified site layout image to help you lay out an existing site layout.
SolarFarmer User Guide Page 8 of 77
The idea is to add control points to the source image and add corresponding control points on the map
(which will have a geographic position) using the downloaded background imagery as a reference. The
software then warps (rectifies) the bitmap image by lining up the corresponding control points and stores
the warped image as a background image.
To use it:
1. Open a source bitmap image. This appears on the top-left of the tool window.
2. Pan and zoom the workbook map (on the top-right of the tool window) to roughly show the same area covered by the source bitmap.
3. Right-click on the source image to add a control point. A corresponding control point appears in the workbook map.
4. Select and drag the corresponding point in the workbook map to the correct geographic location.
5. Add at least 3 controls points to help get the rectification correct.
6. Click the ‘Rectify’ button.
The image will be rectified and added as a background image to the map.
2.2.2 Terrain
Import a terrain file If you have been provided with a specific elevation file for your site you can import it here.
Download terrain
This shows the download wizard where you can download free SRTM (Shuttle Radar Topography Mission) terrain for the selected area. This is generally lower resolution than bought terrain files for your area, but often sufficient.
2.3 Horizon Line
Horizon data is used to tell the energy yield calculation when direct sunlight is/isn’t available to the site,
depending on the position of the sun.
You can import an existing horizon file (from Meteonorm or PVsyst) if you already have one for your site.
Or you can use the terrain data that you have downloaded to generate a horizon for your site. Click on
‘Generate…’ to show the ‘Generate Horizon’ tool.
2.3.1 Generating a Horizon
To generate horizon data for your site click on the ‘Generate…’ button to show the Generate Horizon tool.
The algorithm uses a viewpoint slightly above the ground and renders terrain in all 360° directions from
the near radius to the far radius away from the view location. The terrain inside the near radius is used
in the near-shading model (in the energy yield calculation) and thus isn’t used for the horizon.
A far radius of around 30km is generally sufficient. The dialog will prompt you if you have downloaded
insufficient terrain. Either reduce the far radius so that it covers the available terrain or press the button
to auto-download the terrain required.
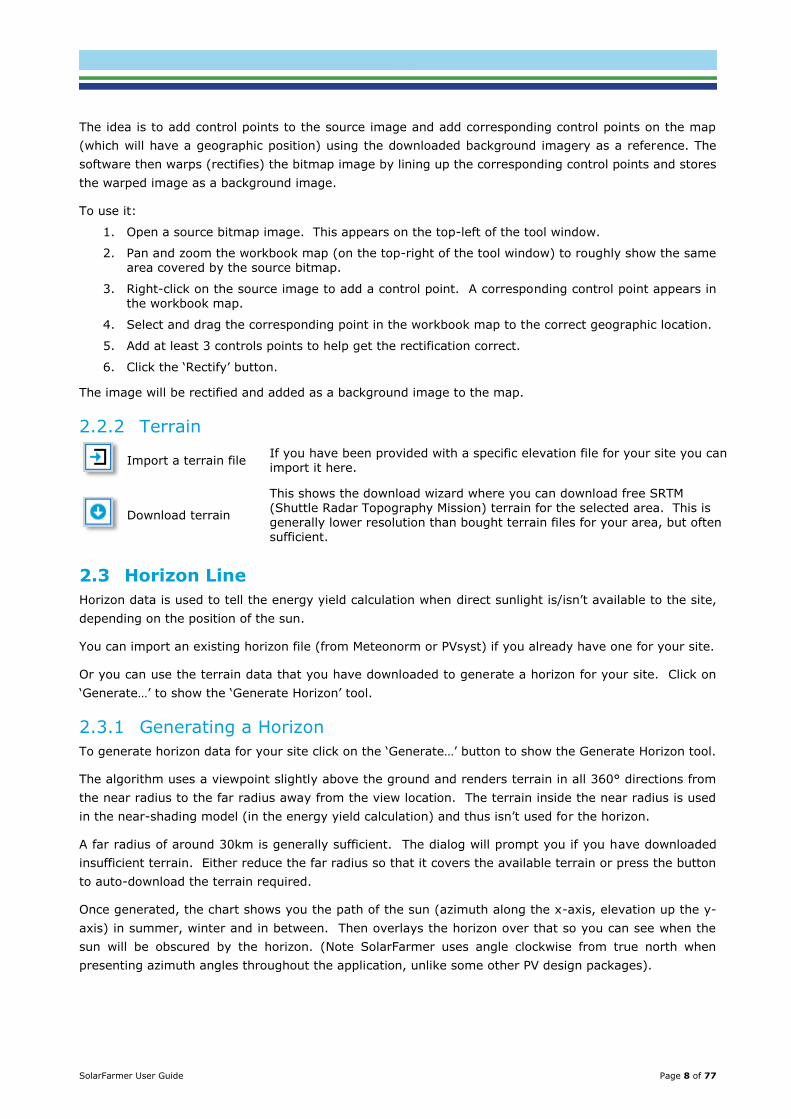
Once generated, the chart shows you the path of the sun (azimuth along the x-axis, elevation up the y-
axis) in summer, winter and in between. Then overlays the horizon over that so you can see when the
sun will be obscured by the horizon. (Note SolarFarmer uses angle clockwise from true north when
presenting azimuth angles throughout the application, unlike some other PV design packages).

SolarFarmer User Guide Page 9 of 77
Figure 2 - Example of sun positions and horizon

SolarFarmer User Guide Page 10 of 77
3 DEFINE CLIMATE
In this chapter climate data affecting the performance of the PV plant are loaded or set.
3.1 Solar Resources
Use this section to load solar resource data to be used in energy yield calculation. Multiple datasets can
be loaded though only one can be used at a time for an individual energy yield calculation.
Several file formats are currently supported by SolarFarmer:
• Meteonorm PVsyst Hourly TMY (*.dat)
• NSRDB TMY3 (*.csv)
• SolarGIS database TMY (*.csv)
• SolarGIS database multi-year (*.csv)
• Tab separated variable, free-format file
• Tab separated variable, Date | POA | Temp | (WS)
• Tab separated variable, Date | DHI | Temp | (WS)
• Tab separated variable, Date | GHI | DHI | Temp | (WS)
Note:
TMY Typical Metrological Year NSRDB National Solar Radiation Database
POA Plane of Array DHI Diffuse Horizontal Irradiance GHI Global Horizontal Irradiance Temp Temperature (in Centigrade) WS Wind Speed (in m/s)
The date/time format in the tab separated variable files must be “yyyy-MM-dd hh:mm” with the time
stamps marking the beginning of the sample periods.
When you select a file, you need to specify the latitude longitude location of the data, along with the
time zone, to help SolarFarmer adjust the data if necessary so it is valid for your site location for files
that do not contain this information.
You will be notified of any validation issues after the import is complete. Consider these carefully before
choosing to use the data with the energy yield calculation.
3.2 Albedo
Albedo is a measure of the reflectivity of a surface, in this case the ground around the PV plant under
analysis. A value of 1.0 indicates perfect reflectivity. A value of 0 indicates complete absorption.
Typical values range from 0.15 for grass to 0.8 for fresh snow.
Specify albedo as either a single annual value or 12 monthly values (if your site has strong seasonal
variation).

SolarFarmer User Guide Page 11 of 77
4 DEFINE SHADING OBSTACLES
4.1 Shading Obstacles
SolarFarmer is built on a full 3D model and shading obstacles can be added to this model in addition to
the terrain data. All these may cause shading effects on the PV modules.
There are two ways to add shading obstacles, described below.
4.1.1 Add Pre-defined 3D Objects
3D objects prepared in other software packages (such as Sketchup) that have been saved in COLLADA
(Collaborative Design Activity) *.dae format can be imported into the SolarFarmer workbook and
positioned in the site. This is particularly suited to complex objects or objects that you want repeated
across the site area.
1. Import the 3D object model into the workbook (click the ‘Import 3D model’ button to select it).
a. The object will be shown in the 3D Model Shading Object Library in the top-left panel.
b. You may add several objects to the library.
2. Select the object in the library that you wish to add an instance of to the map.
3. Select the ‘Located 3D Object’ tool in the map’s toolbar (grey cube with green ‘+’ symbol
highlighted in red below)
4. Click on the map to add an instance of that 3D object at the location you click
a. The map tool reverts to the ‘Select’ tool – click and drag the object to exactly where you
want it.
5. TIP: Hold down the CTRL keyboard key whilst adding 3D objects to maintain the adding object
functionality so you can quickly add multiple objects.
6. Switch the map to 3D mode (the ‘3D button in the top-middle of the map) to view the objects in
3D.
4.1.2 Define Simple Boundary-Based Shading Objects
If you don’t have access to a 3D modelling package, or you just want to create a quick 3D volume to
approximate a forest, hedge or building, you can add a shading region.
1. Click on the ‘Shading region’ button in the map toolbar (green polygon with ‘+’ symbol
highlighted in purple below).
SolarFarmer User Guide Page 12 of 77
2. Click on the map to add points to form a polygon. Finish the polygon by clicking on the first
point you clicked.
a. TIP: You can also double-click on the last point to quickly finish a polygon.
3. A new shading region object is added to the map and also to the table in the ‘Shading Region
Objects’ table in the bottom-left panel.
4. Set the height of the shading region (height above the terrain) and the type:
a. ‘Follows terrain’ means that the height of the volume will be the same above each point.
Useful for forests or hedges whose height you want to follow the terrain.
b. ‘Flat top’ means that the 3D volume will have a horizontal top face. Useful for modelling
simple flat-topped buildings.
5. Again, switch the map to 3D mode to see the 3D volume.
a. TIP: You can adjust the height of the shading regions whilst in 3D mode to fine-tune the
height of the shading regions.

SolarFarmer User Guide Page 13 of 77
5 DEFINE COMPONENTS
This chapter allows you to define the components that will be used in the layout of your site. Think of it
as building a component library.
5.1 PV Modules
This task allows you to define the module specifications that will be used in your site.
5.1.1 Import from a PAN File
You can import a module specification from a PVsyst .PAN file. Only text-based PAN files are supported
(from PVsyst version 6.40 onwards). PAN files in binary format (usually from older versions of PVsyst)
can unfortunately not be read.
5.1.2 Defining the Properties
If you choose to import a PAN file or create a brand-new module specification, you are presented with
multiple properties, organised into groups.
The Electrical Configuration tab contains more electrical-related properties, along with a chart displaying
various properties of the specification.
Any validation errors in the values will be highlighted in red, with additional validation information
appearing at the top in a red (errors) or orange (warnings) drop-down. Any errors must be rectified
before the module specification can be used in the energy yield calculation.
TIP: You can also choose to export the module specification values to a file (.ModuleSpec). This is a
proprietary SolarFarmer format and can be imported into other SolarFarmer workbooks.
5.1.2.1 Bifacial Properties
You can specify whether a module specification is bifacial or not with the properties in the ‘Bifacial’ group
(this is also set automatically when you import from a PAN file). If checked, the module is defined to be
bifacial and will be modelled in the energy calculation.

SolarFarmer User Guide Page 14 of 77
The bifaciality factor is the fraction (in %) of the front side efficiency to convert back side irradiance to
electricity. Other bifacial-related factors (shade, transmission and mismatch factors) are set later for
each layout region.
5.2 Inverters
This task allows you to define the inverter specifications (for both central and string inverters) that will
be used in your site.
5.2.1 Importing Inverter Specifications
There is support for importing PVsyst .OND inverter files (as long as they are in text file format -
generally from PVsyst version 6.40 onwards).
You can also import inverter specifications in SolarFarmer’s proprietary .InverterSpec file format.
5.2.2 Defining the Properties
After creating a brand-new inverter specification or importing a file you are presented with multiple
properties.
Any validation errors in the values will be highlighted in red, with additional validation information
appearing at the top in a red (errors) or orange (warnings) drop-down. Any errors must be rectified
before the inverter specification can be used in the energy yield calculation.
5.2.3 Exporting Inverter Specifications
You can export the inverter specification values to a file (.InverterSpec format - a proprietary
SolarFarmer format and can be imported into other SolarFarmer workbooks). There is currently no
support to export to the PVsyst .OND format.
5.3 String Length
The string length task allows you to define default string lengths for each inverter input/PV module
specification combination.
Once these have been set up, when you come to laying out strings of modules and attaching them to
inverters in the upcoming lay out task, SolarFarmer can use these default string lengths as it creates the
strings.
There is some help in this task to help you determine the optimal string length for the inverter input and
module specification combination, based on some of the component properties. You can choose to use
the suggested string length or use your own.
5.4 Racks
You may know racks as ‘tables’. The concept is the same. We have chosen to use the term ‘rack’ to
mean a structure that a number of PV modules are placed on.

SolarFarmer User Guide Page 15 of 77
5.4.1 Rack System Properties
A rack system is like a family of racks of different lengths. When automatically laying out racks during
the lay out process you choose a rack system and racks of various lengths are used to fill out the layout
region most effectively.
The Module Length and Module Width properties should be the same as the module specification that
you intend to use with the rack system. Click the ‘Use a module specification to set module dimensions…’
button to use the dimensions of an existing module specification.
The Modules Deep value is the number of modules vertically down the rack. This is the same for all
rack specifications in the rack system family.
5.4.2 Rack Specifications
Press the ‘Insert’ button to add a new rack specification to the rack system family.
A rack specification is a specific instance of a rack system of a defined length. Modules Wide is the
number of modules along the rack. You will see a visual representation of the currently selected rack
specification in the lower panel.
You can also specify spacing distances between modules (vertically and horizontally), the spacing
between racks and an optional frame size around each rack.
5.5 Trackers
Trackers refer to single-axis trackers. Similar to rack systems, a tracker system is like a family of
trackers of different lengths.
Single-axis trackers in SolarFarmer are placed on a flat (but not necessarily horizontal) plane over the
terrain - if the terrain is undulating, some trackers will be higher than others. The acceptable tolerances
of the height of the tracker axes are controlled in the properties described below.
5.5.1 Tracker System Properties
Again, the Module Length and Module Width properties should be the same as the module
specification that you intend to use with the tracker system. Click the ‘Use a module specification to set
module dimensions…’ button to use the dimensions of an existing module specification.
Here you define the axis settings:
• Min/max heights above ground – the minimum and maximum heights that the axis can be from
the ground. As described above, as the trackers are all laid out in a flat plane, some may be
higher than others. These parameters control the acceptable tolerances.
• Max rotation angle – the maximum rotation angle (in degrees) from the horizontal that the
tracker panels can rotate around the axis (up to 90°).
• Max tilt along axis – the maximum angle between the axis (along the length of the trackers) and
the horizontal that the trackers can be laid out. If the terrain is undulating the resulting plane
may be at a steeper angle than is allowed.
You also define whether the backtracking algorithm should be used for this tracker system, along with
some frame and module spacing values.

SolarFarmer User Guide Page 16 of 77
There is a cross-section diagram that is updated as up you update the properties to help you understand
why validation issues arise – for example it makes it easier to see if the tracker will hit the ground with
the current settings:
5.5.2 Tracker Specifications
Press the ‘Add’ button to add a new tracker specification to the tracker system family.
Length of tracker row is the number of modules along the length of the tracker. You will see a visual
representation of the currently selected tracker specification in the panel on the right.
5.6 Inverter Blocks
To simplify the construction of some larger PV plants the layout designers design a building block (one
central inverter and associated racks or trackers) and replicate this building block many times over the
area of the site to build the PV plant.
In SolarFarmer we call this building block an inverter block (as it contains just one inverter).
To design and use an inverter block in SolarFarmer:
1. First go to the Lay out plant -> Design layout task and create a layout region containing racks
or trackers, add a central inverter and assign strings on the racks or trackers to the central
inverter.
2. Come back to the Define components -> Inverter blocks task.
3. Add a new inverter block and select the layout region from a list of available layout regions to
use as its template.
4. Go back to the Lay out plant -> Design layout task, add a new layout region and add
instances of the inverter block (either individually or using auto-fill).
5.6.1 Adding Inverter Blocks
Click on the ‘Add new’ button to add a new inverter block. A panel appears (shown below) listing all the
suitable layout regions from all the site layouts in the workbook that can be used as an inverter block
template.

SolarFarmer User Guide Page 17 of 77
Click on the different rows in the table to select that layout region. A summary of its statistics and a
visualisation of the contents is shown to help you pick the right one.
Not all layout regions can be used as inverter block templates. Only those that meet the following
criteria:
• It cannot be empty (it must contain some racks or trackers)
• All the assigned strings must be connected to one central inverter
• The central inverter must not have strings in any other layout region.
• For racks – the azimuth of the layout region must be 0 or 180 (racks must be horizontal)
• For trackers – the system rotation must be 0 (trackers must be vertical).
It will construct a rectangular shape from the layout region (so they tessellate correctly) – so make your
template layout regions rectangular.
Once you have selected the layout region you want, click the ‘Use selected layout region’ button to finish
creating the inverter block. It now shows a visualisation of the inverter block and its statistics:

SolarFarmer User Guide Page 18 of 77
The inverter block is now available in the Lay out plant -> Design layout task to be added to other
layout regions.
5.7 Transformers
This task allows you to define the transformer specifications that will be used in your site.
There are only a few properties to define. A chart updates to show you the transformer performance
depending on the values of the properties.
TIP: You can also choose to export the transformer specification values to a file (*.TransformerSpec).
This is a proprietary SolarFarmer format and can be imported into other SolarFarmer workbooks.
SolarFarmer User Guide Page 19 of 77
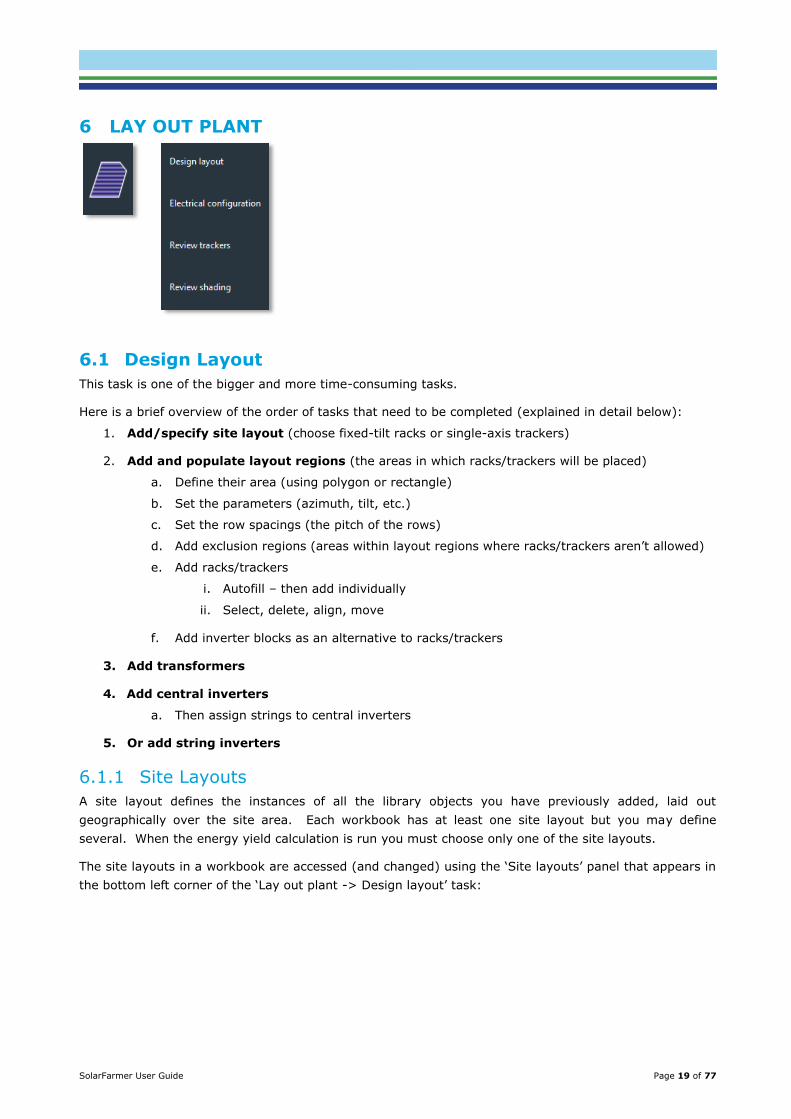
6 LAY OUT PLANT
6.1 Design Layout
This task is one of the bigger and more time-consuming tasks.
Here is a brief overview of the order of tasks that need to be completed (explained in detail below):
1. Add/specify site layout (choose fixed-tilt racks or single-axis trackers)
2. Add and populate layout regions (the areas in which racks/trackers will be placed)
a. Define their area (using polygon or rectangle)
b. Set the parameters (azimuth, tilt, etc.)
c. Set the row spacings (the pitch of the rows)
d. Add exclusion regions (areas within layout regions where racks/trackers aren’t allowed)
e. Add racks/trackers
i. Autofill – then add individually
ii. Select, delete, align, move
f. Add inverter blocks as an alternative to racks/trackers
3. Add transformers
4. Add central inverters
a. Then assign strings to central inverters
5. Or add string inverters
6.1.1 Site Layouts
A site layout defines the instances of all the library objects you have previously added, laid out
geographically over the site area. Each workbook has at least one site layout but you may define
several. When the energy yield calculation is run you must choose only one of the site layouts.
The site layouts in a workbook are accessed (and changed) using the ‘Site layouts’ panel that appears in
the bottom left corner of the ‘Lay out plant -> Design layout’ task:

SolarFarmer User Guide Page 20 of 77
6.1.1.1 Adding a New Site Layout
You can add a new site layout by pressing the ‘Add’ button in the Site Layouts panel. When you add a
new site layout, or the first time you use the default site layout in the workbook, you must choose
whether to work with fixed-tilt racks or single-axis trackers. You cannot mix racks and trackers in the
same site layout.
6.1.1.2 Cloning an Existing Site Layout
If you wish to make an exact copy of an existing site layout (you may then want to slightly modify this
copy) select the site layout you wish to clone, then press the ‘Clone’ button in the Site Layouts panel. A
new site layout will be created that will be an exact copy of the selected site layout.
6.1.1.3 Exporting a Site Layout to Google Earth
You can export the 3D racks or trackers to a Google Earth *.kmz file for viewing in Google Earth. Press
the ‘KMZ’ button in the Site Layouts panel to do this.
6.1.1.4 Generic Layout
You can lay out sites using parameters (rather than draw them out by hand) using the generic layout
functionality. Access this using the ‘Specify…’ button in the Site Layouts panel. See section 6.1.10 for
more details on how to use this.
6.1.2 Layout Regions
For simplicity, the explanations below assume you are laying out a site containing fixed-tilt racks. Most
things are equally applicable to trackers – though trackers tend to be North/South aligned rather than
West/East aligned.
Racks cannot be placed randomly in a site. We define layout regions that will contain rows of racks. The
racks inside a layout region have many of the same properties (azimuth, tilt, rack system). If you wish
to have racks with different properties you must create a separate layout region for these.
6.1.2.1 Adding New Layout Regions
To add a new layout region, click on one of the Layout Region map tools (highlighted in red below):
When adding a polygonal layout region, click to add a new point at each vertex of the required polygon
around the area. For a rectangular layout region, click and drag to delineate the rectangle.

SolarFarmer User Guide Page 21 of 77
TIP: You can also import layout regions from polygonal objects in Shapefiles. Click on the ‘Import…’
button in the Layout Regions tab in the lower panel (highlighted in red below):
Select a Shapefile, select which polygons you wish to import and click ‘Import’.
6.1.2.2 Editing the Shape of Layout Regions
You can edit the shape of a previously added layout region by using the Edit Boundary map tool
(highlighted in red below):
Once selected, click on a layout region to put it in edit mode. You can move (click and drag) existing
points, delete (using the Delete or Backspace keyboard key) existing points, or insert additional points
(click on a boundary line) to the polygon boundaries.
6.1.2.3 Layout region parameters
Each layout region is listed in the table in the Layout Regions tab in the bottom panel.
Rack Layout Parameters:
Azimuth Angle from due North that the tilted racks face (in degrees). 0° means they face due North (typical for southern hemisphere sites) 180° means they face due South (typical for northern hemisphere sites)
Tilt Elevation angle from the horizontal that the racks are tilted (in degrees).
Uc The constant heat transfer component (W/m2K) in this layout region.
Uv The convective heat transfer component (W/m3sK) in this layout region.
Rack System The rack system to use – rack specifications from this family of rack sizes will be used to
populate this layout region.
Shade factor Accounts for shade obstacles like junction boxes and support structures (-100% to 0%).
(Only visible when using bifacial modules).
Transmission factor
Accounts for a fraction of light that reaches the back side due to spaces between modules and racks or transparent sections of the modules and racks (-10% to +10%).
(Only visible when using bifacial modules).

SolarFarmer User Guide Page 22 of 77
Mismatch factor
Accounts for non-uniform backside irradiance (-100% to 0%). (Only visible when using bifacial modules).
Auto fill If this is checked, when a rack system has been selected for this layout region, racks will automatically be laid out along the row positions (dotted row lines). When you edit the layout region boundary, racks will automatically be added/removed to fill the layout region.
If this is not checked, even when you edit the layout region boundary, all existing racks will remain in place - preserving any manual edits you may have made.
Tracker Layout Parameters:
All trackers in a layout region must currently lie on the same plane – the system plane. This is because
the current algorithm for determining the tracker positions assumes they are in the same plane.
Generally trackers are used in flatter sites so this isn’t too much of an issue. Each layout region can
have a different system plane.
When you lay out a layout region for trackers, a system plane is automatically calculated; it tries to find
a best-fit for the underlying terrain that the layout region covers. The system plane is defined by an
azimuth and tilt value. You can manually edit these values – though they may adversely affect the axis
tilt (the tilt from the horizontal along the length of the tracker axis) or the side slope angle (the angle
that subsequent rows of trackers are to their neighbours). If the values are outside acceptable ranges, a
validation error will be given.
System Rotation
Angle from due North that the trackers lie down (in degrees). 0° means they line up along the North/South axis (generally typical).
Uc The constant heat transfer component (W/m2K) for the modules in this layout region.
Uv The convective heat transfer component (W/m3sK) for the modules in this layout region.
Default Aisle Width
The distance (in metres) between each tracker along the direction of the axis.
System Plane Azimuth
The azimuth angle (in degrees) used to define the system plane (see above). This is auto-calculated for you – you can modify the value.
System Plane Tilt
The tilt angle (in degrees) used to define the system plane (see above). This is auto-calculated for you – you can modify the value.
System Plane Validity
(Read-only) An indication that the system plane defined by the azimuth and tilt angles is within acceptable ranges.
Axis Tilt (Read-only) The tilt from the horizontal along the length of the tracker axis (in degrees).
Side Slope (Read-only) The angle from the horizontal that a line of trackers is from its neighbour (in degrees).
Tracker System
The tracker system to use – tracker instances from this family of tracker sizes will be used to populate this layout region.
Shade factor Accounts for shade obstacles like junction boxes and support structures (-100% to 0%). (Only visible when using bifacial modules).
Transmission Accounts for a fraction of light that reaches the back side due to spaces between

SolarFarmer User Guide Page 23 of 77
factor modules and trackers or transparent sections of the modules and trackers (-10% to +10%). (Only visible when using bifacial modules).
Mismatch factor
Accounts for non-uniform backside irradiance (-100% to 0%). (Only visible when using bifacial modules).
Auto fill If this is checked, when a tracker system has been selected for this layout region, trackers will automatically be laid out along the row positions (dotted row lines). When you edit the layout region boundary, trackers will automatically be added/removed to fill the layout region.
If this is not checked, even when you edit the layout region boundary, all existing trackers will remain in place - preserving any manual edits you may have made.
6.1.2.4 Editing Row Spacings
When you add a layout region you will see dotted lines filling the region. These are the rows that racks
can potentially be placed on.
Ensure that the dotted lines run exactly in the direction you wish (maybe you’re using an image to help
guide you for the lay out process). Modify the Azimuth (or System Rotation) layout region parameter to
get the dotted lines running in exactly the right direction.
To modify the spacing and position of the rows use the ‘Edit Lines’ tool in the map toolbar (highlighted in
red below):
One (or more) of the dotted lines will be coloured red. This is an anchor row. When in Edit Lines mode
you can click and drag the anchor rows to change its position. There will be a blue dotted line below
each anchor row. Dragging the blue dotted line changes the pitch (distance between) of all the rows
below the anchor row. The pitch will be the distance between the red and blue lines.
You can have multiple pitches in the same layout region. You just need to make a dotted line into an
anchor row. In Edit Lines mode right-click on a dotted line and choose ‘Make Anchor’ from the popup
menu. It will become a red anchor row and you can set the pitch of the rows below it separately.
Next to the table of layout regions there is additional row spacing properties for the selected layout
region. Each separate area with different pitches are represented. You can manually alter the offset
value (distance in metres from the top of the layout region) and the pitch value (in metres) should you
wish.
6.1.2.5 Defining exclusion regions
You may wish to delineate areas (such as roads or geographical features such as ponds or marshland)
where you don’t want racks or trackers to be placed. A simple way to do this is to add exclusion regions.
Select the ‘Exclusion Region’ map tool (highlighted in red below):
Draw out a polygon defining the exclusion region and when racks are being added they are prohibited
from being placed in exclusion regions.
SolarFarmer User Guide Page 24 of 77
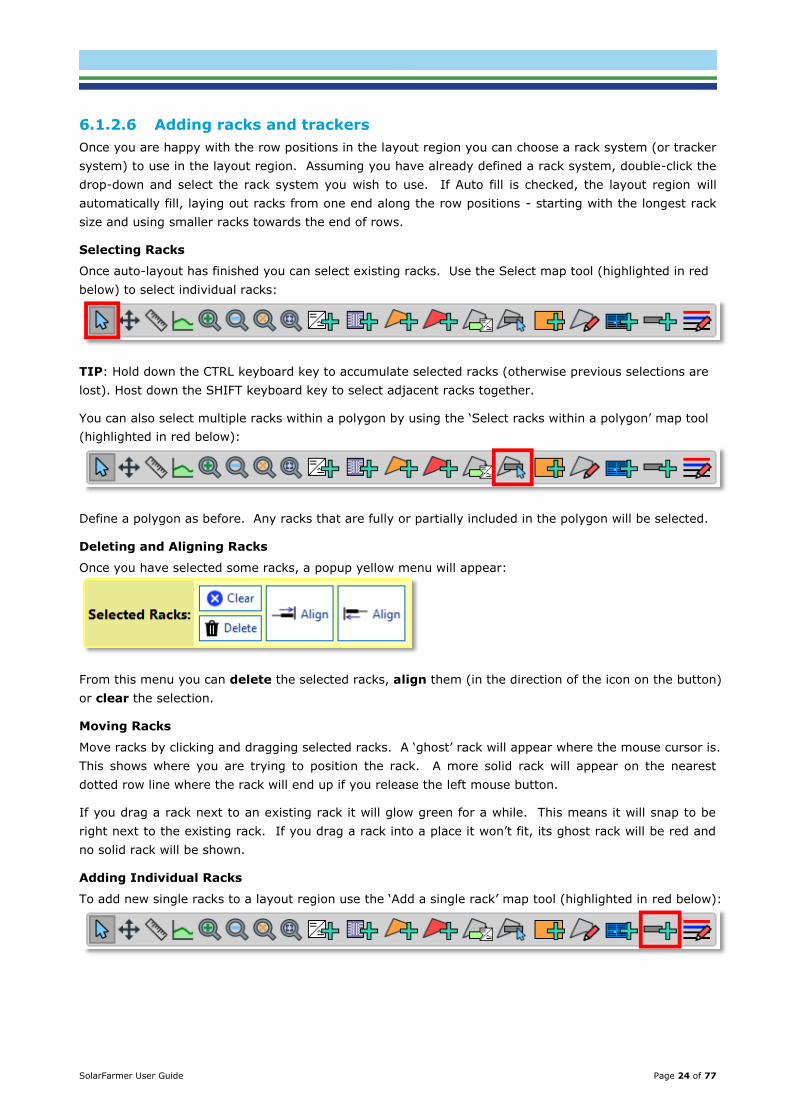
6.1.2.6 Adding racks and trackers
Once you are happy with the row positions in the layout region you can choose a rack system (or tracker
system) to use in the layout region. Assuming you have already defined a rack system, double-click the
drop-down and select the rack system you wish to use. If Auto fill is checked, the layout region will
automatically fill, laying out racks from one end along the row positions - starting with the longest rack
size and using smaller racks towards the end of rows.
Selecting Racks
Once auto-layout has finished you can select existing racks. Use the Select map tool (highlighted in red
below) to select individual racks:
TIP: Hold down the CTRL keyboard key to accumulate selected racks (otherwise previous selections are
lost). Host down the SHIFT keyboard key to select adjacent racks together.
You can also select multiple racks within a polygon by using the ‘Select racks within a polygon’ map tool
(highlighted in red below):
Define a polygon as before. Any racks that are fully or partially included in the polygon will be selected.
Deleting and Aligning Racks
Once you have selected some racks, a popup yellow menu will appear:
From this menu you can delete the selected racks, align them (in the direction of the icon on the button)
or clear the selection.
Moving Racks
Move racks by clicking and dragging selected racks. A ‘ghost’ rack will appear where the mouse cursor is.
This shows where you are trying to position the rack. A more solid rack will appear on the nearest
dotted row line where the rack will end up if you release the left mouse button.
If you drag a rack next to an existing rack it will glow green for a while. This means it will snap to be
right next to the existing rack. If you drag a rack into a place it won’t fit, its ghost rack will be red and
no solid rack will be shown.
Adding Individual Racks
To add new single racks to a layout region use the ‘Add a single rack’ map tool (highlighted in red below):
SolarFarmer User Guide Page 25 of 77
A yellow popup menu will appear with the different rack specifications (sizes) available in the rack
system of the currently selected layout region.
Select a rack specification (size) to add (use the keyboard key 1, 2 etc to select it too). Then left-click
on a dotted line row in a layout boundary. A new rack will be added and appear. Drag to move it to the
required position and release the left mouse button to drop it there.
Click, drag and release to keep adding more single racks.
6.1.3 Adding Transformers
To add a new transformer to the site, click on the ‘Add Transformer’ map tool (highlighted in red below):
A yellow popup menu appears allowing you to choose the transformer type to add (from your previously
defined transformer specifications):
Then click on the map to add a transformer instance of the type you selected. No physical object (that
shades modules, for example) is added to the site - it is just a placeholder for the transformer.
The transformer instances appear in a table in the Transformers tab in the lower pane of the screen:
6.1.4 Adding Central Inverters
To add a central inverter to the site, click on the ‘Central Inverter’ map tool (highlighted in red below):
A yellow popup menu appears allowing you to specify the inverter type to add, along with the module
type to use with this inverter, some collection effect values and which transformer instance to add any
added strings to.

SolarFarmer User Guide Page 26 of 77
Then click on the map to add a central inverter instance. No physical object (that may provide shading)
is added to the site – it is just a placeholder for the central inverter.
The inverters appear in a table in the Inverters tab in the lower pane of the screen. Note the string
length is set to be the default string length you defined in the ‘String Length’ task screen. You can
change the string length in this table:
6.1.5 Assigning Strings to Central Inverters
So far you have just added and positioned empty racks along the row positions. There are no actual
strings of modules on the racks. This step is now done using the ‘Assign strings within boundary to
inverter’ map tool (highlighted in red below):
A yellow popup menu will appear:
Inverter Input The central inverter input (as an inverter may have more than one input) you wish to create strings for.
String pattern The string pattern – one of: • Straight strings – strings are laid straight along the rack
• Snaking strings – strings snake up and down along the rack
• C at top then straight – strings form a C or U pattern along the top 2 rows of a
rack, then straight for the remaining rows of the rack.
Span up to # racks
The strings can span across multiple racks. You can specify the maximum number of racks they can span here.
Set this to 1 if you don’t want them to be able to span between racks.

SolarFarmer User Guide Page 27 of 77
Max span distance
If strings can span across multiple racks, this is the maximum physical distance between racks that spanning is allowed. If the distance is greater than this value then the spanning won’t occur.
Now define a polygon in the map surrounding the racks that you wish to assign strings to. Strings and
modules will be laid out on the racks using the string length defined for that inverter input (in the table
in the Inverters tab in the lower pane). String colours on the map match the colour of the inverter
instance they are connected with.
Zoom into the map to see the detail of the strings and modules:
You can also see the string and module detail in 3D view:
Any grey regions of racks are spaces where strings of the defined string length could not exactly fit.
6.1.6 Adding String Inverters
Some sites use string inverters rather than central inverters. These tend to be smaller and more
numerous, often several string inverters per row. Rather than get the user to add this many string
inverters by hand, they are created and added automatically.
To do this, choose the ‘Assign strings within boundary to inverter’ map tool (highlighted in red below):

SolarFarmer User Guide Page 28 of 77
This time change the drop-down on the far left of the yellow popup menu that appears to ‘Place string
inverters’:
Various options are presented to help you define how exactly the string inverters will be specified and
created.
String pattern The string pattern – one of: • Straight strings – strings are laid straight along the rack
• Snaking strings – strings snake up and down along the rack
• C at top then straight – strings form a C or U pattern along the top 2 rows of a
rack, then straight for the remaining rows of the rack.
Name prefix The prefix to the name given to newly created string inverters.
Name convention
The naming numbering convention to use. One of 2 options:
• Numbers (1, 2, 3) – simply uses a number, starting from 1, counting up
E.g. will produce Inv_1, Inv_2, Inv_3, Inv_4, …
• Letters (A, B, C) – uses letters, starting from A, counting up
E.g. will produce Inv_A, Inv_B, Inv_C, …, Inv_Y, Inv_Z, Inv_AA, Inv_AB, …
Name suffix The suffix to the name given to newly created string inverters (optional)
DC coll effect The DC collection effect (%)
AC coll effect The AC collection effect (%)
Add to transformer
The transformer instance to add these string inverters to.
Span up to # racks
The strings can span across multiple racks. You can specify the maximum number of racks they can span here. Set this to 1 if you don’t want them to be able to span between racks.

SolarFarmer User Guide Page 29 of 77
Max span distance
If strings can span across multiple racks, this is the maximum physical distance between racks that spanning is allowed. If the distance is greater than this value then the spanning won’t occur.
You can then choose string lay out behaviour that is the same for all rack templates (sizes) for the
selected racks or specify slightly different settings (e.g. string length) depending on the specific rack
specifications.
Inverter type The type of the newly added string inverter (from your library of inverter specifications).
Inverter input (Read-only) The different inverter inputs defined by your inverter specification. When creating and adding string inverters and strings, it creates a string inverter,
filling its inputs up in order by the number of strings and string lengths you define
(below).
PV module type The module specification to use for the newly created strings for this inverter input.
String length The string length to use for the newly created strings for this inverter input.
# strings per input
The number of strings to create for this inverter input.
To create string inverters and assign strings to them define a polygon in the map surrounding the racks
that you wish to assign strings to. String inverters, strings and modules will be laid out on the racks
using the parameters have you defined.
All the string inverters are added to the table in the Inverters tab in the lower panel and there is also a
representation of them as coloured squares at the top-left of each row (which are selectable):
6.1.7 Formatting Inverter Blocks
6.1.7.1 The Format Layout Region Dialog
To help you create layout regions suitable for inverter blocks there is the Format Layout Region dialog.
To use this dialog - in the Layout Regions tab, select the layout region you wish to format and click on
the ‘Format…’ button:

SolarFarmer User Guide Page 30 of 77
The ‘Format Layout Region’ dialog appears that allows you to set several properties of the layout region.
This dialog can also be used to format non-inverter block regions - though it will completely change the
layout region’s shape and content so make sure this is something you wish to do.
The Setup tab:
• Its rectangular size (it forces it to be rectangular)
o Specify the number of rows and columns of racks or trackers
o Or specify the absolute size across and down (in metres)
o Or specify the DC/AC ratio. This calculates the number of strings with the selected
inverter and module specifications – assuming you are also adding a central inverter and
allocates the appropriate number of racks or trackers.
• The track or tracker system to use when adding racks or trackers.
• The pitch value.
• The tilt value (for rack layout regions)
• Add a central inverter and automatically assign strings
o The inverter specification to use

SolarFarmer User Guide Page 31 of 77
o The module specification to use
o The string length
o The string pattern
The Inverter tab:
• Set the position of the central inverter relative to the rectangular layout region
The Roads tab:
• Set the inclusion of a vertical and/or horizontal road in the layout region.
o Specify the road width and the position of its centre line.

SolarFarmer User Guide Page 32 of 77
The Margins tab:
• Set the margins from the edges of the layout region to the racks or trackers within.
Click on the ‘Apply’ button (or press the Return keyboard key) to apply the current parameters to the
currently selected layout region. It will update for you to see.
6.1.7.2 Formatting inverter blocks using scripting
The functionality available in the Format Layout Region dialog above is also available via scripting via
functions on the LayoutBoundary class.
See Appendix Appendix AD.2 for more detailed information on using scripting to format layout regions
for inverter blocks.
6.1.8 Adding Inverter Blocks to a Layout Region
Once you have defined one or more inverter blocks in the Design components -> Inverter blocks
task you can add instances of them in a layout region.
Click on the ‘Add inverter block’ button in the map toolbar (highlighted in red below):

SolarFarmer User Guide Page 33 of 77
6.1.8.1 Adding individual inverter blocks
Select the ‘Add individual inverter block’ option to add individual inverter blocks. Select the inverter
block type to add and the transformer to add its central inverter to (add a new transformer if needs be).
Then just left-click the mouse in a layout region (setting the offset of the layout region’s first row
spacing to a large value will hide the dotted row lines). A blue rectangle representing the inverter block
will appear – drag it to the desired location and release the mouse button:
If the rectangle being dragged turns red, it means it is an invalid position (usually over the layout
region’s edge or intersecting with an exclusion region or other inverter block).
6.1.8.2 Auto-fill with inverter blocks
Use the auto-fill option if you wish to fill a large layout region with multiple inverter blocks, all in a
regular grid.
Select the inverter block type and transformer to add to, then:
1. Left-click in the layout region (on the background – not on an existing inverter block).
2. Keep the mouse button pressed and move the mouse. The grid will move with the mouse
cursor – filling the layout region as best it can, dynamically removing any inverter blocks that
would be invalid (if they overlap with the layout region edge or an exclusion region).
3. Release the left mouse button when you are happy with the grid shown (or press the Escape
keyboard key to cancel).

SolarFarmer User Guide Page 34 of 77
Changing the map to 3D mode will show the actual racks or trackers within the inverter blocks:

SolarFarmer User Guide Page 35 of 77
6.1.9 Site Statistics Dialog
As you lay out the components in a site it is useful to keep track of the number of the different
components and other useful statistics. Click on the ‘Site Statistics’ button (highlighted in red below) in
the quick access toolbar (top left of the application window):
The Site Statistics dialog is then shown and is updated in real-time as you add/remove components in
the lay out task.
6.1.10 Generic Layout
The generic layout functionality in SolarFarmer allows you to create a site layout (create one layout
region or use existing layout regions), fill this with racks or trackers and automatically add modules and
strings to automatically created central inverters. By specifying several parameters, you can quickly
produce several sites with slightly different properties (e.g. pitch, tilt, module specification).
SolarFarmer User Guide Page 36 of 77
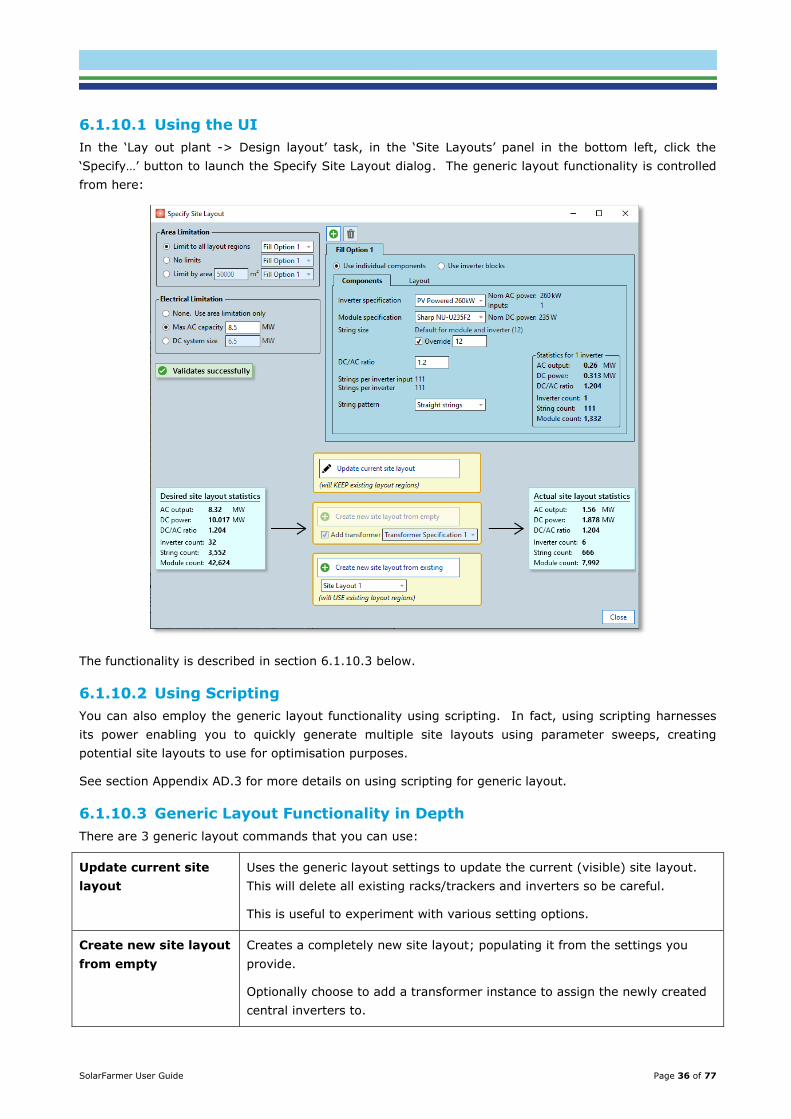
6.1.10.1 Using the UI
In the ‘Lay out plant -> Design layout’ task, in the ‘Site Layouts’ panel in the bottom left, click the
‘Specify…’ button to launch the Specify Site Layout dialog. The generic layout functionality is controlled
from here:
The functionality is described in section 6.1.10.3 below.
6.1.10.2 Using Scripting
You can also employ the generic layout functionality using scripting. In fact, using scripting harnesses
its power enabling you to quickly generate multiple site layouts using parameter sweeps, creating
potential site layouts to use for optimisation purposes.
See section Appendix AD.3 for more details on using scripting for generic layout.
6.1.10.3 Generic Layout Functionality in Depth
There are 3 generic layout commands that you can use:
Update current site
layout
Uses the generic layout settings to update the current (visible) site layout.
This will delete all existing racks/trackers and inverters so be careful.
This is useful to experiment with various setting options.
Create new site layout
from empty
Creates a completely new site layout; populating it from the settings you
provide.
Optionally choose to add a transformer instance to assign the newly created
central inverters to.

SolarFarmer User Guide Page 37 of 77
Create new site layout
from existing
Creates a new site layout based on an existing one that you specify. It will
discard any racks/trackers and inverters but retain everything else.
The availability of the three options depends on the combination of the generic layout settings you select.
The settings consist of an area limitation, electrical limitation and a fill option to use with the area
limitation.
Area Limitation Options
Limit to all layout
regions
• Uses existing layout regions in the current site layout to fill.
• It will remove all existing racks/trackers and attempt to add and fill rows in these layout regions.
• It will stop adding racks/trackers when there is no more room, or when the electrical limitation is reached (if specified).
No limits • Deletes all existing layout regions and creates a new rectangular
layout region centred on the site location. This new layout region can expand infinitely.
• It will stop adding racks/trackers only when the electrical limitation is
reached.
Limit by area • Deletes all existing layout regions and creates a new rectangular
layout region centred on the site location.
• It will stop adding racks/trackers to this new layout region when the area limit is reached or when the electrical limitation is reached (if specified).
Electrical Limitation Options
None • No electrical limitation is considered. It will use the area limitation
option to define the size of the site.
Max AC Capacity • It will add inverters and strings to the available racks/trackers until
the specified maximum AC capacity of the site (in MW) is reached.
DC System Size • It will add inverters and strings to the available racks/trackers until
the specified DC system size of the site (in MW) is reached.
Fill Options
The fill option is used to fill the layout regions. Currently only one fill option can be used for the whole
site. Future-plans include using different fill options for different layout regions.

SolarFarmer User Guide Page 38 of 77
There are 2 options: Use Individual Components or Use Inverter Blocks.
Use Individual Components
First, select the components to use in the layout:
Settings like the inverter specification, module specification, the string size to use, the DC/AC ratio and
the string pattern are chosen. It automatically calculates the number of strings per inverter input from
the settings you choose. It also displays the statistics for one inverter to help with sizing.
Then choose the how to lay out these components (and if racks or trackers). This can be one of 3
options:
1. Fixed-tilt racks:
SolarFarmer User Guide Page 39 of 77
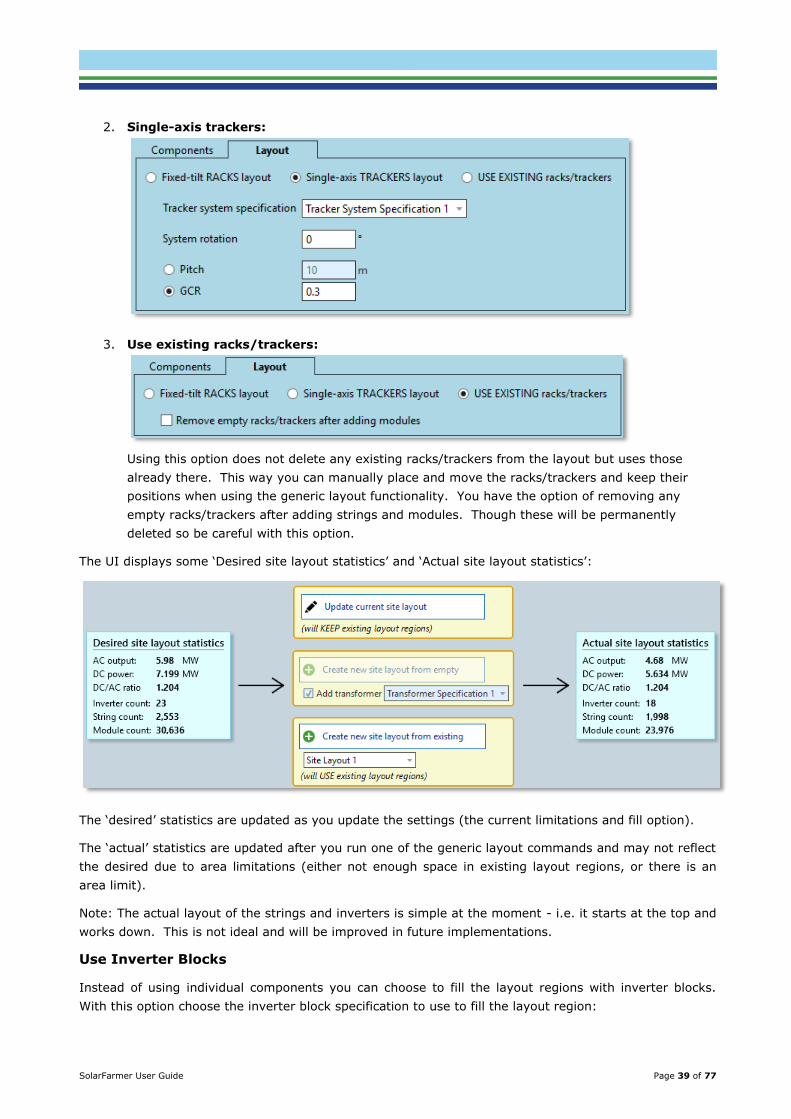
2. Single-axis trackers:
3. Use existing racks/trackers:
Using this option does not delete any existing racks/trackers from the layout but uses those
already there. This way you can manually place and move the racks/trackers and keep their
positions when using the generic layout functionality. You have the option of removing any
empty racks/trackers after adding strings and modules. Though these will be permanently
deleted so be careful with this option.
The UI displays some ‘Desired site layout statistics’ and ‘Actual site layout statistics’:
The ‘desired’ statistics are updated as you update the settings (the current limitations and fill option).
The ‘actual’ statistics are updated after you run one of the generic layout commands and may not reflect
the desired due to area limitations (either not enough space in existing layout regions, or there is an
area limit).
Note: The actual layout of the strings and inverters is simple at the moment - i.e. it starts at the top and
works down. This is not ideal and will be improved in future implementations.
Use Inverter Blocks
Instead of using individual components you can choose to fill the layout regions with inverter blocks.
With this option choose the inverter block specification to use to fill the layout region:

SolarFarmer User Guide Page 40 of 77
Future implementations may allow you to choose several inverter block specifications and fill using a
priority order.
6.2 Electrical Configuration
This task allows you to connect inverters and inverter blocks to transformers in the layout.
If, when adding inverters or inverter blocks you selected a transformer to connect them to, they will
already be connected. However, if this wasn’t in place the inverters/inverter blocks will not be connected
to a transformer and they must be connected for the energy yield calculation to run.
You will see a tree control in the left pane of the Electrical Configuration screen. Simply drag and drop
one (or more) inverters or inverter blocks onto their parent transformer to connect them together.
6.3 Review Trackers
This task allows you to view the tracker behaviour at different days and times. You can see the tilt of
the trackers throughout the day and see the effect of turning backtracking on or off. It obviously only
has effect for single-axis tracker layouts. No effect is seen for fixed-tilt rack layouts.
Change the map to 3D mode. Then modify the date and time using the controls on the left:

SolarFarmer User Guide Page 41 of 77
The sun position is calculated and the in-built tracker algorithm is run to calculate the tilt of each of the
trackers in the layout. These are then displayed in real-time in the 3D view. The tilt angles of the
trackers depend on the angle of the sun, the pitch (distance between the rows of trackers) and whether
backtracking is turned on or not (in the tracker system specification).
For a single day, click and hold your mouse cursor to the right (or left) of the slider control. This has the
effect of moving the time by 10 minutes to give a simple animation throughout the day.
6.4 Review Shading
This task allows you to review the shadows cast by shading obstacles, undulating terrain and rows of
modules on the modules in your site layout.
This may take a while to calculate – make sure that shading points setup is set to ‘One per module’ and
the diffuse shading scheme is set to ‘Per module’ and hit the ‘Run Shading Calculation’ button.
Once the calculation has completed, switch the map to 3D view to see the results. The controls on the
left allow you to change the day of the year and the time of day. The time control shows an indication of
sunrise and sunset to help you gauge when the sun is up.
By default it will show direct lighting. Modules in direct sunlight are shaded pure white. Modules in
shadow are shaded in dark grey:
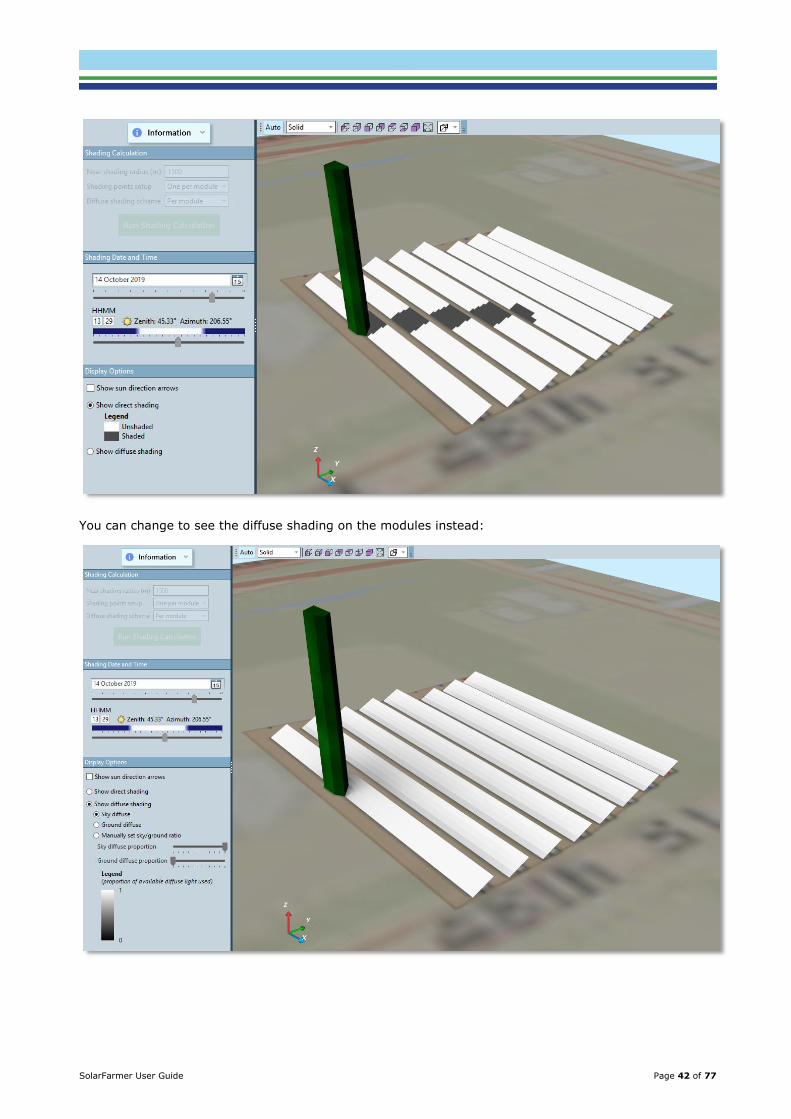
SolarFarmer User Guide Page 42 of 77
You can change to see the diffuse shading on the modules instead:

SolarFarmer User Guide Page 43 of 77
7 CALCULATE ENERGY
This chapter is about setting up and running the energy yield calculation. All the setup you have done so
far leads to this section.
7.1 Setup Yield Calculation Layout and Resources
Select the layout and resources to use in the calculation. If you have imported multiple solar resources or horizon files, you can choose only one of them here.
Soiling Effects Specify soiling effects (losses due to soiling) either by month or as an overall percentage.
Shading Settings Specify the number of shading target points per module. The more per module the more accurate the shading algorithm is, but the longer the calculation takes. ‘Five per submodule’ has been shown to be accurate without taking too long.
‘Per module’ is fine for the diffuse shading scheme.
Disable Models To speed up the calculation (though reduce its accuracy) you can disable parts of the calculation. This is useful for testing and validation purposes but generally best
not to disable anything. • Diffuse transposition model – calculation of the incident irradiance on a
tilted plane from the horizontal irradiance data (Hay or Perez models available).
• IAM model (Incidence Angle Modifier) – describes how much of the irradiance incident on the module’s surface penetrates and enters the cells.
• Near shading model – shading due to obstacles and near terrain.
• Cell temperature model – modelled using the PVsyst cell temperature model (Faiman model, includes wind speed dependency).
• Spectral model – the percentage increase/decrease in module output power resulting from the incident light spectrum.
• Bifacial model – if bifacial modules have been used in the site layout the bifacial model will be used (currently only in the simple model for fixed-tilt
racks). This can be disabled here.
Electrical Effects A couple of effects (gains or losses) that are set for the whole calculation:
• Module mismatch – losses due to variation in module performance.
• Grid availability – losses due to the electrical grid to which the PV plant is
connected is not available to accept power, meaning the PV plant must shut down and will not be able to generate.
Bin Widths The energy yield calculation groups (bins) similar oriented racks and trackers together to optimise the calculation. The bin widths are a way to control the resolution of this binning. The smaller the values, the fewer racks per group, which means a slightly longer calculation time.
If unsure, a default of 0.5 for both are fine. Though smaller values (e.g. 0.01) lead to more accurate results.

SolarFarmer User Guide Page 44 of 77
Cell Temperature Model Parameters
These parameters are used to control the cell temperature model. • Wind speed – if the solar resource data does not include a wind speed
value, you can set a constant wind speed for the site here. • Irradiance type – choose to ignore or apply the module adsorption
coefficient.
Diffuse
Transposition Model
Choose either the Perez or Hay model for the diffuse transposition model (the
calculation of the incident irradiance on a tilted plane from the horizontal irradiance data).
Emulate PVsyst Comparisons of results from PVsyst and SolarFarmer models have revealed a couple of areas where we think we know what PVsyst is doing but don’t agree with. Validating SolarFarmer against PVsyst is desirable, but if we choose slightly different models or behaviour to how PVsyst works, the validation against PVsyst becomes difficult. We cannot change PVsyst’s behaviour but also do not wish to adopt calculations in SolarFarmer that we consider incorrect.
Check this box to choose PVsyst behaviour for the calculation areas where SolarFarmer and PVsyst differ slightly.
Use explicit solver Use an explicit module performance solver. The performance of the performance solver part of the calculation may be marginally quicker if this is checked. But it is recommended to keep this unchecked for now – it may be removed in a later release.
7.1.1 Simple Model vs Full Model
There are two model options when running the energy yield calculations.
1. The Full Model
This is the full shading model. The location and orientation of all PV modules is considered,
along with accurate shading from other modules, shading obstacles and terrain. This takes
longer to complete than the Simple Model but is the most accurate and is the recommended
model to use, particularly for complex terrain.
2. The Simple Model
This is a much-simplified model based on the PVsyst sheds model. Shortcuts and assumptions
are made that speed up the calculation by a large factor, but the results are not as accurate as
the Full Model, as undulating terrain and complex shading are not taken into account. It
assumes a horizontal terrain. Use this when first setting up a site when accuracy isn’t too
important. Switch to the Full Model once you are happy with all the parameters and settings.
7.1.2 Performance Statistics
When you run the energy yield calculation from the user interface, if you expand the Performance
Statistics panel you can see time and memory performance statistics get updated. This is more of a
diagnostic tool for developers, but you may find it interesting and it could be useful if you were to report
a bug or feedback about the software.
7.2 Yield Results
Once the energy yield calculation has completed the annual and monthly yield results are available.
There are tables for annual and monthly values. The results are not stored in the workbook, so you
would need to rerun the calculation to see the results when you reopen an existing workbook.
You can export these results to a *.csv file using the button in the top-left of the screen.

SolarFarmer User Guide Page 45 of 77
7.3 Effects Diagram
Once the energy yield calculation has completed, the effects (gains and losses) are shown in the effects
diagram.
It is split into 4 sections:
Irradiance (sun → module) Gains and losses of irradiance values due to tilt, horizon, shading etc
Conversion (module → inverter) Gains and losses due to temperature, module and electrical mismatch, etc.
Inverter (inverter → transformer) Gains and losses due to inverter efficiencies, etc.
Collection (transformer → grid) Gains and losses due to transformer losses and grid availability
The coloured sections go in/out depending on the size of the loss or gain to give you a visual
representation of the values to help identify large changes.

SolarFarmer User Guide Page 46 of 77
8 CREATE REPORT
8.1 Create Report
Once you have run an energy yield calculation, or if you want to create a report of the workbook settings,
you can do this here.
This exports all the workbook settings to an XML file. Not directly usable by SolarFarmer but it may be used by other developers to compare contents of different
workbooks.
This creates a Word document (using a built-in template) of all the workbook settings.
It does not include any energy yield calculation results.
This creates a Word document (using a built-in template) of all the workbook settings and the energy yield calculation results (tables and effects diagram).
This option is only available when an energy yield calculation has been run.

SolarFarmer User Guide Page 47 of 77
9 MISCELLANEOUS
9.1 Scripting
Scripting functionality is available in SolarFarmer, albeit slightly limited at the moment. This allows you
to write scripts in the C# programming language that update parameters in the workbook and
execute certain functionality, such as running calculations.
To launch the script editor click on the ‘Script Editor’ button in the Quick Access Toolbar in the left of the
application’s title bar (highlighted in red below):
The Script Editor allows you to write and run simple scripts. You can create multiple scripts that are
saved in the current workbook.
There isn’t a comprehensive reference document yet for what is available in scripting. You can discover
what is available by using the built-in intellisense functionality. When you type a variable and press the
‘.’ keyboard key, the list of available properties shows in a popup menu. Choose one of the available
properties (with the mouse or arrow keyboard keys) and press Return to add that property.
9.1.1 ‘Workbook’ for accessing the workbook settings
There is an object called Workbook (of type Workbook) that you can use to access the properties of the
current workbook. Use the intellisense to navigate the various properties and sub-properties.

SolarFarmer User Guide Page 48 of 77
9.1.2 ‘Toolbox’ for accessing the calculation toolbox
There is an object called Toolbox (of type Toolbox) that you can use to access various functions for
working with the workbook. Most notably ExecuteEnergyCalculation.
Use Toolbox.Log() to write text to the output panel. Useful for viewing the values of variables.
9.1.3 Scripting in Future
The scripting functionality will be extended in future, with more comprehensive coverage of the
workbook parameters and a reference guide. Please email the SolarFarmer support email if you have
specific requests or need more guidance.
9.2 Automatic results export
When you run an energy calculation, detailed results files are automatically written to file in a “Testing”
folder next to the workbook. Most of the results will be overwritten every time the calculation is run.
This behaviour will be reviewed and may change in future versions.

SolarFarmer User Guide Page 49 of 77
10 USEFUL HINTS AND TIPS
10.1 Working with the Map
The map control (generally on the right-hand side of the different task screens) is fundamental to the
usage of SolarFarmer and is worth getting to know.
10.1.1 Map Toolbar
The map toolbar is always present and it’s good to get to know the tools. The following tools are present
in all the task screens:
Select Select individual objects on the map (such as inverters and layout regions). Press the CTRL keyboard key to select multiple objects.
Pan & Zoom Left-click and drag to pan the map.
Use the mouse-wheel to zoom in and out.
Ruler
Left-click once to set one end of a ruler. Move the mouse and left-click to set the other end. The distance (in metres) is shown on the ruler line. Right-click to clear the current ruler.
Elevation Profile Tool
Shows the profile of terrain elevation between two points. See Section 10.1.4 for a more detailed explanation of how to use this.
Zoom in Instantly zoom in by a fixed amount.
Zoom out Instantly zoom out by a fixed amount.
Zoom to extents Zoom the map to the full extents of all objects in the workbook (not including
background imagery and elevation data)
Zoom to extents of selected items
Zoom the map to the full extents of all selected objects in the workbook.
Other tools will appear depending on the current task. The Design Layout task has quite a few!
10.1.2 Map Layers
The map is made up of several layers, each responsible for displaying different types of data of the PV
plant. You can turn layers on and off and change their opacity to help you to visualise the data better.
The Layers panel is usually minimized in the top-right of the map area:

SolarFarmer User Guide Page 50 of 77
Just click it to open the Layers panel. It lists the currently available layers (not all are available all the
time – depending on the data you have added to your workbook).
Click the eye icon ( ) to toggle a layer’s visibility (the icon becomes when the layer is invisible).
Click the tag icon ( ) to toggle the visibility of the labels on a layer (the icon becomes when the
labels are invisible).
Select a layer and slide the Opacity slider (at the top) to change the layer’s opacity. 0% means it is
fully transparent and thus invisible. 100% means it is fully opaque and you won’t see any other layers
below.
Clicking on the triangular arrow buttons on the right move selected layers up or down. The layers
are rendered bottom-up, so any layers near the top will be rendered last and thus ‘on-top’ of the others.
Generally big layers that take up the whole area (such as background imagery and elevation grids) are
at the bottom so that smaller objects (such as inverters and shading objects) are visible on top of them.
There is a Legend area that becomes visible and available when certain map layers are selected.
Important for the Elevation Grids map layer to change the colour scheme from a range of options.
10.1.3 3D Mode
The map has a 3D mode to enable you to see the terrain and objects in 3D, to help visualise the site
closer to as it will be in real life.
Click on the ‘3D’ button at the top of the map area to switch the view to 3D.

SolarFarmer User Guide Page 51 of 77
Note that only the area that is currently visible in the 2D map will be portrayed in 3D.
See for example a close-up of the city of Bristol, UK below. When you switch to 3D only the 3D terrain
in that close-up area will be visible in 3D. It takes a screenshot of whatever layers are visible in 2D
mode to drape over the terrain:
If you go back to 2D mode (press the ‘2D’ button at the top of the map) and zoom out. Then go back to 3D view, you will see that a wider area is now portrayed in 3D:

SolarFarmer User Guide Page 52 of 77
Click on the Help question mark button ( ) in the top-right of the 3D view to show mouse and keyboard
controls for working in the 3D view. It may take a while to get used to them.
The main useful one to know is to double-click with the left mouse button on the point you wish to rotate
around.
Changing the rendering mode to Wireframe can be useful to see individual modules and get a better feel
for the undulating terrain. Change the rendering mode with the drop-down in the top-left (or use the
keyboard shortcuts):
10.1.4 Elevation Profile Tool With this tool selected, left-click once to set one end of the profile line. As you move the mouse the profile slope updates on the chart below the map (that has appeared). The distance (in metres) between the start and end of the line is shown on the line in the map. Note that the chart series fills the available space, so the slopes may appear to be steeper/shallower than they are in real-life.
101 sample points are used along the line (so the distance between them depends on the length of the line), sampling the elevation at each point.

SolarFarmer User Guide Page 53 of 77
Left-click to set the other end of the profile line. Various statistics relating to the elevation profile are shown above the chart:
1. The total distance of the line (in metres) 2. The maximum uphill and downhill slopes (in percentages)
3. The average uphill and downhill slopes (in percentages) 4. The minimum, average and maximum elevation (in metres above sea-level) 5. The total elevation gain along the line (in metres) 6. The total elevation loss along the line (in metres) 7. The net elevation gain/loss from the start to the end of the line.
Hovering the mouse cursor over the chart gives you a tooltip containing the elevation and slope at that
point:

SolarFarmer User Guide Page 54 of 77
10.2 Export to PVsyst
The Export to PVsyst functionality allows you to use the setup and layout tools in SolarFarmer to create a
workbook, then export this to generate a PVsyst project. You can then import this project into PVsyst,
verify the settings/parameters and run the calculation via PVsyst. Though obviously you can run the
project in SolarFarmer too.
10.2.1 Important things to note before laying out a site
Fixed-tilt rack layouts are supported. These are 3D layouts in PVsyst,
including the ground terrain around the racks.
Single-axis tracker layouts are NOT currently supported
Inverter blocks are NOT currently supported
BEFORE laying out the site:
1. Make sure the horizontal spacing between racks is greater than 0. This defaults to 100m
which should be ok. Otherwise the racks can intersect in the PVsyst shading scene and it doesn’t
allow you to run the calculation.
Go to the ‘Define components -> Racks’ task and check the ‘Horizontal spacing between racks’
property:
2. Make sure that the inverter spec and module specs that you use come from imported PAN and OND
files.

SolarFarmer User Guide Page 55 of 77
These are stored in the SolarFarmer workbook and then exported directly to the PVsyst project. So
manual modifications to any module or inverter specification parameters are NOT currently exported
to PVsyst.
3. Make sure the strings fit exactly on one rack. Ideally using straight strings with no ‘folds’ in them.
This helps replicate the same in PVsyst.
4. The solar (met) data it exports is the one selected in the calculation settings (‘Calculate energy ->
Setup yield calculation’) page. If you import multiple solar resources in SolarFarmer, make sure
you choose the one you want exporting in the calculation settings.
5. The export targets PVsyst version 6.75.
10.2.2 Using the UI Dialog 1. Click on the ‘File -> Export to PVsyst…’ menu option
2. This launches the Export to PVsyst dialog:

SolarFarmer User Guide Page 56 of 77
o Any validation errors will be listed here. The main thing is to make sure the site layout is the one you want to export (it defaults to the visible layout) and you should set the folder that the PVsyst .zip project will be saved.
o The Project name is separate to the Project filename so you can use invalid file characters (such as “, <, >, :”) as part of the project name if you wish.
o The solar resource data must be a year’s worth of hourly data (e.g. TMY data). PVsyst cannot handle non-hourly intervals or multi-year.
3. After a few seconds, File Explorer in windows should open at the folder with the output file selected.
10.2.3 Using Scripting
You can perform the same functionality as the UI dialog using the scripting in SolarFarmer.
This could be useful if you are generating multiple site layouts using the generic layout functionality and
then want to export each one to PVsyst.
1. Launch the script editor window (click the ‘Script’ button in the application title bar):
It creates a default new script.
2. In the Execute() function, add the Toolbox.Export.ExportToPVsyst() function:
You’ll see it takes 6 parameters that mirror those in the UI dialog:
string projectName The name of the project (can contain any characters)
string projectFileName The file name to export (can’t contain invalid file path characters)
SiteLayout sitelayout The site layout to export
string variantName The name to give to the variant for the layout in PVsyst
SolarResource solarResource The solar resource to export (must be a year’s worth of hourly data (e.g. TMY))
string exportFolderPath The folder to save the created .zip file in
Fill these in as in the UI. Something like this:
public void Execute() { // Select the site layout to export SiteLayout siteLayoutToExport = Workbook.Domain.SiteLayouts.FirstOrDefault(s => s.Name == "Site Layout 1"); SolarResource solarResource = Workbook.Climate.SolarResources.First(); // Call the ExportToPVsyst function Toolbox.Export.ExportToPVsyst("Bern", "Bern", siteLayoutToExport, "Site Layout 1", solarResource, @"D:\PVsystProjects"); }

SolarFarmer User Guide Page 57 of 77
3. Save the script (give it a name first) and run the script. Any validation errors will appear in the Results tab of the script editor. Otherwise it should
confirm that the PVsyst project has been created.
10.2.4 Importing the Project into PVsyst
Using one of the methods above, you should have a .zip file that contains files for the PVsyst project.
1. Launch PVsyst
2. Choose the ‘Files -> Import projects’ menu option from the main application dialog:
3. The ‘Import projects tool’ dialog appears.
• Click the ‘Browse…’ button and select the .zip file that you exported from SolarFarmer.
• Click the ‘Import’ button to import the files from the archive (if any warnings to
overwrite appear, just click ‘Yes’ to them).
• Dismiss the ‘Success’ dialog that appears and exit the ‘Import project tools’ dialog.
4. View the project design (click on ‘Project design’ and then ‘Grid-Connected’ buttons)

SolarFarmer User Guide Page 58 of 77
10.2.4.1 Site Details
Click on the Site -> View site details menu option to view the site details.
• The site name, location, altitude, time zone and country have been set from the SolarFarmer
workbook.
• The met data has been set from the solar resource data in SolarFarmer.
10.2.4.2 Project Settings
Click on the Project settings button to view the ‘Project settings’ dialog.
The albedo values should be filled in from SolarFarmer. Other settings should remain the same.
10.2.4.3 System Variant
One variant will be exported. This represents the site layout you selected in SolarFarmer.
Orientation
Click on the Orientation button to see the ‘Orientation’ dialog.
A ‘Fixed Tilted Plane’ field type has been chosen. The Plane Tilt and Azimuth are set from the first layout
region in the SolarFarmer site layout.
Horizon
Click on the Horizon button to see the Horizon dialog
• The horizon data has been imported into PVsyst.
Near Shadings
Click on the Near Shadings button to see the ‘Near Shadings definition’ dialog.

SolarFarmer User Guide Page 59 of 77
• There may be the following error about the orientation parameters needing updating:
• Click on the ‘Update Orientation Parameters’ to update the orientation (it should do it
automatically)
3D Layout
• Now click on the Construction / Perspective button to see the layout in 3D:
Each rack is individually laid out, orientated the same as it is in SolarFarmer along the terrain.
Here is the equivalent layout in SolarFarmer:

SolarFarmer User Guide Page 60 of 77
If you make changes to the 3D layout in PVsyst you need to set ‘Default spacing between modules’ to
0.00, otherwise it will default to 0.02 – creating erroneous results when you save the project in PVsyst
after making changes.
• To do this – from PVsyst’s main dialog, click the ‘Preferences -> Edit hidden parameters’ menu
option:
• Choose the ‘Miscellaneous: Meteo, Simulation,…’ category and change both the “Shadings:
Default spacing between modules” and “Shadings: Shed field default frame margin” to 0.00.
Module String Definitions
The module string definitions have been replicated as much as they can.
Strings in SolarFarmer:

SolarFarmer User Guide Page 61 of 77
Equivalent module string definitions in PVsyst:
Shading Factors PVsyst will have to compute the shading factors (these are not exported) which may take some time.
10.2.4.4 Grid System Definition Click on the System button to show the ‘Grid system definition’ dialog.
There will be one or more sub-arrays defined, depending on the combination of module and inverter specifications and string lengths in your SolarFarmer site layout.
10.2.4.5 Detailed Losses Click on the Detailed losses button to show the ‘PV field detailed losses parameter’ dialog.
Some of these losses have been filled in by the SolarFarmer export. Please check these thoroughly.

SolarFarmer User Guide Page 62 of 77
11 HELP AND SUPPORT
11.1 Support Email
Please use the SolarFarmer support email [email protected] for:
1. Reporting bugs
a. Give step-by-step details on how to reproduce the bug. This is a BIG help for us.
b. Attach the relevant log file (see Section 11.3 below) and the “SolarFarmer Exception.log”
file to the email. This contains the system information for your PC and the exact version
of SolarFarmer you were using, so no need to add that detail too.
c. If relevant/useful - add screenshots of the application as the error happens.
d. If confidentially acceptable (and not too big) - adding a copy of the workbook that you
were using when the bug/crash happened is very useful too.
2. Providing feedback
a. Features you wish SolarFarmer had.
b. Annoyances in the application that could be improved but aren’t specifically a bug.
c. Positive feedback is very welcome too! It’s nice to know what you like and are finding
useful.
3. General queries
a. Sales queries.
b. Licensing – issues and expiring licenses.
c. Portal page access.
Or use one of the pre-configured templates accessible within SolarFarmer from either the Quick Access
Toolbar or the File menu:
The ‘Report a Problem…’ option also attaches the latest SolarFarmer log file to the email too.
11.2 User Portal Page
SolarFarmer’s portal page can be found here:
https://renewableenergysoftwareportal.dnvgl.com/
Go to this page (log in and click on the SolarFarmer link) for access to the latest SolarFarmer installer,
user guide and tutorial videos.
11.3 Log Files
SolarFarmer records some internal operations to a log file. Each time you start SolarFarmer a new log
file is created. Up to 10 older log files are stored (the filename contains the date and time that the
SolarFarmer session started).
To find the log files, open a File Explorer window and go to %temp%\SolarFarmer Logs.
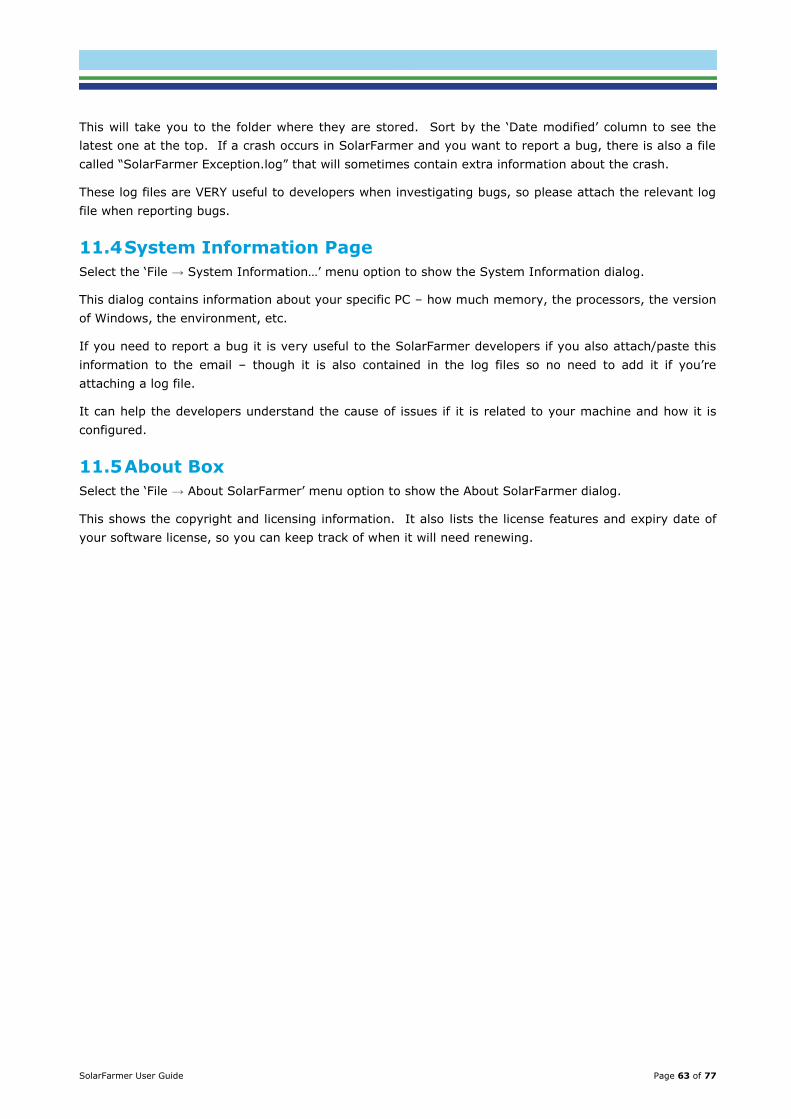
SolarFarmer User Guide Page 63 of 77
This will take you to the folder where they are stored. Sort by the ‘Date modified’ column to see the
latest one at the top. If a crash occurs in SolarFarmer and you want to report a bug, there is also a file
called “SolarFarmer Exception.log” that will sometimes contain extra information about the crash.
These log files are VERY useful to developers when investigating bugs, so please attach the relevant log
file when reporting bugs.
11.4 System Information Page
Select the ‘File → System Information…’ menu option to show the System Information dialog.
This dialog contains information about your specific PC – how much memory, the processors, the version
of Windows, the environment, etc.
If you need to report a bug it is very useful to the SolarFarmer developers if you also attach/paste this
information to the email – though it is also contained in the log files so no need to add it if you’re
attaching a log file.
It can help the developers understand the cause of issues if it is related to your machine and how it is
configured.
11.5 About Box
Select the ‘File → About SolarFarmer’ menu option to show the About SolarFarmer dialog.
This shows the copyright and licensing information. It also lists the license features and expiry date of
your software license, so you can keep track of when it will need renewing.

SolarFarmer User Guide Page 64 of 77
APPENDIX A GLOSSARY AND DEFINITIONS
In the solar industry different terms are often used for the same concepts. Here is a list of terms used in
this User Guide and throughout SolarFarmer.
Array
The set of all strings (which must all be of the same length) connected in parallel to a single bipolar input
of an inverter.
Axis
The line about which something rotates, in this case the axle, modules and associated mounting
structure in Trackers.
Axis Tilt
Angle of inclination of a Tracker Axis from the horizontal. This applies to both “horizontal axis” trackers,
where the axis may not in fact be horizontal owing to underlying terrain slope, and Tilted Axis trackers.
Axis Tilt is positive if the axis is higher at the end further from the equator, regardless of hemisphere.
For horizontal axis trackers, the Axis Tilt is dependent on the System Plane Azimuth and Zenith, and the
System Rotation
Azimuth
Nominal orientation of fixed tilt or tracking arrays.
For Fixed-Tilt arrays, this is the direction of a normal to the primary active face of the modules projected
onto a horizontal plane measured clockwise from true north, if positioned on a flat, horizontal surface.
Fixed-Tilt rows appear normal to the Azimuth Angle when viewed from directly above.
If a rack is positioned on uneven terrain such that one end is higher than the other, the actual azimuth
of the modules on that rack will differ from this value - see Effective Azimuth.
For Tracker arrays, this is the direction of the Axis.
Default Azimuth value is 180o (i.e. south-facing) in the northern hemisphere, 0o (i.e. north-facing) in the
southern hemisphere for both fixed-tilt and tracker arrays.
Bay
Set of modules along a tracker axis which are positioned adjacent to each other (or as close as the
mounting brackets allow). Typically, a Bay falls between Drive- or Support Gaps. For simplicity, Bays are
not currently modelled in SolarFarmer.
Drive Gap
The gap between adjacent bays on a tracker at the point where the tracker is driven (either directly, or
via a link to a central drive). For simplicity, Drive Gaps are not currently modelled in SolarFarmer.
Effect
SolarFarmer uses the word “Effect” to refer to a factor that either increases or decreases the amount of
irradiance, power or any other relevant quantity.
SolarFarmer User Guide Page 65 of 77
• A positive value for a particular Effect indicates that the effect resulted in more irradiance or
power in the calculation (for example the “Tilt Effect” will normally be positive, as tilting the
modules to reduce the average incidence angle results in higher irradiance at the modules).
• A negative value for a particular Effect indicates that the Effect resulted in less irradiance or
power in the calculation (for example the “Soiling Effect”).
• Some effects will almost always have the same sign, others may be negative under some
circumstances, and positive under others (e.g. “Spectral Effect”).
(The sole exception to this is in the Transformer inputs, where “No-Load Loss” and “Full-Load Loss” are
used to describe these inputs, to conform with terminology in standard transformer specifications).
Effects are specified in percent, and an Effect of 0% means that the Effect causes no change. An Effect
of +3% would be equivalent to multiplying the relevant quantity by 1.03; an Effect of -1.5% would be
equivalent to multiplying the relevant quantity by 0.985.
Effective Tilt
The Effective Tilt of a module is the angle between the vertical and a normal to the face of that module
considering any end-to-end slope on a fixed-tilt Rack or any Axis Tilt and Rotation on a Tracker.
Effective Azimuth
The Effective Azimuth of a module is the angle between a normal to the face of that module projected
onto the horizontal and measured from true north, taking into account any end-to-end slope on a fixed-
tilt Rack or any Axis Tilt and Rotation on a Tracker.
Frame
Part of tracker or rack that surrounds and protrudes beyond the edges of the modules in a single Rack or
Tracker. Frames cause shading.
Ground Coverage Ratio (GCR)
The ratio of the rack height to the pitch.
Horizontal-Axis Tracker
A single-axis tracker where the axis is nominally horizontal. In practice, the axis may not be horizontal,
owing to underlying terrain slope. Typically, a Tracker System manufacturer will specify the maximum
Axis Tilt angle. Unlike fixed-tilt racking systems, Horizontal Axis Trackers are installed in rows oriented
close to north-south.
Layout
All Layout Regions in a Plant, as defined in the SolarFarmer model.
Layout Region
Area inside a single, closed boundary in the map. Racks and Trackers can only be positioned within a
Layout Region, but other items like Inverters and Transformers can be positioned outside.

SolarFarmer User Guide Page 66 of 77
Module
A single physical PV module, including all cells, wiring, diodes etc, in suitably transparent protective
encapsulation.
Pitch
A way of specifying the spacing of adjacent Rows in a Layout Region, the Pitch is the absolute distance
between centre lines of the Rows projected onto a horizontal plane (i.e. the distance between centre
lines as seen from above).
Plant
Entire PV installation including all arrays, wiring, inverters and transformers up to the network
connection point.
Plant Array
All Arrays making up the plant.
Rack
The available Rack Templates in the Rack System are used to create Racks within the Layout Regions of
fixed-tilt Layouts.
Rack System
A fixed-tilt Layout will typically be composed of Racks that are similar in design and share many common
dimensions, but vary in length; there may be two, three or more different length Racks based on the
same Rack System in the layout, to enable the most efficient use of available space, and/or reduce wind
loading at the edges of the Layout.
Rack Template
A Rack System must have at least one Rack Template based on the system. A Rack Template specifies
the dimensions of an available rack length option within the system that are not common with other
members of the system. Once a Rack Template has been defined, Racks with the specified dimensions
can be placed in the Layout.
In rooftop Layouts, modules are often mounted individually to allow efficient use of complex spaces
divided by obstacles such as AC units and parapets, in which case the Rack size would effectively be
1 x 1.
Row
Line of Racks or Trackers in a Layout Region, potentially including gaps. Potential positions for these
rows (Row Line) are shown as dotted lines in the Layout Regions in SolarFarmer.
Row Line
Dotted line in Layout view showing each potential Row position in the Layout Regions.

SolarFarmer User Guide Page 67 of 77
String
A set of PV modules connected in series (i.e. the +ve terminal of one module is connected to the –ve
terminal of the next, repeated all the way along the string)
Submodule
A group of cells and wiring within a PV module connected in parallel with a single bypass diode. There
are normally three of these per module. A string of modules is modelled electrically like a string of
submodules.
Substring
A Substring is a set of series-connected cells connected across a bypass diode within a Module.
Support Gap
The gap between adjacent bays on a tracker at the point where the tracker axis is supported. For
simplicity, Support Gaps are not currently modelled in SolarFarmer.
System Plane
Within a Layout Region, the Axes of horizontal trackers are confined to lie within a single plane, the
System Plane. The plane is defined by the System Plane Azimuth and System Plane Zenith and the
vertical offset of the plane.
System Plane Azimuth
The clockwise angle from true north of the projection of the upwards-pointing normal to the System
Plane on a horizontal plane.
System Plane Zenith
The angle between the vertical and the upwards-pointing normal to the System Plane.
System Rotation Angle
The System Rotation Angle describes the angle between the true north-south axis at the site, and the
centre lines of horizontal axis trackers at the site. A positive angle indicates a clockwise rotation,
regardless of the hemisphere in which the site is located. System rotation angle is confined to be
between -90o and +90o.
Tilt
For fixed-tilt racks, the Tilt is the nominal angle between the vertical and a normal to the plane of the
modules mounted on the rack, when the rack is placed on flat, horizontal terrain.
A positive tilt angle indicates that the racks are inclined such that a projection of the normal to the plane
of the modules on rack onto the horizontal plane points toward the equator (in both hemispheres), i.e.
the typical tilt used to increase the irradiance falling on the modules.
If a rack is positioned on uneven terrain such that one end is higher than the other, then this will not be
the actual angle between the normal to the face of the rack and the vertical – see Effective Tilt.
For Horizontal-Axis Trackers, see Axis Tilt.

SolarFarmer User Guide Page 68 of 77
Tracker
The available Tracker Templates in the Tracker System are used to create Trackers within the Layout
Regions of tracking Layouts.
Tracker Rotation Angle
Angle of rotation of Tracker from the middle position (normal to active face of modules on Tracker points
vertically upward – in this position the Rotation angle is 0).
SolarFarmer uses a negative rotation angle to indicate that the active faces of modules on the Tracker
are oriented to point to the East, regardless of hemisphere, and a positive rotation angle to indicate an
orientation to the west. Thus, the rotation angle will normally progress from negative in the morning to
positive in the evening.
Tracker System
A Layout will typically be composed of Trackers that are similar in design and share many common
dimensions and properties, but vary in length; there may be two, three or more different length Trackers
based on the same Tracker System in the layout, to enable the most efficient used of available space.
Tracker Template
A Tracker System must contain at least one Tracker Template based on the System. A Tracker Template
specifies the dimensions of an available Tracker within the system that are not common with other
members of the system – those quantities that define the length of the Tracker. Once a Tracker
Template has been defined, Trackers with the specified dimensions can be placed in the Layout.
SolarFarmer User Guide Page 69 of 77
APPENDIX B TRANSFERRING A SOFTWARE LICENSE
Once a SolarFarmer software license is installed onto a machine it is only valid for that specific machine.
You may transfer it to another machine by using a utility, the RUS application (launch the Software
License Remote Update Tool in the SolarFarmer program folder in the Windows Start Menu).
On the Recipient Machine:
1. Open the RUS application and click on the ‘Transfer License’ tab
2. Click the ‘…’ button next to the ‘Save recipient information to’ field.
3. Enter a filename to save the recipient information, ideally on a network drive that the source machine can also see).
4. Click the ‘Collect and Save Information’ button to generate the recipient *.id file.
On the Source Machine:
5. Open the RUS application and click on the ‘Transfer License’ tab
6. Click the ‘…’ button next to the ‘Read the recipient information file from’ field and choose the *.id file that was generated on the recipient machine above.
7. Click the ‘…’ button next to the ‘Generate the license transfer file to’ field and choose a transfer *.h2h filename (ideally in the same network folder).
8. Click the ‘Generate License Transfer File’ button to generate the *.h2h file. At this point, the license will no longer be available on the source machine.
On the Recipient Machine:
9. Open the RUS application again and click on the ‘Apply License File’ tab.
10. Click the ‘…’ button next to the ‘Update File’ field and choose the *.h2h file generated above.
11. Click the ‘Apply Update’ button to apply the transferred license to the recipient machine.

SolarFarmer User Guide Page 70 of 77
APPENDIX C RUN SOLARFARMER FROM THE COMMAND LINE
The SolarFarmer application can be run from the command line – useful for automation tasks. You can
open a specified workbook and run a procedure (script) in the opened workbook.
Open a command prompt in Windows. Navigate to the latest SolarFarmer installation folder (or use the
full path of the SolarFarmer executable), then use some or all of the following options:
-open filePath Open the specified workbook
-run procedureName Run the specified procedure (must also open a workbook that contains the
procedure)
-close Close SolarFarmer after completing the procedure (must run a procedure to use
this)
-invisible Does not open the application window
-nosplash Hides the splash screen
For example:
GH.SolarFarmer.exe -open "C:\Workbooks\My workbook.sfw" -run MyScript -close -invisible -nosplash

SolarFarmer User Guide Page 71 of 77
APPENDIX D SPECIFIC SCRIPTING EXAMPLES
D.1 Elevation Profile Tool
You can access the elevation profile tool functionality (Section 10.1.4) from the scripting interface too.
There are two functions in the Toolbox class to use:
/// <summary> /// Gets the elevation profile statistics (in the workbook coordinates projection). /// </summary> /// <param name="startPoint">The start point (in workbook coordinates).</param> /// <param name="endPoint">The end point (in workbook coordinates).</param> /// <returns>An ElevationProfileStatistics object for the elevation profile along the line.</returns> ElevationProfileStatistics Toolbox.GetElevationProfileStatistics ( IReadable2DLocation startPoint, // in the workbook local projection IReadable2DLocation endPoint); // in the workbook local projection /// <summary> /// Gets the elevation profile statistics for the specified points (in latitude/longitude format) /// </summary> /// <param name="startPointInLatLon">The start point (in lat lon).</param> /// <param name="endPointInLatLon">The end point (in lat lon).</param> /// <returns>An ElevationProfileStatistics object for the elevation profile along the line.</returns> ElevationProfileStatistics Toolbox.GetElevationProfileStatisticsForLatLonPoints( IReadable2DLocation startPointInLatLon, // in lat/lon (WGS84) IReadable2DLocation endPointInLatLon); // in lat/lon (WGS84)
Choose the appropriate one that you have coordinates for (depending on where you get the coordinates).
Both return an ElevationProfileStatistics object. This has the following properties:
Property Type Units Description
PlanViewDistance double m Gets the plan view distance (2D distance) from the start to
the end point
FollowGroundDistance double m Gets the follow-ground distance (distance along the surface of the ground - the sum of the lengths of all the sections along the profile line).
MaxElevation double m Gets the maximum elevation
MinElevation double m Gets the minimum elevation
AverageElevation double m Gets the average elevation
ElevationGain double m Gets the elevation gain (across the whole line)
ElevationLoss double m Gets the elevation loss (across the whole line)
NetElevationGain double m Gets the net elevation gain
MaxUpSlope double % Gets the maximum up slope
MaxDownSlope double % Gets the maximum down slope
AverageUpSlope double % Gets the average up slope
AverageDownSlope double % Gets the average down slope
SamplePoints List<ElevationProfileSamplePoint> - Gets the list of sample points along the elevation profile line

SolarFarmer User Guide Page 72 of 77
There are currently 101 sample points along the line. The ElevationProfileSamplePoint class has the
following properties:
Property Type Units Description
DistanceFromStart double m Gets the distance from the start point of the line
ElevationAtPoint double m Gets the elevation at point (in metres above sea level)
SlopeAtPoint double % Gets the slope at point (percentage)
Here is a simple example script that uses both versions (if copying this code you will have to use start
and end points at locations within your workbook) and outputs a summary of each statistics object:
public void Execute() { // Use start and end points in the Workbook projection (e.g. UTM) Location startPointInWorkbookProjection = new Location(3564093.6, 2065754.3); Location endPointInWorkbookProjection = new Location(3564528.2, 2065414.5); ElevationProfileStatistics statistics = Toolbox.GetElevationProfileStatistics(startPointInWorkbookProjection, endPointInWorkbookProjection); Toolbox.Log("--- Summary of statistics when getting the statistics from two points in the workbook projection"); OutputStatisticsSummary(statistics); // Use start and end points in latitude/longitude (WGS84) format // (don't forget when creating a Location, use the longitude (x) and latitude (y) Location startPointInLatLong = new Location(-77.752087, 38.252560); Location endPointInLatLong = new Location(-77.7566312, 38.254795); ElevationProfileStatistics statistics2 = Toolbox.GetElevationProfileStatisticsForLatLonPoints(startPointInLatLong, endPointInLatLong); Toolbox.Log("--- Summary of statistics when getting the statistics from two points in latitude/longitude"); OutputStatisticsSummary(statistics2); } private void OutputStatisticsSummary(ElevationProfileStatistics statistics) { Toolbox.Log(string.Format("Plan view distance: {0:0.##} m", statistics.PlanViewDistance)); Toolbox.Log(string.Format("Max up slope: {0:0.##} %", statistics.MaxUpSlope)); Toolbox.Log(string.Format("Max down slope: {0:0.##} %", statistics.MaxDownSlope)); Toolbox.Log(string.Format("Average up slope: {0:0.##} %", statistics.AverageUpSlope)); Toolbox.Log(string.Format("Average down slope: {0:0.##} %", statistics.AverageDownSlope)); Toolbox.Log(string.Format("Net elevation gain: {0:0.##} m", statistics.NetElevationGain)); Toolbox.Log(string.Format("Point 15 slope: {0:0.##} %", statistics.SamplePoints[15].SlopeAtPoint)); Toolbox.Log(string.Format("Point 15 dist from start: {0:0.##} m", statistics.SamplePoints[15].DistanceFromStart)); Toolbox.Log(string.Format("Point 15 elevation: {0:0.##} m", statistics.SamplePoints[15].ElevationAtPoint));
}
And might give something similar to the following output:
INFO 2019-02-21 15:21:26,430 - --- Summary of statistics when getting the statistics from two points in the workbook projection INFO 2019-02-21 15:21:26,520 - Plan view distance: 551.67 m INFO 2019-02-21 15:21:26,521 - Max up slope: 17.1 % INFO 2019-02-21 15:21:26,522 - Max down slope: -20.78 % INFO 2019-02-21 15:21:26,522 - Average up slope: 2.83 % INFO 2019-02-21 15:21:26,523 - Average down slope: -4.54 %

SolarFarmer User Guide Page 73 of 77
INFO 2019-02-21 15:21:26,524 - Net elevation gain: -12.03 m INFO 2019-02-21 15:21:26,524 - Point 15 slope: -1.76 % INFO 2019-02-21 15:21:26,525 - Point 15 dist from start: 82.75 m INFO 2019-02-21 15:21:26,525 - Point 15 elevation: 124.33 m INFO 2019-02-21 15:21:26,534 - --- Summary of statistics when getting the statistics from two points in latitude/longitude INFO 2019-02-21 15:21:26,535 - Plan view distance: 468.76 m INFO 2019-02-21 15:21:26,535 - Max up slope: 41.88 % INFO 2019-02-21 15:21:26,536 - Max down slope: -43.68 % INFO 2019-02-21 15:21:26,536 - Average up slope: 7.82 % INFO 2019-02-21 15:21:26,537 - Average down slope: -5.98 % INFO 2019-02-21 15:21:26,538 - Net elevation gain: 2.36 m INFO 2019-02-21 15:21:26,538 - Point 15 slope: 23.33 % INFO 2019-02-21 15:21:26,539 - Point 15 dist from start: 70.31 m INFO 2019-02-21 15:21:26,539 - Point 15 elevation: 106.7 m
There is also a more complicated example script in the SolarFarmer installation folder. This extracts all
the line placemarks in a Google Earth .kml file, calls the elevation profile functions on each and outputs
the statistics to a .tsv (Tab Separated) file.
To use this – open Google Earth (installed separately!), create some line placemarks at locations you are
interested in, save the .kmz file. Then using a zip extractor tool (e.g. 7-Zip or WinZip), extract the files
from the .kmz archive to another folder. There should be a “doc.kml” file inside. This will contain the
line placemark details – which this script can read.
To load this sample script into SolarFarmer:
1. Open the script editor in SolarFarmer (using the button in the Quick Access Toolbar).
2. Press the ‘Import’ button in the script editor:
3. Select the following script in the installation folder of the version of SolarFarmer that you are
using:
"C:\Program Files\<SolarFarmer Install Folder>\Scripts\ElevationProfile\ElevationProfileScript.cs"
4. Save the script with the suggested name (or choose another name). This will add the imported
script in the current workbook.
5. Follow the instructions in the comment at the top of the imported script (set the path to the .kml
file and the output folder).
6. Run the script.
The .tsv file should be created and saved to the folder that you specify.
Remember to save the workbook after you have updated the script, otherwise the script and the changes
you make won’t be saved for when you reopen the workbook.
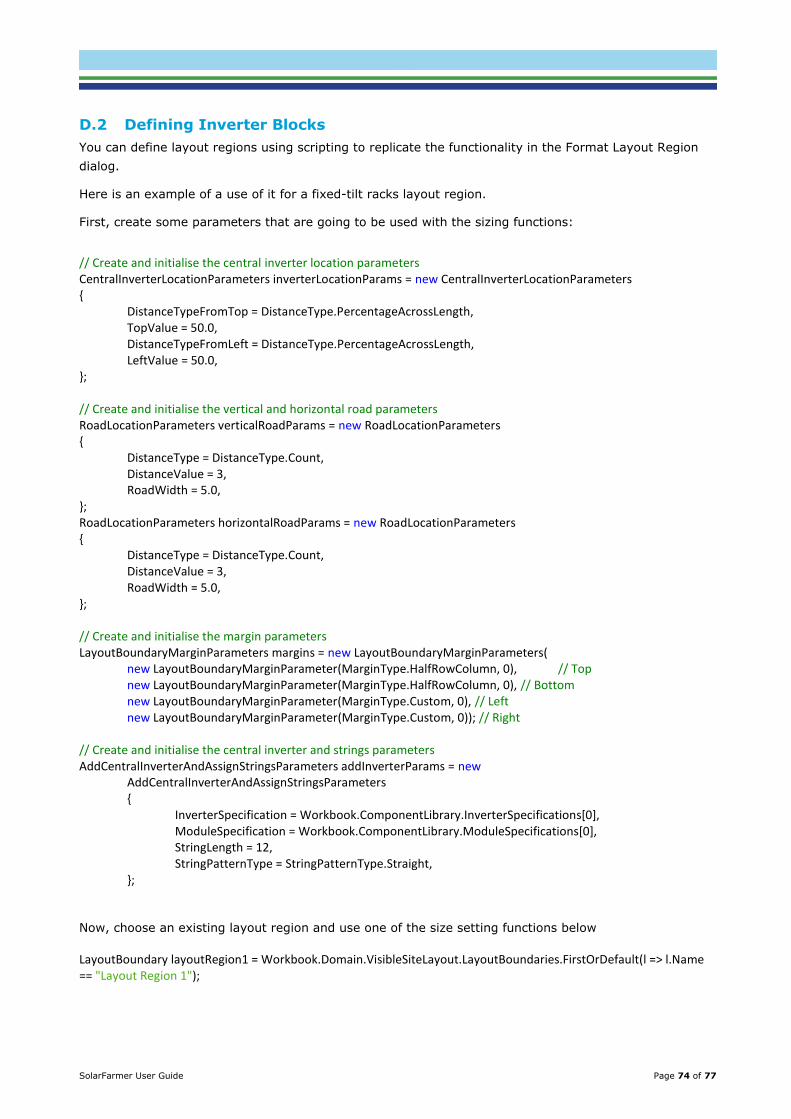
SolarFarmer User Guide Page 74 of 77
D.2 Defining Inverter Blocks
You can define layout regions using scripting to replicate the functionality in the Format Layout Region
dialog.
Here is an example of a use of it for a fixed-tilt racks layout region.
First, create some parameters that are going to be used with the sizing functions:
// Create and initialise the central inverter location parameters CentralInverterLocationParameters inverterLocationParams = new CentralInverterLocationParameters { DistanceTypeFromTop = DistanceType.PercentageAcrossLength, TopValue = 50.0, DistanceTypeFromLeft = DistanceType.PercentageAcrossLength, LeftValue = 50.0, }; // Create and initialise the vertical and horizontal road parameters RoadLocationParameters verticalRoadParams = new RoadLocationParameters { DistanceType = DistanceType.Count, DistanceValue = 3, RoadWidth = 5.0, }; RoadLocationParameters horizontalRoadParams = new RoadLocationParameters { DistanceType = DistanceType.Count, DistanceValue = 3, RoadWidth = 5.0, }; // Create and initialise the margin parameters LayoutBoundaryMarginParameters margins = new LayoutBoundaryMarginParameters( new LayoutBoundaryMarginParameter(MarginType.HalfRowColumn, 0), // Top new LayoutBoundaryMarginParameter(MarginType.HalfRowColumn, 0), // Bottom new LayoutBoundaryMarginParameter(MarginType.Custom, 0), // Left new LayoutBoundaryMarginParameter(MarginType.Custom, 0)); // Right // Create and initialise the central inverter and strings parameters AddCentralInverterAndAssignStringsParameters addInverterParams = new AddCentralInverterAndAssignStringsParameters { InverterSpecification = Workbook.ComponentLibrary.InverterSpecifications[0], ModuleSpecification = Workbook.ComponentLibrary.ModuleSpecifications[0], StringLength = 12, StringPatternType = StringPatternType.Straight, }; Now, choose an existing layout region and use one of the size setting functions below
LayoutBoundary layoutRegion1 = Workbook.Domain.VisibleSiteLayout.LayoutBoundaries.FirstOrDefault(l => l.Name == "Layout Region 1");

SolarFarmer User Guide Page 75 of 77
The 3 different ways to set the size of the layout region.
For the following arguments, if you leave them null it will use the existing values on the layout region
- pitch, tilt, rack/tracker system specification
For the following arguments, if you leave them null it won't apply the parameters
- add inverter, inverter location, margins, vertical and horizontal roads
layoutRegion1.SetRowsColumns( 8, // rows 6, // columns 10, // pitch null, // tilt null, // rack system specification addInverterParams, inverterLocationParams, margins, verticalRoadParams, // vertical road parameters null); // horizontal road parameters); layoutRegion1.SetSizeFromDcAcRatio( 1.5, // DC/AC Ratio 13, // pitch null, // tilt null, // rack system specification addInverterParams,
inverterLocationParams, margins, null, // vertical road parameters null); // horizontal road parameters); layoutRegion1.SetSize( 300, // width (in metres) 250, // height (in metres) null, // pitch null, // tilt null, // rack system specification addInverterParams, inverterLocationParams, // inverter location parameters margins, // margin parameters verticalRoadParams, // vertical road parameters horizontalRoadParams); // horizontal road parameters
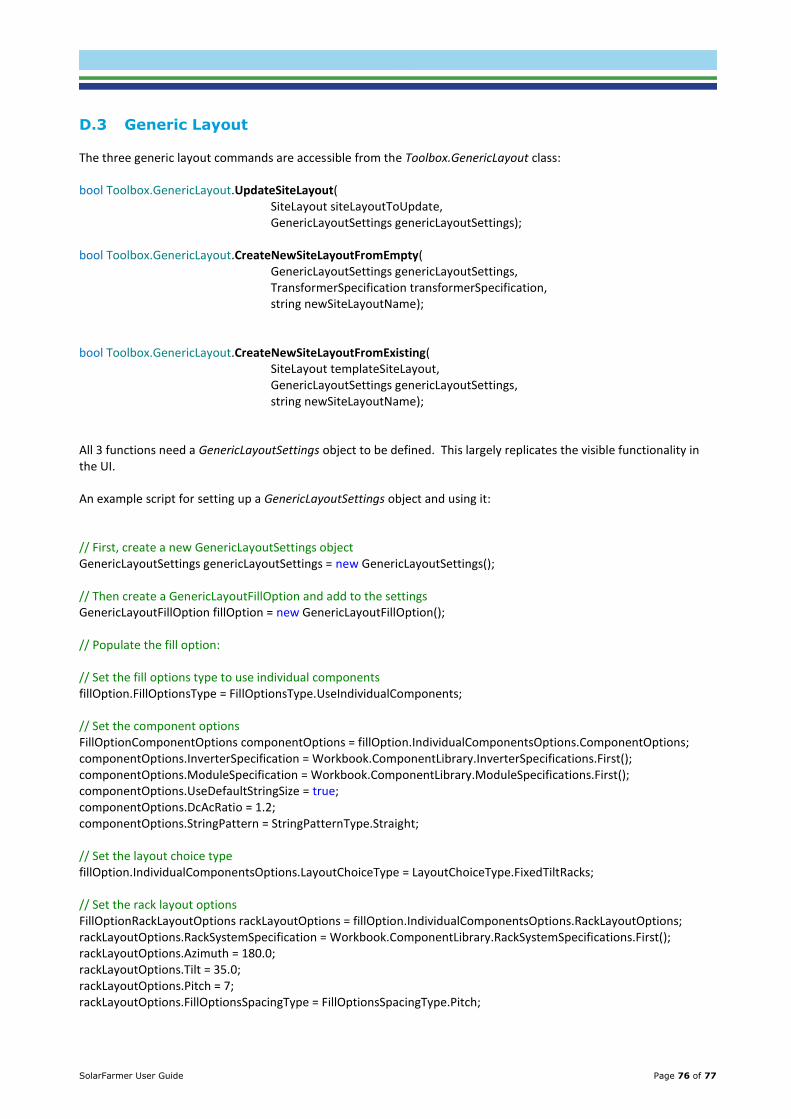
SolarFarmer User Guide Page 76 of 77
D.3 Generic Layout The three generic layout commands are accessible from the Toolbox.GenericLayout class: bool Toolbox.GenericLayout.UpdateSiteLayout(
SiteLayout siteLayoutToUpdate, GenericLayoutSettings genericLayoutSettings);
bool Toolbox.GenericLayout.CreateNewSiteLayoutFromEmpty(
GenericLayoutSettings genericLayoutSettings, TransformerSpecification transformerSpecification, string newSiteLayoutName);
bool Toolbox.GenericLayout.CreateNewSiteLayoutFromExisting(
SiteLayout templateSiteLayout, GenericLayoutSettings genericLayoutSettings, string newSiteLayoutName);
All 3 functions need a GenericLayoutSettings object to be defined. This largely replicates the visible functionality in the UI. An example script for setting up a GenericLayoutSettings object and using it: // First, create a new GenericLayoutSettings object GenericLayoutSettings genericLayoutSettings = new GenericLayoutSettings(); // Then create a GenericLayoutFillOption and add to the settings GenericLayoutFillOption fillOption = new GenericLayoutFillOption(); // Populate the fill option: // Set the fill options type to use individual components fillOption.FillOptionsType = FillOptionsType.UseIndividualComponents; // Set the component options FillOptionComponentOptions componentOptions = fillOption.IndividualComponentsOptions.ComponentOptions; componentOptions.InverterSpecification = Workbook.ComponentLibrary.InverterSpecifications.First(); componentOptions.ModuleSpecification = Workbook.ComponentLibrary.ModuleSpecifications.First(); componentOptions.UseDefaultStringSize = true; componentOptions.DcAcRatio = 1.2; componentOptions.StringPattern = StringPatternType.Straight; // Set the layout choice type fillOption.IndividualComponentsOptions.LayoutChoiceType = LayoutChoiceType.FixedTiltRacks; // Set the rack layout options FillOptionRackLayoutOptions rackLayoutOptions = fillOption.IndividualComponentsOptions.RackLayoutOptions; rackLayoutOptions.RackSystemSpecification = Workbook.ComponentLibrary.RackSystemSpecifications.First(); rackLayoutOptions.Azimuth = 180.0; rackLayoutOptions.Tilt = 35.0; rackLayoutOptions.Pitch = 7; rackLayoutOptions.FillOptionsSpacingType = FillOptionsSpacingType.Pitch;

SolarFarmer User Guide Page 77 of 77
// Now add this fill option to the settings genericLayoutSettings.FillOptions.Add(fillOption); // Set up the area limitation // Make sure you use one of the fill options already in the settings object - not a new orphan fill option genericLayoutSettings.AreaLimitation.LimitToAllLayoutRegionsFillOption = genericLayoutSettings.FillOptions.First(); genericLayoutSettings.AreaLimitation.AreaLimitationType = AreaLimitationType.LimitByAllExistingLayoutRegions; // Set up the electrical limitation genericLayoutSettings.ElectricalLimitation.ElectricalLimitationType = ElectricalLimitationType.MaxAcCapacity; genericLayoutSettings.ElectricalLimitation.MaxAcCapacityInMw = 4.2; // Choose a site layout to update SiteLayout siteLayoutToUpdate = Workbook.Domain.SiteLayouts.FirstOrDefault(s => s.Name == "Site Layout 1"); // Call the generic layout function to update the site layout with the settings Toolbox.GenericLayout.UpdateSiteLayout(siteLayoutToUpdate, genericLayoutSettings);