A user-friendly general-purpose predictive software package for food safety
13
A user-friendly general-purpose predictive software package for food safety Amit Halder a , Ashish Dhall a , Ashim K. Datta a,⇑ , D. Glenn Black b , P.M. Davidson b , Jiajie Li b , Svetlana Zivanovic b a Department of Biological and Environmental Engineering, Riley Robb Hall, Cornell University, Ithaca, NY 14853, USA b Department of Food Science and Technology, 2605 River Dr., University of Tennessee, Knoxville, TN 37996-4591, USA article info Article history: Received 9 June 2010 Received in revised form 15 November 2010 Accepted 19 November 2010 Available online 7 December 2010 Keywords: Food safety Predictive software Process modeling GUI Growth Inactivation Kinetics abstract Computer-aided engineering tools can help speed up food product, process and equipment design by making it easier to check ‘‘what if’’ scenarios, much as such tools have improved productivity in other industries. In particular, food safety is a critical area where such predictive tools can have great impact. A realistic, integrated and comprehensive software has been developed that can simulate a food process and its safety by combining a fundamental, physics-based model of the process with the kinetics of microbiological and chemical changes during processing to provide needed information at any time and at any location in the food during processing. Compositions for a large number of foods are integrated into the software, and therefore, composition-based prediction of thermophysical properties, needed for the model, can be obtained. Microbiological and chemical kinetic databases that are also built-in can cover many practical situations, based on the grouping of foods. An intuitive graphical user interface has been built with those in the food sector in mind. Ó 2010 Elsevier Ltd. All rights reserved. 1. Introduction Computer-aided engineering (CAE) tools, where physical reality is replaced by its equivalent computer model, and which allows implementation of ‘‘what if’’ scenarios more quickly, can go a long way to increasing the efficiency and competitiveness of food prod- uct, process and equipment design (see, e.g., Burnham et al., 2008). However, CAE tools that are customized to food processing and integrate several disciplines (e.g., engineering, food science, food technology, etc.), need to be appropriately developed (Datta, 2008b; Sablani, 2008; Marks, 2008; Van Boekel, 2008; Banga et al., 2008; Jousse, 2008). CAE tools can improve safety and qual- ity, reduce costs and decrease ‘‘time to market.’’ The same tools that have made automobile, airplane and chemical process designs remarkably more efficient (Ivester, 2008) are potentially available to the food sector. However, the quality and safety aspects of food processes, and the characteristics of food materials, have many un- ique features compared with those in any other manufacturing sector. To make computer-aided product and process engineering more of a reality for food, so that the food sector can reap the ben- efits of this technology, an integrated, robust and user-friendly CAE tool has to be developed. This has been an underlying desire in the food community, as expressed in many specialized international conferences and workshops (IFT, 2009; Model-It, 2005; Eurotherm Seminar 77, 2005; FOODSIM, 2004; IFT Annual Meeting et al., 2003; AFoT, 2003; ISFTFPFFS, 2003). In order for the food sector to increase CAE use, available gener- ic simulation software needs to be customized for food applica- tions, e.g., by delivering solutions to sets of equations of relevance to food processing. The need for food sector is not unique in this sense—such customization is required for other industries and involves very significant developmental time and cost. How- ever, the current user base for the food industry is small enough that software companies are reluctant to invest the resources needed to develop specific capabilities of interest to food process- ing. The user base, of course, cannot increase until ready-to-use tools are available. This is a chicken-and-egg situation and the only solution is to start somewhere. The work presented here is such an attempt and it became possible with funding from the United States Department of Agriculture’s National Integrated Food Safety Program for development of a software package to simulate food safety. 1.1. Physics-based models in CAE software Typically, the basis for CAE software is fundamental physics- based or mechanistic models of processes, as opposed to observation-based models that are typically relationships fitted to observations. The relative advantages of these two broad types of models have been discussed at length (Datta and Sablani, 0260-8774/$ - see front matter Ó 2010 Elsevier Ltd. All rights reserved. doi:10.1016/j.jfoodeng.2010.11.021 ⇑ Corresponding author. Tel.: +1 607 255 2482; fax: +1 607 255 4080. E-mail address: [email protected] (A.K. Datta). Journal of Food Engineering 104 (2011) 173–185 Contents lists available at ScienceDirect Journal of Food Engineering journal homepage: www.elsevier.com/locate/jfoodeng
-
Upload
independent -
Category
Documents
-
view
3 -
download
0
Transcript of A user-friendly general-purpose predictive software package for food safety
Journal of Food Engineering 104 (2011) 173–185
Contents lists available at ScienceDirect
Journal of Food Engineering
journal homepage: www.elsevier .com/ locate / j foodeng
A user-friendly general-purpose predictive software package for food safety
Amit Halder a, Ashish Dhall a, Ashim K. Datta a,⇑, D. Glenn Black b, P.M. Davidson b, Jiajie Li b,Svetlana Zivanovic b
a Department of Biological and Environmental Engineering, Riley Robb Hall, Cornell University, Ithaca, NY 14853, USAb Department of Food Science and Technology, 2605 River Dr., University of Tennessee, Knoxville, TN 37996-4591, USA
a r t i c l e i n f o a b s t r a c t
Article history:Received 9 June 2010Received in revised form 15 November 2010Accepted 19 November 2010Available online 7 December 2010
Keywords:Food safetyPredictive softwareProcess modelingGUIGrowthInactivationKinetics
0260-8774/$ - see front matter � 2010 Elsevier Ltd. Adoi:10.1016/j.jfoodeng.2010.11.021
⇑ Corresponding author. Tel.: +1 607 255 2482; faxE-mail address: [email protected] (A.K. Datta).
Computer-aided engineering tools can help speed up food product, process and equipment design bymaking it easier to check ‘‘what if’’ scenarios, much as such tools have improved productivity in otherindustries. In particular, food safety is a critical area where such predictive tools can have great impact.A realistic, integrated and comprehensive software has been developed that can simulate a food processand its safety by combining a fundamental, physics-based model of the process with the kinetics ofmicrobiological and chemical changes during processing to provide needed information at any timeand at any location in the food during processing. Compositions for a large number of foods are integratedinto the software, and therefore, composition-based prediction of thermophysical properties, needed forthe model, can be obtained. Microbiological and chemical kinetic databases that are also built-in cancover many practical situations, based on the grouping of foods. An intuitive graphical user interfacehas been built with those in the food sector in mind.
� 2010 Elsevier Ltd. All rights reserved.
1. Introduction
Computer-aided engineering (CAE) tools, where physical realityis replaced by its equivalent computer model, and which allowsimplementation of ‘‘what if’’ scenarios more quickly, can go a longway to increasing the efficiency and competitiveness of food prod-uct, process and equipment design (see, e.g., Burnham et al., 2008).However, CAE tools that are customized to food processing andintegrate several disciplines (e.g., engineering, food science, foodtechnology, etc.), need to be appropriately developed (Datta,2008b; Sablani, 2008; Marks, 2008; Van Boekel, 2008; Bangaet al., 2008; Jousse, 2008). CAE tools can improve safety and qual-ity, reduce costs and decrease ‘‘time to market.’’ The same toolsthat have made automobile, airplane and chemical process designsremarkably more efficient (Ivester, 2008) are potentially availableto the food sector. However, the quality and safety aspects of foodprocesses, and the characteristics of food materials, have many un-ique features compared with those in any other manufacturingsector. To make computer-aided product and process engineeringmore of a reality for food, so that the food sector can reap the ben-efits of this technology, an integrated, robust and user-friendly CAEtool has to be developed. This has been an underlying desire in thefood community, as expressed in many specialized international
ll rights reserved.
: +1 607 255 4080.
conferences and workshops (IFT, 2009; Model-It, 2005; EurothermSeminar 77, 2005; FOODSIM, 2004; IFT Annual Meeting et al.,2003; AFoT, 2003; ISFTFPFFS, 2003).
In order for the food sector to increase CAE use, available gener-ic simulation software needs to be customized for food applica-tions, e.g., by delivering solutions to sets of equations ofrelevance to food processing. The need for food sector is not uniquein this sense—such customization is required for other industriesand involves very significant developmental time and cost. How-ever, the current user base for the food industry is small enoughthat software companies are reluctant to invest the resourcesneeded to develop specific capabilities of interest to food process-ing. The user base, of course, cannot increase until ready-to-usetools are available. This is a chicken-and-egg situation and the onlysolution is to start somewhere. The work presented here is such anattempt and it became possible with funding from the UnitedStates Department of Agriculture’s National Integrated Food SafetyProgram for development of a software package to simulate foodsafety.
1.1. Physics-based models in CAE software
Typically, the basis for CAE software is fundamental physics-based or mechanistic models of processes, as opposed toobservation-based models that are typically relationships fittedto observations. The relative advantages of these two broad typesof models have been discussed at length (Datta and Sablani,
174 A. Halder et al. / Journal of Food Engineering 104 (2011) 173–185
2007; Datta, 2008a; Sablani, 2008). The phenomenal growth incomputing power and its associated user-friendliness have al-lowed physics-based models to be highly realistic by includingmore and more of the detailed physics and have fueled rapidgrowth in the use of models in product, process, and equipmentdesign and research in other sectors. The advantages of a phys-ics-based model include: (1) a reduction in the number of experi-ments, thus reducing time and expenses; (2) providing immenseinsight into the process that might not even be possible withexperimentation; (3) process optimization; (4) predictive capabil-ity, such as ways of performing ‘‘what if’’ scenarios; and (5) provid-ing improved process automation and control capabilities (Datta,2008a). On the downside, physics-based models are more re-stricted to the food process itself rather than food quality or foodsafety, since physics-based models require precise relationshipsbetween quality/safety and the process parameters, which are gen-erally unavailable. Observation-based models can relate quality/safety to processing parameters more easily as they do not requiredetailed knowledge of the underlying physical process. However,observation-based models are primarily ‘‘blackbox’’ models thatwould not provide insight and they are difficult to generalize intoa framework for use in multiple processes. As mechanistic modelsof quality and safety are continually improved (e.g., Van Boekel,2008) these improvements can be easily integrated with physics-based process models to provide quality and safety parametersthat are readily usable by the food designer.
Modeling food quality and safety requires addressing issuessuch as: (1) complex multiphase heat and mass transfer such asevaporation and multiphase flow as in aseptic processing; (2) mul-tiphysics such as combined microwave or microwave-infraredheating; (3) significant changes in material property during pro-cessing; (4) significant dimensional changes and associated phys-ics; (5) considerable variation (batch to batch or within the samematerial) in material properties due to a material’s biological ori-gin; (6) a large number of new processes continually being intro-duced; and (7) a lack of kinetic data for final variables of interest(quality and safety) as they relate to temperature and moisture(Datta, 2008a). An additional challenge in the food industry is thattechnical professionals who are often in charge of these issues havetraining in chemistry and/or microbiology as opposed to physics-based mathematical modeling. By training, the technical profes-sionals in the food industry are more likely to be accustomed toobservation-based models. These characteristics of food processingpoint to the requirements of a food CAE software in two broaddirections—useful software would need to consider the complexi-ties in food and processes that are unique; and such softwareshould integrate many of the details and at the same time hide it-self under a user interface that is as simple as possible. For com-puter-aided food process engineering (CAE applied to foodprocesses), it would be ideal to have a scenario where a technicalperson, with minimal knowledge of the physics of the processand computational aspects, can use a few clicks of a mouse to de-fine a practical food process. For example, such a user could clickand choose among various container types, food material, andheating systems and ask the computer to provide the heating tem-perature needed for optimum quality in a sterilization process. Thecomputer would need to formulate the physical problem (steriliza-tion) into a mathematical one (equations), decide the best solutionmethod, and finally do an optimization. For food processing appli-cations, this has not yet been a reality.
Most of the modeling or CAE effort is at the research stage (e.g.,Mittal, 1997; Scott and Richardson, 1997; Datta, 1998; Tijskenset al., 2001; Irudayaraj, 2001; Welti-Chanes et al., 2002; Sun,2007; Sablani et al., 2007) and does not migrate to production ormass use in design by practicing scientists and engineers in industry,extension or education. Available software (mostly computational
fluid dynamics (CFD) software that solves fluid flow, heat transferand mass transfer problems) cannot be readily used for food for sev-eral reasons (Datta, 2008a). First, the detailed first-principle-basedand experimentally validated formulations of more complex pro-cesses such as frying are generally unavailable. Second, when theproblem formulations can be made, there are unique aspects of foodprocesses (such as strong evaporation in the food matrix) that can behard to implement in a typical commercial software. Third, when theformulation is available and the software can solve it, we often runinto difficulties obtaining the appropriate material properties forspecific food conditions. Until these items are resolved and hiddenfrom a user through user-friendly interface, simulation will continueto be research rather than design project.
1.2. Current status of CAE in food processing
The current state of the introduction of CAE into the food indus-try can be described as follows: Larger food companies that can in-vest more resources are doing this (Jousse, 2008) but, for otherthan the largest multinationals, modeling is often not seen as anefficient alternative. Smaller companies that do not maintain CAEor simulation infrastructure sometimes utilize consultants to con-tract out simulation work. Such consultants can be those special-ized for food industry (e.g., www.airflowsciences.com) or thegeneric CAE software companies themselves. Customized softwareof the type described in this manuscript can go a long way towardestablishing more widespread use of CAE in the food sector. Someefforts are underway to develop customized software (Torres,2003; CFDfood, 2004; Otles and Onal, 2004; Verdurmen et al.,2006; PROFOOD, 2009). To the best of our knowledge, these soft-ware applications are still quite limited in terms of the physicsthey include. For example, they may include only diffusional heatand mass transfer. There are microbiological modeling software(e.g., ComBase-PMP, 2003; Peleg, 2010) but they typically do notinclude the process model. In a related area, kinetic modeling offood quality has been studied extensively (Van Boekel, 2008) butnot integrated in simulation software with process models.
Thus, a comprehensive software package that integrates realis-tic processes, products and microbiological aspects has not beenavailable. However, such a software package has now been devel-oped and this manuscript presents the underlying scientific princi-ples for a fundamentally-based, easy-to-use, universal softwarepredictive tool that is useful in a broad range of situations in thefood sector (production, processing, distribution, preparation).The developed software can (1) simulate a large variety of foodprocesses, and (2) integrate the process models with the microbi-ological and chemical safety models in order to predict safetyinformation for a wide variety of food processes.
The manuscript is organized by first describing the software.This is followed by a discussion of the development steps for thesoftware: (1) problem formulation for food processes; (2) integra-tion of food type, composition and property estimation; (3) inte-gration of microbiology and chemical safety simulation; (4)model validation; and (5) a short overview of software implemen-tation and the user interface.
2. Outline of the software package
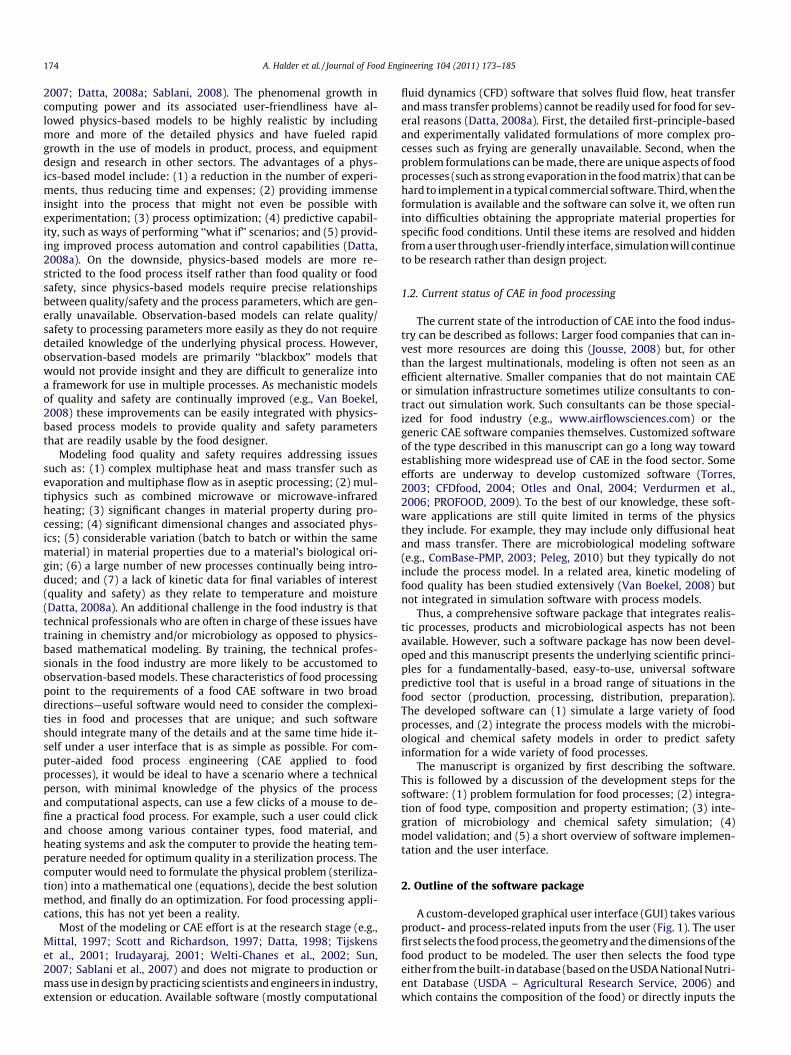
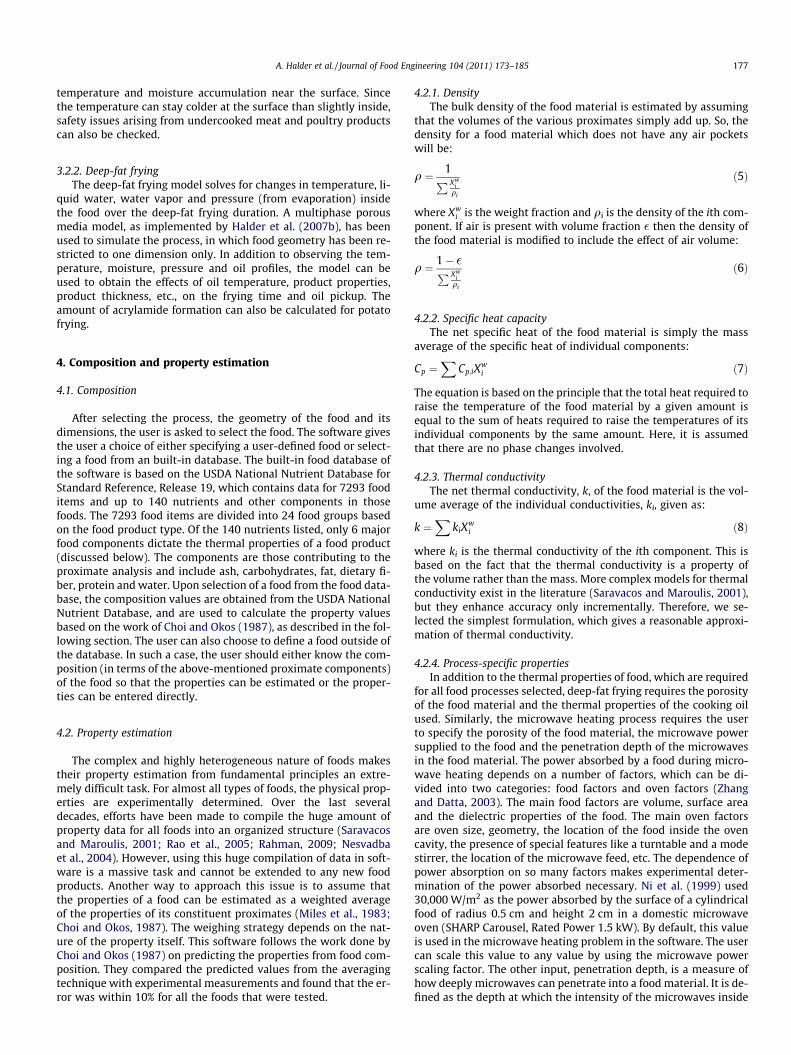
A custom-developed graphical user interface (GUI) takes variousproduct- and process-related inputs from the user (Fig. 1). The userfirst selects the food process, the geometry and the dimensions of thefood product to be modeled. The user then selects the food typeeither from the built-in database (based on the USDA National Nutri-ent Database (USDA – Agricultural Research Service, 2006) andwhich contains the composition of the food) or directly inputs the
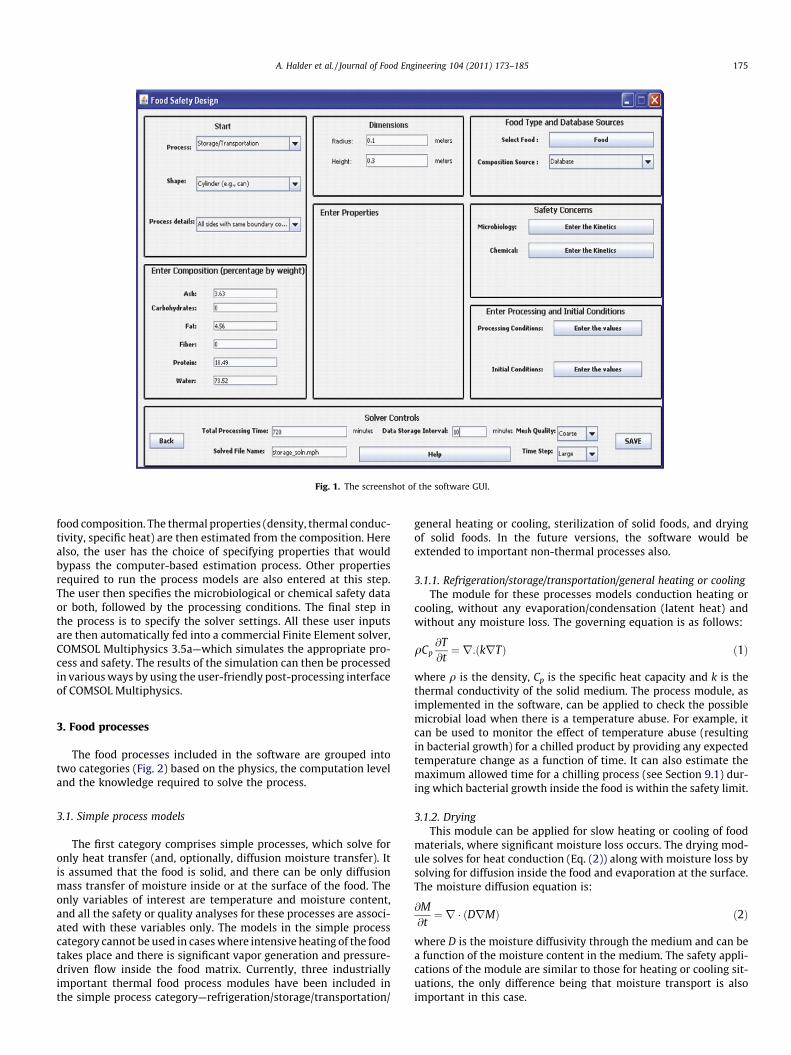
Fig. 1. The screenshot of the software GUI.
A. Halder et al. / Journal of Food Engineering 104 (2011) 173–185 175
food composition. The thermal properties (density, thermal conduc-tivity, specific heat) are then estimated from the composition. Herealso, the user has the choice of specifying properties that wouldbypass the computer-based estimation process. Other propertiesrequired to run the process models are also entered at this step.The user then specifies the microbiological or chemical safety dataor both, followed by the processing conditions. The final step inthe process is to specify the solver settings. All these user inputsare then automatically fed into a commercial Finite Element solver,COMSOL Multiphysics 3.5a—which simulates the appropriate pro-cess and safety. The results of the simulation can then be processedin various ways by using the user-friendly post-processing interfaceof COMSOL Multiphysics.
3. Food processes
The food processes included in the software are grouped intotwo categories (Fig. 2) based on the physics, the computation leveland the knowledge required to solve the process.
3.1. Simple process models
The first category comprises simple processes, which solve foronly heat transfer (and, optionally, diffusion moisture transfer). Itis assumed that the food is solid, and there can be only diffusionmass transfer of moisture inside or at the surface of the food. Theonly variables of interest are temperature and moisture content,and all the safety or quality analyses for these processes are associ-ated with these variables only. The models in the simple processcategory cannot be used in cases where intensive heating of the foodtakes place and there is significant vapor generation and pressure-driven flow inside the food matrix. Currently, three industriallyimportant thermal food process modules have been included inthe simple process category—refrigeration/storage/transportation/
general heating or cooling, sterilization of solid foods, and dryingof solid foods. In the future versions, the software would beextended to important non-thermal processes also.
3.1.1. Refrigeration/storage/transportation/general heating or coolingThe module for these processes models conduction heating or
cooling, without any evaporation/condensation (latent heat) andwithout any moisture loss. The governing equation is as follows:
qCp@T@t¼ r:ðkrTÞ ð1Þ
where q is the density, Cp is the specific heat capacity and k is thethermal conductivity of the solid medium. The process module, asimplemented in the software, can be applied to check the possiblemicrobial load when there is a temperature abuse. For example, itcan be used to monitor the effect of temperature abuse (resultingin bacterial growth) for a chilled product by providing any expectedtemperature change as a function of time. It can also estimate themaximum allowed time for a chilling process (see Section 9.1) dur-ing which bacterial growth inside the food is within the safety limit.
3.1.2. DryingThis module can be applied for slow heating or cooling of food
materials, where significant moisture loss occurs. The drying mod-ule solves for heat conduction (Eq. (2)) along with moisture loss bysolving for diffusion inside the food and evaporation at the surface.The moisture diffusion equation is:
@M@t¼ r � ðDrMÞ ð2Þ
where D is the moisture diffusivity through the medium and can bea function of the moisture content in the medium. The safety appli-cations of the module are similar to those for heating or cooling sit-uations, the only difference being that moisture transport is alsoimportant in this case.
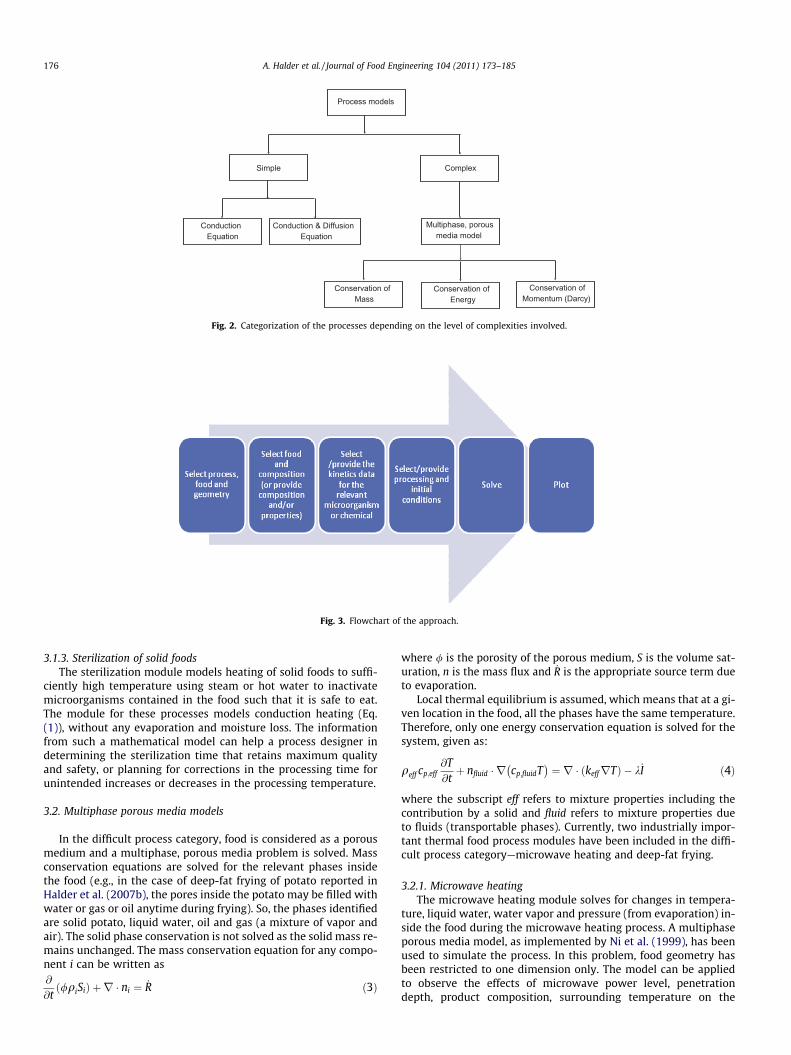
Process models
Simple Complex
Conduction Equation
Conduction & Diffusion Equation
Multiphase, porousmedia model
Conservation ofMass
Conservation ofEnergy
Conservation ofMomentum (Darcy)
Fig. 2. Categorization of the processes depending on the level of complexities involved.
Fig. 3. Flowchart of the approach.
176 A. Halder et al. / Journal of Food Engineering 104 (2011) 173–185
3.1.3. Sterilization of solid foodsThe sterilization module models heating of solid foods to suffi-
ciently high temperature using steam or hot water to inactivatemicroorganisms contained in the food such that it is safe to eat.The module for these processes models conduction heating (Eq.(1)), without any evaporation and moisture loss. The informationfrom such a mathematical model can help a process designer indetermining the sterilization time that retains maximum qualityand safety, or planning for corrections in the processing time forunintended increases or decreases in the processing temperature.
3.2. Multiphase porous media models
In the difficult process category, food is considered as a porousmedium and a multiphase, porous media problem is solved. Massconservation equations are solved for the relevant phases insidethe food (e.g., in the case of deep-fat frying of potato reported inHalder et al. (2007b), the pores inside the potato may be filled withwater or gas or oil anytime during frying). So, the phases identifiedare solid potato, liquid water, oil and gas (a mixture of vapor andair). The solid phase conservation is not solved as the solid mass re-mains unchanged. The mass conservation equation for any compo-nent i can be written as@
@tð/qiSiÞ þ r � ni ¼ _R ð3Þ
where / is the porosity of the porous medium, S is the volume sat-uration, n is the mass flux and _R is the appropriate source term dueto evaporation.
Local thermal equilibrium is assumed, which means that at a gi-ven location in the food, all the phases have the same temperature.Therefore, only one energy conservation equation is solved for thesystem, given as:
qeff cp;eff@T@tþ nfluid � r cp;fluidT
� �¼ r � ðkeffrTÞ � k_I ð4Þ
where the subscript eff refers to mixture properties including thecontribution by a solid and fluid refers to mixture properties dueto fluids (transportable phases). Currently, two industrially impor-tant thermal food process modules have been included in the diffi-cult process category—microwave heating and deep-fat frying.
3.2.1. Microwave heatingThe microwave heating module solves for changes in tempera-
ture, liquid water, water vapor and pressure (from evaporation) in-side the food during the microwave heating process. A multiphaseporous media model, as implemented by Ni et al. (1999), has beenused to simulate the process. In this problem, food geometry hasbeen restricted to one dimension only. The model can be appliedto observe the effects of microwave power level, penetrationdepth, product composition, surrounding temperature on the
A. Halder et al. / Journal of Food Engineering 104 (2011) 173–185 177
temperature and moisture accumulation near the surface. Sincethe temperature can stay colder at the surface than slightly inside,safety issues arising from undercooked meat and poultry productscan also be checked.
3.2.2. Deep-fat fryingThe deep-fat frying model solves for changes in temperature, li-
quid water, water vapor and pressure (from evaporation) insidethe food over the deep-fat frying duration. A multiphase porousmedia model, as implemented by Halder et al. (2007b), has beenused to simulate the process, in which food geometry has been re-stricted to one dimension only. In addition to observing the tem-perature, moisture, pressure and oil profiles, the model can beused to obtain the effects of oil temperature, product properties,product thickness, etc., on the frying time and oil pickup. Theamount of acrylamide formation can also be calculated for potatofrying.
4. Composition and property estimation
4.1. Composition
After selecting the process, the geometry of the food and itsdimensions, the user is asked to select the food. The software givesthe user a choice of either specifying a user-defined food or select-ing a food from an built-in database. The built-in food database ofthe software is based on the USDA National Nutrient Database forStandard Reference, Release 19, which contains data for 7293 fooditems and up to 140 nutrients and other components in thosefoods. The 7293 food items are divided into 24 food groups basedon the food product type. Of the 140 nutrients listed, only 6 majorfood components dictate the thermal properties of a food product(discussed below). The components are those contributing to theproximate analysis and include ash, carbohydrates, fat, dietary fi-ber, protein and water. Upon selection of a food from the food data-base, the composition values are obtained from the USDA NationalNutrient Database, and are used to calculate the property valuesbased on the work of Choi and Okos (1987), as described in the fol-lowing section. The user can also choose to define a food outside ofthe database. In such a case, the user should either know the com-position (in terms of the above-mentioned proximate components)of the food so that the properties can be estimated or the proper-ties can be entered directly.
4.2. Property estimation
The complex and highly heterogeneous nature of foods makestheir property estimation from fundamental principles an extre-mely difficult task. For almost all types of foods, the physical prop-erties are experimentally determined. Over the last severaldecades, efforts have been made to compile the huge amount ofproperty data for all foods into an organized structure (Saravacosand Maroulis, 2001; Rao et al., 2005; Rahman, 2009; Nesvadbaet al., 2004). However, using this huge compilation of data in soft-ware is a massive task and cannot be extended to any new foodproducts. Another way to approach this issue is to assume thatthe properties of a food can be estimated as a weighted averageof the properties of its constituent proximates (Miles et al., 1983;Choi and Okos, 1987). The weighing strategy depends on the nat-ure of the property itself. This software follows the work done byChoi and Okos (1987) on predicting the properties from food com-position. They compared the predicted values from the averagingtechnique with experimental measurements and found that the er-ror was within 10% for all the foods that were tested.
4.2.1. DensityThe bulk density of the food material is estimated by assuming
that the volumes of the various proximates simply add up. So, thedensity for a food material which does not have any air pocketswill be:
q ¼ 1P Xwi
qi
ð5Þ
where Xwi is the weight fraction and qi is the density of the ith com-
ponent. If air is present with volume fraction � then the density ofthe food material is modified to include the effect of air volume:
q ¼ 1� �P Xwi
qi
ð6Þ
4.2.2. Specific heat capacityThe net specific heat of the food material is simply the mass
average of the specific heat of individual components:
Cp ¼X
Cp;iXwi ð7Þ
The equation is based on the principle that the total heat required toraise the temperature of the food material by a given amount isequal to the sum of heats required to raise the temperatures of itsindividual components by the same amount. Here, it is assumedthat there are no phase changes involved.
4.2.3. Thermal conductivityThe net thermal conductivity, k, of the food material is the vol-
ume average of the individual conductivities, ki, given as:
k ¼X
kiXwi ð8Þ
where ki is the thermal conductivity of the ith component. This isbased on the fact that the thermal conductivity is a property ofthe volume rather than the mass. More complex models for thermalconductivity exist in the literature (Saravacos and Maroulis, 2001),but they enhance accuracy only incrementally. Therefore, we se-lected the simplest formulation, which gives a reasonable approxi-mation of thermal conductivity.
4.2.4. Process-specific propertiesIn addition to the thermal properties of food, which are required
for all food processes selected, deep-fat frying requires the porosityof the food material and the thermal properties of the cooking oilused. Similarly, the microwave heating process requires the userto specify the porosity of the food material, the microwave powersupplied to the food and the penetration depth of the microwavesin the food material. The power absorbed by a food during micro-wave heating depends on a number of factors, which can be di-vided into two categories: food factors and oven factors (Zhangand Datta, 2003). The main food factors are volume, surface areaand the dielectric properties of the food. The main oven factorsare oven size, geometry, the location of the food inside the ovencavity, the presence of special features like a turntable and a modestirrer, the location of the microwave feed, etc. The dependence ofpower absorption on so many factors makes experimental deter-mination of the power absorbed necessary. Ni et al. (1999) used30,000 W/m2 as the power absorbed by the surface of a cylindricalfood of radius 0.5 cm and height 2 cm in a domestic microwaveoven (SHARP Carousel, Rated Power 1.5 kW). By default, this valueis used in the microwave heating problem in the software. The usercan scale this value to any value by using the microwave powerscaling factor. The other input, penetration depth, is a measure ofhow deeply microwaves can penetrate into a food material. It is de-fined as the depth at which the intensity of the microwaves inside
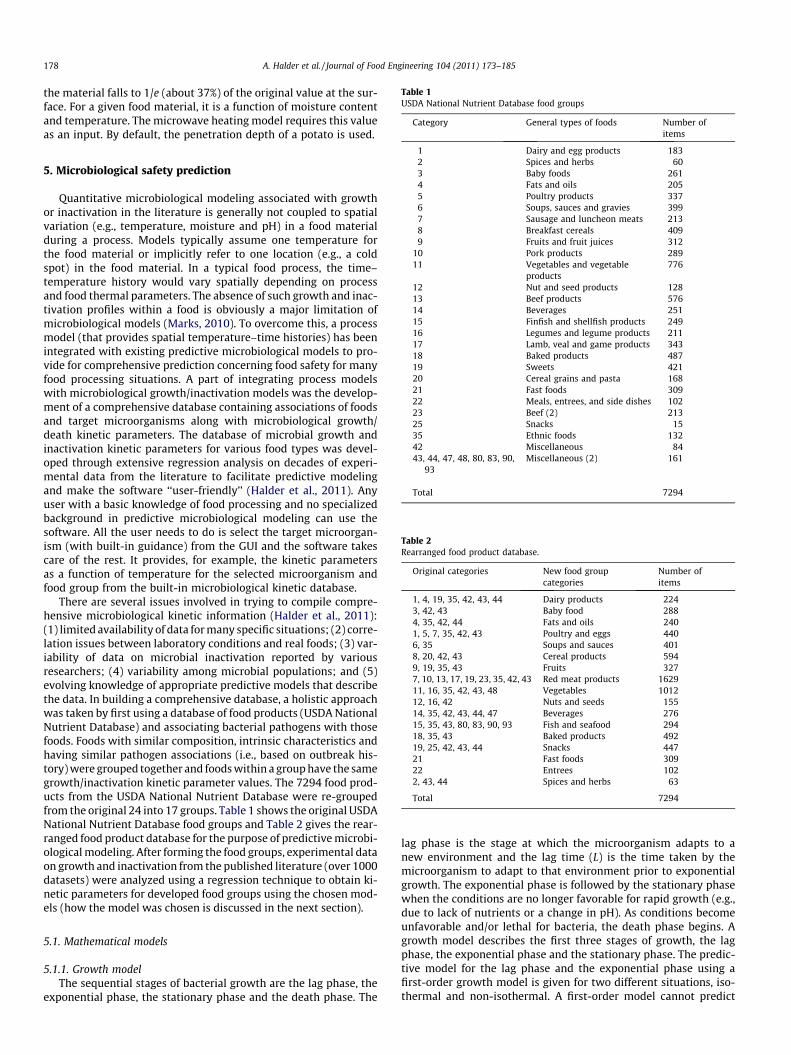
Table 1USDA National Nutrient Database food groups
Category General types of foods Number ofitems
178 A. Halder et al. / Journal of Food Engineering 104 (2011) 173–185
the material falls to 1/e (about 37%) of the original value at the sur-face. For a given food material, it is a function of moisture contentand temperature. The microwave heating model requires this valueas an input. By default, the penetration depth of a potato is used.
1 Dairy and egg products 1832 Spices and herbs 603 Baby foods 2614 Fats and oils 2055 Poultry products 3376 Soups, sauces and gravies 3997 Sausage and luncheon meats 2138 Breakfast cereals 4099 Fruits and fruit juices 312
10 Pork products 28911 Vegetables and vegetable
products776
12 Nut and seed products 12813 Beef products 57614 Beverages 25115 Finfish and shellfish products 24916 Legumes and legume products 21117 Lamb, veal and game products 34318 Baked products 48719 Sweets 42120 Cereal grains and pasta 16821 Fast foods 30922 Meals, entrees, and side dishes 10223 Beef (2) 21325 Snacks 1535 Ethnic foods 13242 Miscellaneous 8443, 44, 47, 48, 80, 83, 90,
93Miscellaneous (2) 161
Total 7294
Table 2Rearranged food product database.
Original categories New food groupcategories
Number ofitems
1, 4, 19, 35, 42, 43, 44 Dairy products 2243, 42, 43 Baby food 2884, 35, 42, 44 Fats and oils 2401, 5, 7, 35, 42, 43 Poultry and eggs 4406, 35 Soups and sauces 4018, 20, 42, 43 Cereal products 5949, 19, 35, 43 Fruits 3277, 10, 13, 17, 19, 23, 35, 42, 43 Red meat products 162911, 16, 35, 42, 43, 48 Vegetables 101212, 16, 42 Nuts and seeds 15514, 35, 42, 43, 44, 47 Beverages 27615, 35, 43, 80, 83, 90, 93 Fish and seafood 29418, 35, 43 Baked products 49219, 25, 42, 43, 44 Snacks 44721 Fast foods 30922 Entrees 1022, 43, 44 Spices and herbs 63
Total 7294
5. Microbiological safety prediction
Quantitative microbiological modeling associated with growthor inactivation in the literature is generally not coupled to spatialvariation (e.g., temperature, moisture and pH) in a food materialduring a process. Models typically assume one temperature forthe food material or implicitly refer to one location (e.g., a coldspot) in the food material. In a typical food process, the time–temperature history would vary spatially depending on processand food thermal parameters. The absence of such growth and inac-tivation profiles within a food is obviously a major limitation ofmicrobiological models (Marks, 2010). To overcome this, a processmodel (that provides spatial temperature–time histories) has beenintegrated with existing predictive microbiological models to pro-vide for comprehensive prediction concerning food safety for manyfood processing situations. A part of integrating process modelswith microbiological growth/inactivation models was the develop-ment of a comprehensive database containing associations of foodsand target microorganisms along with microbiological growth/death kinetic parameters. The database of microbial growth andinactivation kinetic parameters for various food types was devel-oped through extensive regression analysis on decades of experi-mental data from the literature to facilitate predictive modelingand make the software ‘‘user-friendly’’ (Halder et al., 2011). Anyuser with a basic knowledge of food processing and no specializedbackground in predictive microbiological modeling can use thesoftware. All the user needs to do is select the target microorgan-ism (with built-in guidance) from the GUI and the software takescare of the rest. It provides, for example, the kinetic parametersas a function of temperature for the selected microorganism andfood group from the built-in microbiological kinetic database.
There are several issues involved in trying to compile compre-hensive microbiological kinetic information (Halder et al., 2011):(1) limited availability of data for many specific situations; (2) corre-lation issues between laboratory conditions and real foods; (3) var-iability of data on microbial inactivation reported by variousresearchers; (4) variability among microbial populations; and (5)evolving knowledge of appropriate predictive models that describethe data. In building a comprehensive database, a holistic approachwas taken by first using a database of food products (USDA NationalNutrient Database) and associating bacterial pathogens with thosefoods. Foods with similar composition, intrinsic characteristics andhaving similar pathogen associations (i.e., based on outbreak his-tory) were grouped together and foods within a group have the samegrowth/inactivation kinetic parameter values. The 7294 food prod-ucts from the USDA National Nutrient Database were re-groupedfrom the original 24 into 17 groups. Table 1 shows the original USDANational Nutrient Database food groups and Table 2 gives the rear-ranged food product database for the purpose of predictive microbi-ological modeling. After forming the food groups, experimental dataon growth and inactivation from the published literature (over 1000datasets) were analyzed using a regression technique to obtain ki-netic parameters for developed food groups using the chosen mod-els (how the model was chosen is discussed in the next section).
5.1. Mathematical models
5.1.1. Growth modelThe sequential stages of bacterial growth are the lag phase, the
exponential phase, the stationary phase and the death phase. The
lag phase is the stage at which the microorganism adapts to anew environment and the lag time (L) is the time taken by themicroorganism to adapt to that environment prior to exponentialgrowth. The exponential phase is followed by the stationary phasewhen the conditions are no longer favorable for rapid growth (e.g.,due to lack of nutrients or a change in pH). As conditions becomeunfavorable and/or lethal for bacteria, the death phase begins. Agrowth model describes the first three stages of growth, the lagphase, the exponential phase and the stationary phase. The predic-tive model for the lag phase and the exponential phase using afirst-order growth model is given for two different situations, iso-thermal and non-isothermal. A first-order model cannot predict
A. Halder et al. / Journal of Food Engineering 104 (2011) 173–185 179
the stationary phase. Lag times (LT) are available for various tem-peratures from the published literature. So, in a first-order model,for isothermal situations, the growth rate is zero until the lag timeis over and kT, the growth rate at temperature T, is used after thelag time has elapsed. The model is given as:
dNdt¼
0 t < LT
kT N t > LT
�ð9Þ
A methodology to predict microbial growth under fluctuating tem-perature conditions has been developed by Li (1988). The totaladaption under fluctuating temperature conditions is given by:
dAdt¼ 1
LTð10Þ
where A is the total adaptation during the lag phase. An adaptationrate can be defined as the reciprocal of the lag time. When A equals1, adaptation is complete and growth starts. Therefore, the growthis given by:
dNdt¼
0 A < 1kT N A > 1
�ð11Þ
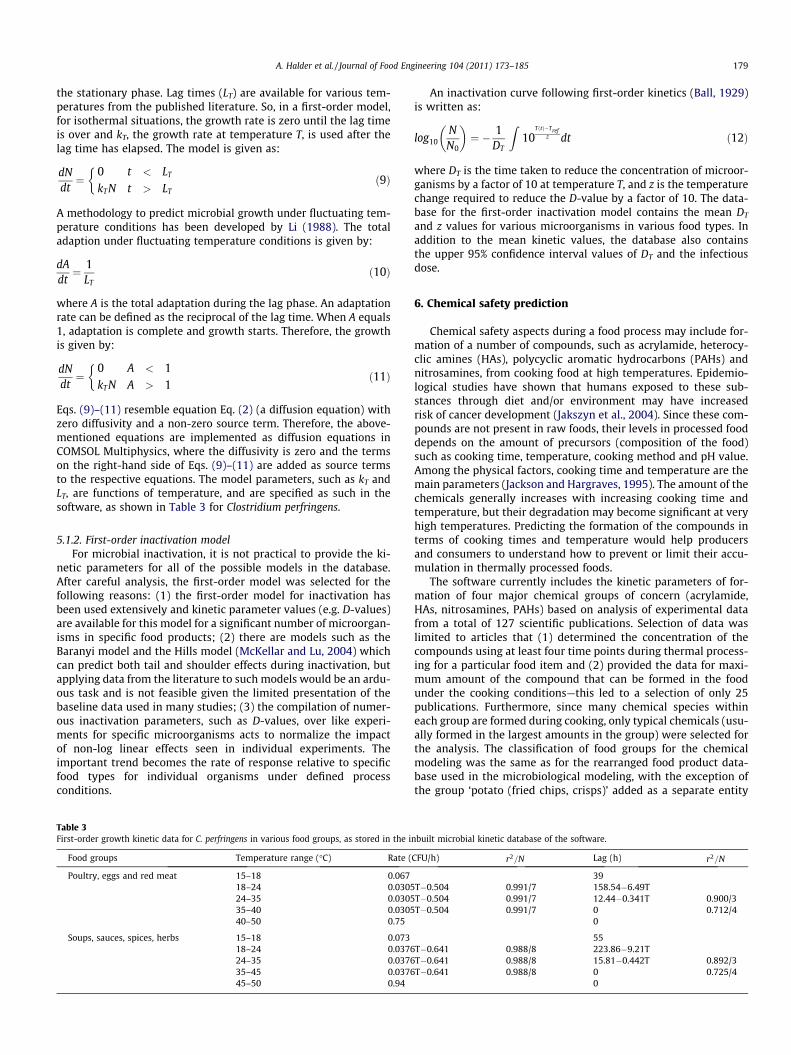
Eqs. (9)–(11) resemble equation Eq. (2) (a diffusion equation) withzero diffusivity and a non-zero source term. Therefore, the above-mentioned equations are implemented as diffusion equations inCOMSOL Multiphysics, where the diffusivity is zero and the termson the right-hand side of Eqs. (9)–(11) are added as source termsto the respective equations. The model parameters, such as kT andLT, are functions of temperature, and are specified as such in thesoftware, as shown in Table 3 for Clostridium perfringens.
5.1.2. First-order inactivation modelFor microbial inactivation, it is not practical to provide the ki-
netic parameters for all of the possible models in the database.After careful analysis, the first-order model was selected for thefollowing reasons: (1) the first-order model for inactivation hasbeen used extensively and kinetic parameter values (e.g. D-values)are available for this model for a significant number of microorgan-isms in specific food products; (2) there are models such as theBaranyi model and the Hills model (McKellar and Lu, 2004) whichcan predict both tail and shoulder effects during inactivation, butapplying data from the literature to such models would be an ardu-ous task and is not feasible given the limited presentation of thebaseline data used in many studies; (3) the compilation of numer-ous inactivation parameters, such as D-values, over like experi-ments for specific microorganisms acts to normalize the impactof non-log linear effects seen in individual experiments. Theimportant trend becomes the rate of response relative to specificfood types for individual organisms under defined processconditions.
Table 3First-order growth kinetic data for C. perfringens in various food groups, as stored in the i
Food groups Temperature range (�C) Rate (
Poultry, eggs and red meat 15–18 0.06718–24 0.030524–35 0.030535–40 0.030540–50 0.75
Soups, sauces, spices, herbs 15–18 0.07318–24 0.037624–35 0.037635–45 0.037645–50 0.94
An inactivation curve following first-order kinetics (Ball, 1929)is written as:
log10NN0
� �¼ � 1
DT
Z10
TðtÞ�Trefz dt ð12Þ
where DT is the time taken to reduce the concentration of microor-ganisms by a factor of 10 at temperature T, and z is the temperaturechange required to reduce the D-value by a factor of 10. The data-base for the first-order inactivation model contains the mean DT
and z values for various microorganisms in various food types. Inaddition to the mean kinetic values, the database also containsthe upper 95% confidence interval values of DT and the infectiousdose.
6. Chemical safety prediction
Chemical safety aspects during a food process may include for-mation of a number of compounds, such as acrylamide, heterocy-clic amines (HAs), polycyclic aromatic hydrocarbons (PAHs) andnitrosamines, from cooking food at high temperatures. Epidemio-logical studies have shown that humans exposed to these sub-stances through diet and/or environment may have increasedrisk of cancer development (Jakszyn et al., 2004). Since these com-pounds are not present in raw foods, their levels in processed fooddepends on the amount of precursors (composition of the food)such as cooking time, temperature, cooking method and pH value.Among the physical factors, cooking time and temperature are themain parameters (Jackson and Hargraves, 1995). The amount of thechemicals generally increases with increasing cooking time andtemperature, but their degradation may become significant at veryhigh temperatures. Predicting the formation of the compounds interms of cooking times and temperature would help producersand consumers to understand how to prevent or limit their accu-mulation in thermally processed foods.
The software currently includes the kinetic parameters of for-mation of four major chemical groups of concern (acrylamide,HAs, nitrosamines, PAHs) based on analysis of experimental datafrom a total of 127 scientific publications. Selection of data waslimited to articles that (1) determined the concentration of thecompounds using at least four time points during thermal process-ing for a particular food item and (2) provided the data for maxi-mum amount of the compound that can be formed in the foodunder the cooking conditions—this led to a selection of only 25publications. Furthermore, since many chemical species withineach group are formed during cooking, only typical chemicals (usu-ally formed in the largest amounts in the group) were selected forthe analysis. The classification of food groups for the chemicalmodeling was the same as for the rearranged food product data-base used in the microbiological modeling, with the exception ofthe group ‘potato (fried chips, crisps)’ added as a separate entity
nbuilt microbial kinetic database of the software.
CFU/h) r2=N Lag (h) r2=N
39T�0.504 0.991/7 158.54�6.49TT�0.504 0.991/7 12.44�0.341T 0.900/3T�0.504 0.991/7 0 0.712/4
0
55T�0.641 0.988/8 223.86�9.21TT�0.641 0.988/8 15.81�0.442T 0.892/3T�0.641 0.988/8 0 0.725/4
0
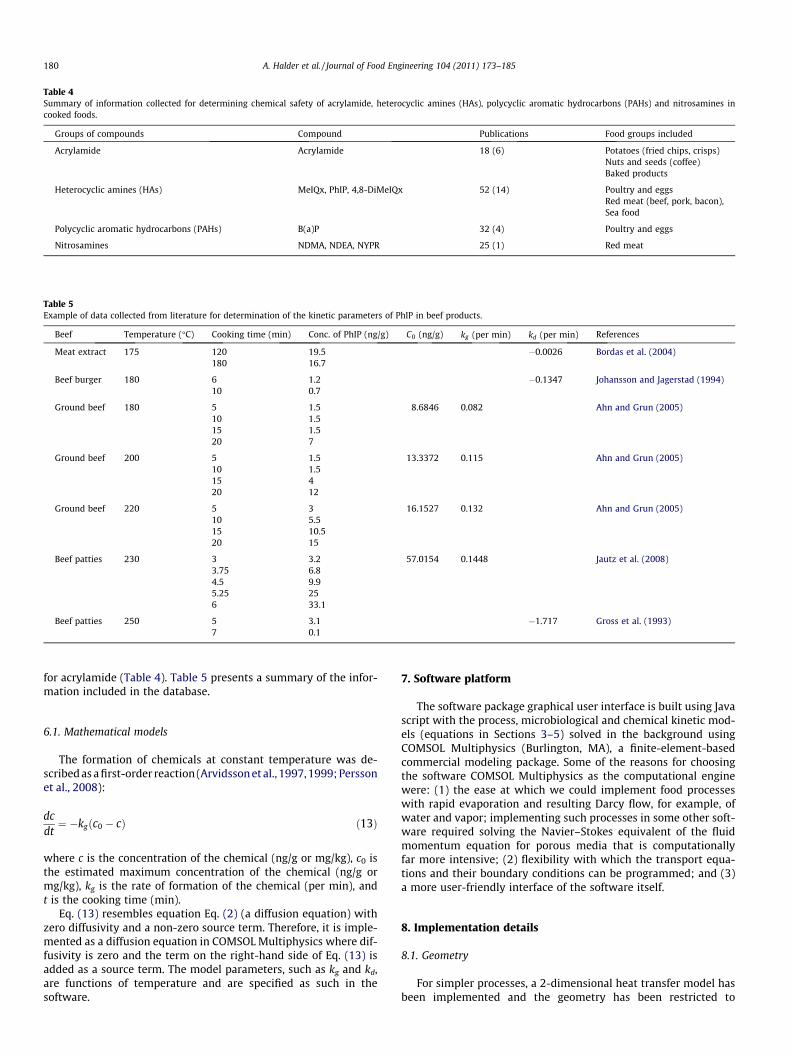
Table 4Summary of information collected for determining chemical safety of acrylamide, heterocyclic amines (HAs), polycyclic aromatic hydrocarbons (PAHs) and nitrosamines incooked foods.
Groups of compounds Compound Publications Food groups included
Acrylamide Acrylamide 18 (6) Potatoes (fried chips, crisps)Nuts and seeds (coffee)Baked products
Heterocyclic amines (HAs) MeIQx, PhIP, 4,8-DiMeIQx 52 (14) Poultry and eggsRed meat (beef, pork, bacon),Sea food
Polycyclic aromatic hydrocarbons (PAHs) B(a)P 32 (4) Poultry and eggs
Nitrosamines NDMA, NDEA, NYPR 25 (1) Red meat
Table 5Example of data collected from literature for determination of the kinetic parameters of PhIP in beef products.
Beef Temperature (�C) Cooking time (min) Conc. of PhIP (ng/g) C0 (ng/g) kg (per min) kd (per min) References
Meat extract 175 120 19.5 �0.0026 Bordas et al. (2004)180 16.7
Beef burger 180 6 1.2 �0.1347 Johansson and Jagerstad (1994)10 0.7
Ground beef 180 5 1.5 8.6846 0.082 Ahn and Grun (2005)10 1.515 1.520 7
Ground beef 200 5 1.5 13.3372 0.115 Ahn and Grun (2005)10 1.515 420 12
Ground beef 220 5 3 16.1527 0.132 Ahn and Grun (2005)10 5.515 10.520 15
Beef patties 230 3 3.2 57.0154 0.1448 Jautz et al. (2008)3.75 6.84.5 9.95.25 256 33.1
Beef patties 250 5 3.1 �1.717 Gross et al. (1993)7 0.1
180 A. Halder et al. / Journal of Food Engineering 104 (2011) 173–185
for acrylamide (Table 4). Table 5 presents a summary of the infor-mation included in the database.
6.1. Mathematical models
The formation of chemicals at constant temperature was de-scribed as a first-order reaction (Arvidsson et al., 1997, 1999; Perssonet al., 2008):
dcdt¼ �kgðc0 � cÞ ð13Þ
where c is the concentration of the chemical (ng/g or mg/kg), c0 isthe estimated maximum concentration of the chemical (ng/g ormg/kg), kg is the rate of formation of the chemical (per min), andt is the cooking time (min).
Eq. (13) resembles equation Eq. (2) (a diffusion equation) withzero diffusivity and a non-zero source term. Therefore, it is imple-mented as a diffusion equation in COMSOL Multiphysics where dif-fusivity is zero and the term on the right-hand side of Eq. (13) isadded as a source term. The model parameters, such as kg and kd,are functions of temperature and are specified as such in thesoftware.
7. Software platform
The software package graphical user interface is built using Javascript with the process, microbiological and chemical kinetic mod-els (equations in Sections 3–5) solved in the background usingCOMSOL Multiphysics (Burlington, MA), a finite-element-basedcommercial modeling package. Some of the reasons for choosingthe software COMSOL Multiphysics as the computational enginewere: (1) the ease at which we could implement food processeswith rapid evaporation and resulting Darcy flow, for example, ofwater and vapor; implementing such processes in some other soft-ware required solving the Navier–Stokes equivalent of the fluidmomentum equation for porous media that is computationallyfar more intensive; (2) flexibility with which the transport equa-tions and their boundary conditions can be programmed; and (3)a more user-friendly interface of the software itself.
8. Implementation details
8.1. Geometry
For simpler processes, a 2-dimensional heat transfer model hasbeen implemented and the geometry has been restricted to
4
10502
2.5
3
3.5
2015
log 10
N
Time (hrs)
Predicted growth
Experimental data(Amezquita et al. , 2005)
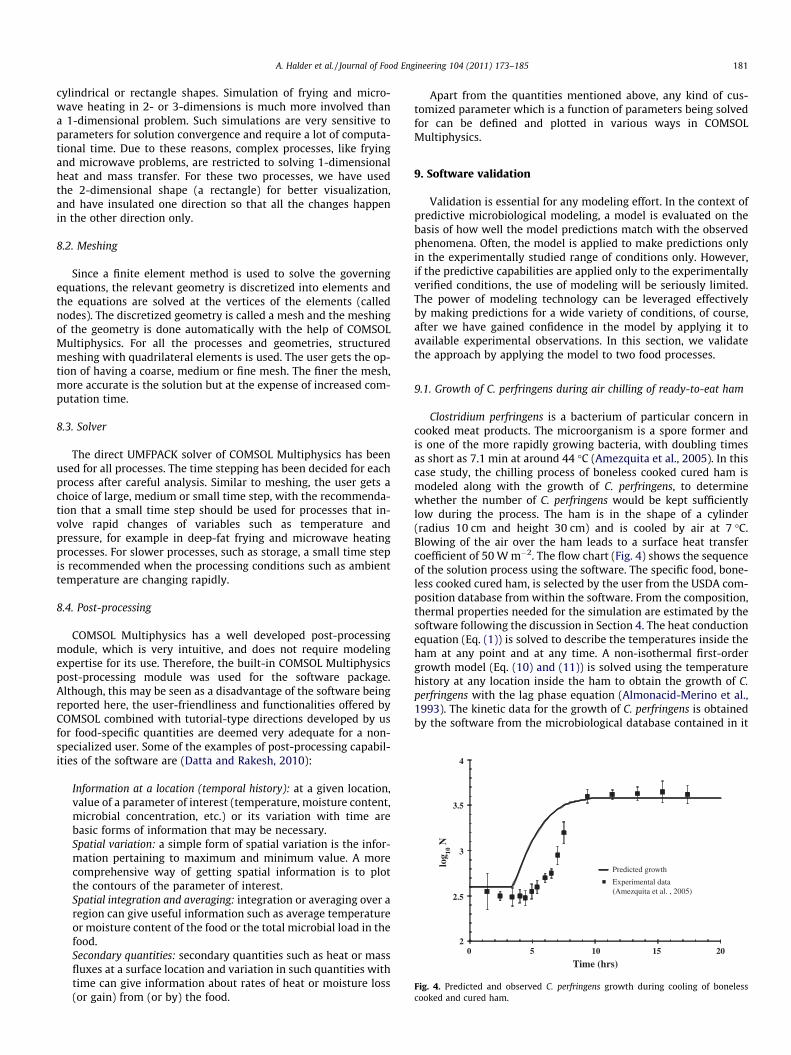
Fig. 4. Predicted and observed C. perfringens growth during cooling of bonelesscooked and cured ham.
A. Halder et al. / Journal of Food Engineering 104 (2011) 173–185 181
cylindrical or rectangle shapes. Simulation of frying and micro-wave heating in 2- or 3-dimensions is much more involved thana 1-dimensional problem. Such simulations are very sensitive toparameters for solution convergence and require a lot of computa-tional time. Due to these reasons, complex processes, like fryingand microwave problems, are restricted to solving 1-dimensionalheat and mass transfer. For these two processes, we have usedthe 2-dimensional shape (a rectangle) for better visualization,and have insulated one direction so that all the changes happenin the other direction only.
8.2. Meshing
Since a finite element method is used to solve the governingequations, the relevant geometry is discretized into elements andthe equations are solved at the vertices of the elements (callednodes). The discretized geometry is called a mesh and the meshingof the geometry is done automatically with the help of COMSOLMultiphysics. For all the processes and geometries, structuredmeshing with quadrilateral elements is used. The user gets the op-tion of having a coarse, medium or fine mesh. The finer the mesh,more accurate is the solution but at the expense of increased com-putation time.
8.3. Solver
The direct UMFPACK solver of COMSOL Multiphysics has beenused for all processes. The time stepping has been decided for eachprocess after careful analysis. Similar to meshing, the user gets achoice of large, medium or small time step, with the recommenda-tion that a small time step should be used for processes that in-volve rapid changes of variables such as temperature andpressure, for example in deep-fat frying and microwave heatingprocesses. For slower processes, such as storage, a small time stepis recommended when the processing conditions such as ambienttemperature are changing rapidly.
8.4. Post-processing
COMSOL Multiphysics has a well developed post-processingmodule, which is very intuitive, and does not require modelingexpertise for its use. Therefore, the built-in COMSOL Multiphysicspost-processing module was used for the software package.Although, this may be seen as a disadvantage of the software beingreported here, the user-friendliness and functionalities offered byCOMSOL combined with tutorial-type directions developed by usfor food-specific quantities are deemed very adequate for a non-specialized user. Some of the examples of post-processing capabil-ities of the software are (Datta and Rakesh, 2010):
Information at a location (temporal history): at a given location,value of a parameter of interest (temperature, moisture content,microbial concentration, etc.) or its variation with time arebasic forms of information that may be necessary.Spatial variation: a simple form of spatial variation is the infor-mation pertaining to maximum and minimum value. A morecomprehensive way of getting spatial information is to plotthe contours of the parameter of interest.Spatial integration and averaging: integration or averaging over aregion can give useful information such as average temperatureor moisture content of the food or the total microbial load in thefood.Secondary quantities: secondary quantities such as heat or massfluxes at a surface location and variation in such quantities withtime can give information about rates of heat or moisture loss(or gain) from (or by) the food.
Apart from the quantities mentioned above, any kind of cus-tomized parameter which is a function of parameters being solvedfor can be defined and plotted in various ways in COMSOLMultiphysics.
9. Software validation
Validation is essential for any modeling effort. In the context ofpredictive microbiological modeling, a model is evaluated on thebasis of how well the model predictions match with the observedphenomena. Often, the model is applied to make predictions onlyin the experimentally studied range of conditions only. However,if the predictive capabilities are applied only to the experimentallyverified conditions, the use of modeling will be seriously limited.The power of modeling technology can be leveraged effectivelyby making predictions for a wide variety of conditions, of course,after we have gained confidence in the model by applying it toavailable experimental observations. In this section, we validatethe approach by applying the model to two food processes.
9.1. Growth of C. perfringens during air chilling of ready-to-eat ham
Clostridium perfringens is a bacterium of particular concern incooked meat products. The microorganism is a spore former andis one of the more rapidly growing bacteria, with doubling timesas short as 7.1 min at around 44 �C (Amezquita et al., 2005). In thiscase study, the chilling process of boneless cooked cured ham ismodeled along with the growth of C. perfringens, to determinewhether the number of C. perfringens would be kept sufficientlylow during the process. The ham is in the shape of a cylinder(radius 10 cm and height 30 cm) and is cooled by air at 7 �C.Blowing of the air over the ham leads to a surface heat transfercoefficient of 50 W m�2. The flow chart (Fig. 4) shows the sequenceof the solution process using the software. The specific food, bone-less cooked cured ham, is selected by the user from the USDA com-position database from within the software. From the composition,thermal properties needed for the simulation are estimated by thesoftware following the discussion in Section 4. The heat conductionequation (Eq. (1)) is solved to describe the temperatures inside theham at any point and at any time. A non-isothermal first-ordergrowth model (Eq. (10) and (11)) is solved using the temperaturehistory at any location inside the ham to obtain the growth of C.perfringens with the lag phase equation (Almonacid-Merino et al.,1993). The kinetic data for the growth of C. perfringens is obtainedby the software from the microbiological database contained in it
182 A. Halder et al. / Journal of Food Engineering 104 (2011) 173–185
(Table 3). In the database, the growth kinetics data for ham belongto a red meat group (pH 5.5; beef, pork and ham), and is the mostconservative estimate within this group. Fig. 4 shows the compar-ison of predicted and observed C. perfringens growth during coolingof the ham, assuming the cooling process is in compliance withFSIS stabilization performance standards for cured products. Theprediction made by taking the database value for the red meatgroup (pH 5.5; beef, pork and ham) is always on the conservativeside (as can be seen in Fig. 4), which is acceptable for evaluationof the safety of the process. The difference between experimentaland predicted values can be attributed partly to the selection ofthe kinetic data as the most conservative value in the food group.This serves to validate predictions related to microbiological safety.
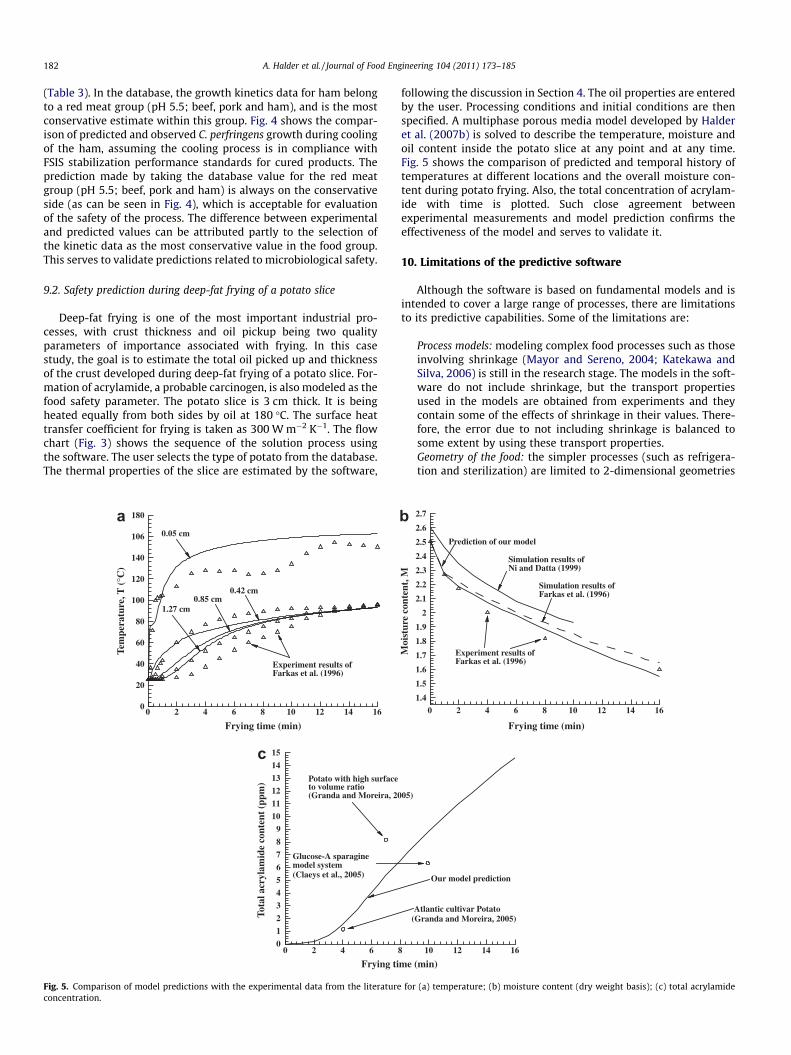
9.2. Safety prediction during deep-fat frying of a potato slice
Deep-fat frying is one of the most important industrial pro-cesses, with crust thickness and oil pickup being two qualityparameters of importance associated with frying. In this casestudy, the goal is to estimate the total oil picked up and thicknessof the crust developed during deep-fat frying of a potato slice. For-mation of acrylamide, a probable carcinogen, is also modeled as thefood safety parameter. The potato slice is 3 cm thick. It is beingheated equally from both sides by oil at 180 �C. The surface heattransfer coefficient for frying is taken as 300 W m�2 K�1. The flowchart (Fig. 3) shows the sequence of the solution process usingthe software. The user selects the type of potato from the database.The thermal properties of the slice are estimated by the software,
Frying time (min)
Frying ti
Tem
pera
ture
, T (
°C)
0 2 4 6 8 10 12 14 160
20
40
60
80
100
120
140
106
180
0.05 cm
0.42 cm0.85 cm
1.27 cm
Experiment results ofFarkas et al. (1996)
Tota
l acr
ylam
ide
cont
ent
(ppm
)
0 2 4 60
1
2
3
4
5
6
7
8
9
10
11
12
13
14
15
Potato with high surfaceto volume ratio(Granda and Moreira, 20
Glucose-A sparaginemodel system(Claeys et al., 2005)
a
c
Fig. 5. Comparison of model predictions with the experimental data from the literatureconcentration.
following the discussion in Section 4. The oil properties are enteredby the user. Processing conditions and initial conditions are thenspecified. A multiphase porous media model developed by Halderet al. (2007b) is solved to describe the temperature, moisture andoil content inside the potato slice at any point and at any time.Fig. 5 shows the comparison of predicted and temporal history oftemperatures at different locations and the overall moisture con-tent during potato frying. Also, the total concentration of acrylam-ide with time is plotted. Such close agreement betweenexperimental measurements and model prediction confirms theeffectiveness of the model and serves to validate it.
10. Limitations of the predictive software
Although the software is based on fundamental models and isintended to cover a large range of processes, there are limitationsto its predictive capabilities. Some of the limitations are:
Process models: modeling complex food processes such as thoseinvolving shrinkage (Mayor and Sereno, 2004; Katekawa andSilva, 2006) is still in the research stage. The models in the soft-ware do not include shrinkage, but the transport propertiesused in the models are obtained from experiments and theycontain some of the effects of shrinkage in their values. There-fore, the error due to not including shrinkage is balanced tosome extent by using these transport properties.Geometry of the food: the simpler processes (such as refrigera-tion and sterilization) are limited to 2-dimensional geometries
me (min)
Frying time (min)
Experiment results ofFarkas et al. (1996)
Moi
stur
e co
nten
t, M
0 2 4 6 8 10 12 14 161.4
1.5
1.6
1.7
1.8
1.9
2
2.1
2.2
2.3
2.4
2.5
2.6
2.7
Simulation results ofFarkas et al. (1996)
Simulation results ofNi and Datta (1999)
Prediction of our model
8 10 12 14 16
05)
Atlantic cultivar Potato(Granda and Moreira, 2005)
Our model prediction
b
for (a) temperature; (b) moisture content (dry weight basis); (c) total acrylamide
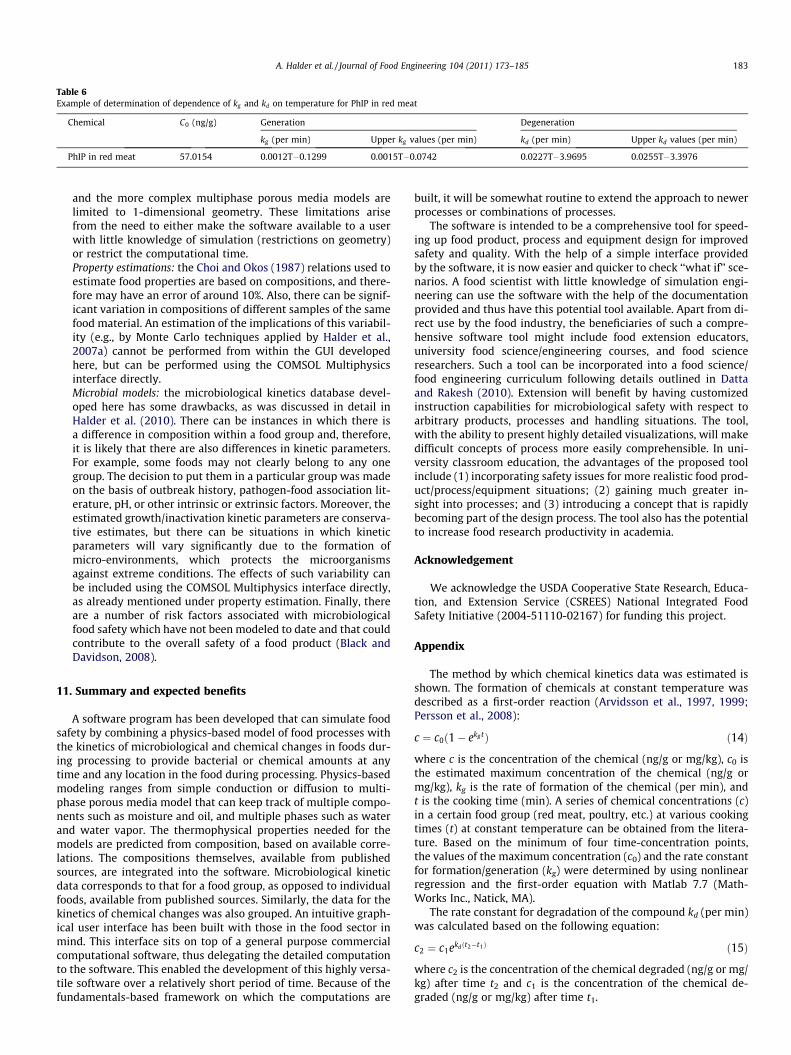
Table 6Example of determination of dependence of kg and kd on temperature for PhIP in red meat
Chemical C0 (ng/g) Generation Degeneration
kg (per min) Upper kg values (per min) kd (per min) Upper kd values (per min)
PhIP in red meat 57.0154 0.0012T�0.1299 0.0015T�0.0742 0.0227T�3.9695 0.0255T�3.3976
A. Halder et al. / Journal of Food Engineering 104 (2011) 173–185 183
and the more complex multiphase porous media models arelimited to 1-dimensional geometry. These limitations arisefrom the need to either make the software available to a userwith little knowledge of simulation (restrictions on geometry)or restrict the computational time.Property estimations: the Choi and Okos (1987) relations used toestimate food properties are based on compositions, and there-fore may have an error of around 10%. Also, there can be signif-icant variation in compositions of different samples of the samefood material. An estimation of the implications of this variabil-ity (e.g., by Monte Carlo techniques applied by Halder et al.,2007a) cannot be performed from within the GUI developedhere, but can be performed using the COMSOL Multiphysicsinterface directly.Microbial models: the microbiological kinetics database devel-oped here has some drawbacks, as was discussed in detail inHalder et al. (2010). There can be instances in which there isa difference in composition within a food group and, therefore,it is likely that there are also differences in kinetic parameters.For example, some foods may not clearly belong to any onegroup. The decision to put them in a particular group was madeon the basis of outbreak history, pathogen-food association lit-erature, pH, or other intrinsic or extrinsic factors. Moreover, theestimated growth/inactivation kinetic parameters are conserva-tive estimates, but there can be situations in which kineticparameters will vary significantly due to the formation ofmicro-environments, which protects the microorganismsagainst extreme conditions. The effects of such variability canbe included using the COMSOL Multiphysics interface directly,as already mentioned under property estimation. Finally, thereare a number of risk factors associated with microbiologicalfood safety which have not been modeled to date and that couldcontribute to the overall safety of a food product (Black andDavidson, 2008).
11. Summary and expected benefits
A software program has been developed that can simulate foodsafety by combining a physics-based model of food processes withthe kinetics of microbiological and chemical changes in foods dur-ing processing to provide bacterial or chemical amounts at anytime and any location in the food during processing. Physics-basedmodeling ranges from simple conduction or diffusion to multi-phase porous media model that can keep track of multiple compo-nents such as moisture and oil, and multiple phases such as waterand water vapor. The thermophysical properties needed for themodels are predicted from composition, based on available corre-lations. The compositions themselves, available from publishedsources, are integrated into the software. Microbiological kineticdata corresponds to that for a food group, as opposed to individualfoods, available from published sources. Similarly, the data for thekinetics of chemical changes was also grouped. An intuitive graph-ical user interface has been built with those in the food sector inmind. This interface sits on top of a general purpose commercialcomputational software, thus delegating the detailed computationto the software. This enabled the development of this highly versa-tile software over a relatively short period of time. Because of thefundamentals-based framework on which the computations are
built, it will be somewhat routine to extend the approach to newerprocesses or combinations of processes.
The software is intended to be a comprehensive tool for speed-ing up food product, process and equipment design for improvedsafety and quality. With the help of a simple interface providedby the software, it is now easier and quicker to check ‘‘what if’’ sce-narios. A food scientist with little knowledge of simulation engi-neering can use the software with the help of the documentationprovided and thus have this potential tool available. Apart from di-rect use by the food industry, the beneficiaries of such a compre-hensive software tool might include food extension educators,university food science/engineering courses, and food scienceresearchers. Such a tool can be incorporated into a food science/food engineering curriculum following details outlined in Dattaand Rakesh (2010). Extension will benefit by having customizedinstruction capabilities for microbiological safety with respect toarbitrary products, processes and handling situations. The tool,with the ability to present highly detailed visualizations, will makedifficult concepts of process more easily comprehensible. In uni-versity classroom education, the advantages of the proposed toolinclude (1) incorporating safety issues for more realistic food prod-uct/process/equipment situations; (2) gaining much greater in-sight into processes; and (3) introducing a concept that is rapidlybecoming part of the design process. The tool also has the potentialto increase food research productivity in academia.
Acknowledgement
We acknowledge the USDA Cooperative State Research, Educa-tion, and Extension Service (CSREES) National Integrated FoodSafety Initiative (2004-51110-02167) for funding this project.
Appendix
The method by which chemical kinetics data was estimated isshown. The formation of chemicals at constant temperature wasdescribed as a first-order reaction (Arvidsson et al., 1997, 1999;Persson et al., 2008):
c ¼ c0ð1� ekg tÞ ð14Þ
where c is the concentration of the chemical (ng/g or mg/kg), c0 isthe estimated maximum concentration of the chemical (ng/g ormg/kg), kg is the rate of formation of the chemical (per min), andt is the cooking time (min). A series of chemical concentrations (c)in a certain food group (red meat, poultry, etc.) at various cookingtimes (t) at constant temperature can be obtained from the litera-ture. Based on the minimum of four time-concentration points,the values of the maximum concentration (c0) and the rate constantfor formation/generation (kg) were determined by using nonlinearregression and the first-order equation with Matlab 7.7 (Math-Works Inc., Natick, MA).
The rate constant for degradation of the compound kd (per min)was calculated based on the following equation:
c2 ¼ c1ekdðt2�t1Þ ð15Þ
where c2 is the concentration of the chemical degraded (ng/g or mg/kg) after time t2 and c1 is the concentration of the chemical de-graded (ng/g or mg/kg) after time t1.
184 A. Halder et al. / Journal of Food Engineering 104 (2011) 173–185
For each type of food, the values of kg and kd were determinedfor at least three temperatures for regression analysis (Excel, MSOffice 2007) in order to determine the respective 95% upper andlower confidence values. After the analysis, the rate constants, kg
and kd, as functions of temperature for each chemical in differentfood products were determined, as shown in Table 6 as anexample.
References
AFoT, 2003. In: Second International Workshop on Mathematical and ComputingTechnologies for Agro-Food Technologies, Barcelona, Spain, November 27–28.
Ahn, J., Grun, I.U., 2005. Heterocyclic amines: 1. Kinetics of formation of polar andnonpolar heterocyclic amines as a function of time and temperature. Journal ofFood Science 70 (2), C173–C179.
Almonacid-Merino, S.F., Simpson, R., Torres, J.A., 1993. Time-variable retorttemperature profiles for cylindrical cans: batch process time, energyconsumption, and quality retention model. Journal of Food ProcessEngineering 16, 271–287.
Amezquita, A., Weller, C.L., Wang, L., Thippareddi, H., Burson, D.E., 2005.Development of an integrated model for heat transfer and dynamic growth ofClostridium perfringens during the cooling of cooked boneless ham. InternationalJournal of Food Microbiology 101, 123–144.
Arvidsson, P., van Boekel, M.A.J.S., Skog, K., Solyakov, A., Jagerstad, M., 1997. Kineticsof formation of polar heterocyclic amines in a meat model system. Journal ofFood Science 62, 911–916.
Arvidsson, P., van Boekel, M.A.J.S., Skog, K., Solyakov, A., Jagerstad, M., 1999.Formation of heterocyclic amines in a meat juice model system. Journal of FoodScience 62, 216–221.
Ball, C.O., 1929. Food preservation by canning. Food Industries 1, 262–263.Banga, J.R., Balsa-Canto, E., Alonso, A.A., 2008. Quality and safety models and
optimization as part of computer-integrated manufacturing. ComprehensiveReviews in Food Science and Food Safety 7 (1), 168–174.
Black, D.G., Davidson, P.M., 2008. Use of modeling to enhance the microbiologicalsafety of the food system. Comprehensive Reviews in Food Science and FoodSafety 7, 159–167.
Bordas, M., Moyano, E., Puignou, L., Galceran, M.T., 2004. Formation and stability ofheterocyclic amines in a meat flavour model system – Effect of temperature,time and precursors. Journal of Chromatography B 802 (1), 11–17.
Burnham, G.M., Schaffner, D.W., Ingham, S.C., 2008. Predict safety. Food Quality 15(2), 14–22.
CFDfood, 2004. The Site of Engineering Thermodynamics for the Evolution of AgriFoodSystems. Available from: <http://www.unibas.it/cfdfood/top_eng.htm>.
Choi, Y., Okos, M.R., 1987. Effects of temperature and composition on thermalproperties of foods. In: Le Maguer, M., Jelen, P. (Eds.), Food Engineering andProcess Applications. Elsevier Applied Science, London, UK.
ComBase-PMP, 2003. Combined Database and Predictive Microbiology Program.Available from: <http://www.ifr.ac.uk/combase>.
Datta, A.K., 1998. Computer-aided engineering in food process and product design.Food Technology 52 (10), 44–52.
Datta, A.K., 2008a. Status of physics-based models in the design of food products,processes and equipment. Comprehensive Reviews in Food Science and FoodSafety 7 (1), 114–116.
Datta, A.K. (Ed.), 2008b. Models for Safety, Quality, and Competitiveness of the FoodProcessing Sector. Comprehensive Reviews in Food Science and Food Safety. IFTPress, Chicago, IL. Available from: <http://www.blackwell-synergy.com/toc/crfs/7/1> .
Datta, A.K., Sablani, S.S., 2007. Overview of mathematical modeling techniques infood and bioprocesses. In: Sablani, S.S., Datta, A.K., Rahman, M.S., Mujumdar,A.S. (Eds.), Handbook of Food and Bioprocess Modeling Techniques. Taylor &Francis, Boca Raton, Florida.
Datta, A.K., Rakesh, V., 2010. An Introduction to Modeling of Transport Processes:Applications to Biomedical Systems. Cambridge University Press, Cambridge,UK.
Eurotherm Seminar 77, June 20–22, 2005. Heat and Mass Transfer in FoodProcessing, Parma, Italy. Available from: <http://ied.eng.unipr.it/fisicatecnica/seminar77/inglese/menu.htm>.
FOODSIM, June 16–18, 2004. WICC-WIR, Wageningen, The Netherlands.Gross, G.A., Turesky, R.J., Fay, L.B., Stillwell, W.G., Skipper, P.L., Tannenbaum, S.R.,
1993. Heterocyclic aromatic amine formation in grilled bacon, beef and fish andin grill scrapings. Carcinogenesis 14 (11), 2313–2318.
Halder, A., Datta, A.K., Geedipalli, S.S.R., 2007a. Uncertainty in thermal processcalculations due to variability in first-order and Weibull kinetic parameters.Journal of Food Science 72, E155–E167.
Halder, A., Dhall, A., Datta, A.K., 2007b. An improved, easily implementable, porousmedia based model for deep-fat frying. Part 1: model development and inputparameters. Transactions of IChemE 85 (C3), 1–11.
Halder, A., Black, D.G., Davidson, P.M., Datta, A.K., 2010. Development ofassociations and kinetic models for microbiological data to be used incomprehensive food safety prediction software. Journal of Food Science 75(6), R107–R120.
Halder, A., Dhall, A., Datta, A.K., 2011. Modeling transport in porous media withphase change: applications to food processing. Journal of Heat Transfer 133 (3),031010.
IFT Annual Meeting, Chicago, IL, July 13–16, 2003. Symposia on ‘Computer-AidedEngineering to Enhance Food Product, Process and Equipment Design’, Co-organized by Ashim K. Datta and Kumar M. Dhanasekharan of Fluent Inc.
IFT Annual Meeting, Anaheim, California, June 6–8. 2009. Workshop on a User-Friendly Food Microbiological and Chemical Safety Simulator. Co-organized byA. Halder, A.K. Datta and P.M. Davidson.
ISFTFPFFS, 2003. International Symposium on Future Technologies for FoodProduction and Future Food Scientists, Goteborg, Sweden, June 2–4.
Irudayaraj, J., 2001. Food Processing Operations Modeling: Design and Analysis.Marcel Dekker, New York.
Ivester, R.W., 2008. Productivity improvement through modeling: an overview ofmanufacturing experience for the food industry. Comprehensive Reviews inFood Science and Food Safety 7 (1), 182–191.
Jackson, L.S., Hargraves, W.A., 1995. Effects of time and temperature on theformation of Meiq(X) and Dimeiq(X) in a model system containing threonine,glucose, and creatine. Journal of Agricultural Food Chemistry 43 (6), 1678–1684.
Jakszyn, P., Agudo, A., Ibanez, R., Garcia-Closas, R., Pera, G., Amiano, P., Gonzalez, C.A.,2004. Development of a food database of nitrosamines, heterocyclic amines, andpolycyclic aromatic hydrocarbons. Journal of Nutrition 134, 2011–2014.
Jautz, U., Gibis, M., Morlock, G.E., 2008. Quantification of heterocyclic aromaticamines in fried meat by HPTLC/UV-FLD and HPLC/UV-FLD: A comparison of twomethods. Journal of Agricultural and Food Chemistry 56 (12), 4311–4319.
Johansson, M.A.E., Jagerstad, M., 1994. Occurrence of mutagenic/carcinogenicheterocyclic amines in meat and fish products, including pan residues,prepared under domestic conditions. Carcinogenesis 15 (8), 1511–1518.
Jousse, F., 2008. Modeling to improve the efficiency of product and processdevelopment. Comprehensive Reviews in Food Science and Food Safety 7 (1),175–181.
Katekawa, M.E., Silva, M.A.A., 2006. A review of drying models including shrinkageeffects. Drying Technology 24 (1), 5–20.
Li, K.Y., 1988. The microbial stability of refrigerated intermediate moisture foods.Ph.D. thesis. Oregon State University, Corvallis, OR.
Marks, B.P., 2008. Status of microbial modeling in food process models.Comprehensive Reviews in Food Science and Food Safety 7 (1), 137–143.
Marks, B.P., 2010. Food safety beyond guidelines and regulations. In: Knipe, C.L.,Rust, R.E. (Eds.), Thermal Processing of Ready-to-eat Meat Products. Wiley–Blackwell, Ames, IA, USA.
Mayor, L., Sereno, A.M., 2004. Modelling shrinkage during convective drying of foodmaterials: a review. Journal of Food Engineering 61 (3), 373–386.
McKellar, R.C., Lu, X., 2004. Primary models. In: McKellar, R.C., Lu, X. (Eds.),Modeling Microbial Responses in Foods. CRC Press, Boca Raton, FL, pp. 21–62.
Model-It, 2005. In: The Third International Symposium on Applications ofModelling as an Innovative Technology in the Agri-Food Chain, May 29 toJune 2, Leuven, Belgium.
Miles, C.A., Van Beek, G., Veerkamp, C.H., 1983. Calculation of thermophysicalproperties of foods. In: Physical Properties of Foods. Applied Science Publishers,New York, pp. 269–312.
Mittal, G.S., 1997. Computerized Control Systems in the Food Industry. MarcelDekker Inc.
Nesvadba, P., Houska, M., Wolf, W., Gekas, V., Jarvis, D., Sadd, P.A., Johns, A.I., 2004.Database of physical properties of agro-food materials. Journal of FoodEngineering 61 (4), 497–503.
Ni, H., Datta, A.K., Torrance, K.E., 1999. Moisture transport in intensive microwaveheating of biomaterials: a multiphase porous media model. InternationalJournal of Heat and Mass Transfer 42 (8), 1501–1512.
Otles, S., Onal, A., 2004. Computer-aided engineering softwares in the food industry.Journal of Food Engineering 65 (2), 311–315.
Peleg, M., 2010. Document on the Web. Available from: <http://people.umass.edu/aew2000/>. Accessed October 30, 2010.
Persson, E., Oroszvari, B.K., Tornberg, E., Sjoholm, I., Skog, K., 2008. Heterocyclicamine formation during frying of frozen beef burgers. International Journal ofFood Science and Technology 43, 62–68.
PROFOOD, 2009. The Site for Advanced Tools for Simulation, Optimization andControl of Food Preservation Processes. Available from: <http://www.cimne.com/profood/default.asp>.
Rahman, M.S., 2009. Food Properties Handbook. CRC Press, Boca Raton, FL.Rao, M.A., Rizvi, S.S.H., Datta, A.K. (Eds.), 2005. Engineering Properties of Foods. CRC
Press, Taylor & Francis Group, Boca Raton, FL.Sablani, S.S., Datta, A.K., Rahman, M.S., Mujumdar, A.S. (Eds.), 2007. Handbook of
Food and Bioprocess Modeling Techniques. CRC Press, Taylor and Francis Group,Boca Raton, Florida.
Sablani, S.S., 2008. Status of observational models used in design and control of foodproducts and processes. Comprehensive Reviews in Food Science and FoodSafety 7 (1), 130–143.
Saravacos, G.D., Maroulis, Z.B., 2001. Transport Properties of Foods. Marcel Dekker,New York.
Scott, G., Richardson, P., 1997. The application of computational fluid dynamics inthe food industry. Trends in Food Science and Technology 8, 119–124.
Sun, D.W., 2007. Computational Fluid Dynamics in Food Processing. Taylor andFrancis, Boca Raton, FL.
Tijskens, L.M.M., Hertog, M.L.A.T.M., Nicolai, B.M. (Eds.), 2001. Food ProcessModelling. CRC Press, Boca Raton, FL.
J.A. Torres, Personal communication. Oregon State University, Corvallis, Oregon.

A. Halder et al. / Journal of Food Engineering 104 (2011) 173–185 185
USDA – Agricultural Research Service, 2006. USDA National Nutrient Database forStandard Reference, Release 19. Nutrient Data Laboratory Home Page. Availablefrom: <http://www.ars.usda.gov/ba/bhnrc/ndl>.
Van Boekel, M.J.A.S., 2008. Kinetic modeling of food quality: a critical review.Comprehensive Reviews in Food Science and Food Safety 7 (1), 144–158.
Verdurmen, R.E.M., Van Houwelingen, G., Gunsing, G., Verschueren, M., Straatsma,J., 2006. Agglomeration in spray drying installations (The EDECAD Project):stickiness measurements and simulation results. Drying Technology 24, 721–726.
Welti-Chanes, J., Velez-Ruiz, J.F., Barbosa-Canovas, G.V. (Eds.), 2002. TransportPhenomena in Food Processing. CRC Press, Boca Raton, FL.
Zhang, H., Datta, A.K., 2003. Microwave power absorption in single and multi-component foods. Transactions of the Institution of Chemical Engineers 81 (C),257–266.