PUBLIC PURPOSE JOURNAL
79
PUBLIC PURPOSE 2018-2019 JOURNAL The Interdisciplinary Journal of the School of Public Affairs at American University Volume XVII THE
-
Upload
khangminh22 -
Category
Documents
-
view
0 -
download
0
Transcript of PUBLIC PURPOSE JOURNAL
PUBLIC PURPOSE2018 -2019
JOURNAL
The Interdisciplinary Journal of the School of Public Affairsat American University
Volume XVII
THE
~ 1 ~
THE PUBLIC PURPOSE JOURNAL | VOL XVII | 2019

~ 2 ~
Copyright © 2019 by The Public Purpose
The Public Purpose
American University
School of Public Affairs
4400 Massachusetts Ave NW
Washington, DC 20016
Journal Layout & Design: Tysianna Marino & Sarah Henry
All rights reserved. No part of this publication may be reproduced, stored in a retrieval system, or
transmitted in any form or by any means, electronic, mechanical, photocopying, recording or otherwise,
except with the written permission from The Public Purpose or the author as dictated by the copyright.

~ 3 ~
ABOUT THE JOURNAL
The Public Purpose is a peer-reviewed interdisciplinary journal presenting the work of
American University graduate students from the Departments of Government; Justice,
Law, and Criminology; and Public Administration and Policy. Founded in 2003, The
Public Purpose is supported by the SPA Graduate Council with involvement and
guidance of Faculty Review Board, consisting of some of American University’s most
distinguished professors. In addition to an annual print journal, The Public Purpose also
manages a public policy blog at thepublicpurpose.com. The journal is entirely student run
and currently has a staff of about 20 students.
Contact us at:
www.thepublicpurpose.com

~ 4 ~
TABLE OF CONTENTS
FROM THE EDITORS 5
STAFF ACKNOWLEDGEMENT 6
BARRIERS TO ABORTION ACCESS FOR ACTIVE-DUTY SERVICEWOMEN
STATIONED DOMESTICALLY AND ABROAD
Annaliese Johnson 7
CRACKING DOWN ON SENTENCING DISPARITIES: THE FEDERAL
SENTENCING ACT OF 2010’S IMPACT ON COCAINE OFFENDERS
Meghan Ballard 19
DEPENDENCE, VIOLENCE AND NEGLECT IN WOMEN WITH DISABILITIES
Karlee Naylon 34
GOVERNMENT-LED DEVELOPMENT INITIATIVES IN ZIMBABWE
Rebekah McDowell 48
MUNICIPAL BROADBAND NETWORKS: A WORK IN PROGRESS
Daniel Emirkhanian 61
CASE STUDY: INCLUSIONARY ZONING IN WASHINGTON D.C.
Lauren Ricci 70

~ 5 ~
FROM THE EDITORS
Dear Readers,
We are honored and delighted to present the 17th edition of The Public Purpose Journal. This journal is an
academic journal led by graduate students in American University’s School of Public Affairs. Every year,
our executive team and faculty board work together to review academic research of the highest caliber
across a broad range of policy and administrative topics.
This year, The Public Purpose Journal received a record number of submissions representing every
program in the American University School of Public Affairs. The papers presented here demonstrate the
range of topics that AU’s graduate community is tackling in the classroom and the workplace. From
domestic policy affecting the lives of some of the most vulnerable members of our communities to the
impact of international economic development practices, the work of our authors demonstrates the breadth
and depth of this university’s academic passions.
We are grateful to the Graduate Student Council and to the Dean’s office for their continued personal and
financial support as we work to add the American University voice to the public academic discourse. We
could not do this increasingly-valuable work without their support. We thank our student writers and
editors for their hard work in developing a peer-reviewed publication. Thank you so much to the executive
team, who has been working so hard behind-the-scenes to make this happen and for their continued
dedication to the mission of The Public Purpose Journal.
And thank you, reader, for your commitment to continuing to learn about the issues of the world around us.
Our democracy is ever-changing, and requires the best of all of us. We hope that this journal contributes, in
some small way, to that national discourse and the fostering of our shared democracy.
Sincerely,
Indira Bhattacharjee & Sarah Henry
Editor in Chief & Managing Print Editor
~ 6 ~
THE PUBLIC PURPOSE
2018-2019
Editor in Chief
INDIRA BHATTACHARJEE
Executive Board
Managing Print Editor
Managing Online Editor
Associate Print Editor
Associate Online Editor
Treasurer
Events Coordinator
Communications Director
SARAH HENRY
FARRAH PAPPA
BRITTANY WEBB
ISABEL TAYLOR
ALEXANDRA GILLETT
LAUREN KOSTICH
TYSIANNA MARINO
Print Journal Team
Editor in Chief
Managing Print Editor
Associate Print Editor
Senior Print Editor
Senior Print Editor
INDIRA BHATTACHARJEE
SARAH HENRY
BRITTANY WEBB
KIMBERLY MCKEE
TREVONNE HOMER

~ 7 ~
BARRIERS TO ABORTION ACCESS FOR ACTIVE-DUTY SERVICEWOMEN
STATIONED DOMESTICALLY AND ABROAD
Annaliese Johnson
INTRODUCTION
Once barred entirely from military service, women now make up 15.2 percent of
active-duty personnel and 18.2 percent of Reserve and National Guard forces. 1
Thousands of women had served as nurses during World War I and were eventually
allowed to volunteer for non-combat roles in 1942 through the Women’s Auxiliary Army
Corps (WAAC).2 The number of active-duty women in the military has grown from
42,000 in 19733 to 204,628 in 2016.4 Since 2016, women are now able to undertake all
occupational specialties,5 apply for combat positions6, and made up 17.3 percent (39,603)
of active-duty officers in that year.
Despite these achievements, women in all branches of the military continue to
face hurdles in accessing a vital component of reproductive healthcare – abortion care.
The lack of coverage through the military’s insurance program, TRICARE, and the
federal ban on abortion services within military treatment facilities (MTFs) conspire to
create financial and logistical burdens that delay abortion care for active-duty
servicewomen and military dependents. Stigma and confidentiality concerns further
complicate servicewomen’s ability to navigate the complex process of obtaining abortion
care while serving their country. Servicewomen stationed abroad face additional
obstacles, depending on the abortion restrictions in the host country and their ability to
travel to another country to access this care. This paper delves deeper into how lack of
insurance coverage, the MTF ban, stigma, and confidentiality concerns work in tandem to
prevent servicewomen from obtaining access to necessary reproductive healthcare.
1 Braun, Lisa A., Kennedy, Holly P., Womack, Julie A. and Wilson, Candy. (2016, January). Integrative Literature Review: U.S.
Military Women’s Genitourinary and Reproductive Health. Military Medicine, 181(1). 35-49. Retrieved April 6, 2018 from:
http://vg5ly4ql7e.scholar.serialssolutions.com/?sid=google&auinit=LA&aulast=Braun&atitle=Integrative+Literature+Review:+US+
Military+Women%27s+Genitourinary+and+Reproductive+Health&id=doi:10.7205/MILMED-D-15-
00242&title=Military+medicine&volume=181&issue=1&date=2016&spage=35&issn=0026-4075 2 Spring, Kelly A. (2017). In the Military: During World War II. National Women’s History Museum. Retrieved March 12, 2019 from: https://www.womenshistory.org/resources/general/military 3 Patten, Eileen, and Parker, Kim. (2011). Women in the U.S. Military: Growing Share, Distinctive Profile. Pew Social & Demographic Trends. Retrieved on April 27, 2018 from http://assets.pewresearch.org/wp-content/uploads/sites/3/2011/12/women-in-
the-military.pdf 4 Department of Defense. (2016). 2016 Demographics: Profile of the Military Community. Retrieved on April 27, 2018 from http://download.militaryonesource.mil/12038/MOS/Reports/2016-Demographics-Report.pdf 5 McGraw, K., Koehlmoos, Tracey P. and Ritchie, Elspeth C. (2016, January). Women in Combat: Framing the Issues of Health and
Health Research for America’s Servicewomen. Military Medicine, Supplement, 181(1S). 7-11. Retrieved April 6, 2018 from:
http://vg5ly4ql7e.scholar.serialssolutions.com/?sid=google&auinit=K&aulast=McGraw&atitle=Women+in+combat:+Framing+the+is
sues+of+health+and+health+research+for+America%27s+servicewomen&id=doi:10.7205/MILMED-D-15-
00223&title=Military+medicine&volume=181&issue=suppl_1&date=2016&spage=7&issn=0026-4075 6 Silva, Jennifer. (2017, March 15). Women in the Military: Through the Decades. The Huffington Post. Retrieved April 6, 2018 from:
https://www.huffingtonpost.com/entry/women-in-the-military-through-the-decades_us_58c9630fe4b05675ee9c5c55

~ 8 ~
BACKGROUND
Until recently, TRICARE only covered abortion procedures if a woman’s life was
at stake. In 2013, Congress included the Shaheen Amendment in the annual National
Defense Authorization Act, which expanded TRICARE coverage to include abortion care
in cases of rape and incest.7 In all other cases, any aspect of abortion care is not covered,
including services, counseling, and referrals. This includes cases of pregnancy
terminations due to severe fetal abnormalities and psychological reasons.8 The limited
coverage of reproductive healthcare under TRICARE reflects the long-held practices that
block federal funds from being used to pay for abortion care, as echoed in the Hyde
Amendment and other federal insurance programs.9
While the TRICARE funding ban directly impacts active-duty servicewomen, it
also affects servicemembers’ dependents, who may rely on TRICARE for health
insurance. As of 2017, TRICARE provides insurance for nearly 9.4 million individuals,
around 5.5 million of whom are either family members of active-duty service members,
survivors of deceased active-duty members, National Guard and Reserve family
members, or family members of retired service members. 10 In 2015, there were 1.4
million women of reproductive age who received their insurance coverage through
TRICARE, including both servicewomen and military dependents. For 64.28 percent of
these women, TRICARE was their only form of insurance.11 Millions of dependents and
servicewomen seeking abortion care are left to finance every aspect of their procedure
due to the TRICARE funding ban, which could lead to delays in care as they get the
necessary funds together.12
For women who lack insurance coverage, the struggle to find resources to pay for
abortion care can force delayed procedures, which may increase the costs and potential
7 Grindlay, K., Seymour, Jane W., Fix, L., Reiger, S., Keefe-Oates, B. and Grossman, D. (2017, December). Abortion Knowledge and
Experiences Among U.S. Servicewomen: A Qualitative Study. Perspectives on Sexual and Reproductive Health, 49(4). 245-252.
Retrieved April 6, 2018 from: https://onlinelibrary-wiley-com.proxyau.wrlc.org/doi/abs/10.1363/psrh.12044 8 TRICARE. (2014, October 9). Abortions. Department of Defense. Retrieved April 6, 2018 from:
https://tricare.mil/CoveredServices/IsItCovered/Abortions 9 Salganicoff, A., Rosenzweig, C. and Sobel, L. (2017, October 16). The Hyde Amendment and Coverage for Abortion Services.
Kaiser Family Foundation. Retrieved April 9 2018 from: https://www.kff.org/womens-health-policy/perspective/the-hyde-
amendment-and-coverage-for-abortion-services/ 10 Military Health System. Beneficiary Population Statistics: Patients by Beneficiary Category. Department of Defense. Retrieved on
April 9 2018 from: https://health.mil/I-Am-A/Media/Media-Center/Patient-Population-Statistics/Patients-by-Beneficiary-Category 11 Donovan, Megan K. (2017, January 5). In Real Life: Federal Restrictions on Abortion Coverage and the Women They Impact.
Guttmacher Policy Review, 20. Retrieved April 9 2018 from: https://www.guttmacher.org/gpr/2017/01/real-life-federal-restrictions-
abortion-coverage-and-women-they-impact 12 Ibis Reproductive Health. (2016, September). Research brief: The impact of out-of-pocket costs on abortion care access. Retrieved
on April 23, 2018 from https://ibisreproductivehealth.org/publications/research-brief-impact-out-pocket-costs-abortion-care-access

~ 9 ~
health risks of a later abortion.13 Though abortion is one of the safest medical procedures
in the US,14 the risk of complications increases later in pregnancy,15 as does cost.
In 2014, the average costs for a first trimester aspiration procedure and a medication
abortion were $506 and $461, respectively. The procedure costs increase with gestational
age, with an average cost of $860 at 14 to <20 weeks, and $1,874 at or after 20 weeks.16
Studies have shown that in addition to using insurance, women seeking abortions
frequently use organizations like abortion funds17 to finance their procedures, indicating
that the out-of-pocket cost is substantial for a significant proportion of women. Similar to
other types of healthcare, findings suggest that access to insurance may reduce the delays
in access to abortion care.18
Because of its limitations, servicewomen and military dependents covered by
TRICARE must foot the bill for their abortion procedures, which creates a substantial
financial barrier for some. In the only study of US servicewomen’s experience with
abortion, Grindlay et.al observed that almost a quarter of participants “noted the financial
burden of paying for an abortion out of pocket,” with some servicewomen spending an
entire paycheck on their care. Junior enlisted women in particular may find financing
their abortion procedures difficult, due to their lower pay grade. 19 Junior enlisted
servicemembers usually enter service at the lowest pay grades (E1-E2) 20 , making
between $1,514.70 and $1,836.30 monthly in basic pay,21 while commissioned officers
make substantially more. It is not unreasonable, therefore, to assume that junior enlisted
servicewomen may face difficulties in trying to finance their abortion procedures.
The out-of-pocket costs servicewomen incur for abortion procedures are
considerable. Due to lack of data, it is difficult to pinpoint the exact out-of-pocket cost
active-duty servicewomen shoulder or the population’s abortion rate. Because
13 Roberts, Sarah C.M., Gould, H., Kimport, K. Weitz, Tracy A. and Greene Foster, D. (2014). Out-of-Pocket Costs and Insurance
Coverage for Abortion in the United States. Women’s Health Issues, 24(2). Retrieved on April 9 2018 from: https://ac-els-cdn-
com.proxyau.wrlc.org/S1049386714000048/1-s2.0-S1049386714000048-main.pdf?_tid=b2c33d2b-e0f3-4722-8671-
80edc629b763&acdnat=1523286703_c8a7402e313d07544fd9505de01d07e4 14 Guttmacher Institute. (2018, January). Fact Sheet: Induced Abortion in the United States. Retrieved on April 9 2018 from:
https://www.guttmacher.org/fact-sheet/induced-abortion-united-states 15 Guttmacher Institute. (2018, February). Targeted Regulation of Abortion Providers (TRAP) Laws. Retrieved on April 9, 2018 from:
https://www.guttmacher.org/evidence-you-can-use/targeted-regulation-abortion-providers-trap-laws 16 Roberts, Sarah C.M., Gould, H., Kimport, K. Weitz, Tracy A. and Greene Foster, D. (2014). Out-of-Pocket Costs and Insurance
Coverage for Abortion in the United States. Women’s Health Issues, 24(2). Retrieved on April 9 2018 from: https://ac-els-cdn-
com.proxyau.wrlc.org/S1049386714000048/1-s2.0-S1049386714000048-main.pdf?_tid=b2c33d2b-e0f3-4722-8671-
80edc629b763&acdnat=1523286703_c8a7402e313d07544fd9505de01d07e4 17 National Network of Abortion Funds. All Funds. Retrieved on April 23, 2018 from https://abortionfunds.org/need-abortion/ 18 Roberts, Sarah C.M., Gould, Heather, Kimport, Katrina, Weitz, Tracy A., and Greene Foster, Diana. (2014). Out-of-Pocket Costs
and Insurance Coverage for Abortion in the United States. Women’s Health Issues, 24(2). Retrieved on April 23, 2018 from
http://vg5ly4ql7e.scholar.serialssolutions.com/?sid=google&auinit=SCM&aulast=Roberts&atitle=Out-of-
pocket+costs+and+insurance+coverage+for+abortion+in+the+United+States&id=pmid:24630423 19 Grindlay, K., Seymour, Jane W., Reiger, S., Keefe-Oates, B. and Grossman, D. (2017, December). Abortion Knowledge and
Experiences Among U.S. Servicewomen: A Qualitative Study. Perspectives on Sexual and Reproductive Health, 49(4). Retrieved on
April 9, 2018 from: https://onlinelibrary-wiley-com.proxyau.wrlc.org/doi/epdf/10.1363/psrh.12044 20 Military Rates. (2018). Military Pay Charts. Retrieved on April 27, 2018 from https://www.militaryrates.com/military-pay-charts 21 Defense Finance and Accounting Services. (2018, March 31). Military Pay Chart 2018. Retrieved online on April 27, 2018 from https://www.dfas.mil/militarymembers/payentitlements/military-pay-charts.html

~ 10 ~
servicewomen, particularly those stationed abroad, face increased obstacles when
accessing abortion care, it is likely that the rate at which they seek abortion care is lower
than the overall national rate. On the other hand, due to the high rates of sexual assault
within the military22 and documented gaps in contraception availability for deployed
servicewomen,23 their incidence of abortion could be higher than the national rate. The
scarcity of data on this issue make a BOTEC calculation appropriate to give a rough
estimate of the rate and average cost of unintended pregnancies resulting in abortion for
servicewomen.
How Much Do Servicewomen Spend on Abortion Procedures?
This calculation assumes that TRICARE failed to pay for any abortion
procedures. If TRICARE were to fund abortion procedures in cases of rape, incest, or
threat to the mother’s life, this number would be lower. This calculation also does not
include the number of intended pregnancies that ended in abortion, in which case the
estimate would be higher.
In 2011, the unintended pregnancy rate of 18-44-year-old active duty
servicewomen was 72 per 1,000, or 7.2%.24 This means there were an estimated 14,739
unintended pregnancies among the 204,714 active-duty servicewomen in 2011.25 While
there is national data on the amount of unintended pregnancies that result in abortion for
the general population, there is no study as of yet that calculates this rate for
servicewomen. Using the national rate of unintended pregnancies ending in abortion
(42%) 26 to calculate the estimated rate for servicewomen, around 6,190 unintended
pregnancies of active-duty servicewomen ended in abortion in 2011.
To calculate the cost of these procedures, the average costs of abortion procedures
at different gestational periods was used to create a range of potential costs. Using the
2014 average costs of abortion care, I estimate that abortions due to unintended
pregnancy for active-duty servicewomen cost the group as a whole between $2,853,590
and $5,323,400 in 2014 alone.
The first figure ($2,853,590) represents the cost if each of the 6,190 procedures
were medication abortions (the least expensive option, available up to 10 weeks
22 Rico, Antonieta. (2017, December 12). Why Military Women Are Missing from the #MeToo Moment. TIME. Retrieved April 9
2018 from: http://time.com/5060570/military-women-sexual-assault/ 23 Grindlay, K. and Grossman, D. (2013). Contraception access and use among US servicewomen during deployment. Contraception,
87. Retrieved April 9 2018 from: https://ac-els-cdn-com.proxyau.wrlc.org/S0010782412008293/1-s2.0-S0010782412008293-
main.pdf?_tid=4c34e64c-8839-41eb-904d-18ad43bb122d&acdnat=1523287624_c7470df23809fc9f663669a2c0cc9f60 24 Grindlay, K. and Grossman, D. (2015, December). Unintended pregnancy among active-duty women in the United States military,
2011. Contraception, 92(6). Retreived on April 9 2018 from:
http://vg5ly4ql7e.scholar.serialssolutions.com/?sid=google&auinit=K&aulast=Grindlay&atitle=Unintended+pregnancy+among+activ
e-duty+women+in+the+United+States+military,+2011&id=pmid:26345183 25 Department of Defense. (2012, November). Profile of the Military Community: Demographics 2011. Retrieved on April 13, 2018
from: http://download.militaryonesource.mil/12038/MOS/Reports/2011_Demographics_Report.pdf 26 Guttmacher Institute. (2016, September). Unintended Pregnancy in the United States. Retrieved on April 9 2018 from:
https://www.guttmacher.org/fact-sheet/unintended-pregnancy-united-states

~ 11 ~
gestation) 27 and the latter ($5,323,400) represents the cost if each procedure were
performed at 19 weeks.
This estimate is so broad mainly because there is no data available on the timing
of servicewomen’s abortion procedures. Were this data available, it would be possible to
assess costs more precisely. On a national level, 89 percent of abortions in the US occur
within the first 12 weeks of gestation (the first trimester), 6.2 percent occur between 13-
15 weeks, 3.8 percent between 16-20 weeks, and 1.3 percent at or after 21 weeks.28
Because active-duty servicewomen stationed internationally and domestically face delays
in care, it is difficult to determine whether their abortion timeframe mirrors this national
trend, though it is likely most are not procuring care at or after 19 weeks. This estimate
assumes that the number of abortions procured by active-duty servicewomen remained
constant through 2014 and that no servicewoman had an abortion performed at or after 20
weeks gestation.
Whether active-duty servicewomen shouldered the entire cost of their procedures
or used abortion funds is also unknown. Regardless, the TRICARE funding ban clearly
imposes significant financial costs on the 1.4 million women of reproductive age who
receive TRICARE insurance.29
The Ban on Abortion Procedures in Military Treatment Facilities (MTFs) and
Other Domestic Barriers
In addition to the funding ban, active-duty servicewomen are burdened by the
federal law’s ban of abortion care in military treatment facilities (MTFs), except for cases
of rape, incest, or life endangerment. In these instances alone may a servicewoman
receive abortion care in an MTF. An estimated average of 3.8 abortions per year were
performed in MTFs between 1996 and 2009, though it is unclear how the extended
coverage of procedures allowed under the Shaheen Amendment has impacted that rate.30
The MTF ban extends to abortion procedures that are privately funded by servicewomen,
who cannot access TRICARE funding due to the restrictions. This ban forces most
servicewomen seeking abortion care to leave their military bases, even those stationed
overseas or in combat zones.31 Pushed off base in search of abortion care, domestically-
based active-duty servicewomen must contend with the abortion restrictions of the states
where they are stationed.
27 Planned Parenthood. The Abortion Pill. Retrieved April 23, 2018 from https://www.plannedparenthood.org/learn/abortion/the-
abortion-pill 28 Guttmacher Institute. (2018, January). Induced Abortion in the United States. Retrieved on April 13, 2018 from:
https://www.guttmacher.org/fact-sheet/induced-abortion-united-states 29 Donovan, Megan K. (2017, January 5). In Real Life: Federal Restrictions on Abortion Coverage and the Women They Impact.
Guttmacher Policy Review, 20. Retrieved April 9 2018 from: https://www.guttmacher.org/gpr/2017/01/real-life-federal-restrictions-
abortion-coverage-and-women-they-impact 30 Grindlay, K., Seymour, Jane W., Reiger, S., Keefe-Oates, B. and Grossman, D. (2017, December). Abortion Knowledge and
Experiences Among U.S. Servicewomen: A Qualitative Study. Perspectives on Sexual and Reproductive Health, 49(4). Retrieved on
April 9, 2018 from: https://onlinelibrary-wiley-com.proxyau.wrlc.org/doi/epdf/10.1363/psrh.12044 31 National Abortion Federation. (2016, April 26). Facilities Ban Coalition Letter. Retrieved on April 9 2018 from:
http://prochoice.org/wp-content/uploads/Facilities-Ban-Coalition-Letter-Final.pdf
~ 12 ~
State-level abortion restrictions such as ultrasound requirements, mandatory
delays, and TRAP Laws (Targeted Regulation of Abortion Providers) make access to
timely abortion care more difficult. Servicewomen are particularly affected by these
abortion restrictions. Active-duty servicewomen face logistical barriers to abortion
access, such as organizing transportation, requesting leave from their duties, and
maintaining confidentiality throughout the process, in addition to navigating state
restrictions. These logistical concerns compound the problems created by ultrasound
requirements, mandatory delays, and TRAP Laws, and make accessing off-base abortion
care more challenging for servicewomen.
Domestic active-duty servicewomen face unequal abortion access, with a large
portion of them stationed in states that are hostile to abortion rights. The Guttmacher
Institute, a research and policy organization focused on sexual and reproductive health
and rights, studies abortion restrictions and determines whether states can be considered
extremely hostile, hostile, middle-ground, or supportive of abortion rights.32 Of the ten
states with the largest numbers of active-duty military personnel (CA, TX, NC, VA, GA,
FL, WA, SC, HI, CO),33 five are considered extremely hostile to abortion rights (TX,
VA, NC, FL, SC), one is considered hostile (GA), two are considered middle-ground (CO
and HI), and two are considered supportive (CA and WA).34 Of the ten aforementioned
states, six have at least two types of ultrasound requirements (TX, VA, NC, FL, SC, GA),
six impose mandatory delays before a woman can have an abortion (TX, VA, NC, FL,
SC, GA), and eight currently enforce at least one form of TRAP Law (TX, VA, NC, FL,
SC, GA, WA, HI).35 Large numbers of active-duty service women are burdened by these
abortion restrictions, on top of the TRICARE funding and MTF restrictions imposed by
the military. These restrictions create delays and logistical issues that are particularly
burdensome for active-duty servicewomen, who must fund their own care, arrange
transportation off-base, and request leave from their duties to receive time-sensitive
reproductive healthcare. I will briefly describe each of these restrictions and their impacts
on servicewomen’s abortion access.
Ultrasound Requirements
There are many uses for ultrasounds in reproductive healthcare, but states that are
hostile to abortion rights often impose ultrasound requirements without considering the
best interest of the patient. Often times, these procedures are neither medically necessary
32 Nash, Elizabeth, Benson Gold, Rachel, Mohammed, Lizamarie, Ansari-Thomas, Zohra, and Cappello, Olivia. (2018, January 2018). Policy Trends in the States, 2017. The Guttmacher Institute. Retrieved online on April 27, 2018 from
https://www.guttmacher.org/article/2018/01/policy-trends-states-2017 33 Governing. (2017, September 31). Military Active-Duty Personnel, Civilians by State. e.Republic. Retrieved on April 9, 2018 from:
http://www.governing.com/gov-data/military-civilian-active-duty-employee-workforce-numbers-by-state.html 34 Guttmacher Institute. (2018, January 2). States Hostile to Abortion Rights, 2017. Retrieved on April 9 2018 from:
https://www.guttmacher.org/infographic/2018/states-hostile-abortion-rights-2017 35 National Partnership for Women & Families. (2018, March). Bad Medicine: How a Political Agenda Is Undermining Abortion Care
and Access. Retrieved on April 9, 2018 from: http://www.nationalpartnership.org/research-library/repro/bad-medicine-third-
edition.pdf

~ 13 ~
nor desired by the patient, flouting medical ethics. Some states impose additional
requirements, such as mandatory delays after the ultrasound or that the ultrasound and
abortion be performed by the same provider. By mandating additional procedures, which
require multiple doctor visits, states with ultrasound requirements create unnecessary
delays and additional logistical hurdles for women seeking abortion care.36 Not only must
women schedule additional transportation for these mandated ultrasounds, but they may
be required to pay for them as well. This is certainly true for servicewomen, as no portion
of their abortion procedure is covered by TRICARE. The many active-duty
servicewomen stationed in states with ultrasound requirements face rising costs of care
and increasing delays in accessing care.
Mandatory Delays
Mandatory delay laws require patients to wait a specified number of days after
their first doctor’s visit before being able to obtain abortion care. Mandatory delays not
only delay time-sensitive care but require additional logistical planning and unnecessary
trips to a clinic, increasing the cost of transportation and time away from work. In a
qualitative study of military womens’ experiences seeking abortion care, most
servicewomen travelled about an hour each way to the clinic, with three women in
Louisiana and Texas having to make two trips to the clinic due to their state’s abortion
restrictions.37 Accessing abortion care is already difficult for active-duty servicewomen,
and mandatory delays further complicate the process.
TRAP Laws
Targeted Regulation of Abortion Providers (TRAP Laws) require abortion clinics
and providers to adhere to onerous, medically unnecessary requirements. TRAP Laws
include requiring providers to have admitting privileges or alternative agreements with a
nearby hospital, the facility to have a transfer agreement with a nearby hospital, clinics to
satisfy specific facility requirements or fetal tissue to be buried or cremated, as well as
stipulations that only physicians may provide abortions. TRAP Laws often force clinics
that cannot afford to meet these unreasonable requirements to close, raising the cost of
care and increasing the distance women must travel to obtain abortion care.38
A recent analysis of Texas’ law HB-2 (struck down by the Supreme Court in
Whole Women’s Health v. Hellerstedt) revealed that clinic closures as a result of HB-2
substantially increased the distances most women had to travel to procure care and
36 National Partnership for Women & Families. (2018, March). Bad Medicine: How a Political Agenda Is Undermining Abortion Care
and Access. Retrieved on April 9, 2018 from: http://www.nationalpartnership.org/research-library/repro/bad-medicine-third-
edition.pdf 37 Grindlay, K., Seymour, Jane W., Reiger, S., Keefe-Oates, B. and Grossman, D. (2017, December). Abortion Knowledge and
Experiences Among U.S. Servicewomen: A Qualitative Study. Perspectives on Sexual and Reproductive Health, 49(4). Retrieved on
April 9 2018 from: https://onlinelibrary-wiley-com.proxyau.wrlc.org/doi/epdf/10.1363/psrh.12044 38 National Partnership for Women & Families. (2018, March). Bad Medicine: How a Political Agenda Is Undermining Abortion Care
and Access. Retrieved on April 9, 2018 from: http://www.nationalpartnership.org/research-library/repro/bad-medicine-third-
edition.pdf

~ 14 ~
decreased the number of clinics available to the same population of women.39 As a result,
abortion rates declined across the state, and the researchers estimate that there would
have been almost 15,000 more abortions performed in Texas in 2014-2015 had access to
abortion care remained at the rate before HB-2 was signed into law.40 Though there is no
research to document what happened to these “missing” abortions, Cunningham et al.
hypothesize that while some women decreased their risky sexual behaviors, others may
have resorted to self-induced abortions, by procuring over-the-counter abortifacients in
Mexican pharmacies.41 The data collected in Texas shows how similar TRAP Laws in
other states can impede timely access to care.
TRAP Laws make care more expensive and harder to procure. In 2014, almost
60% of women who experienced a delay in obtaining abortion care cited that the time it
took to arrange the procedure and raise funds were reasons for the delay. 42 One
servicewoman noted that, “You have enough to go through. And then you also have to
think about the cost of it and… the extra steps, instead of it just being taken care of like
[other health services] normally would.” An officer in the Army said, “In the evenings, I
didn’t have any freedom. I was on training in Georgia, and so I didn’t have a car. And so
that’s why I had to wait all the way until the weekend to go get a pregnancy test, and then
I had to wait until the following weekend [for the abortion].”43 After being forced off-
base and outside of their regular healthcare facilities (MTFs) to access abortion care,
active-duty servicewomen must contend with TRAP Laws that single out abortion care
with medically unnecessary restrictions.
Stigma Surrounding Abortion and Confidentiality Concerns
In addition to these state-specific barriers, active-duty servicewomen seeking
abortion care off-base must request time off. Though higher ranking servicewomen may
be able to obtain leave without request, servicewomen of lower ranks will have to submit
a request to their commanding officer. This process may require them to divulge personal
health information they would otherwise not share with fellow service members or
superiors.44
In the latest qualitative study on the topic, the fear of a lack of confidentiality was
frequently cited by servicewomen who sought abortion care while on active duty. Many
of these servicewomen discussed the stigma surrounding abortion in the military and the
39 Cunningham, Scott, Lindo, Jason M., Myers, Caitlin, and Schlosser, Andrea. (2018, January). How Far is Too Far? New Evidence on Abortion Clinic Closures, Access, and Abortions. National Bureau of Economic Research. 40 Ibid. 41 Ibid. 42 Jones RK and Jerman J, Time to Appointment and Delays in Accessing Care Among U.S. Abortion Patients, New York: Guttmacher
Institute, 2016, https://www.guttmacher.org/report/delays-in-accessing-care-among-us-abortion-patients. 43 Grindlay, K., Seymour, Jane W., Reiger, S., Keefe-Oates, B. and Grossman, D. (2017, December). Abortion Knowledge and
Experiences Among U.S. Servicewomen: A Qualitative Study. Perspectives on Sexual and Reproductive Health, 49(4). Retrieved on
April 9 2018 from: https://onlinelibrary-wiley-com.proxyau.wrlc.org/doi/epdf/10.1363/psrh.12044 44 Grindlay, K., Seymour, Jane W., Reiger, S., Keefe-Oates, B. and Grossman, D. (2017, December). Abortion Knowledge and
Experiences Among U.S. Servicewomen: A Qualitative Study. Perspectives on Sexual and Reproductive Health, 49(4). Retrieved on
April 9 2018 from: https://onlinelibrary-wiley-com.proxyau.wrlc.org/doi/epdf/10.1363/psrh.12044

~ 15 ~
potential negative impact disclosing their pregnancy or abortion decision would have on
their careers. Three participants reported that their commanding officers learned of their
pregnancy without their disclosing the information, highlighting the very real fear of
some servicewomen that their pregnancy status may not be kept confidential. The fear of
disclosing personal healthcare information led some servicewomen to schedule their
appointments during non-work hours, which adds to the logistical burden in accessing
care. Others postponed their appointments until their next scheduled leave, delaying time-
sensitive healthcare.45
Concerns of a lack of confidentiality also influence some servicewomen’s choice
of abortion method and how they follow their post-care instructions. One study
participant noted that the rule requiring service members to report all prescription
medications to their Commanding Officers influenced her decision about her abortion
method – she opted for a surgical abortion without anesthesia to better protect her
privacy. In fact, of the 17 servicewomen participants who opted for surgical abortions,
five did so because of the quicker recovery or minimal follow-up, which required fewer
visits off-base and would better protect their privacy. One participant reported that
because she did not disclose her abortion decision, she could not follow proper post-
abortion care and ended up using tampons after her procedure, although tampon use is
not recommended, due to her infrequent access to a restroom. A total of five respondents
noted that the military’s abortion policy had specifically negative health consequences for
servicewomen, while almost all participants reported that the policy had overall negative
effects on servicewomen. 46 Active-duty servicewomen not only face myriad state
abortion restrictions, but fears of stigma and lack of confidentiality within their
organizations. The combination of these factors leads to logistical hurdles, delays in care,
and healthcare decisions that may not be in the best interests of the patient.
Problems Add Up for Servicewomen Stationed Abroad: The MTF Ban and No
Good Options
Difficulties in procuring abortion care are particularly severe for active-duty
servicewomen who are stationed abroad. The federal law prohibiting abortion procedures
in MTFs forces active-duty servicewomen stationed abroad to seek abortion care off-
base, similar to their domestically-stationed counterparts. But while US-stationed
servicewomen have their right to an abortion reaffirmed by the Supreme Court,
servicewomen stationed abroad are subject to the abortion regulations of their host
country. As such, servicewomen deployed overseas face varied levels of off-base
abortion access. For example, servicewomen stationed in Japan can legally obtain
45 Grindlay, K., Seymour, Jane W., Reiger, S., Keefe-Oates, B. and Grossman, D. (2017, December). Abortion Knowledge and
Experiences Among U.S. Servicewomen: A Qualitative Study. Perspectives on Sexual and Reproductive Health, 49(4). Retrieved on
April 9 2018 from: https://onlinelibrary-wiley-com.proxyau.wrlc.org/doi/epdf/10.1363/psrh.12044 46 Grindlay, K., Seymour, Jane W., Reiger, S., Keefe-Oates, B. and Grossman, D. (2017, December). Abortion Knowledge and
Experiences Among U.S. Servicewomen: A Qualitative Study. Perspectives on Sexual and Reproductive Health, 49(4). Retrieved on
April 9 2018 from: https://onlinelibrary-wiley-com.proxyau.wrlc.org/doi/epdf/10.1363/psrh.12044
~ 16 ~
abortions on socioeconomic grounds, to save their health or life, and in the case of rape.47
Servicewomen stationed in Afghanistan, however, may only obtain an abortion to save
their lives, while those in Iraq will find no legal abortion access, even in the case of rape
or life endangerment.48
Servicewomen stationed in countries with significant abortion restrictions may
choose to travel to a different country with less restrictive laws, such as Germany, Italy,
or Turkey, where abortions are available without restriction as to the reason.49 Like their
US-stationed counterparts, active-duty servicewomen abroad must request time off in
order to leave their bases to seek abortion care, and face similar issues of seeking care
while maintaining confidentiality and avoiding stigma. Deployed and overseas
servicewomen have a number of reasons to not disclose their pregnancy to anyone in
their organizations. One significant reason is the standard protocol to remove pregnant
servicewomen from their deployment. Many surveyed servicewomen feared that
disclosing their status could result in loss of income, formal reprimands, and negative
treatment from peers or supervisors.50 For example, one servicewoman revealed that after
she sought abortion care in the US following an unintended pregnancy during
deployment, she received a formal letter of reprimand from her brigade commander, who
attempted to use her pregnancy as a reason to bar her re-enlistment.51
Therefore, it is unsurprising that deployed and overseas servicewomen face
pregnancy and abortion stigma in their organizations just as their domestically-stationed
peers do. A former military officer reported that it is a commonly held view among
service members that active-duty servicewomen intentionally become pregnant to avoid
deployment, avoid physical labor and training requirements, or to leave the barracks and
move into off-base housing.52 In an effort to maintain their privacy and reduce costs,
some servicewomen overseas choose to wait until their next scheduled leave to procure
an abortion in the US, delaying time-sensitive care. One servicewoman enlisted in the
Navy explained, “I did not tell my chain of command at all. Part of that was because I’m
one of the very few females that works within my department…There’s a lot of like
47 Center for Reproductive Rights. (2018). The World’s Abortion Laws Map. Retrieved on April 13, 2018 from
http://www.worldabortionlaws.com/map/ 48 Center for Reproductive Rights. (2018). The World’s Abortion Laws Map. Retrieved on April 13, 2018 from
http://www.worldabortionlaws.com/map/ 49 Center for Reproductive Rights. (2018). The World’s Abortion Laws Map. Retrieved on April 13, 2018 from
http://www.worldabortionlaws.com/map/ 50 Ibis Reproductive Health. (2017, February). Sexual and reproductive health of women in the US military. Issue brief 4: The impact
of unintended pregnancy on servicewomen and the military. Retrieved on April 13, 2018 from:
https://ibisreproductivehealth.org/sites/default/files/files/publications/Military%20Brief%204%202017-02-21_0.pdf 51 Manski, R., Grindlay, K., Burns, B., Holt, K., and Grossman, D. (2014, June). Reproductive Health Access Among Deployed U.S.
Servicewomen: A Qualitative Study. Military Medicine, 179 (6). Retrieved April 16, 2018 from
http://vg5ly4ql7e.scholar.serialssolutions.com/?sid=google&auinit=R&aulast=Manski&atitle=Reproductive+health+access+among+d
eployed+US+servicewomen:+a+qualitative+study&id=doi:10.7205/MILMED-D-13-
00302&title=Military+medicine&volume=179&issue=6&date=2014&spage=645&issn=0026-4075 52 Ibis Reproductive Health. (2017, February). Sexual and reproductive health of women in the US military. Issue brief 5: Former and
retired military officers’ perspective on military reproductive health access and policy. Retrieved on April 13, 2018 from:
https://ibisreproductivehealth.org/sites/default/files/files/publications/Military%20Brief%201%202017-02-10.pdf
~ 17 ~
negative stigma that goes along with that…I was recently promoted…and this was right
before my promotion.”53 Others may seek unsafe or illegal abortions in their assigned
country, potentially risking their health and lives.
The recent study of Texas’ TRAP Law, HB-2, by Cunningham et al. shows how
policies that curtail abortion access may inadvertently create back channels whereby
women seek to self-induce their abortions or seek illegal abortion care. 54 In fact,
interviews conducted with former and retired military officers indicate that the possibility
of deployed servicewomen seeking unsafe abortions is a very real concern. 55 One
servicewoman who was interviewed about the military’s abortion policy commented that,
“We can be stationed all over the world, and… for other places that aren’t up to par with
their health care standards,… you’re putting women in a really dangerous situation where
they’re probably not getting the safest health care, they probably don’t have access to the
most modern technology, and it’s just putting them in a really bad situation overall.”56
Abortion Care in the Context of Military Sexual Assault
The difficulty active-duty and deployed servicewomen face when obtaining
abortion care is especially troubling when one considers the high rate of sexual trauma
servicewomen experience. It is estimated that between one-fourth and one-third of
servicewomen experience sexual assault while enlisted,57 though experts hypothesize that
only around 32% of victims (both men and women) report their assaults. 58 The
prevalence of sexual assault coupled with the fear of stigma and lack of confidentiality on
pregnancy and abortion decisions put servicewomen in difficult positions.
Although servicewomen are entitled to an MTF abortion procedure and
TRICARE coverage in the case of rape, they may not seek care. It is important to note
that not every sexual assault results in pregnancy and not every survivor will choose to
terminate their pregnancy. However, the low reporting rates of military sexual assault
could indicate that servicewomen experiencing pregnancy as a result of sexual assault
choose not to report their assaults, even though it would help them access abortion
funding or care at their MTFs. A survey of servicewomen in 2010 who experienced
unintended pregnancy revealed that 4% of their pregnancies stemmed from sexual assault
53 Grindlay, K., Seymour, Jane W., Reiger, S., Keefe-Oates, B. and Grossman, D. (2017, December). Abortion Knowledge and
Experiences Among U.S. Servicewomen: A Qualitative Study. Perspectives on Sexual and Reproductive Health, 49(4). Retrieved on
April 9 2018 from: https://onlinelibrary-wiley-com.proxyau.wrlc.org/doi/epdf/10.1363/psrh.12044 54 Cunningham et al. 55 Ibis Reproductive Health. (2017, February). Sexual and reproductive health of women in the US military. Issue brief 5: Former and
retired military officers’ perspective on military reproductive health access and policy. Retrieved on April 13, 2018 from:
https://ibisreproductivehealth.org/sites/default/files/files/publications/Military%20Brief%205%202017-02-21.pdf 56 Grindlay, K., Seymour, Jane W., Reiger, S., Keefe-Oates, B. and Grossman, D. (2017, December). Abortion Knowledge and
Experiences Among U.S. Servicewomen: A Qualitative Study. Perspectives on Sexual and Reproductive Health, 49(4). Retrieved on
April 9 2018 from: https://onlinelibrary-wiley-com.proxyau.wrlc.org/doi/epdf/10.1363/psrh.12044 57 Suris, A., and Lind, L. (2008, October). Military Sexual Trauma: A Review of Prevalence and Associated Health Consequences in
Veterans. Trauma, Violence, & Abuse, 9(4). Retrieved on April 16, 2018 from
http://journals.sagepub.com.proxyau.wrlc.org/doi/pdf/10.1177/1524838008324419 58 Department of Defense. (2016). FY16 Annual Report Statistics Highlights. Retrieved on April 16, 2018 from
http://www.sapr.mil/public/images/FY16_Annual/SAPRO_2016_AR_Report_Statistical_Highlights_Info_Graphic.jpg

~ 18 ~
(18% did not report a reason for their pregnancy). Some of these respondents explained
that they did not seek abortion care at their MTF due to concerns that they would be
blamed for their assault, or not believed, potentially risking their careers.59 Unable or
unwilling to report their sexual assaults or pregnancies, servicewomen in need of timely
healthcare are left to their own devices, putting their health at risk.
CONCLUSION
For active-duty servicewomen stationed domestically and those deployed abroad,
accessing abortion care is logistically challenging, and may result in delays that increase
costs and chances of complications.60 Servicewomen seeking abortion care shoulder a
serious financial burden due to the TRICARE funding ban, and those stationed in
abortion-hostile states must contend with a slew of abortion restrictions designed to
impede their access to care. Servicewomen stationed overseas and those deployed face
additional distance, costs, and delays in accessing care, as well as the potential of being
removed from duty upon disclosing their pregnancy status. For servicewomen who have
experienced sexual assault, the negative consequences of reporting their experience may
serve as a deterrent from accessing the care they are entitled to. The process of seeking
abortion care costs servicewomen considerable time, resources, and energy, in addition to
fears of disclosure, stigma, and negative impacts on their careers. The TRICARE funding
ban and the MTF procedural ban deny servicewomen timely access to the comprehensive
reproductive health services they are entitled to as Americans.
59 Ibis Reproductive Health. (2012, February). Sexual and reproductive health of women in the US military. Issue brief 1:
Contraception, unintended pregnancy, and abortion. Retrieved April 16, 2018 from
https://ibisreproductivehealth.org/publications/sexual-and-reproductive-health-women-us-military-issue-brief-1-contraception-
unintended 60 Ibis Reproductive Health. (2017, February). Sexual and reproductive health of women in the US military. Issue brief 4: The impact
of unintended pregnancy on servicewomen and the military. Retrieved April 16, 2018 from
https://ibisreproductivehealth.org/publications/sexual-and-reproductive-health-women-us-military-issue-brief-4-impact-unintended

~ 19 ~
CRACKING DOWN ON SENTENCING DISPARITIES: THE FEDERAL
SENTENCING ACT OF 2010’S IMPACT ON COCAINE OFFENDERS
Meghan Ballard
ABSTRACT
Crack cocaine’s growth in the United States during the mid-1980s was accompanied by a
suite of deterrence-driven criminal justice policies. One such policy was the Anti-Drug
Abuse Act of 1986 (ADAA), The ADAA was the first federal criminal law to differentiate
crack from other forms of cocaine and imposed a 100:1 sentencing ratio (Palamar,
Davies, Ompad, Cleland & Weitzman, 2015). The ADAA’s general imposition of longer
prison sentences for all cocaine offenders had a disparate and devastating impact on
communities of color. By the 2000s, African Americans had served almost as much time
in prison for non-violent drug offenses as Whites had for violent offenses (Vagins &
McCurdy, 2006). The Fair Sentencing Act of 2010 (FSA) attempted to remedy such
disparities by, among other things, lowering the sentencing ratio for crack and powder
cocaine from 100:1 to 18:1. Using secondary data from the United States Sentencing
Commission, this study examines the FSA’s impact on sentencing disparities of African
American and White cocaine offenders. Results from difference-in-difference regression
analyses indicate that the FSA not only lowered the average prison sentence length for
all cocaine offenders, but also report an average of a 7 to 11 months reduction in prison
sentences for crack cocaine offenders. Additionally, results indicate that the reduced
effect on sentence lengths was stronger for African American than White cocaine
offenders. This study aims to supply policymakers with research about unjust disparities
in sentencing.
INTRODUCTION
Cocaine abuse is responsible for millions of emergency room visits and overdoses
every year in the United States. Most prevalent among the wealthy elite in the 1970s,
cocaine was once a symbol of affluence. Its popularity exploded when crack, a smokable
rock form of cocaine, hit the Los Angeles drug scene in 1981 (Beaver, 2010). Crack was
cheaper, sold in smaller quantities than powder cocaine, and was peddled in inner-city
drug markets (Vagins & McCurdy, 2006). Consequently, crack became associated with
communities of color. In 1985, major newspapers began differentiating powder from
crack cocaine. By 1986, major news outlets declared crack an “epidemic” (Gross, 1985).
Media reports disproportionately linked African Americans with crack in conjunction
with violence (Cobbina, 2008). This fueled a false black threat narrative, and
misleadingly portrayed crack as more dangerous than powder cocaine.

~ 20 ~
President Ronald Reagan harnessed media attention to garner congressional
support for his most significant “War on Drugs” legislation, the Anti-Drug Abuse Act of
1986 (ADAA). The ADAA had unanimous House and Senate support, and created
mandatory minimum sentences for federal drug offenders that varied by amount and type
of drug involved. It was the first federal criminal law that differentiated crack from other
forms of cocaine by imposing a 100:1 ratio for the sentencing of crack versus powder
cocaine offenses (Palamar et al., 2015). Additionally, the ADAA created harsher
sentencing guidelines for possession offenses of crack cocaine. Simple possession of
powder cocaine was a misdemeanor and carried up to a one-year sentence, whereas
simple possession of crack was a felony and carried a mandatory five-year sentence
(Beaver, 2010).
Justification for the sentencing disparity stemmed from a number of myths
associated with crack that have since been dispelled. Crack was believed to be more
addictive than powder cocaine. However, a 1996 study in The Journal of American
Medicine that the first to dispute this myth when it concluded that the effects of cocaine
are similar regardless of form (Hatsukami & Fischman, 1996). Crack was also believed to
cause violent physiological behavior. This myth was initially challenged by a 1988 study
of homicides in New York City that found 85% of all deaths involving crack resulted not
from the drug, but rather from the inherently violent illegal drug market (Goldstein,
Brownstein, Ryan, & Bellucci, 1989). Perhaps the most persuasive myth was that crack,
unlike powder cocaine, posed a unique danger to fetuses (i.e. “crack babies”) (Vagins &
McCurdy, 2006). However, Doctor Hallam Hurt and colleagues’ (2011) decades-long
study that followed 224 babies born to crack-addicted mothers in Philadelphia reported
almost no differences between babies born to addicted-mothers versus non-addicted
mothers. In a National Public Radio interview, Doctor Hurt stated that the issues
identified resulted from poverty, not crack cocaine (Martin, 2013). A sentiment that has
sense been reinforced.
Within years of the ADAA’s passage, it became clear that the Act had a disparate
impact on African Americans. In 1986, before the enactment of the ADAA, the “average
federal drug sentence for African Americans was 11 percent higher than for Whites. Four
years later, the average federal drug sentence for African Americans was 49 percent
higher” (Vagins & McCurdy, 2006, p. ii). In 2004, the United States Sentencing
Commission (USSC) argued that the crack-powder sentencing disparity contributed
“more to the differences in average sentences between African American and White
offenders than any possible effect of discrimination,” and remedying the disparity “would
better reduce the [sentencing] gap than any other single policy change” (USSC, 2014,
n.p.).
Program Description
~ 21 ~
On August 3, 2010, President Barack Obama signed into law the Fair Sentencing
Act of 2010 (FSA). The FSA reduced the sentencing ratio for crack and powder cocaine
offenses from 100:1 to 18:1. Prior to the FSA, 5 grams of crack (or 500 grams of powder
cocaine) carried a 5-year mandatory minimum, and 50 grams of crack (or 5,000 grams of
powder cocaine) carried a 10-year mandatory minimum. After the FSA, 28 grams of
crack (or 500 grams of powder cocaine) triggered a 5-year sentence, and 280 grams of
crack (or 5,000 grams of powder cocaine) triggered a 10-year sentence (Grindler, 2010).
In 2011, the USSC voted to retroactively apply the new guidelines to individuals
sentenced before the law was enacted.
The primary goal of the FSA was to reduce the severity of crack cocaine
sentences and to “reduce unjust disparities in sentencing for similar offenses involving
different types of drugs” (Holder, 2014, n.p.). In turn, it was theorized that these changes
would reduce sentencing disparities among African American and White cocaine
offenders.
Research Question & Hypothesis
This study seeks to answer the following questions: What impact has the FSA had
on sentencing disparities for crack and powder cocaine offenders? In particular, has the
FSA achieved its goal of reducing the sentencing disparity between African American
and White offenders? It is hypothesized that:
● H1: After the passage of the FSA, crack cocaine offenders experienced a
greater reduced effect on sentence length relative to powder cocaine
offenders.
● H2: The reduced effect on sentence lengths was stronger for African
Americans than Whites.
An impact analysis of the FSA on sentencing disparities provides insight into how
the application of sentencing practices, like mandatory minimums, harmfully and
disproportionately impacts historically marginalized populations. Michelle Alexander
(2012) argues in The New Jim Crow that laws like the ADAA perpetuate a system of
racial control. The African American men in America’s prisons are not exclusively
impacted by mass incarceration, as their family and community members who rely on
them feel the impact as well. To avoid the missteps of past politicians, who allowed
myths and media to dictate justice policy, research like this study must be conducted to
encourage the promotion of equitable and data-driven policies.
METHODS
Data & Sample
To determine the FSA’s effect on sentence lengths of cocaine offenders, a natural
experiment was conducted utilizing secondary datasets that captured information about
two naturally-occurring sample groups from two years prior to (2008) and two years after
(2012) the FSA’s enactment. These datasets originated from the USSC Annual

~ 22 ~
Monitoring Reports of Federal Criminal Sentences, which include data on individual
federal criminal cases received by the USSC that were assessed as constitutional.
The control group consists of federal drug offenders sentenced in both fiscal year
2008 (“FY08”) and fiscal year 2012 (“FY12”) where powder cocaine was involved
without the presence of crack, and where the defendant’s race was recorded as African
American or White. The treatment group consists of federal drug offenders sentenced in
both fiscal years where the primary or secondary drug involved was crack cocaine, and
where the defendant’s race was recorded as African American or White. The FY08 and
FY12 datasets were appended to form a third dataset, with an added treatment dummy
variable for fiscal year. Table 1 contains the variable definitions, and Table 2 contains
descriptive statistics broken down by fiscal year.
Statistically significant differences of prison sentence length means in the control
and treatment groups, by substance type and race, indicate that the gaps were not
attributable to chance. In both FY08 and FY12, crack offenders received significantly
longer sentences than powder cocaine offenders, and African American cocaine offenders
received significantly longer sentences than their White counterparts. In FY08, on
average, crack offenders received sentences that were 20 months longer than their
powder cocaine counterparts, and African American cocaine offenders received sentences
that were 43 months longer than their White counterparts. In FY12, while there was a
reduction in the sentencing gap by substance type and race, crack offenders and African
American cocaine offenders still received sentences that were significantly longer. Crack
offenders, on average, received sentences that were eight months longer than powder
cocaine offenders, and African American cocaine offenders received sentences that were
37 months longer than their White counterparts. Perhaps most jarring, however, is that
even when comparing the sentences of offenders within a drug type and across fiscal
years, African Americans received significantly longer prison sentences. Regardless of
when the offense occurred and whether it involved crack or powder cocaine, on average
African American offenders received sentences that were 30 months longer than their
White offenders.
Additionally, Cohen’s d effect size measure was calculated to quantify the size of
difference between the control and treatment groups. A calculation performed on prison
sentence lengths across samples, irrespective of substance type and powder, revealed a
Cohen’s d of .23. According to Cohen’s (1969) guidelines this indicates a small, yet
meaningful, effect size.
Measures
The dependent variable in this study is the offender’s ordered prison sentence in
months, which excludes months of alternative confinement. To maintain consistency
across datasets, a number of adjustments were made to this variable: total prison
sentences were recoded to zero if the sentence was probation, life sentences were recoded

~ 23 ~
to 470 months, and sentences above 480 months were adjusted to 480. While each of
these modifications improve the measurement’s reliability and validity, the recoding of
sentences above 480 months prevented an effective life sentence, like 2880 months, from
skewing the results even when the punishment was not explicitly a life sentence.
Additionally, where no sentence length was identified, including even the possibility of
probation, the subject was dropped from the analysis.
The independent variables are fiscal year, substance type, and an interaction
variable of fiscal year by substance type. In the analysis, fiscal year is a dummy, binary
variable that differentiates the fiscal year in which the case was sentenced to represent
application of the FSA. Substance type is a dummy, binary variable that indicates
whether the offense involved crack cocaine. To strengthen this measure’s validity, any
subject whose offense involved both powder and crack cocaine was coded as a crack
offense. This default coding ensures a more accurate representation of the legal effects of
a crack cocaine sentence. The addition of an interaction term to a regression model
expands the understanding of relationships among model variables. The interaction term
represents the combined effect of substance type (i.e. crack) and treatment application
(i.e. offender sentenced under FSA). Inclusion of an interaction term improves the
reliability and validity of the effectiveness measure (Horn & Lee, 2016). Statistical
significance for this interaction variable would indicate that the effect of the treatment on
sentence length is significantly different for crack cocaine offenders.
In addition to traditional demographic controls (i.e. race, age and gender), other
variables that play a direct role in determining sentencing guideline enhancements were
included to improve the study’s reliability and validity. These include criminal history,
involvement of a weapon, mandatory minimum application and offense type (USSC,
2016). A trial or plea variable was also added to control for outcomes explainable by a
lower sentence offered as a result of an offered plea.
Study Design
This paper employs difference-in-differences (DD) regression analyses to
investigate the impact of the FSA on sentence lengths for cocaine offenders. Crime
outcomes were evaluated for all cocaine offenders, and then separated by White and
African American offenders.
The DD method attempts to measure the effect of a treatment on an outcome
variable by comparing a group of those receiving the treatment with a control group not
receiving the treatment. Both groups are studied over the same time period which begins
before the start of the treatment and ends after the treatment is completed. The difference
in the outcome variable between the change in the treatment group, and the change in the
control group, is the DD estimate and can be attributed to the treatment. This method
subtracts out the effects of broader societal trends that have an influence on the outcome
variable not related to the treatment. The DD method is fitting for this study as the

~ 24 ~
intended goal is to realize the FSA’s effect on both crack and powder cocaine offenders
over time while accounting for broader societal trends.
RESULTS
OLS Regressions
To determine the effect of substance type and race on ordered prison sentence
lengths, ordinary least squares (OLS) regressions were used. Table 3 reports OLS
estimates of the coefficients and standard errors of the variables included in the various
model, and statistical significance is denoted by one or more asterisks. The r-squared
computation was used to determine the percentage of variation in sentence length that can
be explained by the model.
Models 1 and 2 report how substance type, when bundled with control variables,
associate with sentence lengths in FY08 and FY12. For example, Model 1 shows that in
FY08, crack offenders received slightly longer prison sentences than powder cocaine
offenders–though it was not statistically significant, so it is possible that the relationship
is due to chance. This is contrasted with Model 2, which shows that in FY12, crack
cocaine offenders received slightly shorter prison sentences than powder cocaine
offenders. Interestingly, when each model is stripped of just the race control, the direction
of the coefficients mirror that of Models 1 and 2 but are generally more severe. For
example, without a control for race, in crack cocaine offenders in Model 1 received four
additional months in sentence length at a statistically significant level. However, when
Models 1 and 2 are stripped of all control variables, both FY08 and FY12 crack cocaine
offenders received even higher statistically significantly sentences than powder cocaine
offenders. While these models provide insight, they only identify effects within rather
than across fiscal years. Thus, to appropriately test the first hypothesis, an interaction
term was included to perform DD analysis.
Models 3 and 4 report the findings of the DD models. Model 3 reports findings
for the regression without controls, while Model 4 reports such findings with controls. In
Model 3, every variable is statistically significant at the .001 level. This indicates strong
support for rejecting the null hypothesis. However, as indicated by the small r-squared
(2.1 percent), variation in sentence lengths are only weakly explained by Model 3. In
comparison, the r-squared (39.7 percent) in Model 4 indicates a much stronger
explanation of the variation in sentence lengths. This indicates that the control variables
play a significant role in explaining the variation in sentence lengths. As was true in
Model 3, Model 4’s fiscal year and interaction variables are also statistically significant.
This suggests that regardless of controls, the FSA played a critical role in reducing
sentence lengths.
Finally, Models 5 and 6 report the findings of DD models by race. While both
models report significant and negative findings by fiscal year, with Whites (-6.7 months)
and African Americans (-11.2 months) on average receiving shorter sentences in FY12,

~ 25 ~
only the African American model reported a statistically significant finding for the
interaction variable. These findings will be discussed further in the discussion section to
follow. Other noteworthy differences include the significance levels of each model’s
control variables. While each control variable in Models 5 and 6 are significant, strength
of that significance varies by variable and Model. In the African American model all
control variables are strongly statistically significant, while in the White model age and
offense type of possession were comparatively less significant.
DISCUSSION
Models 3 and 4 test the first hypothesis, that crack cocaine offenders in FY12
experienced a greater reduced effect on sentence length relative to powder cocaine
offenders. The fact that both Models’ fiscal year and interaction variables were
statistically significant, and negative, indicates that the FSA had a greater reduced effect
on sentence length relative to all cocaine offenders in FY08 and powder cocaine
offenders in FY12. Specifically, Models 3 and 4 report lower treatment effects over time.
Models 5 and 6 test the second hypothesis, that the reduced effect on sentence
lengths was stronger for African Americans than Whites. The fact that the African
American model, when compared to the White model, reports a larger negative and
statistically significant finding for the fiscal year variable, suggests support for the
hypothesis. However, the strongest evidence in support of the hypothesis stems from the
interaction term. Only the African American model reported a statistically significant
finding for the interaction variable. This indicates that African American crack offenders
in FY12 experienced a significant reduction in sentence length relative to African
American crack cocaine offenders in FY08 and African American powder cocaine
offenders in FY08 and FY12. The fact that only the African American model reported
statistical significance for this variable suggests strong support for the hypothesis, that a
reduced effect on sentence lengths was greater for African Americans than Whites.
Limitations
While secondary data analysis has many benefits, the use of secondary data
presents potential risks to a study’s internal validity. The reliability of secondary data
analysis is dictated by the precision and accuracy of the primary data collection process
(i.e. “garbage in, garbage out”) (Boo & Froelicher, 2013). For example, the risk of
measurement error and bias exists when data is collected and coded by researchers, as
humans are fallible. For this study, these risks are low as the USSC is an independent
government agency that is respected for its collection of high-quality data.
Another threat to internal validity stems from omitted variable bias. Omitted
variable bias can occur when there exist unmeasured variables that confound the results.
While the secondary datasets used for this study include nearly 15,000 variables, there
are a number of variables that were not captured that likely play a role in determining

~ 26 ~
sentence length. For example, while there used to be a measure of defense counsel type, it
was dropped from USSC’s datasets starting in 2003 as the information was often
unavailable. When such variables cannot be captured in the regression analysis, there
exists a risk of omitted variable bias. Precautions were taken in this study to combat this
risk through the inclusion of an interaction term. Given the ability of a DD to account for
parallel trends, like general changes to drug sentences, the potential for omitted variable
bias is lessened as DD analysis can account for influential societal trends.
Additionally, the scope of this study is limited. While the selection of FY08 and
FY12 was appropriate, as they capture an equal time period before and after the FSA’s
implementation, this selection also limits the study’s conclusions. Future research should
consider using a time-series design to evaluate short-term trends to combat the potential
for temporal bias. There are a number of other methodologies that could be used to test
the second hypothesis; for example, the use of a three-way-interaction could allow for a
test on the entire sample group instead of running two separate models of sample group
subsets. While my methodological choices were suitable for this study and my skill level,
as researchers we should strive to employ the best and most fitting methods possible.
Thus, future research should explore these relationships using various research designs
and methodological models.
Future Research
As discussed in the limitations section, there are a number of variables that could
explain variation in sentence lengths which were not included in this study. One such
variable is the location of sentencing by judicial district. In a recently published article,
Pina-Sanchez and Grech (2018) examined court disparities in England and Wales and
found that more severe sentencing occurred in courts located in neighborhoods with high
proportions of Muslim residents. Given such findings, they concluded that sentencing
disparities may, in part, be explained by non-legal contextual factors such as
socioeconomic composition of an area. In the context of sentencing disparities for
cocaine offenders, given existing demographic disparities, an exploration of non-legal
contextual factors could provide policymakers valuable information. If, for example,
there exists a disparity in sentencing across judicial districts, this may suggest the need
for a process evaluation of prosecutorial decision-making or judicial application of
mandatory minimums.
CONCLUSION
All criminal justice interventions should aim to be fair, just, and effective. Unjust
differences undermine the judicial system’s credibility. Thus, when disparities are
identified, all attempts should be made to remedy them. While this paper’s analysis
suggests the FSA achieved its goal of reducing the sentencing disparity among cocaine
offenders, the analysis also confirms historical trends that sentencing ratios

~ 27 ~
disproportionately disadvantage African Americans. As a sentencing ratio still exists, it is
no surprise that sentencing disparities continue to exist as well. Given this, coupled with
the fact that myths around exaggerated dangers of crack cocaine have been debunked, the
existence of any sentencing ratio for cocaine offenses should be abolished. The goal of
this study, and others like it, is to encourage policymakers to acknowledge the harms of
sentencing ratios and to act by challenging the validity of sentencing ratios for drug
offenses.

~ 28 ~
REFERENCES
Alexander, M. (2011). The New Jim Crow. New York, NY: New Press.
Beaver, A. L. (2010). Getting a fix on cocaine sentencing policy: Reforming the
sentencing scheme of the Anti-Drug Abuse Act of 1986. Fordham Law Review,
78(5), 2531-2575.
Boo, S. & Froelicher, E.S. (2013). Secondary analysis of national survey datasets. Japan
Journal of Nursing Science, 10, 130-135.
Cobbina, J. E. (2008). Race and class differences in print media portrayals of crack
cocaine and methamphetamine. Journal of Criminal Justice and Popular Culture,
15(2), 145-167.
Cohen, J. (1969) Statistical Power Analysis for the Behavioral Sciences. NY: Academic
Press.
Fabens-Lassen, B. (2015). A cracked remedy: The Anti-Drug Abuse Act of 1986 and
retroactive application of the Fair Sentencing Act of 2010. Temple Law Review, 87,
645-692.
Families Against Mandatory Minimums (FAMM). (2012). A brief history of crack
cocaine sentencing laws. Retrieved from http://famm.org/wp-
content/uploads/2013/08/FS-Brief-History-of-Crack-Laws-4.13.pdf
Goldstein, P. J., Brownstein, H., Ryan, P. J., Bellucci, P. A. (1989). Crack and homicides
in New York City, 1988: A conceptually based event analysis. Contemporary Drug
Problems, 16, 651-688.
Grindler, G. G. (2010). Memorandum for all federal prosecutors: The Fair Sentencing
Act of 2010. U.S. Department of Justice, Office of the Attorney General. Retrieved
from https://www.justice.gov/sites/default/files/oip/legacy/2014/07/23/fair-
sentencing-act-memo.pdf
Gross, J. (1985). A new, purified form of cocaine causes alarm as abuse increases. New
York Times. Retrieved from https://www.nytimes.com/1985/11/29/nyregion/a-new-
purified-form-of-cocaine-causes-alarm-as-abuse-increases.html

~ 29 ~
Hatsukami, D. K. & Fischman, M. W. (1996). Crack cocaine and cocaine hydrochloride.
Are the differences myth or reality? Journal of American Medicine, 279(19), 1580.
Holder, E. (2014, Jan. 23). Attorney General Holder urges congress to pass bipartisan
‘Smarter Sentencing Act’ to reform mandatory minimum sentences. Department of
Justice, Office of Public Affairs. Retrieved from
https://www.justice.gov/opa/pr/attorney-general-eric-holder-urges-congress-pass-
bipartisan-smarter-sentencing-act-reform
Horn, A.S. & Lee, G. (2016). The reliability and validity of using regression residuals to
measure institutional effectiveness in promoting degree completion. Research in
Higher Education, 57(4), 469-496.
Hurt, H., Betancourt, L. M., Yang, W., Brodsky, N. L., Gallagher, P. R., Malmud, E. K.,
Giannetta, J.M. & Farah, M.J. (2011). Adolescents with and without gestational
cocaine exposure: Longitudinal analysis of inhibitory control, memory and receptive
language. Neurotoxicology and Teratology, 33(1), 36–46.
Johnson, B. D. (2003). Racial and ethnic disparities in sentencing departures across
modes of conviction. Criminology, 41 (2), 449-489.
Martin, M. (Host). (2013, July 31). Decades later, drugs didn't hold 'crack babies' back
[Radio broadcast episode].
https://www.npr.org/templates/story/story.php?storyId=207292639
Palamar, J. J., Davies, S., Ompad, D. C., Cleland, C. M., & Weitzman, M. (2015).
Powder cocaine and crack use in the United States: An examination of risk for arrest
and socioeconomic disparities in use. Drug and Alcohol Dependence, 149, 108–116.
Pina-Sánchez, J. & Grech, D.C. (2018). Location and sentencing: To what extent do
contextual factors explain between court disparities? The British Journal of
Criminology, 58(3), 529-549.
Reagan, R. (1986, October 27). Remarks on signing the Anti-Drug Abuse Act of 1986.
Reagan Presidential Library Archives. Retrieved from
https://www.reaganlibrary.gov/sites/default/files/archives/speeches/1986/102786c.ht
m

~ 30 ~
United States Sentencing Commission (“USSC”). (2008). Monitoring of federal criminal
sentences, 2008. Ann Arbor, MI: Inter-university Consortium for Political and Social
Research [distributor], 2014-06-25.
United States Sentencing Commission (“USSC”). (2011a). Crack cocaine sentencing.
Human Rights, 38(3). Retrieved from
http://www.jstor.org.proxyau.wrlc.org/stable/23375624
United States Sentencing Commission (“USSC”). (2011b). Report to the congress:
Mandatory minimum penalties in the federal criminal justice system. Retrieved from
https://www.ussc.gov/research/congressional-reports/2011-report-congress-
mandatory-minimum-penalties-federal-criminal-justice-system
United States Sentencing Commission (“USSC”). (2012). Monitoring of federal criminal
sentences, 2012. Ann Arbor, MI: Inter-university Consortium for Political and Social
Research [distributor], 2014-11-25.
United States Sentencing Commission (“USSC”). (2014). Fifteen years of guidelines
sentencing. Retrieved from https://www.ussc.gov/research/research-and-
publications/research-projects-and-surveys/fifteen-years-guidelines-sentencing
United States Sentencing Commission (“USSC”). (2016). Guidelines manual: 2016.
Retrieved from https://www.ussc.gov/sites/default/files/pdf/guidelines-
manual/2016/GLMFull.pdf
Vagins, D. J. & McCurdy, J. (2006). Cracks in the system: Twenty years of the unjust
federal crack cocaine law. ACLU. Retrieved from https://www.aclu.org/other/cracks-
system-twenty-years-unjust-federal-crack-cocaine-law?

~ 31 ~
APPENDIX
Table 1. Variable Definitions
Variable Name Measurement/Definition
Ordered Prison Sentence Continuous variable; total prison sentence ordered by month (470 for
Life Sentences; 480 for sentences above 470 but not Life)
Substance Type: Cocaine Dummy variable; 1 = Crack Cocaine and 0 = Powder Cocaine (if both
involved, defaulted 1)
Race Dummy variable; 1 = White/Caucasian and 0 = Black/African American
Age Continuous variable; offender’s age at time of offense
Gender Dummy variable; 1 = Female and 0 = Male
Weapon Involvement Dummy variable; 1 = Weapon Involved and 0 = No Weapon Involved
Criminal History Dummy variable; 1 = yes, criminal history and 0 = no criminal history
Mandatory Minimum Dummy variable; 1 = Mandatory Minimum Applied and 0 = Mandatory
Minimum Not Applied
Offense Type
Dummy variables generated for each drug offense type (trafficking and
possession)
Trial or Plea Dummy variable; 1 = Settled by Trial, 0 = Settled by Plea
Location of Sentencing Dummy variables generated for each judicial district in which the
defendant was sentenced (12 total judicial circuits)
Fiscal Year Dummy variable; 1 = 2012 and 0 = 2008

~ 32 ~
Table 2. Descriptive Statistics
Variable Name Mean S.D.
2008
(N=8,153)
2012
(N=5,908)
2008
(N=8,153)
2012
(N=5,908)
Ordered Prison Sentence (months) 106.156 87.186 86.650 77.000
Substance Type (Powder/Crack): Crack .351 .544 .477 .498
Race: White .207 .225 .405 .417
Age 32.671 34.660 8.884 9.297
Gender: Female .094 .100 .292 .299
Weapon Involvement .223 .183 .416 .387
Criminal History .915 .911 .279 .284
Mandatory Minimum .428 .357 .495 .479
Offense Type
Trafficking and Manufacturing
Simple Possession
.977
.010
.970
.007
.151
.098
.171
.081
Trial or Plea: Trial . 050 .043 .218 .204
Location of Sentencing*
1st Circuit
2nd Circuit
3rd Circuit
4th Circuit
5th Circuit
6th Circuit
7th Circuit
8th Circuit
9th Circuit
10th Circuit
11th Circuit
DC Circuit
.024
.077
.061
.209
.093
.137
.084
.087
.057
.022
.140
.013
.022
.097
.057
.186
.102
.120
.072
.069
.118
.018
.127
.013
.148
.296
.232
.407
.291
.344
.278
.281
.232
.145
.343
.114
.148
.300
.232
.389
.303
.325
.256
.254
.322
.135
.333
.113
*The geographic boundaries of the United States District Courts are as follows: 1st Circuit – Maine, New Hampshire, Massachusetts, Rhode
Island, Puerto Rico; 2nd Circuit – Vermont, New York, Connecticut; 3rd Circuit – Pennsylvania, New Jersey, Delaware; 4th Circuit – West
Virginia, Virginia, North Carolina, Maryland, South Carolina, Virgin Islands; 5th Circuit – Texas, Louisiana, Mississippi; 6th Circuit –
Michigan, Ohio, Kentucky, Tennessee; 7th Circuit – Wisconsin, Illinois, Indiana; 8th Circuit – North Dakota, South Dakota, Nebraska,
Minnesota, Iowa, Missouri, Arkansas; 9th Circuit – Montana, Idaho, Washington, Oregon, Nevada, California, Arizona, Alaska, Hawaii,
Guam; 10th Circuit – Wyoming, Utah, Colorado, Kansas, Oklahoma, New Mexico; 11th Circuit – Alabama, Georgia, and Florida; DC Circuit
– Washington, D.C.

~ 33 ~
Table 3. Ordinary Least Squares (OLS) Regressions Model Results
Model 1
(FY08)
Model 2
(FY12)
Model 3 Model 4 Model 5
(White)
Model 6
(Black)
Fiscal Year
(FY)
- - -9.857***
(2.118)
-8.885***
(1.666)
-6.665**
(2.096)
-11.243***
(2.198)
Substance
Type (ST):
Crack
2.297
(1.721)
-3.914*
(1.671)
19.680***
(1.912)
2.722
(1.578)
1.980
(2.544)
1.700
(1.936)
Interaction
(ST x FY)
- - -11.633***
(2.879)
-7.079*
(2.264)
0.138
(4.333)
-6.186*
(2.777)
Race: White -15.952***
(2.019)
-11.111***
(2.098)
- -13.610***
(1.463)
- -
Age 0.588***
(.087)
0.176*
(.176)
- 0.399***
(.061)
0.180*
(.084)
0.526***
(.078)
Gender:
Female
-28.547***
(2.693)
-27.610***
(2.702)
- -28.139***
(1.927)
-19.700***
(2.258)
-34.258***
(2.710)
Weapon
Involvement
35.425***
(1.852)
29.655***
(2.051)
- 33.191***
(1.380)
25.161***
(2.707)
34.604***
(1.578)
Criminal
History
22.894***
(2.856)
18.870***
(2.959)
- 20.791***
(2.067)
10.674***
(2.216)
31.168***
(3.142)
Mandatory
Minimum
62.093***
(1.625)
62.108***
(1.714)
- 62.085***
(1.188)
67.400***
(2.283)
60.915***
(1.364)
Offense Type:
Trafficking
29.505***
(6.552)
24.044***
(5.167)
- 26.621***
(4.163)
22.400***
(5.961)
27.706***
(5.160)
Offense Type:
Possession
-28.432**
(10.114)
-36.402**
(10.826)
- -32.650***
(7.283)
-20.727*
(9.620)
-41.429***
(9.391)
Trial/Plea:
Trial
114.298***
(3.516)
112.531***
(3.876)
- 113.715***
(2.616)
98.346***
(5.668)
115.81***
(2.943)
Constant 1.689
(7.639)
15.390*
(6.648)
93.377***
(1.541)
12.387*
(5.134)
15.328*
(6.936)
-0.784***
(6.595)
R2
0.383 0.400 0.021 0.397 0.427 0.366
N
8,153 5,988 14,061 14,061 3,013 11,048
p<.05* p<.01** p<.001***
~ 34 ~
DEPENDENCE, VIOLENCE AND NEGLECT IN WOMEN WITH
DISABILITIES
Karlee Naylon
INTRODUCTION
According to the Centers for Disease Control and Prevention, 61 million adults in
the United States, or approximately 26% of the U.S. population, report having a disability
(CDC, 2018). It is generally understood that people with disabilities experience increased
rates of poverty, reduced access to health care services, and social and employment
barriers at higher frequencies as compared to the nondisabled population (Vallas, 2018;
Rapaport, 2017; NCWD, 2016). According to the National Network to End Domestic
Violence, the incidence of domestic and sexual violence is even higher than that of
disability, nearing 1 in 3 women (2018). Experiences of sexual violence and abuse in a
violent relationship have been associated with food and housing insecurity, losses in
education and negative psychological outcomes (NNEDV, 2018). Individuals who have a
disability and experience sexual violence are especially vulnerable to compounding
injustice.
Women with disabilities appear to experience sexual violence at an elevated rate
as compared to the nondisabled population (Basile, Breiding, & Smith, 2016; Martin et
al., 2006). Research performed prior to the 1990’s failed to identify contributing risk
factors to explain this trend, however, Smith (2007) found that being female, disabled,
unemployed, single and under the age of 40 increased one’s likelihood of experiencing
abuse. Recent studies have identified forms of violence unique to disability and aging,
such as manipulation of medication, neglect and withholding of care (Powers, Hughes,
Lund, & Wambach, 2009). Like traditional forms of sexual and interpersonal violence,
this neglect is characterized by power imbalance and the exercise of control over another
person. People with disabilities who rely on family members or personal care assistants to
complete activities of daily living (ADLs) may be particularly vulnerable, because these
relationships include an inherent imbalance of power between the giver and recipient of
care services.
Respective circumstances may increase or decrease an individual’s risk of
experiencing violence or neglect. Individuals with disabilities each live within their own
unique circumstances, thus implying that their levels of reliance on others also vary
accordingly. For example, some individuals with disabilities may function completely
independently, some may live semi-independently (i.e. an individual with a visual or
hearing impairment), and some may exclusively rely on personal care assistants to
complete ADLs (i.e. an individual with total paralysis or a severe intellectual disability).
These differences in dependence may potentially put an individual at elevated risk of
sexual violence and neglect; those who retain a significant level of autonomy may rely

~ 35 ~
very little on others to complete daily activities, while those with comparatively less
mobility may depend on care assistants and thus be more vulnerable to abuse.
The intersection between disability, sex, and level of dependence may have
significant implications for disability policy, methods of identifying victims of violence
and services available to survivors of neglect and sexual abuse. This study explores the
relationship between need for assistance on various tasks and experiences of sexual
violence reported by women with physical disabilities and motor impairments.
CONSIDERATIONS
There has been little research done to explore sexual violence and neglect in
women with disabilities with the inclusion of level of autonomy as a potential
contributing risk factor. These topics (disability, autonomy, sexual violence, and neglect)
are independently sensitive. For this reason, several considerations must be established in
order to pursue the present study in a respectful manner:
The use of person-first language aims to refer to an individual holistically rather
than emphasize observable or non-observable characteristics. Its primary purpose is to
avoid the use of one’s condition as a label, categorization, or definition of who they are.
For example, it is more appropriate to use the phrase “person with a disability” rather
than “disabled person” or “handicapped person,” so as to preserve the entire autonomous
individual. Person-first language is used throughout this paper in accordance with the
Disability Language Style Guide (National Center on Disability and Journalism, 2018).
Additionally, the potential presence of ableism was continually reevaluated to ensure that
the purpose and goals of the study were not corrupted by unintentional discrimination.
While the term “sexual violence” itself is not gendered, research and discussions
of sexual violence tend to focus on the experiences of women and girls rather than those
of men and boys. The present study also focuses on women’s experiences of sexual
violence and neglect, due to the disproportionate amount of violence experienced by
females. This distinction is not intended to imply that men are the sole perpetrators of
violence, or that their sex insulates them from experiencing abuse, but that women are
impacted at a higher frequency overall.
Lastly, people with disabilities are often labeled as members of a “vulnerable
population,” despite many people disagreeing with that categorization. In reality,
disability exists on a spectrum and each individual has a differing set of abilities and
necessary accommodations. This study continues the discussion of whether ‘dependency’
is synonymous with ‘vulnerability’ (Mackenzie, Rogers, & Dodds, 2014), and contributes
to the conversation of how women with physical disabilities might preserve their senses
of autonomy and forfend unwanted advances.

~ 36 ~
DATA/METHODS
Data used for the present study was collected by the Developmental Disabilities
Institute at Wayne State University and the United Cerebral Palsy Association in
Michigan in 2000-2001. This data is publically available on ICPSR through the
University of Michigan. The variables of interest for this study are:
1. the types of tasks where assistance is needed (getting out of bed, eating, dressing,
toileting, personal hygiene, moving around the home, taking medication, meal
preparation and home maintenance)
2. total number of tasks where assistance is needed, and
3. women’s reported experience of violence and neglect.
The hypotheses of this study are as follows:
1. Women with a higher level of dependence on others experience sexual violence
and neglect at a higher rate than women with a lower level of dependence. 61
2. Some types of assistance will predict experiences of sexual violence/neglect at
higher rates than others. 62
3. These differences in experiences of sexual violence and neglect will persist when
analyses are controlled for age and ethnicity.
177 women with physical disabilities were surveyed in 2000-2001 to identify the
types of activities they needed assistance to complete and their experience of neglect and
sexual violence. Tables of descriptive statistics are located in Appendix A. Data were
standardized prior to analysis, and a summary variable of the total number of tasks where
assistance was needed was calculated to serve as an indicator of dependence on others
(variable name ztotal). Bivariate linear regression analyses were performed on the
hypothesized relationships to identify those of significance. All hypotheses were tested at
α = .05 level of significance.
RESULTS
The results of the primary hypothesis indicate that women with a higher level of
dependence on others did not experience violence at a significantly higher rate [t (1,171)
= -.75, p =.457], but did experience neglect at a significantly higher rate than women with
a lower level of dependence [t (1,170) = 2.14, p = .033]. These results persisted when the
regression was controlled for age and ethnicity (Appendix B).
Analyses performed on the variables ‘home maintenance,’ ‘assistance taking
medication,’ and ‘neglect’. Results of the analysis indicate that women who needed
assistance with home maintenance reported neglect at a significantly higher rate than
those who did not need assistance [t (1,172) = 2.16, p = .032]. Women who needed
61 H0: µhigher dependence = µ lower dependence, where µ refers to the average violence or neglect experienced
HA: µhigher dependence ≠ µlower dependence
62 H0: µtype of assistance = µother types of assistance, where µ refers to the average violence or neglect experienced
HA: µtype of assistance ≠ µother types of assistance

~ 37 ~
assistance taking medication also reported neglect at a significantly higher rate than those
who did not need assistance taking medication [t (1,174) = 2.07, p = .04], These results
persisted when controlled for age and ethnicity (Appendix C).
Women who needed assistance getting in and out of bed also experienced neglect
at a higher rate than those who did not need assistance, though this was only significant at
the α = .10 level of significance [t (1,173) = 1.95, p = 0.053]. These results persisted
when controlled for age and ethnicity (Appendix D).
DISCUSSION
The findings of this study indicate that women who reported needing assistance
on a higher number of tasks experienced neglect at a higher rate than women who needed
assistance on fewer tasks. More specifically, women who needed assistance maintaining
their home, taking medication, and getting in and out of bed reported neglect at higher
rates than women who needed assistance on other tasks.
The results of this research are consistent with several studies which found high
prevalence rates of maltreatment and neglect in people with disabilities (Sullivan &
Knitson, 2000; Findley, Plummer, & McMahon, 2015). Findings of the present study
contrast a number of previous studies, however, as this study did not identify a linear
relationship between one’s level of dependence and experiences of sexual violence
(Brownridge, 2006; Erwin, 2000; Martin et. al, 2006; ). Previous studies did not attempt
to draw a relation between level of dependence and rate of abuse and neglect.
Several, but not all, tasks that rely on a certain threshold of mobility were found
to be associated with higher levels of neglect. The extent of neglect experienced by the
women (e.g. withholding of care, manipulation) is unclear. Future research may explore
the relationship between mobility and abuse and neglect.
LIMITATIONS
The external validity of this study is limited in a number of ways. This study’s
small pool of participants exclusively consisted of women with physical disabilities, and
did not include women with intellectual or cognitive disabilities. The experiences
between these two populations may differ significantly. Women with intellectual or
cognitive disabilities may perceive power dynamics and experience exploitation in a
more pronounced way due to economic dependence, and may experience higher levels of
control imposed on their daily lives from others (Benedet & Grant, 2014). Additionally,
these findings are not generalizable to men or people who identify as LGBTQ+ with
disabilities, as these populations may have unique experiences and considerations.
In addition, the data analyzed was collected in 2000-2001, and just 100 of the 177
participants reported having experienced sexual violence or neglect at least once. This
sample is small and prone to self-selection bias due to the sampling method used in the
original study (which consisted of sending letters and flyers to disability advocacy

~ 38 ~
organizations, submitting announcements to newsletters, and sending informational
mailings to physical therapists and domestic abuse programs). It is also generally
understood that relying on self-reporting by participants to gather data on sensitive topics
results in systematic underestimation the true magnitude of prevalence (Garcia &
Gustavson, 1997). This may explain why the findings of this study did not identify a
relationship between level of dependence and experiences of sexual violence (type II
error), as women may hesitate to report experiences due to fear of retaliation or
associated stigma. Due to recent increases in discussions surrounding sexual assault (as a
result of the #MeToo Movement) and increased visibility and inclusion of people with
disabilities, more women may be willing to disclose their experiences of violence and
neglect today compared to 2000-2001. Replication of this study may result in a larger
sample size, as well as increased willingness among participants to disclose experiences
of violence and neglect.
Finally, and perhaps most importantly, this study assumes that one’s need for
assistance in completing certain tasks is a proxy for their level of dependence on others.
In reality, autonomy is a complex indicator and may exist as a spectrum. Due to
unexplored confounding factors, people with disabilities who have a low level of
dependence on others may remain more susceptible to violence or neglect compared to
the nondisabled population. Omitted variables unrelated to dependence may account for
increased risk of assault or neglect, such as living environment during childhood, family
history of domestic violence, previous experiences of violence, cumulative exposure to
violence over the lifetime, level of education regarding preventative interventions, and
informal institutions/normative frameworks in the cultural context (Dabby & Poore,
2007; INSPQ, 2019).
POLICY IMPLICATIONS AND CONCLUSION
Despite these limitations, the findings of this study offer insight into several
research and policy implications for people with disabilities. This study may help inform
future educational and preventative programming meant to protect people with
disabilities from sexual violence and neglect. This may include:
● human-centered awareness trainings for personal care assistants or family
members who serve in this role.
● trainings oriented toward individuals with disabilities themselves, to
include educational programming on signs of neglect and abuse, as well as
actions they may take if they are victimized
● internal accountability improvements in institutions that provide patient
care
Once an instance of abuse or neglect occurs, it is essential that the survivor has
access to the resources they need. While one’s level of dependence on others may put an
individual at elevated risk of violence and neglect, it may also act as an additional barrier

~ 39 ~
to seeking safety following an instance of abuse. Many nondisabled survivors of violence
endure long periods of abuse before ever seeking help due to many existing barriers,
including (but not limited to) stigma, isolation from others, and financial dependence on
their spouse. These barriers may be heightened for people with disabilities living in
abusive settings, who may be unable to escape their circumstance due to limited physical
mobility, unique verbal abilities, and limited access to healthcare (Barrett, O’Day, Roche,
Lepidus Carlson, 2009; Saxton et. al, 2001). Prevention measures aside, ensuring that
people with disabilities have the means to escape from an abusive environment without
enduring further harm should be paramount.
Future revisions to disability policy may include:
● introduction of disability awareness or sensitivity training for responders
to domestic violence situations (including EMTs and law enforcement
officers)
● instruction of appropriate communication with people with disabilities
● implementation of human-centered approaches that keep survivors in
control of their circumstances
Additionally, centers for survivors of domestic violence may not presently be able
to accomodate the needs of people with disabilities (i.e. purchasing of equipment,
accessible lodging, and disability-related medical services) due to scarce resources
(Chang et. al, 2004). Future policy revisions might consider taking steps to:
● increase funding appropriations to emergency shelters for the purchasing
of equipment and medical services
● increase the number of ADA-compliant emergency shelters
In conclusion, while visibility and acknowledgement of sexual violence and
disability have increased over recent decades, these gains have occurred slowly and
research into their overlap is exceedingly scarce in academia. This study attempted to
explain one relationship between intersecting identities and compounding experiences of
injustice. Ableism, or discrimination against people with disabilities, can take many
forms and may not be immediately recognized. Ableism is often unconsciously
perpetrated by well-intentioned, nondisabled people in their language and behaviors. To
combat ableism, advocacy must at its core ensure that the inclusion of individuals with
disabilities is prioritized, and that their voices are not overshadowed by able-bodied
advocates. Future research must thoroughly explore the needs of people with concurrent
identities in order to push policymakers and legislators to effectively serve all people.

~ 40 ~
REFERENCES
Barrett, K. A., O’Day, B., Roche, A., Lepidus Carlson, B. (2009). Intimate partner
violence, health status, and health care access among women with disabilities.
Women’s Health Issues. 19(2), 94-100. Retrieved from
https://www.sciencedirect.com/science/article/abs/pii/S1049386708001783
Basile, K. C., Breiding, M. J., & Smith, S. G. (2016). Disability and risk of recent sexual
violence in the United States. American Public Health Association. 106(5), 928-933.
Retrieved from https://ajph.aphapublications.org/doi/abs/10.2105/AJPH.2015.303004
Benedet, J. & Grant, I. (2014). Sexual assault and the meaning of power and authority for
women with mental disabilities. Feminist Legal Studies. 22(2), 131-154. Retrieved
from https://law.ubalt.edu/downloads/law_downloads/Feminist_2010_grant.pdf
Brownridge, D.A. (2006). Partner violence against women with disabilities: Prevalence,
risk, and explanations. Violence Against Women. 12(9), 805-822. Retrieved from
https://journals.sagepub.com/doi/abs/10.1177/1077801206292681
Centers for Disease Control. (2018). Disability impacts all of us. Retrieved from
https://www.cdc.gov/ncbddd/disabilityandhealth/infographic-disability-impacts-
all.html
Chang, J. C., Martin, S. L., Moracco, K. E., Dulli, L., Scandlin, D., Loucks, M. B.,
Turner, T., Starsoneck, L., Dorian, P. N., Bou-Saada, I. (2004). Helping women with
disabilities and domestic violence: Strategies, limitations, and challenges of domestic
violence programs and services. Journal of Women’s Health, 12(7), 699-708.
Retrieved from https://www.liebertpub.com/doi/10.1089/154099903322404348
Dabby, C. & Poore, G. (2007). Engendering change: Transforming gender roles in Asian
& Pacific Islander communities. Asian & Pacific Islander Institute on Domestic
Violence (APIGBV). Retrieved from https://www.api-gbv.org/resources/engendering-
change-transforming-gender-roles-asian-pacific-islander-communities/
Erwin, T. (2000). Intimate and caregiver violence against women with disabilities. The
Battered Women’s Justice Project: Minneapolis, Minnesota. Retrieved from
https://thl.fi/documents/470564/817072/Intimate_Caregiver_Violence_against_Wom
en_with_Disabilities.pdf/f4ad2791-aa84-4e65-8da4-40feda6d2301

~ 41 ~
Findley, P. A., Plummer, S. B., & McMahon, S. (2015) Exploring the experiences of
abuse of college students with disabilities. Journal of Interpersonal Violence. 31(17),
2801-2823. Retrieved from
https://journals.sagepub.com/doi/abs/10.1177/0886260515581906
Garcia, J. & Gustavson, A. R. (1997). The science of self-report. Association for
Psychological. Retrieved from https://www.psychologicalscience.org/observer/the-
science-of-self-report
Institut National de Santé Publique Québec (INSPQ). (2019). Risk Factors. Retrieved
from https://www.inspq.qc.ca/en/sexual-assault/understanding-sexual-assault/risk-
factors
Mackenzie, C., Rogers, W., & Dodds, S. (2014). Vulnerability: New Essays in Ethics and
Feminist Philosophy. Oxfod University Press: New York, New York. Retrieved from
https://books.google.com/books?id=9708BAAAQBAJ&lpg=PA204&ots=Wced8Kn
Xm&dq=dependence%20neglect%20disability&lr&pg=PP1#v=onepage&q&f=false
Martin, S. L., Ray, N., Sotres-Alvarez, D., Kupper, L. L., Moracco, K. E., Dickens, P. A.,
Scandlin, D., Gizlice, Z. (2006). Physical and sexual assault of women with
disabilities. Violence Against Women. 12(9), 823-837. Retrieved from
http://citeseerx.ist.psu.edu/viewdoc/download?doi=10.1.1.912.5394&rep=rep1&type
Milberger, Sharon. Evaluation of Violence Against Women With Physical Disabilities in
Michigan, 2000-2001. Ann Arbor, MI: Inter-university Consortium for Political and
Social Research [distributor], 2006-03-30. https://doi.org/10.3886/ICPSR03414.v1
National Center on Disability and Journalism. (2018). Disability Language and Style
Guide. Walter Cronkite School of Journalism and Mass Communication, Arizona
State University. Retrieved from https://ncdj.org/style-guide/
National Collaborative on Workforce and Disability for Youth (NCWD). (2016).
Attitudinal barriers for people with disabilities. Retrieved from http://www.ncwd-
youth.info/publications/attitudinal-barriers-for-people-with-disabilities/
National Network to End Domestic Violence. (2018). Domestic violence and sexual
assault factsheet. Retrieved from https://nnedv.org/mdocs-posts/domestic-violence-
and-sexual-assault-factsheet/

~ 42 ~
Nosek, M. A. & Howland, C. A. (1998). Abuse and women with disabilities. VAWnet:
The National Online Resource Center on Violence Against Women. Retrieved from:
https://vawnet.org/sites/default/files/materials/files/2016-09/AR_Disab.pdf
Powers, L. E., Hughes, R. B., Lund, E. M., & Wambach, M. (2009). Interpersonal
violence and women with disabilities: A research update. VAWnet: National Online
Resource Center on Violence Against Women. Retrieved from:
https://vawnet.org/sites/default/files/materials/files/2016-
09/AR_WomenWithDisabilities.pdf
Rapaport, L. (2017). Disabilities tied to worse access to care, poorer health. Reuters.
Retrieved from https://www.reuters.com/article/us-health-care-access-
disabilities/disabilities-tied-to-worse-access-to-care-poorer-health-idUSKBN1CV39O
Saxton, M., Curry, M. A., Powers, L. E., Maley, S., Eckels, K., Gross, J. (2001). “Bring
my scooter so I can leave you”: A study of disabled women handling abuse by
personal assistance providers. Violence Against Women. 7(4), 393-417. Retrieved
from https://journals.sagepub.com/doi/abs/10.1177/10778010122182523
Smith, D. L. (2007). Disability, gender, and intimate partner violence: Relationships from
the Behavioral Risk Factor Surveillance System. Sexuality and Disability, 26(1), 15-
28. Retrieved from
http://genderbias.net/docs/resources/guideline/Disability%20Gender%
20and%20Intimate%20Partner%20Violence.pdf
Sullivan, P. M. & Knitson, J. F. (2000). Maltreatment and disabilities: A population-
based epidemiological study. Child Abuse & Neglect, 24(10), 1257-1273. Retrieved
from https://www.sciencedirect.com/science/article/abs/pii/S0145213400001903
Vallas, R. (2014). Disability is a cause and consequence of poverty. Talk Poverty.
Retrieved from https://talkpoverty.org/2014/09/19/disability-cause-consequence-
poverty/

~ 43 ~
APPENDIX A
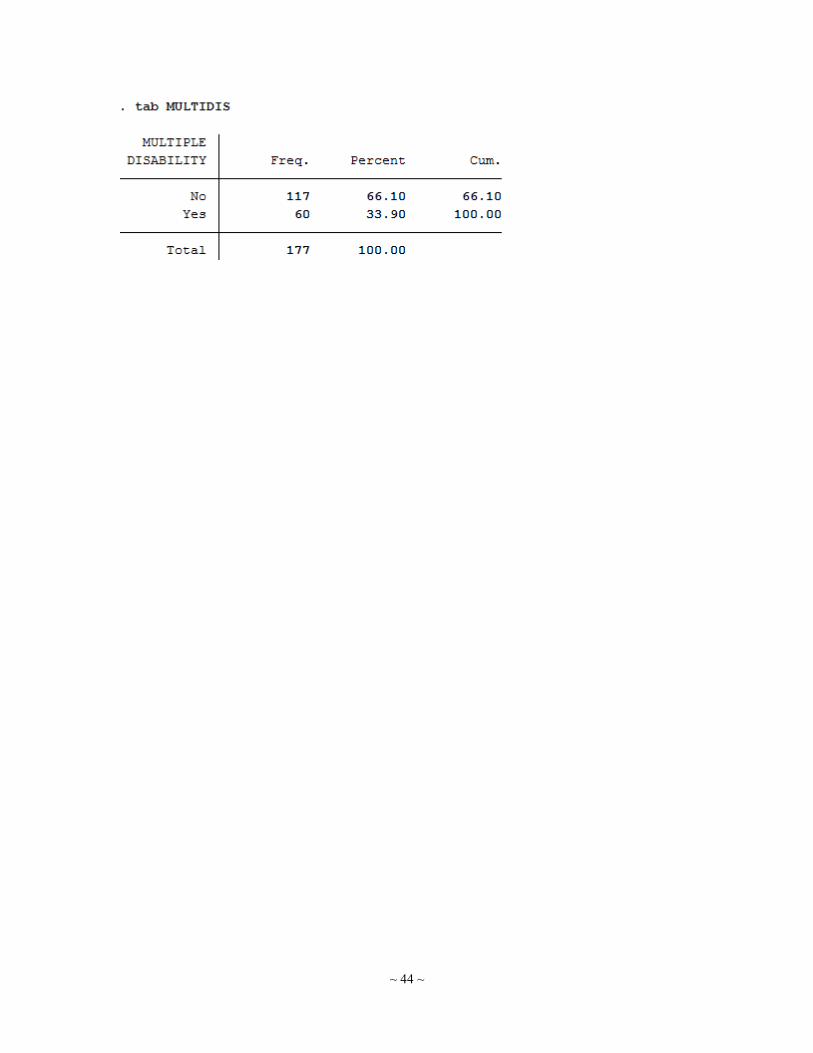
~ 44 ~

~ 45 ~
APPENDIX B
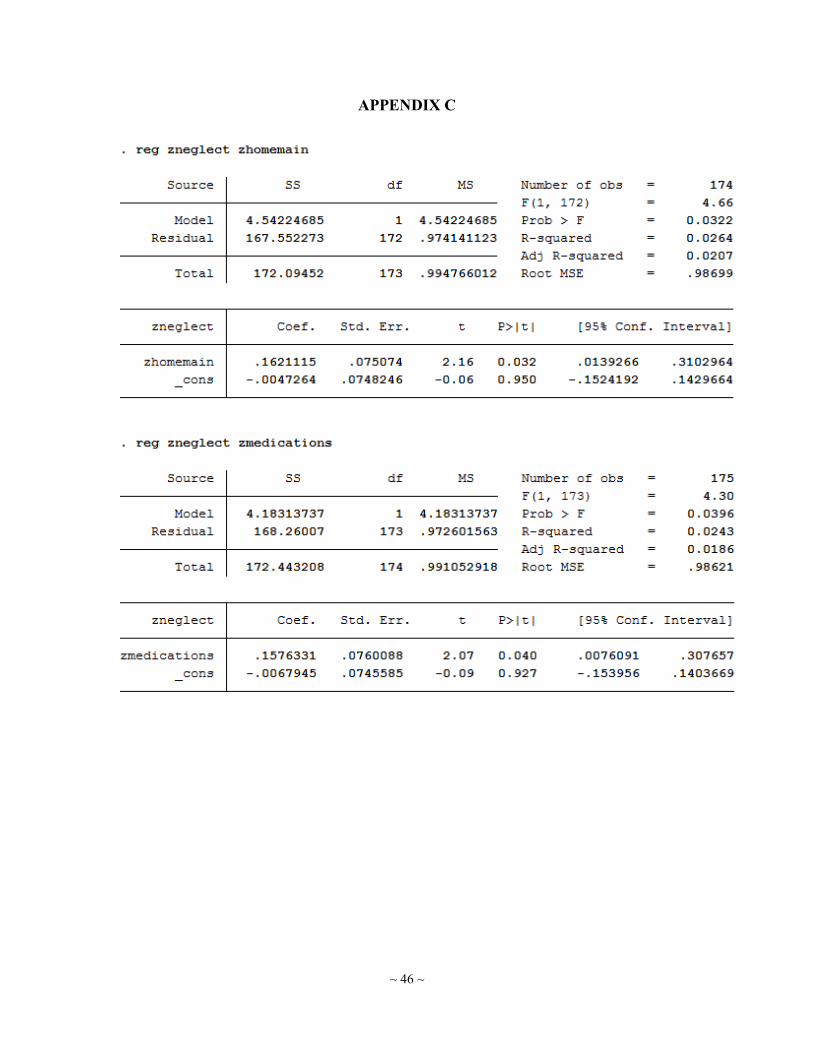
~ 46 ~
APPENDIX C
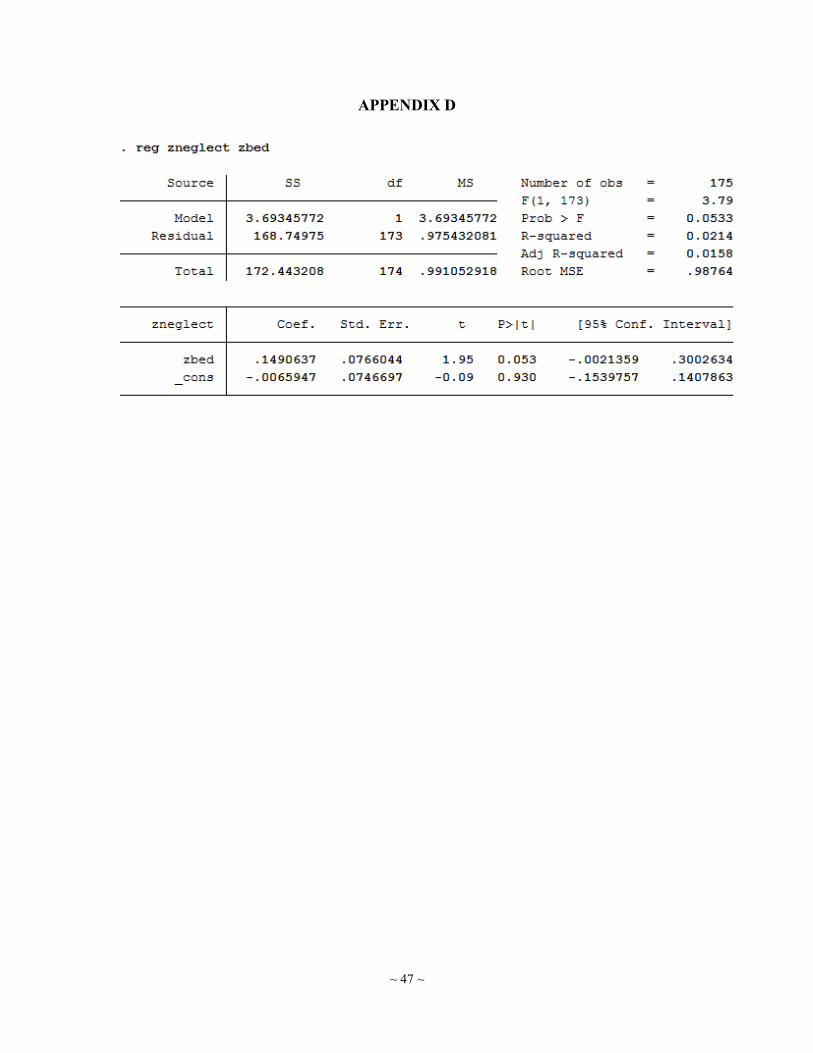
~ 47 ~
APPENDIX D

~ 48 ~
GOVERNMENT-LED DEVELOPMENT INITIATIVES IN ZIMBABWE
Rebekah McDowell
INTRODUCTION
This portfolio explores Zimbabwe’s various efforts to spur development and how
those efforts abound with good intentions, some of which are hampered by unintended
consequences and constrained by tensions. In each of the initiatives discussed, the
government has been primarily concerned with economic development and growth. I
begin by providing a foundational analysis of Zimbabwe’s colonial history and Robert
Mugabe’s aim to liberate the country; I make this analysis through the lens of Amartya
Sen’s and Paulo Freire’s understandings of freedom. Next, I argue that participation in
the World Bank’s Structural Adjustment Programs (SAPs) led to structural violence in
Zimbabwe, particularly in the fields of health and education. Furthermore, SAPs caused
the reversal of some of the advancements made by Mugabe in the 1980s. Thirdly, I
examine Zimbabwe’s Harmonized Social Cash Transfer Program, which has been largely
successful and demonstrates that cash transfer programs do not need conditions to
produce the desired outcomes. After that, I explore the CAMPFIRE program – aimed at
providing economic incentive for conservation – and the degree to which it has shifted
resource management authority and benefits to local communities. Lastly, I review
Zimbabwe’s approach to gender and how efforts have focused on women and girls as a
strategy for economic development yet have overlooked men and gender relations.
Conversations about and approaches to development often center around how
outsiders – Western countries, international financial institutions, NGOs, volunteers, and
other actors – can help a Third World country develop. In this portfolio analysis, I am
interested in what the national government of Zimbabwe has done to promote its own
development. Mugabe’s long-term rule as the revolutionary leader who rebuked British
colonial rule and promised Zimbabweans autonomy creates special interest in examining
national development efforts. The country, however, has not acted in a vacuum. Factors
such as a colonial past, the global dominance of neoliberal economic principles,
hegemonic assumptions about the poor, and international discourse about the role of
women in development have all influenced Zimbabwe’s development policies and
initiatives.
How the “Colonized Mentality” has Thwarted Development in Zimbabwe
Zimbabwe gained freedom from British colonial rule nearly forty years ago. Since
then, it has received billions of dollars from foreign aid agencies. Despite this aid, the
country’s poverty levels remain high and the quality of life for its citizens has seen little
improvement. Why is this? Zimbabwe’s history cultivated a “colonized mentality” that
allowed for continued oppression under the rule of Robert Mugabe. While Zimbabwe has

~ 49 ~
made strides forward since colonial rule, achieving greater development in terms of
overall well-being will require increasing citizens’ freedoms.
Zimbabwe has a history of oppression and underdevelopment. British colonists
arrived at the end of the 19th century and ruled the country (then Southern Rhodesia) until
1980. Following independence, Mugabe, an African nationalist, largely controlled the
national government. Mugabe served first as Prime Minister from 1980-87 and then as
President from 1987-2017. While the country has an election process, it often has not
been free and fair (Banerjee, 2018). Mugabe resigned from office following a military
coup in November 2017. Although some celebrate Mugabe as a revolutionary against
British rule, and his economic and social initiatives brought varying degrees of
improvement to people’s lives, he also perpetuated systems of oppression and eventually
became a despot (Chandler III & Chandler, 2013).
While Mugabe liberated Zimbabwe from colonial oppression, he also embodied the
“colonized mentality,” feeling both contempt and admiration toward the colonizer
(Freire, 2005). The former president’s need for the support of and control over
Zimbabweans caused him to lose sight of his goal of restoring the humanity taken under
British rule and to instead use violence and fraud to remove opposition and maintain his
power for four decades (Frankel, 2017). Freire’s theories in Pedagogy of the Oppressed
explain Mugabe’s apparent hypocrisy and elucidate why liberation did not replace
oppression in Zimbabwe when British rule ended. Initially, the oppressed almost always
become the oppressors, because oppression is their only model and they fail to fight for
true liberation. Revolutionary leaders forget that their main goal is to fight “for the
recovery of the people's stolen humanity, not to ‘win the people over’ to their side”
(Freire, 2005).
The continued oppression in the country has stunted its development. Amartya Sen
defines freedom as both the ends and means of development, arguing that “the
instrumental role of freedom concerns the way different kinds of rights, opportunities,
and entitlements contribute to the expansion of human freedom in general, and thus to
promoting development” (Sen, 1999). He says “instrumental freedoms” – political
freedoms, economic facilities, social opportunities, transparency, and protective securities
– build upon one another and lead to development. Mugabe limited access to and
expansion of instrumental freedoms under his dictatorial rule. For example, opposition to
the former president was met with violence and election fraud, while Mugabe’s policy of
complete redistribution of white-owned land led to famine and poverty (Frankel, 2017).
Mugabe promised liberation but instead traded colonial oppression for autocracy
disguised as democracy.
A revolutionary leader that frees the people is a false hope. Freire (2005) argues that
overcoming oppression requires conscientizacao: critical social consciousness; the
oppressed must first recognize their humanity and how they have been dehumanized.
Once they have attained consciousness, then they can seek liberation together with those

~ 50 ~
committed to freeing the oppressed. Liberation, then, is a mutual process rather than a
gift or self-achievement (Freire, 2005). In trying to give freedom in a top-down,
controlled way, Mugabe left a legacy of violence and greed and deprived Zimbabweans
of the very liberation he promised them (Frankel, 2017).
While Mugabe did lead many efforts to develop the country, particularly through
economic means, he failed in many ways to support full instrumental freedom for
Zimbabweans. The colonized mentality has slowed development in Zimbabwe, where
underdevelopment has manifested in the lack of instrumental freedoms laid out by Sen
(1999). As Freire (2005) argued, true liberation will only come when Zimbabweans have
attained conscientizacao.
Impacts of Structural Adjustment Programs in Zimbabwe: Health & Education
In the early 1990s, Zimbabwe participated in the Structural Adjustment Programs
(SAPs) of the World Bank and International Monetary Fund (IMF), which allowed
countries to restructure debt. The neoliberalist tenets of deregulation, privatization,
production, and decreased social spending underpinned SAPs, whose conditionalities
required debtor countries to shift towards a free-market economy. Contrary to the
intended goals, SAPs had social, political, and economic impacts for developing
countries that resulted in a “new intensity of immiseration” (Pfeiffer & Chapman, 2010).
In 1991, Zimbabwe announced its participation in a SAP, called the Economic
Structural Adjustment Program (ESAP). The Program aimed to promote growth while
reducing poverty and unemployment, but it came with hidden costs. The World Bank
backed the ESAP agenda with $175 million in structural adjustment credits and loans to
support deregulation, trade liberalization, and reduced public spending (World Bank,
2012). International financial institutions protected the interests of creditor countries by
enforcing economic policies that would lead to revenue generation (Graeber, 2017),
which often meant that countries abandoned social programs to be able to pay back the
debt. Graeber described this system as a more sophisticated form of colonialism. In
Zimbabwe, the SAPs had a particularly negative impact on the health and education
sectors.
Following independence in 1980, Mugabe’s government devoted significant
resources to the health sector to address socioeconomic inequalities; accordingly, social
indicators improved (World Bank, 2012). The 1991 introduction of ESAP in response to
the economic crisis, however, led to job cuts in the healthcare sector and imposed service
fees which negatively impacted the poor who could not afford to pay for services
(Pfeiffer & Chapman 2010). Nurses and female community members noted that quality
of care (e.g. clinic fees, wait times, and staff and drug shortages) worsened following the
implementation of ESAP (Bassett, Bijlmakers & Sanders, 1997). Farmer (1999) would
define this situation as structural violence, in which social institutions and structures
deprive individuals of access to their basic needs and rights. SAPs affected Zimbabwe’s

~ 51 ~
healthcare system in a way that negatively and violently impacted health, particularly for
the poor. Clearly, the government did not meet its goal of reducing poverty and suffering.
Much like the health sector, the education sector in Zimbabwe flourished under
increased investment in the 1980s (World Bank, 2012), and the government introduced
free universal primary education. However, many of the gains made in education were
lost under the implementation of the SAPs. The government faced debt-servicing
obligations and pressure to decrease public funding for social services. From 1991 to
1994, per capita spending on education declined by 32 percent; the reduction impacted
primary education in particular (Gordon, 1997). The cuts in public funding transferred the
cost burden to citizens. The government imposed tuition fees in urban areas and applied
exam, sports, uniform, and other fees in all areas (Gordon, 1997). Increased school fees
posed a barrier to education for students of all ages. For example, in 1996, costs
accounted for 65 percent of the unenrolled students aged 13-17 not being in school
(Gordon, 1997). The imposition of school fees represents another form of structural
violence that disproportionately impacted the poor.
Neoliberalism asserts that the free market will allocate goods and services in the
most equitable way. The impacts of SAPs in Zimbabwe, however, serve as one case
among many that shows this mechanism of debt repayment failed to improve
circumstances for developing, debtor countries. Ironically, SAPs in Zimbabwe served
only to dismantle gains previously made in health and education, imposing forms of
structural violence that worsened conditions for the poor and led to increased inequality
and the intensified immiseration Pfeiffer and Chapman (2010) describe.
Zimbabwe’s Harmonized Social Cash Transfer Program
Cash transfer programs have arisen as a development strategy over the past few
decades. Both conditional (CCT) and unconditional (UCT) cash transfer programs
provide a social safety net and are currently seen as effective approaches to poverty
alleviation (Son 2008). The development community continues to debate about which
approach is preferable. Zimbabwe’s Harmonized Social Cash Transfer (HSCT) program
demonstrates that positive impacts can largely be achieved without conditions.
Furthermore, HSCT provides a means for examining how conditions more broadly
contradict principals of human rights and reflect particular assumptions about the poor.
In 2011, Zimbabwe’s Ministry of Labour and Social Welfare (MLSW) introduced
the HSCT program, a UCT program for food-poor, labor-constrained households. The
program covered 10 districts (16,600 households) in 2012; it then expanded to cover 20
districts (55,500 households) by early 2014 (FAO, 2015). Using $10-25 cash transfers,
HSCT aims to increase consumption and make education, basic services, and
opportunities more accessible to the very poor (Angeles, 2018). Zimbabwe severely
needed this program, considering 78 percent of the population lives below the poverty
line and 55 percent falls below the food poverty line (Angeles 2018).

~ 52 ~
Opponents of UCTs argue a lack of conditions will not create sustained poverty-
reduction, “hence, the idea is to transfer cash to the poor ‘on condition’ that the poor will
commit to empower themselves and help bring future generations of poor families out of
poverty” (Son, 2008). The implementation of HSCT in Zimbabwe, however,
demonstrates the poor do improve their circumstances without the imposition of
conditions. While HSCT has not achieved all its goals, it has shown: increased ownership
of livestock/chickens; significant impact on agricultural activities; eased financial
constraints; and a positive impact on food security, nutrition, and dietary diversity (FAO,
2015). Furthermore, the transfers resulted in: households’ reduced dependency on family
and neighbors; decreased debt; a 1.47 spending multiplier of the transfer amount;
improved material well-being for children; and increased protection of youth (Angeles,
2018).
The impacts of HSCT demonstrate that the poor will act to improve their
circumstances when given access to money. The “poverty trap” of no assets and
negligible income – not a lack of understanding – prevent the poor from escaping poverty
(Hanlon, 2009). The beliefs that the poor are responsible for their own poverty, waste
money given to them, and must be taught to be “better” people are rooted in 19th century
thinking and were revived under neoliberalism starting in the 1980s (Hanlon, 2009).
Proponents of UCTs, on the other hand, trust that individuals know their own needs best
and view conditionalities as demeaning coercion of the poor (Son, 2008).
The Universal Declaration of Human Rights names an “adequate standard of living”
as a universal right and provides a rationale for cash transfers (Hanlon, 2009). The
government of Zimbabwe shares the values of this human rights framework, as reflected
in the MLSW’s vision of “a social protection system that promotes a decent standard of
living for all people in Zimbabwe” (MLSW, 2018). Attaching conditions to cash transfer
requires the poor to act in particular ways, making the cash transfer something that must
be earned rather than an entitlement.
When an adequate standard of living is framed as a human right, conditionalities
become unwarranted control mechanisms over the poor. Evidence shows conditions have
little impact on the performance of recipients (Hanlon, 2009), and Zimbabwe’s program
has done well without them. Given these considerations, conditions on cash transfers lack
compelling justification.
CAMPFIRE: Local Benefit from Resource Management & Conservation?
Zimbabwe is one of the top five African countries for international tourism (AfDB,
2018), much of which revolves around its national parks and wildlife. Following
liberation in 1980, the state sought to reverse locals’ dispossession of land that occurred
under colonial rule (McIvor 1994). The goal of Communal Areas Management Program
for Indigenous Resources’ (CAMPFIRE) is for local communities to benefit from natural
resource use. In assessing resource control in Kenya and Indonesia, Peluso (1993) finds

~ 53 ~
that (1) power struggles exist between the state and communities over resource control,
access, and allocation, (2) conservation efforts often benefit the state over local people,
and (3) locals are blamed for destroying nature. Zimbabwe provides the opportunity to
see if these findings hold true in another context.
Conservation efforts often rely on moral arguments for protecting the environment,
with the underlying goal of maintaining a pristine version of nature “for tourist
consumption” (Peluso, 1993). In Zimbabwe, however, an economic argument takes
center stage. Zimbabwe’s 1975 Parks and Wildlife Act “gave landholders the right to
manage wildlife for their own benefit, thus providing an economic rationale to reinforce
the scientific, aesthetic, and moral justifications for wildlife conservation”
(Murindagomo, 1990). The Act paved the way for the Department of National Parks and
Wildlife Management (now the Parks and Wildlife Management Authority) to establish
CAMPFIRE in 1989. CAMPFIRE aims to reduce poverty and support the economic
participation of rural communities via the sustainable use and management of natural
resources (CAMPFIRE Association, 2018).
CAMPFIRE originated within the government and its “original conception aspired
to true bottom-up planning with a focus on community input and autonomy” (Logan &
Moseley, 2002). The program sought to shift authority over wildlife from the state to
citizens and ensure the local community benefitted from the gains from resource
exploitation. In reality, however, Rural District Councils (RDCs) control wildlife
resources and determine the rights individual households have over these resources
(Murindagomo, 1990). Locals possess only partial authority and most remain excluded
from decision-making over wildlife management (Mutandwa & Tafara Gadzirayi, 2007).
Results are mixed in terms of who benefits from CAMPFIRE. The government says
that “communities will benefit from revenue generated from wildlife-based projects
including hunting” (ZPWMA, 2015). In 1990, wildlife (e.g. safari hunting, tourism, etc.)
contributed $250 million annually to Zimbabwe’s economy (Murindagomo, 1990). The
annual monetary benefit of CAMPFIRE was approximately $8.40 per household in
1996/97; only 52 percent of this, however, was distributed to communities, instead of the
80 percent prescribed by the program (Logan & Moseley, 2002). Furthermore, Mutandwa
& Tafara Gadzirayi (2007) found that most community members reported that they did
not feel CAMPFIRE had meaningfully improved their livelihoods – despite the creation
of employment opportunities, building of infrastructure, and dividend payments –
because most activities remained with the RDCs.
Conservationists are often framed as nature’s heroes, while locals are seen as its
destroyers or combatants (Peluso, 1993). CAMPFIRE’s goals – such as reducing poverty
as a necessary condition of conservation – reflect the belief that the poor are “their own
worst environmental enemies” (Logan & Moseley, 2002). Poverty and resource
management are understood as mutually-dependent. Development actors, public officials,
and others commonly believe that conservation cannot be successfully undertaken by the

~ 54 ~
poor because they do not know how to manage resources on their own and will act out of
individual interest at the cost of larger environmental concerns. The Zimbabwean
government’s desire to protect the environment from the poor motivated the creation of
CAMPFIRE.
CAMPFIRE benefits locals more than some other conservation schemes have, yet it
still falls short of its aims. Control has been passed to the local level, but decision-making
authority and economic benefits fall largely to the RDCs rather than community
members. The government must increase trust in locals’ and the poor’s ability to manage
resources and conserve their environment.
The Limitations of Zimbabwe’s Approach to Women and Gender
The Zimbabwean government has increased its focus on gender equality and equity
in the last several years. It established the Ministry of Women Affairs, Gender, and
Community Development (MWAGCD) in 2005 and the Zimbabwe Gender Commission
in 2015. The new Constitution of 2013 recognizes the right for men and women to have
equal opportunities and voids all laws and customs encroaching on the rights of women
(UK Home Office, 2018). The National Gender Policy and several other pieces of
legislation aim to safeguard women and girls. These measures demonstrate a concerted
effort by the government to increase gender equality. However, the government’s
decision to largely take a Women in Development (WID) rather than a Gender and
Development (GAD) approach, could inhibit deep, structural change.
WID focuses on equal opportunity for and economic engagement by women, while
GAD considers gender roles and social relationships pertaining to both women and men
within the context of structural and institutional power relations. Although the global
discourse has shifted towards GAD, the focus has remained primarily on women, while
men and male identities remain in the background (Chant & Gutman, 2005). Within the
WID approach, investment in women and girls is framed as a development strategy and a
means of combatting poverty. Kristoff and WuDunn (2009) argue that aid seems to work
best when focused on health, education, and microfinance and is most effective when
aimed at women and girls. Zimbabwe’s national approaches to “gender” work reflect
global patterns of focusing on female members of society and how they can participate in
and boost the economy.
In Zimbabwe, the MWAGCD takes a leading role in women and gender efforts.
The Ministry focuses on six dimensions relating to: economic involvement of women
(two dimensions); educational empowerment; political empowerment; health and well-
being; and community development (MWAGCD, 2018). All the dimensions, except
community development, refer specifically to women, but never explicitly mention men.
Furthermore, the National Gender Policy (produced by MWAGCD) and several other
pieces of legislation aim to protect and/or empower women/girls vis-à-vis issues such as
gender-based violence, child marriage, inheritance, and reproductive rights. The WID

~ 55 ~
approach centralizes a focus on and investment in women/girls because adherents believe
women/girls will provide a high return and improve economic performance (Kristoff &
WuDunn, 2009).
In 2018, the MWAGCD opened the Zimbabwe Women’s Microfinance Bank
(ZWMB). President Mnangagwa said the bank will “economically empower and
transform the lives” of marginalized women (Home Office, 2018). A member of the UN
said the ZWMB will go far in combatting violence against women/girls; economic
freedom will lead to social and political freedom (Home Office, 2018). While expanding
economic freedom for women may increase women’s autonomy, it is not a stand-alone
solution. WID approaches, such as this one, ignore the impact men have on women and
overlook the fact that women will continue to interact with unsensitized men and within
patriarchal structures (Chant & Gutman, 2005). Additionally, approaches that disregard
men can undermine male identities and status, marginalizing them within the family and
creating a new kind of inequality (Chant & Gutman 2005).
The Zimbabwean Government has undertaken several important efforts to improve
women’s positions and lives. These efforts, however, focus on women and ignore men
and broader gender relations. Gender interventions will only get so far without men,
while women-focused interventions can produce male-female hostilities and a “crisis of
masculinity” (Chant & Gutman, 2005). The government could enhance its approach by
looking beyond economics and women only and by increasing attention on gender
relations and on men. A truer GAD approach would allow Zimbabwe to start to address
the underlying norms and structures that produce and reproduce the gender inequalities,
biases, and violence that negatively impact both women and men.
CONCLUSION
As this portfolio has demonstrated, development initiatives led by Mugabe’s
government in post-colonial Zimbabwe have varied in their levels of success. The
Economic Structural Adjustment Program of the 1990s, heavily interlinked with
international debt, failed to develop the country or benefit the poor. In fact, it introduced
new forms of structural violence that backtracked previous progress made in the areas of
health and education. Conservation efforts under CAMPFIRE and approaches to gender
have achieved notable successes. At the same time, however, CAMPFIRE could go
further to devolve resource management to local communities and approaches to gender
could be broadened to include both men and underlying gender relations. The
Harmonized Social Cash Transfer program stands as one of Zimbabwe’s most prominent
successes. It has provided important social safety nets for the poor, while also
demonstrating trust in individuals’ capabilities to improve their circumstances when
provided with the necessary resources.
Mugabe rose to power as the revolutionary leader that released Britain’s grasp over
Zimbabwe and brought independence to the country. The initiatives discussed in this

~ 56 ~
portfolio were led by Mugabe’s government and represent efforts to develop the country.
In trying to liberate Zimbabweans, however, Mugabe lost sight of the importance of
many of the instrumental freedoms described by Sen (1999) and the need for people to
play an active role in attaining their freedom (Freire, 2005). The overthrow of Mugabe
presents an opportunity for Zimbabwe to become truly liberated and pursue a deeper
level of development that offers social, political, economic, emotional, and physical well-
being. Zimbabwe, like all places, must begin to understand development in more than
purely economic terms. In fact, it may be time to shift away from the “development”
discourse and focus instead on the grassroots and social movements that have started to
dismantle systems of oppression and inequality in various places around the world
(Escobar, 1992).
Questions for further exploration include: Will Mnangagwa’s presidency diverge
from Mugabe’s autocratic rule? In which areas and to what extent have grassroots and
social movements already impacted and brought change to Zimbabwe? Where does
opportunity lie, or where can it be created, for increased participation by community
members? In a time when the world is governed and shaped by entrenched national and
global systems and institutions that produce and perpetuate inequality, to what extent can
post-development and participatory approaches dismantle the status quo, both in
Zimbabwe and the world at large?
~ 57 ~
REFERENCES
AfDB (2018). Africa Tourism Monitor. Report. Vol. 5. Issue 1. Accessed November 30,
2018. https://issuu.com/africandevelopmentbank/docs/africa_tourism_monitor_2018
Alkire, Sabina. (2013). “Why the Poorest of the Poor Need MPI 2.0.” Development
Progress Blog. Accessed September 2, 2018.
http://www.developmentprogress.org/blog/2013/05/29/why-poorest-poor-need-mpi-
20.
Angeles, Gustavo, Chakrabarti, Averi, Handa, Sudhanshu, Otchere, Frank, and Glen
Spektor. (2018). “Zimbabwe’s Harmonised Social Cash Transfer Programme:
Endline Impact Evaluation Report”. The University of North Carolina at Chapel Hill.
Accessed November 9, 2018.
https://www.unicef.org/evaldatabase/files/HSCT_Endline_Report_Final_Zimbabwe_
2018-001.pdf
Banerjee, Vasabjit. "Even after Mugabe, Zimbabwe’s Elections Do Not Appear Free or
Fair." The Washington Post, August 22, 2018. Accessed December 7, 2018.
https://www.washingtonpost.com/news/monkey-cage/wp/2018/08/23/post-mugabe-
zimbabwes-elections-still-look-irregular-much-as-rhodesias-once-
did/?utm_term=.711504e75707.
Bassett, Mary Travel, Bijlmakers, Leon, and David M. Sanders. (1997).
“Professionalism, Patient Satisfaction and Quality of Health Care: Experience During
Zimbabwe’s Structural Adjustment Programme.” Social Science & Medicine 45 (12):
1845-1852.
CAMPFIRE Association (2018). What We Do. Accessed November 30, 2018.
http://campfirezimbabwe.org/index.php/about/20-what-we-do
Chandler III, G. Donald, and John W. Chandler. (2013). “Robert Mugabe and Nelson
Mandela: Revolutionary Leaders” in On Effective Leadership. New York: Palgrave
Macmillan US. Ch. 10, pp. 179–201.
Chant, Sylvia, and Matthew C. Guttman. (2005). “Men-Streaming Gender? Questions for
Gender and Development Policy in the Twenty-First Century.” Progress in
Development Studies 2 (4): 269-282.

~ 58 ~
Escobar, Arturo. (1992). “Reflections on ‘Development’: Grassroots Approaches and
Alternative Politics in the Third World.” Futures 24 (5): 411-434.
FAO. (2015). “Zimbabwe’s Harmonized Social Cash Transfer Programme: impacts on
productive activities and labour allocation”. Research Brief. Accessed November 9,
2018. http://www.fao.org/3/a-i5214e.pdf
Farmer, Paul. (1999). “Pathologies of Power: Rethinking Health and Human Rights.”
American Journal of Public Health 80 (10): 1486-1496
Frankel, Neville. “Mugabe Could Have Been a Hero, like Mandela. Instead his Legacy is
Violence and Greed.” Los Angeles Times, November 17, 2017. Accessed December
7, 2018. https://www.latimes.com/opinion/op-ed/la-oe-frankel-mugabe-mandela-
20171117-story.html
Freire, Paulo. 1970 (2005). Pedagogy of the Oppressed. New York: Continuum
International Publishing Group.
Graeber, David (2017). Promises, Promises: A History of Debt. BBC4. Accessed October
4, 2018. https://www.bbc.co.uk/programmes/b054tl77
Gordon, Rosemary. (1997). “Structural Adjustment and Women in Zimbabwe: Effects
and Prospects.” Canadian Journal of Development Studies 18 (2): 263-277, DOI:
10.1080/02255189.1997.9669708
Hanlon, Joseph. (2009). “Just Give Money to the Poor” in II Conferencia do IESE
“Dinamicas da Pobreza e Padrões de Asumulação em Moçambique”. 22-23 April
2009, Maputo, Mozambique.
Home Office. (2018). “Country Policy and Information Note Zimbabwe: Women Fearing
Gender-Based Harm or Violence.” Government of the United Kingdom. Accessed
November 20, 2018.
https://assets.publishing.service.gov.uk/government/uploads/system/uploads/attachme
nt_data/file/752589/Zimbabwe_-_Women_and_GBV_-_CPIN_-
_v3.0e__October_2018_.pdf
Kristoff, Nicholas D., and Sheryl WuDunn. “The Women’s Crusade.” The New York
Times, August 17, 2009.

~ 59 ~
Logan, B. Ikubolajeh, and William G. Moseley. (2002). “The political ecology of poverty
alleviation in Zimbabwe's Communal Areas Management Programme for Indigenous
Resources (CAMPFIRE).” Geoforum 33(1): 1-14.
McIvor, Chris. (1994). “Management of Wildlife, Tourism and Local Communities in
Zimbabwe.” The United Nations Research Institute for Social Development.
Discussion Paper No. 53, August 1994.
MWAGCD. (2018). “About Us.” Ministry of Women Affairs, Gender, and Community
Development. Accessed November 20, 2018. http://www.women.gov.zw/site-map
MLSW. (2018). "Social Welfare." Ministry of Labour and Social Welfare. Accessed
November 9, 2018. http://www.mpslsw.gov.zw/index.php/social-services.
Murindagomo, Felix. (1990). “Wildlife management in Zimbabwe: The CAMPFIRE
programme.” FAO. Accessed December 1, 2018.
http://www.fao.org/docrep/u5200e/u5200e06.htm
Mutandwa, Edward, and Christopher Tafara Gadzirayi. (2007). “Impact of community-
based approaches to wildlife management: case study of the CAMPFIRE programme
in Zimbabwe.” International Journal of Sustainable Development & World Ecology
14: 336–344.
Peluso, Nancy Lee. (1993). “Coercing Conservation?: The Politics of State Resource
Control.” Global Environmental Change 3(2): 199-217.
Pfeiffer, James, and Rachel Chapman. (2010). “Anthropological Perspectives on
Structural Adjustment and Public Health.” Annual Review of Anthropology 39: 146-
165.
Rodney, Walter. (1974) How Europe Underdeveloped Africa. Washington DC: Howard
University Press.
Rostow, W.W. (2008). “The Five Stages of Growth.” Development and
Underdevelopment. Boulder: Lynn Reinner Publishers. pp. 173-180.
Sen, A. K. (1999). “The Ends and Means of Development” in Development as Freedom.
New York: Knopf. Chapter 2, pp. 35-53.

~ 60 ~
Son, Hyun H. (2008). “Conditional Cash Transfer Programs: An Effective Tool for
Poverty Alleviation?” Asian Development Bank, ERD Policy Brief Series No. 51.
Stiglitz, Joseph E., Amartya Sen, and Jean-Paul Fitoussi. (2010). Mismeasuring Our
Lives: Why GDP Doesn’t Add up. The New Press.
Wade, Robert Hunter (2008). “The Rising Inequality of World Income Distribution.”
Development and Underdevelopment: The Political Economy of Inequality. Boulder:
Lynne Reinner.
World Bank. (2012). “Structural Adjustment and Zimbabwe’s Poor.” Independent
Evaluation Group. Accessed October 15, 2018.
http://lnweb90.worldbank.org/oed/oeddoclib.nsf/DocUNIDViewForJavaSearch/15A9
37F6B215A053852567F5005D8B06.
ZPWMA (2015). “Elephant Hunted in Malipatsi Safari Area.” Accessed December 1,
2018. http://zimparks.org/elephant-hunted-in-malipati-safari-area/

~ 61 ~
MUNICIPAL BROADBAND NETWORKS: A WORK IN PROGRESS
Daniel Emirkhanian
INTRODUCTION
In an increasingly global and connected world, access to the internet has quickly
become crucial for many Americans. The Federal Communications Commission (FCC)
writes that the internet provides “…access to numerous employment, education,
entertainment, and healthcare opportunities” (2018 Broadband Deployment Report,
2018). Considering its importance, it’s surprising that there are remarkably large areas
across the country lacking high-speed broadband capability. One recent FCC study found
that “about 41% of Americans living on tribal lands lack broadband access” (2016
Broadband Progress Report, 2016). This issue is not limited to tribal lands. The Pew
Research Center found that 58% of rural Americans report that reliable internet service
“is a problem in their communities” (Anderson, 2018). Overall, a staggering 7% of the
country lacks access to high-speed broadband internet and 30% of the country has only
one high-speed internet service provider (ISP) in their area ("Fixed Broadband
Deployment," 2017). The issue can only be solved when two questions are answered: (1)
How can unserved rural areas of the country gain access to high-speed broadband
internet, and (2) How can ISP monopolies be challenged? This paper will explore how
local governments are capable of providing access to high-speed broadband internet to
local, rural, communities through municipal broadband networks. By using current
networks as a basis for analysis, this paper will also offer insight into some best practices
that local leaders can adopt.
HIGH-SPEED BROADBAND INTERNET
High-speed broadband internet is defined by the FCC as “a method of
transmitting information using many different frequencies, or bandwidths, allowing a
network to carry more data” and has a minimum speed of 25 megabits per second (Mbps)
("Broadband That Works: Promoting Competition & Local Choice in Next-Generation
Connectivity," 2015). The definition of high-speed internet developed with the
technology. In 2010, for example, high-speed internet was defined as having a download
speed of a mere 4 Mbps. There are a variety of methods to access the internet, including
dial-up, satellite, wireless transmissions. One of the most reliable methods is fiber-optic
cable, which has an installation cost of “$27,000 per mile” (Aman, 2017). Before fiber-
optic cable became widely used, the internet was accessed through phone lines.
When the internet was first invented, most households accessed the service
through the phone line, a system known as dial-up. This provided phone companies a
natural monopoly on internet services. A natural monopoly is a “monopoly in an industry
in which high infrastructural costs and other barriers to entry give the largest supplier in

~ 62 ~
an industry, often the first supplier in a market, an overwhelming advantage over
potential competitors” (emphasis added) (Krugman & Wells, 2013). For ISPs, including
AT&T and Time Warner Cable, the necessary infrastructure for internet delivery had
already been built throughout the country, putting these companies at an enormous
advantage and creating a large barrier to entry to smaller, regional corporations. As
technology progressed, fiber optic cable spread throughout the country and ISPs started
to compete with one another (Eisenach, 2016). Considering the high cost of cable-laying
($27,000 per mile), only large, nationally established companies were able to compete.
As the internet spread rapidly across the country, rural and urban disparities in access
became greater.
WHY THE DISPARITY?
For internet access to spread to rural communities, telecom companies must
believe that building infrastructure is a viable economic investment in those regions. As
mentioned above, rural American residents report that internet access is a major problem
in their community. As of 2016, “39% of rural America (23 million people)” lacked
access to high-speed internet, compared to a mere “4% of urban Americans” (2016
Broadband Progress Report, 2016). Solving this disparity does not end by simply
drawing ISPs to rural communities. According to the FCC, 30% of the country has only
one high-speed internet provider. Without competition, there is little incentive for
companies to offer competitive rates and services ("Fixed Broadband Deployment,"
2017). There are three issues that need to be considered when determining why rural
areas lack high-speed internet: location, population, and competition.
Location
A difficult topography increases infrastructure installation costs and can interrupt
wireless signals from radio towers (2018 Broadband Deployment Report, 2018). Rural
communities that are located in heavily wooded areas or mountainous regions provide a
diverse set of development challenges, which increases the cost to ISPs and make the
region less attractive for development.
Population
“A key element of the ability to recoup investment in network infrastructure is the
economies of geographic population density” (Brake, 2017). In other words, building
internet infrastructure has high up-front costs, but once built, it is relatively easy and
inexpensive to add a new user. Rural communities cover “97 percent of the nation’s land
area” but only contain “19.3 percent of the population,” lacking the communal density
necessary to create a viable market ("New Census Data Show Differences Between
Urban and Rural Populations," 2016).

~ 63 ~
Competition
Densely populated urban areas play host to competitive markets, motivating ISPs
to expand and improve infrastructure and lower costs of services. However, rural areas,
with only one or no ISPs, are paying more and receiving less (The Benefits Of
Competition And Choice For Community Development And Highspeed Internet Access,
2015). Even in ‘competitive’ areas, however, there are typically only two ISPs to choose
from ("Fixed Broadband Deployment," 2017).
THE PUBLIC OPTION
Within the last twenty years, access to high-speed internet has become crucial. “A
private good with large public spillovers,” high-speed broadband significantly benefits
communities (Brake, 2017). Economic studies show that “broadband Internet creates
significant value for consumers and makes an important and rapidly growing contribution
to GDP” (The Benefits Of Competition And Choice For Community Development And
Highspeed Internet Access, 2015). Further, a 2009 study estimated that broadband creates
“$32 billion in annual consumer surplus” (The Benefits Of Competition And Choice For
Community Development And Highspeed Internet Access, 2015). Broadband internet
connection creates new job opportunities, diversifying a community’s economy. In one
particularly compelling example, a woman who, “after years of fighting an opioid
addiction and unemployment,” was able to access remote job opportunities offered by U-
Haul, ultimately increasing her annual earnings and helping to stabilize herself and, by
extension, her locality (DePillis, 2017). In addition to the demonstrated economic
benefits, high-speed internet provides a line to an increasingly connected world (Stanley,
2018). Yet there are large disparities in access across the US, and even locations that
have access suffer as a direct result of the limited number of ISPs. The high cost of entry
into the market means that potential new competitors cannot challenge well-established
companies. The only entity capable of accessing the capital needed to fund, build, and
manage a large infrastructure project on the scale to provide competition to the ISP
companies is local government.
Municipal Broadband Networks
Municipal broadband networks refer to “high-speed internet services provided to
consumers by either a public entity, such as a local government or public utility, or a
public-private partnership, rather than a private telecommunications provider” (DuPuis,
Langan, McFarland, Panettieri, & Rainwater, 2018). Local governments are uniquely
positioned to provide high-speed internet access to rural communities, due to the
correspondence principle, or the understanding that local government’s proximity to its
population means it is better at solving local issues. A rural city does not need to provide
high-speed access to more than one community and can provide unique solutions for
specific geographical limitations. Profit does not motivate local entities when providing

~ 64 ~
services for their communities, so local governments have much more motivation to
serve low-population density areas. Creating a municipal broadband network in a region
with only one ISP has already shown to reduce costs and improve services by creating
competition with the dominant corporation. Chattanooga, Tennessee’s municipal
broadband network began offering high-speed internet access at prices significantly lower
than Comcast, the only private ISP in the region, causing the company to make an
investment of “$15 million in the area to launch the Xfinity Service” (The Benefits Of
Competition And Choice For Community Development And Highspeed Internet Access,
2015). Unfortunately, there are several roadblocks that local communities need to bypass
before being able to adopt this type of policy.
The Legal and Political Perspective
One significant barrier to the launching of municipal broadband networks is
existing preemptive state legislation. Preemption is “the use of state law to nullify a
municipal ordinance or authority” (DuPuis et al., 2018). As of 2016, there were 21 states
that had laws in place that made “it difficult or, in some cases, illegal to create networks
or sell internet service to their citizens” (Koebler, 2015). If a law does not outright
prevent a locality from providing internet access, it can open them to lawsuits from ISPs.
These preemptive laws have resulted in a “chilling effect on municipal broadband
projects,” but has not completely discouraged localities from trying (DuPuis et al., 2018).
One of the most well-known municipal broadband networks is located in Chattanooga,
TN, where the city installed “8,000 miles of fiber for 60,000 residential and 4,500
business customers out of a potential 160,000 homes and businesses” in 2015 (The
Benefits Of Competition And Choice For Community Development And Highspeed
Internet Access, 2015). The city had actively been battling Tennessee’s ban on “offering
services outside” of the city’s limits and was even receiving support from the Obama
administration and the FCC (Koebler, 2015). The Trump administration and new FCC
leadership stopped supporting the town’s efforts. Additionally, knowing that a greater
number of homes have connection speeds of 10 Mbps, the FCC is attempting to redefine
high-speed internet standards from 25 Mbps to 10 Mbps, effectively defining the
disparity away. These legal and political blocks prevent localities from finding ways to be
innovative and provide high-speed internet access to their communities, making this
policy area limited in its understanding. However, by basing analysis on current
municipal networks, we can establish best practices for funding and managing networks.
The Fiscal Perspective
Communities with established networks are consistently “underestimating the
future costs” associated with network management (Wallsten & Gamboa Sorensen,
2017). A closer inspection of the Chattanooga, TN finances revealed that “repaying the
project would take 412 years” due to the networks low profit margin (Yoo & Pfenninger,

~ 65 ~
2017). Residents now hold about “$1 million in public debt,” though local political
leaders maintain the economic benefits far outweigh these costs (Wallsten & Gamboa
Sorensen, 2017). Other localities ended up selling the infrastructure to local ISPs.
Marietta, Georgia sold their network at a “$11 million loss” (Wallsten & Gamboa
Sorensen, 2017). What can be done?
Broadband infrastructure funding is not simple, especially when considering that
the return on investment depends exclusively on user subscription. Previous localities
have opted to pay for broadband projects through “bonds, financial transfers from a
municipality or utility, loans, or grants” (Wallsten & Gamboa Sorensen, 2017). In some
cases, public-private partnerships were established with deals giving exclusive operating
rights to private companies of the network for a set period of years. There is also the
consideration of federal support. In the past, the federal government has established
numerous funding programs adding up to “nearly $100 billion” to subsidize rural
broadband access (Wallsten & Gamboa Sorensen, 2017). Additionally, in states without
municipal network preemption laws, state infrastructure funds can be established and
specifically reserved for network development, much like what is being done for public
transportation initiatives (Pula, Shinkle, & Rall, 2015). However, localities need to
consider much more than just initial funding to successfully run a broadband network.
Many cities that implemented municipal broadband networks underestimated
long-term costs and overestimated the number of users that would subscribe to their
network. These are both problems that can be accounted for. First, proper cost-benefit
analysis is a typical best-practice recommendation for any large project. The issue to this
point was that those establishing municipal broadband networks were forging through
uncharted territory, so to speak. Now though, there are several localities that have
received close public and private scrutiny for which funding analysis is readily available.
Second, relying on user-subscription is not in it of itself a flawed method of funding a
network; rural areas frequently receive poor service quality from ISPs at very high costs,
making them eager to switch to a more affordable option. The issue, rather, was the
single-level payment plan that many of these cities offered. For example, Chattanooga
was dubbed the ‘Gig City’ because it offered internet speeds of 100 Mbps to all users for
a flat rate of “$70 a month” (Wallsten & Gamboa Sorensen, 2017). While certainly a
generous offer, it is inefficient and pushes the infrastructure to stressful levels of output.
Rather than offering such a high-speed, the city should create a tiered subscription
system, in which users pay varying amounts for desired speeds. Users will still receive
competitive rates as well as excellent service while reducing stress on the infrastructure.
An analysis projects a larger growth of users by adopting this system (Brake, 2017).
The Managerial Perspective
Because of the relative novelty of municipal broadband networks, cities have
tried to implement a number of different management strategies with varying success. In

~ 66 ~
general, one report recommends cities follow three basic principles: “(1) High-speed
broadband must be accessible and affordable to all, (2) Community broadband services
must protect free speech, and (3) Community broadband services must protect privacy”
(Stanley, 2018). The second and third principles emerge from recent privacy and net
neutrality concerns and, while important, are not the focus of this paper. Instead, this
paper will expand on how a municipal network can be simultaneously affordable and
accessible to all.
A tiered subscription model, as mentioned previously, allows users to pay for
slower speeds at more affordable prices. Cities then can focus their efforts on connecting
as many users as possible. In several cities, proponents have focused on increasing
internet speed, which has resulted in diminishing marginal benefits. Instead, public
officials should focus on the public good served when high-speed internet becomes easily
accessible.
A large reason why ISPs do not develop in rural communities is a lack of
population density. One fiber-optic cable that connects to an entire apartment building is
a wise investment when compared to a cable that connects to only three or four houses.
Municipal networks must first focus on connecting as many individuals to their service
before attempting to bring 100 Mbps to individuals who may not need it. A study done in
the United Kingdom revealed that “100% coverage at 15 Mbps” earned an estimated
“consumer surplus of €2.25” per euro spent, whereas “92% coverage at 50 Mbps” earned
an estimated “with a €0.72 surplus per euro spent” (Brake, 2017). A broad approach is
better suited for municipal networks for two reasons. First, it allows for an infrastructure
system to support a large number of users. Second, it connects high-speed internet for
everyone and addresses the existing market failure.
CONCLUSION
The FCC’s 2017 data on national broadband connection is bleak, showing an
alarmingly large number of houses either completely lacking high-speed internet
connection or limited to only selecting from one ISP in the region. Because the cost to
enter into the broadband market is so high, emerging companies cannot hope to compete
with the current internet giants. As has been to done to address other types of natural
monopolies, the government should step in to offer reliable and cheaper solutions, if only
to reduce the disparity between urban and rural areas in the country. Unfortunately, the
current political climate seems hostile to this type of innovation and has made
establishing municipal broadband networks difficult, as demonstrated by the FCC’s
recent shift in policy. Additionally, laws prevent the practice altogether or make cities
vulnerable to lawsuits (Koebler, 2015). Even given the robust benefits, a municipal
broadband network should not be established unless local leaders carefully consider the
financial ramifications of undertaking such a large infrastructure project. In worst case
scenarios, “underperforming projects have caused numerous municipalities to face

~ 67 ~
defaults, bond rating reductions, and direct payments from the public coffers” (Yoo &
Pfenninger, 2017). However, with careful management and broad financial support,
establishing these networks have shown to benefit local economies and reduce costs
directly to users, predominantly through the spill-over effect. In Chattanooga, TN, several
businesses located in coastal cities have migrated to the town, citing cheaper internet
costs (The Benefits Of Competition And Choice For Community Development And
Highspeed Internet Access, 2015). Without government intervention, the disparity that
exists between urban and rural regions will only continue to worsen, making the need for
municipal broadband networks all the more urgent.

~ 68 ~
REFERENCES
2016 Broadband Progress Report. (2016). Retrieved from fcc.gov:
https://www.fcc.gov/reports-research/reports/broadband-progress-reports/2016-
broadband-progress-report
2018 Broadband Deployment Report. (FCC 18-10). (2018). www.fcc.gov Retrieved from
https://www.fcc.gov/document/fcc-releases-2018-broadband-deployment-report.
Aman, S. (2017, Apr 12, 2017). Dig Once: A Solution for Rural Broadband. Retrieved
from https://www.ustelecom.org/blog/dig-once-solution-rural-broadband
Anderson, M. (2018). About a quarter of rural Americans say access to high-speed
internet is a major problem. Fact Tank. Retrieved from
http://www.pewresearch.org/fact-tank/2018/09/10/about-a-quarter-of-rural-
americans-say-access-to-high-speed-internet-is-a-major-problem/
The Benefits Of Competition And Choice For Community Development And Highspeed
Internet Access. (2015). Retrieved from The White House:
https://obamawhitehouse.archives.gov/sites/default/files/docs/community-
based_broadband_report_by_executive_office_of_the_president.pdf
Brake, D. (2017). A Policymaker’s Guide to Rural Broadband Infrastructure. Information
Technology and Innovation Foundation, 1991926981.1497921863-
1851887776.1494256561.
Broadband That Works: Promoting Competition & Local Choice in Next-Generation
Connectivity. (2015). Retrieved from https://obamawhitehouse.archives.gov/the-
press-office/2015/01/13/fact-sheet-broadband-works-promoting-competition-local-
choice-next-gener
DePillis, L. (2017). In rural America, building the Internet for everyone has stalled. Cnn
Business. Retrieved from
https://money.cnn.com/2017/12/14/news/economy/kentucky-rural-broadband-
internet/index.html
DuPuis, N., Langan, T., McFarland, C., Panettieri, A., & Rainwater, B. (2018). City
Rights in an Era of Preemption: A State-by-State Analysis. Retrieved from nlc.org:
https://www.nlc.org/resource/city-rights-in-an-era-of-preemption-a-state-by-state-
analysis

~ 69 ~
Eisenach, J. (2016). Don't Make the Internet a Public Utility. Room for Debate. Retrieved
from https://www.nytimes.com/roomfordebate/2015/02/04/regulate-internet-
providers/dont-make-the-internet-a-public-utility
Fixed Broadband Deployment. (2017). Retrieved from
https://broadbandmap.fcc.gov/#/area-
summary?version=jun2017&type=nation&geoid=0&tech=acfosw&speed=25_3
Koebler, J. (2015). The 21 Laws States Use to Crush Broadband Competition.
MotherBoard. Retrieved from
https://motherboard.vice.com/en_us/article/qkvn4x/the-21-laws-states-use-to-crush-
broadband-competition
Krugman, P. R., & Wells, R. (2013). Microeconomics (3rd ed.). New York, NY: Worth
Publishers.
New Census Data Show Differences Between Urban and Rural Populations. (2016).
[Press release]. Retrieved from https://www.census.gov/newsroom/press-
releases/2016/cb16-210.html
Pula, K., Shinkle, D., & Rall, J. (2015). On Track: How States Fund and Support Public
Transportation.
Stanley, J. (2018). The Public Internet Option: How Local Governments Can Provide
Network Neutrality, Privacy, and Access for All. Retrieved from
https://www.aclu.org/report/public-internet-option
Wallsten, S., & Gamboa Sorensen, L. (2017). Public Investment in Broadband
Infrastructure: Lessons from the U.S. and Abroad. Technology Policy Institute, 41.
Yoo, C. S., & Pfenninger, T. (2017). Municipal Fiber in the United States: An Empirical
Assessment of Financial Performance.

~ 70 ~
CASE STUDY: INCLUSIONARY ZONING IN WASHINGTON D.C.
Lauren Ricci
INTRODUCTION
Inclusionary zoning (IZ) has grown in popularity in U.S. cities throughout the last
several decades. According to a study conducted by the Urban Land Institute,
inclusionary zoning policies allow cities to, “encourage developers to create below-
market rental apartments or for-sale homes in connection with the local zoning approval
of a proposed market rate development project” (Williams, Carlton, Juntunen, Picha, &
Wilkerson, 2016). Supporters of IZ programs view the approach is a unique and
innovative tool to incentivize the production of affordable housing units in the private
market. Incentives vary from city to city, and can include options such as “direct
subsidies, tax abatements, density bonuses, and reduced parking requirements” (Williams
et al., 2016). As a policy tool, IZ is politically attractive, since incentives are often framed
as regulatory concessions by government, rather than direct monetary transfers from
taxpayers to private developers.
PROGRAM OVERVIEW
Washington, D.C.’s IZ program, which began in August 2009, has four goals: (1)
Create mixed income neighborhoods, (2) Produce affordable housing for a diverse labor
force, (3) Seek equitable growth of new residents, and (4) Increase homeownership
opportunities for 50 percent MFI and 80 percent MFI households (D.C. Department of
Housing and Community Development, 2018). IZ is one aspect of the D.C. government’s
attempt to reign in the production of high-priced housing and respond to political
pressure to prevent displacement of long-time residents.
The main mechanism through which Washington, D.C.’s IZ program functions is
by providing a density bonus to real estate developers in exchange for their agreement to
set aside a percentage of square footage in a residential development for affordable
housing units. These units are rented or sold at below-market rate for the duration of their
existence.
Program Eligibility
Program eligibility requirements are calculated based on the Median Family
Income (MFI) for a family of four in the Washington, DC Fair Market Rent Area (FMR).
The FY 2018 FMR Area Median Family Income is $117,200 (Office of Economic
Affairs, U.S. Department of Housing and Urban Development, 2019). As of January
2018, the IZ program targets rental units to households making up to 60% of the MFI
($70,320) and for-sale condos to households making up to 80% of MFI ($93,760).
Minimum income thresholds are calculated based on the number of bedrooms in a unit,

~ 71 ~
while maximum income requirements are tied to household size. For example, to qualify
for a three-bedroom IZ apartment, a family of four would need a combined family
income between $54,950 and $66,200.
Historical Context
Inclusionary zoning strategies were developed in part as a tool for desegregation,
to counteract the effects of racially-motivated exclusionary zoning policies. In the U.S.,
neighborhood segregation was legally sanctioned until 1948, when the Supreme Court
outlawed race-specific covenants in Shelley v. Kraemer (1948). After Shelley v. Kraemer,
communities maintained de facto racial segregation through exclusionary zoning
practices, which included strategies such as zoning against multi-family homes and
requirements for minimum lot sizes (Schneider, 2018). These strategies suppressed the
supply of available residential housing and drove up property prices.
To understand the need for inclusionary zoning policies and determine
appropriate indicators for successful implementation, it is critical to acknowledge how
zoning practices were used in the recent past to perpetuate racial segregation.
Exclusionary zoning maintained the effects of racial covenants after they were outlawed,
and prevented construction of affordable housing in cities throughout the U.S., including
Washington, D.C. These policies prevented lower-income, disproportionately Black and
Brown people from moving into wealthier, typically whiter neighborhoods.
In Washington, D.C. wealthy white families clustered in the Upper Northwest
Quadrant of the city. Even today, these neighborhoods are the least diverse and wealthiest
in the city. Ward 3, which includes Chevy Chase, Friendship Heights, Palisades,
Georgetown and Cleveland Park has the highest average MFI in Washington, D.C. at
$190,380, and only 6.8% of the population is Black (80.1% White), according to 2017
American Community Survey Census data. North Capitol Street and the Anacostia River
divide the White section of the city from Black Washington, D.C. Ward 8, which
includes neighborhoods such as Barry Farm, Sheridan, Congress Heights, Douglass and
Shipley Terrace, has the lowest average MFI in Washington, D.C. at $27,979, and 90.8%
of the population is Black (5.6% White), according to 2017 American Community
Survey Census data. Put another way, the average MFI of Ward 3 is seven times the
average MFI of Ward 8.
Demographic Comparison
Highest vs. Lowest Income Washington, D.C. Wards
Ward 2 Ward 3 Ward 7 Ward 8
Population by Race
(%) Black
9.1% 6.8% 93.1% 90.8%
Neighborhood clusters 4, 5, 6, 7, 8 10, 11, 12, 13, 29, 30, 31, 32, 36, 37, 38,

~ 72 ~
14, 15 33, 34, 35 39
Families
Average family size 2.55 2.87 3.53 3.63
Average median family
income**
$161,197 $190,380 $44,300 $27,979
60% of Avg. MFI (IZ
rent baseline)
$96,718 $114,228 $26,580 $16,787
80% of Avg. MFI
(IZ own baseline)
$128,958 $152,304 $35,504 $22,383
Source: D.C. Office of Planning State Data Center (n.d.).
**Source: DC KIDS COUNT data set, Ward Avg MFI calculated by averaging the
Average MFI for neighborhoods in each ward. Source for determining Ward/cluster
equivalency: http://www.neighborhoodinfodc.org/pdfs/Ward_Cluster.pdf
While the stated intent of Washington, D.C.’s IZ program is to ensure that new
developments include affordable units (D.C. Department of Housing and Community
Development. (n.d.), 2019) the definition of “affordability” used by the city fails to
consider the injurious impact of policies that promoted segregation. Racially-restrictive
covenants and exclusionary zoning excluded low-income, Black families from benefiting
from Washington, D.C.’s economic growth over several generations, resulting in poverty
and limited opportunity to concentrate in several neighborhoods. For the IZ program to
truly be affordable to residents of neighborhoods that have suffered from consequences of
exclusionary zoning policies, IZ would need to address the current economic hardships
experienced by these families by tailoring affordability thresholds to their current
economic situations. This paper explores the thresholds that would be affordable to
residents in Washington, D.C.’s lowest income neighborhoods, which also have the
highest percentage of Black residents.
ELIGIBILITY BENCHMARK ISSUES
Although Washington, D.C. geographically lies within the FMR Area, differences
in the demographic makeup and income of high-earning surrounding cities make the
FMR Median Family Income an inappropriate baseline for the IZ program. The cities
factored into the FMR Area MFI calculation include some of the wealthiest cities in the
United States. For example, the Median Family Income for the Washington, D.C. HUD
FMR Area includes Bethesda, MD, which has a MFI of $232,466 – more than eight times
the average MFI for Ward 8 in Washington, D.C. ($27, 979).

~ 73 ~
Median Family Income of Cities in
the Washington-Arlington-Alexandria, DC-VA-MD HUD Metro FMR Area
Principal Cities Median Family Income
(income and benefits in 2017
inflation-adjusted dollars)
Mean Family Income
(income and benefits in 2017
inflation-adjusted dollars)
Washington, DC $106,528 $155,436
Bethesda, MD $232,466 $299,504
Frederick City,
MD
$94,921 $105,237
Gaithersburg
City, MD
$92,656 $109,905
Rockville city,
MD
$118,742 $140,209
Silver Spring,
MD
$83,140 $113,269
Alexandria city,
VA
$118,757 $146,244
Arlington, VA $154,926 $194,685
Source: American FactFinder (Accessed 3.18.2018)
The use of the FMR Area MFI is a major flaw of the design of the IZ program. By
targeting rental units to families making 60% of FMR Area MFI and for-sale units to
households making 80% of the FMR Area MFI, the city is effectively prioritizing a
specific subset of low-income residents.
According to a study by The Urban Institute titled, The Color of Wealth in the
Nation’s Capital, researchers determined that the MFI for Black families in the
Washington, D.C. Metropolitan Statistical Area is $72,000, the MFI for Hispanic/Latinx
families is $80,000, and the MFI for White families is $110,000 (Kijakazi et al., 2016).
While 60% of the White MFI for the Washington, D.C. FMR area is close to the
program’s benchmark ($66,000), the program is less accessible for Black and
Latinx/Hispanic families. For Black family of four in the Washington, D.C. FMR Area to
qualify to rent a three-bedroom IZ apartment, that family would need a combined family
income between 76% and 92% of the adjusted Black MFI (between $54,950 and

~ 74 ~
$66,200). A Hispanic family would need to make between 69% and 83% of the adjusted
MFI. By basing qualifications on the DC FMR Area MFI, lower income minority
residents are less likely to have access the program, since the bar is higher for for these
residents.
One potential strength of the current program design related to eligibility
requirements is that income minimum requirements do not apply to applicants who
receive rental assistance through the Housing Choice Voucher program (Section 8) or
other subsidies (Deputy Mayor for Planning and Economic Development, 2017). This has
the potential to benefit extremely low income residents (usually below ~30% MFI) who
also qualify for additional subsidies, particularly families in the lowest income areas of
the city. By allowing “double dipping” the program has the potential to serve a wider
range of D.C.’s lowest-income population, even though units are set-aside at 60% of
MFI. Unfortunately, the 2017 IZ Annual Report provides data on subsidies for purchased
units, but the percentage of renters in IZ units who received other forms of rental
assistance is not currently known.
By basing the program eligibility on statistics that incorporate the incomes of
wealthier, whiter communities within and outside of the city, the current program
eligibility formula erases the economic reality of Black Washingtonians, many of whom
have lived in the city for several generations and have been pushed to low-income
neighborhoods in Wards 6, 7 and 8. Since eligibility is not based on the income
distribution of the population in Washington, D.C., it could be argued that even without
considering the racial differences within the city, the program is not adequately tailored
to serve the intended population. It is imperative to consider race when assessing the
accessibility of the Washington, D.C. IZ program because of the legacy of exclusionary
zoning practices that imposed the barriers Black citizens in Washington, D.C. still
struggle with today.
DHCD maintains a database of all IZ projects in the planning stages, under
construction, completed with a lottery pending, completed with a lottery held, or a
subsequent lottery pending. As real estate development continues in Washington, D.C.,
rents are rising in historically disadvantaged parts of the city, including in Wards 7 and 8.
As of November 2017, six residential projects set to produce 14 units were in the pipeline
in Ward 7, and another six projects with 19 total units in Ward 8, where the average MFI
is $27,979. In the context of rapid development, it is likely that many long-time residents
and families will be displaced as the place they call home becomes unaffordable.
Inclusionary zoning can only prevent displacement of these residents if it is targeted to
their economic situation.
CONCLUSION
Affordability requirements for D.C.’s IZ program are calculated based on a
flawed statistic, the Washington, D.C. FMR Area Median Family Income. Although

~ 75 ~
administrators have an interest in maintaining consistency with federal housing programs
whenever possible, the needs of Washington, D.C.’s most vulnerable citizens should
come first. The city’s failure to truly consider the severity of inequality and the economic
reality of the city’s lowest income residents undermines the stated objectives of the
program itself. If the program truly intends to address the downstream effects of racially-
restrictive covenants and exclusionary zoning practices, the relationship between race and
socioeconomic status should be closely examined and factored into program design.
That being said, if the city were to commit to implementing an IZ program to
meet the needs of the District’s most marginalized residents, it is unlikely that the cost of
providing that service could realistically be borne by private developers. For IZ programs
to work, there must be a balance between the city’s interest in providing affordable
housing, and cost efficiency for the developer. It is likely that by increasing affordability
of units and decreasing prices to a threshold which would be affordable to residents of
neighborhoods with a low average MFI (i.e. residents in Wards 7 and 8), private
developers would not have sufficient incentive to participate in the program, and could
simply opt out.
Instead of relying on the private market to produce affordable housing,
Washington, D.C.’s government should commit to producing affordable housing and
actively undoing the remnants of exclusionary zoning practices that still exist today. The
sheer quantity of affordable housing units needed to meet citizen’s needs far exceeds the
scale of the IZ program, as currently constituted. Programs such as the National Housing
Trust Fund and the DC Housing Production Trust Fund should be strengthened and fully
funded.
As long as the supply of affordable housing is suppressed as a result of
unnecessarily restrictive zoning practices which limit density and prevent development of
affordable units, the cost to rent or own property in the city will continue to increase,
causing lower-income residents to be pushed out of the city. It is the responsibility of the
city to confront its history and dedicate resources to remedying the its legacy of racist
policies that continue to put many Black Washingtonians, especially those who have
lived in the city for generations, at a serious disadvantage. It is critical that as a society,
we take every step possible to undo the damage done through the discriminatory policies
of our past, and ensure that new and innovative policies do not worsen the divide, and
actively work to improve conditions for those affected.

~ 76 ~
REFERENCES
American FactFinder. Data Access and Dissemination Systems (DADS). (2010, October
05). Retrieved from https://factfinder.census.gov/faces/nav/jsf/pages/index.xhtml
D.C. Department of Housing and Community Development. (2017). Inclusionary Zoning
Annual Report 2016. Washington, DC.
D.C. Department of Housing and Community Development. (n.d.). Inclusionary Zoning
Affordable Housing Program. Retrieved March 15, 2019, from
https://dhcd.dc.gov/service/inclusionary-zoning-affordable-housing-program
D.C. Office of Planning State Data Center. (n.d.). State Data Center: 2013-2017 ACS
Key Demographic Indicators. Retrieved March 16, 2019, from
https://planning.dc.gov/sites/default/files/dc/sites/op/publication/attachments/Key
Indicators 2013 - 2017.pdf
DC Action for Children. (n.d.). Data Tools 2.0 Data & Methodology. Retrieved from
https://www.dcactionforchildren.org/data-tools-20-data-methodology
Department of Housing and Community Development. (2017). Flyer: Inclusionary
Zoning Steps for Developers. Retrieved from
https://dhcd.dc.gov/sites/default/files/dc/sites/dhcd/service_content/attachments/Inclu
sionary Zoning Steps for Developers Fact Sheet November 2017.pdf
Deputy Mayor for Planning and Economic Development. (2017). Inclusionary Zoning
2017 Maximum Income, Rent and Purchase Price Schedule, Revised. Washington,
DC: DHCD. Retrieved from
https://dhcd.dc.gov/sites/default/files/dc/sites/dhcd/publication/attachments/IZ
Income Schedule as of October 6 2017_0.pdf
Kijakazi, K., Brooks Atkins, R. M., Paul, M., Price, A., Hamilton, D., & Darity, W. A.
(2016). The Color of Wealth in the Nation’s Capital. Inequality and Mobility,
(November 2016). Retrieved from
https://www.urban.org/sites/default/files/publication/85341/2000986-the-color-of-
wealth-in-the-nations-capital.pdf
Office of Economic Affairs, U.S. Department of Housing and Urban Development. (n.d.).
FY 2019 Income Limits Documentation System. Retrieved March 17, 2019, from
https://www.huduser.gov/portal/datasets/il/il2018/2018MedCalc.odn

~ 77 ~
Schneider, B. (2018, September 06). The Ultimate Primer on Inclusionary Zoning.
Retrieved from https://www.citylab.com/equity/2018/07/citylab-university-
inclusionary-zoning/565181/
Shelley v. Kraemer, 334 U.S. 1 (May 3, 1948).
Williams, S., Carlton, I., Juntunen, L., Picha, E., & Wilkerson, M. (2016). The Economics
of Inclusionary Development. Washington, DC.

BARRIERS TO ABORTION ACCESS FOR ACTIVE-DUTY
SERVICEWOMEN STATIONED DOMESTICALLY AND
ABROAD
Annaliese Johnson
CRACKING DOWN ON SENTENCING DISPARITIES: THE
FEDERAL SENTENCING ACT OF 2010’S IMPACT ON
COCAINE OFFENDERS
Meghan Ballard
DEPENDENCE, VIOLENCE AND NEGLECT IN WOMEN
WITH DISABILITIES
Karlee Naylon
GOVERNMENT-LED DEVELOPMENT INITIATIVES IN
ZIMBABWE
Rebekah McDowell
MUNICIPAL BROADBAND NETWORKS: A WORK IN
PROGRESS
Daniel Emirkhanian
CASE STUDY: INCLUSIONARY ZONING IN
WASHINGTON D.C.
Lauren Ricci