Public Finance in Rajasthan (Published in Indian Economic Journal)
14
1 Management of Public Finances in Rajasthan Govind Bhattacharjee 1 , Abstract Having long extricated itself out of the so-called BIMARU status, Rajasthan today is marching ahead towards development and progress along with all other states of India. Thanks partly to its FRBM Act, the state’s public finances are today in a healthy sta te though there remains areas of concern. The state has been able to increase its own revenues, both tax and non-tax, appreciably over the last five years, thereby reducing its dependence on Central grants significantly. VAT constitutes the most important source of its revenues followed by state excise, stamps & registration fees and taxes on vehicles, all of which are also highly buoyant and which together account for most of its own tax receipts, while royalty from petroleum is the main source of its non-tax revenues. As regards Central funds, direct off-budget transfers of Central plan funds to state implementing agencies have always far exceeded the Central grants routed through state budgets; this aberration is likely to stop from this year onwards, giving the state more autonomy and control over development expenditure. Though state revenues have grown faster than total expenditure, enabling the state to progressively increase a surplus in the revenue account, the ever-growing committed expenditure on salary, pension, interest and subsidy continue to consume a large of its revenue expenditure, seriously limiting the scope of expenditure on maintenance of assets. Populist subsidies like that on electricity needs to be curtailed, and non-developmental expenditure on running the day to day administration of the State also needs to be controlled. The fiscal deficit of the state is under control, but borrowings, even without posing any immediate danger in view of high growth rate of the state economy, need to be carefully calibrated and controlled as the state is unable to derive any benefit from the debt funds. It has actually been paying far more than what it borrows due to its high debt servicing obligations and cutting down on subsidy and other unproductive expenditure is urgently warranted to bring this problem under control. This would also allow the State to increase its capital outlay. The state compares well with its neighbours in respect of important parameters with regard to management of public finances. 1 The author is Director General, Eastern Region, at the Office of the Comptroller & Auditor General of India, New Delhi. Sources of all data used in this paper are the Finance Accounts of the Government of Rajasthan compiled by the Comptroller & Auditor General of India, unless otherwise stated. Opinions expressed in the paper are strictly personal and do not reflect the view of the Indian Audit & Accounts Department.
-
Upload
independent -
Category
Documents
-
view
5 -
download
0
Transcript of Public Finance in Rajasthan (Published in Indian Economic Journal)

1
Management of Public Finances in Rajasthan
Govind Bhattacharjee1,
Abstract
Having long extricated itself out of the so-called BIMARU status, Rajasthan today is
marching ahead towards development and progress along with all other states of India.
Thanks partly to its FRBM Act, the state’s public finances are today in a healthy state though
there remains areas of concern. The state has been able to increase its own revenues, both
tax and non-tax, appreciably over the last five years, thereby reducing its dependence on
Central grants significantly. VAT constitutes the most important source of its revenues
followed by state excise, stamps & registration fees and taxes on vehicles, all of which are
also highly buoyant and which together account for most of its own tax receipts, while royalty
from petroleum is the main source of its non-tax revenues. As regards Central funds, direct
off-budget transfers of Central plan funds to state implementing agencies have always far
exceeded the Central grants routed through state budgets; this aberration is likely to stop
from this year onwards, giving the state more autonomy and control over development
expenditure.
Though state revenues have grown faster than total expenditure, enabling the state to
progressively increase a surplus in the revenue account, the ever-growing committed
expenditure on salary, pension, interest and subsidy continue to consume a large of its
revenue expenditure, seriously limiting the scope of expenditure on maintenance of assets.
Populist subsidies like that on electricity needs to be curtailed, and non-developmental
expenditure on running the day to day administration of the State also needs to be controlled.
The fiscal deficit of the state is under control, but borrowings, even without posing any
immediate danger in view of high growth rate of the state economy, need to be carefully
calibrated and controlled as the state is unable to derive any benefit from the debt funds. It
has actually been paying far more than what it borrows due to its high debt servicing
obligations and cutting down on subsidy and other unproductive expenditure is urgently
warranted to bring this problem under control. This would also allow the State to increase its
capital outlay.
The state compares well with its neighbours in respect of important parameters with regard
to management of public finances.
1 The author is Director General, Eastern Region, at the Office of the Comptroller & Auditor General of India,
New Delhi. Sources of all data used in this paper are the Finance Accounts of the Government of Rajasthan
compiled by the Comptroller & Auditor General of India, unless otherwise stated. Opinions expressed in the
paper are strictly personal and do not reflect the view of the Indian Audit & Accounts Department.
2
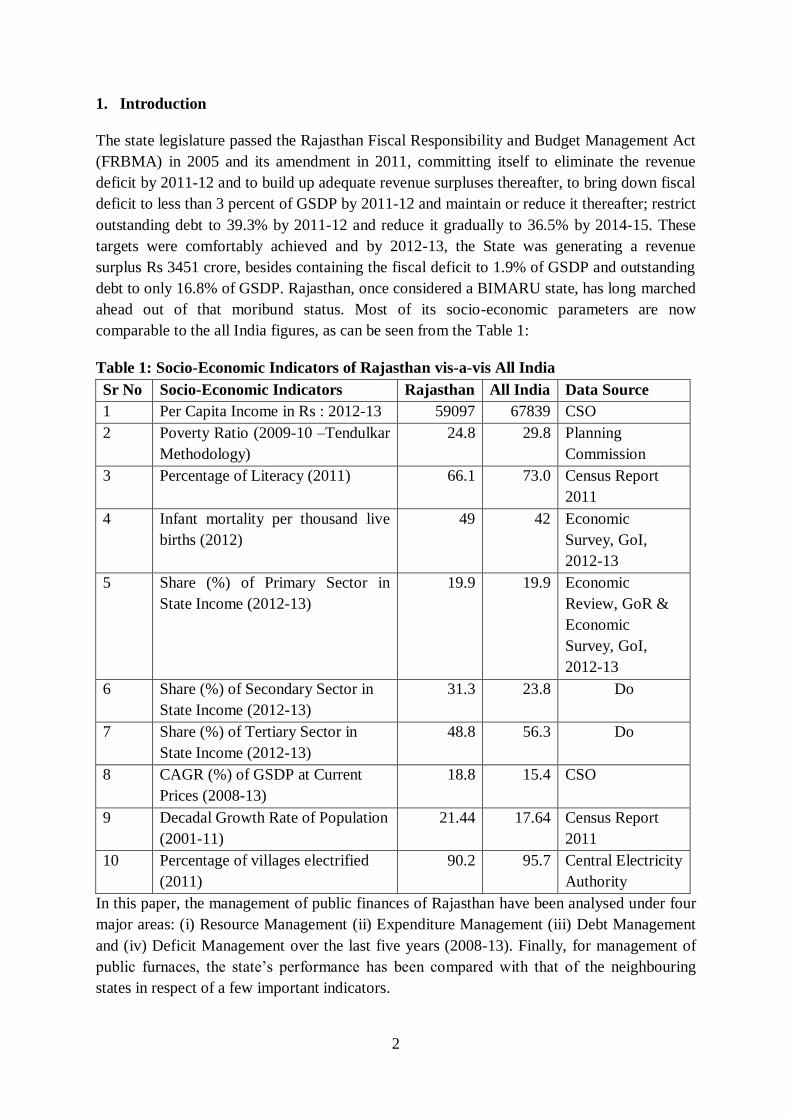
1. Introduction
The state legislature passed the Rajasthan Fiscal Responsibility and Budget Management Act
(FRBMA) in 2005 and its amendment in 2011, committing itself to eliminate the revenue
deficit by 2011-12 and to build up adequate revenue surpluses thereafter, to bring down fiscal
deficit to less than 3 percent of GSDP by 2011-12 and maintain or reduce it thereafter; restrict
outstanding debt to 39.3% by 2011-12 and reduce it gradually to 36.5% by 2014-15. These
targets were comfortably achieved and by 2012-13, the State was generating a revenue
surplus Rs 3451 crore, besides containing the fiscal deficit to 1.9% of GSDP and outstanding
debt to only 16.8% of GSDP. Rajasthan, once considered a BIMARU state, has long marched
ahead out of that moribund status. Most of its socio-economic parameters are now
comparable to the all India figures, as can be seen from the Table 1:
Table 1: Socio-Economic Indicators of Rajasthan vis-a-vis All India
Sr No Socio-Economic Indicators Rajasthan All India Data Source
1 Per Capita Income in Rs : 2012-13 59097 67839 CSO
2 Poverty Ratio (2009-10 –Tendulkar
Methodology)
24.8 29.8 Planning
Commission
3 Percentage of Literacy (2011) 66.1 73.0 Census Report
2011
4 Infant mortality per thousand live
births (2012)
49 42 Economic
Survey, GoI,
2012-13
5 Share (%) of Primary Sector in
State Income (2012-13)
19.9 19.9 Economic
Review, GoR &
Economic
Survey, GoI,
2012-13
6 Share (%) of Secondary Sector in
State Income (2012-13)
31.3 23.8 Do
7 Share (%) of Tertiary Sector in
State Income (2012-13)
48.8 56.3 Do
8 CAGR (%) of GSDP at Current
Prices (2008-13)
18.8 15.4 CSO
9 Decadal Growth Rate of Population
(2001-11)
21.44 17.64 Census Report
2011
10 Percentage of villages electrified
(2011)
90.2 95.7 Central Electricity
Authority
In this paper, the management of public finances of Rajasthan have been analysed under four
major areas: (i) Resource Management (ii) Expenditure Management (iii) Debt Management
and (iv) Deficit Management over the last five years (2008-13). Finally, for management of
public furnaces, the state’s performance has been compared with that of the neighbouring
states in respect of a few important indicators.

3
2. Resource Management
2.1 Tax Revenues
The resource position of Rajasthan during the period 2008-13 is shown in Table 2. Total
Revenue receipts of Rajasthan have doubled over the period growing at a CAGR of about 19
percent. Among the state taxes, stamp & registration fees registered the highest CAGR of
25% during the period, followed by taxes on sales (VAT) which grew at an average rate of
20%. Non-tax revenue grew at a very high CAGR of nearly 33% during this period, growing
more than three folds. Central grants registered a modest average growth of 6% while State’s
share of divisible pool of taxes grew at a CAGR of about 17% during this 5 year period.
Table 2: Resource Mobilisation: 2008-09 through 2012-13 (Rs Crore)
2008-
09
2009-
10
2010-
11
2011-
12
2012-
13
CAGR
2008-13
1. Revenue Receipts 33469 35385 45928 57011 66913 18.9
(i) Own Tax Revenue 14943 16414 20758 25377 30503 19.5
Taxes on Sales, Trade, etc 8904 10163 12630 15767 18575 20.2
State Excise 2170 2300 2861 3287 3988 16.4
Taxes on Vehicles 1214 1373 1612 1927 2283 17.1
Stamps & Registration fees 1357 1363 1941 2651 3335 25.2
Land Revenue 163 148 222 209 304 16.9
Taxes on Goods and
Passengers
190 176 231 220 249
7.0
Other Taxes 945 891 1261 1316 1769 17.0
(ii) Non Tax Revenue 3889 4558 6294 9175 12133 32.9
(iii)State's Share of Union Taxes
& Duties
8999 9258 12856 14977 17103
17.4
(iv) Grants-in-Aid from
Government of India
5638 5155 6020 7482 7174
6.2
2. Miscellaneous Capital Receipts 4 9 13 16 8 18.9
3. Recoveries of Loans and
Advances
89 112 319 1229 1102
87.6
4. Totals Revenue and Non debt
Capital Receipts (1+2+3)
33562 35506 46260 58256 68023
19.3
Charts 1 and 2 depict the growth and composition of state’s resources. State’s own resources
comprised by its own revenues and non-tax revenues has increased its share in total revenue
receipts of the State from 56% to 64% over this period, while the share of Central transfers
comprised by the State’s share of divisible pool of taxes and Central grants, plan and non-
plan combined, declined from 64% to 46%. The growth of all these components accelerated
from 2010-11 onwards, which is understandable in the aftermath of the global economic
meltdown in 2008-09 which affected the finances of all Indian states along with that of the
Union, but recovery did not take long in the case of Rajasthan.

4
From Table 3, it can be seen that among the State taxes, VAT constitutes the most important
source accounting for than 60% of total taxes, followed by State Excise, Stamps &
Registration Fees and Taxes on Vehicles. Together these four taxes constitute more than 90%
of the State’s own tax receipts. Their buoyancies are also high, indicating their continued
potential to higher yields, especially the taxes on vehicles. Total tax revenue also shows high
buoyancy.
0
10000
20000
30000
40000
50000
60000
70000
80000
2008-09 2009-10 2010-11 2011-12 2012-13
Chart 1: Revenue Receipts of Rajasthan: 2008-13 (Rs
Crore)
Grants in Aid and
Contributions
Share of Divisible Pool
Non Tax Revenue
Own Tax Revenue
0%
10%
20%
30%
40%
50%
60%
70%
80%
90%
100%
2008-09 2009-10 2010-11 2011-12 2012-13
Chart 2: Composition of Revenue Receipts (%)
Grants in Aid and
Contributions
Share of Divisible Pool
Non Tax Revenue
Own Tax Revenue

5
Table 3: Composition of Tax Revenues (%)
2008-
09
2009-
10
2010-
11
2011-
12
2012-
13
Buoyancy
(2012-13)
Sales Tax/ VAT 59.6 61.9 60.8 62.1 60.9 1.3
State Excise 14.5 14.0 13.8 13.0 13.1 1.5
Stamps & Registration Fees 9.1 8.3 9.4 10.4 10.9 1.3
Taxes on Vehicles 8.1 8.4 7.8 7.6 7.5 1.9
Subtotal 91.3 92.6 91.7 93.1 92.4 ---
Land Revenue 1.1 0.9 1.1 0.8 1.0 3.3
Taxes on Goods and
Passengers
1.3 1.1 1.1 0.9 0.8
1.0
Other Taxes 6.3 5.4 6.1 5.2 5.8 ---
Tax Revenue 14943 16414 20758 25377 30503 1.5
2.2 Non-Tax Revenues
Major sources of non-tax revenues of the state are Interest receipts and receipts from
petroleum and non-ferrous mining and metallurgical industries (Table 4). Receipts from
petroleum sector have shown astounding growth during the last five years, growing from only
Rs 9 crore to Rs 5070 crore during this period. This growth is a result of higher royalty from
the production of crude oil from Mangala, Bhagyam, Aishwariya and other oilfields in the
State.
Table 4: Non-Tax Revenues (Rs Crore)
Revenue Head
2008-
09
2009-
10
2010-
11
2011-
12
2012-
13
CAGR
2008-13
Interest receipts 1,196 1,185 1,277 1,715 2,067 14.7
Dividends & profits 43 37 21 58 57 7.3
Royalty from petroleum 9 111 1,630 3,436 5,070 387.2
Royalty from non-ferrous mining
and metallurgical industries 1,276 1,612 1,930 2,366 2,839 22.1
Other non-tax receipts 1,365 1,613 1,436 1,600 2,100 11.4
Total 3,889 4,558 6,294 9,175 12,133 32.9
2.3 Central Grants
Share of Central grants in the total revenue receipts of Rajasthan has gradually come down
from 16.8% to only 10.7% (Table 5). Most of the grants have come under the plan grants, of
which Grants for Centrally Sponsored Schemes constituted 46% in 2012-13. It is known that
most of these grants were passed directly to the State implementing agencies in respect of the
flagship welfare schemes of the then Central Government bypassing the State budget. Such
direct transfers have now been abolished w.e.f. the current budget and the State government
can now control the use of such funds. It is a well known fact that these schemes were ill-
conceived and badly implemented and were designed more for electoral rather than
developmental purposes, and were at best an aberration in the federal financial relations
between the Union and the states in India. Total amount of such direct transfers in 2012-13

6
was Rs 7826 crore for Rajasthan, which is much higher than the plan funds of Rs 4499 crore
routed through the State budget during the year.
Table 5: Central Grants (Rs Crore)
Particulars 2008-
09
2009-
10
2010-
11
2011-
12
2012-
13
Non-Plan Grants 1,272 1,715 1,716 2,901 2,675
Plan Grants 4,366 3,440 4,304 4,581 4,499
(i) Grants for State Plan Schemes 2,077 1,606 2,488 2,416 2,316
(ii) Grants for Central Plan Schemes 67 128 165 166 92
(iii) Grants for Centrally Sponsored
Schemes 2,222 1,706 1,651 1,999 2,091
Total 5,638 5,155 6,020 7,482 7,174
Percentage of Growth over previous year 14.5 8.6 16.8 24.3 4.1
Share of Grants in Revenue Receipts 16.8 14.6 13.1 13.1 10.7
3. Expenditure Management
The disbursements of the State government during the last 5 years are shown in Table 6 and
Charts 3, 4 and 5. Government expenditure has grown at a lesser rate than revenues after
2009-10, leading to a progressive build up of revenue surplus as we shall see. Though
developmental expenditure constituted around two thirds of the total disbursements made by
the Government during the period, of the total revenue expenditure, the committed
expenditure on salaries, pension, interest and subsidy consumed more than 60% of the
revenue expenditure, leaving very little for the operation and maintenance of the capital
assets. In respect of merit goods like education, public health, water supply and sanitation, the
actual; expenditure on operation and maintenance constituted a negligible percentage of total
expenditure (~ 1 percent). Committed expenditure on subsidy had increased steeply in 2012-
13 due to subsidy on account of electricity which was increased from Rs 2800 crore in 2011-
12 to Rs 4861 crore in 2012-13, and half of it for providing relief to consumers against
increase in tariff, which was an exercise in populism. More than 40% of the non-
developmental expenditure was on account of interest payments alone. The non-
developmental expenditure incurred on running the day-to-day administration of the state has
been rising at an annual compounded rate of more than 12 percent over this period, limiting
the state’s ability to spend more on development.
Plan expenditure constituted about a third of total expenditure in 2012-13. Capital outlays
were made mostly in respect of economic services for creation of physical infrastructure like
road, power and irrigation works. Capital expenditure grew at a CAGR of 16% during this
period financed partly by revenue surpluses and partly by borrowings.

7
Table 6: Disbursements of Rajasthan Government, 2008-13 (Rs Crore)
2008-
09
2009-
10
2010-
11
2011-
12
2012-
13
CAGR
2008-
13
(i) Revenue Expenditure 34296 40132 44873 53654 63462 16.6
Plan 5771 6287 8752 12416 14235 25.3
Non-Plan 28525 33845 36121 41238 49227 14.6
Committed Expenditure 22684 27179 29317 32859 38257 14.0
Committed Expenditure % of
Revenue Expenditure 66.1 67.7 65.3 61.2 60.3 ----
General Services, of which 12950 15647 16737 18709 20496 12.2
Interest payments 6224 6769 7369 7892 8340 7.6
Social Services 14053 16494 17895 21928 25293 15.8
Economic Services 7267 7972 10220 12744 17408 24.4
Grants-in-aid-and
Contributions
26 19 21 273 265 78.7
(ii) Capital Expenditure 5900 5175 5251 7119 10683 16.0
Plan 5704 4530 5231 7103 10682 15.1
Non-Plan 196 645 20 16 1 -73.3
General Services -145 -577 155 204 249 14.5
Social Services 3088 2506 1836 1997 2840 -2.1
Economic Services 2957 3246 3260 4918 7594 26.6
(iii) Disbursement of
Loans and Advances
340 498 262 1109 2412 63.2
Total Expenditure 40536 45805 50386 61882 76557 17.2
Composition of Expenditure
Developmental Expenditure
(%)
67.7 64.6 66.5 69.4 72.9 -----
Non- Developmental
Expenditure (%)
32.3 35.4 33.5 30.6 27.1 -----
Plan Expenditure (%) 29.2 26.4 27.8 31.5 32.5 -----
Non-Plan Expenditure (%) 70.8 75.3 71.7 66.7 64.3 -----

8
0 10000 20000 30000 40000 50000 60000 70000 80000 90000
Chart 3: Expenditure of Rajasthan
Government by Type of Expenditure (Rs
Crore)
Disbursement of
Loans and Advances
Capital Expenditure
Revenue Expenditure
0
10000
20000
30000
40000
50000
60000
70000
Chart 4: Revenue Expenditure by Services
(Rs Crore)
Grants-in-aid-and
contributions
Economic
Services
Social Services
General Services
11703 14030 14570 15847 17595
6224 6769 7369
7892 8340
3322
4887 5151 5920
6858
1435
1493 2227
3200
5464
2008-09 2009-10 2010-11 2011-12 2012-13
Chart 5: Committed Expenditure (Rs Crore)
Salary Interest Pension Subsidy
9
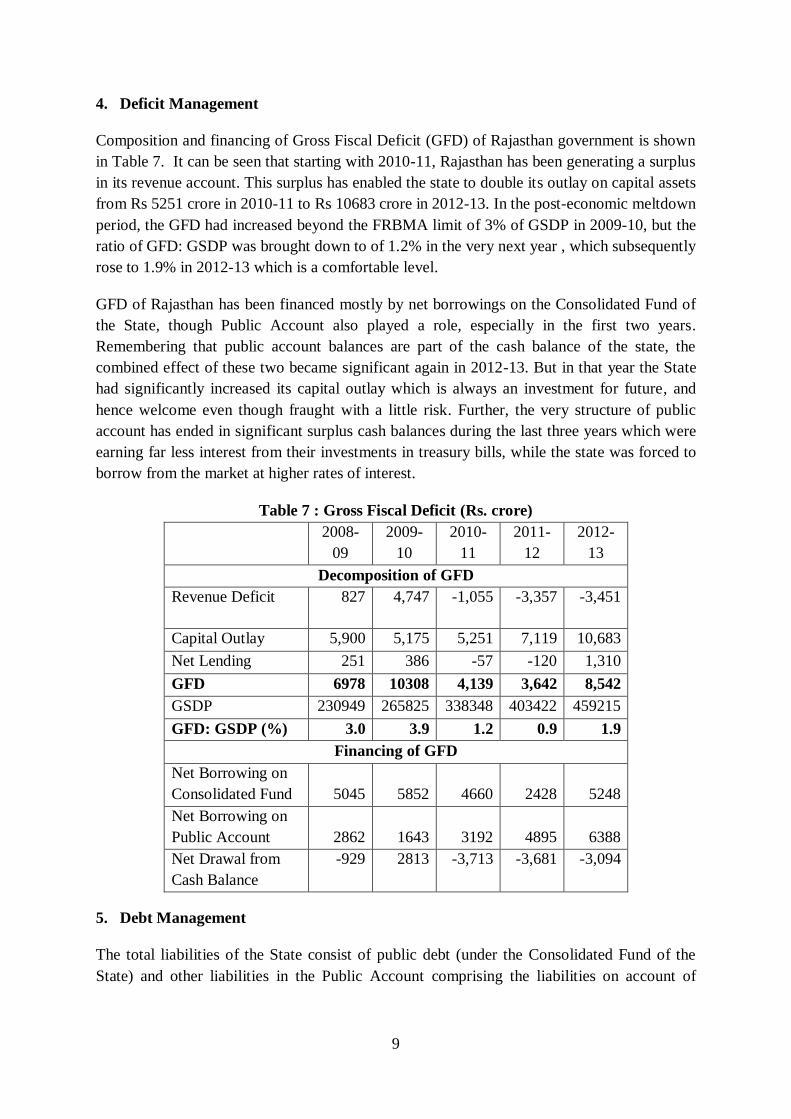
4. Deficit Management
Composition and financing of Gross Fiscal Deficit (GFD) of Rajasthan government is shown
in Table 7. It can be seen that starting with 2010-11, Rajasthan has been generating a surplus
in its revenue account. This surplus has enabled the state to double its outlay on capital assets
from Rs 5251 crore in 2010-11 to Rs 10683 crore in 2012-13. In the post-economic meltdown
period, the GFD had increased beyond the FRBMA limit of 3% of GSDP in 2009-10, but the
ratio of GFD: GSDP was brought down to of 1.2% in the very next year , which subsequently
rose to 1.9% in 2012-13 which is a comfortable level.
GFD of Rajasthan has been financed mostly by net borrowings on the Consolidated Fund of
the State, though Public Account also played a role, especially in the first two years.
Remembering that public account balances are part of the cash balance of the state, the
combined effect of these two became significant again in 2012-13. But in that year the State
had significantly increased its capital outlay which is always an investment for future, and
hence welcome even though fraught with a little risk. Further, the very structure of public
account has ended in significant surplus cash balances during the last three years which were
earning far less interest from their investments in treasury bills, while the state was forced to
borrow from the market at higher rates of interest.
Table 7 : Gross Fiscal Deficit (Rs. crore)
2008-
09
2009-
10
2010-
11
2011-
12
2012-
13
Decomposition of GFD
Revenue Deficit 827 4,747 -1,055 -3,357 -3,451
Capital Outlay 5,900 5,175 5,251 7,119 10,683
Net Lending 251 386 -57 -120 1,310
GFD 6978 10308 4,139 3,642 8,542
GSDP 230949 265825 338348 403422 459215
GFD: GSDP (%) 3.0 3.9 1.2 0.9 1.9
Financing of GFD
Net Borrowing on
Consolidated Fund 5045 5852 4660 2428 5248
Net Borrowing on
Public Account 2862 1643 3192 4895 6388
Net Drawal from
Cash Balance
-929 2813 -3,713 -3,681 -3,094
5. Debt Management
The total liabilities of the State consist of public debt (under the Consolidated Fund of the
State) and other liabilities in the Public Account comprising the liabilities on account of

10
Small Savings and Provident Fund, Deposits and Advances and Reserve Funds – some of
these are interest bearing and some are not.
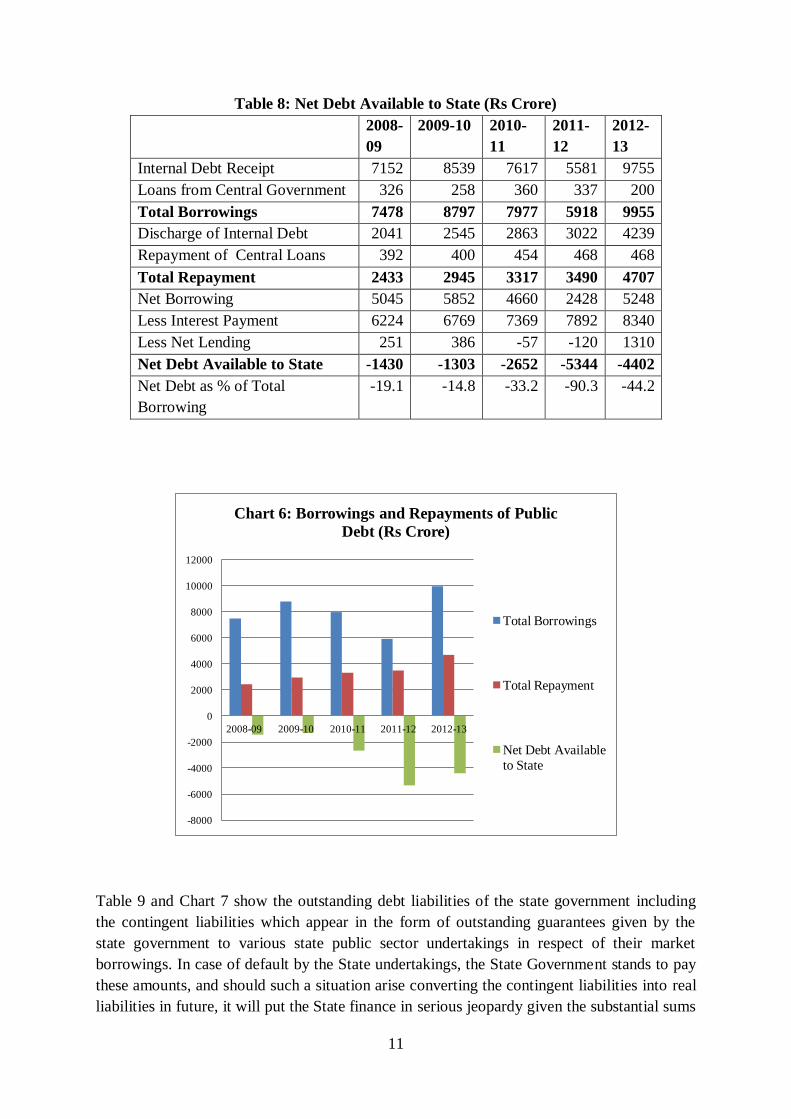
Table 8 shows the debt receipts and repayment liabilities of the state government during the
period 2008-13 and the net debt available to the State after discharging the debt servicing
obligations. In 2012-13, the total repayment of principal by the state government amounted to
Rs. 4707 crore, while the interest payment was much higher at Rs 8340 crore. In each of the
previous years the interest payments were more than double the total repayment of principal
amounts of the outstanding loans. The annual interest burden has increased from Rs 6224
crore to Rs 8340 crore over the past 5 years, at an annual compounded rate of 7.6%, almost in
tandem with the rate of growth of total outstanding liability on which the interest is paid,
which has grown at an annual compounded rate of 8.8%. Most of these repayments were due
to the internal loans from the market as in the case of other states in the post 12th Finance
Commission era; Central loans no longer play any significant role in the borrowing portfolio
of the State. It is also to be noted that interest on Pubic Account balances, which are not
really Government money but are held in trust by the Government on behalf of the
depositors, are paid from the Consolidated Fund of the State, sometimes even when the State
did not need those balances to borrow from. It was rather a question of availability rather than
of need and that introduces some distortion in the whole scheme of borrowing, the basic
purpose behind which is to create income generating capital assets for the State.
Public debt can be a powerful agent of economic growth, if it is utilised for the creation of
productive assets. But as can be seen from Table 8, the State could never utilise the debt
resources for creating productive assets. They were completely used up to discharge the
existing debt servicing obligations including payment of interests on outstanding loans and
were not even adequate for that purpose. In none of the years, anything accrued to the state
out of its borrowed funds; rather the state had to spend its own precious resources for
discharging some of its existing debt obligations. Even though the borrowings have been
growing steeply, this draining of the state’s own resources also continues at an increasing
pace as easily seen from Chart 6, shrinking the fiscal space available to the State. Only in
2012-13, the situation appears to have improved marginally.
If unchecked this has the potential of upsetting the gains made by the State in managing its
finances; fiscal consolidation cannot be achieved if this state of affairs is allowed to continue.
The government must find a way to reduce its borrowings by curtailing unproductive
expenditure and expenditure on administration, which constitutes a significant part of its total
expenditure as we have seen earlier.
11
Table 8: Net Debt Available to State (Rs Crore)
2008-
09
2009-10 2010-
11
2011-
12
2012-
13
Internal Debt Receipt 7152 8539 7617 5581 9755
Loans from Central Government 326 258 360 337 200
Total Borrowings 7478 8797 7977 5918 9955
Discharge of Internal Debt 2041 2545 2863 3022 4239
Repayment of Central Loans 392 400 454 468 468
Total Repayment 2433 2945 3317 3490 4707
Net Borrowing 5045 5852 4660 2428 5248
Less Interest Payment 6224 6769 7369 7892 8340
Less Net Lending 251 386 -57 -120 1310
Net Debt Available to State -1430 -1303 -2652 -5344 -4402
Net Debt as % of Total
Borrowing
-19.1 -14.8 -33.2 -90.3 -44.2
Table 9 and Chart 7 show the outstanding debt liabilities of the state government including
the contingent liabilities which appear in the form of outstanding guarantees given by the
state government to various state public sector undertakings in respect of their market
borrowings. In case of default by the State undertakings, the State Government stands to pay
these amounts, and should such a situation arise converting the contingent liabilities into real
liabilities in future, it will put the State finance in serious jeopardy given the substantial sums
-8000
-6000
-4000
-2000
0
2000
4000
6000
8000
10000
12000
2008-09 2009-10 2010-11 2011-12 2012-13
Chart 6: Borrowings and Repayments of Public
Debt (Rs Crore)
Total Borrowings
Total Repayment
Net Debt Available
to State

12
involved. This carries a risk for the State and the repayment of loans by these undertakings
needs to monitored by the State government to minimise this risk.
Table 9 also shows the sustainability of the public debt of the State Government. A state can
afford of a higher level of debt if its income is high enough to enable the state to service its
debt without putting its finances into unnecessary strain. The determinants of sustainability
are therefore the relative rates of growth between the State income (GSDP of the State) and
the cost of additional borrowings for which the average interest on outstanding debt can serve
as a proxy. The condition for debt stabilisation implies that the State income should grow
faster than the cost of borrowings. In addition, the primary balance of the state is important;
the state should not have a large negative balance in its primary account. If these two
conditions are satisfied, the debt to GSDP ratio should stabilise or fall.
In the case of Rajasthan, we see that both these conditions are satisfied, even if we take the
total outstanding liabilities including those on public account into consideration, given the
healthy growth of GSDP of the State. Primary account of the State also started showing
substantial surpluses since 2010-11 and even though it has turned into a small deficit in 2012-
13, the smallness of this deficit is unlikely to alter the inherent strength of economic
fundamentals of the State. But there is no alternative to limit the borrowing as we have
pointed out earlier so as to contain the debt servicing obligations of the state.
Table 9: Sustainability of Public Debt (Rs Crore)
2008-
09
2009-
10
2010-
11
2011-
12
2012-
13
Public Debt Outstanding 58766 64618 69278 71706 76954
Outstanding Liability in
Public Account2 25257 26915 30007 34854 40855
Total Outstanding
Liabilities including Net
Public Account Liabilities 84023 91533 99285 106560 117809
Outstanding Guarantees 27765 39069 50692 60711 75546
Debt : GSDP Ratio 25.4 24.3 20.5 17.8 16.8
Primary Deficit 1146 4829 -3230 -4250 202
Growth Rate of GDSP (%) 18.5 15.1 28.6 21.9 14.7
Average Interest Rate on
Borrowings 11.1 11.0 11.0 11.2 11.2
Growth Rate of
Outstanding Public Debt
(%) 9.4 10.0 7.2 3.5 7.3
Growth Rate of
Outstanding Liabilities
(%) 9.2 8.9 8.5 7.3 10.6
2 This excludes balances in the adjustment-nature accounts under Suspense and Remittance transactions.

13
6. Comparative Fiscal Performance
Lastly, we compare the fiscal parameters of Rajasthan with other members of the so-called
unceremonious BIMARU group of states as well as with the neighbouring states of Gujrat,
Punjab and Haryana. The parameters considered are shown in Table 10, from which we can
see mixed results in respect of Rajasthan’s performance vis-à-vis the other states. Overall,
Rajasthan’s performance lies somewhere in the middle within this group of states.
Table 10 : Comparison of Major Fiscal Ratios (2012-13)
Ratio of
Figures in percent
(i)
Revenue
Deficit
(ii)
Capital
Outlay
(iii)
Non-Dev.
Rev. Exp
(iv)
Interest
Payment
(v)
Own
Revenue
(vi)
Gross
Transfers
(vii)
State’s
Own Tax
(viii)
Debt
State to
GFD GFD Agg. Dis Rev. Exp Rev. Exp. Agg. Dis. GSDP GSDP
Bihar -77.9 146.4 28.2 8.6 31.9 63.8 6.0 19.4
Madhya Pradesh -79.2 122.8 22.2 7.4 61.3 42.2 8.2 17.9
Rajasthan -40.4 125.2 26.8 13.1 67.2 31.4 6.6 16.8
Uttar Pradesh -26.9 123.9 36.2 12.0 50.5 44.5 7.4 21.1
Gujarat -31.2 119.0 26.3 17.5 86.0 25.7 8.0 20.4
Punjab -79.3 20.5 44.7 17.3 63.9 16.3 7.9 25.0
Haryana 42.8 55.6 26.8 13.0 74.2 12.0 6.9 14.9
7. Conclusion
Rajasthan today is a state marching towards development and progress along with the other
states of India. Its public finances are in a healthy state though there are areas of concern. Its
own revenues have registered appreciable growth over the period of this study and the
0
20000
40000
60000
80000
100000
120000
140000
2008-09 2009-10 2010-11 2011-12 2012-13
Chart 7: Outstanding Liabilites (Rs Crore)
Public Debt Outstanding Total Outstanding Liabilities
Outstanding Guarantees

14
dependence of Central grants has consequently been much reduced. But the ever-growing
committed expenditure on salary, pension, interest and subsidy restricts the scope of
developmental expenditure. The state has kept its fiscal deficit under control, but borrowings,
even though these do not pose any immediate danger in view of the high growth of its
economy, need to be carefully calibrated and controlled as the state is repaying far more than
what it borrows. It needs to cut down on subsidy and other unproductive expenditure to bring
this problem under control, which would also allow the State more leeway to increase its
capital outlay.