Cationic Complexes of the Group 13-15 Elements Supported ...
Journal of Hazardous Materials B131 (2006) 217–228
The adsorption kinetics of the cationic dye, methylene blue, onto clay
A. Gurses a,∗, C. Dogar c, M. Yalcın a, M. Acıkyıldız a, R. Bayrak a, S. Karaca b
a Ataturk University, K.K. Eitim Fakultesi, Department of Chemistry, 25240 Erzurum, Turkeyb Ataturk University, Fen-Edebiyat Fakultesi, Department of Chemistry, 25240 Erzurum, Turkey
c Ataturk University, Erzincan Egitim Fakultesi, Department of Science Education, 24030 Erzincan, Turkey
Received 4 July 2005; received in revised form 13 September 2005; accepted 15 September 2005Available online 27 October 2005
Abstract
In this study, adsorption kinetics of a cationic dye, methylene blue, onto clay from aqueous solution with respect to the initial dye concentration,temperature, pH, mixing rate and sorbent dosage were investigated. In order to understand the adsorption mechanism in detail, zeta potentials andthe conductivities of clay suspensions at various pH (1–11) and cation exchange capacity (CEC) were measured. Porosity and BET surface area ofclay studied were determined. The results showed that the adsorption has been reached to equilibrium in 1 h. It was found that the amount adsorbedof methylene blue increases with decreasing temperature and also with increasing both sorbent dosage and increasing initial dye concentration.Absa©
K
1
ntas[abtilsaalr
0d
dsorption capacity decreases with increasing pH, except for the natural pH (5.6) of clay suspensions. The adsorption kinetics of methylenelue has been studied in terms of pseudo-first-order, pseudo-second-order sorption and intraparticle diffusion processes thus comparing chemicalorption and diffusion sorption processes. It was found that the pseudo-second-order mechanism is predominant and the overall rate of the dyedsorption process appears to be controlled by the more than one-step.
2005 Elsevier B.V. All rights reserved.
eywords: Adsorption kinetics; Dye; Clay; Pseudo-first-order kinetics; Pseudo-second-order kinetics; Intraparticle diffusion
. Introduction
There has been an increase for effluent being disposed toatural water bodies due to rapid industrialization. Major con-aminants found in wastewater include biodegradable, volatilend recalcitrant organic compounds, toxic metals, suspendedolids, plant nutrients, dyes, microbial pathogens and parasites1,2]. Color is an effluent characteristic, which is easily detectednd readily traced back to its source. Some dyes are stable toiological degradation. Consequently, there is considerable needo treat colored effluents prior to their discharge into receiv-ng waters [3–6]. The removals of such compounds at suchow levels are a difficult problem. Physicochemical techniquesuch as coagulation, flocculation, ozonation, reverse osmosisnd adsorption on activated carbon, manganese oxide, silicagelnd clays are among the methods employed [7–13]. The bio-ogical processes typically accomplish very little towards coloremoval [14].
∗ Corresponding author. Fax: +90 442 2360955.
Adsorption of dye at the solid/liquid interface has been exten-sively studied the last years. One reason for this interest isthat importance of adsorption on solid surfaces in many indus-trial applications in order to improve efficiency and economy.Therefore, it is essential to understand the mechanism and kinet-ics of adsorption, because the studies of adsorption kineticsare ultimately a prerequisite for designing an adsorption col-umn. Adsorption techniques have proven successful in removingcolored organic species with activated carbon being the mostwidely used adsorbent due to its high capacity for the adsorp-tion of organic materials [15–17]. However, due to its high costand the difficulty of regeneration, a search for cheap, effectiveadsorbents such as bentonite clay derivatives is needed. Unlikeactivated carbons, clay is relatively cheap due to its accessibilityand abundance [17]. In recent years, clays are important in manydifferent fields such as agriculture, oil drilling, and the buildingindustry. Owing to their interesting physicochemical properties(lamellar structure, high surface area, and high cation exchangecapacity), clay minerals have great potential to fix pollutantssuch as heavy metals, dye wastewater and organic compounds[18]. Among the studied clays, expandable layered silicates
E-mail address: [email protected] (A. Gurses). (e.g., montmorillonite) as adsorbents have received considerable
304-3894/$ – see front matter © 2005 Elsevier B.V. All rights reserved.oi:10.1016/j.jhazmat.2005.09.036

218 A. Gurses et al. / Journal of Hazardous Materials B131 (2006) 217–228
Nomenclature
C0 initial concentrationD pore diffusion coefficienth initial adsorption rateki intraparticle diffusion rate constantk1 rate constant for first-order modelk2 rate constant for second-order modelqe adsorbed amount at equilibriumqt adsorbed amount at t timer0 average mean size of adsorbentt timet1/2 half-time for adsorptionms sorbent dosage
recognition. An important property of the clays is that the lay-ers are negatively charged and this negative charge is normallybalanced by hydrated cations placed in the interlayer spaces.Cationic dyes, like those used in this work, can be attractedtoward the anionic layers and are, therefore, quite suitable forinvestigating the properties of these minerals in aqueous suspen-sions [19]. In this respect the interaction between clay mineralsand methylene blue (MB), a monovalent organic dye, has beenextensively studied [20–26].
Rytwo et al. [27] have suggested the three different modelsfor the adsorption of organic cations onto sepiolite surface:
(i) A neutral complex may form by the electrostatically bind-ing of a cation to a monovalent negative site on the clayblock.
(ii) A second organic cation may bind to a neutral clay–organiccomplex by non-coulombic interactions, forming a sin-gle positively charged complex with two organic cationsand one charged site. This type of binding arises fromhydrophobic interactions between large organic molecules,and may lead at high loads to charge reversal.
(iii) A monovalently charged complex may form by the bindingof one organic cation and a neutral site.
Cationic dye molecules also have very high affinity for claysssretticprcsit
The study of sorption kinetics in wastewater treatment issignificant as it provides valuable insights into the reaction path-ways and into the mechanism of sorption reactions. In addition,the kinetics describes the solute uptake rate that in turn con-trols the residence time of sorbate uptake at the solid–solutioninterface. Therefore, it is important to be able to predict the rateat which pollutant is removed from aqueous solutions in orderto design appropriate sorption treatment plants. The aim of thepresent work is to investigate both the adsorption mechanismand adsorption kinetics of a cationic dye, methylene blue, ontoclay from aqueous solution with respect to the initial dye con-centration, temperature, pH, mixing rate and sorbent dosage.
2. Materials and methods
2.1. Sampling
Clay samples used in this study were mineralogicallymixed dominated by montmorillonite and nontronite fromErzurum region, in Turkey. The sample was air dried thensieved to give −180 + 450 �m sizes fraction using ASTM,Standard sieves. The sample was collected and stored in ajam. Chemical composition of the clay sample was determinedby X-ray spectroscopy. The results are given in Table 1. Thecation exchange capacity (CEC) of clay was determined bythe ammonium acetate method [30]. Cation exchange capacity(wmCa
2
pA4
2
m
TC
C
SAFC
urfaces and are readily adsorbed when added to clay suspen-ions. Therefore, these dyes were used as probes to determineeveral properties of the clay surfaces and the interlayer envi-onments, like particle morphology, degree of dispersion, thextent and location of the layer charge, among others. Many ofhe aggregation and adsorption properties of clays can be relatedo the layer charge density [28]. Bujdak and Komadel [29] stud-ed the interaction between modified clays with different layerharges and the cationic dye methylene blue in aqueous sus-ension. The authors concluded that the strong aggregation andedistribution of the molecules in the clays with higher layerharge was due to the proximity of the negative sites in the clayurfaces and the different coverage of the clay surfaces, suggest-ng that the dye is adsorbed initially only on a small fraction ofhe clay particles, followed by a redistribution as time passes.
CEC) is 34.4 mequiv./100 g. All chemicals used in this studyere obtained from Merck. As adsorbate, a cationic dye,ethylene blue (MB) was chosen. MB is a basic blue dyestuff,I Classification Number 52015. The formula is C16H18N3SClnd the structure is
.2. BET surface area and porosity measurements
BET surface area and porosity measurements of clay sam-le were determined by Micrometrics FlowSorb II-2300 andutopore II 9220 Hg Porosimeter (maximum Hg pressure0,000 psi), respectively. The results were given in Table 2.
.3. Effect of initial concentration
A 0.1 g sample of clay was added to each 100 mL volume ofethylene blue solution. The initial concentrations of dye solu-
able 1hemical composition of clay sample
onstituent Percentage present
iO2 46.3l2O3 23.7e2O3 21.6aO 8.4

A. Gurses et al. / Journal of Hazardous Materials B131 (2006) 217–228 219
Table 2BET surface area and porosity of clay sample
BET surface area (m2/g) 30.0Average pore diameter (�m) 0.0342Total pore surface area (m2/g) 28.91
tion tested were 10, 20, 30, 40, 50, 60, 70, 80, 90, and 100 mg/Land the experiments were carried out at 20 ◦C in a constant tem-perature shaker bath.
2.4. Effect of temperature
A 0.1 g sample of clay was added to each 100 mL volume ofmethylene blue aqueous solution having an initial concentration100 mg/L. The experiments were carried out at 20, 40, and 60 ◦Cin a constant temperature shaker bath which controlled the tem-perature to within ±1 ◦C for various sorption times, in 15, 30,60, and 120 min.
2.5. Effect of initial pH
Effect of initial pH was investigated at various pH, which are1, 3, 5, 7, 9, and 11. In the experiments, a 0.1 g sample of claywas added to each 100 mL volume of methylene blue aqueoussolution having an initial concentration 100 mg/L for a constantsorption time, 1 h.
2.6. Effect of mixing rate
A 0.1 g sample of clay was added to each 100 mL volumeof methylene blue aqueous solution having an initial concen-trmb
2
f1s
ta
2
0wscaqλ
calculated from the concentrations in solution before and afteradsorption.
2.9. Adsorption kinetics
2.9.1. Pseudo-first-order modelIn order to investigate the mechanism of adsorption, the
pseudo-first-order kinetics model, the pseudo-second-orderkinetics model and the intraparticle diffusion model were used totest dynamical experimental data. The pseudo-first-order modelwas presented by Lagergren [31]. The Lagergren’s first-orderreaction model is expressed as follows by Yalcın et al. [32]:
dqt
dt= k1(qe − qt) (1)
where qe and qt are the amounts of dye (mg/g) adsorbed onthe clay at equilibrium, and at time t, respectively and k1 is therate constant (min−1). Integrating and applying the boundarycondition, t = 0 and qt = 0 to t = t and qe = qt Eq. (1) takes theform:
log(qe − qt) = log qe − k1
2.303t (2)
The rate constant, k1 was obtained from slope of the linear plotsof log(qe − qt) against t. For various initial dye concentrationskT
2
s
w(a
q
w
I
h
t
q
a
ration of 100 mg/L for investigation of the effect of mixingate at various stirring rate (90, 120, and 200 rpm). The experi-ents were carried out at 20 ◦C in a constant temperature shaker
ath.
.7. Zeta potential and conductivity measurements
Zeta potentials of solid particles in clay/water suspensionsrom the experiments at different initial pHs (1, 3, 5, 7, 9, and1) were measured by using Zeta Meter 3.0+ for a constantorption time, 60 min.
Conductivity measurements by using Karl Kolb conductome-er were determined after adsorption under the same conditionss zeta potential measurements.
.8. Adsorption experiments
In adsorption experiments, the stirring speed of 90 rpm, a.1 g of clay sample, methylene blue concentration of 100 mg/Las kept constant. At the end of each adsorption period, the
upernatant was centrifuged for 2 min at 3750 min−1. The con-entration of methylene blue remaining in the supernatant afternd before adsorption was determined with a 1.0 cm light pathuartz cells using spectrophotometer (Shimadzu UV1201) atmax of 666 nm. The adsorbed amount of methylene blue was
1 obtained for adsorption over the first 120 min are given inable 4 along with the corresponding correlation coefficients.
.9.2. Pseudo-second-order modelThe sorption data was also analyzed in terms of pseudo-
econd-order mechanism, described by [33–37]
dqt
dt= k2(qe − qt)
2 (3)
here k2 is the rate constant of pseudo-second-order sorptiong/mg min). Integrating and applying boundary conditions t = 0nd qt = 0 to t = t and qe = qt Eq. (3) becomes
t = t1
k2q2e
+ tqe
(4)
hich has linear form of
t
qt
= 1
k2q2e
+ 1
qet (5)
f initial adsorption rate [38] is
= k2q2e (6)
hen Eqs. (4) and (5) become
t = t1h
+ tqe
(7)
nd
t
qt
= 1
h+ 1
qet (8)

220 A. Gurses et al. / Journal of Hazardous Materials B131 (2006) 217–228
If second-order kinetics is applicable, the plot of t/qt against t ofEq. (8) should give a linear relationship from which the constantsqeh and k2 can be determined.
The values of constants qeh and k2 for pseudo-second-ordersorption have also been given in Table 4.
2.9.3. Intraparticle diffusion modelIntraparticle diffusion can be described by three consecutive
steps [39]:
(i) The transport of sorbate from bulk solution to outer surfaceof the sorbent by molecular diffusion, known as external(or) film diffusion.
(ii) Internal diffusion, the transport of sorbate from the particlessurface into interior sites.
(iii) The sorption of the solute particles from the active sitesinto the interior surface of the pores.
The overall rate of the sorption process will be controlled bythe slowest, the rate limiting step. The nature of the rate-limitingstep in a batch system can be determined from the properties ofthe solute and sorbent. In adsorption systems where there isthe possibility of intraparticle diffusion being the rate-limitingstep, the intraparticle diffusion approach described by Weber andMorris [40] is used. The rate constants, for intraparticle diffusion([
q
w(atccttaalw[
3
3
tadtsnTw
Fig. 1. The variation of the amount adsorbed vs. equilibrium concentration atvarious temperatures.
However, the isotherm shape for 60 ◦C in which there is a plateauin the range of concentration of 10–30 mg/L is different from theothers. The adsorption isotherm for a cationic dye such as MBonto clay having a negatively charged surface is expected as S-shaped. However, it has been suggested [44] that an absence ofS-shaped behavior at the lowest temperature may be due to thecompetition of dye molecules with water molecules in the inter-lamellar spaces because it is well known that the adsorption ofwater molecules on a solid is higher at lower temperatures [44].Therefore, it can be said that the higher uptake of MB at lowertemperature requires the intensive electrostatically interactionsbetween the dye molecules and the active sites on the clay, com-paring to dipole–dipole interactions between water moleculesand the active sites on the clay. Thus, the high charged trim-mers (MB+)3 of MB stabilized at lower temperature may beresponsible from the intensive interactions with the active siteson the clay through ion-pairing mechanism. The increase of theadsorption temperature could cause to the increasing of effec-tiveness of the interactions between the hydrophobic parts of MBand/or changing of swelling properties of clay. The isotherm for60 ◦C may indicate that the monomeric form becomes domi-nant with increasing of the adsorption temperature and so theadsorption processes thorough ion pairing mechanism follow-ing ion exchange mechanism. In addition, the rapidly increasein the adsorption efficiency after the formation of plateau at60 ◦C may be attributed to the agglomeration of MB at the rel-aamcsla
ca4
ki) are determined using equation given by Weber and Morris40]. This equation can be described as [41–43]
t = kit0.5 + c (9)
here ki and c are the intraparticle diffusion rate constantmg/g min1/2) under different initial concentration of dye andconstant, respectively. The ki is the slope of straight-line por-
ions of plot of qt versus t0.5. The values of constants, ki and, for intraparticle diffusion kinetics and pore diffusion coeffi-ients have been given in Table 4. These plots have generallyhe double nature, i.e. initial curve portions and final linear por-ions. It is explained by the fact that the initial curved portionsre boundary layer diffusion effects. The final linear portions areresult of intraparticle diffusion effects. An extrapolation of the
inear portions of the plots back to the axis yield intercepts (c)hich are proportional to the extent of boundary layer thickness
17].
. Results and discussion
.1. Adsorption Isotherm
The adsorption of MB onto the clay was studied for threeemperatures (20, 40, and 60 ◦C) at different times (15, 30, 60,nd 120 min), at a constant stirring speed of 90 rpm, and initialye concentration of 100 mg/L. The adsorption isotherms forhree temperatures (20, 40, and 60 ◦C) are given in Fig. 1. Aseen from this figure, both adsorption efficiency and effective-ess of MB decreased with increasing adsorption temperature.he adsorption at the all temperatures studied usually completedhen the surface of clay is covered with a monolayer of MB.
tively higher concentrations. It has been suggested that MBgglomeration and protonation were found to be sensitive toany factors, such as the dye load rate, surface properties of the
lay, exchangeable cations, pH, and the age of MB-clay suspen-ion. The greatest extent of agglomeration occurs at high dyeoadings, while monomers and protonated cations predominatet low loadings [29,19].
In our previous work [45], in which the adsorption data washecked to fitting many adsorption models for the same claynd dye samples at 20, 40, and 60 ◦C, a high fit at 20 and0 ◦C and a relatively low fit at 60 ◦C for Langmuir adsorp-
A. Gurses et al. / Journal of Hazardous Materials B131 (2006) 217–228 221
Table 3Materials used as adsorbents for methylene blue
Adsorbent Capacity (mg/g) Reference
Wood 84 [47]Cotton waste 24 [47]Bentonite 150 [47]Chrome sludge 0.51 [48]Activated olive stones with 40 wt.% ZnCl2
at 873 K16.1 [49]
Activated olive stones with 40 wt.% ZnCl2at 873 K in a nitrogen atmosphere
22.1
Activated furniture (850 ◦C) 200.0 [50]Activated sewage char (800 ◦C) 120.0Activated tyres (850 ◦C) 130.0Pyrolysed furniture 80.0Fly ash 1.3 [51]Zeolite 12.7Amorphous silica 26.5Banana peel 20.8 [52]Orange peel 18.6Pure kaolin 15.55 [13]NaOH-treated pure kaolin 20.49Calcined pure kaolin 8.88Activated tyre char 227.0 [53]Clay 58.2 Present workRaw date pits 80.3 [55]Activated date pits (500 ◦C) 12.9Activated date pits (900 ◦C) 17.3
tion model was found but not for Freundlich adsorption model.This also indicates that the adsorption of MB onto clay com-plete with the saturation of surface. In contrast to the adsorptionisotherms for 20 and 40 ◦C are typically of Langmuir type, the S-shaped isotherm for 60 ◦C implies to lateral interactions betweenadsorbed species onto clay surface and/or changing agglomera-tion characteristics [46].
The maximum adsorption capacities of methylene blue forthe adsorbent used in this study along with that of other adsor-bents are presented in Table 3. Although the adsorption capacityof clay for methylene blue was low; it was much higher than thatof other potential adsorbents such as cotton waste, orange andbanana peel, activated olive stones and kaolin (raw and treated).According to the results obtained, clay could be employed aslow-cost adsorbents and could be considered as an alternative tocommercial activated carbons for the removal of color. Becauseof the low adsorption capacity of the activated forms of clay theywere not used further.
3.2. Effect of initial dye concentration
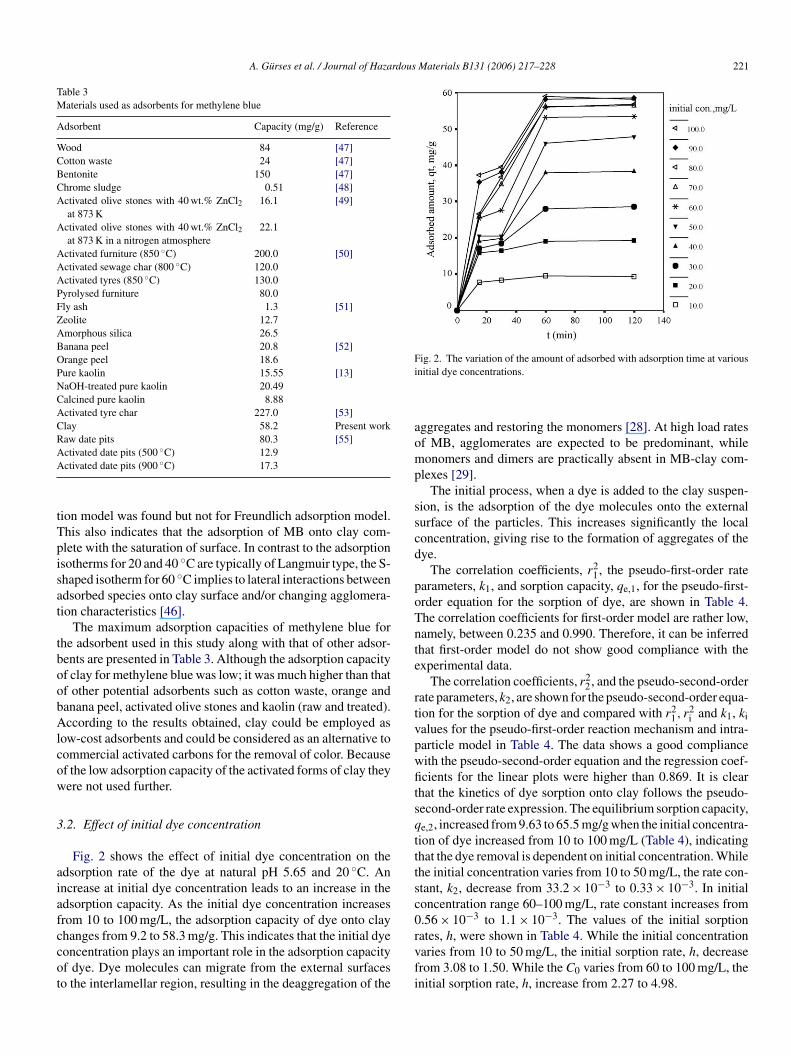
Fig. 2 shows the effect of initial dye concentration on theadsorption rate of the dye at natural pH 5.65 and 20 ◦C. Anincrease at initial dye concentration leads to an increase in theadsorption capacity. As the initial dye concentration increasesfccot
Fig. 2. The variation of the amount of adsorbed with adsorption time at variousinitial dye concentrations.
aggregates and restoring the monomers [28]. At high load ratesof MB, agglomerates are expected to be predominant, whilemonomers and dimers are practically absent in MB-clay com-plexes [29].
The initial process, when a dye is added to the clay suspen-sion, is the adsorption of the dye molecules onto the externalsurface of the particles. This increases significantly the localconcentration, giving rise to the formation of aggregates of thedye.
The correlation coefficients, r21, the pseudo-first-order rate
parameters, k1, and sorption capacity, qe,1, for the pseudo-first-order equation for the sorption of dye, are shown in Table 4.The correlation coefficients for first-order model are rather low,namely, between 0.235 and 0.990. Therefore, it can be inferredthat first-order model do not show good compliance with theexperimental data.
The correlation coefficients, r22, and the pseudo-second-order
rate parameters, k2, are shown for the pseudo-second-order equa-tion for the sorption of dye and compared with r2
1, r2i and k1, ki
values for the pseudo-first-order reaction mechanism and intra-particle model in Table 4. The data shows a good compliancewith the pseudo-second-order equation and the regression coef-ficients for the linear plots were higher than 0.869. It is clearthat the kinetics of dye sorption onto clay follows the pseudo-second-order rate expression. The equilibrium sorption capacity,q , increased from 9.63 to 65.5 mg/g when the initial concentra-tttsc0rvfi
rom 10 to 100 mg/L, the adsorption capacity of dye onto clayhanges from 9.2 to 58.3 mg/g. This indicates that the initial dyeoncentration plays an important role in the adsorption capacityf dye. Dye molecules can migrate from the external surfaceso the interlamellar region, resulting in the deaggregation of the
e,2ion of dye increased from 10 to 100 mg/L (Table 4), indicatinghat the dye removal is dependent on initial concentration. Whilehe initial concentration varies from 10 to 50 mg/L, the rate con-tant, k2, decrease from 33.2 × 10⁻³ to 0.33 × 10⁻³. In initialoncentration range 60–100 mg/L, rate constant increases from.56 × 10−3 to 1.1 × 10⁻³. The values of the initial sorptionates, h, were shown in Table 4. While the initial concentrationaries from 10 to 50 mg/L, the initial sorption rate, h, decreaserom 3.08 to 1.50. While the C0 varies from 60 to 100 mg/L, thenitial sorption rate, h, increase from 2.27 to 4.98.
222 A. Gurses et al. / Journal of Hazardous Materials B131 (2006) 217–228
Tabl
e4
Para
met
ers
for
effe
ctof
initi
alco
ncen
trat
ion
for
met
hyle
nebl
ue
Initi
aldy
eco
ncen
trat
ion,
C0
(mg/
L)
Pseu
do-fi
rst-
orde
rm
odel
Pseu
do-s
econ
d-or
der
mod
elIn
trap
artic
ledi
ffus
ion
q e,1
,pre
.r2 1
k 1(×
10−3
min
−1)
q e,2
,pre
.
(mg/
g)k 2
(×10
−3g/
mg
min
)h
(mg/
gm
in)
r2 2R
ate
cons
tant
,ki
(mg/
gm
in1/
2)
r2 iIn
terc
epts
,c(f
rom
Eq.
(9))
t 1/2
(fro
mE
q.(9
))D
(×10
−6cm
2s−
1)
1028
.80.
703
5.02
9.63
33.2
3.08
0.99
80.
767
0.99
75.
763.
03.
1520
21.4
0.69
05.
9620
.011
.04.
390.
999
1.19
80.
943
12.4
4.6
2.05
3019
.10.
235
0.61
33.3
1.80
2.00
0.98
61.
215
0.91
34.
3518
.50.
5140
20.4
0.64
03.
8050
.00.
671.
680.
942
1.13
80.
854
−3.2
437
.10.
2550
19.5
0.87
05.
4167
.10.
331.
500.
869
0.74
10.
830
−10.
360
.00.
1660
13.5
0.84
09.
6364
.00.
562.
270.
940
1.96
20.
880
−7.1
830
.20.
3170
9.62
0.81
015
.50
69.5
0.60
2.88
0.97
72.
519
0.97
9−6
.05
23.9
0.39
807.
980.
713
15.9
360
.00.
653.
100.
985
3.11
70.
994
−3.6
219
.20.
4990
3.32
0.99
028
.84
64.8
1.0
4.37
0.98
44.
677
0.90
88.
9910
.70.
8810
01.
730.
915
36.4
265
.51.
14.
980.
986
5.91
60.
891
12.4
8.6
1.1
The corresponding linear plots of the values of qe,2, k2 and hagainst C0 were regressed to obtain expressions for these valuesin terms of the initial dye concentration with high correlationcoefficients (Table 4). Therefore, it is further considered thatqe,2, k2 and h can be expressed as a function of C0 for dye asfollows:
k = C0
5 × 10²C0 − 5 × 10³ , r2 = 0.925 (10)
qe = 1.62C0 − 9.6 × 10⁻³C20, r2 = 0.991 (11)
h = 0.21C0 − 5.1 × 10⁻³C0 + 5 × 10⁻⁵C20, r2 = 0.910
(12)
Substituting the values of qe,2 and h from Table 4 into Eq. (7),the relationship of qt, C0 and t can be represented as follows:
qt = t1
0.21C0−5.1×10⁻³C0+5×10⁻⁵C20
+ t
1.62C0−9.6×10⁻³C20
(13)
Eq. (13) can be used to derive the amount of dye sorbed ontoclay at any given initial dye concentration and contact time, atthe pH of 5.65 and within amount of sorbent, 0.10 g.
As seen from Table 4, the equilibrium sorption capacities andcorrelation coefficients for second-order model are much morereasonable when compared with experimental results than thatodtoelmmatlttsscsBvwspamc
3
wpfi
f the first-order model. Since most of the first-order qe,1 valueseviate significantly from the experimental values, it suggestshat the sorption of dye onto clay follows the pseudo-second-rder model. Further, there was very minor deviation betweenxpected and observed qe,2 (amount of dye adsorbed at equi-ibrium, mg/g) values. It can be said that more than one-step
ay be involved in sorption process. In addition, for first-orderodel the intercept of the straight line plots of log(qe,1 − qt)
gainst t should be equal to log qe. If this not the case, it suggestshat the sorption would not be a first-order reaction even if theinearized plots have higher correlation coefficients than otherwo mechanisms. From Table 4, this suggests that dye adsorp-ion does not follow a first-order kinetic mechanism. Becauseecond-order model assumes the rate-limiting step may be theorption in agreement with chemical sorption being the rate-ontrolling step, which may involve valence forces throughharing or exchange of electrons between dye and adsorbent.ujdak and Komadel [29] reports that the cations are adsorbedia ion exchange, frequently accompanied by agglomeration,here micelles consisting of three or more cations at the clay
urface orient via �–� interaction on both sides of the molecularlane with two neighboring cations. Also, this situation shows inqueous medium, the role of the exchangeable alkali and otheretal cations on the surface and in the interlayer region of the
lay.
.2.1. Intraparticle diffusion modelThe sorption kinetic data were further processed to determine
hether intraparticle diffusion is rate limiting and to find ratearameter for intraparticle diffusion (ki). The correlation coef-cients of the intraparticle diffusion model are given in Table 4
A. Gurses et al. / Journal of Hazardous Materials B131 (2006) 217–228 223
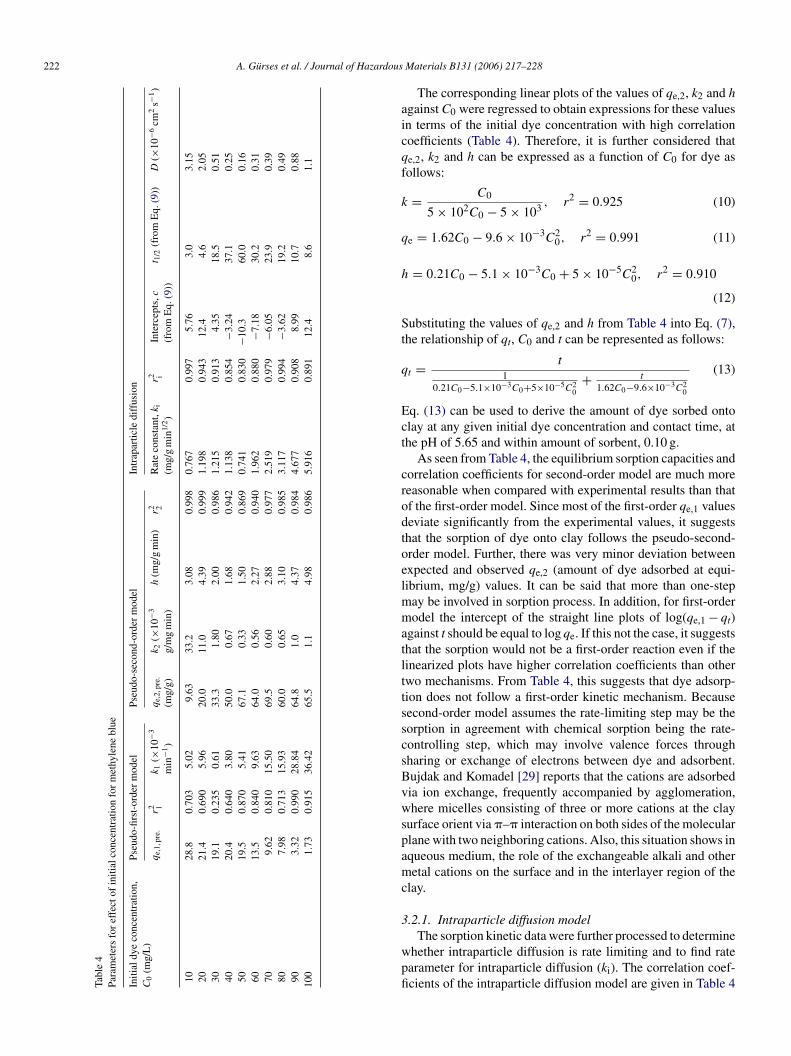
Fig. 3. Effect of temperature on the adsorption of methylene blue onto clay.
for the different initial concentrations and although all high(>0.830), they are significantly lower than that of the second-order kinetic model. This suggests that the pseudo-second-orderadsorption mechanism is predominant and that the overall rateof the dye adsorption process appears to be controlled by themore than one-step [34,35].
3.3. Effect of temperature
Fig. 3 shows the effect of temperature on adsorption ofdye onto clay at pH 5.65 at dye concentration 100 mg/L. Theincrease in temperature (from 20 to 40 ◦C) leads to a decreasein dye uptake, but when the temperature varies from 40 to60 ◦C, the uptake increases. After the equilibrium, the decreasein dye uptake in the temperature interval, 20–40 ◦C, indicatesthe exothermic nature of adsorption (see Table 6 for isostericadsorption enthalpy value) [54]. However, a slight increase indye uptake in temperature interval, 40–60 ◦C, shows endother-mic adsorption process.
Table 5 lists the results of rate constant studies for differ-ent temperatures calculated by the three models. From Table 5depicts that the pseudo-second-order adsorption model for theadsorption of dye onto clay and the correlation coefficients (r2)indicate that the dye sorption onto clay does not follow pseudo-first-order kinetic model for 20 ◦C. The correlation coefficients( 2
hpms2tf2riitc Ta
ble
5Pa
ram
eter
sfo
ref
fect
ofte
mpe
ratu
refo
rm
ethy
lene
blue
Tem
pera
ture
(◦C
)Ps
eudo
-firs
t-or
der
mod
elPs
eudo
-sec
ond-
orde
rm
odel
Intr
apar
ticle
diff
usio
n
q e,1
,pre
.r2 1
k 1(m
in−1
)q e
,2,p
re.(m
g/g)
k 2(g
/mg
min
)h
(mg/
gm
in)
r2 2R
ate
cons
tant
,ki
(mg/
gm
in1/
2)
r2 iIn
terc
epts
,c(f
rom
Eq.
(9))
t 1/2
(fro
mE
q.(1
0))
2027
.50.
793
0.04
6966
.23
0.00
103
4.52
0.99
96.
100.
944
9.50
9.7
4038
.90.
990
0.05
5544
.02
0.00
202
3.88
0.99
92.
800.
997
14.3
4.6
6033
.90.
993
0.04
7444
.05
0.00
263
5.10
0.98
92.
740.
987
18.0
3.8
200.
050.
922
57.6
400.
620.
922
31.2
600.
340.
922
37.0
r ) for the pseudo-second-order adsorption model (see Table 5)ave the highest values (>0.989), suggesting the dye adsorptionrocess is predominant by the pseudo-second-order adsorptionechanism. For the pseudo-second-order model, the rate con-
tant increases significantly with increasing of temperature from0 to 60 ◦C. The initial adsorption rate firstly decreases from 4.52o 3.88 mg/g min with increasing temperature and then increasesrom 3.88 to 5.10 mg/g min. In Table 5, the rate constant at0, 40 and 60 ◦C are 0.00103, 0.00202 and 0.00263 g/mg min,espectively. While temperature increases from 20 to 40 ◦C, thencrease in rate constant is nearly twice time of the increasen temperature interval 40–60 ◦C. The change of the adsorp-ion capacity is not influenced with increasing temperature. Thehange in adsorption capacity with increasing temperature can

224 A. Gurses et al. / Journal of Hazardous Materials B131 (2006) 217–228
Table 6Activation energy and isosteric adsorption enthalpy values for adsorption of dyeonto clay
Temperature interval (◦C) Activation energy,Ea (kJ/mol)
(�Hads)y (kJ/mol)
20–40 25.6 −7.9940–60 11.4
be attributed to the exothermic nature of process. The adsorptioncapacity decreases with increasing temperature indicates that theadsorption process occurs through physical interactions.
As seen from Table 5, the equilibrium sorption capacities andcorrelation coefficients for second-order model are much morereasonable when compared with experimental results than thatof the first-order system. Since the first-order qe,1 values devi-ate significantly from the experimental values, it suggests thatthe sorption of dye onto clay follows the pseudo-second-ordermodel. It can be said that more than one-step may be involvedin sorption process. In addition, this suggests that the adsorptionof dye does not follow a first-order kinetic mechanism.
Changing temperature from 20 to 40 ◦C, an increase in theamount adsorbed suggests that sorption process has an endother-mic character. While temperature varies from 40 to 60 ◦C, theuptake decreases indicating that an exothermic process controlsthe adsorption of dye. Ea values for the two distinct temperatureinterval are given in Table 6. Although, the values of activationenergy implies to a chemical sorption process, it can be said thatthe predominant adsorption mechanism is physical, consideringthe value for the isosteric sorption enthalpy (−7.99 kJ/mol).
3.3.1. Intraparticle diffusion modelFor the sorption of dye, the correlation coefficients of the
intraparticle diffusion model are given in Table 5 for the dif-ferent temperatures. Although all high (>0.922), they are lowerttiaeatthtbo
3
dwait6
Fig. 4. Effect of sorbent dosage on the adsorption of methylene blue onto clay.
centration provided more available adsorption sites for MB andthus increased the extent of MB removal [55]. The fit to the var-ious kinetics models of data and the parameters calculated bymodel are given in Table 7.
The correlation coefficients, r21, the first-order rate param-
eters, k1, and sorption capacity, qe,1 for the pseudo-first-orderequation for the sorption of dye are shown in Table 7. The corre-lation coefficients for first-order model are low, namely, between0.939 and 0.977. Therefore, it can be inferred that first-ordermodel do not show good compliance with experimental data.The correlation coefficients, r2, the pseudo-second-order rateconstant, k, and equilibrium sorption capacity, qe, were calcu-lated and presented in Table 7. It is evident that the kinetic of dyesorption on the clay follows a pseudo-second-order rate expres-sion, because correlation coefficient for second-order model ishigher than first-order model. With increasing sorbent dosage,both initial rate, h, and rate constant, k, increases. This implythat the number of active sites increase as parallel to increasingsorbent dosage. For the sorption of dye, the correlation coeffi-cients of the intraparticle diffusion model are given in Table 7for the different sorbent amount and although all high (>0.906),they are lower than those of for the second-order kinetic model.
The corresponding linear plots of the values of qe2, k2 andh against clay dose, ms, were regressed to obtain expressionsfor these values in terms of ms with high correlation coeffi-cients. Therefore, it is further considered that q , k and h canb
k
h
q
q
han that of for the second-order kinetic model. These suggesthat the pseudo-second-order adsorption mechanism is predom-nant and that the overall rate of the dye adsorption processppears to be controlled by the chemical reaction [34,35]. How-ver, the correlation coefficients for both intraparticle diffusionnd second-order kinetic models above 40 ◦C are high and closeo each other. At especially 60 ◦C the effectiveness of the adsorp-ion is extremely low, although the efficiency of adsorption atigher concentrations is higher. Therefore, it can also be said thathe overall rate of the dye adsorption process is controlled byoth diffusion of dye cations to interlayer spaces and the extentf interactions between dye cations and active sites on the clay.
.4. Effect of sorbent dosage
The effect of sorbent dosage on the adsorption rate of theye at natural pH 5.65 and 20 ◦C was investigated. The resultsere shown in Fig. 4. An increase in sorbent dosage leads to
n increase in the adsorption capacity. While sorbent dosagencreases from 0.10 to 0.30 g at adsorption time of 120 min,he adsorption capacity of dye onto clay changes from 57.1 to6.1 mg/g. Increasing the adsorbent dosage at a fixed MB con-
e2 2e expressed as a function of ms for dye as follows:
= 2.57 × 10⁻³ + 6.55 × 10⁻³ log ms, r2 = 0.999 (14)
= 13.2 + 3.8 log ms, r2 = 0.999 (15)
e = 75.4(ms)0.061, r2 = 0.995 (16)
t = t1
13.2+3.8 log ms+ t
75.4(ms)0.061
(17)

A. Gurses et al. / Journal of Hazardous Materials B131 (2006) 217–228 225
Tabl
e7
Para
met
ers
for
effe
ctof
sorb
entd
osag
efo
rm
ethy
lene
blue
Sorb
entd
osag
e(g
)Ps
eudo
-firs
t-or
der
mod
elPs
eudo
-sec
ond-
orde
rm
odel
Intr
apar
ticle
diff
usio
n
q e,1
,pre
.r2 1
k 1(m
in−1
)q e
,2,p
re.(m
g/g)
k 2(g
/mg
min
)h
(mg/
gm
in)
r2 2R
ate
cons
tant
,ki
(mg/
gm
in1/
2)
r2 iIn
terc
epts
,c(f
rom
Eq
(9))
t 1/2
(fro
mE
q.(1
0))
0.10
104.
270.
977
0.02
3065
.40.
0010
64.
520.
994
3.21
0.90
624
.74
11.6
0.20
104.
130.
939
0.02
2168
.50.
0015
17.
090.
998
2.72
0.92
135
.02
8.50
0.30
103.
800.
960
0.01
8769
.90.
0017
88.
700.
999
2.49
0.92
439
.75
7.26
Fig. 5. Effect of initial suspension pH on the adsorption of methylene blue ontoclay.
3.5. Effect of initial pH
The variation of adsorption of MB onto clay with adsorptiontime was investigated as a function of initial suspension pH.The data graphed in Fig. 5 did not reveal a good compliancewith any kinetics models studied for the other parameters. Thevariations of both the zeta potentials of particles and the amountadsorbed of the MB onto clay with initial pH were investigatedin the range of pH 1–11 and the results are given in Fig. 6. Thevariation of both the zeta potentials of particles and electricalconductivity values with initial pH were also presented in Fig. 7.The adsorption of dye from aqueous solution onto surface ofclay is highly dependent on pH of the solution that affects theboth surface properties and topography of the sorbent and dyestructure. The methylene blue adsorption showed a minimum atpH 3 and 7 while the maximum adsorption values of methyleneblue were obtained at pH 1 and 5.6 (in Fig. 6). Although the highuptake of MB at natural pH (5.6) is difficult to explain, it canbe said that the adsorptive characteristics of the clay below andabove the natural pH was changed, depending on the changing of
Fps
ig. 6. The variation of both the amount adsorbed and zeta potential with sus-ension pH. Adsorption temperature: 293 K, adsorption time: 60 min, stirringpeed: 90 rpm and Cint:100 mg/L.
226 A. Gurses et al. / Journal of Hazardous Materials B131 (2006) 217–228
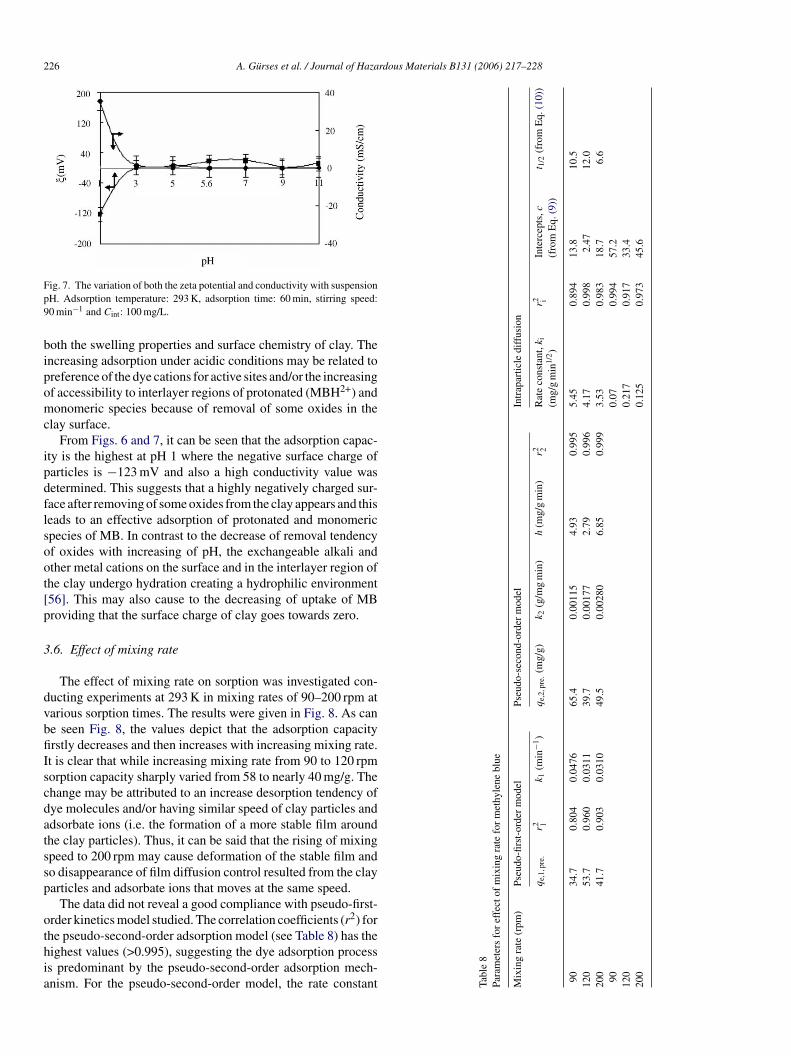
Fig. 7. The variation of both the zeta potential and conductivity with suspensionpH. Adsorption temperature: 293 K, adsorption time: 60 min, stirring speed:90 min−1 and Cint: 100 mg/L.
both the swelling properties and surface chemistry of clay. Theincreasing adsorption under acidic conditions may be related topreference of the dye cations for active sites and/or the increasingof accessibility to interlayer regions of protonated (MBH2+) andmonomeric species because of removal of some oxides in theclay surface.
From Figs. 6 and 7, it can be seen that the adsorption capac-ity is the highest at pH 1 where the negative surface charge ofparticles is −123 mV and also a high conductivity value wasdetermined. This suggests that a highly negatively charged sur-face after removing of some oxides from the clay appears and thisleads to an effective adsorption of protonated and monomericspecies of MB. In contrast to the decrease of removal tendencyof oxides with increasing of pH, the exchangeable alkali andother metal cations on the surface and in the interlayer region ofthe clay undergo hydration creating a hydrophilic environment[56]. This may also cause to the decreasing of uptake of MBproviding that the surface charge of clay goes towards zero.
3.6. Effect of mixing rate
The effect of mixing rate on sorption was investigated con-ducting experiments at 293 K in mixing rates of 90–200 rpm atvarious sorption times. The results were given in Fig. 8. As canbe seen Fig. 8, the values depict that the adsorption capacityfiIscdatssp
othia Ta
ble
8Pa
ram
eter
sfo
ref
fect
ofm
ixin
gra
tefo
rm
ethy
lene
blue
Mix
ing
rate
(rpm
)Ps
eudo
-firs
t-or
der
mod
elPs
eudo
-sec
ond-
orde
rm
odel
Intr
apar
ticle
diff
usio
n
q e,1
,pre
.r2 1
k 1(m
in−1
)q e
,2,p
re.(m
g/g)
k 2(g
/mg
min
)h
(mg/
gm
in)
r2 2R
ate
cons
tant
,ki
(mg/
gm
in1/
2)
r2 iIn
terc
epts
,c(f
rom
Eq.
(9))
t 1/2
(fro
mE
q.(1
0))
9034
.70.
804
0.04
7665
.40.
0011
54.
930.
995
5.45
0.89
413
.810
.512
053
.70.
960
0.03
1139
.70.
0017
72.
790.
996
4.17
0.99
82.
4712
.020
041
.70.
903
0.03
1049
.50.
0028
06.
850.
999
3.53
0.98
318
.76.
690
0.07
0.99
457
.212
00.
217
0.91
733
.420
00.
125
0.97
345
.6
rstly decreases and then increases with increasing mixing rate.t is clear that while increasing mixing rate from 90 to 120 rpmorption capacity sharply varied from 58 to nearly 40 mg/g. Thehange may be attributed to an increase desorption tendency ofye molecules and/or having similar speed of clay particles anddsorbate ions (i.e. the formation of a more stable film aroundhe clay particles). Thus, it can be said that the rising of mixingpeed to 200 rpm may cause deformation of the stable film ando disappearance of film diffusion control resulted from the clayarticles and adsorbate ions that moves at the same speed.
The data did not reveal a good compliance with pseudo-first-rder kinetics model studied. The correlation coefficients (r2) forhe pseudo-second-order adsorption model (see Table 8) has theighest values (>0.995), suggesting the dye adsorption processs predominant by the pseudo-second-order adsorption mech-nism. For the pseudo-second-order model, the rate constant

A. Gurses et al. / Journal of Hazardous Materials B131 (2006) 217–228 227
Fig. 8. Effect of mixing rate on the adsorption of methylene blue onto clay.
increases significantly with increasing of mixing rate from 90 to200 rpm. The initial adsorption rate firstly decrease from 4.93to 2.79 mg/g min with increasing mixing rate and then increasefrom 2.79 to 6.85 mg/g min. In Table 8, the rate constants at 90,120, and 200 rpm are 0.00115, 0.00177, and 0.00280 g/mg min,respectively. While mixing rate increases from 120 to 200 rpm,the increase in rate constant is nearly twice time of the increasein mixing rate interval 90–120 rpm. The correlation coefficientsof the intraparticle diffusion model are given in Table 8 for thedifferent mixing rate. The data are lower than those of for thepseudo-second-order kinetic model.
As seen from Table 8, the equilibrium sorption capacitiesand correlation coefficients for second-order model are muchmore reasonable when compared with experimental results thanthat of the first-order system and intraparticle diffusion kinetics.Since the first-order qe,1 values deviate significantly from theexperimental values, it suggests that the sorption of dye ontoclay follows the pseudo-second-order model. It can be said thatmore than one-step may be involved in sorption process. Thissuggests that the adsorption of dye does not follow a first-orderkinetic mechanism and intraparticle diffusion kinetic model.
4. Conclusions
Clay mineral crystals carry a charge arising from isomor-pabAccoo
efcs
second-order rate model and sorption can not been describedwith first-order model or intraparticle model. qe,2, k2 and h can beexpressed as a function of ms and C0 for dye. MB was adsorbedby clay in greater amounts than their CEC values. The sorptionmaxima of organic cations exceed the CEC of clay minerals,showing that besides the contribution of CEC, sorption takesplace on neutral sites and neutral complexes that are formedthrough sorption of an organic cation on a negative site. Mar-gulies et al. [20] showed that the clay particles moved to thenegative electrode if adsorption of the organic cations was inexcess of the CEC. Some researchers have discussed the sorp-tion of organic cations on a negatively charged site that is alreadyneutralized. Organic cation sorption on neutral sites and neutralcomplexes results in a charge reversal of the surfaces, which inturn alters the sorption characteristics, and colloid behavior ofthe clays [20,22].
References
[1] G. Bitton, Wastewater Microbiology, John Wiley & Sons, Inc., USA,1994, pp. 63–65.
[2] M. Sidat, H.C. Kasan, F. Bux, Laboratory-scale investigation of biologi-cal phosphate removal from municipal wastewater, Water SA 25 (1999)459–462.
[3] V.J.P. Poots, G. McKay, J.J. Healy, Removal of acid dye from effluentusing natural adsorbents. 1. Peat, Water Res. 10 (1976) 1061–1066.
[
[
[
[
[
[
[
[
hous substitutions of certain atoms in their structure for othertoms of a different valence. In the tetrahedral sheet, Si(IV) maye replaced by trivalent cations, or divalent cations may replacel(III) in the octahedral sheet. When this is the case, charge defi-
iency results and negative potential at the surface of the clay isreated. The negative potential is compensated by the adsorptionf cations on the surface. The total number of cations adsorbedn the clay is called the cation exchange capacity CEC [18].
In this study, it was found that the sorption tends to attain thequilibrium in nearly 60 min. The maximum removal capacityor initial dye concentration, 100 mg/L, was 58.2 mg/g. Also, aomparison of the kinetic models on the overall adsorption ratehowed that dye/clay system was best described by the pseudo-
[4] V.J.P. Poots, G. McKay, J.J. Healy, Removal of acid dye from effluentusing natural adsorbents. 2. Wood, Water Res. 10 (1976) 1067–1070.
[5] G. McKay, M.S. Otterburn, A.J. Aga, Fullers earth and fired clay asadsorbents for dyestuffs—equilibrium and rate studies, Water Air SoilPollut. 24 (1985) 307–322.
[6] M. Dogan, M. Alkan, Y. Onganer, Adsorption of methylene bluefrom aqueous solution onto perlite, Water Air Soil Pollut. 120 (2000)229–248.
[7] A. Gurses, M. Yalcın, C. Dogar, Investigation on settling velocitiesof aluminium hydroxide-dye flocs, Fresenous Environ. Bull. 12 (2003)16–23.
[8] M. Pollock, Neutralizing dyehouse wastes with flue gases and decol-orizing with fly ash, Am. Dyestuff Rep. 62 (1973) 21–23.
[9] I. Arvanitoyannis, I. Eleftheriadis, E. Kavlentis, Treatment of dye-containing effluents with different bentonites, Chemosphere 16 (1987)2523–2529.
10] I. Arvanitoyannis, I. Eleftheriadis, E. Tsatsaroni, Influence of pH onadsorption of dye-containing effluents with different bentonites, Chemo-sphere 18 (1989) 1707–1711.
11] N. Nyholm, B.N. Jacobsen, B.M. Pederson, O. Poulsen, A. Damborg,B. Schultz, Removal of organic micropollutants at ppb levelsin laboratory activated-sludge reactors under various operating-conditions—biodegradation, Water Res. 26 (1992) 339–353.
12] P. Mavros, A.C. Daniilidou, N.K. Lazaridis, L. Stergiou, Color removalfrom aqueous-solutions. 1. Flotation, Environ. Technol. 15 (1994)601–616.
13] D. Ghosh, K.G. Bhattacharyya, Adsorption of methylene blue on kaoli-nite, Appl. Clay Sci. 20 (2002) 295–300.
14] A. Gurses, M. Yalcın, C. Dogar, Electrocoagulation of some reactivedyes: a statistical investigation of some electrochemical variables, WasteManage. 22 (2002) 491–499.
15] B. Chen, C.W. Hui, G. McKay, Pore-surface diffusion modeling for dyesfrom effluent on pith, Langmuir 17 (2001) 740–748.
16] R.S. Juang, F.C. Wu, R.L. Tseng, The ability of activated clay for theadsorption of dyes from aqueous solutions, Environ. Technol. 18 (1997)525–531.
17] L. Markovska, V. Meshko, V. Noveski, M. Marinovski, Solid diffusioncontrol of the adsorption of basic dyes onto granular activated carbon

228 A. Gurses et al. / Journal of Hazardous Materials B131 (2006) 217–228
and natural zeolite in fixed bed columns, J. Serbian Chem. Soc. 66(2001) 463–475.
[18] C. Bilgic, Investigation of the factors affecting organic cation adsorptionon some silicate minerals, J. Colloid Interf. Sci. 281 (2005) 33–38.
[19] A.P.P. Cione, M.G. Neumann, F. Gessner, Time-dependent spectropho-tometric study of the interaction of basic dyes with clays. III. Mixeddye aggregates on SWy-1 and laponite, J. Colloid Interf. Sci. 198 (1998)106–112.
[20] L. Margulies, H. Rozen, S. Nir, Model for competitive adsorption oforganic cations on clays, Clays Clay Miner. 36 (1988) 270–276.
[21] G. Rytwo, C. Serban, S. Nir, L. Margulies, Use of methylene blue andcrystal violet for determination of exchangeable cations in montmoril-lonite, Clays Clay Miner. 39 (1991) 551–555.
[22] G. Rytwo, S. Nir, L. Margulies, Interactions of monovalent organiccations with montmorillonite-adsorption studies and model-calculations,Soil Sci. Soc. Am. J. 59 (1995) 554–564.
[23] G. Rytwo, S. Nir, L. Margulies, B. Casal, J. Merino, E. Ruiz-Hitzky, J.M.Serratosa, Adsorption of monovalent organic cations on sepiolite: exper-imental results and model calculations, Clays Clay Miner. 46 (1998)340–348.
[24] R.A. Schoonheytdt, L. Heughebaert, Clay adsorbed dyes: methylene blueon laponite, Clay Miner. 27 (1992) 91–100.
[25] C. Breen, B. Rock, The competitive adsorption of methylene blue on tomontmorillonite from binary solution with thioflavin T, proflavine andacridine yellow. Steady-state and dynamic studies, Clay Miner. 29 (2)(1994) 179–189.
[26] Y.G. Mishael, G. Rytwo, S. Nir, M. Crespin, F. Annabi-Bergaya, H. VanDamme, Interactions of monovalent organic cations with pillared clays,J. Colloid Interf. Sci. 209 (1999) 123–129.
[27] G. Rytwo, D. Tropp, C. Serban, Adsorption of diquat, paraquat andmethyl green on sepiolite: experimental results and model calculations,
[
[
[
[
[
[
[
[
[
[37] F.C. Wu, R.L. Tseng, R.S. Juang, Adsorption of dyes and humic acidfrom water using chitosan-encapsulated activated carbon, J. Chem. Tech-nol. Biotechnol. 77 (2002) 1269–1279.
[38] R. Gundogan, B. Acemioglu, M.H. Alma, Copper (II) adsorption fromaqueous solution by herbaceous peat, J. Colloid Interf. Sci. 269 (2)(2004) 303–309.
[39] M. Ugurlu, A. Gurses, C. Dogar, M. Yalcın, Removal of phenolic andlignin compounds from bleached kraft mill effluent by fly ash and sepi-olite, Adsorption 11 (2005) 87–97.
[40] W.J. Weber, J.C. Morris, Kinetics of adsorption on carbon from solution,J. Sanit. Eng. Div. Am. Soc. Civ. Eng. 89 (1963) 31–60.
[41] C.K. Jain, M.K. Sharma, Adsorption of cadmium on bed sediments ofRiver Hindon: adsorption models and kinetics, Water Air Soil Pollut.137 (2002) 1–19.
[42] M. Basibuyuk, C.F. Forster, An examination of the adsorption charac-teristics of a basic dye (Maxilon Red Bl-N) on to live activated sludgesystem, Process Biochem. 38 (2003) 1311–1316.
[43] R. Sivaraj, C. Namasivayam, K. Kadirvelu, Orange peel as an adsorbentin the removal of acid Violet 17 (acid dye) from aqueous solutions,Waste Manage. 21 (2001) 105–110.
[44] G. Atun, G. Hisarli, W.S. Sheldrick, M. Muhler, Adsorptive removal ofmethylene blue from colored effluents on fuller’s earth, J. Colloid Interf.Sci. 261 (2003) 32–39.
[45] A. Gurses, S. Karaca, C. Dogar, R. Bayrak, M. Acıkyıldız, M. Yalcın,Determination of adsorptive properties of clay/water system: methyleneblue sorption, J. Colloid Interf. Sci. 269 (2) (2004) 310–314.
[46] M.J. Rosen, Surfactants and Interfacial Phenomena, 1st ed., John Wiley& Sons, Inc., New York, 1978.
[47] G. McKay, V. Poots, Kinetics and diffusion processes in color removalfrom effluent using wood, J. Chem. Technol. Biotechnol. 30 (1986)279–282.
[
[
[
[
[
[
[
[
[
Appl. Clay Sci. 20 (2002) 273–282.28] M.G. Neumann, F. Gessner, C.C. Schmitt, R. Sartori, Influence of the
layer charge and clay particle size on the interactions between thecationic dye methylene blue and clays in an aqueous suspension, J.Colloid Interf. Sci. 255 (2002) 254–259.
29] J. Bujdak, P. Komadel, Interaction of methylene blue with reducedcharge montmorillonite, J. Phys. Chem. B 101 (1997) 9065–9068.
30] J.D. Rhoades, Cation exchange capacity, in: Methods of Soil Analysis.Part 2. Chemical and Microbiological Properties, 2nd ed., AmericanSociety of Agronomy/Soil Science Society of America, Madison, WI,USA, 1982, pp. 149–157.
31] S. Lagergren, Zur theorie der sogenannten adsorption geloster stoffe.Kungliga Svenska Vetenskapsakademiens, Handlingar 24 (4) (1898)1–39.
32] M. Yalcın, A. Gurses, C. Dogar, M. Sozbilir, The adsorption kinetics ofcethyltrimethylammonium bromide (CTAB) onto powdered active car-bon, Adsorption 10 (2004) 339–348.
33] R.L. Tseng, F.C. Wu, R.S. Juang, Liquid-phase adsorption of dyesand phenols using pinewood-based activated carbons, Carbon 41 (2003)487–495.
34] Y.S. Ho, G. McKay, Sorption of dye from aqueous solution by peat,Chem. Eng. J. 70 (1998) 115–124.
35] Y.S. Ho, G. McKay, Sorption of dyes and copper ions onto biosorbents,Process Biochem. 38 (2003) 1047–1061.
36] Y.S. Ho, C.C. Chiang, Sorption studies of acid dye by mixed sorbents,Adsorption 7 (2001) 139–147.
48] C. Lee, K. Low, S. Chow, Chrome sludge as an adsorbent for colorremoval, Environ. Technol. 17 (9) (1996) 1023–1028.
49] M. Alaya, M. Hourieh, A. Youssef, F. El-Sejarah, Adsorption propertiesof activated carbons prepared from olive stones by chemical and physicalactivation, Adsorp. Sci. Technol. 18 (1) (1999) 27–42.
50] C. Sainz-Diaz, A. Griffiths, Activated carbon from solid wastes using apilot-scale batch flaming pyrolyser, Fuel 79 (2000) 1863–1871.
51] C. Woolard, J. Strong, C. Erasmus, Evaluation of the use of modi-fied coal ash as a potential sorbent for organic waste streams, Appl.Geochem. 17 (8) (2002) 1159–1164.
52] G. Annadurai, R. Juang, D. Lee, Use of cellulose-based wastes foradsorption of dyes from aqueous solutions, J. Hazard. Mater. 92 (3)(2002) 263–274.
53] Y. Lin, H. Teng, Mesoporous carbons from waste tire char and theirapplication in wastewater discoloration, Micropor. Mesopor. Mater. 54(2002) 167–174.
54] D. Mohan, K.P. Singh, G. Singh, K. Kumar, Removal of dyes fromwastewater using fly ash, a low-cost adsorbent, Ind. Eng. Chem. Res.41 (2002) 3688–3695.
55] F. Banat, S. Al-Asheh, L. Al-Makhadmeh, Evaluation of the use of rawand activated date pits as potential adsorbents for dye containing waters,Process Biochem. 39 (2003) 193–202.
56] M.A.M. Lawrence, R.K. Kukkadapu, S.A. Boyd, Adsorption of phenoland chlorinated phenols from aqueous solution by tetramethylammoniumand tetramethy-lphosphonium exchanged montmorillonite, Appl. ClaySci. 13 (1998) 13–20.
Copyright © 2022 FDOKUMEN