Cationic Microbubbles and Antibiotic-free miniplasmid for ...
33
HAL Id: hal-01656574 https://hal.archives-ouvertes.fr/hal-01656574 Submitted on 21 Jan 2018 HAL is a multi-disciplinary open access archive for the deposit and dissemination of sci- entific research documents, whether they are pub- lished or not. The documents may come from teaching and research institutions in France or abroad, or from public or private research centers. L’archive ouverte pluridisciplinaire HAL, est destinée au dépôt et à la diffusion de documents scientifiques de niveau recherche, publiés ou non, émanant des établissements d’enseignement et de recherche français ou étrangers, des laboratoires publics ou privés. Cationic microbubbles and antibiotic-free miniplasmid for sustained ultrasound–mediated transgene expression in liver Simona Manta, Gilles Renault, Anthony Delalande, Olivier Couture, Isabelle Lagoutte, Johanne Seguin, Franck Lager, Pascal Houzé, Patrick Midoux, Michel Bessodes, et al. To cite this version: Simona Manta, Gilles Renault, Anthony Delalande, Olivier Couture, Isabelle Lagoutte, et al.. Cationic microbubbles and antibiotic-free miniplasmid for sustained ultrasound–mediated trans- gene expression in liver. Journal of Controlled Release, Elsevier, 2017, 262, pp.170 - 181. 10.1016/j.jconrel.2017.07.015. hal-01656574
-
Upload
khangminh22 -
Category
Documents
-
view
3 -
download
0
Transcript of Cationic Microbubbles and Antibiotic-free miniplasmid for ...

HAL Id: hal-01656574https://hal.archives-ouvertes.fr/hal-01656574
Submitted on 21 Jan 2018
HAL is a multi-disciplinary open accessarchive for the deposit and dissemination of sci-entific research documents, whether they are pub-lished or not. The documents may come fromteaching and research institutions in France orabroad, or from public or private research centers.
L’archive ouverte pluridisciplinaire HAL, estdestinée au dépôt et à la diffusion de documentsscientifiques de niveau recherche, publiés ou non,émanant des établissements d’enseignement et derecherche français ou étrangers, des laboratoirespublics ou privés.
Cationic microbubbles and antibiotic-free miniplasmidfor sustained ultrasound–mediated transgene expression
in liverSimona Manta, Gilles Renault, Anthony Delalande, Olivier Couture, Isabelle
Lagoutte, Johanne Seguin, Franck Lager, Pascal Houzé, Patrick Midoux,Michel Bessodes, et al.
To cite this version:Simona Manta, Gilles Renault, Anthony Delalande, Olivier Couture, Isabelle Lagoutte, et al..Cationic microbubbles and antibiotic-free miniplasmid for sustained ultrasound–mediated trans-gene expression in liver. Journal of Controlled Release, Elsevier, 2017, 262, pp.170 - 181.�10.1016/j.jconrel.2017.07.015�. �hal-01656574�

Cationic Microbubbles and Antibiotic-free miniplasmid for sustained Ultrasound–mediated
Transgene Expression in Liver
Simona Mantaa, Gilles Renaultb, Anthony Delalandec, Olivier Coutured, Isabelle Lagoutteb, Johanne
Seguina, Franck Lagerb, Pascal Houzéa, Patrick Midouxc, Michel Bessodesa, Daniel Schermana,
Michel-Francis Bureaua, Corinne Mariea, Chantal Pichonc*§, Nathalie Migneta§
a CNRS, UTCBS UMR 8258, F-75006 Paris, France; Université Paris Descartes, Sorbonne-Paris-
Cité, UTCBS, F-75006 Paris, France; Chimie ParisTech, PSL Research University, Unité de
Technologies Chimiques et Biologiques pour la Santé (UTCBS), F-75005 Paris, France; INSERM,
UTCBS U 1022, F-75006 Paris, France
b INSERM, U1016, Institut Cochin, Paris, France; CNRS, UMR8104, Paris, France; Université Paris
Descartes, Sorbonne Paris Cité, France.
c Centre de Biophysique Moléculaire, UPR 4301, F-45071 Orléans, France.
d Institut Langevin - Ondes et Images ; ESPCI ParisTech, PSL Research University, CNRS
UMR7587, INSERM U979 ; 1, rue Jussieu, 75238 PARIS CEDEX 05, France
* Corresponding author:
Chantal Pichon: e-mail address [email protected]; Centre de Biophysique Moléculaire, UPR
4301, F-45071 Orléans, France.
§C.P and N.M have contributed equally to this work.
1

Abstract
Despite the increasing number of clinical trials in gene therapy, no ideal methods still allow non viral
gene transfer in deep tissues such as the liver. We were interested in ultrasound (US)-mediated gene
delivery to provide long term liver expression. For this purpose, new positively charged
microbubbles were designed and complexed with pFAR4, a highly efficient small length miniplasmid
DNA devoid of antibiotic resistance sequence. Sonoporation parameters, such as insonation time,
acoustic pressure and duration of plasmid injection were controlled under ultrasound imaging
guidance. The optimization of these various parameters was performed by bioluminescence optical
imaging of luciferase reporter gene expression in the liver. Mice were injected with 50 µg pFAR4-
LUC either alone, or complexed with positively charged microbubbles, or co-injected with neutral
MicroMarker™ microbubbles, followed by low ultrasound energy application to the liver. Injection
of the pFAR4 encoding luciferase alone led to a transient transgene expression that lasted only for
two days. The significant luciferase signal obtained with neutral microbubbles decreased over 2 days
and reached a plateau with a level around 1 log above the signal obtained with pFAR4 alone. With
the newly designed positively charged microbubbles, we obtained a much stronger bioluminescence
signal which increased over 2 days. The 12-fold difference (p < 0.05) between MicroMarker™ and
our positively charged microbubbles was maintained over a period of 6 months. Noteworthy, the
positively charged microbubbles led to an improvement of 180-fold (p<0.001) as regard to free
pDNA using unfocused ultrasound performed at clinically tolerated ultrasound amplitude. Transient
liver damage was observed when using the cationic microbubble-pFAR4 complexes and the
optimised sonoporation parameters. Immunohistochemistry analyses were performed to determine
the nature of cells transfected. The pFAR4 miniplasmid complexed with cationic microbubbles
allowed to transfect mostly hepatocytes compared to its co- injection with MicroMarker™ which
transfected more preferentially endothelial cells.
Keywords: Cationic microbubbles; Ultrasound imaging; Physical delivery; Liver gene delivery;
Image-guided delivery, transfection, miniplasmid.
2

1. Introduction
Due to its fundamental role in metabolism, liver has attracted a number of therapeutic strategies, in
particular gene therapy [1]. Various technologies have been applied such as viral or non-viral gene
delivery associated or not with physical methods, such as hydrodynamic or ultrasound mediated gene
delivery [2]. In terms of physical methods, ultrasound (US) advantageously allows to non- invasively
reach deep tissues, and therefore shows great interest in gene delivery [3,4].
Various studies have reported the efficacy of ultrasound-mediated microbubbles (MB) gene delivery.
The majority of the studies were obtained with therapeutic ultrasound operating at frequency between
1 to 3 MHz and various types of MB, made with gaseous liposomes or polymers [5,6]. In this
context, with microbubbles constituted of liposomal nanobubbles, the group of Tanyama has
described an efficient IL12 gene expression within tumours [5]. Long lasting gene expression (up to
100 days) was obtained following co- injection of plasmid DNA encoding luciferase gene (pDNA-
LUC) and MicroMarker™ MB either in tendons [7] or in the muscle [8]. In the liver, two main
studies have been published. The first study used the Optison™ ultrasound contrast agent which was
co-injected with pDNA directly inside mice liver followed by ultrasound exposure [9]. The second
study used a zwitterionic MB (a mix of DL-α-phosphatidylcholine, dipalmitolyl and DL-α-
phosphatidylethanolamine, dipalmitolyl) loaded with pDNA injected into the left ventricle of the
heart, followed by an ultrasound application in the liver area [10]. Significant expression of reporter
genes such as green fluorescent protein, luciferase, beta-galactosidase, or therapeutic genes such as
factor IX were observed in those two studies. The co- injection of Definity® MB with pDNA into a
rat liver lobe via a specific portal vein branch promoted as well an increased gene transfection using
high intensity ultrasound (1.1 MHz frequency, 20 cycles, 13.9 Hz of Pulse Repetition Frequency –
PRF-, 2.7 MPa peak negative acoustic pressure) [11].
It is clear pDNA complexation with MB could be of interest for systemic delivery as it would allow
both MB and pDNA to reach the targeted tissue at the same time. In addition, this complexation
could reduce plasmid degradation, and thereby improving gene transfer.
Several strategies have been proposed to anchor nucleic acids at a microbubble surface. Some groups
have exploited avidin-biotin linkage to couple nucleic acids complexed with cationic vectors
(liposomes or polymers) on microbubble surface [12,13]. Various reports have described the use of
cationic liposomes-based microbubbles [10,14–19], formed with gas- filled cationic liposomes made
with zwitterionic lipid (DSPC) or cationic lipids such as DSTP or 1,2-stearoyl-3-
3

trimethylammonium-propane (DPTAP). The main challenge is to obtain cationic MB promoting
pDNA complexation without any alteration of their acoustic properties.
In addition to the improvement of physical gene delivery techniques, a particular attention was paid
on plasmid design in the present study, which was identified to be of crucial importance. Indeed, in
liver, non-viral gene vectors mostly display much more transient gene expression than that observed
in other organs such as muscle, partly due to heterochromatin formation [20,21]. Removal of all or
part of bacterial sequences from gene vectors (e.g. in minicircles or in pFAR4 miniplasmids,
respectively) allowed to alleviate this silencing effect [22,23]. Alternatively, the use of molecular
tools (DNA transposons or integrases) that mediate transgene integration into host genome led, in
mice, to high and prolonged therapeutic levels of Factor IX that is deficient in hemophilia B patients.
DNA transposon was also used to obtain gene insertion and long-term expression in combination
with ultrasound using a low frequency unfocused transducer [11]. The use of unfocused transducer is
of importance because it allows to treat a larger area, as compared to focused ultrasound, and is thus
more appropriate for a large organ such as the liver.
Taking into account all these data, we ought to design positively charged MB to increase plasmid
amount reaching the liver. Based on our former screening of positively charged lipids [24], we chose
a highly charged bicatenar lipid with a branched polyspermine head [25]. We designed MB
composed of a unique cationic lipid, providing a simple and reliable vector [26] able to interact with
high efficiency with DNA. The other originality of our study comes from the pDNA used. We chose
a miniplasmid devoid of antibiotic resistance sequence, called pFAR4 [27]. The absence of this
sequence leads to a small size plasmid which was shown to be highly efficient in transfecting cells in
vitro [27] and in vivo [23]. Finally, the parameters of low-energy unfocused ultrasound were also
optimized using image-guided delivery. In this article, we report that the combination of plasmid
molecular optimization and US non- invasive physical trigger led to a stable gene expression in the
liver over 6 months, with a mild and transient apparent toxicity.
2. Material and Methods
2.1. Plasmid preparation
The pFAR4 derivative, pFAR4-CMV LUC BGH (pFAR4-LUC), which is a plasmid devoid of
antibiotic resistance gene, was propagated using a dedicated bacterial producing strain [27]. The
plasmid was purified using Nucleobond Endofree plasmid preparation kits (Macherey Nagel, Hoerdt,
4

France). Endotoxin levels were validated using the LAL (Limulus Amoebocyte Lysate) procedure
(Lonza, Verviers, Belgium).
pTG11, full name pTG11033 with 9514 bp was obtained from Transgene S. A. (Strasbourg, France).
It encodes the luciferase gene under the cytomegalovirus promoter. pTG11 was propagated from
Escherichia coli DH5α cultures. Supercoiled plasmid was isolated from bacteria with the standard
alkaline lysis method, and purification was carried out with the Qiagen Mega Kit (Qiagen,
Courtaboeuf, France) according to the manufacturer’s instructions.
2.2. Ultrasound exposure system for in vitro gene transfer
The ultrasound system used in this study was previously described [28]. US were generated from a
0.5-inch diameter, IBMF-014 transducer with a centre frequency of 1 MHz (Sofranel, Sartrouville,
France). The transducer was placed in a custom made polystyrene tank filled with degassed pure
water. A signal consisting of 1.0 MHz centre frequency, 40% duty cycle and a pulse repetition
frequency of 10 kHz was generated by a 33220A arbitrary function generator (Agilent technologies,
Les Ulis, France) and amplified by a RF power amplifier (ADECE, Artannes sur Indre, France) was
used as the input for the transducer. Peak negative pressure of 150 kPa was used corresponding to an
MI of 0.15. Ultrasound stimulation time was set to 60 sec. The transducer was calibrated in a Perspex
container using an HGL-200 PVDF bullet type hydrophone (Onda, Sunnyvale, CA) placed at 3 cm,
the natural focal distance of the transducer. The transducer was positioned in front of the
sonoporation cuvette (Sarstedt AG & Co, Nümbrecht, Germany). The attenuation of the cuvette walls
was measured separately and found to be negligible (less than 10%).
2.3. Microbubble formulations
The cationic lipid, DMAPAP, synthesized as previously described [25], was diluted in 5% sucrose
and placed in 2 mL vials containing 1 mL of lipid suspension. The vials were capped and air was
displaced by perfluorobutane gas (Matrix Scientific, Columbia, SC, USA) at atmospheric pressure.
MB were formed by vigorous mechanical agitation using a Vialmix system (DuPont Pharmaceuticals
Company, Billerica, MA, USA) for 45 sec. PEGylated MBs were obtained post agitation by addition
of 20% of home-made N-hydroxysuccinimide polyethylene glycol (PEG) – 2000 at pH 7.5. All
samples were left for 10 min before use and were used within 1 h following agitation. Prior to pDNA
interaction, approximatively 200 µL of MB were collected into 1 mL syringe with a 27g needle. The
syringe was kept in vertical position with the plunger up for 2 min in order to separate MB by
buoyancy. The largest MB formed a cake against the syringe plunger and the rest of the suspension
5

containing monodisperse microbubbles were collected by pushing the plunger. Then pFAR4-LUC
(50µg) was added dropwise to interact with MB prior to intravenous (IV) injection.
Cationic MB formulation with DOTAP lipid was also prepared as control for gene delivery. Briefly,
a liposomal formulation of DSPC: DOTAP:DSPE-PEG2000 (0.7:0.2:0.1 molar ratio) was prepared in
10 mM HEPES buffer, pH7.4 at a final concentration of 5 mg/mL. This solution was freeze dried,
and the vial headspace was replaced by C4F10 gas. The vial was resuspended and activated by a
mechanical agitation using a VialMix during 45 sec.
2.4. In vitro sonoporation
1x10⁵ HeLa cells were grown on a resized Opticell® membrane (10×15 mm) (Nunc GmbH & Co. KG,
Langenselbold, Germany). The Opticell® membranes were transferred into polystyrene cuvettes
(Sarstedt, Nümbrecht, Germany) containing 1.5 mL of OptiMEM medium (Invitrogen, Carlsbad, CA,
USA) supplemented with 1% FCS (Thermofisher, France). During sonoporation the cell medium was
placed under gentle agitation using a magnetic stirrer. After sonoporation the membrane was placed
in the incubator with the sonoporation medium on a 12-well cell culture plate. Sonoporation was
performed using 1 µL of Micromarker™ MB (Visualsonics, Amsterdam, The Netherlands) and an
equimolar amount of pTG11 (2 µg) or luciferase-encoding pFAR4 plasmid DNA (5 µg). Ultrasound
parameters used were 1 MHz, 150 kPa, 40% duty cycle, 10 kHz pulse repetition frequency and 60
sec. of insonation time. Gene transfer efficiency was evaluated 24 h after sonoporation by measuring
the luciferase activity using a Lumat LB9507 luminometer (Berthold, Thoiry, France) as previously
described [28]. For confocal microscopy analysis, pFAR4-LUC and PTG11 were labelled with Cy3
or Cy5 fluorophore dyes using Label IT® Nucleic Acid Labeling Reagents Mirus kit according to
manufacturer’s instructions.
2.5. Size and Microbubbles counting using Tunable Resistive Pulse Sensing (TRPS)
MBs obtained with 1 mg/mL of cationic lipids were analysed by the TRPS technique (Izon, France)
as previously described [26]. The size and concentration were measured after microbubble
PEGylation prior and post pDNA interaction. All measurements were performed in triplicate on a
NP2000 nanopore, using 20 mM NaCl as electrolyte, and an applied pressure of 5 mbar. Certified
particles were used for calibration (CPC2000; mode size 1.90 µm; concentration 5.5×10⁹
particles/mL). The sample statistics were obtained using IZON Science software. The median value,
d50, represents the diameter at the 50th percentile. The size distribution is given by the d10-d90
range, which represent the MB population between the 10th and the 90th percentile.
6

2.6 Microbubble/DNA interaction
The complexation of DNA with MB has been investigated by gel retardation assay. Several volumes
(0.5; 1; 2; 4; 8; 10; 12 or 15 µL) of cationic microbubbles at lipid concentration of 1 mg/mL were
mixed with 1 µg of pFAR4-LUC in a final volume of 20 µL. MicroMarker™ MBs, which have no
ability to complex DNA, were used as control. After 5 min of complexation, solutions of mixed
pDNA and MB were loaded onto a 0.6% agarose gel containing ethidium bromide and
electrophoresis was performed in TAE buffer at 100 V during 45 min. The DNA loading capacity
was evaluated by increasing the quantity of DNA (from 0.1 to 2 µg) on a fixed quantity of
microbubbles (2 µL of microbubbles were used for this experiment). The gel was revealed under UV
illumination.
2.7. Acoustic properties
The microbubble harmonic response to US was determined using a homemade set-up (Figure 2A). A
5 MHz transducer (Panametrics, Olympus, Center Valley, USA flat transducer 13 mm diameter)
connected to an oscilloscope (Tie-Pie, Sneek, Netherlands) was used for ultrasound detection.
For ultrasound emission, a 3Bop ultrasound generator (Image Guided Therapy, Pessac, France)
connected to a 10-mm diameter Continuous Doppler probe (Blatek, State College PA, USA) at 1
MHz emission frequency. For each acoustic parameter, microbubbles (1 mg/mL) with and without
pDNA (17 µg) were diluted in degassed water at a concentration of approximatively 107 MB/mL and
placed in a cuvette. Carboxylated polystyrene particles (CPC1000; IZON Science) were used for
reference as linear scatterer. Measurements were performed at different acoustic pressures, from 75
to 375 kPa, with a duty-cycle of 10% and 20 pulses of 100 µs. Results are means of 5 measurements
for each parameter. The radio-frequency data acquired by the 5 MHz transducer were processed with
Matlab (Mathworks, Natick, USA). The echo from MB was windowed and converted into a power
spectrum to determine the presence of harmonics (multiples of the fundamental emitted frequency),
subharmonics (half the emitted frequency). The energy comprised in each harmonic was summed
over the bandwidth of the pulse. Broadband signal was measured as the total energy in between
harmonics and subharmonic peaks. Identical signal processing was applied to the linear scatters for
reference.
7

2.8. Ultrasound imaging using microbubbles
To assess the instantaneous biodistribution of MB in vivo, we performed ultrasonography on
BALB/cJ mice. Mice were anesthetized with 3% isoflurane (Isovet, Virbac, France) in air for
induction, and maintained at 1.5% for imaging. Mice were then shaved using a depilatory cream, and
placed on the heating pad of the Vevo Imaging Station (Visualsonics). A catheter was inserted in the
tail vein using a 27g needle. In vivo imaging of microbubbles was performed using a VEVO2100
imaging system (Visualsonics) with an 18 MHz probe (MS250) allowing non- linear imaging. The
probe was fixed and placed in axial plane to image the whole liver. Images were acquired using the
contrast mode acquisition, with low output power setting (4%) and a 10 to 14 Hz frame rate. MB-
pDNA complexes were prepared prior to injection with a cationic lipid concentration of 2 mg/mL and
50 µg of pFAR4-LUC. MB suspension (200 µL, 2.7×107 MB) coupled with pDNA were injected via
the catheter and then an additional 100 µL saline flush was performed. The contrast uptake sequence
in the liver was stored during 120 sec.
2.9 Targeted gene delivery
The gene delivery step was performed using the 3Bop ultrasound generator, a specific device
allowing high duty cycles and high intensity ultrasound emission, using the same continuous Doppler
probe. The system allowed the generation of any duty cycle and a peak Negative Pressure of 1.6 MPa
at its focal zone (22 mm), the emission diagram of the system was provided by the 3Bop
manufacturer and is displayed in supplementary data (Supplementary Figure 1).
A 2-cm spacer consisting on a rigid tube filled with ultrasonic gel was used to ensure that the focal
zone was located below the skin, in the liver parenchyma. The sonication probe was positioned on
the right flank of the mouse, in the axial plane, with a 45° angle to the sagittal plane. Adequate
positioning was ensured by ultrasound imaging: the gel contact between the sonication probe and the
skin, the distance to the skin of the probe and the expected location of the focal zone in right lobe of
the liver was assessed using the imaging probe (Supplementary Figure 2).
Evaluation of MB concentration dynamics in the liver was obtained analysing B-mode image
sequence from the ultrasound scanner (Figure 3). Briefly a user-defined ROI was placed in the liver
and backscattered echo amplitude was measured using the VEVOLAB quantification software. This
software provides linearized acoustic amplitudes from linear and non- linear imaging modes along
time. Normalized fundamental acoustic response from microbubbles was built after two separate
experiments of bolus injection with and without sonoporation. Since sonoporation could not be
8

synchronized to B-mode imaging, white artefacts due to ongoing sonoporation (left of figure 4) could
be seen on some frames.
MB-pDNA complexes were prepared and administrated as described above. Optimal sonoporation
conditions were determined by varying US parameters after microbubble IV injection on BALB/cJ
mice (n=5).
Bolus injections or continuous infusion using a syringe pump (Pump 11 Elite, Havard Apparatus)
during 1 or 3 min were tested to determine optimal transfection condition. The Pulse Repetition
Frequency (PRF) was kept constant at 100 Hz. Multiple Duty Cycles (DC) were tested but the total
ultrasound exposure time was kept constant, therefore the following DC and duration of the
procedure time were used: 10% DC and 2 min sonoporation time, 20% DC and 1 min sonoporation
time, 40% DC and 30 sec sonoporation time with an acoustic pressure of 480 kPa or 750 kPa. A
combination of multiple ultrasound emission acoustical pressures was also tested to determine the
optimal settings. 480, 750, 930 and 1125 kPa of peak negative pressure pulses were tested with 20%
DC.
The optimal sonoporation parameters were used to compare gene transfer for free pDNA, pDNA co-
injected with MicroMarker™ MB or adsorbed on cationic MB (n=9).
Luciferase expression was followed by bioluminescence imaging. Briefly, mice were depilated 24h
before, anesthetized as described above and then injected intraperitoneally with 150 mg/kg of
luciferin (Xenolight D luciferin potassium salt, Perkin Elmer) 5 min before image acquisition.
Bioluminescence was acquired with a Photon imager RT (Biospacelab, France) imaging system
during 10 min, placing 3 to 5 animals at a time in the device. This real-time bioluminescence imaging
allowed to detect the plateau of photon emission for each individual. This time frame was used to
calculate the photon emission in ph/s/cm²/sr within a constant pre-defined ellipsoid region of interest,
placed in the liver on each mouse followed. Statistical analysis of bioluminescence activity was
performed with GraphPad Prism software (version 5.00, GraphPad Software, San Diego, CA, USA)
using a non-parametric Mann-Whitney test between 2 groups. Differences were considered
statistically significant for a p-value <0.05.
2.10 Histological assessments
Livers were collected before and 1, 3 and 7 days after insonation. They were placed in a solution of
4% paraformaldehyde overnight and then stored in 70% ethanol. Samples were then included in
paraffin using an automated device (VIP, Tissue-Tek, Sakura). Livers were then cut in 4 µm-thick
9

slices every 150 µm and stained with haematoxylin and eosin. Histological slides were analysed by a
pathologist and scores according to toxicity criteria.
2.11. Toxicity assay
To assess liver toxicity, blood (100 µL) was collected in the retro-orbital sinus before and 1, 2 and 7
days after sonoporation, with Pasteur pipettes prepared with 20 µL of 50 mg/mL heparin. Blood
samples were then centrifuged at 4°C for 20 min at 4000 rpm. Plasma was then collected and stored
at -20°C for further analysis. Alanine amino transferase (ALAT) and aspartate amino transferase
(ASAT) activities were determined at 37°C using end point methods. Absorbance decreases to 340
nm were measured automatically on Modular® biochemistry analyser (Roche, Meylan, France) using
20 µL of plasma samples. Results were expressed in International Unit per litre (IU/L). Methods
were linear until 900 IU/L and 880 IU/L for ASAT and ALAT, respectively. Validity of activities
was assessed using quality controls, Precinorm U® and Precinorm H® (Roche, Meylan, France)
during sample determinations.
2.12. Immunofluorescence labelling and fluorescence microscopy analyses
Liver tissues were harvested, frozen in isopentane immersed in liquid nitrogen for 1 min, and stored
at -80°C until the preparation of histology slides. Five micron frozen tissues sections were placed on
superfrost plus slides and stored at -80°C before immunofluorescence. These liver slices were first
fixed in cooled acetone for 5 min. After 3 washes in phosphate buffer saline (PBS 10 mM), saturation
of unspecific sites was done by incubation of slices with PBS supplemented with 10% of bovine
serum albumin for 20 min at room temperature. Liver sections were co- incubated with 1/1000 anti-
Firefly Luciferase rabbit antibody (ab21176, Abcam, Cambridge, UK) and 1/100 rat anti-mouse
CD31 (PECAM-1) antibody (550274 BD, Pharmingen, US) overnight at 4°C. The slices were
washed three times and incubated with the secondary antibodies (1/400 Goat Anti-rabbit IgG (H+L),
CF™488A antibody SAB4600234 ; Sigma Aldrich, France and 1/400 rat anti-mouse IgG Rhodamine
antibody SAB3700552 Sigma Aldrich) for 30 min at room temperature. Finally, cell nuclei were
stained with 4′,6-Diamidino-2-phenylindole dihydrochloride (DAPI D9542; SIGMA). Photographs
(1000× magnification) were taken on a Zeiss fluorescence microscope (Carl Zeiss SAS, Marly Le
Roi, France).
All animal experiments were approved by the local ethics committee according to the procedure
agreement #02166.04.
10

3. Results
3.1. Plasmid size influence on gene transfer efficiency
To both increase transfection efficiency and transgene expression, the pFAR4 miniplasmid DNA that
is devoid of antibiotic resistance marker and has a reduced size was used as a gene vector [27]. The
luciferase reporter gene was chosen to monitor in vivo gene expression [29]. We hypothesized that
the small size of the pFAR4-LUC miniplasmid could be advantageous for US associated microbubble
gene delivery. This was first evaluated in vitro using US parameters that has been previously
optimized for gene delivery with MicroMarker™ MB [28]. As comparison, we used pTG11 pDNA
which encodes as well for luciferase gene under CMV promotor but has a larger size (~9.5 kb) than
pFAR4-LUC (~3.7 kb). Following sonoporation, gene expression obtained with the pFAR4
derivative was 20-fold higher than that with pTG11 (Figure 1A) in absence and in presence of
microbubbles. Confocal microscopy analysis revealed that 1 h post-sonoporation, pFAR4-LUC was
found closer to the nucleus area as compared to pTG11 (Figure 1B).
Figure 1: Adherent HeLa cells were sonoporated at 1 MHz of frequency, 150 kPa, 40% DC, 1 min of
exposure time in the presence Micromarker™ bubbles of either 2 µg/mL of pFAR4-LUC or pTG11
11

plasmids both encoding luciferase reporter gene. A) Luciferase activity was determined 24 h post-
sonoporation and values are expressed as mean of triplicate experiments performed 3 times. B) Cells
were sonoporated in the presence of Micromarker™ microbubbles and of either 2 µg/mL of pFAR4-
LUC (a and b) or pTG11 (c and d) labelled with Cy3 probe (red) with the same acoustic parameters
as in A. The transfection medium was removed and cells were further incubated for 30 min at 37°C
before fixation. a and c (fluorescence images); b and d (merge of fluorescence and bright field
images) Scale bar: 10 µm.
3.2. Microbubble preparation and characterization
To produce cationic MB, we used a bicatenar dimyristoyl lipid with a branched polyamine head able
to interact with pDNA using a low lipid amount (Figure 2 A). This lipid was selected from a series of
cationic lipids for its ability to transfect cell with high efficiency [25].
In order to avoid the accumulation of cationic MB into the lung post intravenous injection, we chose
to PEGylate them. As the insertion of PEG-lipid into microbubbles formulation was leading to foam
formation, PEGylation was performed post microbubble formation, using an N-hydroxysuccinimide
PEG able to react on 20% of the amines of the cationic lipid. The rest of the amines of the cationic
lipid were therefore available for the interaction with pDNA, which was added dropwise on the
microbubble suspension.
The concentration and size range of the MB were obtained using the TRPS technique. The
characterisation of the positively charged MB solely consisting in DMAPAP lipid has been described
previously [26]. The characterisation of PEGylated MB with and without pDNA is given in Table 1.
Shaking a suspension of cationic lipid (1 mg/mL) with perfluorobutane led to 3×108 MB/mL with a
size centred on 2.05 µm and a low polydispersity. The pDNA interaction on the microbubble surface
had no influence on the microbubble concentration and size. To demonstrate the loading of pDNA on
MB, confocal microscopy analysis was performed on MB complexed with fluorescently labelled
pDNA (Figure 2B). The fluorescent pDNA was found all around the surface of MB demonstrating an
efficient loading of pDNA.
12

Table 1: Microbubble concentration, median size (d50) and size range between the 10th and the
90th percentile obtained by TRPS technique.
Formulation Concentration (MB/mL) d50 (µm) d10 - d90 (µm)
DMAPAP MB 2.7 ± 0.3 × 10⁸ 2.05 ± 0.04 1.53 - 3.16
DMAPAP MB +
pFAR4-LUC 2.7 ± 0.4 × 10⁸ 2.07 ± 0.02 1.54 - 3.12
Gel retardation assay showed that DMAPAP microbubbles interacted with pDNA, while the neutral
microbubbles MicroMarker™ did not (Figure 2C). A significant reduction in pDNA migration was
observed starting from 8 µL of DMAPAP MB. The absence of migration was complete when
increasing the volume of MB. In marked contrast, a migration of pDNA was observed whatever the
volume of Micromarker ™ MB used. A gel retardation assay was also performed with a standard
cationic MB formulation made with DSPC:DOTAP and DSPE-PEG 2000 (Figure 2D). DMAPAP
MB were found more able to carry plasmid DNA than DOTAP-based MB.
Figure 2: Complexation of pDNA on cationic charged MB. A) Structure of DMAPAP lipid, B)
DMAPAP microbubbles complexing a Cy5-labelled plasmid DNA were imaged by confocal
13

microscopy C) Gel shift assay was performed to evaluate the interactions of 1 µg pTG11 with
increasing volume of DMAPAP, MicroMarkerTM MB. D) Gel shift assay was performed to evaluate
the plasmid DNA loading capacity of DMAPAP microbubbles compared to DOTAP microbubbles.
To assess the stability of MB and the influence of PEGylation, complexes were made either with non
PEGylated or PEGylated MB were analysed by flow cytometry at 5 and 10 min post-complexation
(Supplementary Figure 3). Intact MB exhibited a specific serpentine pattern in the forward-scatter vs.
side-scatter plots as previously reported [30]. Destabilized MB led to the formation of lipoplexes that
can be observed as dots below the serpentine pattern. The evolution of percentage as function of time
clearly indicates that the PEGylation has also a positive influence on MB stability once complexed
with pDNA. The efficiency of DMAPAP-MB for gene delivery in vitro following sonoporation was
compared to that obtained with DSPC:DOTAP MB (supplementary Figure 4). When compared to
DMAPAP MB, luciferase activity obtained with DOTAP MB was 100- and 30-fold lower in absence
and in the presence of US, respectively.
Figure 3: Microbubble oscillation and destruction under ultrasound. (A) Illustration of the
homemade set-up for acoustic measurements. (B) Power spectrum showing harmonics and
subharmonics linked to the nonlinear oscillations of the microbubbles. (C) Echo intensity
accumulated in the harmonics, subharmonics and in between as broadband signal.
14

We then evaluated the acoustic activity of MB using a 5 MHz transducer as ultrasound detector and a
1 MHz Doppler probe used for the in vivo experiments as ultrasound emitter with increased acoustic
pressures. To determine the energy required for microbubble oscillations and the energy leading to
microbubble destruction, acoustic measurements were performed in water bath onto suspension of
MB, using an acoustic pressure ranging from 75 to 375 kPa (Figure 3A).
Positively charged MB was sensitive to ultrasound, as evidenced by the presence of upper harmonic
and subharmonic frequency signal responses (Figure 3B). Both upper harmonic and subharmonic
total intensity signals were increased as a function of the ultrasound acoustic pressure, as regard to
linear scatterers which are not prone to oscillation (Figure 3C). An increased broadband noise was
obtained for MB, whereas stable broadband noise was obtained for linear scatterers (Figure 3C). The
increased broadband is reflecting the MB destruction starting at an acoustic pressure of 375 kPa. It is
important to point out that the association of pDNA on the MB surface did not impact their acoustic
response (Figure 3B and C).
3.3. Image guided study
In vivo experiments were performed on BALB/cJ mice under ultrasound imaging to follow the
kinetic of MB accumulation into the liver after tail vein injection and to assess the effect of
insonation conditions on MB destruction. First, the set-up had to be adjusted to obtain the correct
positioning of the ultrasound emitting transducer, the ultrasound imaging probe for mice liver
observation (Supplementary Figure 2).
Mouse liver could be observed in both B-mode and contrast mode from this axial view (Figure 4A).
After DMAPAP MB administration, contrast uptake in the liver could be assessed in conventional B-
mode (Figure 4B). The kinetics of microbubbles accumulation in the liver could be monitored and
showed that MB remained visible during at least 1 min post- injection, with a maximum accumulation
within the liver at 20 sec (Figure 4D, Figure 4E black squares). Most of MB signal was lost right
after sonoporation (750 kPa, DC 20%, 60 sec, PRF 100 Hz) (Figure 4C, Figure 4E gray circles)
because of microbubble destruction (Figure 4E).
As a comparison, Micromarker™ MB kinetics of accumulation in the liver was also monitored. In
absence of sonoporation, Micromarker™ MB lasted longer in the circulation as opposed to
DMAPAP MB (Supplementary Figure 5A). Upon sonoporation, both Micromarker™ and DMAPAP
15

contrast intensities in B-mode decreased (Supplementary Figure 5B). No more contrast uptake could
be observed at the end of the sonoporation sequence for both MBs.
The contrast enhancement obtained after MB administration and the observation of their fate allowed
us to test and select appropriate ultrasound parameters for gene transfer in the liver. In particular, we
could select the appropriate time to turn on the ultrasound emission thanks to the observation of a
fully contrasted liver 20 sec post-injection.
Figure 4: Ultrasound imaging and kinetic of MB accumulation in liver.
Liver US imaging performed (A) before microbubble injection, (B) after microbubble injection, (C)
during sonoporation and (D) after sonoporation. (E) Kinetics of microbubbles accumulation after
bolus injection, with (grey circles, ●) and without (black squares, ■) sonoporation. Normalized
acoustic amplitude of linear response from microbubbles is displayed over time. Dashed lines
represent the time window of sonoporation.
3.4. Optimisation of the protocol for in vivo gene transfer
In vivo sonoporation conditions require a number of adjustments to obtain efficient gene transfer into
the liver. To identify the optimal parameters of sonoporation, the next experiments were performed,
under ultrasound imaging guidance, and transfection efficiency of luciferase-encoding pFAR4 was
assessed by optical luminescence imaging.
First, we evaluated the impact of the injection speed on gene transfer at a constant PRF. The shorter
the injection was, the higher the gene expression level was, indicating that a maximal amount of
0
0,2
0,4
0,6
0,8
1
1,2
0 20 40 60 80 100 120
Aco
us
tic U
nit
(a.u
)
Time (s)
A B C
D E
16

microbubbles reaching the liver is required to get optimal gene transfer (Figure 5A). Therefore, a
bolus injection was used for the next experiments.
Second, we investigated the US parameters in terms of duty cycle and energy optimisation. We found
that, using a constant total ultrasound exposure time and acoustic pressure, of 480 kPa and 750 kPa,
and varying the duty cycle, duration of 2 ms over 10 ms, the transfection level was optimal (Figure
5B).
Moreover, varying the energy from 480 kPa to 930 kPa, while maintaining the duty cycle constant
significantly improved the transfection level (more than 10-fold) compared to the control without US
(Figure 5C). At higher energy (1125 kPa), despite a stronger level obtained on 2 mice, a lethal effect
was observed for 3 others. The highest nontoxic acoustic power, 930 kPa, was therefore chosen as
optimal parameter.
According to all these observations, we finally selected the following conditions as the optimal ones:
a bolus injection of MB, 930 kPa as ultrasound acoustic pressure with a duty cycle of 20%, with an
ultrasound exposure applied for 20 sec post-MB injection.
These ultrasound conditions were used to compare the transfection efficiency obtained 2 days after
the administration of pDNA either alone or associated with DMAPAP positively charged MB (Figure
5D). Upon ultrasound exposure, the luciferase activity was significantly increased (15-fold) for the
group receiving DMAPAP MB/pDNA complexes, compared to the mice injected with pDNA alone
followed by insonation. Therefore, the complexation of pDNA on MB led to an increased gene
expression likely by improving the amount of pDNA reaching the liver. To get a clear comparison
between DMAPAP MB/pDNA complexes and the lipoplexes counterpart, we assessed the gene
transfer efficiency of DMAPAP lipoplexes (LPX) using the same conditions for DMAPAP MB as in
Figure 5E. The luminescence intensity obtained with LPX without or with US application was very
low and close to that of pDNA alone. Representative images of 3 mice sonoporated with DMAPAP
MB and LPX both complexed with pFAR-Luc were shown in Figure 5F. Mice injected with LPX
exhibited a background signal whilst those injected with DMAPAP MB showed bright
bioluminescence signals.
17

Figure 5: Influence of US parameters on in vivo gene transfection efficiency.
Bioluminescence reporter gene expression obtained 2 days post-administration of pDNA injected
either alone or complexed with DMAPAP MB followed by US exposure with varied parameters: (A)
the injection speed (using the following parameters: 1 MHz, 750 kPa; DC 20%); (B) the US duty-
cycle; (C) the acoustic pressure; (D) the injection of pDNA alone or complexed with microbubbles
with or without US application (1 MHz, 930 kPa; 100 Hz PRF; DC 20%; 6000 cycles); (E) the
injection of DMAPAP LPX with or without US application (1 MHz, 930 kPa; 100 Hz PRF; DC 20%;
6000 cycles); (F) Bioluminescence images obtained 2-days post- injection of DMAPAP LPX (top)
and DMAPAP microbubbles (bottom) both followed by similar US application. Values represent box
and whiskers (median, 10th and 90th percentiles) of bioluminescence levels (n=5).
In order to evaluate the long-term duration of gene expression, we performed a second set of
experiments by following the luciferase activity for a longer period of time, 180 days, and compared
the efficacy of DMAPAP MB to commercially available MicroMarker™ MB (Figure 6). At day 1,
the level of gene transfer was equivalent for all groups. At day 2, the level of gene transfer dropped
down only when DNA was not injected with MB, reaching the background noise level 30 days post-
LPX US+
18

sonoporation. No difference was found between groups injected with pDNA complexed with
positively charged MB or co-injected with MicroMarker™ MB at day 1 and day 2. However, for
longer period of time, a clear significant difference was observed between these two groups. Whilst
the level obtained with the group injected with pDNA complexed with positively charged MB was
stable over 180 days that of mice injected with pDNA and MicroMarker™ MB dropped down. Note
that statistically significant difference between these two groups was found from 8 days post-
sonoporation.
Figure 6: Long lasting luciferase gene expression in the liver following sonoporation with
DMAPAP/pFAR4-LUC complexes.
Injection of DMAPAP MB complexed with pFAR4-LUC followed by sonoporation led to a long-
term luciferase expression in the liver. Mice were injected with either free pDNA (○), pDNA
associated with DMAPAP microbubbles () and pDNA co-injected with MicroMarker™ MBs ()
followed by US exposure with optimal parameters (1 MHz, 930 kPa; 100 Hz PRF; DC 20%; 6000
cycles). Values are means ± standard errors, n=9, # represent statistics for pDNA vs DMAPAP
MB+pDNA and * for DMAPAP MB+pDNA vs MicroMarker™ MB+pDNA; one symbol p-
value<0.05, two symbols p-value<0.01, three symbols p-value<0.001.
To evaluate the toxicity of the protocol, blood was collected prior sonoporation, then 24h, 48h and 7
days post-treatment. The aspartate aminotransferase (ASAT) and alanine aminotransferase (ALAT)
0 2 4 6 8102
103
104
105
106
30 60 90 120 150 180
free pDNA DMAPAP MB+pDNAMicromarker MB+pDNA
ns
ns
*
****
*
**
**
###
###
######
###
###
time (days)
Bio
lum
inescen
ce
(ph
/s/c
m²/
sr)
19

blood levels were measured as biomarkers of liver toxicity. As shown in Table 2, no signs of toxicity
were observed for all groups tested apart from the group treated with positively charged
microbubbles with sonoporation which exhibited a transient elevation of transaminases over 1 to 2
days. Normal levels of those transaminases were recovered at day 7.
Table 2: Quantification of transaminases blood levels 1, 2 and 7 days after sonoporation.
Treatment ASAT (IU/L)
Day 0 Day 1 Day 2 Day 7
NaCl 42 ± 6 55 ± 22 42 ± 6 38 ± 6
pDNA +US 62 ± 11 55 ± 9 38 ± 5 35 ± 4
MicroMarker MB +pDNA +US 44 ± 9 47 ± 4 49 ± 7 55 ± 8
DMAPAP MB +pDNA +US 88 ± 16 187 ± 51 79 ± 13 55 ± 4
ALAT (IU/L)
Day 0 Day 1 Day 2 Day 7
NaCl 41 ± 8 33 ± 4 34 ± 5 31 ± 4
pDNA +US 27 ± 3 64 ± 12 39 ± 7 29 ± 5
MicroMarker MB +pDNA +US 36 ± 4 52 ± 6 38 ± 11 53 ± 14
DMAPAP MB +pDNA +US 61 ± 6 173 ± 25 107 ± 16 53 ± 8
Values shown are mean ± SD of 5 measurements.
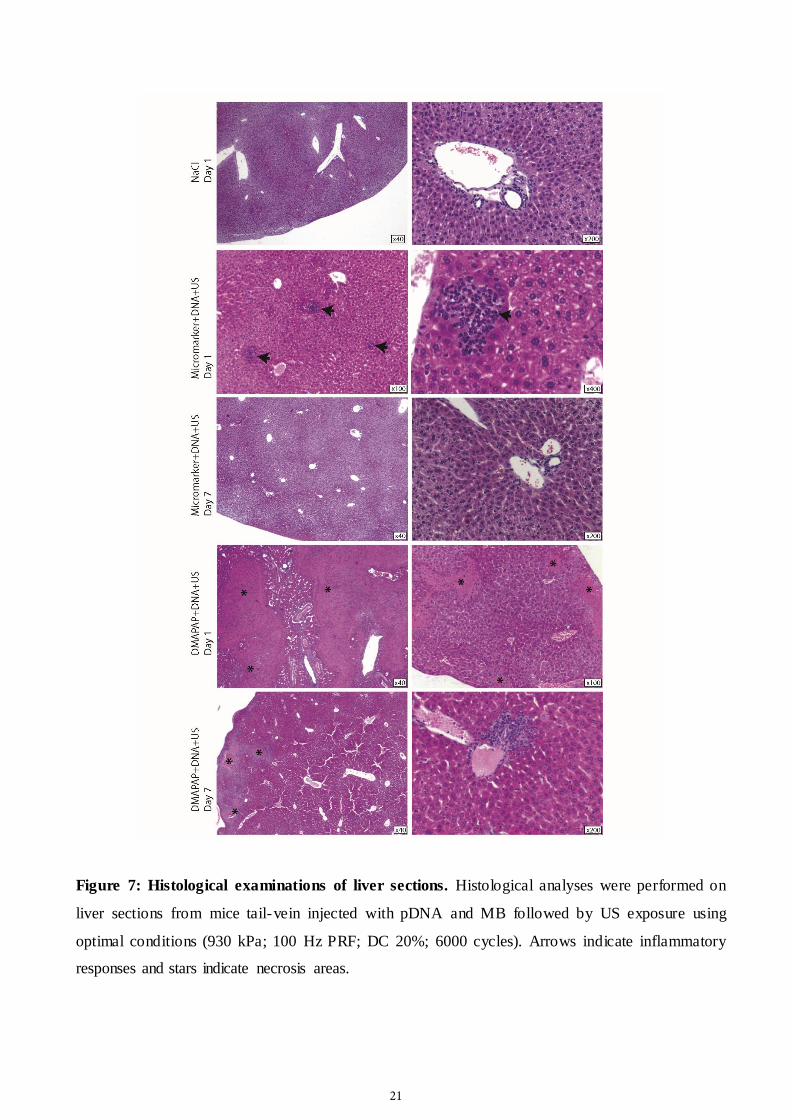
Histological analyses of livers from treated mice were also performed. The use of DMAPAP MB was
inducing more tissue damages compared to MicroMarker™ MB. At day 1, very few spots of lobular
hepatitis were found (Figure 7, arrows). These spots were not visible at day 7 in the MicroMarker™
MB group. The use of DMAPAP MB seemed to induce subcapsular necrotic areas covering less than
5% of the tissue one day (Figure 7, stars). At day 7, lobular hepatitis foci and smaller sub capsular
necrosis areas were still observable. Note that the data were comparable to the observations
previously reported by Anderson et al. [10].
20
ACC
EPTE
D M
ANU
SCR
IPT
Figure 7: Histological examinations of liver sections. Histological analyses were performed on
liver sections from mice tail-vein injected with pDNA and MB followed by US exposure using
optimal conditions (930 kPa; 100 Hz PRF; DC 20%; 6000 cycles). Arrows indicate inflammatory
responses and stars indicate necrosis areas.
21

At the end of the time course study, immunohistochemistry studies were performed to determine
which types of cells were transfected when sonoporation was conducted either with MicroMarker™
or DMAPAP MB. We ought to evaluate the proportion of hepatocytes versus vascular endothelial
cells that were transfected under those two conditions. As shown by the representative images,
hepatocytes were much more transfected than endothelial cells following sonoporation made with
DMAPAP MB (Figure 8). By contrast, the co- injection of pFAR4-LUC with MicroMarker™ led to a
higher number of luciferase-expressing endothelial cells, as proven by the colocalization of anti-
luciferase and anti-CD31 antibodies.
22

Figure 8: Assessment of transfected cell type by immunohistochemistry. Mice were tail vein
injected with pFAR-LUC complexed with DMAPAP MB or co- injected with Micromarker™
followed by US exposure using optimal acoustic parameters. Liver sections from those treated mice
and from non-treated control mice were processed for immunostaining. Luciferase expression was
revealed with anti- luciferase antibody (green) immunolabelling; endothelial cells were identified by
immunolabelling of CD31 marker (red). Cell nuclei were labelled with DAPI (blue). Scale bar: 100
µm.
23

4. Discussion
In this study, we developed cationic liposomal based MB based on DMAPAP cationic lipids,
previously shown to be efficient for gene transfection when used as lipoplexes (pDNA/liposomes
complexes). Liposomes made with this cationic lipid were able to interact with pDNA, protecting it
from nuclease degradation, thus improving cellular uptake [31,32].
For an efficient ultrasound and MB-associated gene delivery, it is crucial to deliver sufficient pDNA
at the sonoporation site. This can be achieved by loading pDNA on MB surface via direct interaction
of either pDNA or pDNA complexed with cationic polymers or liposomes. Since different studies
have reported that endocytosis could be also implicated in the sonoporation mechanism in addition to
MB destruction [28,33,34], gas MB with DMAPAP branched cationic lipids could thereby be of
interest. The DMAPAP cationic lipid allowed to produce MB exhibiting acoustic features. Cationic
liposomal bubbles reported so far by other groups were usually comprised of neutral and cationic
lipids. By contrast, our MB formulation was solely composed of the DMAPAP cationic lipids and of
PEG moieties. The optimal proportion of PEG chains to mask positive charges without impairing the
capacity of MB to form electrostatic interactions with pDNA was determined. The MB surface
modifications induced by the MB-pDNA interaction did not alter the MB acoustic properties.
For the US energy generated, a mixture of both oscillation and destruction of DMAPAP MB has been
found to occur as observed in our in vitro study. In particular, MB destruction was mainly obtained at
higher acoustic pressure used during in vivo experiments. Therefore, both oscillations and destruction
of MB are likely responsible for transfection obtained. For all tested acoustic pressures, using DC
above 20% was not beneficial for gene transfer. Acute toxicity was also induced when the acoustic
pressure was increased up to 1125 kPa.
Long term liver reporter gene expression was obtained with both neutral MicroMarker™ and
positively charged microbubbles. However, a stable expression over 6 months at a level of 5×10⁴
ph/s/cm2/sr could only be obtained by pDNA association with positively charged microbubbles. Thus,
these newly designed cationic microbubbles associated with the small pFAR4 miniplasmid allowed
to increase local pDNA concentration in the sonicated area, resulting in a higher plasmid copy
number in the liver and a more stable expression. A long lasting gene expression up to 4 months has
already been observed in sonoporated tendons using MicroMarkerTM MB. In that study, the episomal
form of pDNA was found to be responsible for this expression [7]. Here, it could be the case but
DNA integration cannot be excluded even though this event is very rare.
Long term transgene expression is necessary for gene therapy, in order to avoid treatment repetition.
Recent progresses in biotechnology resulted in the emergence of pDNA designed with either DNA
24

transposons Sleeping Beauty [35], PiggyBac [36] or integrases such as C31 [37,38], which mediate
transgene integration into host genomes and prolonged transgene expression. Nevertheless, DNA
transposons still display the drawback of generating an integration profile which is not site-specific,
potentially leading to side genotoxicity caused by insertional oncogenesis. In our study, we showed
that a long term transgene expression could be obtained using pFAR4 miniplasmids. The advantages
of these miniplasmids have been proven in vivo upon hydrodynamic injection thanks to their reduced
size, nontoxic and non- immunogenic side effects [22,23]. These features may play a significant role
in gene transfer efficiency by sonoporation.
In particular, the other noticeable point comes from the search of cells which have been transfected
following liver sonoporation. Knowing the type of transfected cells is particularly important to select
the appropriate application of the US protocol. Our immunohistochemistry analyses revealed that
with cationic MB, hepatocytes are majorly transfected whilst endothelial cells were also transfected
with neutral MB. Such identification had never been reported in previous studies. Hepatocytes
surface can be reached from the space of Disse which is directly accessible to liver sinusoidal
endothelia via fenestrae. These fenestrae contain pores that play a role for anatomical targeting.
Unfortunately, the small size of those pores limits the anatomical targeting of gene delivery systems.
In most cases, endothelial cells lining the vessel are transfected when the extravasation is inefficient.
Opening the fenestrae of liver sinusoids is one of the consequences of hydrodynamic injection that
allows an efficient hepatocytes gene transfer. During sonoporation, MB oscillations are also
supposed to act on the endothelium and improve the extravasation through pores opening. When
pDNA miniplasmids are compacted by cationic MB, our results show that the effectiveness of
plasmid passage through the pores is improved, thus leading to a higher hepatocyte transfection. By
contrast, when co- injected with neutral MB such as Micromarker™, transfection was mostly
restricted to vessel endothelial cells.This study represents a first step towards using cationic MB and
US for in vivo gene transfer in liver, which will require improvements for an increased efficiency..
Amongst published reports related to liver gene delivery by US and microbubbles, our study could be
compared to those made by Song et al. [11,39] and Anderson et al., [10]. The injection mode was
found to be crucial to get efficient gene delivery in the liver. Here, we have performed a tail vein
injection which is more convenient and less invasive than intra-hepatic injection [11] or than the
injection into the left ventricle of the heart [10] followed by ultrasound application in the liver. Our
MB formulation was clearly stable enough; since MB could be detected in the liver by B-mode
imaging (Figure 4). This image guidance was also of great help to finely adjust the mode of injection
and the ultrasound parameters.
25

5. Conclusion
The long-term expression obtained during this work can be likely attributed to the straightforward
and reproducible preparation of MB formation using the DMAPAP lipid, to the small size of the
pFAR miniplasmid, and to their oscillation properties leading to hepatocyte transfection under
optimised ultrasound parameters. Nevertheless, there is still room for improvement to enhance the
US-based gene transfer efficiency obtained with our new formulation.
6. Acknowledgements
This work was funded by the French National Agency for Research (ANR Blanc-MEDDU).
Our acknowledgement to different platforms: 1) Animal Platform , CRP2 - UMS 3612 CNRS - US25
Inserm-IRD – Faculté de Pharmacie de Paris, Université Paris Descartes, Paris, France; 2) Optical
imaging plateform LIOPA, Life imaging, PIV, Faculty of Pharmacy, Université Paris Desca rtes
Univ., Paris, France. We are grateful to the histo-pathology service of Regional Hospital of Orléans
(France) for their excellent expertise.
26

7. References
[1] S.E. Raper, M. Grossman, D.J. Rader, J.G. Thoene, B.J. Clark, D.M. Kolansky, D.W. Muller,
J.M. Wilson, Safety and feasibility of liver-directed ex vivo gene therapy for homozygous
familial hypercholesterolemia., Ann. Surg. 223 (1996) 116–126. doi:10.1097/00000658-
199602000-00002.
[2] A.M. Salazar-Montes, L.D. Hernández-Ortega, M.S. Lucano-Landeros, J. Armendariz-
Borunda, New gene therapy strategies for hepatic fibrosis, World J. Gastroenterol. 21 (2015)
3813–3825. doi:10.3748/wjg.v21.i13.3813.
[3] Y. Sakakima, S. Hayashi, Y. Yagi, A. Hayakawa, K. Tachibana, A. Nakao, Gene therapy for
hepatocellular carcinoma using sonoporation enhanced by contrast agents, Cancer Gene Ther.
12 (2005) 884–889. doi:10.1038/sj.cgt.7700850.
[4] J.W. Castle, K.P. Kent, Y. Fan, K.D. Wallace, C.E.L. Davis, J.C. Roberts, M.E. Marino, K.E.
Thomenius, H.W. Lim, E. Coles, M.H. Davidson, S.B. Feinstein, A. DeMaria, Therapeutic
ultrasound: Increased HDL-Cholesterol following infusions of acoustic microspheres and
apolipoprotein A-I plasmids, Atherosclerosis. 241 (2015) 92–99.
doi:10.1016/j.atherosclerosis.2015.04.817.
[5] R. Suzuki, E. Namai, Y. Oda, N. Nishiie, S. Otake, R. Koshima, K. Hirata, Y. Taira, N.
Utoguchi, Y. Negishi, S. Nakagawa, K. Maruyama, Cancer gene therapy by IL-12 gene
delivery using liposomal bubbles and tumoral ultrasound exposure, J. Control. Release. 142
(2010) 245–250. doi:10.1016/j.jconrel.2009.10.027.
[6] A. Delalande, M. Postema, N. Mignet, P. Midoux, C. Pichon, Ultrasound and microbubble-
assisted gene delivery: recent advances and ongoing challenges, Ther. Deliv. 3 (2012) 1199–
1215. doi:10.4155/tde.12.100.
[7] A. Delalande, A. Bouakaz, G. Renault, F. Tabareau, S. Kotopoulis, P. Midoux, B. Arbeille, R.
Uzbekov, S. Chakravarti, M. Postema, C. Pichon, Ultrasound and microbubble-assisted gene
delivery in Achilles tendons: Long lasting gene expression and restoration of fibromodulin KO
phenotype, J. Control. Release. 156 (2011) 223–230. doi:10.1016/j.jconrel.2011.08.020.
[8] G. Shapiro, A.W. Wong, M. Bez, F. Yang, S. Tam, L. Even, D. Sheyn, S. Ben-David, W.
Tawackoli, G. Pelled, K.W. Ferrara, D. Gazit, Multiparameter evaluation of in vivo gene
delivery using ultrasound-guided, microbubble-enhanced sonoporation, J. Control. Release.
223 (2016) 157–164. doi:10.1016/j.jconrel.2015.12.001.
27

[9] C.H. Miao, A.A. Brayman, K.R. Loeb, P. Ye, L. Zhou, P. Mourad, L.A. Crum, Ultrasound
enhances gene delivery of human factor IX plasmid., Hum. Gene Ther. 16 (2005) 893–905.
doi:10.1089/hum.2005.16.ft-85.
[10] C.D. Anderson, S. Moisyadi, A. Avelar, C.B. Walton, R. V Shohet, Ultrasound targeted
hepatic delivery of Factor IX in hemophiliac mice, Gene Ther. (2016) 1–47.
doi:10.1038/gt.2016.23.
[11] S. Song, M. Noble, S. Sun, L. Chen, A.A. Brayman, C.H. Miao, Efficient microbubble- and
ultrasound-mediated plasmid DNA delivery into a specific rat liver lobe via a targeted
injection and acoustic exposure using a novel ultrasound system, Mol. Pharm. 9 (2012) 2187–
2196. doi:10.1021/mp300037t.
[12] D. Yang, Y.-H. Gao, K.-B. Tan, Z.-X. Zuo, W.-X. Yang, X. Hua, P.-J. Li, Y. Zhang, G. Wang,
Inhibition of hepatic fibrosis with artificial microRNA using ultrasound and cationic liposome-
bearing microbubbles., Gene Ther. 20 (2013) 1140–8. doi:10.1038/gt.2013.41.
[13] M.L. De Temmerman, H. Dewitte, R.E. Vandenbroucke, B. Lucas, C. Libert, J. Demeester,
S.C. De Smedt, I. Lentacker, J. Rejman, MRNA-Lipoplex loaded microbubble contrast agents
for ultrasound-assisted transfection of dendritic cells, Biomaterials. 32 (2011) 9128–9135.
doi:10.1016/j.biomaterials.2011.08.024.
[14] K. Anwer, G. Kao, B. Proctor, I. Anscombe, V. Florack, R. Earls, E. Wilson, T. McCreery, E.
Unger, A. Rolland, S.M. Sullivan, Ultrasound enhancement of cationic lipid-mediated gene
transfer to primary tumors following systemic administration, Gene Ther. 7 (2000) 1833–1839.
doi:10.1038/sj.gt.3301302.
[15] J.P. Christiansen, B.A. French, A.L. Klibanov, S. Kaul, J.R. Lindner, Targeted tissue
transfection with ultrasound destruction of plasmid-bearing cationic microbubbles, Ultrasound
Med. Biol. 29 (2003) 1759–1767. doi:10.1016/S0301-5629(03)00976-1.
[16] S. Hayashi, M. Mizuno, J. Yoshida, A. Nakao, Effect of sonoporation on cationic liposome-
mediated IFNbeta gene therapy for metastatic hepatic tumors of murine colon cancer, Cancer
Gene Ther. 16 (2009) 638–643. doi:cgt20081 [pii]\r10.1038/cgt.2008.1.
[17] J.L. Tlaxca, C.R. Anderson, A.L. Klibanov, B. Lowrey, J.A. Hossack, J.S. Alexander, M.B.
Lawrence, J.J. Rychak, Analysis of in vitro transfection by sonoporation using cationic and
neutral microbubbles, Ultrasound Med. Biol. 36 (2010) 1907–1918.
doi:10.1016/j.ultrasmedbio.2010.05.014.
28

[18] M. Vannan, T. McCreery, P. Li, Z. Han, E. Unger, B. Kuersten, E. Nabel, S. Rajagopalan,
Ultrasound-mediated transfection of canine myocardium by intravenous administration of
cationic microbubble-linked plasmid DNA, J. Am. Soc. Echocardiogr. 15 (2002) 214–218.
doi:10.1067/mje.2002.119913.
[19] C.H. Fan, C.Y. Ting, C.Y. Lin, H.L. Chan, Y.C. Chang, Y.Y. Chen, H.L. Liu, C.K. Yeh,
Noninvasive, Targeted, and Non-Viral Ultrasound-Mediated GDNF-Plasmid Delivery for
Treatment of Parkinson’s Disease, Sci. Rep. 6 (2016) 19579. doi:10.1038/srep19579.
[20] L.E. Gracey Maniar, J.M. Maniar, Z.-Y. Chen, J. Lu, A.Z. Fire, M.A. Kay, Minicircle DNA
vectors achieve sustained expression reflected by active chromatin and transcriptional level.,
Mol. Ther. 21 (2013) 131–8. doi:10.1038/mt.2012.244.
[21] E. Riu, Z. Chen, H. Xu, C. He, M.A. Kay, Histone Modifications are Associated with the
Persistence or Silencing of Vector-mediated Transgene Expression, Gene Ther. 15 (2007)
1348–55. doi:10.1038/sj.mt.6300177.
[22] Z.Y. Chen, C.Y. He, A. Ehrhardt, M.A. Kay, Minicircle DNA vectors devoid of bacterial
DNA result in persistent and high-level transgene expression in vivo, Mol. Ther. 8 (2003)
495–500. doi:10.1016/S1525-0016(03)00168-0.
[23] M. Quiviger, a Arfi, D. Mansard, L. Delacotte, M. Pastor, D. Scherman, C. Marie, High and
prolonged sulfamidase secretion by the liver of MPS-IIIA mice following hydrodynamic tail
vein delivery of antibiotic-free pFAR4 plasmid vector., Gene Ther. (2014) 1–7.
doi:10.1038/gt.2014.75.
[24] G. Byk, D. Scherman, B. Schwartz, C. Dubertret, Lipopolyamines as transfection agents and
pharmaceutical uses thereof, US Pat. 6,171,612. 1 (2001).
[25] B. Thompson, N. Mignet, H. Hofland, D. Lamons, J. Seguin, C. Nicolazzi, N. de la Figuera,
R.L. Kuen, X.Y. Meng, D. Scherman, M. Bessodes, Neutral postgrafted colloidal particles for
gene delivery., Bioconjug. Chem. 16 (2005) 608–14. doi:10.1021/bc040244z.
[26] S. Manta, A. Delalande, M. Bessodes, M.F. Bureau, D. Scherman, C. Pichon, N. Mignet,
Characterization of Positively Charged Lipid Shell Microbubbles with Tunable Resistive Pulse
Sensing (TRPS) Method: A Technical Note, Ultrasound Med. Biol. 42 (2016) 624–630.
doi:10.1016/j.ultrasmedbio.2015.10.010.
[27] C. Marie, G. Vandermeulen, M. Quiviger, M. Richard, V. Préat, D. Scherman, pFARs,
plasmids free of antibiotic resistance markers, display high-level transgene expression in
29

muscle, skin and tumour cells, J. Gene Med. 12 (2010) 323–332. doi:10.1002/jgm.1441.
[28] A. Delalande, C. Leduc, P. Midoux, M. Postema, C. Pichon, Efficient gene delivery by
sonoporation is associated with microbubble entry into cells and the clathrin-dependent
endocytosis pathway, Ultrasound Med. Biol. 41 (2015) 1913–1926.
doi:10.1016/j.ultrasmedbio.2015.03.010.
[29] Chen CC, Borden MA. Ligand conjugation to bimodal poly(ethylene glycol) brush layers on
microbubbles. Langmuir. 2010; 26: 13183-94.
{30] Feshitan JA, Chen CC, Kwan JJ, Borden MA. Microbubble size isolation by differential
centrifugation. J Colloid Interface Sci. 2009; 329: 316-24;
[31] C. Bloquel, C. Trollet, E. Pradines, J. Seguin, D. Scherman, M.F. Bureau, Optical imaging of
luminescence for in vivo quantification of gene electrotransfer in mouse muscle and knee.,
BMC Biotechnol. 6 (2006) 16. doi:10.1186/1472-6750-6-16.
[32] M. Breton, J. Leblond, J. Seguin, P. Midoux, D. Scherman, J. Herscovici, C. Pichon, N.
Mignet, Comparative gene transfer between cationic and thiourea lipoplexes, J. Gene Med. 12
(2010) 45–54. doi:10.1002/jgm.1417.
[33] B.D.M. Meijering, L.J.M. Juffermans, A. Van Wamel, R.H. Henning, I.S. Zuhorn, M. Emmer,
A.M.G. Versteilen, W.J. Paulus, W.H. Van Gilst, K. Kooiman, N. De Jong, R.J.P. Musters,
L.E. Deelman, O. Kamp, Ultrasound and microbubble-targeted delivery of macromolecules is
regulated by induction of endocytosis and pore formation, Circ. Res. 104 (2009) 679–687.
doi:10.1161/CIRCRESAHA.108.183806.
[34] M. Derieppe, K. Rojek, J.-M. Escoffre, B.D. de Senneville, C. Moonen, C. Bos, Recruitment
of endocytosis in sonopermeabilization-mediated drug delivery: a real-time study., Phys. Biol.
12 (2015) 46010. doi:10.1088/1478-3975/12/4/046010.
[35] L. Mates, M.K. Chuah, E. Belay, B. Jerchow, N. Manoj, A. Acosta-Sanchez, D.P. Grzela, A.
Schmitt, K. Becker, J. Matrai, L. Ma, E. Samara-Kuko, C. Gysemans, D. Pryputniewicz, C.
Miskey, B. Fletcher, T. VandenDriessche, Z. Ivics, Z. Izsvak, Molecular evolution of a novel
hyperactive Sleeping Beauty transposase enables robust stable gene transfer in vertebrates, Nat.
Genet. 41 (2009) 753–761. doi:10.1038/ng.343.
[36] M. Di Matteo, E. Samara-Kuko, N.J. Ward, S.N. Waddingon, J.H. McVey, M.K.L. Chuah, T.
VandenDriessche, S.N. Waddington, J.H. McVey, M.K.L. Chuah, T. VandenDriessche,
Hyperactive PiggyBac Transposons for Sustained and Robust Liver-targeted Gene Therapy,
30

Mol. Ther. 22 (2014) 1614–1624. doi:10.1038/mt.2014.131.
[37] A. Keravala, S. Lee, B. Thyagarajan, E.C. Olivares, V.E. Gabrovsky, L.E. Woodard, M.P.
Calos, Mutational derivatives of PhiC31 integrase with increased efficiency and specificity.,
Mol. Ther. 17 (2009) 112–120. doi:10.1038/mt.2008.241.
[38] A. Keravala, C.L. Chavez, G. Hu, L.E. Woodard, P.E. Monahan, M.P. Calos, Long-term
phenotypic correction in factor IX knockout mice by using ΦC31 integrase-mediated gene
therapy., Gene Ther. 18 (2011) 842–8. doi:10.1038/gt.2011.31.
[39] S. Song, Z. Shen, L. Chen, A.A. Brayman, C.H. Miao, Explorations of high-intensity
therapeutic ultrasound and microbubble-mediated gene delivery in mouse liver., Gene Ther. 18
(2011) 1006–1014. doi:10.1038/gt.2011.34.
31

Graphical abstract
32