Fate of antibiotic resistant bacteria and antibiotic resistance ...
156
Fate of antibiotic resistant bacteria and antibiotic resistance genes in constructed wetlands Dissertation zur Erlangung des akademischen Grades Doktoringenieurin (Dr.-Ing.) von Frau Lic. Camila Ayelén Knecht geb. am 16.10.1986 in Viedma, Argentinien genehmigt durch die Fakultät für Verfahrens- und Systemtechnik der Otto-von-Guericke-Universität Magdeburg Promotionskommission: Prof. Dr.-Ing. Udo Reichl (Vorsitzer) Prof. Dr.-Ing. habil. Heinz Köser (Gutacher) Prof. Dr. Susanne Lackner (Gutacherin) Prof. Dr. rer. nat. Thomas U. Berendonk (Gutacher) Dr. rer. nat. Jochen A. Müller (Mitglied) eingereicht am: 26.09.2019 Promotionskolloquium am: 10.06.2020
-
Upload
khangminh22 -
Category
Documents
-
view
2 -
download
0
Transcript of Fate of antibiotic resistant bacteria and antibiotic resistance ...
Fate of antibiotic resistant bacteria and antibiotic
resistance genes in constructed wetlands
Dissertation
zur Erlangung des akademischen GradesDoktoringenieurin (Dr.-Ing.)
von Frau Lic. Camila Ayelén Knechtgeb. am 16.10.1986 in Viedma, Argentinien
genehmigt durch dieFakultät für Verfahrens- und Systemtechnik
der Otto-von-Guericke-Universität Magdeburg
Promotionskommission:
Prof. Dr.-Ing. Udo Reichl (Vorsitzer)Prof. Dr.-Ing. habil. Heinz Köser (Gutacher)Prof. Dr. Susanne Lackner (Gutacherin)Prof. Dr. rer. nat. Thomas U. Berendonk (Gutacher)Dr. rer. nat. Jochen A. Müller (Mitglied)
eingereicht am: 26.09.2019Promotionskolloquium am: 10.06.2020

This work has been entirely edited using free and open-source software:LibreOffice for word processing, Zotero for reference managing, R for data analysis
and graphics and Inkscape for figures, in a Linux environment (Ubuntu)
ii

“La madre tierra militarizada, cercada, envenenada,
donde se violan sistemáticamente derechos elementales, nos exige actuar.
Construyamos entonces sociedades capaces de coexistir
de manera justa, digna y por la vida.”
Berta Cáceres
Mother earth, militarized, fenced, poisoned, where elementary rights are systematically violated, demands us to act.
Let us then build societies capable of coexisting in a fair and dignified manner and for life.
iii

Acknowledgements
I am very grateful to my University supervisor Prof. Dr.-Ing. habil. Heinz Köser for his continuous and
thoughtful supervision from the very beginning until now. I am also deeply grateful to my supervisor
and mentor at the Helmholtz Centre for Environmental Research (UFZ), Dr. Jochen A. Müller. Besides
of being my scientific advisor he was a fundamental support throughout my PhD process.
Thanks to the Department of Environmental Biotechnology (UBT) at the UFZ and the head of the
Department Prof. Dr. habil. Matthias Kästner for hosting my research. Thanks to my colleagues Uwe,
Ines, Nancy R., Nancy D., Inge, Maja, Kerstin, Ola, Mariam K., Mariam A., Ruth, Moni, Mahsa, Hao-
Yu, Yuying, Anna, Ingrid, Christian, Hermann, Odion, Nick, Arndt and Stephan. To the students who
collaborated to my work Hanna, Angie, Hiep and Amelie. To Prof. Stottmeister and Peter Kuschk for
being my first contacts at the UFZ.
Special thanks to Dr. Jaime Nivala because the cooperation with the UBZ was essential to this work.
Thanks for letting me taking samples from the ecotechnology research facility at Langenreichenbach,
for sharing her knowledge and data with me. Thanks to Dr. Katy Bernhard for her assistance in the
sampling. Thanks to Dr. Monika Möder from the analytical department for the analysis on antibiotic
concentrations. Thanks to Olawale Olufemi Adelowo for sharing his valuable expertise knowledge on
antibiotic resistance.
Thanks to HIGRADE and Dr. Jula Zimmerman for her continuous work to improve doctoral researchers
conditions. Thanks to Barbara Timmel for her efforts to improve internationals conditions. Thanks to
Mick Wu for his advices on statistics.
Big thanks to the Heinrich Böll Stiftung for giving me a scholarship and a program full of new insights.
Specially thanks to Jutta Helm. Thanks to Katrin Strach and Liane Müller from the Deutsche Biomasse
Forschungszentrum for giving me a job.
Thanks to my friends in Christiane and her family for welcoming me in Germany. To Liesbeth for being
my flatmate for three years and for being a good friend. To Anna, my new flatmate. To the family
Steinhagen, my second family. To Ana María for all her strength. To Flavia and Naty for all we shared in
a short time. To Volkert and Niklas for helping me to correct reports. To my friends Jessica, Camila,
Sofía, Soraya, Lucía, Mauricio, Martín and Anita for being an important part of my life for several
years.
Thanks to my family for supporting me over the Atlantic ocean, specially to my mother Nancy, my
father Oscar and my sister Florencia for believing in me. To my grandmas Selma and Coli for their
tenderness and unconditional love. To my niece Malaika for filling my heart with joy.
iv

v
Summary
The World Health Organization (WHO) reported that because of antibiotic resistance, diseases that
were previously essentially under control may soon pose a severe global risk to human health. The
current extensive release of antibiotic resistant bacteria (ARB) and their respective antibiotic
resistance genes (ARG) into the environment is of significant concern. The knowledge about which
factors favour the development of antibiotic resistance in clinical settings has increased in the last
decades but little is known about its driving forces in the environment. The most common
approaches to assess antibiotic resistance in the environment is either to isolate resistant colonies on
agar plates or quantify some indicator ARG by means of quantitative PCR (qPCR). As biological
contaminants, ARG exhibit different behaviour and fate in various environmental media, since their
abundance and composition may change depending on the physiological status of their hosts.
Therefore, knowing the ARG hosts is of interest in order to understand the mechanisms underlying
the spread of ARG in the environment. Among all phenomena related to the hosts taking place in
the environment, horizontal gene transfer (HGT) of ARG is of great concern because bacteria that
are pathogenic but susceptible can become resistant and bacteria that were already resistant may
become multi-drug resistant.
Wastewater treatment plants (WWTP) represent an interface between human activities and the
environment and therefore play a key role in the prevention of ARB and ARG spreading. While the
total abundance of ARG decreases during wastewater treatment, an increase in the relative
abundance of some ARG usually takes place in WWTP. Although quantities of some ARG
significantly decrease during wastewater treatment process, the concentrations of these resistance
genes in the effluent are still high. The incomplete removal of antibiotics and ARG in WWTP
severely affects the receiving river, where both types of emerging pollutants are found at higher
concentration in downstream waters than in samples collected upstream from the discharge point.
Constructed wetlands (CW) constitute a near-natural wastewater treatment technology in operation
around the world. CW are viewed both as alternative wastewater treatment option for removal of
ARB and ARG and as a near natural habitat to investigate their environmental fate. Horizontal
subsurface flow constructed wetlands (HSSF-CW) are the most common type of CW built
worldwide due to its technical simplicity, low costs of implementation, and low energy and
maintenance requirements. As oxygen is one of the main limiting factors in the removal of organic
matter and ammonium through HSSF-CW, aeration of these systems constitutes an improvement for
vi
wastewater treatment. In this work, the effects of aeration on antibiotic resistance in CW was
addressed. For that, two HSSF-CW at the Ecotechnology Research Facility in Langenreichenbach
(UBZ), Germany were compared: one standard HSSF-CW (H50p) and an aerated HSSF-CW
(HAp).
With the aim of evaluating the performance of the aerated CW regarding removal of ARB and ARG
in comparison with an standard CW and to study HGT of ARG, the antimicrobials
sulfamethoxazole (SMX) and trimethoprim (TMP) were chosen. Five genes were selected: 16S
rRNA gene which is useful to quantify total bacterial abundance; sul1, sul2 and dfrA1 which are
ARG that give resistance to the aforementioned antibiotics and intI1, a gene which is related to
ARG and mobile genetic elements (MGE). A multiphasic approach was applied, making use of
culture- dependent and independent methods to analyse samples from in- and outflows as well as
from internal points in both CW. Comparing in- and outflows, both CW showed higher reductions
of ARG/ARB than what was observed for HSSF-CW before, and aeration was beneficial for the
total reduction of ARB and ARG. ARB were identified as members of Enterobacteriaceae,
Pseudomonas, Aeromonas and Enterococcus, whereas ARG hosts belonged to members of
Enterobacteriaceae and Aeromonas, the other two groups rarely carried them. As Escherichia coli
and Aeromonas were common hosts of the selected ARG, additional analysis were carried out for
this bacteria.
The investigated CW showed different internal behaviour. While the trend in reduction was gradual
in H50p, at the beginning of HAp high aerobic metabolism took place and an increase in intI1 and
sul genes abundances was seen. Copy numbers of 16S rRNA gene remained almost constant and
dfrA1 decreased, indicating that the increase in intI1 and sul genes abundances was specific. Cells
carrying more than one type of class 1 integron in the first half of HAp showed higher diversity than
in the inlet and the rest of HAp, accounting for a higher integrase activity. Because of their very low
concentrations and the absence of statically significant differences between the CW, the presence of
SMX/TMP in the media was unlikely the cause for the difference in antibiotic resistance observed
between the CW, even though a synergistic effect can’t be discarded. It is known that reactive
oxygen species (ROS) can increase HGT through activation of the SOS system and they are more
abundant in HAp than in H50p. Based on the data from this study and on what was known from
other studies, oxidative stress is proposed as an important factor for increasing HGT of ARG in
wastewater treatment plants.
vii

Zusammenfassung
Die Weltgesundheitsorganisation berichtete, dass Krankheiten die zuvor im Wesentlichen unter
Kontrolle standen, aufgrund von Antibiotikaresistenzen bald ein schwerwiegendes globales Risiko für
die menschliche Gesundheit darstellen können. Die derzeitige weitreichende Freisetzung von
Antibiotika-resistenten Bakterien (ARB) und ihrer jeweiligen Antibiotika-Resistenzgene (ARG) in
die Umwelt gibt Anlass zu großer Sorge. Das Wissen darüber, welche Faktoren die Entwicklung von
Antibiotika-Resistenzen im klinischen Umfeld begünstigen, hat in den letzten Jahrzehnten
zugenommen, während über die treibenden Kräfte in der Umwelt wenig bekannt ist. Der
gebräuchlichste Ansatz zur Bewertung der Antibiotikaresistenz in der Umwelt besteht in der
Quantifizierung bestimmter Indikator-ARG mittels quantitativer PCR (qPCR). Als biologische
Schadstoffe weisen ARG in verschiedenen Umweltmedien ein unterschiedliches Verhalten auf, da
sich ihre Häufigkeit und Zusammensetzung mit dem physiologischem Zustand ihrer Wirte ändern
kann. Daher ist es wichtig, die ARG-Wirte zu kennen, um die Mechanismen zu verstehen, die der
Verbreitung von ARG in der Umwelt zugrunde liegen. Unter allen in der Umwelt stattfindenden
Phänomenen die sich auf die Wirte beziehen, ist der horizontale Gentransfer (HGT) von ARG der
bedeutendste. Dadurch können Bakterien die pathogen, aber anfällig sind, resistent und bereits
resistente Bakterien multiresistent werden.
Kläranlagen bilden die Schnittstelle zwischen menschlichen Aktivitäten und der Umwelt und spielen
daher eine Schlüsselrolle bei der Verhinderung der Ausbreitung von ARB und ARG. Während die
Gesamtmenge an ARG in der Abwasserbehandlung abnimmt, findet in Kläranlagen normalerweise
eine Zunahme der relativen Häufigkeit von einigen ARG statt. Obwohl die Mengen einiger ARG
während der Abwasserbehandlung deutlich abnehmen, sind die Konzentrationen dieser Resistenzgene
im Abwasser immer noch hoch. Die unvollständige Entfernung von Antibiotika und ARG in der
Kläranlage wirkt sich schwerwiegend auf den aufnehmenden Fluss aus. Beide Arten von
Schadstoffen kommen in höherer Konzentration in flussabwärts gelegenen Gewässern vor als in
Proben, die stromaufwärts von der Einleitstelle entnommen werden.
Pflanzenkläranlagen (PKA) bilden eine nahezu natürliche Abwasserbehandlungstechnologie, die
weltweit eingesetzt wird. PKA werden sowohl als alternative Abwasserbehandlungsoption zur
Entfernung von ARB und ARG, als auch als natürlicher Lebensraum zur Untersuchung ihres
Umweltverhaltens betrachtet. Horizontal durchströmte Pflanzenkläranlagen (HDS-PKA) sind
aufgrund ihrer technischen Einfachheit, niedrigen Implementierungskosten und niedrigen Energie-
und Wartungskosten die weltweit am häufigsten genutzte PKA. Da Sauerstoff einer der
viii
Begrenzungsfaktoren für die Entfernung von organischem Material durch HDS-PKA ist, stellt die
Belüftung dieser Systeme eine Verbesserung für die Abwasserbehandlung dar. In dieser Arbeit
wurden die Auswirkungen der Belüftung auf Antibiotikaresistenzen in PKA untersucht. Dafür wurden
eine standard HDS-PKA (H50p) und eine belüftete HDS-PKA (HAp) miteinander verglichen.
Mit dem Ziel, die Leistung der belüfteten PKA hinsichtlich der Entfernung von ARB und ARG zu
bewerten und die HGT von ARG in der PKA zu untersuchen, wurden die antimikrobiellen-Stoffe
Sulfamethoxazol (SMX) und Trimethoprim (TMP) ausgewählt. Fünf Gene wurden ausgesucht: das
16S-rRNA-Gen, ein Gen die Gesamtbakteriengemeinschaft quantifiziert, sul1, sul2 und dfrA1 welche
ARG sind die Resistenzen gegen die zuvor genannten Antibiotika geben; und intI1, ein Gen das mit
ARG und mobilen genetischen Elementen (MGE) verwandt ist. Eine mehrphasige Methode wurde
eingesetzt, die kulturabhängige und -unabhängige Methoden zur Analyse von Proben beim Ein- und
Ausstritt, sowie von internen Punkten in beiden PKA verwendet. Beim Vergleich von Ein- und
Ausströmseite zeigten beide untersuchten PKA eine stärkere Reduktion von ARG/ARB als zuvor für
HDS-PKA beobachtet wurde und die Belüftung schien für den gesamten Abbau von ARB und ARG
vorteilhaft zu sein. ARB wurden als Bestandteil von Enterobacteriaceae, Pseudomonas, Aeromonas
und Enterococcus identifiziert. Während ARG-Wirte zu Enterobacteriaceae und Aeromonas
gehörten, trugen sie die anderen beiden Gruppen nur selten. Da E. coli und Aeromonas häufige Wirte
des ausgewählten ARG waren, wurden zusätzliche Analysen für diese Bakterien durchgeführt.
Die PKA zeigten ein unterschiedliches internes Verhalten. Während die Tendenzen zum Abbau bei
H50p konstant waren, trat in dem ersten Bereich von HAp ein starker aerober Metabolismus auf und
es wurde eine Zunahme der int11 und sul Gene beobachtet. Das 16S rRNA Gen blieb nahezu konstant
und dfrA1 nahm ab, was darauf hindeutet, dass die Zunahme der intI1 und sul Gene Abundanzen
spezifisch war. Zellen, die mehr als eine Klasse-1-Integron-Kopie trugen, zeigten im ersten Bereich
von HAp eine größere Diversität als im Einlass und im Rest von HAp auf, was auf einer erhöhten
Integrase-Aktivität hindeutet. Aufgrund ihrer sehr niedrigen Konzentration und des Ausbleibens der
statistisch signifikanten Unterschiede zwischen den PKA, war die Ursache für den beobachteten
Unterschied in der Resistenz zwischen den PKA um Vorhandensein von SMX/TMP in den Medien
unwahrscheinlich, obwohl ein synergistischer Effekt nicht ausgeschlossen werden kann. Reaktive
Sauerstoffspezies (ROS) können HGT durch Aktivierung des SOS-Systems erhöhen und sie sind
häufiger in HAp als in H50p vorhanden. Basierend auf den Daten aus dieser Studie und auf dem, was
bekannt war, wird oxidativer Stress als wichtiger Faktor für die Erhöhung der HGT von ARG in
Kläranlagen vorgeschlagen.
ix

Contents
Acknowledgements............................................................................................................................iv
Summary............................................................................................................................................vi
Zusammenfassung...........................................................................................................................viii
List of acronyms and abbreviations...............................................................................................xiii
List of tables......................................................................................................................................xv
List of figures..................................................................................................................................xvii
Glossary............................................................................................................................................xxi
1. Introduction....................................................................................................................................1
1.1. Antibiotic resistance as a major worldwide health threat.........................................................1
1.2. The role of horizontal gene transfer in antibiotic resistance.....................................................4
1.3. Antibiotic resistant bacteria and antibiotic resistance genes in the aquatic environment.........8
1.4. Constructed wetlands as a near-natural approach to treat wastewater......................................9
1.5. Bacterial strategies to cope with oxidative stress can pose a risk for human health..............13
1.6. Methodological approaches to study antibiotic resistance in the environment......................15
1.6.1. Antibiotic resistance: indicator bacteria and indicator genes.......................................17
1.6.2. Tracking horizontal gene transfer..................................................................................18
2. Objectives......................................................................................................................................20
3. Materials and methods.................................................................................................................22
3.1. Constructed wetlands at the ecotechnology in Langenreichenbach.......................................22
3.2. Samples and standard wastewater parameters........................................................................24
3.3. Chemical analysis of antibiotics.............................................................................................25
3.4. Isolation of resistant bacteria..................................................................................................27
3.5. Characterization of SMX/TMP resistant isolates...................................................................27
x

3.6. Phylogenetic trees...................................................................................................................30
3.7. Quantitative PCR analysis......................................................................................................30
3.8. Quantification of specific bacteria..........................................................................................32
3.9. Statistics..................................................................................................................................32
3.10. Set up of emulsion, paired isolation and concatenation PCR (epicPCR).............................32
4. Research output............................................................................................................................36
4.1. Fate of antibiotic resistance in CW: technology evaluation...................................................36
4.1.1. Effect of aeration on the reduction of antibiotic resistance in an HSSF-CW.................38
4.1.1.1 Wastewater standard parameters and antibiotics concentration....................................38
4.1.1.2 Reduction of antibiotic resistance genes and antibiotic resistant bacteria..................43
4.1.2. Discussion.......................................................................................................................53
4.1.3. Conclusion......................................................................................................................57
4.2. Fate of antibiotic resistance in CW: internal behaviour..........................................................60
4.2.1. Effect of physicochemical parameters on antibiotic resistance......................................60
4.2.2. The role of aeration in horizontal gene transfer of ARG................................................62
4.2.2.1 Standard wastewater parameters within H50p and HAp.............................................62
4.2.2.2 Abundance of 16S rRNA gene and ARG.......................................................................65
4.2.2.3 Quantification of specific bacteria...............................................................................88
4.2.2.4 Emulsion paired isolation and concatenation PCR (epicPCR)....................................92
4.2.3. Discussion.......................................................................................................................94
4.2.4. Conclusion....................................................................................................................101
5. General discussion and outlook.................................................................................................103
Bibliography....................................................................................................................................104
Appendices.......................................................................................................................................116
Appendix A: Culture media composition....................................................................................117
Appendix B: Raw data.................................................................................................................120
Appendix C: Cassettes sequences................................................................................................129
Curriculum vitae............................................................................................................................132
xi

xii

List of acronyms and abbreviations
AIA Aeromonas isolation agar
ARB Antibiotic resistant bacteria
ARG Antibiotic resistance gene(s)
AMR Antimicrobial resistance
APS Ammonium persulfate
BLD Below the level of detection
bp Base pairs
C-BOD5 5-day carbonaceous biochemical oxygen demand
CFU Colony forming units
CFUR Antibiotic resistant colony forming units
CFUSMX Sulfamethoxazol resistant colony forming units
CFUTMP Trimethoprim resistant colony forming units
CW Constructed wetland(s)
DHF Dihydrofolate
DO Dissolved oxygen
EA Endoagar
EDTA Ethylenediaminetetraacetic acid
e.g. exempli gratia: for example
epicPCR Emulsion paired isolation and concatenation PCR
HAp Horizontal aerated planted
H50p Horizontal 50 cm deep
HGT Horizontal gene transfer
HLR Hydraulic loading rate
HRT Hydraulic retention time
HSF Horizontal surface flow
HSSF Horizontal sub-surface flow
ICE Integrative and conjugative element(s)
i.e. id est: that is
IS Insertion sequence(s)
kb Kilo base pairs
kow Octanol-water partition coefficient
LODi/m Instrumental/methodological limit of detection
LMIC Low and middle income countries
xiii

LRB Langenreichenbach
MDR Multi-drug resistance
MGE Mobile genetic element
MH Müller-Hinton
MIC Minimal inhibitory concentration
N4-Ac-SMX N4-acetylsulfamethoxazole
NGS Next generation sequencing
OCR Oxygen consumption rate
OECD The Organisation for Economic Co-operation and Development
OLR Organic loading rate
Orf Open reading frame
OTU Operational taxonomic unit(s)
PABA para-amino benzoic acid
PIA Pseudomonas isolation agar
PKA Pflanzenkläranlage(n)
ROS Reactive oxygen species
rpm Revolutions per minute
SF Surface flow
SMX Sulfamethoxazole
SPE Solid-phase extraction
spp. species pluralis: multiple species
TEMED Tetramethylethylenediamine
THF Tetrahydrofolate
TKN Total kjeldahl nitrogen
TMP Trimethoprim
TSS Total suspended solids
UBZ Environmental and Biotechnology Centre of the UFZ
VSF Vertical surface flow
WHO World health organization
WWTP Wastewater treatment plant
xiv

List of tables
Table 1| Design and operating details for the two sampled CW.........................................................22
Table 2| Inflows, outflows and rain volume for the months in which sampling took place...............23
Table 3| Characteristics of the target antibiotics and the HPLC-MS-MS method..............................26
Table 4| Description of primers used in this study.............................................................................28
Table 5| Number of isolates analysed.................................................................................................29
Table 6| Fusion PCR primers for epicPCR.........................................................................................34
Table 7| Nested/semi-nested-Illumina PCR primers for epicPCR......................................................35
Table 8| Standard wastewater parameters of the in- and outflows of HAp and H50p........................38
Table 9| Micropollutants median concentrations for the in in- and outflows for HAp and H50p......39
Table 10| Areal removal rates for HAp and H50p..............................................................................40
Table 11| Median total abundance and relative abundance of total colony forming units on Mueller-
Hinton agar and sulfamethoxazole.....................................................................................................44
Table 12| Median total abundance and relative abundance of total colony forming units and
trimethoprim.......................................................................................................................................45
Table 13| Gene abundances. Median, minimal and maximal values for the inlet and outflows for
HAp and H50p....................................................................................................................................51
Table 14| Gene cassettes types inserted in class 1 integrons in the studied isolates...........................86
Table 15| Gene cassettes types inserted in class 1 integrons for the different sampling points..........87
Table 16| Agarose pictures of the PCR products of the last step of epicPCR before Illumina
sequencing..........................................................................................................................................93
xv

xvi

List of figures
Figure 1| Antibiotics mode of action....................................................................................................1
Figure 2| Mechanisms of antibiotics resistance....................................................................................2
Figure 3| Antibiotics and antibiotic resistance genes selected..............................................................3
Figure 4| Different mechanisms of horizontal gene transfer................................................................5
Figure 5| General structure of integrons class 1...................................................................................7
Figure 6| Antibiotic resistance and water cycle....................................................................................8
Figure 7| Schematic representation of a horizontal sub surface flow constructed wetland................10
Figure 8| Scheme of oxygen fluxes in constructed wetlands wastewater treatment..........................12
Figure 9| Reactive oxygen species formation.....................................................................................13
Figure 10| Dependence of H2O2 production on percentage of air saturation and the number of DNA
breaks as a function of H2O2 concentration .....................................................................................14
Figure 11| Multiphasic approach to study horizontal gene transfer in the environment....................19
Figure 12| Sampling schema and pictures of the constructed wetlands.............................................25
Figure 13| Mean areal removal rates for N4-acetyl-sulfamethoxazole, sulfamethoxazole and
trimethoprim for H50p and HAp........................................................................................................42
Figure 14| Median log reductions of colony forming units growing in the absence of antibiotics, on
sulfamethoxazole and on trimethoprim for HAp and H50p...............................................................46
Figure 15| Mean areal removal rates of colony forming units on Mueller-Hinton agar without
antibiotics, with sulfamethoxazole and with trimethoprim for H50p and HAp.................................46
Figure 16| Phylogenetic tree of sequenced sulfamethoxazole resistant bacteria and reference strains..
............................................................................................................................................................49
xvii

Figure 17| Phylogenetic tree of identified trimethoprim resistant bacteria and reference strains. .. . .50
Figure 18| Median log reduction for intI1, sul1, sul2, dfrA1 and 16S rRNA gene for the outlet of
H50p and the outlet of HAp compared to the literature on HSSF-CW..............................................52
Figure 19| Mean log10 areal removal rate for intI1, sul1, sul2, dfrA1 and 16S rRNA gene for H50p
and HAp..............................................................................................................................................52
Figure 20| Median abundance of intI1, sul1, sul2, dfrA1 relative to 16S rRNA gene for inlet, H50p
outlet and HAp outlet.........................................................................................................................53
Figure 21| Main research question......................................................................................................61
Figure 22| Mean dissolved oxygen and carbonaceous oxygen demand along the flow path.............62
Figure 23| Mean nitrogenous compounds along the flow path for HAp............................................63
Figure 24| Sulfamethoxazole and N4-acetylsulfamethoxazole concentrations for the inlet, HAp and
H50p...................................................................................................................................................64
Figure 25| Trimethoprim concentration for the inlet, HAp and H50p................................................64
Figure 26| 16S rRNA gene abundances measured by qPCR along the flow path. Inlet in shown in
brown, H50p in green and HAp in blue.............................................................................................65
Figure 27 | Absolute gene abundances measured by qPCR along the flow path................................66
Figure 28 | Fold change of gene abundances along the flow path......................................................67
Figure 29| intI1 abundance relative to 16S rRNA gene vs. 16S rRNA gene abundance....................68
Figure 30| Abundance of intI1 measured by qPCR along the flow path............................................68
Figure 31| Proportion of the gene hosts grouped in the main three hosts types detected by
sequencing of the resistant (SMX and TMP) isolates in percentage..................................................69
Figure 32| Mueller-Hinton agar colony forming units counting and colony-PCR survey along the
flow path.............................................................................................................................................70
xviii

Figure 33| Endoagar colony forming units counting and colony-PCR survey along the flow path...71
Figure 34| Pseudomonas isolation agar colony forming units counting and colony-PCR survey along
the flow path.......................................................................................................................................72
Figure 35| Genotypes of sulfamethoxazole resistant bacteria isolated from the same sampling day
on Mueller-Hinton agar, Pseudomonas isolation agar and Endoagar along the flow path.................74
Figure 36| Phylogenetic tree of sequenced sulfamethoxazole resistant bacteria from Mueller-Hinton
media and reference strains................................................................................................................75
Figure 37| Phylogenetic tree of sequenced sulfamethoxazole resistant bacteria from endoagar media
and reference strains...........................................................................................................................76
Figure 38| Phylogenetic tree of sequenced sulfamethoxazole resistant bacteria from Pseudomonas
isolation agar media and reference strains..........................................................................................77
Figure 39| Mueller-Hinton agar colony forming units counting and colony-PCR survey along the
flow path.............................................................................................................................................78
Figure 40| Endoagar colony forming units counting and colony-PCR survey along the flow path...79
Figure 41| Pseudomonas isolation agar colony forming units counting and colony-PCR survey along
the flow path.......................................................................................................................................80
Figure 42| Genotypes of trimethoprim bacteria isolated from the same sampling day on Mueller-
Hinton agar, Pseudomonas isolation agar and Endoagar along the flow path....................................82
Figure 43| Phylogenetic tree of sequenced trimethoprim resistant bacteria from Mueller-Hinton
media and reference strains................................................................................................................83
Figure 44| Phylogenetic tree of sequenced trimethoprim resistant bacteria from endoagar media and
reference strains..................................................................................................................................84
Figure 45| Phylogenetic tree of sequenced trimethoprim resistant bacteria from Pseudomonas
isolation agar media and reference strains..........................................................................................85
xix
Figure 46| Class 1 integrons diversity of polycarriers isolates along the flow path for inlet, HAp and
H50p...................................................................................................................................................86
Figure 47| Escherichia coli abundance along the flow path, measured by qPCR, most probable
number and colony forming units.......................................................................................................88
Figure 48| Resistant E. coli quantified by colony forming units on endoagar with the addition of
antibiotics along the flow path...........................................................................................................89
Figure 49| Aeromonas spp abundance along the flow path, measured by qPCR and colony forming
units....................................................................................................................................................90
Figure 50| Resistant Aeromonas spp. quantified by colony forming units on Aeromonas isolation
agar with the addition of antibiotics along the flow path...................................................................91
Figure 51| Polyacrilamyde beads from a pure culture of an isolate obtained from the studied
constructed wetlands..........................................................................................................................94
Figure 52| Molecular mechanisms linking oxidative stress with an increased diversity in class 1
integrons and the observable consequence of it.................................................................................99
Figure 53| Molecular mechanisms linking oxidative stress with an increased horizontal gene transfer
of an int gene on the ICE SXT and the observable consequence of it.............................................100
xx

Glossary
Antibiotic: Antimicrobial substance active against bacteria. In the original definition, an antibiotic
was produced by one microorganism that selectively inhibits the growth of another. Synthetic
antibiotics, usually chemically related to natural antibiotics, have since been produced that
accomplish comparable tasks. Antibiotics can be bactericidal or bacteriostatic.
Antimicrobial: Agent that kills microorganisms or stops their growth. Includes antibiotics,
antifungals, antiprotozoals, and antivirals.
Cometabolism: Ability of a microorganism to biodegrade a pollutant without using it as a growth-
substrate (non-growth-substrate), while sustaining its own growth by assimilating a different substrate
(growth-substrate).
Conjugation: Horizontal gene transfer that involves the physical contact of two cells. Often mediated
by plasmids.
Co-resistance: Concomitant resistance to different antibiotics. It occurs when antibiotic resistance
genes are located in the same cell. Furthermore, these genes can be located on the same mobile
genetic element (MGE) (e.g. plasmid pB10 encodes for resistance against amoxicillin, streptomycin,
sulfonamides and tetracycline).
Cross resistance: Single resistance mechanism confers resistance to several antibiotics of the same
class (e.g. efflux pump MexAB-OprM confers resistance against sulfonamides and trimethoprim).
Dormant state: Reversible state of low metabolic activity after facing with unfavourable
environmental conditions.
Enrichment: Favouring the growth of a particular microorganism or group of microorganisms over
others.
gyrB: Gene that codifies for the subunit B of the DNA gyrase. The DNA gyrase is an enzyme that
reduces topological strain while double-stranded DNA is being unwound.
Integrative and conjugative elements (ICE): Selftransmissible mobile genetic elements. Similar to
conjugative plasmids, ICE transfer via conjugation but, unlike plasmids, do not replicate
independently from the chromosome.
Metagenome: All the genetic material present in an environmental sample.
MexAB-OprM: Multidrug efflux pump. MexA is the membrane fusion protein; MexB is the inner
membrane transporter; and OprM is the outer membrane channel.
xxi

Microbiota: The entire collection of microorganisms in a specific environment. It often implies
microorganisms living in the guts of animals and when the open environment is referred, the
adjective environmental is added.
Micropollutant: Anthropogenic chemicals that occur in the (aquatic) environment above a (potential)
natural background level due to human activities but with concentrations remaining at trace levels
(i.e. up to the microgram per litre range).
Mobile genetic element: Segments of DNA that encode enzymes and other proteins that mediate the
movement of DNA within genomes (intracellular mobility) or between bacterial cells (intercellular
mobility). Examples: plasmids, insertion sequences (IS), transposons, integron-associated gene
cassettes and bacteriophages.
Mobilome: The total pool of mobile genes in the metagenome.
Multi-drug resistance: Resistance against at least three classes of antibiotics.
One health approach: Is a term used to describe a principle which recognises that human and animal
health are interconnected, that diseases are transmitted from humans to animals and vice versa and
must therefore be tackled in both. The One Health approach also encompasses the environment,
another link between humans and animals and likewise a potential source of new resistant
microorganisms.
Resistance gene: A gene that confers resistance to antibiotics when it is present and that increases
susceptibility to antibiotics when it is absent.
Resistome: Collection of all the antibiotic resistance genes in both pathogenic and non-pathogenic
bacteria.
Selection: Inhibition of the growth of certain bacteria.
SOS system: A generalized response to DNA damage that is exhibited by many bacteria.
SXT: Integrative and conjugative mobile element (ICE) with more than 1000 kb which encodes
resistance to multiple antibiotics, including trimethoprim and sulfamethoxazole.
Transformation: Horizontal gene transfer mediated by the uptake of naked DNA.
Transduction: Horizontal gene transfer mediated by phages.
uidA: Gene that codifies for the enzyme beta-glucuronidase, which catalizes the breakdown of
complex carbohydrates.
xxii

1. Introduction
1.1. Antibiotic resistance as a major worldwide health threat
Antibiotics are one of the most important discoveries of modern medicine and, together with
vaccines, have played a key role in the increase of human life expectancy. In the early 1900s, the
scientist Paul Ehrlich developed the concept of selective toxicity, the ability of a chemical to inhibit
or kill pathogenic microorganisms without adversely affecting the host. In the past century a variety
of antibiotics with different modes of action have been discovered and synthesised (Figure 1). Some
of them, like penicillins, interfere with the cell wall synthesis while others inhibit the enzyme DNA
gyrase which in turn stops DNA replication. Other antibiotics like chloramphenicol and kanamycin
interfere with ribosomal function, which is the synthesis of proteins. This work focuses on
sulfonamides and trimethoprim, which inhibit the synthesis of tetrahydrofolate, a compound
necessary for the synthesis of DNA, RNA and proteins.
Figure 1| Antibiotics mode of action. Antibiotics can hinder bacterial growth by inhibiting nucleic acid orprotein synthesis, interfering with cell wall or cytoplasmic membrane synthesis. PABA: para-amino benzoicacid, DHF: dihydrofolate, THF: tetrahydrofolate. Adapted from Gullberg et al., 2011.
However, life struggles to prevail in every being, and bacteria are not an exception. These have
developed strategies to escape from the effects of antimicrobial agents, and bacteria that survive and
multiply in the presence of antibiotics are becoming more and more common. Some of the
mechanisms of antibiotics resistance are shown in Figure 2. Some mechanisms like a decreased
1

uptake and efflux pumps can be unspecific and therefore protect the cells against diverse damaging
substances. Other mechanisms are specific and act against a particular class of molecules. One
example of this type of resistance is based on the synthesis alternative enzymes with a higher
affinity for the actual substrate than for the antibiotic, which is the mechanisms this work focuses is
on.
Although resistance was present before the use of antibiotics in medicine, the rates at which it
develops and spreads have increased in the last decades (Xie et al., 2018). In a recent report, The
Organisation for Economic Co-operation and Development (OECD) estimated that 2.4 million
people in Europe, North America and Australia will die from infections with resistant
microorganisms in the next 30 years (OECD, 2018). In low and middle income countries (LMIC)
the situation does not look better. In Brazil and Indonesia 40–60% of infections are already caused
by resistant microorganisms. The World Health Organization (WHO), that has been warning about
antibiotic resistance as a major global health issue since 2014, reported that diseases that were
previously essentially under control may soon pose a severe global risk to human health (World
Health Organization, 2014). Particularly alarming is the rise and the spreading of multi-drug
resistant pathogenic bacteria, which pose a major challenge for the treatment of infections (Aslam et
al., 2018).
Figure 2| Mechanisms of antibiotics resistance. Antibiotics can hinder bacterial growth by inhibitingnucleic acid or protein synthesis and interfering with cell wall or cytoplasmic membrane synthesis.Resistance mechanisms are efflux pumps, target alterations, inactivating enzymes and a decreased uptake ofantibiotics. Adapted from Madigan et al., 2012.
2

The first antimicrobials used systemically in human medicine were sulfonamides. The antimicrobial
effect of sulfonamides was first discovered in 1935 by Gerhard Domagk, and since then diverse
sulfonamides have been used to treat animal and human infections. Sulfamethoxazole (SMX) is a
widely used sulfonamide (Figure 3) and is often taken in combination with trimethoprim (TMP) in a
mass proportion 5:1 (co-trimoxazole) in order to increase their effectiveness (Bushby and
Hitchings, 1968). This combination is part of the WHO core list of essential medicines, which
presents a myriad of minimum medicine needs for a basic health‐care system, listing the most
efficacious, safe and cost–effective medicines for priority conditions. In a long term project called
ANTI-Resist in Dresden, Germany this combination made up 10-20% of the antibiotics prescribed
for infections in human medicine. Both antibiotics and other sulfonamides have been detected in
several rivers in Europe (Johnson et al., 2015) and are introduced into the environment through
farmyard manure and domestic wastewater (Hannappel et al., 2016).
Figure 3| Antibiotics and antibiotic resistance genes selected. Sulfamethoxazole and trimethoprim inhibitthe metabolic pathway of tetrahydrofolic acid. On the left side of the figure the chemical structure of theantibiotics SMX and TMP are given and on the right, the names of their respective resistance genes sul1,sul2 and dfrA1.
Some years after the introduction of sulfonamides, sulfonamide resistant bacteria were reported for
the first time (Davies and Davies, 2010). Since then, different resistance genes for sulfonamides as
well as for TMP have been identified. The specific resistance mechanism relies on genes that
encode for alternative enzymes with an increased affinity for the target (Jahne et al., 2015). Three of
these genes were found for sulfonamide resistance (sul1, sul2 and sul3) (Perreten and Boerlin,
2003) and more than 20 for TMP resistance (Kehrenberg and Schwarz, 2005). The genes sul1 and
3

sul2 are often found at roughly the same frequency (50% each) among sulfonamide resistant Gram-
negative clinical isolates. One reason for this could be that they are both located on very efficient
mobile genetic elements (MGE) for dissemination (Sköld, 2000). In the case of dfrA gene alleles,
their relative frequencies varies and it greatly depends on the origin of the isolates (Seputiene et al.,
2010).
Knowledge about which factors favour the development of antibiotic resistance in clinical settings
has increased in the last decades but little is known about its driving forces in the environment.
While these uncertainties hamper a quantitative risk assessment, the consequences of a transfer of
antibiotic resistant bacteria (ARB) from environmental reservoirs into the human population can be
severe. Fighting antibiotic resistance needs urgent global concerted action. The concept “One
Health Approach” was created in order to emphasize that antibiotics like sulfonamides are used in
human and animal medicine. Both sources of antibiotics and antibiotic resistant bacteria (ARB)
should be taken into account by researchers and policy-makers.
1.2. The role of horizontal gene transfer in antibiotic resistance
The mechanisms underlying bacterial resistance to antimicrobial agents reside in the ability of
bacteria to quickly modify their genomes. When antibiotic resistance was first discovered, multi-
drug resistance was not anticipated. The co-appearance of multiple mutations conferring resistance
was considered to be beyond the evolutionary potential of a given bacterial population (Mazel,
2006). However, bacterial genome’s plasticity is a consequence not only of spontaneous mutations
or genome rearrangements that can occur during the bacterial life cycle, but also of exogenous gene
acquisition through genetic exchange between bacteria and gene capture in integrons (Baharoglu et
al., 2013). Genetic exchange of antibiotic resistance genes (ARG) take place through different
horizontal gene transfer (HGT) mechanisms (Figure 4). While HGT indicates the exchange of
genetic material between already existing bacteria, vertical gene transfer refers to the propagation of
genetic material from a mother cell into daughter cells during cellular division.
Transformation is the uptake, integration, and functional expression of naked fragments of
extracellular DNA. Through specialized or generalized transduction, bacteriophages may transfer
bacterial DNA from a previously infected donor cell to the recipient cell. Conjugation is a process
requiring cell to cell contact via cell surface pili or adhesins, which help to keep the cells close
enough to ensure DNA is transferred from the donor cell to the recipient cell. Even though the
transfer of ARG through conjugation doesn’t necessarily involve plasmids or integrative and
4

conjugative elements (ICE), when it does the probabilities that more bacteria in the community
become resistant increases substantially (Derbyshire and Gray, 2014). Horizontal gene transfer
through conjugation doesn’t need the recombination of the incoming DNA in the new host in order
to be further functional and transferable. Necessary conditions for the transmission of antibiotic
resistance through conjugation are:
1) Cell-to-cell contact (connectivity). That means HGT will be favoured in environments with high
cell density, like biofilms (Balcázar et al., 2015).
2) Time. 3.5-4 minutes are sufficient for HGT of a plasmid to take place (Andrup and Andersen,
1999).
3) Donor-recipient compatibility. HGT is most likely to occur between individuals of the same
species but transfer between rather distantly related bacteria is also possible (Matsushita et al.,
2018).
Figure 4| Different mechanisms of horizontal gene transfer. Conjugation, transformation andtransduction. Adapted from von Wintersdorff et al., 2016.
Furthermore, it is known that many of the individual processes contributing to HGT are responsive
to environmental stress. Some stress sources like antimicrobials (Jutkina et al., 2018), heavy metals
(Zhang et al., 2018) and DNA damaging agents (Beaber et al., 2004) can enhance HGT. The
physical linkage of numerous and functionally diverse groups of genes within a mobile genetic
element (MGE) has implications for their persistence in the environment. Selection that is imposed
5

towards even a single component/gene of an MGE will automatically select for the whole MGE
(co-selection) (Aminov, 2011).
Horizontal gene transfer of ARG is of concern as bacteria that are pathogenic but susceptible can
become resistant and bacteria that were already resistant may become multi-drug resistant. The
extent to which HGT is affected by environmental stressors is uncertain but conditions in
wastewater treatment plants (WWTP) represent a hotspot for it, as both a high concentration of
microorganisms and different sources of stress are present. In fact, wastewater was addressed as one
of the four genetic reactors in antibiotic resistance, together with human and animal microbiota,
hospitals and farms and soil and surface groundwater (Baquero et al., 2008).
Class 1 integrons and horizontal gene transfer of antibiotic resistance genes
Integrons constitute genetic platforms that incorporate open reading frames, known as gene
cassettes, by site-specific recombination and convert them to functional genes by inserting them
downstream a promotor (Mazel, 2006). In that way, they can be transcribed and later expressed as
an active protein. A defining feature of all integrons is a gene coding for a site-specific tyrosine
recombinase called integrase, which can excise and integrate gene cassettes into the variable region
of the integron (Partridge et al., 2009). It can also reshuffle the order of gene cassettes which affects
the relative rate of expression of the individual cassettes (Berglund, 2015). There are over 100
different integron classes and this classification is based on the aminoacids sequence of the
integrase (Deng et al., 2015). Most of the integrons classes are present on bacterial chromosomes
(chromosomal superintegrons) and are found in approximately 10% of sequenced bacterial genomes
(Rapa and Labbate, 2013). Five classes of integrons are present on MGE like plasmids and
transposons (mobile integrons) and are known to play a role in the dissemination of ARG (Mazel,
2006). The high diversity of mobile integrons on plasmids in WWTP was already pointed out by
Tennstedt et al. (2003). Mobile integrons have been detected mainly in Gram-negative isolates,
although they have also been observed in some Gram-positive genera like Staphylococcus (Xu et
al., 2011) and Enterococcus (Nandi et al., 2004).
Among all the integrons, integron class 1 is the most abundant and it belongs to the mobile type.
Because integron class 1 is often on MGE, intI1 abundance can be used as an indicator of the
presence of MGE in a bacterial community (Chen et al., 2015a). The structure of a typical class 1
integron is depicted in Figure 5.
6

Upstream of the gene cassettes the gene intI1 can be found, which codifies for the integrase. There
are several alleles of the integrase and different sets of primers have been developed which are
specific for some of them. For example Mazel et al. (2010) designed primers which detect the
majority of intI1 alleles and Gillings et al. (2015) designed primers which can be used to selectively
amplify clinical alleles. The clinical allele originated recently under anthropogenic selective
pressure and has already spread into diverse pathogenic and commensal bacteria of humans and
their domestic animals. Downstream of the gene cassettes, a typical class 1 integron possesses a 3′ -
conserved region with the genes qacEΔ1 and sul1, encoding resistance to quaternary ammonium
salts and sulfonamides, respectively. The function of Orf5 is still unkown (Deng et al., 2015). The
recombination sites are called attI and attC on the integron and on the gene cassette respectively.
The class 1 integron’s capacity to operate in different hosts is likely the reason why this particular
integron has been successful in its mobilization across different bacteria. This trait and possibly a
great capacity to integrate cassettes with diverse attC sites (Biskri et al., 2005) make this integron an
exception rather than the rule.
Figure 5| General structure of integrons class 1. On the 5’ conserved region intI1 is found (yellow) whichcodifies for an integrase. Pc is the promotor from which gene cassettes are transcribed and P int is the integrasepromotor. Resistance gene sul1 (red), qacEΔ1 and Orf5 are part of the 3' conserved region. attC arerecombination sites where ARG can be inserted, a reaction catalysed by the integrase. attI is therecombination site on the integron. The function of Orf5 is unknown. Adapted from Ravi et al., 2015.
The abundance of intI1 can quickly change in response to environmental pressures, as the class 1
integron is hosted by bacterial species that have rapid generation times and it is often located on
MGE that can be transferred among bacteria. Its abundance has been therefore proposed as a proxy
for anthropogenic pollution (Gillings et al., 2015). The integrase gene is upregulated under cellular
stress, thus increasing the rate at which gene cassettes are mobilized (Michael et al., 2016). This
response of the integrase towards stress is mediated by the SOS system (Guerin et al., 2009). A
bacterium harbouring a class 1 integron is more prone to become multi-drug resistant as it can
easily incorporate gene cassettes which codify for resistance against different classes of antibiotics
7
(Ghaderpour et al., 2015). This potential increases if the bacteria carries two or more class 1
integrons, which might even be placed on the same MGE in a cell (Cambray et al., 2011).
1.3. Antibiotic resistant bacteria and antibiotic resistance genes in the aquatic environment
The current extensive release of ARB and their ARG into the environment is of significant concern.
ARG can be seen as special contaminants in the environment, due to their unique property of being
replicative and the big risk they represent to human and animal health (Pruden et al., 2006).
Because ARG are harboured within microbes and are selected in the presence of antibiotics, they
have the potential to be amplified in response to treatment.
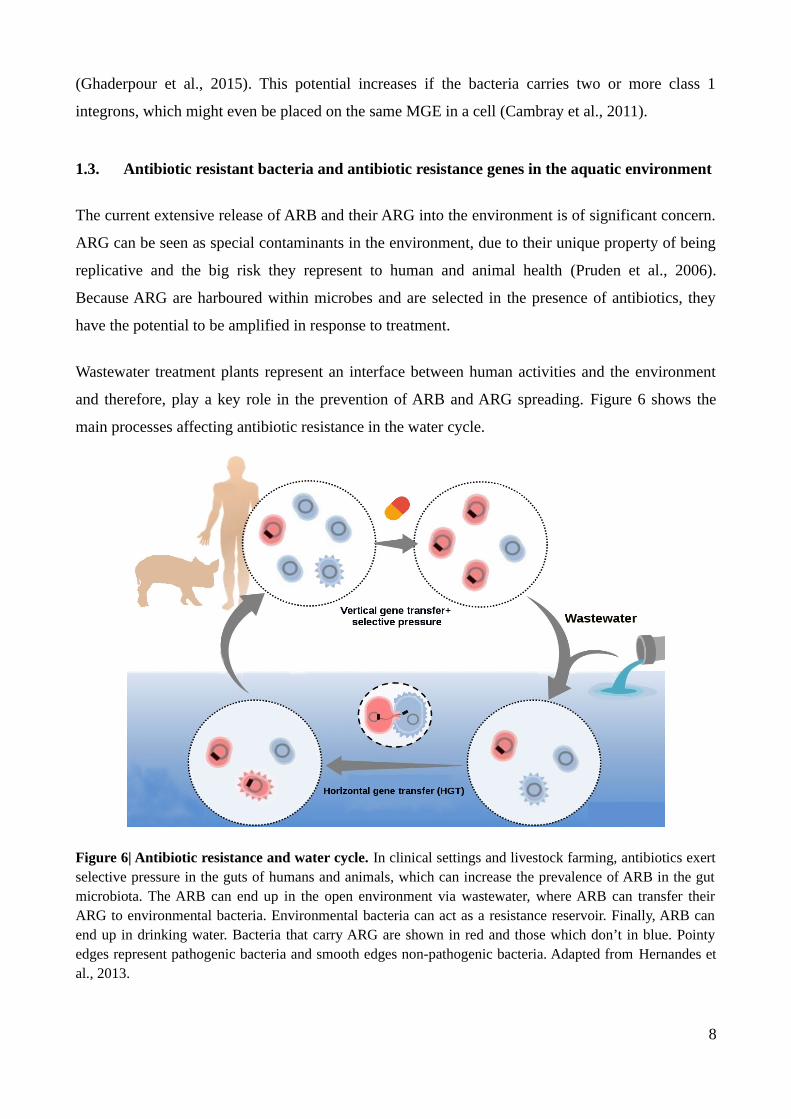
Wastewater treatment plants represent an interface between human activities and the environment
and therefore, play a key role in the prevention of ARB and ARG spreading. Figure 6 shows the
main processes affecting antibiotic resistance in the water cycle.
Figure 6| Antibiotic resistance and water cycle. In clinical settings and livestock farming, antibiotics exertselective pressure in the guts of humans and animals, which can increase the prevalence of ARB in the gutmicrobiota. The ARB can end up in the open environment via wastewater, where ARB can transfer theirARG to environmental bacteria. Environmental bacteria can act as a resistance reservoir. Finally, ARB canend up in drinking water. Bacteria that carry ARG are shown in red and those which don’t in blue. Pointyedges represent pathogenic bacteria and smooth edges non-pathogenic bacteria. Adapted from Hernandes etal., 2013.
8

Even though a clear risk assessment for the whole water cycle can’t be done yet, it has been
observed that the quality of the WWTP effluents affects receiving waters in terms of antibiotic
resistance. Rodriguez-Mozaz et al. (2015) found that the incomplete removal of antibiotics and
ARG in WWTP severely affected the receiving river, where both types of emerging pollutants were
found at higher concentration in downstream waters than in samples collected upstream from the
discharge point. It was noted that the quantities of tet and sul genes significantly decreased during
the wastewater treatment process, but the concentrations of these resistance genes in the effluent
were still high (Jahne et al., 2015). It has been indicated that the abundance of background bacteria
affects the spread of tet genes and sul genes (Liu et al., 2014). This implies that the abundance of
different types of sul genes in the environment would be mainly affected by the content level of
those in pollution sources. Koczura et al. (2016) demonstrated that the frequency of intI1 gene
carriage among total heterotrophic bacteria was significantly higher downstream from the WWTP.
As biological contaminants, ARG exhibit different behaviour and fate in various environmental
media, since their abundance and composition may change with biological activities. For example,
in terms of dissolved oxygen (DO) the lower relative abundance of ARG in the aerobic lagoons with
respect to activated sludge could be simply attributed to a higher abundance of bacterial groups that
do not carry or rarely carry target ARG, such as autotrophic ammonia oxidizing bacteria (Yi et al.,
2017). Whereas the total abundance of ARG decreases during wastewater treatment, an increase in
the relative abundance of at least some ARG usually takes place in WWTP (Guo et al., 2017,
Rodriguez-Mozaz et al., 2015; Liu et al., 2014; Yi et al., 2017). Relative increase might occur
through selection of ARB, acquisition of ARG through HGT or a combination of both (Rizzo et al.,
2013).
1.4. Constructed wetlands as a near-natural approach to treat wastewater
Constructed wetlands (CW) constitute a near-natural wastewater treatment technology in operation
around the world (Hickey et al., 2018; Zhang et al., 2014). They consist of beds that are usually dug
into the ground, lined, filled with a granular medium and planted with emergent macrophytes which
can be fixed to a substrate or floating (Afzal et al., 2019). In the case of fixed macrophytes,
wasteflow paths through the granular medium and comes into contact with biofilms and plant roots
and rhizomes. Compared to conventional treatment systems, CW are low cost, are easily operated
and maintained, and have a strong potential for application in developing countries, particularly by
small rural communities (Kivaisi, 2001).CW are divided into three main types depending on the
9

pattern of wasteflow pathing through the CW: free surface flow (FSF), horizontal subsurface flow
(HSSF) and vertical subsurface flow (VSSF). In FSF systems some flow paths above the substrate.
In a typical HSSF system (Figure 7), wastewater is maintained at a constant depth and flows
horizontally below the surface of the granular medium. HSSF-CW are the most common type of
CW built worldwide due to their technical simplicity, low costs of implementation, and low energy
and maintenance requirements.
In vertical flow systems, wastewater is distributed over the surface of the wetland and trickles
downwards through the granular medium. Vertical systems can be sorted in at least four types
depending on the hydraulic regimes: unsaturated flow (like conventional trickling filters),
permanently saturated flow, intermittent unsaturated flow, and flood and drain wetlands. With the
exception of permanently saturated flow systems, the mode of functioning of the other vertical
systems improves the aeration of the bed in comparison to horizontal flow wetlands. Consequently,
vertical beds operate generally under more oxidized conditions than horizontal beds and are more
efficient, as they can treat higher contaminant loads. Nevertheless, HSSF-CW are often preferred
because they are easier to design than vertical systems (Hoffmann, H. et al., 2011).
Figure 7| Schematic representation of a horizontal sub surface flow constructed wetland. The maincomponents of a CW are the watertight membrane, the filter media and the helophytes. Adapted from Nivalaet al., 2013.
Pilot-scale HSSF-CW have been tested for the removal of organic load (García et al., 2005),
Escherichia coli (Ibekwe et al., 2016), pathogenic microorganisms (Reinoso et al., 2008), nitrogen
and phosphorus (Akratos and Tsihrintzis, 2007), and organic micropollutants (Matamoros and
Bayona, 2006) from rural-municipal wastewater. Sulfonamides constitute micropollutants with low
10

sorption potential to suspended solids and show good removal rates by constructed wetlands (Li et
al., 2014b). They are mostly hydrophilic and were designed to be biologically resistant; they are
therefore expected to mainly remain in the aqueous phase of the wastewater (Michael et al., 2013).
Although little is known about the mechanisms that are responsible for these results, it has been
proposed that plants are important for the bioremediation process (Xian et al., 2010) and that
microorganisms could play an important role as well (Hijosa-Valsero et al., 2011). Of particular
interest are the intermediates and metabolites that derive from these antibiotics, that could be more
persistent and toxic that the original compounds (Michael et al., 2013). These by-products can be
originated by the metabolism of living organisms (Gobel et al., 2007a) and it has been stated that
photolysis could be also an important way of transforming certain sulfonamides, such as
sulfamethoxazol, into another compounds (Trovó et al., 2009). In the case of HSSF-CW photolysis
is not expected to play a role, as wastewater flows protected from sun light.
The removal of organic load can be followed by the biochemical oxygen demand (BOD) test. This
test measures the biodegradable fraction of the wastewater by monitoring the assimilation of
organic material by aerobic microorganisms over a set period of time under controlled conditions
(Gray, 2004). Usually the test is carried out for in five days (BOD5) at 20°C and if a nitrification
inhibitor is added, BOD5 is referred as C-BOD5. Although aeration constitutes a common step in
biological wastewater treatment due to a more efficient organic load removal, CW are not typically
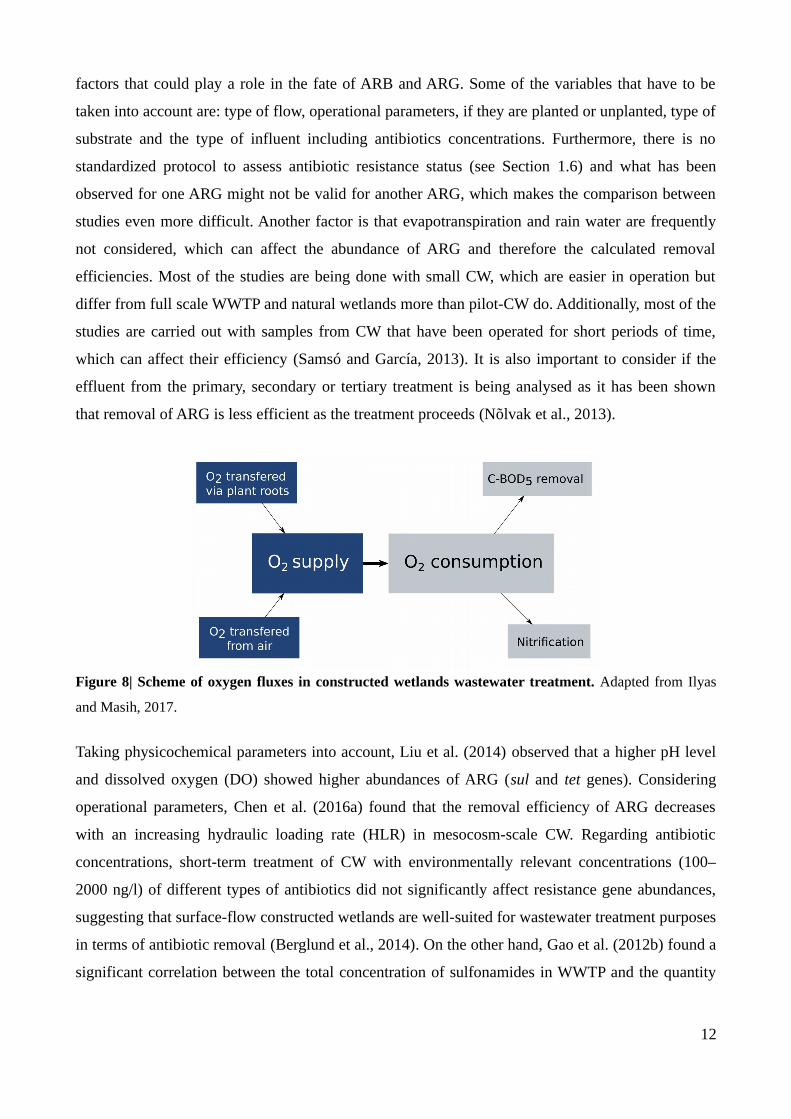
aerated. As oxygen is one of the main limiting factors in the removal of organic matter through
HSSF-CW, aeration of these systems constitutes an improvement for wastewater treatment for the
removal of carbonaceous and nitrogenous compounds (Nivala et al., 2013). On the other hand,
many ARB of simultaneous clinical and environmental relevance are facultative or aerobic bacteria
(Manaia et al., 2018). Therefore it is expected that aeration has an impact on ARB. A scheme of
oxygen fluxes in CW wastewater treatment is shown in Figure 8.
The ability of CW to improve water quality in wastewater effluents depends largely on the bacterial
communities present within them. Horizontal subsurface flow-CW are designed to simulate the
processes that occur in natural wetlands but in a more controlled environment, and contaminants are
removed by a wide range of mechanisms (García et al., 2010). Processes such as ammonia
oxidation, nitrogen fixation and denitrification are mediated by different bacterial taxa (Berglund et
al., 2014). Therefore, CW are viewed both as alternative wastewater treatment option for removal of
ARB and ARG and as a near-natural habitat to investigate their environmental fate. A detailed
literature evaluation on the fate of ARB and ARG in constructed wetlands reveals the multiplicity of
11
factors that could play a role in the fate of ARB and ARG. Some of the variables that have to be
taken into account are: type of flow, operational parameters, if they are planted or unplanted, type of
substrate and the type of influent including antibiotics concentrations. Furthermore, there is no
standardized protocol to assess antibiotic resistance status (see Section 1.6) and what has been
observed for one ARG might not be valid for another ARG, which makes the comparison between
studies even more difficult. Another factor is that evapotranspiration and rain water are frequently
not considered, which can affect the abundance of ARG and therefore the calculated removal
efficiencies. Most of the studies are being done with small CW, which are easier in operation but
differ from full scale WWTP and natural wetlands more than pilot-CW do. Additionally, most of the
studies are carried out with samples from CW that have been operated for short periods of time,
which can affect their efficiency (Samsó and García, 2013). It is also important to consider if the
effluent from the primary, secondary or tertiary treatment is being analysed as it has been shown
that removal of ARG is less efficient as the treatment proceeds (Nõlvak et al., 2013).
Figure 8| Scheme of oxygen fluxes in constructed wetlands wastewater treatment. Adapted from Ilyas
and Masih, 2017.
Taking physicochemical parameters into account, Liu et al. (2014) observed that a higher pH level
and dissolved oxygen (DO) showed higher abundances of ARG (sul and tet genes). Considering
operational parameters, Chen et al. (2016a) found that the removal efficiency of ARG decreases
with an increasing hydraulic loading rate (HLR) in mesocosm-scale CW. Regarding antibiotic
concentrations, short-term treatment of CW with environmentally relevant concentrations (100–
2000 ng/l) of different types of antibiotics did not significantly affect resistance gene abundances,
suggesting that surface-flow constructed wetlands are well-suited for wastewater treatment purposes
in terms of antibiotic removal (Berglund et al., 2014). On the other hand, Gao et al. (2012b) found a
significant correlation between the total concentration of sulfonamides in WWTP and the quantity
12

of sul genes although this correlation was not observed in another study (Yi et al., 2017). The reason
for the different results from theses studies could have been the variation in SMX concentrations
which was between 845.7 and 2101.7 ng/L in the first study and between 62 and 438 ng/L in the
second case.
In terms of HGT in CW, the conditions that are necessary for conjugation (see Section 1.1) can vary
depending on the operational parameters: a high HRT increases the time when a HGT event can
take place and a high organic loading rate (OLR) increases the connectivity. In addition, stress
sources that can be present in wastewater such as heavy metals and sub-inhibitory concentrations of
antimicrobials can increase HGT of ARG (Jutkina et al., 2018; Zhang et al., 2018). However, this
data was obtained in-vitro with higher contaminants concentrations as found normally in
wastewater. In the case of antimicrobials, the concentrations tested were in the range of 0.1-1.0 mg/
L and in the case of heavy metals 0.0001 to 100 mg/L. Oxygen levels can be seen as a operating
parameter and a stress source at the same time (see Section 1.5). It has been seen that the abundance
of sul1 relative to 16S rRNA gene which is a hint of HGT (see Section 1.6.2), increased during
wastewater treatment in CW. This effect was more pronounced in CW with higher oxidizing
capacity (HSF compared to SF and VSF) (Liu et al., 2014; Yi et al., 2017).
1.5. Bacterial strategies to cope with oxidative stress can pose a risk for human health
Environmental changes in oxygen quantities constitute a source of stress. Molecular oxygen (O2) is
small and non-polar, and it diffuses across biological membranes as quickly as through water
(Ligeza et al., 1998). Reactive oxygen species (ROS) are mainly formed in the cell as a by-product
of aerobic metabolism and oxygenic photosynthesis (Figure 9). Flavoproteins, quinones, and iron-
sulfur proteins found in virtually all cells can also catalyse the reduction of oxygen to superoxide.
Thus, whether or not it can respire oxygen, a cell can be exposed to toxic oxygen species from time
to time (Madigan, 2012).
Figure 9| Reactive oxygen species formation. Reactive oxygen species (ROS) are mainly formed in the cellas a by-product of aerobic metabolism and oxygenic photosynthesis. Whether or not it can respire oxygen, acell can be exposed to toxic oxygen species from time to time. Adapted from Imlay, 2013.
13

While some microorganisms circumvent oxidative stress by residing in anaerobic microhabitats, all
others must contend with intracellular O2. The ability to do so varies widely: obligate anaerobes
cannot tolerate oxygen at all, microaerophiles require a low-micromolar O2 concentration, and some
aerobes can thrive in air-saturated fluids. The types of genotoxic stress induced by ROS include
physical damage to the DNA base moiety and the sugar-phosphate backbone of incorporated or
unincorporated (“free”) nucleotides, as well as single- and double-stranded breaks within the double
DNA helix; in addition, DNA can be damaged by by-products of lipid peroxidation. This also holds
true for the facultative anaerobe E. coli (Imlay, 2013). Figure 10 shows H2O2 production in the
presence of aeration for an E. coli strain deficient in catalase/peroxidase, which are enzymes that
catalyse the conversion of ROS into innocuous products for the cell (Korshunov and Imlay, 2010).
Figure 10| Dependence of H2O2 production on percentage of air saturation (left, adapted fromKorshunov and Imlay, 2010) and the number of DNA breaks as a function of H2O2 concentration (right,
adapted from Muiras et al., 1993). The production of H2O2 as a function of oxygen concentration wasstudied for an E. coli strain, whereas DNA breaks were studied using plasmid DNA.
Figure 10 also shows the DNA damage as a function of H2O2 concentration. In this case, plasmid
DNA was used (Muiras et al., 1993). It can be seen that the production of H2O2 is directly
proportional to the dissolved oxygen present in the media. On the other hand, at low concentrations
of H2O2, the amount of DNA breaks per plasmid is proportional to H2O2 concentration. The quantity
of DNA breaks decreases after a certain concentration of H2O2 in the media. It was postulated that
H2O2 has two modes of action: at low concentrations it acts by causing DNA damage and at high
concentrations, by oxidizing other molecules in the cell (Uhl et al., 2015).
14

Cellular strategies have evolved to cope with ROS, and variations in external oxygen concentrations
lead to physiological and molecular changes in order to maintain cellular homoeostasis (Imlay,
2013). Cuny et al. (2005) suggested that ROS play a role in the formation of dormant cells.
Entering the dormant state may be a common adaptive mechanism of bacteria inhabiting different,
stressful environments, instead of a specific mechanism limited to bacteria living in a particular
niche (Pinto et al., 2015). Many bacteria, including a variety of important human pathogens, can
enter into the dormant state in the presence of unfavourable environmental conditions. It has been
suggested to be a survival strategy by which bacteria are able to withstand such conditions. While
the ability to entering a dormant state is advantageous for the survival of bacteria, it poses a risk to
public health. Dormant cells can pose a health risk because they aren’t detected with standard
cultivation tests but can resume growth under appropriate conditions. For some pathogens such as
E. coli the resuscitation can be achieved by a increase in the temperature (Li et al., 2014a).
The mechanism of action of some antibiotics like quinolones involves ROS as a key factor for the
damage of DNA and ultimately lethality (Luan et al., 2017). From an evolutionary perspective,
acquiring defence mechanisms against ROS can protect bacteria against some antibiotics. It has
been already shown that oxidative stress can lead to changes in antibiotic resistance by different
means. On one hand, oxygen is thought to be an agent that in combination with environmental
conditions can lead to a higher mutation rate and de novo acquisition of antibiotic resistance
(Händel et al., 2016). On the other hand, damage of the DNA can activate the cellular SOS system,
which has been linked to higher HGT rates of ARG (Beaber et al., 2004) .
1.6. Methodological approaches to study antibiotic resistance in the environment
Antibiotic resistance has been studied extensively in clinical isolates and the databases of ARB,
their MGE and ARG are dominated by them. There are until now suggestions but no standardized
procedure to monitor antibiotic resistance in wastewater treatment and to quantitatively assess the
risk derived from their release into the environment (Berendonk et al., 2015; Exner and Schwartz,
2015). Although it is important to monitor ARB coming from WWTP as they represent a risk
themselves, until now little is known about which ARG abundances are indicators of health risk. In
order to determine the conditions at which resistance acquisition and selection is likely to occur in
environmental compartments, combined molecular- and culture-based methods are necessary.
Depending on the method that is being used, the antibiotic resistance load estimation may vary.
15
The main advantages of culture-dependent methods are that no sophisticated equipment is needed,
an ARG can be linked to it’s resistant phenotype and ARB can be identified. The major
disadvantage of culture-dependent methods is that few species can be cultivated under standard
conditions. Although the environmental prevalence of ARG primarily depends on the host and the
type of MGE, the estimation of the levels of ARG has been proposed as a reliable and feasible
method to monitor antibiotic resistance (Berendonk et al., 2015). Culture-independent methods like
qPCR of ARG have the advantage of being able to quantify total ARG abundance, independently of
whether their host are able to grow in the laboratory under selective conditions or not. This
technique however doesn’t allow to identify ARG hosts. Metagenomic studies also rely on culture
independent methods which nowadays are largely based on next generation sequencing (NGS)
technologies, like Illumina sequencing. These can reveal both bacterial taxonomy and the different
ARG present in a sample but, although linking species with ARG is possible, it remains challenging
(Burton et al., 2014).
In order to understand the mechanisms underlying the spread of ARG and ARB in the environment
it is of interest to know the hosts outside the hospital walls. The standard procedure for the
identification of ARB and/or ARG hosts is to cultivate bacteria in the presence of antibiotics and to
identify the ones that can grow on the basis of their morphological characteristics or by sequencing
of their 16S rRNA gene. As already mentioned, this approach has the drawback that just a little
proportion of the environmental microbiota is culturable. The non-culturable part is made up of
bacteria that don’t grow in the laboratory under standard conditions and bacteria that are normally
capable to grow under these conditions but are in a non-culturable state. A novel method called
epicPCR (Spencer et al., 2015) allows to link phylogenetic information to predicted function
without culturing and it has already been applied to ARG (Hultman et al., 2018). Another recently
developed method called proximity-ligation Hi-C was also proposed to be appropriate for the same
aim and was tested for wastewater (Stalder et al., 2019). Although these methods give a handful of
useful information, the fact that a bacterium hosts an ARG doesn’t necessarily mean that it is
resistant towards a particular antibiotic. A metaproteomic approach would be more accurate
(Provenzano et al., 2013) to predict antibiotic resistance but this approach doesn’t allow to link
function to taxonomy and just correlations can be made.
16

1.6.1. Antibiotic resistance: indicator bacteria and indicator genes
Although organisations at different levels have developed guidelines for action against
antimicrobial resistance (Adler, N. et al., 2018; European Commission, 2017; World Health
Organization, 2017), to date there no specific requirements concerning ARB and ARG. In Germany,
emissions of ARB and ARG from WWTP have not been regulated, either in terms of regulatory law
(Waste Water Ordinance) or tax law (Waste Water Charges Act). These is in part due to a lack of a
unified protocol for assessing antibiotic resistance. In the attempt to look at the resistance status of a
given environment and/or to evaluate wastewater treatment technologies it is necessary to find
bacteria and genes that serve as indicators. Universal indicators or protocols haven’t been
established so far but there are a myriad of suggestions. Berendonk et al. (2015) and Exner and
Schwartz (2015) have suggested members of the class Gammaproteobacteria or the phylum
Firmicutes as indicator bacteria, as these are the most frequent carriers of acquired ARG. In
particular, Escherichia coli and faecal enterococci have been recommended. They are already being
used to control water quality and are well characterized with regards to antibiotic resistance. Other
indicators were proposed for testing environmental samples in which faecal contamination is not
expected: Pseudomonas aeruginosa, which is being used as water quality indicator and Aeromonas
spp., which are commonly found in aquatic environments (Berendonk et al., 2015).
Koczura et al. (2012) found that class 1 integrons are often found not only in E. coli clinical isolates
(56%) but also in E. coli isolated from environmental sources. Furthermore, in the same study it has
been seen that WWTP effluent contributes to increased frequency of integron-carrying isolates in
the river downstream the WWTP. In a study by Slekovec et al. (2012) it was concluded that,
although WWTP can reduce P. aeruginosa counts in effluent, P. aeruginosa load in the river was
higher downstream from the WWTP. Several ARG linked to class 1 integrons were found in
environmental members of the genus Pseudomonas in contaminated waters (Adelowo et al., 2018).
The Aeromonas spp. mobilome linked to ARG comprises several plasmids of broad host range,
transposons, insertion sequences and class 1 integrons (Piotrowska and Popowska, 2015). Among
multi-drug resistant Aeromonas spp. isolated by Harnisz and Korzeniewska (2018) from water
samples taken upstream, within and downstream a WWTP, the majority (81.1%) were obtained
downstream from the WWTP.
The absolute abundance of indicator genes is an important bit of information about the overall
environmental antibiotic resistance state and for assessing risk associated with their presence.
Indicator genes should be common in anthropogenic sources and scarce in non-contaminated
17
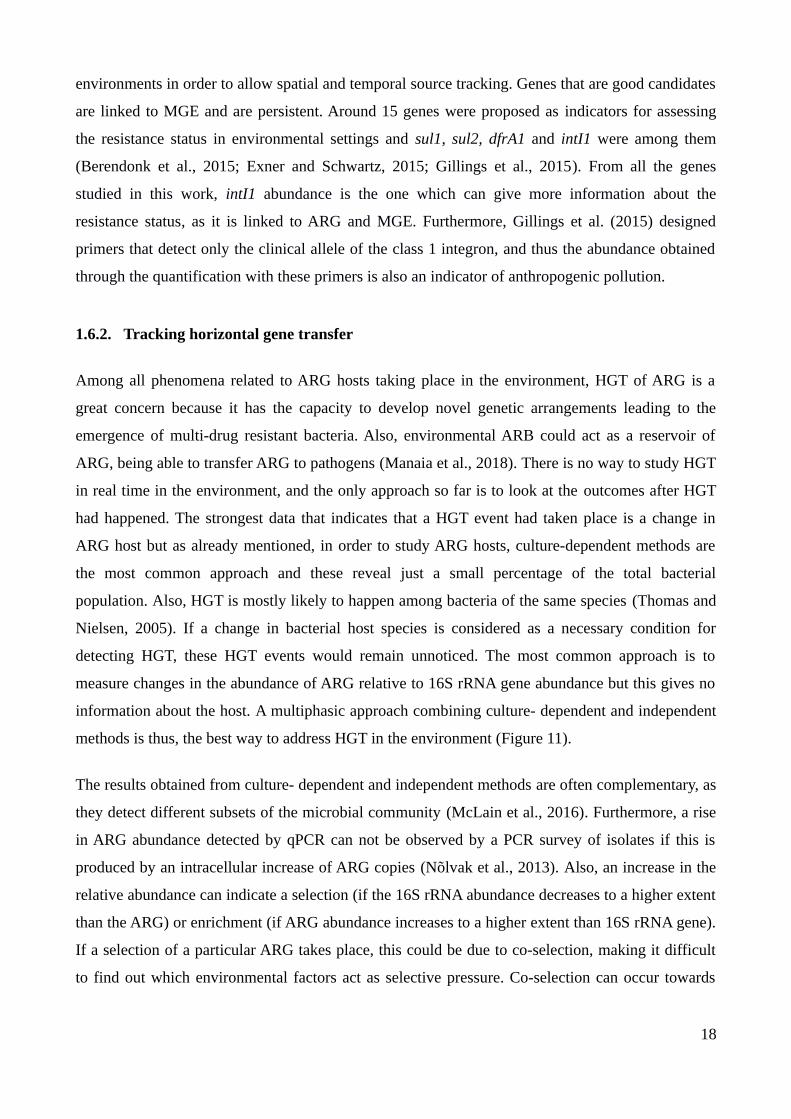
environments in order to allow spatial and temporal source tracking. Genes that are good candidates
are linked to MGE and are persistent. Around 15 genes were proposed as indicators for assessing
the resistance status in environmental settings and sul1, sul2, dfrA1 and intI1 were among them
(Berendonk et al., 2015; Exner and Schwartz, 2015; Gillings et al., 2015). From all the genes
studied in this work, intI1 abundance is the one which can give more information about the
resistance status, as it is linked to ARG and MGE. Furthermore, Gillings et al. (2015) designed
primers that detect only the clinical allele of the class 1 integron, and thus the abundance obtained
through the quantification with these primers is also an indicator of anthropogenic pollution.
1.6.2. Tracking horizontal gene transfer
Among all phenomena related to ARG hosts taking place in the environment, HGT of ARG is a
great concern because it has the capacity to develop novel genetic arrangements leading to the
emergence of multi-drug resistant bacteria. Also, environmental ARB could act as a reservoir of
ARG, being able to transfer ARG to pathogens (Manaia et al., 2018). There is no way to study HGT
in real time in the environment, and the only approach so far is to look at the outcomes after HGT
had happened. The strongest data that indicates that a HGT event had taken place is a change in
ARG host but as already mentioned, in order to study ARG hosts, culture-dependent methods are
the most common approach and these reveal just a small percentage of the total bacterial
population. Also, HGT is mostly likely to happen among bacteria of the same species (Thomas and
Nielsen, 2005). If a change in bacterial host species is considered as a necessary condition for
detecting HGT, these HGT events would remain unnoticed. The most common approach is to
measure changes in the abundance of ARG relative to 16S rRNA gene abundance but this gives no
information about the host. A multiphasic approach combining culture- dependent and independent
methods is thus, the best way to address HGT in the environment (Figure 11).
The results obtained from culture- dependent and independent methods are often complementary, as
they detect different subsets of the microbial community (McLain et al., 2016). Furthermore, a rise
in ARG abundance detected by qPCR can not be observed by a PCR survey of isolates if this is
produced by an intracellular increase of ARG copies (Nõlvak et al., 2013). Also, an increase in the
relative abundance can indicate a selection (if the 16S rRNA abundance decreases to a higher extent
than the ARG) or enrichment (if ARG abundance increases to a higher extent than 16S rRNA gene).
If a selection of a particular ARG takes place, this could be due to co-selection, making it difficult
to find out which environmental factors act as selective pressure. Co-selection can occur towards
18
genes that reside in the same bacterium or that are on the same genetic element, for example ARG
that are part of class 1 integrons.
Figure 11| Multiphasic approach to study horizontal gene transfer in the environment. Culture-independent methods are shown with a dashed border and in filled border the culture-dependent method isdepicted. Culture-dependent methods allow to identify ARG hosts. While a change in ARG abundancerelative to 16S rRNA gene abundance can indicate HGT, a change in ARG hosts is sufficient to conclude thatHGT has taken place.
19

2. Objectives
The WHO addresses antimicrobial resistance as a major health problem and it warns about a post-
antibiotic era. Modern medicine relies on antibiotics and the consequences of an increased
resistance are detrimental, both for human lives and for economical costs (OECD, 2018). While
several strategies are taken in the clinical setting in several countries in order to prevent the
development and the spreading of resistance, a lot remains to be done outside the hospitals walls. In
a multivariate study (Collignon et al., 2018), poor sanitation was linked to increased antibiotic
resistance.
Constructed wetlands constitute an alternative wastewater treatment that resemble natural wetlands
and therefore serve as models for the processes taking place in natural aquatic environments
(Hammer and Bastian, 1989). Aeration is beneficial for wastewater treatment by HSSF-CW in
terms of final water quality, as low concentration subsurface oxygen is one of the main limiting
factors in this kind of CW (Nivala et al., 2013). How aeration of CW affects the removal of ARB
and ARG hasn’t been addressed yet. The presence of reactive oxygen species coming from the
incomplete reduction of oxygen causes DNA damage and this can enhance HGT of ARG through
the activation of the SOS system. This work addresses the question whether aeration in CW causes
an increased HGT of ARG. For the studying of HGT it is important to know ARG hosts, which
hasn’t been studied in CW before.
In this work, two CW treating municipal-rural wastewater were studied, one CW was mechanically
aerated and the other was not. Comparing both CW helps to understand better the effects of aeration
on antibiotic resistance during wastewater treatment and enables studying the physiochemical
factors affecting it in the open environment. A common approach in wastewater treatment is to
compare input and output in order to evaluate the systems. However, in a study on the same CW,
Button et al. (2015) found that the microbial communities in the outflow and in internal samples
differed significantly. That highlights the importance of obtaining internal samples to understand the
processes involving bacteria during wastewater treatment. Therefore, water samples from the in-
and outlet as well as from inside the CW were analysed.
With the aim of evaluating the performance of the aerated CW with regard to removal of ARB and
ARG and to study HGT of ARG in the CW, the antimicrobials SMX and TMP and five genes were
selected. The gene 16S rRNA is useful to quantify the total bacterial community, sul1, sul2 and
20
dfrA1 are three ARG that give resistance to the aforementioned antibiotics; and intI1 is related to
ARG and MGE. A multiphasic approach was applied making use of culture- dependent and
independent methods to analyse samples from in- and outflows as well as from internal points in
both CW. The culture-independent method consisted in the quantification of the selected genes
through qPCR. The culture-dependent approach consisted in the quantification of colony forming
units on different solid culture media with and without the addition of the selected antibiotics. Over
1600 of these colonies were isolated and analysed through PCR for the selected genes. In addition,
the 16S rRNA gene of over 250 isolates was sequenced in order to identify ARG hosts. The variable
region of the class 1 integrons were studied through amplification by PCR and sequencing of the
PCR product. As E. coli and Aeromonas spp. were common hosts of the studied genes, they were
further quantified by culture dependent and independent methods. For E. coli the MPN method,
CFU counting and qPCR of the uidA gene was used. In the case of Aeromonas spp., CFU counting
and qPCR of the gene gyrB was applied. Standard wastewater parameters and antibiotic
concentrations were also determined.
21

3. Materials and methods
3.1. Constructed wetlands at the ecotechnology in Langenreichenbach
The studied pilot-scale saturated HSSF-CW planted with common reed (Phragmites australis) are
located in Saxony, Germany and receive the same wastewater from the surrounding rural-residential
villages (~16000 inhabitants), after a pretreatment by a three-chamber septic tank (Nivala et al.,
2013). They act then as secondary treatment and have the advantage that samples can be taken
within the CW. Water samples were taken over a period of four years (May 2014 - October 2017)
during periods were the CW were covered with fully grown plants (March-October). Three out of
22 sampling events took place outside this time period. Means of the values of this days were
compared to the mean values of the vegetation period and the differences weren’t statistically
significant. Therefore, these data were included in the analysis. Operating details of both CW are
provided in Table 1. H50p stands for Horizontal 50 cm depth and planted and HAp for Horizontal
Aerated and planted. Aeration in HAp takes place from the bottom of the CW, homogeneously and
perpendicular to the direction of flow. For the calculation of HRT, the porosity of the media was
taken into account to calculate the water volume in the CW (0.38).
Table 1| Design and operating details for the two sampled CW. HLR: hydraulic loading rate, HRT:hydraulic retention time. The HLR for HAp changed from 130 to 100 L/m2.d in 10/2015.
Systemname
Length [m] Width [m] Depth [m] HLR [L/m2.d] HRT [d]Aeration
[m3 air/ m2-h]
HAp 4.70 1.20 1.00 130/100 2.9/3.7 0.35
H50p 4.70 1.20 0.5 36 5.4 none
The two CW studied are stable wastewater treatment systems, as they have been run uninterruptedly
for over 7 years with essentially constant performance levels regarding removal of C-BOD5,
inorganic nitrogen, and E. coli as microbial indicator for faecal contamination (Headley et al., 2013;
Kahl et al., 2017). Because they are stable systems and they receive the same wastewater, the
changes in wastewater that can be monitored in space are simultaneously changes in time, in
contrast to systems like activated sludge which are mostly mixed. In this way, these CW offer a
model to study flow- and therefore time-dependant changes of antibiotic resistance in a WWTP
during aeration. In Table 2 the inflows, outflows and rain volume are shown for the months when
sampling took place.
22

Table 2| Inflows, outflows and rain volume for the months in which sampling took place. “a” is the isthe ratio between outflow and inflow. The inlet flow in HAp was modified by UBZ from 770 to 578 L/d on10/2015.
Month Rain (mm) Qinlet (L/d) Qoutlet (L/d) a (Qoutlet/Qinlet)
HAp H50p HAp H50p HAp H50p
05/2014 95 770 195 689 141 0.9 0.7
06/2014 25 771 195 655 105 0.8 0.5
07/2014 73 770 194 615 116 0.8 0.6
08/2014 77 768 192 655 131 0.9 0.7
09/2014 35 769 192 701 168 0.9 0.9
10/2014 32 769 193 727 181 0.9 0.9
06/2015 60 770 197 669 121 0.9 0.6
07/2015 155 770 197 641 117 0.8 0.6
08/2015 113 770 197 734 164 1.0 0.8
09/2015 45 770 197 726 156 0.9 0.8
10/2015 73 770 197 749 176 1.0 0.9
Mean+SD 770±1 687±41 0.9±0.05
11/2015 115 578 197 558 183 1.0 0.9
12/2015 46 578 197 571 191 1.0 1.0
07/2016 67 578 197 436 130 0.8 0.7
08/2016 40 578 197 436 143 0.8 0.7
09/2016 28 578 197 440 155 0.8 0.8
10/2016 89 577 197 533 186 0.9 0.9
11/2016 44 577 196 553 189 1.0 1.0
05/2017 37 578 197 516 159 0.9 0.8
06/2017 84 578 197 461 117 0.8 0.6
07/2017 109 578 197 469 130 0.8 0.7
08/2017 74 578 197 470 141 0.8 0.7
Mean+SD 68±33 578±0.5 196±20 495±50 150±27 0.9±0.1 0.8±0.1
In October 2015 the inflow changed from 770 L/d to 578 L/d for HAp for external reasons to this
work. No changes in the values of the studied parameters were observed. It was already observed
before (Kahl et al., 2017) that HAp it is a robust system. Robustness can be related to the extent to
which the performance of a system is affected by operational conditions and the time needed for
adaptation to changes.
23

It is worth noticing that due to a longer HRT and a higher surface/depth ratio, evapotranspiration is
higher in H50p. On average, the proportion of inflow that leaves the CW was 90% in the case of
HAp and 80% in the case of H50p. This calculations take evapotranspiration and rain into account.
Whereas the correction due to these processes is of relevance for the evaluation of CW overall
performance, the concentration of the substances within the CW is the one affecting
microorganisms and their responses.
Areal removal rates were calculated using Equation 1. Calculating areal removal rate is of relevance
in order to compare the treatment capacity (speed) of different CW.
arealremoval rate=Qinlet∗[Abundance ]inlet−Qoutlet∗[Abundance ]outlet
A(1)
Where Q is flow in m3/d, abundance is gene copies/m3 or g/m3 and area is the surface of the CW in
m2. An average of Q calculated with the values of the sampling months was used in order to simplify
the analysis. Not all the parameters described were measured for every sampling day for logistical
reasons. Water coming out from the septic tank entering the CW is called “inlet”.
3.2. Samples and standard wastewater parameters
An schematic representation of the sampling and pictures of the CW are shown in Figure 12. The
sample collection procedure is described in detail by Nivala et al. (2013). Briefly, grab samples
were taken at 0.12, 0.25, 0.50, 0.75 of the fractional length and 0.50 of the fractional depth of each
CW, using a peristaltic pump. That means at a depth of 0.50 m in HAp and 0.25 m in H50p.
Standard wastewater parameters (T, pH, redox potential and DO) were determined on site as
described by Kahl et al. (2017). Water temperature and pH were measured with a SenTix 41 sensor,
dissolved Oxygen (DO) with a ConOx sensor, and redox potential with a SenTix ORP sensor
(Pt/Ag+/AgCl/Cl−). The sensors were part of a Multi 350i instrument (WTW, Weilheim, Germany).
After arrival, part of the samples was immediately used for culturing on agar plates (Section 3.4)
and some for DNA extraction (Section 3.7). The rest of the sample volume was transported in cold
to the laboratory (around 2 h of transportation time). The systems were sampled at inlet/outlet
simultaneously. This disregards transport delay within the treatment system, adding uncertainties
whether the changes seen in water are a result of treatment or are affected by fluctuations in the
incoming water. This is partly overcome by the stability of systems which allows repetition of the
sampling and calculation of average values.
24

Removal efficiencies were calculated using Equation 2.
removalefficiency=[compound]out−[compound ]inlet
[compound]inlet
∗100 (2)
Variables in brackets represent concentration values. The ratio between in and outflows (called “a”
in Table 2) was taken into account.
Figure 12| Sampling schema (top) and pictures (bottom) of the constructed wetlands. The numbersindicate the fractional length at which the samples were taken.
3.3. Chemical analysis of antibiotics
The compounds SMX, N4-acetyl-sulfamethoxazole (N4-Ac-SMX) and TMP were measured by
liquid chromatography LC-MS in water and sediments, together with other two sulfonamides
(sulfadiazin, sulfamethazin) which due to their low concentrations (<15 ng/L) were no longer
considered. About 43-48% of SMX taken is excreted in the form of N4-Ac-SMX by warm-blooded
animals (Ven et al., 1995). This metabolite can be microbially transformed into its parental
compound in the environment (Gobel et al., 2007) and has no anti-microbial activity.
25

Sample preparation
250 mL water samples were filtered (0.45 mesh, glass fibre filter, GE Healthcare, Buckinghamshire,
UK) before solid phase extraction with Oasis HLB sorbent (200 mg, Waters, Milford, USA). The
SPE sorbent was conditioned with methanol (Biosolve, Dieuze, France) and Milli-Q water before
the sample was applied. After drying the sorbent under a gentle stream of inert gas for 30 min, the
analytes were eluted with 10 mL methanol. The eluates were concentrated to 0.5 mL by evaporating
the methanol (TurboVap II, Biotage, SWE). Adding 0.5 mL HPLC solvent A water, 5mM NH4
acetate) gave the final sample volume of 1 mL from that 5 µL were injected for HPLC-MS-MS
analysis.
HPLC-MS-MS analysis
High Performance Liquid Chromatography-tandem mass spectrometry (HPLC-MS-MS) analysis
used an Agilent 1260 HPLC instrument (Agilent Technologies, Waldbronn, Germany) coupled to a
triple stage quadrupol mass spectrometer (“QTrap 5500”, SCIEX, Darmstadt, Germany). The
chromatographic separation was performed with an “Ascentis Express C18” column (10 cm x 3 mm
id and 2.7 µm particle size, Supelco, Seelze, Germany). Water with 0.1 % formic acid (solvent A)
and methanol with 0.1 % formic acid (solvent B) were used to elute at the antibiotics at a flow rate
of 300 µL min-1 and following linear gradient: to 1 min 95 % A, to 15 min 10 % A, from 20 – 25
min 95 % A. Column oven was set at 30 °C. Electrospray operated for ionization at positive mode
with 5.5 kV spray voltage. Mass analysis at multiple reaction monitoring mode used the analyte-
specific ion transitions listed in Table 3.
Table 3| Characteristics of the target antibiotics and the HPLC-MS-MS method.
CAS-No./logP*
Ion transitions(m/z)
HPLC-retention time
(min)
SPE recovery (%),
(n=4)
LODi (ng/L)
± SD (n=3)
LODm (ng/L)
± SD (n=3)
SMX723-46-6
0.89254.2 → 92.0254.2 → 65.0
9.9 111 0.5 ± 0.02 1.50 ± 0.06
N4-Ac-SMX21312-10-7
0.86295.9 → 134.1295.9 → 65.0
6.5 89 1.0 ± 0.08 3.10 ± 0.30
TMP738-70-5
0.91290.9 → 230.1290.9 → 261.0
8.5 109 0.5 ± 0.03 1.50 ± 0.08
Sulfadiazine68-35-9
0.09250.9 → 156.0250.9 → 92.0
6.6 104 0.5 ± 0.03 1.50 ± 0.09
Sulfamethazine57-68-1
0.89279.4 → 186.1279.4 → 92.0
9.0 111 1.0 ± 0.06 3.10 ± 0.20
CAS: chemical abstract service, SPE: solid-phase extraction, LOD i: instrumental limit of detection. LODm: limit ofdetection of the method.*logP from PubChem open chemical database.
26

External calibration enabled quantification via calibration curves with 4-5 concentration points.
Duplicates of each sample were measured randomly distributed in an analysis batch. Instrument
controls were included multiple times within the series of analyses. Due to the good recoveries (89-
111%) in solid-phase extraction (SPE) enrichment, concentration data were not corrected.
Instrumental limits of detection and method limit of quantification (LOD i, LOQm) as well as
precision are included in Table 3.
3.4. Isolation of resistant bacteria
Different solid culture media were used in order to select common ARG hosts in wastewater:
Mueller-Hinton agar, a rich media suitable for antibiotic resistance tests, Endoagar (EA), selective
for Enterobacteriaceae spp. and differential for E. coli, Pseudomonas Isolation Agar (PIA),
selective for Pseudomonas spp. and differential for P. aeruginosa and Aeromonas Isolation Agar
(AIA), selective for Aeromonas spp. and differential for A. hydrophila. One set of petri dishes was
plated without antibiotics, one was supplemented with SMX (64 mg/l) and another set with TMP (8
mg/l) (Czekalski et al., 2012). This type of selection was chosen and not a combination because in
this way the dynamics of the ARB and ARG towards each antibiotic can be studied separately. This
allowed a better comparison to qPCR data, where no selection or enrichment was carried out prior
to analysis. Furthermore, using only SMX permits the selection of the total abundance of class 1
integrons with conserved 3’ region and not only those which carry a dfrA allele in their variable
region. Two serial dilutions differing in one order of magnitude were prepared per sampling point.
The selected order of magnitude depended on the sampling point and the culture media. Before
pipetting to plate, the containers were shaken in order to get a homogeneous sample and afterwards,
100 µL of each dilution were cultivated in duplicates. The incubation time and temperature were
16-43 h at 20 °C for all media when the differential property wasn’t necessary. When also the
differential property was needed, instructions were followed depending on the media (Appendix A).
Bacterial cells were picked from the centre of well isolated colonies of each sample grown in the
presence of antibiotics.
3.5. Characterization of SMX/TMP resistant isolates
Genomic DNA extraction from cultured SMX/TMP-resistant bacteria was performed by the
microwave boiling method described by Orsini and Romano-Spica, 2001. Extracted DNA was
stored at –20 °C until used.
27
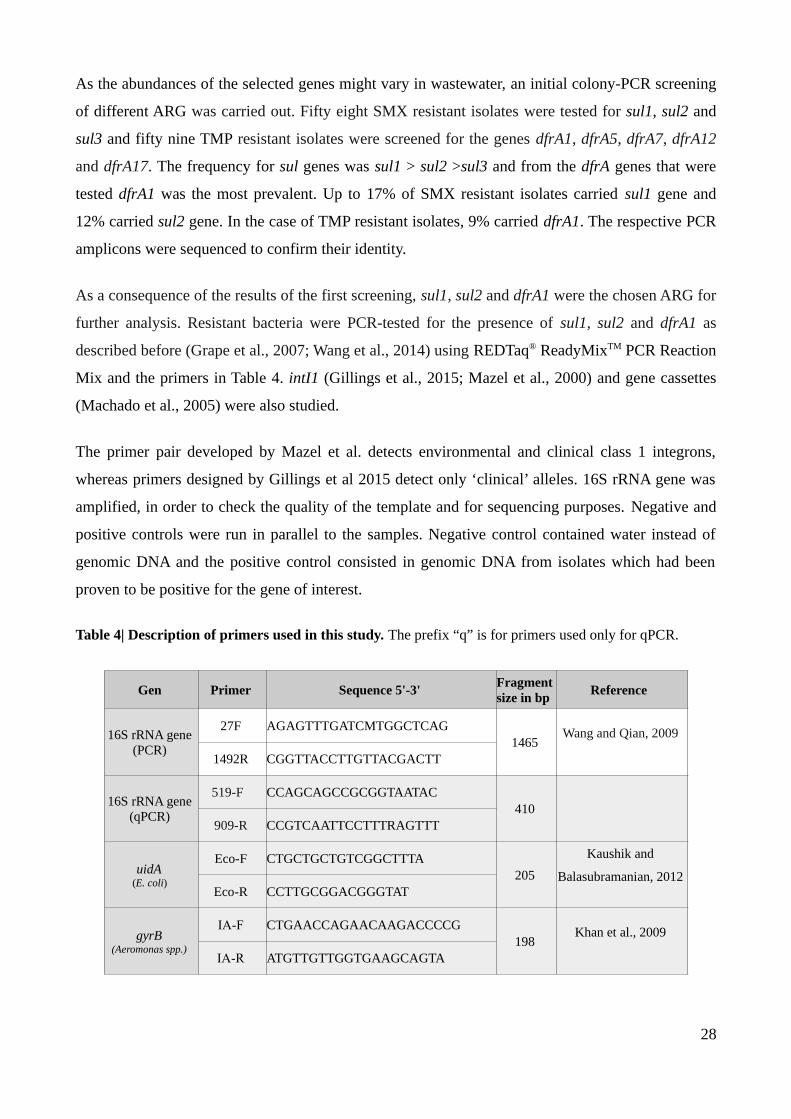
As the abundances of the selected genes might vary in wastewater, an initial colony-PCR screening
of different ARG was carried out. Fifty eight SMX resistant isolates were tested for sul1, sul2 and
sul3 and fifty nine TMP resistant isolates were screened for the genes dfrA1, dfrA5, dfrA7, dfrA12
and dfrA17. The frequency for sul genes was sul1 > sul2 >sul3 and from the dfrA genes that were
tested dfrA1 was the most prevalent. Up to 17% of SMX resistant isolates carried sul1 gene and
12% carried sul2 gene. In the case of TMP resistant isolates, 9% carried dfrA1. The respective PCR
amplicons were sequenced to confirm their identity.
As a consequence of the results of the first screening, sul1, sul2 and dfrA1 were the chosen ARG for
further analysis. Resistant bacteria were PCR-tested for the presence of sul1, sul2 and dfrA1 as
described before (Grape et al., 2007; Wang et al., 2014) using REDTaq® ReadyMixTM PCR Reaction
Mix and the primers in Table 4. intI1 (Gillings et al., 2015; Mazel et al., 2000) and gene cassettes
(Machado et al., 2005) were also studied.
The primer pair developed by Mazel et al. detects environmental and clinical class 1 integrons,
whereas primers designed by Gillings et al 2015 detect only ‘clinical’ alleles. 16S rRNA gene was
amplified, in order to check the quality of the template and for sequencing purposes. Negative and
positive controls were run in parallel to the samples. Negative control contained water instead of
genomic DNA and the positive control consisted in genomic DNA from isolates which had been
proven to be positive for the gene of interest.
Table 4| Description of primers used in this study. The prefix “q” is for primers used only for qPCR.
Gen Primer Sequence 5'-3'Fragmentsize in bp
Reference
16S rRNA gene(PCR)
27F AGAGTTTGATCMTGGCTCAG1465
Wang and Qian, 2009
1492R CGGTTACCTTGTTACGACTT
16S rRNA gene(qPCR)
519-F CCAGCAGCCGCGGTAATAC410
909-R CCGTCAATTCCTTTRAGTTT
uidA(E. coli)
Eco-F CTGCTGCTGTCGGCTTTA205
Kaushik and
Balasubramanian, 2012Eco-R CCTTGCGGACGGGTAT
gyrB(Aeromonas spp.)
IA-F CTGAACCAGAACAAGACCCCG198
Khan et al., 2009
IA-R ATGTTGTTGGTGAAGCAGTA
28

sul1
sul1-F CGGCGTGGGCTACCTGAACG433
Wang et al., 2014sul1-R GCCGATCGCGTGAAGTTCCG
sul1-qF TGTCGAACCTTCAAAAGCTG113
sul1-qR TGGACCCAGATCCTTTACAG
sul2
sul2-F GCGCTCAAGGCAGATGGCATT293
Wang et. al. 2014sul2-R GCGTTTGATACCGGCACCCGT
sul2-qF ATCTGCCAAACTCGTCGTTA89
sul2-qR CAATGTGATCCATGATGTCG
dfrA1dfr1-F TGGTAGCTATATCGAAGAATGGAGT
425Grape et al., 2007
dfr1-R TATGTTAGAGGCGAAGTCTTGGGTA
intI1(all the alleles)
intI1-F GGTCAAGGATCTGGATTTCG483
Mazel et al., 2000
intI1-R ACATGCGTGTAAATCATCGTC
intI1(clinical allele)
intI1-F CGAACGAGTGGCGGAGGGTG311
Gillings et al., 2015
intI1-R TACCCGAGAGCTTGGCACCCA
Gene cassettes5’CS GGCATCCAAGCAGCAAG
VariableLevesque et al., 1995
3’CS AAGCAGACTTGCCTGA
PCR products of 16S rRNA gene and gene cassettes were purified by using MinElute PCR
purification Kit (Qiagen, Valencia, CA, USA) in order to be sequenced. Sequencing was carried out
by the Sanger method (Macrogen, Netherlands). The sequence were then analysed using BLASTn.
The number of isolates are shown in Table 5.
Table 5| Number of isolates analysed.
SMX TMP total
screened 837 787 1642
sequenced - - 256
intI1(+), cassettes 294 207 501
29
3.6. Phylogenetic trees
Phylogenetic trees of the 16S rRNA gene were built in R using the package ‘ggtree’ (Yu et al.,
2017). For alignment ‘aliview’ (Larsson, 2014) and ARB (Ludwig, 2004) was used, and ‘trex-
online’ (Boc et al., 2012) for tree generation, using maximum likelihood method. Illumina
sequencing of the 16 rRNA gene of the total community could not be finished within the scope of
this research. These results coming from a culture-independent method would have provided data
about the taxonomy and phylogeny of the total bacterial community.
3.7. Quantitative PCR analysis
In the case of DNA extraction, samples were centrifuged for 15 min at 13000 rpm and the pellets
were the starting material for DNA extraction. The volume of sample that was centrifuged varied
depending on the sample in order to get a visible pellet after centrifugation (1,5 to 60 mL). This was
taken into account to correct the final concentration results. DNA was extracted using the DNeasy
Blood & Tissue Kit (Qiagen), which is an appropriate Kit to extract total DNA from a myriad of
samples, including water samples (Jeunen et al., 2019). DNA concentrations were quantified with a
NanoDrop 1000 (NanoDrop Technologies, Wilmington, DE).
The abundances of the 16S rRNA gene, sul1, sul2, dfrA1, and intl1 were determined by SYBR-
green based real-time PCR with 3 technical replicates per sample. The assay was run on a StepOne
Plus Cycler (Applied Biosystems) in a 12.5 µL reaction mixture per standard and sample. The PCR
conditions were 95 °C for 2 min, followed by 40 cycles of 95 °C for 20 s, 20 s at the correspondent
annealing temperature and 72 °C for 20 s. Dilutions of template DNA were used for each sample to
compensate for the effect of PCR inhibitors in the samples. Standards were PCR-amplified
fragments of the uidA gene of E. coli as well as the sul genes, dfrA1 and intI1 from bacteria isolated
in this study. gyrB standard was obtained from an A. aquatica strain AE235 from the Leibniz-
Institut DSMZ-Deutsche Sammlung von Mikroorganismen und Zellkulturen GmbH.
DNA concentrations of the standards were measured by Nanodrop spectrophotometry and the copy
number (CN) per mL of sample was calculated using Equation 3.
CN=c∗6.022∗1023
660∗N(3)
where c is the measured DNA concentration (µg/µL) and N is the DNA fragment length in bp.
Average efficiency values were 90% for 16S rRNA gene, 84.5% for sul1, 94.1% for sul2, 91.3% for
30
intl1, 90% for dfrA1, >95% for uidA and 90% for gyrB. ARG removal efficiencies were calculated
using Equation 4.
ARG removal efficiency=[ARG]inlet−[ARG]out
[ARG ]inlet
∗100 (4)
where [ARG] means gene abundance in copies/100 mL.
Fold change is defined as the change in abundance compared to the abundance in the inlet and was
calculated using Equation 5.
fold change=[ ARG ]fractional length−[ARG ]inlet
[ ARG ]inlet
(5)
which further normalise the data for possible fluctuations in time in the incoming wastewater.
Relative abundance of ARG was calculated with Equation 6.
ARG relative abundance=[ ARG ]
[16 S rRNA gene ](6)
Log reduction shows how many orders of magnitude the abundances changed after the treatment
and was calculated with Equation 7.
log reduction=log10[abundance]inlet− log10[abundance ]outlet (7)
In terms of antibiotic resistance, in order to compare absolute abundances from culture dependent
and independent methods, the total ARG abundance from culture-dependent methods can be
estimated using the Equation 8.
CFU R−ARG∗culturability factor≃[ ARG] (8)
where CFUR-ARG represents the frequency in which screened isolates were positive for ARG. The
culturability factor considers that each cell has in average 4 copies of the 16S rRNA (Klappenbach,
2001) and it takes the data of the correspondent sampling point into account.
Which in the case of sul1 is:
(CFU SMX− sul1∗CFU SMX
)∗16 S rRNA gene/4
CFU≃[sul1] (9)
31
3.8. Quantification of specific bacteria
Quantification of Escherichia coli.
Culturable E. coli was measured by most probable number (MPN), adopting the Colilert18 Quanti-
Tray method (IDEXX Laboratories, USA) and CFU counting on Endoagar. Abundance of total E.
coli was carried out by measuring the uidA gene by qPCR. The selectivity of uidA primers as well
as the differential property of the media towards E. coli was confirmed by sequencing the 16S
rRNA gene.
Quantification of Aeromonas spp.
Culturable Aeromonas was quantified by CFU counting on Aeromonas isolation agar. Abundance of
total Aeromonas spp was carried out by measuring the gyrB gene by qPCR. The selectivity of gyrB
primers as well as the differential property of the media towards Aeromonas spp. was confirmed by
PCR of CW isolates that had been identified as Aeromonas through 16S rRNA gene sequencing.
3.9. Statistics
No outliers treatment was carried out in order to include biological variability. Statistical
significance was calculated with Wilcoxon test in R studio using the package ‘ggpubr’(Alboukadel,
2018).
3.10. Set up of emulsion, paired isolation and concatenation PCR (epicPCR)
The protocol was based on previous studies (Hultman et al., 2018; Spencer et al., 2015). Primers
were designed with the online tool Primer-BLAST. A first set of three primers is necessary for one-
step fusion PCR which amplifies part of a functional gene and part of the 16S rRNA gene. A second
set of two primers is used to improve the specificity by the principle of nested-PCR and to introduce
partial adaptor sequences for sequencing purposes. The primers giving the best results are shown in
Tables 6 and 7. epicPCR products are being sequenced by the Illumina sequencing technic.
Polyacrylamide bead formation
Water samples were centrifuged at 8000 rpm for 15 in at room temperature. The volume centrifuged
in order to get a visible pellet depended on the sample (between 2 and 180 mL depending on the
sample, in order to get 1-2x10⁷ cells). The pellets containing the cells were then resuspended in 100
32

μl of nuclease free water. 100 μl of 30% acrylamide/bis- acrylamide and 25 μl of ammonium
persulfate (APS) were given to the cells and gently vortexed. After adding 600 μl of mineral oil the
mixtures were vortexed at 3000 rmp for 30 s. After vortexing, 25 μl of tetramethylethylenediamine
(TEMED) were added and vortexed again but this time at maximum speed (3000 rpm) for 30 s. The
mixture was kept for 90 min at room temperature to allow polymerization.
For the extraction of the beads, 800 μl of diethyl ether was added and a precipitated formed. After
adding 1 mL of nuclease free water, mixing and centrifuging for 30 s at 12000 g, three layers
formed: bottom layer contained the beads, the middle layer contained a mixture of oil and water and
the top layer was made of oil. The oil phase was discarded. This step was repeated until no top layer
was visible. The water layer was discarded and 1 mL of TK-buffer (20 mM Tris-HCl, pH 7.5, 60
mM KCl) was added to the beads. The bead suspension was run through a 40 μm cell strainer and
the flow through contained the beads.
Cell lysis
2 μl of lysozyme were added to 250 μl of the beads and incubated overnight at 37 °C. 2 aliquots
were put together and centrifuged at 12000 g for 30 s. The supernatant was discarded and 400 μl of
TK were used to resuspend the beads. 100 μl of proteinase K and 4 μl of triton X-100 were added to
the samples and incubated 37 °C for 30 min and 95 °C for 10 min. Samples were aliquoted in 1 mL
and centrifuged at 12000 g for 30 s. The beads were resuspended with enough TK buffer to reach
500 μl of total volume.
Fusion PCR
Four 2 mm glass beads and 900 μl ABIL emulsion oil were added to each tube. 110 μl of the
flowing mix was added to 90 μl of the polyacrylamide beads:
- 40 μl of 5X Phusion High-Fidelity buffer (New England Biolabs Inc.)
- 5 μl of 10 mM dNTPs
- 20 μl of each each fusion primer (Forward and reverse: 10 μM, Fusion primer: 0,1 μM).
- 16 μl of Phusion Hot Start Flex (New England Biolabs Inc.)The mixture was emulsified by
vortexing at 3000 rpm for 1 min and aliquoted in of 60 μl. The PCR program run was as follows: 98
°C 30 s, [98 °C 5 s, 55 °C 30 s, 72 °C 30 s]x33 cycles, 72 °C 5 min. After the purification of the
products, 2 μl of 50 mM of ethylenediaminetetraacetic (EDTA) were added.
33

Table 6| Fusion PCR primers for epicPCR
Gene Primer Sequence Size (bp) Reference
sul1
sul1 qF TGTCGAACCTTCAAAAGCTG
1180Wang et al., 2014
sul1 qR/519F’ GWATTACCGCGGCKGCTGTGGACCCAGATCCTTTACAG
pH’ AAGGAGGTGATCCAGCCGCA Edwards et al., 1989
sul2
sul2 qF ATCTGCCAAACTCGTCGTTA
1111Wang et al., 2014
sul2 qR/519F’ GWATTACCGCGGCKGCTGCAATGTGATCCATGATGTCG
pH’ AAGGAGGTGATCCAGCCGCA Edwards et al., 1989
dfrA1
dfrA-F1 (2) ATCGAAGAATGGAGTTATCG
1413
This work
dfrA1-R1/519F’ GWATTACCGCGGCKGCTGTATGTTAGAGGCGAAGTCTTGGGTA Grape et al. 2007
pH’ AAGGAGGTGATCCAGCCGCA Edwards et al., 1989
intI1
intI1-F1 (3) CGAAGTCGAGGCATTTCTGTC
1241Hultman et al., 2018
intI1-R1/519F’ GWATTACCGCGGCKGCTGGCCTTCCAGAAAACCGAGGA
pH’ AAGGAGGTGATCCAGCCGCA Edwards et al., 1989
Beads breaking and fusion-products purification
The samples were centrifuged at 13000 for 5 min at 22 °C and the upper phase was discarded. 1 mL
of diethyl ether was added to each sample and vortexed gently. The samples were centrifuged for 1
min at 13000 g and the upper phase was disposed. This step was repeated. The same step was
carried out using ethyl acetate instead of diethyl ether. Two more extraction were done with diethyl
ether. After leaving the samples open in a laminar flow for 10 min, 100-150 μl of the bottom phase
were taken. The kit NucleoSpin Gel and PCR clean-up was used to purify the fusion PCR products.
Nested/semi-nested PCR
Fusion-PCR products were purified and subjected to a new round of PCR, which had both the aims
of increasing specificity and introducing partial adaptors for Illumina sequencing. In the case of sul
genes a semi-nested approach was used and for the rest of the genes a nested approach was applied.
For the reaction different volumes of the samples (4-6 μl) were added to the following mix:
- 5 μl of 5X HF buffer
- 0.5 μl of 10 mM dNTP
- 1.5 μl of 10 μM of the primers
- 0.25 μl of 2 U/μl of Phusion Hot Start Flex
- 15.5 μl ddH2O
34

Afterwards PCR was performed following the cycling program: 98 °C 30 s, [98 °C 10 s, 55 °C 30 s,
72 °C 30 s] x 40 cycles and a final elongation step of 5 min at 72 °C. The products were sent to be
sequenced by the Illumina sequencing technique.
Table 7| Nested/semi-nested-Illumina PCR primers for epicPCR
Gene Primer SequenceSize
(bp)Reference
sul1
sul1qF-TSATCTACACTCTTTCCCTACACGACGCTCTTCCGATCTTGTCGAACCTTCAAAAGCTG
474
Wang et al.,
2014
785 R4illumina GTGACTGGAGTTCAGACGTGTGCTCTTCCGATCTctgagtgGACTACHVGGGTATCTAATCC
Herlemann
et al., 2011
sul2
sul2qF-TSATCTACACTCTTTCCCTACACGACGCTCTTCCGATCTATCTGCCAAACTCGTCGTTA
449
Wang et al.,
2014
785 R43illumina
GTGACTGGAGTTCAGACGTGTGCTCTTCCGATCTtctGACTACHVGGGTATCTAATCC Herlemann
et al., 2011
dfrA1
dfrA1-F1_TS
ATCTACACTCTTTCCCTACACGACGCTCTTCCGATCTGGGAGCATTACCCAACCGAA
626
This work
785 R4illumina
GTGACTGGAGTTCAGACGTGTGCTCTTCCGATCTctgagtgGACTACHVGGGTATCTAATCC Herlemann
et al., 2011
intI1
nested intI1-F_TS
ATCTACACTCTTTCCCTACACGACGCTCTTCCGATCTGAGGCATTTCTGTCCTGGCT
571
This work
785 R3illumina
GTGACTGGAGTTCAGACGTGTGCTCTTCCGATCTtctGACTACHVGGGTATCTAATCC Herlemann
et al., 2011
35
4. Research output
4.1. Fate of antibiotic resistance in CW: technology evaluation
Wastewater treatment plants weren’t design with the aim of removing micropollutants and antibiotic
resistance. In this respect it is important to mention that even in Germany, a leading country in
wastewater treatment, the performance of WWTP is not normally evaluated in terms of
microbiology. Only surface and drinking waters are evaluated in Germany for microbiological
parameters.
Constructed wetlands have the potential to contribute to the removal of common pharmaceuticals
that are usually present in urban wastewater. Their ability to remove a wide spectrum of
pharmaceuticals can be ascribed to the coexistence of anoxic–aerobic–anaerobic
microenvironments within the systems that favour the different mechanisms involved in their
removal. The processes leading to removal are mainly biodegradation, sorption, plant uptake and,
for surface systems, also photodegradation (Verlicchi and Zambello, 2014). Both SMX and TMP are
hydrophilic (kow SMX= 0.89, kow
TMP= 0.91), which means that they can be available for
degradation and shouldn’t accumulate in the substrate at a pH around neutral (Radke et al., 2009).
Even though bacterial degradation of SMX has been the subject of several studies, the conditions
affecting it and the metabolic pathways involved are still under investigation (Wang and Wang,
2018). Regarding DO, biodegradation of SMX occurs under both anaerobic conditions and aerobic
conditions (Rodríguez-Escales and Sanchez-Vila, 2016). Adding readily biodegradable carbon
sources has been shown to be beneficial for SMX degradation suggesting cometabolism (Müller et
al., 2013; Yang et al., 2018). It was observed that the removal of TMP was poor in activated sludge
(Li and Zhang, 2010), indicating a preference by the microorganisms for SMX.
The study of removal of antibiotic resistance is more difficult than studying the elimination of
micropollutants for the reasons described in Section 1.6. Reductions of 16S rRNA gene and ARG
abundances in conventional wastewater treatment facilities have been between two to three orders
of magnitude (Auerbach et al., 2007; Gao et al., 2012a; Zhang et al., 2009). Gao et al. (2012b)
quantified 1x10⁸ CFUSMX/100 mL and detected a 2.5 log reduction in a three step WWTP. With
respect to ARG, common abundances for sul genes and intI1 in untreated wastewater are between
1x10⁷ and 1x10⁹ copies/100 mL (Chen et al., 2015a; Fang et al., 2017; Makowska et al., 2016).
Activated sludge-based systems and membrane reactors show a reduction of around 2 orders of
36

magnitude in sul1 abundances (Munir et al., 2011). Reductions of sul1 and sul2 in CW vary greatly
from an increase in the abundance in a pilot-scale CW (Liu et al., 2014) to a reduction of 2 orders of
magnitude in a WWTP integrating 5 sequential full-scale CW (Chen et al., 2015b). In the same
study, the decrease in intI1 abundance was of one order of magnitude. Abundance of dfrA1 is not
quantified as often as sul genes and intI1 are, probably because it is in general less abundant. In a
hybrid system including a full-scale CW, (Yi et al., 2017) found that dfrA1 concentrations in raw
landfill leachate were between 1x10³ and 1x10⁵ copies/100 mL and that it either remained the same
or decreased one order of magnitude (wet and dry season respectively) .
Considering the treatment performance in the case of aerated CW, a recent review (Ilyas and Masih,
2017) showed that effluent DO was the most dominant factor for predicting organic matter and
nitrogen removal. The organic loading rate and area could be stated as the second most influencing
factors, whereas the wetland depth seemingly had the least influence on performance. The HLR, on
the other hand, did not have a significant influence on the removal efficiencies of organic matter
and nitrogen. This review didn’t take antibiotic resistance into account and if these observations
correlate with the behaviour of ARB and ARG remains unclear. Understanding which factors affect
the removal mechanisms of ARB and ARG in CW is key for the design and operation of advanced
treatment systems.
This chapter is a general analysis of the CW of LRB in terms of their potential to remove antibiotic
resistance from wastewater. With this aim, only in- and outflow data and ARB isolated from
Mueller-Hinton agar were included. Concentrations and areal removal rates were determined for C-
BOD5, DO, nitrogenous compounds and the antibiotics SMX and TMP. In the case of SMX, its
most abundant metabolite N4-Ac-SMX was also quantified. Log reductions and areal removal rate
were calculated for E. coli (MPN), the aforementioned selected genes (qPCR) and CFU on Mueller-
Hinton agar+SMX, Mueller-Hinton agar+TMP and on Mueller-Hinton agar without the addition of
antibiotics. 328 resistant colonies were isolated and tested through PCR for the selected genes. 55
isolates were identified by sequencing of the 16S rRNA gene PCR product.
It should be noted that the resistance mechanism studied in the present work doesn’t affect the
concentrations of antibiotics, as it would be the case for inactivating enzymes that degrade
antibiotics (See Figure 1). Identifying which bacteria carry out the degradation of SMX and TMP
wasn’t an objective of this work.
37

4.1.1. Effect of aeration on the reduction of antibiotic resistance in an HSSF-CW
4.1.1.1 Wastewater standard parameters and antibiotics concentration
Inlet and effluent concentrations
Common wastewater parameters are shown in Table 8 for inlet and the outlets of HAp and H50p.
The total suspended solids (TSS) were more abundant in HAp than in H50p, even though the water
in the outlet of HAp had a clearer appearance. This was already observed before for the same
systems where TSS and turbidity were measured and turbidity was lower in HAp than in H50p
(Button et al., 2015) although TSS was higher.
Table 8| Standard wastewater parameters of the in- and outflows of HAp and H50p (mean±SD). Data on T, pH, C-BOD5, DO, redox potential and Escherichia coli data were recorded on the sampling dates(N=9). Redox potential was measured with a SenTix ORP sensor (Pt/Ag+/AgCl/Cl−, WTW, Weilheim,Germany). Data on nitrogen and TSS was recorded before by the UBZ (N=87). Total suspended solids weredetermined according to DIN EN 872. Ammonium, nitrate, and nitrite nitrogen were measured using aGallery Plus photometric analyser.
Parameter inlet H50p out HAp out
T (°C) 16.1 ±3.4 15.7 ± 4.4 15.8 ± 4.1
pH 7.2 ± 0.1 7.2 ± 0.1 7.5 ± 0.3
TSS (mg/L) 115.1±75.1 6.7±4.9 23.7±16.7
C-BOD5 (mg/L) 314.6±66.8 37.6±7.1 2.1±1.7
NH4+-N (mg/L) 72.0±12.6 61.4±11.7 0.2±0.5
NO3--N (mg/L) 0.05±0.02 1.06±3.88 44.90±8.32
TN (mg/L) 87.9±10.0 68.7±8.7 47.6±9.3
DO (mg/l) 0.6±0.3 2.3±1.5 9.9±1.3
Redox potential (mV) -263.4±25.8 -199.8±38.9 +217.7±14.8
Escherichia coli (MPN/100 mL) 5.106±4.106 1.105±9.104 4.102±2.102
The most important effect that organic wastes can cause in receiving waters is a reduction in the DO
concentration, which is normally due to the microbial breakdown of the organic matter present. The
more biodegradable organic matter present in water, the higher BOD and the less DO if no external
oxygen input is present. Some of the oxygen present can be used by bacteria for nitrification. N-
nitrite was between below the level of detection (BLD), which was 0.04 mg/L, and 0.1 mg/L for the
inlet as well as for the outlets.
38

While C-BOD5 is related to oxygen as electron acceptor, the redox potential is also affected by other
electron acceptors in the media, such as Fe3+ and NO3-. Measuring this parameters parallel to the
study of ARB and ARG is useful to predict which conditions are more suitable for the treatment of
ARB and ARG in wastewater by the means of CW. Comparing both CW, C-BOD5, NH4+ and total
nitrogen decreased in HAp to a larger extent than in H50p, while NO3- and DO increased in HAp
more than in H50p. The German standards for WWTP of the size of the one operating in LRB
(plant size 4) are: 20 mg/L for C-BOD5 and 10 mg/L for NH4+-N. Whereas the values for C-BOD5
and NH4+-N in the outflow of HAp were below the regulations standards, the treatment in H50p was
insufficient. The values recorded from the WWTP in LRB, after a standard activated sludge
treatment are: 10 mg/L of C-BOD5 and 3 mg/l of NH4+ (values extracted from the WWTP in LRB:
https://www.azv-heidelbach.de). The redox potential stayed below zero for H50p, whereas it
increased to positive values in HAp.
Because there’s still no consensus about how sub-inhibitory concentrations of antibiotics can affect
antibiotic resistance in wastewater, antibiotics were quantified. Both SMX and TMP concentrations,
as well as SMX’s main metabolite N4-Ac-SMX are shown in Table 9 for inlet and outflows. All
concentrations were below 100 ng/L, which is several orders of magnitude lower than the MIC of
SMX and TMP. Even in the inlet, SMX and TMP concentrations were at the lower limit of the
range reported before in the literature for Saxony and other regions in Germany, which was about
100 ng/L (Gurke et al., 2015; Ternes et al., 2007). The value of 100 ng/L was proposed as an upper
limit for SMX and TMP in groundwater by the German Federal Environment Agency (Hannappel et
al., 2016). In terms of their reductions, the concentrations of all compounds decreased in both CW.
Whereas for TMP and N4-Ac-SMX the concentrations in the outflows were similar, SMX
concentrations decreased in H50p to a larger extent than in HAp. However, the difference in
concentrations in the outlets of the CW weren’t statistically significant.
Table 9| Micropollutants median concentrations for the in in- and outflows for HAp and H50p.Minimal and maximal values are shown in brackets. N=6-10
Compound (ng/L) inlet H50p out HAp out
SMX 96.9 (4.3-517.6) 19.8 (2.2-168.4) 59.9 (7.8-328.8)
TMP 8.2 (1.2-61.3) 0.8 (0.0-7.4) 0.8 (0.0-6.8)
N4-Ac-SMX 95.9 (18.3-766.3) 5.9 (0.5-20.7) 4.2 (0.0-58.9)
39

Removal rates
While the concentrations before and after the treatment indicate how water quality improves, areal
removal rates (See Chapter 3) inform about how efficient the treatments are in cleaning pollutants
from water. The capacity of the CW to remove organic matter, ammonium and nitrate is shown in
Table 10. Areal removal rates of SMX, TMP and N4-Ac-SMX are shown in Figure 13.
Table 10| Areal removal rates for HAp and H50p (means±SD). For E. coli, log reduction is also shown.N=9 and N=89 for nitrogen compounds data. Oxygen removal rate was calculated by Nivala et al., 2013.
Areal removal rate H50p out HAp out
C-BOD5 (g/m2-d) 9.9±2.2 38.6±8.1
NH4+-N (g/m2-d) 0.8±0.4 8.6±2.5
NO3--N (g/m2-d) 1.9±0.0 -3.8±2.2
TN (g/m2-d) 1.2±0.4 5.6±1.6
OCR (g/m2-d)(minimum/medium/maximum) 1.3/7.6/12.9 15.4/46.0/87.5
Escherichia coli (MPN/m2-d) 1.9 x 10⁹ 5.7 x 10⁹
Escherichia coli log reduction (MPN/100 mL) 1.6±0.4 4.1±0.7
Although O2 doesn’t constitute a pollutant, it’s areal removal rate can be estimated and is also
shown. Oxygen consumption rate (OCR) was estimated as described by Headley (2013), where
three equations can be used to calculate minimum (Equation 10), intermediate (Equation 11) and
maximum (Equation 12) values. The carbonaceous component has different stoichiometric
coefficients: 1.5 for the maximum case, 1.0 for the intermediate and zero for the minimum (where it
is assumed that all the carbonaceous compounds are removed anaerobically).
OCRMaximum=1.5(ΔMCBOD5
)+4.6(ΔMTKN)
A(10)
OCRIntermediate=1.0(ΔMCBOD5
)+1.7(ΔMTKN)
A(11)
OCRMinimum=1.7 (ΔMTKN)
A(12)
where ΔM represents the mass removed per unit of time (g/d).
The maximum value for the stoichiometric coefficient (Equation 10) is calculated for the oxidation
of the average molecular composition of organic molecules in wastewater (C18H19O9N) (Wiesmann
40

et al., 2006). From equation 13 derives that ~1.5 g of oxygen are needed to oxidise 1 g of organic
carbonaceous matter.
C18 H19 O9 N+17.5O2 +H+→18CO2+8H2 O+NH4
+ (13)
The nitrogenous demand is calculated using Total Kjeldahl Nitrogen (TKN), which takes
ammonium and organic nitrogen entering the system into account. The maximum case reflects
conventional nitrification and intermediate and minimum consider alternative nitrogen pathways.
Nitrification accounts for the use of ammonium by bacteria as electron donor for the reduction of
oxygen with the concomitant production of energy. Conventional nitrification is represented in
Equation 16, where the two biological steps shown in Equations 14 and 15 are combined. As a
result, for every 14 g of nitrogen, 64 g of oxygen are needed giving a ratio of 4.6 g of oxygen for
every gram of nitrogen.
2 NH4++3 O2→2 NO2
−+4 H+
+2 H2 O (14)
2NO2−+O2→2NO3
− (15)
NH4++4 O2→2 NO3
−+4 H+
+2 H2 O (16)
Under alternative nitrogen pathways anammox (anaerobic ammonium oxidation) is considered.
The combination of the first step of nitrification (Equation 14) and anammox (Equation 17) results
in equation 18. In turn, for every gram of nitrogen 1.7 gram of oxygen are needed. This considers
that the nitrite necessary for Anammox is produced in the system and therefore still some oxygen is
required. The processes leading to Equations 14 and 17 are compartmentalised in the system as
anammox reaction can only take place in anoxic conditions.
NH4++NO2
−→N 2+2H2 O (17)
4 NH4++3 O2→2 N2
−+4 H+
+6 H2 O (18)
This method for estimating OCR doesn’t take the oxygen that is used to oxidise sulfide into
account, which is present in the incoming water at an average concentration of 8.6 mg/L (Saad,
2017). Such demand of oxygen was not accounted for in the determination of the C-BOD5 which
leads to an overestimation of the biodegradable carbonaceous compounds content in the wastewater.
41

Logarithmic areal removal of Escherichia coli (MPN/m2-d) was calculated using the equation:
logarithmicareal removal rate= log10
Qinlet∗[MPN ]inlet−Q outlet∗[MPN ]oulet
A(19)
which in the case of H50p is:
areal removal rateH 50 p=
0.196m3
d∗[E . coli ]inlet−0.150
m3
d∗[E .coli ]H 50 p outlet
5.64 m2 ∗10000
(20)
For HAp Qinlet/outlet represent different values depending if it was before or after 10/2015 (see Table2). In the case of the faecal indicator E. coli, it’s log reduction was also calculated using theequation 21
log reductionof E . coli= log10[E .coli]H 50 p oulet− log10[E. coli]inlet(21)
[E. coli] is given in MPN/100 mL for equations.
Figure 13| Mean areal removal rates for N4-acetyl-sulfamethoxazole, sulfamethoxazole andtrimethoprim for H50p (green) and HAp (blue).
The aerated CW showed a higher capacity than H50p to remove organic matter and ammonium,
whereas it performed worse in terms of nitrate removal. This is a consequence of a much higher
production of nitrate in HAp than in H50p. In H50p the amount of nitrate in the outflow is similar
to the amount in the inflow. However, some TN is being removed in H50p and that is an indication
that some denitrification is taking place, for which the formation of at least some nitrate is
necessary within the system. E. coli MPN decreased in HAp about 4 orders of magnitude, whereas
in H50p the reduction was less than 2 orders of magnitude. Areal removal rate of E. coli was around
42

3 times higher in HAp in comparison with H50p. The difference in areal removal rate wasn’t as
pronounced as the difference in log reduction because of the high removal of the E. coli MPN in
both CW.
Considering the areal removal of SMX, TMP and N4-Ac-SMX, HAp showed a greater capacity than
H50p for all of them but the differences weren’t statistically significant. The concentration values
were between 100-1000 micrograms per day and square meter.
4.1.1.2 Reduction of antibiotic resistance genes and antibiotic resistant bacteria
Culture-dependent method
The selected ARG represent one of the many resistance mechanisms (See Figure 1) against SMX
and TMP. To know to which extent this mechanism is responsible for the overall phenotypic
resistance to these antibiotics in the system, culture dependent methods are necessary. Another
reason for culturing is identifying resistant bacteria. This is important in order to detect resistant
bacteria that are at the same time pathogens and therefore pose a health risk. Only results from
Mueller-Hinton agar were taking into account for the analysis of the culture-dependent method in
this chapter.
Colonies and isolates: sulfamethoxazole as selective pressure
The abundance of colony forming units (CFU) on Mueller-Hinton agar with the addition of SMX
decreased in both CW and in HAp to a larger extent (Table 11). When comparing the CFU and
CFUSMX values between the CW’s outlets, the differences weren’t statistically significant. The same
was true for the comparisons between CFUSMX/CFU in the inlet and the outlet for a single CW. This
last observation means that no significant selection of SMX resistant bacteria took place during the
treatment, at least among bacteria that were culturable in the used conditions. To confirm whether
this change is significant or not, more biological replicates should be carried out (in this case 3
biological replicates were analysed). Comparing the CFU that were counted on plates with SMX
with those growing on plates without antibiotics, around 15% of bacteria were still resistant in the
outlet of H50p and 8% in the outlet of HAp. Comparing the total number of isolates that were
screened (isolates positive for ARG/screened isolates) the most common gene carried by the
resistant isolates was sul1 (46% of SMX-resistant isolates, inlet). That means that sul1 accounts for
the resistance of almost half of the sulfamethoxazole culturable resistant bacteria in the incoming
43
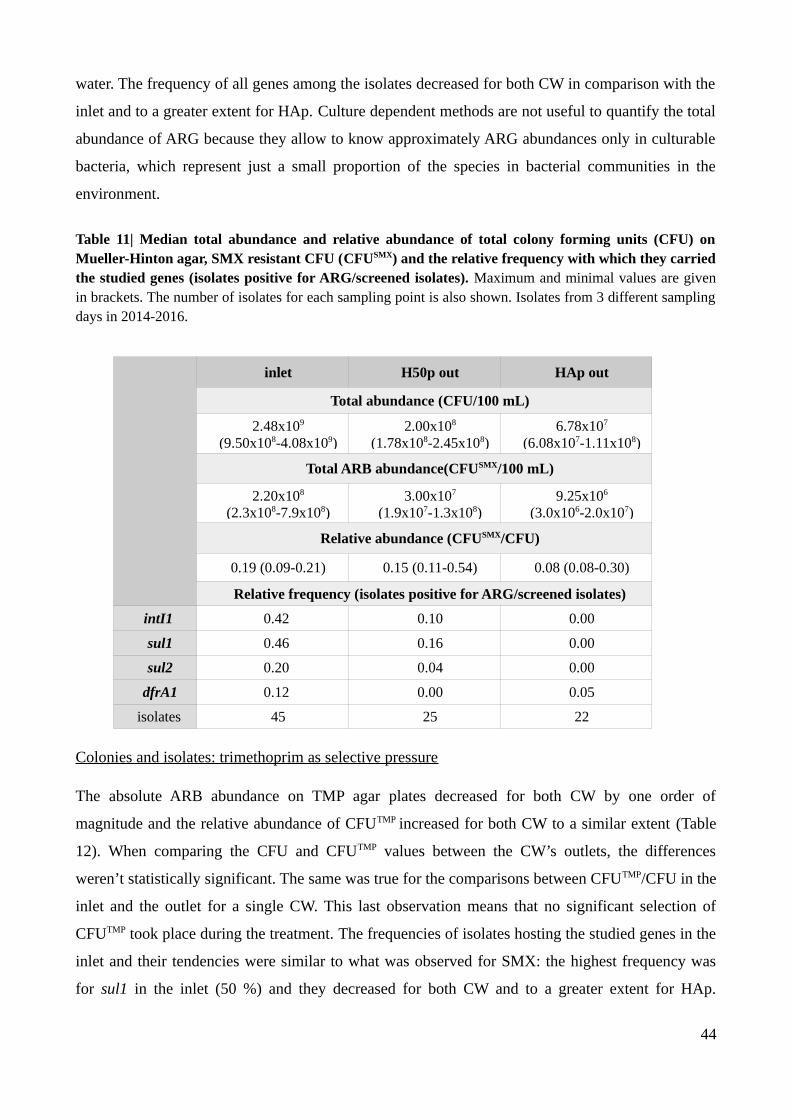
water. The frequency of all genes among the isolates decreased for both CW in comparison with the
inlet and to a greater extent for HAp. Culture dependent methods are not useful to quantify the total
abundance of ARG because they allow to know approximately ARG abundances only in culturable
bacteria, which represent just a small proportion of the species in bacterial communities in the
environment.
Table 11| Median total abundance and relative abundance of total colony forming units (CFU) onMueller-Hinton agar, SMX resistant CFU (CFUSMX) and the relative frequency with which they carriedthe studied genes (isolates positive for ARG/screened isolates). Maximum and minimal values are givenin brackets. The number of isolates for each sampling point is also shown. Isolates from 3 different samplingdays in 2014-2016.
inlet H50p out HAp out
Total abundance (CFU/100 mL)
2.48x10⁹
(9.50x10⁸-4.08x10⁹)2.00x10⁸
(1.78x10⁸-2.45x10⁸)6.78x10⁷
(6.08x10⁷-1.11x10⁸)
Total ARB abundance(CFUSMX/100 mL)
2.20x10⁸
(2.3x10⁸-7.9x10⁸)3.00x10⁷
(1.9x10⁷-1.3x10⁸)9.25x10⁶
(3.0x10⁶-2.0x10⁷)
Relative abundance (CFUSMX/CFU)
0.19 (0.09-0.21) 0.15 (0.11-0.54) 0.08 (0.08-0.30)
Relative frequency (isolates positive for ARG/screened isolates)
intI1 0.42 0.10 0.00
sul1 0.46 0.16 0.00
sul2 0.20 0.04 0.00
dfrA1 0.12 0.00 0.05
isolates 45 25 22
Colonies and isolates: trimethoprim as selective pressure
The absolute ARB abundance on TMP agar plates decreased for both CW by one order of
magnitude and the relative abundance of CFUTMP increased for both CW to a similar extent (Table
12). When comparing the CFU and CFUTMP values between the CW’s outlets, the differences
weren’t statistically significant. The same was true for the comparisons between CFUTMP/CFU in the
inlet and the outlet for a single CW. This last observation means that no significant selection of
CFUTMP took place during the treatment. The frequencies of isolates hosting the studied genes in the
inlet and their tendencies were similar to what was observed for SMX: the highest frequency was
for sul1 in the inlet (50 %) and they decreased for both CW and to a greater extent for HAp.
44

Probably TMP indirectly selected for the different dfrA variants which are frequently found in the
variable region of class 1 integrons. That would explain the high frequency of sul1 positive isolates
among TMP resistant bacteria. The frequencies in the outlets were higher for TMP than for SMX
and for H50p higher than for HAp, with the exception of dfrA1 that was higher on SMX for HAp
(5%).
Table 12| Median total abundance and relative abundance of total colony forming units (CFU) onMueller-Hinton agar, TMP resistant CFU (CFUTMP) and relative frequency with which they carried thestudied genes (isolates positive for ARG/screened isolates). Maximum and minimal values are given inbrackets. The number of isolates for each sampling point is also shown. Isolates were from 3 differentsampling days in 2014-2016.
inlet H50p out HAp out
Total abundance (CFU/100 mL)
2.48x10⁹
(9.50x10⁸-4.08x10⁹)2.00x10⁸
(1.78x10⁸-2.45x10⁸)6.78x10⁷
(6.08x10⁷-1.11x10⁸)
Total ARB abundance (CFU TMP/100 mL)
1.8x10⁸
(4.0x10⁷-2.0x10⁸)3.8x10⁷
(3.8x10⁷-7.9x10⁷)1.2x10⁷
(1.1x10⁷-2.4x10⁷)
Relative abundance (CFU TMP/CFU)
0.04 (0.04-0.08) 0.21 (0.00-0.32) 0.18 (0.17-0.22)
Relative frequency (isolates positive for ARG/screened isolates)
intI1 0.46 0.35 0.00
sul1 0.50 0.35 0.00
sul2 0.13 0.12 0.00
dfrA1 0.10 0.00 0.00
isolates 29 18 22
Reduction and removal of ARB
The differences observed between the CW in terms of CFU weren’t statistically significant. The log
reductions of culturable bacteria (Figure 14) ranged between 0.35 (TMP, H50p) and 1.80 (SMX,
HAp) and were higher for HAp in all cases. In average, the abundance TMP resistant colonies
decreased less than the control and that results in a higher relative TMP resistance abundance as it
could be seen from Table 12.
Areal removal rates (Figure 15) were around 1010 and 1012 CFU/100 mL and were one order of
magnitude higher for HAp than for H50p. This difference wasn’t statically significant.
45
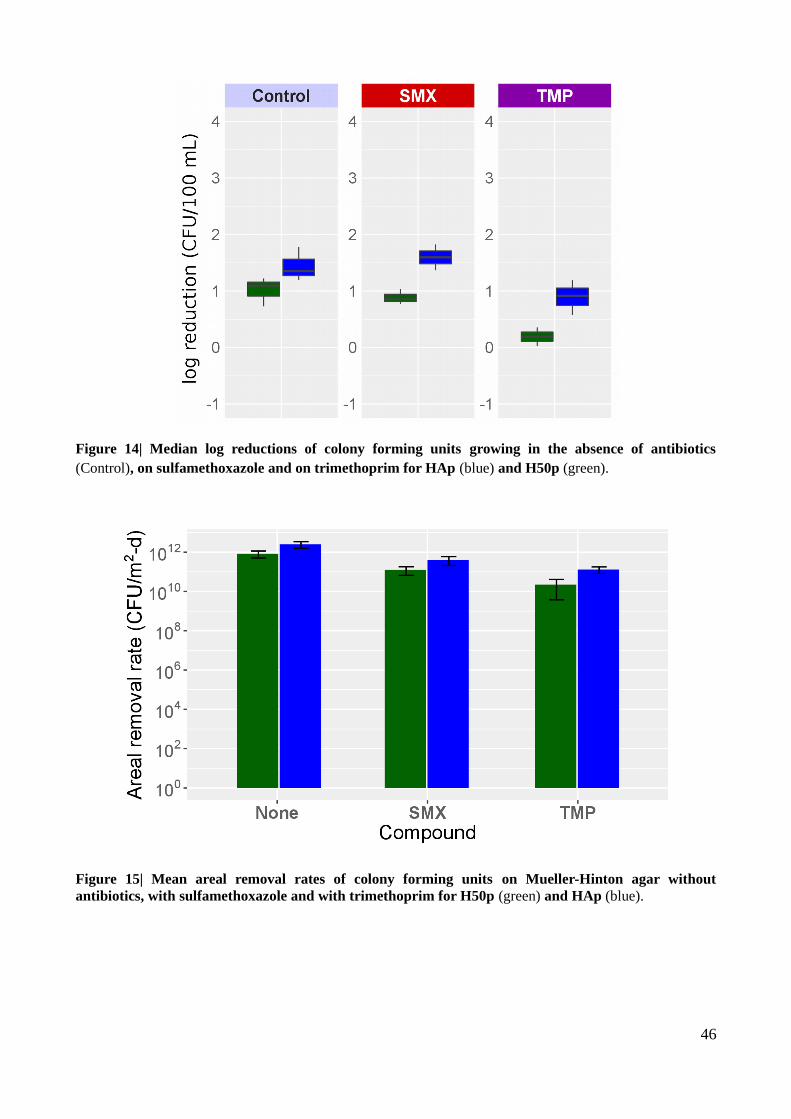
Figure 14| Median log reductions of colony forming units growing in the absence of antibiotics(Control), on sulfamethoxazole and on trimethoprim for HAp (blue) and H50p (green).
Figure 15| Mean areal removal rates of colony forming units on Mueller-Hinton agar withoutantibiotics, with sulfamethoxazole and with trimethoprim for H50p (green) and HAp (blue).
46
Taxonomy and phylogeny of ARB and ARG hosts
Sequencing of the 16S rRNA gene of 55 resistant isolates revealed no difference between CW and
antibiotics in terms of taxonomy of ARG host (Figure 16 and 17). Most of the ARG hosts belonged
to Gram-negative Gammaproteobacteria. More specifically, they classified as Enterobacteriaceae,
Pseudomonas and Aeromonas in most cases. This method is limited to bacteria that can grow under
the conditions used in this work, which represent a little proportion of the total bacterial diversity
(for an overview of the different approaches to study antibiotic resistance see Section 1.6). Little
can be said about the pathogenicity of the bacterial species found among the resistant isolates
because the identification method doesn’t allow to identify strains. However, in all of the groups
detected there are members which can be pathogenic for humans. Some examples are several strains
of E. coli, Aeromonas hydrophyla, Pseudomonas aeruginosa and Enterococcus faecalis.
Bacteria belonging to the genus Pseudomonas and to the Gram-positive phylum Firmicutes from
the class Bacilli, like the families Enterococcaceae and Carnobacteriaceae rarely carried the
studied genes. Enterobacteriaceae were more common in the inlet and in H50p, Aeromonas were
evenly distributed and Pseudomonas and Gram-positive bacteria were more frequently found in the
outlets than in the inlet. Enterobacteriaceae, Aeromonas, Enterococcaceae and Carnobacteriaceae
are facultative anaerobes, whereas Pseudomonas are strict aerobes. A higher DO in the outflows
might have favoured the growth of Pseudomonas.
Even though Enterobacteriaceae and Aeromonas were the most common ARG hosts, there were
some members of these groups which didn’t carry any of the genes but were resistant. This kind of
isolates were found in all of the studied sample points but were more common in the outlets than in
the inlet and for HAp more than for H50p. One explanation for this observation can be that the
fitness of bacteria in the outlet was compromised. Plasmids can represent a burden to bacterial
fitness (Smith and Bidochka, 1998). If the studied genes were on plasmids, the plasmids could have
represented an extra burden for bacteria to resume growth on the plates.
Phylogenetic trees also show that bacteria carrying the same ARG weren’t clones. Even though the
studied genes weren’t common in distantly related bacteria, their presence wasn’t limited to one
phylogenetic group. This confirms that HGT of the studied genes can take place among different
bacterial families and genera. In the case of SMX resistant isolates, Aeromonas seemed to be the
most common host on intI1 and sul1 whereas no pattern can be detected for sul2 and dfrA1. The
gene dfrA1 was in little proportion of isolates and sul2 was evenly distributed among all bacterial
47

groups. Only 3 of the 55 isolates carried dfrA1 and intI1 simultaneously. On the contrary, intI1 and
sul1 were usually found together in isolates, even though there were some isolates that only had
intI1 or sul1. Some bacteria carried sul1 and sul2. Although the biological explanation of this
redundancy remains unknown, sul1 and sul2 were correlated in the environment (Chen et al.,
2015b) and can be found on the same plasmid (del Castillo et al., 2013).
48

intI1 sul1 sul2 dfrA1
Figure 16| Phylogenetic tree of sequenced sulfamethoxazole resistant bacteria and reference strains.Carrying at least one of the studied genes was a eligibility criteria in 2015, whereas in 2016 the isolates werechosen randomly.
49
08.2015
08.2016
Reference strains
Escherichia coli
Pseudomonas putida
Aeromonas aquatica
11

intI1 sul1 sul2 dfrA1
Pseudomonas putida
Escherichia coli
Aeromonas aquatica
Figure 17| Phylogenetic tree of identified trimethoprim resistant bacteria and reference strains.Carrying at least one of the studied genes was a eligibility criteria in 2015, whereas in 2016 the isolates werechosen randomly.
50
08.2015
08.2016
Reference strains
0.70.7
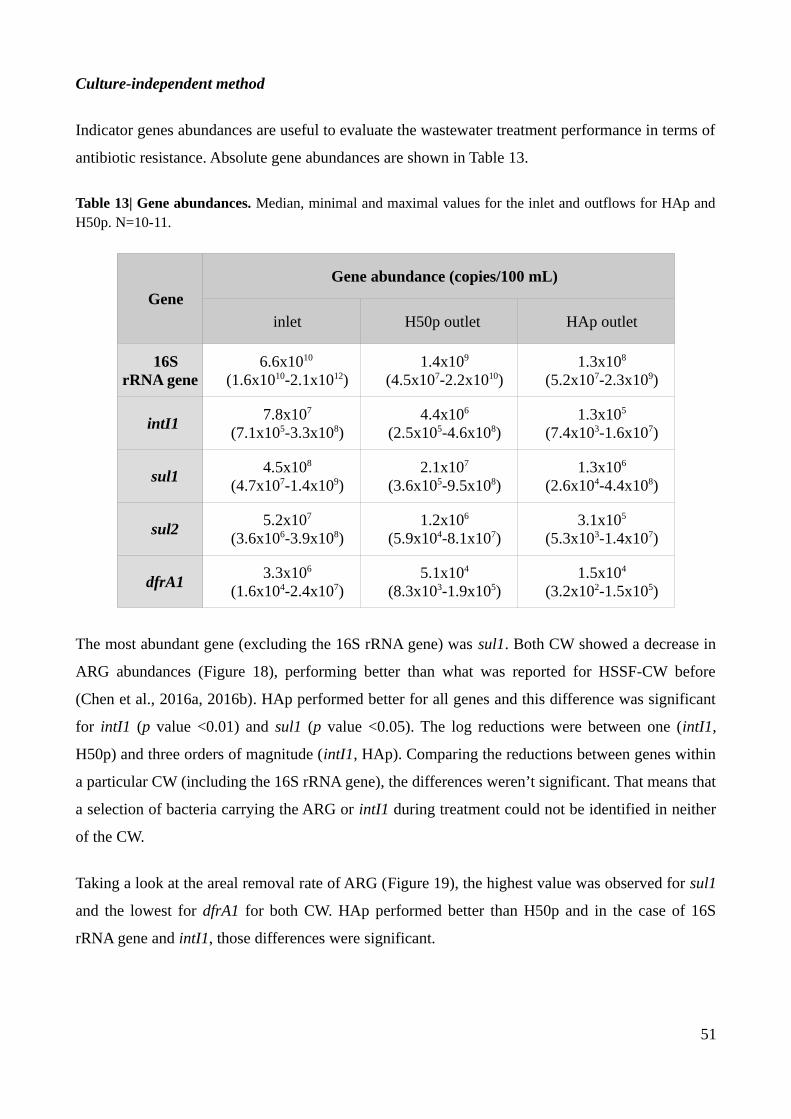
Culture-independent method
Indicator genes abundances are useful to evaluate the wastewater treatment performance in terms of
antibiotic resistance. Absolute gene abundances are shown in Table 13.
Table 13| Gene abundances. Median, minimal and maximal values for the inlet and outflows for HAp andH50p. N=10-11.
Gene
Gene abundance (copies/100 mL)
inlet H50p outlet HAp outlet
16SrRNA gene
6.6x10¹⁰
(1.6x10¹⁰-2.1x10¹²)1.4x10⁹
(4.5x10⁷-2.2x10¹⁰)1.3x10⁸
(5.2x10⁷-2.3x10⁹)
intI1 7.8x10⁷
(7.1x10⁵-3.3x10⁸)4.4x10⁶
(2.5x10⁵-4.6x10⁸)1.3x10⁵
(7.4x10³-1.6x10⁷)
sul14.5x108
(4.7x10⁷-1.4x10⁹)2.1x10⁷
(3.6x10⁵-9.5x10⁸)1.3x10⁶
(2.6x10⁴-4.4x10⁸)
sul25.2x107
(3.6x10⁶-3.9x10⁸)1.2x10⁶
(5.9x10⁴-8.1x10⁷)3.1x10⁵
(5.3x10³-1.4x10⁷)
dfrA13.3x106
(1.6x10⁴-2.4x10⁷)5.1x10⁴
(8.3x10³-1.9x10⁵)1.5x10⁴
(3.2x10²-1.5x10⁵)
The most abundant gene (excluding the 16S rRNA gene) was sul1. Both CW showed a decrease in
ARG abundances (Figure 18), performing better than what was reported for HSSF-CW before
(Chen et al., 2016a, 2016b). HAp performed better for all genes and this difference was significant
for intI1 (p value <0.01) and sul1 (p value <0.05). The log reductions were between one (intI1,
H50p) and three orders of magnitude (intI1, HAp). Comparing the reductions between genes within
a particular CW (including the 16S rRNA gene), the differences weren’t significant. That means that
a selection of bacteria carrying the ARG or intI1 during treatment could not be identified in neither
of the CW.
Taking a look at the areal removal rate of ARG (Figure 19), the highest value was observed for sul1
and the lowest for dfrA1 for both CW. HAp performed better than H50p and in the case of 16S
rRNA gene and intI1, those differences were significant.
51
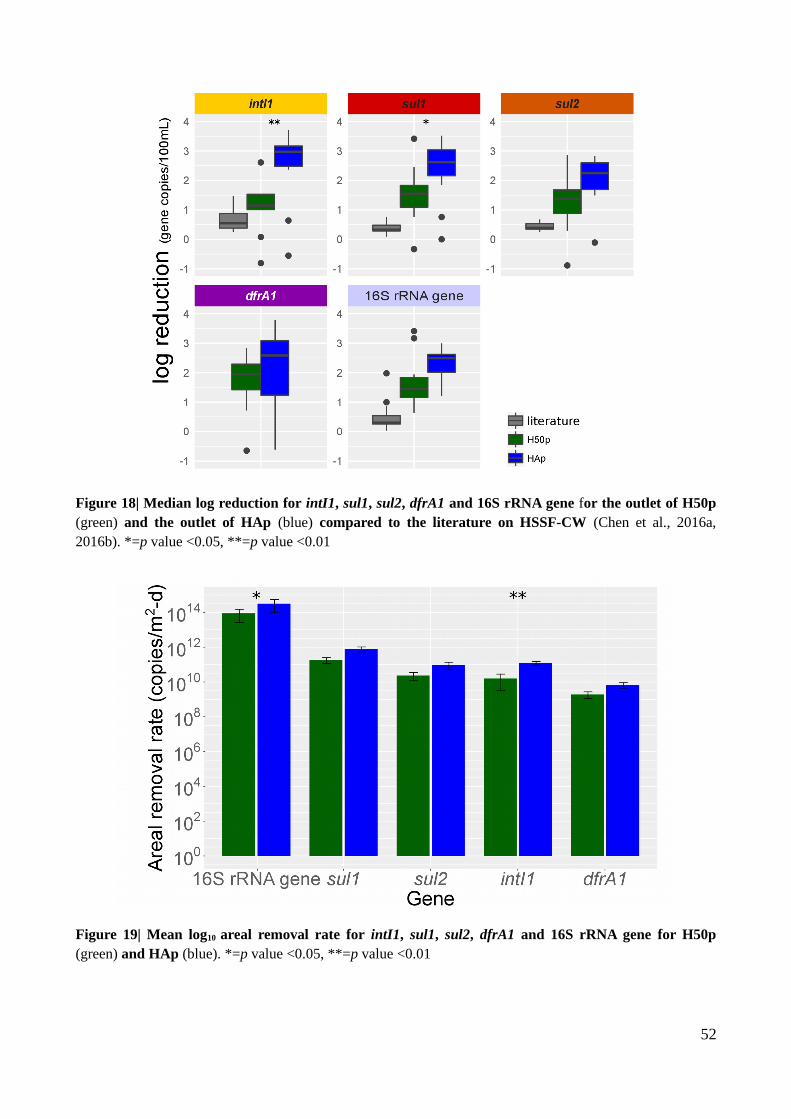
Figure 18| Median log reduction for intI1, sul1, sul2, dfrA1 and 16S rRNA gene for the outlet of H50p(green) and the outlet of HAp (blue) compared to the literature on HSSF-CW (Chen et al., 2016a,2016b). *=p value <0.05, **=p value <0.01
Figure 19| Mean log10 areal removal rate for intI1, sul1, sul2, dfrA1 and 16S rRNA gene for H50p(green) and HAp (blue). *=p value <0.05, **=p value <0.01
52

Relative abundances
The abundances of the studied genes (ARG and intI1) relative to the total bacterial community (16S
rRNA gene) (Figure 20) didn’t show any statistically significant changes, with the exception of
intI1 which increased for H50p (p <0.05). A reduction of the relative abundance of studied genes in
the CW wasn’t observed, and this is consistent with what was reported for other wastewater
technologies so far (Mao et al., 2015; Rodriguez-Mozaz et al., 2015). An increase in the relative
abundance of genes linked to MGE, as in the case of intI1 can indicate HGT. Therefore, the
significant increase in the relative abundance of only the intI1 gene was one of the reasons to look
at the processes taking place inside the CW that could affect HGT of ARG.
Figure 20| Median abundance of intI1, sul1, sul2, dfrA1 relative to 16S rRNA gene (log10) for inlet(brown), H50p outlet (green) and HAp outlet (blue). *=p value <0.05
4.1.2. Discussion
Standard wastewater parameters for H50p and HAp
The standard water parameters data recorded during this work showed the same treatment
performance than what was reported in the literature for these systems (Headley et al., 2013; Nivala
et al., 2013), indicating that the studied CW remained stable. Total suspended solids were higher for
the outlet of HAp (in Table 8), probably because of the presence of elemental sulfur. The incoming
sulfide oxidises to dispersed elemental sulfur at higher redox potential in HAp whereas in H50p it
remains dissolved as sulfide as it was documented by Saad (2017). The average percentage
reduction of C-BOD5 in H50p was 88%, almost the same reported by Tanner et al. (1995) for a
53
HSSF-CW with a similar HRT (90%). However in our case, the C-BOD5 in the outflow was double
than what was stated in the literature. This can be caused by the high organic loading rate (OLR)
which was around 11 g C-BOD5 m-2 d-1, almost double of the upper limit recommended by Kadlec
and Wallace (2009) to achieve an effluent concentration of less than 30 mg/L. HAp showed a better
treatment efficiency and fulfilled the minimum requirement in the outflow, even though the OLR
was around 42 g C-BOD5 m-2 d-1 before October 2015 and 32 g C-BOD5 m-2 d-1 after that date. The
redox potential in the outflow of H50p was around -200 mV and it was similar to the inlet. The
negative values of redox potential in spite of the presence of 2.3 mg/l of O2 can be caused by high
amounts of sulfide in the media documented by Saad (2017). Differences between the system can
be also observed in terms of nitrogenous compounds. N-ammonium was detected only in very low
concentration in the outlet of HAp whereas nitrate concentration increased, indicating that most of
the ammonium and organic-N was oxidised by bacteria (nitrification). The removal of total nitrogen
was higher for HAp (~ 54%), indicating that denitrification is taking place in HAp, in spite of the
presence of oxygen. In a review about the performance of aerated CW by Ilyas and Masih (2017),
TN removal ranged between 10% and 86% but in the case of the highest value recorded the CW had
limited aeration. Some TN was removed in H50p which is an indication that some denitrification is
taking place, for which the formation of at least some nitrate is necessary inside the system. Various
members of the genus Pseudomonas (a genus abundant among the culturable bacteria in the last
fraction of HAp) are capable of this transformation under aerobic conditions (Ji et al., 2015).
Furthermore, in spite of the overall oxygenic environment, there might be some micro-
environments lacking DO. Examples of these are spaces in the interior of biofilms which are
attached to the plant roots, the gravel and the basins walls.
Antibiotic concentrations for the inlet in this study (Table 9) were in the lowest limit of the range
reported before in the literature for Saxony and other regions of Germany (146 ng/L-1100 ng/L)
(Gurke et al., 2015; Ternes et al., 2007). The proportion SMX:TMP in the inlet was around 10:1 and
it’s not consistent with the ratio of Co-trimoxazole (5:1). This could be caused by a differential
pharmacokinetics with which these substances are eliminated from the body. On the other hand,
sulfonamides can be used in other combinations as anti-parasites in veterinary medicine which
don’t include TMP. This could be the case at the WWTP in Langenreichenbach where pig farming
is taking place in the area. Although outlet SMX concentration was lower in H50p than in HAp, the
latter showed higher areal removal rates for all studied compounds. The difference in removal rate
of SMX between the CW wasn’t as big as for TMP and N4-Ac-SMX, probably because of the
transformation of N4-Ac-SMX back into its parental compound in HAp. Lower SMX concentration
54

in the outflow of H50p can be a consequence of a longer HRT and a higher C-BOD5 throughout the
CW than in HAp, which can enhance co-metabolism. The concentration-based removal efficiency
for SMX was higher in H50p (80%) and lower in HAp (9%) than what was observed by Chen et al
(2016) in mesocosm-scale HSSF-CW (46-69%). Higher areal removal rates for HAp can be caused
by differences in water conditions such as redox potential (Rodriguez-Escales and Sanchez-Vila,
2016) and/or BOD5 (Drillia et al., 2005). Sulfamethoxazol can be degraded both under aerobic and
anaerobic conditions with different kinetics, the degradation being faster at higher redox potentials.
The dependence on C-BOD5 is valid for all the redox conditions and can be explained through co-
metabolism, where the degradation of SMX is enhanced by the presence of external labile organic
carbon. Furthermore, in contrast to what was observed for TMP before (Li and Zhang, 2010), TMP
was highly degraded in the CW. Even though the concentrations of the selected antibiotics were
very low, their presence in the incoming wastewater evidences their use and that selective pressure
towards ARB and ARG could have taken place during medical treatment.
Regarding E. coli, HAp performed better than H50p and as it can be seen by looking at the load in
the outlet and the log reduction although the areal removal rates were similar. The average
culturable E. coli load (QoutletxMPNoutlet/L) coming from H50p was 2.4x10⁸ MPN/d and from HAp
was 2.4x10⁶ MPN/d. With regard to E. coli reduction, HAp showed a reduction of 4 orders of
magnitude and H50p 1.6 orders of magnitude. The reduction of E. coli in H50p was similar to the
one observed by Decamp and Warren (2000) while treating secondary effluent with an HSSF-CW.
The higher performance of the aerated CW is in accordance with Karimi et al. (2014), who
observed a negative correlation between DO and E. coli abundance. A higher DO can indicate a
lower BOD and therefore less organic matter available, leading to starvation. Another reason can be
oxidative stress, as E. coli is a facultative anaerobe (see Section 1.5).
Characterization of antibiotic resistance for H50p and HAp
Considering the ARG abundances in the inlet and the outlets, HAp showed a similar reduction (~2
log reduction) as other treatment technologies such as activated sludge-based systems and
membrane reactors (Munir et al., 2011). Compared to other studies of the same genes in CW (Chen
et al., 2016b, 2016a; Yi et al., 2017) both studied CW showed a higher reduction. In those other
studies the substrate material and hydraulic loading rate had an impact on ARG/ARB removal and
they were laboratory scaled CW run for a shorter period of time. The time that the system has been
running is important for stability and the latter for a higher C-BOD5 removal (Samsó and García,
55

2013). It remains unknown if stability could be the reason why a high removal of ARB and ARG
occurred in the studied systems.
In terms of bacterial reduction in absolute abundance, the comparison between culture- independent
and dependent methods showed a similar reduction of CFU and 16S rRNA gene for H50p and in
HAp a higher reduction of 16S rRNA gene than CFU. This could be caused by a change in bacterial
species (which can be seen from the phylogenetical trees) as the 16S rRNA gene copy number is
species-dependant (Klappenbach, 2001). In terms of antibiotic resistance, in order to compare
absolute abundances, the number from culture-independent methods can be estimated using
Equation 8.
For sul1 (Equation 9) in the outlet of H50p this calculation results in 8x10⁶ which is of the order of
magnitude as the mean value observed from qPCR. However, in the case of the outlet of HAp the
result is zero although around 1x10⁶ copies could be still detected by qPCR. With these copy
numbers the gene should be present at least with a frequency of 0.30 of the the resistant isolates.
This incongruence could be due to a decrease in culturability of sul1 hosts. A decrease in
culturability could be caused by a higher stress pressure at the end of HAp, where oxygen is
abundant and nutrients are scarce. The host lowered culturability could mean that they are dead or
in a state in which they are no longer culturable by the used conditions but could grow again under
appropriate conditions.
Another possible explanation for the difference in ARG between culture- dependent and
independent methods is a change of hosts towards species that aren’t culturable in the used
conditions. Antibiotic resistant bacteria were identified as members of Enterobacteriaceae,
Pseudomonas, Aeromonas and Enterococcus. While the hosts for the studied genes belonged to
members of Enterobacteriaceae and Aeromonas, the other two groups rarely carried them. A shift in
taxonomy of ARB inside the CW could be observed: Enterobacteriaceae and Aeromonas were more
common among the culturable bacteria in the inlet whereas the other two groups were more
common in the outlet of the CW. If this taxonomic change also encompassed a change in ARG hosts
remains unanswered and the results of epicPCR will help to clarify this question.
The identified ARB belonging to Enterobacteriaceae, Pseudomonas and Aeromonas are members
of the class Gammaproteobacteria and the phylum Proteobacteria. Enterococcus belong to the class
Bacilli and the phylum Firmicutes. Proteobacteria, Firmicutes and Chloroflexi were shown to be the
most predominant phyla in the total bacterial community in different CW types (Bouali et al., 2014;
56
He et al., 2016). In these studies different culture-independent methods involving 16S rRNA gene
sequencing were applied. The bacterial diversity revealed in these studies was much higher than in
the current work but the method used in this case targets a bacterial sub-community which has to be
both culturable and resistant to SMX and/or TMP. In this sense, in the study from Bouali et al.
(2014) it was concluded that only 20% of the 839 operational taxonomic units (OTU) were
affiliated with cultured microorganisms in the microbial community from a HSF-CW planted with
Phragmites australis. Chloroflexi wasn’t detected in the current study but bacteria belonging to this
phylum are anaerobic and the culturing conditions used in this study are aerobic. Data from
Illumina sequencing of 16S rRNA gene of the total community has not been analysed within the
scope of this work.
With both culture dependent- and culture independent methods, HAp showed better removal rates
of ARG and ARB. Nevertheless, this difference wasn’t evident when considering relative
abundances of ARG, which remained the same with the exception of intI1 for H50p. This can also
be seen by the fact that log reductions of the studied genes aren’t significantly different compared to
the reduction of 16S rRNA gene in a particular CW. This means that no selection of the studied
genes took place in the CW. Considering CFUR/CFU, the median relative abundances increased for
TMP but not for SMX. However, the maximum values detected were always higher for the outlet of
both CW than for the inlet for both antibiotics. This can be a sign of selection or enrichment of ARB
in the CW, which aren’t hosts of the selected ARG. In the case of SMX resistance in the inlet, it can
be seen that around 60% of the isolates carry sul genes and for TMP, dfrA1 was in 10% of the
isolates. For the outlets these frequencies were lower. Together, these results indicate that CW don’t
select ARG but select/enrich bacteria which are SMX/TMP resistant through other mechanisms.
Bacteria like several members of Pseudomonas spp., which were more predominant in the outflows
than in the inlet, are naturally resistant against TMP/SMX because of efflux pumps (Köhler et al.,
1996).
4.1.3. Conclusion
In terms of physicochemical parameters (Tables 8 and 10) it was confirmed but it was already
reported in the literature for both CW: they are stable and HAp performs better. Additionally, SMX
and TMP were in very low concentrations (Table 9) and were partially removed in both CW
presumably by biodegration, as photodegradation and sorption can be discarded. Photodegradation
can be discarded because of the type of flow of the CW (subsurface) and sorption looking at the kow
57

of the studied compounds. In terms of antibiotic resistance, both CW showed higher reductions of
ARB (Figure 14) and ARG (Figure 18) than what was observed for HSSF-CW before.
For the culture dependent method in this chapter, only results from Mueller-Hinton agar were taking
into account for the analysis. An increase in CFUTMP/CFU was seen in both CW (Table 12). In the
case of CFUSMX/CFU although the median values showed a reduction in CFUSMX/CFU, single values
showed an increase (Table 11). That means that there was a partial increase in the abundance of
resistant bacteria relative to the total abundance among culturable bacteria. This difference wasn’t
statistically significant but this could be caused by a low number of biological replicates (N=3). In
the inlet, sul genes accounted for ~60% of SMX resistance observed and dfrA1 for ~10% of TMP
resistance. In the outlets, these frequencies were lower and in HAp were lower than for H50p. ARB
were identified as members of Enterobacteriaceae, Pseudomonas, Aeromonas and Enterococcus.
While ARG hosts belonged to members of Enterobacteriaceae and Aeromonas, the other two
groups rarely carried them. The decrease in the frequency of the isolates carrying the ARG at the
same time that the ARB frequency increased, can be partly explained by the phylogenetical shift of
the bacterial community into the CW. In the outflows, bacterial species that are resistant against
TMP/SMX through other mechanisms, such as Pseudomonas spp. and Enterococcus spp. were
more frequent. However, although a taxonomic change towards species that aren’t normally host of
the studied genes took place, the relative abundance of the studied genes didn’t decrease during
treatment (Figure 20).
Culture independent methods HAp performed better for all genes and this difference was significant
for intI1 and sul1. The log reductions were between one (intI1, H50p) and three orders of magnitude
(intI1, HAp). Comparing the reductions between genes within a particular CW (including the 16S
rRNA gene), the differences weren’t significant. That means that a selection of bacteria carrying the
ARG or intI1 during treatment could not be identified in neither of the CW. The abundances of the
studied genes (ARG and intI1) relative to the total bacterial community (16S rRNA gene) (Figure
20) didn’t show any statistically significant changes, with the exception of intI1 which increased for
H50p.
Aeration seemed to be beneficial for the total reduction of ARB and ARG although a question arises
from this evaluation: why can’t ARG be detected in the cultivated isolates for the outlet of HAp
although they can be detected in high abundances by the culture independent method? For this, at
least two explanations seem plausible: the same bacterial species carrying the genes in the inlet
became non-culturable during treatment and/or ARG are hosted by other bacterial species, which
58

are non-culturable under the conditions used in this work. This question and the fact that the relative
abundance of intI1 increased in the outlet of H50p led to a more detailed study inside the CW. This
permitted to take a look at the parameters driving the changes observed between inflow and
outflows and the differences between the CW.
59

4.2. Fate of antibiotic resistance in CW: internal behaviour
4.2.1. Effect of physicochemical parameters on antibiotic resistance
In order to improve the risk evaluation it is necessary to understand the biological processes linked
to antibiotic resistance. In a recent study on antibiotic resistance in E. coli from a WWTP it was
seen that, while the amount of bacteria released after treatment into the environment was reduced,
the potential for antibiotic resistance of these bacteria wasn’t (Mahfouz et al., 2018). However, this
was limited to culturable bacteria belonging to one species. Taking a look inside the CW can help to
understand which factors are responsible for the observed changes between the inlet and the
outflows of the CW in terms of ARB taxonomy and ARG abundances. Assessing which
environmental factors can increase the risk of the spreading of antibiotic resistance and the
development of new antibiotic resistance bacteria remains a challenge due to several aspects. One
major aspect is the lack of a standardised protocol for which choosing indicator bacteria and
indicator ARG is crucial. Studies in wastewater treatment currently focus on antibiotics
concentrations in water as a factor increasing the risk and to a minor extent on co-selection whereas
more general conditions like physicochemical parameters are overlooked. However,
physicochemical parameters have a big influence on the environmental microbiome. Small changes
in temperature, BOD or DO can have a large impact on the microbial community.
Aeration is a common procedure in wastewater treatment as it increases the removal efficiency of
organic compounds, which if were released into the environment would cause pollution. Also
oxygen can indirectly inhibit bacterial growth through the effects that ROS have on biomolecules
like DNA. Many bacteria suffer oxidative stress under a higher DO than what is optimal for their
growth. It has been determined that DNA damage can activate the SOS response and the latter can
affect HGT of ARG linked to integrons. How aeration affects wastewater treatment, specially in
terms of ARB and ARG, and if the additional stress caused by oxygen could increase HGT of ARG
is the main research question of this chapter (Figure 21).
With this aim and in order to address the questions that arose from Chapter 4.1, we analysed
internal samples of the CW and the same procedures that were carried out in Chapter 4.1 was
repeated with the internal samples of the CW. Taking the results coming from Mueller-Hinton
media into account, three selective and differential agar media for the most common ARB,
Enterobacteriaceae, Pseudomonas and Aeromonas, were chosen. This was a way to zoom into the
60
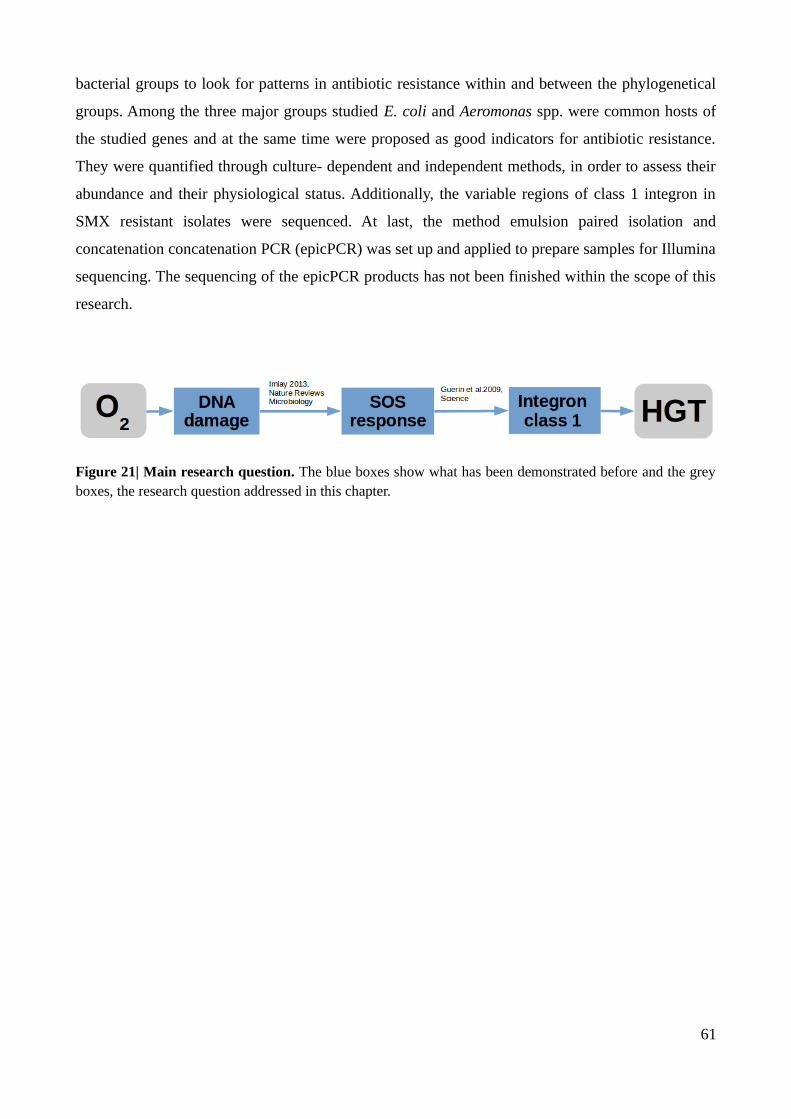
bacterial groups to look for patterns in antibiotic resistance within and between the phylogenetical
groups. Among the three major groups studied E. coli and Aeromonas spp. were common hosts of
the studied genes and at the same time were proposed as good indicators for antibiotic resistance.
They were quantified through culture- dependent and independent methods, in order to assess their
abundance and their physiological status. Additionally, the variable regions of class 1 integron in
SMX resistant isolates were sequenced. At last, the method emulsion paired isolation and
concatenation concatenation PCR (epicPCR) was set up and applied to prepare samples for Illumina
sequencing. The sequencing of the epicPCR products has not been finished within the scope of this
research.
Figure 21| Main research question. The blue boxes show what has been demonstrated before and the greyboxes, the research question addressed in this chapter.
61

4.2.2. The role of aeration in horizontal gene transfer of ARG
4.2.2.1 Standard wastewater parameters within H50p and HAp
Changes in C-BOD5 content and DO along the flow path of H50p and HAp are depicted in Figure
22. These values as well as other raw data are shown in Appendix B. DO value increased sharply
after 0.25 of the fractional length, reaching oxygen saturation in the outlet of HAp. For H50p, DO
remained low (~1 mg/L) throughout the watercourse, with the exception of H50p out. Together, C-
BOD5, DO, redox potential and nitrogenous compounds concentrations give information of the
predominant overall microbial metabolisms taking place in the CW.
Figure 22| Mean dissolved oxygen and carbonaceous oxygen demand along the flow path. DO (darkcolours) and C-BOD5 (light colours) values along the flow path for HAp (blue) and H50p (green), N=9.
62
H50p
HAp

Figure 22 also shows that dissolved oxygen is absent for the first fraction of HAp although aeration
is taking place uniformly along the flow path path. Figure 23 shows how ammonia was transformed
to nitrate, which indicates that oxygen is being introduced to the system although it was not
measurable. The internal behaviour of nitrogenous compounds wasn’t measured for H50p as the
concentration of nitrogenous compounds didn’t change as much as in HAp (Table 8). Nitrate-N
concentration in the inlet was always below the level of detection and in 0.12 of the fractional
length of HAp the value rose to 0.1 mg/L. Nitrite-N concentration was mostly zero, although for
same samples in HAp 0.25 and 0.50 it had values of 0.1-0.8 mg/l.
Figure 23| Mean nitrogenous compounds along the flow path for HAp. NH4+-N (dark blue) and NO3
--N(light blue), N=8.
Antibiotics concentrations.
The concentrations of SMX, N4-Ac-SMX and TMP along the flow path are shown in Figure 24 and
25. Other antibiotics belonging to the sulfonamide family; sulfadiazine and sulfamethazine were
detected in even lower concentrations in all the samples (<2 ng/L). The concentration of SMX and
TMP in sediments were normally below the level of detection (except for one sample where the
concentration was 2 ng/g of sediment). This confirmed what is reported about SMX and TMP in the
literature, that these antibiotics don’t accumulate in the sediment and discarded the possibility of a
higher selection pressure in the sediments than in water. The difference in concentrations between
the CW weren’t statistically significant for any of the sampling points inside the CW. The average
concentrations of SMX and TMP in the inlet were at least 7 and 8 orders of magnitude lower than
63
HAp

their Minimal Inhibitory Concentrations (MIC), respectively (Czekalski et al., 2012). Trimethoprim
concentrations were one order of magnitude lower than SMX concentrations.
For both wetlands, a sustained decrease in N4-Ac-SMX was seen. For SMX, H50p showed a
decrease all along the flow path, whereas in HAp it remained around constant. For TMP the
concentration decreased until 0.5 of the fractional length for both CW and to a larger extent for
HAp. For 0.75 and 1.00 of HAp the concentration remained almost constant. In the case of H50p,
the concentration continued decreasing till 0.75 of the fractional length and remained constant
towards the outlet. Nevertheless, it is worth noticing that in this case the values are close to the limit
of detection of the method (1.5 ng/mL).
Sulfamethoxazole N4-Acetyl-sulfamethoxazole
Figure 24| Sulfamethoxazole (left) and N4-acetylsulfamethoxazole concentrations (right) for the inlet(brown), HAp (blue) and H50p (green). N=6
Trimethoprim
Figure 25| Trimethoprim concentration for the inlet (brown), HAp (blue) and H50p (green). N=6
64
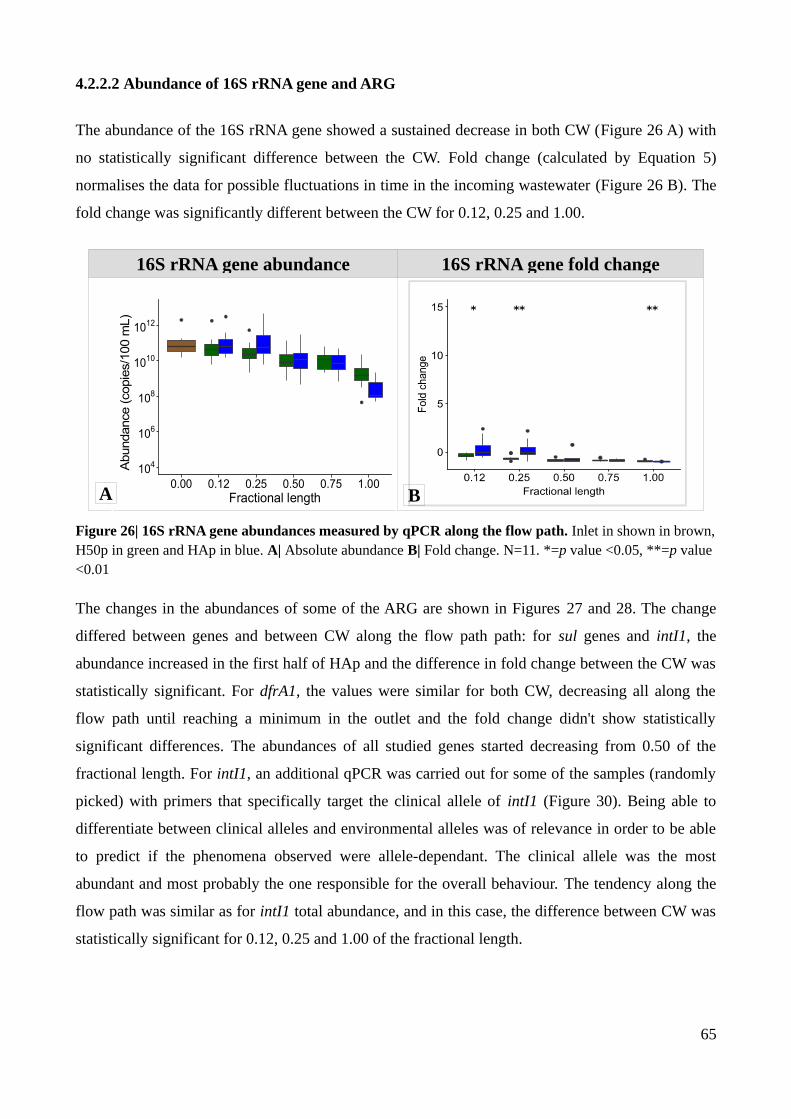
4.2.2.2 Abundance of 16S rRNA gene and ARG
The abundance of the 16S rRNA gene showed a sustained decrease in both CW (Figure 26 A) with
no statistically significant difference between the CW. Fold change (calculated by Equation 5)
normalises the data for possible fluctuations in time in the incoming wastewater (Figure 26 B). The
fold change was significantly different between the CW for 0.12, 0.25 and 1.00.
16S rRNA gene abundance 16S rRNA gene fold change
Figure 26| 16S rRNA gene abundances measured by qPCR along the flow path. Inlet in shown in brown,H50p in green and HAp in blue. A| Absolute abundance B| Fold change. N=11. *=p value <0.05, **=p value <0.01
The changes in the abundances of some of the ARG are shown in Figures 27 and 28. The change
differed between genes and between CW along the flow path path: for sul genes and intI1, the
abundance increased in the first half of HAp and the difference in fold change between the CW was
statistically significant. For dfrA1, the values were similar for both CW, decreasing all along the
flow path until reaching a minimum in the outlet and the fold change didn't show statistically
significant differences. The abundances of all studied genes started decreasing from 0.50 of the
fractional length. For intI1, an additional qPCR was carried out for some of the samples (randomly
picked) with primers that specifically target the clinical allele of intI1 (Figure 30). Being able to
differentiate between clinical alleles and environmental alleles was of relevance in order to be able
to predict if the phenomena observed were allele-dependant. The clinical allele was the most
abundant and most probably the one responsible for the overall behaviour. The tendency along the
flow path was similar as for intI1 total abundance, and in this case, the difference between CW was
statistically significant for 0.12, 0.25 and 1.00 of the fractional length.
65
104
106
108
1010
1012
0.00 0.12 0.25 0.50 0.75 1.00Fractional length
Abu
ndan
ce (
copi
es/1
00 m
L)
A B

intI1 sul1
sul2 dfrA1
Figure 27 | Absolute gene abundances measured by qPCR along the flow path. Inlet in shown in brown,H50p in green and HAp in blue. A| intI1 B| sul1 C| sul2 D| dfrA1. N=11
The genes intI1 and sul1 are frequently genetically linked in the class 1 integron structure and thus
their similar behaviour indicates that the increase in the first sampling points of HAp are due to this
type of integron. Furthermore, an increase in sul2 abundance was also seen although this gene
hasn’t been detected previously in class 1 integrons. A correlation in the abundances of intI1 and
sul2 has already been observed by Chen et al. (2015). In this study the concentrations of intI1 and
several resistance genes were measured by qPCR in samples from a river. A possible explanation is
that the integron class 1 and sul2 can be on the same plasmid, as in the case of plasmid p148 (del
Castillo et al., 2013). This plasmid belongs to the incA/C group, which are conjugative and broad
host range.
66
104
105
106
107
108
109
1010
1011
0.00 0.12 0.25 0.50 0.75 1.00Fractional length
Abu
ndan
ce (
copi
es/1
00 m
L)
104
105
106
107
108
109
1010
1011
0.00 0.12 0.25 0.50 0.75 1.00Fractional length
Abu
ndan
ce (
copi
es/1
00 m
L)
104
105
106
107
108
109
1010
1011
0.00 0.12 0.25 0.50 0.75 1.00Fractional length
Abu
ndan
ce (
copi
es/1
00 m
L)
104
105
106
107
108
109
1010
1011
0.00 0.12 0.25 0.50 0.75 1.00Fractional length
Abu
ndan
ce (
copi
es/1
00 m
L)
A B
C D

intI1 sul1
sul2 dfrA1
Figure 28 | Fold change of gene abundances along the flow path. H50p is shown in green and HAp inblue. A| intI1 B| sul1 C| sul2 D| dfrA1. N=11. *=p value <0.05, **=p value <0.01
Although dfrA1 can be found as gene cassette in integrons, in a study in aquaculture farms
(Muziasari et al., 2014), intI1 and dfrA1 abundances weren’t correlated, suggesting that other
genetic context are prevalent for dfrA1. The trend seen for 16S rRNA gene was similar to the one
observed for dfrA1, indicating that the increase in sul genes and intI1 is specific and it’s not a result
of clonal amplification. In Figure 29, the abundance of intI1 relative 16S rRNA gene is shown
against 16S rRNA gene abundance. That the relative abundance is not correlated with 16S rRNA
gene abundance further confirms that the increase in intI1 isn’t a result of clonal amplification and
that is not a consequence of a higher bacterial density (higher connectivity). That this increase took
place only in the first fraction of HAp and was specific for intI1 led to the hypothesis that oxidative
stress was the cause for this observation. Oxidative stress can damage the DNA and DNA damage
has already been linked to a higher integrase activity (Guerin et al., 2009) and to an increased HGT
of int and ARG (Beaber et al., 2004).
67
A B
C D

Figure 29| intI1 abundance relative to 16S rRNA gene vs. 16S rRNA gene abundance. x-axis decreasesto the right in order to reflect the flow path in the CW, where the 16S rRNA gene abundance decreasestowards the outflow. N=11
Figure 30| Abundance of intI1 measured by qPCR along the flow path. Inlet is shown in brown, H50p ingreen and HAp in blue. A| Absolute abundance B| Fold change. N=6. *=p value <0.05, **=p value<0.01
Antibiotic resistant bacteria quantification and characterization.
Culturing and sequencing of the 16S rRNA gene of 256 SMX or TMP resistant isolates further
confirmed that the culturable hosts of the studied genes in our systems belonged to the genera
Aeromonas and Pseudomonas and to the family Enterobacteriaceae. In Figure 31 the 256 isolates
that were sequenced are shown without distinguishing between agar media, antibiotic used or CW
from which they originated.
68
104
105
106
107
108
109
1010
1011
0.00 0.12 0.25 0.50 0.75 1.00Fractional length
Ab
unda
nce
(co
pies
/100
mL) ** * *
intI1
/16
S r
RN
A g
en
e
0
5
10
15
0.12 0.25 0.50 0.75 1.00Sample
Fo
ld c
hang
e
*
A B

The taxonomic distribution of sul1 hosts was similar to the taxonomic distribution of intI1 hosts and
Aeromonas spp. was the most abundant group. The taxonomic distribution of sul2 hosts was similar
to the taxonomic distribution of dfrA1 hosts and in this case Enterobacteriaceae spp. was the most
abundant group. The results for intI1 and sul1 were not identical in terms of their host. This further
confirms the observations from qPCR results, where the results for sul1 were similar yet not
identical to those for intI1. Although sul1 is part of the 3’ conserved region of the class 1 integron,
some variants lacking this region have been already detected before (Chah et al., 2010).
Figure 31| Proportion of the gene hosts grouped in the main three hosts types detected by sequencingof the resistant (SMX and TMP) isolates in percentage. The hosts for each gene are shown without
distinguishing between sampling points, constructed wetland variety or isolation media. N= 256.
The selectivity property of the agar media isn’t 100% effective. These agar media are useful in
clinical diagnostic in order to be able to differentiate among some pathogens. The results obtained
with environmental samples can vary due to the great diversity of the bacterial community.
Endoagar permitted the growth of Aeromonas and Pseudomonas, and Enterobacteriaceae and
Aeromonas were able to grow on Pseudomonas isolation agar.
Sulfamethoxazole-resistant isolates
The results of CFU counting along the flow path are shown in Figures 32-34 (A-B). For Mueller-
Hinton agar, the tendency was similar without or with SMX. For EA and PIA, CFU numbers were
similar in HAp and H50p on the plates without SMX. On the plates with SMX, the counting was
higher for HAp in the first two sampling points and for PIA it was higher than in the inlet, even
69
intI1 sul1 sul2 dfrA1
0
25
50
75
100
Aeromonas
Enterobacteriaceae
Pseudomonas

though those differences weren’t statistically significant. In order to find out the genotype
responsible for the resistance, the resistant isolates were PCR-screened for the sul1 and sul2. intI1
was also studied (32-34, C-D panels). The same incubation conditions were used for all the media
in order to be able to compare the results between the media.
Mueller-Hinton agar (MH agar):
Figure 32| Mueller-Hinton agar (MH agar) colony forming units (CFU) counting and colony-PCRsurvey along the flow path. A-B| Inlet in shown in brown, H50p in green and HAp in blue. CFU withoutantibiotics are shown with grey border and CFU on MH agar+SMX with red border. N=3 sampling days. C-
D| Percentage of bacteria isolated from MH agar+SMX carrying intI1 (▬), sul1 (▬) and sul2 (▬) for H50p
and HAp. N=20 isolates per sampling site on one sampling day.
70
106
107
108
109
1010
0.00 0.12 0.25 0.50 0.75 1.00Fractional length
Abu
nda
nce
(CF
U/1
00 m
L)
106
107
108
109
1010
0.00 0.12 0.25 0.50 0.75 1.00Fractional length
Ab
unda
nce (
CF
U/1
00 m
L)
A B
D
MH MH+SMX
MH+SMXH50p
C
MH+SMXHAp
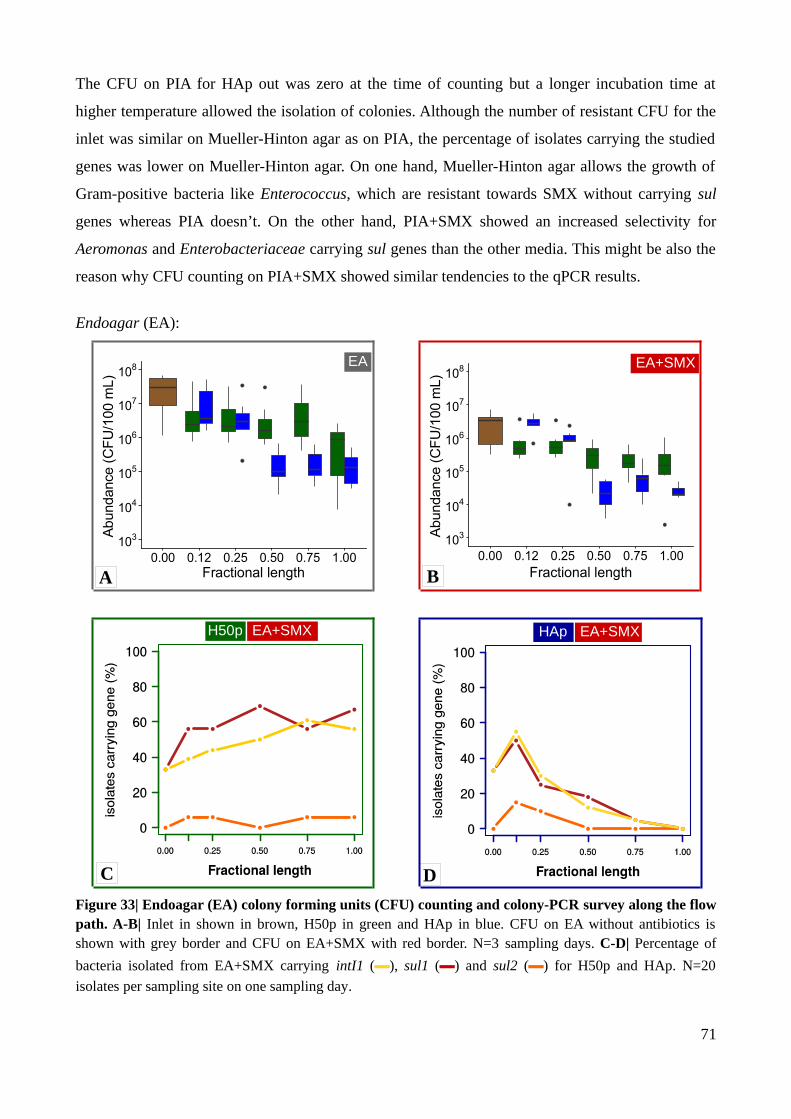
The CFU on PIA for HAp out was zero at the time of counting but a longer incubation time at
higher temperature allowed the isolation of colonies. Although the number of resistant CFU for the
inlet was similar on Mueller-Hinton agar as on PIA, the percentage of isolates carrying the studied
genes was lower on Mueller-Hinton agar. On one hand, Mueller-Hinton agar allows the growth of
Gram-positive bacteria like Enterococcus, which are resistant towards SMX without carrying sul
genes whereas PIA doesn’t. On the other hand, PIA+SMX showed an increased selectivity for
Aeromonas and Enterobacteriaceae carrying sul genes than the other media. This might be also the
reason why CFU counting on PIA+SMX showed similar tendencies to the qPCR results.
Endoagar (EA):
Figure 33| Endoagar (EA) colony forming units (CFU) counting and colony-PCR survey along the flowpath. A-B| Inlet in shown in brown, H50p in green and HAp in blue. CFU on EA without antibiotics isshown with grey border and CFU on EA+SMX with red border. N=3 sampling days. C-D| Percentage of
bacteria isolated from EA+SMX carrying intI1 (▬), sul1 (▬) and sul2 (▬) for H50p and HAp. N=20
isolates per sampling site on one sampling day.
71
103
104
105
106
107
108
0.00 0.12 0.25 0.50 0.75 1.00Fractional length
Abu
nda
nce
(CF
U/1
00 m
L)
103
104
105
106
107
108
0.00 0.12 0.25 0.50 0.75 1.00Fractional length
Abun
danc
e (
CF
U/1
00 m
L)
C D
EA EA+SMX
EA+SMXHApEA+SMXH50p
A B

Furthermore, sul1 abundance and CFU on PIA+SMX had the same order of magnitude, whereas for
the other media the CFU counting was an order of magnitude higher than sul1 abundance. For the
inlet, CFU without antibiotics on PIA had the same order of magnitude as on the plates with SMX,
whereas CFU on the other media with antibiotics showed one order of magnitude less than the
corresponding plates without SMX. 20 isolates from PIA plates without antibiotics were screened
and the colonies didn’t carry sul genes, with no difference in taxonomy.
Pseudomonas isolation agar (PIA):
Figure 34| Pseudomonas isolation agar (PIA) colony forming units (CFU) counting and colony-PCRsurvey along the flow path. A-B| Inlet in shown in brown, H50p in green and HAp in blue. CFU on PIAwithout antibiotics is shown with grey border and on PIA+SMX with red border. N=3 sampling days. C-D|
Percentage of bacteria isolated from PIA+SMX carrying intI1 (▬), sul1 (▬) and sul2 (▬) for H50p and
HAp N=20 isolates per sampling site on one sampling day.
72
105
106
107
108
109
1010
0.00 0.12 0.25 0.50 0.75 1.00Fractional length
Abu
ndanc
e (C
FU
/100
mL)
A B
C D
105
106
107
108
109
1010
0.00 0.12 0.25 0.50 0.75 1.00Fractional length
Abu
nda
nce
(CF
U/1
00 m
L)
PIA PIA+SMX
PIA+SMXHApH50p PIA+SMX
In Figure 35, the proportion out of 825 SMX resistant isolates carrying sul genes and intI1 are
shown along the flow path for both CW. In the inlet, most of the resistant isolates tested carried at
least one of the genes. This remained constant for H50p but decreased to almost zero in HAp. The
change in HAp is likely partly due to a shift in the bacterial community along the flow path in HAp
to species that are naturally resistant to SMX, like Pseudomonas spp or Enterococcus spp (Figures
16-17, 35-38). However both intI1 and sul genes were still abundant in the outlet of HAp but were
in hosts that weren’t culturable in the used conditions. Either hosts culturability had been
compromised through environmental stress (starvation and ROS) or a change in hosts had taken
place towards species that can’t be cultured. Sulfamethoxazole resistant isolates from all media that
were intI1 positive with Mazel’s primers (environmental and clinical) were also tested with Gillings
primers (clinical). Of all bacteria carrying integrons, 13% of the isolates hosted an environmental
variant.
The phylogenetic trees of bacteria isolated from different agar media showed similar results as what
was seen in chapter 4.1 for Mueller-Hinton agar. In this case, isolates coming from 0.12 and 0.25 of
the fractional length in HAp were included. Only one of the isolates identified as Pseudomonas this
time were host of the studied genes. Finding Pseudomonas which carry the studied genes depends
on the selection criteria. In the case of the isolates in the phylogenetic trees in this chapter, the
resistant isolates were randomly picked. If only those resistant isolates carrying one of the studied
genes were picked to be sequenced, some Pseudomonas could be found as it can be seen from
Figure 31. In the case of Mueller-Hinton agar, resistant Enterobacteriaceae outweighed resistant
Aeromonas and Pseudomonas. Gram-positive bacteria can grow on Mueller-Hinton agar and can be
recognised from the tree because they have no background colour. In the case of EA and PIA,
Aeromonas outweighed Enterobacteriaceae and no resistant Gram-positive bacteria were detected.
In the case of PIA, all the resistant isolates that weren’t identified as Pseudomonas carried at least
one of the sul genes. One isolate belonging to the Nitrobacterium family carried both sul1 and sul2
genes. The results from this media showed that the hosts of class 1 integrons in the inlet belonged to
Enterobacteriaceae, while for the rest of the sampling points they were identified as Aeromonas.
This wasn’t the case for EA, where some of the class 1 integron hosts were identified as Aeromonas
both in the inlet and in the rest of the sampling points. These results confirm Aeromonas as good
indicator bacteria for antibiotic resistance monitoring. They also suggest the importance of
Aeromonas as ARG reservoirs in aquatic environments.
73

Figure 35| Genotypes of sulfamethoxazole resistant bacteria isolated from the same sampling day on Mueller-Hinton agar, Pseudomonas isolation agar andEndoagar along the flow path. Percentage of isolates carrying intI1 in yellow. Percentage of isolates carrying sul1 in light red, sul2 in orange and sul1+sul2 in darkred. The inlet is shown on the left, H50p on top and HAp at the bottom, n: 53-60 isolates per sampling point.
74
H50p inlet
0.00 1.000.750.500.250.12
HAp
Fractional length
0.00 1.000.750.500.250.12
inlet
HAp
H50p

Mueller-Hinton agar
intI1 sul1 sul2
Figure 36| Phylogenetic tree of sequenced sulfamethoxazole resistant bacteria from Mueller-Hintonmedia and reference strains. N=7 per sample point.
75
1
Escherichia coli
Aeromonas aquatica
Pseudomonas putida
1.0

Endoagar
intI1 sul1 sul2
Figure 37| Phylogenetic tree of sequenced sulfamethoxazole resistant bacteria from endoagar mediaand reference strains. N=7 per sample point.
76
Escherichia coli
Pseudomonas putida
11.0
Aeromonas aquatica
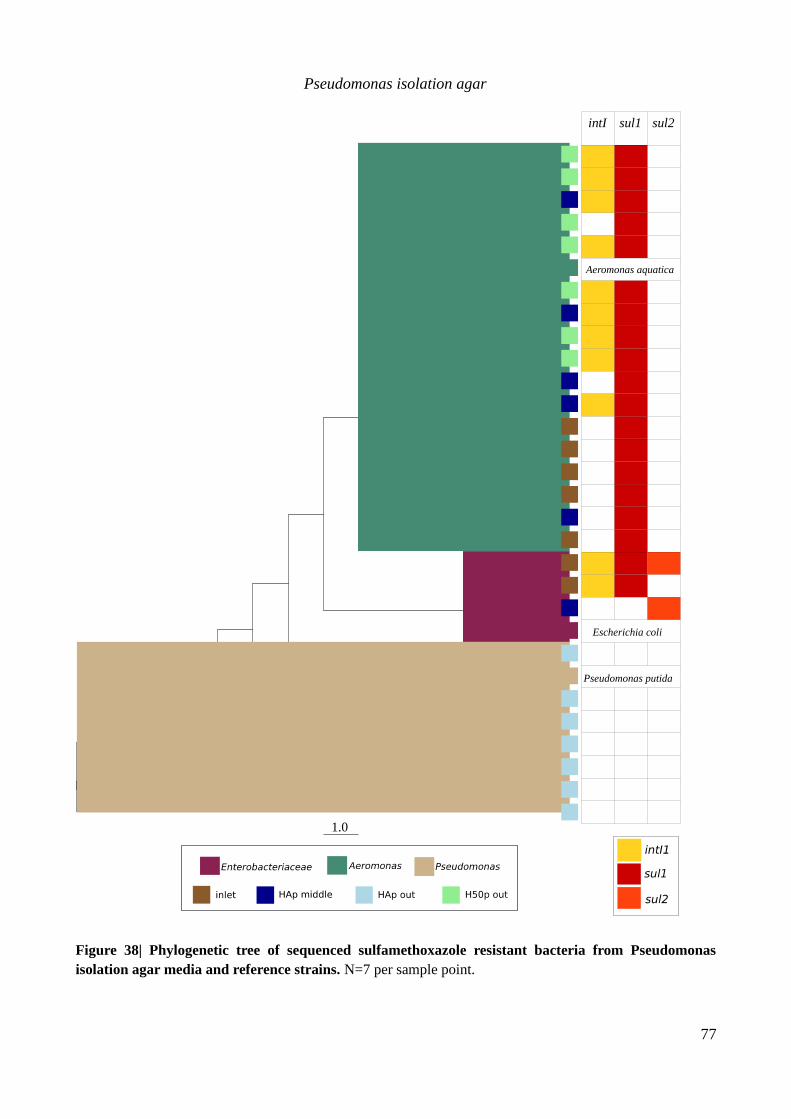
Pseudomonas isolation agar
intI
1
sul1 sul2
Figure 38| Phylogenetic tree of sequenced sulfamethoxazole resistant bacteria from Pseudomonasisolation agar media and reference strains. N=7 per sample point.
77
1
Escherichia coli
Pseudomonas putida
Aeromonas aquatica
1.0
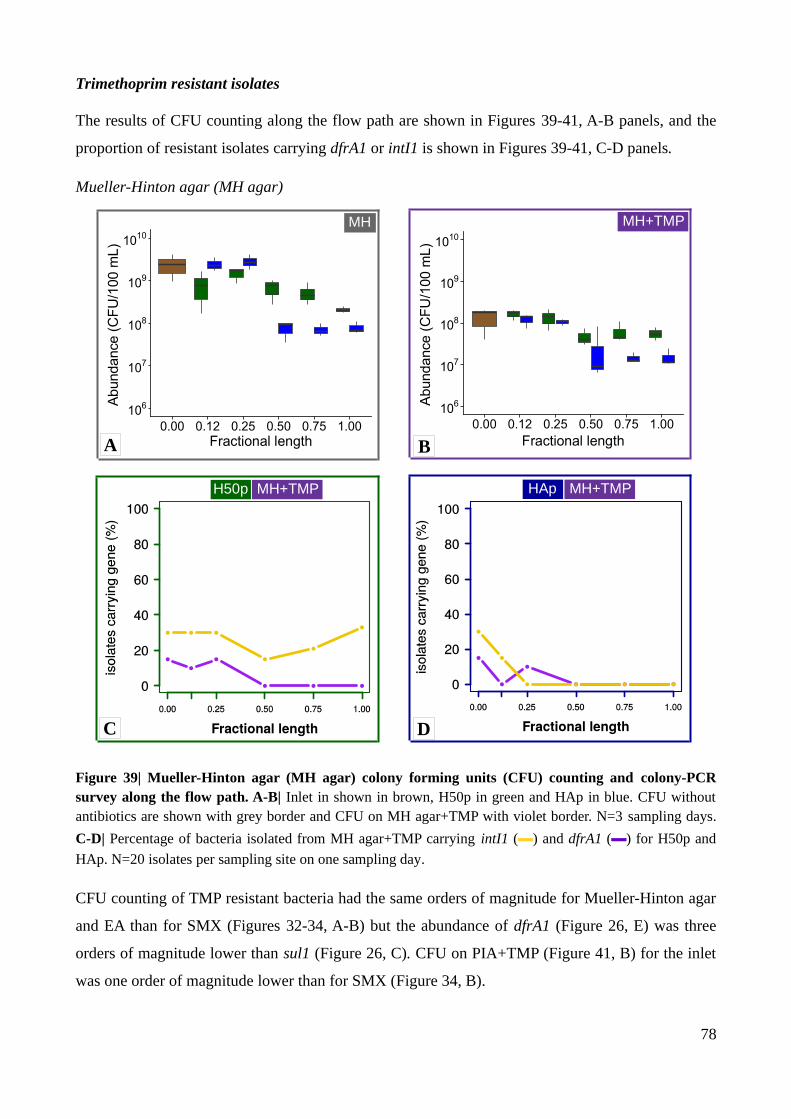
Trimethoprim resistant isolates
The results of CFU counting along the flow path are shown in Figures 39-41, A-B panels, and the
proportion of resistant isolates carrying dfrA1 or intI1 is shown in Figures 39-41, C-D panels.
Mueller-Hinton agar (MH agar)
Figure 39| Mueller-Hinton agar (MH agar) colony forming units (CFU) counting and colony-PCRsurvey along the flow path. A-B| Inlet in shown in brown, H50p in green and HAp in blue. CFU withoutantibiotics are shown with grey border and CFU on MH agar+TMP with violet border. N=3 sampling days.
C-D| Percentage of bacteria isolated from MH agar+TMP carrying intI1 (▬) and dfrA1 (▬) for H50p and
HAp. N=20 isolates per sampling site on one sampling day.
CFU counting of TMP resistant bacteria had the same orders of magnitude for Mueller-Hinton agar
and EA than for SMX (Figures 32-34, A-B) but the abundance of dfrA1 (Figure 26, E) was three
orders of magnitude lower than sul1 (Figure 26, C). CFU on PIA+TMP (Figure 41, B) for the inlet
was one order of magnitude lower than for SMX (Figure 34, B).
78
106
107
108
109
1010
0.00 0.12 0.25 0.50 0.75 1.00Fractional length
Abu
ndanc
e (C
FU
/100
mL)
106
107
108
109
1010
0.00 0.12 0.25 0.50 0.75 1.00Fractional length
Abun
danc
e (
CF
U/1
00 m
L)
A B
C D
MH MH+TMPMH+TMP
HAp MH+TMPH50p MH+TMP

Endoagar (EA)
Figure 40| Endoagar (EA) colony forming units (CFU) counting and colony-PCR survey along the flowpath. A-B| Inlet in shown in brown, H50p in green and HAp in blue. CFU without antibiotics are shown withgrey border and CFU on EA+TMP with violet border. N=3 sampling days. C-D| Percentage of bacteria
isolated from EA agar+TMP carrying intI1 (▬) and dfrA1 (▬) for H50p and HAp. N=20 isolates per
sampling site on one sampling day.
The proportion of isolates on TMP carrying the intI1 and dfrA1 genes showed similarities with
those from SMX (Figure 32-34, C-D) in that the percentage was the lowest for Mueller-Hinton agar,
intermediate for EA and highest for PIA. In contrast to the observed trend for SMX and sul1
(Figures 32-34, C-D), the proportion of ARB carrying intI1 often outweighed the proportion of
ARB carrying dfrA1. Furthermore, about 75% of the isolates that were dfrA1 positive, didn’t carry
this gene in the genetic context of class 1 integrons. Most of the isolates for which this observation
was true, were identified as Enterobacteriaceae (Figures 43-45). The presence of dfrA1 in a genetic
context different than class 1 integrons was detected more frequently on TMP than on SMX. SMX
79
103
104
105
106
107
108
0.00 0.12 0.25 0.50 0.75 1.00Fractional length
Abu
ndanc
e (C
FU
/100
mL)
103
104
105
106
107
108
0.00 0.12 0.25 0.50 0.75 1.00Fractional length
Abun
danc
e (
CF
U/1
00 m
L)
A B
C D
EA EA+TMP
EA+TMPH50p EA+TMPHAp

indirectly selects for intI1 because sul1 is often in the conserved regions of these integrons. When
comparing the results for the inlet in the case of TMP, CFUTMP were also higher than the abundance
of dfrA1 measured by qPCR (Figure 26, E). In this case, the difference in orders of magnitude
between the qPCR results and the CFU were higher than for SMX.
Pseudomonas isolation agar (PIA)
Figure 41| Pseudomonas isolation agar (PIA) colony forming units (CFU) counting and colony-PCRsurvey along the flow path. A-B| Inlet in shown in brown, H50p in green and HAp in blue. CFU withoutantibiotics are shown with grey border and CFU on PIA+TMP with violet border. N=3 sampling days. C-D|
Percentage of bacteria isolated from PIA agar+TMP carrying intI1 (▬) and dfrA1 (▬) for H50p and HAp.
N=20 isolates per sampling site on one sampling day.
In Figure 42, the proportion out of 787 TMP resistant isolates carrying dfrA1 genes and intI1 are
shown along the flow path for both CW. Comparing the proportion of isolates that carry dfrA1 with
the abundance of this gene from qPCR data (Figure 26, E), it can be seen that for HAp the reduction
80
105
106
107
108
109
1010
0.00 0.12 0.25 0.50 0.75 1.00Fractional length
Abu
ndanc
e (C
FU
/100
mL)
105
106
107
108
109
1010
0.00 0.12 0.25 0.50 0.75 1.00Fractional length
Abu
ndanc
e (C
FU
/100
mL)
A B
C D
PIA PIA+TMP
H50p PIA+TMP HAp PIA+TMP

is reflected whereas for H50p is not: while the abundance of the gene decreased for both CW, the
proportion of isolates remained the same for H50p and decreased for HAp.
The percentage of isolates carrying intI1 were comparable for both antibiotics on PIA, and that is
the reason why the results of CFUTMP were also similar to qPCR results, as it was seen for SMX. An
increase of CFUTMP for the first sampling points of HAp could be observed, although dfrA1
abundance decreased. Another difference between PIA+SMX and PIA+TMP was that on the latter
there were still 106 CFU/100 mL in the outlet for HAp, where for SMX there was none. This can be
a consequence of the growth of Gram-positive bacteria, like Enterococcus spp. (Figures 43-45).
Figures 43-45 also show that TMP resistant bacteria weren’t different to SMX resistant bacteria in
terms of their taxonomy. As in the case of PIA+SMX, isolates from PIA+TMP carried the studied
genes more frequently than isolates on the other two agar media. On Mueller-Hinton agar no TMP
resistant Aeromonas were detected but these could be observed in the other two agar media with a
similar frequency to Enterobacteriaceae.
81

Figure 42| Genotypes of trimethoprim bacteria isolated from the same sampling day on Mueller-Hinton agar, Pseudomonas isolation agar and Endoagaralong the flow path. Percentage of isolates carrying intI1 in yellow, percentage of isolates carrying dfrA1 in purple. The inlet is shown on the left, H50p on top andHAp at the bottom, N=52-59 per sampling point.
82
H50p inlet
0.00 1.000.750.500.250.12
HAp
Fractional length
0.00 1.000.750.500.250.12
inlet
HAp
H50p

Mueller-Hinton
intI1 dfrA1
Figure 43| Phylogenetic tree of sequenced trimethoprim resistant bacteria from Mueller-Hinton mediaand reference strains. N=4 per sampling point.
83
1
Escherichia coli
Aeromonas hydrophila
Pseudomonas putida
1.0

Endoagar
intI1 dfrA1
Figure 44| Phylogenetic tree of sequenced trimethoprim resistant bacteria from endoagar media andreference strains. N=4 per sampling point.
84
0.8
Escherichia coli
Pseudomonas putida
Aeromonas hydrophila
0.8

Pseudomonas isolation agar
intI1 dfrA1
Figure 45| Phylogenetic tree of sequenced trimethoprim resistant bacteria from Pseudomonas isolationagar media and reference strains. N=4 per sampling point.
85
1
Pseudomonas putida
Aeromonas hydrophila
Escherichia coli
1.0

Gene cassettes
The enzyme IntI1 mediates the recombination of antibiotic-resistant gene cassettes between
different integrons in the same cell, facilitating the persistence and dissemination of these genes
(Shearer and Summers, 2009). If a cell carries only one copy of class 1 integron, the PCR product
run in an agarose gel will show only one band. If the cell carries more than one integron class 1
with different variable regions, the PCR product shows more than one band in an agarose gel
(polycarriers). In Figure 46, those isolates showing more than one band as a result of the
amplification of the variable region of class 1 integron were taken into account. The number of
combinations of different types in a cell are shown in the y axis for the different sampling sites.
HAp showed a higher integron diversity than H50p, being highest in isolates from the first half of
the bed and thus mirroring the increase in intl1 abundance. The antibiotic resistance genes found in
the variable region were: dfrA1, aadA1, aadA2 and catB3 in different combinations (Table 14). Data
on which inserts combinations were found and their frequency are shown in Table 15.
Figure 46| Class 1 integrons diversity of polycarriers isolates along the flow path for inlet (brown), HAp(blue) and H50p (green). Polycarriers host more than class 1 integron type per cell. Type is assigneddepending on the size of the variable region.
Table 14| Gene cassettes types inserted in class 1 integrons in the studied isolates. The type wasdetermined according to their sizes (in brackets). Cassettes sequences are listed in Appendix C
Cassette type Gene cassettes hosts taxonomy
A (150 bp) - Aeromonas
B (600-850 bp) aadA1 Enterobacteriaceae
C (1000 bp) aadA2|catB3 Enterobacteriaceae
D (2200 bp) dfrA1|catB3|aadA4 Aeromonas/Enterobacteriaceae
E (2700 bp) aadA|pkg|ereA|Orf Enterobacteriaceae
86
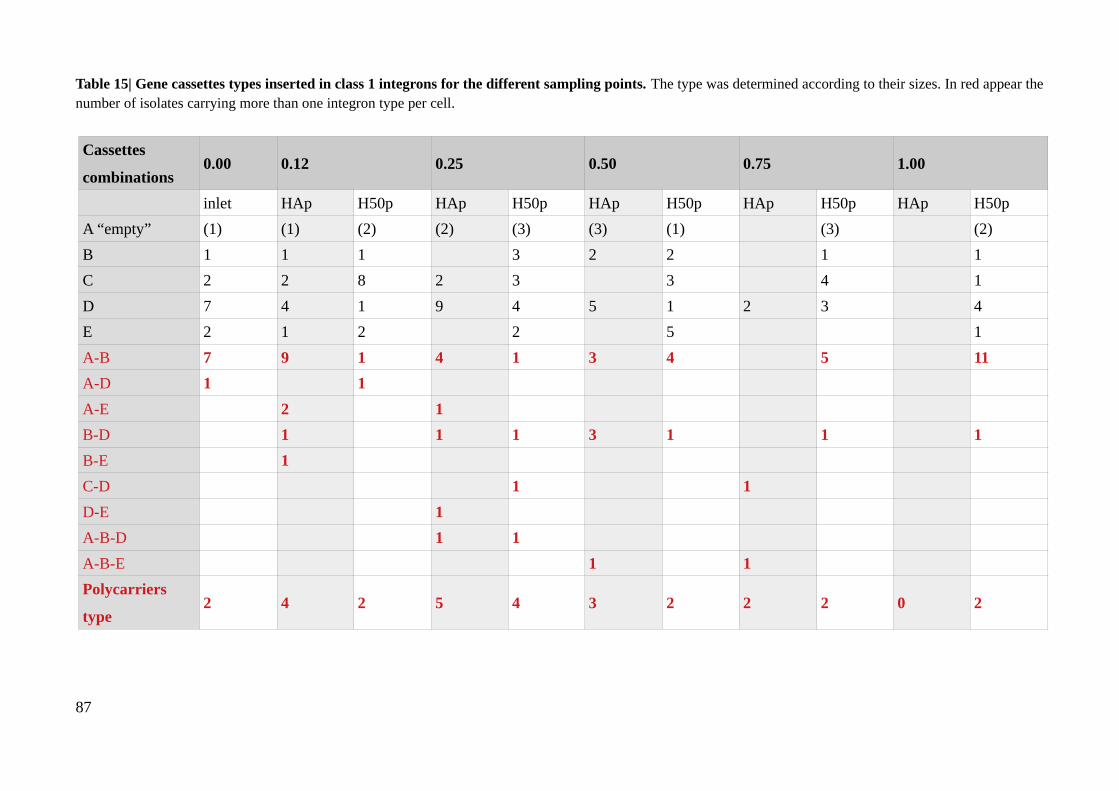
Table 15| Gene cassettes types inserted in class 1 integrons for the different sampling points. The type was determined according to their sizes. In red appear thenumber of isolates carrying more than one integron type per cell.
Cassettes
combinations0.00 0.12 0.25 0.50 0.75 1.00
inlet HAp H50p HAp H50p HAp H50p HAp H50p HAp H50p
A “empty” (1) (1) (2) (2) (3) (3) (1) (3) (2)
B 1 1 1 3 2 2 1 1
C 2 2 8 2 3 3 4 1
D 7 4 1 9 4 5 1 2 3 4
E 2 1 2 2 5 1
A-B 7 9 1 4 1 3 4 5 11
A-D 1 1
A-E 2 1
B-D 1 1 1 3 1 1 1
B-E 1
C-D 1 1
D-E 1
A-B-D 1 1
A-B-E 1 1
Polycarriers
type2 4 2 5 4 3 2 2 2 0 2
87
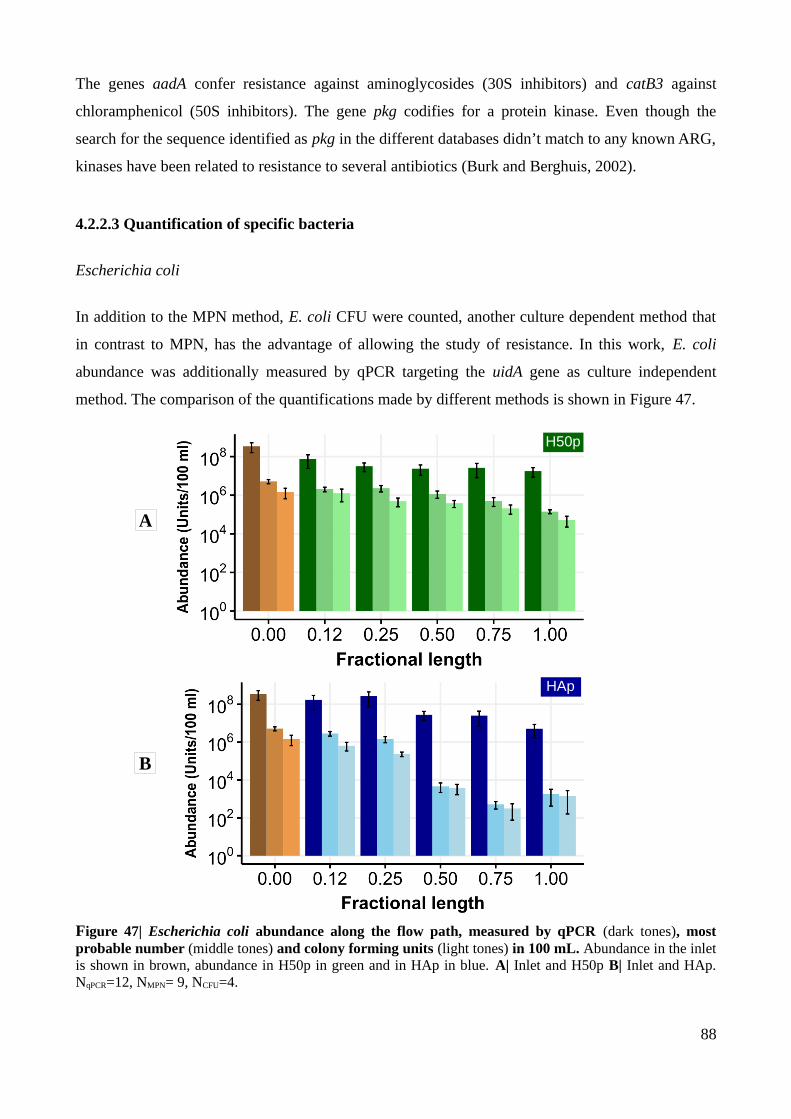
The genes aadA confer resistance against aminoglycosides (30S inhibitors) and catB3 against
chloramphenicol (50S inhibitors). The gene pkg codifies for a protein kinase. Even though the
search for the sequence identified as pkg in the different databases didn’t match to any known ARG,
kinases have been related to resistance to several antibiotics (Burk and Berghuis, 2002).
4.2.2.3 Quantification of specific bacteria
Escherichia coli
In addition to the MPN method, E. coli CFU were counted, another culture dependent method that
in contrast to MPN, has the advantage of allowing the study of resistance. In this work, E. coli
abundance was additionally measured by qPCR targeting the uidA gene as culture independent
method. The comparison of the quantifications made by different methods is shown in Figure 47.
Figure 47| Escherichia coli abundance along the flow path, measured by qPCR (dark tones), mostprobable number (middle tones) and colony forming units (light tones) in 100 mL. Abundance in the inletis shown in brown, abundance in H50p in green and in HAp in blue. A| Inlet and H50p B| Inlet and HAp.NqPCR=12, NMPN= 9, NCFU=4.
88
H50p
HAp
A
B
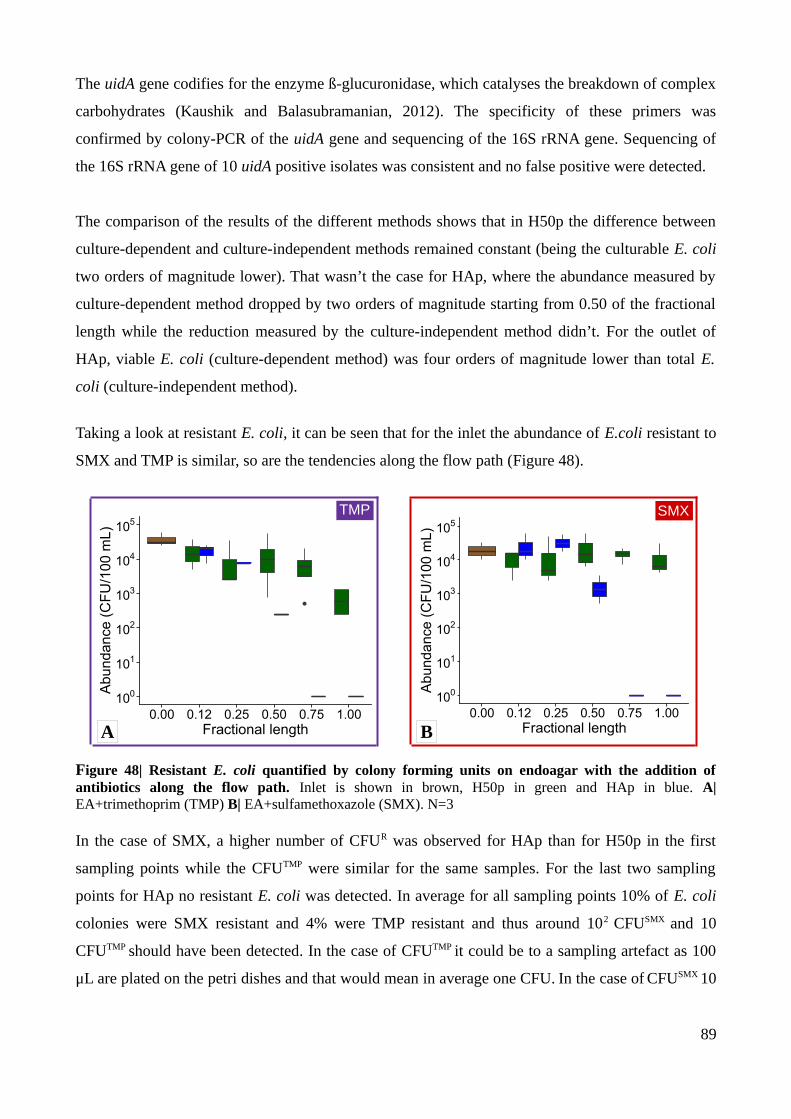
The uidA gene codifies for the enzyme ß-glucuronidase, which catalyses the breakdown of complex
carbohydrates (Kaushik and Balasubramanian, 2012). The specificity of these primers was
confirmed by colony-PCR of the uidA gene and sequencing of the 16S rRNA gene. Sequencing of
the 16S rRNA gene of 10 uidA positive isolates was consistent and no false positive were detected.
The comparison of the results of the different methods shows that in H50p the difference between
culture-dependent and culture-independent methods remained constant (being the culturable E. coli
two orders of magnitude lower). That wasn’t the case for HAp, where the abundance measured by
culture-dependent method dropped by two orders of magnitude starting from 0.50 of the fractional
length while the reduction measured by the culture-independent method didn’t. For the outlet of
HAp, viable E. coli (culture-dependent method) was four orders of magnitude lower than total E.
coli (culture-independent method).
Taking a look at resistant E. coli, it can be seen that for the inlet the abundance of E.coli resistant to
SMX and TMP is similar, so are the tendencies along the flow path (Figure 48).
Figure 48| Resistant E. coli quantified by colony forming units on endoagar with the addition ofantibiotics along the flow path. Inlet is shown in brown, H50p in green and HAp in blue. A|EA+trimethoprim (TMP) B| EA+sulfamethoxazole (SMX). N=3
In the case of SMX, a higher number of CFUR was observed for HAp than for H50p in the first
sampling points while the CFUTMP were similar for the same samples. For the last two sampling
points for HAp no resistant E. coli was detected. In average for all sampling points 10% of E. coli
colonies were SMX resistant and 4% were TMP resistant and thus around 102 CFUSMX and 10
CFUTMP should have been detected. In the case of CFUTMP it could be to a sampling artefact as 100
μL are plated on the petri dishes and that would mean in average one CFU. In the case of CFUSMX 10
89
100
101
102
103
104
105
0.00 0.12 0.25 0.50 0.75 1.00Fractional length
Abu
ndan
ce (
CF
U/1
00 m
L)
100
101
102
103
104
105
0.00 0.12 0.25 0.50 0.75 1.00Fractional length
Abu
nda
nce
(CF
U/1
00 m
L)
A B
TMP SMX

CFU should be present in average in 100 μL but no E. coli CFU was observed. However, as it can
be seen from the difference between molecular and culture dependent methods, this doesn’t
necessarily mean that SMX resistant E. coli was absent in the effluent of HAp, it means that it
couldn’t be cultured. E. coli isolates were also tested for the studied genes, their 16S rRNA gene
was sequenced and the data was included in Figure 31.
Aeromonas spp
A similar procedure to what was done for E. coli was carried out for Aeromonas spp. (Figure 49), as
they were also common hosts of the studied genes (Figure 31). As a culture-independent method the
gene gyrB was quantified by qPCR using published primers (Khan et al., 2009). This gene codifies
for a DNA gyrase, which is an enzyme that relieves molecular tension in DNA supercoiling. As a
culture dependent method, CFU on AIA were counted. Aeromonas spp. appear on this medium as
dark green colonies .
Figure 49| Aeromonas spp abundance along the flow path, measured by qPCR (dark tones) and colonyforming units (light tones) in 100 mL. Abundance in the inlet is shown in brown, abundance in H50p ingreen and in HAp in blue. A| Inlet and H50p B| Inlet and HAp. N=3.
90
H50p
HAp
A
B

In this case and other than expected, the abundance detected by the molecular method was around 2
orders of magnitude lower than the culture-dependent method. 17 putative Aeromonas colonies
from AIA were tested by PCR with gyrB primers and just 5 (30%) were PCR-positive. That means
that either the primers were too specific and didn’t detect all the Aeromonas spp. in the samples or
the medium is not selective enough and some dark green colonies didn’t belong to this genus. The
sequencing of colonies that were gyrB negative were identified as Pseudomonas spp. by Sanger
sequencing of their 16S rRNA gene.
Otherwise, the spatio-temporal changes towards the outlets of the CW were comparable with the
results obtained for E. coli (Figure 50). For H50p, neither the abundance nor the difference between
methods changed along the flow path. For HAp there was a decrease that could be seen by both
methods starting from 0.50 of the fractional length (one order of magnitude in culture-dependent
method and three orders of magnitude in culture-independent method). This change correlates with
multiple changes in HAp in terms of physicochemical parameters like DO, C-BOD5 and nitrogen
species. It also correlated with changes regarding the taxonomy of cultured resistant bacteria and
the abundance of ARB and ARG.
Figure 50| Resistant Aeromonas spp. quantified by colony forming units on Aeromonas isolation agarwith the addition of antibiotics along the flow path. Inlet is shown in brown, H50p in green and HAp inblue. A| AIA+trimethoprim (TMP) B| AIA+sulfamethoxazole (SMX). N=3.
The total abundance was higher than for E. coli partly because it is a whole genus which is being
detected and not only one species. There were still 107 CFUSMX/100 mL in the outflow of HAp
(Figure 50), comparable to what has been observed on Mueller-Hinton agar (a non-selective
medium), which further suggests that there was an overestimation of Aeromonas spp. CFU on AIA.
While the total abundance might be overestimated, there was also a slight increase in CFUR in the
91
105
106
107
108
109
0.00 0.12 0.25 0.50 0.75 1.00Fractional length
Abu
nda
nce
(CF
U/1
00 m
L)
105
106
107
108
109
0.00 0.12 0.25 0.50 0.75 1.00Fractional length
Ab
unda
nce
(C
FU
/100
mL)
TMP SMX
A B

first sampling point of HAp for both antibiotics, although these difference weren’t significant. The
difference wasn’t statistically significant but the data is coming from 3 biological replicates. In
order to confirm or discard the significance of this difference more biological replicates should be
considered.
That in this case this increase can also be observed for TMP resistant isolates in HAp might be a
consequence of the selective conditions in Aeromonas isolation agar which contains ampicillin (see
Appendix A). The gene pkg could account for ampicillin resistance (Li et al., 2016) and it was often
found in the variable region of the integrons in the CW (see Table 14). Even though an increase
could be seen also for H50p in the first sampling point, the increase is higher for HAp.
4.2.2.4 Emulsion paired isolation and concatenation PCR (epicPCR)
As already mentioned throughout this work, linking phylogenetic information with function by
culture independent methods in environmental samples represents a big challenge. Some methods
have been recently developed and are currently being validated and applied. Among them, epicPCR
allows to link taxonomic and antibiotic resistance genetic information without culturing by
physically linking genes and sequencing of the fused PCR product. This is achieved by the
formation of polyacrylamide beads that trap single cells. Afterwards, a fusion PCR is carried out
which links part of the 16S rRNA gene with part of the ARG. The products are then purified and a
second PCR is carried out which increases the specificity and prepares the products to be
sequenced.
The protocol was first set up for pure cultures. Genomic DNA of isolates that were hosts of the
studied genes and whose 16S rRNA gene had been sequenced were used for the set up of the PCR.
Several primers for the first and the second PCR steps and variation of the protocols were tested.
Once that specific amplification and that the products showed the predicted size in agarose gels, the
final products were sequenced by Sanger sequencing and the specificity was confirmed.
In Table 16 agarose gel pictures of the different epicPCR products are shown. This products are
obtained in the second PCR step (nested or semi-nested PCR of fusion products obtained from first
step PCR) and included:
1) part of the ARG or intI1 gene
2) part of 16S rRNA gene and
3) partial sequences of Illumina adaptors necessary for subsequent sequencing.
92
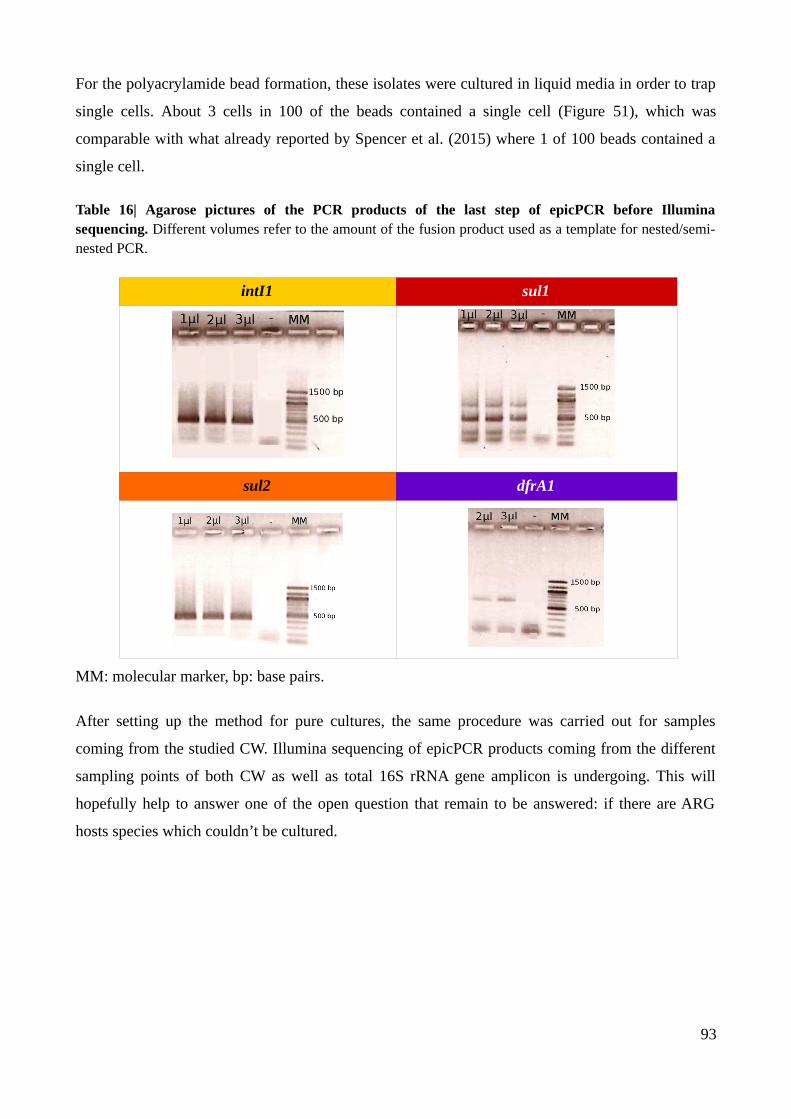
For the polyacrylamide bead formation, these isolates were cultured in liquid media in order to trap
single cells. About 3 cells in 100 of the beads contained a single cell (Figure 51), which was
comparable with what already reported by Spencer et al. (2015) where 1 of 100 beads contained a
single cell.
Table 16| Agarose pictures of the PCR products of the last step of epicPCR before Illuminasequencing. Different volumes refer to the amount of the fusion product used as a template for nested/semi-nested PCR.
intI1 sul1
sul2 dfrA1
MM: molecular marker, bp: base pairs.
After setting up the method for pure cultures, the same procedure was carried out for samples
coming from the studied CW. Illumina sequencing of epicPCR products coming from the different
sampling points of both CW as well as total 16S rRNA gene amplicon is undergoing. This will
hopefully help to answer one of the open question that remain to be answered: if there are ARG
hosts species which couldn’t be cultured.
93

Figure 51| Polyacrilamyde beads from a pure culture of an isolate obtained from the studiedconstructed wetlands. Red arrows point towards bacterial cells trapped in polycrilamyde beads. 3 % of thebeads contained a single cell, which is in the range of what has been reported by the developers of themethod (Spencer et al., 2015).
4.2.3. Discussion
Physicochemical conditions for H50p and HAp
Antibiotics in wastewater have been thought to be the main driving force for the development of
antibiotic resistance in wastewater and the environment. Therefore, several studies tried to figure
out whether there was a correlation pattern between antibiotic concentrations and antibiotic
resistance. Physicochemical parameters in this context are often overlooked although they vastly
affect the bacterial community, indirectly affecting ARB and ARG hosts. Specifically oxygen
content together with the nutritional status can lead to oxidative stress and this could directly affect
antibiotic resistance. In H50p changes in standard wastewater parameters showed the same
continuous tendency all along the flow path, whereas in HAp showed a shift after 0.50 of the
fractional length. Whereas in H50p a sustained decrease in C-BOD5 was seen, in HAp the organic
biodegradable matter was totally consumed before reaching half of the CW. This acute change
reflected in the DO concentration, which increased after 0.50, and in the concentration of
nitrogenous compounds. Ammonium-N decreased till 0.50 of HAp where it reached a value below
the detection limit. At the same time, NO3--N reached a constant value of around 45 mg/L. The
94
absence of DO in the first fraction of HAp in spite of active aeration together with the
transformation of NH4+ into NO3
- and NO2- indicates high aerobic metabolism. Although ROS
weren’t measured, they are an unavoidable intracellular by-product of aerobic metabolism. In that
sense, ROS are being constantly produced in situ in the first fraction of HAp. The amount of ROS
produced and the effect on the cell is difficult to predict, as there is no simple correlation between
DO and oxidative stress since ROS production is species dependent (Korshunov and Imlay, 2006).
The study of the oxidative damage of a particular bacterial species is difficult in the systems
investigated, due to the diversity of the microbial community and the risks of introducing labelled
bacteria into the open environment. One possibility for measuring the impact of ROS in the cells is
by the quantification of carbonylated proteins through mass spectrometry. If the aim was to quantify
how a particular species is affected by this modifications in a bacterial community in the
investigated CW. One possibility of labelling is introducing a gene which codifies for a fluorescent
protein, which allows to select the cells by flow cytometry. It would be necessary to introduce
genetically modified cells of this species in the open environment which is not allowed in Germany.
Antibiotics median concentrations in the inlet were 96.9 ng/L for SMX and 8.2 ng/L for TMP, 8
orders of magnitude lower than their Minimal Inhibitory Concentrations (MIC) (Czekalski et al.,
2012). The concentrations inside the CW were always lower than in the inlet. Because their
concentrations were very low and because the differences between the CW weren’t statistically
significant, the presence of SMX/TMP in the media was unlikely the cause for the difference in
resistance observed between the CW. All in all, both CW are run in parallel and receive the same
municipal-rural wastewater. Besides from aeration and the physicochemical parameters related to
DO, both CW are the same.
Characterization of antibiotic resistance in H50p and HAp
In the chapter 4.1 it was observed that the relative abundance of intI1 for H50p was higher than in
the inlet. In chapter 4.2 a transient increase of sul genes and intI1 (Figure 27) abundance in the first
half of HAp correlated with the highest oxygen turnover (Figures 22 and 23). This increase wasn’t
seen for the first fraction of H50p. One possibility is that at the end of H50p, with a higher oxygen
availability and lower C-BOD5, the same phenomena that take place at he beginning of HAp take
place at the end of H50p. For dfrA1, the values were similar for both CW, decreasing all along the
flow path until reaching a minimum in the outlet (Figure 27). Furthermore, qPCR of the total
abundance of intI1 and it’s the clinical allele had the same tendency, showing an increase in the first
portion of HAp (Figure 30). The clinical nature of most of the class 1 integrons was further
95

confirmed by the fact that just 13% of the SMX resistant isolates hosted an environmental allele.
Dissolved oxygen concentration has been positively correlated with intI1 copy number measured by
qPCR in a river samples with different grade of anthropogenic pollution (Koczura et al., 2016). This
is anyway a study carried out in the environment were no controlled aeration conditions are possible
and where therefore no evidence for the amount of aerobic metabolism were provided. Furthermore
this is not what we observed in our study, as with higher measured DO intI1 abundance was lower.
In another study carried out by Sulfikar et al. (2018), it was observed that resistance against
amoxicillin or norfloxacin was more likely to increase in the aeration tank than in the primary
sedimentation tank or final sedimentation tank. This study was nevertheless limited to the
determination of the MIC of E. coli and the time of residence in the aeration tank was longer than in
the other tanks.
Looking at the isolates from the studied CW, when comparing resistance patterns of isolates from
the various agar media, it is better to look at the inlet samples in order to reduce the number of
variables. That means to compare isolates before the treatment in order to be able to elucidate which
differences observed in the isolates from internal samples are caused by treatment in the CW and
which by the selection on the different agar media. The CFUR in the inlet were the same on PIA as
on Mueller-Hinton agar (Figures 32, 34, 39 and 41, B). Isolates carrying the studied genes in the
inlet were more frequent on PIA than on Mueller-Hinton agar. This can be attributed partly to the
selectivity of PIA towards Gram-negative bacteria (32, 34, 39 and 41, C and D). Gram-positive
bacteria rarely carry these genes, as they often have efflux pumps that make them resistant. The
increased selectivity on PIA is due to its triclosan content, a wide spectrum biocide. The
observations that the percentage of isolates carrying intI1 on PIA (Figures 34 and 41, C and D) is
the same for both antibiotics and higher than for the other media could be explained through co-
selection. The qac∆E gene on the integron could serve as an efflux pump for triclosan but this
hypothesis warrants further investigation. Pseudomonas isolation agar in combination with SMX
represents a good methodological approach to monitor and study antibiotic resistance in culturable
indicator bacteria.
The number of CFUSMX in the outlet of HAp varied between the agar media to a greater extent than
for the outlet of H50p (Figures 32-34 and 39-42, B). This can be explained by the difference in
bacterial communities and in bacterial viability between the CW. Endoagar and, to a broader extent,
PIA exert an additional constraint on the growth of resistant bacteria in comparison to Mueller-
Hinton. In the case of the outlet of HAp, bacterial viability is compromised to a greater extent than
96

in the case of H50p at least for E. coli and Aeromonas spp (Figures 47 and 49). As mentioned
before, if bacteria aren’t culturable but still detected by culture-independent methods there’s the risk
that they are activated under appropriate conditions.
The analysis of the ARB selected on TMP is not as straight forward as with SMX selection because
dfrA1 is less frequently the cause of TMP resistance than sul genes is of SMX resistance (compare
Figures 35 and 42). Alternative possibilities for TMP resistance are other mechanisms or different
dfrA alleles. Although there are less frequent as the first screening showed (Chapter 3.5), there are
more than 20 dfrA alleles. Different dfrA alleles can be part of the variable region of class 1 and
class 2 integrons (Labar et al., 2012). This can be further confirmed by the web-search tool
INTEGRALL: http://integrall.bio.ua.pt/. By setting the search parameters integrase “1” and cassette
“dfrA”, the several alleles for the gene can be seen in different arrangements with no apparent
preference. As a consequence, the proportion carrying intI1 was higher than the dfrA1 frequency in
TMP resistant isolates (Figures 39-41, C and D), in contrast to what was observed with sul1 in SMX
resistant bacteria (Figures 32-34, C and D). The data from this study suggested that whether dfrA1
is part of the variable region of class 1 integron is species-dependent. Bacteria carrying dfrA1 in a
different genetic context than in class 1 integron belonged to the family Enterobacteriaceae. This
can explain why even though there was an increase in intI1 and sul genes for the first half of HAp,
dfrA1 decreased. The possible increase in dfrA1 as an indirect consequence of the increase in class 1
integron abundance was smaller than the decrease in bacteria carrying dfrA1 in other genetic
contexts and an overall reduction in dfrA1 abundance took place.
Colony forming units on TMP (Figures 39-41, B) for the inlet had the same order of magnitude
than on SMX for all media except for PIA+TMP (Figures 32-34, B), where it was one order of
magnitude lower. In this case co-selection (TMP+triclosan) could also be a possible explanation for
this observation, although this hypothesis needs further investigation. A gene codifying for
resistance against SMX (sul1) is in a conserved region of class 1 but resistance against TMP is in a
variable region. In that way, the probability of co-selection is lower. An increase of CFUR for the
first sampling points of HAp can be seen on PIA+TMP (Figure 41, B), although dfrA1 abundance
decreases (Figure 27, D). These could be caused by the selection of those bacteria carrying class 1
integrons with different dfrA alleles in their variable region or due to a change in the position of
dfrA1 in the integron, which can result in a more resistant phenotype.
97

Viability of Escherichia coli and Aeromonas spp in H50p and HAp with treatment
Comparing qPCR results from E. coli (Figure 47) and sul1 abundance (Figure 27) it can be seen
that they have the same orders of magnitude. This is consistent with what was observed for E. coli
isolates, which was proven to be a common host of the studied genes. This further confirms E. coli
as good indicator for antibiotic resistance. Studying the physiological status of bacteria in the
environment is complex from a methodological point of view. By quantifying the same bacteria by
both culturable dependent and independent method we were able to observe not only that bacteria
are under stress in the last portion of HAp but also that this stress is species dependant. The
comparison of the values obtained through culture- dependent and independent method can indicate
the viability of a particular organism or group of organisms. In the case of E. coli, an increased
difference between the culture- dependent and independent methods could be seen for HAp,
whereas this was not observed for H50p (Figure 47). For the case of Aeromonas spp. an absolute
difference between culture- dependent and independent method that accounted for viability wasn’t
observed but a relative increase in the difference between culture- dependent and independent
methods in HAp could be seen (Figure 47). This data was also important in order to discard that the
increase in sul1-intI1 in the first sample points of HAp was due to a clonal amplification of
Aeromonas, which are the most frequent host of class 1 integrons.
The conditions compromising the viability can be a combination of oxidative stress and starvation.
It is not clear if this difference between culture- dependent and independent method is due to dead
bacteria or bacteria that are a non-culturable state but still active/viable. Furthermore, if they were
no longer viable the question remains whether the ARG that they carry could be still be transferred.
By qPCR 5.104 dfrA1 copies could be detected (Table 9) and this corresponds with 20% of isolates
that carry the gene in the outflow of H50p (Figure 42). A similar copy number of sul2 in the outflow
of HAp (Table 9) reflects in just 2% of the isolates carrying the gene (Figure 35). This is another
proof on how much ARG detection is affected by culturing bias when bacterial viability is
compromised. This is of relevance as E. coli is a common host of the studied ARG: about 44% of
the isolated Enterobacteriaceae or 21% of all isolates that were host of the indicator genes were
identified as E. coli.
Horizontal gene transfer
In Figure 52, the molecular mechanism linking O2 to an increased activity of the integrase and it’s
consequence observed in this study are shown. This observation has to be done at the isolate level
98
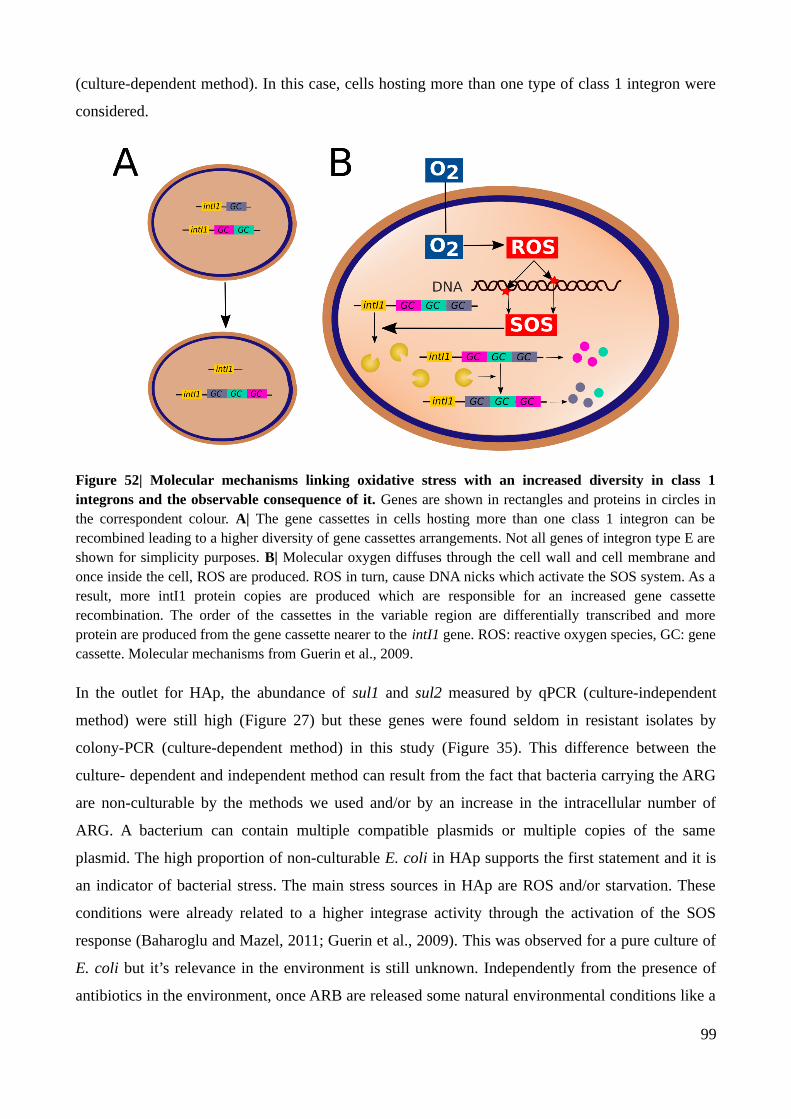
(culture-dependent method). In this case, cells hosting more than one type of class 1 integron were
considered.
Figure 52| Molecular mechanisms linking oxidative stress with an increased diversity in class 1integrons and the observable consequence of it. Genes are shown in rectangles and proteins in circles inthe correspondent colour. A| The gene cassettes in cells hosting more than one class 1 integron can berecombined leading to a higher diversity of gene cassettes arrangements. Not all genes of integron type E areshown for simplicity purposes. B| Molecular oxygen diffuses through the cell wall and cell membrane andonce inside the cell, ROS are produced. ROS in turn, cause DNA nicks which activate the SOS system. As aresult, more intI1 protein copies are produced which are responsible for an increased gene cassetterecombination. The order of the cassettes in the variable region are differentially transcribed and moreprotein are produced from the gene cassette nearer to the intI1 gene. ROS: reactive oxygen species, GC: genecassette. Molecular mechanisms from Guerin et al., 2009.
In the outlet for HAp, the abundance of sul1 and sul2 measured by qPCR (culture-independent
method) were still high (Figure 27) but these genes were found seldom in resistant isolates by
colony-PCR (culture-dependent method) in this study (Figure 35). This difference between the
culture- dependent and independent method can result from the fact that bacteria carrying the ARG
are non-culturable by the methods we used and/or by an increase in the intracellular number of
ARG. A bacterium can contain multiple compatible plasmids or multiple copies of the same
plasmid. The high proportion of non-culturable E. coli in HAp supports the first statement and it is
an indicator of bacterial stress. The main stress sources in HAp are ROS and/or starvation. These
conditions were already related to a higher integrase activity through the activation of the SOS
response (Baharoglu and Mazel, 2011; Guerin et al., 2009). This was observed for a pure culture of
E. coli but it’s relevance in the environment is still unknown. Independently from the presence of
antibiotics in the environment, once ARB are released some natural environmental conditions like a
99

change in DO can trigger cellular responses that lead to health risk related to antibiotic resistance. A
greater integrase activity can lead to novel genetic arrangements of ARG and a higher HGT. This
two phenomena combined can enhance the probability of the development of multi-drug resistant
bacteria. Furthermore environmental bacteria could act as resistance reservoirs and with an
enhanced HGT could transfer the ARG to pathogenic bacteria. The broader cassette diversity in
intI1 polycarriers in HAp is an evidence for an increased integrase activity which can render novel
genetic arrays of ARG. Although we have recorded a considerable amount of data supporting this
hypothesis, it is difficult to predict the actual risk that this posses.
A higher HGT rate was related to the activation of SOS system for an ICE called SXT (Beaber et
al., 2004), which shares with class 1 integron the characteristics of codifying for a integrase and
giving resistance against TMP and SMX. Although SXT is not expected to be common in the
studied systems, the molecular mechanism could be similar. In Figure 53, the molecular
mechanisms linking O2 with an increased horizontal gene transfer and its effect observed in this
study are shown. This was to be observed at the community level (culture-independent method). A
greater cassette variety in polycarriers can be a result from a combination of the molecular
mechanisms shown in Figure 52 and 53.
Figure 53| Molecular mechanisms linking oxidative stress with an increased horizontal gene transfer ofan int gene on the ICE SXT and the observable consequence of it. Genes are shown in rectangles andproteins in circles. A| int copies in the community increase without an increase of the 16S rRNA gene. B|Molecular oxygen diffuses through the cell wall and cell membrane and once inside the cell, ROS areproduced. ROS in turn, cause DNA nicks which activate the SOS system. As a consequence, the horizontalgene transfer of an int gene is increased by the generation of tra proteins. Molecular mechanisms fromBeaber et al., 2004.
100
Furthermore, an increase in sul2 abundance was also seen although this gene hasn’t been detected
in class 1 integrons. A possible explanation is that the integron class 1 and sul2 can be on the same
plasmid, as in the case of plasmid p148 (del Castillo et al., 2013). This plasmid belongs to the incA/
C group, which are conjugative and broad host range. In an in vivo study by Matsushita et al.
(2018) it was seen that this kind of plasmids can be transferred between E. coli and A. caviae.
Furthermore, this plasmid group was identified as the closest relatives of ICE (Fricke et al., 2009).
4.2.4. Conclusion
Constructed wetlands in this study showed different internal behaviour with regard to antibiotic
resistance. In H50p, a continuous decrease in ARB and ARG abundances was observed whereas the
tendencies in HAp were different depending on the gene and on the fractional length. The progress
of waste water treatment in HAp can be divided in two sections: from inlet to 0.50 of the fractional
length and from there to the outlet. In the first fraction of HAp, substantial aerobic metabolism took
place and an increase in intI1 and sul genes abundances was seen. The abundance of the 16S rRNA
gene remained almost constant and dfrA1 decreased, indicating that the increase in intI1 and sul
abundances was specific. Furthermore, Aeromonas which were the most common hosts of class 1
integrons based on culture-dependent method, didn’t show an increase in this fraction of the CW.
Cells carrying more than one class 1 integron copy showed more diversity than in the inlet and the
rest of HAp. The rest of the HAp showed a decrease in genes abundances higher than for the total
length of H50p. The main stress sources in HAp are probably ROS and/or starvation and whereas
oxidative stress is present for the totality of HAp, after 0.50 of its fractional length starvation might
play a major role. Because of their very low concentrations and the absence of statistically
significant differences between the CW, the presence of SMX/TMP in the media was unlikely the
cause for the difference in resistance observed between the CW, even though a synergistic effect
can’t be discarded.
Oxidative stress is proposed as an important factor increasing the HGT of ARG in some wastewater
treatment plants. In order to do so, it would be important to answer the following questions: are
bacteria that are not detectable by culture dependent methods still viable? If they aren’t viable, can
their ARG still be transferred by transformation? Would epicPCR reveal a change of host during the
treatment? Another question is if there is an optimal C-BOD5/bacterial concentration/DO ratio
which can minimize HGT? And if a choice had to be made on one criteria for wastewater treatment
in terms of antibiotic resistance, would quantity (total abundance of ARG) matter more than the
101

quality (the risks associated with HGT)? It would be also important to find out the mobile genetic
elements that carry integrons in the studied systems. For that a novel method called inverse PCR
could could be useful (Pärnänen et al., 2016).
102
5. General discussion and outlook
Both HAp and H50p were effective in the reduction of ARG/ARB acting as a second step in
municipal wastewater treatment. Cultured ARB were identified as members of Enterobacteriaceae,
Pseudomonas, Aeromonas, Enterococcaceae and Carnobacteriaceae. In the outflows, bacterial
species that are resistant against TMP/SMX through mechanisms different from the one studied in
this work were more frequent than in the inlet and this was more pronounced for HAp.
Whereas aeration was beneficial for the total reduction of ARB and ARG, the first portion of HAp
showed a rise in the abundance of some ARG which could be a hint of HGT of ARG. The same
factors can represent stress sources or cause death, depending on a the combination with other
environmental factors. The main stress sources in HAp are thought to be ROS and/or starvation.
One of the resources that bacteria have in order to deal with stress is an increase conjugation to
transfer genes that might be improve community’s chances of survival. The observations in this
study suggest that while oxidative stress at first enhanced HGT, at the end of HAp and in
combination with starvation, it led to the death of some ARG hosts or at least their inactivation.
While some questions remain open, antibiotic resistance poses a present burden and a big risk not
only for human health but also in economical terms. As bacteria and ARG represent a special type
of contaminants that are capable of amplification and susceptible to several environmental
conditions to make use of the precautionary principle, preventing ARB and ARG to end up in the
environment in the first place is highly recommended. For that lowering the use of antibiotics is
essential. Measures have to be implemented worldwide, and which are priority depends on the
socio-economical situation of each country. Investing in hygiene, sanitation and wastewater
treatment is necessary specially in the Global South (Collignon et al., 2018), and reducing the
amount of antimicrobials used for the production of meat and dairy products, considering the One
Health approach is also a needed in the Global North (Van Boeckel et al., 2017).
In October 2018 the European Parliament approved restrictions on the use of antimicrobials in
healthy livestock which are planned to become law in 2022. The new legislation bans the use of
antibiotics for animals that are important for human medicine and prohibits the use of any
antimicrobials in livestock without a prescription from a veterinary. This is a big step in the right
direction and others steps worldwide should follow.
103

Bibliography
Adelowo, O.O., Vollmers, J., Mäusezahl, I., Kaster, A.-K., and Müller, J.A. (2018). Detection of thecarbapenemase gene blaVIM-5 in members of the Pseudomonas putida group isolated from pollutedNigerian wetlands. Sci. Rep. 8.
Adler, N., Balzer, F., Blondzik, K., Brauer, F., Chorus, I., Ebert, I., Fiedler, T., Grummt, T.,Heidemeier, J., Hein, A., et al. (2018). Antibiotics and Antibiotic Resistances in the Environment:Background, Challenges and Options for Action.
Afzal, M., Arslan, M., Müller, J.A., Shabir, G., Islam, E., Tahseen, R., Anwar-ul-Haq, M., Hashmat,A.J., Iqbal, S., and Khan, Q.M. (2019). Floating treatment wetlands as a suitable option for large-scale wastewater treatment. Nat. Sustain.
Akratos, C.S., and Tsihrintzis, V.A. (2007). Effect of temperature, HRT, vegetation and porousmedia on removal efficiency of pilot-scale horizontal subsurface flow constructed wetlands. Ecol.Eng. 29, 173–191.
Alboukadel, K. (2018). ggpubr: “ggplot2” Based Publication Ready Plots. R package version 0.2.URL https://CRAN.R-project.org/package=ggpubr
Aminov, R.I. (2011). Horizontal Gene Exchange in Environmental Microbiota. Front. Microbiol. 2.
Andrup, L., and Andersen, K. (1999). A comparison of the kinetics of plasmid transfer in theconjugation systems encoded by the F plasmid from Escherichia coli and plasmid pCFl0 fromEnterococcus faecalis. Microbiology 145, 2001–2009.
Aslam, B., Wang, W., Arshad, M.I., Khurshid, M., Muzammil, S., Rasool, M.H., Nisar, M.A., Alvi,R.F., Aslam, M.A., Qamar, M.U., et al. (2018). Antibiotic resistance: a rundown of a global crisis.Infect. Drug Resist. Volume 11, 1645–1658.
Auerbach, E.A., Seyfried, E.E., and McMahon, K.D. (2007). Tetracycline resistance genes inactivated sludge wastewater treatment plants. Water Res. 41, 1143–1151.
Baharoglu, Z., Garriss, G., and Mazel, D. (2013). Multiple Pathways of Genome Plasticity Leadingto Development of Antibiotic Resistance. Antibiotics 2, 288–315.
Balcázar, J.L., Subirats, J., and Borrego, C.M. (2015). The role of biofilms as environmentalreservoirs of antibiotic resistance. Front. Microbiol. 6.
Baquero, F., Martínez, J.-L., and Cantón, R. (2008). Antibiotics and antibiotic resistance in waterenvironments. Curr. Opin. Biotechnol. 19, 260–265.
Bastian, R. (1989). A Handbook of Constructed Wetlands (Lewis Publishers: Chelsea, MI, USA).
Beaber, J.W., Hochhut, B., and Waldor, M.K. (2004). SOS response promotes horizontaldissemination of antibiotic resistance genes. Nature 427, 72–74.
Berendonk, T.U., Manaia, C.M., Merlin, C., Fatta-Kassinos, D., Cytryn, E., Walsh, F., Bürgmann,H., Sørum, H., Norström, M., Pons, M.-N., et al. (2015). Tackling antibiotic resistance: theenvironmental framework. Nat. Rev. Microbiol. 13, 310–317.
104

Berglund, B. (2015). Environmental dissemination of antibiotic resistance genes and correlation toanthropogenic contamination with antibiotics. Infect. Ecol. Epidemiol. 5.
Berglund, B., Khan, G.A., Weisner, S.E.B., Ehde, P.M., Fick, J., and Lindgren, P.-E. (2014).Efficient removal of antibiotics in surface-flow constructed wetlands, with no observed impact onantibiotic resistance genes. Sci. Total Environ. 476–477, 29–37.
Biskri, L., Bouvier, M., Guerout, A.-M., Boisnard, S., and Mazel, D. (2005). Comparative Study ofClass 1 Integron and Vibrio cholerae Superintegron Integrase Activities. J. Bacteriol. 187, 1740–1750.
Boc, A., Diallo, A.B., and Makarenkov, V. (2012). T-REX: a web server for inferring, validating andvisualizing phylogenetic trees and networks. Nucleic Acids Res. 40, W573–W579.
Bouali, M., Zrafi, I., Bakhrouf, A., Chaussonnerie, S., and Sghir, A. (2014). Bacterial structure andspatiotemporal distribution in a horizontal subsurface flow constructed wetland. Appl. Microbiol.Biotechnol. 98, 3191–3203.
Burk, D.L., and Berghuis, A.M. (2002). Protein kinase inhibitors and antibiotic resistance.Pharmacol. Ther. 93, 283–292.
Burton, J.N., Liachko, I., Dunham, M.J., and Shendure, J. (2014). Species-Level Deconvolution ofMetagenome Assemblies with Hi-C–Based Contact Probability Maps. G3amp58GenesGenomesGenetics 4, 1339–1346.
Bushby, S.R.M., and Hitchings, G.H. (1968). Trimethoprim, a sulphonamide potentiator. Br. J.Pharmacol. Chemother. 33, 72–90.
Button, M., Nivala, J., Weber, K.P., Aubron, T., and Müller, R.A. (2015). Microbial communitymetabolic function in subsurface flow constructed wetlands of different designs. Ecol. Eng. 80,162–171.
Cambray, G., Sanchez-Alberola, N., Campoy, S., Guerin, É., Da Re, S., González-Zorn, B., Ploy,M.-C., Barbé, J., Mazel, D., and Erill, I. (2011). Prevalence of SOS-mediated control of integronintegrase expression as an adaptive trait of chromosomal and mobile integrons. Mob. DNA 2, 6.
del Castillo, C.S., Hikima, J., Jang, H.-B., Nho, S.-W., Jung, T.-S., Wongtavatchai, J., Kondo, H.,Hirono, I., Takeyama, H., and Aoki, T. (2013). Comparative Sequence Analysis of a Multidrug-Resistant Plasmid from Aeromonas hydrophila. Antimicrob. Agents Chemother. 57, 120–129.
Chah, K.F., Agbo, I.C., Eze, D.C., Somalo, S., Estepa, V., and Torres, C. (2010). Antimicrobialresistance, integrons and plasmid replicon typing in multiresistant clinical Escherichia coli strainsfrom Enugu State, Nigeria. J. Basic Microbiol. 50, S18–S24.
Chen, B., Liang, X., Nie, X., Huang, X., Zou, S., and Li, X. (2015a). The role of class I integrons inthe dissemination of sulfonamide resistance genes in the Pearl River and Pearl River Estuary, SouthChina. J. Hazard. Mater. 282, 61–67.
Chen, J., Liu, Y.-S., Su, H.-C., Ying, G.-G., Liu, F., Liu, S.-S., He, L.-Y., Chen, Z.-F., Yang, Y.-Q.,and Chen, F.-R. (2015b). Removal of antibiotics and antibiotic resistance genes in rural wastewaterby an integrated constructed wetland. Environ. Sci. Pollut. Res. 22, 1794–1803.
105

Chen, J., Ying, G.-G., Wei, X.-D., Liu, Y.-S., Liu, S.-S., Hu, L.-X., He, L.-Y., Chen, Z.-F., Chen, F.-R., and Yang, Y.-Q. (2016a). Removal of antibiotics and antibiotic resistance genes from domesticsewage by constructed wetlands: Effect of flow configuration and plant species. Sci. Total Environ.571, 974–982.
Chen, J., Wei, X.-D., Liu, Y.-S., Ying, G.-G., Liu, S.-S., He, L.-Y., Su, H.-C., Hu, L.-X., Chen, F.-R.,and Yang, Y.-Q. (2016b). Removal of antibiotics and antibiotic resistance genes from domesticsewage by constructed wetlands: Optimization of wetland substrates and hydraulic loading. Sci.Total Environ. 565, 240–248.
Collignon, P., Beggs, J.J., Walsh, T.R., Gandra, S., and Laxminarayan, R. (2018). Anthropologicaland socioeconomic factors contributing to global antimicrobial resistance: a univariate andmultivariable analysis. Lancet Planet. Health 2, e398–e405.
Cuny, C., Dukan, L., Fraysse, L., Ballesteros, M., and Dukan, S. (2005). Investigation of the FirstEvents Leading to Loss of Culturability during Escherichia coli Starvation: Future NonculturableBacteria Form a Subpopulation. J. Bacteriol. 187, 2244–2248.
Czekalski, N., Berthold, T., Caucci, S., Egli, A., and Bürgmann, H. (2012). Increased Levels ofMultiresistant Bacteria and Resistance Genes after Wastewater Treatment and Their Disseminationinto Lake Geneva, Switzerland. Front. Microbiol. 3.
Davies, J., and Davies, D. (2010). Origins and Evolution of Antibiotic Resistance. Microbiol. Mol.Biol. Rev. 74, 417–433.
Decamp, O., and Warren, A. (2000). Investigation of Escherichia coli removal in various designs ofsubsurface flow wetlands used for wastewater treatment. Ecol. Eng. 14, 293–299.
Deng, Y., Bao, X., Ji, L., Chen, L., Liu, J., Miao, J., Chen, D., Bian, H., Li, Y., and Yu, G. (2015).Resistance integrons: class 1, 2 and 3 integrons. Ann. Clin. Microbiol. Antimicrob. 14.
Derbyshire, K.M., and Gray, T.A. (2014). Distributive Conjugal Transfer: New Insights intoHorizontal Gene Transfer and Genetic Exchange in Mycobacteria. Microbiol. Spectr. 2.
Edwards, U., Rogall, T., Blöcker, H., Emde, M., and Böttger, E.C. (1989). Isolation and directcomplete nucleotide determination of entire genes. Characterization of a gene coding for 16Sribosomal RNA. Nucleic Acids Res. 17, 7843–7853.
European Commission (2017). A European One Health Action Plan againstAntimicrobialResistance.
Exner, M., and Schwartz, T. (2015). Bewertungskonzepte der Mikrobiologie mit denSchwerpunkten neue Krankheitserreger und Antibiotikaresistenzen (Frankfurt am Main:DECHEMA e.V.).
Fang, H., Zhang, Q., Nie, X., Chen, B., Xiao, Y., Zhou, Q., Liao, W., and Liang, X. (2017).Occurrence and elimination of antibiotic resistance genes in a long-term operation integratedsurface flow constructed wetland. Chemosphere 173, 99–106.
Fricke, W.F., Welch, T.J., McDermott, P.F., Mammel, M.K., LeClerc, J.E., White, D.G., Cebula,T.A., and Ravel, J. (2009). Comparative Genomics of the IncA/C Multidrug Resistance PlasmidFamily. J. Bacteriol. 191, 4750–4757.
106

Gao, P., Mao, D., Luo, Y., Wang, L., Xu, B., and Xu, L. (2012a). Occurrence of sulfonamide andtetracycline-resistant bacteria and resistance genes in aquaculture environment. Water Res. 46,2355–2364.
Gao, P., Munir, M., and Xagoraraki, I. (2012b). Correlation of tetracycline and sulfonamideantibiotics with corresponding resistance genes and resistant bacteria in a conventional municipalwastewater treatment plant. Sci. Total Environ. 421–422, 173–183.
García, J., Aguirre, P., Barragán, J., Mujeriego, R., Matamoros, V., and Bayona, J.M. (2005). Effectof key design parameters on the efficiency of horizontal subsurface flow constructed wetlands.Ecol. Eng. 25, 405–418.
García, J., Rousseau, D.P.L., Morató, J., Lesage, E., Matamoros, V., and Bayona, J.M. (2010).Contaminant Removal Processes in Subsurface-Flow Constructed Wetlands: A Review. Crit. Rev.Environ. Sci. Technol. 40, 561–661.
Ghaderpour, A., Ho, W.S., Chew, L.-L., Bong, C.W., Chong, V.C., Thong, K.-L., and Chai, L.C.(2015). Diverse and abundant multi-drug resistant E. coli in Matang mangrove estuaries, Malaysia.Front. Microbiol. 6.
Gillings, M.R., Gaze, W.H., Pruden, A., Smalla, K., Tiedje, J.M., and Zhu, Y.-G. (2015). Using theclass 1 integron-integrase gene as a proxy for anthropogenic pollution. ISME J. 9, 1269–1279.
Gobel, A., Mcardell, C., Joss, A., Siegrist, H., and Giger, W. (2007a). Fate of sulfonamides,macrolides, and trimethoprim in different wastewater treatment technologies. Sci. Total Environ.372, 361–371.
Gobel, A., Mcardell, C., Joss, A., Siegrist, H., and Giger, W. (2007b). Fate of sulfonamides,macrolides, and trimethoprim in different wastewater treatment technologies. Sci. Total Environ.372, 361–371.
Grape, M., Motakefi, A., Pavuluri, S., and Kahlmeter, G. (2007). Standard and real-time multiplexPCR methods for detection of trimethoprim resistance dfr genes in large collections of bacteria.Clin. Microbiol. Infect. 13, 1112–1118.
Gray, N.F. (2004). Biology of wastewater treatment (UK: Imperial College Press).
Guerin, E., Cambray, G., Sanchez-Alberola, N., Campoy, S., Erill, I., Da Re, S., Gonzalez-Zorn, B.,Barbe, J., Ploy, M.-C., and Mazel, D. (2009). The SOS Response Controls Integron Recombination.Science 324, 1034–1034.
Gullberg, E., Cao, S., Berg, O.G., Ilbäck, C., Sandegren, L., Hughes, D., and Andersson, D.I.(2011). Selection of Resistant Bacteria at Very Low Antibiotic Concentrations. PLoS Pathog. 7,e1002158.
Guo, J., Li, J., Chen, H., Bond, P.L., and Yuan, Z. (2017). Metagenomic analysis reveals wastewatertreatment plants as hotspots of antibiotic resistance genes and mobile genetic elements. Water Res.123, 468–478.
Gurke, R., Rößler, M., Marx, C., Diamond, S., Schubert, S., Oertel, R., and Fauler, J. (2015).Occurrence and removal of frequently prescribed pharmaceuticals and corresponding metabolites inwastewater of a sewage treatment plant. Sci. Total Environ. 532, 762–770.
107

Händel, N., Hoeksema, M., Mata, M.F., Brul, S., and Ter Kuile, B.H. (2016). Effects of Stress,Reactive Oxygen Species, and the SOS Response on De Novo Acquisition of Antibiotic Resistancein Escherichia coli. Antimicrob. Agents Chemother. 60, 1319–1327.
Hannappel, D.S., Köpp, M.C., and Zühlke, D.S. (2016). Aufklärung der Ursachen vonTierarzneimittelfunden im Grundwasser – Untersuchung eintragsgefährdeter Standorte inNorddeutschland. 188.
Harnisz, M., and Korzeniewska, E. (2018). The prevalence of multidrug-resistant Aeromonas spp.in the municipal wastewater system and their dissemination in the environment. Sci. Total Environ.626, 377–383.
He, T., Guan, W., Luan, Z., and Xie, S. (2016). Spatiotemporal variation of bacterial and archaealcommunities in a pilot-scale constructed wetland for surface water treatment. Appl. Microbiol.Biotechnol. 100, 1479–1488.
Headley, T., Nivala, J., Kassa, K., Olsson, L., Wallace, S., Brix, H., van Afferden, M., and Müller,R. (2013). Escherichia coli removal and internal dynamics in subsurface flow ecotechnologies:Effects of design and plants. Ecol. Eng. 61, 564–574.
Herlemann, D.P., Labrenz, M., Jürgens, K., Bertilsson, S., Waniek, J.J., and Andersson, A.F. (2011).Transitions in bacterial communities along the 2000 km salinity gradient of the Baltic Sea. ISME J.5, 1571–1579.
Hernandes, F., Henriques, L., Pilz, R., Bonifacio, O., Boechat Salloto, G.R., Oliveira Santoro, D.de, Mandetta, M., and Machado, A. (2013). Antibiotic Resistance in Aquatic Environments of Riode Janeiro, Brazil. In Perspectives in Water Pollution, I.A. Dar, ed. (InTech), p.
Hickey, A., Arnscheidt, J., Joyce, E., O’Toole, J., Galvin, G., O’ Callaghan, M., Conroy, K., Killian,D., Shryane, T., Hughes, F., et al. (2018). An assessment of the performance of municipalconstructed wetlands in Ireland. J. Environ. Manage. 210, 263–272.
Hijosa-Valsero, M., Fink, G., Schlüsener, M.P., Sidrach-Cardona, R., Martín-Villacorta, J., Ternes,T., and Bécares, E. (2011). Removal of antibiotics from urban wastewater by constructed wetlandoptimization. Chemosphere 83, 713–719.
Hoffmann, H., Platzer, C., Winker, M., and von Muench, E. (2011). Technology review ofconstructed wetlands.
Hultman, J., Tamminen, M., Pärnänen, K., Cairns, J., Karkman, A., and Virta, M. (2018). Hostrange of antibiotic resistance genes in wastewater treatment plant influent and effluent. FEMSMicrobiol. Ecol. 94.
Ibekwe, A.M., Murinda, S.E., DebRoy, C., and Reddy, G.B. (2016). Potential pathogens,antimicrobial patterns and genotypic diversity of Escherichia coli isolates in constructed wetlandstreating swine wastewater. FEMS Microbiol. Ecol. 92, fiw006.
Ilyas, H., and Masih, I. (2017). The performance of the intensified constructed wetlands for organicmatter and nitrogen removal: A review. J. Environ. Manage. 198, 372–383.
Imlay, J.A. (2013). The molecular mechanisms and physiological consequences of oxidative stress:lessons from a model bacterium. Nat. Rev. Microbiol. 11, 443–454.
108

Jahne, M.A., Rogers, S.W., Ramler, I.P., Holder, E., and Hayes, G. (2015). Hierarchal clusteringyields insight into multidrug-resistant bacteria isolated from a cattle feedlot wastewater treatmentsystem. Environ. Monit. Assess. 187.
Jeunen, G., Knapp, M., Spencer, H.G., Taylor, H.R., Lamare, M.D., Stat, M., Bunce, M., andGemmell, N.J. (2019). Species‐level biodiversity assessment using marine environmental DNAmetabarcoding requires protocol optimization and standardization. Ecol. Evol. 9, 1323–1335.
Ji, B., Yang, K., Zhu, L., Jiang, Y., Wang, H., Zhou, J., and Zhang, H. (2015). Aerobicdenitrification: A review of important advances of the last 30 years. Biotechnol. Bioprocess Eng. 20,643–651.
Jutkina, J., Marathe, N.P., Flach, C.-F., and Larsson, D.G.J. (2018). Antibiotics and commonantibacterial biocides stimulate horizontal transfer of resistance at low concentrations. Sci. TotalEnviron. 616–617, 172–178.
Kadlec, R.H., and Wallace, S.D. (2009). Treatment wetlands (Boca Raton, FL: CRC Press).
Kahl, S., Nivala, J., van Afferden, M., Müller, R.A., and Reemtsma, T. (2017). Effect of design andoperational conditions on the performance of subsurface flow treatment wetlands: Emerging organiccontaminants as indicators. Water Res. 125, 490–500.
Kaushik, R., and Balasubramanian, R. (2012). Assessment of bacterial pathogens in fresh rainwaterand airborne particulate matter using Real-Time PCR. Atmos. Environ. 46, 131–139.
Kehrenberg, C., and Schwarz, S. (2005). dfrA20, a Novel Trimethoprim Resistance Gene fromPasteurella multocida. Antimicrob. Agents Chemother. 49, 414–417.
Khan, I.U.H., Loughborough, A., and Edge, T.A. (2009). DNA-based real-time detection andquantification of aeromonads from fresh water beaches on Lake Ontario. J. Water Health 07, 312.
Kivaisi, A.K. (2001). The potential for constructed wetlands for wastewater treatment and reuse indeveloping countries: a review. Ecol. Eng. 16, 545–560.
Klappenbach, J.A. (2001). rrndb: the Ribosomal RNA Operon Copy Number Database. NucleicAcids Res. 29, 181–184.
Koczura, R., Mokracka, J., Jabłońska, L., Gozdecka, E., Kubek, M., and Kaznowski, A. (2012).Antimicrobial resistance of integron-harboring Escherichia coli isolates from clinical samples,wastewater treatment plant and river water. Sci. Total Environ. 414, 680–685.
Koczura, R., Mokracka, J., Taraszewska, A., and Łopacinska, N. (2016). Abundance of Class 1Integron-Integrase and Sulfonamide Resistance Genes in River Water and Sediment Is Affected byAnthropogenic Pressure and Environmental Factors. Microb. Ecol. 72, 909–916.
Köhler, T., Kok, M., Michea-Hamzehpour, M., Plesiat, P., Gotoh, N., Nishino, T., Curty, L.K., andPechere, J.-C. (1996). Multidrug efflux in intrinsic resistance to trimethoprim and sulfamethoxazolein Pseudomonas aeruginosa. Antimicrob. Agents Chemother. 40, 2288–2290.
Korshunov, S., and Imlay, J.A. (2006). Detection and Quantification of Superoxide Formed withinthe Periplasm of Escherichia coli. J. Bacteriol. 188, 6326–6334.
109

Korshunov, S., and Imlay, J.A. (2010). Two sources of endogenous hydrogen peroxide inEscherichia coli. Mol. Microbiol. 75, 1389–1401.
Labar, A.S., Millman, J.S., Ruebush, E., Opintan, J.A., Bishar, R.A., Aboderin, A.O., Newman,M.J., Lamikanra, A., and Okeke, I.N. (2012). Regional Dissemination of a Trimethoprim-ResistanceGene Cassette via a Successful Transposable Element. PLoS ONE 7, e38142.
Larsson, A. (2014). AliView: a fast and lightweight alignment viewer and editor for large datasets.Bioinformatics 30, 3276–3278.
Levesque, C., Piche, L., Larose, C., and Roy, P.H. (1995). PCR mapping of integrons revealsseveral novel combinations of resistance genes. Antimicrob. Agents Chemother. 39, 185–191.
Li, B., and Zhang, T. (2010). Biodegradation and Adsorption of Antibiotics in the Activated SludgeProcess. Environ. Sci. Technol. 44, 3468–3473.
Li, L., Mendis, N., Trigui, H., Oliver, J.D., and Faucher, S.P. (2014a). The importance of the viablebut non-culturable state in human bacterial pathogens. Front. Microbiol. 5.
Li, L., Wang, Q., Zhang, H., Yang, M., Khan, M.I., and Zhou, X. (2016). Sensor histidine kinase is aβ-lactam receptor and induces resistance to β-lactam antibiotics. Proc. Natl. Acad. Sci. 113, 1648–1653.
Li, Y., Zhu, G., Ng, W.J., and Tan, S.K. (2014b). A review on removing pharmaceuticalcontaminants from wastewater by constructed wetlands: Design, performance and mechanism. Sci.Total Environ. 468–469, 908–932.
Ligeza, A., Tikhonov, A.N., Hyde, J.S., and Subczynski, W.K. (1998). Oxygen permeability ofthylakoid membranes: electron paramagnetic resonance spin labeling study. Biochim. Biophys. ActaBBA - Bioenerg. 1365, 453–463.
Liu, L., Liu, Y., Wang, Z., Liu, C., Huang, X., and Zhu, G. (2014). Behavior of tetracycline andsulfamethazine with corresponding resistance genes from swine wastewater in pilot-scaleconstructed wetlands. J. Hazard. Mater. 278, 304–310.
Luan, G., Hong, Y., Drlica, K., and Zhao, X. (2017). Suppression of Reactive Oxygen SpeciesAccumulation Accounts for Paradoxical Bacterial Survival at High Quinolone Concentration.Antimicrob. Agents Chemother. 62.
Ludwig, W. (2004). ARB: a software environment for sequence data. Nucleic Acids Res. 32, 1363–1371.
Machado, E., Canton, R., Baquero, F., Galan, J.-C., Rollan, A., Peixe, L., and Coque, T.M. (2005).Integron Content of Extended-Spectrum- -Lactamase-Producing Escherichia coli Strains over 12Years in a Single Hospital in Madrid, Spain. Antimicrob. Agents Chemother. 49, 1823–1829.
Madigan, M.T., Martinko, J., Stahl, D.A., and Clark, D.P. (2012). Brock Biology of microorganisms(Pearson).
Mahfouz, N., Caucci, S., Achatz, E., Semmler, T., Guenther, S., Berendonk, T.U., and Schroeder, M.(2018). High genomic diversity of multi-drug resistant wastewater Escherichia coli. Sci. Rep. 8.
110

Makowska, N., Koczura, R., and Mokracka, J. (2016). Class 1 integrase, sulfonamide andtetracycline resistance genes in wastewater treatment plant and surface water. Chemosphere 144,1665–1673.
Manaia, C.M., Rocha, J., Scaccia, N., Marano, R., Radu, E., Biancullo, F., Cerqueira, F., Fortunato,G., Iakovides, I.C., Zammit, I., et al. (2018). Antibiotic resistance in wastewater treatment plants:Tackling the black box. Environ. Int. 115, 312–324.
Mao, D., Yu, S., Rysz, M., Luo, Y., Yang, F., Li, F., Hou, J., Mu, Q., and Alvarez, P.J.J. (2015).Prevalence and proliferation of antibiotic resistance genes in two municipal wastewater treatmentplants. Water Res. 85, 458–466.
Matamoros, V., and Bayona, J.M. (2006). Elimination of Pharmaceuticals and Personal CareProducts in Subsurface Flow Constructed Wetlands. Environ. Sci. Technol. 40, 5811–5816.
Matsushita, M., Okubo, T., Hasegawa, T., Matsuo, J., Watanabe, T., Iwasaki, S., Fukumoto, T.,Hayasaka, K., Akizawa, K., Shimizu, C., et al. (2018). Tetrahymena promotes interactive transfer ofcarbapenemase gene encoded in plasmid between fecal Escherichia coli and environmentalAeromonas caviae: Ciliates promote bacterial gene transfer. Microbiol. Immunol. 62, 720–728.
Mazel, D. (2006). Integrons: agents of bacterial evolution. Nat. Rev. Microbiol. 4, 608–620.
Mazel, D., Dychinco, B., Webb, V.A., and Davies, J. (2000). Antibiotic resistance in the ECORcollection: integrons and identification of a novel aad gene. Antimicrob. Agents Chemother. 44,1568–1574.
McLain, J.E., Cytryn, E., Durso, L.M., and Young, S. (2016). Culture-based Methods for Detectionof Antibiotic Resistance in Agroecosystems: Advantages, Challenges, and Gaps in Knowledge. J.Environ. Qual. 45, 432.
Michael, C.A., Franks, A.E., and Labbate, M. (2016). The antimicrobial resistance crisis:management through gene monitoring. Open Biol. 6, 160236.
Michael, I., Rizzo, L., McArdell, C.S., Manaia, C.M., Merlin, C., Schwartz, T., Dagot, C., andFatta-Kassinos, D. (2013). Urban wastewater treatment plants as hotspots for the release ofantibiotics in the environment: A review. Water Res. 47, 957–995.
Muiras, M.L., Giacomoni, P.U., and Tachon, P. (1993). Modulation of DNA breakage induced viathe Fenton reaction. Mutat. Res. 295, 47–54.
Müller, E., Schüssler, W., Horn, H., and Lemmer, H. (2013). Aerobic biodegradation of thesulfonamide antibiotic sulfamethoxazole by activated sludge applied as co-substrate and sole carbonand nitrogen source. Chemosphere 92, 969–978.
Munir, M., Wong, K., and Xagoraraki, I. (2011). Release of antibiotic resistant bacteria and genes inthe effluent and biosolids of five wastewater utilities in Michigan. Water Res. 45, 681–693.
Muziasari, W.I., Managaki, S., Pärnänen, K., Karkman, A., Lyra, C., Tamminen, M., Suzuki, S., andVirta, M. (2014). Sulphonamide and Trimethoprim Resistance Genes Persist in Sediments at BalticSea Aquaculture Farms but Are Not Detected in the Surrounding Environment. PLoS ONE 9,e92702.
111
Nandi, S., Maurer, J.J., Hofacre, C., and Summers, A.O. (2004). Gram-positive bacteria are a majorreservoir of Class 1 antibiotic resistance integrons in poultry litter. Proc. Natl. Acad. Sci. 101, 7118–7122.
Nivala, J., Headley, T., Wallace, S., Bernhard, K., Brix, H., van Afferden, M., and Müller, R.A.(2013). Comparative analysis of constructed wetlands: The design and construction of theecotechnology research facility in Langenreichenbach, Germany. Ecol. Eng. 61, 527–543.
Nõlvak, H., Truu, M., Tiirik, K., Oopkaup, K., Sildvee, T., Kaasik, A., Mander, Ü., and Truu, J.(2013). Dynamics of antibiotic resistance genes and their relationships with system treatmentefficiency in a horizontal subsurface flow constructed wetland. Sci. Total Environ. 461–462, 636–644.
OECD (2018). Stemming the Superbug Tide Just A Few Dollars More. OECD Health PolicyStudies, OECD Publishing, Paris, https://doi.org/10.1787/9789264307599-en
Orsini, M., and Romano-Spica, V. (2001). A microwave-based method for nucleic acid isolationfrom environmental samples. Lett. Appl. Microbiol. 33, 17–20.
Pärnänen, K., Karkman, A., Tamminen, M., Lyra, C., Hultman, J., Paulin, L., and Virta, M. (2016).Evaluating the mobility potential of antibiotic resistance genes in environmental resistomes withoutmetagenomics. Sci. Rep. 6, 35790.
Partridge, S.R., Tsafnat, G., Coiera, E., and Iredell, J.R. (2009). Gene cassettes and cassette arraysin mobile resistance integrons. FEMS Microbiol. Rev. 33, 757–784.
Perreten, V., and Boerlin, P. (2003). A New Sulfonamide Resistance Gene (sul3) in Escherichia coliIs Widespread in the Pig Population of Switzerland. Antimicrob. Agents Chemother. 47, 1169–1172.
Pinto, D., Santos, M.A., and Chambel, L. (2015). Thirty years of viable but nonculturable stateresearch: Unsolved molecular mechanisms. Crit. Rev. Microbiol. 41, 61–76.
Piotrowska, M., and Popowska, M. (2015). Insight into the mobilome of Aeromonas strains. Front.Microbiol. 6.
Provenzano, J.C., Siqueira, J.F., Rôças, I.N., Domingues, R.R., Paes Leme, A.F., and Silva, M.R.S.(2013). Metaproteome Analysis of Endodontic Infections in Association with Different ClinicalConditions. PLoS ONE 8, e76108.
Pruden, A., Pei, R., Storteboom, H., and Carlson, K.H. (2006). Antibiotic Resistance Genes asEmerging Contaminants: Studies in Northern Colorado †. Environ. Sci. Technol. 40, 7445–7450.
Radke, M., Lauwigi, C., Heinkele, G., Mürdter, T.E., and Letzel, M. (2009). Fate of the AntibioticSulfamethoxazole and Its Two Major Human Metabolites in a Water Sediment Test. Environ. Sci.Technol. 43, 3135–3141.
Rapa, R.A., and Labbate, M. (2013). The function of integron-associated gene cassettes in Vibriospecies: the tip of the iceberg. Front. Microbiol. 4.
Ravi, A., Avershina, E., Foley, S.L., Ludvigsen, J., Storrø, O., Øien, T., Johnsen, R., McCartney,A.L., L’Abée-Lund, T.M., and Rudi, K. (2015). The commensal infant gut meta-mobilome as apotential reservoir for persistent multidrug resistance integrons. Sci. Rep. 5, 15317.
112

Reinoso, R., Torres, L.A., and Bécares, E. (2008). Efficiency of natural systems for removal ofbacteria and pathogenic parasites from wastewater. Sci. Total Environ. 395, 80–86.
Rizzo, L., Fiorentino, A., and Anselmo, A. (2013). Advanced treatment of urban wastewater by UVradiation: Effect on antibiotics and antibiotic-resistant E. coli strains. Chemosphere 92, 171–176.
Rodríguez-Escales, P., and Sanchez-Vila, X. (2016). Fate of sulfamethoxazole in groundwater:Conceptualizing and modeling metabolite formation under different redox conditions. Water Res.105, 540–550.
Rodriguez-Mozaz, S., Chamorro, S., Marti, E., Huerta, B., Gros, M., Sànchez-Melsió, A., Borrego,C.M., Barceló, D., and Balcázar, J.L. (2015). Occurrence of antibiotics and antibiotic resistancegenes in hospital and urban wastewaters and their impact on the receiving river. Water Res. 69,234–242.
Saad, R.A.B. (2017). Influence of system type, loading regimes and helophyte species on inorganicsulfur transformations in constructed wetlands. Dissertation. Otto-von-Guericke-UniversitätMagdeburg. https://d-nb.info/1139048457/34
Samsó, R., and García, J. (2013). Bacteria distribution and dynamics in constructed wetlands basedon modelling results. Sci. Total Environ. 461–462, 430–440.
Seputiene, V., Povilonis, J., Ruzauskas, M., Pavilonis, A., and Suziedeliene, E. (2010). Prevalenceof trimethoprim resistance genes in Escherichia coli isolates of human and animal origin inLithuania. J. Med. Microbiol. 59, 315–322.
Shearer, J.E.S., and Summers, A.O. (2009). Intracellular Steady-State Concentration of IntegronRecombination Products Varies with Integrase Level and Growth Phase. J. Mol. Biol. 386, 316–331.
Sköld, O. (2000). Sulfonamide resistance: mechanisms and trends. Drug Resist. Updat. 3, 155–160.
Slekovec, C., Plantin, J., Cholley, P., Thouverez, M., Talon, D., Bertrand, X., and Hocquet, D.(2012). Tracking Down Antibiotic-Resistant Pseudomonas aeruginosa Isolates in a WastewaterNetwork. PLoS ONE 7, e49300.
Smith, M.A., and Bidochka, M.J. (1998). Bacterial fitness and plasmid loss: the importance ofculture conditions and plasmid size. 44, 5.
Spencer, S.J., Tamminen, M.V., Preheim, S.P., Guo, M.T., Briggs, A.W., Brito, I.L., Weitz, D.A.,Pitkänen, L.K., Vigneault, F., Virta, M.Pj., et al. (2015). Massively parallel sequencing of singlecells by epicPCR links functional genes with phylogenetic markers. ISME J.
Sulfikar, Honda, R., Noguchi, M., Yamamoto-Ikemoto, R., and Watanabe, T. (2018). Effect ofSedimentation and Aeration on Antibiotic Resistance Induction in the Activated Sludge Process. J.Water Environ. Technol. 16, 94–105.
Tennstedt, T., Szczepanowski, R., Braun, S., Pühler, A., and Schlüter, A. (2003). Occurrence ofintegron-associated resistance gene cassettes located on antibiotic resistance plasmids isolated froma wastewater treatment plant. FEMS Microbiol. Ecol. 45, 239–252.
113
Ternes, T.A., Bonerz, M., Herrmann, N., Teiser, B., and Andersen, H.R. (2007). Irrigation of treatedwastewater in Braunschweig, Germany: An option to remove pharmaceuticals and musk fragrances.Chemosphere 66, 894–904.
Thomas, C.M., and Nielsen, K.M. (2005). Mechanisms of, and Barriers to, Horizontal GeneTransfer between Bacteria. Nat. Rev. Microbiol. 3, 711–721.
Trovó, A.G., Nogueira, R.F.P., Agüera, A., Sirtori, C., and Fernández-Alba, A.R. (2009).Photodegradation of sulfamethoxazole in various aqueous media: Persistence, toxicity andphotoproducts assessment. Chemosphere 77, 1292–1298.
Uhl, L., Gerstel, A., Chabalier, M., and Dukan, S. (2015). Hydrogen peroxide induced cell death:One or two modes of action? Heliyon 1, e00049.
Van Boeckel, T.P., Glennon, E.E., Chen, D., Gilbert, M., Robinson, T.P., Grenfell, B.T., Levin, S.A.,Bonhoeffer, S., and Laxminarayan, R. (2017). Reducing antimicrobial use in food animals. Science357, 1350–1352.
Ven, A.J., Vree, T.B., Ewijk-Beneken Kolmer, E.W., Koopmans, P.P., and Meer, J.W. (1995).Urinary recovery and kinetics of sulphamethoxazole and its metabolites in HIV-seropositivepatients and healthy volunteers after a single oral dose of sulphamethoxazole. Br. J. Clin.Pharmacol. 39, 621–625.
Verlicchi, P., and Zambello, E. (2014). How efficient are constructed wetlands in removingpharmaceuticals from untreated and treated urban wastewaters? A review. Sci. Total Environ. 470–471, 1281–1306.
Wang, J., and Wang, S. (2018). Microbial degradation of sulfamethoxazole in the environment.Appl. Microbiol. Biotechnol. 102, 3573–3582.
Wang, Y., and Qian, P.-Y. (2009). Conservative Fragments in Bacterial 16S rRNA Genes and PrimerDesign for 16S Ribosomal DNA Amplicons in Metagenomic Studies. PLoS ONE 4, e7401.
Wang, N., Yang, X., Jiao, S., Zhang, J., Ye, B., and Gao, S. (2014). Sulfonamide-Resistant Bacteriaand Their Resistance Genes in Soils Fertilized with Manures from Jiangsu Province, SoutheasternChina. PLoS ONE 9, e112626.
Wiesmann, U., Choi, I.S., and Dombrowski, E. (2006). Fundamentals of Biological WastewaterTreatment (Wiley).
von Wintersdorff, C.J.H., Penders, J., van Niekerk, J.M., Mills, N.D., Majumder, S., van Alphen,L.B., Savelkoul, P.H.M., and Wolffs, P.F.G. (2016). Dissemination of Antimicrobial Resistance inMicrobial Ecosystems through Horizontal Gene Transfer. Front. Microbiol. 7.
World Health Organization (2014). Antimicrobial resistance: global report on surveillance (Genève:World Health Organization).
World Health Organization (2017). Guidelines for drinking-water quality.
Xian, Q., Hu, L., Chen, H., Chang, Z., and Zou, H. (2010). Removal of nutrients and veterinaryantibiotics from swine wastewater by a constructed macrophyte floating bed system. J. Environ.Manage. 91, 2657–2661.
114

Xie, R., Zhang, X.D., Zhao, Q., Peng, B., and Zheng, J. (2018). Analysis of global prevalence ofantibiotic resistance in Acinetobacter baumannii infections disclosed a faster increase in OECDcountries. Emerg. Microbes Infect. 7.
Xu, Z., Li, L., Shirtliff, M.E., Peters, B.M., Li, B., Peng, Y., Alam, M.J., Yamasaki, S., and Shi, L.(2011). Resistance class 1 integron in clinical methicillin‐resistant Staphylococcus aureus strains insouthern China, 2001–2006. Clin. Microbiol. Infect. 17, 714–718.
Yang, C.-W., Tsai, L.-L., and Chang, B.-V. (2018). Anaerobic degradation of sulfamethoxazole inmangrove sediments. Sci. Total Environ. 643, 1446–1455.
Yi, X., Tran, N.H., Yin, T., He, Y., and Gin, K.Y.-H. (2017). Removal of selected PPCPs, EDCs, andantibiotic resistance genes in landfill leachate by a full-scale constructed wetlands system. WaterRes. 121, 46–60.
Yu, G., Smith, D.K., Zhu, H., Guan, Y., and Lam, T.T.-Y. (2017). ggtree: an R package forvisualization and annotation of phylogenetic trees with their covariates and other associated data.Methods Ecol. Evol. 8, 28–36.
Zhang, D.Q., Jinadasa, K.B.S.N., Gersberg, R.M., Liu, Y., Ng, W.J., and Tan, S.K. (2014).Application of constructed wetlands for wastewater treatment in developing countries – A review ofrecent developments (2000–2013). J. Environ. Manage. 141, 116–131.
Zhang, T., Zhang, M., Zhang, X., and Fang, H.H. (2009). Tetracycline Resistance Genes andTetracycline Resistant Lactose-Fermenting Enterobacteriaceae in Activated Sludge of SewageTreatment Plants. Environ. Sci. Technol. 43, 3455–3460.
Zhang, Y., Gu, A.Z., Cen, T., Li, X., He, M., Li, D., and Chen, J. (2018). Sub-inhibitoryconcentrations of heavy metals facilitate the horizontal transfer of plasmid-mediated antibioticresistance genes in water environment. Environ. Pollut. 237, 74–82.
115

Appendices
116

Appendix A: Culture media composition
Mueller-Hinton
Mueller Hinton Agar is a medium very rich in nutrients that is used primarily for sensitivity testing
of microorganisms.
Component Quantity (g/L)
Beef Infusion 2.0
Corn starch 1.5
Acid Casein Peptone 17.5
Agar 17.0
pH 7.4±0.2
Endo Agar
Endo Agar is recommended for the detection of coliform and other enteric organisms. It is used for
the microbiological examination of potable water, waste water, dairy products and food.
Component Quantity (g/L)
Peptic Digest of Animal Tissue 10.0
Lactose 10.0
Dipotassium Phosphate 3.5
Sodium Sulphite 2.5
Basic Fuchsin 0.5
Agar 15.0
pH 7.5±0.2
Sodium sulphite and basic fuchsin have an inhibitory effect on Gram-positive microorganisms
(selective). Lactose fermenting coliforms produce aldehyde and acid. The aldehyde in turn liberates
fuchsin from the fuchsin-sulphite complex giving rise to red colonies. With Escherichia coli, this
reaction is very pronounced as the fuchsin crystallizes (differential). The differential characteristic
develops after 18-24 hours at 35-37 °C.
117

Pseudomonas isolation agar.
Component Quantity (g/L)
Peptic digest of animal tissue 20.0
Magnesium chloride 1.4
Potassium sulfate 10.0
Triclosan (Irgasan) 0.025
Agar 13.6
pH 7.0±0.2
Peptic digest of animal tissue provides nitrogenous compounds. Glycerol serves as carbohydrate
source and promotes the phycocyanin (blue-green pigment) production (differential for
Pseudomonas Aeruginosa). Magnesium is a cofactor for many metabolic reactions and together
potassium sulfate stimulate phyocyanin production as well. Irgasan is an antibiotic and selectively
inhibits Gram-positive and Gram-negative bacteria other than Pseudomonas spp (selective).
Cultural characteristics are evident after 24-48 hours at 35 °C.
Aeromonas isolation agar
Aeromonas media are used for the detection of Aeromonas in tap water, bottled water and foods
including meat, poultry, fish and seafood
Component Quantity (g/L)
Peptone, special 5.0
Yeast extract 3.0
L-Lysine hydrochloride 3.5
L-Arginine hydrochloride 2.0
Inositol 2.5
Lactose 1.5
Sorbose 3.0
Xylose 3.8
Bile salts 3.0
Sodium thiosulfate 10.7
Sodium chloride 5.0
Ferric ammonium citrate 0.8
118

Bromothymol Blue 0.04
Thymol Blue 0.04
Agar 12.5
Ampicilin 1.125x10⁻³
Final pH 7.0±0.2
Peptone special, amino acid and yeast extract provide nitrogenous compounds, carbon, sulfur, trace
nutrients, vitamin B complex, which are essential for the growth of Aeromonas. Inositol, Lactose,
Sorbose and Xylose are the carbohydrate substrates and sodium thiosulfate is important for the
neutralisation of chlorinated water. Complex sodium thiosulfate-ferric ammonium citrate produces
black -centered colonies when ferric ammonium citrate precipitates (H2S production) (differential).
The mixed indicator bromothymol blue and thymol blue changes its colour to yellow, when acid is
formed. Sodium chloride is for the osmotic balance and bile salts inhibits growth of Gram-positive
bacteria (selective).
119
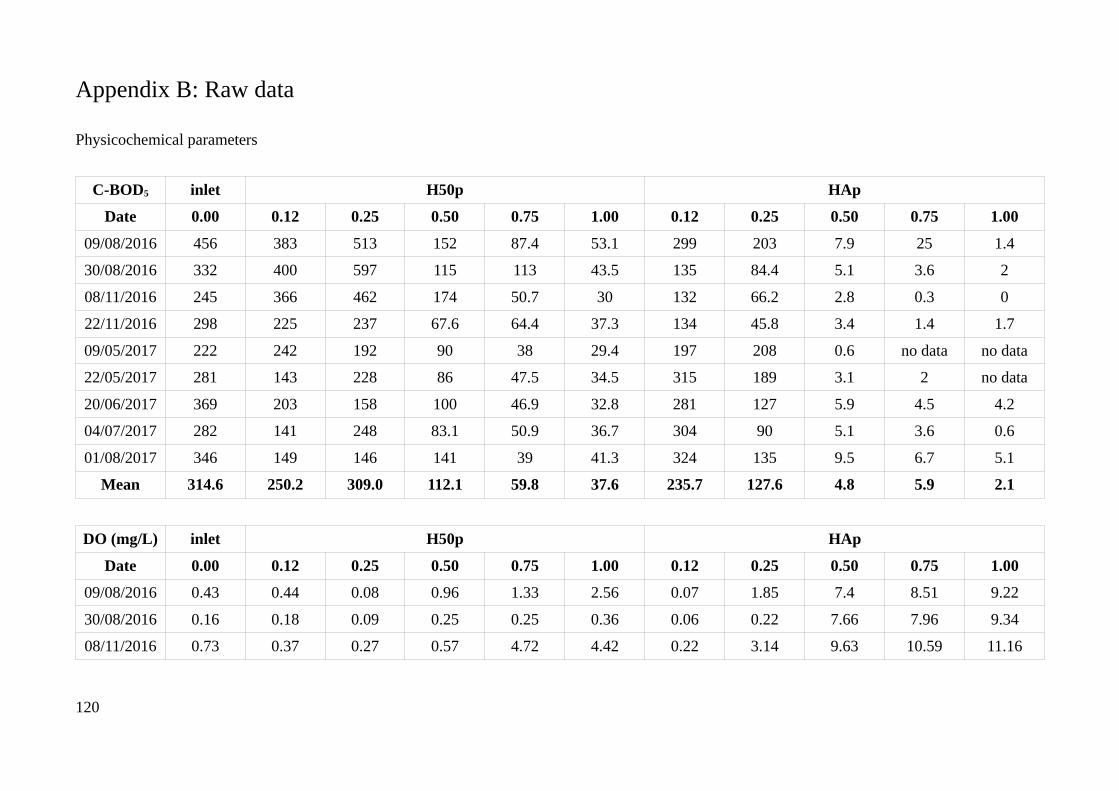
Appendix B: Raw data
Physicochemical parameters
C-BOD5 inlet H50p HAp
Date 0.00 0.12 0.25 0.50 0.75 1.00 0.12 0.25 0.50 0.75 1.00
09/08/2016 456 383 513 152 87.4 53.1 299 203 7.9 25 1.4
30/08/2016 332 400 597 115 113 43.5 135 84.4 5.1 3.6 2
08/11/2016 245 366 462 174 50.7 30 132 66.2 2.8 0.3 0
22/11/2016 298 225 237 67.6 64.4 37.3 134 45.8 3.4 1.4 1.7
09/05/2017 222 242 192 90 38 29.4 197 208 0.6 no data no data
22/05/2017 281 143 228 86 47.5 34.5 315 189 3.1 2 no data
20/06/2017 369 203 158 100 46.9 32.8 281 127 5.9 4.5 4.2
04/07/2017 282 141 248 83.1 50.9 36.7 304 90 5.1 3.6 0.6
01/08/2017 346 149 146 141 39 41.3 324 135 9.5 6.7 5.1
Mean 314.6 250.2 309.0 112.1 59.8 37.6 235.7 127.6 4.8 5.9 2.1
DO (mg/L) inlet H50p HAp
Date 0.00 0.12 0.25 0.50 0.75 1.00 0.12 0.25 0.50 0.75 1.00
09/08/2016 0.43 0.44 0.08 0.96 1.33 2.56 0.07 1.85 7.4 8.51 9.22
30/08/2016 0.16 0.18 0.09 0.25 0.25 0.36 0.06 0.22 7.66 7.96 9.34
08/11/2016 0.73 0.37 0.27 0.57 4.72 4.42 0.22 3.14 9.63 10.59 11.16
120

22/11/2016 1.12 0.88 0.43 0.49 0.62 0.72 0.22 0.49 9.79 10.33 11.84
09/05/2017 0.55 0.82 0.52 0.65 1.15 1.14 0.35 0.17 9.37 10.5 11.15
22/05/2017 0.61 1.41 0.99 1.65 1.64 1 0.85 1.16 10.54 11.63 11.12
20/06/2017 0.7 0.86 0.77 0.74 0.79 4.06 0.19 0.9 7.32 8.36 8.68
04/07/2017 0.55 0.78 0.43 0.96 0.89 2.25 0.11 2.64 8.32 8.66 8.75
01/08/2017 0.9 0.9 0.68 0.45 0.79 3.86 0.09 2.21 7.1 8.08 8.47
Mean 0.64 0.74 0.47 0.75 0.93 2.26 0.24 1.42 8.57 9.40 9.97
HAp
NH4+ (mg/L) NO3
- (mg/L)
Date 0.00 0.12 0.25 0.50 0.75 1.00 0.00 0.12 0.25 0.50 0.75 1.00
04/09/2014 84.33 71.04 41.49 0.04 0.04 0.05 <LOD 0.07 12.22 34.38 31.99 29.98
09/09/2014 71.10 68.70 48.26 0.06 0.05 0.05 <LOD <LOD 11.00 38.61 35.94 35.49
07/10/2014 100.24 81.54 no data 0.02 0.07 0.05 <LOD <LOD no data 42.58 48.66 41.63
19/05/2015 77.17 83.02 79.02 2.43 0.07 <LOD <LOD 0.09 0.32 52.07 51.57 50.17
26/05/2015 81.41 80.46 79.43 0.71 <LOD 0.04 <LOD <LOD 0.16 50.26 50.40 50.62
02/06/2015 77.30 79.08 74.17 0.08 <LOD <LOD <LOD 0.07 0.32 52.07 no data 53.00
09/06/2015 75.55 79.47 74.06 0.18 0.05 0.03 <LOD 0.07 0.29 48.68 51.30 49.52
23/06/2015 66.40 67.45 64.98 0.03 <LOD 0.05 <LOD <LOD 0.11 42.38 38.79 38.31
30/06/2015 74.95 72.34 67.72 <LOD <LOD <LOD <LOD <LOD 0.07 41.32 41.93 39.85
Mean 78.72 75.90 66.14 0.45 0.05 0.04 <LOD 0.07 3.06 44.70 43.82 43.17
121

SMX (ng/L) inlet H50p HAp
Date 0.00 0.12 0.25 0.50 0.75 1.00 0.12 0.25 0.50 0.75 1.00
09/08/2016 16 12 8 25 34 4 9 1 463 23 47
14/08/2016 159 172 143 62 6 8 212 216 174 223 264
07/11/2016 47 45 38 33 33 29 18 15 17 39 66
22/05/2017 24 11 11 12 11 109 23 14 25 53 7
20/06/2017 66 30 35 17 34 2 64 36 12 29 10
01/08/2017 127 42 42 19 27 10 80 53 19 47 41
Median 56.5 36 36.5 22 30 9 43.5 25.5 22 43 44
N4-Ac-SMX
(ng/L)
inlet H50p HAp
Date 0.00 0.12 0.25 0.50 0.75 1.00 0.12 0.25 0.50 0.75 1.00
09/08/2016 27.5 9.7 6.7 11.3 <LOD <LOD 16.4 14.3 22.0 11.9 12.8
14/08/2016 657.1 77.3 39.9 26.6 6.7 5.4 187.7 343.4 130.9 40.8 7.3
07/11/2016 40.7 1.8 6.6 1.9 9.7 1.5 24.6 8.8 10.8 3.6 5.9
22/05/2017 49.8 19.7 9.6 6.8 1.1 2.9 9.9 9.1 8.79 3.7 0.5
20/06/2017 96.3 40.1 17.6 2.9 <LOD 2.6 24.3 20.5 4.8 BLD 1.2
01/08/2017 95.4 35.6 15.8 0.8 <LOD <LOD 19.2 18.4 6.7 12.5 3.5
Median 72.6 27.6 12.7 4.8 6.7 2.8 21.8 16.3 9.8 11.9 4.7
< LOD: limit of detection
122
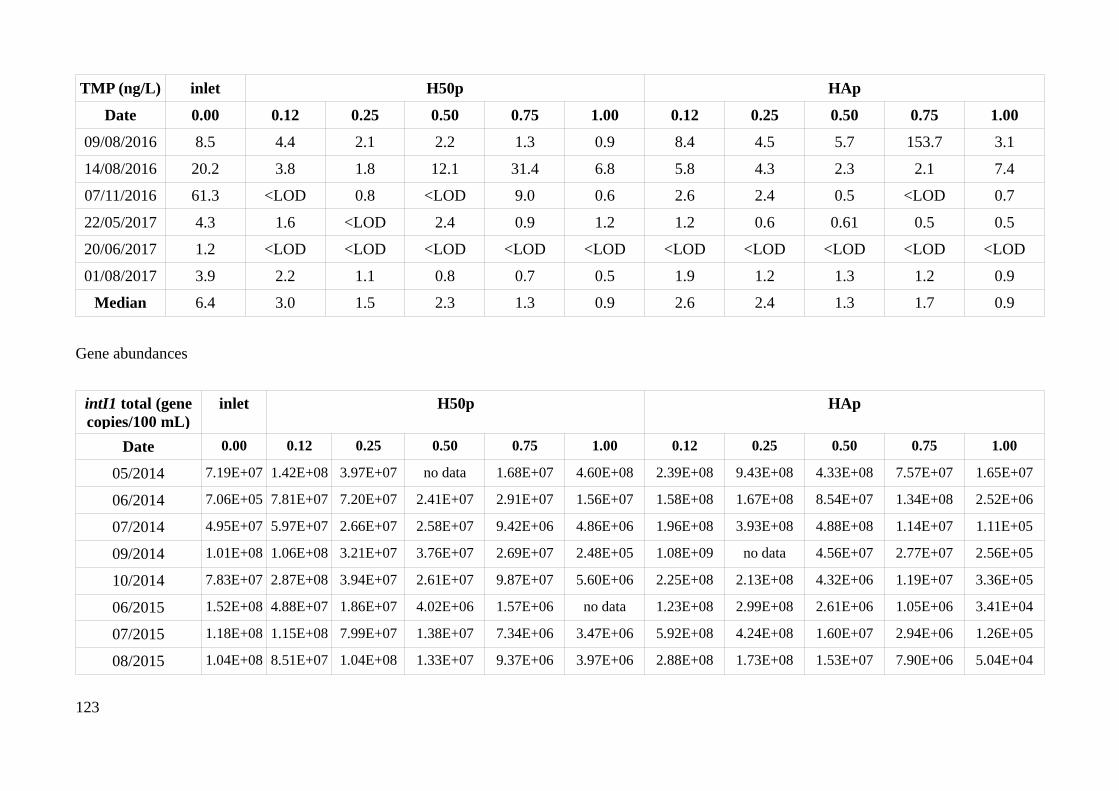
TMP (ng/L) inlet H50p HAp
Date 0.00 0.12 0.25 0.50 0.75 1.00 0.12 0.25 0.50 0.75 1.00
09/08/2016 8.5 4.4 2.1 2.2 1.3 0.9 8.4 4.5 5.7 153.7 3.1
14/08/2016 20.2 3.8 1.8 12.1 31.4 6.8 5.8 4.3 2.3 2.1 7.4
07/11/2016 61.3 <LOD 0.8 <LOD 9.0 0.6 2.6 2.4 0.5 <LOD 0.7
22/05/2017 4.3 1.6 <LOD 2.4 0.9 1.2 1.2 0.6 0.61 0.5 0.5
20/06/2017 1.2 <LOD <LOD <LOD <LOD <LOD <LOD <LOD <LOD <LOD <LOD
01/08/2017 3.9 2.2 1.1 0.8 0.7 0.5 1.9 1.2 1.3 1.2 0.9
Median 6.4 3.0 1.5 2.3 1.3 0.9 2.6 2.4 1.3 1.7 0.9
Gene abundances
intI1 total (genecopies/100 mL)
inlet H50p HAp
Date 0.00 0.12 0.25 0.50 0.75 1.00 0.12 0.25 0.50 0.75 1.00
05/2014 7.19E+07 1.42E+08 3.97E+07 no data 1.68E+07 4.60E+08 2.39E+08 9.43E+08 4.33E+08 7.57E+07 1.65E+07
06/2014 7.06E+05 7.81E+07 7.20E+07 2.41E+07 2.91E+07 1.56E+07 1.58E+08 1.67E+08 8.54E+07 1.34E+08 2.52E+06
07/2014 4.95E+07 5.97E+07 2.66E+07 2.58E+07 9.42E+06 4.86E+06 1.96E+08 3.93E+08 4.88E+08 1.14E+07 1.11E+05
09/2014 1.01E+08 1.06E+08 3.21E+07 3.76E+07 2.69E+07 2.48E+05 1.08E+09 no data 4.56E+07 2.77E+07 2.56E+05
10/2014 7.83E+07 2.87E+08 3.94E+07 2.61E+07 9.87E+07 5.60E+06 2.25E+08 2.13E+08 4.32E+06 1.19E+07 3.36E+05
06/2015 1.52E+08 4.88E+07 1.86E+07 4.02E+06 1.57E+06 no data 1.23E+08 2.99E+08 2.61E+06 1.05E+06 3.41E+04
07/2015 1.18E+08 1.15E+08 7.99E+07 1.38E+07 7.34E+06 3.47E+06 5.92E+08 4.24E+08 1.60E+07 2.94E+06 1.26E+05
08/2015 1.04E+08 8.51E+07 1.04E+08 1.33E+07 9.37E+06 3.97E+06 2.88E+08 1.73E+08 1.53E+07 7.90E+06 5.04E+04
123
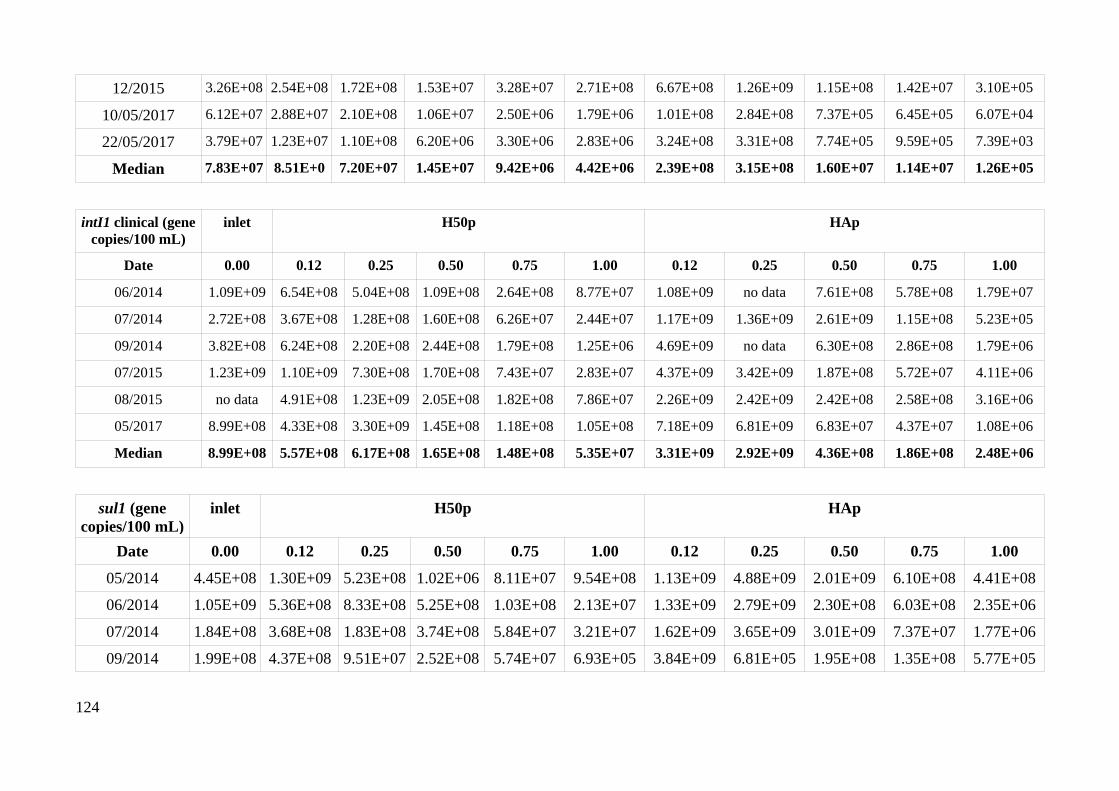
12/2015 3.26E+08 2.54E+08 1.72E+08 1.53E+07 3.28E+07 2.71E+08 6.67E+08 1.26E+09 1.15E+08 1.42E+07 3.10E+05
10/05/2017 6.12E+07 2.88E+07 2.10E+08 1.06E+07 2.50E+06 1.79E+06 1.01E+08 2.84E+08 7.37E+05 6.45E+05 6.07E+04
22/05/2017 3.79E+07 1.23E+07 1.10E+08 6.20E+06 3.30E+06 2.83E+06 3.24E+08 3.31E+08 7.74E+05 9.59E+05 7.39E+03
Median 7.83E+07 8.51E+0
7
7.20E+07 1.45E+07 9.42E+06 4.42E+06 2.39E+08 3.15E+08 1.60E+07 1.14E+07 1.26E+05
intI1 clinical (genecopies/100 mL)
inlet H50p HAp
Date 0.00 0.12 0.25 0.50 0.75 1.00 0.12 0.25 0.50 0.75 1.00
06/2014 1.09E+09 6.54E+08 5.04E+08 1.09E+08 2.64E+08 8.77E+07 1.08E+09 no data 7.61E+08 5.78E+08 1.79E+07
07/2014 2.72E+08 3.67E+08 1.28E+08 1.60E+08 6.26E+07 2.44E+07 1.17E+09 1.36E+09 2.61E+09 1.15E+08 5.23E+05
09/2014 3.82E+08 6.24E+08 2.20E+08 2.44E+08 1.79E+08 1.25E+06 4.69E+09 no data 6.30E+08 2.86E+08 1.79E+06
07/2015 1.23E+09 1.10E+09 7.30E+08 1.70E+08 7.43E+07 2.83E+07 4.37E+09 3.42E+09 1.87E+08 5.72E+07 4.11E+06
08/2015 no data 4.91E+08 1.23E+09 2.05E+08 1.82E+08 7.86E+07 2.26E+09 2.42E+09 2.42E+08 2.58E+08 3.16E+06
05/2017 8.99E+08 4.33E+08 3.30E+09 1.45E+08 1.18E+08 1.05E+08 7.18E+09 6.81E+09 6.83E+07 4.37E+07 1.08E+06
Median 8.99E+08 5.57E+08 6.17E+08 1.65E+08 1.48E+08 5.35E+07 3.31E+09 2.92E+09 4.36E+08 1.86E+08 2.48E+06
sul1 (genecopies/100 mL)
inlet H50p HAp
Date 0.00 0.12 0.25 0.50 0.75 1.00 0.12 0.25 0.50 0.75 1.00
05/2014 4.45E+08 1.30E+09 5.23E+08 1.02E+06 8.11E+07 9.54E+08 1.13E+09 4.88E+09 2.01E+09 6.10E+08 4.41E+08
06/2014 1.05E+09 5.36E+08 8.33E+08 5.25E+08 1.03E+08 2.13E+07 1.33E+09 2.79E+09 2.30E+08 6.03E+08 2.35E+06
07/2014 1.84E+08 3.68E+08 1.83E+08 3.74E+08 5.84E+07 3.21E+07 1.62E+09 3.65E+09 3.01E+09 7.37E+07 1.77E+06
09/2014 1.99E+08 4.37E+08 9.51E+07 2.52E+08 5.74E+07 6.93E+05 3.84E+09 6.81E+05 1.95E+08 1.35E+08 5.77E+05
124
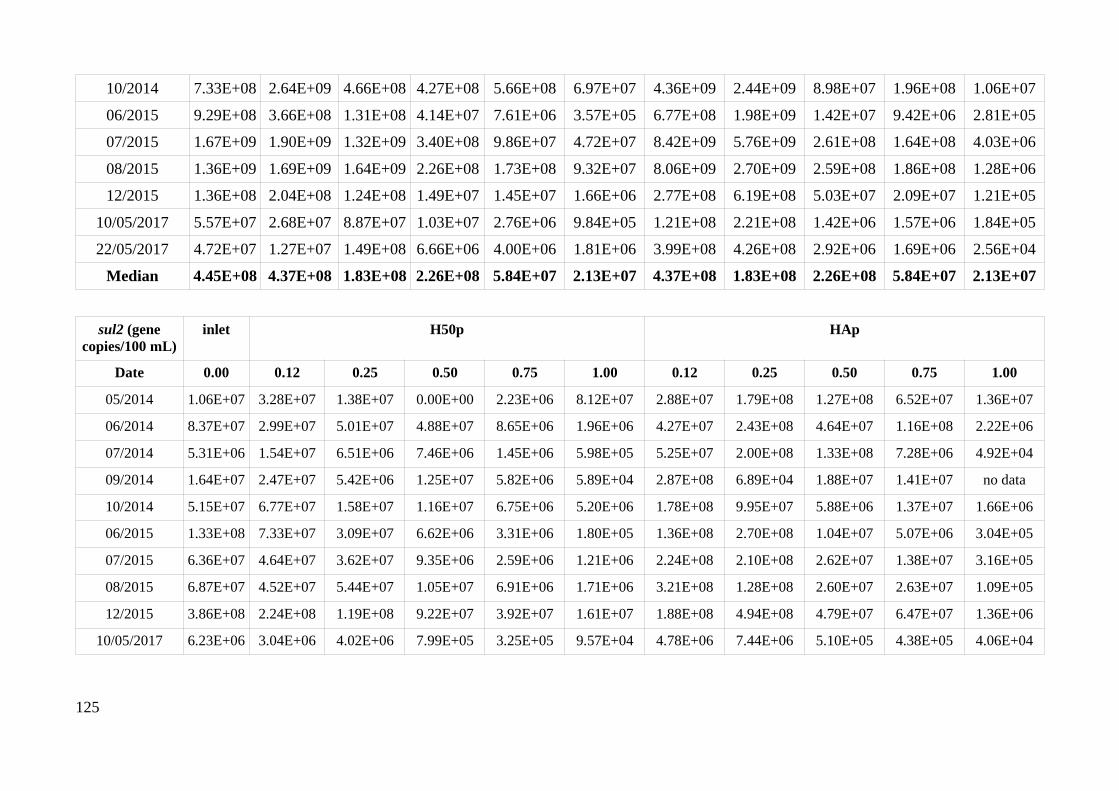
10/2014 7.33E+08 2.64E+09 4.66E+08 4.27E+08 5.66E+08 6.97E+07 4.36E+09 2.44E+09 8.98E+07 1.96E+08 1.06E+07
06/2015 9.29E+08 3.66E+08 1.31E+08 4.14E+07 7.61E+06 3.57E+05 6.77E+08 1.98E+09 1.42E+07 9.42E+06 2.81E+05
07/2015 1.67E+09 1.90E+09 1.32E+09 3.40E+08 9.86E+07 4.72E+07 8.42E+09 5.76E+09 2.61E+08 1.64E+08 4.03E+06
08/2015 1.36E+09 1.69E+09 1.64E+09 2.26E+08 1.73E+08 9.32E+07 8.06E+09 2.70E+09 2.59E+08 1.86E+08 1.28E+06
12/2015 1.36E+08 2.04E+08 1.24E+08 1.49E+07 1.45E+07 1.66E+06 2.77E+08 6.19E+08 5.03E+07 2.09E+07 1.21E+05
10/05/2017 5.57E+07 2.68E+07 8.87E+07 1.03E+07 2.76E+06 9.84E+05 1.21E+08 2.21E+08 1.42E+06 1.57E+06 1.84E+05
22/05/2017 4.72E+07 1.27E+07 1.49E+08 6.66E+06 4.00E+06 1.81E+06 3.99E+08 4.26E+08 2.92E+06 1.69E+06 2.56E+04
Median 4.45E+08 4.37E+08 1.83E+08 2.26E+08 5.84E+07 2.13E+07 4.37E+08 1.83E+08 2.26E+08 5.84E+07 2.13E+07
sul2 (genecopies/100 mL)
inlet H50p HAp
Date 0.00 0.12 0.25 0.50 0.75 1.00 0.12 0.25 0.50 0.75 1.00
05/2014 1.06E+07 3.28E+07 1.38E+07 0.00E+00 2.23E+06 8.12E+07 2.88E+07 1.79E+08 1.27E+08 6.52E+07 1.36E+07
06/2014 8.37E+07 2.99E+07 5.01E+07 4.88E+07 8.65E+06 1.96E+06 4.27E+07 2.43E+08 4.64E+07 1.16E+08 2.22E+06
07/2014 5.31E+06 1.54E+07 6.51E+06 7.46E+06 1.45E+06 5.98E+05 5.25E+07 2.00E+08 1.33E+08 7.28E+06 4.92E+04
09/2014 1.64E+07 2.47E+07 5.42E+06 1.25E+07 5.82E+06 5.89E+04 2.87E+08 6.89E+04 1.88E+07 1.41E+07 no data
10/2014 5.15E+07 6.77E+07 1.58E+07 1.16E+07 6.75E+06 5.20E+06 1.78E+08 9.95E+07 5.88E+06 1.37E+07 1.66E+06
06/2015 1.33E+08 7.33E+07 3.09E+07 6.62E+06 3.31E+06 1.80E+05 1.36E+08 2.70E+08 1.04E+07 5.07E+06 3.04E+05
07/2015 6.36E+07 4.64E+07 3.62E+07 9.35E+06 2.59E+06 1.21E+06 2.24E+08 2.10E+08 2.62E+07 1.38E+07 3.16E+05
08/2015 6.87E+07 4.52E+07 5.44E+07 1.05E+07 6.91E+06 1.71E+06 3.21E+08 1.28E+08 2.60E+07 2.63E+07 1.09E+05
12/2015 3.86E+08 2.24E+08 1.19E+08 9.22E+07 3.92E+07 1.61E+07 1.88E+08 4.94E+08 4.79E+07 6.47E+07 1.36E+06
10/05/2017 6.23E+06 3.04E+06 4.02E+06 7.99E+05 3.25E+05 9.57E+04 4.78E+06 7.44E+06 5.10E+05 4.38E+05 4.06E+04
125

22/05/2017 3.58E+06 1.23E+06 8.94E+06 3.58E+05 2.85E+05 6.47E+04 8.71E+06 1.03E+07 8.87E+05 6.21E+05 5.27E+03
Median 5.15E+07 3.28E+07 1.58E+07 9.35E+06 3.31E+06 1.21E+06 1.36E+08 1.79E+08 2.60E+07 1.38E+07 3.10E+05
dfrA1 (genecopies/100 mL)
inlet H50p HAp
Date 0.00 0.12 0.25 0.50 0.75 1.00 0.12 0.25 0.50 0.75 1.00
05/2014 6.24E+05 1.12E+06 2.61E+05 7.78E+04 9.10E+04 1.19E+05 3.54E+05 2.78E+05 1.18E+05 5.20E+04 9.32E+04
06/2014 1.63E+04 6.64E+05 3.57E+05 1.04E+05 3.88E+05 7.22E+04 4.58E+05 8.74E+04 3.59E+04 3.29E+04 6.65E+04
07/2014 7.58E+05 3.89E+05 2.46E+05 2.89E+05 4.71E+04 2.90E+04 1.67E+05 9.86E+04 1.32E+05 3.16E+04 1.46E+05
09/2014 6.13E+06 1.41E+06 3.23E+05 4.75E+05 5.98E+05 8.94E+03 2.10E+06 1.22E+04 3.74E+04 1.47E+04 1.37E+04
10/2014 5.10E+06 1.68E+06 3.41E+05 1.78E+05 3.36E+05 1.89E+05 1.33E+05 4.98E+05 1.84E+04 2.05E+04 1.69E+04
06/2015 2.97E+06 5.08E+06 1.61E+06 3.24E+05 6.07E+04 8.27E+03 1.25E+07 3.58E+06 0.00E+00 1.71E+04 9.05E+03
07/2015 1.17E+07 5.62E+06 2.13E+06 1.05E+06 3.77E+05 9.27E+04 6.32E+06 2.66E+06 6.12E+04 8.96E+04 1.19E+04
08/2015 2.35E+07 8.30E+06 4.37E+06 2.73E+06 1.54E+06 1.70E+05 6.28E+05 6.28E+06 1.15E+05 1.54E+05 1.86E+04
10/05/2017 3.71E+06 4.07E+05 6.59E+05 2.00E+05 6.26E+04 1.70E+04 8.47E+05 3.77E+05 3.09E+03 5.29E+03 6.03E+02
22/05/2017 1.11E+06 9.35E+04 9.20E+04 9.19E+04 3.81E+04 1.80E+04 1.55E+06 6.17E+05 2.15E+03 2.40E+03 3.24E+02
Median 3.34E+06 1.26E+06 3.49E+05 2.45E+05 2.13E+05 5.06E+04 7.38E+05 4.38E+05 3.67E+04 2.60E+04 1.53E+04
126

Escherichia coli
uidA (genecopies/100 mL)
inlet H50p HAp
Date 0.00 0.12 0.25 0.50 0.75 1.00 0.12 0.25 0.50 0.75 1.00
05/2014 2.29E+08 1.36E+07 9.90E+06 3.92E+06 6.20E+06 7.62E+06 1.73E+07 3.33E+07 3.26E+07 6.52E+06 6.48E+06
06/2014 2.14E+09 1.55E+07 1.97E+07 1.25E+07 5.11E+06 8.35E+07 9.72E+06 1.01E+07 1.50E+06 1.07E+06 6.03E+05
07/2014 2.06E+08 1.75E+07 1.66E+07 1.82E+07 6.65E+06 2.53E+07 1.99E+007 5.15E+007 3.91E+007 9.20E+006 5.30E+006
09/2014 3.20E+08 1.55E+08 4.37E+07 5.69E+07 7.26E+07 8.05E+06 1.41E+009 6.51E+008 1.07E+008 5.51E+007 5.23E+006
10/2014 9.17E+08 6.11E+08 1.75E+08 1.56E+08 2.18E+08 8.60E+07 4.55E+08 2.06E+09 1.22E+08 2.02E+08 3.81E+07
07/2015 1.99E+07 2.07E+07 7.28E+06 3.38E+06 1.02E+06 2.85E+05 1.58E+07 5.06E+06 0.00E+00 0.00E+00 0.00E+00
08/2015 1.65E+07 6.97E+06 4.55E+06 9.89E+05 4.29E+05 1.86E+04 1.25E+06 6.36E+06 no data no data no data
12/2015 2.10E+07 1.68E+07 no data 8.18E+06 1.46E+05 5.56E+05 8.73E+06 1.08E+07 3.89E+06 0.00E+00 0.00E+00
10/05/2017 1.07E+08 1.81E+07 4.57E+07 7.82E+06 1.94E+06 7.22E+05 3.60E+07 2.22E+07 8.38E+04 1.43E+05 2.62E+04
22/05/2017 6.24E+07 4.92E+06 1.60E+07 9.44E+06 3.20E+06 6.77E+05 4.56E+07 3.23E+07 1.75E+05 1.51E+05 7.45E+03
20/6/2017 3.60E+07 4.77E+06 6.03E+06 2.59E+06 8.46E+05 2.02E+05 1.27E+07 8.23E+06 1.63E+05 2.85E+05 1.67E+04
04/07/2017 1.08E+07 7.53E+06 2.93E+06 4.01E+06 7.32E+05 3.87E+05 8.46E+06 6.39E+06 1.64E+05 1.91E+05 1.58E+04
Median 8.46E+07 1.61E+07 1.60E+07 8.00E+06 2.57E+06 7.00E+05 1.66E+07 2.22E+07 1.50E+06 2.85E+05 2.62E+04
MPN(MPN/100 mL)
inlet H50p HAp
Date 0.00 0.12 0.25 0.50 0.75 1.00 0.12 0.25 0.50 0.75 1.00
09/08/2016 6.49E+06 3.26E+06 3.87E+06 2.10E+06 2.42E+06 1.42E+05 6.13E+02 1.67E+02 3.55E+01 4.88E+01 3.65E+02
127
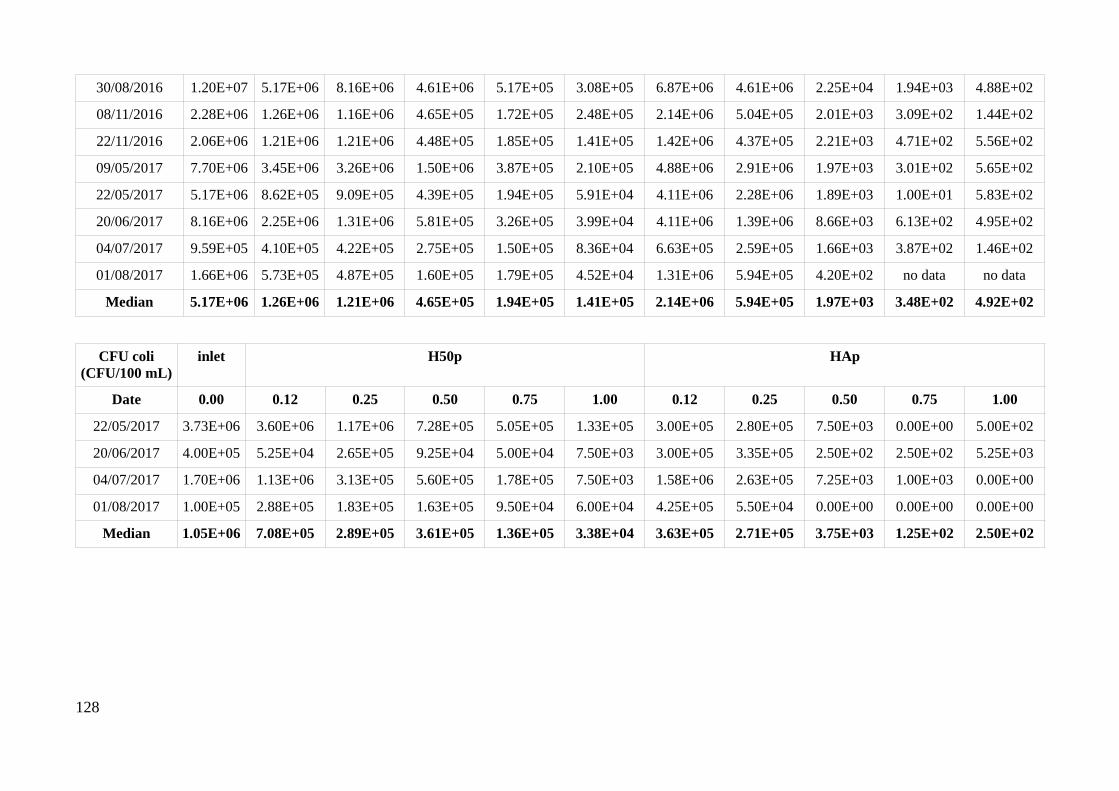
30/08/2016 1.20E+07 5.17E+06 8.16E+06 4.61E+06 5.17E+05 3.08E+05 6.87E+06 4.61E+06 2.25E+04 1.94E+03 4.88E+02
08/11/2016 2.28E+06 1.26E+06 1.16E+06 4.65E+05 1.72E+05 2.48E+05 2.14E+06 5.04E+05 2.01E+03 3.09E+02 1.44E+02
22/11/2016 2.06E+06 1.21E+06 1.21E+06 4.48E+05 1.85E+05 1.41E+05 1.42E+06 4.37E+05 2.21E+03 4.71E+02 5.56E+02
09/05/2017 7.70E+06 3.45E+06 3.26E+06 1.50E+06 3.87E+05 2.10E+05 4.88E+06 2.91E+06 1.97E+03 3.01E+02 5.65E+02
22/05/2017 5.17E+06 8.62E+05 9.09E+05 4.39E+05 1.94E+05 5.91E+04 4.11E+06 2.28E+06 1.89E+03 1.00E+01 5.83E+02
20/06/2017 8.16E+06 2.25E+06 1.31E+06 5.81E+05 3.26E+05 3.99E+04 4.11E+06 1.39E+06 8.66E+03 6.13E+02 4.95E+02
04/07/2017 9.59E+05 4.10E+05 4.22E+05 2.75E+05 1.50E+05 8.36E+04 6.63E+05 2.59E+05 1.66E+03 3.87E+02 1.46E+02
01/08/2017 1.66E+06 5.73E+05 4.87E+05 1.60E+05 1.79E+05 4.52E+04 1.31E+06 5.94E+05 4.20E+02 no data no data
Median 5.17E+06 1.26E+06 1.21E+06 4.65E+05 1.94E+05 1.41E+05 2.14E+06 5.94E+05 1.97E+03 3.48E+02 4.92E+02
CFU coli(CFU/100 mL)
inlet H50p HAp
Date 0.00 0.12 0.25 0.50 0.75 1.00 0.12 0.25 0.50 0.75 1.00
22/05/2017 3.73E+06 3.60E+06 1.17E+06 7.28E+05 5.05E+05 1.33E+05 3.00E+05 2.80E+05 7.50E+03 0.00E+00 5.00E+02
20/06/2017 4.00E+05 5.25E+04 2.65E+05 9.25E+04 5.00E+04 7.50E+03 3.00E+05 3.35E+05 2.50E+02 2.50E+02 5.25E+03
04/07/2017 1.70E+06 1.13E+06 3.13E+05 5.60E+05 1.78E+05 7.50E+03 1.58E+06 2.63E+05 7.25E+03 1.00E+03 0.00E+00
01/08/2017 1.00E+05 2.88E+05 1.83E+05 1.63E+05 9.50E+04 6.00E+04 4.25E+05 5.50E+04 0.00E+00 0.00E+00 0.00E+00
Median 1.05E+06 7.08E+05 2.89E+05 3.61E+05 1.36E+05 3.38E+04 3.63E+05 2.71E+05 3.75E+03 1.25E+02 2.50E+02
128

Appendix C: Cassettes sequences
Cassette A:
>MH_SMX_108GTtanGgagCagCACGATGTTACGCAGCAGGgCagTCGCCCTAAAACAAAGTTAGATGCACTAAGCACATAATTGCTCACaGCCAAACTATCAGGTCAAGT
Cassette B:
>S11CGCGTCATATGTGCTTAGTGCATCTACGCTTGAGTTAAGCCGCGCCGCGAAGCGGCGTCGGCTTGAACGAATTGTTAGACATTATTTGCCGACTACCTTGGTGATCTCGCCTTTCACGTAGTGGACAAATTCTTCCAACTGATCTGCGCGCGAGGCCAAGCGATCTTCTTCTTGTCCAAGATAAGCCTGTCTAGCTTCAAGTATGACGGGCTGATACTGGGCCGGCAGGCGCTCCATTGCCCAGTCGGCAGCGACATCCTTCGGCGCGATTTTGCCGGTTACTGCGCTGTACCAAATGCGGGACAACGTAAGCACTACATTTCGCTCATCGCCAGCCCAGTCGGGCGGCGAGTTCCATAGCGTTAAGGTTTCATTTAGCGCCTCAAATAGATCCTGTTCAGGAACCGGATCAAAGAGTTCCTCCGCCGCTGGACCTACCAAGGCAACGCTATGTTCTCTTGCTTTTGTCAGCAAGATAGCCAGATCAATGTCGATCGTGGCTGGCTCGAAGATACCTGCAAGAATGTCATTGCGCTGCCATTCTCCAAATTGCAGTTCGCGCTTAGCTGGATAACGCCACGGAATGATGTCGTCGTGCACAACAATGGTGACTTCTACAGCGCGGAGAATCTCGCTCTCTCCAGGGGAAGCCGAAGTTTCCAAAAGGTCGTTGATCAAAGCTCGCCGCGTTGTTTCATCAAGCCTTACGGTCACCGTAACCAGCAAATCAATATCACTGTGTGGCTTCAGGCCGCCATCCACTGCGGAGCCGTACAAATGTACGGCCAGCAACGTCGGTTCGAGATGGCGCTCGATGACGCCAACTACCTCTGATAGTTGAGTCGATACTTCGGCGATCACCGCTTCCCTCATGATGTTTAACTTTGTTTTAGGGCGACTGCCCTGCTGCGTAACATCGTTGCTGCTCCATAACATCAAACATCGACCCACGGCGTACGCTGGCCCCTGGCGGGAACACAAACAAAAAAAAGGCGGGGGCTTGTTG
Cassette C:
>S21
GGAGAGCTTGTTTCTTAAGAAACCTTTGGACTCTTTCAAAAGGCGGGTGAACCCTCTCTTGGCAATTTGTTTTGGATAGGCTTGGGAGCATATGTTTCCCCGGCATAAAAATTGGAGCCGGCCCCTTAATAGGTATTCCTCTGTTGGTAACAAAAGATGTAACCCTTATCCCTTCATCGGGGAAATCCCGCAAAGCAAATTAAGAAGCGTTTCTCCGATGAGGAAATCTCATTGCTCATGGAGATGGAGTGGTGGAACTGGCCACTAGATAAAATTAAGACAGCAATGCCTCTGCTGTGCTCGTCAAATATTTTTGGTCTGCATAAGTATTGGCGCGAGTTTGCCGTCTAACAATTCATTCAAGCCGACGCCGCTTCGCGGCACGGCTTAATTCTGGAGTTAAACATCATGAGGGAAGCGGTGATCGCCGAAGTATCGACTCAACTATCAGAGGTAGTTGGCGTCATCGAGCGCCATCTCGAACCGACGTTGCTGGCCGTACATTTGTACGGCTCCGCAGTGGATGGCGGCCTGAAGCCACACAGTGATATTGATTTGCTGGTTACGGTGACCGTAAGGCTTGATGAAACAACGCGGCGAGCTTTGATCAACGACCTTTTGGAAACTTCGGCTTCCCCTGGAGAGAGCGAGATTCTCCGCGCTGTAGAAGTCACCATTGTTGTGCACGACGACATCATTCCGTGGCGTTATCCAGCTAAGCGCGAACTGCAATTTGGAGAATGGCAGCGCAATGACATTCTTGCAGGTATCTTCGAGCCAGCCACGATCGACATTGATCTGGCTATCTTGCTGACAAAAGCAAGAGAACATAGCGTTGCCTTGGTAGGTCCAGCGGCGGAGGAACTCTTTGATCCGGTTCCTGAACAGGATCTATTTGAGGCGCTAAATGAAACCTTAACGCTATGGAACTCGCCGCCCGACTGGGCTGGCGATGAGCGAAATGTAGTGCTTACGTTGTCCCGCATTTGGTACAGCGCAGTAACCGGCAAAATCGCGCCGAAGGATGTCGCTGCCGACTGGGCAATGGAGCGCCTGCCGGCCCAGTATCAGCCCGTCATACTTGAAGCTAGACAGGCTTATCTTGGACAAGAAGAAGATCGCTTGGCCTCCCGCGCAGATCAGTTGGAAGAATTTGTTCACTACGTGAAAGGCGAGATCACCAAGGTAGTCGGCAAATAATGTCTAACAATTCGTTCAAGCCGACGCCGCTTCGCGGCGCGGCTTAACTCAAGCGTTAGATGCACTAAGCACATATGACCCC
129
Cassette D:
>MH SMX 124 (2273 bp)
CAGTTTGATGTTATGGAGCAGCAACGATGTTACGCAGCAGGGCAGTCGCCCTAAAACAAAGTTAACCTCTGAGGAAGAATTGTGAAACTATCACTAATGGTAGCTATATCGAAGAATGGAGTTATCGGGAATGGCCCTGATATTCCATGGAGTGCCAAAGGTGAACAGCTCCTGTTTAAAGCTATTACCTATAACCAATGGCTGTTGGTTGGACGCAAGACTTTTGAATCAATGGGAGCATTACCCAACCGAAAGTATGCGGTCGTAACACGTTCAAGTTTTACATCTGACAATGAGAACGTATTGATCTTTCCATCAATTAAAGATGCTTTAACCAACCTAAAGAAAATAACGGATCATGTCATTGTTTCAGGTGGTGGGGAGATATACAAAAGCCTGATCGATCAAGTAGATACACTACATATATCTACAATAGACATCGAGCCGGAAGGTGATGTTTACTTTCCTGAAATCCCCAGCAATTTTAGGCCAGTTTTTACCCAAGACTTCGCCTCTAACATAAATTATAGTTACCAAATCTGGCAAAAGGGTTAACAAGTGGCAGCAACGGATTCGCAAACCTGTCACGCCTTTTGTGCCAAAAGCCGCGCCAGGTTTGCGATCCGCTGTGCCAGGCGTTAGACGGCAAAGTCACAGACCGCGGGATCTCTTATGACCAACTACTTTGATAGCCCCTTCAAAGGCAAGCTGCTTTCTGAGCAAGTGAAGAACCCCAATATCAAAGTTGGGCGGTACAGCTATTACTCTGGCTACTATCATGGGCACTCATTCGATGACTGCGCACGGTATCTGTTTCCGGACCGTGATGACGTTGATAAGTTGATCATCGGTAGTTTCTGCTCTATCGGGAGTGGGGCTTCCTTTATCATGGCTGGCAATCAGGGGCATCGGTACGACTGGGCATCATCTTTCCCGTTCTTTTATATGCAGGAAGAACCTGCATTCTCAAGCGCACTCGATGCCTTCCAGAGAGCAGGTAATACTGTCATTGGCAATGACGTTTGGATCGGCTCTGAGGCAATGGTCATGCCCGGAATCAAGATCGGGCACGGTGCGGTGATAGGCAGCCGCTCGTTGTGAACAAATGATGTGGAGCCTTACGCTATCGTTGGCGGCAATCCCGCTAAGAGAAGATTAAGAAACGCTTCACCGATGAGGAAATTTCATTGCTTCTGGAGATGGAGTGGTGGAATTGGTCACTGGAGAAGATCAAAGCGGCAATGCCCATGCTGTGCTCGTCTAATATTGTTGGCCTGCACAAGTATTGGCTCGAGTTTGCCGTCTAACAATTCAATCAAGCCGATGCCGCTTCGCGGCACGGCTTATTTCAGGCGTTAGGCATCATGGGTGAATTTTTCCCTGCACAAGTTTTCAAGCAGCTGTCCCACGCTCGCGCGGTGATCGAGCGCCATCTGGCTGCGACACTGGACACAATCCACCTGTTCGGATCTGCGATCGATGGAGGGCTGAAGCCGGACAGCGACATAGACTTGCTCGTGACCGTCAGCGCCGCACCTAACGATTCGCTCCGGCAGGCGCTAATGCTCGATTTGCTGAAAGTCTCATCACCGCCAGGCGATGGCGGAACATGGCGACCGCTGGAGCTAACTGTTGTCGCTCGAAGCGAAGTAGTGCCTTGGCGCTATCCGGCGCGGCGTGAGCTTCAGTTCGGTGAGTGGCTCCGCCACGACATCCTTTCCGGAACGTTCGAGCCTGCCGTTCTGGATCACGATCTTGCGATTTTGCTGACCAAGGCGAGGCAACACAGCCTTGCGCTTCTAGGCCCATCCGCAGCCACGTTTTTCGAGCCGGTGCCGAAGGAGCATTTCTCCAAGGCGCTTTTCGACACTATTGCCCAGTGGAATGCAGAGTCGGATTGGAAGGGTGACGAGCGGAACGTCGTTCTTGCTCTTGCTCGCATTTGGTACAGCGCTTCAACTGGTCTCATTGCTCCTAAGGACGTTGCTGCCGCATGGGTATCGGAGCGTTTGCCTGCCGAGCATCGGCCCCTCATCTGCAAGGCACGCGCGGCGTACCTGGGTAGCGAGGACGACGACCTAGCAATGCGCGTCGAAGAGACGGCCGCGTTCGTTCGATATGCCAAAGCAACGATTGAGAGAATCTTGCGTTGAGCGGCATGTGCGAAAAGTGCATCGACCCGCGCCGAGGGCATCTGATGCCTAACTCGGCGTTCAAGCGGACGGGCTGCGCCCGCCGCTCAATTATGCGTTAGATGCACTAAGCACAATTCC
Cassette E:
AGTTTGATGTTATGGAGCAGCAACGATGTTACGCAGCAGGGCAGTCGCCCTAAAACAAAGTTAGGACGACGCCTTCGGCGCGTTGAAGAAAATTGTATTTGTATGTATATAAGTTTAAAAAATATGGTTATTTATCAGTTTCTATATTATAGGAGCAGGTGTGTCCAGAAAAAGAAAATTTGACGTTTTATTAATATGTGGTGCAAGCGGAACTGGTAAATCAAATATTGCTTATCAGCTTGGTAAATATTATAAAATGAACATAGTTCAGGTTGATGATTTTCAATGTATTATCGAAAGTGCTACAAAAGAAATTGATTATCCAGTATTTCATTATTGGAACGAACATTTTGAAGAAGCTATTCAGCAACCAATAAATAAAAAACTTGAAATAATGATTTCATATGCAAACACATTAGCTCAATTTTTAGAGATTGTTATTTTTAATCATCTTGAAGAAAACAGACCAATGATAATTGAAGGTGATTTCATTTCACCAGATCTCTGTCATAAGCTACAGAATAATCCAGAAATTAGAAAGAGAATAAAATGTATATTAATTACTGAAGATTCAAAAGAACAGATTATTAAGAACTATCAGCAAAGAGAAGGATCAATACAAGAAGATCGTGCTGAATTGAGTAGCAAATACAACAG
130

CTGGTTATATAATGAGGCGTTAAAATACGGAATAAAAAACGAACCGTCAAGACCATGGAAAAGCTTAAGACAAAGAATAGTAAAAAGAATTGAAGAATAATATTAAAAGAAAATTTTCCTAACAACGGTTTCAACCTGACTTATTTGCTTGTCACGGATTTTTGCACTTCGCTACGCTTGGCAAAGACCGCGCCAAACAAAACGCAGGTTAAACCAATGTTATGCTCTGTGAGCCTGGTTATTGGCGAAGCGAAAGTATGACGATTTCAGCAATAAACGCAAAAGGATAAAAAAATGACATGGAGAACGACCAGAACACTTTTACAGCCTCAGAAGCTGGAGTTCAATGAGTTTGAGATTCTTAATCCCGTAGTTGAGGGCGCCCGAATTGTCGGCATTGGCGAGGGTGCTCACTTTGTCGCGGAGTTCTCCTGGCTAGAGCTAGTCTTATTCGCTATTTTGTCGAG()GCGTCGCTTGCCTCCAGTCCTGAAAAATCACGTCAACAGCGATTTTTTCCGAAAAGCCTCTGATCGAATAGAGTCGATAGAGTATACGTTGGAAACCTTGCGTGTAATGAAAGCTTTCTTCGATGGTACCTCTCTTGAGGGAGATACTTCCGTACGTGACTCGTATATGGCGGGCGTGGTGGATGGAATGGTTCGAGCGAATCCGGATGTAAGGATAATTCTGCTGGCGCACAACAATCATCTACAAAAAACTCCAGTTTCCTTTTCAGGCGAGCTTACGGCTGTTCCCATGGGACAGCATCTCGCAGAGAGGGAGGAGGGGGATTACCGTGCGATTGCATTCACCCATCTTGGACTCACCGTGCCGGAAATGCATTTCCCATCGCCCGACAGTCCTCTTGGATTCTCTGTTGTGACCACGCCTGCCGATGCAATCCGTGAGGATAGTGTGGAACAGTATGTCATCGATGCCTGTGGTAAGGAGGATTCATGCCTGACATTGACAGATGACCCCATGGAAGCAAAGCGAATGCGGTCCCAAAGCGCCTCTGTAGAAACGAATTTGAGCGAGGCATTTGATGCCATCGTCTGCGTTCCCAGCGCCGGCAAGGACAGCCTGGTTGCCCTATAGGAAACCAGAAATGAAATGAAGGAGCATAACCTGCCAATCCACCGGACGGTTTTCAACCGCCGGTGATCAGCGCGTTAGTACCACTGAAACCCTCCTTTATTTCGCCCATGTTTATTCAAACGGCATTCAGTTTCTCAAACGCTGTGCAGCGCTGGGTTTGCCGTTTCTCTGGGCTTCGCCTGGTGGCGTTACGCTGGTTTGTGGTCTTTTTGGCCTCTGGCCCTTGTGTAGCAAGCGCGAGCAGCTATTTTTTTCGTAGTGCTGTGCCGCCTCGGTGGCACCGTGCCTTTTCGCAGTTAGCGCCCGTCGCCAAGTTACGGTTATCCGTTTTGGCTTCTGGCTCTAACATTTCGGTCAAGCCGACCCGCATTCTGCGGTCGGCTTACCTCGCCCGTTAGATGCACTAAGCAACATATTA
131
Curriculum vitae
Oral presentations
C. Knecht, M. Krüger, H. Dambeck, J. Nickolaus, A. Ahmed, S. Kellmann, I. Mäusezahl, M.
Möder, M. Kästner, O. O. Adelowo, J. Nivala, J. A. Müller. Fate of antibiotic resistant bacteria in
two different constructed wetland types. VAAM Annual Meeting • 69th Annual Meeting of the
DGHM Wurzburg, Germany from March the 5th to 8th, 2017.
Poster presentations
Knecht C., Dambeck, H., Krüger, M., Nikolaus, J., Ahmed, A., Kellman, S., Mäusezahl, I., Kästner,
M., Adelowo, O.O., Nivala, J., Müller, J. A. Fate of antibiotic resistant bacteria in two different
constructed wetland types. VAAM Annual Meeting, Jena, Germany from March the 13 th to 16th,
2016.
C. Knecht, M. Krüger, A. Buchholz, H. Dambeck, J. Nickolaus, A. Ahmed, S., Kellmann, I.
Mäusezahl, M. Möder, M. Kästner, O. O. Adelowo, J.Nivala, J. A. Müller. Fate of antibiotic
resistant bacteria in two different constructed wetland types, 17th International Symposium on
Microbial Ecology, Leipzig, Germany from August the 12th to 17th , 2018.
Camila Knecht, Heinz Köser, Jochen A. Müller. Bioremediation von Antibiotika-resistenten
Bakterien und Antibiotika-Resistenzgenen in Pflanzenkläranlagen, Spurenstoffe und
Krankheitserreger im Wasserkreislauf, Frankfurt, Deutschland, von dem 23. zu dem 24. Oktober,
2018.
Camila Knecht, Markus Krüger, Arif Ahmed, Simon Kellmann, Ines Mäusezahl, Monika Möder,
Heinz Köser, Olawale. O. Adelowo, Jaime Nivala, Jochen A. Müller. Enhanced horizontal transfer
of antibiotic resistance genes in an aerated constructed wetland. 8th International Symposium on
Wetland Pollutant Dynamics, Aarhus, Denmark from June the 17th to 21st , 2018.
Distinctions
17th International Symposium on Microbial Ecology, Poster award.
Scholarship from the Heinrich Böll Foundation (2015-2018)
132

Published manuscripts
Camila Knecht, Cecilia L. Balaban, Joaquín V. Rodríguez, Eduardo A. Ceccarelli, Edgardo E.
Guibert, Germán L. Rosano (2018). Proteome variation of the rat liver after simple cold storage
assayed in an ex vivo model, Cryobiology 85, 47-55.
Adelowo, O.O., Helbig, T., Knecht, C., Reincke, F., Mäusezahl, I., MüllerI, J. A. D(2018). High
abundances of class 1 integrase and sulfonamide resistance genes, and characterisation of class 1
integron gene cassettes in four urban wetlands in Nigeria. PLoS ONE 13.
Manuscript in preparation
Camila Knecht, Markus Krüger, Simon Kellmann, Arif Ahmed, Ines Mäusezahl, Monika Möder,
Olawale O. Adelowo, Heinz Köser, Jaime Nivala, Jochen A. Müller. Oxidative stress enhances
horizontal transfer of antibiotic resistance genes during wastewater treatment.
Personal information
Name: Camila Ayelén Knecht
Address: Ludwigstraße 101, 04315 Leipzig
E-mail addresses: [email protected], [email protected]
Nationality: Argentinian
Education
10/2015 - today PhD at the Otto-von-Guericke University, Magdeburg, Germany. Faculty of Process & Systems Engineering Field: Waste water treatment
10/2015 – today Member of the Helmholtz Interdisciplinary GRADuate School for Environmental Research (HIGRADE)
03/2006 - 06/2014 Master in biotechnology at the National University of Rosario, Argentina
Faculty of Biochemical and Pharmaceutical sciences.
Master thesis: “Proteomic analysis of livers subjected to injuries due to
hypoxia/reperfusion.”
133

Languages
Spanish Mother tongue
English Level B2, First certificate in English, December 2005.
German Level B2, Goethe-Zertifikat, January 2015.
134