IJOMA GN - Antibiotic Resistance in coliforms (VUT)
139
ANTIBIOTIC RESISTANCE OF COLIFORM BACTERIA IN THE RIETSPRUIT RIVER GRACE NKECHINYERE IJOMA 207053456 Dissertation submitted in fulfilment of the requirements for the degree of Magister Technologiae: Biotechnology Department of Biosciences Faculty of Applied and Computer Sciences Vaal University of Technology Vanderbijlpark Supervisor: Mrs. CS van Wyk Co-Supervisor: Dr. HA Esterhuysen September 2010
Transcript of IJOMA GN - Antibiotic Resistance in coliforms (VUT)
ANTIBIOTIC RESISTANCE OF COLIFORM BACTERIA IN
THE RIETSPRUIT RIVER
GRACE NKECHINYERE IJOMA
207053456
Dissertation submitted in fulfilment of the requirements for the degree of
Magister Technologiae: Biotechnology
Department of Biosciences
Faculty of Applied and Computer Sciences
Vaal University of Technology
Vanderbijlpark
Supervisor: Mrs. CS van Wyk
Co-Supervisor: Dr. HA Esterhuysen
September 2010
ii
DECLARATION
I declare that this dissertation is my own work. It is submitted for the degree of Magister
Technologiae Biotechnology, in the Department of Biosciences at the Vaal University of
Technology, Vanderbijlpark. It has not been submitted before for any degree and is not being
concurrently submitted in candidature for any degree.
Ijoma Grace Nkechinyere
September 2010

iii
DEDICATION
To the memory of my father
Isaac Chijioke Ijomah
1943 - 2003
iv
ACKNOWLEDGEMENTS
I am greatly indebted to my supervisor, Mrs C. S. Van Wyk, the Principal Lecturer in
Biotechnology in the Department of Biosciences, Vaal University of Technology for her
encouragement and guidance during the course of this research.
My sincere thanks also go to:
Mr. George Dewing, the Plant Manager, Emfuleni, Waste Water Works, Sebokeng for your kind
assistance during sample collection;
Mrs. Laurette D. Marais, Biotechnology Research Laboratory, Vaal University of Technology
for your assistance during sample collection and laboratory analyses;
Victor, my first son and my partner Wale Adeyanju for their unflinching support during the
course of this research; and
To Sami, my son and Samira Ollanma, my daughter and little princess who was born during the
course of this research, I acknowledge the many weekends you had to spend alone without me.
Thank you.
v
TABLE OF CONTENTS
Declaration ii
Dedication iii
Acknowledgements iv
Table of contents v
List of tables viii
Abstract ix
Chapter 1 Introduction 1
Chapter 2 Literature Review 4
2.1 Introduction to Literature Review 4
2.2 Characteristics that qualify antibiotics as chemotherapeutic agents 4
2.3 Bacterial susceptibility to antibiotics 5
2.4 Antibiotics and their mode of action 5
2.4.1 Inhibition of cell wall synthesis 8
2.4.2 Damage to the cytoplasmic membrane 8
2.4.3 Inhibition of protein synthesis 9
2.4.4 Inhibition of nucleic acid synthesis 10
2.4.5 Inhibition of specific enzyme systems in metabolic pathways 10
2.5 Uses of antibiotics 11
2.5.1 Chemotherapeutic uses 11
2.5.2 Clinical uses as research tool 12
2.5.3 Veterinary uses 12
2.5.4 Food preservative uses 13
2.6 Adverse reactions to antibiotic use 14
2.7 Bacterial resistance to antibiotics 14
vi
2.7.1 Introduction to Bacterial resistance to antibiotics 14
2.7.2 Causes of antibiotic resistance 15
2.8 Genetic basis for antibiotic resistance 17
2.8.1 Organisms which are innately resistant to certain antibiotics 17
2.8.2 Organisms that acquire antibiotic resistance 17
2.8.3 Acquisition of antibiotic resistance through spontaneous mutation 19
2.8.4 Acquisition of antibiotic resistance through DNA transfer 20
2.9 Unprecedented trends that led to an increase in antibiotic resistance 22
2.10 Epidemiology of antibiotic resistance 24
2.11 Factors that encourage the spread of antibiotic resistance 27
2.12 Microbiology of water 29
2.12.1 Introduction to Microbiology of water 29
2.12.2 Indicators of water pollution and presence of water-borne infection 30
2.12.3 Water-borne diseases and the source of antibiotic resistant bacteria in
water 31
2.12.4 Brief overview of some clinically significant isolates identified using the
API 20E tests in this study 33
2.13 Purpose and aims of Study 43
Chapter 3 Materials and methods 44
3.1 Introduction to Materials and Methods 44
3.2 Study area 44
3.3 Sampling 45
3.4 Processing of water samples 45
3.4.1 Chemical Oxygen Demand (COD) 45
3.4.2 Biological Oxygen Demand (BOD) 46
vii
3.4.3 Tests for the presence of coliform bacteria 48
3.4.4 Preliminary identification of isolated bacteria 48
3.5 Antibiotic susceptibility test 48
3.6 Identification of organisms using the API 20E System 50
Chapter 4 Results 55
4.1 Introduction to Results 55
4.2 On-site analysis of water samples 55
4.3 Multiple antibiotic resistances 56
4.4 Antibiotic resistance patterns 64
4.5 API 20E tests 67
Chapter 5 Discussion 72
5.1 Introduction to Discussion 72
5.2 Discussion 73
5.4 Conclusion 78
Bibliography 76
Appendices 90

viii
List of tables
Table 2.1 Classes of Antibiotics based on chemical structure
Table 2.2 Properties of selected Antibiotics
Table 3.1 COD measuring range and corresponding sample volume for BOD5 testing.
Table 3.2 Antibiotics used in this study
Table 3.3 API 20E tests with their corresponding numerical value
Table 3.4 Chemical / Physical Principles – Basis for the API 20E System
Table 4.1a On-site examination of water samples
Table 4.1b COD and BOD values of water samples
Table 4.2 Number of Resistant Isolates at each Sample Point for each Date Collected
Table 4.3a Total Number of Resistant Isolates at each Sample Point
Table 4.3b Number of Isolates Resistant to Each Antibiotic
Table 4.4 Ranking of Antibiotics according to the number of resistant isolates
Table 4.5 Sample Site Multiple Antibiotic Resistance (MAR) Index
Table 4.6 Antibiotics to which all isolates at specific months were resistant per sample point
Table 4.7a Most Prevalent Antibiotic Resistance Patterns and notations
Table 4.7b The Most Prevalent Patterns (with notations) at Each Sample Point
Table 4.8a The Percentages of Individual Isolates in the Total number of Coliforms tested using the
API 20E and its occurrence in sample sites
Table 4.8b Isolates identified with the most prevalent patterns at each sample point
ix
ABSTRACT
Water samples were collected from the Rietspruit River during the course of three seasons and
investigated for the presence of antibiotic and multiple antibiotic resistant coliforms. Three
different sampling points were identified; the upstream, final effluent and downstream sampling
points. Both the upstream and downstream routes pass through urban, rural and industrial areas
as well as a variety of informal settlements; whilst the final effluent sampling point is located
within the premises of the Sebokeng Waste Water Works, where treatment is carried out on
water from the upstream before it is released downstream. Samples were taken in the months of
February, June and September. Coliforms were isolated from all sample points and their
multiple-antibiotic resistance (MAR) profiles were determined against seven different
antibiotics. Isolates showed a 100% resistance to Ampicillin with the least resistance shown
towards Streptomycin (4.8%). The highest MAR index (0.8) was shown in September at the
final Effluent site. The area MAR index for different months varied from 0.01 – 0.03 with the
final Effluent showing the lowest index. A total of 6 different patterns were identified as the
most prevalent; with the highest frequency occurring in multiple resistances to 5 different
antibiotics (Cephalothin, Cotrimoxazole, Colistin sulphate, Ampicillin, and Tetracycline). The
most prevalent resistance patterns at each sample point revealed no specific or common trend in
all 3 sample points over the 3 months period of sample collection; although isolates from the
same sample point tended to show resistance and susceptibilities to the same antibiotics but
varied in some cases with other sample points. Isolates were identified using the API 20E tests.
The API 20E tests revealed a variety of faecal and non-faecal coliforms present in the water
samples. There was not a particular growth pattern observed in all the seasons. A total of 17
different coliforms were identified using the API 20E test kits. Higher numbers of Klebsiella spp.
and Serratia spp, (both at 20.6%) were isolated. Isolates tended to share common resistance
patterns with other coliforms found at a particular sampling point or in some cases during a
particular season, in other cases increasing the number of antibiotics to which they were initially
resistant, making the transfer of antibiotic resistance a possibility. The absence of significant
differences in the presence of coliforms and patterns of multiple antibiotic resistances between
the upstream and downstream is indicative that treatment in the final effluent did not impact the
water quality and this may be attributed to the constant introduction of faecal matter into the
water body mostly from the informal settlements along its route.
1
CHAPTER 1
INTRODUCTION
Antibiotics have been a formidable force in the physician‟s arsenal in the battle against
bacterial pathogens, the discovery of antibiotics arguably being the greatest single
achievement in medicine in the 20th century in terms of human and animal lives saved
(Shoemaker, Vlamakis, Hayes & Salyers 2001: 561). In 1929, British bacteriologist
Alexander Fleming (1881–1955) discovered the bacteria-killing property of penicillin; this
triggered an era of discoveries of antimicrobials with chemotherapeutic properties. Fleming
noticed that a mould that had accidentally fallen into a bacterial culture of Staphylococcus
aureus in his laboratory had killed the bacteria. Having identified the mould as the fungus
Penicillium notatum, Fleming made a juice with it that he named penicillin. After giving it to
laboratory mice, he discovered that it killed bacteria in the mice without harming healthy
body cells. Although Fleming had made an incredible discovery, he was unable to produce
penicillin in a form useful to doctors (Pelczar, Chan & Krieg 1986: 513).
In the early 1940s, spurred partially by the need for antimicrobial agents in World War II,
penicillin was isolated, purified and injected into experimental animals, where it was found
not only to cure infections, but also to possess low toxicity towards animals (Harrison & Svec
1998; Purdom 2007: 1). The subsequent discoveries, development and clinical use of other
antibiotics that followed this major event, resulted in the effective treatment of infection
caused by major bacterial pathogens to the extent that many experts considered bacterial
infectious diseases to be under complete therapeutic control (Harrison & Svec 1998: 151).
Antibiotics are a special kind of chemotherapeutic agent obtained from living organisms.
Serrano (2005: 3) defines “antibiotics” as drugs of natural or synthetic origin that have the
capacity to kill or to inhibit the growth of micro-organisms. The word „antibiotic‟ refers to a
metabolic product of one microorganism that in very small amounts are detrimental or
inhibitory to other microorganisms (Pelczar et al. 1986: 513). This effect or antagonism as it
had been described has been known for many years. Vuillemin in 1889 was the first to define
the term „antibiosis‟ as the condition in which “one creature destroys the life of another in
order to sustain his own, the first being entirely active and the second entirely passive; one is
in unrestricted opposition to the life of the other” (Waksman 1947: 565). However, Waksman
in 1945 proposed the present day use of the term antibiotics as applying to those chemical
2
substances of microbial origin which in small amounts exert antimicrobial activity (Pelczar et
al. 1986: 514).
With the development and widespread application of antibiotics and vaccines, and through
improvements in urban sanitation and water quality, death from infectious diseases has
reduced dramatically. Progress was so great that, three decades ago, some experts predicted
the end of infectious diseases (WHO 2002: 1; Serrano 2005: 1). This optimism was
premature; the effectiveness of these so-called miracle drugs has waned in recent years. There
is a global resurgence of infectious diseases, with both newly identified infectious agents and
a re-emergence of older infectious diseases associated with the rapid spread of antimicrobial
resistance. Some of the very bacteria that these antibiotics are meant to control have been
mutating into new forms that don‟t respond to treatment. Many medical experts blame this
phenomenon on both the misuse and overuse of antibiotics in recent years in both human
medicine and in agriculture; other medical experts believe the increased prevalence of
antibiotic resistance is an outcome of evolution (Sircus 2008: 1). Whichever way we look at it
one fact prevails: the gains realized by the discovery of antibiotics are now being seriously
jeopardized by this phenomenon (WHO 2002: 1).
The emergence and spread of microbes that are resistant to cheap and effective first-choice,
or "first-line" drugs create severe consequences as infections caused by resistant microbes fail
to respond to treatment, resulting in prolonged illness and greater risk of death. Treatment
failures also lead to longer periods of infectivity, which increases the numbers of infected
people moving in the community and thus exposes the general population to the risk of
contracting a resistant strain of infection. When infections become resistant to first-line
antimicrobials, treatment has to be switched to second- or third-line drugs, which are nearly
always much more expensive and sometimes more toxic as well (WHO 2002: 1).
According to WHO Factsheet No. 194 released in 2002; the high cost of such replacement
drugs is prohibitive, with the result that some diseases can no longer be treated in areas where
resistance to first-line drugs is widespread in many countries. Most alarming of all are
diseases where resistance is developing for virtually all currently available drugs, thus raising
the spectre of a post-antibiotic era. Even if the pharmaceutical industry were to step up efforts
to develop new replacement drugs immediately, current trends suggest that some diseases
will have no effective therapies within the next ten years.
3
The Rietspruit River is a major source of water supply for the entire population of Southern
Gauteng; as a result periodic research into any form of contamination is of utmost
importance. The present study will be devoted to the collection of water samples from 3
major sampling points in Rietspruit River during 3 different seasons in 2009 (February, June
and September). The physico–chemical properties of this water, especially the presence and
identification (using both biochemical properties and DNA analysis) of antibiotic resistant
coliforms, that may be present in the water samples, will be investigated.

4
CHAPTER 2
LITERATURE REVIEW
2.1 Introduction to Literature Review
Certain organisms, in a bid for survival, produce metabolites that inhibit or destroy other
organisms present in their vicinity. The production of these metabolites does not take place in
the primary pathways in which these organisms synthesize and utilize essential chemical
compounds necessary for their survival (Mann 1978: 3 - 15). However in an environment
depleted of essential nutrients, organisms enter the stationary phase of growth (a state where
there is no net increase or decrease in cell numbers). It is at this stage that secondary
metabolites are produced and these include antibiotics (Rose 1979: 8). The production of
antibiotics by microorganisms in their natural environment confers an advantage to the
organism producing it in the perpetual war for survival (Rose 1979: 8).Antibiotics are
chemical compounds produced as secondary metabolites of microbial metabolism. Although
many antibiotics used today are produced by microorganisms, some are manufactured partly
or entirely by chemical synthesis. The term „antimicrobic‟ is often used to include agents
produced entirely by microorganisms, as well as commercial antibiotics that have been
chemically altered to improve potency or to increase the range of species they affect (Atlas
1997: 1181; Elliot, Hastings & Desselberger 1997: 332; Jacob 1999: 1).
2.2 Characteristics that qualify antibiotics as chemotherapeutic agents.
For antibiotics to be useful as chemotherapeutic agents, they must have the following
qualities:
1. They should have the ability to destroy or inhibit many different species of pathogenic
microorganisms; this means they should be broad-spectrum.
2. They should prevent the ready development of resistant forms of the microorganisms.
3. They should not produce undesirable side effects in the host, such as sensitivity or
allergic reaction, nerve damage, or irritation of the kidneys and gastrointestinal tract.
4. They should not eliminate the normal microbial flora of the host, because doing so
may upset the „balance of nature‟ and permit the normally non-pathogenic microbes,

5
or particularly pathogenic forms normally restrained by the usual flora, to establish a
new infection (Pelczar et al. 1986: 515).
2.3 Bacterial Susceptibility to Antibiotics.
Species and strains of species of microorganisms have varying degrees of susceptibility to
different antibiotics. Furthermore, the susceptibility of an organism to a given antibiotic may
change, especially during treatment. It is therefore important for the clinician to know the
identity of the organism and the specific antibiotic which may give the most satisfactory
results in treatment (Lancini, Parenti & Gallo 1995: 278; Lennette, Balows, Hausler, Truant
& Shadomy 1985: 451).
The susceptibility of a microorganism to antibiotics and other chemotherapeutic agents can
be determined by either the tube dilution or the paper-disk-plate technique. By the tube
dilution method, one can determine the “minimal inhibitory concentration” (MIC). The MIC
is the minimal concentration of antibiotic required to completely inhibit the growth of a given
bacterial strain (Lennette et al. 1985: 450 - 455; Pelczar et al. 1993: 897).
2.4 Antibiotics and their mode of action.
Antibiotics can be classified in several ways. For example, some are „bactericidal‟ and others
are „bacteriostatic‟. When an antibiotic is classified as bacteriostatic, it means it inhibits the
growth of bacteria without killing them. As a result bacteriostatic drugs rely on the normal
host defences to eliminate or kill the pathogen after growth has been inhibited. For example
de-sulpha drugs, which are frequently prescribed in the treatment of urinary tract infections,
simply inhibit the growth of the bacteria in the bladder until they are cleared by the normal
process of urination. On the other hand drugs that kill bacteria outright are bactericidal. These
drugs are particularly useful in situations where the host defences cannot be relied upon to
remove or destroy pathogens (Pelczar et al. 1986: 490; Nester, Roberts, Pearsall, Anderson &
Nester 1995: 450; Rafay & Nsanze 2003: 261).
The most common method classifies them according to their chemical structure, as antibiotics
sharing the same or similar chemical structure and these will generally show similar patterns
of antibacterial activity, effectiveness, toxicity and allergic potential. The usefulness of
antibiotics in medicine stems from the fact that their toxicity is often due to their ability to
6
interfere with essential biochemical structure or processes that are unique to prokaryotes; an
example is the synthesis of peptidoglycan. By interfering with a target that is unique to
prokaryotes, the antibiotics cause relatively little harm to the human host, in a phenomenon
called selective toxicity. That is, the drugs are toxic to the bacteria but not to the human host
(Nester et al. 1995: 448).
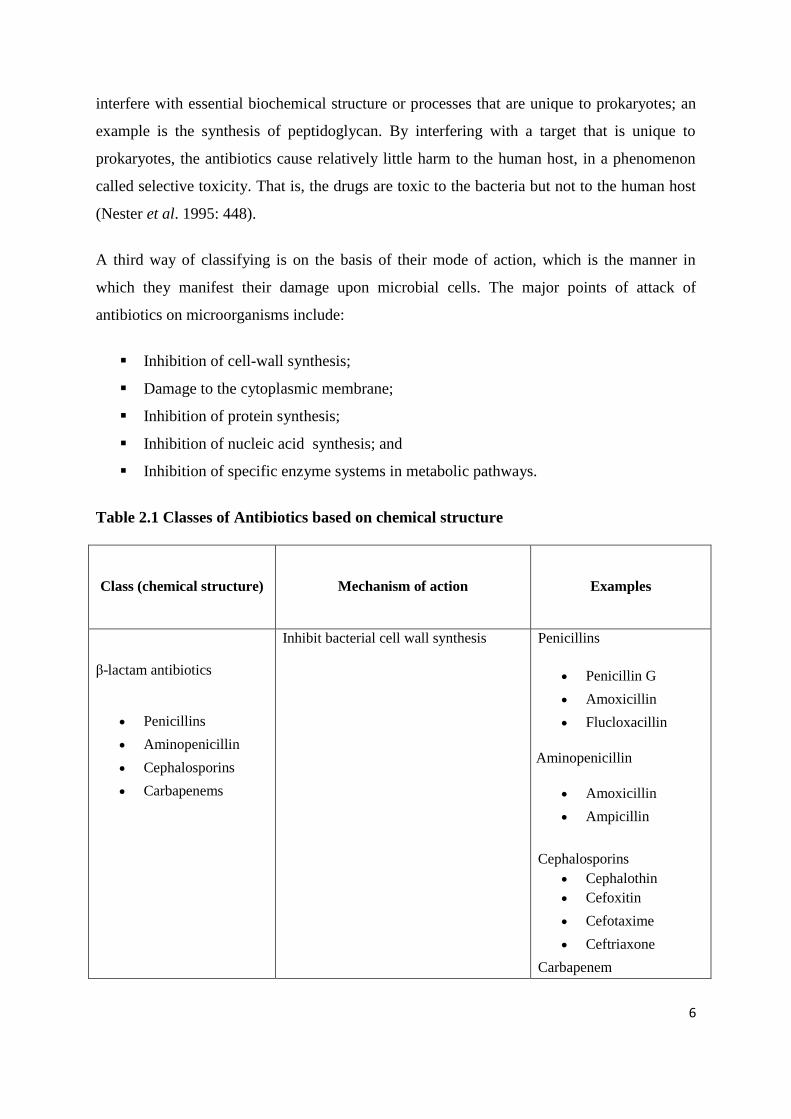
A third way of classifying is on the basis of their mode of action, which is the manner in
which they manifest their damage upon microbial cells. The major points of attack of
antibiotics on microorganisms include:
Inhibition of cell-wall synthesis;
Damage to the cytoplasmic membrane;
Inhibition of protein synthesis;
Inhibition of nucleic acid synthesis; and
Inhibition of specific enzyme systems in metabolic pathways.
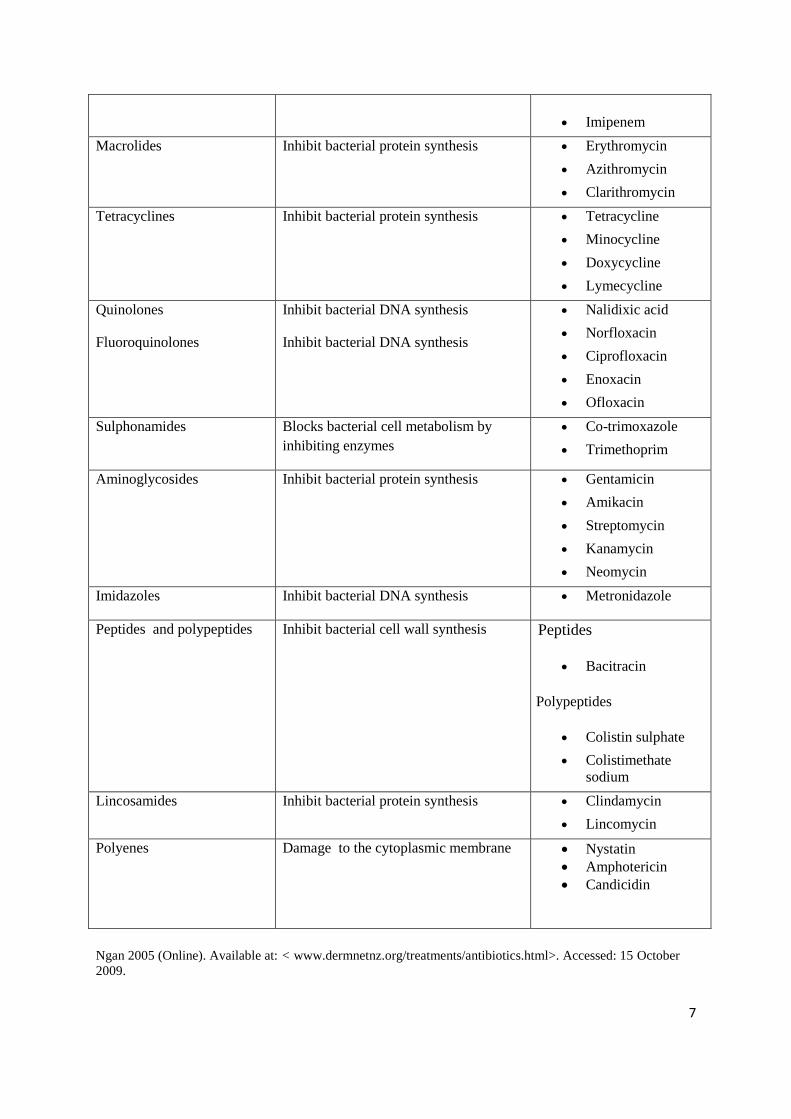
Table 2.1 Classes of Antibiotics based on chemical structure
Class (chemical structure) Mechanism of action Examples
β-lactam antibiotics
Penicillins
Aminopenicillin
Cephalosporins
Carbapenems
Inhibit bacterial cell wall synthesis Penicillins
Penicillin G
Amoxicillin
Flucloxacillin
Aminopenicillin
Amoxicillin
Ampicillin
Cephalosporins
Cephalothin
Cefoxitin
Cefotaxime
Ceftriaxone
Carbapenem
7
Imipenem
Macrolides Inhibit bacterial protein synthesis Erythromycin
Azithromycin
Clarithromycin
Tetracyclines Inhibit bacterial protein synthesis Tetracycline
Minocycline
Doxycycline
Lymecycline
Quinolones
Fluoroquinolones
Inhibit bacterial DNA synthesis
Inhibit bacterial DNA synthesis
Nalidixic acid
Norfloxacin
Ciprofloxacin
Enoxacin
Ofloxacin
Sulphonamides Blocks bacterial cell metabolism by
inhibiting enzymes
Co-trimoxazole
Trimethoprim
Aminoglycosides Inhibit bacterial protein synthesis Gentamicin
Amikacin
Streptomycin
Kanamycin
Neomycin
Imidazoles Inhibit bacterial DNA synthesis Metronidazole
Peptides and polypeptides Inhibit bacterial cell wall synthesis Peptides
Bacitracin
Polypeptides
Colistin sulphate
Colistimethate
sodium
Lincosamides Inhibit bacterial protein synthesis Clindamycin
Lincomycin
Polyenes Damage to the cytoplasmic membrane Nystatin
Amphotericin
Candicidin
Ngan 2005 (Online). Available at: < www.dermnetnz.org/treatments/antibiotics.html>. Accessed: 15 October
2009.

8
2.4.1 Inhibition of cell-wall synthesis.
The substance that gives rigidity to the cell-wall is the peptidoglycan. The structure of this
compound is essentially that of a series of strands (polymers with repeating units of N-
acetylglucosamine and N-acetylmuramic acid) that are cross-linked with small peptides
(peptide-bridge), with a frequency and in a manner that imparts considerable rigidity to the
cell wall. It is a protective covering for the bacterial cell (Ferris & Beveridge 1985: 175).
Penicillin, the first antibiotic discovered, interferes with the formation of the peptide bridge
by binding to proteins, called penicillin-binding proteins (PBP) that are involved in cell wall
biosynthesis. The resulting lack of cross-linking weakens the structural integrity of the cell
wall, ultimately leading to cell lysis (Donowitz & Mandell 1988: 318). Since peptidoglycan is
only synthesized in actively growing cells, penicillin is only effective against multiplying
bacteria. Other antibiotics such as Bacitracin and Vancomycin also interfere with
peptidoglycan synthesis, but their action is not restricted to the cell wall and, therefore, their
therapeutic index is low (Donowitz & Mandell 1988: 318).
2.4.2 Damage to the cytoplasmic membrane.
Several polypeptide antibiotics produced by Bacillus spp. have the ability to damage cell
membrane structure. They adversely affect the normal permeability characteristics of the cell
membrane; they include Polymyxins, Gramicidins and Tyrocidines (Franklin & Snow 1989:
121).
The Polymyxins are particularly effective against Gram-negative organisms while the
Tyrocidines and Gramicidines are more effective against Gram-positive organisms (Franklin
& Snow 1989: 119). These agents are bactericidal; they cause a leakage from the cytoplasmic
content of the cell. Unfortunately, these drugs also bind to eukaryotic cells, though to a lesser
extent. As a result they have limited application in chemotherapy (Elsbach 1990: 26).
Another category referred to as Polyene antibiotics are, for example, Nystatin, produced by
Streptomyces noursei and Amphotericin, produced by Streptomyces nodusus. Polyene
antibiotics act upon cells which have sterols in their cytoplasmic membrane. They act upon
fungi (including yeasts) and animal cells but do not affect bacteria. Their antimicrobial action
is attributed to their ability to increase cell permeability (Franklin & Snow 1989: 119).

9
2.4.3 Inhibition of protein synthesis.
Several groups of antibiotics including streptomycin, chloramphenicol and tetracycline exert
their effect on bacteria by interfering with steps of protein synthesis. Streptomycin is
produced by Streptomyces griseus; it is particularly useful because it inhibits many organisms
resistant to sulphonamides and penicillin. Streptomycin and other aminoglycoside antibiotics
inhibit protein synthesis by combining irreversibly with the 30S subunit of the 70S mRNA;
this interferes with the formation of initiation complexes, the first step in genetic code
translation, thus affecting the fidelity of translation into protein (Garrod, Lambert & O‟
Grady 1981: 120; Mims, Playfair, Roitt, Wakelin & William 1993: 22; Atlas 1997: 1183).
Aminoglycosides are used almost exclusively in the treatment of infections caused by Gram-
negative bacteria, but they are relatively ineffective against anaerobic bacteria, facultative
anaerobes and Gram-positive bacteria (Elliot et al. 1997: 332).
According to Elliot et al. (1997: 332), chloramphenicol binds the 50S subunit and interferes
with the linkage of amino acids in the peptide chain formation, or combines with the bacterial
ribosome to prevent the assembly of amino acids into a protein chain. Chloramphenicol is
active against many species of Gram-negative bacteria. Chloramphenicol is used for treating
typhoid fever and various infections caused by Salmonella.
Tetracyclines bind to the 30S subunit, preventing binding of the aminoacyl transfer RNA to
the acceptor site in the ribosome, thereby inhibiting amino acid chain elongation. At least two
processes appear to be required for these antibiotics to gain access to the ribosomes of Gram-
negative bacteria, namely (i) passive diffusion through the hydrophilic channels formed by
the porin proteins of the outer membrane and (ii) active transport by an energy-depending
system that pumps all tetracyclines through the inner cytoplasmic membrane (Mandell &
Petri 1996: 1062). Tetracyclines have a broad spectrum of activity against many Gram-
positive and some Gram-negative bacteria (Elliot et al. 1997: 332). Tetracyclines are also
useful against various bacterial infections, including Mycoplasma pneumoniae, causative
agent of brucellosis, tularemia and cholera.
Only a few antibiotics having this mode of action are selective enough in their toxicity to be
administered safely to patients, which is not surprising since protein synthesis is a feature of
all cells, not just those of pathogenic microorganisms. Fortunately, 80S eukaryotic ribosomes
10
are different enough in their structure to allow for the possibility of some selectivity in their
action. Even so, bacterial-type (70S) ribosomes are present in the mitochondria. This may
partially account for the side effects often observed in patients undergoing treatment with
antimicrobial agents that interfere with prokaryotic protein synthesis (Franklin & Snow 1989:
123).
2.4.4 Inhibition of nucleic acid synthesis.
Several enzymes involved in DNA replication and transcription in prokaryotes are
sufficiently different from eukaryotes to act as selective targets. Rifampin, for example binds
strongly to bacterial RNA polymerase and thereby inhibit mRNA synthesis (Hooper &
Wolfson 1991: 392). Rifampin, a semi-synthetic derivative of rifamycin B inhibits DNA-
dependent RNA polymerase of mycobacteria and other microorganisms by forming a stable
drug-enzyme complex, leading to the suppression of the initiation of chain formation in RNA
synthesis (Mandell & Petri 1996: 1060). Rifampin is used in combination with other
antibiotics in the treatment of tuberculosis (Elliot et al. 1997: 332). Rifampin inhibits the
growth of most Gram-positive and Gram-negative microbes such as Escherichia coli,
Pseudomonas, indole-positive and indole-negative Proteus and Klebsiella. Rifampin is very
active against Staphylococcus aureus and coagulase-negative staphylococci (Mandell & Petri
1996: 1070).
The family of synthetic antibacterial drugs called quinolones (nalidixic acid) are also
inhibitors of nucleic acid synthesis, but they act against the enzyme DNA gyrase, thereby
stopping DNA synthesis. DNA gyrase mediates the breaking and reunion of DNA strands and
is required for replication of DNA as well as transcription of DNA to mRNA (Hooper &
Wolfson 1991: 392). Quinolones are effective against a broad range of Gram-positive and
Gram-negative bacteria including the mycobacteria (Mims et al. 1993: 27).
2.4.5 Inhibition of specific enzyme systems in metabolic pathways.
Some antimicrobial drugs interfere with metabolic pathways common in prokaryotes but not
humans. One such pathway is the synthesis of folic acid, which is an important precursor of
an essential coenzyme. Folic acid, consisting in part of para-aminobenzoic acid (PABA) has
an essential role as co-substrate in the biosynthesis of amino acids, purine and pyrimidines.
11
Many types of bacteria are able to synthesize folic acid through a multi-step pathway, but
they cannot take it up from their external environment. Humans, on the other hand, lack this
pathway, so folic acid must be provided in their diet (Franklin & Snow 1989: 122; Atlas
1997: 1184).
Drugs such as sulphonamides and trimethoprim that inhibit essential enzymes in the pathway
of folic acid synthesis are selectively toxic to bacteria because humans do not have the target
enzymes (Franklin & Snow 1989: 123). The one-carbon transfer required for the synthesis of
thymidine and purines does not occur in the presence of trimethoprim, an antimicrobial agent
(Nester et al. 1995: 452)
Many Gram-positive cocci, including Staphylococcus aureus, streptococci and the viridians
streptococci, and to a variable extent the enterococci, are susceptible to trimethoprim. The
enterobacteria, including E.coli and Salmonella species, are also sensitive to the action of
trimethoprim. The wide-spectrum activity of trimethoprim favors the application of this drug
in the treatment of gastroenteritis as well as respiratory and urinary tract infections caused by
susceptible organisms. Sulphonamides and trimethoprim are often used in combination to
combat bacterial infection (Mann & Grabbe 1996: 74; Atlas 1997: 1184 -1185).
2.5 Uses of Antibiotics.
Antibiotics have found diverse uses in various aspects of human and veterinary medicine and
in food preservation as well as it being used as research tools.
2.5.1 Chemotherapeutic uses
Antibiotics are chemotherapeutic agents used in the treatment of infectious diseases of
microbial origin. This is achieved by the systemic administration of the chosen antibiotic
(Lancini et al. 1995: 278).
Some antibiotics have been found to possess antitumor activity. The anthramycin group
(anthramycin, sibromycin, tomaymycin, neothramycin) is an example of potent antitumor
agents. However, research is still ongoing to eliminate their adverse side effects, and to find
new antibiotics with these qualities (Zenzaburo, Hisatoyo, Masayoshi & Takao 1983: 9).

12
2.5.2 Clinical uses as research tool
Antibiotics can be used in the identification of infectious bacterial agents. In cases where the
agent cannot be isolated and identified or the DNA cannot be matched it is possible that
antibiotic therapy will cause the release of the microbial antigen to initiate a specific antibody
response. The serologic measure of a change or response in the serum antibody level to a
bacterial infection would indicate its presence. The sero-conversion or the increase in
antibody titre, resulting from the administration of a vaccine would indicate the host‟s
immune responsiveness to a particular antibiotic therapy. The specificity and sensitivity of
the serologic response depends on the test used, such as: growth inhibition, neutralization,
agglutination (ELISA), complement fixation, immuno-blotting (Clark 2000: 1).
2.5.3 Veterinary uses
Following the discovery of the growth promoting and disease fighting capabilities of
antibiotics, fish farmers, poultry and livestock producers began using such drugs in animal
feeds. Antibiotics routinely used for treatment of human infections are also used for animals,
for therapy, prophylactic reasons or growth promotion. For the last-named purpose, sub-
therapeutic doses of antibiotics usually have been used (Khachatourians 1998: 1). The
addition of sub-therapeutic amounts of certain antimicrobial agents to animal feeds, not only
prevents infectious diseases caused by bacteria or protozoa, but also decrease the amount of
feed required while increasing the rate of weight gain (Du Pont & Steele 1987: 448). The
addition of tetracycline or penicillin to commercial swine or poultry feed at the rate of 5 to
20grams per ton of feed was found to have increased the growth rate of young animals by at
least 10% and sometimes more. This may be as result of the added drugs destroying
pathogenic bacteria and intestinal parasites that could have caused mild forms of disease that
affect the growth and development of young animals (Pelczar et al. 1993: 913;
Khachatourians 1998: 1). Antibiotics in animal feeds could also improve the performance of
animals under conditions of stress such as poor ventilation or overcrowding during transit.
Chronic respiratory disease in poultry, scouring and diarrhoeal diseases in pigs commonly
occur under these conditions (Cooke 1974: 82). The use of sub-therapeutic levels of
antimicrobial agents is one of the tools that have facilitated the confinement housing,
allowing larger numbers of animals to be maintained in a production facility of a given size.

13
This practice of adding sub-therapeutic amounts of antibiotics to the feed of livestock and
poultry probably contributes to lower cost of animal care and ultimately lowers cost to the
consumer of meat milk and eggs (Du Pont & Steele 1987: 459).
2.5.4 Food preservative uses.
Processing of fresh dressed poultry has always presented serious spoilage problems. This is
because the skin of live birds as well as feet, feathers and faeces contain a variety of
microorganisms. Contamination of poultry usually occurs during washing, plucking and
evisceration. Much has been done in recent years to improve poultry processing operations
and although improved sanitation has done much to better protect the consumer, dressed and
cut-up poultry still deteriorates rapidly. Even at refrigerator temperatures, microbial spoilage
still occurs when food is stored for long periods (Durbin 1956: 1307; Frazier & Westhoff
1996: 494). Freshly laid eggs, which are usually sterile inside become contaminated on the
outside by faecal matter from the hen, cage, nest and wash water if the eggs are washed
during handling. If these fresh eggs exhibit cracks in the shell this becomes a route of
infection which leads to spoilage during storage and if these organisms are pathogenic it
becomes a route of transmission to consumers (Frazier & Westhoff 1996: 494).
According to Jay (1992: 553), internal temperature of food is not reduced to within the
refrigerator range and the spoilage that is likely to occur is caused by internal sources,
including Clostridium perfringens and the genera of the Enterobacteriaceae family. Bacterial
spoilage of refrigerated-stored meats may also be reflective of external conditions and
sources of contamination including handling.
Preservation methods that have been developed to reduce the risk of food-borne outbreaks of
infectious diseases include physical procedures such as irradiation, freezing, vacuum
packaging or chilling (Frazier & Westhoff 1996: 495). Food can also be preserved using
chemicals such as benzoic acid, the parabens, sorbic acid, nitrites or nitrates, sulphites or
sulphur dioxide, or by increasing carbon dioxide concentrations. Nisin, a bacteriocin
produced by some strains of Lactococcus lactis, as well as antibiotics such as tetracycline,
natamycin and subtilins, are often applied to preserve food (Jay 1992: 553).
14
2.6 Adverse reactions to antibiotic use.
Some people develop hypersensitivities or allergies to certain antimicrobials. An allergic
reaction to penicillin and other related drugs may result in a fever or rash and can sometimes
lead to life-threatening anaphylactic shock. For this reason, it is important that people who
are allergic to antimicrobials alert their physician so they can prescribe alternative drugs
(Mandell, Douglas, Bennet & Dolin 1995: 122 - 145).
Several antibiotics are toxic at high concentration and occasionally cause adverse reactions.
For example, streptomycin can damage kidneys and impair a sense of balance, but its most
toxic effect is irreversible deafness. Patients taking this drug must be closely monitored
because it has a low therapeutic index. Some antibiotics have such severe potential side
effects that they are reserved only for life-threatening conditions. For example, in rare cases
chloramphenicol causes the potentially lethal condition called aplastic anaemia in which the
body is unable to make white and red blood cells. For this reason chloramphenicol is used
only when no other alternatives are available such as in treating penicillin-allergic patients
who have bacterial meningitis (Mandell & Petri 1996: 1069).
In some cases antibiotics suppress the normal flora of the body where the target pathogen is
located. These normal flora play an important role in excluding pathogens, their absence
could potentially lead to opportunistic infections (Pelczar et al. 1986: 894). Patients who take
broad-spectrum antibiotics are at risk of developing the life-threatening disease antibiotic
associated colitis (pseudomembranous colitis) caused by the growth of toxin-producing
Clostridium difficile in the intestine. This organism is not usually able to establish itself in the
intestine due to competition with other bacteria. However, when the growth of the normal
flora is inhibited or floras are killed, C. difficile can flourish and cause disease (Nester et al.
1995: 453; Mandell et al. 1995: 147).
2.7 Bacterial resistance to antibiotics
2.7.1 Introduction to Bacterial resistance to antibiotics.
The extraordinary ability of certain bacteria to develop resistance to antibiotics which are
otherwise useful in speeding recovery from some illnesses has been a hot topic on the minds
of doctors, hospital staff, reporters, and the general public for several years. It is also heralded

15
as a textbook example of evolution in action. Scientists are dismayed to discover that some
bacteria have become resistant to antibiotics through various alterations, or mutations, in their
DNA. Unfortunately the development of resistance is a normal process and occurs as a way
to protect bacteria from extinction (Purdom 2007: 1; Serrano 2005: 41). In the laboratory this
is observed when strains of bacteria are able to multiply in the presence of antibiotic
concentration higher than the concentration in humans receiving therapeutic doses (WHO
2002: 1).
Some studies have suggested that antibiotic resistance, once acquired are very slowly lost.
For example the persistence of streptomycin or sulphonamide resistance in E. coli despite the
decrease in antibiotic use and the persistence of vancomycin-resistant enterococci have led to
the ban of avoparicin in Norway (Enne, Livemore, Stephen & Hall 2001: 1325; Heuer,
Pedersen, Andersen & Madsen 2002: 137).
As early as the late 1940s resistant strains of bacteria began to appear. Currently, it is
estimated that more than 70% of the bacteria that cause hospital-acquired infections are
resistant to at least one of the antibiotics used to treat them (Purdom 2007: 1; Nester et al.
1995: 725).
The application of antibiotics in the treatment of viral infections, prescription of erroneous
dosage, or failure of patients to complete the prescribed course are factors that probably
played a major role in rendering many important antibiotics ineffective (Hardman & Limbird
1996: 1120).
2.7.2 Causes of antibiotic resistance
Microbes (the collective term for bacteria, fungi, parasites, and viruses) can cause infectious
diseases, and antimicrobial agents such as penicillin, streptomycin, and more than 150 others,
have been developed to combat the spread and severity of many of these diseases. Resistance
to antimicrobials is a natural biological phenomenon that can be amplified or accelerated by a
variety of factors, including human practices. The use of an antimicrobial for any infection,
real or feared, in any dose and over any time period, forces microbes to either adapt or die in
a phenomenon known as "selective pressure". The microbes which adapt and survive carry
genes for resistance, which can be passed on (Purdom 2007: 1).
16
Bacteria are particularly efficient at enhancing the effects of resistance, not only because of
their ability to multiply very rapidly but also because they can transfer their resistance genes,
which are passed on when the bacteria replicate. In the medical setting such resistant
microbes will not be killed by an antimicrobial agent during a standard course of treatment.
Resistant bacteria can also pass on their resistance genes to other related bacteria through
"conjugation", whereby plasmids carrying the genes jump from one organism to another.
Resistance to a single drug can thus spread rapidly through a bacterial population. When anti-
microbials are used incorrectly - for too short a time, at too low a dose, at inadequate
potency; or for the wrong disease - the likelihood that bacteria and other microbes will adapt
and replicate rather than be killed is greatly enhanced (Pelczar et al. 1993: 898; Purdom
2007: 1).
The accumulated scientific evidence is that certain uses of antibiotics in food-producing
animals can lead to antibiotic resistance in intestinal bacteria, and this resistance can then be
transmitted to the general population, causing treatment-resistant illness. These uses of
antibiotics can also create antibiotic resistance in non-pathogenic bacteria, the resistance
genes of which can be transferred to disease-causing bacteria, resulting in antibiotic-resistant
infections for humans (Khachatourians 1998: 1; Jacob 1999: 1; Ghosh & LaPara 2007: 191 -
203).
The report from the invitational European Union conference on The Microbial Threat (EU
1998) recognized that the major route of transmission of resistant microorganisms from
animals to humans is through the food chain. This trend is confirmed by other authors
(Nawaz, Erickson, Khan, Khan, Pothulari, Rafii, Sutherland, Wagner & Cerniglia 2001: 5).
According to WHO (2002: 1) the total consumption of antimicrobials is the critical factor in
selecting resistance. Paradoxically, underuse through lack of access, inadequate dosing, poor
adherence, and substandard anti-microbials may play as important a role as overuse. For
these reasons, improving use is a priority if the emergence and spread of resistance are to be
controlled (WHO 2002: 1).
17
2.8 Genetic basis for antibiotic resistance
2.8.1 Organisms which are innately resistant to certain antibiotics.
Organisms that naturally lack a target for a specific antibiotic are innately resistant to that
antibiotic. For example, members of the genus Mycoplasma lack a cell wall, as a result they
are resistant to penicillin and other drugs that target peptidoglycan. Additionally, many
Gram-negative organisms are inherently resistant to penicillin because the selective
permeability of their outer membrane excludes the drug from the cell wall. Innate resistance
is consistent and predictable because it reflects the natural composition of an organism
(Donowitz & Mandell 1988: 491).
2.8.2 Organisms that acquire antibiotic resistance.
Unlike innate resistance, acquired antibiotic resistance is ever changing. As antibiotics are
increasingly used and misused, the bacterial strains that are resistant to their effects have a
selective advantage over their sensitive counterparts when the antimicrobial is in the
environment. For example, when penicillin was first introduced, less than 3% of
Staphylococcus aureus strains were resistant to its effects. Heavy use of the drug, measured
in hundreds of tons per year, progressively eliminated sensitive strains, so that now 85% or
more are now resistant (Nester et al. 1995: 459; Neu 1992: 1064). This development is
understandably of great concern to health professionals because of the impact on cost,
complications and outcomes of treatment (Neu 1992: 1064; WHO 2002: 1).Bacteria have
evolved diverse and remarkable ways to avoid the effects of antimicrobials. In several cases,
resistance is due to a minor structural alteration in the target so that it is no longer bound by
the drug yet still functions. For example, streptomycin normally binds to a part of the
prokaryotic 30S ribosomal subunit that is critical for protein synthesis. A slight alteration in
the structure of the ribosome results in a distortion, so that streptomycin is no longer able to
bind but the ribosome can still functionally translate mRNA. Similarly, changes in the
penicillin-binding proteins (PBPs) do not alter their function but prevent the binding of
penicillin (Jacoby & Archer 1991: 608; Purdom 2007: 1).
Some bacteria have evolved the ability to over-produce the target as a way of avoiding the
effects of an antimicrobial drug. The increased quantity of target molecules overwhelms the
18
drug. For example, sulfa drugs normally interfere with the folic acid synthesis by acting as a
decoy substrate for the enzyme, thus competitively inhibiting the enzyme. When an organism
produces excess, enough uninhibited enzyme will be available to complete the synthesis of
folic acid (Nester et al. 1995: 452; Jacoby & Archer 1991: 608).
An entirely different mechanism of drug resistance involves the destruction or inactivation of
the antibiotic. Some organisms produce specific enzymes that can cleave or chemically
modify the essential portion of an antibiotic to destroy its activity. For example, the enzyme
„penicillinase‟ is one of a group of enzymes generally called „β-lactamases‟ that destroy the
activity of penicillin and some other similar drugs operate by cleaving an essential portion,
the β-lactam ring. Similarly, resistance to chloramphenicol is caused by the organisms‟
acquisition of a plasmid that encodes an enzyme (chloramphenicol acetyltransferase [CAT])
which inactivates the drug by adding an acetyl group. The modified form of chloramphenicol
is not toxic to bacteria (Wright 1994: 380; Jacoby & Archer 1991: 610; Neu 1992: 1064).
Sulphonamide-resistant bacteria produce modified enzymes which have a higher affinity for
the substrate para-amino benzoic acid (PABA), a precursor in folic acid metabolism, than for
sulphonamide. Consequently, even in the presence of sulphonamide, the enzyme works well
enough to allow the bacterium to function (Black 1996: 790).
Some sulphonamide-resistant bacteria may alter a metabolic pathway in order to bypass the
reaction inhibited by the antimicrobial agent. These organisms have acquired the ability to
use ready-made folic acid from their environment and no longer need to make it from PABA
(Black 1996: 790; Schwarz & Chaslus-Dancla 2001: 210).
Alteration in membrane permeability or its other functions may also confer antibiotic
resistance. In some cases, mutational alteration of a membrane protein responsible for
maintaining selective permeability prevents the drug from entering the cell. In the case of
tetracycline resistance, however, the drug is actively pumped back out of the cell (Jacoby &
Archer 1991: 612). This pump action prevents the accumulation of toxic levels of
tetracycline so that bacterial protein synthesis is not inhibited. The efflux pump mechanism
function is associated with the inner membrane and it occurs in both Gram-positive and
Gram-negative bacteria (Atlas 1997: 1185).

19
2.8.3 Acquisition of antibiotic resistance through spontaneous mutation.
In the presence of antibiotics, the process of natural selection will occur, favouring the
survival and reproduction of the mutant bacteria. The mutant bacteria are better able to
survive in the presence of the antibiotic and will continue to cause illness in the patient
(Purdom 2007: 1). Mutation may either arise spontaneously, or could be induced by external
stress factors in the environment, including chemical agents such as antibiotics, heat or
irradiation (Todar 1996b: 1; Elliot et al. 1997: 332; Nester et al. 1995: 156).
Acquisition of antimicrobial resistance may be due to spontaneous mutations that naturally
occur during cell growth. For example, streptomycin-resistance is acquired through point
mutation, that, like all spontaneous mutations occur only very rarely. However, given the
high numbers of bacteria associated with an active infection and the selective advantage that
resistant mutants have when antibiotics are used, the rare mutation is significant indeed
(Wright 1990: 23; 1994: 370).
Mutations causing a change in only a single nucleotide with no detectable alteration in the
end product, namely the transcribed protein, are referred to as point mutations. Point
mutations probably are of less consequence to the problem antibiotic resistance compared to
the major genetic changes that cause significant alterations in the bacterial cells. Such
alterations often are detrimental and the mutant organisms may not survive (Todar 1996b: 1;
Elliot et al. 1997: 332).
Antimicrobials to which spontaneous mutations frequently occur are sometimes given in
combination with a second antimicrobial drug. For example, streptomycin alone is never used
to treat tuberculosis but is instead used in combination with other drugs such as rifampin. The
chance that an organism will simultaneously develop resistance to both drugs is extremely
low, so an organism that develops resistance to one drug will still be killed by the other drug
(Mandell et al. 1995: 145).
Although the mutant bacteria can survive well in the hospital environment, the change has
come at a cost. The altered protein is less efficient in performing its normal function, making
the bacteria less fit in an environment without antibiotics. Typically, the non-mutant bacteria
are better able to compete for resources and reproduce faster than the mutant form (Purdom
20
2007: 1). A famous example to help clarify this was during the anthrax scare shortly after the
September 11 2001 attacks in the U.S., when Ciprofloxacin (Cipro) was given to potential
victims. Cipro belongs to a family of antibiotics known as quinolones, which bind to a
bacterial protein called gyrase, decreasing the ability of the bacteria to reproduce. This allows
the body‟s natural immune defences to overtake the infectious bacteria as they are
reproducing at a slower rate. Quinolone-resistant bacteria have mutations in the genes
encoding the gyrase protein. The mutant bacteria survive because the Cipro cannot bind to
the altered gyrase (Purdom 2007: 1). This comes at a cost as quinolone-resistant bacteria
reproduce more slowly (Heddle & Anthony 2002: 1814; Barnard & Anthony 2001; 1997).
Resistance to this family of antibiotics is becoming a major problem with Campylobacter
jejuni bacteria which cause food poisoning. In the US alone, studies show that C. jejuni
increased its resistance to quinolones 10-fold in just five years (Molbak, Gerner-Smidt &
Wegener 2002: 1).
2.8.4 Acquisition of antibiotic resistance through DNA transfer.
Bacteria can also become antibiotic-resistant by gaining mutated DNA from other bacteria.
This mechanism of exchanging DNA is necessary for bacteria to survive in extreme or
rapidly changing environments like a hospital (Purdom 2007: 1). Genetic traits for antibiotic
resistance are encoded by genes occurring either on the bacterial genome, or on extra-
chromosomal genetic elements called plasmids (Khachatourians 1998: 1).
Alterations in the bacterial genome may result in the mutant cell having new properties of
significant advantage under particular environmental conditions which may allow them to
out-compete other daughter cells (Todar 1996b: 1; Elliot et al. 1997: 332).
In bacteria, extra-chromosomal genetic material occurs in plasmid and transposons. Plasmids
carry those genes that encode properties or functions that are not essential for growth and
multiplication, but rather give the organism an advantage for survival in environments where
they are exposed to particular stress factors, such as antibiotics (Harrison & Svec 1998: 160).
Transposons, often known as jumping genes, are mobile genetic elements that move from one
site to another, inevitably causing the amino acid sequence in these sites to change. At the
end of the transposon there are specific base sequences known as insertion sequences which
21
allow the transposon DNA to be inserted into existing DNA strands. Transposons allow
genetic information to be transferred rapidly between plasmids and chromosomal DNA, and
also facilitate the dissemination of genetic information among bacteria in the environment
(Elliot et al. 1997: 332; Harrison & Svec 1998: 160; Nester et al. 1995: 157).
Plasmids are relatively large, independent, self-replicating genetic units that carry several
genes that control the activities of the plasmid itself as well as those of the parent cell, such as
plasmid replication, production of sex pili, conjugation, DNA transfer, antibiotic resistance
and toxin production (Mims et al. 1993: 27).
The resistance genes that code for enzymes that inactivate the antimicrobials are often found
on the conjugative plasmids called resistance plasmids or „R-plasmids‟. A single R-plasmid
frequently encodes on several different genes resistance to several different antimicrobial
drugs, thus enabling an organism to simultaneously gain resistance to several completely
different drugs in a phenomenon known as „multiple drug resistance‟ (Wright 1994: 372; Neu
1992: 1064; Jacoby & Archer 1991: 610). According to Harrison & Svec (1998: 161) the
frequent exchange of these R-plasmids is a major factor in the rapid distribution of resistance
genes among bacteria in the environment.
Unfortunately, the mobility of these genes makes the possibility of widespread resistance a
grim reality (Neu 1992: 1064). For example, extensive use of antibiotics selects for normal
flora such as Staphylococcus epidermidis that carry „R-plasmids‟. Normally this would not be
threatening, except for the fact that S. epidermidis is capable of transferring its plasmids to
the common pathogen S. aureus. As a result of the ease with which antibiotic resistance can
be transferred through conjugation; many isolates of S. aureus are now resistant to all
antibiotics except vancomycin (Mandell et al. 1995: 1069).
Vancomycin is a drug usually reserved for life-threatening conditions. Even more serious is
the fact that some strains of Enterococcus, a common opportunistic pathogen that is part of
normal flora, are resistant to all known antimicrobial agents including vancomycin. These
„vancomycin-resistant enterococci‟ (VRE) are particularly a problem in intensive-care
settings in which patients are prone to opportunistic infections. Infections caused by these
strains are untreatable with conventional drug therapy (Neu 1992: 1064; Mandell et al. 1995:
1070).
22
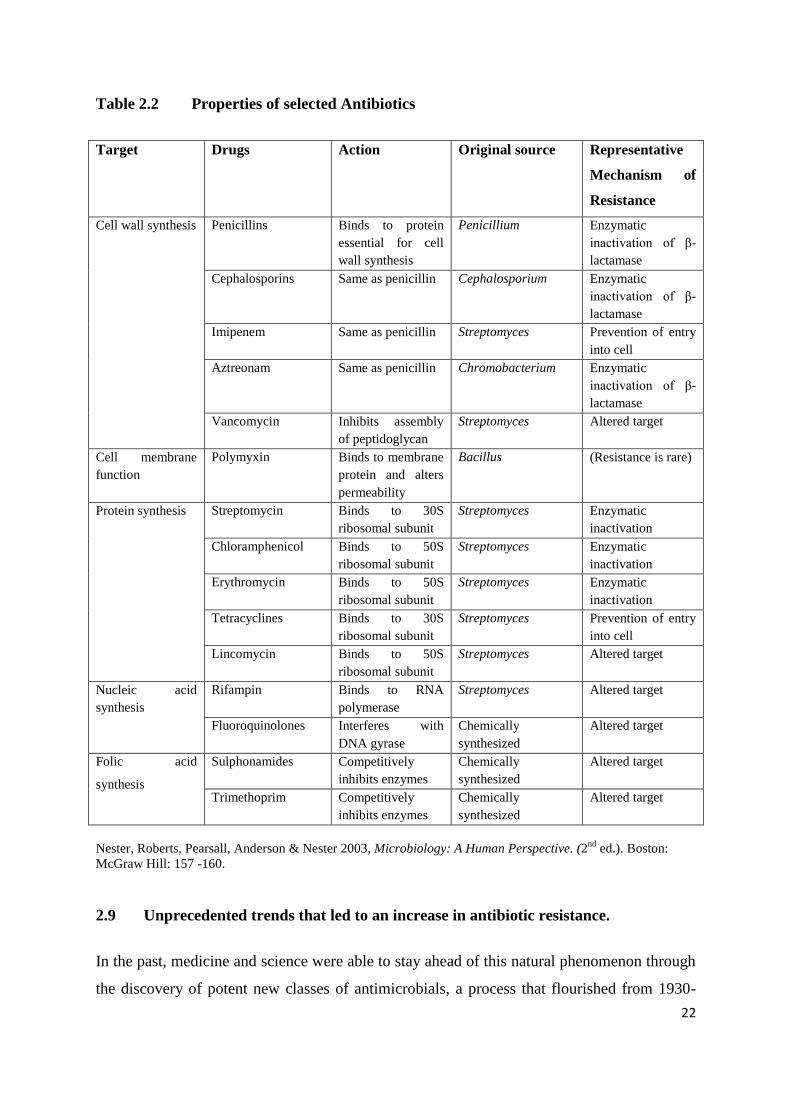
Table 2.2 Properties of selected Antibiotics
Target Drugs Action Original source Representative
Mechanism of
Resistance
Cell wall synthesis Penicillins Binds to protein
essential for cell
wall synthesis
Penicillium Enzymatic
inactivation of β-
lactamase
Cephalosporins Same as penicillin Cephalosporium Enzymatic
inactivation of β-
lactamase
Imipenem Same as penicillin Streptomyces Prevention of entry
into cell
Aztreonam Same as penicillin Chromobacterium Enzymatic
inactivation of β-
lactamase
Vancomycin Inhibits assembly
of peptidoglycan
Streptomyces Altered target
Cell membrane
function
Polymyxin Binds to membrane
protein and alters
permeability
Bacillus (Resistance is rare)
Protein synthesis Streptomycin Binds to 30S
ribosomal subunit
Streptomyces Enzymatic
inactivation
Chloramphenicol Binds to 50S
ribosomal subunit
Streptomyces Enzymatic
inactivation
Erythromycin Binds to 50S
ribosomal subunit
Streptomyces Enzymatic
inactivation
Tetracyclines Binds to 30S
ribosomal subunit
Streptomyces Prevention of entry
into cell
Lincomycin Binds to 50S
ribosomal subunit
Streptomyces Altered target
Nucleic acid
synthesis
Rifampin Binds to RNA
polymerase
Streptomyces Altered target
Fluoroquinolones Interferes with
DNA gyrase
Chemically
synthesized
Altered target
Folic acid
synthesis
Sulphonamides Competitively
inhibits enzymes
Chemically
synthesized
Altered target
Trimethoprim Competitively
inhibits enzymes
Chemically
synthesized
Altered target
Nester, Roberts, Pearsall, Anderson & Nester 2003, Microbiology: A Human Perspective. (2nd
ed.). Boston:
McGraw Hill: 157 -160.
2.9 Unprecedented trends that led to an increase in antibiotic resistance.
In the past, medicine and science were able to stay ahead of this natural phenomenon through
the discovery of potent new classes of antimicrobials, a process that flourished from 1930-

23
1970 and has since slowed to a virtual standstill, partly because of misplaced confidence that
infectious diseases had been conquered, at least in the industrialized world. In just the past
few decades, the development of resistant microbes has been greatly accelerated by several
concurrent trends (WHO 2002: 3). These have worked to increase the number of infections
and thus expand both the need for antimicrobials and the opportunities for their misuse. Such
trends include:
urbanization with its associated overcrowding and poor sanitation, which greatly
facilitate the spread of such diseases as typhoid, tuberculosis, respiratory infections,
and pneumonia;
pollution, environmental degradation, and changing weather patterns, which can
affect the incidence and distribution of infectious diseases, especially those, such as
malaria, that are spread by insects and other vectors;
demographic changes, which have resulted in a growing proportion of elderly people
needing hospital-based interventions and thus at risk of exposure to highly resistant
pathogens found in hospital settings;
the AIDS epidemic, which has greatly enlarged the population of immuno-
compromised patients at risk of numerous infections, many of which were previously
rare;
the resurgence of old foes, such as malaria and tuberculosis, which are now
responsible for many millions of infections each year; and
the enormous growth of global trade and travel which have increased the speed and
facility with which both infectious diseases and resistant microorganisms can spread
between continents (WHO 2002: 3).
As the number of infections and the corresponding use of antimicrobials have increased, so
has the prevalence of resistance. In addition, the enhanced food requirements of an expanding
world population have led to the widespread routine use of antimicrobials as growth
promoters or preventive agents in food-producing animals and poultry flocks. Such practices
have likewise contributed to the rise in resistant microbes, which can be transmitted from
animals to man (Khachatourians 1998: 1; WHO 2002: 3).
24
2.10 Epidemiology of antibiotic resistance
Emerging antimicrobial resistance, due to use of antimicrobials, is a public health concern in
human and animal medicine worldwide. According to the Centres for Disease Control and
Prevention (CDC) (HHS, 1999a: 1), resistant strains of three micro-organisms causing human
illness – Salmonella sp., Campylobacter sp. and Escherichia coli – are linked to the use of
antibiotics in animals. Young children, the elderly and immuno-compromised are the
population at risk. These bacteria infect humans through ingested contaminated foods,
especially foods of animal origin. Animals serve as reservoirs for many food-borne
pathogens, including Salmonella and Campylobacter. Antibiotic-resistant organisms may be
present in or on animals as a result of drug use and these resistant food-borne pathogens can
contaminate a carcass during slaughter or processing. When these resistant bacteria cause
illness in a person requiring medical treatment, medical therapy may be compromised if the
pathogenic bacteria are resistant to the drug(s) available for treatment. In England, in studies
of 5 400 strains of Campylobacter jejuni and 376 of Campylobacter coli reported by Frost &
Thwaites (1998: 4) and by Threlfall, Ward, Frost & Willshaw (2000: 4- 5), 11% were
resistant to ciprofloxacin at concentrations exceeding 8 mg/litre, with resistance being most
pronounced in C. coIi. It must be assumed that a proportion of ciprofloxacin-resistant isolates
originated in food producing animals.
In the United States of America, it has been demonstrated that a considerable increase
occurred in incidence of Campylobacter-resistant isolates in poultry, associated with the
licensing in the United States of America of fluoroquinolone antibiotics for use in chickens.
In the Netherlands, a direct association between the licensing of fluoroquinolones for water
medication for poultry and resistance development in animal isolates was demonstrated,
while at the same time resistance in human isolates increased. A similar situation has been
reported for Spain (Wegener, Aarestrup, Gerner-Smidt & Bager 1999). Campylobacter, the
most common bacterial cause of food-borne illness, infects an estimated 2.4 million people
annually in the United States of America. Fluoroquinolones (e.g. ciprofloxacin) are
commonly used in adults to reduce the severity and duration of the symptoms.
The continued use of fluoroquinolones in chickens threatens the efficacy of fluoroquinolones
for treatment of Campylobacter infections in humans, and so mitigating action is needed to
25
preserve the efficacy of fluoroquinolones (Rossiter, Joyce, Ray, Benson, Mackinson, Gregg,
Sullivan, Vought, Leano, Besser, Marano, Angulo: 1 & The EIP Food Networking Group
2000: 1). Each year, Salmonella bacteria infect an estimated 1.4 million persons in the United
States of America; these infections result in several hundred deaths annually. One of the most
common strains isolated from humans is multidrug-resistant (MR) Salmonella enterica
serotype typhimurium definitive type 104 (DT 104). This strain was first isolated from
humans in 1984 in the United Kingdom, where it emerged as a major cause of human illness
in the late 1980s, before its emergence in the United States of America and elsewhere in the
mid-1990s (Serrano 2005: 12).
Most of the infections are caused by Salmonella typhimurium DT 104, which is usually
resistant to ampicillin, chloramphenicol, streptomycin, sulphonamides and tetracycline, and
has acquired resistance against trimethoprim and fluoroquinolones, most probably because
affected groups of animals could only be treated with these antibiotics (Van den Bogaard &
Stobberingh 2000: 332). This strain was first isolated in the UK from exotic birds, and, with
the exception of a human outbreak in Scotland in the mid-1980s, it was not isolated from
human beings until 1989. During the next five years, the strain became an epidemic in bovine
animals, and common in poultry (particularly turkeys), pigs and sheep. It is often discussed
whether resistant Salmonella develops primarily as a result of antibiotic use in agriculture or
in human medicine. Although both uses always play a part, it is more probable that antibiotic
resistance in Salmonella-causing infection mainly reflects resistance developed in the animal
reservoirs. This is supported by the facts that humans are not often carriers of Salmonella
compared with food animals, that antibiotics are usually given to animals for long periods
and often in sub-therapeutic doses and, finally, that resistance to antibiotics used for food
animals (tetracycline, apramycin), but not for treatment of Salmonella in humans, has been
observed in Salmonella (Wegener et al. 1999: 56).
Human infection has been associated with the consumption of chicken, beef, pork sausages
and meat paste, and to a lesser extent with direct contact with farm animals. In the 1990s, the
infection was recognized in cattle and humans in the United States of America, and during
recent years this MR strain has been responsible for infections in European countries, Israel
and Canada (Threlfall et al. 2000: 4). It is important to note that all DT 104 isolates contained

26
the same cassette gene, which codifies for resistance irrespective of source (food animal or
human), or country of origin.
Since 1992, the DT 104 strain has acquired resistance against trimethoprim and ciprofloxacin,
and, as a consequence, since 1997, 15% of the isolates have been resistant to trimethoprim,
and 13% have shown decreased sensitivity to ciprofloxacine. The appearance of resistance to
trimethoprim has been attributed to the use of this drug to combat infections caused by DT
104. The emergence of isolates of MR DT 104 with reduced sensitivity to ciprofloxacin has
followed the licensing in the United Kingdom of a related fluoroquinolone drug,
enrofloxacin, for veterinary use. This drug has been used for prophylactic and therapeutic
purposes in poultry and cattle in the UK and as a consequence resistance against nalidixic
acid has rapidly emerged in food-producing animals in the United Kingdom, particularly
turkeys, chickens and cattle (Serrano 2005: 12).
In an outbreak of DT 104 in Denmark, attributed to the consumption of pork, lack of
response to fluoroquinolone has been described (Threlfall et al. 2000: 4). The Danish
researchers were unable to discover how the DT 104 strain entered the food chain. The pigs
suspected of carrying this resistant strain had not been fed any fluoroquinolones, but the
compounds may previously have been used at the farms. Wild animals or equipment may
have spread the bacteria environmentally, and concomitantly with globalization of trade such
outbreaks could become more common (Swint 1999: 1). More recently, in the light of these
findings, a series of proposals to ban the use of quinolones in food animals have been
proposed (Sundlof 2000: 1; Tollefson 2000: 1; Environmental Defense 2000: 1).
In countries that have banned certain sub-therapeutic uses of antibiotics, decreases in
resistance to those antibiotics have been reported, restoring the effectiveness of those
antibiotics for treating disease. For example, in Denmark, after a 1995 ban on the use of
avoparcin as a growth promoter, glycopeptide-resistant enterococci in Danish broiler flocks
declined from 82 to 12%. No reduction has been seen in swine, due probably to the facts that
swine production is continuous (in contrast to cyclical broiler production, which allows
complete cleaning between flocks) and that swine producers changed from avoparcin to
tylosine, which also selects for glycopeptides-resistant antibiotic, whereas Danish broiler
producers stopped using any kind of antimicrobial growth promoters. Nevertheless, in

27
Norway, vancomycin-resistant enterococci (VRE) were still isolated from broilers after three
years from its banning, and resistant genes were appearing in Lactococcus lactis and
Streptococcus bovis (Borgen, Serum, Wasteson & Kruse 2001: 91).
In Sweden, all antibiotics have been banned as growth promoters since 1986, including
avoparcin. There, avoparcin-resistant enterococci and VRE have not been isolated from pig
faecal samples. In other northern European countries, where avoparcin has been used as a
growth promoter, enterococci resistant to this antibiotic and also to vancomycin are common
in healthy people. In contrast, in United States of America, where agricultural uses of
avoparcin and vancomycin are banned, this kind of resistance is not observed (HHS
1999a&b). Another aspect of the resistance problem that has also to be considered is that
recently some similarities between bacterial resistance patterns to antibiotics and tobiocides
(antiseptics, disinfectants, preservatives) have been reported. Gram-negative bacteria that
have developed resistance to cationic biocides (chlorhexidine salts and quaternary ammonium
compounds) may also be resistant to some antibiotics (Russell 2000: 230). There is clear
evidence that, with an increase in the consumption of antimicrobial agents by humans or
animals, there is a resultant increase in antimicrobial resistance (Donabedian, Thal,
Hershberger, Perri, Chow, Bartlett, Jones, Joyce, Rossiter, Gay, Johnson, Mackinson, Debess,
Madden, Angulo & Zervos 2003: 1112).
2.11 Factors that encourage the spread of antibiotic resistance
The emergence and spread of antimicrobial resistance are complex problems driven by
numerous interconnected factors; many of which are linked to the misuse of antimicrobials
and are thus amenable to change. In turn, antimicrobial use is influenced by interplay of the
knowledge, expectations, and interactions of prescribers and patients, economic incentives,
characteristics of a country's health system, and the regulatory environment (WHO 2002: 3).
Patient-related factors are major drivers of inappropriate antimicrobial use. For example,
many patients believe that new and expensive medications are more efficacious than older
agents. In addition to causing unnecessary health care expenditure, this perception
encourages the selection of resistance to these newer agents as well as to older agents in their
class (WHO 2002: 3). Self-medication with antimicrobials is another major factor
contributing to resistance. Self-medicated antimicrobials may be unnecessary, are often
28
inadequately dosed, or may not contain adequate amounts of active drug, especially if they
are counterfeit drugs. In many developing countries, antimicrobials are purchased in single
doses and taken only until the patient feels better, which may occur before the pathogen has
been eliminated. Inappropriate demand can also be stimulated by marketing practices. Direct-
to-consumer advertising allows pharmaceutical manufacturers to market medicines directly to
the public via television, radio, print media, and the Internet. In particular, advertising on the
Internet is gaining market penetration, yet it is difficult to control with legislation due to poor
enforceability (WHO 2002: 4; Harrison & Svec 1998: 159 - 160).
Prescribers' perceptions regarding patient expectations and demands substantially influence
prescribing practice. Physicians can be pressured by patient expectations to prescribe
antimicrobials even in the absence of appropriate indications. In some cultural settings,
antimicrobials given by injection are considered more efficacious than oral formulations.
Such perceptions tend to be associated with the over-prescribing of broad-spectrum injectable
agents when a narrow-spectrum oral agent would be more appropriate. Prescribing “just to be
on the safe side" increases when there is diagnostic uncertainty, lack of prescriber knowledge
regarding optimal diagnostic approaches, lack of opportunity for patient follow-up, or fear of
possible litigation. In many countries, antimicrobials can easily be obtained in pharmacies
and markets without a prescription (WHO 2002: 3).
Patient compliance with recommended treatment is another major problem. Patients forget to
take medication, interrupt their treatment when they begin to feel better, or may be unable to
afford a full course, thereby creating an ideal environment for microbes to adapt rather than
be killed. In some countries, low quality antibiotics (poorly formulated or manufactured,
counterfeited or expired) are still sold and used for self-medication or prophylaxis (WHO
2002: 3).
Hospitals are a critical component of the antimicrobial resistance problem worldwide. The
combination of highly susceptible patients, intensive and prolonged antimicrobial use, and
cross-infection have resulted in nosocomial infections with highly resistant bacterial-
pathogens. Resistant hospital-acquired infections are expensive to control and extremely dif-
ficult to eradicate. Failure to implement simple infection control practices, such as hand
washing and changing gloves before and after contact with patients, is a common cause of
infection spread in hospitals throughout the world. Hospitals are also the eventual site of
29
treatment for many patients with severe infections due to resistant pathogens acquired in the
community. In the wake of the AIDS epidemic, the prevalence of such infections can be
expected to increase (Purdom 2007: 1; Pelczar et al. 1993: 912; Mandell et al. 1995: 151).
Veterinary prescription of antimicrobials also contributes to the problem of resistance. In
North America and Europe, an estimated 50% in tonnage of all antimicrobial production is
used in food-producing animals and poultry. The largest quantities are used as regular
supplements for prophylaxis or growth promotion, thus exposing a large number of animals,
irrespective of their health status, to frequently sub-therapeutic concentrations of
antimicrobials. Such widespread use of antimicrobials for disease control and growth
promotion in animals has been paralleled by an increase in resistance in those bacteria (such
as Salmonella and Campylobacter) that can spread from animals, often through food, to cause
infections in humans (Khachatourians 1998: 1).
2.12 Microbiology of Water.
2.12.1 Introduction to Microbiology of Water
The drinking water of most communities and municipalities is obtained from surface sources;
rivers, streams and lakes. Such natural water supplies, particularly streams and rivers, are
likely to be polluted with domestic and industrial wastes i.e., the used water of a community
(waste water). Municipal water-purification systems have been very effective in protecting
the inhabitants against polluted water. At the same time, as population centres grow, pollution
problems become more serious. A greater quantity of water is required, and the used water
must be disposed of, generally by returning it to a natural body of water in the vicinity, which
in turn may be the water supply source of another community or municipality (Pelczar et al.
1986: 593).
Water bodies are potential carriers of pathogenic microorganisms; as a result they can
endanger health and life. The pathogens that are frequently transmitted through water are
those which cause infections of the intestinal tract; namely typhoid and paratyphoid bacteria,
dysentery (bacillary and amoebic) and cholera bacteria as well as enteric viruses. The
causative organisms of these diseases are present in the faeces or urine of an infected person,

30
and when discharged may gain entrance into a body of water that ultimately serves as a
source of drinking water (Pelczar et al. 1986: 594).
Sources of faecal contamination to surface waters include wastewater treatment plants, on-
site septic systems, domestic and wild animal manure, and storm runoff. In addition to the
possible health risk associated with the presence of elevated levels of faecal bacteria, they can
also cause cloudy water, unpleasant odours, and an increased oxygen demand (USEPA 1985:
1).
2.12.2 Indicators of water pollution and presence of water-borne infections.
Municipalities usually treat drinking water to remove impurities and eliminate contamination
especially pathogenic microorganisms. Therefore regular testing must be done to ensure the
water is safe. It is not feasible to test for pathogens in the water on a regular basis (due in part
to cost limitation and time) so the accepted method tests for coliform bacteria and faecal
streptococci, a sure sign of faecal contamination and an indication of the possible presence of
pathogenic bacteria, viruses, and protozoans that also live in human and animal digestive
systems (Nester et al. 1995: 749; USEPA 1985: 1).
Coliforms are defined as a group of Gram-negative, rod-shaped, non-spore-forming, aerobic
and facultatively anaerobic bacteria that ferment lactose, forming acid and gas within 46hrs at
35oC. These bacteria are commonly found in soil and in the gut and faeces of warm-blooded
animals. Their presence in water may indicate contamination with human and/or animal
faeces. For municipal water supplies, a maximum of 1 coliform organism per 100mls is
considered safe for potable water. Higher numbers are acceptable in water used for other
purposes, such as recreational waters (Nester et al. 1995: 749; Pelczar et al. 1993: 598 - 99).
The classical species of this group are Escherichia coli and Enterobacter aerogenes. These
microorganisms have a common relationship with other enteric organisms which include;
Salmonella, Shigella, Klebsiella, Proteus, Serratia and other genera. Escherichia coli is a
normal inhabitant of the intestinal tract of humans and animals. Enterobacter aerogenes is
most frequently found on grains and plants but may occur in human and animal faeces. These
species bear a very close resemblance to each other in their morphological and cultural

31
characteristics. Consequently, it is necessary to resort to biochemical tests for differentiation
(Pelczar et al. 1986: 596 - 97).
2.12.3 Water-borne diseases and the source of antibiotic-resistant bacteria in water.
Pollution of water occurs from a variety of sources. Contamination of water with pathogenic
organisms remains a major cause of epidemics of disease and the incidence of antibiotic
resistant bacteria due to overuse in aquatic environment has greatly increased concern by
medical experts. At the present time antibiotic-resistant bacteria can be found in all
environments and under all kinds of climate. Thus antibiotic resistance has been reported in
rivers and coastal areas, in domestic sewage, in surface water and sediments, in lakes, in
sewage polluted sea waters and in drinking water (Nester et al. 1995: 155; Mezriou & Baleus
1994: 2404).
Aquaculture is becoming a more concentrated industry of fewer but much larger farms.
Infective diseases are always a hazard, and may cause major stock losses and problems of
animal welfare. To control infectious diseases in aquaculture, the same strategies used in
other areas of animal production are employed. Whenever antibiotics are used, they should be
strictly controlled under the same code applying to other veterinary medicines. As there are
no antibiotics specifically designed for aquaculture, authorized products developed for other
areas of veterinary medicine are used (Serrano 2005: 23 - 24).
In the United States of America, the majority of fish farming enterprises where antibiotics
might be used have pond-like or tank structures, rather than open-water habitats, like oceans
or lakes. Generally, after harvest, large commercial ponds for fish are not drained, so high
levels of drugs may still remain, affecting newly growing fish, which are then exposed to the
antibiotic residues and actively-resistant bacteria (Committee on Drug Use in Food Animals
1999: 1 - 8).
It is estimated that nearly 150 pounds of antibiotics are applied per acre (≈170 kg/ha) of
salmon harvested in the United States of America, and since pens are placed in natural
seawaters, antibiotics and the resultant resistant bacteria are in contact with the environment.
Some countries, such as Norway, utilize natural structures like fjords for salmon farming and,
32
for this reason; there are concerns about the wastes that collect in the bottom of fjords
(FAO/NACA/WHO 1997: 3).
Aquaculture promotes the production of various sizes and types of aquatic organisms, and the
use of antibiotics and drugs in the fish industry is complicated because of the need to
administer the compounds usually directly into the water where the organisms live. Several
factors have to be considered: the safety of aquatic fish products, the integrity of the
environment, the safety of target animals, and the safety of the persons administering the
compounds (Serrano 2005: 25).
Antibiotics effective in human medicine, including oxytetracycline, sulfamerazine and
ormethoprim, are used for treatment of bacterial infections in salmon, catfish, trout and other
commercially-raised fish. The most frequent fish infections treated with antibiotics are skin
ulcers, diarrhoea and blood sepsis. The micro-organisms responsible for these infections
belong to bacterial families that also produce infections in humans. Therefore, transference of
antibiotic resistance is highly probable. Even when treatment is suspended before the fish is
sold for consumption, the resistance can still be transmitted. For this reason, the
environmental and health impact of the use of antibiotics in aquaculture is recognized; in
many countries the use of antibiotics in aquaculture is under veterinary medicine control
(Serrano 2005: 25).
In situations where the water-borne infection is due to antibiotic-resistant bacteria, the
infected patients may fail to respond to antibiotics. Sewage-polluted water is often a common
source of diseases. The antibiotics used in the treatment of human infectious diseases and
also in animal diseases treated in veterinary practices present residues in alimentary canals
which are subsequently excreted and then find their way into sewage. Indiscriminate use of
antibiotics may result in surviving populations of antibiotic-resistant bacteria being shed with
faeces and urine and this contaminates soil and aquatic environments (FDA 2000a & b).
33
2.12.4 Brief overview of some clinically significant isolates identified using the API 20E
tests in this study.
Pantoea agglomerans
Formerly called Enterobacter agglomerans, but now renamed Pantoea agglomerans; is a
Gram-negative bacterium that belongs to the family Enterobacteriaceae. This bacterium is
known to be an opportunistic pathogen in the immuno-compromised causing wound, blood
and urinary tract infections. It is commonly isolated from plant surfaces, seeds, fruits
(especially mandarin oranges), and animal or human faeces (Winn, Allen, Janda, Koneman,
Propcop, Schreckenberger &Woods 2006: 211 - 302).
It is difficult to differentiate easily from other members of this family such as Enterobacter,
Klebsiella and Serratia species. The amino acid utilization pattern of lysine, arginine and
orinithine will distinguish Pantoea spp. from the others. Pantoea is negative for utilization of
these three amino acids (Barnes, Wiederhold, Micek, Polish & Ritchie 2003: 539).
Enterobacter cloacae
Enterobacter cloacae are clinically significant Gram-negative, facultatively-anaerobic, rod-
shaped bacterium. Enterobacter cloacae are sometimes associated with urinary tract and
respiratory tract infections. Treatment with cefepime and gentamycin has been reported
(Barnes et al. 2003: 540).
Enterobacter species, particularly Enterobacter cloacae and Enterobacter aerogenes, are
important nosocomial pathogens responsible for various infections, including bacteremia,
lower respiratory tract infections, skin and soft-tissue infections, urinary tract infections
(UTIs), endocarditis, intra-abdominal infections, septic arthritis, osteomyelitis, and
ophthalmic infections. Enterobacter species can also cause various community-acquired
infections, including UTIs, skin and soft-tissue infections, and wound infections, among
others. (Barnes et al. 2003: 540 - 541).
Risk factors for nosocomial Enterobacter infections include hospitalization for longer than 2
weeks, invasive procedures within the timeline of 72 hours, treatment with antibiotics in the
past 30 days, and the presence of a central venous catheter. Specific risk factors for infection
with nosocomial multidrug-resistant strains of Enterobacter species include the recent use of
34
broad-spectrum cephalosporins or aminoglycosides and ICU care (Fraser, Arnette & Sinave
2008:1).
These "ICU bugs" cause significant morbidity and mortality, and infection management is
complicated by resistance to multiple antibiotics. Enterobacter species possess inducible β-
lactamases, which are undetectable in vitro but are responsible for resistance during
treatment. Physicians treating patients with Enterobacter infections are advised to avoid
certain antibiotics, particularly third-generation cephalosporins, because resistant mutants can
quickly appear. The crucial first step is appropriate identification of the bacteria.
Antibiograms must be interpreted with respect to the different resistance mechanisms and
their respective frequency, as is reported for Enterobacter species, even if routine in vitro
antibiotic susceptibility testing has not identified resistance (Fraser et al. 2008:1).
Enterobacter species rarely cause disease in healthy individuals. This opportunistic pathogen,
similar to other members of the Enterobacteriaceae family, possesses an endotoxin known to
play a major role in the pathophysiology of sepsis and its complications (Fraser et al.
2008:1).
Rahnella aquatilis
Rahnella aquatilis is the only species of the new genus Rahnella within the family
Enterobacteriaceae; a rare enteric gram-negative rod which is usually found in fresh water,
and has been isolated from the bronchial washing of a patient with acquired
immunodeficiency syndrome (Harrell, Cameron & O‟Hara 1989:1671). R. aquatilis has been
known to cause septicaemia in immuno-compromised individuals (Maraki, Samonis,
Marnelakis & Tselentis 1994:2706).
Klebsiella spp.
Klebsiella are found widely throughout nature and are often found as part of the normal flora
of the GI tract, throat and skin of man and animals. K. pneumoniae and K. oxytoca are
responsible for almost all the infections associated with humans. Klebsiella oxytoca is
characterized by its ability to produce indole. Clinically it resembles Klebsiella pneumoniae;
however, nosocomial strains tend to exhibit a greater propensity to develop antibiotic
resistance. The number of infections caused by K. pneumoniae, however, is far greater in
number than those caused by K. oxytoca; thus, K. pneumoniae is the most medically
35
important of the group. Pneumonia caused by K. pneumoniae is the most common infection
caused by this microorganism inside and outside of healthcare facilities. Both K. pneumoniae
and K. oxytoca are associated with neonatal bacteremia. Most cases have occurred among
premature infants. K. pneumoniae is also a common causative agent of Urinary Tract
Infections (UTI). These urinary tract infections are usually clinically indistinguishable from
those caused by other common urinary tract pathogens. Most of these infections are the result
of urinary catheterization and are nosocomial in nature (Umeh & Berkowitz 2006:1).
In the hospital and long-term care setting, Klebsiella spp. are occasionally isolated from
wounds and abscesses. Their pathogenic role, however, is often questionable as they are often
colonizers causing no symptoms as opposed to being actual pathogens. Members of the genus
Klebsiellae are found as normal flora in the intestine; some strains of Klebsiella are
considered “enterotoxigenic” and are capable of causing diarrhoea. This is especially true in
immuno-compromised and immuno-suppressed individuals (Umeh & Berkowitz 2006:1).
Extensive use of broad-spectrum antibiotics in hospitalized patients has led to both increased
carriage of Klebsiellae and, subsequently, the development of multidrug-resistant strains that
produce extended-spectrum β-lactamase (ESBL). These strains are highly virulent, show
capsular type K55, and have an extraordinary ability to spread. Most outbreaks are due to a
single clone or single gene; the bowel is the major site of colonization with infection of the
urinary tract, respiratory tract, and wounds. Bacteremia and significant increased mortality
have resulted from infection with these species (Umeh & Berkowitz 2006:1).
In 1981, Bagley, Seidler & Brenner, and Izard, Ferragut, Gavini, Kersters, DeLey & Leclerc
described two new environmental species, Klebsiella planticola and Klebsiella terrigena, .
Originally thought to occur solely in aquatic, botanic, and soil environments, these species
was also recently isolated from human clinical specimens. These investigations found a
surprisingly high frequency of K. planticola among clinical Klebsiella isolates (Bouza &
Cercanado 2002: 217; Umeh & Berkowitz 2006:1). These species were differentiated from K.
pneumoniae and K. oxytoca by using tests for temperature-dependent fermentation of
glucose, acid production from melezitose and L-sorbose, utilization of carbon sources, and
gas production from lactose at 44.5°C (fecal coliform test). Studies from France and
Germany suggest that up to 19% of Klebsiella spp. identified in clinical settings is actually K.
planticola. K. planticola is not routinely identified because clinical identification protocols do
not include the tests that are necessary for its identification. Test kits and automated methods

36
have not been able to correctly identify these environmental organisms because they are not
included in the identification databases of most diagnostic products nor are substrates
included on panels that would differentiate them(Westbrook, O‟Hara, Roman & Miller 2000:
1495 – 1497)
In 1998, Podschun, Acktun, Okpara, Linderkamp, Ullmann & Borneff-Lipp isolated K.
planticola from neonates; these were obtained from oropharyngeal and rectal swabs.
Klebsiella belong to the eight most common bacterial pathogens causing nosocomial
infections. Immuno-compromised patients, especially elderly people and infants, comprise
the population most at risk. In pediatrics, too, nosocomial Klebsiella infections are
remarkably troublesome, particularly in premature infants and intensive care units. Pediatric
patients are easily colonized by Klebsiella spp. Intestinal and oropharyngeal colonization acts
as the main reservoir for nosocomial outbreaks.
Kluyvera ascorbata
Kluyvera is a relatively newly described genus in the family Enterobacteriaceae that
infrequently causes infections in humans. The organism has been isolated from various
clinical specimens, but its significance has not been clearly established. In fact, it has been
regarded as saprophytic, opportunistic, or pathogenic. In the early 1980s, the organism was
regarded mostly as a benign saprophyte that colonized predominantly the respiratory,
gastrointestinal, or urinary tract. More recently, however, diverse infections occurring under
various host conditions have been reported. Most of these infections involved the
gastrointestinal or urinary tract and the soft tissues. Bacteremia and other serious infections
have also occurred (West, Vijayan & Shekar 1998; Dollberg, Gandacu & Klar 1990).
Kluyvera is a small, flagellated, motile Gram-negative bacillus that clearly belongs to the
family Enterobacteriaceae (Asai, Iizuka & Komagata 1962). The organism is distinguished
from other related genera by its ability to use citrate and malonate, decarboxylate lysine and
ornithine and to produce large quantities of α-ketoglutaric acid during the fermentation of
glucose. Kluyvera grows well in ordinary culture media, and its colonies resemble those of
Escherichia (Kluyver & Van Niel 1936). No specific virulence factor has been identified, but
like other Enterobacteriaceae, the organism has a lipopolysaccharide complex and surface
antigens that may confer virulence. The genus has 3 species: Kluyvera ascorbata, the type
species of the genus and the species most frequently isolated in clinical specimens; Kluyvera

37
cryocrescens, a strain found predominantly in the environment; and Kluyvera species group
3, a strain infrequently isolated from any source. Kluyvera is present in the environment as
free-living organisms in water, soil, sewage, hospital sinks, and food products of animal
origin. In humans, it is usually isolated from sputum, urine, and stool samples. Kluyvera is
part of the normal flora of the human digestive tract, but it is usually associated with low
bacterial counts. This might explain why its isolation in clinical infections is rare. It is
unknown whether Kluyvera infections are predominantly endogenous or environmentally
acquired or whether both routes are equally important. In 2001, Sarria, Vidal & Kimbrough
isolated K. ascorbata from 5 cases of infections involving multiple organs and systems.
Escherichia coli
Escherichia coli (abbreviated as E. coli) are a large and diverse group of bacteria found in the
gut of humans and ruminants. Although most strains of E. coli are harmless, others are
capable of causing diseases. Virulent strains of E. coli can cause gastroenteritis, urinary tract
infections, and neonatal meningitis. In rare cases, virulent strains are also responsible for
hæmolytic-uremic syndrome (HUS), peritonitis, mastitis, septicemia and Gram-negative
pneumonia (Todar 2008:2). Still other kinds of E. coli are used as markers for water
contamination (USEPA 1985:4).
Some kinds of E. coli cause disease by making a toxin called Shiga toxin. The bacteria that
make these toxins are called “Shiga toxin-producing” E. coli or STEC for short. This group
are also called verocytotoxic E. coli (VTEC) or enterohemorrhagic E. coli (EHEC); these all
refer generally to the same group of bacteria (Karch,Tarr, Bielaszewska 2005:415). The most
commonly identified STEC in North America is E. coli O157:H7 (often shortened to E. coli
O157 or even just “O157”). Usually news reports about outbreaks of “E. coli” infections
mostly refer to E. coli O157. This particular strain is linked to the 2006 United States E. coli
outbreak of fresh spinach. Severity of the illness varies considerably; it can be fatal,
particularly to young children, the elderly or the immuno-compromised, but is more often
mild. Earlier, poor hygienic methods of preparing meat in Scotland killed seven people in
1996 due to E. coli poisoning, and left hundreds more infected (Dundas, Todd, Stewart,
Murdoch, Chaudhuri & Hutchinson 2001: 929).
In addition to E. coli O157, many other kinds (called serogroups) of STEC cause disease.
These other kinds are sometimes called “non-O157 STEC.” E. coli serogroups O26, O111,
38
and O103 are the non-O157 serogroups that most often cause illness in people in the United
States. Around 5–10% of those who are diagnosed with STEC infection develop a potentially
life-threatening complication known as hemolytic uremic syndrome (HUS) which could lead
to kidney failure and death. Infection is usually as a result of ingestion of the organism
(WHO 2002:1).
Serratia spp.
Serratia species are opportunistic Gram-negative bacteria classified in the tribe Klebsielleae
and the large family Enterobacteriaceae. Serratia marcescens is the primary pathogenic
species of Serratia. Rare reports have described disease resulting from infection with Serratia
plymuthica, Serratia liquefaciens,
Serratia rubidaea,
and Serratia odorifera (Hejazi &
Falkiner 1997: 903).
Some strains of S. marcescens are capable of producing a pigment called prodigiosin, which
ranges in colour from dark red to pale pink, depending on the age of the colonies. S
marcescens has a predilection for growth on starchy foodstuffs, where the pigmented
colonies are easily mistaken for drops of blood (Bennett & Bentley 2000: 2). In the hospital,
Serratia species tend to colonize the respiratory and urinary tracts, rather than the
gastrointestinal tract in adults and is responsible for most catheter-associated bacteraemia
cases. Since 1950, S. marcescens has steadily increased as a cause of human infection, with
many strains resistant to multiple antibiotics (Hejazi & Falkiner 1997: 907).
Serratia infection is responsible for about 1.4% of nosocomial infections of the bloodstream,
lower respiratory tract, urinary tract, surgical wounds, skin and soft tissues in adult patients
in the United States. Outbreaks of S. marcescens meningitis, wound infections, and arthritis
have occurred in pediatric wards (Ania 2008:1; Auwaerter 2007:1). S. marcescens can cause
infection in several sites, including the urinary tract, respiratory tract, wounds, and the eye,
where it may cause conjunctivitis, keratitis, endophthalmitis and tear duct infections (Cohen,
Flynn & Miller 1997: 195). It is also a rare cause of endocarditis and osteomyelitis
(particularly in people who use intravenous drugs recreationally), pneumonia and meningitis.
Most S. marcescens strains are resistant to several antibiotics because of the presence of R-
factors all are considered intrinsically resistant to ampicillin, macrolides, and first-generation
cephalosporins such as cefalexin (Ania 2008:1; Auwaerter 2007:1).
39
Serratia ficaria was first described in 1979 by Grimont, Grimont & Starr. S. ficaria produces
non-pigmented, lactose-negative colonies which give off a potato-like odour. This odour is a
primary feature of S. ficaria and distinguishes it from S. plymuthica and S. marcescens. In
1994, Darbas, Jean-Pierre & Paillisson showed that S. ficaria caused septicaemia as observed
from blood cultures collected post operation for antrectomy.
Citrobacter freundii
Citrobacter species are members of the aerobic Enterobacteriaceae family, Gram-negative
bacilli commonly found in water, soil, food and the intestinal tracts of animals and humans
(Gupta, Yadav, Chaoudhary & Arora 2003: 765; Forbes, Sahm & Weissfeld 2002: 617).
Citrobacter species use citrate as a carbon source. Citrobacter species have the ability to
accumulate uranium by building phosphate complexes. Citrobacter freundii has also been
investigated for biodegradation of tannic acid used in tanneries.
Citrobacter species cause a wide spectrum of infections in the urinary tract, blood, superficial
wounds, skin, peritoneum and several other normally sterile sites; most frequently, their
hosts
are hospitalized and immuno-compromised patients (Gupta et al., 2003:765; Forbes et al.,
2002: 617; Kim, Woo, Ryu & Kim 2003: 202). Citrobacter freundii and Citrobacter
diversus are often the cause of these opportunistic infections. Citrobacter spp. cause neonatal
meningitis but are unique in their frequent association with brain abscess formation. They
also can cause infections of the urinary tract infections and nosocomial pneumonia (hospital
pneumonia) (Kim et al., 2003)
Salmonella spp.
Salmonella is a genus of rod-shaped, Gram-negative, non-spore forming, predominantly
motile Enterobacteria that are peritrichously flagellated. Salmonella are facultative anaerobes
and are closely related to the Escherichia genus and are found worldwide in warm and cold-
blooded animals, in humans, and in nonliving habitats. They cause illnesses in humans and
many animals, such as typhoid fever, paratyphoid fever, and the food-borne illness
salmonellosis (Ryan & Ray 2004: 362 - 8). Salmonella infections are zoonotic; they can be
transmitted by humans to animals and vice versa. Infection via food is also possible. A
distinction is made between enteritis Salmonella and typhoid/paratyphoid Salmonella,
whereby the latter because of a special virulence factor and a capsule protein (virulence
40
antigen) can cause serious illness, such as Salmonella enterica subsp. enterica serovar Typhi,
or Salmonella typhi). Salmonella typhi is adapted to humans and does not occur in animals
(Ryan & Ray 2004: 362 - 8).
According to the Centre for food security and public safety (2005:8); enteritis Salmonella
(e.g., Salmonella enterica subsp. enterica serovar Enteritidis) can cause diarrhoea, which
usually does not require antibiotic treatment. However, people at risk such as infants, small
children, the elderly, HIV patients and those with suppressed immunity can become seriously
ill. Children with sickle cell anemia who are infected with salmonella may develop
osteomyelitis.
Salmonellosis is one of the most common and widely distributed food borne diseases. It
constitutes a major public health burden and represents a significant cost in many countries.
Millions of human cases are reported worldwide every year and the disease results in
thousands of deaths. Since the beginning of the 1990s, strains of Salmonella which are
resistant to a range of antimicrobials, including first-choice agents for the treatment of
humans, have emerged and are threatening to become a serious public health problem. This
resistance results from the use of antimicrobials both in humans and animal husbandry.
Multi-drug resistance to "critically important antimicrobials" are compounding the problems
(WHO 2005:1).
Research done in 1979/80 and 1989/90 identified Salmonella isolates (Salmonella
typhimurium definitive type 104) that were exhibiting antibiotic and multidrug resistance to
ampicillin, chloramphenicol, streptomycin, sulfonamides and tetracycline (Lee, Puhr,
Maloney, Bean & Taupe 1994: 128 - 34; Angulo 1997: 414).
Aeromonas hydrophila
Aeromonas hydrophila is a heterotrophic, Gram-negative, rod shaped bacterium with polar
flagella, mainly found in areas with a warm climate. This bacterium can also be found in
fresh, salt, marine, estuarine, chlorinated, and un-chlorinated water. Aeromonas hydrophila
can survive in aerobic and anaerobic environments. This bacterium can digest materials such
as gelatin, and haemoglobin. This bacterium is the most well known of the six species of
Aeromonas. It is also very hard to kill, because it is a very resistant bacterium. Aeromonas
hydrophila is resistant to chlorine, refrigeration or cold temperatures (Hayes 2008:1). The

41
toxicity of this species comes from its structure. When it enters the body of its victim, it
travels through the bloodstream to the first available organ. It produces Aerolysin Cytotoxic
Enterotoxin (ACT), a toxin that can cause tissue damage (Chopra, Xu, Ribardo, Gonzalez,
Kuhl, Peterson & Houston 2000: 2808). It is known as a pathogenic bacterium. Aeromonas
hydrophila, Aeromonas caviae and Aeromonas sobria are all considered to be “opportunistic
pathogens,” meaning they only infect hosts with weakened immune responses. Though
Aeromonas hydrophila is considered a pathogenic bacterium, scientists have not been able to
prove that it is the actual cause of some of the diseases it is associated with. It is believed that
this bacterium aids in the infection of diseases, but does not cause the diseases themselves.
Aeromonas hydrophila also excretes extracellular proteins which are toxic to other cells.
These are aerolysin, glycerophospholipid:cholesterol acyltransferase (GCAT), and serine
protease. Another major chemical that contributes to pathogenicity is hemolysin (Chopra et
al., 2000: 2808 - 2818; Hayes 2008:1).
Aeromonas hydrophila can cause both intestinal and non-intestinal infections in humans, and
can often be fatal (Chopra & Clifford 1999: 1130). Some of the diseases that Aeromonas
hydrophila and other Aeromonas species can cause include: septicemia, meningitis,
pneumonia, and gastroenteritis (FDA 2008:1; Farmer, Arduino & Hickman-Brenner 2005:
3028; Kirov & Hayward 1993: 54 - 58). There are many factors influencing the toxicity of
Aeromonas hydrophila. For example, this species is able to resist complement-mediated lysis.
It has been suggested that Aeromonas hydrophila causes human diarrhea, but this has not yet
been verified. The research of Albert, Ansaruzzaman, Talukder, Chopra, Kuhn, Rahman,
Faruque, Islam, Sack & Mollby (2000: 3785 - 90) indicates mixed infections, which has been
illustrated in a previous study as well. This finding suggests that Aeromonas organisms are
not true pathogens, but work with others to produce infection. There are three major wound
infections caused by Aeromonas hydrophila: cellulitis, myonecrosis, and ecthyma
gangrenosum. Cellulitis is the most common, and occurs as the result of injury or sepsis.
Myonecrosis and ecthyma gangrenosum are less common, and tend to occur in immuno-
compromised individuals. However, Aeromonas hydrophila is a very prevalent species, and is
capable of affecting immuno-competent people as well. At one point, it was believed this
species did not pose a threat to healthy individuals, but the work of Chopra & Clifford
(1999:1137) illustrates that Aeromonas hydrophila is more harmful than was previously
believed. Aeromonas hydrophila is resistant to many common antibiotics such as penicillin
and ampicillin (FDA 2008:1).
42
As a consequence of its prevalence in aquatic environments, Aeromonas hydrophila can
cause serious pathology in fish. It can cause tail rot, fin rot, haemorrhagic septicaemia, scale
protrusion disease, and ulcer disease. Systemic infections usually attack the liver or kidneys.
Aeromonas hydrophila is also responsible for a disease called Red Leg, which occurs in
Xenopus species of frogs. This disease causes internal haemorrhaging, and is often fatal. It is
similar to haemorrhagic septicaemia, which is also known as Red-Sore Disease. However,
Aeromonas hydrophila is naturally found in fish gut. Infection from this bacterium is usually
the result of stress (Cipriano 2001:1). Work done by King (2000:1) showed the development
of resistance to oxytetracycline by Aeromonas spp. as a result of its use in aquaculture.
Raoultella ornithinolytica
Raoultella ornithinolytica (formerly Klebsiella ornithinolytica) is a Gram-negative aerobic
bacillus in the family Enterobacteriaceae. This species has been related to histamine-
producing bacteria causing subsequent fish poisoning (Kanki, Yoda, Tsukamoto & Shibata
2002: 3462). R. ornithinolytica has also been isolated from dentin of infected root canals
(Nakajo, Nakazawa, Iwaku & Hoshino 2004: 390). Human infections caused by bacteria of
the genus Raoultella are infrequent, and spontaneously occurring bacteraemia cases have not
been reported. However, Morais, Daporta, Bao, Campello & Andrés (2009: 869) presented a
case of enteric fever-like syndrome and bacteraemia caused by R. ornithinolytica. R.
ornithinolytica is an uncommon cause of enteric fever-like syndrome characterized by fever,
headache, and abdominal pain that may be clinically indistinguishable from enteric fever
caused by Salmonella enterica serovar Typhi or other salmonellae (Morais et al. 2009: 869).
R. ornithinolytica has been isolated from the gut of fish, ticks, and termites and from
estuarine water (Henriques, Fonseca, Alves, Saavedra, Correia 2006: 938; Kamanda Ngugi,
Khamis Tsanuo, Iddi Boga 2007: 87; Montasser 2005: 95), and it has been shown to produce
histamine, contributing to fish poisoning (Becker, Southwick, Reardon, Berg, MacCormack
2001: 1327; Kanki et al., 2002: 3463; Lopéz-Sabater, Rodriguez-Jerez, Hernandez-Herrero &
Mora-Ventura 1996: 416). Fish poisoning (scombroid syndrome) has been associated with
the consumption of scombroid fish, such as tuna, bonito, sardine, and mackerel. Klebsiella
pneumoniae and Klebsiella oxytoca are the best-known histamine-producing bacteria in fish.
However, many of the histamine-producing bacteria from fish first identified as K.
pneumoniae or K. oxytoca by commercialized systems were later correctly identified as
Raoultella planticola as a result of additional tests (Kanki et al. 2002: 416). Histamine
43
(scombroid toxin) poisoning occurs when persons ingest fish in which the bacteria have
converted histidine to histamine, a process that can usually be controlled by storage at low
temperatures. Scombroid syndrome has an incubation period of 1 min to 3 hours after eating
tuna or other fish and manifests with facial flushing, dizziness, vomiting, diarrhoea, other
gastrointestinal symptoms, dyspnea, headache, burning of the mouth, urticaria, and
generalized pruritus, but the symptoms usually resolve in a few hours (Becker et al. 2001:
1329; Swaminathan, Beebee & Besser 1999: 174 - 190).
R. ornithinolytica has been shown to be resistant in vitro to ampicillin and other commonly
used antibiotics (Hostacká & Klokocniková 2001: 117). This resistance can be associated
with the presence of β-lactamases (Walckenaer, Poirel, Leflon-Guibout, Nordmann & Niolas-
Chanoine 2004: 311).
2.13 Purpose and aims of study
The general aim of this study is to investigate the presence of antibiotic resistant coliforms in
the Rietspruit River, which is a major source of water to the inhabitants of the Sebokeng area
and a significant source of water to the Gauteng province in general.
The objectives are to:
1. Determine the number of types of antibiotic resistant coliforms at three different
sampling points at different times of the year 2009;
2. Ascertain if there are any number of types of multiple antibiotic resistances present in
coliforms at these sampling points;
This study may contribute to:
1. Providing data on antibiotic resistance as a tool to enable the authorities to take
precautions that will prevent the spread of antibiotic resistant bacteria; and
2. Enabling the public to realise the consequences of the spread of antibiotic resistance
among bacteria.
44
CHAPTER 3
MATERIALS AND METHODS
3.1 Introduction to Materials and Methods
The materials and methods used in this study to isolate Gram-negative bacteria, specifically
coliforms, showing multiple drug resistance are described in this chapter.
3.2 Study Area
The study area was a portion of the Rietspruit River located within the premises of the
Sebokeng Waste Water Care Works Emfuleni and the downstream which is located within an
informal settlement in the Sebokeng Area.
Sampling Point 1 (Upstream): The upstream of the Rietspruit River has two branches; the
Eastern branch flows from Johannesburg through Bushkoppies, Goudkoppies, Orange farm,
Ennerdale, Evaton and Sebokeng. The Western branch comes through Mogale (Krugersdorp)
and Carltonville. These areas have large concentrations of mine lands and as a result
contribute alkalinity to the river water from chemical run-off used in gold purification
processes. Along this route are informal settlements and this river serves as their source of
domestic water supply. This also impacts on the final constitution of the river as waste water
both industrial and domestic are dumped into this water body.
Sampling Point 2 (Final Effluent): These samples were taken from the final effluent after
treatment in the Water Works; this treatment includes collecting the river water in quantities
as large as 150 mega-litres into maturation ponds and settling tanks where sedimentation
takes place and the natural process of aerobiosis and anaerobiosis allows the majority of the
microorganisms to die off. The final stage of treatment is chlorination. A limitation to the
chlorination process is that it is costly and in some instances it is by-passed.
Sampling Point 3 (Down Stream): The water, after treatment, is discharged back into the
river. The river downstream of the treatment plant also flows through the Sebokeng area.
Along this route are informal settlements with a significant presence of livestock (cattle)
reared by members of the informal settlement.
45
These sampling points were chosen for the study because water from the Rietspruit River,
after purification, is used for human consumption, recreational purposes, agricultural and
industrial uses. Although, the Downstream receives water from the sewage treatment plant
after treatment; majority of the informal settlements along the Rietspruit River route still
dump both human and domestic waste into the water body without prior treatment and this is
a definite way of introducing faecal contamination. As a result it is of the utmost importance
to investigate the microbiological quality of water from this source. Undesirable water quality
can impact negatively on human health. Prevalence of drug-resistant coliforms in water
supplies requires re-evaluation of water quality standards as well as the introduction of a
more advanced purification process for sewage before discharge into the environment.
3.3 Sampling
Water samples were collected from all three sampling areas during three seasons in a year i.e.
winter, spring and summer (February, June and September) of 2009. Water samples were
collected in 1000ml sterile glass bottles on the same day within a 2-hour period and brought
back to the laboratory. Some onsite analyses (pH, temperature and turbidity) were carried out
at the sampling point. The elapsed time between collection and processing was less than two
hours. Water samples for later analyses were stored in a refrigerator at 4oC. Water samples
were collected from shallow areas by directly dipping the bottles into the surface of the water.
A volume of 100ml of water was taken after shaking the bottles and was filtered through
membrane filters. These membrane filters were placed on plates of m.FC agar, a dehydrated
medium manufactured by Merck used in the selective isolation of faecal coliforms. The
composition of m.FC is given in Appendix A.
3.4 Processing of the Water Samples.
3.4.1 Chemical Oxygen Demand (COD).
In environmental chemistry, the chemical oxygen demand (COD) test is commonly used to
indirectly measure the amount of organic compounds in water. Most applications of COD
determine the amount of organic pollutants found in surface water (e.g. lakes and rivers),
making COD a useful measure of water quality. It is expressed in milligrams per litre (mg/L),
which indicates the mass of oxygen consumed per litre of solution. Because COD measures
46
the oxygen demand of organic compounds in a sample of water, it is important that no
outside organic material be accidentally added to the sample to be measured. To control for
this, a so-called blank sample is required in the determination of COD (and BOD, for that
matter). A blank sample is created by adding all reagents (e.g. acid and oxidizing agent) to a
volume of distilled water. COD is measured for both the water and blank samples, and the
two are compared. The oxygen demand in the blank sample is subtracted from the COD for
the original sample to ensure a true measurement of organic matter. The COD level can be
determined more readily than BOD, but this measurement does not indicate how much of the
waste can be decomposed by biological oxidation. Simply put, the higher the COD: the
higher the water pollution.
A volume of 2ml of sample water was added to each test-tube containing commercial
reagents; (1) Nanocolor® CSB 40 with COD measuring range of 2 – 40mg/l, (2) Nanocolor®
CSB with COD measuring range of 15 – 160mg/l and (3) Nanocolor® CSB with COD
measuring range of 100 – 1500mg/l. The COD digester (Nanocolor® Vario 3) was
programmed for 2 hours at a temperature of 120oC. The test-tubes were left to cool after
which the COD of each of the samples at various ranges was taken in a COD meter
(Macherey-Nagel Nanocolor® 500D).
3.4.2 Biological Oxygen Demand (BOD).
BOD is the measure of the amount of oxygen taken up by aerobic microorganisms that
decompose organic waste matter in water. It is therefore used as a measure of the amount of
certain types of organic pollutant in water. BOD is calculated by keeping a sample of water
containing a known amount of oxygen for five days at 20°C. The oxygen content is measured
again after this time. A high BOD indicates the presence of a large number of
microorganisms, which suggests a high level of pollution. It is used in water quality
management and assessment, ecology and environmental science. BOD is not an accurate
quantitative test, although it could be considered as an indication of the quality of a water
source. BOD can be used as a gauge of the effectiveness of wastewater treatment plants. The
BOD5 test measures the rate of oxygen uptake by micro-organisms in a sample of water at a
temperature of 20°C and over an elapsed period of five days in the dark. In theory the
expected BOD5 value is approximately 80% of the COD value.
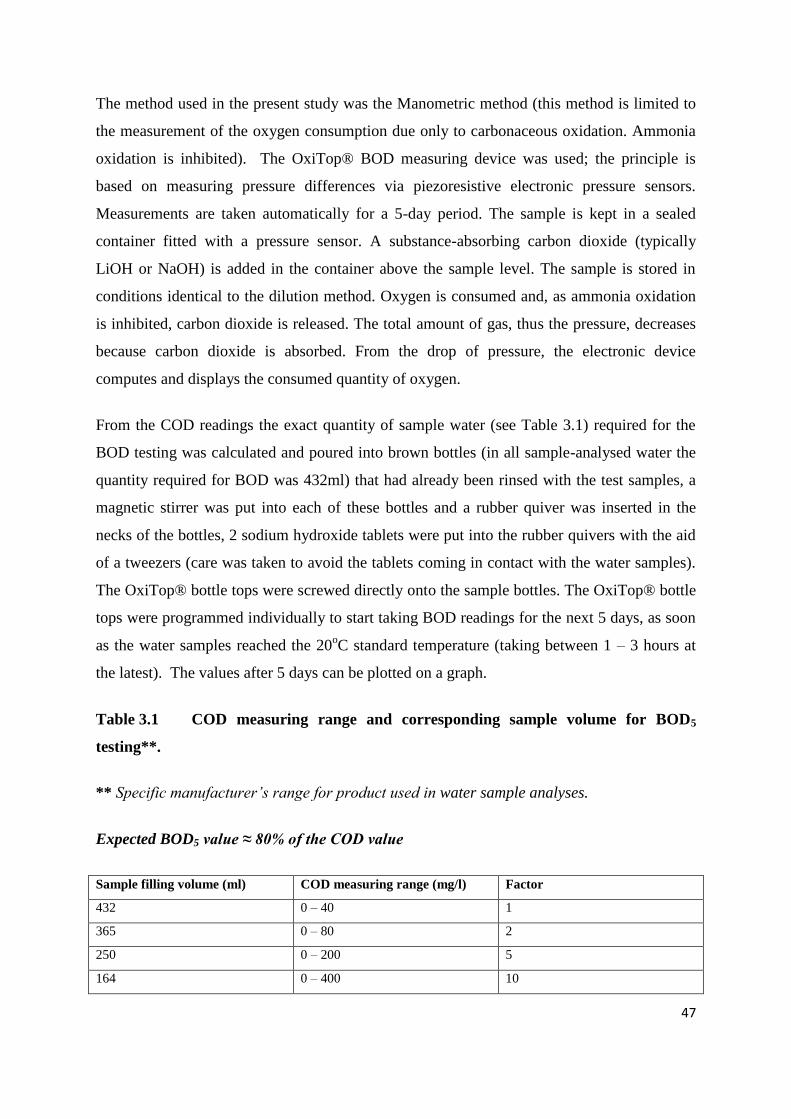
47
The method used in the present study was the Manometric method (this method is limited to
the measurement of the oxygen consumption due only to carbonaceous oxidation. Ammonia
oxidation is inhibited). The OxiTop® BOD measuring device was used; the principle is
based on measuring pressure differences via piezoresistive electronic pressure sensors.
Measurements are taken automatically for a 5-day period. The sample is kept in a sealed
container fitted with a pressure sensor. A substance-absorbing carbon dioxide (typically
LiOH or NaOH) is added in the container above the sample level. The sample is stored in
conditions identical to the dilution method. Oxygen is consumed and, as ammonia oxidation
is inhibited, carbon dioxide is released. The total amount of gas, thus the pressure, decreases
because carbon dioxide is absorbed. From the drop of pressure, the electronic device
computes and displays the consumed quantity of oxygen.
From the COD readings the exact quantity of sample water (see Table 3.1) required for the
BOD testing was calculated and poured into brown bottles (in all sample-analysed water the
quantity required for BOD was 432ml) that had already been rinsed with the test samples, a
magnetic stirrer was put into each of these bottles and a rubber quiver was inserted in the
necks of the bottles, 2 sodium hydroxide tablets were put into the rubber quivers with the aid
of a tweezers (care was taken to avoid the tablets coming in contact with the water samples).
The OxiTop® bottle tops were screwed directly onto the sample bottles. The OxiTop® bottle
tops were programmed individually to start taking BOD readings for the next 5 days, as soon
as the water samples reached the 20oC standard temperature (taking between 1 – 3 hours at
the latest). The values after 5 days can be plotted on a graph.
Table 3.1 COD measuring range and corresponding sample volume for BOD5
testing**.
** Specific manufacturer’s range for product used in water sample analyses.
Expected BOD5 value ≈ 80% of the COD value
Sample filling volume (ml) COD measuring range (mg/l) Factor
432 0 – 40 1
365 0 – 80 2
250 0 – 200 5
164 0 – 400 10
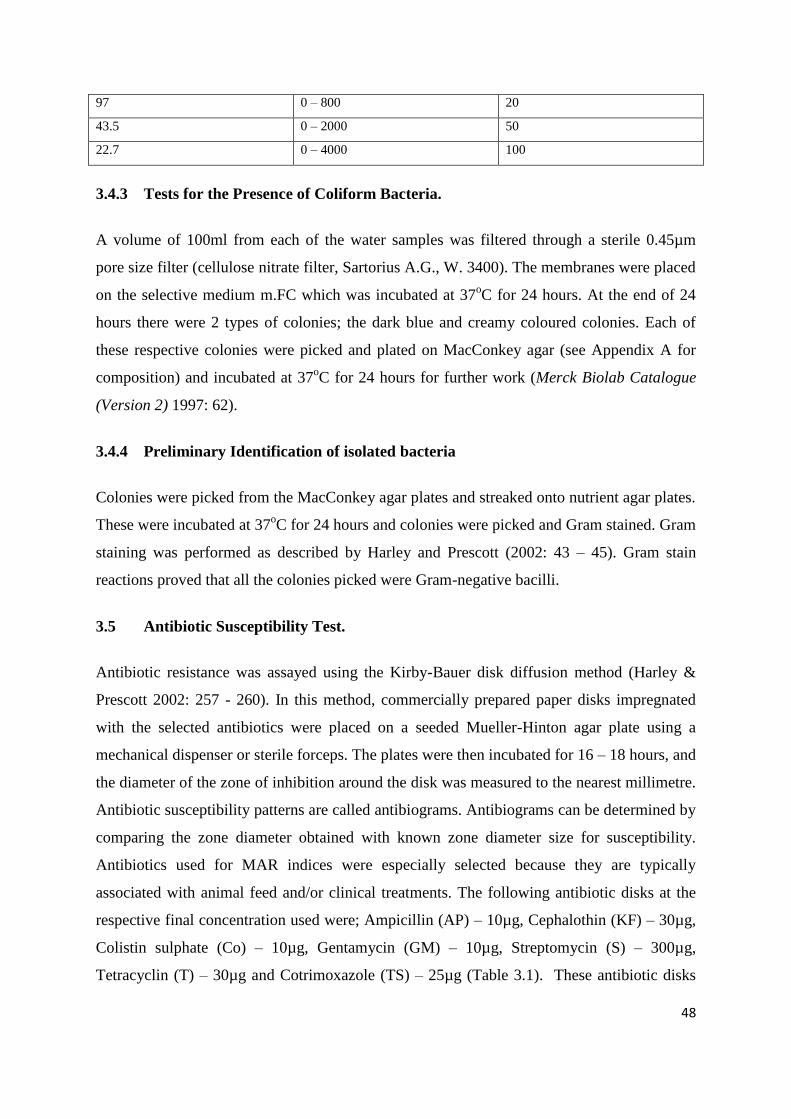
48
97 0 – 800 20
43.5 0 – 2000 50
22.7 0 – 4000 100
3.4.3 Tests for the Presence of Coliform Bacteria.
A volume of 100ml from each of the water samples was filtered through a sterile 0.45µm
pore size filter (cellulose nitrate filter, Sartorius A.G., W. 3400). The membranes were placed
on the selective medium m.FC which was incubated at 37oC for 24 hours. At the end of 24
hours there were 2 types of colonies; the dark blue and creamy coloured colonies. Each of
these respective colonies were picked and plated on MacConkey agar (see Appendix A for
composition) and incubated at 37oC for 24 hours for further work (Merck Biolab Catalogue
(Version 2) 1997: 62).
3.4.4 Preliminary Identification of isolated bacteria
Colonies were picked from the MacConkey agar plates and streaked onto nutrient agar plates.
These were incubated at 37oC for 24 hours and colonies were picked and Gram stained. Gram
staining was performed as described by Harley and Prescott (2002: 43 – 45). Gram stain
reactions proved that all the colonies picked were Gram-negative bacilli.
3.5 Antibiotic Susceptibility Test.
Antibiotic resistance was assayed using the Kirby-Bauer disk diffusion method (Harley &
Prescott 2002: 257 - 260). In this method, commercially prepared paper disks impregnated
with the selected antibiotics were placed on a seeded Mueller-Hinton agar plate using a
mechanical dispenser or sterile forceps. The plates were then incubated for 16 – 18 hours, and
the diameter of the zone of inhibition around the disk was measured to the nearest millimetre.
Antibiotic susceptibility patterns are called antibiograms. Antibiograms can be determined by
comparing the zone diameter obtained with known zone diameter size for susceptibility.
Antibiotics used for MAR indices were especially selected because they are typically
associated with animal feed and/or clinical treatments. The following antibiotic disks at the
respective final concentration used were; Ampicillin (AP) – 10µg, Cephalothin (KF) – 30µg,
Colistin sulphate (Co) – 10µg, Gentamycin (GM) – 10µg, Streptomycin (S) – 300µg,
Tetracyclin (T) – 30µg and Cotrimoxazole (TS) – 25µg (Table 3.1). These antibiotic disks
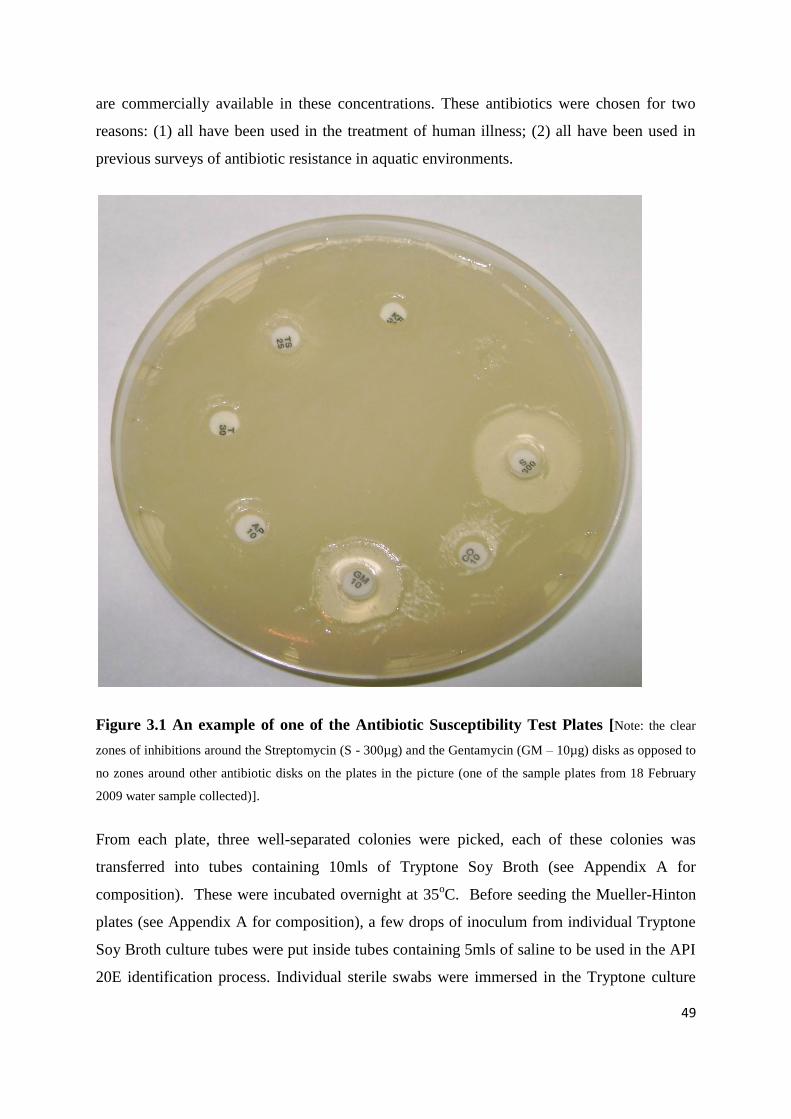
49
are commercially available in these concentrations. These antibiotics were chosen for two
reasons: (1) all have been used in the treatment of human illness; (2) all have been used in
previous surveys of antibiotic resistance in aquatic environments.
Figure 3.1 An example of one of the Antibiotic Susceptibility Test Plates [Note: the clear
zones of inhibitions around the Streptomycin (S - 300µg) and the Gentamycin (GM – 10µg) disks as opposed to
no zones around other antibiotic disks on the plates in the picture (one of the sample plates from 18 February
2009 water sample collected)].
From each plate, three well-separated colonies were picked, each of these colonies was
transferred into tubes containing 10mls of Tryptone Soy Broth (see Appendix A for
composition). These were incubated overnight at 35oC. Before seeding the Mueller-Hinton
plates (see Appendix A for composition), a few drops of inoculum from individual Tryptone
Soy Broth culture tubes were put inside tubes containing 5mls of saline to be used in the API
20E identification process. Individual sterile swabs were immersed in the Tryptone culture

50
tubes and used to streak the entire surface of plates of Mueller-Hinton. These cultures were
left to dry for 10 minutes with their lids in place. A multiple dispenser was used to place the
antibiotic disks on the seeded plates. These plates were incubated for 18hours at 35oC. After
this period of incubation individual zones of inhibition were measured and recorded.
Table 3.2: Antibiotics used in this study
Antibiotics used Disk
concentration(µg)
Class
AP Ampicillin 10 β – Lactams
KF Cephalothin 30 β – Lactams
Co Colistin sulphate 10 Peptide antibiotics
GM Gentamycin 10 Aminoglycosides
S Streptomycin 300 Aminoglycosides
T Tetracycline 30 Tetracyclines
TS Cotrimoxazole 25 Sulphonamides
3.6 Identification of organisms using the API 20E System
The organisms isolated from the Rietspruit River using the m.FC media were identified using
the API 20E system. The API 20E system is a rapid but standardized, miniaturized version of
conventional biochemical procedures used in the identification of Enterobacteriaceae and
other gram-negative bacteria. A total of 127 taxa can be identified with this system. It is a
ready-to-use microtube system that performs 21 standard biochemical tests on pure cultures
from appropriate primary isolation media. This system consists of a strip containing 20
chambers, each consisting of a microtube and a depression called a cupule. The tubes contain
dehydrated substrates. The substrates are rehydrated by adding a bacterial saline suspension.
The system includes tests that require anaerobic conditions; to achieve this condition, sterile
mineral oil is added to several of the microtubes. The strip was incubated for 18 to 24 hours
at 35o to 37
oC so that the bacterium can act on the substrates. The strip was read by noting the
colour changes after the various indicator systems had been affected by the metabolites or
added reagents. The identification of the unknown bacterium was achieved by determining a
seven-digit profile index number and consulting the API 20E Profile Recognition System or
the API 20E Profile Index Booklet. On the result sheet, the tests were separated into groups of
3 and a value of 1, 2 or 4 was indicated for each. By adding the value corresponding to

51
positive reactions within each group, a 7-digit profile number was obtained for the 20 tests of
the API 20E strip. The oxidase reaction constituted the 21st test and had a value of 4 if it was
positive.
Table 3.3 API 20E tests with their corresponding numerical value
ONPG ADH LDC ODC CIT H2S URE TDA IND VP GEL GLU MAN INO SOR RHA SAC MEL AMY ARA OXI
1 2 4 1 2 4 1 2 4 1 2 4 1 2 4 1 2 4 1 2 4
Sterile disposable pipettes were used to transfer drops of inoculum (from the overnight
growth in the Tryptone Soy Broth used to seed the Mueller-Hinton plates) into 5ml of 0.85%
saline solutions in sterile test tubes. These were shaken and then drops of the bacterial
suspension were used to fill the tubes labelled ONPG, TDA, IND, GLU, MAN, INO, SOR,
RHA, SAC, MEL, AMY and ARA microtubes. The tubes labelled ADH, LDC, ODC, H2S
and URE were slightly under-filled and then completely filled with sterile mineral oil. Both
the tubes and cupules were filled for the tubes |CIT|, |VP| and |GEL| tubes. These strips were
incubated in plastic trays containing about 5ml of water (to create humidity and prevent
dehydration) at 35oC for 24 hours. After the 24 hours incubation period the colour changes
for the reactions that did not require the addition of reagents were recorded and allocated the
corresponding numerical value (Table 3.3). To the TDA tubules 1 drop of TDA reagent was
added, a reddish brown colour indicates a positive reaction. To the |VP| tubules 1 drop each
of VP1 and VP2 reagents were added and results were read after 10 minutes, a pink to red
colour indicates a positive reaction. Finally to the IND tubules 1 drop of JAMES reagent was
added, a pink colour indicated positive reaction. All reaction results were noted and the
numerical values were added up to get the corresponding 7-digit profile number which was
used to identify the unknown coliforms.
Table 3.4 Chemical / Physical Principles – Basis for the API 20E System
TESTS ACTIVE
INGREDIENTS
QUANTITY REACTION/ENZYMES CHEMICAL/PHYSICAL
PRINCIPLE
ONPG
2-nitrophenyl-βD-
galactopyranoside
0.2mg
β-galactosidase (Ortho
nitrophenyl-βD
galactopyranosidase)
Hydrolysis of ONPG by beta-
galactosidase releases yellow
orthonitrophenol from the colourless
ONPG; ITPG
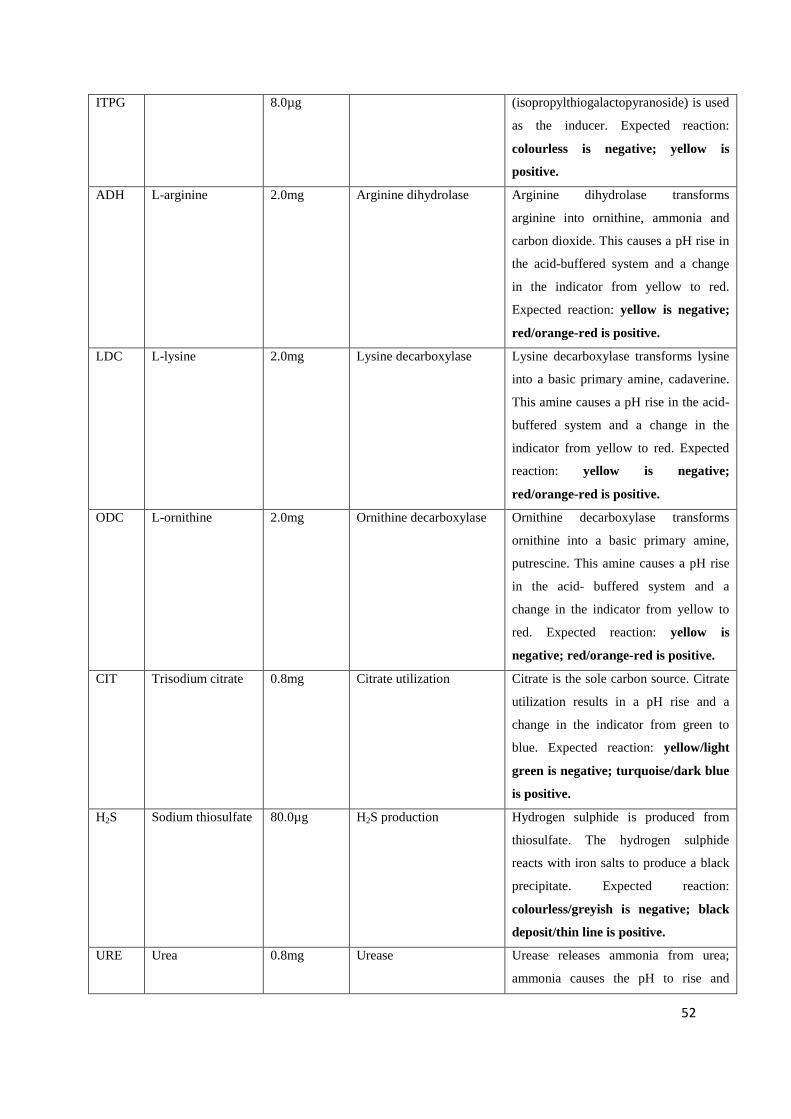
52
ITPG 8.0µg (isopropylthiogalactopyranoside) is used
as the inducer. Expected reaction:
colourless is negative; yellow is
positive.
ADH L-arginine 2.0mg Arginine dihydrolase Arginine dihydrolase transforms
arginine into ornithine, ammonia and
carbon dioxide. This causes a pH rise in
the acid-buffered system and a change
in the indicator from yellow to red.
Expected reaction: yellow is negative;
red/orange-red is positive.
LDC L-lysine 2.0mg Lysine decarboxylase Lysine decarboxylase transforms lysine
into a basic primary amine, cadaverine.
This amine causes a pH rise in the acid-
buffered system and a change in the
indicator from yellow to red. Expected
reaction: yellow is negative;
red/orange-red is positive.
ODC L-ornithine 2.0mg Ornithine decarboxylase Ornithine decarboxylase transforms
ornithine into a basic primary amine,
putrescine. This amine causes a pH rise
in the acid- buffered system and a
change in the indicator from yellow to
red. Expected reaction: yellow is
negative; red/orange-red is positive.
CIT Trisodium citrate 0.8mg Citrate utilization Citrate is the sole carbon source. Citrate
utilization results in a pH rise and a
change in the indicator from green to
blue. Expected reaction: yellow/light
green is negative; turquoise/dark blue
is positive.
H2S Sodium thiosulfate 80.0µg H2S production Hydrogen sulphide is produced from
thiosulfate. The hydrogen sulphide
reacts with iron salts to produce a black
precipitate. Expected reaction:
colourless/greyish is negative; black
deposit/thin line is positive.
URE Urea 0.8mg Urease Urease releases ammonia from urea;
ammonia causes the pH to rise and
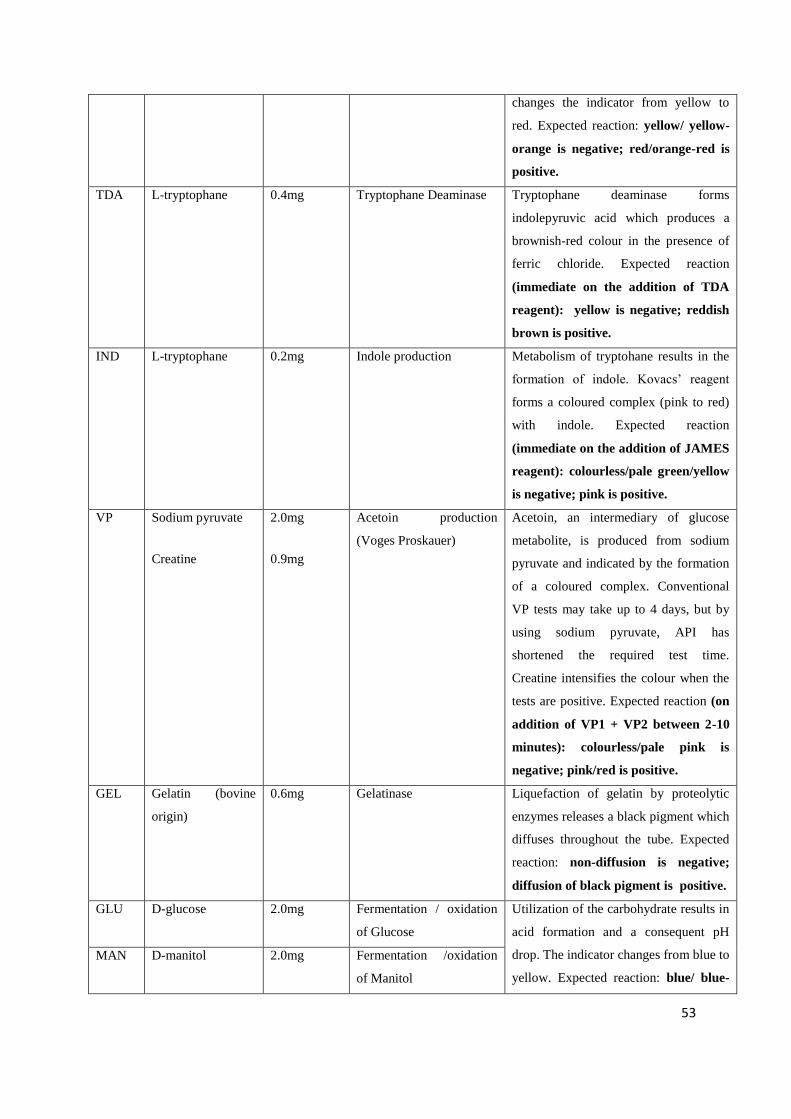
53
changes the indicator from yellow to
red. Expected reaction: yellow/ yellow-
orange is negative; red/orange-red is
positive.
TDA L-tryptophane 0.4mg Tryptophane Deaminase Tryptophane deaminase forms
indolepyruvic acid which produces a
brownish-red colour in the presence of
ferric chloride. Expected reaction
(immediate on the addition of TDA
reagent): yellow is negative; reddish
brown is positive.
IND L-tryptophane 0.2mg Indole production Metabolism of tryptohane results in the
formation of indole. Kovacs‟ reagent
forms a coloured complex (pink to red)
with indole. Expected reaction
(immediate on the addition of JAMES
reagent): colourless/pale green/yellow
is negative; pink is positive.
VP Sodium pyruvate
Creatine
2.0mg
0.9mg
Acetoin production
(Voges Proskauer)
Acetoin, an intermediary of glucose
metabolite, is produced from sodium
pyruvate and indicated by the formation
of a coloured complex. Conventional
VP tests may take up to 4 days, but by
using sodium pyruvate, API has
shortened the required test time.
Creatine intensifies the colour when the
tests are positive. Expected reaction (on
addition of VP1 + VP2 between 2-10
minutes): colourless/pale pink is
negative; pink/red is positive.
GEL Gelatin (bovine
origin)
0.6mg Gelatinase Liquefaction of gelatin by proteolytic
enzymes releases a black pigment which
diffuses throughout the tube. Expected
reaction: non-diffusion is negative;
diffusion of black pigment is positive.
GLU D-glucose 2.0mg Fermentation / oxidation
of Glucose
Utilization of the carbohydrate results in
acid formation and a consequent pH
drop. The indicator changes from blue to
yellow. Expected reaction: blue/ blue-
MAN D-manitol 2.0mg Fermentation /oxidation
of Manitol
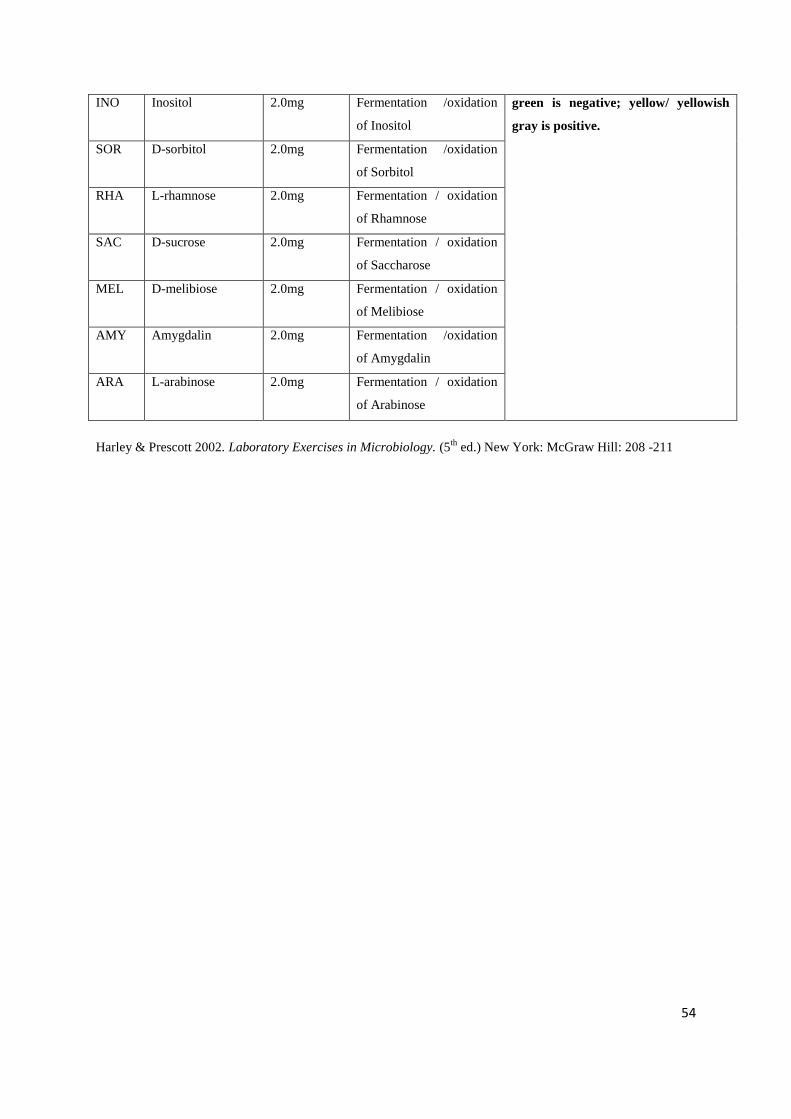
54
INO Inositol 2.0mg Fermentation /oxidation
of Inositol
green is negative; yellow/ yellowish
gray is positive.
SOR D-sorbitol 2.0mg Fermentation /oxidation
of Sorbitol
RHA L-rhamnose 2.0mg Fermentation / oxidation
of Rhamnose
SAC D-sucrose 2.0mg Fermentation / oxidation
of Saccharose
MEL D-melibiose 2.0mg Fermentation / oxidation
of Melibiose
AMY Amygdalin 2.0mg Fermentation /oxidation
of Amygdalin
ARA L-arabinose 2.0mg Fermentation / oxidation
of Arabinose
Harley & Prescott 2002. Laboratory Exercises in Microbiology. (5th
ed.) New York: McGraw Hill: 208 -211
55
CHAPTER 4
RESULTS
4.1 Introduction to Results
A total of 21 different colonies of coliforms isolates from each of the three different sample
points (see section 3.2) were tested against seven different antibiotics for antibiotic resistance
and MAR indices. Gram stains were performed on each colony to confirm them as Gram-
negative bacilli. Biochemical tests which included oxidase tests were done on each isolate
using the API 20E test-kit. The antibiotics used were those commonly added to animal feed
and used clinically. The original results as obtained during the months of February, June and
September 2009, their preliminary tests, resistances as well as the MAR of different bacteria,
are given in Appendix B.
In February, because this was peak summer there was high rainfall; as a result the water flow
surpassed the plant capacity (150 mega litres) therefore making treatment difficult. There was
leaking due to the overflow of the Maturation pond into the treated Final Effluent and this
ended up in the Downstream. The result being that a great deal of untreated water flowed
back into the river. It is pertinent to note that due to rising costs of chlorination, treatment of
water at the facility does not (at times) include this step.
4.2 On-site analysis of water samples
The on-site examination of water samples showed no inconsistencies as the temperature
increase and decrease were consistent with the changing seasons; summer temperatures
(February) were higher than winter (June), while spring temperatures (September) were lower
than summer but higher than winter (Table 4.1). The pH through all the seasonal changes
remained between 7.0 – 7.7(Table 4.1) [WHO standard: 6.5 - 8.5] (WHO 2006). The
Upstream water samples in February showed the highest turbidity (53.4) when compared
with all the months of sample collection.

56
Table 4.1a On-site examination of water samples
SAMPLE
POINTS
pH Temperature (oC) Turbidity (NTU)
Feb. June Sept. Feb. June Sept. Feb. June Sept.
Upstream 7.6 7.0 7.7 22.9 12.5 18.9 53.4 18.5 20.9
Final Effluent 7.3 7.2 7.4 24.3 15.8 19.6 4.4 7.3 10.4
Downstream 7.1 7.1 7.1 25.0 15.4 15.9 27.0 20.5 25.7
The COD and BOD for all the water samples were determined and the results are given in
Table 4.1b. The COD values at the Final Effluent (after treatment) sample point were
consistently higher than those of the other two sampling points through all the months of
sample collection. The Upstream showed its highest COD value of 17 in February; this also
applied to both Final Effluent and Downstream sites with values 29 and 19 respectively. The
BOD at the Downstream sample point was highest (1.7) through all the seasons (and
remained consistent) compared to the other two sample points. All BOD readings were within
the range of the WHO standard of between 0 – 6mg/l (WHO 2006).
Table 4.1b COD and BOD values of water samples
SAMPLE POINTS
COD (mg/l) BOD (mg/l)
Feb. June Sept. Feb. June Sept.
Upstream 17 8 14 1.4 1.4 1.3
Final Effluent 29 16 25 1.1 0.8 1.4
Downstream 19 12 18 1.7 1.7 1.7
4.3 Multiple antibiotic resistance
From the data in Appendix B, it should be noted that all tested isolates exhibited some form
of multiple antibiotic resistance. All tested isolates showed resistance to Ampicillin.
Remarkably, all organisms isolated from Upstream (through different seasonal changes)
showed multiple resistance to three antibiotics; Cephalothin, Ampicillin and Tetracycline.
Susceptibility to Streptomycin and Gentamycin in the Upstream isolates is also remarkable as
resistance to Streptomycin (in less than 15% of isolates) was only achieved in September at
one sample point (Final Effluent whilst with Gentamycin it was achieved in the month of
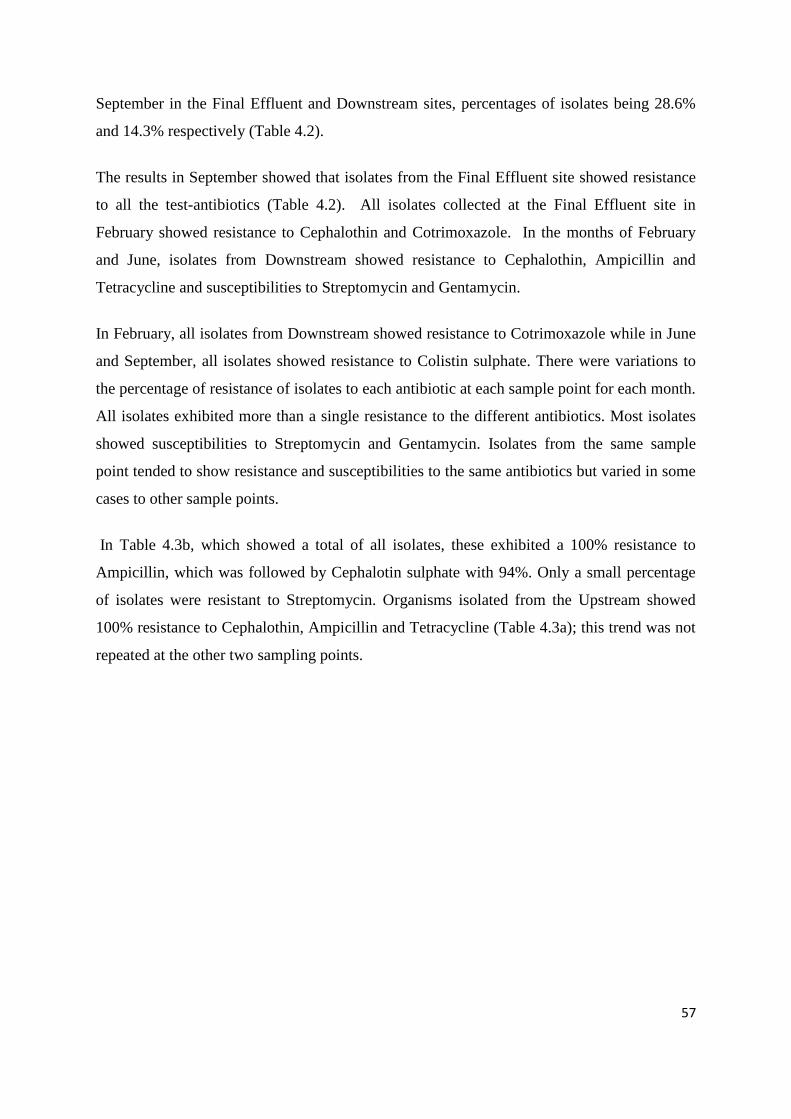
57
September in the Final Effluent and Downstream sites, percentages of isolates being 28.6%
and 14.3% respectively (Table 4.2).
The results in September showed that isolates from the Final Effluent site showed resistance
to all the test-antibiotics (Table 4.2). All isolates collected at the Final Effluent site in
February showed resistance to Cephalothin and Cotrimoxazole. In the months of February
and June, isolates from Downstream showed resistance to Cephalothin, Ampicillin and
Tetracycline and susceptibilities to Streptomycin and Gentamycin.
In February, all isolates from Downstream showed resistance to Cotrimoxazole while in June
and September, all isolates showed resistance to Colistin sulphate. There were variations to
the percentage of resistance of isolates to each antibiotic at each sample point for each month.
All isolates exhibited more than a single resistance to the different antibiotics. Most isolates
showed susceptibilities to Streptomycin and Gentamycin. Isolates from the same sample
point tended to show resistance and susceptibilities to the same antibiotics but varied in some
cases to other sample points.
In Table 4.3b, which showed a total of all isolates, these exhibited a 100% resistance to
Ampicillin, which was followed by Cephalotin sulphate with 94%. Only a small percentage
of isolates were resistant to Streptomycin. Organisms isolated from the Upstream showed
100% resistance to Cephalothin, Ampicillin and Tetracycline (Table 4.3a); this trend was not
repeated at the other two sampling points.

58
Table 4.2 Number of Resistant Isolates at each Sample Point for each Date Collected.
SAMPLE POINT
DATE COLLECTED
KF TS S Co GM AP T
N % N % N % N % N % N % N %
UPSTREAM
FEBRUARY
7/21
33.3
5/21
24.0
0/21
0
0/21
0
0/21
0
7/21
33.3
7/21
33.3
JUNE
7/21
33.3
7/21
33.3
0/21
0
6/21
28.6
0/21
0
7/21
33.3
7/21
33.3
SEPTEMBER
7/21
33.3
7/21
33.3
0/21
0
7/21
33.3
0/21
0
7/21
33.3
7/21
33.3
FINAL
EFFLUENT
FEBRUARY
7/21
33.3
7/21
33.3
0/21
0
3/21
14.3
0/21
0
7/21
33.3
3/21
14.3
JUNE
6/21
28.6
4/21
19.0
0/21
0
3/21
14.3
0/21
0
7/21
33.3
4/21
19.0
SEPTEMBER
6/21
28.6
4/21
19.0
3/21
14.3
6/21
28.6
6/21
28.6
7/21
33.3
6/21
28.6
DOWN STREAM
FEBRUARY
7/21
33.3
7/21
33.3
0/21
0
3/21
14.3
0/21
0
7/21
33.3
7/21
33.3
JUNE
7/21
33.3
5/21
23.8
0/21
0
7/21
33.3
0/21
0
7/21
33.3
7/21
33.3
SEPTEMBER
5/21
33.3
5/21
23.8
0/21
0
7/21
33.3
3/21
14.3
7/21
33.3
5/21
23.8
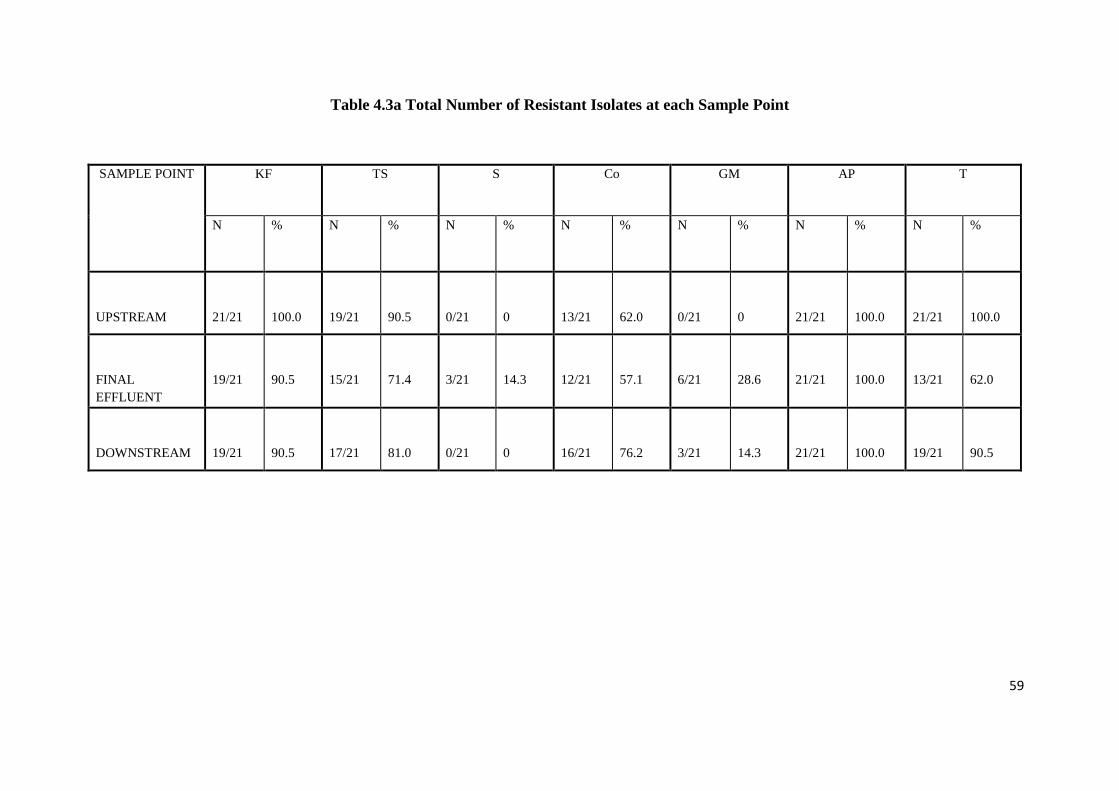
59
Table 4.3a Total Number of Resistant Isolates at each Sample Point
SAMPLE POINT
KF TS S Co GM AP T
N % N % N % N % N % N % N %
UPSTREAM
21/21
100.0
19/21
90.5
0/21
0
13/21
62.0
0/21
0
21/21
100.0
21/21
100.0
FINAL
EFFLUENT
19/21
90.5
15/21
71.4
3/21
14.3
12/21
57.1
6/21
28.6
21/21
100.0
13/21
62.0
DOWNSTREAM
19/21
90.5
17/21
81.0
0/21
0
16/21
76.2
3/21
14.3
21/21
100.0
19/21
90.5
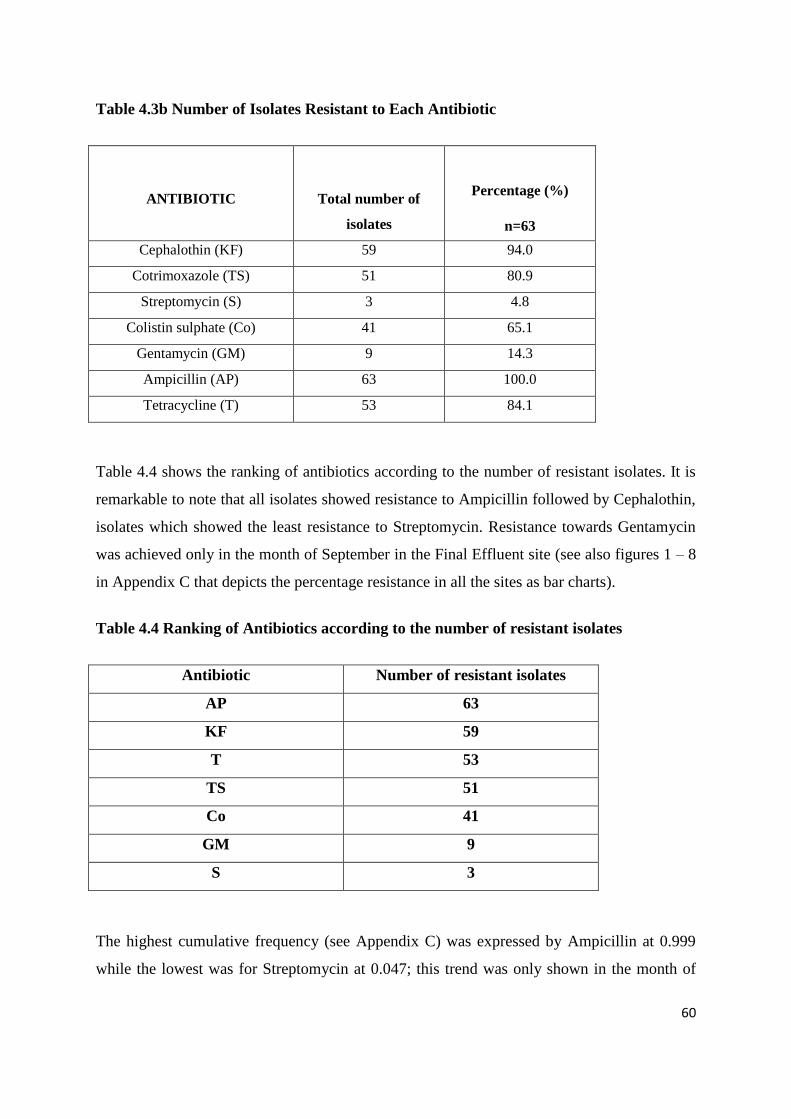
60
Table 4.3b Number of Isolates Resistant to Each Antibiotic
ANTIBIOTIC
Total number of
isolates
Percentage (%)
n=63
Cephalothin (KF) 59 94.0
Cotrimoxazole (TS) 51 80.9
Streptomycin (S) 3 4.8
Colistin sulphate (Co) 41 65.1
Gentamycin (GM) 9 14.3
Ampicillin (AP) 63 100.0
Tetracycline (T) 53 84.1
Table 4.4 shows the ranking of antibiotics according to the number of resistant isolates. It is
remarkable to note that all isolates showed resistance to Ampicillin followed by Cephalothin,
isolates which showed the least resistance to Streptomycin. Resistance towards Gentamycin
was achieved only in the month of September in the Final Effluent site (see also figures 1 – 8
in Appendix C that depicts the percentage resistance in all the sites as bar charts).
Table 4.4 Ranking of Antibiotics according to the number of resistant isolates
Antibiotic Number of resistant isolates
AP 63
KF 59
T 53
TS 51
Co 41
GM 9
S 3
The highest cumulative frequency (see Appendix C) was expressed by Ampicillin at 0.999
while the lowest was for Streptomycin at 0.047; this trend was only shown in the month of
61
September. Cumulative frequency for Gentamycin at the Upstream through all the months of
sample collections remained at 0.000 and marginally increased in the month of September at
the Final Effluent site. At the Downstream the cumulative frequency for Gentamycin
increased marginally from 0.095 to 0.144, when isolates were found here as well. Since all
organisms tested were resistant to Ampicillin, the cumulative frequency increased
accordingly with the final figure being 0.999.
The MAR index for each of the various sample sites and the average MAR index for all
isolates in a sample site were calculated (Table 4.5).
For an individual isolate the MAR index = the number of antibiotics to which the isolate was
resistant ÷ the total number of antibiotics tested.
The MAR index for samples at a site = the number of antibiotics to which all isolates at the
site were resistant ÷ (number of antibiotics tested x number of isolates) (Kasper, Burgess,
Knight & Colwell 1990: 892 -893).
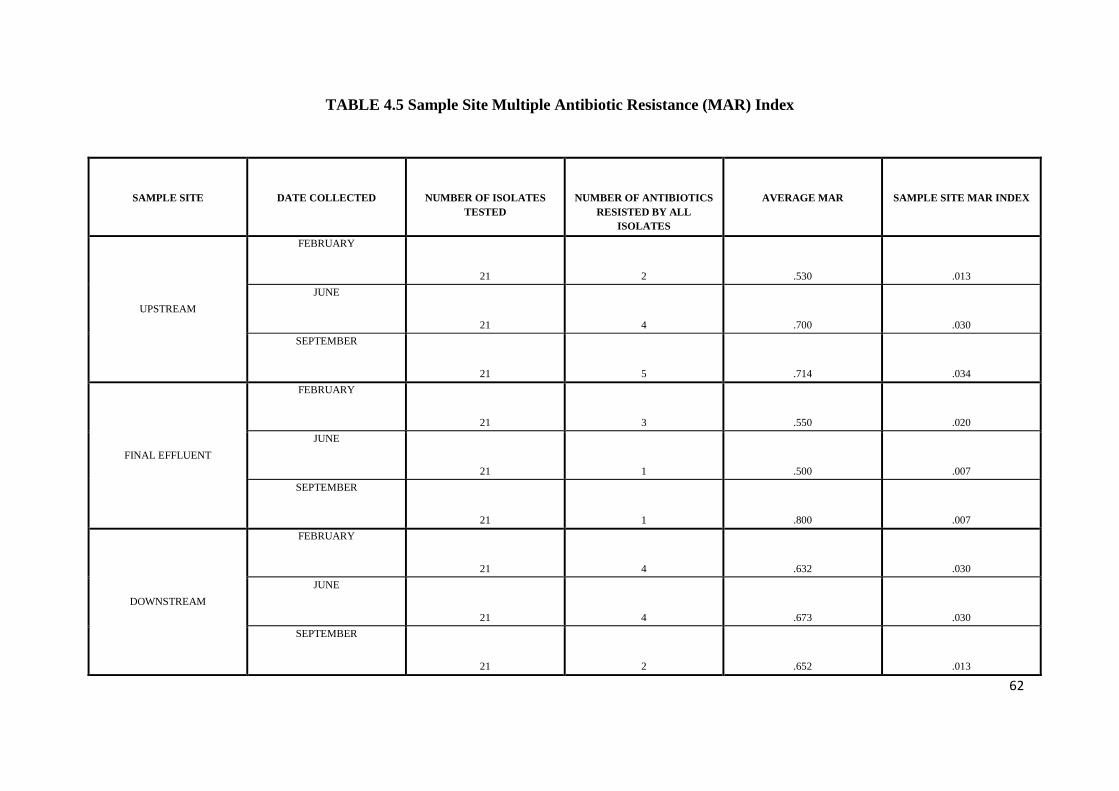
62
TABLE 4.5 Sample Site Multiple Antibiotic Resistance (MAR) Index
SAMPLE SITE
DATE COLLECTED
NUMBER OF ISOLATES
TESTED
NUMBER OF ANTIBIOTICS
RESISTED BY ALL
ISOLATES
AVERAGE MAR
SAMPLE SITE MAR INDEX
UPSTREAM
FEBRUARY
21
2
.530
.013
JUNE
21
4
.700
.030
SEPTEMBER
21
5
.714
.034
FINAL EFFLUENT
FEBRUARY
21
3
.550
.020
JUNE
21
1
.500
.007
SEPTEMBER
21
1
.800
.007
DOWNSTREAM
FEBRUARY
21
4
.632
.030
JUNE
21
4
.673
.030
SEPTEMBER
21
2
.652
.013

63
From Table 4.5; the highest average MAR index (0.800) was shown in September at the Final
Effluent site, but because of high variations in the degree of resistance exhibited by isolates,
only one antibiotic was consistently resisted and as a result the MAR index of the site was the
lowest. It follows that the higher the number of antibiotics to which all isolates are resistant
the higher the area MAR index. The area MAR index for all the different months varied
between 0.01 – 0.03, with the Final Effluent site showing the lowest MAR index. In
September, the upstream site showed the highest area MAR index and isolates from this
month showed the highest number of antibiotic resistance.
Isolates showed the same MAR index when they were resistant to an equal number of
antibiotics irrespective of the type of antibiotic, for example at Upstream in February where
organisms were resistant to 2 antibiotics with sample site MAR index of 0.013; the same
applied to Downstream in September with the same values. The area MAR index from area to
area did not vary remarkably but was relatively low at the Final Effluent site (see values in
the Final Effluent site for the months of June and September [0.007]).
Table 4.6 shows antibiotics to which all isolates exhibited resistance at specific sample points
and in specific months of sample collection. In the Upstream site all 21 isolates showed
resistance to Cephalothin, Ampicillin and Tetracycline through the different months. In June
and September all isolates showed resistance to Cotrimoxazole, but in September all
Upstream isolates showed resistance to Colistin sulphate as well. At the Final Effluent site in
February, all isolates exhibited resistance to Cephalothin, Cotrimoxazole and Ampicillin,
while in June and September all isolates showed resistance to only Ampicillin. All isolates
from Downstream during the months of February showed resistance to Cephalothin,
Ampicillin and Tetracycline, with February isolates showing resistance to Cotrimoxazole as
well. During the months of June and September all isolates showed a resistance to Colistin
sulphate as well. Comparing all three sampling areas, a trend of resistance towards
Ampicillin was observed, therefore making it the most prominent antibiotic in this regard.
The antibiotic to which isolates were least resistant was Streptomycin.
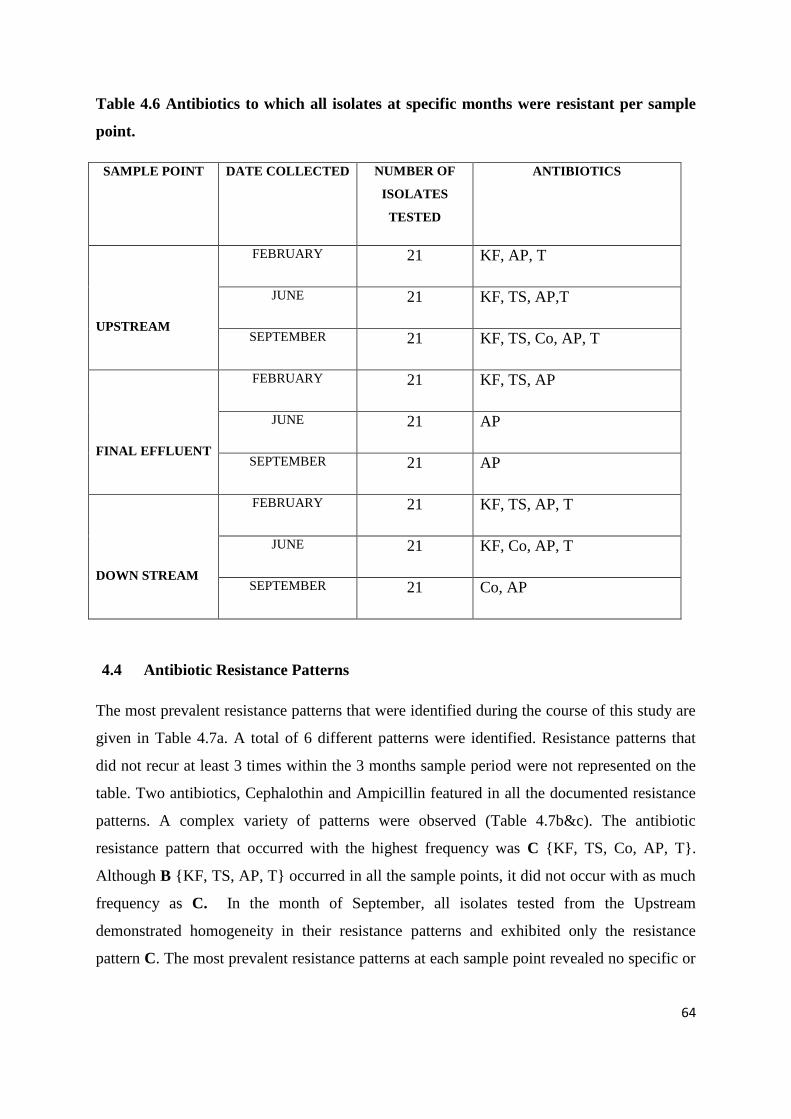
64
Table 4.6 Antibiotics to which all isolates at specific months were resistant per sample
point.
SAMPLE POINT DATE COLLECTED NUMBER OF
ISOLATES
TESTED
ANTIBIOTICS
UPSTREAM
FEBRUARY 21 KF, AP, T
JUNE 21 KF, TS, AP,T
SEPTEMBER 21 KF, TS, Co, AP, T
FINAL EFFLUENT
FEBRUARY 21 KF, TS, AP
JUNE 21 AP
SEPTEMBER 21 AP
DOWN STREAM
FEBRUARY 21 KF, TS, AP, T
JUNE 21 KF, Co, AP, T
SEPTEMBER 21 Co, AP
4.4 Antibiotic Resistance Patterns
The most prevalent resistance patterns that were identified during the course of this study are
given in Table 4.7a. A total of 6 different patterns were identified. Resistance patterns that
did not recur at least 3 times within the 3 months sample period were not represented on the
table. Two antibiotics, Cephalothin and Ampicillin featured in all the documented resistance
patterns. A complex variety of patterns were observed (Table 4.7b&c). The antibiotic
resistance pattern that occurred with the highest frequency was C {KF, TS, Co, AP, T}.
Although B {KF, TS, AP, T} occurred in all the sample points, it did not occur with as much
frequency as C. In the month of September, all isolates tested from the Upstream
demonstrated homogeneity in their resistance patterns and exhibited only the resistance
pattern C. The most prevalent resistance patterns at each sample point revealed no specific or
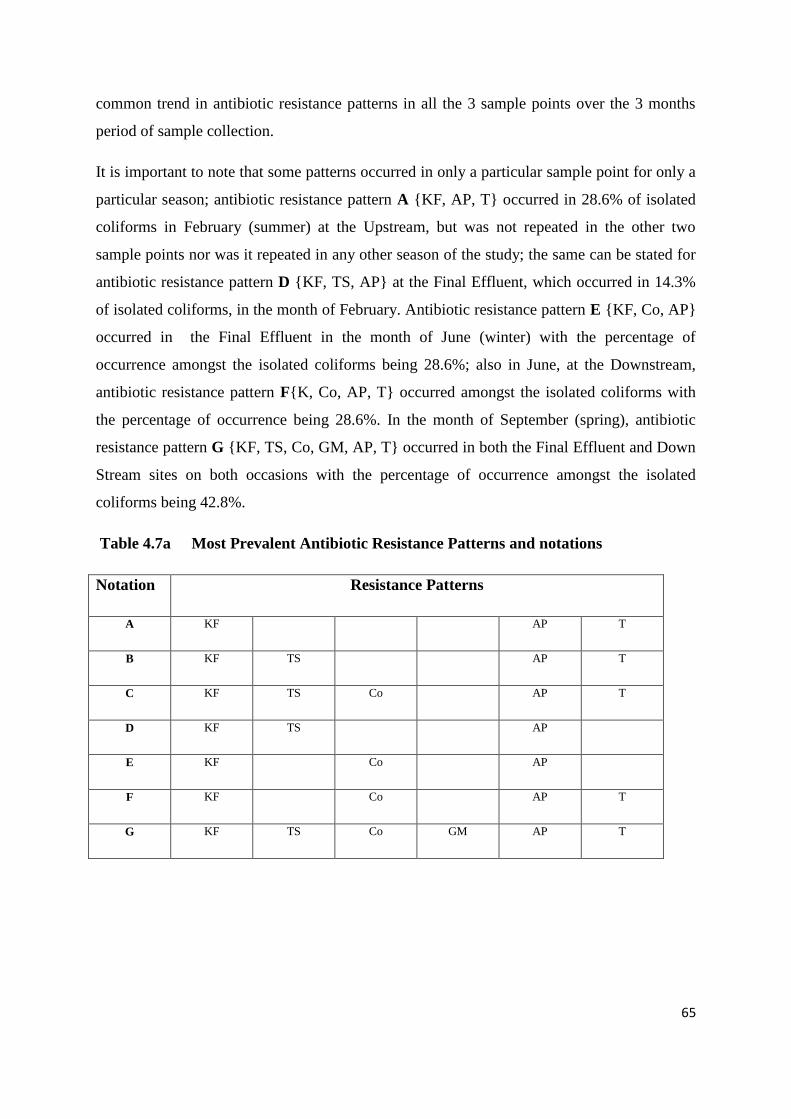
65
common trend in antibiotic resistance patterns in all the 3 sample points over the 3 months
period of sample collection.
It is important to note that some patterns occurred in only a particular sample point for only a
particular season; antibiotic resistance pattern A {KF, AP, T} occurred in 28.6% of isolated
coliforms in February (summer) at the Upstream, but was not repeated in the other two
sample points nor was it repeated in any other season of the study; the same can be stated for
antibiotic resistance pattern D {KF, TS, AP} at the Final Effluent, which occurred in 14.3%
of isolated coliforms, in the month of February. Antibiotic resistance pattern E {KF, Co, AP}
occurred in the Final Effluent in the month of June (winter) with the percentage of
occurrence amongst the isolated coliforms being 28.6%; also in June, at the Downstream,
antibiotic resistance pattern F{K, Co, AP, T} occurred amongst the isolated coliforms with
the percentage of occurrence being 28.6%. In the month of September (spring), antibiotic
resistance pattern G {KF, TS, Co, GM, AP, T} occurred in both the Final Effluent and Down
Stream sites on both occasions with the percentage of occurrence amongst the isolated
coliforms being 42.8%.
Table 4.7a Most Prevalent Antibiotic Resistance Patterns and notations
Notation Resistance Patterns
A KF AP T
B KF TS AP T
C KF TS Co AP T
D KF TS AP
E KF Co AP
F KF Co AP T
G KF TS Co GM AP T
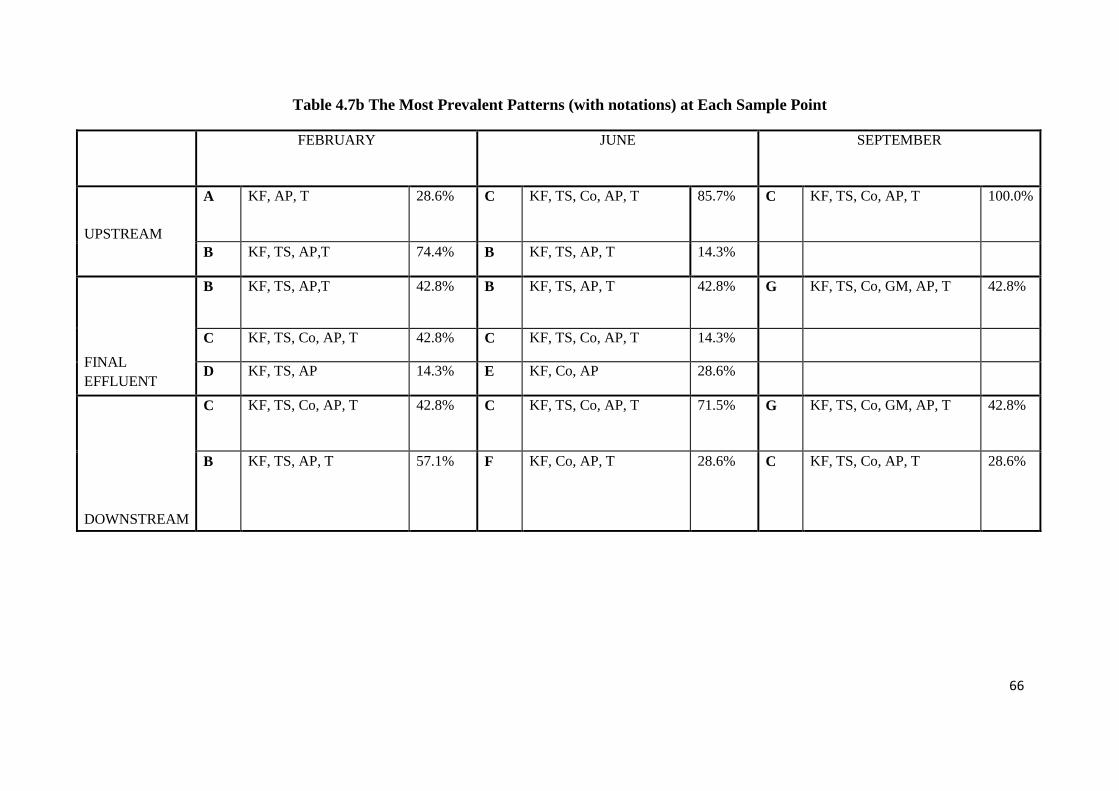
66
Table 4.7b The Most Prevalent Patterns (with notations) at Each Sample Point
FEBRUARY JUNE SEPTEMBER
UPSTREAM
A KF, AP, T 28.6% C KF, TS, Co, AP, T 85.7% C KF, TS, Co, AP, T 100.0%
B KF, TS, AP,T 74.4% B KF, TS, AP, T 14.3%
FINAL
EFFLUENT
B KF, TS, AP,T 42.8% B KF, TS, AP, T 42.8% G KF, TS, Co, GM, AP, T 42.8%
C KF, TS, Co, AP, T 42.8% C KF, TS, Co, AP, T 14.3%
D KF, TS, AP 14.3% E KF, Co, AP 28.6%
DOWNSTREAM
C KF, TS, Co, AP, T 42.8% C KF, TS, Co, AP, T 71.5% G KF, TS, Co, GM, AP, T 42.8%
B KF, TS, AP, T 57.1% F KF, Co, AP, T 28.6% C KF, TS, Co, AP, T 28.6%
67
4.5 API 20E tests
The API 20E tests revealed a variety of faecal and non-faecal coliforms present in the water
body (Rietspruit River) under study. There was no particular growth pattern observed in all
the seasons. A total of 17 different coliforms were identified using the API 20E test kits.
Higher numbers of Klebsiella spp. and Serratia spp., (20.6% allocated to each) (see Table
4.8a) were isolated. Isolates tended to share common resistance patterns with other coliforms
found at a particular sampling point or in some cases during a particular season and in some
cases increasing the number of antibiotics to which they were initially resistant, This can be
seen in Table 4.7b; Pantoea spp. when first isolated at the Upstream site in February was
only resistant to 3 antibiotics (Cephalothin, Ampicillin and Tetracycline). At the
Downstream site in February and June when Pantoea was isolated there was an increase from
3 to 5 antibiotics to which it was resistant; it exhibited resistance pattern C {Cephalothin,
Cotrimoxazole, Colistin sulphate, Ampicillin and Tetracycline} with other coliforms like
Enterobacter cloacae, Rahnella aquatilis, Serratia and E. coli. When Pantoea spp. was
isolated again at the Final Effluent site in September with other coliforms like Klebsiella,
Salmonella and Aeromonas, there was an increase in the number of antibiotics to which it
was resistant. It was resistant to 6 out of the 7 test antibiotics (this still included the former 3
antibiotics). The same phenomenon was observed with E. coli; when first isolated in
February at the Upstream site, it exhibited a resistance to 3 antibiotics (Cephalothin,
Ampicillin and Tetracycline); but in June at the same site there was an increase first by the
addition of one more antibiotic (Cotrimoxazole) to the former 3 antibiotics to which it was
resistant making it a total of 4 (resistance pattern B). In that same month (June) E. coli was
isolated that showed a resistance to 5 antibiotics (Cephalothin, Ampicillin, Tetracycline,
Cotrimoxazole and Colistin sulphate), which is the resistance pattern C. The resistance
pattern C was also exhibited by other coliforms isolated in June at the Upstream like
Kluyvera, Serratia, Enterobacter cloacae and Klebsiella. Both resistance patterns B and C
were repeated for E. coli in February and June for the Final Effluent and Downstream sites.
Klebsiella also showed this increase in the number of antibiotics to which it became resistant
with changes in season and sample sites. Serratia marcescens was isolated in the Upstream
site in June and September. It consistently exhibited the same resistance pattern C
{Cephalothin, Cotrimoxazole, Colistin sulphate, Ampicillin and Tetracycline}, thereby
showing resistance to 5 out of the 7 antibiotics tested. This same pattern was repeated in the

68
month of June when it was isolated at the Final Effluent and Downstream sites. It is
important to note that coliforms isolated in September resisted the highest number of
antibiotics i.e. 6 out of the 7 antibiotics used in the study (in the Final Effluent and
Downstream sites) and it was only in this season that Salmonella was isolated.
Figure 4.8a shows the percentages of individual isolates and their occurrence at each sample
site with passing of the months and seasons, some coliforms showed a pattern in their
occurrence as can be seen with Escherichia coli and Salmonella; with the latter, it occurred in
all three sample sites in the months of February and June whilst Salmonella occurred in all
sample sites in the month of September. Klebsiella occurred in February, June and September
in both the Upstream and Final Effluent sites but was only isolated in February at the
Downstream sites.

69
Table 4.8a The Percentages of Individual Isolates in the Total number of Coliforms
tested using the API 20E and its occurrence in sample sites
ISOLATED COLIFORMS
(%)
UPSTREAM FINAL EFFLUENT DOWNSTREAM
FEB. JUNE SEPT. FEB. JUNE SEPT. FEB. JUNE SEPT.
. *Serratia spp. 20.6 √
√
√
√
√
√
*Klebsiella spp. 20.6 √
√
√
√
√
√
√
Escherichia coli. 15.9 √
√
√
√
√
√
Kluyvera spp 12.7 √
√
√
√
√
*Enterobacter spp. 9.5 √
√
√
√
√
Pantoea spp 6.3 √
√
√
√
Salmonella spp. 4.8 √
√
√
Rhaoultella ornithinolytica 3.1 √
Rahnella aquatilis 3.1 √
√
Aeromonas hydrophila 1.6 √
Citrobacter freundii 1.6 √
* variety of species grouped together
√ occurred
% percentages

70
TABLE 4.8b Isolates identified with the most prevalent patterns at each sample point
FEBRUARY JUNE SEPTEMBER
UP
ST
RE
AM
A KF, AP, T 28.6% Pantoea spp.
Escherichia coli
C KF, TS, Co, AP, T 85.7% Kluyvera spp
Serratia fonticola
Enterobacter cloacae
Escherichia coli
Serratia marcescens
Klebsiella oxytoca
C KF, TS, Co, AP, T 100.0% Klebsiella oxytoca
Serratia marcescens
Raoultella ornithinolytica
Serratia odorifera
Salmonella spp.
B KF, TS, AP,T 74.4% Klebsiella pneumonia
Kluyvera spp.
Rahnella aquatilis
Klebsiella oxytoca
B KF, TS, AP, T 14.3% Escherichia coli
FIN
AL
EF
FL
UE
NT
B KF, TS, AP,T 42.8% Escherichia coli
Enterobacter cloacae
B KF, TS, AP, T 42.8% Enterobacter cloacae
Citrobacter freundii
Escherichia coli
G KF, TS, Co, GM, AP, T 42.8% Pantoea spp.
Salmonella spp.
Klebsiella pneumoniae ssp. ozaenae
C KF, TS, Co, AP, T 42.8% Escherichia coli
Kluyvera spp
C KF, TS, Co, AP, T 14.3% Serratia marcescens
D KF, TS, AP 14.3% Klebsiella pneumoniae E KF, Co, AP 28.6% Klebsiella pneumoniae ssp.
ozoenae
Enterobacter cloacae
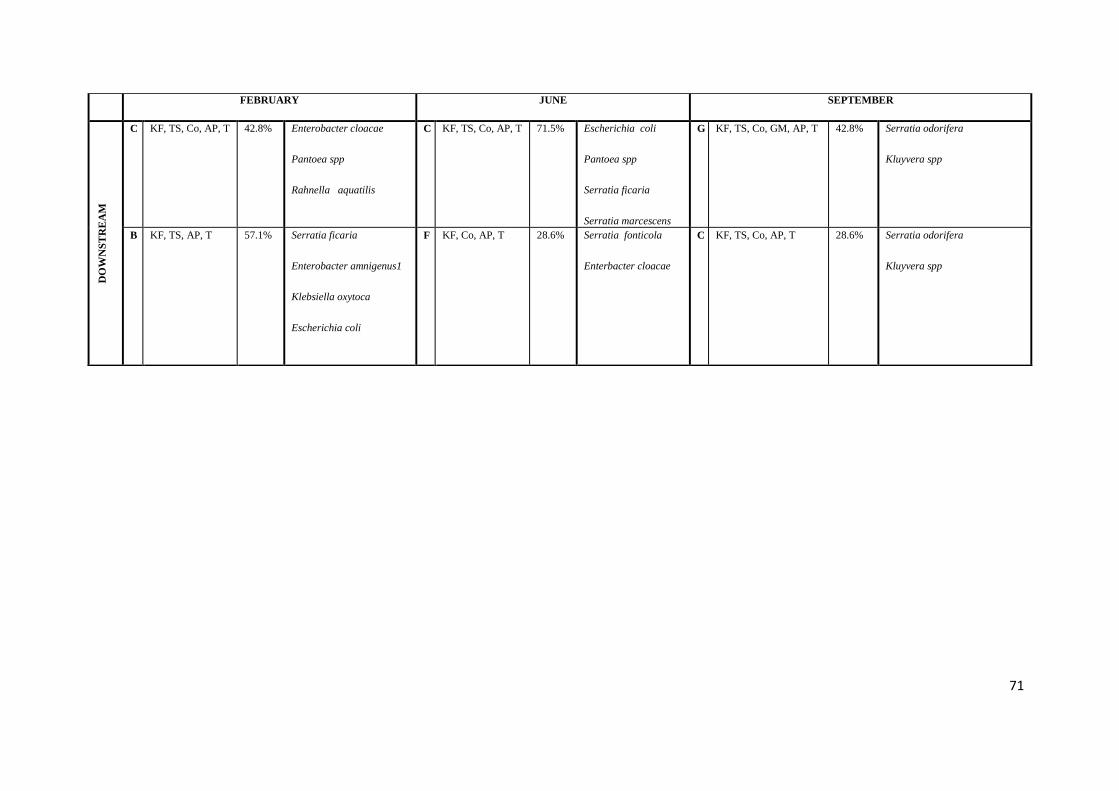
71
FEBRUARY JUNE SEPTEMBER D
OW
NS
TR
EA
M
C KF, TS, Co, AP, T 42.8% Enterobacter cloacae
Pantoea spp
Rahnella aquatilis
C KF, TS, Co, AP, T 71.5% Escherichia coli
Pantoea spp
Serratia ficaria
Serratia marcescens
G KF, TS, Co, GM, AP, T 42.8% Serratia odorifera
Kluyvera spp
B KF, TS, AP, T 57.1% Serratia ficaria
Enterobacter amnigenus1
Klebsiella oxytoca
Escherichia coli
F KF, Co, AP, T 28.6% Serratia fonticola
Enterbacter cloacae
C KF, TS, Co, AP, T 28.6% Serratia odorifera
Kluyvera spp

72
CHAPTER 5
DISCUSSION
5.1 Introduction to Discussion
The resistance to antibiotics by bacteria is a natural phenomenon (Gaur & English 2006:1;
Purdom 2007:1). Resistant strains of micro-organisms have been noted since the discovery of
antibiotics (Palumbi 2001:1786). All living organisms need to develop defence mechanisms
against threats that would otherwise lead to their elimination and subsequent extinction of
their species at large. In the case of bacteria, antibiotics developed by humans are such
defence mechanisms; but because it is a struggle that entails a survival of the fittest; it follows
that with the development of this defence, humans must in turn intensify their effort so that
the stronger organism may survive. For this reason there has to be routine re-evaluation of
our status in this struggle for survival.
The development of single and multiple antibiotic resistance is of great concern to scientists
all over the world as this implies that expedient efforts must be applied to the production of
new and alternative treatment therapy for the same disease.
Many bacterial species multiply rapidly enough to double their numbers every 20–30
minutes, and their ability to adapt to changes in the environment and survive unfavourable
conditions often result in the development of mutations that protect them. In addition, a factor
contributing to their adaptability is that individual cells do not rely on their own genetic
resources alone. Many, if not all, have access to a large pool of itinerant genes that move
from one bacterial cell to another and can spread through bacterial populations on a variety of
mobile genetic elements, of which plasmids and transposable elements are two examples.
Bacterial capacity to adapt to external changes using these mechanisms is known as
resistance development in the face of selection pressures and this allows the resistant
organisms to proliferate in the prevailing conditions (Serrano 2005:19).
73
5.2 Discussion
It cannot be over emphasized that the Rietspruit River is an important source of water supply
to the population of South-west Johannesburg. The Rietspruit drains into the Vaal River
upstream of Vaal Barrage. The residential areas in the catchment include various gold mining
towns, smallholdings and the towns of Sebokeng, Evaton and Orange Farm. An iron and steel
works is situated in the lower part of the River. But, one significant contributor to the
microbiological change of the water body is the rapidly-expanding informal settlement in the
urban development component in South Africa; this has adversely affected most water bodies
that may be situated within the areas where they are located. These informal settlements
along the river route are a direct source of faecal contamination and this is further aggravated
because in most cases there is a lack of sanitation systems. This poses an increased risk for
the outbreak of water-borne diseases (Pretorius 2000: 11). Similarly, increase of faecal
pollution in source water is also a problem in developing as well as developed countries
(Sinton, Donnison & Hastie 1993: 136; Bezuidenhout, Mthembu, Pucktree & Lin 2002: 285).
These factors coupled with the lack of any chemical treatment (chlorine) are detrimental to
the final quality of discharged water. According to Momba, Osode & Sibewu (2006: 687)
there are statistical correlation between the type of treatment carried out on final effluents and
the final quality of the receiving water body. They alluded to the fact that better treatment of
effluents yielded better overall water quality. This phenomenon has necessitated routinely re-
evaluating and investigating the water bodies in South Africa. For the purpose of this study
the Rietspruit River was chosen. This study involved the isolation of pollution indicator
micro-organisms, faecal coliforms, from the water supply, identification of possible point
source and non-point source of antibiotic resistant coliforms, evaluating the MAR profiles
among the coliforms isolated and identified from different sample points. A volume of 100ml
of sample water was filtered and mFC (and later MacConkey) was used as a selective growth
medium. Seven antibiotics were used to test the MAR of the isolated coliforms; these isolates
were identified using both the API 20E test (see Chapter 3).
Preliminary analyses done on-site in February on samples collected Upstream showed the
highest turbidity value (53.4) through all the seasons of sample collection which could be
attributed to high amounts of rainfall the day before the samples were collected. Also in
February all COD values from all sample sites were greater than in the other months of
sample collection. It is important to recall that as a result of the high amounts of rainfall water

74
led to an overflow from the maturation pond (where there is a high concentration of
microorganisms) into the Final Effluent this would have contributed to the spike in the COD
values. Studies done by Bezuidenhout et al. (2002:285) showed that there is a strong
correlation between increased levels of faecal and other indicator micro-organisms and
changing meteorological conditions. It is also significant to note that the COD at the Final
Effluent (after treatment) sample point was consistently higher than those of the other two
sampling points through all the seasons as a result of the constant aeration of this sample
point. This study could not show if this had a positive impact on the final quality of the water.
Coliforms were recovered in February, June and September 2009 from the three sample
points, all of which could be indicative of a large reservoir of bacterial population in general.
The antibiotic susceptibility testing of coliforms isolated from water samples obtained from
the Rietspruit River in this study showed that a large proportion was resistant to multiple
antibiotics. High resistance of isolates in this study to Ampicillin, Tetracycline, Cephalothin,
Cotrimoxazole and Colistin sulphate (see Table 4.2a) corroborates the findings of Obi,
Bessong, Momba, Potgieter Samie & Igumbor (2004: 518) who showed that at least 20% of
bacterial isolates from the water supply in rural Venda communities of South Africa
demonstrated antibiotic resistance to Cotrimoxazole, Tetracycline, Erythromycin and
Chloramphenicol. In this present study a seasonal variation in antibiotic resistance pattern
was observed that was unique to an individual site. This type of phenomenon was also
observed by Abu & Egenonu (2008) with isolates from various sample sites on the new
Calabar River in Nigeria. Abu & Egeonu (2008: 139- 140) stated that this phenomenon may
be attributed to the impact of industrial and human activities on the bacterial isolates within
these sites. There are reports demonstrating the role played by industrial and human activities
on the antibiotic resistance distribution of bacterial isolates in an environment (Davidson
1999: 86; Lin, Biyela & Pucktree 2004: 27). Goni Urizza, Capdepuy, Arpin, Raymond,
Caumette & Quentin (2000: 130) found a correlation between antibiotic resistant bacteria in
rivers and the input of urban effluents.
Coliforms isolated and identified from the sites in significant numbers included Serratia,
Klebsiella, E. coli, Kluyvera, Enterobacter, Pantoea, Salmonella, Aeromonas hydrophila,
Citrobacter freundii, Rhaoultella ornithinolytica; majority of these coliforms were also
identified as present in the water treatment plants located in at Alice, Dimbaza, East London
75
and Fort Beaufort in South Africa (Momba et al. 2006: 691) and consequently could be found
in receiving water bodies. All of these microorganisms are capable of causing various forms
of gastro-intestinal diseases and other forms of infections either as opportunistic infections
(Winn et al. 2006: 211 – 302; Barnes et al. 2003: 537 - 42) or directly (Umeh & Berkowitz
2006: 1; Dundas et al 2001: 923 - 31). The presence of Aeromonas hydrophila and E. coli
was of particular concern in previous studies done by Momba et al. (2006: 690) they
concurred with work done by Pearson & Idema (1998: 1 -17) that indicated that the high
levels of Aeromonas hydrophila in the final effluents is an indication of the inefficiencies of
the wastewater treatment plants for the removal of the presumptive pathogens, and a
consequence of inadequate disinfection practices and inadequate maintenance of the
infrastructure. Another organism identified in this study, although not in high numbers (but
its presence at all is significant) is Rahnella aquatilis, studies show it can be found in
bronchial washings of AIDS patients and causes septicaemia in immunocompromised
individuals (Harrell et al. 1989: 1671; Maraki et al. 1994: 2706); its presence in South
African water bodies may be linked to the increasing populations of individuals with HIV.
Experiments with rabbits that inhaled endotoxins produced by Rahnella, induced strong
immunological responses with elevation of cytokines levels (Skórska, Sitkowska, Burrell,
Szuster-Ciesielska & Dutkiewicz 1996:61 – 65).
Isolates with a common MAR index may represent a common source of contamination
(indicating that antibiotic resistance profiles are a useful tool in separating populations). This
study measured antibiotic resistance of faecal coliforms from 3 different sources on the
Rietspruit River, but it has been difficult to use the information obtained conclusively to
identify the primary source of faecal pollution; taking into consideration that some faecal
contaminant may escape treatment as observed during the heavy rainfall seasons and the fact
that there were direct introduction of faeces into the water at the downstream as a result of the
presence of members of the informal communities living so close to the river route. The
advantage of analysing the MAR population within an area is that sub-populations can be
separated by isolates‟ MAR indices as explained by Kasper et al. (1990: 892 - 893). The data
showed that the MAR indices of isolates in the Upstream and Downstream sites are greater
than that of the Final Effluent (after treatment) site. This is to be expected as treatment in any
form on the water reduces the microbial load of the water body, but of considerable concern
is that the Downstream showed a relatively higher MAR index value to the Upstream which
76
should not be so as the Final Effluent body of water is usually emptied into it. This in turn,
should help reduce the microbial load. The only explanation that can be given is that along
the Downstream site are a group of informal settlements and from observation, most of them
did not have proper sanitation systems. Most inhabitants here also reared cattle and these
herds used the water for drinking purpose and also defecated directly into the river.
Isolates tested form all sample sites showed highest resistance to ampicillin and cephalothin
which both belong to the same family and have structural similarities. Resistance to β-
lactams antibiotics has become a particular problem in recent decades as strains that produce
β-lactamases have become more common. The β-lactamase enzymes cause many, if not all,
of the penicillins and cephalosporins to be ineffective as therapy (Paterson & Bonomo 2005:
658). The great resistance to ampicillin could be as a result of its use in the treatment and
prevention of infection or as growth promoters in poultry, a practice still carried out in most
poultry farms in South Africa. Wiggins (1996: 3997) showed that bacterial isolates from
chicken and turkey were generally more resistant to antibiotics given to them in sub-
therapeutic doses. Studies have also shown that micro-organisms tend to resist the older and
much more widely used antibiotics (Abu & Egeonu 2008: 140).
Isolates obtained from the same site tended to show common resistance to particular
antibiotics. As noted some antibiotic resistance patterns occurred in only a particular sample
point for only a particular season and this could be attributed to a transfer of resistance-
factors amongst the micro-organisms, the absence of this resistance pattern in subsequent
months may be due to dying-off of the particular population and with the changing season the
predominance of fresh colonies and/or the absence of certain coliforms carrying the
resistance genes for a cluster of antibiotics could also play a role in the loss of a particular
resistance pattern; Figure 4.8a shows the occurrence of individual coliforms at the different
sites and different seasons. There is a direct correlation between bacterial growth and
seasonal changes (Byamukama, Knasiime, Mach & Farnleitner 2000: 866; Solo-Gabriele,
Wolfert, Desmarais & Palmer 2000: 234; Pernthaler Glöckner, Unterholzner, Alfreider
Psenner & Amann 1998: 4304; Lobitz, Beck, Huq, Wood, Fuch, Faruque & Colwell 2000:
1441 ; Bezuidenhout et al. 2002; 285). To further buttress this point, from Table 4.7b it could
be seen that identified coliforms of the same species showed a variety of antibiotic resistance
patterns sometimes with change in seasons and in other cases, just with a change in the site as
77
was seen with Pantoea, E. coli, Serratia and Klebsiella. A study published in the journal
Science in August 2007 found the rate of adaptive mutation in E. coli is “in the order of 10-5
per genome per generation which is 1000 times as high as the previous estimate,” (Foster
2004: 4847) a finding which may have significance for the study and management of
antibiotic resistance. Work done by Salyers, Gupta & Wang (2004: 415) showed that E. coli
may pass on genes responsible for antibiotic resistance to species of bacteria, such as
Staphylococcus aureus. They also stated that E. coli often carry multidrug resistant plasmids
and under stress readily transfer those plasmids to other species; therefore E. coli and other
species in the Enterbacteriacae family are important reservoirs of transferable antibiotic
resistance. However, a wide variation in antibiotic resistance patterns was found among the
different coliforms isolated in this study. These variations may be attributed to predisposition
of isolates to the prevailing selective pressure in the river or to pre-existing characteristics
such as genetic composition and molecular mechanisms including cell permeability in the
organisms (Guardabassi & Dalsgaard 2002: 1; Kummerer 2004: 314). It is therefore
imperative to note that susceptibility of bacteria to antibiotics could be altered by the impact
of environmental and human activities on such isolates. This possibly results in the
development and selection of antibiotic resistant strains. This is a health risk as infections by
such resistant strains are more difficult to treat (Abu & Egeonu 2008: 140).
The sample collected in September yielded isolates with the highest MAR, there were 3
different resistance patterns observed involving six antibiotics which is similar to MAR
observed by Mezriou & Baleux (1994: 2401). These antibiotic resistance pattern are; KF, TS,
Co, GM, AP & T in Salmonella spp., KF, TS, S, Co, AP & T in Kluyvera spp. and KF, S,
Co, GM, AP & T in Aeromonas hydrophila/caviae/sobria. These 3 antibiotic resistance
patterns were exhibited with isolates obtained from the water sample collected at Final
Effluent, although the former resistance pattern (KF, TS, Co, GM, AP & T) was repeated by
Kluyvera spp. at the Downstream site, also in September. It is probable that there was a
transfer of R-factor to this species, since previous isolates of the same species did not exhibit
this antibiotic resistance pattern. The presence of Salmonella species, which are naturally
multi-resistant organisms (Angulo 1997: 414) within this site, may explain that situation.
78
5.4 Conclusion
Evidence provided in this study has shown the presence of antibiotic-resistant and multiple
antibiotic-resistant coliforms in the Rietspruit River. All coliforms isolated showed a form of
this phenomenon. The contributing factors such as the proximity of both industrial and
human activities cannot be overlooked; as these are having a significant impact on the aquatic
ecosystem; wastes from domestic and industrial source will eventually end up in the water
body. The observation of coliforms in the same sample site exhibiting similar multiple
antibiotic resistance, even showing coliforms of the same species exhibiting increased
multiple antibiotic resistance dependent on the sample site and in some cases seasonal
changes, needs to be further investigated. One effect of great concern is the insignificant
difference in microbial activity when comparing the Upstream to the downstream (also taking
into consideration the limitation of cost to chlorine treatment) it implies that the final quality
of water reaching end users is questionable. Although studies done in the Eastern Cape
Province showed that even the treatment of water with chlorine was not adequate in
eliminating target pathogens as high levels were still detected in final effluents (Momba et al.
2006: 692); the total by-pass of chlorination treatment at the wastewater plant in Sebokeng
further compounds the problem contamination and would prove catastrophic on the long run
for end users of water from the Rietspruit River. The introduction of these AR and MAR
coliforms into the human system has far-reaching consequences and as a result, steps must be
taken to remove these organisms from the water by introducing better and structured
treatment measures.

79
BIBLOGRAPHY
ABU, G. & EGEONU, C. 2008. The current pollution status of the new Calabar River in the Niger
Delta region of Southern Nigeria: A survey of antibiogram profiles of its bacterial isolates. African
Journal of Environmental Science Technology, 2(6): 134 – 141.
ALBERT, M., ANSARUZZAMAN, M., TALUKDER, K., CHOPRA, K., KUHN, I., RAHMAN,
M., FARUQUE, A., ISLAM, M., SACK, R. & MOLLBY, R. 2000. Prevalence of enterotoxin
genes in Aeromonas spp. Isolated from Children with Diarrhoea, Healthy Controls, and the
Environment. Journal of Clinical Microbiology, 38(10): 3785-3790.
ANGULO, F. 1997. Multidrug-resistant Salmonella typhimurium definitive type 104.
Emerging Infectious Diseases, 3: 414.
ANÍA B. 2008. Serratia: Overview. E-Medicine. WebMD. [Web:]
http://www.emedicine.medscape.com/article/228495-overview. [Date of access: 11 December
2008].
ANONYMOUS. 2007. Adaptive mutations in bacteria: High rate and small effects. Science
Magazine. 10 August 2007. [Web:] http://www.sciencemag.org/cgi/content/abstract/317/5839/813?
[Date of access: 15 November 2008].
ASAI, T., IIZUKA, H. & KOMAGATA, K. 1962. The flagellation of genus Kluyvera.
Journal of General Applied Microbiology. (Japan), 8: 187 – 191.
ATLAS, R. 1997. Principles of microbiology. 2nd
ed. Boston: McGraw Hill, pp. 1180 – 1185.
AUWAERTER, P. 2007. Serratia species. Point-of-Care Information Technology ABX Guide.
Johns Hopkins University.
[Web:] http://www.prod.hopkinsabxguide.org/pathogens/bacteria/serratia_species.html. [Date of
access: 11 December 2008].
BAGLEY, S., SEIDLER, J. & BRENNER D. 1981. Klebsiella planticola sp nov.: a new species of
Enterobacteriaceae found primarily in nonclinical environment. Current Microbiology. 6: 105 –
109.
BARNARD, F. & ANTHONY, M. 2001 Interaction between DNA gyrase and quinolones: effects
of alanine mutations at GyrA subunit residues Ser83 and Asp87. Antimicrobial Agents and
Chemotherapy, 45(7): 1994–2000.

80
BARNES, B., WIEDERHOLD, N., MICEK, S., POLISH, L. & RITCHIE, D. 2003. "Enterobacter
cloacae ventriculitis successfully treated with cefepime and gentamicin: case report and review of
the literature". Pharmacotherapy, 23(4): 537–42. PMID 12680484.
BECKER, K., SOUTHWICK, K., REARDON, J., BERG, R. & MACCORMACK, J. 2001.
Histamine poisoning associated with eating tuna burgers. JAMA 285: 1327-1330.
BENNETT, J. & BENTLEY, R. 2000. Seeing red: The story of prodigiosin. Advanced Applied
Microbiology, 47: 1–32. PMID 12876793.
BEZUIDENHOUT, C., MTHEMBU, C., PUCKREE, T & LIN, J. 2002. Microbiological evaluation
of the Mhlathuze River, KwaZulu-Natal (RSA). Water SA., 28(3): 281-286.
BIOLAB. 1997. Catalogues Version 2. Merck, p. 62.
BLACK, J. 1996. Microbiology principles and application. 3rd
ed. London: Prentice Hall, p. 790.
BLACK, W. 1984. The use of antimicrobial drugs in agriculture. Canadian Journal of Physiology
Pharmacology. 62: 1044–1048.
BORGEN, K., SERUM, M., WASTESON, Y. & KRUSE, H. 2001. VanA - type vancomycin
resistant enterococci (VRE) remain prevalent in poultry carcasses 3 years after avoparcin was
banned. International Journal of Food Microbiology, 64: 89–94.
BOUZA, E. & CERCENADO, E. 2002. Klebsiella and Enterobacter: antibiotic resistance and
treatment options. Seminars in Respiratory Infections 17: 215-230.
BYAMUKAMA, D., KNASIIME, F., MACH, R. & FARNLEITNER, H. 2000.
Determination of Escherichia coli contamination with chromocult coliform agar showed a
high level of discrimination efficiency for differing faecal pollution levels in tropical waters
of Kampala, Uganda. Applied and Environmental Microbiology, 66 (2): 864 – 868.
CDC see CENTER FOR DISEASE CONTROL
CENTER FOR DISEASE CONTROL. 1974. Annual Salmonella Surveillance, CDC, Atlanta.
CENTER FOR FOOD SECURITY & PUBLIC HEALTH. 2005. Salmonellosis: Paratyphoid and
non-typhoidal salmonellosis. Institute for international co-operation in animal biologics. Iowa State
University. College of Veterinary Medicine. pp 1- 8.
CHOPRA, A. & CLIFFORD, W. 1999. Enterotoxins in Aeromonas-associated gastroenteritis.
Microbes and Infection. 1:1129-1137.
CHOPRA, A., XU, X., RIBARDO, D., GONZALEZ, M., KUHL, K., PETERSON, J. &
HOUSTON, C. 2000 .The cytotoxic enterotoxin of Aeromonas hydrophila induces proinflammatory
cytokine production and activates arachidonic acid metabolism in macrophages. Infection and
Immunity, 68(5): 2808 - 2818.
81
CHUBB, L. 2000. Research fuels - antibacterial debate.
[Web:] http://www.enn.com/extras/printer-friendly.asp?storyid=15116 [Date of access: 12 August
2008].
CIPRIANO, R. 2001. Aeromonas hydrophila and Motile Aereomonad septicaemias of Fish. Fish
and Disease. Leaflet 68.
CLARK, H. 2000. Multiple uses of antibiotics. The Arthritis Trust of America.
COHEN, S., FLYNN, H. & MILLER, D. 1997. Endophthalmitis caused by Serratia
marcescens. Ophthalmic Surgery Lasers, 28(3):195-200. [Web:] [Medline]. [Date of access: 14
December 2009].
COMMITTEE ON DRUG USE IN FOOD ANIMALS. 1999. The use of drugs in food animals:
benefits and risks. Based on reports commissioned by the Panel on Animal Health, Food Safety,
and Public Health (a joint activity of the [USA] National Research Council and the [USA] Institute
of Medicine. Wallingford, UK: CABI Publishing, and Washington, DC: National Academy Press,
p. 290.
COOKE, E. 1974. Escherichia coli and man. London: Churchill Livingstone., p. 82.
DARBAS, H., JEAN-PIERRE, H. & PAILLISSON, J. 1994. Case report and review of
septicaemia due to Serratia ficaria. Journal of Clinical Microbiology, 32(9): 2285 – 2288.
DAVIDSON, J. 1999. Genetic exchange between bacteria in the environment. Plasmid.42: 73 - 91.
DOLLBERG S, GANDACU A. & KLAR, A. 1990. Acute pyelonephritis due to a Kluyvera species
in a child. European Journal of Clinical Microbiology Infection, 9: 281–3.
DONABEDIAN, S., THAL, L., HERSHBERGER, E., PERRI, M., CHOW, J., BARTLETT, P.,
JONES, R., JOYCE, K., ROSSITER, S., GAY, K., JOHNSON, J., MACKINSON, C., DEBESS,
E., MADDEN, J., ANGULO, F. & ZERVOS, M. 2003. Molecular characterization of gentamycin
resistant Enterococci in the United States: Evidence of spread from animals to humans through
food. Journal of Clinical Microbiology, 41(3): 1109–1113.
DONOWITZ, G. & MANDELL, G. 1988. Beta-lactam antibiotics. The New Journal of Medicine,
318: 419-423 and 490-496.
DUNDAS, S., TODD, W., STEWART, A., MURDOCH, P., CHAUDHURI, A. & HUTCHINSON,
S. 2001. The central Scotland Escherichia coli O157:H7 outbreak: risk factors for the hemolytic
uremic syndrome and death among hospitalized patients. Clinical Infectious Diseases, 33(7):923-
31. PMID 11528561
82
DUPONT, H. & STEELE, J. 1987. Use of antimicrobial agents in animal feeds: Implications for
human health. Reviews of Infectious Diseases, 9: 447 – 460.
DURBIN, C. 1956. Antibiotics in food preservation. American Journal of Public Health 46: 1305 –
1309.
ELLIOT, T., HASTINGS, M. & DESSELBERGER, U. 1997. Lecture notes on medical
microbiology. 3rd
ed. London: Blackwell Science, p. 332.
ELSBACH, P. 1990. Antibiotics from within: antibacterials from human and animal sources.
Trends in Biotechnology, 8: 26.
ENNE, V., LIVERMORE, D., STEPHEN, P. & HALL, L. 2001. Persistence of sulphonamide
resistance in Escherichia coli in the UK despite national prescribing restriction. Lancet 2001, 1325
– 1328.
ENVIRONMENTAL DEFENSE. 2000. Letter to the National Centre for Infectious Diseases with
Comment on the Interaction Task Force‟s “Public Health Action Plan to Combat Antimicrobial
Resistance”. [Web:] http://www.environmentaldefense.org/pubs/Fillings/actionplan.html
[Date of access: 12 July 2008].
EU see EUROPEAN UNION
EUROPEAN UNION. 1998. Conference on The Microbial Threat. The Copenhagen
Recommendations Report from the Invitational EU Conference on; The Microbial Threat.
Copenhagen, Denmark, 9 –10 September 1998.
FAO/NACA/WHO. 1997. Joint Study Group. Food safety issues associated with products from
aquaculture. WHO Technical Report Series, No. 883.
FARMER III, J., ARDUINO, M. & HICKMAN - BRENNER, F. 2005. The Genera Aeromonas and
Plesiomonas: The Prokaryotes. 1991-2005, New York: Springer-Verlag. p. 3028
FDA see U.S FOOD AND DRUG ADMINISTRATION
FOOD AND DRUG ADMINISTRATION. 2000a. Effect of the use of antimicrobials in
food producing animals on pathogen load: Systematic review of the published literature.
Center for Veterinary Medicine. October 2000, Rockville, MD, USA.
FOOD AND DRUG ADMINISTRATION. 2000b. FDA Task Force on Antimicrobial Resistance:
Key Recommendations and Report. December 2000.
[Web:] http://www.fda.gov/oc/antimicrobial/taskforce2000. html.
FOOD AND DRUG ADMINISTRATION. 2008. "Aeromonas hydrophila." Bad Bug Book: food
borne pathogenic microorganisms and natural toxins handbook.
83
FEINMAN, S. 1999. Antibiotics in animal feed – Drug resistance revisited. American Society
Microbiology News, 64: 24 – 30.
FERRIS, F. & BEVERIDGE, T. 1985. Functions of bacterial cell surface structures. Bioscience,
35(3): 172 – 177.
FORBES, B., SAHM, D. & WEISSFELD, A. 2002. Bailey & Scott's Diagnostic Microbiology. St
Louis, MO: Mosby. pp 501 – 667.
FOSTER, P. 2004. Adaptive mutation in Escherichia coli. Journal of Bacteriology, 186 (15): 4846
– 4852.
FRANKLIN, T. & SNOW, G. 1989. Biochemistry of antimicrobial action. 4th
ed. London:
Chapman and Hall Ltd. pp. 99 – 129.
FRASER, S., ARNETTE, M. & SINAVE, C. 2008. Enterobacter Infections. E–Medicine
[Web:] http://www.emedicine.com/med/topic1237.htm [Date of access: 11 December 2008].
FRAZIER, W. & WESTHOFF, D. 1996. Food microbiology. 4th
ed. New York: McGraw Hill Inc.
pp. 490 – 505.
FROST, J. & THWAITES, R. 1998. Links between quinolones use in food animals,
observed increases in quinolone-resistant food-borne pathogens and human treatment
problems. Evidence in relation to Campylobacter. In: Use of Quinolones in food, animals
and potential impact on public health. Report and proceedings of a WHO Meeting. Document
No. WHO/EMC/ZDI/98.12. WHO, Geneva.
GARROD, L., LAMBERT, H. & O‟GRADY. 1981. Antibiotics and chemotherapy. 5th
ed.
Edinburgh: Churchill Livingstone, p. 120.
GAUR, A. & ENGLISH, B. 2006. The judicious use of antibiotics – An investment towards
optimized health care. Indian Journal of Pediatrics, 73(4): 343 – 350.
GHAZALI, A., JAZRAWI, M. & AL-DOORI, Z. 1988. Antibiotic resistance among pollution
indicator bacteria isolated from Al-Khair River, Baghdad. Water Research, 22: 641 – 644.
GHOSH, S & LAPARA, T. 2007. The effects of sub-therapeutic antibiotic use in farm animals on
the proliferation and persistence of antibiotic resistance among soil bacteria. The ISME Journal, 1:
191- 203. doi:10.1038/ismej.2007.31[Date of access: 11 December 2009]
GONI-URRIZA, M., CAPDEPUY, M., ARPIN, C., RAYMOND, N., CAUMETTE, P. &
QUENTIN, C. 2000. Impact of an urban effluent on antibiotic resistance of riverine
Enterobacteriaceae and Aeromonas spp. Applied Environmental Microbiology, 66(1): 125- 132.
84
GRIMONT, P., GRIMONT, F. & STARR, M. 1979. Serratia ficaria sp. nov., a bacterial species
associated with Smyrna figs and the fig wasp Blastophaga psenes. Current Microbiology, 2: 277 -
282.
GUARDABASSI, L & DALSGAARD, A. 2002. Occurrence and fate of antibiotic resistant bacteria
in sewage. Environmental Project No. 722, Danish Environmental Protection Agency, Danish
Ministry of the Environment.
GUPTA, N., YADAV, A., CHOUDHARY, U. & ARORA, D. 2003. Citrobacter bacteraemia in a
tertiary care hospital. Scandinavian Journal of Infectious Diseases, 35: 765–768. [Web:]
[CrossRef][Medline] [Date of access: 11 December 2009]
GUPTA, R., RAUF, S., SINGH, S., SMITH, J. & AGRAHARKAR, M. 2003. Sepsis in a renal
transplant recipient due to Citrobacter brakii. South Medical Journal, 96: 796 -798.
[Web:] [CrossRef][Medline] [Date of access: 11 December 2009]
GUSTAFSON, R. & BOWEN, R. 1997. Antibiotic use in animal agriculture. Journal of Applied
Microbiology., 83: 531 – 541.
HARDMAN, J. & LIMBIRD, L. 1996. Goodman and Gilman‟s pharmacological basis of
therapeutics. 9th
ed. New York: McGraw Hill Inc. p.1120.
HARLEY, J. & PRESCOTT, L. 2002. Laboratory Exercises in Microbiology. 5th
ed. New York:
McGraw Hill Inc. pp. 43 – 47, 93 – 105, 208 – 211, 257 – 260.
HARRELL, L., CAMERON, M. & O‟HARA, C. 1989. Rahnella aquatilis, an unusual gram-
negative rod isolated from bronchial washing of a patient with acquired immunodeficiency
syndrome. Journal of Clinical Microbiology, 27(7): 1671 – 1672. PMCID: PMC267639
HARRISON, J. & SVEC, T. 1998. The beginning of the end of the antibiotic era. Part 1. The
problem: Abuse of the “miracle drugs” Quintessance International, 29: 151 – 162.
HAYES, J. 2008. Aeromonas hydrophila. Oregon State University.
HEDDLE, J., & ANTHONY M. 2002.Quinolone-binding pocket of DNA gyrase: role of GyrB,
Antimicrobial Agents and Chemotherapy, 46(6):1805–1815.
HEJAZI, A. & FALKINER, F. 1997. Serratia marcescens. Journal of Medical Microbiology, 46
(11): 903–12. PMID 9368530
HENRIQUES, I., FONSECA, F., ALVES, A., SAAVEDRA, M. & CORREIA, A. 2006.
Occurrence and diversity of integrons and beta-lactamase genes among ampicillin-resistant isolates
from estuarine waters. Research in Microbiology, 157: 938 – 947. [Web:] [Medline] [Date of
access: 12 December 2009].
85
HEUER, O., PEDERSEN, K., ANDERSEN, J. & MADSEN, M. 2002. Vancomycin resistant
enterococci (VRE) in broiler flock 5 years after the avoparicin ban. Microbiology Drug Resistance
2002, 133 – 138.
HOLZMAN, D. 1998. Current topics and features. ASM News, 64: 130 – 131.
HOOPER, D. & WOLFSON, J. 1991. Fluoroquinolone antimicrobial agents. The New England
Journal of Medicine, 324: 384 – 394.
HOSTACKÁ, A., & KLOKOCNIKOVÁ. 2001. Antibiotic susceptibility, serum response and
surface properties of Klebsiella species. Microbios. 104:115-124. [Web:] [Medline] [Date of access:
12 December 2009].
IZARD, D., FERRAGUT, C., GAVINI, F., KERSTERS, K., De LEY, J. & LECLERC, H. 1981.
Klebsiella terrigena a new species from soil and water. International Journal of Systematic.
Bacteriology. 31: 116 – 127.
JACOB, J. 1999. What is the impact of antibiotic use in poultry? Dairy and poultry sciences,
University of Florida. [Web:] http://www.dps.ufl.edu/Pub/Proceeding p 98. htm# Toc432844219 [
Date of access: 9 June 2008].
JACOBY, G. & ARCHER, G. 1991. New mechanism of bacterial resistance to antimicrobial
agents. The New England Journal of Medicine, 324: 601 – 612.
JAY, J. 1992. Modern food microbiology. 4th
ed. New York: Chapman & Hall. p. 553.
KAMANDA NGUGI, D., KHAMIS TSANUO, M., & IDDI BOGA, H. 2007. Benzoic acid-
degrading bacteria from the intestinal tract of Macrotermes michaelseni. Sjöstedt Journal of Basic
Microbiology, 47:87-92. [Web:] [CrossRef][Medline] [Date of access: 11 December 2009]
KANKI, M., YODA, T., TSUKAMOTO, T. & SHIBATA, T. 2002. Klebsiella pneumoniae
produces no histamine: Raoultella planticola and Raoultella ornithinolytica strains are histamine
producers. Applied Environmental Microbiology, 68:3462-3466
KARCH, H., TARR, P., BIELASZEWSKA, M. 2005. Enterohaemorrhagic Escherichia coli in
human medicine. International Journal of Medical Microbiology, 295 (6-7): 405–18. PMID
16238016
KASPER, C., BURGESS, J., KNIGHT, I., & COLWELL, R. 1990. Antibiotic resistance indexing
of E. coli to identify sources of faecal contamination in watercan. Journal of Microbiology, 36: 891
– 894.
KHACHATOURIANS, G. 1998. Agricultural use of antibiotics and the evolution and transfer of
antibiotic-resistant bacteria. Department of Applied Microbiology and Food Science, College of
Agriculture. [Web:] [email protected] [Date of access: 12 July 2008].
86
KIM, B., WOO, J., RYU, J. & KIM, Y. 2003. Resistance to extended-spectrum cephalosporins and
mortality in patients with Citrobacter freundii bacteremia. Infection 31: 202–207. [Web:] [Medline]
[Date of access: 12 July 2009].
KING, R. 2000. Identification of pathogenic bacteria in biofilms of recirculating aquaculture
systems. Abstract presented in the 2000 Institute of Food Technologists Annual Meeting.
[Web:] http://ift.confex.com/ift/2000/techprogram/paper_3738.html
KIROV, S. & HAYWARD, L. 1993. Virulence traits of Aeromonas in relation to species and
geographic region. Australian Journal Medical Sciences, 14: 54–58.
KLUYVER, A. & VAN NIEL, C. 1936. Prospects for a natural system of classification of bacteria.
Zentralbl Bakteriol Parasitenkd Infektionskr Hyg Abt II, 94:369–403.
KUMMERER, K. 2004. Resistance in the environment. Journal of Antimicrobial Chemotherapy,
54(2): 311 - 320.
LANCINI, G., PARENTI, F. & GALLO, G. 1995. Antibiotics: a multidisciplinary approach. New
York: Plenum. p. 278.
LEE, L., PUHR, N., MALONEY, F., BEAN N. & TAUPE, R. 1994. Increase in antimicrobial-
resistant Salmonella infections in the United States, 1989-1990. Journal of Infectious Diseases,170:
128 - 34.
LENNETTE, E., BALOWS, A., HAUSLER, W., TRUANT, J., AND SHADOMY, H. 1985.
Manual of Clinical Microbiology. 4th
ed. American Society for Microbiology. pp. 450 – 555.
LIN, J., BIYELA, P. & PUCKREE, T. 2004. Antibiotic resistance profiles of environmental isolates
from Mhlathuze River, KwaZulu-Natal (RSA). Water SA, 30(1): 23-28.
LOBITZ, B., BECK, L., HUQ, A., WOOD, B., FUCH, G., FARUQUE, A. & COLWELL, R.
2000. Climate and infectious disease: Use of remote sensing for detection of Vibrio cholerae
by indirect measurement. Proceedings of the National Academy of Science 97 (4): 1438 –
1443.
LOPÉZ-SABATER, E., RODRIGUEZ-JEREZ, J., M. HERNANDEZ-HERRERO, M. & MORA-
VENTURA, M. 1996. Incidence of histamine-forming bacteria and histamine content in scombroid
fish species from retail markets in the Barcelona area. International Journal of Food Microbiology,
28:411-418. [Web:] [CrossRef][Medline] [Date of access: 11 December 2009]
MANDELL, G., DOUGLAS, R., BENNET, J. & DOLIN, R. 1995. Principles and practice of
infectious disease therapy 1995/1996. London: Churchill Livingstone Inc., pp. 1 – 156.
MANDELL, G., & PETRI, W. 1996. Antimicrobial agents: sulphonamides, trimethoprim-
sulfamethoxazole, quinolones, and agents for the urinary tract infections. In Hardman, J., Limbird,
87
L., Molinoff, P.,Ruddon, R. & Gilman, A., (eds.). The pharmacological basis of therapeutics. New
York: McGraw Hill Inc., pp 1057 -1071.
MANN, J. 1978. Secondary Metabolism. Britain: Oxford University Press, pp. 3 – 15.
MANN, J., & GRABBE, M. 1996. Bacteria and antimicrobial agents. United States: Spektrum, p.
74.
MARAKI, S., SAMONIS, G., MARNELAKIS, E. & TSELENTIS, Y. 1994. Surgical wound
infection caused by Rahnella aquatilis. Journal of Clinical Microbiology, 32(11): 2706 – 2708
PMCID: PMC264147.
MEZRIOU, N. & BALEUX, B. 1994. Resistance patterns of E. coli strains isolated from domestic
sewage before and after treatment in both aerobic lagoon and activated sludge. Water Research, 28:
2399 – 2406.
MIMS, C., PLAYFAIR, J., ROITT, I., WAKELIN, D. & WILLIAM, R. 1993. Medical
microbiology. St. Louis: Mosby, pp. 18 - 39.
MOLBAK, K., GERNER- SMIDT, P. & WEGENER, H. 2002. Increasing quinolone resistance in
Salmonella enterica serotype Enteritidis. Emerging Infectious Diseases, 8(5) [Web:]
www.cdc.gov.mill1.sjlibrary.org/ncidod/eid/vol8no5/01-0288.htm. [Date of access: July 22 2008].
MOMBA, M., OSODE, A. & SIBEWU, M. 2006. The impact of inadequate wastewater treatment
on the receiving water bodies – Case study: Buffalo City and Nkokonbe Municipalities of the
Eastern Cape Province. Water SA, 32 (5): 687 – 692. [Web:] http://www.wrc.org.za [Date of
access: 18 October 2010].
MONTASSER, A. 2005. Gram-negative bacteria from the camel tick Hyalomma dromedarii
(Ixodidae) and the chicken tick Argas persicus (Argasidae) and their antibiotic sensitivities. Journal
of the Egyptian Society Parasitology, 35:95-106. [Web:] [Medline] [Date of access: 11 December
2009].
MORAIS, V., DAPORTA, M., BAO, A., CAMPELLO, M. & ANDRÉS, G. 2009. Enteric Fever-
Like Syndrome caused by Raoultella ornithinolytica (Klebsiella ornithinolytica). Journal of
Clinical Microbiology, 47(3): 868-869, PMID: 19144809. [Web:] [Medline] [Date of access: 11
December 2009].
NAKAJO, K., NAKAZAWA, F., IWAKU, M. & HOSHINO, E. 2004. Alkali-resistant bacteria in
root canal systems. Oral Microbiology and Immunology, 19: 390-394. [Web:] [CrossRef][Medline]
[Date of access: 11 December 2009]

88
NAWAZ, M., ERICKSON, B., KHAN, A., KHAN, S., POTHULARI, J., RAFII, F.,
SUTHERLAND, J., WAGNER, R. & CERNIGLIA, C. 2001. Human health impact and regulatory
issues involving antimicrobial resistance in the food animal production environment. Regulatory
Research Perspectives 1: 1–10.
NESTER, E., ROBERTS, C., PEARSALL, N., ANDERSON, D. & NESTER, M. 1995.
Microbiology: A Human Perspective, 2nd ed. Boston: McGraw Hill Inc. pp. 449 – 450.
NEU, H. 1992. The crisis in antibiotic resistance. Science, 257: 1064.
NGAN, V. 2005. Classes of antibiotics based on chemical structures. [Web:]
http://www.dermnetz.org/treatments/antibiotic/html [Date of access: 15 October 2009].
OBI, C., BESSONG, P., MOMBA, M., POTGIETER, N., SAMIE, A. & IGUMBOR, E. 2004.
Profiles of antibiotic susceptibilities of bacterial isolates and physico-chemical quality of water
supply in rural Venda communities, South Africa. Water SA, 30(4): 515-519.
PALUMBI, S. 2001. Humans as the world‟s greatest evolutionary force. Science, 1786 – 1790.
PATERSON, D. & BONOMO, R. 2005. Extended-spectrum β-lactamases: a clinical update.
Clinical Microbiology Review, 18(4): 657 – 86 PMID 16223952.
PEARSON, I. & IDEMA, G. 1998. CSIR Division of Water, Environment and Forestry
Technology, Pretoria. WRC Report No 649/1/98. Water Research Commission, Pretoria, South
Africa. 1-17.
PELCZAR, M., CHAN, E. & KRIEG, N. 1986. Microbiology. Tata: McGraw Hill Inc. pp. 510 –
539, 595 – 617.
PELCZAR, M., CHAN, E., & KRIEG, N. 1993. Microbiology: concepts and application. New
York: McGraw Hill Inc. pp. 899 – 915.
PERNTHALER, J., GLÖCKNER, F., UNTERHOLZNER, S., ALFREIDER, A., PSENNER,
R. & AMANN, R. 1998. Seasonal community and population dynamics of pelagic bacteria
and archaea in a high mountain lake. Applied and Environmental Microbiology 64 (11):
4299 – 4306.
PODSCHUN, R., ACKTUN, H., OKPARA, J., LINDERKAMP, O., ULLMANN, U. &
BORNEFF-LIPP, M. 1998. Isolation of Klebsiella planticola from Newborns in a Neonatal Ward.
Journal of Clinical Microbiology, 36(8): 2331- 2332. PMCID: PMC105041.
PRETORIOUS, L. 2000. An investigation into the effect of various levels of sanitation on surface
water quality in a typical developing community. SA Waterbulletin, 26(23):10-12.
PURDOM, G. 2007. Antibiotic Resistance of Bacteria: An Example of Evolution in Action? [Web:]
www.answersmagazine.com/go/bacteria-good-or-bad [Date of access 12 July 2008].
89
RAFAY, A. & NSANZE, H. 2003. Multi-drug resistance of Escherichia coli from the urinary tract.
Saudi Medical Journal, 24 (3): 261 -264.
ROSE, A. 1979. Production and Industrial importance of Secondary Products of Metabolism in:
Economic Microbiology, Vol. 3. London, New York, San Francisco: Academic Press. pp. 1 – 10.
ROSSITER, S., JOYCE, K., RAY, M., BENSON, J., MACKINSON, C., GREGG, C., SULLIVAN,
M., VOUGHT, K., LEANO, F., BESSER, J., MARANO, N., ANGULO, F., & THE EIP FOOD
NET WORKING GROUP. 2000. High prevalence of fluoroquinolone resistant Campylobacter
jejuni in the FoodNet Sites: a hazard in the food supply. 2nd International Conference on Emerging
Infectious Diseases. Atlanta, GA, July 2000.
RUSSELL, A. 2000. Do biocides select for antibiotic resistance? Journal of Pharmacy and
Pharmacology, 52: 227–233.
RYAN, K. & RAY, C. (Editors). 2004. Sherris Medical Microbiology 4th ed. McGraw Hill.
pp. 362–8.
SALYERS, A., GUPTA, A. & WANG, Y. 2004. Human intestinal bacteria as reservoirs for
antibiotic resistance genes. Trends in Microbiology, 12(9): 412 – 416.
SARRIA, J. VIDAL, A. & KIMBROUGH, R. 2001. Infections caused by Kluyvera species in
humans. CID 2001: 33 e69 – 74.
SCHWARZ, S. & CHASLUS – DANCLA, E. 2001. Use of antimicrobials in veterinary medicine
and mechanism of resistance. Veterinary Research, 32: 201 – 225.
SERRANO, P. 2005. Responsible use of antibiotics in aquaculture. FAO Fisheries Technical Paper
469. Rome FAO. pp. 12 - 97.
SHOEMAKER, B., VLAMAKIS, H., HAYES, K., SALYERS, A. 2001. Evidence for extensive
resistance gene transfer among Bacteroides spp. and other Bacteroides and other Genera in the
human colon. Applied Environmental Microbiology, 67(2): 561-568.
SINTON, L., DONNISON, A. & HASTIE, C. 1993. Faecal streptococci as faecal pollution
indicators: a review. II. Sanitary significance, survival, and use. New Zealand. Journal of Marine
and Freshwater Research. 27: 117-137.
SIRCUS, M. 2008. The end of antibiotics. Natural News, 1: 1 – 4.
SKÓRSKA, C., SITKOWSKA, J., BURRELL, R., SZUSTER-CIESIELSKA, A. &
DUTKIEWICZ, J. 1996. Effects of repeated inhalation exposure to microvesiclebound
endotoxin. Ann Agricultural Environmental Medicine, 3: 61-65.
SNUSTAD, D & CECH, T. 2003. Principles of genetics. John Wiley & Sons, Inc. p. 612
90
SOLO-GABRIELE, H., WOLFERT, M., DESMARAIS, T. & PALMER, C. 2000. Sources
of Escherichia coli in a coastal subtropical environment. Applied and Environmental
Microbiology, 66 (1): 230 – 237.
SUNDLOF, S. 2000. Interview: Director S. Sundolf speaks out on proposed fluoroquinolone
withdrawal. Food Chemical News, 20 November 2000.
SWAMINATHAN, B., BEEBE, J. & BESSER, J. 1999. Investigation of foodborne and waterborne
disease outbreaks, p. 174-190. In P. R. Murray, E. J. Baron, M. A. Pfaller, F. C. Tenover, and R. H.
Yolken (ed.), Manual of clinical microbiology. American Society for Microbiology, Washington,
DC.
SWINT, S. 1999. Salmonella outbreak shows increased resistance to antibiotics. Rare
strain resistant to many treatments is apparently spreading. WebMD Medical News
[Web:] http://my.webmed.com/content/article/1728.50050 [Date of access: 11 July 2009].
THRELFALL, J., WARD, L., FROST, J. & WILLSHAW, G. 2000. The emergence and spread of
antibiotic resistance in food-borne bacteria. International Journal of Food Microbiology, 62: 1–5.
TODAR, K.1996b. Bacteriology 330 Lecture topics: Bacterial resistance to antibiotics [Web:]
http://www.bact.wisc.edu/Bact330/lectureama [Date of access: 12 July, 2008].
TODAR, K. 2008. Todar‟s Online Text Book of Bacteriology. [Web:]
http://www.textbookofbacteriology.net [Date of access: 22 August 2009 & 11 December 2009]
TOLLEFSON, L. 2000. CVM official gives status report on antimicrobial resistance. Food
Chemical News, 29 May 2000.
UMEH, O. & BERKOWITZ, L. 2006. Klebsiella infections. E-Medicine [Web:]
http://www.emedicine.com/med/topic1237.htm [Date of access: 24 August 2009].
HHS see U.S. Department of Health and Human Services.
U.S. DEPARTMENT OF HEALTH AND HUMAN SERVICES. 1999a. Assistant Secretary for
Legislation (ASL). Statement on Antimicrobial Resistance: Solutions to a Growing Public Health
Threat. By David Satcher, 25 February 1999.
[Web:] http://www.hhs.gov/asl/testify/t990225a.html [Date of access: 11 June 2008].
U.S. DEPARTMENT OF HEALTH AND HUMAN SERVICES. 1999b. Petition to rescind
approvals of the sub-therapeutic uses in livestock of antibiotics used in or related to those
used in human medicine. Document submitted by the Centre for Science in the Public
Interest, Environmental Defense Fund, Food Animal Concerns Trust, Public Citizens Health
Research Group, and the Union of Concerned Scientists, 9 March 1999. Public Health Threat.
91
By David Satcher, 25 February 1999. [Web:] http://www.hhs.gov/asl/testify/t990225a.html
[Date of access: 11 June 2008].
USEPA see U.S. Environmental Protection Agency.
U.S. ENVIRONMENTAL PROTECTION AGENCY. 1985. Test methods for Escherichia
coli and enterococci in water by the membrane filter procedure (Method #1103.1).
EPA 600/4-85-076.
U.S. Environmental Protection Agency, Environmental Monitoring and Support Laboratory,
Cincinnati, OH.
VAN DEN BOGAARD, A. & STOBBERINGH, E. 2000. Epidemiology of resistance to
antibiotics. Links between animals and humans. International. Journal of. Antimicrobial Agents,
14: 327–335.
VOET, D., VOET, J. & PRATT, C. 2006. Fundamentals of Biochemistry 2nd
ed. New Jersey: John
Wiley & Sons, Inc. pp. 51 – 72, 525, 914, 929 -931, 1000.
WAKSMAN, S. 1947.”What is an antibiotic or an antibiotic substance?” Mycologia, 39 (5): 565 –
569. doi:10.2307/3755196. PMID 20264541. http://jstor.org/stable/3755196.
WALCKENAER, E., POIREL, L., LEFLON-GUIBOUT, V., NORDMANN, P. & NICOLAS-
CHANOINE, M. 2004. Genetic and biochemical characterization of the chromosomal class A β-
lactamases of Raoultella (formerly Klebsiella) planticola and Raoultella ornithinolytica.
Antimicrobial Agents and Chemotherapy 48: 305-312.
WEGENER, H., AARESTRUP, F., GERNER-SMIDT, P. & BAGER, F. 1999. Transfer of
antibiotic resistant bacteria from animals to man. Acta Veterinaria Scandinava, 92 (Suppl.): 51–57.
WEST, B., VIJAYAN, H. & SHEKAR, R. 1998. Kluyvera cryocrescens finger infection: case
report and review of eighteen Kluyvera infections in human beings. Diagnosis and Microbiology of
Infectious Diseases, 32:237–41.
WESTBROOK, G., O‟HARA, C., ROMAN, S. & MILLER, M. 2000. Incidence and identification
of Klebsiella planticola in clinical isolates with emphasis on newborns. Journal of Clinical
Microbiology, 38 (4): 1495 -1497. PMCID: PMC86473.
WIGGINS, B. 1996. Discriminate analysis of resistance patterns in faecal Streptococci, a method to
differentiate human and animal sources of faecal pollution in natural water. Applied Environmental
Microbiology, 62: 3997 – 4002.
WINN, W., ALLEN, S., JANDA, W., KONEMAN, E., PROCOP, G., SCHRECKENBERGER, P.
& WOODS, G. 2006. Koneman's Color Atlas and Textbook of Diagnostic Microbiology 6th ed. pp.
211–302. Philadelphia, PA: Lippincott Williams & Willkins.
92
WHO see World Health Organization
WORLD HEALTH ORGANIZATION. 2002. Antimicrobial Resistance. Fact Sheet. No. 194.
[Web:] http://www.who.int/mediacentre/factsheets/fs194/en/ [Date of access: 16 June 2008].
WORLD HEALTH ORGANIZATION. 2005. Drug-resistant Salmonella. Fact Sheet. No. 139.
[Web:] http://www.who.int/mediacentre/factsheets/fs139/en/ [Date of access: 10 December 2009].
WORLD HEALTH ORGANIZATION. 2006. Guidelines for drinking-water quality (electronic
resource). Incorporating first addendum – 3rd ed. Volume 1. Recommendations. World Health
Organization, Geneva.
WRIGHT, K. 1990. Bad news bacteria. Science 249: 22 – 24.
WRIGHT, K. 1994. Frontiers in biotechnology: resistance to antibiotics. Science 264: 360 – 388.
ZENZABURO, T., HISATOYO, Y., MASAYOSHI, M. & TAKAO T. 1983. Syntheses and
antitumor activity of Tomaymycin. Studies on Tomaymycin, 3: 1 – 11.

93
APPENDICES

94
APPENDIX A

95
APPENDIX A
Media and Reagents
A. Nutrient Agar (g/l)
Meat extracts 1.0
Peptone 5.0
Yeast extract 2.0
Sodium chloride 8.0
Agar 15.0
To prepare agar plates: dissolve 31g of agar in a litre of distilled water. Stir constantly
until solution boils. Autoclave at 121oC for 15 minutes. After sterilization leave to
cool to about 55oC and pour into petridishes and leave in laminar airflow to gel before
streaking.
B. mFc Agar (g/l)
A selective medium for the enrichment, cultivation and isolation of faecal coliforms.
Tryptose 10.0
Peptone 5.0
Yeast extract 3.0
Sodium chloride 5.0
Lactose 12.5
Bile salts no. 3 1.5
Aniline Blue 0.1
Agar 13.0
Suspend 50g in one litre of demineralised water. Bring to boil whilst constantly
stirring until agar dissolves completely. Mix well and pour plates immediately. Allow
agar surface to dry before use. This medium is best used with membrane filtration
technique. The mFc medium should not be autoclaved.

96
C. MacConkey Agar (g/l)
A selective medium suitable for the isolation of Salmonella, Shigella and coliform
bacteria from foods, urine, faeces, waste water etc.
Peptone 20.0
Lactose 10.0
Bile Salts No.3 1.5
Sodium Chloride 5.0
Neutral Red 0.03
Crystal Violet 0.001
Agar 13.5
Suspend 50g in one litre of demineralised water. Bring to boil whilst constantly
stirring until agar dissolves completely. Autoclave at 121oC for 15minutes. Cool to
about 45 – 50oC, mix well and pour plates.
D. Mueller Hinton Agar (g/l)
A medium suitable for testing for the sensitivity of clinically important pathogens
towards antibiotics or sulphonamides.
Meat Infusion 5.0
Casein Hydrolysate 17.5
Soluble Starch 1.5
Agar 14.0
Suspend 38g in one litre demineralised water and allow to stand for 15minutes. Boil
whilst constantly stirring until agar dissolves completely. Autoclave at 121oC for 15
minutes. Caution should be taken not to overheat
97
E. Trypton Soy Broth
A versatile liquid medium, suitable for general laboratory use. Due to its high
nutrient value it will produce a luxuriant growth of many fastidious organisms
without the addition of serum.
Tryptone 15.0
Soy Peptone 5.0
Sodium Chloride 5.0
di-Potassium Hydrogen
Phosphate 2.5
Dextrose 2.5
Suspend 30g in one litre demineralised water. Dispense into final containers and
autoclave at 121oC for 15 minutes.
F. Saline solution (85%)
Sodium Chloride 8.5g
Distilled water 1000ml
G. Acetone Alcohol
Acetone 30ml
95% ethanol 70ml
H. Crystal Violet
Crystal violet 2.0g
95% ethanol 20ml
98
I. Gram’s Iodine
Iodine 1.0g
Potassium iodide 2.0g
Distilled water 300ml
Mix the iodine crystals and potassium iodide in a mortar and grind until fine. Add
water and mix well. Store in tinted bottles.
J. Safranin
Safranin 0.25g
95% ethanol 10ml
Distilled water 100ml
Dissolve the safranin in the alcohol, add the water and filter.

99
APPENDIX B

100
APPENDIX B
Antibiotic Resistance Data
r = resistance; s = sensitive
Upstream Samples
DATE
COLLECTED
SAMPLES KF
30µg
TS
25µg
S
300µg
Co
10µg
GM
10µg
AP
10µg
T
30µg
MAR
INDEX
FEBRUARY US1 r s s s s r r 0.429
US2 r r s s s r r 0.571
US3 r r s s s r r 0.571
US4 r r s s s r r 0.571
US5 r s s s s r r 0.429
US6 r r s s s r r 0.571
US7 r r s s s r r 0.571
JUNE US1a r r s r s r r 0.714
US2a r r s r s r r 0.714
US3a r r s s s r r 0.571
US4a r r s r s r r 0.714
US5a r r s r s r r 0.714
US6a r r s r s r r 0.714
US7a r r s r s r r 0.714
SEPTEMBER US1b r r s r s r r 0.714
US2b r r s r s r r 0.714
US3b r r s r s r r 0.714
US4b r r s r s r r 0.714
US5b r r s r s r r 0.714
US6b r r s r s r r 0.714
US7b r r s r s r r 0.714

101
Final Effluent Samples
DATE
COLLECTED
SAMPLES KF
30µg
TS
25µg
S
300µg
Co
10µg
GM
10µg
AP
10µg
T
30µg
MAR
INDEX
FEBRUARY FE1 r r s r s r r 0.714
FE2 r r s r s r r 0.714
FE3 r r s r s r r 0.714
FE4 r r s s s r s 0.428
FE5 r r s s s r s 0.428
FE6 r r s s s r s 0.428
FE7 r r s s s r s 0.428
JUNE FE1a r r s s s r r 0.571
FE2a r r s s s r r 0.571
FE3a r r s s s r r 0.571
FE4a r r s r s r r 0.714
FE5a r s s r s r s 0.428
FE6a r s s r s r s 0.428
FE7a s s s s s r s 0.142
SEPTEMBER FE1b r r s r r r r 0.857
FE2b r r s r r r r 0.857
FE3b r s r r r r r 0.857
FE4b r s r s r r r 0.714
FE5b r r s r r r r 0.857
FE6b s s s r r r s 0.428
FE7b r r r r s r r 0.857

102
Down Stream Samples
DATE
COLLECTED
SAMPLES KF
30µg
TS
25µg
S
300µg
Co
10µg
GM
10µg
AP
10µg
T
30µg
MAR
INDEX
FEBRUARY DS1 r r s r s r r 0.714
DS2 r r s r s r r 0.714
DS3 r r s r s r r 0.714
DS4 r r s s s r r 0.571
DS5 r r s s s r r 0.571
DS6 r r s s s r r 0.571
DS7 r r s s s r r 0.571
JUNE DS1a r r s r s r r 0.714
DS2a r r s r s r r 0.714
DS3a r s s r s r r 0.571
DS4a r r s r s r r 0.714
DS5a r r s r s r r 0.714
DS6a r s s r s r r 0.571
DS7a r r s r s r r 0.714
SEPTEMBER DS1b s s s r s r s 0.286
DS2b r r s r r r r 0.857
DS3b r r s r s r r 0.714
DS4b r r s r r r s 0.714
DS5b r r s r r r r 0.857
DS6b s s s r s r r 0.428
DS7b r r s r s r r 0.714

103
APPENDIX C
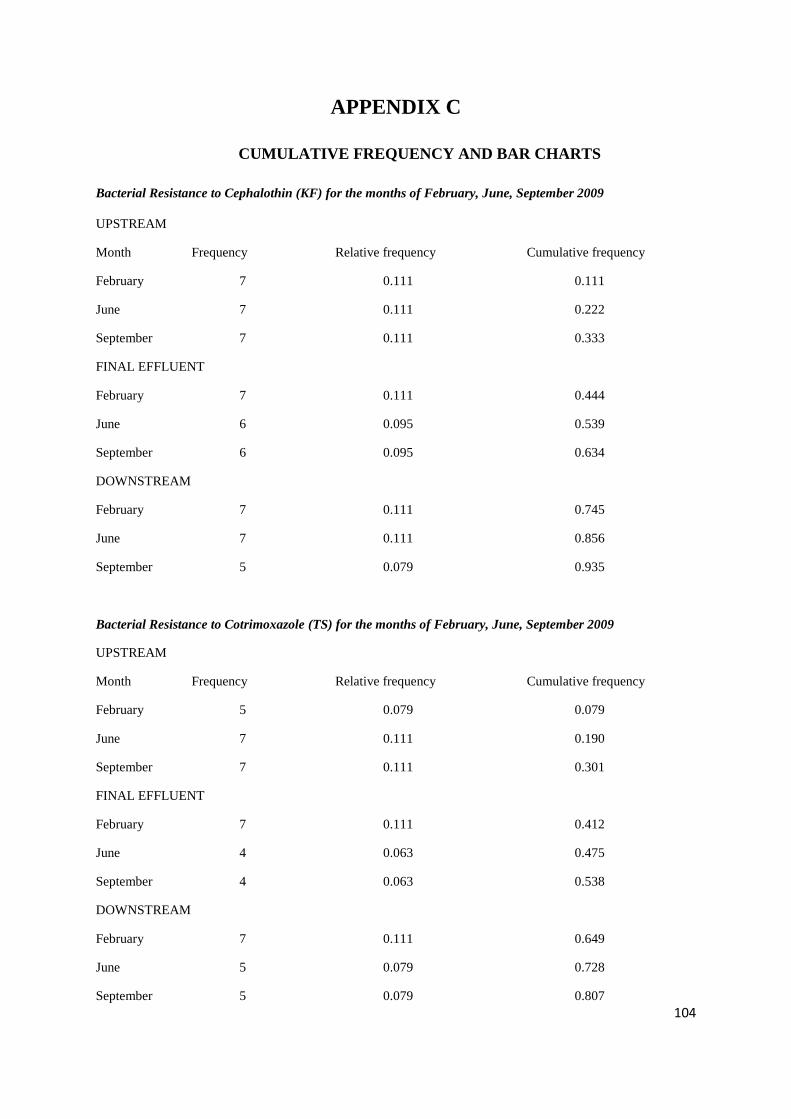
104
APPENDIX C
CUMULATIVE FREQUENCY AND BAR CHARTS
Bacterial Resistance to Cephalothin (KF) for the months of February, June, September 2009
UPSTREAM
Month Frequency Relative frequency Cumulative frequency
February 7 0.111 0.111
June 7 0.111 0.222
September 7 0.111 0.333
FINAL EFFLUENT
February 7 0.111 0.444
June 6 0.095 0.539
September 6 0.095 0.634
DOWNSTREAM
February 7 0.111 0.745
June 7 0.111 0.856
September 5 0.079 0.935
Bacterial Resistance to Cotrimoxazole (TS) for the months of February, June, September 2009
UPSTREAM
Month Frequency Relative frequency Cumulative frequency
February 5 0.079 0.079
June 7 0.111 0.190
September 7 0.111 0.301
FINAL EFFLUENT
February 7 0.111 0.412
June 4 0.063 0.475
September 4 0.063 0.538
DOWNSTREAM
February 7 0.111 0.649
June 5 0.079 0.728
September 5 0.079 0.807

105
Bacterial Resistance to Streptomycin (S) for the months of February, June, September 2009
UPSTREAM
Month Frequency Relative frequency Cumulative frequency
February 0 0.000 0.000
June 0 0.000 0.000
September 0 0.000 0.000
FINAL EFFLUENT
February 0 0.000 0.000
June 0 0.000 0.000
September 3 0.047 0.047
DOWNSTREAM
February 0 0.000 0.047
June 0 0.000 0.047
September 0 0.000 0.047
Bacterial Resistance to Colistin sulphate (Co) for the months of February, June, September 2009
UPSTREAM
Month Frequency Relative frequency Cumulative frequency
February 0 0.000 0.000
June 6 0.095 0.095
September 7 0.111 0.206
FINAL EFFLUENT
February 3 0.047 0.253
June 3 0.047 0.300
September 6 0.095 0.395
DOWNSTREAM
February 3 0.047 0.442
June 7 0.111 0.553
September 7 0.111 0.664
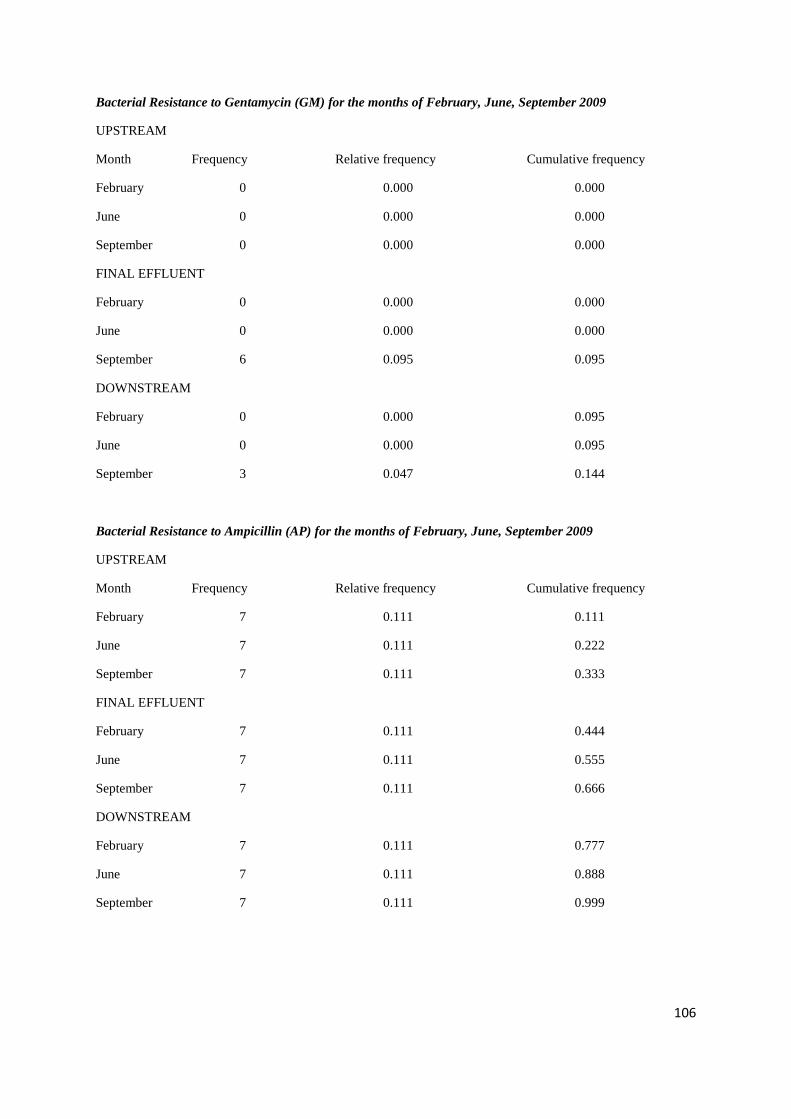
106
Bacterial Resistance to Gentamycin (GM) for the months of February, June, September 2009
UPSTREAM
Month Frequency Relative frequency Cumulative frequency
February 0 0.000 0.000
June 0 0.000 0.000
September 0 0.000 0.000
FINAL EFFLUENT
February 0 0.000 0.000
June 0 0.000 0.000
September 6 0.095 0.095
DOWNSTREAM
February 0 0.000 0.095
June 0 0.000 0.095
September 3 0.047 0.144
Bacterial Resistance to Ampicillin (AP) for the months of February, June, September 2009
UPSTREAM
Month Frequency Relative frequency Cumulative frequency
February 7 0.111 0.111
June 7 0.111 0.222
September 7 0.111 0.333
FINAL EFFLUENT
February 7 0.111 0.444
June 7 0.111 0.555
September 7 0.111 0.666
DOWNSTREAM
February 7 0.111 0.777
June 7 0.111 0.888
September 7 0.111 0.999

107
Bacterial Resistance to Tetracycline (T) for the months of February, June, September 2009
UPSTREAM
Month Frequency Relative frequency Cumulative frequency
February 7 0.111 0.111
June 7 0.111 0.222
September 7 0.111 0.333
FINAL EFFLUENT
February 3 0.047 0.380
June 4 0.063 0.538
September 6 0.095 0.633
DOWNSTREAM
February 7 0.111 0.744
June 7 0.111 0.855
September 5 0.079 0.934
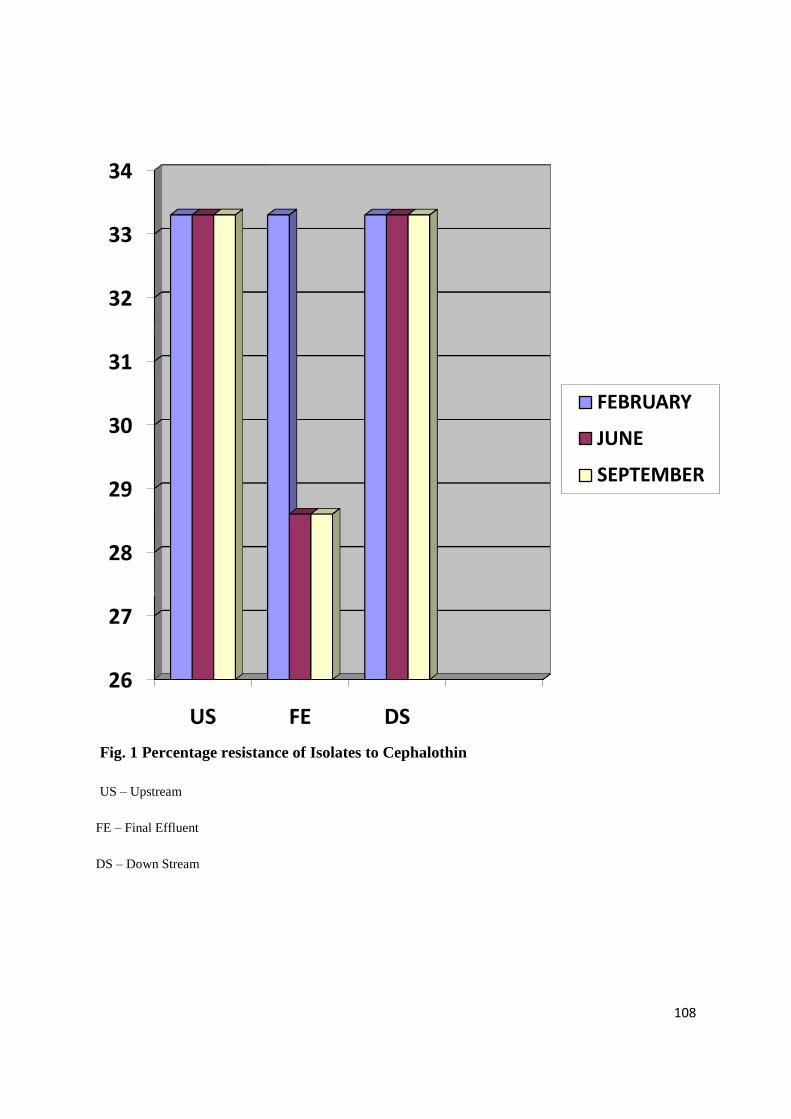
108
Fig. 1 Percentage resistance of Isolates to Cephalothin
US – Upstream
FE – Final Effluent
DS – Down Stream
26
27
28
29
30
31
32
33
34
US FE DS
FEBRUARY
JUNE
SEPTEMBER

109
Fig. 2 Percentage resistance of Isolates to Cotrimoxazole
US – Upstream
FE – Final Effluent
DS – Down Stream
0
5
10
15
20
25
30
35
US FE DS
FEBRUARY
JUNE
SEPTEMBER

110
Fig. 3 Percentage resistance of Isolates to Streptomycin
US – Upstream
FE – Final Effluent
DS – Down Stream
0
2
4
6
8
10
12
14
16
US FE DS
FEBRUARY
JUNE
SEPTEMBER
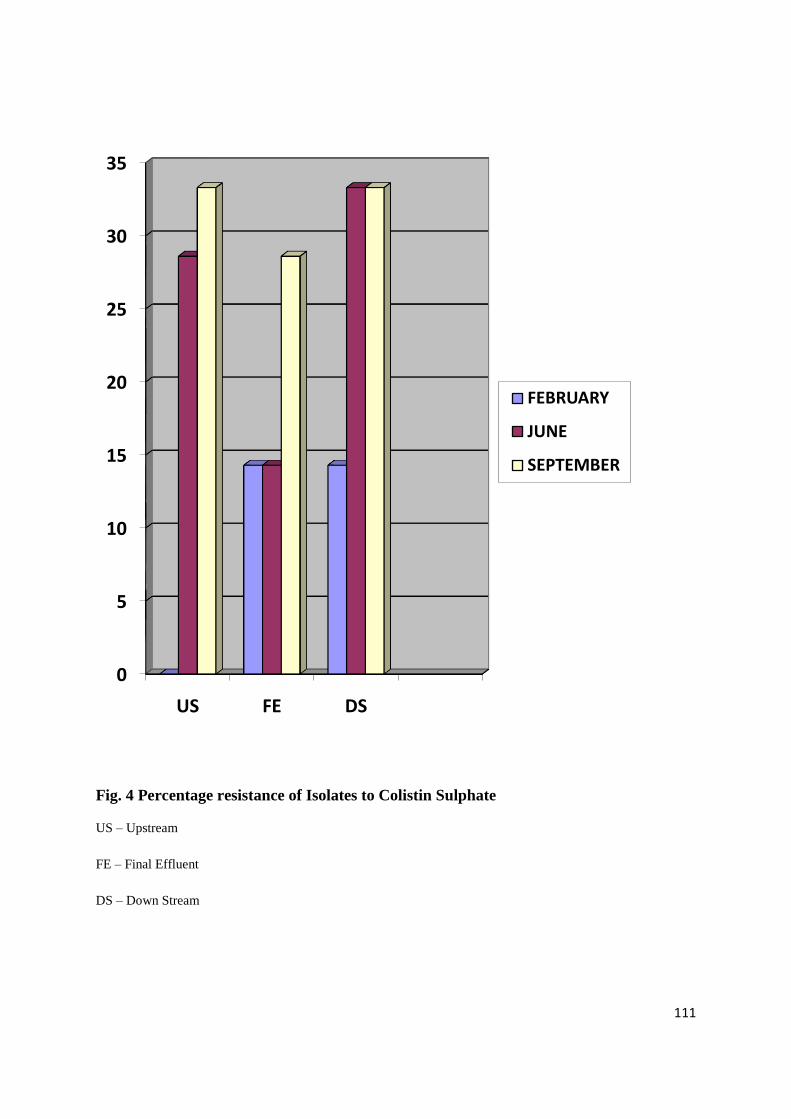
111
Fig. 4 Percentage resistance of Isolates to Colistin Sulphate
US – Upstream
FE – Final Effluent
DS – Down Stream
0
5
10
15
20
25
30
35
US FE DS
FEBRUARY
JUNE
SEPTEMBER
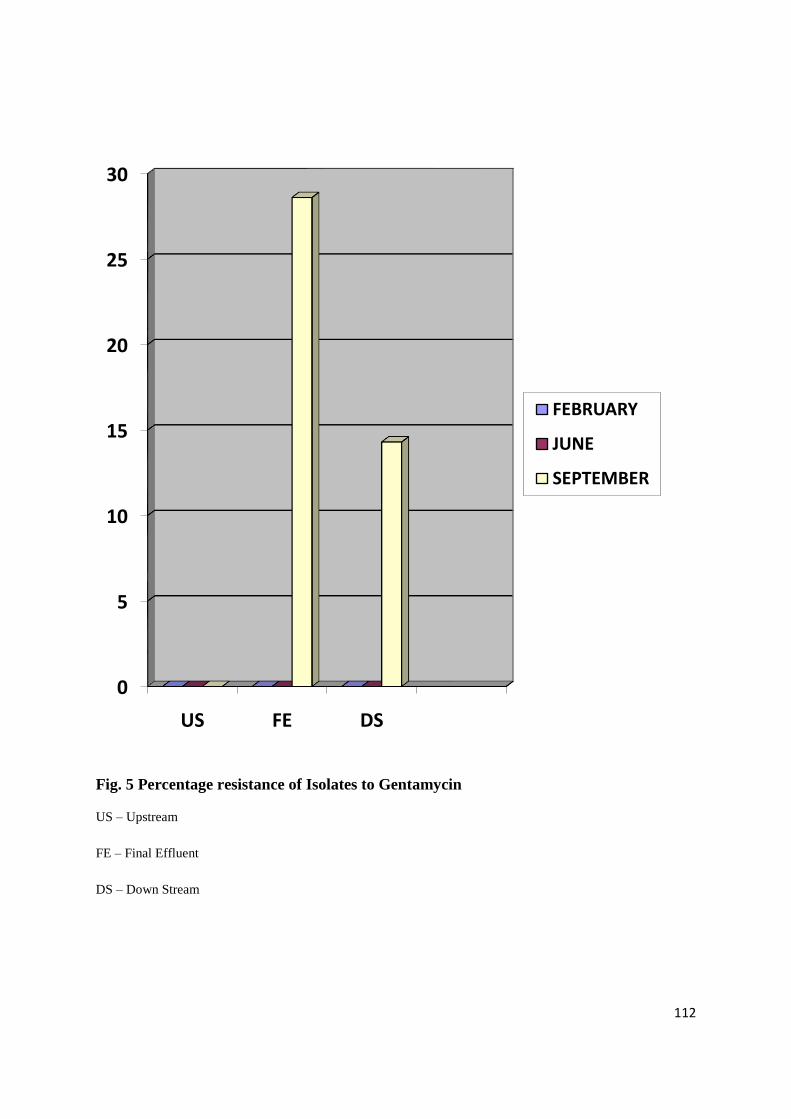
112
Fig. 5 Percentage resistance of Isolates to Gentamycin
US – Upstream
FE – Final Effluent
DS – Down Stream
0
5
10
15
20
25
30
US FE DS
FEBRUARY
JUNE
SEPTEMBER
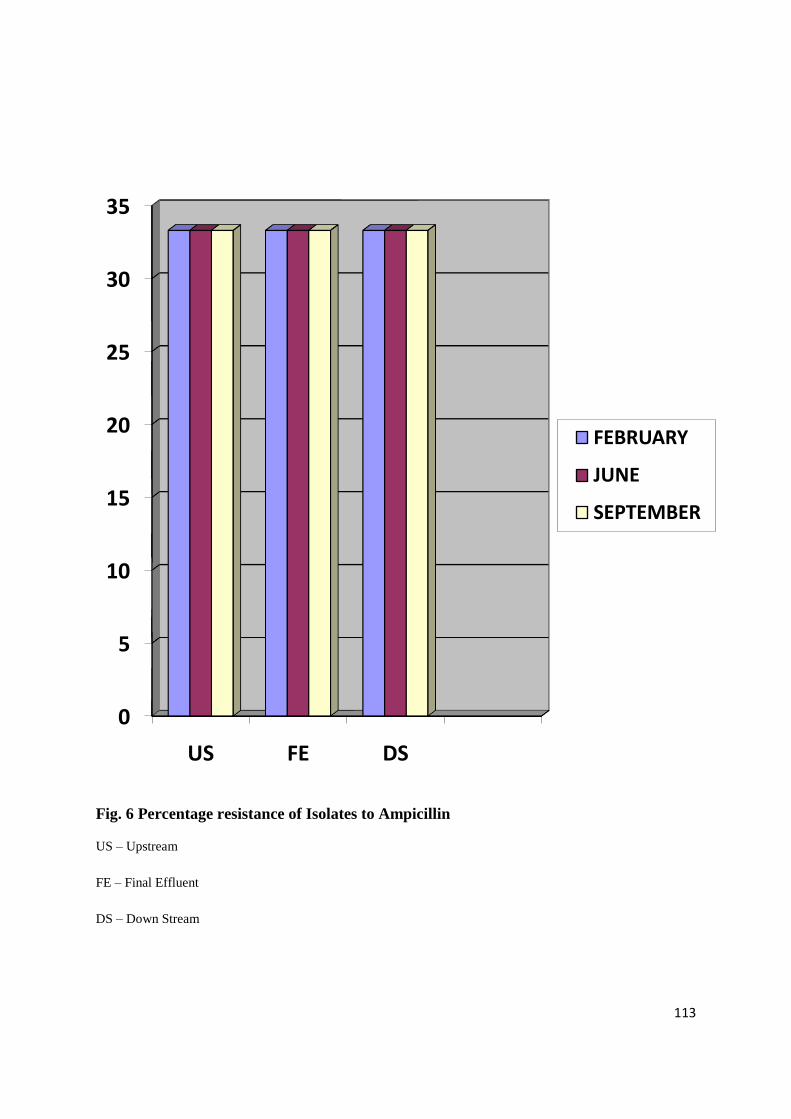
113
Fig. 6 Percentage resistance of Isolates to Ampicillin
US – Upstream
FE – Final Effluent
DS – Down Stream
0
5
10
15
20
25
30
35
US FE DS
FEBRUARY
JUNE
SEPTEMBER
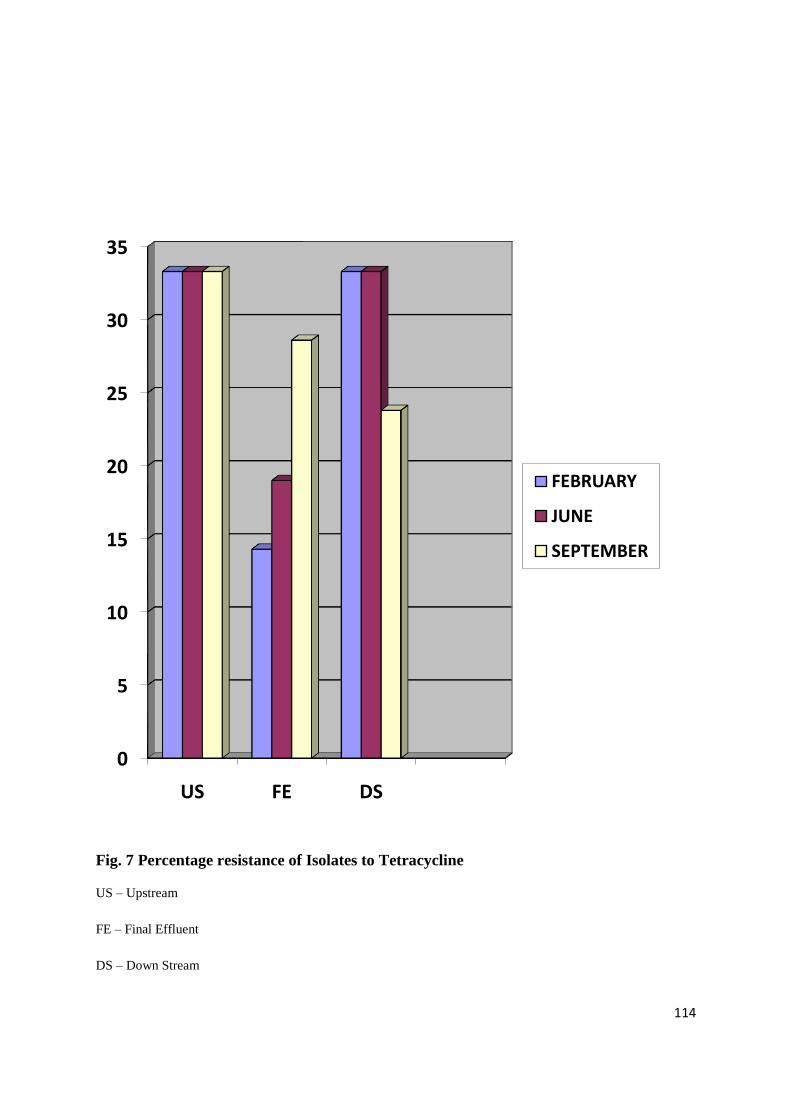
114
Fig. 7 Percentage resistance of Isolates to Tetracycline
US – Upstream
FE – Final Effluent
DS – Down Stream
0
5
10
15
20
25
30
35
US FE DS
FEBRUARY
JUNE
SEPTEMBER
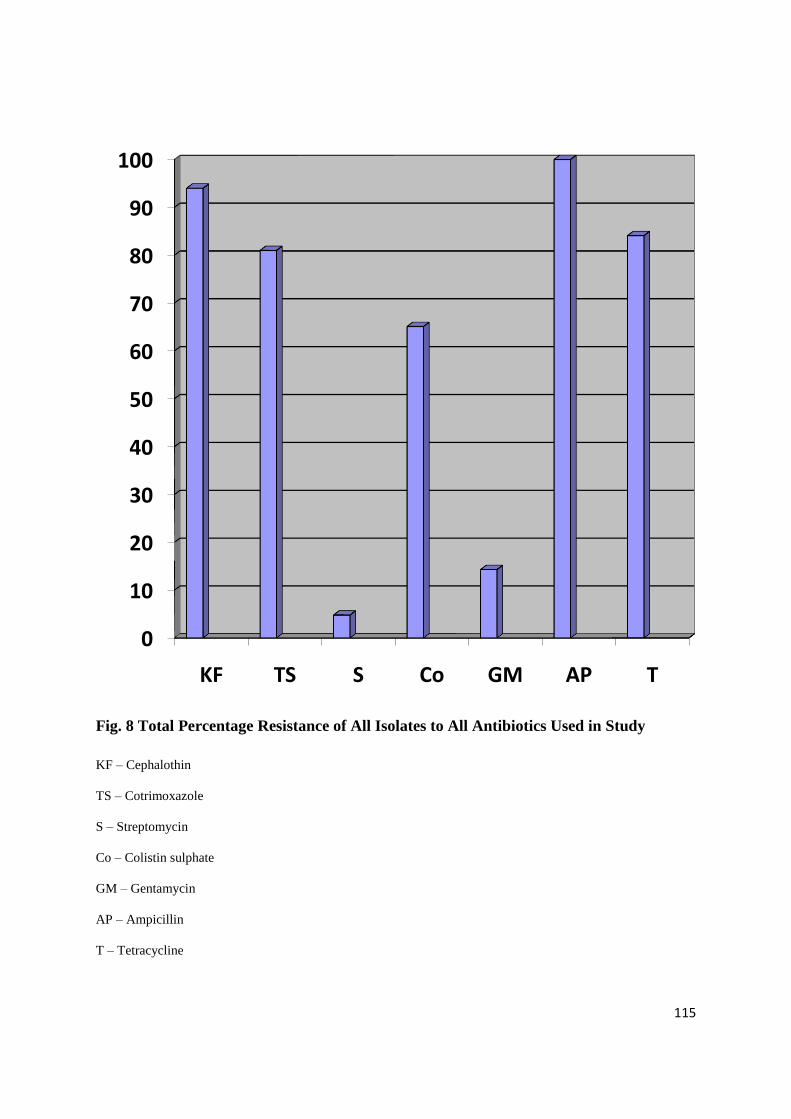
115
Fig. 8 Total Percentage Resistance of All Isolates to All Antibiotics Used in Study
KF – Cephalothin
TS – Cotrimoxazole
S – Streptomycin
Co – Colistin sulphate
GM – Gentamycin
AP – Ampicillin
T – Tetracycline
0
10
20
30
40
50
60
70
80
90
100
KF TS S Co GM AP T

116
APPENDIX D

117
APPENDIX D
ISOLATES AND THEIR ANTIBIOTIC RESISTANCE PATTERNS
Upstream Samples
DATE
COLLECTED
SAMPLES
ANTIBIOTIC
RESISTANCE PATTERN
TAXON
FEBRUARY US1 KF, AP,T Pantoea spp.
US2 KF,TS,AP,T Klebsiella pneumoniae
US3 KF,TS,AP,T Klebsiella pneumoniae
US4 KF,TS,AP,T Kluyvera spp.
US5 KF,AP,T Escherichia coli
US6 KF,TS, AP,T Rahnella aquatilis
US7 KF, TS, AP,T Klebsiella oxytoca
JUNE US1a KF, TS, Co, AP,T Kluyvera spp
US2a KF, TS ,Co, AP,T Serratia fonticola
US3a KF,TS,AP,T Escherichia coli
US4a KF, TS, Co, AP,T Enterobacter cloacae
US5a KF, TS, Co, AP,T Escherichia coli
US6a KF, TS, Co, AP,T Serratia marcescens
US7a KF, TS, Co, AP,T Klebsiella oxytoca
SEPTEMBER US1b KF, TS, Co, AP,T Klebsiella oxytoca
US2b KF, TS, Co, AP,T Serratia marcescens
US3b KF, TS, Co, AP,T Serratia marcescens
US4b KF, TS, Co, AP,T Raoultella ornithinolytica
US5b KF, TS, Co, AP,T Serratia odorifera
US6b KF, TS, Co, AP,T Salmonella spp.
US7b KF, TS, Co, AP,T Raoultella ornithinolytica
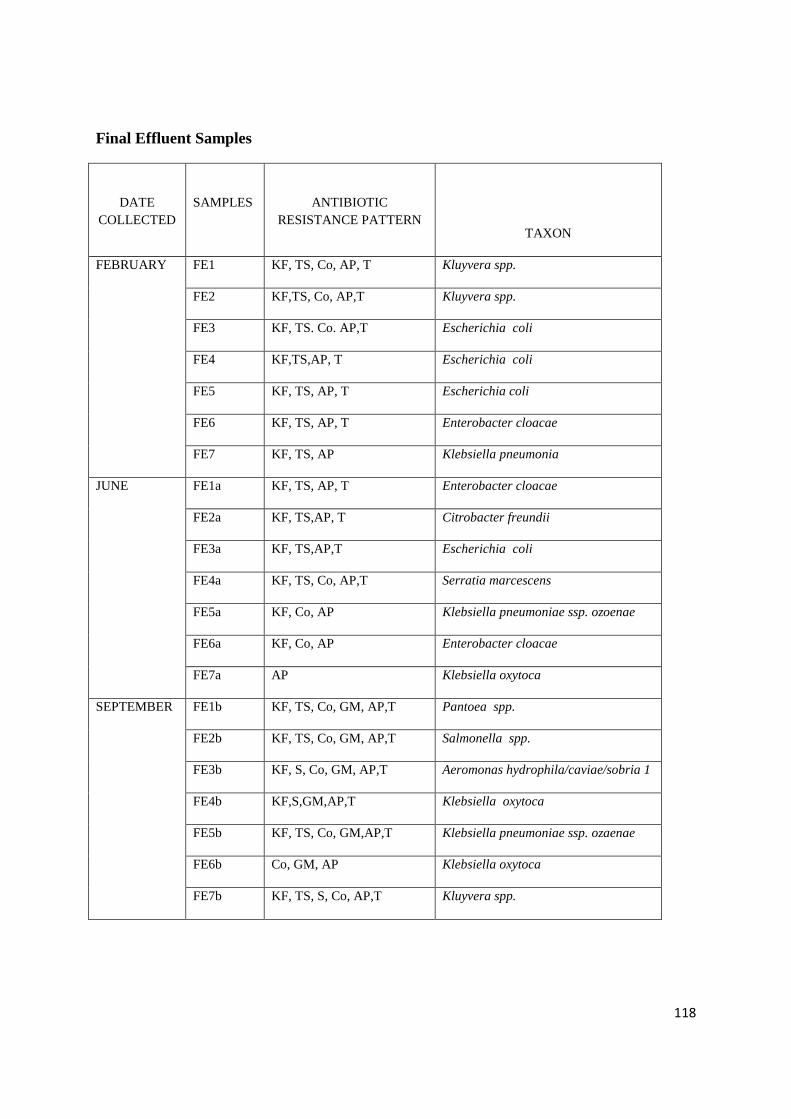
118
Final Effluent Samples
DATE
COLLECTED
SAMPLES
ANTIBIOTIC
RESISTANCE PATTERN
TAXON
FEBRUARY FE1 KF, TS, Co, AP, T Kluyvera spp.
FE2 KF,TS, Co, AP,T Kluyvera spp.
FE3 KF, TS. Co. AP,T Escherichia coli
FE4 KF,TS,AP, T Escherichia coli
FE5 KF, TS, AP, T Escherichia coli
FE6 KF, TS, AP, T Enterobacter cloacae
FE7 KF, TS, AP Klebsiella pneumonia
JUNE FE1a KF, TS, AP, T Enterobacter cloacae
FE2a KF, TS,AP, T Citrobacter freundii
FE3a KF, TS,AP,T Escherichia coli
FE4a KF, TS, Co, AP,T Serratia marcescens
FE5a KF, Co, AP Klebsiella pneumoniae ssp. ozoenae
FE6a KF, Co, AP Enterobacter cloacae
FE7a AP Klebsiella oxytoca
SEPTEMBER FE1b KF, TS, Co, GM, AP,T Pantoea spp.
FE2b KF, TS, Co, GM, AP,T Salmonella spp.
FE3b KF, S, Co, GM, AP,T Aeromonas hydrophila/caviae/sobria 1
FE4b KF,S,GM,AP,T Klebsiella oxytoca
FE5b KF, TS, Co, GM,AP,T Klebsiella pneumoniae ssp. ozaenae
FE6b Co, GM, AP Klebsiella oxytoca
FE7b KF, TS, S, Co, AP,T Kluyvera spp.

119
Down Stream Samples
DATE
COLLECTED
SAMPLES
ANTIBIOTIC RESISTANCE
PATTERN
TAXON
FEBRUARY DS1 KF, TS, Co ,AP,T Enterobacter cloacae
DS2 KF, TS, Co, AP,T Pantoea spp.
DS3 KF, TS, Co, AP,T Rahnella aquatilis
DS4 KF,TS,AP,T Serratia ficaria
DS5 KF,TS,AP,T Enterobacter amnigenus1
DS6 KF,TS,AP,T Klebsiella oxytoca
DS7 KF,TS,AP,T Escherichia coli
JUNE DS1a KF, TS, Co, AP,T Escherichia coli
DS2a KF, TS, Co ,AP,T Pantoea spp.
DS3a KF, Co, AP,T Serratia fonticola
DS4a KF, TS, Co, AP,T Serratia ficaria
DS5a KF, TS, Co, AP, T Serratia marcescens
DS6a KF, Co, AP,T Enterbacter cloacae
DS7a KF, TS, Co, AP,T Escherichia coli
SEPTEMBER DS1b Co, AP Salmonella spp.
DS2b KF,TS, Co, GM,AP,T Serratia odorifera
DS3b KF, TS, Co, AP,T Serratia odorifera
DS4b KF, TS, Co, GM,AP,T Serratia odorifera
DS5b KF, TS, Co, GM,AP,T Kluyvera spp.
DS6b Co, AP,T Kluyvera spp
DS7b KF, TS, Co, AP,T Kluyvera spp.

120
APPENDIX E
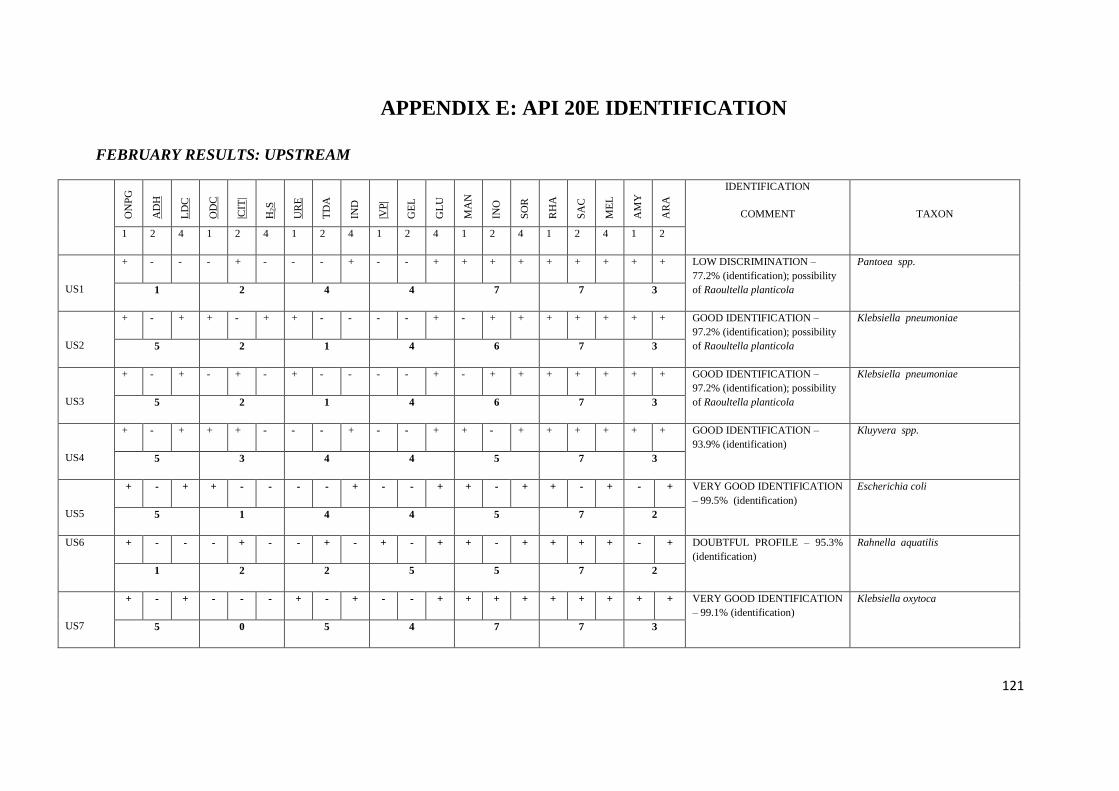
121
APPENDIX E: API 20E IDENTIFICATION
FEBRUARY RESULTS: UPSTREAM
ON
PG
AD
H
LD
C
OD
C
|CIT
|
H2S
UR
E
TD
A
IND
|VP
|
GE
L
GL
U
MA
N
INO
SO
R
RH
A
SA
C
ME
L
AM
Y
AR
A
IDENTIFICATION
COMMENT
TAXON
1 2 4 1 2 4 1 2 4 1 2 4 1 2 4 1 2 4 1 2
US1
+ - - - + - - - + - - + + + + + + + + + LOW DISCRIMINATION –
77.2% (identification); possibility
of Raoultella planticola
Pantoea spp.
1 2 4 4 7 7 3
US2
+ - + + - + + - - - - + - + + + + + + + GOOD IDENTIFICATION –
97.2% (identification); possibility
of Raoultella planticola
Klebsiella pneumoniae
5 2 1 4 6 7 3
US3
+ - + - + - + - - - - + - + + + + + + + GOOD IDENTIFICATION –
97.2% (identification); possibility
of Raoultella planticola
Klebsiella pneumoniae
5 2 1 4 6 7 3
US4
+ - + + + - - - + - - + + - + + + + + + GOOD IDENTIFICATION –
93.9% (identification)
Kluyvera spp.
5 3 4 4 5 7 3
US5
+ - + + - - - - + - - + + - + + - + - + VERY GOOD IDENTIFICATION
– 99.5% (identification)
Escherichia coli
5 1 4 4 5 7 2
US6 + - - - + - - + - + - + + - + + + + - + DOUBTFUL PROFILE – 95.3%
(identification)
Rahnella aquatilis
1 2 2 5 5 7 2
US7
+ - + - - - + - + - - + + + + + + + + + VERY GOOD IDENTIFICATION
– 99.1% (identification)
Klebsiella oxytoca
5 0 5 4 7 7 3
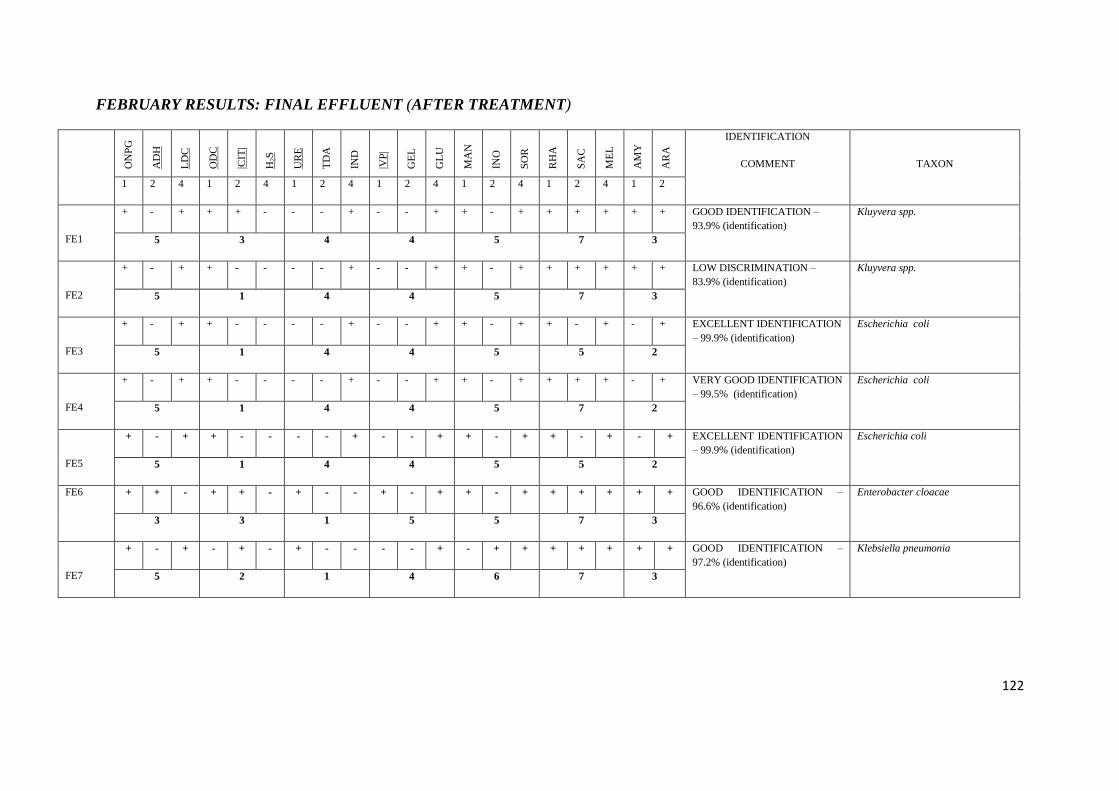
122
FEBRUARY RESULTS: FINAL EFFLUENT (AFTER TREATMENT)
O
NP
G
AD
H
LD
C
OD
C
|CIT
|
H2S
UR
E
TD
A
IND
|VP
|
GE
L
GL
U
MA
N
INO
SO
R
RH
A
SA
C
ME
L
AM
Y
AR
A
IDENTIFICATION
COMMENT
TAXON
1 2 4 1 2 4 1 2 4 1 2 4 1 2 4 1 2 4 1 2
FE1
+ - + + + - - - + - - + + - + + + + + + GOOD IDENTIFICATION –
93.9% (identification)
Kluyvera spp.
5 3 4 4 5 7 3
FE2
+ - + + - - - - + - - + + - + + + + + + LOW DISCRIMINATION –
83.9% (identification)
Kluyvera spp.
5 1 4 4 5 7 3
FE3
+ - + + - - - - + - - + + - + + - + - + EXCELLENT IDENTIFICATION
– 99.9% (identification)
Escherichia coli
5 1 4 4 5 5 2
FE4
+ - + + - - - - + - - + + - + + + + - + VERY GOOD IDENTIFICATION
– 99.5% (identification)
Escherichia coli
5 1 4 4 5 7 2
FE5
+ - + + - - - - + - - + + - + + - + - + EXCELLENT IDENTIFICATION
– 99.9% (identification)
Escherichia coli
5 1 4 4 5 5 2
FE6 + + - + + - + - - + - + + - + + + + + + GOOD IDENTIFICATION –
96.6% (identification)
Enterobacter cloacae
3 3 1 5 5 7 3
FE7
+ - + - + - + - - - - + - + + + + + + + GOOD IDENTIFICATION –
97.2% (identification)
Klebsiella pneumonia
5 2 1 4 6 7 3
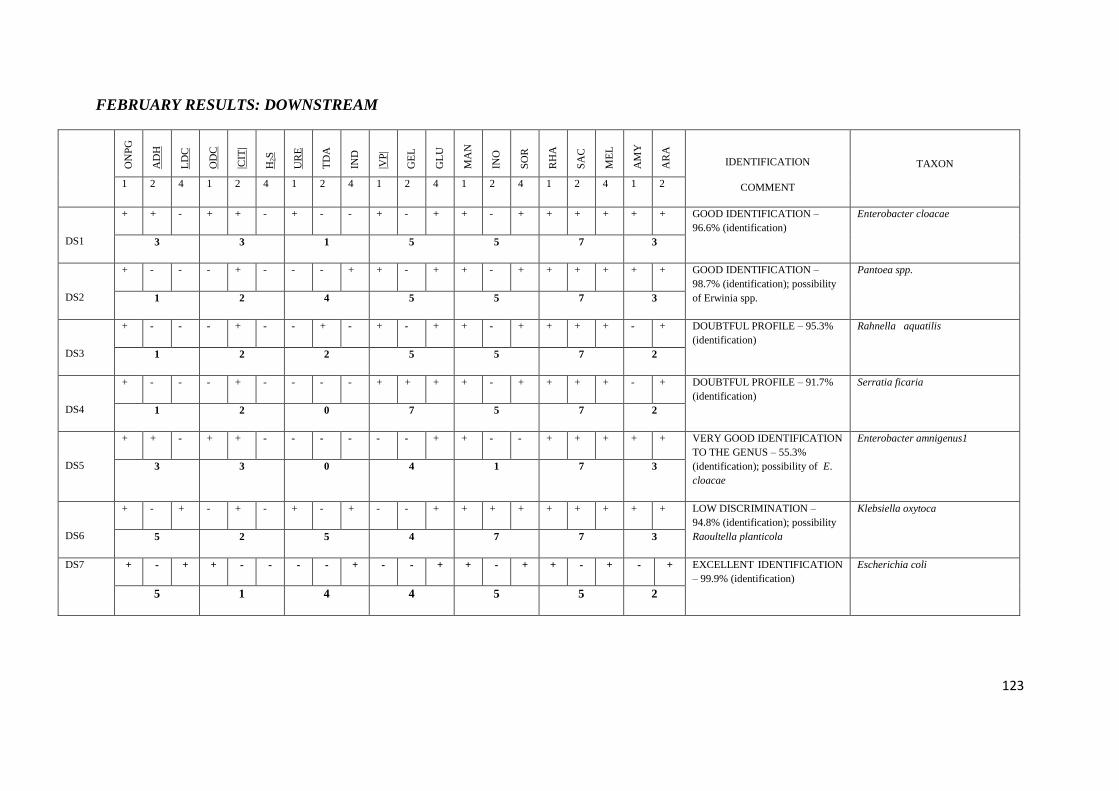
123
FEBRUARY RESULTS: DOWNSTREAM
O
NP
G
AD
H
LD
C
OD
C
|CIT
|
H2S
UR
E
TD
A
IND
|VP
|
GE
L
GL
U
MA
N
INO
SO
R
RH
A
SA
C
ME
L
AM
Y
AR
A
IDENTIFICATION
COMMENT
TAXON
1 2 4 1 2 4 1 2 4 1 2 4 1 2 4 1 2 4 1 2
DS1
+ + - + + - + - - + - + + - + + + + + + GOOD IDENTIFICATION –
96.6% (identification)
Enterobacter cloacae
3 3 1 5 5 7 3
DS2
+ - - - + - - - + + - + + - + + + + + + GOOD IDENTIFICATION –
98.7% (identification); possibility
of Erwinia spp.
Pantoea spp.
1 2 4 5 5 7 3
DS3
+ - - - + - - + - + - + + - + + + + - + DOUBTFUL PROFILE – 95.3%
(identification)
Rahnella aquatilis
1 2 2 5 5 7 2
DS4
+ - - - + - - - - + + + + - + + + + - + DOUBTFUL PROFILE – 91.7%
(identification)
Serratia ficaria
1 2 0 7 5 7 2
DS5
+ + - + + - - - - - - + + - - + + + + + VERY GOOD IDENTIFICATION
TO THE GENUS – 55.3%
(identification); possibility of E.
cloacae
Enterobacter amnigenus1
3 3 0 4 1 7 3
DS6
+ - + - + - + - + - - + + + + + + + + + LOW DISCRIMINATION –
94.8% (identification); possibility
Raoultella planticola
Klebsiella oxytoca
5 2 5 4 7 7 3
DS7 + - + + - - - - + - - + + - + + - + - + EXCELLENT IDENTIFICATION
– 99.9% (identification)
Escherichia coli
5 1 4 4 5 5 2

124
JUNE RESULTS: UPSTREAM
O
NP
G
AD
H
LD
C
OD
C
|CIT
|
H2S
UR
E
TD
A
IND
|VP
|
GE
L
GL
U
MA
N
INO
SO
R
RH
A
SA
C
ME
L
AM
Y
AR
A
IDENTIFICATION
COMMENT
TAXON
1 2 4 1 2 4 1 2 4 1 2 4 1 2 4 1 2 4 1 2
US1a
+ - + + + - - - + - - + + - + + + + + + GOOD IDENTIFICATION –
93.9% (identification)
Kluyvera spp
5 3 4 4 5 7 3
US2a
+ - + + + - - - - - - + + + + + + + + + LOW DISCRIMINATION –
55.1% (identification);
Serratia fonticola
5 3 0 4 7 7 3
US3a
+ - + - + - + - - - - + - + + + + + + + GOOD IDENTIFICATION –
98.1% (identification);
Escherichia coli
5 0 4 4 5 4 2
US4a
+ + + + + - - - - - - + + - + + + + + + GOOD IDENTIFICATION –
96.6% (identification)
Enterobacter cloacae
7 3 0 4 5 7 3
US5a
+ - + + - - - - + - - + + - - + - + - + GOOD IDENTIFICATION –
97.7% (identification)
Escherichia coli
5 1 4 4 1 5 2
US6a
+ - + + - - - - - + + + + - + - + - + - VERY GOOD IDENTIFICATION
TO THE GENUS – 84.9%
(identification)
Serratia marcescens
5 1 0 7 5 2 1
US7a
+ - + - - - + - + - - + + + + + + + + + VERY GOOD IDENTIFICATION
– 99.1% (identification)
Klebsiella oxytoca
5 0 5 4 7 7 3
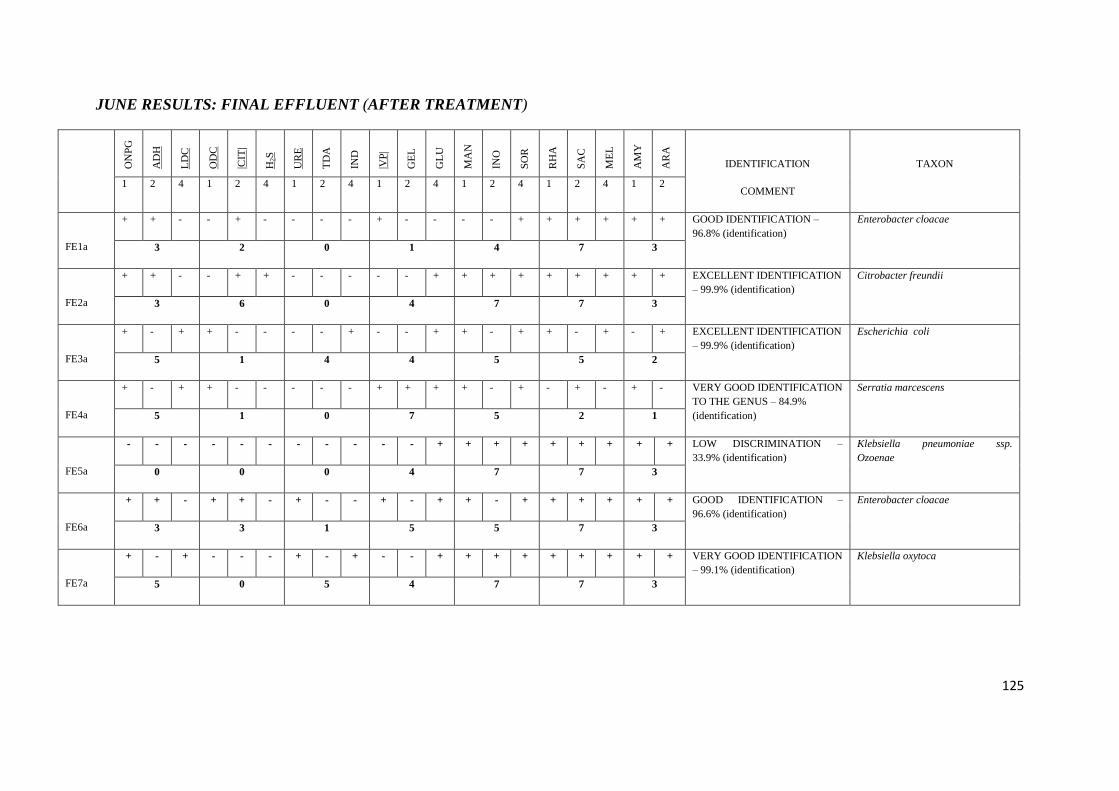
125
JUNE RESULTS: FINAL EFFLUENT (AFTER TREATMENT)
O
NP
G
AD
H
LD
C
OD
C
|CIT
|
H2S
UR
E
TD
A
IND
|VP
|
GE
L
GL
U
MA
N
INO
SO
R
RH
A
SA
C
ME
L
AM
Y
AR
A
IDENTIFICATION
COMMENT
TAXON
1 2 4 1 2 4 1 2 4 1 2 4 1 2 4 1 2 4 1 2
FE1a
+ + - - + - - - - + - - - - + + + + + + GOOD IDENTIFICATION –
96.8% (identification)
Enterobacter cloacae
3 2 0 1 4 7 3
FE2a
+ + - - + + - - - - - + + + + + + + + + EXCELLENT IDENTIFICATION
– 99.9% (identification)
Citrobacter freundii
3 6 0 4 7 7 3
FE3a
+ - + + - - - - + - - + + - + + - + - + EXCELLENT IDENTIFICATION
– 99.9% (identification)
Escherichia coli
5 1 4 4 5 5 2
FE4a
+ - + + - - - - - + + + + - + - + - + - VERY GOOD IDENTIFICATION
TO THE GENUS – 84.9%
(identification)
Serratia marcescens
5 1 0 7 5 2 1
FE5a
- - - - - - - - - - - + + + + + + + + + LOW DISCRIMINATION –
33.9% (identification)
Klebsiella pneumoniae ssp.
Ozoenae
0 0 0 4 7 7 3
FE6a
+ + - + + - + - - + - + + - + + + + + + GOOD IDENTIFICATION –
96.6% (identification)
Enterobacter cloacae
3 3 1 5 5 7 3
FE7a
+ - + - - - + - + - - + + + + + + + + + VERY GOOD IDENTIFICATION
– 99.1% (identification)
Klebsiella oxytoca
5 0 5 4 7 7 3
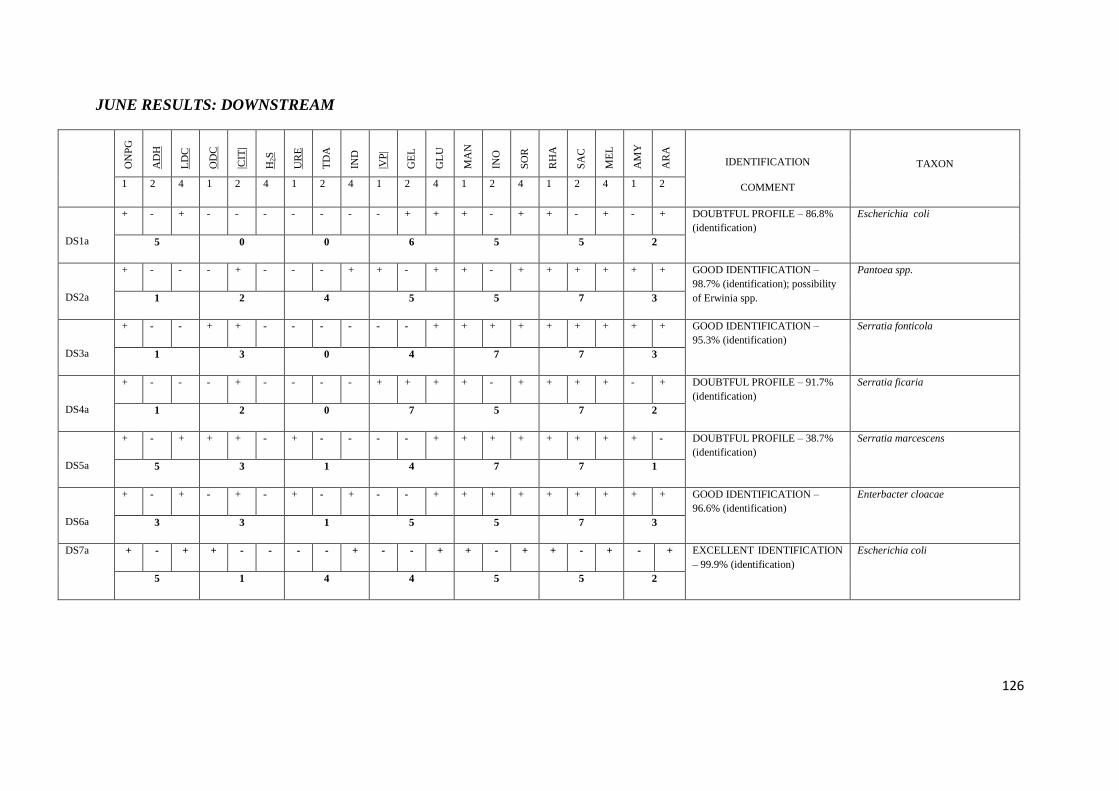
126
JUNE RESULTS: DOWNSTREAM
O
NP
G
AD
H
LD
C
OD
C
|CIT
|
H2S
UR
E
TD
A
IND
|VP
|
GE
L
GL
U
MA
N
INO
SO
R
RH
A
SA
C
ME
L
AM
Y
AR
A
IDENTIFICATION
COMMENT
TAXON
1 2 4 1 2 4 1 2 4 1 2 4 1 2 4 1 2 4 1 2
DS1a
+ - + - - - - - - - + + + - + + - + - + DOUBTFUL PROFILE – 86.8%
(identification)
Escherichia coli
5 0 0 6 5 5 2
DS2a
+ - - - + - - - + + - + + - + + + + + + GOOD IDENTIFICATION –
98.7% (identification); possibility
of Erwinia spp.
Pantoea spp.
1 2 4 5 5 7 3
DS3a
+ - - + + - - - - - - + + + + + + + + + GOOD IDENTIFICATION –
95.3% (identification)
Serratia fonticola
1 3 0 4 7 7 3
DS4a
+ - - - + - - - - + + + + - + + + + - + DOUBTFUL PROFILE – 91.7%
(identification)
Serratia ficaria
1 2 0 7 5 7 2
DS5a
+ - + + + - + - - - - + + + + + + + + - DOUBTFUL PROFILE – 38.7%
(identification)
Serratia marcescens
5 3 1 4 7 7 1
DS6a
+ - + - + - + - + - - + + + + + + + + + GOOD IDENTIFICATION –
96.6% (identification)
Enterbacter cloacae
3 3 1 5 5 7 3
DS7a + - + + - - - - + - - + + - + + - + - + EXCELLENT IDENTIFICATION
– 99.9% (identification)
Escherichia coli
5 1 4 4 5 5 2

127
SEPTEMBER RESULTS: UPSTREAM
O
NP
G
AD
H
LD
C
OD
C
|CIT
|
H2S
UR
E
TD
A
IND
|VP
|
GE
L
GL
U
MA
N
INO
SO
R
RH
A
SA
C
ME
L
AM
Y
AR
A
IDENTIFICATION
COMMENT
TAXON
1 2 4 1 2 4 1 2 4 1 2 4 1 2 4 1 2 4 1 2
US1b
- + + - + - + - + - - + + + + + + + + + DOUBTFUL PROFILE – 97.3%
(identification); possibility of
Raoultella planticola
Klebsiella oxytoca
6 2 5 4 7 7 3
US2b
+ - + + + - + - - - - + + + + + + + + - DOUBTFUL PROFILE – 38.7%
(identification)
Serratia marcescens
5 3 1 4 7 7 1
US3b
+ - + + - - - - - + + + + - + - + - + - VERY GOOD IDENTIFICATION
TO THE GENUS – 84.9%
(identification)
Serratia marcescens
5 1 0 7 5 2 1
US4b
+ + + + + - + - + - - + + - + + + + + + DOUBTFUL PROFILE – 98.6%
(identification)
Raoultella ornithinolytica
7 3 5 4 5 7 3
US5b
- - + + + - - - + - + + + + + + + + + + EXCELLENT IDENTIFICATION
– 99.9% (identification).
Serratia odorifera
4 3 4 6 7 7 3
US6b
- + + + + - - - + - - + + - + + + + - + ACCEPTABLE
IDENTIFICATION – 94.2%
(identification)
Salmonella spp.
6 3 4 4 5 7 2
US7b
- - + + + - + - + - - + - + + + + + + + DOUBTFUL PROFILE – 99.8%
(identification)
Raoultella ornithinolytica
4 3 5 4 6 7 3
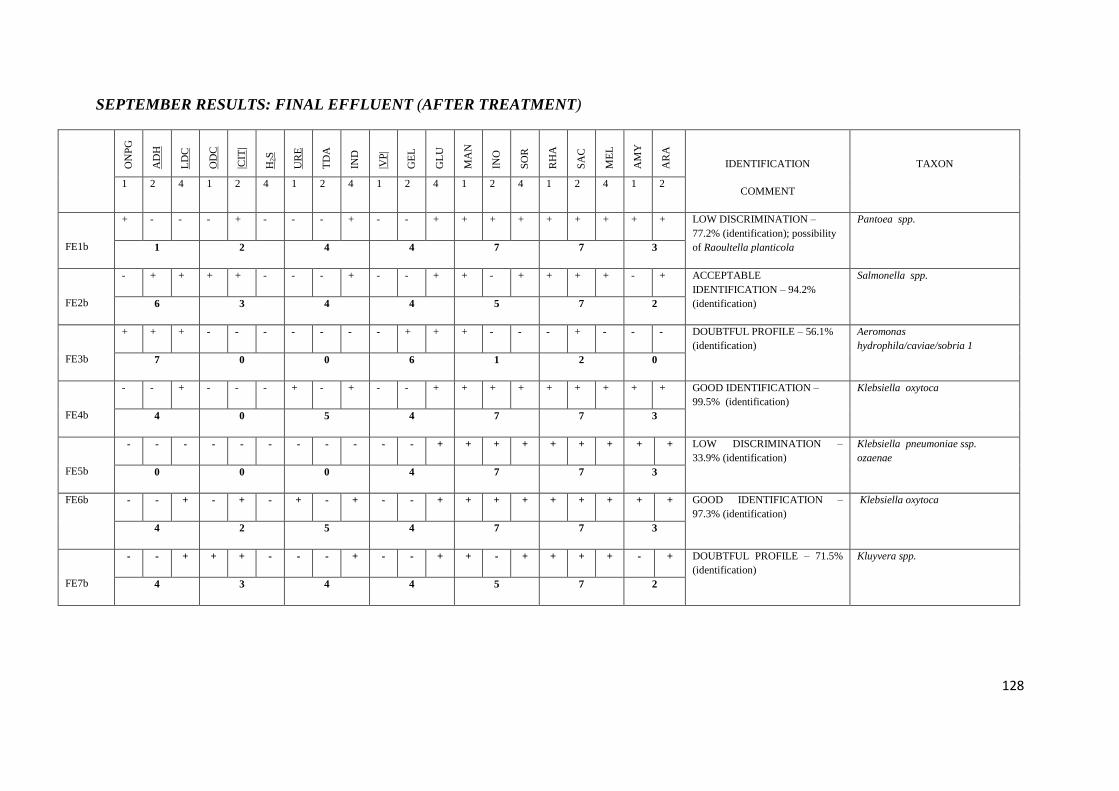
128
SEPTEMBER RESULTS: FINAL EFFLUENT (AFTER TREATMENT)
O
NP
G
AD
H
LD
C
OD
C
|CIT
|
H2S
UR
E
TD
A
IND
|VP
|
GE
L
GL
U
MA
N
INO
SO
R
RH
A
SA
C
ME
L
AM
Y
AR
A
IDENTIFICATION
COMMENT
TAXON
1 2 4 1 2 4 1 2 4 1 2 4 1 2 4 1 2 4 1 2
FE1b
+ - - - + - - - + - - + + + + + + + + + LOW DISCRIMINATION –
77.2% (identification); possibility
of Raoultella planticola
Pantoea spp.
1 2 4 4 7 7 3
FE2b
- + + + + - - - + - - + + - + + + + - + ACCEPTABLE
IDENTIFICATION – 94.2%
(identification)
Salmonella spp.
6 3 4 4 5 7 2
FE3b
+ + + - - - - - - - + + + - - - + - - - DOUBTFUL PROFILE – 56.1%
(identification)
Aeromonas
hydrophila/caviae/sobria 1
7 0 0 6 1 2 0
FE4b
- - + - - - + - + - - + + + + + + + + + GOOD IDENTIFICATION –
99.5% (identification)
Klebsiella oxytoca
4 0 5 4 7 7 3
FE5b
- - - - - - - - - - - + + + + + + + + + LOW DISCRIMINATION –
33.9% (identification)
Klebsiella pneumoniae ssp.
ozaenae
0 0 0 4 7 7 3
FE6b - - + - + - + - + - - + + + + + + + + + GOOD IDENTIFICATION –
97.3% (identification)
Klebsiella oxytoca
4 2 5 4 7 7 3
FE7b
- - + + + - - - + - - + + - + + + + - + DOUBTFUL PROFILE – 71.5%
(identification)
Kluyvera spp.
4 3 4 4 5 7 2
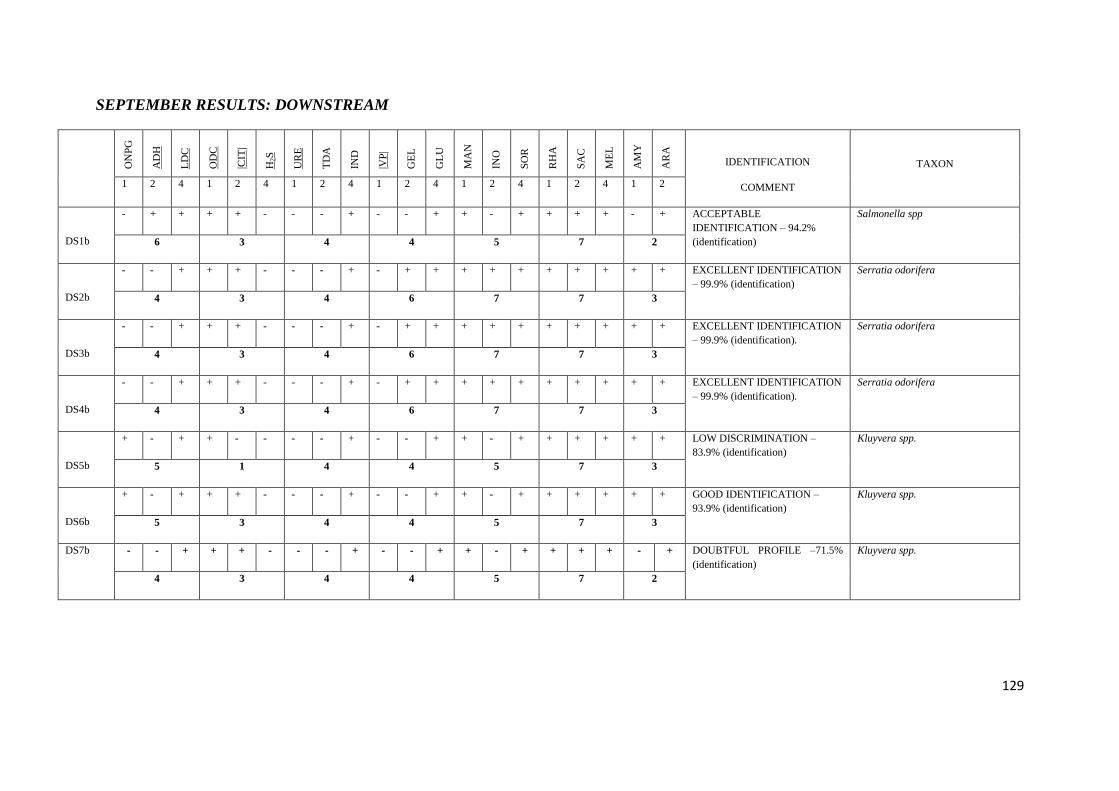
129
SEPTEMBER RESULTS: DOWNSTREAM
O
NP
G
AD
H
LD
C
OD
C
|CIT
|
H2S
UR
E
TD
A
IND
|VP
|
GE
L
GL
U
MA
N
INO
SO
R
RH
A
SA
C
ME
L
AM
Y
AR
A
IDENTIFICATION
COMMENT
TAXON
1 2 4 1 2 4 1 2 4 1 2 4 1 2 4 1 2 4 1 2
DS1b
- + + + + - - - + - - + + - + + + + - + ACCEPTABLE
IDENTIFICATION – 94.2%
(identification)
Salmonella spp
6 3 4 4 5 7 2
DS2b
- - + + + - - - + - + + + + + + + + + + EXCELLENT IDENTIFICATION
– 99.9% (identification)
Serratia odorifera
4 3 4 6 7 7 3
DS3b
- - + + + - - - + - + + + + + + + + + + EXCELLENT IDENTIFICATION
– 99.9% (identification).
Serratia odorifera
4 3 4 6 7 7 3
DS4b
- - + + + - - - + - + + + + + + + + + + EXCELLENT IDENTIFICATION
– 99.9% (identification).
Serratia odorifera
4 3 4 6 7 7 3
DS5b
+ - + + - - - - + - - + + - + + + + + + LOW DISCRIMINATION –
83.9% (identification)
Kluyvera spp.
5 1 4 4 5 7 3
DS6b
+ - + + + - - - + - - + + - + + + + + + GOOD IDENTIFICATION –
93.9% (identification)
Kluyvera spp.
5 3 4 4 5 7 3
DS7b - - + + + - - - + - - + + - + + + + - + DOUBTFUL PROFILE –71.5%
(identification)
Kluyvera spp.
4 3 4 4 5 7 2

130