Adsorption kinetics of methyl violet onto perlite
12
Adsorption kinetics of methyl violet onto perlite Mehmet Do gan, Mahir Alkan * Department of Chemistry, Faculty of Science and Literature, Balıkesir University, 10100 Balıkesir, Turkey Received 15 January 2002; received in revised form 16 September 2002; accepted 24 September 2002 Abstract This study examines adsorption kinetics and activation parameters of methyl violet on perlite. The effect of process parameters like contact time, concentration of dye, temperature and pH on the extent of methyl violet adsorption from solution has been investigated. Results of the kinetic studies show that the adsorption reaction is first order with respect to dye solution concentration with activation energy of 13.2 kJ mol 1 . This low activation energy value indicates that the adsorption reaction is diffusion controlled. The activation parameters using Arrhenius and Eyring equations have been calculated. Adsorption increases with increase of variables such as contact time, initial dye concentration, tem- perature and pH. Ó 2002 Elsevier Science Ltd. All rights reserved. Keywords: Perlite; Methyl violet; Activation parameters; Kinetics of adsorption; Dye; Intra-particle diffusion; Rate constant 1. Introduction In the natural aquatic systems, sorption processes play a dominant role in the transport and ultimate fate of pollutants. Thus, the adsorption behaviour of organic contaminants on natural particles has been of central interest in recent years (Liu et al., 2001). Pignatello and Xing (1996) as well as Luthy et al. (1997) have reviewed the sorption/desorption of organic compounds on nat- ural particles. Numerous studies have been devoted to sorption kinetics, equilibrium modelling, and mecha- nism as well as to the factors that affect adsorption. It has been shown that the sorption of low-polarity, non- polar, and nonionic organic compounds onto natural particles occurs largely by the partition of these com- pounds to organic matter involved in the solid (Xia and Ball, 1999), and the interface behaviour of ionic organic compounds is controlled mainly by the specific chemical and electrostatic interactions (Undabeyti and Nir, 1999). Dyes are widely used for textiles, printing, and dye- ing, as well as in the food and paper-making industries. Environmental research has paid special attention to dye compounds because of the extensive environmental contamination arising from dyeing operations. Most studies have focused on the development of a treatment technique and method for dye wastewater, such as a physical–chemical technique destroying the color groups (Meyer, 1992; Lin and Peng, 1994), a bio-degradation process mineralizing the colorless organic intermediates (Specchia and Gianetto, 1984), and chemical oxidation including homogeneous (Kuo, 1992) and heterogeneous photocatalytic oxidation (Choi et al., 1994). However, because of its higher organic concentration, particular toxicity, complex composition, and poor degradabil- ity, dye wastewater cannot be efficiently purified and treated. Thus, a large amount of wastewater containing dye compounds in low concentrations may be leaked and released into natural waters, leading to aquatic en- vironmental contamination. Investigations have been conducted on physico-chemical methods of removing color from textile effluent. These studies include the use of coagulants, oxidising agents, ultra-filtration, electro- chemical and adsorption techniques. The advantages Chemosphere 50 (2003) 517–528 www.elsevier.com/locate/chemosphere * Corresponding author. E-mail addresses: [email protected] (M. Do gan), [email protected] (M. Alkan). 0045-6535/03/$ - see front matter Ó 2002 Elsevier Science Ltd. All rights reserved. PII:S0045-6535(02)00629-X
Transcript of Adsorption kinetics of methyl violet onto perlite

Adsorption kinetics of methyl violet onto perlite
Mehmet Do�ggan, Mahir Alkan *
Department of Chemistry, Faculty of Science and Literature, Balıkesir University, 10100 Balıkesir, Turkey
Received 15 January 2002; received in revised form 16 September 2002; accepted 24 September 2002
Abstract
This study examines adsorption kinetics and activation parameters of methyl violet on perlite. The effect of process
parameters like contact time, concentration of dye, temperature and pH on the extent of methyl violet adsorption from
solution has been investigated. Results of the kinetic studies show that the adsorption reaction is first order with respect
to dye solution concentration with activation energy of 13.2 kJ mol�1. This low activation energy value indicates that
the adsorption reaction is diffusion controlled. The activation parameters using Arrhenius and Eyring equations have
been calculated. Adsorption increases with increase of variables such as contact time, initial dye concentration, tem-
perature and pH.
� 2002 Elsevier Science Ltd. All rights reserved.
Keywords: Perlite; Methyl violet; Activation parameters; Kinetics of adsorption; Dye; Intra-particle diffusion; Rate constant
1. Introduction
In the natural aquatic systems, sorption processes
play a dominant role in the transport and ultimate fate
of pollutants. Thus, the adsorption behaviour of organic
contaminants on natural particles has been of central
interest in recent years (Liu et al., 2001). Pignatello and
Xing (1996) as well as Luthy et al. (1997) have reviewed
the sorption/desorption of organic compounds on nat-
ural particles. Numerous studies have been devoted to
sorption kinetics, equilibrium modelling, and mecha-
nism as well as to the factors that affect adsorption. It
has been shown that the sorption of low-polarity, non-
polar, and nonionic organic compounds onto natural
particles occurs largely by the partition of these com-
pounds to organic matter involved in the solid (Xia and
Ball, 1999), and the interface behaviour of ionic organic
compounds is controlled mainly by the specific chemical
and electrostatic interactions (Undabeyti and Nir, 1999).
Dyes are widely used for textiles, printing, and dye-
ing, as well as in the food and paper-making industries.
Environmental research has paid special attention to
dye compounds because of the extensive environmental
contamination arising from dyeing operations. Most
studies have focused on the development of a treatment
technique and method for dye wastewater, such as a
physical–chemical technique destroying the color groups
(Meyer, 1992; Lin and Peng, 1994), a bio-degradation
process mineralizing the colorless organic intermediates
(Specchia and Gianetto, 1984), and chemical oxidation
including homogeneous (Kuo, 1992) and heterogeneous
photocatalytic oxidation (Choi et al., 1994). However,
because of its higher organic concentration, particular
toxicity, complex composition, and poor degradabil-
ity, dye wastewater cannot be efficiently purified and
treated. Thus, a large amount of wastewater containing
dye compounds in low concentrations may be leaked
and released into natural waters, leading to aquatic en-
vironmental contamination. Investigations have been
conducted on physico-chemical methods of removing
color from textile effluent. These studies include the use
of coagulants, oxidising agents, ultra-filtration, electro-
chemical and adsorption techniques. The advantages
Chemosphere 50 (2003) 517–528
www.elsevier.com/locate/chemosphere
* Corresponding author.
E-mail addresses: [email protected] (M. Do�ggan),
[email protected] (M. Alkan).
0045-6535/03/$ - see front matter � 2002 Elsevier Science Ltd. All rights reserved.
PII: S0045-6535 (02 )00629-X

and disadvantages of each technique have been exten-
sively reviewed. Of these methods, adsorption has been
found to be an efficient and economic process to remove
dyes, pigments and other colorants and also to control
the bio-chemical oxygen demand. Activated carbon, in-
organic oxides, natural adsorbents (such as clays and
clay minerals, cellulosic materials, chitin, and chitosan)
have been extensively used as adsorbents.
Activated carbon adsorption has been found to be
an effective and widely employed means of water and
wastewater treatment. Despite its profilic use in water
and wastewater industries, commercial activated carbon
remains an expensive materials. This has led to a search
for low-cost materials as alternative adsorbents (Kan-
nan and Sundaram, 2001).
The purpose of this work is to study the kinetics and
mechanism of adsorption of methyl violet on perlite.
Perlite, a glassy volcanic rock, has been chosen as a
adsorbent, which is essentially a metastable amorphous
alumina silicate (Do�ggan, 1997, 2001; Do�ggan et al., 1997,
2000; Alkan and Do�ggan, 1998, 2001, 2002). In our pre-
vious works, we investigated the electrokinetic proper-
ties (Do�ggan et al., 1997) and surface titrations of perlite
suspensions (Alkan and Do�ggan, 1998), and also the
adsorption of copper (II) (Alkan and Do�ggan, 2001) and
methylene blue (Do�ggan et al., 2000) onto perlite samples.
Thus, this investigation aims at to study kinetics and
thermodynamic activation parameters, to describe the
rate and mechanism of adsorption, to determine the
factors controlling the rate of adsorption and to find out
the possibility of using this material as low-cost adsor-
bent for the removal of dye. The effects of solution pH,
concentration and temperature on methyl violet ad-
sorption rate have been evaluated.
2. Materials and methods
2.1. Materials
The perlite sample was obtained from Cumaovası
Perlite Processing Plants of Etibank (_IIzmir, Turkey).
The chemical composition of the perlite found in Turkey
is given in Table 1 (Uluatam, 1991). Before using in the
experiments, the perlite sample was treated as follows
(Do�ggan, 1997, 2001; Do�ggan et al., 1997, 2000; Alkan and
Do�ggan, 1998, 2001, 2002): a suspension containing 10
g l�1 perlite was mechanically stirred for 24 h. After
waiting for about two minutes the supernatant sus-
pension was filtered through a white-band filter paper
(U ¼ 12:5 cm) and the solid sample was dried at 110 �C
Nomenclature
K adsorption constant, g mol�1
Qe equilibrium dye concentration on adsorbent,
mol g�1
R linear regrassion coefficient
t time, s
T temperature, K
m mass of adsorbent, g
Qt the amount of dye adsorbed per unit mass of
the adsorbent at time t, mol g�1
C0 initial dye concentration in aqueous solu-
tion, mol l�1
k adsorption rate constant, s�1
t1=2 the half-adsorption time of dye, s
kdif intra-particle diffusion rate constant,
mol min�1=2 g�1
bL mass transfer coefficient, m s�1
SS the surface area of adsorbent, m2 g�1
Ct dye concentration in solution at time t,mol l�1
r0 the radius of the adsorbent particle, cm
D diffusion coefficient, cm2 s�1
Ea activation energy, kJ mol�1
Rg gas constant
DH � enthalpy of activation, kJ mol�1
DS� entropy of activation, J mol�1 K�1
DG� free energy of activation, kJ mol�1
kb Boltzmann�s constant, J K�1
h Planck�s constant, J s
Table 1
Chemical composition of perlite
Constituent Percentage present
SiO2 71–75
Al2O3 12.5–18
Na2O 2.9–4.0
K2O 4.0–5.0
CaO 0.5–2.0
Fe2O3 0.1–1.5
MgO 0.03–0.5
TiO2 0.03–0.2
MnO2 0.0–0.1
SO3 0.0–0.1
FeO 0.0–0.1
Ba 0.0–0.1
PbO 0.0–0.5
Cr 0.0–0.1
518 M. Do�ggan, M. Alkan / Chemosphere 50 (2003) 517–528

for 24 h, then sieved by 100-mesh sieve. The particles
under 100-mesh are used in further experiments.
The cation exchange capacity (CEC) of perlite was
determined by the ammonium acetate method, while the
density was determined by the picnometer method. The
specific surface area of perlite was measured by BET N2
adsorption. Zeta potential of perlite was measured using
a Zeta Meter 3.0 equipped with a microprocesser unit.
The results are summarized in Table 2. All chemicals
were A.R. grade.
2.2. Methyl violet
Methyl violet contains a secondary amine group. The
color of methyl violet changes from yellow to green in
the pH range 0.13–0.5, from green to blue in the pH
range 2.0–3.0. When pH is higher than 3, the solubility
of methyl violet are essentially unchanged. Methyl violet
has a molecular weight of 393.96 g mol�1. The structure
of this dye is shown in Fig. 1 (Dai, 1994).
2.3. Method
Methyl violet was A.R. grade from Carlo Erba (C.I.
42535) and was used without further purification. Me-
thyl violet was first dried at 70–80 �C for 4 h to remove
moisture befor use. All of the methyl violet solution was
prepared with distilled water. Since the dye is difficult to
dissolve in water, the dye solution was allowed to stand
for 1–2 days until the absorbance of the solutions re-
mained unchanged. Studies of the kinetics of methyl
violet adsorption onto perlite were carried out from
its solution. In systems, the dye concentration was
2:0 � 10�4 mol l�1, except those in which the effect of
concentration was investigated. For the experiments of
adsorption kinetics, 10-g-perlite sample was added into
a litre of methyl violet solution at the desired concen-
tration, temperature and pH. The pH of the solution
was adjusted with NaOH or HNO3 solution by using a
Orion 920A pH-meter with a combined pH electrode.
The pH-meter was standardized with NBS buffers before
every measurement. A preliminary experiment revealed
that about 30 min time is required for the adsorption
process to reach the equilibrium concentration. The
mixture was continuously agitated by a magnetic stirrer
at 30 �C and 500 rpm for 30 min. A constant tempera-
ture bath was used to keep the temperature constant. At
the end of the adsorption period, the solution was cen-
trifuged for 15 min at 5000 rpm. The samples at ap-
propriate time intervals were pipetted from the reactor
by the aid of the very thin point micropipette, which
prevents the transition to solution of perlite samples.
Preliminary experiments had shown that the effect of the
separation time on the amount of adsorbed dye were
negligible. The amount of adsorbed dye on perlite at any
time, t, was determined from absorbency as measured
with a Cary j1Ej UV–visible spectrophotometer (varian)
at a 584 nm wavelength. The amounts of dye adsorbed
were calculated from the concentrations in solutions
before and after adsorption. Each experimental point
was an average of two independent adsorption tests
(Yang and Al-Duri, 2001).
3. Results and discussion
3.1. Equilibrium time
The optimum period for the adsorption of methyl
violet on perlite can be observed by looking at the final
absorbance of methyle violet solution after adding per-
lite. As shown in Fig. 2, preliminary investigations on
the rate of adsorption by the perlite under study have
indicated that adsorption occurs rapidly. In Fig. 2, Qe
represents the ratio of adsorbed amount of methyl violet
to the gram amount of adsorbent (mol g�1). The amount
of adsorbed methyl violet after adding perlite as a
function of time is shown in Fig. 2. The rate of ad-
sorption of methyl violet onto perlite was followed by
looking at the increase in the adsorption of the methyl
violet as a function of time until the adsorption of
the methyl violet remained constant; implying equilib-
rium was reached. The gradual increase in adsorption
was observed, and, after 30 min for perlite, a gradualFig. 1. The structure of methyl violet.
Table 2
Some physico-chemical properties of perlite used in the study
Cation exchange capacity (CEC meg/100 g) 25.97
Density (g ml�1) 2.30
Specific surface area (m2 g�1) 1.22
Zeta potential (mV) )23.50
M. Do�ggan, M. Alkan / Chemosphere 50 (2003) 517–528 519

approach to the limiting adsorption was observed.
Therefore, the optimum agitation period of methyl vi-
olet is about 30 min for perlite. Similar results were
obtained by other workers for other adsorbate–adsor-
bent systems (Ngah and Musa, 1998).
3.2. Adsorption rate
The application of the adsorption technique to larger
scale studies is facilitated by clear elucidation of the
kinetic parameters and sorption characteristics of the
adsorbent material. Four issues of prime importance in
this respect are the influence of initial adsorbate con-
centration, contact time, temperature and pH on uptake.
3.2.1. The effect of contact time on adsorption process
Contact time experiments investigate the influence of
system parameters on the rate and extent of adsorption
of methyl violet onto perlite, and also the kinetic data
essential for the identification of the rate determining
step(s) in the adsorption process. The influence of dif-
ferent initial methyl violet concentrations, 1:0 � 10�4;
1:5 � 10�4; 2:0 � 10�4 and 2:5 � 10�4 mol l�1 at pH ¼ 7
and 30 �C, on the equilibrium time is shown in Fig. 2,
which indicates that the initial concentration did not
have a significant effect on the time to reach equilibrium.
This is in agreement with the experimental results of
McKay et al. (2001). On changing the initial concen-
tration of methyl violet solution from 1:0 � 10�4 mol l�1
to 2:5 � 10�4 mol l�1, the amount adsorbed increases
from 9:8 � 10�6 to 1:5 � 10�5 mol g�1 at pH ¼ 7 and 30
�C. It is evident from Fig. 2 that with a lower initial
concentration of adsorbate the amount of adsorbate
attained on the solid phase is smaller than the amount
attained with higher initial concentrations are used.
However, the percent removal of methyl violet was
greater with lower initial concentrations and smaller
with higher initial concentrations.
3.2.2. The effect of temperature on the adsorption process
The results of the studies on the influence of tem-
perature on methyl violet adsorption is presented in Fig.
3. A study of the temperature dependence of adsorption
reactions gives valuable information about the enthalpy
change during adsorption. The effect of temperature on
the adsorption rate was studied by carrying out a series
of experiments at 30, 40, 50 and 60 �C for perlite. The
adsorption of methyl violet on perlite increased from
1:4 � 10�5 to 1:9 � 10�5 mol g�1, indicating that the
adsorption process is endothermic in nature when tem-
perature was increased from 30 to 60 �C (Fig. 3) at
pH ¼ 7 and C0 ¼ 2:0 � 10�4 mol l�1. The increase in the
equilibrium sorption of dye with temperature indicates
that dye removal by adsorption on perlite favours a high
temperature (Do�ggan et al., 2000). This may be a result of
increase in the mobility of the large dye ion with tem-
perature. An increasing number of molecules may also
acquire sufficient energy to undergo an interaction with
active sites at the surface. Furthermore, increasing tem-
perature may produce a swelling effect within the in-
ternal structure of the perlite enabling large dyes to
penetrate further (Do�ggan et al., 2000).
3.2.3. The effect of pH on adsorption process
The magnitude of electrostatic charges imparted by
the ionized dye molecules is primarily controlled by the
Fig. 2. The effect of contact time and concentration on the removal of methyl violet from aqueous solutions with perlite.
520 M. Do�ggan, M. Alkan / Chemosphere 50 (2003) 517–528

pH of medium. The amount of dye adsorbed or rate of
adsorption tends to vary with pH (3–9) of aqueous
medium. The amount of methyl violet adsorbed on the
perlite as a function of pH at an initial dye concen-
tration of 2:0 � 10�4 mol l�1 and temperature 30 �C is
shown in Fig. 4. The amount of methyl violet adsorbed
increased with increase in pH (i.e., as the solution be-
came more basic). The adsorption of methyl violet on
perlite increased from 1:3 � 10�5 to 1:5 � 10�5 mol g�1,
when pH was increased from 3 to 9 (Fig. 4) at 30 �Cand C0 ¼ 2:0 � 10�4 mol l�1. This indicates that the
adsorption capacity of the perlite is pH dependent. Thus,
it is clear that pH determined the speciation of the
methyl violet as well as providing a favourable adsor-
bent surface charge for the adsorption to occur. As
the pH increased from 3 to 9, the number of ionizable
sites on the perlite increased. These observations are
in line with earlier findings of Lafferty and Hobday
(1990).
SOH þ OH� ¼ SO� þ H2O ð1Þ
It had been shown that perlite samples had no point
of zero charge and exhibited negative zeta potential
values in the pH range 3–11 (Do�ggan et al., 1997; Alkan
and Do�ggan, 1998). As the pH of the dye solution became
Fig. 3. The effect of contact time and temperatures on the removal of methyl violet from aqueous solutions with perlite.
Fig. 4. The effect of contact time and pH on the removal of methyl violet from aqueous solutions with perlite.
M. Do�ggan, M. Alkan / Chemosphere 50 (2003) 517–528 521
higher, the association of dye cations with more nega-
tively charged perlite could more easily take place;
SO� þ Dyeþ ¼ S–O–Dye ð2Þ
3.3. Adsorption kinetics and mechanism
In order to examine the controlling mechanism of
the adsorption process such as mass transfer, diffusion
control and chemical reaction, several kinetic models are
used to test experimental data. From a system design
viewpoint, a lumped analysis of adsorption rates is thus
sufficient to practical operation (Wu et al., 2001).
A simple kinetic analysis of adsorption is the Lag-
ergren equation. In this equation the average value of
the rate constant, k, for adsorption of methyl violet on
perlite can be calculated in the form
dQt
dt¼ kðQe � QtÞ ð3Þ
where k is the rate constant of the first-order adsorption
(s�1), and Qe and Qt are the amount of dye adsorbed per
unit mass of the adsorbent (mol g�1) at equilibrium and
time t, respectively. The first-order kinetics only de-
scribes the sorption sites and not the adsorption process
as a whole. After definite integration by applying the
initial conditions Qt ¼ 0 at t ¼ 0 and Qt ¼ Qt at t ¼ t,Eq. (3) becomes
lnðQe � QtÞ ¼ lnQe � kt ð4Þ
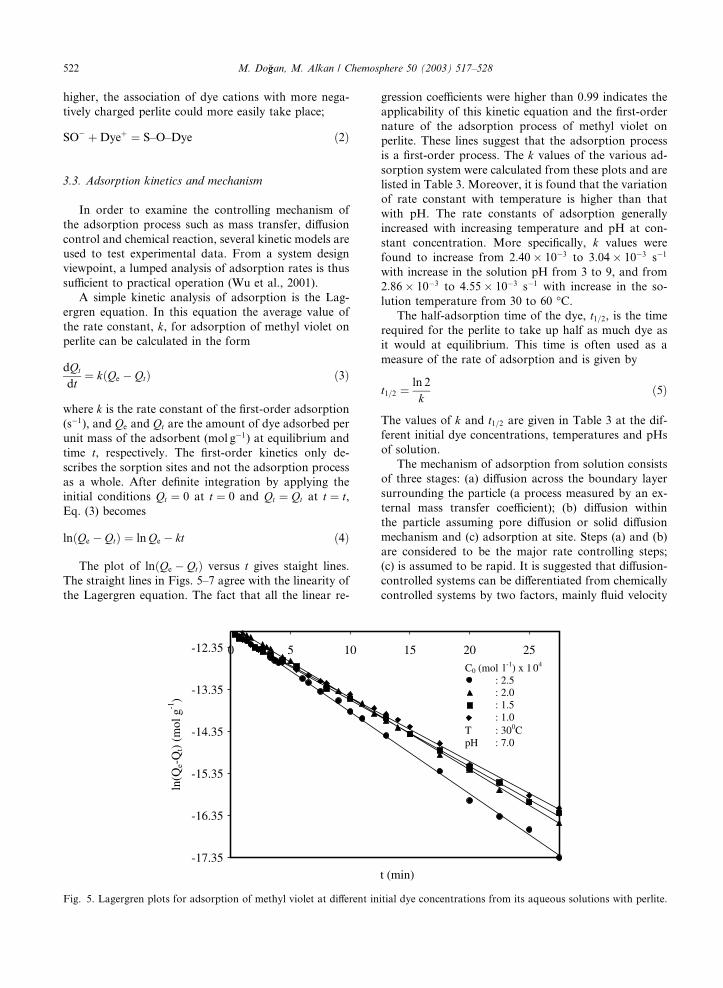
The plot of lnðQe � QtÞ versus t gives staight lines.
The straight lines in Figs. 5–7 agree with the linearity of
the Lagergren equation. The fact that all the linear re-
gression coefficients were higher than 0.99 indicates the
applicability of this kinetic equation and the first-order
nature of the adsorption process of methyl violet on
perlite. These lines suggest that the adsorption process
is a first-order process. The k values of the various ad-
sorption system were calculated from these plots and are
listed in Table 3. Moreover, it is found that the variation
of rate constant with temperature is higher than that
with pH. The rate constants of adsorption generally
increased with increasing temperature and pH at con-
stant concentration. More specifically, k values were
found to increase from 2:40 � 10�3 to 3:04 � 10�3 s�1
with increase in the solution pH from 3 to 9, and from
2:86 � 10�3 to 4:55 � 10�3 s�1 with increase in the so-
lution temperature from 30 to 60 �C.
The half-adsorption time of the dye, t1=2, is the time
required for the perlite to take up half as much dye as
it would at equilibrium. This time is often used as a
measure of the rate of adsorption and is given by
t1=2 ¼ln 2
kð5Þ
The values of k and t1=2 are given in Table 3 at the dif-
ferent initial dye concentrations, temperatures and pHs
of solution.
The mechanism of adsorption from solution consists
of three stages: (a) diffusion across the boundary layer
surrounding the particle (a process measured by an ex-
ternal mass transfer coefficient); (b) diffusion within
the particle assuming pore diffusion or solid diffusion
mechanism and (c) adsorption at site. Steps (a) and (b)
are considered to be the major rate controlling steps;
(c) is assumed to be rapid. It is suggested that diffusion-
controlled systems can be differentiated from chemically
controlled systems by two factors, mainly fluid velocity
Fig. 5. Lagergren plots for adsorption of methyl violet at different initial dye concentrations from its aqueous solutions with perlite.
522 M. Do�ggan, M. Alkan / Chemosphere 50 (2003) 517–528
and temperature. Since the uptake of dye at the active
sites of perlite is a rapid process, the rate of adsorption is
mainly governed either by external mass transfer rate or
intra-particle diffusion rate. The adsorption mechanism
can be simply determined using mass transfer and intra-
particle diffusion models (Allen et al., 1997).
The external mass transfer coefficient, bL (m s�1) of
methyl violet at the perlite–solution interface, was de-
termined by using Eq. (6)
lnCt
C0
�� 1
1 þ mK
�¼ ln
mK1 þ mK
� �� 1 þ mK
mK
� �bLSSt
ð6Þ
where K is the Langmuir constant (L g�1), m is the mass
of adsorbent (g), and SS is the surface area of adsorbent
(m2 g�1).
A linear graphical relation between ln½ðCt=C0Þ � 1=ð1 þ mKÞ versus t was not obtained. In plotting the
curves, K values for the adsorption of methyl violet onto
perlite were taken from our previous work (Do�ggan,
2001). This result indicates that the model mentioned
above for the system is not valid. The values of regres-
sion coefficient (r-values) calculated from equation men-
tioned above are given in Table 3.
It has been stated that the specific surface areas of
non-porous adsorbents change more frequently in the
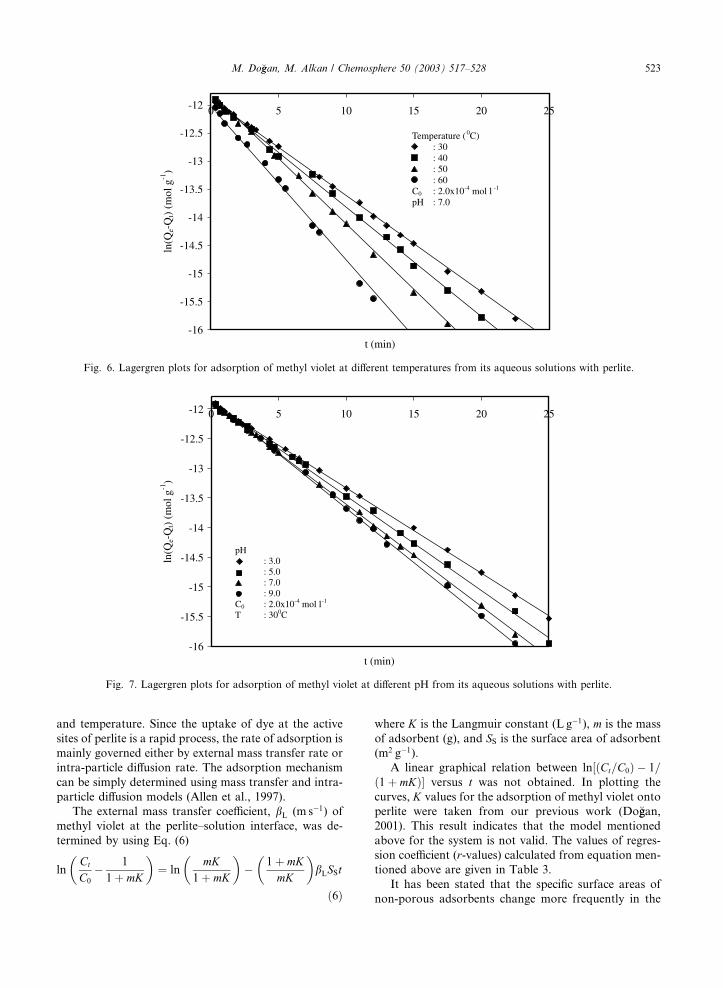
Fig. 7. Lagergren plots for adsorption of methyl violet at different pH from its aqueous solutions with perlite.
Fig. 6. Lagergren plots for adsorption of methyl violet at different temperatures from its aqueous solutions with perlite.
M. Do�ggan, M. Alkan / Chemosphere 50 (2003) 517–528 523

range of 0.1–1.0 m2 g�1 (Oscik, 1982). The specific sur-
face areas of perlite samples have changed in the range
of 1.23–2.30 m2 g�1 (Do�ggan, 2001). Despite the result
above, it can be said that perlite is more or less a porous
adsorbents.
Generally, a process is diffusion controlled if its rate
is dependent upon the rate at which components dif-
fuse toward one another. A diffusion-controlled reaction
would have a comparatively small activation energy, for
if Ea is large (Ea=RT � 1), then the rate of the reaction is
not controlled by the diffusion rate but by the number of
molecules with energy greater than the activation energy
(Woodbury, 1997). The possibility of intra-particle dif-
fusion was explored by using the intra-particle diffusion
model:
Qt ¼ kdif
ffiffit
pþ C ð7Þ
where Qt is the amount of dye adsorbed at time t(mol g�1); C is the intercept and kdif is the intra-particle
diffusion rate constant (mol s�1=2 g�1). According to Eq.
(7), a plot of Qt versus t1=2 should be a straight line with
a slope kdif and intercept C when adsorption mechanism
follows the intra-particle diffusion process. Values of
intercept (Table 3) give an idea about the thickness of
boundary layer, i.e., the larger intercept the greater is the
boundary layer effect (Kannan and Sundaram, 2001).
The kdif values were calculated by using correlation
analysis (Table 3). The high regression coefficient values
suggest that the uptake of methyl violet varies almost
linearly with the half power of time (t1=2). This func-
tional relationship corresponds to the characteristic of
intra-particle diffusion. It is found that diffusion rate was
increased with increase of dye concentration, tempera-
ture and pH (Figs. 8–10).
3.4. Diffusion coefficient
The diffusion coefficients for the intra-particle trans-
port of methyl violet within the pores of perlite particles
have been calculated at different temperatures, initial
dye concentrations and pH by employing Eq. (8)
t1=2 ¼0:030r2
0
Dð8Þ
where D is the diffusion coefficient with the unit cm2 s�1;
t1=2 is the time (s) for half-adsorption of methyl violet
and r0 is the radius of the adsorbent particle in cm. The
value of r0 was calculated as 3:75 � 10�3 cm for per-
lite sample. In these calculations, it has been assumed
that the solid phase consists of spherical particles with
an average radius between the radii corresponding to
upper- and lower-size fractions (for <150 lm mesh-size).
For the present study, the pore diffusion coefficient
values obtained from Eq. (8) are given in Table 3. The
values of diffusion coefficient for adsorption of methylTab
le3
Kin
etic
svalu
esca
lcu
late
dfo
rm
eth
yl
vio
let
ad
sorp
tio
no
np
erlite
Tem
per
atu
re
(�C
)
Co
nce
ntr
ati
on
�10
4(m
oll
�1)
pH
Lager
gre
neq
uati
on
Mass
tran
sfer
Intr
a-p
art
icle
diff
usi
on
D�
10
10
(cm
2s�
1)
t 1=2
(s)
rk�
10
3(s
�1)
rk d
if�
10
7
(mo
ls�
1=2
g�
1)
rC
30
1.0
70.9
992
2.5
60.9
979
2.1
50.9
928
0.3
015.6
271
30
1.5
70.9
996
2.6
40.9
860
2.1
70.9
955
0.5
416.1
262
30
2.0
70.9
998
2.8
60.9
807
2.5
60.9
916
0.6
817.4
243
30
2.5
70.9
995
3.2
50.9
735
2.6
20.9
963
0.8
219.8
213
30
2.0
30.9
998
2.4
00.9
779
2.3
10.9
934
0.5
814.6
289
30
2.0
50.9
994
2.6
50.9
770
2.3
90.9
944
0.6
316.1
262
30
2.0
90.9
997
3.0
40.9
876
2.6
20.9
973
0.7
618.5
228
40
2.0
70.9
995
3.2
40.9
705
2.6
10.9
884
0.7
919.7
214
50
2.0
70.9
996
3.8
80.9
602
2.9
60.9
742
0.9
323.6
179
60
2.0
70.9
999
4.5
50.9
794
3.0
00.9
940
1.2
527.7
152
524 M. Do�ggan, M. Alkan / Chemosphere 50 (2003) 517–528

violet increase from 17:4 � 10�10 to 27:7 � 10�10 cm2 s�1
with change in temperature from 30 to 60 �C. These
results agree with those of Chibowski et al. (2001a,b)
and McKay and McConvey (1985). Compared to as-
trozane blue and telon blue on wood (McKay and Po-
ots, 1980), the D values for methyl violet on perlite
are higher. The diffusion coefficients vary from 6:0�10�13 to 1:8 � 10�13 cm2 s�1 for astrazone blue and from
3:0 � 10�13 to 8:0 � 10�13 cm2 s�1 for telon blue. It can
be result of crystalline defects in the structure of perlite
(Vieth, 1991).
3.5. Activation parameters
The rates of most chemical reactions increase mark-
edly as the temperature is increased, typically doubling
Fig. 8. Intra-particle diffusion plots for adsorption of methyl violet at different initial dye concentrations from its aqueous solutions
with perlite.
Fig. 9. Intra-particle diffusion plots for adsorption of methyl violet at different temperatures from its aqueous solutions with perlite.
M. Do�ggan, M. Alkan / Chemosphere 50 (2003) 517–528 525

with a temperature rise of a few degrees kelvin. In the
rate law, the temperature dependence appears in the
rate constant. Quite remarkably, the temperature de-
pendence of virtually all reactions can be fit successfully
to the Arrhenius equation (Laidler and Meiser, 1999):
ln k ¼ lnA� Ea
RgTð9Þ
where Ea is the Arrhenius activation energy, and A is the
Arrhenius factor. To extract A and Ea from kinetic data,
we plot the series of rate constants measured at different
temperatures in a graph of ln k versus 1=T . As shown in
Fig. 11, the corresponding activation energy was deter-
mined from the slope of linear plot. The result obtained
is 13.2 kJ mol�1 for adsorption from its solution. As
known when the rate is controlled by intra-particle dif-
fusion mechanism, the activation energy is very low and
hence it can be concluded that process is controlled by
intra-particle diffusion which is a physical step in the
adsorption process (Sismanoglu and Pura, 2001).
Fig. 10. Intra-particle diffusion plots for adsorption of methyl violet at different pHs from its aqueous solutions with perlite.
Fig. 11. Arrhenius plots for adsorption of methyl violet.
526 M. Do�ggan, M. Alkan / Chemosphere 50 (2003) 517–528

Free energy (DG�), enthalpy (DH �) and entropy (DS�)
of activation can be calculated by Eyring equation
(Laidler and Meiser, 1999);
lnkT
� �¼ ln
kb
h
� �þ DS�
Rg
� DH �
RgTð10Þ
where kb and h are Boltzmann�s and Planck�s constants,
respectively. According to Eq. (10), a plot of lnðk=T Þversus 1=T should be a straight line with a slope DH �=Rg
and intercept ½lnðkb=hÞ þ DS�=Rg. DH � and DS� were
calculated from slope and intercept of line, respectively
(Fig. 12). Gibbs energy of activation may be written in
terms of entropy and enthalpy of activation:
DG� ¼ DH � � T DS� ð11Þ
DG� was calculated at 333 K from Eq. (11). It is found
that the values of the free energy (DG�), enthalpy (DH �)
and entropy (S�) of activation is 83.8 kJ mol�1, 15.8
kJ mol�1 and )204.2 J mol�1 K�1, respectively. The free
energy of activation, DG� have also been computed at
333 K. The fact that the activation entropy is negative
is a result of interactions between dye and perlite as ex-
pected.
4. Conclusions
The use of perlite for the adsorption of methyl violet
from aqueous solutions has been examined. The fol-
lowing results are obtained:
• Initially, the rate of adsorption of methyl violet
onto perlite was very high. This was then fol-
lowed by a slower rate, and gradually approached a
plateau.
• The kinetics of the adsorption of methyl violet by
perlite can be approximated to first-order kinetics.
• The effect of the initial concentration of the solute on
the rate of reaction was found to be of considerable
significant. The uptake rate of methyl violet increased
with the increasing initial concentration.
• The rate of adsorption of methyl violet increased
with increasing temperature and pH.
• Perlite is capable of removing methyl violet from an
aqueous solution.
• Because of crystalline defects rather than changes in
amorphous phase, the results of this research demon-
strate that an intra-particle diffusion mechanism
plays a significant role in the adsorption of methyl vio-
let by perlite, and it is apparent that the adsorption
rate is controlled by diffusion process.
References
Alkan, M., Do�ggan, M., 1998. J. Colloid Interface Sci. 207, 90–
96.
Alkan, M., Do�ggan, M., 2001. J. Colloid Interface Sci. 243, 280–
291.
Alkan, M., Do�ggan, M., 2002. Perlite Surfaces, Encyclopedia of
Surface and Colloid Science, Marcel Dekker, New York,
pp. 3945–3958.
Allen, S.J., Whitten, L.J., Murray, M., Duggan, O., 1997. J.
Chem. Tech. Biotechnol. 68, 442–452.
Fig. 12. Plot of lnðk=T Þ against 1=T for methyl violet adsorption on perlite.
M. Do�ggan, M. Alkan / Chemosphere 50 (2003) 517–528 527
Chibowski, E., Espinosa-Jim�eenez, M., Ortega, A.O., Gimenez-
Martin, E., 2001a. Langmuir 14, 5237–5244.
Chibowski, E., Ortega, A.O., Espinosa-Jim�eenez, M., Perea-
Carpio, R., Holysz, L., 2001b. J. Colloid Interface Sci. 235,
283–288.
Choi, W., Termin, A., Hoffmann, M.R., 1994. J. Phys. Chem.
98, 13669.
Dai, M., 1994. J. Colloid Interface Sci. 164, 223–228.
Do�ggan, M., 1997. M.Sc. Thesis, Department of Chemistry,
Balıkesir University, Balıkesir, Turkey (in Turkish).
Do�ggan, M., 2001. Ph.D. Thesis, Department of Chemistry,
Balıkesir University, Balıkesir, Turkey (in Turkish).
Do�ggan, M., Alkan, M., C�akır, €UU., 1997. J. Colloid Interface
Sci. 192, 114–118.
Do�ggan, M., Alkan, M., Onganer, Y., 2000. Water Air Soil
Pollut. 120, 229–248.
Kannan, N., Sundaram, M.M., 2001. Dyes Pigments 51, 25–40.
Kuo, W.G., 1992. Water Res. 26 (7), 881.
Lafferty, C., Hobday, M., 1990. Fuel 69, 78–83.
Laidler, K.J., Meiser, J.H., 1999. Physical Chemistry. Hough-
ton Mifflin, New York, p. 852.
Lin, S.H., Peng, C.F., 1994. Water Res. 28 (2), 277.
Liu, R., Liu, X., Tang, H., Su, Y., 2001. J. Colloid Interface Sci.
239, 475–482.
Luthy, R.G., Aiken, G.R., Brusseau, M.L., Cunningham, S.D.,
Gschwend, P.M., Pignatello, J.J., Reinhard, M., Traina,
S.J., Weber, W.J., Westall, J.C., 1997. Environ. Sci.
Technol. 31, 3341.
McKay, G., Poots, V.J.P., 1980. J. Chem. Tech. Biotechnol. 30,
279–292.
McKay, G., McConvey, I.F., 1985. Chem. Eng. Process. 19,
287–295.
McKay, G., Bino, M.J., Altememi, A., 2001. Water Res. 35 (3),
613–618.
Meyer, V., 1992. Water Sci. Technol. 26 (5/6), 1205.
Ngah, W.W.S., Musa, A., 1998. J. Appl. Polym. Sci. 69, 2305–
2310.
Oscik, J., 1982. Adsorption. Halsted Press: a division of John
Willey and Sons, New York.
Pignatello, J.J., Xing, B.S., 1996. Environ. Sci. Technol. 30, 1.
Sismanoglu, T., Pura, S., 2001. Colloids Surf. A: Physicochem.
Eng. Aspects 180, 1–6.
Specchia, V., Gianetto, A., 1984. Water Res. 18 (2), 133.
Uluatam, S.S., 1991. J. AWWA 70.
Undabeyti, T., Nir, S., 1999. Environ. Sci. Technol. 33 (6), 864.
Xia, G.S., Ball, W.P., 1999. Environ. Sci. Technol. 33, 262.
Vieth, W.R., 1991. Diffusion in and Through Polymers. Carl
Hanser Verlag Publishers, Munich.
Woodbury, G., 1997. Physical Chemistry. Brooks/Cole Pub-
lishing Company, New York, p. 820.
Wu, F., Tseng, R., Juang, R., 2001. Water Res. 35 (3), 613–618.
Yang, X.Y., Al-Duri, B., 2001. Chem. Eng. J. 83, 15–23.
528 M. Do�ggan, M. Alkan / Chemosphere 50 (2003) 517–528