Master Thesis - Phosphate adsorption onto laterite and laterite ...
66
Queen’s University Belfast School of Chemistry and Chemical Engineering Chemical Engineering Master Thesis Phosphate adsorption onto laterite and laterite waste from a leaching process Martín Méndez Pasarín Supervisors: Dr. Gavin M. Walker; Prof. Stephen J. Allen Submission date: 26/03/2012
-
Upload
khangminh22 -
Category
Documents
-
view
2 -
download
0
Transcript of Master Thesis - Phosphate adsorption onto laterite and laterite ...

Queen’s University Belfast
School of Chemistry and Chemical Engineering
Chemical Engineering
Master Thesis
Phosphate adsorption onto
laterite and laterite waste
from a leaching process
Martín Méndez Pasarín
Supervisors: Dr. Gavin M. Walker; Prof. Stephen J. Allen
Submission date: 26/03/2012

Master Thesis - Phosphate adsorption onto laterite and laterite waste from a leaching process
i
Abstract
It has been proved by several authors that adsorption is a good way to remove
phosphate from wastewaters, especially using fly ash or modified fly ash as an
adsorbent. There are also various studies regarding removal of arsenic and mercury
with an adsorbent called laterite, which is a type of soil rich in iron and aluminium,
usually formed in hot and wet tropical areas.
The main aim of this research is to study the removal capacity of laterite and modified
laterite toward phosphate. Different kinds of laterite have been provided by Kinney
Environmental Science Services Consultancy, a local company based in Northern
Ireland. Properties of laterite have been determined using X-ray diffractograms.
One of the innovations presented in this thesis is the calibration of phosphorus with a
colorimetric method. It was carried out in order to avoid the use of much more
expensive methods, such as the Inductively Coupled Plasma spectrometry (ICP).
Subsequent adsorption experiments include: adsorption kinetics, pH studies,
adsorption isotherms, temperature studies, thermodynamic parameters and column
studies. Laterite charred at different temperatures has been used and different particle
sizes have also been tested.
Finally, a global comparison of the results with other authors has been made, as well
as with some other synthesized materials that could be used for future research.

Master Thesis - Phosphate adsorption onto laterite and laterite waste from a leaching process
ii
Acknowledgments
Writing this master thesis would not have been possible without the support of several
mentors. First of all I would like to thank Dr. Tony McNally for giving me the opportunity
to carry out all the experiments and write this thesis at the School of Chemistry and
Chemical Engineering within the Queen’s University of Belfast. Special thanks go to my
supervisor Dr. Gavin M. Walker and PhD student Yoann Glocheux for their great
support to my thesis, as well as John Kinney from KESS-Consult for providing the
adsorbent I have been using for these last months. Further, I would like to show my
gratitude to all the members of the Adsorption Group for their friendliness towards me.
I would also like to thank all the friends that I have made during this unforgettable
Erasmus exchange. Special thanks go to Irina Díaz, Philipp Neumann, Stefan
Taalman, Annabelle Perret, Mathilde Felber, Ciaran Doherty, Jenny McAfee, Adam
Downey, Adam Young, Paul Walsh, Íñigo Blond, Marco Ciavola, Dora Scapin and
Guillermo Llorente for standing and supporting me, as well as for all the experiences
that we have shared in Belfast.
My deep gratitude goes to my parents José and Delfina, for the opportunity to study
and their support during my student’s career. Finally, I would like to thank my friends
and family from Spain for their remarkable support throughout these past five years of
my degree, these include Carlos Fernández, Marta Sànchez, Alejandro Marín, Cristina
Casal, David Sáiz, Daniel Galeano, Pedro J. Aguas, Marc Dalmau, Daniel García,
Arnau Mestres, Eduard Laguarda, Mª Carmen Balsalobre, David Gracia, Mariona Vilà,
Montserrat Soro, Alberto Díaz, Sonia Miranda and Elena Rois, amongst others.

Master Thesis - Phosphate adsorption onto laterite and laterite waste from a leaching process
1
Table of Contents
1. Introduction ............................................................................................................. 2
2. Adsorption of Phosphates ..................................................................................... 4
2.1. Background and Literature Review .................................................................... 4
2.2. Phosphorus Regulations in Northern Ireland ..................................................... 6
3. Materials and Methods ........................................................................................... 9
3.1. Chemicals and Adsorbents ................................................................................ 9
3.2. Adsorption Kinetics .......................................................................................... 11
3.3. Freundlich and Langmuir Isotherms ................................................................ 12
3.4. Thermodynamic Parameters ........................................................................... 13
4. Experimental Results and Discussion ................................................................ 14
4.1. Properties of Laterite ....................................................................................... 14
4.2. Phosphate Calibration ..................................................................................... 16
4.2.1. Colorimetric Method.............................................................................. 16
4.2.2. Calibration Curve .................................................................................. 17
4.3. Adsorption Kinetics .......................................................................................... 18
4.3.1. Preliminary Study ................................................................................. 18
4.3.2. First and Second Order Approximations ............................................... 22
4.4. Adsorption Isotherms....................................................................................... 27
4.4.1. Effect of Initial Concentration ................................................................ 27
4.4.2. Freundlich and Langmuir Isotherms ...................................................... 30
4.4.3. Effect of Temperature ........................................................................... 34
4.4.4. Thermodynamic Parameters ................................................................. 38
4.5. Effect of Adsorbent Dose ................................................................................. 40
4.6. Effect of Initial pH ............................................................................................ 43
4.7. Column Studies ............................................................................................... 46
5. Result Comparison ............................................................................................... 49
5.1. Comparison with Other Materials..................................................................... 49
5.2. Comparison with Other Authors ....................................................................... 53
6. Conclusions and Perspectives ............................................................................ 54
7. References ............................................................................................................ 55
Appendix A. Kinetics, Isotherms and Thermodynamics Data ............................... 57
Appendix B. COSHH Risk Assessment ................................................................... 59

Master Thesis - Phosphate adsorption onto laterite and laterite waste from a leaching process
2
1. Introduction
Phosphorus is one of the more common elements on earth and is essential to all living
organisms. It is found combined with other elements in the earth’s crust in the form of
phosphate rock. The major commercial deposits are in the United States, China, the
former Soviet Union, Morocco, Finland, South Africa, and some Pacific Islands. It is
estimated that there are 40 billion tons of reserves of phosphate rock or a 250-year
supply at current usage. This may seem like an abundant supply, but some of this
material is not accessible or of poor quality. In addition, we are using this material at an
increasing rate. In fact, phosphate is recognised as being one of the resources that will
be lost in near future.
Figure 1. Different kinds of phosphorus: waxy white, red and violet phosphorus.
A large amount of used phosphate finally reaches water environment as diluted waste,
which often leads to pollution of the water environment. It is of value to collect the
finally disposed phosphates from effluents and drain water before further dispersion
and dilution of them in the water environment.
Phosphorus is often regarded as the main culprit in cases of eutrophication in lakes.
Eutrophication is the term used to describe the process of nutrient enrichment, where a
water body gradually changes from a nutrient poor state (oligotrophic) to a nutrient rich
state (eutrophic). It is defined in the European Commission’s Urban Waste Water
Treatment (EC UWWT) Directive (91/271/EEC) as:
“The enrichment of water by nutrients, especially compounds of nitrogen and/or
phosphorus, causing accelerated growth of algae and higher forms of plant life to
produce an undesirable disturbance to the balance of organisms present in the water
and to the quality of water concerned.”

Master Thesis - Phosphate adsorption onto laterite and laterite waste from a leaching process
3
The concentration of algae and the trophic state of lakes correspond well to
phosphorus levels in water. Studies conducted in the Experimental Lakes Area in
Ontario (Canada) have shown a relationship between the addition of phosphorus and
the rate of eutrophication.
Figure 2. Eutrophication from phosphorus contamination. Source: US EPA.
In 2005, The Environmental Protection Agency identified eutrophication as the major
threat to water quality in Ireland, with the basic cause in most cases likely to be excess
phosphorus inputs. Eutrophication also poses the most widespread single threat to
good water quality in Northern Ireland while in the United Kingdom 23% of lakes are
considered to be eutrophic. Freshwater lakes are considered to be eutrophic if the
phosphorus concentration exceeds 35 g P L-1; by this standard both Lough Neagh and
Lough Erne from Northern Ireland can be considered to be highly eutrophic. Phosphate
removal from wastewaters is important for the control of eutrophication and is enforced
by increasingly stringent legislation e.g. the European Urban Wastewater Treatment
Directive 91/271 and 98/15.
Many techniques have been proposed for the removal of phosphate from wastewater.
Coagulation–precipitation and biological methods are widely accepted methods of
phosphate removal at industrial level. Extensive research has also been carried out to
produce simplification of maintenance, stable running and removal efficiency. Among
these researches, many researchers have promoted development of adsorbents with
high selectivity and removal capacity for phosphate. Furthermore, adsorption is known
more useful and economical. In this project, this technique is proposed as a possible
solution for phosphate removal using local laterite –a kind of mineral rich in iron and
aluminium– as an adsorbent.

Master Thesis - Phosphate adsorption onto laterite and laterite waste from a leaching process
4
2. Adsorption of Phosphates
2.1. Background and Literature Review
Adsorption involves, in general, the accumulation (or depletion) of solute molecules at
an interface (including gas-liquid interfaces, as in foam fractionation, and liquid-liquid
interfaces, as in detergency). In this project only liquid-solid interfaces are considered,
with solute distributed selectively between the fluid and solid phases. Adsorption
separation has been widely used in environmental chemistry, owing to its relatively low
cost, simplicity of design and operation, and pollutant removal to low concentrations.
Among the possible separation and purification techniques, adsorption by selective
adsorbent shows promise in being among the most attractive and efficient methods for
purification and separation of trace anion contaminants.
Adsorbents are natural or synthetic materials of amorphous or microcrystalline
structure. Those used on a large scale, in order of sales volume, are activated carbon,
molecular sieves, silica gel, and activated alumina, amongst others.
Figure 3. Activated carbon. Source: Calgon Carbon.
Regarding phosphates removal, several studies have been done using both chemical
and biological methods, which have traditionally been proposed for phosphate removal
from water and wastewater. Coagulation and biological methods are used in industries
but these treatment processes are unable to satisfy the mandate level or reduce it to
near zero or below 10 mg/L (Stante et al., 1997; Zhao and SenGupta, 1998; Bektas et
al., 2004; Vasudevan et al., 2008; Namasivayam and Prathap, 2005; Babatunde et al.,
2008; Yildiz, 2004; de-Bashan and Bashan, 2004). Therefore, extensive researches
have been investigated to develop suitable methods based on stable running, simple
operation technique, high selectivity and excellent kinetic performances. Ion exchange
adsorbents, electrodialysis, and specially ligand exchangers possess all of these
characteristics.

Master Thesis - Phosphate adsorption onto laterite and laterite waste from a leaching process
5
Fly ash is a very common adsorbent used for phosphate adsorption; several studies
have been made using both fly ash and modified fly ash with particularly good results in
this last case due to the increase of the specific surface area of the fly ash (Lu et al.,
2009; Xu et al., 2010). In some cases, the phosphate removal percentage reached
percentages between 90-97%, although the total removal was mainly through
precipitation, with a relative contribution of adsorption to the total removal accounting
for 30-34%.
Figure 4. Micrograph of fly ash particles taken using a Scanning Electron Microscope (SEM). Source: Fly Ash Australia.
Other minor studies about adsorptive removal of phosphate have been done with
numerous kinds of adsorbents, such as peat (Xiong and Mahmood, 2010), red mud
(Chang-jun et al., 2007), iron oxide tailings (Zeng et at., 2004), vesuvianite (Li et al.,
2009), skin split waste (Huang et al., 2009), calcite (Karageorgiou et al., 2007), or
alunite (Özacar, 2003).
Laterite has also traditionally been used in adsorption, and its properties regarding
arsenic and mercury are widely well-known (Yu et al., 2008; Maji et al., 2007, Partey et
al., 2008). It has been proved that about 98% arsenite can be removed using a laterite
dose of 40 g/L, for an initial arsenite concentration of 1 mg/L (Maiti et al., 2010).
Nevertheless, only a few studies have used laterite for phosphate removal. Some
temperature studies undertaken by Zhang et al., (2010) are worth noting, as they
showed that the capacity of the laterite for phosphorus adsorption increases with
temperature. In Northern Ireland, a research project was carried out in the University of
Ulster regarding the use of local laterite in phosphorus and heavy metal removal (Wood
and McAtamney, 1996). In this study, a pilot-scale experimental constructed wetland
containing laterite achieved up to a 96% removal of phosphorus.

Master Thesis - Phosphate adsorption onto laterite and laterite waste from a leaching process
6
2.2. Phosphorus Regulations in Northern Ireland
Under the Northern Ireland Water Act 1972, the Environment and Heritage Service
(EHS), an Executive Agency within the Department of the Environment for Northern
Ireland, has a duty to promote the conservation of water resources of Northern Ireland
(NI) and the cleanliness of water in waterways and underground strata. Eutrophication
is considered by EHS to pose the most widespread single threat to good water quality
in Northern Ireland.
The most widely used classification of lake trophic status is that proposed by the
Organisation for Economic Co-operation and Development (OECD) and described in
Table 1. Lakes are classified in terms of the average phosphorus concentration, the
average and maximum crops of algae (estimated by the pigment chlorophyll a) and the
measurement of water transparency. The OECD scheme proposed three main classes:
oligotrophic for nutrient poor waters, mesotrophic for waters slightly to moderately
enriched with nutrients. In addition two boundary classes were proposed: ultra-
oligotrophic for extremely nutrient and alegal concentrations. The accompanying table
shows the range of values proposed for each of these classes. The relevant data for
Lough Neagh, Lower Lough Erne and Upper Lough Erne are also presented in Table 1.
It is clear that each lake is eutrophic and, in fact, both Lough Neagh and Upper Lough
Erne generally fall into the hypertrophic class.
Table 1. OECD lake trophic classification criteria for phosphorus. Source: EHS.

Master Thesis - Phosphate adsorption onto laterite and laterite waste from a leaching process
7
But eutrophication has also affected Northern Irish rivers. The rivers in NI are classified
under the General Quality Assessment (GQA) systems using routine chemical and
macroinvertebrate biological monitoring. The chemical quality classification does not
require measurement of phosphorus, and classifying rivers in terms of their trophic
status using phosphorus concentrations remains questionable. The criteria for
identification of Sensitive Areas under the EC UWWT Directive suggest that a river is
excessively enriched if the mean concentration for soluble phosphates is greater than
100 µg P L-1.
The biological GQA classification system is based on the presence of various
macroinvertebrate species, which are sensitive to a range of pollutants. From 1994 to
1997 this biological monitoring programme was complemented by surveys of
macrophytes in NI rivers. The presence and abundance of macrophytes provide an
index of environmental disturbance due to nutrient enrichment and the surveys showed
that most rivers in NI are enriched. The level of enrichment in the Lagan, Foyle and
Blackwater catchments was sufficiently severe for plant respiration to reduce dissolved
oxygen levels in rivers. These findings were the first reliable indication that
eutrophication is a significant problem in a number of river catchments in NI.
Continuing studies on nutrient enrichment of lakes in NI have included the collection of
data on soluble phosphate for rivers flowing into Lough Neagh and Lough Erne along
with data for the River Bush. The average phosphate concentrations for these rivers
measured during 1997 are summarised in Figure 5 and indicate that many rivers
currently exceed the EC UWWT Directive 100 µg P L-1 criteria highlighted above.
Figure 5. Phosphate concentrations in NI rivers. Source: EHS.

Master Thesis - Phosphate adsorption onto laterite and laterite waste from a leaching process
8
As regards phosphate contamination caused by agriculture, on January 1st, 2007, new
legislation came into operation in Northern Ireland introducing measures to improve the
use of nitrogen and phosphorus nutrients on farms. Its aim is to improve water quality
by protecting water against pollution caused by nitrates from agricultural sources. It
stipulates, among other things, that organic manures including dirty water must not be
applied within:
20 m of lakes;
50 m of a borehole, spring or well;
250 m of a borehole used for a public water supply;
15 m of exposed cavernous or karstified limestone features;
10 m of a waterway other than lakes; this distance may be reduced to 3 m where
slope is less than 10% towards the waterway and where organic manures are
spread by bandspreaders, trailing shoe, trailing hose or soil injection or where
adjoining area is less than 1 ha in size or not more than 50 m in width.
Furthermore, one of the factors to be considered if planning to spread fertilizer on
sleepy sloping land is the proximity of waterway. The distance from the area where
spreading is planned to the nearest waterway at the bottom of the slope should be
assessed. For organic manures, high risk is defined as less than 20 m from a waterway
other than a lake, moderate risk is 20-30 m and low risk is more than 30 m. In the case
of lakes, for organic manures, high risk is defined as less than 30 m from a lake,
moderate risk is 30-40 m and low risk is more than 40 m. For chemical fertilisers, high
risk is less than 5 m from any waterway, moderate risk is 5-10 m and low risk is more
than 10 m.

Master Thesis - Phosphate adsorption onto laterite and laterite waste from a leaching process
9
3. Materials and Methods
3.1. Chemicals and Adsorbents
Deionized distilled water was used to prepare all solutions and suspensions.
Standard solution of phosphorus (P) 1000 + 2 µg/mL –provided by JVA Analytical–
was used to obtain the different dilutions of the calibration curve explained in section
5 (Phosphate calibration).
Aqueous solutions of ascorbic acid (C6H8O6) were prepared according to Lenoble et
al. The concentration of ascorbic acid in the stock solution was 0.57 mol/L (10.03 g
of solid ascorbic acid in 100 mL of deionized water).
The molybdate stock solution was prepared by dissolution of 5.2 g ammonium
molybdate and 8.8 mg of potassium antimonyl tartrate in 30 ml of 9 mol/L sulfuric
acid (H2SO4) and diluted by deionized water to a final volume of 50 ml in a
volumetric flask. (Tsang et al., 2006).
Figure 6. Ascorbic acid (yellow) and molybdate stock solution (white).
The rest of phosphate solutions were prepared by dilutions of a synthetic
phosphorus solution comprising deionized water and a certain amount of an 85%
calcium dihydrogen phosphate (Ca(H2PO4)2) salt, according to the stoichiometry of
the following reaction:
2
2 4 2 42Ca H PO Ca 2 H PO

Master Thesis - Phosphate adsorption onto laterite and laterite waste from a leaching process
10
Sodium hydrogen carbonate (NaHCO3) was used as a pH buffer in most of the
experiments.
Different solutions of hydrochloric acid (HCl) and sodium hydroxide (NaOH) within a
range from 0.1 mM to 0.1 M were used to adjust the pH of the phosphate solution
when necessary.
Three different kinds of laterite were provided by Kinney Environmental Science
Services Consultancy (KESS-Consult, Co. Antrim, Northern Ireland). Two of them
were from different layers: an upper layer (sample called “upper”) and a lower layer
(sample called “lower”). Additionally, a waste resulting from a H2SO4 leaching on
laterite was also included (sample called “acidified”).
Figure 7. Samples “upper”, “lower” and “acidified” from the provided laterite.
The three kinds of laterite were subsequently cleaned, dried and sieved until the
following granule size distribution was obtained:
Figure 8. Granulometric distribution of the three kinds of laterite.
0
50
100
150
200
250
300
350
400
450
Mass (
g)
Diameter size Φ (µm)
Lower
Upper
Acidified

Master Thesis - Phosphate adsorption onto laterite and laterite waste from a leaching process
11
3.2. Adsorption Kinetics
The batch experimental data from this study will be applied to selected adsorption
kinetic models, namely pseudo-first-order and pseudo-second-order models.
The form of the pseudo-first-order (or Lagergren first-order) rate equation is as follows:
1 e t
dqk q q
dt (1)
Where:
qe is the equilibrium adsorption of phosphorus adsorbed on unit mass of the laterite
(mg/g), and can be calculated by using the following expression:
0 e
e
C C Vq
m (2)
where C0 and Ce are the initial phosphorus concentration (mg/L) and phosphorus
concentration (mg/L) at equilibrium respectively; V is the volume of the phosphorus
solution (L); and m is the weight of laterite used (g).
qt is the amount of adsorbate adsorbed (mg/g) at time t, defined as:
0 t
t
C C Vq
m
(3)
where Ct is the phosphorus concentration (mg/L) at time t.
k1 is the pseudo-first-order adsorption rate constant (h-1).
After integration and applying boundary conditions t = 0 to t = t and qt = 0 to qt = qt, the
integrated form of equation (1) becomes:
1ln( ) lne t eq q q k t (4)
The values of k1 and qe can be calculated from the intercept and slope of the plots of
ln(qe – qt) versus t.
The pseudo-second-order equation is also based on the sorption capacity of the solid
phase and is expressed as:
2
2 e t
dqk q q
dt (5)

Master Thesis - Phosphate adsorption onto laterite and laterite waste from a leaching process
12
Where:
k2 is the rate constant of second-order adsorption (g mg-1 h-1).
For the same boundary conditions, the integrated form of equation (5) becomes:
2
2
1 1
t ee
tt
q qk q (6)
If second order kinetics is applicable, then the plot of t/q against t should give a linear
relationship, from which qe and k2 can be determined from the slope and intercept of
plot respectively.
3.3. Freundlich and Langmuir Isotherms
There are basically two well established types of adsorption isotherm: the Freundlich
adsorption isotherm and the Langmuir adsorption isotherm.
The Freundlich model is often expressed as:
1/n
e F eq K C (7)
where KF and n are constants related to adsorption capacity and energy of adsorption.
The previous equation can be linearized as:
1
ln ln lne F eq K Cn
(8)
Therefore, the two Freundlich constants can be easily determined from the plot of ln qe
versus ln Ce.
The Langmuir equation has the following expression when applied to P sorption:
0
1
L ee
L e
K Q Cq
K C (9)
Or, alternatively:
0 0
1 1ee
e L
CC
q K Q Q (10)
Master Thesis - Phosphate adsorption onto laterite and laterite waste from a leaching process
13
Where:
KL is a constant related to the binding strength of phosphate (L/mg).
Q0 is the Langmuir sorption maximum (mg/g).
These two parameters can be calculated from the linearized Langmuir model, through
the slope and the intercept of the plot of Ce/qe in front of Ce.
3.4. Thermodynamic Parameters
The thermodynamic parameters, namely the standard Gibbs free energy (∆G0), change
in enthalpy (∆H0) and entropy change (∆S0) are estimated as follows. The change in
Gibbs free energy of the process is related to equilibrium constant by the following
equation:
0
0lnG RT K (11)
Where:
K0 is the equilibrium constant, which can be calculated as:
0
e
e
qK
C (12)
R is the ideal gas constant (8.314 J mol-1 K-1).
T is the absolute temperature (K).
Gibbs free energy change is also related to the enthalpy change (∆H0), and entropy
change (∆S0) at constant temperature by the following expression:
0 0 0G H T S (13)
Combining equations (10) and (12) gives the integrated form of the van’t Hoff equation:
0 0
0lnS H
KR RT
(14)
Therefore, the values of entropy change (∆S0) and enthalpy change (∆S0) can be
obtained from intercept and slope of the plot of ln K0 versus (1/T). Subsequently, the
value of Gibbs free energy (∆G0) can be calculated from either equation (11) or (13).

Master Thesis - Phosphate adsorption onto laterite and laterite waste from a leaching process
14
4. Experimental Results and Discussion
4.1. Properties of Laterite
The solid structure of the three kinds of laterite was analyzed using X-ray fluorescence
(XRF). The result of this analysis is shown in Table 2, giving the main chemical
composition of samples.
Table 2. Main chemical compositions of laterite.
Composition (%) Upper Lower Acidified
SiO2 9.96 27.54 35.33
TiO2 4.22 4.05 4.48
Al2O3 56.55 33.29 33.80
Fe2O3 26.20 31.97 23.06
Mn3O4 0.20 0.23 0.14
MgO 1.19 0.92 1.00
CaO 0.80 0.60 0.74
Na2O 0.16 0.12 0.33
K2O 0.01 0.03 0.15
P2O5 0.25 0.23 0.15
SO3 0.09 0.07 0.07
V2O5 0.12 0.13 0.09
Cr2O3 0.08 0.11 0.06
SrO 0.02 0.02 0.02
ZrO2 0.08 0.09 0.07
BaO < 0.006 < 0.007 < 0.006
NiO 0 0.04 0.01
CuO 0.01 0.02 0.01
ZnO 0.01 0.02 0.01
PbO 0.02 0.02 0.02
HfO2 0.01 < 0.005 < 0.004
Loss of ignition 22.94 13.52 15.29
Total 99.97 99.49 99.54
Master Thesis - Phosphate adsorption onto laterite and laterite waste from a leaching process
15
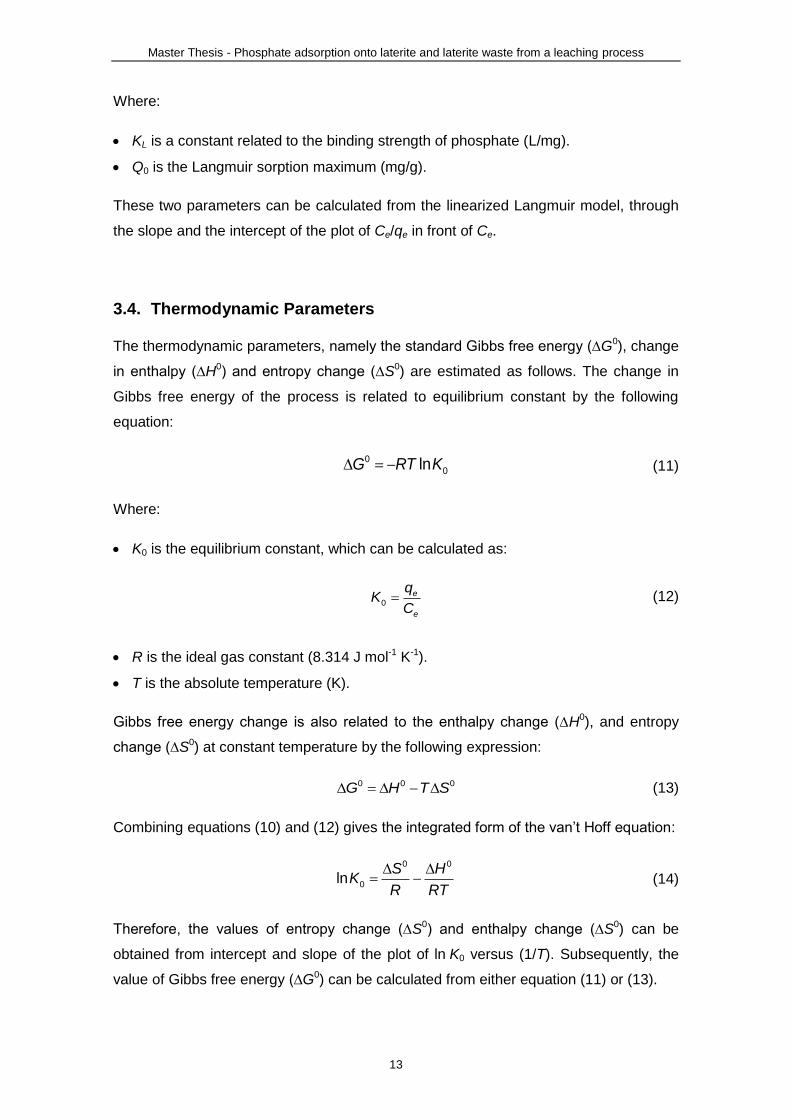
Some other properties were also studied, as shown in Table 3 below:
Table 3. Main properties of laterite.
Property Upper Lower Acidified
Point of zero charge (pHpzc) 7.8 8.0 5.2
BET surface area (m2/g)
Φ < 75 µm 24.79 50.61 85.70
500 µm < Φ < 600 µm 30.13 55.59 98.48
1 mm < Φ < 1.18 mm 29.90 50.79 99.36
Mean pore size (nm)
Φ < 75 µm 6.74 6.36 4.27
500 µm < Φ < 600 µm 7.28 6.22 4.22
1 mm < Φ < 1.18 mm 6.98 6.30 4.27
Porosity (cm3/g)
Φ < 75 µm 0.08 0.16 0.18
500 µm < Φ < 600 µm 0.11 0.17 0.21
1 mm < Φ < 1.18 mm 0.10 0.16 0.21
Finally, various Secondary Electron Images (SEI) were obtained –see Figure 9 below–
in order to understand the intern shape of the particles of laterite.
Figure 9. SEM Images of laterite particles: (a) Lower; (b) Upper; (c) Acidified.
From the figure above it is clear that the adsorbent surface has a highly porous
structure with heterogeneous structure, especially in the sample with “acidified” laterite.

Master Thesis - Phosphate adsorption onto laterite and laterite waste from a leaching process
16
4.2. Phosphate Calibration
4.2.1. Colorimetric Method
According to S. Tsang et al., the optimized procedure for the determination of
phosphate over the 0-5 µmol/L range is described below:
a) 9.3 mL of analyte solution is measured out in a 10 mL volumetric flask;
b) Add 0.1 mL of 98% H2SO4, shake;
c) Wait 45 s and add 0.4 mL of molybdate stock solution; shake;
d) Wait 45 s and add 0.2 mL of ascorbic acid stock solution; shake;
e) Wait approximately 10 minutes and then measure absorbance at a single
wavelength λ = 880 nm.
In order to apply this procedure to the phosphates calibration, various dilutions of a 10
ppm (mg/L) phosphorus standard solution were prepared, along with a blank of
deionized water. Subsequently, the absorbance was read with a DR 2800
Spectrophotometer.
Figure 10. Hach DR 2800TM Portable Spectrophotometer.
The results of the experimental procedure are shown in Table 4 below:
Table 4. Results of the absorbance read for the phosphate dilutions.
C (ppm) 1.0 1.5 2.0 2.5 3.0 4.0 5.0
A (AU) 0.442 0.548 0.663 0.773 0.891 1.107 1.403

Master Thesis - Phosphate adsorption onto laterite and laterite waste from a leaching process
17
4.2.2. Calibration Curve
The concentration dependence of the absorbance was graphically represented in order
to obtain a correlation between both magnitudes, as seen in Figure 11 below:
Figure 11. Phosphorus calibration curve within the range from 1 to 5 ppm.
According to the above graph, the mathematical model that gives the relation between
the absorbance (A) and the concentration of phosphorus (C) for the range from 1 to 5
ppm is given as follows:
0,237 0,190A C (15)
This equation was used from now then to determinate the concentration of phosphorus
in all the subsequent experiments and studies. Its validity was also studied by
measuring the absorbance of a 2.5 ppm phosphorus solution made from a Ca(H2PO4)2
salt, which gave a relative error between the calculated concentration and the original
concentration of 5.86%, which is pretty acceptable if we consider its economic
advantages in comparison with another methods, such as the Inductively Coupled
Plasma spectrometry (ICP).
y = 0.237x + 0.190 R² = 0.997
0.0
0.2
0.4
0.6
0.8
1.0
1.2
1.4
1.6
0.0 0.5 1.0 1.5 2.0 2.5 3.0 3.5 4.0 4.5 5.0 5.5
Ab
so
rban
ce (
AU
)
Concentration (ppm)

Master Thesis - Phosphate adsorption onto laterite and laterite waste from a leaching process
18
4.3. Adsorption Kinetics
4.3.1. Preliminary Study
Some preliminary studies were done to estimate how long it takes for the adsorption
process to reach equilibrium, and also to see the effect of the kind of layer and the
particle size. These experiments were made under the following conditions:
Temperature: T = 25 ºC (Room temperature).
Initial concentration of phosphorus [P]: C0 = 50 ppm.
Volume of the flasks: V = 200 mL.
Mass of adsorbent (laterite): m = 0.2 g (Dose = 1 g/L).
Mass of pH buffer (NaHCO3): 20 mg (Dose = 100 mg/L).
Initial pH: 7.0 (constant due to the pH buffer).
Stirrer speed: 500 rpm (RCT basic IKAMAG® safety control).
Figure 12. RCT basic IKAMAG® safety control magnetic stirrer.
Volume of the samples: 10 mL.
The samples were taken at the intervals of 0, 2, 6, 24, 48 hours after the start of the
adsorption reaction, and subsequently diluted and analyzed in the
spectrophotometer after following the procedure of the colorimetric method.
For each one of the intervals, the concentration of phosphorus was calculated with
equation (15) and later re-calculated considering the dilution factor in order to obtain
the real concentration.

Master Thesis - Phosphate adsorption onto laterite and laterite waste from a leaching process
19
This procedure was followed for three different experiments: the first one using the
layer of laterite called “lower”, the second one with the layer called “upper”, and the
third one with the layer called “acidified”.
In each case, three different particle sizes (in function of the diameter Φ) were also
used: Φ < 75 µm; 500 µm < Φ < 600 µm; and 1 mm < Φ < 1.18 mm.
The results from the experiments are outlined in Figures 13, 14 and 15:
Figure 13. Kinetics of phosphorus sorption on “lower” laterite for particle sizes:
Φ < 75 µm; 500 µm < Φ < 600 µm; and 1 mm < Φ < 1.18 mm.
47.0
47.5
48.0
48.5
49.0
49.5
50.0
50.5
51.0
0 4 8 12 16 20 24 28 32 36 40 44 48
Co
ncen
trati
on
(p
pm
)
Time (h)
Lower 1-1.18 mm
Lower 500-600 µm
Lower <75 µm

Master Thesis - Phosphate adsorption onto laterite and laterite waste from a leaching process
20
Figure 14. Kinetics of phosphorus sorption on “upper” laterite for particle sizes:
Φ < 75 µm; 500 µm < Φ < 600 µm; and 1 mm < Φ < 1.18 mm.
Figure 15. Kinetics of phosphorus sorption on “acidified” laterite for particle sizes:
Φ < 75 µm; 500 µm < Φ < 600 µm; and 1 mm < Φ < 1.18 mm.
47.0
47.5
48.0
48.5
49.0
49.5
50.0
50.5
51.0
0 4 8 12 16 20 24 28 32 36 40 44 48
Co
ncen
trati
on
(p
pm
)
Time (h)
Upper 1-1.18 mm
Upper 500-600 µm
Upper <75 µm
47.0
47.5
48.0
48.5
49.0
49.5
50.0
50.5
51.0
0 4 8 12 16 20 24 28 32 36 40 44 48
Co
ncen
trati
on
(p
pm
)
Time (h)
Acidified 1-1.18 mm
Acidified 500-600 µm
Acidified <75 µm

Master Thesis - Phosphate adsorption onto laterite and laterite waste from a leaching process
21
As observed from figures, in the three experiments carried out the time needed to
reach equilibrium was approximately 8 hours, although this is not particularly clear in
the last case, when the acidified laterite was used, due to the length of the time
intervals selected for taking the samples.
It can also be observed that the reduction in the phosphorus concentration once the
equilibrium is reached is relatively low, since the lowest equilibrium concentration is
47.62 ppm (acidified laterite, particle size Φ < 75 µm), which gives a percentage of
removal of 5.45% of the initial concentration.
Furthermore, it is clear to see that as the particle size of laterite decreases, the
adsorption is done more efficiently. This may be attributed to the fact that diffusion
inside the particle is quicker for smaller particle sizes.
All of these conclusions can also be drawn from Table 5, which shows the amount of
equilibrium adsorption qe, calculated through equation (2), for each one of the
experiments carried out:
Table 5. Equilibrium adsorption of phosphorus for the three layers and the three particle sizes.
qe (mg/g)
Laterite
Lower Upper Acidified
1 mm < Φ < 1.18 mm 1.18 1.52 1.73
500 µm < Φ < 600 µm 1.44 1.90 2.37
Φ < 75 µm 1.69 2.16 2.75
The table above emphasizes again the fact that the best choice for future experiments
would be the acidified laterite with the lowest particle size possible, since if we consider
all the results from the equilibrium adsorption, the best of them all is 2.75 mg/g,
obtained from the acidified laterite and the particle diameter lower than 75 µm (the
lowest one in the granulometric distribution of the laterite).

Master Thesis - Phosphate adsorption onto laterite and laterite waste from a leaching process
22
4.3.2. First and Second Order Approximations
In order to predict the kinetic model of the adsorption process, three simultaneous
experiments were carried out under the following conditions:
Temperature: T = 25 ºC (Room temperature).
Initial concentration of phosphorus [P]: C0 = 25 ppm.
Volume of the flasks: V = 1 L.
Mass of adsorbent (laterite): m = 1 g (Dose = 1 g/L).
Particle size of the adsorbent: Φ < 75 µm.
Mass of pH buffer (NaHCO3): 100 mg (Dose = 100 mg/L).
Initial pH: 7.0 (Constant due to the pH buffer).
Stirrer speed: 500 rpm (RCT basic IKAMAG® safety control).
Volume of the samples: 10 mL.
The samples were taken at the intervals of 0, 1, 2, 3, 4, 5, 6, 7, 8, 24, 28 and 48
hours after the start of the adsorption reaction, and subsequently diluted and
analyzed in the spectrophotometer after following the procedure of the colorimetric
method.
For each one of the intervals, the concentration of phosphorus was calculated with
equation (15) and later re-calculated considering the dilution factor in order to obtain
the real concentration.
Similarly to the preliminary study, this procedure was followed for three different
experiments: the first one using the layer of laterite called “lower”, the second one with
the layer called “upper”, and the third one with the layer called “acidified”. This was
done in order to obtain another comparison between the different kinds of laterite,
although this time only the lowest particle size was used.
The results are illustrated in Figure 16:

Master Thesis - Phosphate adsorption onto laterite and laterite waste from a leaching process
23
Figure 16. Kinetics of phosphorus sorption on laterite (particle size Φ < 75 µm),
for C0 = 25 ppm, adsorbent dose = 1 g/L and pH = 7.
From the above figure it is clear to see that the acidified laterite is the best choice for
future experiments, since it is the kind of laterite that gives the highest percentage of
removal of phosphorus. This is probably due to the fact that the acidified laterite has a
more porous structure, as suggested in section 4.1. Therefore, from that moment
onwards only acidified laterite was used for the rest of experiments in this project.
Phosphate adsorption on laterite consisted of a fast and a slow reaction process. The
fast process was completed in approximately 8 hours, in which phosphorus sorption
increased rapidly with increasing retention time, whereas the slow process could
extend over 48 h. The slow phosphorus sorption process was likely related to the
diffusion of adsorbed P into inner surface of the laterite and to the possibility of surface
precipitation reactions to form different kinds of iron and aluminium phosphates.
Adsorption kinetic data were subsequently treated in order to obtain a suitable kinetic
model, although only the data from acidified laterite were considered, as they gave the
highest efficiency in phosphate removal. Figures 17 and 18 show the pseudo-first and
pseudo-second order approximations obtained from fitting the experimental data from
the acidified laterite to both equations (4) and (6):
22.0
22.5
23.0
23.5
24.0
24.5
25.0
25.5
0 4 8 12 16 20 24 28 32 36 40 44 48 52
Co
ncen
trati
on
(p
pm
)
Time (hours)
Lower
Upper
Acidified

Master Thesis - Phosphate adsorption onto laterite and laterite waste from a leaching process
24
Figure 17. Linear first-order kinetic sorption data for P on acidified laterite
(particle size Φ < 75 µm), for C0 = 25 ppm, adsorbent dose = 1 g/L and pH = 7.
Figure 18. Linear second-order kinetic sorption data for P on acidified laterite
(particle size Φ < 75 µm), for C0 = 25 ppm, adsorbent dose = 1 g/L and pH = 7.
y = -0.1344x - 0.2583 R² = 0.8429
-4.5
-4
-3.5
-3
-2.5
-2
-1.5
-1
-0.5
0
0.5
0 2 4 6 8 10 12 14 16 18 20 22 24 26 28 30
ln(q
e -
qt)
Time (hours)
y = 0.3645x + 0.3355 R² = 0.9997
0
2
4
6
8
10
12
14
16
18
20
0 4 8 12 16 20 24 28 32 36 40 44 48
t/q
(h
ou
rs·g
·mg
-1)
Time (hours)

Master Thesis - Phosphate adsorption onto laterite and laterite waste from a leaching process
25
The kinetic parameters from both models are shown in Table 6 below:
Table 6. Comparison of the first- and second-order reaction constants for acidified laterite.
First-order kinetic model Second-order kinetic model
k1 (h-1
) qe R2 k2 (g mg
-1 h
-1) qe R
2
0.134 0.772 0.843 0.396 2.743 0.999
The results indicate that the first-order kinetic model is not applicable, since the
correlation coefficient (R2) obtained with this approximation is relatively low. This is due
to the fact that near equilibrium the experimental data deviate notably from the previous
data obtained during the first stage of the experiment. The correlation coefficient
obtained with the second-order approximation is, however, much higher (~1), which
shows the suitability of this model.
A good way to compare the model and the experimental data is calculating the relative
error between both values of adsorption capacities at equilibrium (qe), which is shown
in Table 7 below:
Table 7. Comparison between experimental and model adsorption capacities.
qe (mg/g) from experimental data (eq. 2)
qe (mg/g) from second-order model
Relative error (%)
2.684 2.743 2.198 %
The low value of the relative error (2.198%) between both adsorption capacities again
confirms the applicability of the pseudo-second-order kinetic model.
Therefore, the kinetic model that can be applied to the adsorption process of
phosphate onto acidified laterite is based in the following equation:
2
0.396 2.743 t
dqq
dt (16)
Or, alternatively:
0.336 0.365t
tt
q (17)

Master Thesis - Phosphate adsorption onto laterite and laterite waste from a leaching process
26
Finally, a graph with the experimental and mathematical model data was made –see
Figure 19– in order to see the similarity between both models:
Figure 19. Comparison between experimental and second-order model data for P on acidified
laterite (particle size Φ < 75 µm), for C0 = 25 ppm, adsorbent dose = 1 g/L and pH = 7.
From the above figure it is clear to see that the pseudo-second-order model fits
relatively well with the experimental data, with only slight differences in the first stage of
the adsorption (fast stage). We can therefore conclude that this model is perfectly
applicable to predict the kinetics of the phosphorus adsorption onto acidified laterite.
22.0
22.5
23.0
23.5
24.0
24.5
25.0
25.5
0 4 8 12 16 20 24 28 32 36 40 44 48 52
Co
ncen
trati
on
(p
pm
)
Time (hours)
Experimental data
Kinetic model

Master Thesis - Phosphate adsorption onto laterite and laterite waste from a leaching process
27
4.4. Adsorption Isotherms
4.4.1. Effect of Initial Concentration
Phosphate adsorption isotherm studies were carried out under the following conditions:
Temperature: T = 25 ºC (Room temperature).
Volume of the flasks: V = 50 mL.
Mass of adsorbent (“acidified” laterite): m = 50 mg (Dose = 1 g/L).
Particle size of the adsorbent: Φ < 75 µm.
Mass of pH buffer (NaHCO3): 100 mg (Dose = 100 mg/L).
Initial pH: 7.0 (Constant due to the pH buffer).
Shaker: Gerhardt Bonn LS/RO500 type 655.
Figure 20. Gerhardt Bonn LS/RO500 type 655 shaker.
Time of reaction: 72 h.
Volume of the samples: 10 mL.
Once the samples were filtered, the concentration of phosphorus in the equilibrium
(Ce) of each one of them was calculated with equation (15) and later re-calculated
considering the dilution factor in order to obtain the real concentration.
Furthermore, for each one of the samples, the quantity of adsorbed phosphorus (qe)
was subsequently calculated with equation (2).
This procedure was followed for eight different initial concentrations (C0) of
phosphorus: 5, 10, 15, 20, 25, 30, 40 and 50 ppm.
The results of the phosphate adsorption isotherm experiments are shown in Figures
21a and 21b:

Master Thesis - Phosphate adsorption onto laterite and laterite waste from a leaching process
28
Figures 21a and 21b. Phosphorus adsorption isotherm for acidified laterite.
Particle size: Φ < 75 µm; temperature = 25 ºC; adsorbent dose = 1 g/L; pH = 7.
0.0
0.5
1.0
1.5
2.0
2.5
3.0
0 5 10 15 20 25 30 35 40 45 50
qe (
mg
/g)
Ce (ppm)
2.0
2.1
2.2
2.3
2.4
2.5
2.6
2.7
2.8
0 5 10 15 20 25 30 35 40 45 50
qe (m
g/g
)
Ce (ppm)

Master Thesis - Phosphate adsorption onto laterite and laterite waste from a leaching process
29
The experimental isotherm data can be characterized by the typical L-curve isotherm,
in which the initial slope does not significantly change with the solute concentration.
Even so, this cannot be confirmed because of the lack of data within the range from 0
to 5 ppm, due to limitations in the range of concentrations with which the phosphorus
calibration curve was done (see Figure 21b).
Phosphorus adsorption capacity significantly increased with the phosphorus
concentration increasing from 5 to 20 ppm. This capacity was approximately 2.6 mg/g
for a phosphorus equilibrium concentration of 20 ppm. Nevertheless, with a further
increase of the phosphorus equilibrium concentration, the increase of adsorption was
less significant, as it only increased until 2.75 mg/g for an equilibrium concentration of
47.25 ppm.
Even so, the general results from the adsorption capacity can be considered low, and
better results in terms of percentage of removal are expected with an increasing of the
dose of laterite, as the highest percentage of removal was approximately 44%,
obtained with the lowest value of the phosphorus equilibrium concentration (see Figure
22 below).
Figure 22. Percentage of removal of P for acidified laterite (particle size Φ < 75 µm).
Temperature = 25 ºC; adsorbent dose = 1 g/L; pH = 7.
0
5
10
15
20
25
30
35
40
45
50
0 5 10 15 20 25 30 35 40 45 50
% r
em
ov
al
of
P
Ce (ppm)

Master Thesis - Phosphate adsorption onto laterite and laterite waste from a leaching process
30
4.4.2. Freundlich and Langmuir Isotherms
The adsorption data were analyzed using the Freundlich and Langmuir models as
outlined in section 3.3. In order to compare both isotherms, two graphs were plotted
over the concentration range, whose results are illustrated in Figures 23 and 24 below:
Figure 23. Freundlich linear isotherm data for P adsorption on acidified laterite.
Particle size: Φ < 75 µm; temperature = 25 ºC; adsorbent dose = 1 g/L; pH = 7.
y = 0.0738x + 0.7361 R² = 0.9812
0.7
0.75
0.8
0.85
0.9
0.95
1
1.05
0.0 0.5 1.0 1.5 2.0 2.5 3.0 3.5 4.0 4.5
ln(q
e)
ln(Ce)
Master Thesis - Phosphate adsorption onto laterite and laterite waste from a leaching process
31
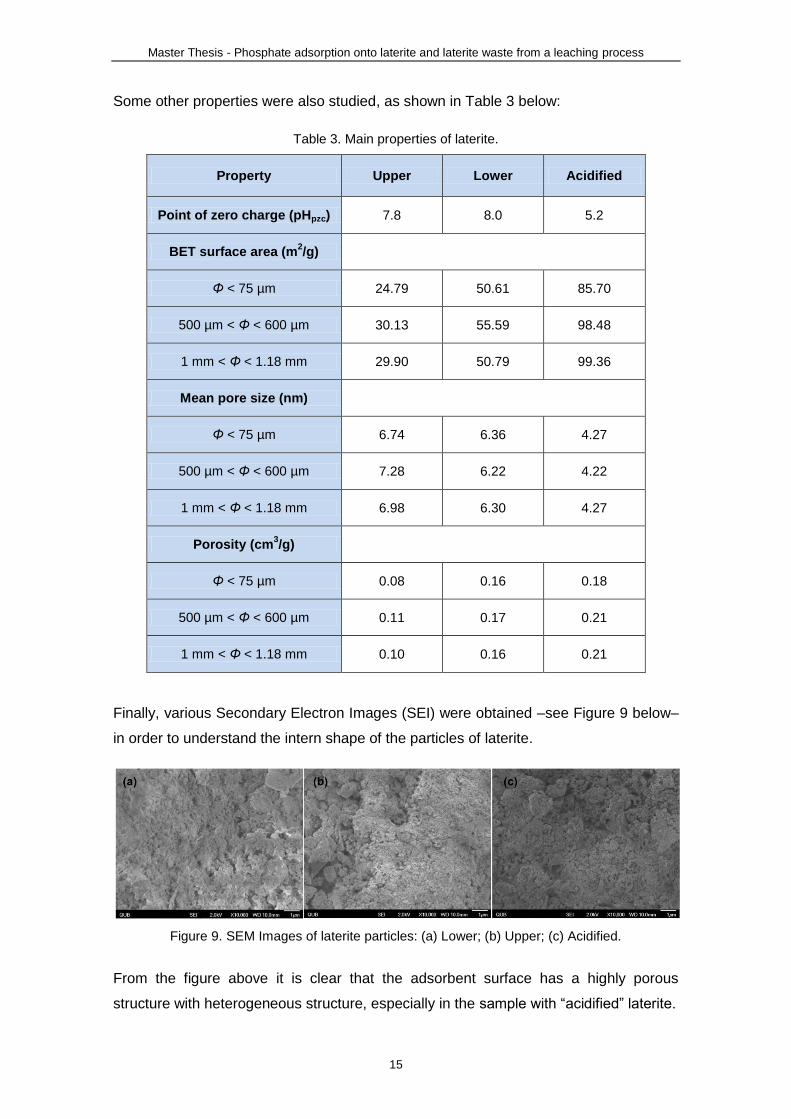
Figure 24. Langmuir linear isotherm data for P adsorption on acidified laterite.
Particle size: Φ < 75 µm; temperature = 25 ºC; adsorbent dose = 1 g/L; pH = 7.
The estimated values of P adsorption parameters obtained from these models are
shown in Table 8:
Table 8. Freundlich and Langmuir adsorption constants for P adsorption on acidified laterite.
Freundlich model Langmuir model
KF n R2 KL (L/mg) Q0 (mg/g) R
2
2.088 13.550 0.981 0.900 2.793 0.999
The experimental data fitted well the Freundlich and Langmuir equations, with
correlation coefficients ranging from 0.981 to 0.999 (~1).
Similar results were obtained regarding P sorption capacity (KF and Q0 values),
although the value of Q0 is more reliable due to the comparison with the approximated
value that can be obtained directly from the experimental data –see Figure 21– and
also because the value of the correlation coefficient is slightly higher for the Langmuir
model.
y = 0.3581x + 0.3981 R² = 0.9998
0
2
4
6
8
10
12
14
16
18
20
0 5 10 15 20 25 30 35 40 45 50
Ce/q
e (
g/L
)
Ce (ppm)

Master Thesis - Phosphate adsorption onto laterite and laterite waste from a leaching process
32
On the other hand, the parameters n and KL are not directly comparable. The constant
n refers to the interaction between exchange sites in the adsorbent and P ions. A high
value for n > 1 –as the one obtained– indicates favourable adsorption. The KL in the
Langmuir model measures the affinity of the adsorbent for the solute, this means that a
higher value of KL refers to a higher adsorption level at low solution concentration.
Even so, the Langmuir isotherm shape can be classified by a term RL, a dimensional
constant separation factor, using equation (18);
0
1
1L
L
RK C
(18)
the value of which indicates the nature of the adsorption process, as shown in Table 9:
Table 9. RL value definitions.
RL value Nature of adsorption process
RL > 1 Unfavourable
RL = 1 Linear
0 < RL < 1 Favourable
RL = 0 Irreversible
The values obtained are shown in Table 10 below:
Table 10. RL values for P adsorption on acidified laterite.
C0 (ppm) RL value Nature of adsorption process
5 0.182 Favourable
10 0.100 Favourable
15 0.069 Favourable
20 0.053 Favourable
25 0.043 Favourable
30 0.036 Favourable
40 0.027 Favourable
50 0.022 Favourable

Master Thesis - Phosphate adsorption onto laterite and laterite waste from a leaching process
33
The results again confirm that the adsorption was a highly favourable process over the
concentration range. Furthermore, it may be noted that all the values are close to zero,
suggesting proximity to irreversibility.
In order to establish a mathematical model for the isotherm, the Langmuir equation was
applied, since the highest value of the correlation coefficient was obtained with such
model. Therefore, the isotherm that can be applied to the adsorption process of
phosphate onto acidified laterite is based in the following equation:
2.512
1 0.9
ee
e
Cq
C
(19)
Finally, a graph with the experimental and Langmuir model data was made in order to
confirm the similarity between both models, as shown in Figure 25 below:
Figure 25. Comparison between experimental and Langmuir model data for P adsorption on
acidified laterite (particle size: Φ < 75 µm). Temp. = 25 ºC; adsorbent dose = 1 g/L; pH = 7.
From the above figure, it can be concluded that the Langmuir model fits relatively well
with the experimental data in terms of shape, with only slight deviations for the lowest
concentration data within the working range.
0.0
0.5
1.0
1.5
2.0
2.5
3.0
0 5 10 15 20 25 30 35 40 45 50 55
qe (
mg
/g)
Ce (ppm)
Experimental data
Langmuir model

Master Thesis - Phosphate adsorption onto laterite and laterite waste from a leaching process
34
4.4.3. Effect of Temperature
Temperature normally has important effects on an adsorption process. In order to see
the variation in parameters such as the adsorption capacity or the percentage of
removal, three different isotherms were carried out at the temperatures of 303, 313 and
323 K. The procedure followed was exactly the same as that one described in section
4.4.2, with the only difference that the flasks were placed into a temperature controlled
water bath –see Figure 26 below– with agitation, and again left for 72 hours.
Figure 26. Lifton NE5-28 Analogue Shaking Water Bath.
Once the results from the colorimetric method were obtained, the experimental data
were plotted along with the isotherm at room temperature (298 K) obtained in section
4.4.2. A comparison between the four isotherms can be seen in Figure 27:

Master Thesis - Phosphate adsorption onto laterite and laterite waste from a leaching process
35
Figure 27. Isotherms obtained at 298, 303, 313 and 323 K for P adsorption on acidified laterite.
Particle size: Φ < 75 µm; adsorbent dose = 1 g/L; pH = 7.
As seen in the figure above, an increase in the temperature has a positive effect in the
maximum adsorption capacity of the laterite, ranging between approximately 2.75 mg/g
for the lowest value of temperature (298 K) and 3.24 mg/g for the highest one (323 K).
This is equivalent to a 17.82% growth in the maximum adsorption capacity.
These values suggest that phosphorus adsorption on laterite must be an endothermic
process, as it was found in literature of phosphorus adsorption onto inorganic
adsorbents, for example, electrocoagulated metal hydroxides sludge, iron oxide coated
sand and kaolinite.
It is also interesting to see the changes in terms of percentage of removal of
phosphorus, as outlined in Table 11:
2.0
2.2
2.4
2.6
2.8
3.0
3.2
3.4
0 5 10 15 20 25 30 35 40 45 50
qe (
mg
/g)
Ce (ppm)
T = 298 K
T = 303 K
T = 313 K
T = 323 K

Master Thesis - Phosphate adsorption onto laterite and laterite waste from a leaching process
36
Table 11. Effect of the temperature in the percentage of removal of P on acidified laterite.
C0 (mg/L)
% removal of P
T = 298 K T = 303 K T = 313 K T = 323 K
5 44.63 44.98 45.08 45.40
10 24.18 24.68 24.88 25.45
15 16.91 17.25 17.73 19.19
20 13.10 13.38 13.91 14.90
25 10.57 10.86 11.30 12.17
30 8.88 9.18 9.60 10.49
40 6.76 7.04 7.46 7.99
50 5.49 5.69 6.03 6.48
Although it is clear that the % of removal of P increases with increasing process
temperature, the variation is not as high as that one observed for the maximum
adsorption capacity, since it only changes –at the very best– from 44.63% to 45.40%,
considering the data obtained from the lowest initial phosphorus concentration.
Finally, the experimental data were fitted to the Langmuir isotherm as done in section
4.4.2, in order to obtain mathematical models that can be applied to the adsorption of
phosphorus on laterite at different temperatures. The results are outlined in Table 12
and Figure 28:
Master Thesis - Phosphate adsorption onto laterite and laterite waste from a leaching process
37
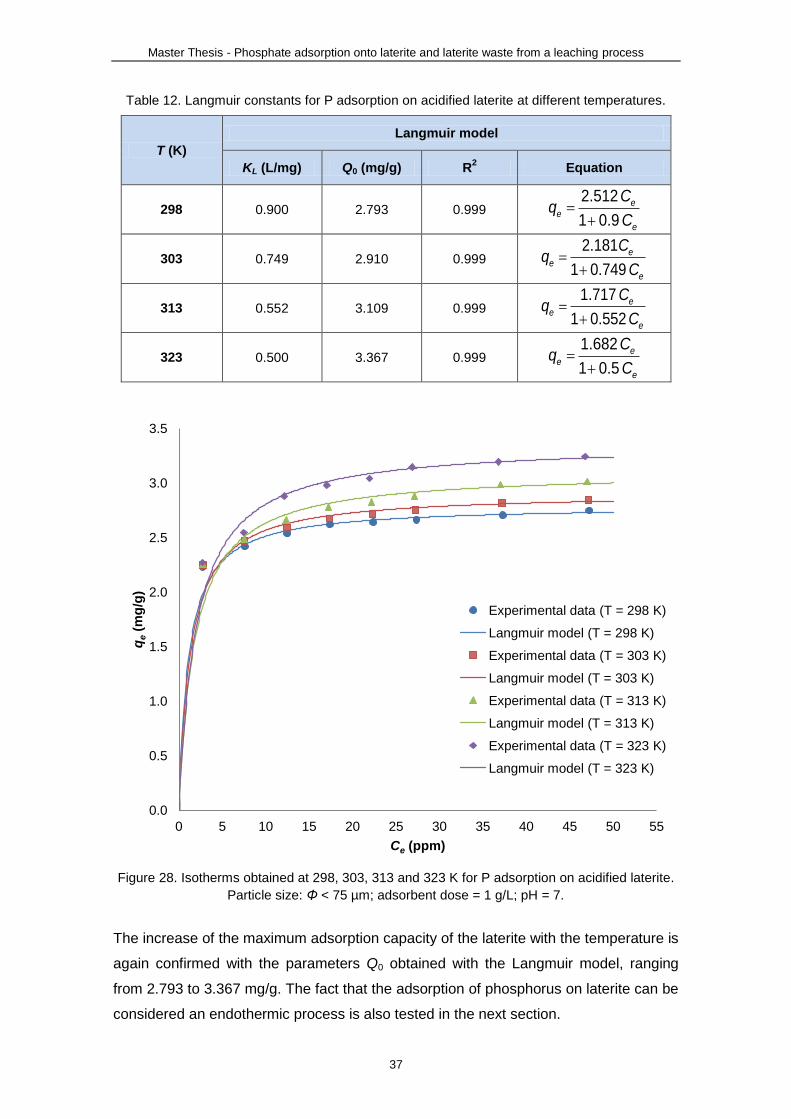
Table 12. Langmuir constants for P adsorption on acidified laterite at different temperatures.
T (K)
Langmuir model
KL (L/mg) Q0 (mg/g) R2 Equation
298 0.900 2.793 0.999 2.512
1 0.9
ee
e
Cq
C
303 0.749 2.910 0.999 2.181
1 0.749
ee
e
Cq
C
313 0.552 3.109 0.999 1.717
1 0.552
ee
e
Cq
C
323 0.500 3.367 0.999 1.682
1 0.5
ee
e
Cq
C
Figure 28. Isotherms obtained at 298, 303, 313 and 323 K for P adsorption on acidified laterite.
Particle size: Φ < 75 µm; adsorbent dose = 1 g/L; pH = 7.
The increase of the maximum adsorption capacity of the laterite with the temperature is
again confirmed with the parameters Q0 obtained with the Langmuir model, ranging
from 2.793 to 3.367 mg/g. The fact that the adsorption of phosphorus on laterite can be
considered an endothermic process is also tested in the next section.
0.0
0.5
1.0
1.5
2.0
2.5
3.0
3.5
0 5 10 15 20 25 30 35 40 45 50 55
qe (
mg
/g)
Ce (ppm)
Experimental data (T = 298 K)
Langmuir model (T = 298 K)
Experimental data (T = 303 K)
Langmuir model (T = 303 K)
Experimental data (T = 313 K)
Langmuir model (T = 313 K)
Experimental data (T = 323 K)
Langmuir model (T = 323 K)

Master Thesis - Phosphate adsorption onto laterite and laterite waste from a leaching process
38
4.4.4. Thermodynamic Parameters
The values of the thermodynamic parameters for the adsorption process of phosphorus
on acidified laterite were determined applying the method described in section 3.4 for
the experimental data obtained from the four experiments –at four different
temperatures– carried out in section 4, although only the highest phosphorus
concentration (50 ppm) was considered for this study.
The results obtained from the van’t Hoff equation are shown in Figure 29 below:
Figure 29. Plot of ln(K0) vs (1/T) for estimation of thermodynamic parameters for P adsorption
on acidified laterite. Particle size: Φ < 75 µm; adsorbent dose = 1 g/L; pH = 7; C0 = 50 ppm.
The thermodynamic parameters were obtained from the slope and intercept of the
graph above and they are outlined in Table 13:
y = -667.02x + 3.7854 R² = 0.9955
1.52
1.54
1.56
1.58
1.6
1.62
1.64
1.66
1.68
1.7
1.72
1.74
0.00305 0.00310 0.00315 0.00320 0.00325 0.00330 0.00335 0.00340
ln (
K0)
1/T (K-1)

Master Thesis - Phosphate adsorption onto laterite and laterite waste from a leaching process
39
Table 13. Thermodynamic parameters for P adsorption on acidified laterite.
Particle size: Φ < 75 µm; adsorbent dose = 1 g/L; pH = 7; C0 = 50 ppm.
T (K) Thermodynamic parameters
(∆H0) (kJ/mol) (∆S
0) (J mol
-1 K
-1) (∆G
0) (kJ/mol)
298
5.545 -5.055
-3.836
303 -3.995
313 -4.285
323 -4.631
The positive value of the enthalpy change (∆H0) confirms that the adsorption of this
work is an endothermic reaction, as suggested in section 4.4.3, while the negative
value of the entropy change (∆S0) shows the decreasing randomness at the solid/liquid
interface during the sorption of phosphorus onto laterite. Finally, the negative value of
Gibbs free energy (∆G0) indicates the feasibility of the process and the spontaneous
nature of adsorption.

Master Thesis - Phosphate adsorption onto laterite and laterite waste from a leaching process
40
4.5. Effect of Adsorbent Dose
Some studies were made in order to see the influence of the adsorbent dosage in the
adsorption capacity of the laterite and the percentage of removal of phosphorus. These
experiments were made under the following conditions:
Temperature: T = 25 ºC (Room temperature).
Initial concentration of phosphorus [P]: C0 = 25 ppm.
Volume of the flasks: V = 100 mL.
Particle size of the adsorbent: Φ < 75 µm.
Mass of pH buffer (NaHCO3): 100 mg (Dose = 100 mg/L).
Initial pH: 7.0 (Constant due to the pH buffer).
Shaker: Gerhardt Bonn LS/RO500 type 655.
Time of reaction: 72 h.
Volume of the samples: 10 mL.
Once the samples were filtered, the concentration of phosphorus in the equilibrium
(Ce) of each one of them was calculated with equation (15) and later re-calculated
considering the dilution factor in order to obtain the real concentration.
Furthermore, for each one of the samples, the quantity of adsorbed phosphorus (qe)
was subsequently calculated with equation (2).
This procedure was followed for eight different adsorbent doses of “acidified” laterite,
as shown in Table 14 below:
Table 14. Adsorbent doses and mass of laterite used for the dose study.
Adsorbent dose (g/L) Mass of “acidified” laterite, m (mg)
1 100
2 200
3 300
4 400
5 500
6 600
7 700
8 800

Master Thesis - Phosphate adsorption onto laterite and laterite waste from a leaching process
41
The results from the experiments are outlined in Figures 30 and 31 below:
Figure 30. Effect of adsorbent dose on adsorption capacity of acidified laterite for P adsorption.
Particle size: Φ < 75 µm; C0 = 25 ppm; pH = 7.
Figure 31. Effect of adsorbent dose on percentage of removal of P on acidified laterite.
Particle size: Φ < 75 µm; C0 = 25 ppm; pH = 7.
2.4
2.6
2.8
3.0
3.2
3.4
0 1 2 3 4 5 6 7 8 9
qe (
mg
/g)
Adsorbent dose (g/L)
0
10
20
30
40
50
60
70
80
90
100
0 1 2 3 4 5 6 7 8 9
% r
em
ov
al
Adsorbent dose (g/L)

Master Thesis - Phosphate adsorption onto laterite and laterite waste from a leaching process
42
From Figure 30, it could be seen that adsorption capacity was found to increase
proportionally with an increase in the amount of laterite, with a maximum adsorption
capacity of approximately 3.18 mg/g for an adsorbent dosage of 6 g/L. Following
decrease in adsorption capacity is attributable to the splitting effect of the concentration
gradient between adsorbate and adsorbent, with increased laterite concentration
causing a decrease in amount of phosphorus adsorbed onto unit weight of laterite.
Regarding Figure 31, it is clear to see that the removal is more efficient for higher
adsorbent dose due to availability of more adsorption sites. It may be noted here that
for adsorbent dose of 8 g/L and feed concentration of 25 ppm of phosphorus, the final
concentration falls to a level of approximately 1 ppm -due to a percentage of removal of
98.9%-, which is very near to the EC UWWT Directive 100 µg P L-1 criteria highlighted
in section 2.2 regarding eutrophication in Northern Irish rivers. This may also explain
the decrease in adsorption capacity for high adsorbent dosages, since for these cases
there is not any phosphate left that can be adsorbed –the percentage of removal is
100%–, resulting in a lower adsorption capacity.

Master Thesis - Phosphate adsorption onto laterite and laterite waste from a leaching process
43
4.6. Effect of Initial pH
The pH of the aqueous solution is an important variable that influences the adsorption
of anions and cations at the solid-liquid interfaces. In order to observe the effect of pH
on adsorption of phosphorus, a series of experiments were carried out under the
following conditions:
Temperature: T = 25 ºC (Room temperature).
Initial concentration of phosphorus [P]: C0 = 10 ppm.
Volume of the flasks: V = 50 mL.
Mass of adsorbent (“acidified” laterite): m = 50 mg (Dose = 1 g/L).
Particle size of the adsorbent: Φ < 75 µm.
Mass of pH buffer (NaHCO3): 100 mg (Dose = 100 mg/L).
Shaker: Gerhardt Bonn LS/RO500 type 655.
Time of reaction: 72 h.
Volume of the samples: 10 mL.
Once the samples were filtered, the concentration of phosphorus in the equilibrium
(Ce) of each one of them was calculated with equation (15) and later re-calculated
considering the dilution factor in order to obtain the real concentration.
Furthermore, for each one of the samples, the quantity of adsorbed phosphorus (qe)
was subsequently calculated with equation (2).
This procedure was followed for fifteen different initial pH values (pH0) of the
phosphorus aqueous solution: 3.0, 3.5, 4.0, 4.5, 5.0, 5.5, 6.0, 6.5, 7.0, 7.5, 8.0, 8.5, 9.0,
9.5 and 10. The pH of every suspension was adjusted to desired value using HCl or
NaOH solutions as described in section 3.1 and kept constant due to the pH buffer,
while the pH value was measured with an Orion 3-Star™ Plus Portable pH Meter.
Figure 32. Orion 3-Star™ Plus Portable pH Meters.

Master Thesis - Phosphate adsorption onto laterite and laterite waste from a leaching process
44
The results of these experiments are outlined in Figure 33, which shows the adsorption
capacity of the acidified laterite versus the final pH (pHf) of the solution:
Figure 33. Effect of final pH on phosphorus adsorption onto acidified laterite.
Particle size: Φ < 75 µm; C0 = 10 ppm; pH = 7.
As seen in figure above, the process is clearly pH dependent, which indicates that
electrostatic interactions and chemisorption might be involved in the adsorption
mechanism of phosphorus on laterite.
The amount of phosphorus adsorbed on laterite was found to be nearly constant at low
pH values (below 5.0), with qe values between 3.46 mg/g and 3.68 mg/g. This can be
explained considering that for low pH values the surface of the laterite is surrounded by
high quantities of hydronium ions (H3O+), and therefore positively charged, which will
attract the negative charged phosphate ions. More specifically, in the pH range of 3-5
the predominant specie is the dihydrogen phosphate ion (H2PO4-), as can be observed
in Figure 34:
0.0
0.5
1.0
1.5
2.0
2.5
3.0
3.5
4.0
2.5 3.0 3.5 4.0 4.5 5.0 5.5 6.0 6.5 7.0 7.5 8.0 8.5
qe (
mg
/g)
pHf

Master Thesis - Phosphate adsorption onto laterite and laterite waste from a leaching process
45
Figure 34. Phosphoric acid speciation for a total phosphate concentration of 10 mM.
Source: Medusa Software (Royal Institute of Technology).
On the other hand, for high pH values the adsorption capacity of laterite decreases until
1.94 mg/g (at pH 8.0), which can be attributed to the competition between hydroxyl ions
(OH-) and phosphate ions for adsorption sites.
Another way to justify this change in the adsorption capacity from the pH region
between 5.0-5.5 is the point of zero charge (pzc) of the acidified laterite, which was
found to be approximately at pHpzc = 5.2, as seen in section 4.1. Therefore, at pH
values lower than pHpzc, laterite surface is positively charged, attracting more easily
anions such as phosphate, while above this value the surface is negatively charged,
repelling anions.

Master Thesis - Phosphate adsorption onto laterite and laterite waste from a leaching process
46
4.7. Column Studies
The last experiments of the project were some column studies, which are different from
the rest of the experiments previously done because they are based on dynamic
processes instead of batch processes. In these column studies three different flow
rates were tested. The rest of the conditions were as follows:
Temperature: T = 25 ºC (Room temperature).
Initial concentration of phosphorus [P]: C0 = 10 ppm.
Initial volume of influent: 900 mL.
Mass of pH buffer (NaHCO3): 100 mg (Dose = 100 mg/L).
Initial pH: 7.0 (constant due to the pH buffer).
Mass of adsorbent (“acidified” laterite): m = 6 g.
Particle size of the adsorbent: 500 µm < Φ < 600 µm.
Bed volume: BV = 9 mL.
Peristaltic pump: Watson-Marlow 503S.
Flow rates: Q1 = 2 mL/min; Q2 = 4 mL/min; Q3 = 6 mL/min.
Figure 35. Colum adsorption system.
Volume of the samples: 9 mL.
For each one of the samples, the concentration of phosphorus was detected with
ICP-AES. The colorimetric method was not applied in this case due to lack of time.

Master Thesis - Phosphate adsorption onto laterite and laterite waste from a leaching process
47
The breakthrough curves of phosphorus on acidified laterite for the different flow rates
are presented in Figure 36 below:
Figure 36. Breakthrough curve of phosphorus on acidified laterite column.
Particle size: 500 µm < Φ < 600 µm; C0 = 10 ppm; BV = 9 mL; pH = 7.
From the figure above it is clear to see that the shape of the breakthrough curves is not
very sharp, in contrast with which was expected from the theory. This may be attributed
to a preferential way of the fluent inside the column, and also due to a velocity profile
which makes the particles in the middle of the column get saturated before those ones
closer to the internal surface of the column.
On the other hand, the breakthrough point can be obtained from Figure 36 considering
the ratio Ct/C0 = 0.1, as outlined in table 15 below:
Table 15. Breakthrough point of laterite column to phosphorus.
Flow rate Q (mL/min) Bed volume at Ci/C0 = 0.1 Breakthrough time tb (min)
2 11.69 17.53
4 10.55 23.73
6 1.19 5.34
0
0.1
0.2
0.3
0.4
0.5
0.6
0.7
0.8
0.9
1
0 10 20 30 40 50 60 70
Ci/C
0
Bed volume
Q = 2 mL/min
Q = 4 mL/min
Q = 6 mL/min

Master Thesis - Phosphate adsorption onto laterite and laterite waste from a leaching process
48
In order to obtain the adsorption capacity of laterite column to phosphate, the following
model was applied:
0( )
e
b
t
et
t f t dt Q CX
m
(20)
Where:
X is the adsorption capacity of the column.
tb is the time of breakthrough point.
te is the time at exhaustion.
( )e
b
t
tf t dt is the area under the breakthrough curve.
It may be noted here that the time at exhaustion can only be considered for the highest
flow rate (Q3 = 6 mL/min), since it is the only case in which exhaustion was reached
with the obtained experimental data (see Figure 36). Therefore, the time at exhaustion
was considered as the time at BV = 58, in order to get a logical comparison between
the three flow rates, although the adsorption capacity for the highest flow rate can be
considered very similar to that one which would be obtained with the real value of
exhaustion time. The results of adsorption capacities are presented in Table 16 below:
Table 16. Adsorption capacities of laterite column to phosphorus.
Flow rate Q (mL/min) X (mg P / g laterite)
2 0.951
4 0.794
6 0.369
The highest adsorption capacity was obtained with the lowest flow rate, as expected
from Figure 36, since it graphically corresponds to the area above the breakthrough
curve. Nevertheless, it is necessary to point out that the results are much lower than
those obtained from the batch experiments. This is due to the fact that a true
equilibrium is never attained in this kind of dynamic processes, since the contact time
in column system is limited –it can be calculated as the residence time in the column–,
and it will always be lower than the time needed to reach true equilibrium, as showed in
section 4.3 (Adsorption Kinetics).

Master Thesis - Phosphate adsorption onto laterite and laterite waste from a leaching process
49
5. Result Comparison
5.1. Comparison with Other Materials
Some other isotherm studies were also carried out, but using synthetic iron oxides as
an adsorbent instead of laterite. These iron oxides possessing high surface area
(273.31 m2/g) were produced using Fe(NO3)3·9 H2O as the iron source, Pluronic P-123
(PEO20PPO70PEO20) as a surfactant and ammonium hydroxide as a precipitation agent.
The sample tested was produced as follow: 1 g of P-123 was dissolved in 100 mL of
Fe3+ solution respecting a molar ratio of 250 for Fe3+/P-123. The solution was steered
during 2 hours until a cleared solution was obtained. The pH was then slowly rose
using a 25% NH3OH solution and stirred further for 1 hour. The glass flask was closed
and the solution allowed to age at 60 °C for 16 hours. The precipitated was then filtered
and cleaned with deionised water to remove any excess of P-123 and dried at 60 °C.
The dried material was soaked in methanol at 60 °C and shacked overnight to remove
incorporated surfactant. Finally the powder produced was filter and dried at 60 °C.
Figure 37. Sample of synthetic iron oxides.
The rest of conditions were exactly the same as described in section 4.4.1. This was
made in order to see the efficiency of laterite compared to other materials commonly
used in adsorption processes, such as iron oxides.
The results obtained from these adsorption isotherm experiments are outlined in
Figures 38 and 39:

Master Thesis - Phosphate adsorption onto laterite and laterite waste from a leaching process
50
Figure 38. Phosphorus adsorption isotherm for synthetic iron oxides.
Particle size: Φ < 75 µm; temperature = 25 ºC; adsorbent dose = 1 g/L; pH = 7.
Figure 39. Percentage of removal of P for synthetic iron oxides.
Particle size: Φ < 75 µm; temperature = 25 ºC; adsorbent dose = 1 g/L; pH = 7.
0
5
10
15
20
25
30
0 5 10 15 20 25 30 35
qe (
mg
/g)
Ce (ppm)
0
10
20
30
40
50
60
70
80
90
100
0 5 10 15 20 25 30 35
% r
em
ov
al
P
Ce (ppm)

Master Thesis - Phosphate adsorption onto laterite and laterite waste from a leaching process
51
The results are clearly much better than those obtained with the acidified laterite, as
the maximum adsorption capacity is now approximately 24.21 mg/g, while in section
4.4.1 the value of this same parameter was 2.75 mg/g. Therefore, this new value is
almost 9 times the maximum adsorption capacity of acidified laterite. This change is
probably related to the surface area of the new material, which is also much higher
than that one from the acidified laterite.
A higher efficiency for P adsorption into iron oxide is also shown in Figure 39, as the
percentage of removal of phosphorus found with the lowest equilibrium concentration is
approximately 99%, in contrast with the 44% obtained with acidified laterite for the
same experimental conditions.
As done in section 4.4.2, the experimental data were fitted to both Freundlich and
Langmuir equations, in order to find a suitable model for the phosphorus adsorption
onto synthetic iron oxides. The estimated values of adsorption parameters obtained
from these models are shown in Table 17:
Table 17. Freundlich and Langmuir adsorption constants for P sorption on synthetic iron oxides.
Freundlich model Langmuir model
KF n R2 KL (L/mg) Q0 (mg/g) R
2
9.048 3.004 0.926 0.698 24.691 0.990
The experimental data fitted well the Freundlich and Langmuir equations, with
correlation coefficients ranging from 0.926 to 0.990 (~1). On the other hand, only the
Q0 value from the Langmuir model is reliable, as it is very similar to the maximum
adsorption capacity obtained with the experimental data (24.21 mg/g). Therefore, the
Langmuir model was applied in order to obtain a mathematical model for the adsorption
process. The equation that can be applied to the adsorption process of phosphate onto
synthetic iron oxides is based in the following equation:
17.241
1 0.698
ee
e
Cq
C
(21)
Finally, a graph with both experimental and Langmuir model data was made in order to
confirm the similarity between the experimental and the mathematical model, as shown
in Figure 40:

Master Thesis - Phosphate adsorption onto laterite and laterite waste from a leaching process
52
Figure 40. Comparison between experimental and Langmuir model data for P adsorption on
synthetic iron oxide (particle size: Φ < 75 µm). Temp. = 25 ºC; adsorbent dose = 1 g/L; pH = 7.
From the above figure, it can be concluded that the Langmuir model fits with the
experimental data in terms of shape, with only some deviations for the medium
concentration data within the working range. Even so, both models present more
differences between them than those in section 4.4.2 (model for acidified laterite), due
to a lower correlation coefficient (R2) in this last case.
0
5
10
15
20
25
30
0 10 20 30 40 50 60
qe (
mg
/g)
Ce (ppm)
Experimental data
Langmuir model

Master Thesis - Phosphate adsorption onto laterite and laterite waste from a leaching process
53
5.2. Comparison with Other Authors
In order to compare the efficiency of the acidified laterite with some other adsorbents
regarding phosphorus adsorption, a study based on the literature review about the
maximum adsorption capacity in different papers was done. The results of this study
are outlined in Table 18 below:
Table 18. Comparative table of maximum adsorption capacity qm for different studies.
Author(s) Adsorbent Particle size
Phosphorus
concentration
range (ppm)
qm (mg/g)
Zhang et al.
(2011)
Natural laterite
(Wuhan, China) 590 - 750 nm 0 - 25 1.07
Current study Acidified laterite
(Northern Ireland) < 75 µm 1 - 50 2.75
Li et al.
(2009)
Lanthanum
doped vesuvianite
(Yunnan, China)
- 0 - 4 6.70
Zeng et al.
(2003)
Iron oxide tailings
(Alberta, Canada)
68.6 µm
(average) 0 - 20 8.21
Xiong and
Mahmood (2010)
Peat
(Jilin, China) < 1 mm 0 - 120 8.91
Xu et al.
(2010)
Modified fly ash
(Eastern China) < 50 µm 0 - 20 9.15
Current study Synthetic iron oxides
(Northern Ireland) < 75 µm 1 - 50 24.21
Liu et al.
(2007)
Active red mud
(Shandong, China)
10 mesh
(2 mm) 1 - 2500 95.86
Özacar, M.
(2002)
Alunite
(Şaphane, Turkey) 90 - 150 µm 5 - 200 118
From the above table it can be concluded that the acidified laterite used in the current
study is clearly far from other adsorbents in terms of adsorption capacity, although it is
still better than natural laterite, as previously suggested in the Adsorption Kinetics (see
section 4.3). Even so, red mud and alunite can be considered the best adsorbents for
phosphorus, as their maximum adsorption capacity is more than 10 times higher than
those from the other studied adsorbents.

Master Thesis - Phosphate adsorption onto laterite and laterite waste from a leaching process
54
6. Conclusions and Perspectives
Based on results of this work, it can be concluded that the laterite is an interesting
option for removing phosphate from fresh or waste water, although it is clear that the
adsorption process has some limitations.
Modification of laterite by acid significantly enhances its phosphate immobilization
ability; although the time needed to reach equilibrium will be approximately 8 hours in
any case. The adsorption kinetics of phosphorus on acidified laterite can be well
described by a pseudo-second-order model.
The Langmuir isotherm was found to be the best mathematical model to describe the
adsorption isotherms of phosphorus removal onto acidified laterite. The adsorption
process can be considered favourable in terms of affinity of the adsorbent for the solute
within the working range of initial phosphorus concentration.
An increasing in the temperature of the process results in a higher adsorption capacity,
suggesting an endothermic process. This was confirmed by the determination of the
thermodynamic parameters, which also showed the spontaneous nature of adsorption.
High percentages of removal –close to 100%– can be reached with adsorbent dosages
above 8 g/L for an initial phosphorus concentration of 25 ppm, with final phosphorus
concentrations that satisfy the EC UWWT Directive in most of the cases.
Among the parameters studied, pH is proved to be the key variable for phosphate
uptake. The results show that the process is more effective in the highly acid pH region
–between pH 3 and 5–, due to a point of zero charge of the laterite near to pH 5. These
results also suggest that the phosphorus adsorptive process onto acidified laterite is
based on chemisorption and electrostatic interactions.
The column adsorption experiments suggest that phosphate in industrial wastewater
could be removed as efficiently as in batch experiments for sufficiently low flow rates.
This would simulate the conditions of batch experiments as long as the contact time
inside the column is similar to the one needed to reach a true equilibrium.
Finally, it is necessary to point out that regardless of its local availability; laterite is still
far from other adsorbents in terms of adsorption capacity. Therefore, it would be
interesting for future research to repeat similar experiments with other synthetic
adsorbents, such as iron oxides, which showed much higher adsorption capacity than
most of the adsorbents from literature.

Master Thesis - Phosphate adsorption onto laterite and laterite waste from a leaching process
55
7. References
Albadarin, A. B.; Mangwandi, C.; Al-Muhtaseb, A. H.; Walker, G. M.; Allen, S. J.;
Ahmad, M. N. M. Kinetic and thermodynamics of chromium ions adsorption onto
low-cost dolomite adsorbent. Chemical Engineering Journal 2012, 179, 193–202.
Al-Ghouti, M. A.; Li, J.; Salamh, Y.; Al-Laqtah, N.; Walker, G.; Ahmad, M. N. M.
Adsorption mechanisms of removing heavy metals and dyes from aqueous solution
using date pits solid adsorbent. Journal of Hazardous Materials 2010, 176, 510–520.
Awual, M. R.; Jyo, A.; Ihara, T.; Seko, N.; Tamada, M.; Lim, K. T. Enhanced trace
phosphate removal from water by zirconium(IV) loaded fibrous adsorbent. Water
Research 2011, 45, 4592–4600.
Demirbas, E.; Kobya, M.; Senturk, E.; Ozkan, T. Adsorption kinetics for the removal
of chromium(VI) from aqueous solutions on the activated carbons prepared from
agricultural wastes. Water S. A. 2004, 30, 533–540.
Gibbons, M. K.; Gagnon, G. A. Understanding removal of phosphate or arsenate
onto water treatment residual solids. Journal of Hazardous Materials 2011, 186,
1916–1923.
Huang, X.; Liao, X.; Shi, B. Adsorption removal of phosphate in industrial
wastewater by using metal-loaded skin split waste. Journal of Hazardous Materials
2009, 166, 1261–1265.
Karageorgiou, K.; Paschalis, M.; Anastassakis, G. N. Removal of phosphate species
from solution by adsorption onto calcite used as natural adsorbent. Journal of
Hazardous Materials 2007, 139, 447–452.
Li, H.; Ru, J.; Yin, W.; Liu, X.; Wang, J.; Zhang, W. Removal of phosphate from
polluted water by lanthanum doped vesuvianite. Journal of Hazardous Materials
2009, 168, 326–330.
Liu, H.; Sun, X.; Yin, C.; Hu, C. Removal of phosphate by mesoporous ZrO2. Journal
of Hazardous Materials 2008, 151, 616–622.
LIU, C.; LI, Y.; LUAN, Z.; CHEN, Z.; ZHANG, Z.; JIA, Z. Adsorption removal of
phosphate from aqueous solution by active red mud. Journal of Environmental
Sciences 2007, 19, 1166–1170.
Lu, S. G.; Bai, S. Q.; Zhu, L.; Shan, H. D. Removal mechanism of phosphate from
aqueous solution by fly ash. Journal of Hazardous Materials 2009, 161, 95–101.
Maiti, A.; Basu, J. K.; De, S. Experimental and kinetic modeling of As(V) and As(III)
adsorption on treated laterite using synthetic and contaminated groundwater: Effects
of phosphate, silicate and carbonate ions. Chemical Engineering Journal.

Master Thesis - Phosphate adsorption onto laterite and laterite waste from a leaching process
56
Maiti, A.; DasGupta, S.; Basu, J. K.; De, S. Adsorption of arsenite using natural
laterite as adsorbent. Separation and Purification Technology 2007, 55, 350–359.
Murphy, J.; Riley, J. P. A Single-Solution Method for the Determination of Soluble
Phosphate in Sea Water. Journal of the Marine Biological Association of the United
Kingdom 1958, 37, 9–14.
Özacar, M. Adsorption of phosphate from aqueous solution onto alunite.
Chemosphere 2003, 51, 321–327.
Salameh, Y.; Al-Lagtah, N.; Ahmad, M. N. M.; Allen, S. J.; Walker, G. M. Kinetic and
thermodynamic investigations on arsenic adsorption onto dolomitic sorbents.
Chemical Engineering Journal 2010, 160, 440–446.
Seida, Y.; Nakano, Y. Removal of phosphate by layered double hydroxides
containing iron. Water Research 2002, 36, 1306–1312.
Tian, S.; Jiang, P.; Ning, P.; Su, Y. Enhanced adsorption removal of phosphate from
water by mixed lanthanum/aluminum pillared montmorillonite. Chemical Engineering
Journal 2009, 151, 141–148.
Tsang, S.; Phu, F.; Baum, M. M.; Poskrebyshev, G. A. Determination of
phosphate/arsenate by a modified molybdenum blue method and reduction of
arsenate by S2O42−. Talanta 2007, 71, 1560–1568.
Wood, R.; McAtamney, C. Constructed wetlands for waste water treatment: the use
of laterite in the bed medium in phosphorus and heavy metal removal. Hydrobiologia
1996, 340, 323–331.
Xiong, J. B.; Mahmood, Q. Adsorptive removal of phosphate from aqueous media by
peat. Desalination 2010, 259, 59–64.
Xu, K.; Deng, T.; Liu, J.; Peng, W. Study on the phosphate removal from aqueous
solution using modified fly ash. Fuel 2010, 89, 3668–3674.
Zeng, L.; Li, X.; Liu, J. Adsorptive removal of phosphate from aqueous solutions
using iron oxide tailings. Water Research 2004, 38, 1318–1326.
Zhang, L.; Hong, S.; He, J.; Gan, F.; Ho, Y. Adsorption characteristic studies of
phosphorus onto laterite. Desalination and Water Treatment 2011, 25, 98–105.
ZHANG, B.; WU, D.; WANG, C.; HE, S.; ZHANG, Z.; KONG, H. Simultaneous
removal of ammonium and phosphate by zeolite synthesized from coal fly ash as
influenced by acid treatment. Journal of Environmental Sciences 2007, 19, 540–545.

Master Thesis - Phosphate adsorption onto laterite and laterite waste from a leaching process
57
Appendix A. Kinetics, Isotherms and Thermodynamics Data
Table A1. Comparison of the first- and second-order reaction constants for acidified laterite.
First-order kinetic model Second-order kinetic model
k1 (h-1
) qe R2 k2 (g mg
-1 h
-1) qe R
2
0.134 0.772 0.843 0.396 2.743 0.999
Table A2. Freundlich and Langmuir adsorption constants for P adsorption on acidified laterite.
Freundlich model Langmuir model
KF n R2 KL (L/mg) Q0 (mg/g) R
2
2.088 13.550 0.981 0.900 2.793 0.999
Table A3. RL values for P adsorption on acidified laterite.
C0 (ppm) RL value Nature of adsorption process
5 0.182 Favourable
10 0.100 Favourable
15 0.069 Favourable
20 0.053 Favourable
25 0.043 Favourable
30 0.036 Favourable
40 0.027 Favourable
50 0.022 Favourable
Table A4. Langmuir constants for P adsorption on acidified laterite at different temperatures.
T (K) Langmuir model
KL (L/mg) Q0 (mg/g) R2
298 0.900 2.793 0.999
303 0.749 2.910 0.999
313 0.552 3.109 0.999
323 0.500 3.367 0.999

Master Thesis - Phosphate adsorption onto laterite and laterite waste from a leaching process
58
Table A5. Thermodynamic parameters for P adsorption on acidified laterite.
Particle size: Φ < 75 µm; adsorbent dose = 1 g/L; pH = 7; C0 = 50 ppm.
T (K) Thermodynamic parameters
(∆H0) (kJ/mol) (∆S
0) (J mol
-1 K
-1) (∆G
0) (kJ/mol)
298
5.545 -5.055
-3.836
303 -3.995
313 -4.285
323 -4.631
Table A6. Freundlich and Langmuir adsorption constants for P sorption on synthetic iron oxides.
Freundlich model Langmuir model
KF n R2 KL (L/mg) Q0 (mg/g) R
2
9.048 3.004 0.926 0.698 24.691 0.990

Master Thesis - Phosphate adsorption onto laterite and laterite waste from a leaching process
Appendix B. COSHH Risk Assessment
QUEEN’S UNIVERSITY BELFAST
COSHH RISK ASSESSMENT Title: “Phosphates removal using laterite and modified laterite” Student: Martín Mendez Pasarín Supervisor: Dr Gavin Walker
Phase 1: Phosphate removal using laterite
1. What is the process/work activity and where will you be carrying it out? Project All experiments will be carried out in laboratory OG-410; QUESTOR furnace in OG-009 will be used. The aim of the research is to study the removal capacity of laterite and modified laterite toward phosphate. A calibrate with the colorimetric method for phosphates determination will be carried out. Adsorption experiments planned include: isotherms, kinetics, pH studies and columns studies. Laterite charred at different temperatures will be used; different particles sizes will also be tested. Chemical used
- The chemical used during experiments are:
o Potassium dihydrogen phosphate o Ascorbic acid o Ammonium molybdate o Potassium antimonyl tartrate o Sulfuric acid o Nitric acid o Hydrochloric acid o Sodium hydroxide o Potassium hydroxyde o Deionized water
- Raw materials: o Laterite (Aluminium, iron and silica oxides minerals)
- The physical process used are:
o Heating with: heating stirrers, mantle, water bath, oven, furnace o Washing and separation with: deionised water, centrifuge o Drying with: oven, vacuum drying
Phosphates measurement Phosphate will be measured using the Hach spectrophotometer (Method called “Modified molybdenum blue”). Calibration curves will be compared with ICP-AES measure from laboratory OG-201.
Specific hazard: Reagents from the “Modified molybdenum blue” All synthesis reactions will be carried out under a fume cupboard equipped.

Master Thesis - Phosphate adsorption onto laterite and laterite waste from a leaching process
- 2 - 2. What hazardous substances will you be using?
Name of Substance(s) used
Hazard Classification*
Nature of health hazard and
route of entry into body OEL (mg/m
3)
1 2 3 4 5 6 7 8
I. Potassium dihydrogen phosphate (KH2PO4)
X X May cause irritation to skin, eyes and respiratory system. TWA: n/a STEL: n/a
II. Ascorbic acid (C6H8O6) X X X Slightly hazardous in case of skin contact (irritant), of eye contact (irritant), of ingestion, of inhalation. TWA: n/a STEL: n/a
III. Ammonium molybdate ((NH4)6Mo7O24·4H2O)
X X X Corrosive. May be harmful if inhaled. May be harmful or fatal if swallowed. Causes severe burns to eyes and skin.
TWA: 5 mg.m-3
STEL: 20 mg.m
-3
IV. Potassium antimonyl tartrate (C4H4O7SbK)
X X X X Harmful if inhaled or swallowed. Toxic to aquatic organisms, may cause long-term adverse effects in the aquatic environment. May cause liver damage.
TWA: 0.5 mg.m-3
STEL: n/a
V. Sulfuric acid (H2SO4) X X X X Causes severe skin burns. Causes severe eye burns. Causes burns of the mouth, throat, and stomach. TWA: 1 mg.m
-3
STEL: n/a
VI. Nitric acid (HNO3) X X X Strong oxidizer. Contact with other material may cause fire. Corrosive. Liquid and mist cause severe burns to all body tissue. May be fatal if swallowed or inhaled. Inhalation may cause lung and tooth damage.
TWA: 5.2 mg.m-3
STEL: 10 mg.m
-3
VII. Hydrochloric acid (HCl) X X X Corrosive. Liquid and mist cause severe burns to all body tissue. May be fatal if swallowed or inhaled. TWA: 2 mg.m
-3
STEL: 8 mg.m-3
VIII. Sodium hydroxide (NaOH) X X X Corrosive. Liquid and mist cause severe burns to all body tissue. May be fatal if swallowed or inhaled. TWA: 2 mg.m
-3
STEL: 10 mg.m-3
IX. Potassium hydroxide (KOH) X X Corrosive. May cause serious burns. Harmful by ingestion, inhalation and in contact with skin. If the solid or solution comes into contact with the eyes, serious eye damage may result.
TWA: n/a STEL: 2 mg.m
-3
X. Deionized water
* 1. Very Toxic 2. Toxic 3. Harmful 4. Corrosive 5. Irritant 6. Respiratory Sensitiser
7. Carcinogen, mutagen or teratogen (agent toxic to reproduction) 8. Micro-organism/Biological Agent
STEL: Short Term Exposure Limit (15 min) TWA: Time weighted average (over 8 hours)

Master Thesis - Phosphate adsorption onto laterite and laterite waste from a leaching process
- 3 - 3. How long will the process/work activity last? What will the exposure pattern be? Phosphate measurement method time is in the order of minutes. Kinetics adsorption studies are in the order of hours. 4. Can you prevent exposure to the hazardous substances? By doing any of the following?: (a) using a different process; or (b) using alternative substances; or (c) using different forms of the same substance If YES, to any of the above repeat Sections 1 – 4 again and proceed to Section 5. If NO, continue into next section. 5. Which precautionary measures will you be using for the work process/activity? (Tick as appropriate)
X
Total Partial LEV Dilution PPE Other Containment Containment Ventilation (please state) 6. Which type of personal protective equipment will you be using? (if required)
X X
Respiratory Face Eye Hand Foot Other (Aprons etc) (please state) 7. Who is likely to be exposed to the hazardous substances that you will be working with?
Me and potentially other workers at the laboratory OG-410 and OG-009.

Master Thesis - Phosphate adsorption onto laterite and laterite waste from a leaching process
- 4 - 8. Is a “permit-to-work” required to prevent exposure to others? NO 9. Is air monitoring required? NO 10. Is health surveillance required? NO 11. What are the procedures for dealing with unplanned releases and spillages? I. Ventilate area of leak or spill. Wear appropriate personal protective equipment. Vacuum or sweep up. Vacuuming or wet sweeping materials should avoid dust dispersal and be disposed as hazardous material. II - III. Use appropriate tools to put the spilled solid in a convenient waste disposal container. Finish cleaning by spreading water on the contaminated surface. IV. Dilute with water and mop up, or absorb with an inert dry material and place in an appropriate waste disposal container. Finish cleaning by spreading water on the contaminated surface. V - X. Neutralize material (with soda ash or lime or acid), then absorb with an inert material (vermiculite, dry sand, earth). Ventilate area of leak or spill. Place in a chemical waste container the adsorbent materials. Do not get water on spilled substances or inside containers. Use appropriate personal protective equipment. 12. What are the procedures for disposing of the hazardous substances? I. Residual water from experiments can be evacuated by the sink when low phosphate concentration is present. High concentrated solution can be treated by precipitation and disposal of the solid part into the laboratory bin. II - IV. Waste should be collected in a suitable lidded waste container clearly labelled as Toxic, Irritant and/or corrosive. It has to be disposed of using the Scholl Waste Chemical Disposal Procedure. V - X. Solution having a low concentration of acid or base can be evacuated into the sink. Concentrated solution can be neutralize with opposite. 13. What training is required for the work process/activity?
- No training required. * (delete as appropriate)

Master Thesis - Phosphate adsorption onto laterite and laterite waste from a leaching process
- 5 - 14. Conclusions It is considered that the quantities, rates and manner of use of the substances detailed in this risk assessment, do not constitute any significant risk to health when the control measures indicated:
- are working
- are maintained in good working order
- and are used in accordance with training given
Signed: Project Worker ________________________ Date ______________ ________________________ ______________ ________________________ ______________ ________________________ ______________ ________________________ ______________ ________________________ ______________ ________________________ ______________ ________________________ ______________ ________________________ ______________ ________________________ ______________ ________________________ ______________ Signed: Project Supervisor ______________________ Date ______________ Signed: COSHH Supervisor _____________________ Date ______________ Review Date ______________ September 2011