Contact angles and external protein adsorption onto UF membranes
13
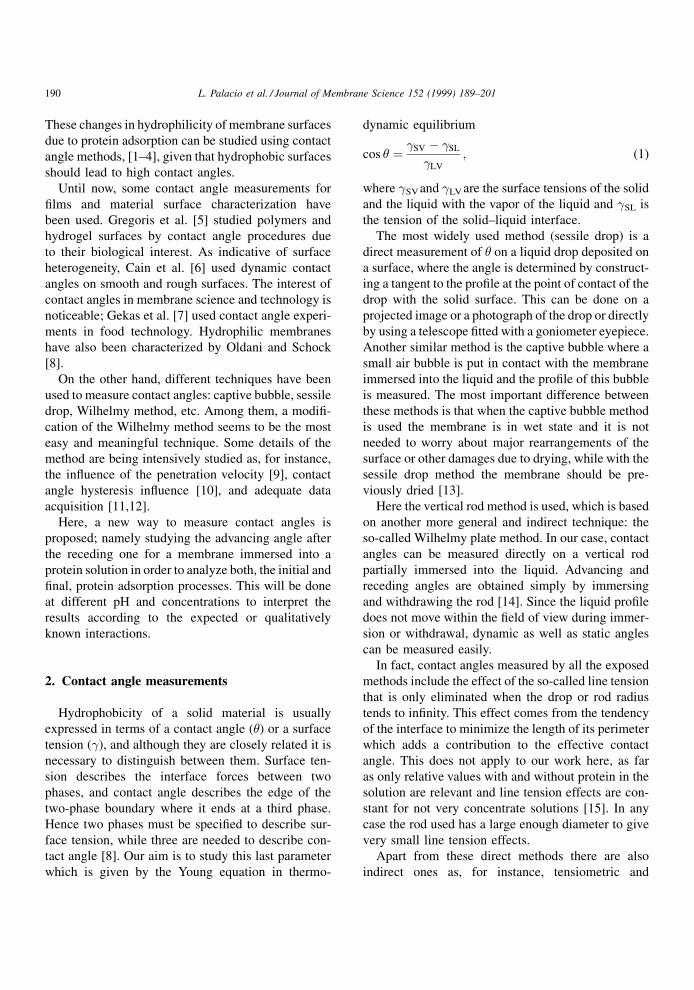
Contact angles and external protein adsorption onto UF membranes L. Palacio a,* , J.I. Calvo a , P. Pra ´danos a , A. Herna ´ndez a , P. Va ¨isa ¨nen b , M. Nystro ¨m b a Dept. Termodina ´mica y Fı ´sica Aplicada, Fac. Ciencias, Univ. Valladolid, 47071 Valladolid, Spain b Laboratory of Technical Polymer Chemistry, Lappeenranta University of Technology, PO Box 20, 53851 Lappeenranta, Finland Received 17 April 1998; received in revised form 3 June 1998; accepted 2 July 1998 Abstract Both receding and advancing contact angles of pure water and BSA solutions against the active layers of several retentive ultrafiltration membranes are studied here. In particular, three membranes from desalination systems, whose active layers are made of aromatic polyamides: G5, G20 and G50 have been chosen. It has been shown that these membranes are hydrophilic with equal advancing contact angles against pure water while the receding ones decrease with increasing pore radii. Finally, both the contact angles against the BSA solutions are studied at different pH and concentrations. It is shown that the stationary advancing contact angles correspond to the early adsorption steps while receding ones correspond to the final adsorption level. When analyzed within this frame, the results obtained can easily be explained in terms of the qualitatively known molecule–molecule and molecule–membrane surface interactions. # 1999 Elsevier Science B.V. All rights reserved. Keywords: Contact angles; Protein adsorption; Surface roughness; Pore size; Ultrafiltration membranes 1. Introduction In membrane technology, a problem usually encountered is the fouling of the membranes. The nature of the forces or interactions causing solute deposition and eventual fouling is discussed in litera- ture. In any case it is undoubtful that solute deposition can be caused by chemical binding, hydrophobicity of the membrane, electrostatic attraction or short range forces as Van der Waals forces, etc. The extent to which these forces are present depends on both the particles in solution and the membrane material. Deposition should depend, for instance, on solution pH and ionic strength because the solute molecules should change their charged state as a consequence of modifications in their solution environment. The aim of this work is to study adsorption of bovine serum albumin (BSA) on UF membranes by investigating how surface properties of membranes and proteins affect adsorption. Electrical and chemical properties of the membranes have also been studied previously, as well as porosity, in order to understand this interaction and to have as complete as possible a characterization of the membranes. During the adsorption of external particles on the membrane surface, the hydrophilicity of the porous material increases if the adsorbed molecules are more hydrophilic than the material or decrease otherwise. Journal of Membrane Science 152 (1999) 189–201 *Corresponding author. Tel.: +34-83-423013; fax: +34-83- 423134. 0376-7388/99/$ – see front matter # 1999 Elsevier Science B.V. All rights reserved. PII: S0376-7388(98)00203-8
Transcript of Contact angles and external protein adsorption onto UF membranes
Contact angles and external protein adsorption onto UF membranes
L. Palacioa,*, J.I. Calvoa, P. PraÂdanosa, A. HernaÂndeza, P. VaÈisaÈnenb, M. NystroÈmb
aDept. TermodinaÂmica y FõÂsica Aplicada, Fac. Ciencias, Univ. Valladolid, 47071 Valladolid, SpainbLaboratory of Technical Polymer Chemistry, Lappeenranta University of Technology, PO Box 20, 53851 Lappeenranta, Finland
Received 17 April 1998; received in revised form 3 June 1998; accepted 2 July 1998
Abstract
Both receding and advancing contact angles of pure water and BSA solutions against the active layers of several retentive
ultra®ltration membranes are studied here. In particular, three membranes from desalination systems, whose active layers are
made of aromatic polyamides: G5, G20 and G50 have been chosen.
It has been shown that these membranes are hydrophilic with equal advancing contact angles against pure water while the
receding ones decrease with increasing pore radii.
Finally, both the contact angles against the BSA solutions are studied at different pH and concentrations. It is shown that the
stationary advancing contact angles correspond to the early adsorption steps while receding ones correspond to the ®nal
adsorption level. When analyzed within this frame, the results obtained can easily be explained in terms of the qualitatively
known molecule±molecule and molecule±membrane surface interactions. # 1999 Elsevier Science B.V. All rights reserved.
Keywords: Contact angles; Protein adsorption; Surface roughness; Pore size; Ultra®ltration membranes
1. Introduction
In membrane technology, a problem usually
encountered is the fouling of the membranes. The
nature of the forces or interactions causing solute
deposition and eventual fouling is discussed in litera-
ture. In any case it is undoubtful that solute deposition
can be caused by chemical binding, hydrophobicity of
the membrane, electrostatic attraction or short range
forces as Van der Waals forces, etc. The extent to
which these forces are present depends on both the
particles in solution and the membrane material.
Deposition should depend, for instance, on solution
pH and ionic strength because the solute molecules
should change their charged state as a consequence of
modi®cations in their solution environment.
The aim of this work is to study adsorption of
bovine serum albumin (BSA) on UF membranes by
investigating how surface properties of membranes
and proteins affect adsorption. Electrical and chemical
properties of the membranes have also been studied
previously, as well as porosity, in order to understand
this interaction and to have as complete as possible a
characterization of the membranes.
During the adsorption of external particles on the
membrane surface, the hydrophilicity of the porous
material increases if the adsorbed molecules are more
hydrophilic than the material or decrease otherwise.
Journal of Membrane Science 152 (1999) 189±201
*Corresponding author. Tel.: +34-83-423013; fax: +34-83-
423134.
0376-7388/99/$ ± see front matter # 1999 Elsevier Science B.V. All rights reserved.
P I I : S 0 3 7 6 - 7 3 8 8 ( 9 8 ) 0 0 2 0 3 - 8
These changes in hydrophilicity of membrane surfaces
due to protein adsorption can be studied using contact
angle methods, [1±4], given that hydrophobic surfaces
should lead to high contact angles.
Until now, some contact angle measurements for
®lms and material surface characterization have
been used. Gregoris et al. [5] studied polymers and
hydrogel surfaces by contact angle procedures due
to their biological interest. As indicative of surface
heterogeneity, Cain et al. [6] used dynamic contact
angles on smooth and rough surfaces. The interest of
contact angles in membrane science and technology is
noticeable; Gekas et al. [7] used contact angle experi-
ments in food technology. Hydrophilic membranes
have also been characterized by Oldani and Schock
[8].
On the other hand, different techniques have been
used to measure contact angles: captive bubble, sessile
drop, Wilhelmy method, etc. Among them, a modi®-
cation of the Wilhelmy method seems to be the most
easy and meaningful technique. Some details of the
method are being intensively studied as, for instance,
the in¯uence of the penetration velocity [9], contact
angle hysteresis in¯uence [10], and adequate data
acquisition [11,12].
Here, a new way to measure contact angles is
proposed; namely studying the advancing angle after
the receding one for a membrane immersed into a
protein solution in order to analyze both, the initial and
®nal, protein adsorption processes. This will be done
at different pH and concentrations to interpret the
results according to the expected or qualitatively
known interactions.
2. Contact angle measurements
Hydrophobicity of a solid material is usually
expressed in terms of a contact angle (�) or a surface
tension ( ), and although they are closely related it is
necessary to distinguish between them. Surface ten-
sion describes the interface forces between two
phases, and contact angle describes the edge of the
two-phase boundary where it ends at a third phase.
Hence two phases must be speci®ed to describe sur-
face tension, while three are needed to describe con-
tact angle [8]. Our aim is to study this last parameter
which is given by the Young equation in thermo-
dynamic equilibrium
cos � � SV ÿ SL
LV
; (1)
where SV and LV are the surface tensions of the solid
and the liquid with the vapor of the liquid and SL is
the tension of the solid±liquid interface.
The most widely used method (sessile drop) is a
direct measurement of � on a liquid drop deposited on
a surface, where the angle is determined by construct-
ing a tangent to the pro®le at the point of contact of the
drop with the solid surface. This can be done on a
projected image or a photograph of the drop or directly
by using a telescope ®tted with a goniometer eyepiece.
Another similar method is the captive bubble where a
small air bubble is put in contact with the membrane
immersed into the liquid and the pro®le of this bubble
is measured. The most important difference between
these methods is that when the captive bubble method
is used the membrane is in wet state and it is not
needed to worry about major rearrangements of the
surface or other damages due to drying, while with the
sessile drop method the membrane should be pre-
viously dried [13].
Here the vertical rod method is used, which is based
on another more general and indirect technique: the
so-called Wilhelmy plate method. In our case, contact
angles can be measured directly on a vertical rod
partially immersed into the liquid. Advancing and
receding angles are obtained simply by immersing
and withdrawing the rod [14]. Since the liquid pro®le
does not move within the ®eld of view during immer-
sion or withdrawal, dynamic as well as static angles
can be measured easily.
In fact, contact angles measured by all the exposed
methods include the effect of the so-called line tension
that is only eliminated when the drop or rod radius
tends to in®nity. This effect comes from the tendency
of the interface to minimize the length of its perimeter
which adds a contribution to the effective contact
angle. This does not apply to our work here, as far
as only relative values with and without protein in the
solution are relevant and line tension effects are con-
stant for not very concentrate solutions [15]. In any
case the rod used has a large enough diameter to give
very small line tension effects.
Apart from these direct methods there are also
indirect ones as, for instance, tensiometric and
190 L. Palacio et al. / Journal of Membrane Science 152 (1999) 189±201

capillary methods [14]. Other methods can also be
found in the bibliography [13,14,16±19].
With all these techniques, advancing and receding
angles can be obtained as shown in Fig. 1. The
difference in both angles is called contact angle
hysteresis. Hysteresis depends on the conformation
changes of the membrane and also on surface rough-
ness. It should be taken into account that a wet
membrane behaves differently than a dry one.
3. Other characterization techniques
Several other characterization methods have been
used to complement the contact angle technique. They
help to characterize the membrane structure as well as
to characterize the colloidal behavior of BSA solu-
tions.
Pore size distribution can be obtained from ®ltra-
tion experiments of macromolecules whose size dis-
tribution is assumed as well-known. Flux and retention
are studied in tangentially ®ltered for several trans-
membrane pressures and recirculation velocities.
Results are analyzed with the ®lm theory for the
concentration polarization phenomenon, obtaining
the mass transfer coef®cient along with the true
retention coef®cient as a function of the feed circula-
tion velocity and the molecular weight of the solute.
The resulting standard retention curves can be
expressed in terms of molecular size and treated to
obtain the effective pore size distribution of the mem-
brane, [20,21].
Porosity can be obtained from a method developed
recently [22]. In this method an inert gas penetrates the
void volume of the membrane in controlled tempera-
ture under different applied low pressures. The mass
versus pressure dependence ®ts the ideal gas one,
which after an adequate calibration allows the bulk
porosity of the sample to be obtained.
The surface structural characteristics of the mem-
branes, especially roughness, can be analyzed by
using atomic force microscopy. Atomic force micro-
scopy (AFM) sometimes called sweeping probe
microscopy (SPM) can detect topography by using
contact, non-contact or tapping modes [23±25]. The
last one which will be used here is a variation of the
contact mode where a stiff cantilever is oscillated at its
resonant frequency with high amplitudes allowing it to
touch the sample during the oscillations; highly sen-
sible photodiodes allow to detect amplitude variations
by the corresponding de¯ections of a laser beam. The
relative height of the sample allows to de®ne an
average roughness as
Ra � 1
n
Xn
i�0
jzi ÿ smj; (4)
where n is the total number of points where height, zi,
is measured and zm is the mean height.
It is well known that streaming potential follows the
sign of charges or potentials at the shear surface [17].
Thus, in order to take into account electrical properties
of the membrane surfaces, we will here analyze the
streaming potential versus pH behavior. In effect, the
streaming potential can be measured easily as
�p � �V
�p
� �I�0
; (5)
where �V is the electric potential appearing when a
transmembrane pressure �p is applied at zero electric
conduction.
Finally, the colloidal properties of macromolecular
solutes can be studied in terms of zeta potential, i.e.
the electric potential appearing at the shear surface
surrounding the macromolecules. This potential gives
a mobility in response to an externally applied elec-
trical ®eld. This electrophoretic mobility can be mea-
sured by analyzing the dispersion of a laser beam, and
it can be subsequently transformed to zeta potentials
according to the appropriate theory [26].
Fig. 1. Scheme of the contact angle measurement in a gas±liquid±
solid interface.
L. Palacio et al. / Journal of Membrane Science 152 (1999) 189±201 191

4. Experimental
4.1. Membranes and chemicals
Three different composite membranes made by
Desalination Sys. have been used. They consist of
an aromatic polyamide active layer on a polysulfone
support. The membranes are named: G5, G20 and
G50, and their nominal molecular weight cut-offs
(MWCO) are 2000, 3500 and 15 000 g/mol, corre-
sponding to diameters of 2.82, 3.46 and 7.75 nm,
respectively [27,28].
Bovine serum albumin (BSA) has been used to foul
the membranes. It has been obtained from Sigma
Chemical. Some properties of BSA relevant for our
study are:
1. Molar mass: 66 700 g/mol [29].
2. Isoelectric point: values from 4.7 to 4.9 are given in
the literature [30] while a value of 4.8 has been
obtained by us from measurements of electro-
phoretic mobilities.
3. Size: several even somehow divergent dimensions
are reported for BSA. Nevertheless, the results of
Peters [29], obtained from many independent tech-
niques, give 4.16�4.16�14.09 (nm) for a BSA
molecule in water, while Nakatsuka and Michaels
[31] give a gyration radius of 3.64 nm.
The water used was Millipore RO treated with a
conductivity less than 1 mS cmÿ1. For contact angle
experiments, the pH was controlled by adding small
amounts of HCl and KOH of pa grade. The BSA
concentrations used were 0.001, 0.005, 0.01 and
0.05 g/l while the pH values were 3, 5 and 8.
Retention experiments were done with aqueous solu-
tions (0.1%, w/w) of polyethylene glycols (PEG) whose
molar masses were 300, 600, 1000, 2000, 3000, 4000,
6000, 10 000 and 12 000 g/mol at neutral pH.
Finally the streaming potential was measured with
KCl solutions at 1�10ÿ3 mol/l, being pH set also by
small addition of HCl or KOH. While solution zeta
potentials have been measured for BSA solutions of
5 g/l with 0.01 mol/l of NaCl and controlled additions
of HCl or NaOH.
4.2. Experimental devices
The contact angles between the liquid phase, air and
the membrane surfaces were measured at the Labora-
tory of Technical Polymer Chemistry in Lappeenranta
by using a thick rod with a diameter of 2 cm [32]. The
set-up for the measurements is pictured in Fig. 2. The
movement of the rod was controlled to give a constant
speed of 1 mm/min. The equipment was attached to a
video camera provided with magnifying optics so that
Fig. 2. Scheme of the contact angle device. (1) TV monitor, (2) video recorder, (3) video camera, (4) cast rod immersed into the liquid phase,
(5) motor attached to lifting shrew, (6) control board for lifting speed regulation and (7) light source.
192 L. Palacio et al. / Journal of Membrane Science 152 (1999) 189±201
the contact angle change with time could be measured
dynamically. It is worth mentioning that the rod was
covered by the membrane leaving the active surface
free to interact with the liquid phase in the reservoir.
The membrane was not allowed to roll up completely
in order to avoid capillary effects, as shown in Fig. 2.
All membranes were previously cleaned with pure
water in an ultrasound bath. Afterwards they were kept
immersed in pure water until receding and advancing
processes started, ®rstly with pure water and ®nally
with each BSA solution. The measurement process
has been designed in such a way that just when the
protein solution enters the measurement vessel the rod
starts to be extracted thus obtaining receding angles. In
this way the contact time of protein molecules and
membrane surface increases until the advancing pro-
cess starts. Now, when the rod is advancing, contact
angles are measured for membrane surfaces that have
been in contact with the protein for decreasing times.
The pore size distributions were obtained from
experiments performed at the Group of Membrane
Science and Technology in Valladolid in isothermal
conditions at 298 K with pressures up to 7 bar and
recirculation velocities from 0.02 to 4.6 m/s, by using
a ¯at membrane tangential ultra®ltration device that
has been described elsewhere [33]. The membrane cell
used for retention experiments was a Minitan-S mani-
fold from Millipore made of methacrylate. On the
membrane, there are nine ducts of rectangular section
0.40 mm�7.0 mm and a length of L�55.0 mm. The
resulting channel hydraulic diameter is dh�0.76 mm,
giving an effective membrane area of 36.8 cm2 and a
channel section of 2.8 mm2.
The permeate ¯ux through the membrane is mea-
sured by timing and weighting with a high precision
balance with errors lower than �1�10ÿ7 kg. The
retentate and permeate concentrations have been mea-
sured by an adequately calibrated differential refracto-
meter.
The streaming potentials were measured at the
Laboratory of Technical Polymer Chemistry in Lap-
peenranta by using a ¯at-sheet cross-¯ow ®ltration
module equipped with a set of Ag/AgCl electrodes,
which could measure the streaming potential across
the pores of the membrane [34]. Pressure (0±1 bar) and
temperature (298 K) were measured with appropriate
sensors. Temperature was measured at four different
points along the feed circuit. Concentrate was circu-
lated through a magnetic pump. Concentration was
measured by a calibrated conductivity meter placed at
the concentrate entrance of the ¯ow cell; while pH was
measured with a pH-meter at the thermostated feed
vessel. The permeate was weighted in a balance. All
the measurements were programmed to be performed
at constant time intervals (4 min) and the measure-
ment signal was ampli®ed and converted to binary
code with an analog to digital converter and processed
by a computer.
Referring to solution zeta potentials they have been
measured at the Group of Membrane Science and
Technology in Valladolid by using a Zetamaster from
Malvern. Atomic Force Microscopy has been done at
the same laboratory by using tapping mode with a
Nanoscope IIIA from Digital Inst. The tips were
etched silicon pyramids TESP. Finally gas penetration
volumetry was conducted by using an Omnisorp
100CX from Coulter and with He as penetrating
gas by the Group of Membrane Science and Technol-
ogy in Valladolid [22].
5. Results
According to the gas penetration method, the por-
osities of the membranes studied are (in %): 55.1�0.5
for G5, 46.2�0.6 for G20 and 55.6�0.7 for G50 [35].
An AFM three-dimensional picture of the active
layer of the G50 membrane is shown in Fig. 3. As can
be seen roughness is quite signi®cative giving Ra
values of 7.67 nm for G5, 10.79 nm for G20 and
12.93 nm for G50.
The streaming potentials versus pH of the mem-
branes used are shown in Fig. 4. It can be seen that
negative streaming potentials are obtained through all
the pH range. This shows that the membranes do not
present an isoelectric point in contact with KCl, but
rather they are always negatively charged. Given that
Clÿ anions are known to adsorb easily on all poly-
meric materials; most of the charge responsible for the
streaming potential sign should come from this
adsorption process. The measured zeta potential for
BSA is shown against pH in Fig. 5.
Retention experiments with PEGs can be inter-
preted in terms of sizes by taking into account that
the mean gyration radius of a molecule of PEG is
given as a function of its molecular weight in terms of
L. Palacio et al. / Journal of Membrane Science 152 (1999) 189±201 193

Fig. 3. AFM picture of the active layer of the G50 membrane.
Fig. 4. Streaming potential as a function of pH for the three
membranes studied. Fig. 5. Zeta potential of BSA versus pH.
194 L. Palacio et al. / Journal of Membrane Science 152 (1999) 189±201
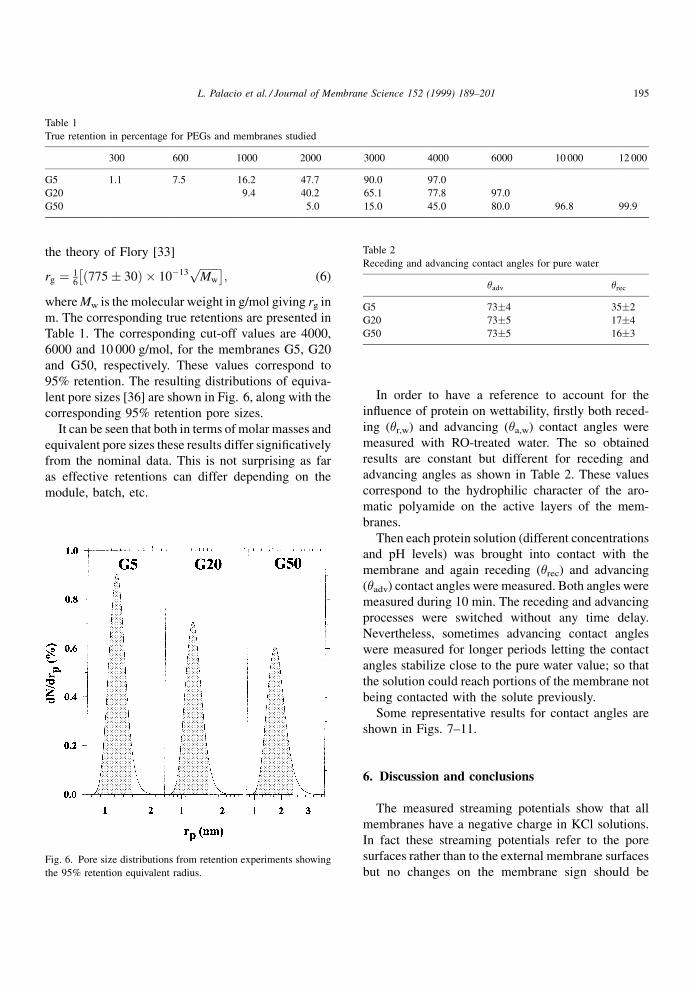
the theory of Flory [33]
rg � 16�775� 30� � 10ÿ13
�������Mw
p� �; (6)
where Mw is the molecular weight in g/mol giving rg in
m. The corresponding true retentions are presented in
Table 1. The corresponding cut-off values are 4000,
6000 and 10 000 g/mol, for the membranes G5, G20
and G50, respectively. These values correspond to
95% retention. The resulting distributions of equiva-
lent pore sizes [36] are shown in Fig. 6, along with the
corresponding 95% retention pore sizes.
It can be seen that both in terms of molar masses and
equivalent pore sizes these results differ signi®catively
from the nominal data. This is not surprising as far
as effective retentions can differ depending on the
module, batch, etc.
In order to have a reference to account for the
in¯uence of protein on wettability, ®rstly both reced-
ing (�r,w) and advancing (�a,w) contact angles were
measured with RO-treated water. The so obtained
results are constant but different for receding and
advancing angles as shown in Table 2. These values
correspond to the hydrophilic character of the aro-
matic polyamide on the active layers of the mem-
branes.
Then each protein solution (different concentrations
and pH levels) was brought into contact with the
membrane and again receding (�rec) and advancing
(�adv) contact angles were measured. Both angles were
measured during 10 min. The receding and advancing
processes were switched without any time delay.
Nevertheless, sometimes advancing contact angles
were measured for longer periods letting the contact
angles stabilize close to the pure water value; so that
the solution could reach portions of the membrane not
being contacted with the solute previously.
Some representative results for contact angles are
shown in Figs. 7±11.
6. Discussion and conclusions
The measured streaming potentials show that all
membranes have a negative charge in KCl solutions.
In fact these streaming potentials refer to the pore
surfaces rather than to the external membrane surfaces
but no changes on the membrane sign should be
Table 1
True retention in percentage for PEGs and membranes studied
300 600 1000 2000 3000 4000 6000 10 000 12 000
G5 1.1 7.5 16.2 47.7 90.0 97.0
G20 9.4 40.2 65.1 77.8 97.0
G50 5.0 15.0 45.0 80.0 96.8 99.9
Fig. 6. Pore size distributions from retention experiments showing
the 95% retention equivalent radius.
Table 2
Receding and advancing contact angles for pure water
�adv �rec
G5 73�4 35�2
G20 73�5 17�4
G50 73�5 16�3
L. Palacio et al. / Journal of Membrane Science 152 (1999) 189±201 195

expected from inner to outer surfaces of the same
material.
It is known that protein is positively charged for pH
below the isoelectric point (IEP) while it is negatively
charged for pH over the IEP. It is worth noting that the
protein zeta potential measurements were done with
BSA solutions of 5 g/l with 0.01 mol/l of NaCl as
mentioned. In fact, the contact angles have been
Fig. 7. Receding and advancing contact angles for membrane G50
and pH 3.
Fig. 8. Receding and advancing contact angles for membrane G50
and pH 5.
Fig. 9. Receding and advancing contact angles for membrane G50
and pH 8.
Fig. 10. Receding and advancing contact angles for membrane
G20 and pH 5.
196 L. Palacio et al. / Journal of Membrane Science 152 (1999) 189±201

measured for substantially lower concentrations than
those used to measure zeta potentials which should be
affected by very high relative errors if lower concen-
trations were used. Also, solutions with almost neg-
ligible ionic strengths were used when measuring
contact angles. Nevertheless, low ionic strengths
should cause the protein to aggregate at the relatively
high BSA concentrations used in electrophoretic
experiments. In any case, lower BSA and salt con-
centrations should not change qualitatively the main
features of the results obtained, i.e. IEP value, and sign
of its charge below and over it.
From these results and on the basis of electrostatic
attraction/repulsion, it should be expected that adsorp-
tion should be greater at pH values below the BSA IEP
than over it. Nevertheless, these aspects need and will
be reconsidered after an adequate re¯ection on the
results obtained here.
In Fig. 12 the receding contact angle of pure water
is shown as a function of pore radii (as taken from
Fig. 6) and roughness. It is seen that receding contact
Fig. 11. Receding and advancing contact angles for membrane G5
and pH 5.
Fig. 12. Receding contact angle of pure water as a function of pore radius and surface roughness. Both contact angles versus the contact angle
hysteresis are also shown.
L. Palacio et al. / Journal of Membrane Science 152 (1999) 189±201 197

angles decrease with increasing pore radius and rough-
ness. This contact angle versus pore radius behavior
has been reported for Sartorius polysulfone mem-
branes by Gekas et al. [37]. A linear dependence
was suggested by them, nevertheless this dependence
is hardly obtained in our case. A better linearity seems
to correlate contact angles and roughness. Both the
presence of pores and/or valleys should clearly lead to
decreasing receding angles as far as the liquid should
penetrate easier into a porous material. Nevertheless,
this dependence could be somehow obscured by the
different porosities that the G membranes have. This
and the fact that we only study three membranes of the
same kind should allow neither to conclude nor to
discard a linear dependence of water receding contact
angle on pore size and/or roughness.
In any case, these pure water contact angles mean
that the G membranes are fairly hydrophilic. On the
other hand, if the linear decrease of receding contact
angles with increasing pore radii and roughness were
accepted, in spite of their lack of an actual justi®ca-
tion, the ®ts could be extrapolated to zero radius,
�rec�508, or to zero roughness, �rec�628. An alter-
native approach, followed by Schultze et al. [38], is to
plot both the contact angles versus the contact angle
hysteresis (����advÿ�rec), in such a way that linear
dependencies should be expected. It is clear that
zero hysteresis should correspond to a perfectly ¯at
non-porous solid surface. When our data are repre-
sented in this way, two perfect straights are effectively
obtained leading by extrapolation to a Young's equili-
brium contact angle of 738, as shown in Fig. 12. The
differences of extrapolated contact angles should
be due to the interaction of both pore size and rough-
ness along with porosity, whose effects cannot be
separated.
Referring to both receding and advancing angles for
membrane-protein experiments, no consistent differ-
ences are noted for the different membranes, which
seems to indicate that they are determined by the
interaction of the liquid with a protein layer deposited
on the membrane as a consequence of their total
retentivity for BSA. Things are substantially different
if the concentration dependence of contact angles are
analyzed for different pH, as will be shown below.
As seen for example in Figs. 7±11, at long times
contact angles reach almost static values. These pla-
teau values correspond to the initial interface for
advancing angles and to the ®nal interface for receding
angles. In effect, as mentioned, receding contact
angles refer to increasing surface-protein contact
times, while advancing angles are measured for mem-
brane surfaces that have been in contact with protein
for decreasing times. In fact, during the receding
process the contact angle is almost constant after
nearly 5 min for all membranes, concentrations and
pH. This means that the last receding contact angles
measured refer effectively to membrane portions
where adsorption has been totally established. For
the advancing process this is not so clear, as far as
sometimes the plateau is not totally reached. This can
be due to small variations in the time gap from solution
entrance in the vessel to effective receding of the rod.
These times can be very critical considering the short
characteristic times for adsorption. On the other hand,
it is clear that the last advancing angles correspond to
membrane portions that have been outside the solution
for more than 10 min, this is why a certain drying
process can be relevant. Thus advancing contact
angles should be carefully extrapolated to long times
to be sure that they refer to the initial adsorption.
To resume we can accept that ®nal receding angles,
�rec, refer to ®nal adsorption, i.e. to these correspond-
ing to an in®nite adsorption time (t!1), while the
®nal advancing angles, �adv, should lead to the contact
angles for initial adsorption times (t!0), when only
the ®rst protein layer or layers appear on the mem-
brane.
Thus, both the �rec and �adv were averaged for all
membranes, ®tted and extrapolated for long measure-
ment times to get the contact angle for ®nal (t!1)
and initial (t!0) adsorption, respectively. These
values are shown in Figs. 13 and 14. It is clear that,
in this process the in¯uence of some long time advan-
cing contact angles affected by drying effects has been
minimized.
First of all, it is seen that all these values correspond
to very hydrophilic surfaces as it should when corre-
sponding to BSA layers.
On the other hand, referring to early adsorption, it is
seen in Fig. 13 that:
1. At pH 8, �adv is always in the pure water zone for
all concentrations. This should be due to the
repulsion between BSA molecules, negative at this
pH, and the always negatively charged membrane
surface.
198 L. Palacio et al. / Journal of Membrane Science 152 (1999) 189±201

2. At pH 3, �adv decreases below the pure water
values. In effect, at this pH BSA's positively
charged protein molecules are attracted by the
membrane. The so formed protein layer is thicker
for increasing concentrations leading to decreasing
contact angles which should be more and more
determined only by the protein surfaces.
3. Finally at the isoelectric point the protein is neither
repelled nor attracted by the membrane surface or
by the other protein molecules. Thus they can
approach enough the solid surface to be attracted
by short range forces. Thus forming a very thick
protein layer on the membrane surface leading to
even lower contact angles. Of course, adsorption in
these conditions should be higher for increasing
concentrations, as far as more BSA molecules are
present at the interface, thus leading to decreasing
contact angles.
As far as late or ®nal adsorption is concerned, from
Fig. 14, it can be seen that for high concentrations �rec
is almost equal for all pH which means that a thick
enough protein layer is formed at all pH values, which
gives a contact angle totally determined by the protein
surfaces. This should be due to the disposability of
enough BSA molecules in the solution to be adsorbed.
For these high concentrations, at the isoelectric point
there is a slightly lower adsorption than for the other
pH, possibly due to the high intermolecular short
range attraction that balances somehow the BSA±
membrane interaction. For low concentrations, some
signi®cant differences are detected for different pH:
1. At the isoelectric point the protein is easily
adsorbed even at low concentrations as far as it
can approach the membrane and be linked, even
forming multilayers, by short range interactions
leading to low �rec. Charged proteins form with
dif®culty more than one layer at low concentra-
tions and thus have higher �rec.
2. At pH 3 the protein is positively charged thus being
easily adsorbed in the first layer but hardly
adsorbed at long times due to repulsion for second
and subsequent layers. This layer to layer repulsion
should be relatively strong as far as the correspond-
ing zeta potential for BSA at pH 3 has the highest
absolute value for the pH range measured (see
Fig. 5).
3. At pH 8 a slightly better adsorption than at pH 3 is
indicated by the lower �rec. This can be due to a
partial displacement of Clÿ anions, which are
responsible for at least a part of the negative charge
Fig. 13. Advancing contact angle for t�0 as a function of protein
concentration for the three pH used. The contact angles shown are
averaged values for all the membranes.
Fig. 14. Receding contact angle for t�1 as a function of
concentration for the three pH used. The contact angles shown
are averaged values for all the membranes.
L. Palacio et al. / Journal of Membrane Science 152 (1999) 189±201 199
of the membrane, by the protein molecules that are
also negatively charged and whose affinity for the
membrane organic polymer is high. The secondary
layers should also be repelled but to a lower extent
than at pH 3 as indicated by the protein zeta
potentials of ÿ15 mV and �23 mV at pH 8 and
3, respectively (see Fig. 5).
In conclusion it has been shown that the dynamic
measurement of contact angle is an important and
useful technique to characterize adsorption and
deposition behavior of membranes in contact with
protein solutions. In particular dynamic measurements
of contact angles on membranes when immersed into
protein solutions help to distinguish between early and
®nal adsorption steps.
Acknowledgements
The Spanish authors would like to thank the ®nan-
cial support of this work through projects QUI96-0767
of the Spanish `̀ Plan Nacional de InvestigacioÂn y
Desarrollo'' (CICYT) and VA10496 of the J. Castilla
y LeoÂn, MSc Pasi VaÈisaÈnen would like to thank the
Tekes foundation for its support.
References
[1] C. JoÈnsson, A.-S. JoÈnsson, Influence of the membrane
material on the adsorptive fouling of UF membranes, J.
Membr. Sci. 108 (1995) 79.
[2] J.H. Lee, H.B. Lee, Wettability as a tool to study protein
adsorption and cell adhesion on polymer surfaces, J.
Biomatter. Sci. Polym. Edn. 4 (1993) 467.
[3] J.T.F. Keurentjes, J.G. Harbrecht, D. Brinkman, J.H. Hane-
maaijer, M.A. Cohen Stuart, H. vanÂt Riet, Hydrophobicity
measurements of MF and UF membranes, J. Membr. Sci. 47
(1989) 333.
[4] A. Baszkin, Comments on contact angle kinetics of human
albumin solutions at solid surfaces, Colloids & Surfaces A 81
(1993) 291.
[5] D.E. Gregoris, R. Hsu, D.E. Buerger, L.M. Smith, J.D.
Andrade, Wettability of polymers and hydrogels as deter-
mined by Wilhelmy plate technique, in: R.B. Seymour, G.
Allan (Eds.), Macromolecular Solutions, Pergamon Press,
New York, 1981.
[6] J.R. Cain, W. Francis, R.D. Venter, A.W. Newmann, Dynamic
contact angles on smooth and rough surfaces, J. Colloid
Interface Sci. 94 (1983) 123.
[7] V. Gekas, K.M. Persson, M. Wahlgren, B. Sivik, Contact
angles of UF membranes and their possible correlation to
membrane performance, J. Membr. Sci. 72 (1992) 293.
[8] M. Oldani, G. Schock, Characterization of UF membranes by
Infrared spectroscopy, ESCA and contact angle measure-
ments, J. Membr. Sci. 43 (1989) 243.
[9] R.V. Sedev, C.J. Budziak, J.G. Petrow, A.W. Newmann,
Dynamic contact angles at low velocities, J. Colloid Interface
Sci. 159 (1993) 392.
[10] K.S. Birdi, Contact angle hysteresis on some polymeric
solids, J. Colloid Interface Sci. 88 (1982) 290.
[11] C.J. Budziak, A.W. Neumann, Automation of capillary rise
technique for measuring contact angles, Colloids and
Surfaces 43 (1990) 279.
[12] M.J. Rosa, M.N. de Pinho, Membranes surface characteriza-
tion by contact angle measurements using the immersed
method, J. Membr. Sci. 131 (1997) 167.
[13] W. Zhang, M. Wahlgren, B. Sivik, Membrane characteriza-
tion by the contact angle technique. II. Characterization of
UF-membranes and comparison between the captive bubble
and sessile drop as methods to obtain water contact angles,
Desalination 72 (1989) 263.
[14] R.E. Johnson Jr., E. Dettre, Wettability and contact angles, in:
E. Matijevic (Ed.), Surface and Colloid Science, vol. II,
Wiley, New York, 1969.
[15] Y. Gu, D. Li, P. Cheng, A novel contact angle measurement
technique by analysis of capillary rise profile around a
cylinder (ACRPAC), Colloid and Surfaces A 122 (1997) 135.
[16] P.C. Hiemenz, Principles of Colloid and Surface Chemistry,
Ch. 6. Marcel Dekker, New York, 1986.
[17] R.J. Hunter, Foundations of Colloid Science, vol. I, Ch. 5,
Oxford Science Publications, UK, 1987.
[18] N. Milman, J.K. Yoon, A.J. Hickey, D.J. Burgess, Compar-
ison of contact angle measurements by three methods,
Colloids and Surfaces B: Biointerfaces 1 (1993) 315.
[19] W. Zhang, B. HallstroÈm, Membrane characterization using
the contact angle technique. I. Methodology of captive bubble
technique, Desalination 79 (1990) 1.
[20] R. Nobrega, H. de Balmann, P. Aimar, V. SaÂnchez, Transfer of
dextran through ultrafiltration membranes: A study of
rejection data analyzed by gel permeation chromatography,
J. Membr. Sci. 45 (1989) 17.
[21] P. PraÂdanos, A. HernaÂndez, Cross-flow ultrafiltration of
proteins through asymmetric polysulfonic membranes: I.
Retention curves and pore size distributions, Biotechnol.
Bioeng. 47 (1995) 617.
[22] L. Palacio, P. PraÂdanos, J.I. Calvo, A. HernaÂndez, Porosity
determinations by a new gas penetration volumetric method,
Acta Polytechnica Scandinavica, CHEMTECH 247 (1997)
115.
[23] G. Binnig, C.F. Quate, Ch. Gerber, Atomic force microscope,
Phys. Rev. Lett. 12 (1986) 930.
[24] P. Dietz, P.K. Hansma, O. Inacker, H.D. Lehmann, K.H.
Hermann, Surface pore structures of micro- and ultrafiltration
membranes imaged with atomic force microscope, J. Membr.
Sci. 65 (1992) 101.
[25] J.I. Calvo, P. PraÂdanos, A. HernaÂndez, W.R. Bowen, N. Hilal,
R.W. Lovitt, P.M. Williams, Bulk and surface characterization
200 L. Palacio et al. / Journal of Membrane Science 152 (1999) 189±201

of composite UF membranes. Atomic force microscopy, gas
adsorption±desorption and liquid displacement techniques, J.
Membr. Sci. 128 (1997) 7.
[26] R. Hidalgo, On the conversion of experimental electrokinetic
data into double layer characteristics in solid±liquid inter-
faces, Adv. Colloid and Interface Sci. 34 (1991) 217.
[27] M. Sarbolouki, A general diagram for estimating pore size of
ultrafiltration and reverse osmosis membranes, Sep. Sci.
Technol. 17 (1982) 381.
[28] P. PraÂdanos, Estudio y caracterizacioÂn de membranas de
ultrafiltracioÂn. Su aplicacioÂn a procesos de intereÂs enoloÂgico,
Ph.D. Thesis, University of Valladolid, Valladolid, Spain,
1994.
[29] T. Peters, Serum albumin, Adv. Protein Chem. 37 (1985) 161.
[30] D. Malamud, J.W. Drysdale, Isoelectric point of proteins: A
table, Anal. Bio-Chem. 86 (1978) 620.
[31] S. Nakatsuka, A.S. Michaels, Transport and separation of
proteins by ultrafiltration through sorptive and non-sorptive
membranes, J. Membr. Sci. 69 (1992) 189.
[32] M. NystroÈm, P. JaÈrvinen, Modification of polysulfone
ultrafiltration membranes with UV irradiation and hydophi-
licity increasing agents, J. Membr. Sci. 60 (1991) 275.
[33] P. PraÂdanos, J.I. Arribas, A. HernaÂndez, Mass transfer
coefficient and retention of PEGs in low pressure cross-flow
ultrafiltration through asymmetric membranes, J. Membr. Sci.
99 (1995) 1.
[34] M. NystroÈm, A. PihlajamaÈki, N. Ehsani, Characterization of
ultrafiltration membranes by simultaneous streaming poten-
tial and flux measurements, J. Membr. Sci. 87 (1994) 245.
[35] L. Palacio, P. PraÂdanos, J.I. Calvo, A. HernaÂndez, Gas
penetration volumetry and other porosity determinations,
Thin Solid Films (1998), submitted.
[36] P. PraÂdanos, L. Palacio, A. HernaÂndez, Pore size distributions
of ultrafiltration membranes by the retention method, in: W.R.
Bowen, R.W. Field, J.A. Howell (Eds.), Proceedings of
Euromembrane' 95, vol. 1, Bath, UK, 1995.
[37] V. Gekas, G. TraÈgaÊrdh, B. HallstroÈm, Ultrafiltration mem-
brane performance fundamentals, The Swedish Foundation
for Membrane Technology, Lund University, Sweden, 1993.
[38] R.D. Schultze, W. Possart, H. Kamusewitz, C. Bischof,
Young's equilibrium contact angle on rough solid surfaces.
Part I An empirical determination, J. Adhesion Sci. Technol.
3 (1989) 39.
L. Palacio et al. / Journal of Membrane Science 152 (1999) 189±201 201