Adsorption of precious metal ions onto electrochemically oxidized carbon fibers
12
PERGAMON Carbon 37 (1999) 1607–1618 Adsorption of precious metal ions onto electrochemically oxidized carbon fibers b a b a b a, * Z.R. Yue ,W. Jiang , L. Wang , H. Toghiani , S.D. Gardner , C.U. Pittman Jr. a Department of Chemistry, Mississippi State University, University / Industry Chemical Research Center, Mississippi State, MS 39762, USA b Department of Chemical Engineering, Mississippi State University, Mississippi State, MS 39762, USA Received 25 November 1998; accepted 23 January 1999 Abstract 1 Electrochemically oxidized carbon fibers (ECF) adsorbed a prodigious amount of Ag in contrast to oxygen plasma and 1 nitric acid treated carbon fibers. The amount of adsorbed Ag reached 3700 mmol / g after 5652 C / g of electrochemical 1 oxidation. This value approaches the 4050 mmol / g of Ag which adsorbed onto steam-activated Kenaf-based carbon (with a 2 surface area of 1284 m / g determined by N / BET) under the same adsorption conditions. ECF oxidized to 9540 C / g 2 1 2 adsorbed more than its own weight of Ag (12 608 mmol/g). These fibers exhibited a surface area of 115 m /g (CO –DR). 2 1 1 Two different reactions occurred during Ag adsorption. These reactions were ion exchange adsorption between Ag and 1 acidic functions (carboxyl) and redox adsorption between Ag and reducing functions such as catechol groups on these electrochemically oxidized fibers (ECF). The redox capability was expressed by the reaction electric potential ( E ) using the 1 Nernst equation. High resolution XPS C 1s spectra of ECFs (level of oxidation 5300 C / g), before and after Ag adsorption, showed that the carbon atoms present in phenolic, alcohol or ether groups and those present in carbonyl or quinone groups 1 increased after Ag adsorption. X-ray diffraction and X-ray photoelectron spectroscopy (XPS) Ag 3d spectra of the ECF 1 0 1 showed that adsorbed Ag was reduced to Ag after both Ag adsorption and subsequent post-heat treatment of the fibers 31 under N at 5508C for 30 min. Only about one-third as much Au adsorption occurred versus the extent of electrochemical 2 1 31 oxidation as was observed for Ag . This ratio matches the requirement that three electrons are required to convert Au to 0 1 Au versus one to convert Ag to Ag. High resolution angle resolved XPS (ARXPS) Pd 3d and Pt 4f spectra show that there 21 21 are two different Pd oxidation states and three different Pt oxidation states present after adsorption of Pd and Pt onto 0 0 ECF. The peak areas as a function of take off angle showed that substantial amounts of Pd and Pt are present in addition to 21 21 41 Pd and Pt and Pt on the outermost surface regions of oxidized fibers. 1999 Elsevier Science Ltd. All rights reserved. Keywords: A. Carbon fibers; B. Electrochemical treatment; C. Adsorption, X-ray photoelectron spectroscopy (XPS); D. Adsorption properties 1. Introduction functional groups on their surface, strong corrosion resist- ance and, especially, good electrical conductivity. Adsorption of precious metallic ions onto carbonaceous We have previously investigated the surface area and materials is of interest for the preparation of carbon pore size distribution of electrochemically oxidized carbon supported catalysts [1,2], and for the removal of metallic fibers [4]. These oxidized carbon fiber surface areas, ions from water effluents [3]. This is, in part, because derived by applying the DR method to CO adsorption 2 2 carbonaceous materials have unique properties, such as data, increased almost linearly from ¯1 to 132 m /g as the high specific surface area, the existence of various forms of extent of electrochemical oxidation increased from 0 to 10600 C/g [4]. At 6360 C/g levels of oxidation about 1000 mmol / g of acidic functions were formed [5,6] and in *Corresponding author. Tel.: 11-601-3257616; fax: 11-601- other studies we have achieved up to 2475 mmol/g of 3257611. E-mail address: [email protected] (C.U. Pittman Jr.) acidic functions (10 600 C / g of oxidation) [7]. Further- 0008-6223 / 99 / $ – see front matter 1999 Elsevier Science Ltd. All rights reserved. PII: S0008-6223(99)00041-X
-
Upload
independent -
Category
Documents
-
view
0 -
download
0
Transcript of Adsorption of precious metal ions onto electrochemically oxidized carbon fibers
PERGAMON Carbon 37 (1999) 1607–1618
Adsorption of precious metal ions onto electrochemicallyoxidized carbon fibers
b a b a b a ,*Z.R. Yue , W. Jiang , L. Wang , H. Toghiani , S.D. Gardner , C.U. Pittman Jr.aDepartment of Chemistry, Mississippi State University, University /Industry Chemical Research Center, Mississippi State, MS 39762,
USAbDepartment of Chemical Engineering, Mississippi State University, Mississippi State, MS 39762, USA
Received 25 November 1998; accepted 23 January 1999
Abstract
1Electrochemically oxidized carbon fibers (ECF) adsorbed a prodigious amount of Ag in contrast to oxygen plasma and1nitric acid treated carbon fibers. The amount of adsorbed Ag reached 3700 mmol /g after 5652 C/g of electrochemical
1oxidation. This value approaches the 4050 mmol /g of Ag which adsorbed onto steam-activated Kenaf-based carbon (with a2surface area of 1284 m /g determined by N /BET) under the same adsorption conditions. ECF oxidized to 9540 C/g2
1 2adsorbed more than its own weight of Ag (12 608 mmol /g). These fibers exhibited a surface area of 115 m /g (CO –DR).21 1Two different reactions occurred during Ag adsorption. These reactions were ion exchange adsorption between Ag and
1acidic functions (carboxyl) and redox adsorption between Ag and reducing functions such as catechol groups on theseelectrochemically oxidized fibers (ECF). The redox capability was expressed by the reaction electric potential (E) using the
1Nernst equation. High resolution XPS C 1s spectra of ECFs (level of oxidation 5300 C/g), before and after Ag adsorption,showed that the carbon atoms present in phenolic, alcohol or ether groups and those present in carbonyl or quinone groups
1increased after Ag adsorption. X-ray diffraction and X-ray photoelectron spectroscopy (XPS) Ag 3d spectra of the ECF1 0 1showed that adsorbed Ag was reduced to Ag after both Ag adsorption and subsequent post-heat treatment of the fibers
31under N at 5508C for 30 min. Only about one-third as much Au adsorption occurred versus the extent of electrochemical21 31oxidation as was observed for Ag . This ratio matches the requirement that three electrons are required to convert Au to
0 1Au versus one to convert Ag to Ag. High resolution angle resolved XPS (ARXPS) Pd 3d and Pt 4f spectra show that there21 21are two different Pd oxidation states and three different Pt oxidation states present after adsorption of Pd and Pt onto
0 0ECF. The peak areas as a function of take off angle showed that substantial amounts of Pd and Pt are present in addition to21 21 41Pd and Pt and Pt on the outermost surface regions of oxidized fibers. 1999 Elsevier Science Ltd. All rights
reserved.
Keywords: A. Carbon fibers; B. Electrochemical treatment; C. Adsorption, X-ray photoelectron spectroscopy (XPS); D. Adsorptionproperties
1. Introduction functional groups on their surface, strong corrosion resist-ance and, especially, good electrical conductivity.
Adsorption of precious metallic ions onto carbonaceous We have previously investigated the surface area andmaterials is of interest for the preparation of carbon pore size distribution of electrochemically oxidized carbonsupported catalysts [1,2], and for the removal of metallic fibers [4]. These oxidized carbon fiber surface areas,ions from water effluents [3]. This is, in part, because derived by applying the DR method to CO adsorption2
2carbonaceous materials have unique properties, such as data, increased almost linearly from ¯1 to 132 m /g as thehigh specific surface area, the existence of various forms of extent of electrochemical oxidation increased from 0 to
10600 C/g [4]. At 6360 C/g levels of oxidation about1000 mmol /g of acidic functions were formed [5,6] and in*Corresponding author. Tel.: 11-601-3257616; fax: 11-601-other studies we have achieved up to 2475 mmol /g of3257611.
E-mail address: [email protected] (C.U. Pittman Jr.) acidic functions (10 600 C/g of oxidation) [7]. Further-
0008-6223/99/$ – see front matter 1999 Elsevier Science Ltd. All rights reserved.PI I : S0008-6223( 99 )00041-X
1608 Z.R. Yue et al. / Carbon 37 (1999) 1607 –1618
1more, a larger amount of Ag adsorbed onto electro- 2.3. Adsorption of precious metallic ionschemically oxidized carbon fibers upon adjusting the pH of
1the Ag solution to 10.5 [4]. These previous studies 12.3.1. Ag adsorptionshowed that extensive electrochemical oxidation of carbon
Oxidized carbon fiber samples (0.04–0.5 g) were im-fibers produced a porous carbon fiber with interesting
mersed in 50–100 ml of AgNO solution (|5 mM) and3adsorbent capabilities.shaken at 258C for 24 h in the dark. The initial pH value of
In the present investigation, PAN-based carbon fibersthe AgNO solution was adjusted with aqueous NH OH to3 4were electrochemically oxidized from 0 to 10 600 C/g. 1|10.5 generating [Ag(NH ) ] complexed ions. The3 2The adsorption properties of electrochemically oxidized 1change in Ag concentration after adsorption was de-1 31 21 21carbon fibers towards Ag , Au , Pd and Pt weretermined by KSCN titration using Fe(NH )(SO ) as the4 4 2characterized by chemical analysis, X-ray photoelectronindicator [8]. Before titration, the pH of all of the
spectroscopy and X-ray diffraction.adsorbates was adjusted to an acidic state with HNO (pH3
2–4). When highly oxidized fiber samples were used, thefiber weight gain could be used to follow the amount of
2. Experimental 1Ag adsorbed. The fibers were carefully washed withdistilled water followed by drying at 1208C for 2 days
2.1. Materialsprior to weighing.
The carbon fiber consisted of high strength, type II,31PAN-based fibers (Thornel T-300) manufactured by 2.3.2. Au adsorption
Amoco Performance Products, Inc. with 3000 filaments per Gold foil (Aldrich, 199.9%, |0.5 g) was dissolved intotow. All other chemicals were of analytical purity from a 3:1 weight ratio of HNO /HCl. This solution was3
Aldrich and used as received. concentrated by heating followed by dilution with distilledwater to 500 ml. The concentration of AuCl in this3
2.2. Electrochemical oxidation and other surface solution was |5 mM and pH was 2–2.2. Oxidized carbontreatments fiber samples (|0.04g) were immersed in 25 ml of AuCl3
31solution and shaken at 258C for 24 h. The change in AuContinuous electrochemical treatments were carried out concentration after adsorption was determined by 1,2-
in a U-tube apparatus. An aqueous 1%wt KNO solution benzoquinone titration using aminobiphenyl as the in-3
(no pH adjustment) was used as the electrolyte. The carbon dicator [9].fibers were fed continuously and served as the anode. A254-cm long U-shaped stainless steel bar inside the U-tube 21 212.3.3. Pd and Pt adsorptionacts as the cathode. A gear system allowed variation of the
PdCl (99%) and K PtCl (98%) (Aldrich) were used as2 2 4fiber residence time in the oxidation reaction and theprecursors to prepare aqueous stock solutions of PdCl2voltage could be varied from 30 to 45 V to change the rate(6.0 mM) and K PtCl (2.8 mM) with distilled water. The2 4of current flow. The schematic diagram of this apparatuspH of the K PtCl solution was 6.2. To prevent Pd(OH)2 4 2and the details of the treatment methods have previouslyprecipitation of PdO?(H O) , the pH of the PdCl solution2 x 2been described [4]. After electrochemical oxidation, allwas adjusted to 2.3 with HCl. Qualitative adsorptions of
samples were thoroughly washed with distilled water, and 21 21Pd and Pt were conducted by immersing oxidizeddried at 1108C. 21fiber samples (|0.1g) into 50 ml of either of the Pd or
For comparison, nitric acid and oxygen plasma treated 21Pt stock solutions, respectively. These solutions werefibers were also considered.
shaken at 258C for 24 h.The nitric acid surface treatments involved submerging
the as-received carbon fibers in 70% nitric acid (Aldrich,A.C.S. reagent grade) at 1158C for different times, then 2.4. X-ray photoelectron spectroscopy (XPS)rinsing with distilled water and drying at 1108C [12–17].
Oxygen plasma treatment was carried out with a 40-kHz All samples (after adsorption) analyzed by XPS wereplasma system (Advanced Plasma System, Inc., Model first washed repeatedly with distilled water and then driedB-12) consisting of an aluminum vacuum chamber (123 in a vacuum at 708C/10–20 mmHg for 24h.12316 in) with two interior high-voltage plates. The Several 2.5-cm fiber sections (each of which containedcarbon fiber tows were spread and wound onto a copper approximately 3000 fiber filaments) were carefully cutwire frame and then hung between the two high-voltage from the carbon fiber tow. These fiber sections wereplates. Plasma power was adjusted to 200 W and the positioned on top of a custom stainless steel sample holder.exposure time varied from 1 to 10 min. The oxygen flow The fibers were held firmly in place by a gold foil maskrate was controlled (about 1–2 standard l per min) in order secured to the sample holder with screws. The gold foilto set the plasma pressure at the desired values. contained a machined oval opening in its center that
Z.R. Yue et al. / Carbon 37 (1999) 1607 –1618 1609
exposed a 1.530.8-cm area of the underlying carbonfibers.
XPS experiments were performed on a Physical Elec-tronics PHI Model 1600 surface analysis system. Theinstrument is equipped with a PHI 10-360 sphericalcapacitor energy analyzer (SCA) fitted with an OmniFocus III small-area (800-mm diameter analysis area) lensand a high-performance multi-channel detector. Sampleswere oriented such that the axial direction of the carbonfibers was in the plane of the X-ray source and theanalyzer entrance. Angle-resolved XPS (ARXPS) spectrawere recorded at electron take-off angles of 10, 30 and 908.
XPS spectra were obtained using an achromatic MgKa
(1253.6 eV) X-ray source operated at 200 W. Survey scanswere collected from 0–1100 eV with the pass energy equal
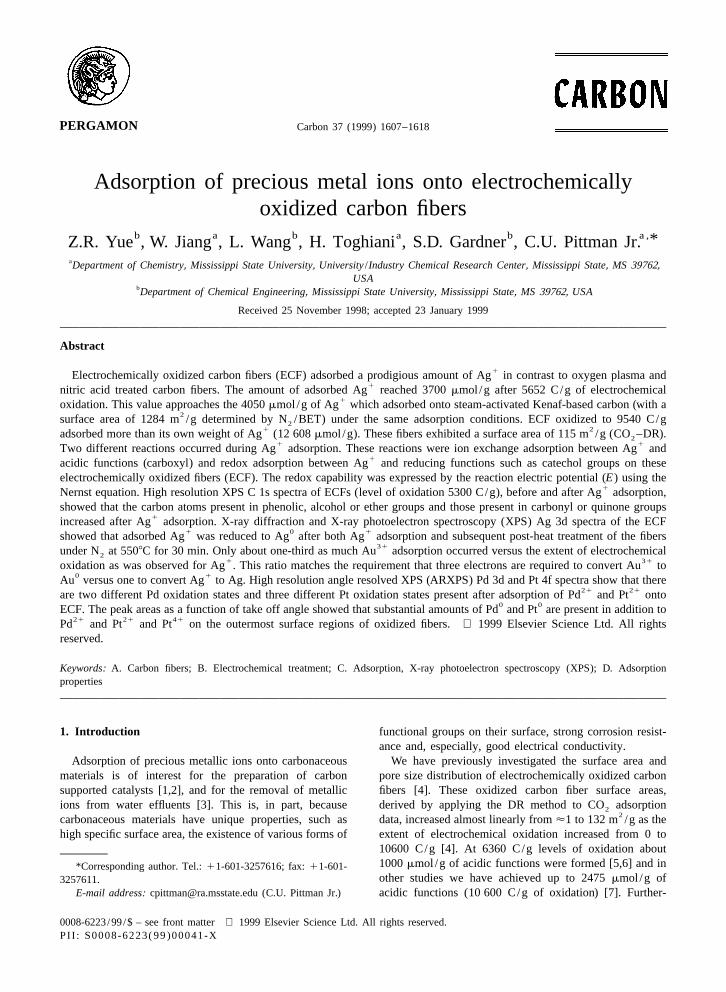
1Fig. 1. Ag adsorption onto O plasma treated carbon fibers2to 46.95 eV. High-resolution scans were performed with theversus plasma exposure. pH value of AgNO initial solution was3pass energy adjusted to 23.50 eV. The pressure inside the adjusted with NH ?H O to 10.5; volume of solution was 50 ml;3 229vacuum system was maintained at approximately 10 weight of fibers was about 0.17 g; initial concentration AgNO3
Torr during all XPS experiments. was 5 mM; T5258C; t524 h.A non-linear least-squares curve fitting program
(XPSPEAK95 software, version 2.0) with a Gaussian-Lorent-zian mix function and Shirley background subtraction was onto oxidized fibers decreased with progressive oxidationused to deconvolute the XPS peaks. The carbon 1s electron by oxygen plasma at 200 W [12]. The fiber surface areabinding energy corresponding to graphitic carbon was (N BET) remained approximately constant as plasma2
referenced at 284.6 eV for calibration [10]. The higher oxidation continued [12]. This implies that oxygen plasmaenergy C 1s peaks were found at 286.2, 287.5, 288.6 and treatment might preferentially cut away some high surface290.7 eV, respectively. Atomic ratios were calculated from area roughened regions resulting in a somewhat smootherthe XPS spectra after correcting the relative peak areas by surface [18–20]. Therefore, this surface smoothing might
1sensitivity factors based on the transmission characteristics lead to a slight decrease in Ag adsorption.1of the Physical Electronics SCA [11]. Nitric acid oxidized fibers exhibited increased Ag
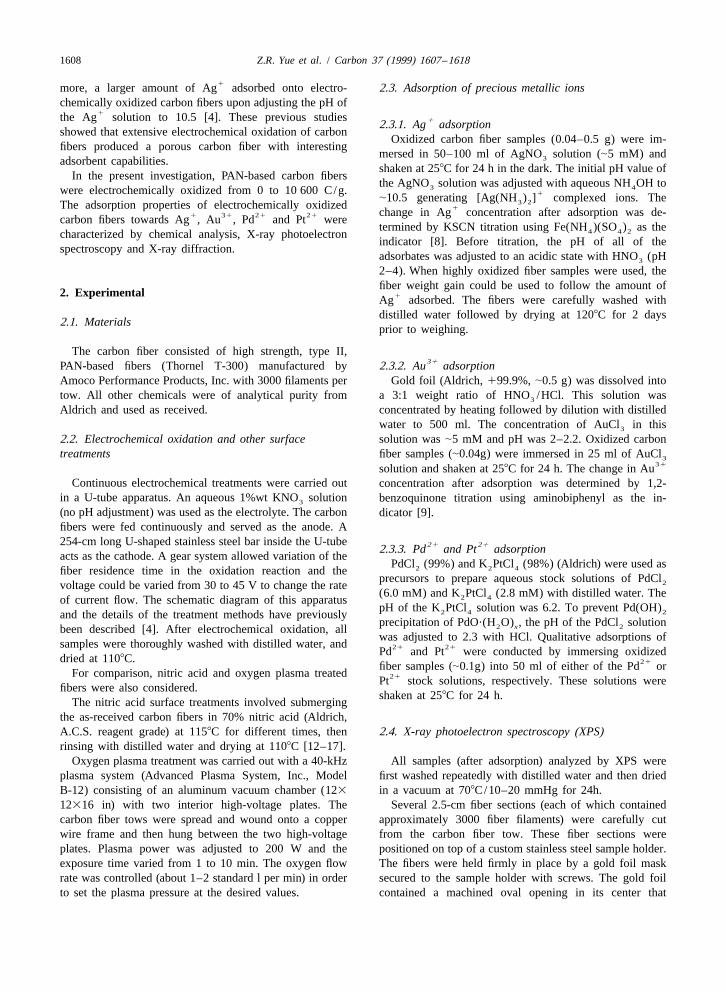
adsorption as the oxidation time was prolonged in 70%2.5. X-ray diffraction HNO solution at 1158C. These results are shown in Fig. 2.3
1The quantity of Ag adsorbed onto oxidized fibers was upX-ray diffraction was performed with a Philips ana- to 625 mmol /g after 105 min of oxidation.
lytical X-ray B.V., X’Pert-MPD multi-purpose diffractome- In contrast to oxygen plasma and nitric acid treatments,ter. Selected carbon fiber samples (|50 mg) were pow- electrochemically oxidized carbon fibers adsorbed adered, and the diffraction lines were measured with CuKa1
radiation (l50.15405 nm).
3. Results and Discussion
13.1. Adsorption of Ag
13.1.1. Quantity of Ag adsorption by oxidized carbonfibers
To explore the ability of oxidized carbon fibers to1adsorb Ag , three different surface-treated carbon fibers
1were employed. The amount of Ag adsorbed onto oxygenplasma-treated carbon fibers as a function of the exposuretime to the oxygen plasma at 200 W is shown in Fig. 1.
1The amount of Ag adsorption did not increase with 1Fig. 2. Ag adsorption onto carbon fibers oxidized in 70% HNO3treatment time up to 10 min of plasma exposure. Instead, at 1158C versus treating time. pH value of AgNO initial solution31Ag adsorption decreased slightly from |38 to 23 mmol / was adjusted with NH ?H O to 10.5; volume of solution was 503 2
g. This result is in accord with previous experiments, ml; weight of fibers was about 0.04 g; initial concentration AgNO3
where the absolute values of methylene blue adsorption was 5 mM; T5258C; t524 h.
1610 Z.R. Yue et al. / Carbon 37 (1999) 1607 –1618
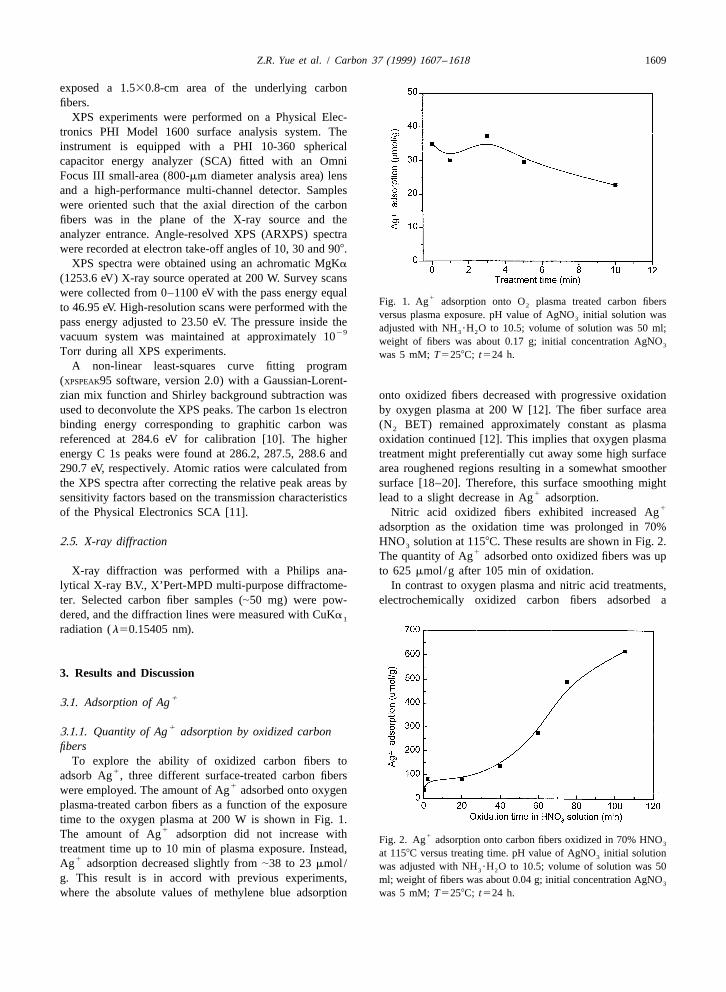
1 1Fig. 3. Ag adsorption onto electrochemically oxidized carbon fibers versus the extent of oxidation at different ratios of initial Agpresent /weight of fibers immersed. pH value of AgNO initial solution was adjusted with NH ?H O to 10.5; initial concentration AgNO3 3 2 3
was 5 mM; T5258C; t524 h.
1prodigious amount of Ag with progressive electrochemi- oxidations produced special, highly porous carbon fibers1cal oxidation as shown in Fig. 3, (see square symbols). with high Ag adsorption capacities. Such fibers might
This adsorption curve was obtained from the same aqueous have potential uses in precious metal recovery and aAgNO adsorption solution used with the oxygen plasma precious metal catalyst-supports.3
and nitric acid treated carbon fibers described above. The1amount of Ag adsorbed reached 3700 mmol /g after 5652 13.2. Adsorption properties of Ag onto1C/g of electrochemical oxidation when the ratio of Ag in electrochemically oxidized fibers
the absorption solution to the weight of fibers immersed1was 12 500 mmmol Ag /g fiber. This value approached 1Two kinds of reactions might occur during Ag ad-1the 4050 mmol /g of Ag which adsorbed onto steam 1sorption. First, ion exchange between Ag and acidic
activated Kenaf-based carbon (which exhibited a surface carboxyl functions present on the pore surfaces can occur2area of 1284 m /g by N /BET [4]) under the same2 as follows:adsorption conditions. When fibers subjected to 10 600 and
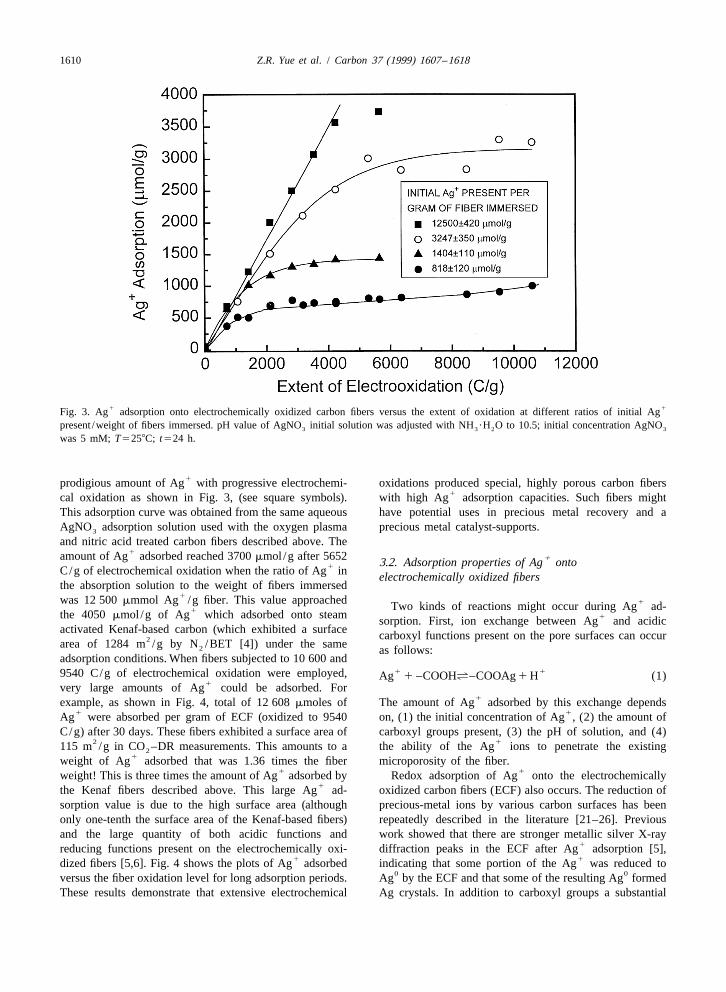
1 19540 C/g of electrochemical oxidation were employed, Ag 1 –COOHá–COOAg 1 H (1)1very large amounts of Ag could be adsorbed. For
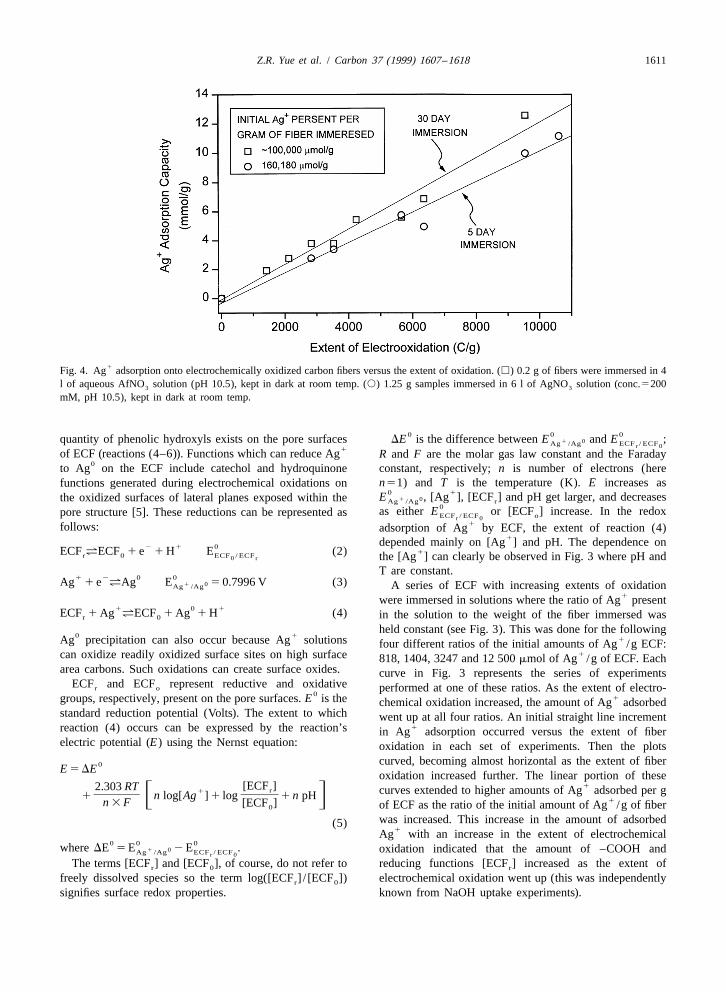
1example, as shown in Fig. 4, total of 12 608 mmoles of The amount of Ag adsorbed by this exchange depends1 1Ag were absorbed per gram of ECF (oxidized to 9540 on, (1) the initial concentration of Ag , (2) the amount of
C/g) after 30 days. These fibers exhibited a surface area of carboxyl groups present, (3) the pH of solution, and (4)2 1115 m /g in CO –DR measurements. This amounts to a the ability of the Ag ions to penetrate the existing2
1weight of Ag adsorbed that was 1.36 times the fiber microporosity of the fiber.1 1weight! This is three times the amount of Ag adsorbed by Redox adsorption of Ag onto the electrochemically
1the Kenaf fibers described above. This large Ag ad- oxidized carbon fibers (ECF) also occurs. The reduction ofsorption value is due to the high surface area (although precious-metal ions by various carbon surfaces has beenonly one-tenth the surface area of the Kenaf-based fibers) repeatedly described in the literature [21–26]. Previousand the large quantity of both acidic functions and work showed that there are stronger metallic silver X-ray
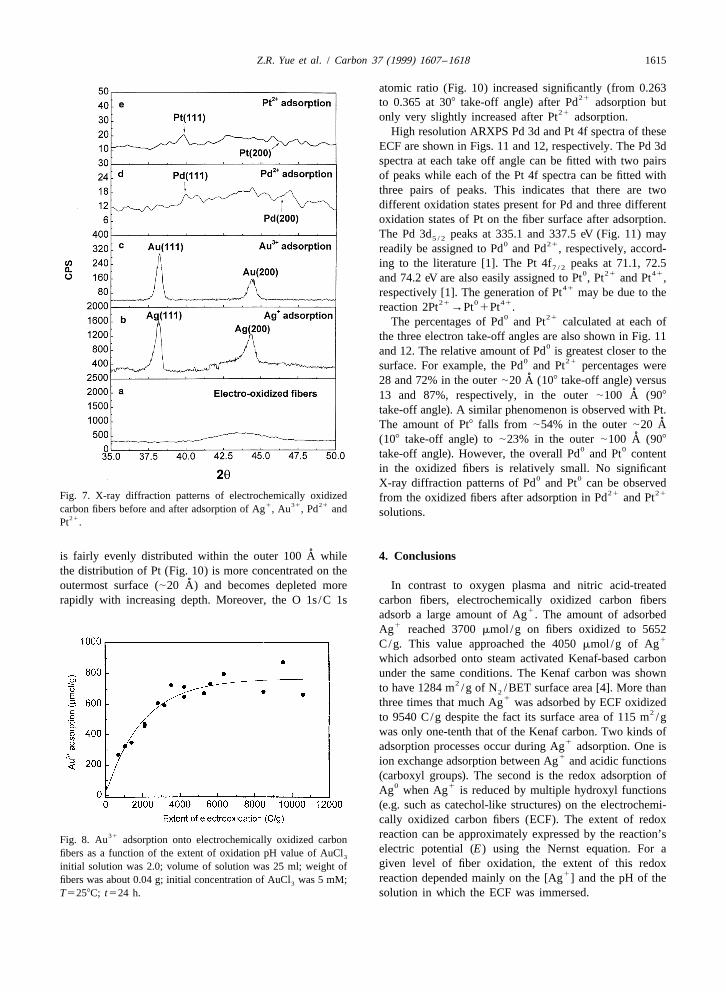
1reducing functions present on the electrochemically oxi- diffraction peaks in the ECF after Ag adsorption [5],1 1dized fibers [5,6]. Fig. 4 shows the plots of Ag adsorbed indicating that some portion of the Ag was reduced to
0 0versus the fiber oxidation level for long adsorption periods. Ag by the ECF and that some of the resulting Ag formedThese results demonstrate that extensive electrochemical Ag crystals. In addition to carboxyl groups a substantial
Z.R. Yue et al. / Carbon 37 (1999) 1607 –1618 1611
1Fig. 4. Ag adsorption onto electrochemically oxidized carbon fibers versus the extent of oxidation. (h) 0.2 g of fibers were immersed in 4l of aqueous AfNO solution (pH 10.5), kept in dark at room temp. (s) 1.25 g samples immersed in 6 l of AgNO solution (conc.52003 3
mM, pH 10.5), kept in dark at room temp.
0 0 0quantity of phenolic hydroxyls exists on the pore surfaces DE is the difference between E and E ;1 0Ag /Ag ECF / ECFr 01of ECF (reactions (4–6)). Functions which can reduce Ag R and F are the molar gas law constant and the Faraday
0to Ag on the ECF include catechol and hydroquinone constant, respectively; n is number of electrons (heren51) and T is the temperature (K). E increases asfunctions generated during electrochemical oxidations on
0 1E , [Ag ], [ECF ] and pH get larger, and decreases1 0the oxidized surfaces of lateral planes exposed within the Ag /Ag r0as either E or [ECF ] increase. In the redoxpore structure [5]. These reductions can be represented as ECF / ECF or 0
1follows: adsorption of Ag by ECF, the extent of reaction (4)1depended mainly on [Ag ] and pH. The dependence on2 1 0
1ECF áECF 1 e 1 H E (2)r 0 ECF / ECF0 r the [Ag ] can clearly be observed in Fig. 3 where pH andT are constant.
1 2 0 0Ag 1 e áAg E 5 0.7996 V (3)1 0Ag /Ag A series of ECF with increasing extents of oxidation1were immersed in solutions where the ratio of Ag present
1 0 1ECF 1 Ag áECF 1 Ag 1 H (4) in the solution to the weight of the fiber immersed wasr 0
held constant (see Fig. 3). This was done for the following0 1
1Ag precipitation can also occur because Ag solutions four different ratios of the initial amounts of Ag /g ECF:1can oxidize readily oxidized surface sites on high surface 818, 1404, 3247 and 12 500 mmol of Ag /g of ECF. Each
area carbons. Such oxidations can create surface oxides. curve in Fig. 3 represents the series of experimentsECF and ECF represent reductive and oxidativer o performed at one of these ratios. As the extent of electro-
01groups, respectively, present on the pore surfaces. E is the chemical oxidation increased, the amount of Ag adsorbed
standard reduction potential (Volts). The extent to which went up at all four ratios. An initial straight line increment1reaction (4) occurs can be expressed by the reaction’s in Ag adsorption occurred versus the extent of fiber
electric potential (E) using the Nernst equation: oxidation in each set of experiments. Then the plotscurved, becoming almost horizontal as the extent of fiber0E 5 DE oxidation increased further. The linear portion of these
1[ECF ]2.303 RT r1 curves extended to higher amounts of Ag adsorbed per g]]] ]]1 n log[Ag ] 1 log 1 n pHF G 1n 3 F [ECF ] of ECF as the ratio of the initial amount of Ag /g of fiber0
was increased. This increase in the amount of adsorbed(5)1Ag with an increase in the extent of electrochemical
0 0 0where DE 5 E 2 E .1 0 oxidation indicated that the amount of –COOH andAg /Ag ECF / ECFr 0
The terms [ECF ] and [ECF ], of course, do not refer to reducing functions [ECF ] increased as the extent ofr 0 r
freely dissolved species so the term log([ECF ] / [ECF ]) electrochemical oxidation went up (this was independentlyr 0
signifies surface redox properties. known from NaOH uptake experiments).
1612 Z.R. Yue et al. / Carbon 37 (1999) 1607 –1618
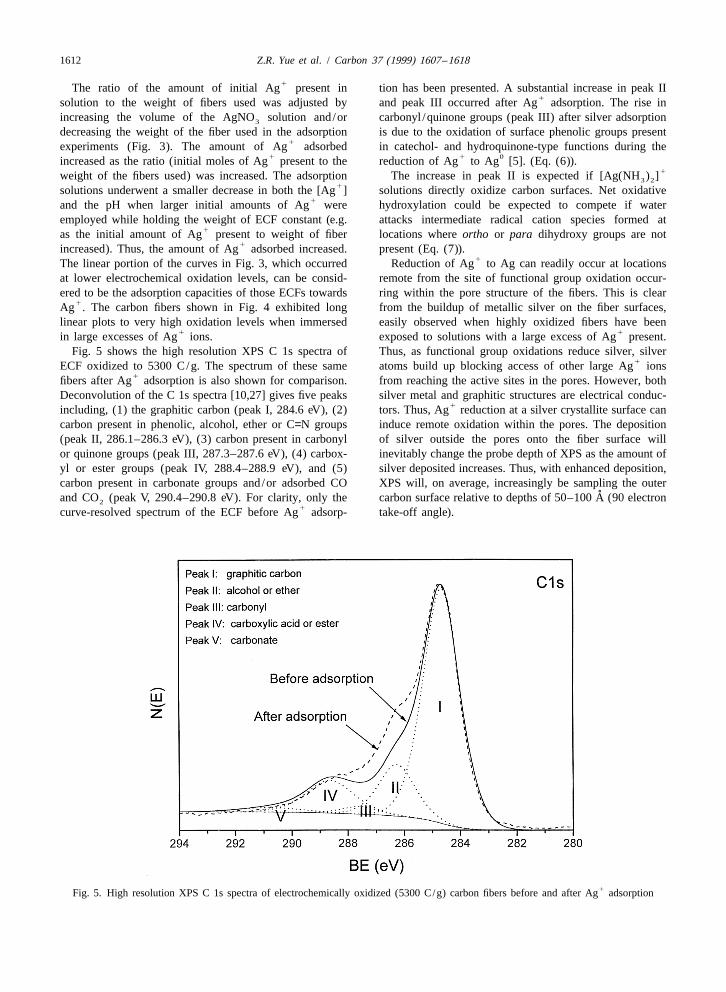
1The ratio of the amount of initial Ag present in tion has been presented. A substantial increase in peak II1solution to the weight of fibers used was adjusted by and peak III occurred after Ag adsorption. The rise in
increasing the volume of the AgNO solution and/or carbonyl /quinone groups (peak III) after silver adsorption3
decreasing the weight of the fiber used in the adsorption is due to the oxidation of surface phenolic groups present1experiments (Fig. 3). The amount of Ag adsorbed in catechol- and hydroquinone-type functions during the
1 1 0increased as the ratio (initial moles of Ag present to the reduction of Ag to Ag [5]. (Eq. (6)).1weight of the fibers used) was increased. The adsorption The increase in peak II is expected if [Ag(NH ) ]3 2
1solutions underwent a smaller decrease in both the [Ag ] solutions directly oxidize carbon surfaces. Net oxidative1and the pH when larger initial amounts of Ag were hydroxylation could be expected to compete if water
employed while holding the weight of ECF constant (e.g. attacks intermediate radical cation species formed at1as the initial amount of Ag present to weight of fiber locations where ortho or para dihydroxy groups are not
1increased). Thus, the amount of Ag adsorbed increased. present (Eq. (7)).1The linear portion of the curves in Fig. 3, which occurred Reduction of Ag to Ag can readily occur at locations
at lower electrochemical oxidation levels, can be consid- remote from the site of functional group oxidation occur-ered to be the adsorption capacities of those ECFs towards ring within the pore structure of the fibers. This is clear
1Ag . The carbon fibers shown in Fig. 4 exhibited long from the buildup of metallic silver on the fiber surfaces,linear plots to very high oxidation levels when immersed easily observed when highly oxidized fibers have been
1 1in large excesses of Ag ions. exposed to solutions with a large excess of Ag present.Fig. 5 shows the high resolution XPS C 1s spectra of Thus, as functional group oxidations reduce silver, silver
1ECF oxidized to 5300 C/g. The spectrum of these same atoms build up blocking access of other large Ag ions1fibers after Ag adsorption is also shown for comparison. from reaching the active sites in the pores. However, both
Deconvolution of the C 1s spectra [10,27] gives five peaks silver metal and graphitic structures are electrical conduc-1including, (1) the graphitic carbon (peak I, 284.6 eV), (2) tors. Thus, Ag reduction at a silver crystallite surface can
carbon present in phenolic, alcohol, ether or C=N groups induce remote oxidation within the pores. The deposition(peak II, 286.1–286.3 eV), (3) carbon present in carbonyl of silver outside the pores onto the fiber surface willor quinone groups (peak III, 287.3–287.6 eV), (4) carbox- inevitably change the probe depth of XPS as the amount ofyl or ester groups (peak IV, 288.4–288.9 eV), and (5) silver deposited increases. Thus, with enhanced deposition,carbon present in carbonate groups and/or adsorbed CO XPS will, on average, increasingly be sampling the outer
˚and CO (peak V, 290.4–290.8 eV). For clarity, only the carbon surface relative to depths of 50–100 A (90 electron21curve-resolved spectrum of the ECF before Ag adsorp- take-off angle).
1Fig. 5. High resolution XPS C 1s spectra of electrochemically oxidized (5300 C/g) carbon fibers before and after Ag adsorption

Z.R. Yue et al. / Carbon 37 (1999) 1607 –1618 1613
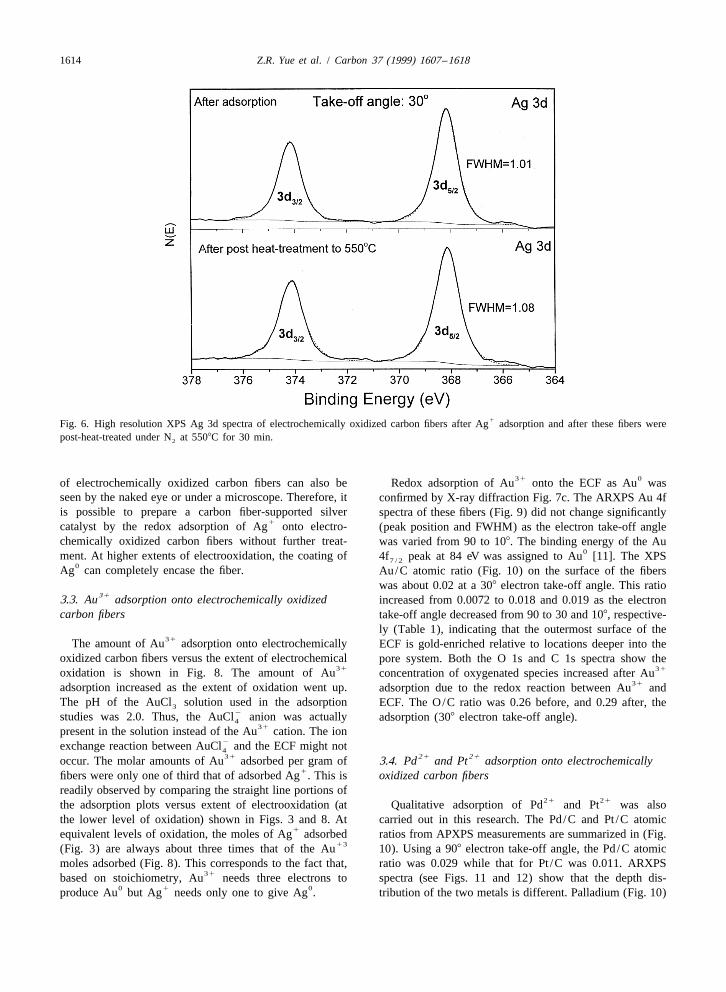
1The XPS Ag 3d spectrum of ECF after Ag adsorption this peak to broaden when both oxidation states areis shown in Fig. 6 together with the spectrum of these present. The FWHM of the Ag 3d peak found in Fig. 65 / 2
same fibers after they have been heat-treated in N at was used here to attempt to characterize the existence of215508C for 30 min. Both spectra exhibited the same two Ag Ag on the oxidized fibers by comparing ECF fibers after
0 13d peaks. Ag is known to exhibit a Ag 3d spectrum with Ag adsorption with those same fibers after the subsequent0 0 1 1peaks at 374.3 eV (Ag ) and 368.3 eV (Ag ) [11]. Ag 5508C heat treatment. During heating, Ag in compounds3 / 2 5 / 2
0in silver acetate also exhibits a 3d peak at 368.3–368.8 can be reduced to Ag [28,29]. However, the values of5 / 20eV [11]. Therefore it is difficult to differentiate Ag and FWHM in Fig. 6 provide no specific evidence for the
1 1 1Ag using XPS. The Ag 3d peak of the ECF, after Ag existence of Ag . X-ray diffraction patterns (see Fig. 7b)5 / 20adsorption, at 368.1 eV is assigned to Ag based on the exhibit a strong diffraction peak for metallic silver on the
1literature [11]. However, small differences in energy fibers after Ag adsorption. Furthermore, a large amount0 1between the Ag 3d peaks of Ag and Ag should cause of metallic silver particles on large fractions of the surface
1614 Z.R. Yue et al. / Carbon 37 (1999) 1607 –1618
1Fig. 6. High resolution XPS Ag 3d spectra of electrochemically oxidized carbon fibers after Ag adsorption and after these fibers werepost-heat-treated under N at 5508C for 30 min.2
31 0of electrochemically oxidized carbon fibers can also be Redox adsorption of Au onto the ECF as Au wasseen by the naked eye or under a microscope. Therefore, it confirmed by X-ray diffraction Fig. 7c. The ARXPS Au 4fis possible to prepare a carbon fiber-supported silver spectra of these fibers (Fig. 9) did not change significantly
1catalyst by the redox adsorption of Ag onto electro- (peak position and FWHM) as the electron take-off anglechemically oxidized carbon fibers without further treat- was varied from 90 to 108. The binding energy of the Au
0ment. At higher extents of electrooxidation, the coating of 4f peak at 84 eV was assigned to Au [11]. The XPS7 / 20Ag can completely encase the fiber. Au/C atomic ratio (Fig. 10) on the surface of the fibers
was about 0.02 at a 308 electron take-off angle. This ratio313.3. Au adsorption onto electrochemically oxidized increased from 0.0072 to 0.018 and 0.019 as the electron
carbon fibers take-off angle decreased from 90 to 30 and 108, respective-ly (Table 1), indicating that the outermost surface of the
31The amount of Au adsorption onto electrochemically ECF is gold-enriched relative to locations deeper into theoxidized carbon fibers versus the extent of electrochemical pore system. Both the O 1s and C 1s spectra show the
31 31oxidation is shown in Fig. 8. The amount of Au concentration of oxygenated species increased after Au31adsorption increased as the extent of oxidation went up. adsorption due to the redox reaction between Au and
The pH of the AuCl solution used in the adsorption ECF. The O/C ratio was 0.26 before, and 0.29 after, the32studies was 2.0. Thus, the AuCl anion was actually adsorption (308 electron take-off angle).4
31present in the solution instead of the Au cation. The ion2exchange reaction between AuCl and the ECF might not431 21 21occur. The molar amounts of Au adsorbed per gram of 3.4. Pd and Pt adsorption onto electrochemically
1fibers were only one of third that of adsorbed Ag . This is oxidized carbon fibersreadily observed by comparing the straight line portions of
21 21the adsorption plots versus extent of electrooxidation (at Qualitative adsorption of Pd and Pt was alsothe lower level of oxidation) shown in Figs. 3 and 8. At carried out in this research. The Pd/C and Pt /C atomic
1equivalent levels of oxidation, the moles of Ag adsorbed ratios from APXPS measurements are summarized in (Fig.13(Fig. 3) are always about three times that of the Au 10). Using a 908 electron take-off angle, the Pd/C atomic
moles adsorbed (Fig. 8). This corresponds to the fact that, ratio was 0.029 while that for Pt /C was 0.011. ARXPS31based on stoichiometry, Au needs three electrons to spectra (see Figs. 11 and 12) show that the depth dis-
0 1 0produce Au but Ag needs only one to give Ag . tribution of the two metals is different. Palladium (Fig. 10)
Z.R. Yue et al. / Carbon 37 (1999) 1607 –1618 1615
atomic ratio (Fig. 10) increased significantly (from 0.26321to 0.365 at 308 take-off angle) after Pd adsorption but
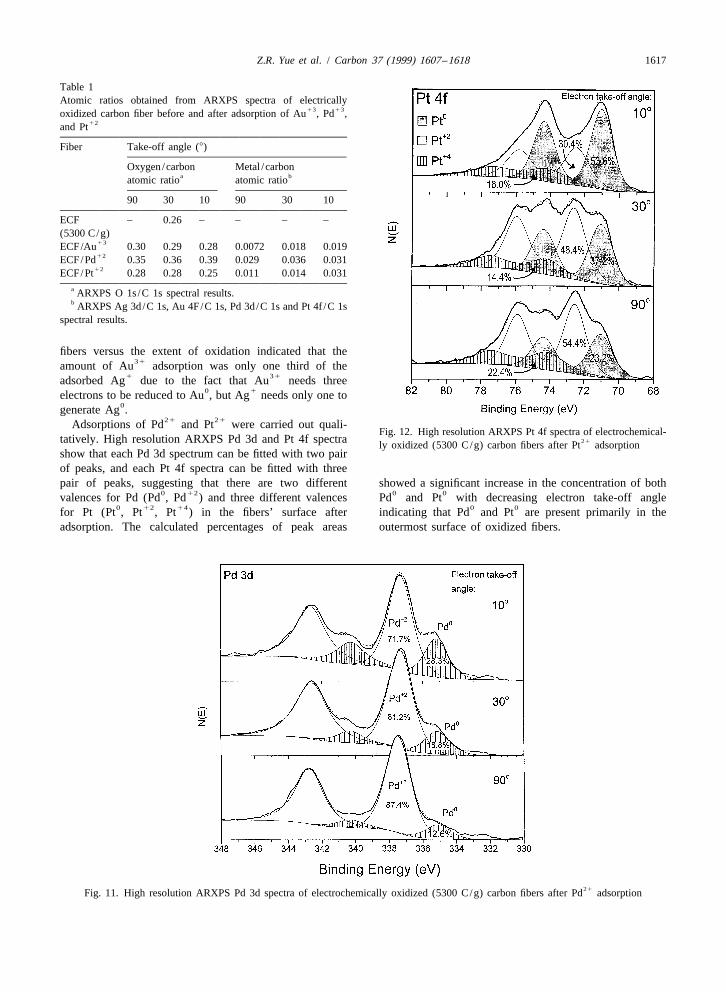
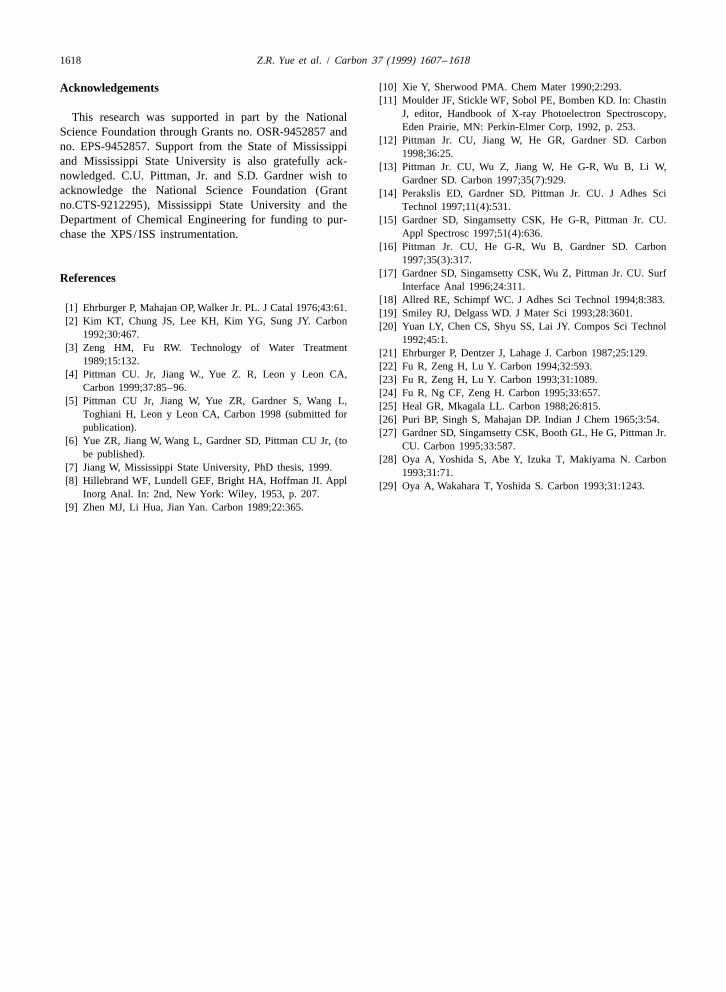
21only very slightly increased after Pt adsorption.High resolution ARXPS Pd 3d and Pt 4f spectra of these
ECF are shown in Figs. 11 and 12, respectively. The Pd 3dspectra at each take off angle can be fitted with two pairsof peaks while each of the Pt 4f spectra can be fitted withthree pairs of peaks. This indicates that there are twodifferent oxidation states present for Pd and three differentoxidation states of Pt on the fiber surface after adsorption.The Pd 3d peaks at 335.1 and 337.5 eV (Fig. 11) may5 / 2
0 21readily be assigned to Pd and Pd , respectively, accord-ing to the literature [1]. The Pt 4f peaks at 71.1, 72.57 / 2
0 21 41and 74.2 eV are also easily assigned to Pt , Pt and Pt ,41respectively [1]. The generation of Pt may be due to the
21 0 41reaction 2Pt →Pt 1Pt .0 21The percentages of Pd and Pt calculated at each of
the three electron take-off angles are also shown in Fig. 110and 12. The relative amount of Pd is greatest closer to the
0 21surface. For example, the Pd and Pt percentages were˚28 and 72% in the outer |20 A (108 take-off angle) versus
˚13 and 87%, respectively, in the outer |100 A (908
take-off angle). A similar phenomenon is observed with Pt.˚The amount of Pt8 falls from |54% in the outer |20 A
˚(108 take-off angle) to |23% in the outer |100 A (9080 0take-off angle). However, the overall Pd and Pt content
in the oxidized fibers is relatively small. No significant0 0X-ray diffraction patterns of Pd and Pt can be observed
21 21Fig. 7. X-ray diffraction patterns of electrochemically oxidized from the oxidized fibers after adsorption in Pd and Pt1 31 21carbon fibers before and after adsorption of Ag , Au , Pd and solutions.
21Pt .
˚is fairly evenly distributed within the outer 100 A while 4. Conclusionsthe distribution of Pt (Fig. 10) is more concentrated on the
˚outermost surface (|20 A) and becomes depleted more In contrast to oxygen plasma and nitric acid-treatedrapidly with increasing depth. Moreover, the O 1s/C 1s carbon fibers, electrochemically oxidized carbon fibers
1adsorb a large amount of Ag . The amount of adsorbed1Ag reached 3700 mmol /g on fibers oxidized to 5652
1C/g. This value approached the 4050 mmol /g of Agwhich adsorbed onto steam activated Kenaf-based carbonunder the same conditions. The Kenaf carbon was shown
2to have 1284 m /g of N /BET surface area [4]. More than21three times that much Ag was adsorbed by ECF oxidized
2to 9540 C/g despite the fact its surface area of 115 m /gwas only one-tenth that of the Kenaf carbon. Two kinds of
1adsorption processes occur during Ag adsorption. One is1ion exchange adsorption between Ag and acidic functions
(carboxyl groups). The second is the redox adsorption of0 1Ag when Ag is reduced by multiple hydroxyl functions
(e.g. such as catechol-like structures) on the electrochemi-cally oxidized carbon fibers (ECF). The extent of redox
31 reaction can be approximately expressed by the reaction’sFig. 8. Au adsorption onto electrochemically oxidized carbonelectric potential (E) using the Nernst equation. For afibers as a function of the extent of oxidation pH value of AuCl3given level of fiber oxidation, the extent of this redoxinitial solution was 2.0; volume of solution was 25 ml; weight of
1reaction depended mainly on the [Ag ] and the pH of thefibers was about 0.04 g; initial concentration of AuCl was 5 mM;3
T5258C; t524 h. solution in which the ECF was immersed.
1616 Z.R. Yue et al. / Carbon 37 (1999) 1607 –1618
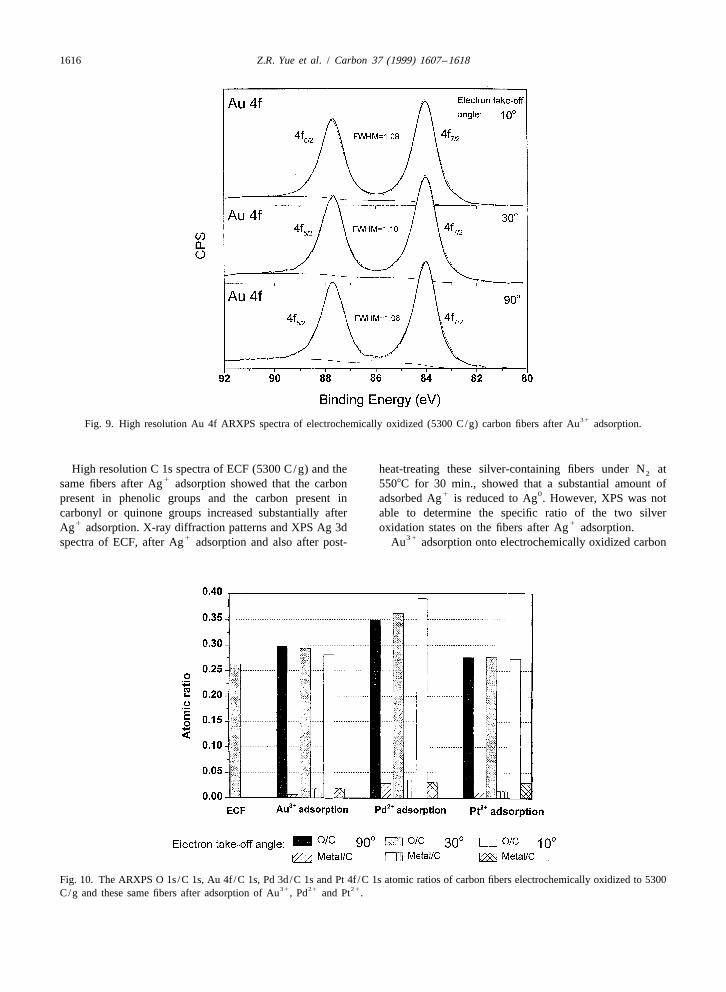
31Fig. 9. High resolution Au 4f ARXPS spectra of electrochemically oxidized (5300 C/g) carbon fibers after Au adsorption.
High resolution C 1s spectra of ECF (5300 C/g) and the heat-treating these silver-containing fibers under N at21same fibers after Ag adsorption showed that the carbon 5508C for 30 min., showed that a substantial amount of
1 0present in phenolic groups and the carbon present in adsorbed Ag is reduced to Ag . However, XPS was notcarbonyl or quinone groups increased substantially after able to determine the specific ratio of the two silver
1 1Ag adsorption. X-ray diffraction patterns and XPS Ag 3d oxidation states on the fibers after Ag adsorption.1 31spectra of ECF, after Ag adsorption and also after post- Au adsorption onto electrochemically oxidized carbon
Fig. 10. The ARXPS O 1s/C 1s, Au 4f /C 1s, Pd 3d/C 1s and Pt 4f /C 1s atomic ratios of carbon fibers electrochemically oxidized to 530031 21 21C/g and these same fibers after adsorption of Au , Pd and Pt .
Z.R. Yue et al. / Carbon 37 (1999) 1607 –1618 1617
Table 1Atomic ratios obtained from ARXPS spectra of electrically
13 13oxidized carbon fiber before and after adsorption of Au , Pd ,12and Pt
Fiber Take-off angle (8)
Oxygen/carbon Metal /carbona batomic ratio atomic ratio
90 30 10 90 30 10
ECF – 0.26 – – – –(5300 C/g)
13ECF/Au 0.30 0.29 0.28 0.0072 0.018 0.01912ECF/Pd 0.35 0.36 0.39 0.029 0.036 0.031
12ECF/Pt 0.28 0.28 0.25 0.011 0.014 0.031a ARXPS O 1s/C 1s spectral results.b ARXPS Ag 3d/C 1s, Au 4F/C 1s, Pd 3d/C 1s and Pt 4f /C 1s
spectral results.
fibers versus the extent of oxidation indicated that the31amount of Au adsorption was only one third of the
1 31adsorbed Ag due to the fact that Au needs three0 1electrons to be reduced to Au , but Ag needs only one to
0generate Ag .21 21Adsorptions of Pd and Pt were carried out quali-
Fig. 12. High resolution ARXPS Pt 4f spectra of electrochemical-tatively. High resolution ARXPS Pd 3d and Pt 4f spectra 21ly oxidized (5300 C/g) carbon fibers after Pt adsorptionshow that each Pd 3d spectrum can be fitted with two pairof peaks, and each Pt 4f spectra can be fitted with threepair of peaks, suggesting that there are two different showed a significant increase in the concentration of both
0 12 0 0valences for Pd (Pd , Pd ) and three different valences Pd and Pt with decreasing electron take-off angle0 12 14 0 0for Pt (Pt , Pt , Pt ) in the fibers’ surface after indicating that Pd and Pt are present primarily in the
adsorption. The calculated percentages of peak areas outermost surface of oxidized fibers.
21Fig. 11. High resolution ARXPS Pd 3d spectra of electrochemically oxidized (5300 C/g) carbon fibers after Pd adsorption
1618 Z.R. Yue et al. / Carbon 37 (1999) 1607 –1618
[10] Xie Y, Sherwood PMA. Chem Mater 1990;2:293.Acknowledgements[11] Moulder JF, Stickle WF, Sobol PE, Bomben KD. In: Chastin
J, editor, Handbook of X-ray Photoelectron Spectroscopy,This research was supported in part by the NationalEden Prairie, MN: Perkin-Elmer Corp, 1992, p. 253.Science Foundation through Grants no. OSR-9452857 and
[12] Pittman Jr. CU, Jiang W, He GR, Gardner SD. Carbonno. EPS-9452857. Support from the State of Mississippi1998;36:25.
and Mississippi State University is also gratefully ack- [13] Pittman Jr. CU, Wu Z, Jiang W, He G-R, Wu B, Li W,nowledged. C.U. Pittman, Jr. and S.D. Gardner wish to Gardner SD. Carbon 1997;35(7):929.acknowledge the National Science Foundation (Grant [14] Perakslis ED, Gardner SD, Pittman Jr. CU. J Adhes Scino.CTS-9212295), Mississippi State University and the Technol 1997;11(4):531.Department of Chemical Engineering for funding to pur- [15] Gardner SD, Singamsetty CSK, He G-R, Pittman Jr. CU.
Appl Spectrosc 1997;51(4):636.chase the XPS/ISS instrumentation.[16] Pittman Jr. CU, He G-R, Wu B, Gardner SD. Carbon
1997;35(3):317.[17] Gardner SD, Singamsetty CSK, Wu Z, Pittman Jr. CU. SurfReferences
Interface Anal 1996;24:311.[18] Allred RE, Schimpf WC. J Adhes Sci Technol 1994;8:383.
[1] Ehrburger P, Mahajan OP, Walker Jr. PL. J Catal 1976;43:61. [19] Smiley RJ, Delgass WD. J Mater Sci 1993;28:3601.[2] Kim KT, Chung JS, Lee KH, Kim YG, Sung JY. Carbon [20] Yuan LY, Chen CS, Shyu SS, Lai JY. Compos Sci Technol
1992;30:467. 1992;45:1.[3] Zeng HM, Fu RW. Technology of Water Treatment [21] Ehrburger P, Dentzer J, Lahage J. Carbon 1987;25:129.
1989;15:132. [22] Fu R, Zeng H, Lu Y. Carbon 1994;32:593.[4] Pittman CU. Jr, Jiang W., Yue Z. R, Leon y Leon CA, [23] Fu R, Zeng H, Lu Y. Carbon 1993;31:1089.
Carbon 1999;37:85–96. [24] Fu R, Ng CF, Zeng H. Carbon 1995;33:657.[5] Pittman CU Jr, Jiang W, Yue ZR, Gardner S, Wang L, [25] Heal GR, Mkagala LL. Carbon 1988;26:815.
Toghiani H, Leon y Leon CA, Carbon 1998 (submitted for [26] Puri BP, Singh S, Mahajan DP. Indian J Chem 1965;3:54.publication). [27] Gardner SD, Singamsetty CSK, Booth GL, He G, Pittman Jr.
[6] Yue ZR, Jiang W, Wang L, Gardner SD, Pittman CU Jr, (to CU. Carbon 1995;33:587.be published). [28] Oya A, Yoshida S, Abe Y, Izuka T, Makiyama N. Carbon
[7] Jiang W, Mississippi State University, PhD thesis, 1999. 1993;31:71.[8] Hillebrand WF, Lundell GEF, Bright HA, Hoffman JI. Appl [29] Oya A, Wakahara T, Yoshida S. Carbon 1993;31:1243.
Inorg Anal. In: 2nd, New York: Wiley, 1953, p. 207.[9] Zhen MJ, Li Hua, Jian Yan. Carbon 1989;22:365.