Oxidized carbon nanofiber/polymer composites prepared by chaotic mixing
13
Oxidized carbon nanofiber/polymer composites prepared by chaotic mixing Guillermo A. Jimenez, Sadhan C. Jana * Department of Polymer Engineering, University of Akron, 250 South Forge Street, Akron, OH 44325, USA Received 12 March 2007; accepted 19 May 2007 Available online 2 June 2007 Abstract Composites of oxidized carbon nanofibers (ox-CNFs) and polymethyl methacrylate and thermoplastic polyurethane (TPU) were pre- pared in a chaotic mixer and their electrical and mechanical properties were compared with those prepared using untreated carbon nanofibers (CNFs). X-ray photoelectron spectroscopy data of ox-CNFs showed higher oxygen to carbon ratio than CNFs indicating the presence of polar functional groups on the surfaces of ox-CNFs. Consequently, dispersion of ox-CNFs improved in both polymers and the resultant composites showed improved thermal-oxidative stability, higher storage modulus, and higher glass transition temper- ature. The electrical conductivity, however, decreased with improved nanofiber dispersion. In the case of TPU/ox-CNF composites, maxi- mum values of tensile strength and Young’s modulus were obtained with 1 wt.% fiber content; higher amounts of ox-CNFs promoted phase mixing of soft and hard segment domains and consequently caused a reduction in tensile properties. Ó 2007 Elsevier Ltd. All rights reserved. 1. Introduction Achieving good dispersion of carbon nanofibers (CNFs) and carbon nanotubes in polymers still remains a challenge. Researchers have attempted many different approaches including mixing in solution by sonication [1,2], in situ poly- merization [3,4], and high shear melt mixing [5–9]. Melt mixing is by far the most popular method for its ready application in thermoplastics industry and ready availabil- ity of a series of high shear mixing devices – extruders [5–7] and internal mixers [8,9] have been primarily used to fabricate polymer/CNFs composites. Several surface treatment techniques have been shown to enhance interactions between CNFs and polymer chains. Purification and cleaning [10], coating by plasma polymeri- zation [11], acid oxidation [12], and plasma oxidation [13] have all been used to disentangle the nanofibers, to remove non-graphitic carbon, and to introduce functional groups in order to promote hydrophilicity on the fiber surfaces. Intro- duction of oxygen- or nitrogen-containing functional groups on the surfaces of CNFs is used as a tool to improve dispersion. It was observed that acid-treated carbon nano- fibers remained dispersed in water for several hours without agglomeration, while untreated CNFs agglomerated almost immediately [14]. The differences in dispersability of untreated and acid-treated CNFs were investigated using 1-napthol (1-NP) as an in situ fluorescent probe, whereby 1-NP molecules formed hydrogen bonds with oxygen-con- taining functional groups on acid-treated CNFs [15]. Sev- eral surface treatment methods, however, may introduce significant defects into the fibers, potentially affecting their intrinsic properties, such as electrical conductivity. Darm- stadt et al. [16] found that air-oxidation of CNFs affected not only its texture and chemical surface but also its gra- phitic structure. Acid and plasma treatment, on the other hand, have been found not to harm severely the graphitic structure of CNFs as reported by Serp et al. [17], although Toebes et al. [18] reported increase of specific surface area and pore volume upon acid treatment, purportedly due to opening of the inner tubes in CNFs. It has been observed that the mechanical properties of polymer composites containing oxidized CNFs are generally 0008-6223/$ - see front matter Ó 2007 Elsevier Ltd. All rights reserved. doi:10.1016/j.carbon.2007.05.015 * Corresponding author. Fax: +1 330 258 2339. E-mail address: [email protected] (S.C. Jana). www.elsevier.com/locate/carbon Carbon 45 (2007) 2079–2091
-
Upload
independent -
Category
Documents
-
view
1 -
download
0
Transcript of Oxidized carbon nanofiber/polymer composites prepared by chaotic mixing

www.elsevier.com/locate/carbon
Carbon 45 (2007) 2079–2091
Oxidized carbon nanofiber/polymer composites preparedby chaotic mixing
Guillermo A. Jimenez, Sadhan C. Jana *
Department of Polymer Engineering, University of Akron, 250 South Forge Street, Akron, OH 44325, USA
Received 12 March 2007; accepted 19 May 2007Available online 2 June 2007
Abstract
Composites of oxidized carbon nanofibers (ox-CNFs) and polymethyl methacrylate and thermoplastic polyurethane (TPU) were pre-pared in a chaotic mixer and their electrical and mechanical properties were compared with those prepared using untreated carbonnanofibers (CNFs). X-ray photoelectron spectroscopy data of ox-CNFs showed higher oxygen to carbon ratio than CNFs indicatingthe presence of polar functional groups on the surfaces of ox-CNFs. Consequently, dispersion of ox-CNFs improved in both polymersand the resultant composites showed improved thermal-oxidative stability, higher storage modulus, and higher glass transition temper-ature. The electrical conductivity, however, decreased with improved nanofiber dispersion. In the case of TPU/ox-CNF composites, maxi-mum values of tensile strength and Young’s modulus were obtained with 1 wt.% fiber content; higher amounts of ox-CNFs promotedphase mixing of soft and hard segment domains and consequently caused a reduction in tensile properties.� 2007 Elsevier Ltd. All rights reserved.
1. Introduction
Achieving good dispersion of carbon nanofibers (CNFs)and carbon nanotubes in polymers still remains a challenge.Researchers have attempted many different approachesincluding mixing in solution by sonication [1,2], in situ poly-merization [3,4], and high shear melt mixing [5–9]. Meltmixing is by far the most popular method for its readyapplication in thermoplastics industry and ready availabil-ity of a series of high shear mixing devices – extruders[5–7] and internal mixers [8,9] have been primarily used tofabricate polymer/CNFs composites.
Several surface treatment techniques have been shown toenhance interactions between CNFs and polymer chains.Purification and cleaning [10], coating by plasma polymeri-zation [11], acid oxidation [12], and plasma oxidation [13]have all been used to disentangle the nanofibers, to removenon-graphitic carbon, and to introduce functional groups inorder to promote hydrophilicity on the fiber surfaces. Intro-
0008-6223/$ - see front matter � 2007 Elsevier Ltd. All rights reserved.doi:10.1016/j.carbon.2007.05.015
* Corresponding author. Fax: +1 330 258 2339.E-mail address: [email protected] (S.C. Jana).
duction of oxygen- or nitrogen-containing functionalgroups on the surfaces of CNFs is used as a tool to improvedispersion. It was observed that acid-treated carbon nano-fibers remained dispersed in water for several hours withoutagglomeration, while untreated CNFs agglomerated almostimmediately [14]. The differences in dispersability ofuntreated and acid-treated CNFs were investigated using1-napthol (1-NP) as an in situ fluorescent probe, whereby1-NP molecules formed hydrogen bonds with oxygen-con-taining functional groups on acid-treated CNFs [15]. Sev-eral surface treatment methods, however, may introducesignificant defects into the fibers, potentially affecting theirintrinsic properties, such as electrical conductivity. Darm-stadt et al. [16] found that air-oxidation of CNFs affectednot only its texture and chemical surface but also its gra-phitic structure. Acid and plasma treatment, on the otherhand, have been found not to harm severely the graphiticstructure of CNFs as reported by Serp et al. [17], althoughToebes et al. [18] reported increase of specific surface areaand pore volume upon acid treatment, purportedly due toopening of the inner tubes in CNFs.
It has been observed that the mechanical properties ofpolymer composites containing oxidized CNFs are generally

2080 G.A. Jimenez, S.C. Jana / Carbon 45 (2007) 2079–2091
improved [12,13,19,20], although some authors reportedreduction in electrical conductivity due to oxidation [12].Carbon nanofibers with more perfect graphitic charactershow higher electrical conductivity in composites than com-posites made with more defective as-grown CNFs [19]. Sim-ilar results have been reported for epoxy systems containingsingle- [21] and multi-walled carbon nanotubes [22].
In this work, composites of polymethyl methacrylate(PMMA) and thermoplastic polyurethane (TPU) and oxy-gen-rich carbon nanofibers (ox-CNFs) were prepared in achaotic batch mixer. Both PMMA and TPU possess polarfunctional groups containing oxygen or nitrogen. It wasanticipated that such polar functional groups would facili-tate dispersion of oxidized carbon nanofibers and presentunfavorable interactions with untreated CNFs. Chaoticmixing was used in view of its potential in producing excel-lent mixing under low shear conditions so as to preventappreciable fiber damage. High mixing efficiency of chaoticmixers are derived from the exponential stretching and fold-ing of the polymer, which increases the interfacial area ofthe nanofibers for potential interactions with the polymer[23–29]. There are a few reports on polymer–carbon com-posites fabricated by chaotic mixing, e.g., low percolationthreshold in polystyrene and carbon black composites frommixing of pre-concentrate with polystyrene [30,31], or muchreduced percolation threshold by double percolation net-works in blends of 1 wt.% carbon black, 10 wt.% polypro-pylene, and polyamide-6 [32]. We have reported recentlythat electrically conductive composites of PMMA anduntreated CNFs can be easily fabricated by a two-dimen-sional chaotic mixer from as-received CNFs [33,34]. Thelow shear nature of the chaotic mixer with maximum shearrate less than 15 s�1 caused little damage to the fibers andthe self-similar mixing microstructures helped build carbonnanofiber networks. Consequently, only 2 wt.% CNFs wasneeded to obtain percolation networks compared to6 wt.% CNFs in the case of a commercial mixer under sim-ilar conditions of shear. Schueler et al. [35] observed thatagglomerates of carbon black are responsible for low per-colation thresholds in carbon black-epoxy systems.
Our goal in this work was to investigate if and how ox-CNFs would disperse when melt mixed in PMMA andTPU in the chaotic mixer. The following specific issueswere investigated. First, improved interaction with polarpolymers is a norm for ox-CNFs. However, it was not clearat the outset if such interaction would dramaticallyimprove dispersion considering that the nanofibers werereceived as bundles. Second, the key issue of a balancebetween the degree of dispersion and composite electricalconductivity needs to be explored, especially as ox-CNFshave high aspect ratios. Third, oxidation and other treat-ments of CNF are known to reduce intrinsic electrical con-ductivity of CNF. It remains to be seen as to how suchreduction impacts the electrical conductivity of the com-posites, especially since the fibers were available as bundles.In addition, chaotic mixers present much different mixingmicrostructures and cause much less fiber damage com-
pared to commercial mixing devices, therefore, may yielddifferent results than reported in literature.
2. Experimental
2.1. Materials
PMMA Perspex CP-80 was obtained in the form of pellets kindly sup-plied by Lucite International (Cordova, TN) with a melt flow index of 1.8(ASTM D 1238) and density of 1.19 g/mL (ASTM D 792). The pelletswere grinded, screened into particles with sizes no larger than 2 mm,and dried at 90 �C under vacuum for 24 h. TPU was synthesized withpolyether-based polypropylene glycol (Arcol PPG-2000) soft segments ofmolecular weight 2000 supplied by Bayer (Pittsburgh, PA), and a hard seg-ment based on 4,4 0-diphenylmethane diisocyanate, MDI (Bayer) andchain extender 1,4-butanediol, BDO from Avocado (Ward Hill, MA).Dibutyltin dilaurate (DABCO 120�, Air Products, Allentown, PA) wasused as the catalyst for chain extension. The isocyanate (NCO) to hydro-xyl (OH) molar ratio was maintained at 1.05 with a hard segment contentof 23 wt.%. The prepolymer was prepared by reacting MDI and PPG in athree-neck flask at 80 �C under nitrogen atmosphere for 5 h and 30 min.The prepolymer was then stored in a sealed container under nitrogengas for future use.
Untreated carbon nanofibers (CNFs) and oxidized carbon nanofibers(ox-CNFs) grades PR-24-PS and PR-24-PS-ox, respectively were providedby Applied Sciences Inc. (Cedarville, OH) both with a density of 1.95g/mL, fiber diameters around 200 nm, and average length around65 lm. Oxidized nanofibers were obtained by air-oxidation of CNFs at400–500 �C [36] – a detailed account of the surface treatment process,however was not disclosed by the supplier. The nanofibers were dried at125 �C in vacuum for 24 h.
2.2. Composite preparation
A series of PMMA/CNFs and PMMA/ox-CNFs composites were pro-duced in a two-dimensional low-shear batch chaotic mixer. The mixingchamber volume was 33 cm3 with a mixing gap of 12.5 mm with rotorsof 12.5 mm radius. A second chaotic mixer was used to prepare TPU/CNFs and TPU/ox-CNFs composites. This mixer had a volume of70 cm3, rotors with a radius of 12.5 mm, and a mixing gap of 7.62 mm.A detailed account of the chaotic mixer designs and operation is presentedelsewhere [33,34,37–40]. The composite materials were produced by usinga sinewave protocol, with angular speeds of rotors A (XA) and B (XB) var-ied as XA ¼ X 1þ cos 2pt
T
� �, and XB ¼ X 1� cos 2pt
T
� �, where X is the ampli-
tude, and t and T are time and time-period, respectively. The value of thechaotic mixing parameter, h (� XT), was chosen to be 8p radians whichprovided globally chaotic flow in the mixer. The maximum rotor speedwas 0.144 m/s and the time-period was 6 s. This resulted in a time-aver-aged shear rate of 6.2 s�1 in the mixer.
PMMA powder and carbon nanofibers were first premixed in a plasticbag, poured into the mixing chamber and mixed for 4 min at 230 �C. TPU/carbon nanofiber composites were prepared by hand-mixing stoichiometricamounts of the prepolymer, BDO, tin catalyst (concentration 7.9 ·10�4 mol/L), and corresponding amounts of CNFs or ox-CNFs. Themixture was poured into the chaotic mixer preheated at 80 �C, and mixedfor 90 min at 80 �C in order to obtain good dispersion of the nano-fibers, and to ensure complete conversion of prepolymer and BDO intopolyurethane. TPU composite materials were collected from the chamber,molded by compression, and kept at room temperature for further analysis.
2.3. Characterization
2.3.1. Surface analysis
Specimens of the as-received CNFs and ox-CNFs were subjected toX-ray photoelectron spectroscopy analysis (XPS), in order to determine

G.A. Jimenez, S.C. Jana / Carbon 45 (2007) 2079–2091 2081
the ratio oxygen-to-carbon in the nanofibers surface. XPS was performedunder high vacuum conditions with a pressure of 1 · 10�8 Torr, an alumi-num anode, and scans were taken with 1 eV resolution.
2.3.2. Volume electrical conductivity
The eight-shaped PMMA composite blocks obtained from the chaoticmixer were cut into halves for measurement of volume electrical conduc-tivity. The electrical conductivity along the longitudinal direction wasmeasured by applying a layer of silver paste to the edges of the specimento ensure good contact with the electrodes. Compressed sheets of TPUcomposite materials were placed in a Keithley 8009 Resistivity Test Cham-ber (Keithley, Cleveland, OH) for electrical conductivity measurements.Both electrode configurations were connected to a Keithley 487 picoam-meter/voltage source (Cleveland, OH), from which electrical resistance,and consequently, volume electrical resistivity and conductivity were cal-culated according to ASTM D 257 method. A maximum error of 10%was incurred in these measurements.
2.3.3. Thermal and thermo-mechanical properties
Thermal properties such as glass transition temperature, (Tg) and hardsegment melting point (Tm) of TPU composites were determined using aTA Instruments 2920 DSC (New Castle, DE) at a heating rate of 10 �C/min from �100 to 230 �C. Dynamic mechanical analysis (DMA) was per-formed in tensile mode at 3 �C/min under nitrogen atmosphere, and 1 Hzfrequency using a Pyris Diamond DMA, from Perkin Elmer-Seiko Instru-ments (Boston, MA). PMMA composites were heated from room temper-ature to 140 �C, while TPU composites were scanned from �90 to 40 �C.Thermo-oxidative stability of TPU and PMMA composites were investi-gated in a TGA 2050 device from TA Instruments (New Castle, DE).Specimens weighing ca. 6 mg were subjected to thermal scan from roomtemperature up to 1000 �C, at a scan rate of 20 �C/min under static airfor PMMA composites, and under nitrogen gas for TPU composites.The temperatures at 5% mass loss (T1), maximum rate of mass loss (T2),and the end of thermal degradation process (T3) were determined.
2.3.4. Phase separation
The extent of phase separation in TPU composites was determined byinfrared spectroscopy. The hydrogen bonding index, R was determinedfrom the ratio of areas of deconvoluted peaks corresponding to hydro-gen-bonded (�1700 cm�1) and free carbonyl group (�1730 cm�1). Filmsof TPU were cast on KBr disc from a solution in dimethylformamide.FT-IR spectra were recorded from 4000 to 800 cm�1 with a Perkin Elmer16 PC FT-IR (Wellesley, MA) in transmission mode, and 4 cm�1
resolution.
2.3.5. Tensile properties
Tensile properties of the TPU composites were analyzed by means ofan Instron 5567 machine (Norwood, MA) with a crosshead speed of100 mm/min, gauge length of 20 mm, and 100 N load cell.
Fig. 1. SEM images of (a) C
2.3.6. Morphological analysis
Thin slices of 40–70 lm thickness were cut from samples of PMMAcomposites along the flow direction by using an Isomet low-speed saw(Buehler, Lake Bluff, IL). Optical micrographs of the slices were takenwith a Leitz Laborlux 12 Pol S optical microscope (Oberkochen, Ger-many) in transmission mode. Optical images were taken with a DiagnosticInstruments Inc. 11.2 Color Mosaic digital camera (Sterling Heights, MI),and analyzed using Image Tool Version 3.00 software. Scanning electronmicroscopy (SEM) was used to reveal the state of the fiber agglomeratesand the nature of the fiber–matrix interface in the planes of fractured spec-imens. Sample specimens were coated with silver using a K575x sputtercoater from Emitech (Kent, England) under argon gas atmosphere. Sur-face morphology was observed using a SEM S-2150 from Hitachi (Ibaraki,Japan) at 20 kV. Thin sections of about 200 nm were cut from TPU com-posites along the flow direction by a cryo ultramicrotome (Microstar,Huntsville, TX) with a glass knife at �80 �C and collected on a coppergrid. In addition, films of TPU solutions in dimethylformamide were caston a copper grid. These latter samples revealed the state of fibers in com-posites without artificial sectioning by the microtoming technique. Trans-mission electron microscopy (TEM) images were taken using Tecnai-12TEM, from FEI (Hillsboro, OR) with an operating voltage of 120 kV.
3. Results and discussion
3.1. Fibers morphology and surface chemistry
Fig. 1a and b shows scanning electron micrographs ofas-received CNFs and ox-CNF, respectively. The as-received CNFs were more entangled than ox-CNFs – somefibers were available as bundles and knotted together bylayers of amorphous carbon shown as the encircled whitespots in Fig. 1. These knots potentially acted as deterrentto dispersion during mixing. It is apparent from Fig. 1bthat much less amorphous carbon was present in ox-CNFs.These fibers also differed by the extent of their hydrophilic-ity. For example, a stable dispersion was obtained in thecase of the oxidized carbon nanofibers when equal amountsof nanofibers were added to the same volume of deionizedwater and mechanically mixed (Fig. 2). On the other hand,a majority of fibers either sank or floated in the case ofCNFs. This indicates that ox-CNFs possess a higher degreeof hydrophilicity than CNFs due to the presence of oxygen-containing functional groups such as alcohol, carbonyl,and carboxyl on the surface, as will be revealed later. Sim-ilar behavior has been observed in the case of carbon
NFs and (b) ox-CNFs.

Fig. 2. Dispersion of carbon nanofibers in deionized water: (a) CNFs and(b) ox-CNFs.
280285290295300
Graphitic carbon
COOH,COOR
6008001000
Binding En
Binding Energy (eV)
Inte
nsity
(a.
u.)
Inte
nsity
(a.
u.)
CNFs
O(1s)
ox-CNFs
a
b
Fig. 3. (a) Full XPS spectra of carbon nanofibers. C
2082 G.A. Jimenez, S.C. Jana / Carbon 45 (2007) 2079–2091
nanofibers oxidized in a mixture of nitric and sulfuric acid[25].
X-ray photoelectron spectroscopy, XPS was used toinvestigate the chemical composition of fiber surfaces. Thistechnique has been used extensively to characterize carbonmaterials, and specifically carbon nanofibers which havebeen surface treated [41–45]. From XPS data, chemicalinformation up to a 10 nm depth can be obtained whencore electrons are excited by X-ray irradiation [46]. Nor-mally carbon materials show two main peaks assigned tocarbon and oxygen, C (1s) and O (1s), respectively. MostXPS studies on the surface chemistry of carbon materialsinvolve C (1s) analysis which shows one graphitic peak at284.6 eV and four oxide peaks: 286.3 eV assigned to –C–OH or –C–O–C–; 287.7 eV assigned to –C@O; 289.4 eVcorresponding to –COOH or –COOR, and 290.6 eV corre-sponding to –COO– and the p–p* shake-up satellite [43–45,47,48]. Fig. 3a shows the XPS spectra of CNFs andox-CNFs. In the case of CNFs, only C (1s) produced a sig-nal with significant intensity, while in the case of ox-CNFs,C (1s) and O (1s) generated significant peaks. A very smallpeak due to O (1s) at about 530 eV still can be observed for
280285290295300
Inte
nsity
(a.
u.)
Graphitic carbon
COOH,COOR
C=O
00200400
ergy (eV)
Binding Energy (eV)
C(1s)
c
(1s) XPS spectra of (b) CNFs and (c) ox-CNFs.

G.A. Jimenez, S.C. Jana / Carbon 45 (2007) 2079–2091 2083
CNFs. The oxygen to carbon ratio determined from thearea under the C (1s) and O (1s) peaks in Fig. 3(a) are pre-sented in Table 1. Generally, oxygen is the most commonforeign element present on carbon materials which arechemisorbed on the edge carbon atoms [49]. Fig. 3 alsoshows the deconvolution of C (1s) peaks from high-resolu-tion XPS of CNFs (Fig. 3b) and ox-CNFs (Fig. 3c). Theincrease of oxygen-containing functional groups – mostlyC@O groups – on the ox-CNFs surface is clear from thechange in asymmetry of the C (1s) peak toward higher val-ues of binding energies corresponding to non-graphiticC (1s). Consequently, better dispersion in water seen inFig. 3 can be attributed to the presence of hydrophilic func-tional groups on ox-CNFs.
100 mμ
a
0
0.1
0.2
0.3
0.4
5-10 15-20 25-30 35-40 45-50 55-60
Size range (μm
Freq
uenc
y
100 mμ
Fig. 4. Optical micrographs of PMMA composites with 2 wt.% nanofibers: (awith corresponding particle size distribution.
Table 1Oxygen to carbon ratio present on the carbon nanofibers
Carbon nanofiber Ratio of area under peaks O (1s)/C (1s)
CNFs 0.015ox-CNFs 0.13
3.2. Morphological analysis
Optical microscopy revealed that nanofiber compositesof ox-CNFs showed much better dispersion as presentedin Fig. 4. It is worth noting that mixing conditions wereidentical, and equal amount of carbon nanofibers to thoseused in the case of CNFs were used. Carbon agglomerateswere of much reduced size for PMMA/ox-CNFs as it isseen from the particle size distribution in Fig. 4c obtainedfrom optical micrographs as those shown in Fig. 4a and b.Close inspection of Fig. 4a and b shows that a large frac-tion of agglomerates in the case of ox-CNFs were smallerthan 15 lm. In addition, some agglomerates with size lar-ger than 100 lm could be seen in the case of CNFs, whilethey were absent in the case of ox-CNFs. This is a ramifi-cation of the improvement in dispersion, owing to betterpolymer–fiber interactions by the polar functional groupson the fibers.
The evidence of better polymer–fiber interface is alsomanifested with good wetting between the fibers and thematrix. It is seen in Fig. 5 (circled areas) that carbon nano-fibers were more wetted by the polymer in PMMA/
100 m
b
65-70 75-80 85-90 95-100 150-200
)
CNFs
ox-CNFs
c
μ
) CNFs and (b) ox-CNFs. Arrow indicates flow direction. (c) Histogram

Fig. 5. SEM of the fractured surface of PMMA composites having 2 wt.%of (a) CNFs and (b) ox-CNFs. Some nanofibers are circled for comparison.
Fig. 7. TEM image of cast films of TPU/3 wt.% ox-CNF.
2084 G.A. Jimenez, S.C. Jana / Carbon 45 (2007) 2079–2091
ox-CNFs composites, which in turn produced better fiberdispersion in the matrix. TEM images of thin sections ofTPU composites with 3 wt.% of CNFs and ox-CNFs areshown in Fig. 6. Good dispersion and alignment of the car-bon nanofibers can be observed for both types of compos-ites. In each case, good dispersion was obtained due to longmixing time during preparation of these composites. Oneimportant feature of 2D chaotic mixing is the possibilityof fiber alignment, which can be seen in Fig. 6 as well. Ina previous report [34] we observed alignment of CNFs in
Fig. 6. TEM images of thin sections of 3 wt.% TPU
PMMA along the flow direction in composites preparedin the chaotic mixer, which resulted in much lower percola-tion threshold.
Any attempt to glean information on fiber damage fromthe TEM images in Fig. 6 would give us wrong informa-tion. First, it is likely that nanofibers were cut during sec-tioning due to their pronounced curved structure [50] andthat only portions of the fibers can be inspected in TEM.Second, only small portions of mixed materials are cap-tured by TEM images. To circumvent this, thin films werecast from solution of a bulk specimen in order to obtain abetter representation of the state of the nanofibers, therebyallowing the observation of the real length of the fibers inmixed materials. Fig. 7 shows TEM micrographs of suchcast thin films of TPU composite with 3 wt.% ox-CNFs.It is seen that nanofibers in mixed materials were of muchreduced length compared to the original fiber length. It isseen that after processing, nanofibers with typical lengthsof 4 lm represents a 96% length reduction from the origi-nal fiber size (�100 lm). This reflects the effect of the longmixing time (90 min) used to prepare the nanocomposite inthe chaotic mixer and much less the effect of shear, whichwas low.
composites with (a) CNFs and (b) ox-CNFs.

G.A. Jimenez, S.C. Jana / Carbon 45 (2007) 2079–2091 2085
3.3. Thermal and thermo-oxidative stability
Thermo-oxidative stability (TOS) of PMMA/ox-CNFcomposites were also evaluated and compared withPMMA/CNF composites. Fig. 8 shows the first derivativeof mass loss vs. temperature curves for PMMA/ox-CNFcomposites. Note that the temperature at maximum rateof mass loss (T2) is obtained from the peak of these curves.A higher value of T2 indicates higher thermal stability.Table 2 lists the values of T1, T2, and T3 for compositesof CNF and ox-CNF. It is evident that the presence ofox-CNFs also improved TOS of the polymer matrix as withuntreated CNFs (Fig. 8a, Table 2). However, T2 shiftedremarkably to higher values in the case of 6 and 10 wt.%of ox-CNFs (see Fig. 8b and Table 2). An increase in T2
by 70 �C with respect to that of unfilled PMMA is observedwith 6 wt.% of ox-CNFs content. On the other hand, theonset of oxidative decomposition, T1, barely changed inthe presence of 6 wt.% of CNFs, while the presence of
0.0
0.5
1.0
1.5
2.0
2.5
3.0
250 275 300 325 350 375 400 425
0.0
0.5
1.0
1.5
2.0
2.5
3.0
250 275 300 325 350 375 400 425Temperature (°C)
Temperature (°C)
Der
iv. W
eigh
t (%
/°C
)D
eriv
. Wei
ght (
%/°
C)
PMMA
1 wt.%
2 wt.%
6 wt.%
10 wt.%
PMMA1 wt.% 2 wt.% 6 wt.% 10 wt.%
Fig. 8. Derivative curves from thermogravimetric analysis data ofcomposites of PMMA with (a) CNFs and (b) ox-CNFs.
Table 2Thermo-oxidative degradation of PMMA and its composites with different co
T (�C) PMMA 1 wt.% 2 wt.%
CNF ox-CNF CNF
T1 306 305 293 NAT2 324 320 324 NAT3 355 359 393 NA
the same amount of ox-CNFs increased the value of T1
by 15 �C. This indicates a much better interaction betweenthe functionalized carbon nanofibers and polymer chains.Functional groups such as those carrying atomic oxygenon the carbon nanofiber surface may have interacted viadipole–dipole forces with carbonyl groups present in thePMMA macromolecules, therefore, restricting their motionupon heating. Additionally, enhancement of TOS in ox-CNFs composites can be explained on the basis of well dis-persed carbon nanofibers forming a barrier, thus hinderingthe transport of degradation products from the solid to thegas phase. This argument has been used to explain similarbehavior in polymer composites of nanoclay [51] and car-bon nanotubes [52].
The thermal stability of TPU composites was also inves-tigated. Fig. 9a and b shows the weight loss and its firstderivative vs. temperature, respectively. It can be seen thatT1 (�278 �C) did not change much while T2 of TPUincreased with the addition of merely 0.5 wt.% of CNFs,or ox-CNFs (from 346 to 380 �C). Thermal degradation ofTPUs is a complicated process as hard and soft segmentsrespond differently to elevated temperatures. It has beenfound that thermal degradation of TPU occurs in two stages[53,54]. In Stage I, decomposition of the hard segmentsoccurs, involving dissociation of urethane to the originalpolyol and isocyanate. In Stage II, depolycondensationand polyol degradation in the soft segments take place.Therefore, Stage I can be associated with the hard segmentsand T1, while Stage II can be related to the soft segments andT2. As it can be noticed from Fig. 9, T2 was more affected bythe presence of carbon nanofibers, which suggests that thenanofibers interacted more with the soft segment chains inTPU. Similar results were observed for TPU/multi-wall car-bon nanotube composites [53]. As in the case of PMMA/CNF composites, improvement in the thermal stability ofTPU may be explained on the basis of stabilization ofCNF-bonded macroradicals [55].
3.4. Thermo-mechanical behavior
Fig. 10 shows the values of storage modulus and tand ofPMMA and composites of 4 wt.% CNFs and ox-CNFs.These composites showed an increase of E 0 at room andelevated temperatures over PMMA (Fig. 10a), althoughthe enhancement was more prominent in the case of ox-CNFs. The storage modulus in the rubbery state at temper-atures above the Tg of PMMA (120–130 �C) showed rein-forcement only in the case of functionalized nanofibers,
ntent of CNF and ox-CNF
6 wt.% 10 wt.%
ox-CNF CNF ox-CNF CNF ox-CNF
293 309 323 304 313344 344 397 348 392395 385 406 387 404

0
20
40
60
80
100
20 120 220 320 420 520 620
Wei
ght (
%)
TPU
0.0
0.5
1.0
1.5
2.0
200 250 300 350 400 450 500
TPU
0.5 wt. % CNFs
0.5 wt. % CNFs
0.5 wt.% ox-CNFs
0.5 wt.% ox-CNFs
Der
iv. W
eigh
t (%
/°C
)
Temperature (°C)
Temperature (°C)
Fig. 9. Weight loss from thermogravimetric analysis under N2 of TPUcomposites with 0.5 wt.% of CNFs and ox-CNFs. (a) Mass loss; (b) firstderivative of mass loss.
0
0.4
0.8
1.2
1.6
2
20 40 60 80 100 120 140
PMMA
PMMA
PMMA/ox-CNFs (4 wt.%)
PMMA/ox-CNFs (4 wt.%)
PMMA/CNFs (4 wt.%)
PMMA/CNFs (4 wt.%)
E’(
GPa
)
0
0.4
0.8
1.2
1.6
90 100 110 120 130 140
tan
δ
Temperature (°C)
Temperature (°C)
Fig. 10. Dynamic mechanical properties of composites of PMMA and4 wt.% of CNFs or ox-CNFs. (a) Storage modulus, E 0, and (b) tand.
1.E+06
1.E+05
1.E+07
1.E+08
1.E+09
1.E+10
-90 -70 -50 -30 -10 10 30 50
E'(P
a)
1.E+06
1.E+07
1.E+08
1.E+09
1.E+10
E'(P
a)
0 wt.% 0.5 wt.%1 wt.% 3 wt.%
0 wt.% 0.5 wt.%1 wt.% 3 wt.%
Temperature (°C)
-90 -70 -50 -30 -10 10 30 50
Temperature (°C)
Fig. 11. Effect of nanofiber content on the storage modulus of (a) TPU/CNF and (b) TPU/ox-CNF composites.
2086 G.A. Jimenez, S.C. Jana / Carbon 45 (2007) 2079–2091
as is seen in Fig. 10a. In addition, the tand vs. temperatureplot in Fig. 10b shows a Tg increase in the case of compos-
ites of ox-CNFs. Such increase in Tg and the values of E 0 inthe rubbery plateau clearly indicates that the interactionbetween fibers and the polymer matrix was much higherin composites of ox-CNFs. Such additional increase canbe attributed to restriction imposed on the polymer chainsmobility by ox-CNFs which also influenced the values ofT2, as it was previously discussed. Similar observationshave been made for composites made of epoxy-vapor-grown graphite nanofibers [56].
Fig. 11 shows the effect of fiber content on the value ofstorage modulus of composites of TPU with CNFs and ox-CNFs. It can also be observed that the values of E 0 aroundthe glass transition are higher for composites with ox-CNFs, similar to what was observed in the case of PMMA.The increase in E 0 with fiber content indicates that carbonnanofibers also reinforced TPU. Similar reinforcement hasbeen observed for TPU with single- and multi-wall carbonnanotubes [53]. As in the case of PMMA, higher values ofE 0 around the glass transition in Fig. 11b indicates morefavorable interaction of ox-CNFs with TPU soft segmentchains. On the other hand, a drastic reduction of E 0 atroom temperature is seen for composites of 3 wt.% ox-CNFs. A shift of the tand peak to higher values, indicatinghigher soft segment glass transition temperature, Tg,SS canbe appreciated in Fig. 12 for TPU composites with ox-CNFs. Such increase has been reported for composites ofacid-treated multi-wall carbon nanotubes with TPU in con-trast with untreated multi-wall carbon nanotubes [57]. Thisincrease in Tg,SS also indicates an increase in phase mixingof TPU materials. This may be the reason for a decrease inthe value of storage modulus at room temperature for com-

0.0
0.2
0.4
0.6
0.8
1.0
1.2
-100 -80 -60 -40 -20 0 20 40
tan
δ
0.0
0.2
0.4
0.6
0.8
1.0
1.2
tan
δ
0 wt.%0.5 wt.%1 wt.%3 wt.%
0 wt.%0.5 wt.%1 wt.%3 wt.%
Temperature (°C)
-100 -80 -60 -40 -20 0 20 40
Temperature (°C)
Fig. 12. tand of (a) TPU/CNF and (b) TPU/ox-CNF composites.
G.A. Jimenez, S.C. Jana / Carbon 45 (2007) 2079–2091 2087
posites of 3 wt.% ox-CNFs (Fig. 11). In order to verify thisreasoning, it is important to analyze the data obtainedfrom the thermal transitions measured by DSC and theextent of phase separation determined by FTIR. Such anal-ysis will be presented later.
3.5. Electrical conductivity
Composites of PMMA and ox-CNFs, although showedbetter dispersion, showed poor electrical conductivity ascompared to composites of CNFs (Fig. 13). It is seen that
0 4 10
Carbon nanofiber content (wt %)
Vol
ume
cond
uctiv
ity, σ
(S/
cm)
CNFs
ox-CNFs
101
10-1
10-3
10-5
10-7
10-9
10-11
10-13
2 6 8
Fig. 13. Volume electrical conductivity of PMMA/CNF and PMMA/ox-CNF composites.
conductive composites were obtained with just 2 wt.% ofCNFs, while materials made with ox-CNFs were still insu-lators at that composition. A percolation model such asr = r0(/ � /c)
t [58,59] was applied to the electrical con-ductivity data of the PMMA–CNF system in Fig. 13. Inthis case, r is the electrical conductivity of the compositeat filler volume fraction /, r0 is the electrical conductivityof the filler, /c is the filler volume fraction for percolation(percolation threshold), and t is the power law exponent.The percolation threshold was estimated to be /c � 0.01(ca. 2 wt.% CNFs), with a power law exponent t � 2.45,and r0 � 30 S/cm. Note that this estimated value of r0 ismuch smaller than 18,000 S/cm, the electrical conductivityof a single fiber reported by the manufacturer [34]. It isimperative, however, that the electrical conductivity ofthe bulk CNFs, i.e., in powder form should be taken intoaccount in stead of a single fiber as CNFs were present inthe composites as agglomerates (Fig. 4). The bulk conduc-tivity of about 100 S/cm has been reported by a supplier ofCNFs [60], which compares well with the value of r0 esti-mated in this work. In the case of ox-CNFs, approximately6 wt.% of ox-CNFs was needed to elevate the electricalconductivity to only two orders of magnitude above theelectrical insulator level. This dramatic decrease in electri-cal conductivity seen with ox-CNFs can be attributed toimprovement of fiber dispersion (Fig. 4b and c), agglomer-ate reduction (Fig. 4c), and even loss of intrinsic electricalconductivity of ox-CNFs due to oxidation. Although weattempted to apply the percolation model for compositesof ox-CNFs, a percolation threshold could not be deter-mined as the conductivity value did not reach a plateaueven with 10 wt.% ox-CNFs (Fig. 13). It has been statedpreviously [33,34], that the dispersion of agglomeratesand their distribution by chaotic mixing play an importantrole in obtaining highly conductive materials. It has alsobeen determined that the electrical conductivity inPMMA/CNFs composites is strongly affected by para-meters such as mixing time and shear rate [33,34]. In thisstudy, the most likely reason why the electrical conductiv-ity dropped in composites of ox-CNFs is twofold. First,dispersion was enhanced i.e., more fibers are surroundedby polymer, thereby limiting the formation of conductivenetworks. Second, the number and size of the nanofiberagglomerates were reduced, thereby increasing the agglo-merate–agglomerate distance. Similar findings werereported for composites of oxidized carbon nanofibersand vinyl ester polymer by Xu et al. [12]. These authorsdetermined that even with up to 15 wt.% of nitric acid-trea-ted carbon nanofibers the composite materials exhibited noelectrical conductivity. They concluded that an oxygen-richsurface and the resin acted as electronic barrier between thecarbon nanofibers. Additionally, as it was mentioned ear-lier, carbon nanofibers might lose graphitic character uponoxidation, which may result in a reduction of their intrinsicelectrical conductivity. Therefore, the dramatic reductionin electrical conductivity in PMMA/ox-CNF compositesseen in Fig. 13 can be due to a combined effect of less
2
4
6
8
10
12
14
CNFs
ox-CNFs
800
1200
1600
2000
2400
0 1 2 3
CNFs
ox-CNFs
Stre
ss a
t bre
ak (
MPa
)St
rain
at b
reak
(M
Pa)
You
ng,s
mod
ulus
(M
Pa)
Carbon nanofiber content; wt%
0 1 2 3
Carbon nanofiber content; wt%
Carbon nanofiber content; wt%
0
0.4
0.8
1.2
1.6
2
0 1 2 3
CNFs
ox-CNFs
Mixing rule
Fig. 14. Tensile properties TPU composites of CNFs and ox-CNFs:(a) stress at break, (b) strain at break, and (c) Young’s modulus.
0
2
4
6
8
10
12
14
0 250 500 750 1000 1250 1500 1750 2000
Neat TPU1 wt.% CNFs
3 wt.% CNFs
1 wt.% ox-CNFs
3 wt.% ox-CNFs
Stre
ss (
MPa
)
Strain (%)
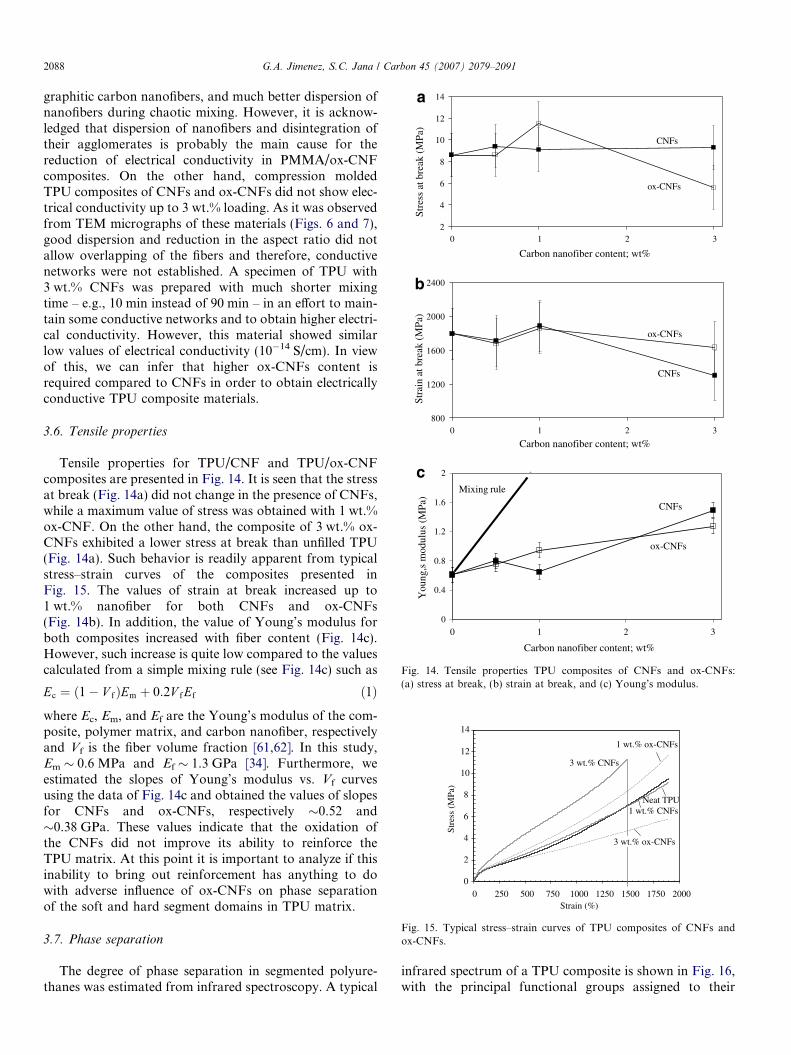
Fig. 15. Typical stress–strain curves of TPU composites of CNFs andox-CNFs.
2088 G.A. Jimenez, S.C. Jana / Carbon 45 (2007) 2079–2091
graphitic carbon nanofibers, and much better dispersion ofnanofibers during chaotic mixing. However, it is acknow-ledged that dispersion of nanofibers and disintegration oftheir agglomerates is probably the main cause for thereduction of electrical conductivity in PMMA/ox-CNFcomposites. On the other hand, compression moldedTPU composites of CNFs and ox-CNFs did not show elec-trical conductivity up to 3 wt.% loading. As it was observedfrom TEM micrographs of these materials (Figs. 6 and 7),good dispersion and reduction in the aspect ratio did notallow overlapping of the fibers and therefore, conductivenetworks were not established. A specimen of TPU with3 wt.% CNFs was prepared with much shorter mixingtime – e.g., 10 min instead of 90 min – in an effort to main-tain some conductive networks and to obtain higher electri-cal conductivity. However, this material showed similarlow values of electrical conductivity (10�14 S/cm). In viewof this, we can infer that higher ox-CNFs content isrequired compared to CNFs in order to obtain electricallyconductive TPU composite materials.
3.6. Tensile properties
Tensile properties for TPU/CNF and TPU/ox-CNFcomposites are presented in Fig. 14. It is seen that the stressat break (Fig. 14a) did not change in the presence of CNFs,while a maximum value of stress was obtained with 1 wt.%ox-CNF. On the other hand, the composite of 3 wt.% ox-CNFs exhibited a lower stress at break than unfilled TPU(Fig. 14a). Such behavior is readily apparent from typicalstress–strain curves of the composites presented inFig. 15. The values of strain at break increased up to1 wt.% nanofiber for both CNFs and ox-CNFs(Fig. 14b). In addition, the value of Young’s modulus forboth composites increased with fiber content (Fig. 14c).However, such increase is quite low compared to the valuescalculated from a simple mixing rule (see Fig. 14c) such as
Ec ¼ ð1� V fÞEm þ 0:2V fEf ð1Þ
where Ec, Em, and Ef are the Young’s modulus of the com-posite, polymer matrix, and carbon nanofiber, respectivelyand Vf is the fiber volume fraction [61,62]. In this study,Em � 0.6 MPa and Ef � 1.3 GPa [34]. Furthermore, weestimated the slopes of Young’s modulus vs. Vf curvesusing the data of Fig. 14c and obtained the values of slopesfor CNFs and ox-CNFs, respectively �0.52 and�0.38 GPa. These values indicate that the oxidation ofthe CNFs did not improve its ability to reinforce theTPU matrix. At this point it is important to analyze if thisinability to bring out reinforcement has anything to dowith adverse influence of ox-CNFs on phase separationof the soft and hard segment domains in TPU matrix.
3.7. Phase separation
The degree of phase separation in segmented polyure-thanes was estimated from infrared spectroscopy. A typical
infrared spectrum of a TPU composite is shown in Fig. 16,with the principal functional groups assigned to their

10
20
30
40
50
800130018002300280033003800
Wavenumber (cm-1)
Tra
nsm
ittan
ce (
%)
N-H(Hydrogen
bonded)
C-H
C-Oν free C=O ν bonded C=O
C=O
Fig. 16. Typical infrared spectra of a TPU carbon nanofiber compositewith 3 wt.% ox-CNFs. Inset corresponds to deconvolution of the carbonylpeak into free and hydrogen-bonded segments.
low
(m
W)
0.5 wt.% ox-CNFs
0.5 wt.% CNFs
Neat TPUTA TB TC
G.A. Jimenez, S.C. Jana / Carbon 45 (2007) 2079–2091 2089
respective peaks. The carbonyl peak was deconvoluted bycurve fitting into overlapping peaks as presented in theinset in Fig. 16. A similar procedure described by Xiaand Song [53] was followed in order to obtain the valuesof hydrogen bonding index, R, and the degree of phase sep-aration, DPS. Table 3 shows that DPS decreased with car-bon nanofiber content. The values of R and DPS forcomposites with ox-CNF are higher than those for com-posites with CNFs. The additional hydrogen bonding inTPU/ox-CNF composites may have come from chemicalinteractions of the urethane groups with functional groupson ox-CNFs. Several researchers have reported results onphase separation in TPU–montmorillonite composites[63–65]. Tien and Wei [63] found that hydroxyl groupson silicate layers form hydrogen bonds with hard and softsegments in TPU. They concluded that although silicatelayers reinforce TPU, they also reduce hydrogen bondingin the hard segment region. Pattanayak and Jana [64,65]reported a reduction in hydrogen bonding in TPU in thepresence of reactive nanoclay. Chen [66] reported seg-mented polyurethane composites with single-wall carbonnanotubes, and observed good mechanical properties with0.5 wt.% nanotube content. However, further addition ofsingle-wall carbon nanotubes led to reduction in tensilestrength and elongation at break. These authors attributedsuch reduction to several possible reasons such as alteredmicrophase morphology of TPU, excessive polymer–fillerinteractions, and inhibition of morphological changes dur-ing mechanical deformation of TPU. The same argumentscan be applied in this case to explain the reduction of ten-
Table 3Hydrogen bonding index, R and degree of phase separation, DPS in TPUcomposites determined by FT-IR
Fiber content (wt.%) R DPS
CNFs ox-CNFs CNFs ox-CNFs
0 1.9 1.9 65 651 1.3 1.8 56 653 0.8 1.2 43 55
sile strength and the degree of phase separation values pre-sented previously for TPU composites having 3 wt.% of ox-CNFs. At this point, we require more information on thebehavior of the hard segment domains that can be obtainedfrom the investigation of the thermal transitions of thesecomposites.
3.8. Differential scanning calorimetry
DSC traces of TPU and its composites with 0.5 and3 wt.% of CNFs and ox-CNFs are shown in Fig. 17.MDI/BDO-based TPU materials are known to show multi-ple endotherms and significant research work has beendone to discover the morphological sources behind thoseendotherms [67–69]. The first endotherm, TA, appears atapproximately 20–30 �C above the annealing temperature –normally room temperature – and it has been ascribed toa short-range order in the hard domains. A second endo-therm, TB observed between 120 and 200 �C has beenattributed either to a long-range ordering in the harddomains or to a microphase mixing occurring betweenthe hard and soft domains. Finally, melting of the hard seg-ment microcrystalline regions produces an endotherm atTC above 200 �C. Besides hard segment transitions, softsegments provide a glass transition Tg,SS occurring at�40 �C. Soft segment crystallization is absent in thisTPU due to the presence of a methyl group in PPG polyolwhich probably prevents crystalline packing of the polyolchains with a 2000 molecular weight.
Two morphological sources have been proposed toexplain the first endotherm TA; (i) disordering of short-range hard segments [67] and (ii) hard segment glass tran-sition [63]. More recently Chen et al. [69] investigated thisendotherm and determined that its source could be dueto an enthalpy relaxation resulting from physical aging ofthe amorphous hard segment. From Fig. 17, it is seen thatTA is easily noticeable in composites with 3 wt.% of carbon
-100 -50 0 50 100 150 200 250
Hea
t F
3 wt.% ox-CNFs
3 wt.% CNFs
Temperature (°C)
Fig. 17. Thermal transitions of TPU/CNF and TPU/ox-CNF compositesobserved by DSC.

2090 G.A. Jimenez, S.C. Jana / Carbon 45 (2007) 2079–2091
nanofibers, although the change in slope is more prominentfor ox-CNF composites. In view of this, we can infer thathigh content of functionalized nanofibers may affect thehard segment regions and promote the disorder of suchphase. Due to the presence of oxygen-containing functionalgroups, ox-CNFs can form hydrogen bonds with the ure-thane groups and alter the hard domain morphology.Additional hydrogen bonding in ox-CNF composites wasalready estimated in this work (Table 3). Consequently,TB is practically absent and TC decreased in TPU with3 wt.% ox-CNFs, which reflects the increase of short-rangeorder in this sample upon reduction of the long-order tran-sitions. Although it is conceivable that the tensile strengthshould have improved with ox-CNFs content, high con-tents of those fibers seem to disrupt the hard segmentdomains in TPU, therefore, reducing the mechanicalstrength of the polymer significantly.
4. Conclusions
The study showed that surface treatment of carbonnanofibers can produce composites with better nanofiberdispersion and improved thermal and thermo-mechanicalproperties when used in conjunction with polar polymerssuch as PMMA and TPU. However, as observed in otherinvestigations, electrical conductivity decreases withimproved fiber dispersion, although a part of such reduc-tion can be attributed to lower intrinsic conductivity of oxi-dized carbon nanofibers. The study also showed thatsurface functional groups on oxidized nanofibers can pro-mote phase mixing between hard and soft domains in poly-urethanes. In the case of PMMA composites, the onset ofoxidative decomposition temperature, T1, increased by15 �C in the presence of 6 wt.% ox-CNFs. It was found thatthe nanofibers interact more with the soft segment chains inTPU as T2 of TPU increased from 346 to 380 �C with theaddition of merely 0.5 wt.% of CNFs or ox-CNFs.
Acknowledgements
This work was supported by NSF in the form of a CA-REER Award (DMI-0134106) to S.C.J. G.A.J. wants tothank the Fulbright Commission of the Department ofState, USA, Universidad Nacional of Costa Rica, andthe Science and Technology Bureaus of Costa Rica (MI-CIT and CONICIT) for providing grants during thisresearch.
References
[1] Choi YK, Sugimoto KI, Song SM, Endo M. Mechanical and thermalproperties of vapor-grown carbon nanofiber and polycarbonatecomposite sheets. Mater Lett 2005;59:3514–20.
[2] Yang Y, Gupta MC, Dudley KL, Lawrence RW. The fabrication andelectrical properties of carbon nanofiber–polystyrene composites.Nanotechnology 2004;15:1545–8.
[3] Higgins BA, Brittain WJ. Polycarbonate carbon nanofiber compos-ites. Eur Polym J 2005;41:889–93.
[4] Choi YK, Sugimoto KI, Song SM, Gotoh Y, Ohkoshi Y, Endo M.Mechanical and physical properties of epoxy composites reinforcedby vapor grown carbon nanofibers. Carbon 2005;43:2199–208.
[5] Carneiro OS, Covas JA, Bernardo CA, Caldeira G, Van HattumFWJ, Ting JM, et al. Production and assessment of polycarbonatecomposites reinforced with vapor-grown carbon fibres. Compos SciTechnol 1998;58:401–7.
[6] Ma H, Zeng J, Realff ML, Kumar S, Schiraldi DA. Processing,structure, and properties of fibers from polyester/carbon nanofibercomposites. Compos Sci Technol 2003;63:1617–28.
[7] Hammel E, Tang X, Trampert M, Schmitt T, Mauthner K, Eder A,et al. Carbon nanofibers for composite applications. Carbon2004;42:1153–8.
[8] Lozano K, Barrera EV. Nanofiber-reinforced thermoplastic compos-ites. I. Thermoanalytical and mechanical analyses. J Appl Polym Sci2001;79:125–33.
[9] Yang S, Lozano K, Lomeli A, Foltz HD, Jones R. Electromagneticinterference shielding effectiveness of carbon nanofiber/LCP compos-ites. Composites Part A 2005;36:691–7.
[10] Lozano K, Bonilla-Rios J, Barrera EV. A study on nanofiber-reinforcedthermoplastic composites (II): investigation of the mixing rheology andconduction properties. J Appl Polym Sci 2001;80:1162–72.
[11] Shi D, Lian J, He P, Wang LM, Xiao F, Yang L, et al. Plasmacoating of carbon nanofibers for enhanced dispersion and interfacialbonding in polymer composites. Appl Phys Lett 2003;83:5301–3.
[12] Xu J, Donohoe JP, Pittman Jr CU. Preparation, electrical andmechanical properties of vapor grown carbon fiber (VGCF)/vinylester composites. Composites Part A 2004;35:693–701.
[13] Brandl W, Marginean G, Chirila V, Warschewski W. Production andcharacterization of vapour grown carbon fiber/polypropylene com-posites. Carbon 2004;42:5–9.
[14] Zhao J, Schaefer DW, Shi D, Lian J, Brown J, Beaucage G, et al.How does surface modification aid in the dispersion of carbonnanofibers? J Phys Chem B 2005;109:23351–7.
[15] Kubota S, Nishikiori H, Tanaka N, Endo M, Fujii T. Dispersion ofacid-treated carbon nanofibers into gel matrices prepared by the sol–gel method. J Phys Chem B 2005;109:23170–4.
[16] Darmstadt H, Summchen L, Ting JM, Roland U, Kaliaguine S, RoyC. Effects of surface treatment on the bulk chemistry and structure ofvapor grown carbon fibers. Carbon 1997;35:1581–5.
[17] Serp Ph, Figueiredo JL, Bertrand P, Issi JP. Surface treatments ofvapor-grown carbon fibers produced on a substrate. Carbon1998;36:1791–9.
[18] Toebes ML, Van Hesswijk JMP, Bitter JH, Van Dillen AJ, De JongKP. The influence of oxidation on the texture and the number ofoxygen-containing surface groups of carbon nanofibers. Carbon2004;42:307–15.
[19] Tibbetts GG, Finegan IC, Kwag C. Mechanical and electricalproperties of vapor-grown carbon fiber thermoplastic composites.Mol Cryst Liq Cryst 2002;387:353. 129-[357]/133.
[20] Finegan IC, Tibbets GG, Glasgow DG, Ting JM, Lake ML.Surface treatments for improving the mechanical properties ofcarbon nanofiber/thermoplastic composites. J Mater Sci 2003;38:3485–3490.
[21] Zhu J, Kim J, Peng H, Margrave JL, Khabashesku VN, Barrera EV.Improving the dispersion and integration of single-walled carbonnanotubes in epoxy composites through functionalization. Nanolet-ters 2003;3:1107–13.
[22] Kim YJ, Shin TS, Choi HD, Kwon JH, Chung YC, Yoon HG.Electrical conductivity of chemically modified multiwalled carbonnanotubes/epoxy composites. Carbon 2005;43:23–30.
[23] Ottino JM, Muzzio FJ, Tjahjadi M, Franjione J, Jana SC, Kusch HA.Chaos, symmetry and self similarity: exploiting order and disorder inmixing processes. Science 1992;257:754–60.
[24] Leong CW, Ottino JM. Experiments on mixing due to chaoticadvection in cavity. J Fluid Mech 1989;209:463–99.

G.A. Jimenez, S.C. Jana / Carbon 45 (2007) 2079–2091 2091
[25] Jana SC, Metcalfe G, Ottino JM. Experimental and computationalstudies of mixing in complex Stokes flows: the vortex mixing flow andmulticellular cavity flows. J Fluid Mech 1994;269:199–246.
[26] Aref H. Stirring by chaotic advection. J Fluid Mech 1984;143:1–21.[27] Ottino JM. The kinematics of mixing: stretching, chaos, and
transport. New York: Cambridge University Press; 1989.[28] Aref H. The development of chaotic advection. Phys Fluids
2002;14:1315–25.[29] Wiggins S, Ottino JM. Foundations of chaotic mixing. Philos Trans
R Soc Lond A 2004;362:937–70.[30] Danescu RI, Zumbrunnen DA. Creation of conducting networks
among particles in polymer melts by chaotic mixing. J ThermoplastCompos Mater 1998;11:299–320.
[31] Chougule VA, Zumbrunnen DA. In situ assembly using a co-continuous chaotic advection blending process of electrically con-ducting networks in carbon black-thermoplastic extrusions. ChemEng Sci 2005;60:2459–67.
[32] Dharaiya D, Jana SC, Lyuksyutov S. Production of electricallyconductive networks in immiscible polymer blends by chaotic mixing.Polym Eng Sci 2006;46:19–28.
[33] Jimenez GA, Jana SC. Preparation of poly(methyl methacrylate) andcarbon nanofiber composites by chaotic mixing. In: Proceedings ofANTEC 63rd conference, Boston, May 2005. p. 1938–42.
[34] Jimenez GA, Jana SC. Electrically conductive polymer nanocompos-ites of polymethylmethacrylate and carbon nanofibers prepared bychaotic mixing. Compos Part A: Appl Sci Manuf 2007;38:983–93.
[35] Schueler R, Petermann J, Schulte K, Wentzel HP. Agglomeration andelectrical percolation behavior of carbon black dispersed in epoxyresin. J Appl Polym Sci 1997;63:1741–6.
[36] Higgins BA. Carbon nanofiber–polymer composites for electronicapplications. PhD Thesis, 2006, University of Akron, OH.
[37] Sau M, Jana SC. A study on the effects of chaotic mixer design andoperating conditions on morphology development in immisciblepolymer systems. Polym Eng Sci 2004;44:407–22;Sau M, Jana SC. A study on the effects of chaotic mixer design andoperating conditions on morphology development in immisciblepolymer systems. Polym Eng Sci 2004;44:1403.
[38] Sau M, Jana SC. Effect of waveforms on morphology development inchaotic mixing of immiscible polymers. AIChE J 2004;50:2346–58.
[39] Jung CD, Jana SC. Synthesis of thermoplastic polyurethanes bychaotic mixing. In: Proceedings of ANTEC 62nd conference, 2004. p.2814–8.
[40] Jung CD, Gunes IS, Jana SC. Time scales of mixing and chemicalreactions in synthesis of thermoplastic polyurethanes in chaoticmixers. Ind Eng Chem Res 2007;46:2413–22.
[41] Ros TG, Van Dillen AJ, Geus JW, Koningsberger DC. Surfaceoxidation of carbon nanofibers. Chem Eur J 2002;8:1151–62.
[42] Yue ZR, Jiang W, Wang L, Gardner SD, Pittman Jr CU. Surfacecharacterization of electrochemically oxidized carbon fibers. Carbon1999;37:1785–96.
[43] Boehm HP. Surface oxides on carbon and their analysis: a criticalassessment. Carbon 2002;40:145–9.
[44] Bubert H, Ai X, Haiber S, Heintze M, Bruser V, Pasch E, et al. Basicanalytical investigation of plasma-chemically modified carbon fibers.Spectrochim Acta Part B 2002;57:1601–10.
[45] Haiber S, Ai X, Bubert H, Heintze M, Bruser V, Brandl W, et al.Analysis of functional groups on the surface of plasma-treated carbonnanofibers. Anal Bioanal Chem 2003;375:875–83.
[46] Peebles LH. Carbon fibers: formation, structure and proper-ties. FL: CRC Press; 1995.
[47] Biniak S, Szymanski G, Siedlewski J, Swiatkowski A. The character-ization of activated carbons with oxygen and nitrogen surface groups.Carbon 1997;35:1799–810.
[48] Moreno-Castilla C, Lopez-Ramon MV, Carrasco-Marin F. Changesin surface chemistry of activated carbons by wet oxidation. Carbon2000;38:1995–2001.
[49] Ehrburger P, Vix-Guterl C. Surface properties of carbons foradvanced carbon-based composites. In: Rand B, Appleyard SP,Yardim MF, editors. Design and control of structure of advancedcarbon materials for enhanced performance. Amsterdam: Kluwer;2001.
[50] Potschke P, Bhattacharyya AR, Janke A. Melt mixing of polycar-bonate with multiwalled carbon nanotubes: microscopic studies onthe state of dispersion. Eur Polym J 2004;40:137–48.
[51] Zanetti M, Camino G, Reichert P, Mulhaupt R. Thermal behaviourof poly(propylene) layered silicate nanocomposites. Macromol RapidCommun 2001;22:176–80.
[52] Kashiwagi T, Grulke E, Hilding J, Harris R, Awad W, Douglas J.Thermal degradation and flammability properties of poly(propylene)/carbon nanotubes composites. Macromol Rapid Commun2002;23:761–5.
[53] Xia H, Song M. Preparation and characterization of polyurethane–carbon nanotube composites. Soft Matter 2005;1:386–94.
[54] Petrovic ZS, Zavargo Z, Flynn JH, Macknight WJ. Thermal-degradation of segmented polyurethanes. J Appl Polym Sci1994;51:1087–95.
[55] Troitskii BB, Troitskaya LS, Yakhnov AS, Lopatin MA, NovikovaMA. Retardation of thermal degradation of PMMA and PVC by C-60. Eur Polym J 1997;33:1587–90.
[56] Seo M-K, Park S-J, Lee S-K. Influence of atmospheric plasma onphysicochemical properties of vapor-grown graphite nanofibers. JColloid Interface Sci 2005;285:306–13.
[57] Kwon J, Kim H. Comparison of the properties of waterbornepolyurethane/multiwalled carbon nanotube and acid-treated multi-walled carbon nanotube composites prepared by in situ polymeriza-tion. J Appl Polym Sci 2005;43:3973–85.
[58] Koerner H, Liu W, Alexander M, Mirau P, Dowty H, Vaia RA.Deformation-morphology correlations in electrically conductive car-bon nanotube–thermoplastic polyurethane composites. Polymer2005;46:4405–20.
[59] Flandin L, Brechet Y, Cavaille JY. Electrically conductive polymernanocomposites as deformation sensors. Compos Sci Technol2001;61:895–901.
[60] Showa Denko. JCN newswire September 27th, 2004.[61] Nielsen LE, Landel RF. Mechanical properties of polymers and
composites. 2nd ed. New York: Dekker; 1994.[62] Buffa F, Abraham GA, Grady BP, Resasco D. Effect of nanotubes
functionalization on the properties of single-walled carbon nano-tubes/polyurethane composites. J Polym Sci: Part B: Polym Phys2007;45:490–501.
[63] Tien YI, Wei KH. Hydrogen bonding and mechanical properties insegmented montmorillonite/polyurethane nanocomposites of differ-ent hard segment ratios. Polymer 2001;42:3213–21.
[64] Pattanayak A, Jana SC. Synthesis of thermoplastic polyurethanenanocomposites of reactive nanoclay by bulk polymerization meth-ods. Polymer 2005;46:3275–88.
[65] Pattanayak A, Jana SC. Properties of bulk-polymerized thermoplasticpolyurethane nanocomposites. Polymer 2005;46:33394–406.
[66] Chen W, Tao X. Production and characterization of polymernanocomposites with aligned single wall carbon nanotubes. ApplSurf Sci 2006;252:3547–52.
[67] Seymour RW, Cooper SL. Thermal analysis of polyurethane blockpolymers. Macromolecules 1973;6:48–53.
[68] Koberstein JT, Russell TP. Simultaneous SAXS-DSC study ofmultiple endothermic behavior in polyether-based polyurethane blockcopolymers. Macromolecules 1986;19:714–20.
[69] Chen TK, Shieh TS, Chui JY. Studies on the first DSC endotherm ofpolyurethane hard segment based on 4,40-diphenylmethane diiso-cyanate and 1,4-butanediol. Macromolecules 1998;31:1312–20.