Tanzania's Precious Minerals Boom: Issues In Mining and ...
164
Tanzania's Precious Minerals Boom: Issues In Mining and Marketing Research Paper March 2001 Lucie C. Phillips [[email protected]], InternationaPBusiness Initiatives Dr. Haji Semboja [[email protected]], Economic and Social Research Foundation G.P. Shukla [[email protected]], Harvard University John F. Kennedy School of Government Rogers Swinga [[email protected]], TanDiscovery Wilson Mutagwaba [[email protected]], STAMICO and Ben Mchwampaka [[email protected]], Ministry of Energy and Minerals with Godwill Wanga I:[email protected]], Economic and Social Research Foundation Godius Kahyamra, Economic and Social Research Foundation and Peter C. Keller, The Bowers Museum of Cultural Art Funded by United States Agency for International Development Bureau for Africa Office of Sustainable Development Washington, DC 20523-4600 The views and interpretations in this paper are those of the author(s) and not necessarily of the affiliated institutions.
-
Upload
khangminh22 -
Category
Documents
-
view
1 -
download
0
Transcript of Tanzania's Precious Minerals Boom: Issues In Mining and ...

Tanzania's Precious Minerals Boom: Issues In Mining and Marketing
Research Paper March 2001
Lucie C. Phillips [[email protected]], InternationaPBusiness Initiatives Dr. Haji Semboja [[email protected]], Economic and Social Research Foundation
G.P. Shukla [[email protected]], Harvard University John F. Kennedy School of Government
Rogers Swinga [[email protected]], TanDiscovery Wilson Mutagwaba [[email protected]], STAMICO
and Ben Mchwampaka [[email protected]], Ministry of Energy and Minerals
with Godwill Wanga I:[email protected]], Economic and Social Research Foundation Godius Kahyamra, Economic and Social Research Foundation
and Peter C. Keller, The Bowers Museum of Cultural Art
Funded by United States Agency for International Development
Bureau for Africa Office of Sustainable Development
Washington, DC 20523-4600
The views and interpretations in this paper are those of the author(s) and not necessarily of the affiliated institutions.

Equity and Growth through m Economic Research
EAGER supports economic and social science policy analysis in Sub-Saharan Africa. Its primary goal is to increase the availability and the use of policy analysis by both public and private sector decision-makers. In addition to the goal of achieving policy reform, EAGER seeks to &nprove the capacity of African researchers and research organizations to contribute to policy debates in their countries. In support of this goal, EAGER sponsors collaboration among American and African researchers and research organizations.
EAGER is implemented through two cooperative agreements and a communications logistics contract fmanced by the United States Agency for International Development (USAID), Strategic Analysis Division, The Office of Sustainable Development, Bureau for Africa. A consortium led by the Harvard Institute for International Development (HIID) holds the cooperative agreement for Public Strategies for Growth and Equity. Associates for International Resources and Development (AIRD) leads the group that holds the cooperative agreement for Trade Regimes and Growth. The Communications Logistics Contract (CLC) is held by a consortium led by BHM International, Inc. (BHM). Other capacity-buildmg support provides forpolicy analysis by African institutions including the AfricanEconomic Research Consortium, R6seau sur Les Politiques Industrielles (Network on Industrial Policy), Programme Troisikme Cycle Intemuiversitaire en Economie, and the International Center for Economic Growth. Clients for EAGER research activities include African governments and private organizations, USAID country missions and USAIDIWashington, and other donors.
For information contact:
Yoon Lee, Project Officer
Washington, D.C. 20523 Tel: 202-712-4281 Fax: 202-216-3373
E-mail: [email protected]
Carrie Main, Project Administrator Belfer Center for Science & International Affairs
John F. Kennedy School of Government Harvard University
79 John F. Kennedy Street Cambridge, MA 02138
Tel: 617-496-0112 Fax: 617-496-2911 E-mail: [email protected] C o n W AOT-0546-A-00-5133-00
Lisa M. Matt, Senior Advisor BHM International
P.O. Box 3415 Alexandria, VA 22302
Tel: 703-299-0650 Fax: 703-299-065 1 E-mall: [email protected]
Contract AOT-0546-Q-00-5271-00
J. Dirck Sejker, Chief of Patty Associates for International
Resources and Development (AIRD) 185 Alewife Brook Parkway
Cambridge, MA 02138 Tel: 617-864-7770 Fax: 617-864-5386
E-mail: [email protected] Contract AOT-0546-A-00-5073-00
Abstract
Since Tanzania began liberalising and privatising the mining sector a decade ago, the substantial economic potential of the industry is more and more apparent. Two key policy decisions set off a mining boom. One was the decision in the late 1980s to end the State Mining Company (STAMICO) monopoly and allow any Tanzanian to register a claim and sell minerals. The second was the liberalisation of currency controls, beginning with permission to exporters to use their export proceeds and culminating in the floating of the currency in 1994. This doubled the benefits of mining, as the foreign exchange proceeds could be used to finance imported consumer goods, equipment and spare parts, which had long been scarce. These all set off an immediate artisanal mining boom
The purpose of this study is to provide an understanding of artisanal marketing patterns, their logic and their economic impact. This study has come at a time of sweeping changes in Tanzania's mining sector, and in the larger national economy. Tanzanian policy-makers face a unique opportunity in the swelling mining boom. They also have to prepare for its inevitable subsequent decline. The liberalization of mining has brought poverty alleviation to rural areas in the 1990s on a scale far surpassing the impact of donor-funded job-creation efforts. Working with that trend, future donor-funded efforts can multiply their impact. On the other hand, if this sudden growth is neglected or misunderstood, the benefits of sudden growth in mining could be transitory. The impact could be negative if future inflation and other economic distortions are not controlled, if arms or d u g dealers, or money launderers infiltrate the trade, or if greed, corruption or ethnic tensions are allowed to build around resource riches. None of these negative situations is currently an imminent trend in Tanzania, but all have occurred in other mineral-rich countries.
Acknowledgments
The team that conducted this study comprised EAGER Principal Investigator Dr. Lucie Colvin Phillips (IBI), Tanzanian Team Leader Dr. Haji Semboja (ESRF), Prof. Gupta Shukla (HIID), Dr. Wilson Mutaewaba (STAMICO). Mr. Rogers Sezinea (TanDiscoveni). Mr. Ben Mchwamuaka CMEM). Mr. ~ o d & ~ a & a ( E s R F ) ~ ~ ~ Mr. Godius ~aiyaiara (ESRF). yhe Policy Advisory 'Con&ittee &at supervised it comprised, in their individual capacities, the Commissioner of Mines Gray Mwakalukwa, ~xecutive ~irector of the ESW, Professor ~amuel Wangwe, Chairman of the Chamber of Mines Samuel Lwakatare, and, over four years, several representatives of the government and academic community. Peter C. Keller of The Bowers Museum of Cultural Art in Santa, Ana, California, served as advisor to the team and reported on the Tucson Gem Conference and Show. The research was funded by United States Agency for International Development (USAID) under the Equity and Growth through Economic Research Trade Policy cooperative agreement (EAGERITrade), through sub agreements by the primary recipient, Associates for Intemational Resources and Development (AIRD), with IBI and ESRF. The EAGER project funds demand-driven economic policy studies in countries throughout Africa that are attempting to move from centrally managed and largely state-owned economies to market oriented systems. The research was conducted in two separately funded phases, the first in 1996-97 and the second in 1999. To the people in all of these organisations, and the friends, miners, brokers, dealers and Ministry of Energy and Minerals representatives who so graciously contributed their time and thoughts to this effort, we say heartfelt thanks. They deserve much of the credit for the study, but none of the blame. The views represented here are those of the authors, not of the US or Tanzanian governments or any of their agencies. Any errors or omissions are the responsibility of the authors.

Table of Contents ACRONYMS and ABBREVIATIONS .............................. .. .......................................................... 4 1.0 INTRODUCTION ...................................................................................................................... 5
1.1 Background ............................................................................................................................ 5 1.1 . 1 Mineral geology ................................................................................................................. 5 . . 1.1.2 Government o b ~ e c t ~ v ~ ....................................................................................................... 6 1.1.3 Recent develo~ments ......................................................................................................... 7
1.2 Purpose of the study .................................................................................................................. 8 1.3 Methodolow of the study ......................................................................................................... 9
1.3.1 The consultative process ..................................................................................................... 9 1.3.2 Field interviews and data collection .................................................................................... 9 1.3.3 The sample interview& .................................................................................................... 10 1.3.4 Review of available 1- ........................................................................................... 12
2.0 MARKETING FOR SMALL SCALE MINING IN TANZANIA ........................................... 15 2.1 Backmound of mineral marketing in Tanzania ........................................................................ 15 2.2 Strncture and characteristics of the mineral markets ............................................................... 17 2.3 Participants in the Tanzanian minine marketing chain. profiles and roles ................................. 24
2.3.1 Remlators ...................................................................................................................... 24 . . 2.3.2 Formal nnmng cornpa& ......................................................................................... 25 2.3.3 Roles in the artisanal &r .............................................................................................. 25
2.4 Domestic Mineral Market Performance ................................................................................... 38 2.4.1 Mine and town mark@ .................................................................................................... 38 2.4.2 International minerals marketing. manufacturing and iewellew retailing ........................... 40 2.4.3 Value added activities: The imuact of volumes and price differentials ............................... 50 2.4.4 Mineral smugeling .............................. .. ..................................................................... 52
3.0 SECONDARY ECONOMIK! ACTMTIES IN MINING COMMUNITIES .......................... 56 . . 3.1 Types of secondan/ economic activ~tles ................................................................................. 56 . . 3.2 Factors influencing theu e- .......................................................................................... 57 3.3 Factors consminine busincsscs in m i n i i ~ r s ..................................................................... 58 3.1 Economic and social impm of mining-related businesses ...................................................... 59 3.5 Pros~ects for miniig-related businesses .................................................................................. 61
4.0 HEALTH . SAFETY AND ENVIRONMENTAL ASPECTS ................................................... 62 4.1 Environmental aspects ............................................................................................................ 62
4.1.1 Land disturbance and degradation ..................................................................................... 62 4.1.2 Hvdrological effects and water pollution ........................................................................... 62 4.1.3 Air ~ollution .................................................................................................................... 63 4.1.4 Noise ~ollution ................................................................................................................ 63 4.1.5 Other impacts ................................................................................................................... 63
~ ~~~p
422Jealth and safety asuccrs ................................ ........ ............................................................... 64 5.0 INSTITUTIONAI . AND SOCIAL REL.\TIONSHIPS ................... .. ................................ 66 . .
5 . l Institutional relationshius ........................................................................................................ 66 - .... . . 5.1 . 1 Admin~strative strucn~res are in lace ............................................................................... 66 5.1.2 MEM faces classical underdevelopment constr- ......................................................... 66 5.1.3 Increased facilitation of mining investment o~pormnities .................................................. 67 5.1.4 Data and information on mining activities is still verv weak ............................................ 67 . .
5.2 Professional assoc~at~ons ......................................................................................................... 67 . . 5.3 Soc~al linkages ...................................................................................................................... 68
6.0 CO-EXISI'ENCE OF LARGE AND SMALL SCALE MI;VIKG ........................................... 70 6.1 Coexistence of large and small-scale mining in Tanzania ....................................................... 70 . .
6.1.1 Historv of large and small-scale miing ............................................................................ 70 6.1.2 Different deposits interest different eroups .................................................................... 73 6.1.3 Minine technoloey ........................................................................................................... 73 6.1.4 Mineral Policy .................................................................................................................. 75 6.1.5 Employment .................................................................................................................... 76
6.2 Current status of relationsl& .................................................................................................. 76 6.2.1 Factors influencing relationship ........................................................................................ 77

............................................................................. 7 . TAX POLICIES AND ADMINISTRATION 79 ................................................... 7.1 Existing tax system as applied to mining sector in Tanzania 79
7.1.1 Corporate income tax ....................................................................................................... 80 7.1.2 Value added tax (VAT) .................................................................................................... 84 7.1.3 Withholding tax ............................................................................................................... 86 7.1.4 Import tariff ..................................................................................................................... 87 7.1.5 Stamp dntv ....................................................................................................................... 87
7.2 Royalty .................................................................................................................................. 87 7.3 Emplovment taxes .................................................................................................................. 88
7.3.1 Pay as you earn (PAYE) ................................................................................................... 88 7.3.2 Benefit (or fiinge benefits) tax ......................................................................................... 88 7.3.3 National social securitv fmd (NSSF) ................................................................................ 89 7.3.4 Director's tax ................................................................................................................... 89 . . 7.3.5 Tax for vocational traunng ............................................................................................... 89 7.3.6 House development fees ................................................................................................... 89
7.4 Comparative study of fiscal regimes in the region .................................................................... 89 7.4.1 hlaior taxes in Tanzania and other African colmtries ......................................................... 89
7.5 Problems of the fiscal regime and tax administration in Tanzania from the regional pers~ective:93 7.6 Conclusion and policy recommendations ................................................................................. 94
7.6.1 General recommendations ............................................................................................... 94 7.6.2 Policy recommendations ................................................................................................. 95 7.6.3 Administrative recommendations ..................................................................................... 97
8 . ECONOMIC ANALYSIS .......................................................................................................... 99 8.1 Macroeconomic analvsis ......................................................................................................... 99
8.1.1 Methods Used .................................................................................................................. 99 ..................................................................................................... 8.1.2 Macroeconomic Results 106
............................................................................................................. 8.2 Srnugglrng and GDP 115 8.3 Impact of tax incentives on dealers . business growth and tax revenues ................................... 117 . . 8.4 Job Creation and Povertv Allenation .................................................................................... 120 8.5 Foreign exchange and minerals marketing ............................................................................ 121
8.5.1 Impact of minerals exports on foreign exchange earnings .............................................. 121 8.5.2 Impact of exchange controls and currency fluctuations on the trade ................................. 122
8.6 The sector revenue collection and present tax base ............................................................. 123 8.7 Policies favouring value added activities ......................................................................... 124 . . 8.8 Negative externalities from artisanal minmng .......................................................................... 126
8.8.1 Environmental damage ................................................................................................... 126 8.8.2 Health and safety problems ............................................................................................. 127
9 . STRATEGIC ANALYSIS OF THE MINERALS SECTOR ................................................... 128 ................................................................ 9.1 Avoid over reliance of basic factors of advantage 128
9.2 Improve understanding of customers ..................................................................................... 129 . . . . 9.3 Know vour relative competitive position .............................................................................. 130 9.4 Know when and when not to forward inteaate ..................................................................... 130 9.5 Improve i n t e f i i cooperation .............................................................................................. 132 9.6 Overcome defensiveness ....................................................................................................... 133 9.7 Avoid paternalism ................................................................................................................ 133
10 SUMMARY OF RECOMMENDATIONS ............................................................................. 134 10.1 Create a conducive environment for mining and mineral market development ...................... 134
10.1.1 Create and enforce competitive formal mine~als markets at all levels ............................. 134 ....................................................... 10.1.2 Take additional measures to discourage smuggling 135
...................................... 10.1.3 Continue attracting investment in minine and minerals trading 135 ..................................................... 10.1.4 Improve basic infrastructure and reduce usage costs 135
10.1.5 Assist miners to improve security ................................................................................. 136 ........................................................... 10.2 Improve the fiscal regime and the tax administration 136 . .
10.2.1 Fiscal policy lssues ....................................................................................................... 136 10.2.2 Tax administration issues ............................................................................................. 137
2

10.3 Provide essential s u v p o r t ~ ........................................................................................ 138 10.3.1 Improve market and technical information .................................................................... 138 10.3.2 Support gem shows and other promotional activities .................................................... 139 10.3.3 Training and extension ................................................................................................. 139
10.4 Ensure sustainable economic development .............................................. : ........................... 139 BIBLIOGRAPHY ........................................................................................................................ 141 ANNEXES .................................................................................................................................... 152
List of Tables
Table 2.1 Number of Licensed Dealers. 1997-1999 ...................................... 35 Table 2.2 Size of Dealerships' Declared Export Value. 1997 ........................... 35 Table 2.3 Taxes Initially Imposed on Artisanal Mining Exports by Dealers ......... 36 Table 2.4 World Diamond Markets. 1998 ................................................. 44 Table 2.5 Indicators of Low Cost Semi-skilled and Skilled Labour Availability .... 48 Table 2.6 Annual Bullion Supply and Demand (in metric tons) ........................ 49 Table 7.1 Major changes in tax regime applied to the mining sector in Tanzania ... 81 Table 7.2 Summary of Major Taxes in Selected African Countries .................... 91 Table 8.1 Calculation of GDP - All Sectors Formal ..................................... 100 Table 8.2 Calculation of GDP - Accounting for Formal and Informal Sectors ...... 101 Table 8.3 Marketing Activities in the Gold Mining Sector .............................. 104 Table 8.4 Marketing Activities in the Gold Mining Sector .............................. 105 Table 8.5 Precious Minerals Exports. 1989-1999. Declared Value in US$ ........... 106 Table 8.6 Summary of Estimated Actual Values of Precious Minerals Exports ...... 110 Table 8.7 Value-Added in the Gold Marketing Chain. Tanzania and Kenya ......... 112 Table 8.8 Value Added in the Tanzanite Marketing Chain. Tanzania and Kenya ... 11 3 Table 8.9 Price Fluctuations for Coloured Gems in Regional Markets ................ 114 Table 8.10 Hypothetical Gem Dealerships in Arusha and Nairobi -- Effect of Transaction Taxes on Business Growth and Total Taxes ................................ 119 Table 8.1 1: Estimates of Total Incomes of Participants in Arusha Market for the Year 1995 ....................................................................................... 123
List of Figures
Figure 2.1 MINERAL MARKET CHANNELS .......................................... 19 Figure 2.2 Gemstone Marketing and the Impact of the Internet ........................ 41 Figure 2.3 Sources of African Diamonds, by country. 1998 ............................ 46 Figure 6.1 Gold. Gem and Diamond Exports. 1989-1999 Declared Value in US $ .. 70 Figure 6.2 Gold Exports: Artisanal and First Mine ...................................... 71 Figure 6.3 Projected Production from Formal Gold Mines. 1999-2020 ............... 72 Figure 8.1 Gold. Gem and Diamond Exports. 1989-1999 Declared Value in US $ 108 Figure 8.2 Total Precious Minerals Exports 1989-1999 Value in US $ ............... 109 Figure 8.3 Regional Value Added from Artisanal Gold ................................. 112 Figure 8.4 Tanzanite Value Added ......................................................... 113
List of Maps
MAP 1 . Mineral Trade Routes ............................................................... 16 Map 6.1 Reconnaissance and Prospecting Licences. 1997 .................................... 75
3
ACRONYMS and ABBREVIATIONS
AIRD BOT DRC DSE ESRF FEMATA FOREX GDP HIID HIPC IBI MADINI MEM MIB A MIC MML MRD NSSF PAYE REMA SADC STAMICO TAMIDA TAWOMA TCM TGI TIC TRA UNIDO USAID VAT VETA
Associates for International Resources and Development Bank of Tanzania Democratic Republic of Congo Dares Salaam Stock Exchange Economic and Social Research Foundation Federation of Miners Associations of Tanzania Foreign Exchange Gross Domestic Product Harvard Institute for International Development Highly Indebted Poor Countries International Business Initiatives Corp. Minerals Division Ministry of Energy and Minerals State Mining Corporation Ministry of Industry and Commerce Merelani Mining Limited Mineral Resources Department National Social Security fund Pay as you earn Regional Miners Associations Southern African Development Community State Mining Compnay Tanzania Mineral Dealers Association Women's Mining Association Tanzanian Chamber of Mines Tanzania Gemstones Industry Tanzania Investment Center Tanzania Revenue Authority United Nations Industrial Development Organization United States Agency for International Development Value Added Tax Vocational Education and Training Act

1.0 INTRODUCTION
1.1 Background ,
The substantial economic potential of Tanzania's mining industry is increasingly being appreciated since the country began liberalising and privatising the minerals sector a decade ago. Two key policy decisions set off a mining boom. One was the decision in the late 1980s to end the State Mining Company (STAMICO) monopoly and to allow any Tanzanian to register a claim and sell minerals. The second, in 1994, was the decision to remove currency controls and float the Tanzanian shilling. This doubled the benefits of mining, as the foreign exchange proceeds could be used to finance imported consumer goods, equipment and spare parts, which had long been scarce.
Two groups of mining interests responded to the liberalisation, one small and local, the other large and international. Artisanal and small-scale mining, predominantly by Tanzanian citizens, took off immediately. Fonnal mining by expatriate investors began with an exploration boom, which is still underway. The first new formal gold mine began production in late 1998, and ten large gold mines are expected to come on line by 2002.
According to the official statistics, mining still contributes only about 1 percent of the GDP, and roughly 2% of the total export earnings. These figures, however, seriously underestimate the value of current mining and related activities, as artisanal mining of gold, coloured gems and diamonds and the related marketing tasks are mainly in the informal sector. Employment and income growth in the mining sector rose rapidly in the mid 1990s. A sectoral baseline study in 1995 found that 550,000 people were employed in the sector (Tan Discovery 1996). There were only 1.2 million total salaried jobs in Tanzania in 1995, which means that the mining sector had added another 46% of middle income jobs to the total employment, mostly in the early 1990s. No other sector has reduced ma1 poverty on such a scale. Making this trend a sustainable and healthy sector, however, requires careful management of relations between large-scale and small-scale mining. Health, safety, social and environmental problems that developed with mining also need sustained attention.
Official statistics also do not reflect the true potential that Tanzania has in the mining sector, as reserves have not been systematically evaluated. The sector is expected to continue to grow rapidly over the next decade (Intra governmental Export Strategy Task Force 1995). Artisanal mining appears to be levelling off, however, in the last three years.
1.1.1 Mineral geology
Tanzania has a rich mineral resource base. Geological mapping, exploration and mining activities dating back to the early twentieth century culminated in the first comprehensive geological and minerals s w e y in 1958. (Harris 1958). This was recently updated for the government (Ministry of Energy and Minerals, ed. Brian Hester 1992,1995,1998). The major mining companies are primarily interested in gold, although there is some investment in diamonds and industrial minerals. Artisanal miners are exploiting gold, diamonds, and a wide variety of coloured gems. 'The gold and diamond reserves have been well documented in
5

UNDP-sponsored studies and studies sponsored by private mining companies. Commercially, viable deposits are scattered along the western side of the Rift Valley, gold in the greenstone belts of the Archean craton and diamonds in the hundreds of Kimberlite pipes throughout the same geographic area.
Gold mining activity is concentrated in three major areas, but activity often shifts as old deposits become less profitable and new ones are found. The main gold areas include the following:
the Lake zone gold fields, south and east of Lake Victoria, up to the Kenya border. The most active sites are Geita, Bulyanhulu near Kaharna, Irambe, Sekenke, Kilima Fedha, Serengeti, Nyambegena, Buzroba, Matinje, Musoma and Tarime (north Mara).
the Lupa area in Chunya District of Mbeya Region near the Zambia border. The most active mining sites are Saza, Makongolosi, Ntumbi, Chunya, Lupa-Sira, Sengambi, Mabadaga and Iyai.
Mpanda, with six active mining areas: D-reef, Magamba, Kapanda, Kitisunga, Ibindi, and Sikitiko.
new sites at Lukalasi in Mbinga district, Kitowero in Liwale district and Iluma in Manyoni district.
The major diamond mining areas are in northern Tanzania, around Shinyanga, Mwananga, Mabuki and Mwanza. Williamson Diamond Mine at Mwadui is the only formal mining operation, with exports of $17 million in 1998. Diamonds worth an estimated $13 million to $16 million per year (Vethouse/USAID 1995) are produced by artisanal miners and exported, mostly through informal channels.
Commercially exploitable deposits of coloured gems tend to be found on the eastern side of the Rift Valley. They were originally discovered and exploited by individuals and small companies. They are now the subjects of a mining rush comparable to that of Brazil in the 1980s. This geographic region hosts two gemstones unique in the world, Tanzanite and green garnet (called Tsavorite in Kenya, for the Tsavo area in which it was originally found). The only known deposit of Tanzanite in the world lies near Merelani, in northern Tanzania between Arusha and Moshi. This is a brilliant but slightly brittle gemstone ranging in colour from pale violet to deep blue- violet. It was popularised by Tiffany's in the late 1970s, and commanded a peak price of US$2500 per carat by 1983, declining thereafter. More recently rare and precious Alexandrites, previously known only in Sri Lanka, have been found in southern Tanzania near Tunduru. There are extensive deposits of ruby (Morogoro and Umba River), sapphire, garnet, tourmaline (Umba River and Tunduru), emerald, chrysoberyl and other semi-precious gems (Tunduru).
1.1.2 Government objectives
The government set the following objectives for the mining sector (Ministry of Energy and Minerals 1997):
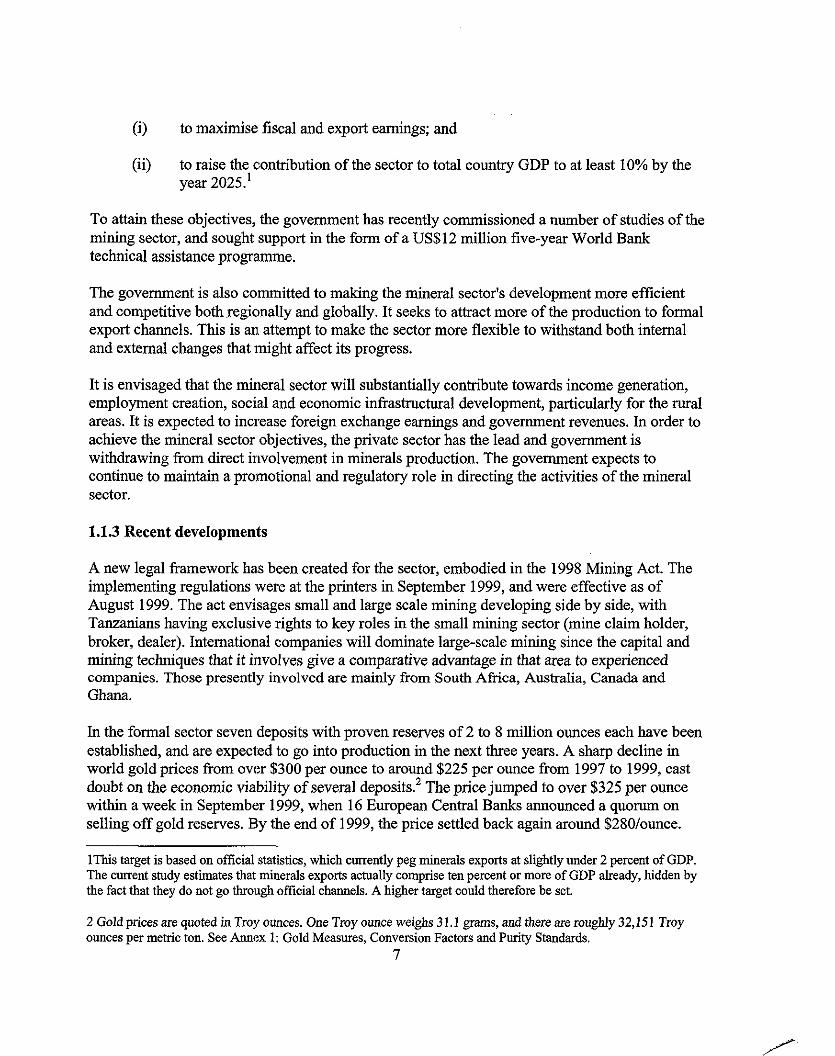
(i) to maximise fiscal and export earnings; and
(ii) to raise the contribution of the sector to total country GDP to at least 10% by the year 2025.'
To attain these objectives, the govemment has recently commissioned a number of studies of the mining sector, and sought support in the form of a US$12 million five-year World Bank technical assistance programme.
The govemment is also committed to making the mineral sector's development more efficient and competitive both regionally and globally. It seeks to attract more of the production to formal export channels. This is an, attempt to make the sector more flexible to withstand both internal and external changes that might affect its progress.
It is envisaged that the mineral sector will substantially contribute towards income generation, employment creation, social and economic infrastructural development, particularly for the rural areas. It is expected to increase foreign exchange earnings and government revenues. In order to achieve the mineral sector objectives, the private sector has the lead and government is withdrawing from direct involvement in minerals production. The govemment expects to continue to maintain a promotional and regulatory role in directing the activities of the mineral sector.
1.1.3 Recent developments
A new legal framework has been created for the sector, embodied in the 1998 Mining Act. The implementing regulations were at the printers in September 1999, and were effective as of August 1999. The act envisages small and large scale mining developing side by side, with Tanzanians having exclusive rights to key roles in the small mining sector (mine claim holder, broker, dealer). International companies will dominate large-scale mining since the capital and mining techniques that it involves give a comparative advantage in that area to experienced companies. Those presently involved are mainly from South Africa, Australia, Canada and Ghana.
In the formal sector seven deposits with proven reserves of 2 to 8 million ounces each have been established, and are expected to go into production in the next three years. A sharp decline in world gold prices from over $300 per ounce to around $225 per ounce from 1997 to 1999, cast doubt on the economic viability of several deposits2 The price jumped to over $325 per ounce within a week in September 1999, when 16 European Central Banks announced a quorum on selling off gold reserves. By the end of 1999, the price settled back again around $280/ounce.
- IThis target is based on oficial statistics, which currently peg minerals exports at slightly under 2 percent of GDP. The current study estimates that minerals exports actually comprise ten percent or more of GDP already, hidden by the fact that they do not go through official channels. A higher target could therefore be set.
2 Gold prices are quoted in Troy ounces. One Troy ounce weighs 31.1 grams, and there are roughly 32,151 Troy ounces per metric ton. See Annex 1: Gold Measures, Conversion Factors and Purity Standards.
7

This improved price outlook changes the economics of gold mining in Tanzania. Some mines may operate longer, and some deposits considered marginal at $255 per ounce, may be developed after all. An additional thirteen lesser deposits currently being drilled, may thus come into production.
1.2 Purpose of the study
The first phase of this study focused on minerals marketing. The Ministry of Energy and Minerals had put in place a licensed dealer system, but it was not working well. A large, but unquantified, portion of the gold and gemstones was being smuggled. The 1995 mineral sector baseline study described the markets, but how they worked was not really understood.
The second phase of this study was designed to explore in greater depth several issues that emerged from the first phase of research. The most important of these was how the interests of large-scale and artisanalkmall-scale mining could be balanced over the long term. Sometimes they were competing for the same deposits. They needed clear criteria, procedures and an overall legal framework conducive to the development of both types of mining.
The dimensions of the parallel-market trade needed to be evaluated with additional methods. The first-phase of this study produced low and high estimates of trade volume, with a wide gap of uncertainty. By the low estimate, the total value of gems and gold exported from the artisanal mining sector was US$65 million. By the high estimate it was $300 million. The second phase of the study tries to narrow the gap. One new approach was to estimate the "missing exports" from the statistics on imports, exports, money supply, inflation and exchange rates. Tanzania had run an unsustainable official trade imbalance for more than a decade, in which imports exceeded exports, sometimes by over 200 percent. Yet inflation had actually come under control, the money supply had not expanded very sharply and the floating currency had not devalued as much as such a trade imbalance would normally engender. Foreign exchange clearly was entering the system through invisible exports.
It was clear during the first phase field work that mining generated a lot of new small business investment and trade, for transportation, shops, cafes, bars, guest houses, groceries, etc. The second phase of research sought to quantify the contribution of secondary economic activities to GDP, and to describe them in more detail. We had hoped to use the most recent Household Budget and Consumption Survey, comparing incomes and activities in mining vs. purely agricultural villages. Upon closer inspection, however, the data had been collected back in 1991. As this was before the recent mining booms developed, this line of inquiry was abandoned.
The second phase of the study also envisaged a fuller review of tax policy in the mineral sector. The fist phase of the study showed that high and arbitrary tax rates and payment procedures were the primary disincentive to use "legal channels." We decided to bring in a fiscal specialist (Dr. G.P, Shukla), to review tax policy and administrative practice in the sector.
Finally, phase two was used to explore further new opportunities for value-added activities in the sector. Both upstream and downstream opportunities were examined. Upstream includes geological studies, surveying, cartography, construction, mining supplies and services, etc.
8

Downstream processing can include refining gold, faceting gemstones, and jewellery design and manufacture. We studied the global competition to focus on niches where Tanzania could build a comparative advantage.
Due to funding and time limitations on EAGER grants, the first phase only conducted fieldwork in the North and Center of the country. The second phase completed the geographic coverage by conducting fieldwork in Zanzibar, Dar es Salaam, the southern gem-rush zone, and the Southwest.
1.3 Methodology of the shdy
1.3.1 The consultative process
An integral part of the study approach has been to work in consultation with a Policy Advisory Committee comprising policy makers from both the public and private sectors. The research team was mobilised at ESIW in August 1996 and a policy-makers' Advisory Committee was immediately constituted to guide the study. It was comprised of individuals who work in the Ministry of Energy and Minerals, the Tanzania Revenue Authority; the Tanzania Chamber of Mines; the Tanzania Mineral Dealersrs' Association (TAMIDA) and the Federation of Miners Associations of Tanzania (FEMATA). All members served in their individual capacities on the Policy Advisory Committee. In August 1996 the committee inaugurated the study and provided advice for the first field work trip, which took place in the northern zone in August and September 1996. It met again periodically throughout the period of the study.
During phase two the policy dialogue moved to more public arenas, with two workshops sponsored by the study. One, entitled 'Wational ~ i n i n i Awareness Workshop," was conducted by the ~ h a i b e r of ~ i n e s i n ~ w a n z a September 25-28, 1999. It focused on bringing together the small and large mining sectors with local officials and national Ministry officials. It enhanced communications on key issues between the different levels of government, different scales and modes of mining and between government and private sectors. The second workshop, conducted by ESRF in Dar es Salaam, December 17, 1999, was entitled "Mining and Marketing: Will it Lead to Sustainable Development." One working group focused on tax issues while the other debated benefits and sustainability of each type of mining.
1.3.2 Field interviews and data collection
The team used rapid rural appraisal methods to interview participants at every level of the marketing chain. This yielded a portrait of the sector and its various actors, as well as a map of trade flows. It also gave a fairly clear picture of how different groups were affected by policy changes that occurred during the study period.
Key informant interviews were held with mining and other local officials throughout the zones covered, and at the national level. We interviewed and collected data from officials in the ~ i n i s t & of Energy and Minerals, the World Bank Minerals Sector Project, and the Tanzania Revenue Authority. We spoke with five representatives of international mining companies interested in Tanzania. At the local level we interviewed leaders of the mining community,
9
mining associations, minerals zonal officers, police, migration officers, and leaders of national professional associations involved in mining and marketing. Semi-structured interviews were conducted with miners and traders at all levels of the chain, extensively in Tanzania and more lightly in Kenya. This proved to be the most useful form of information collection, as participants nearly always refused to answer formal questionnaires on their marketing practices. The team agreed upon a set of topics to be covered with each type of actor in the chain. Semi- structured individual and small-group interviews were held, following a specific set of topics, but without a formal questionnaire. In most cases the team took notes during the interviews. Whenever the team believed that this made the interviewees less forthcoming, note taking was deferred. During evening feedback sessions the team compared notes and highlighted the key ideas from each interview. Focus groups were held when possible, for example, with the mine claim-holders of Tanga Region and with the brokers of Arusha Region. This allowed us to estimate the proportions of commodities following different routes and to understand the logic of the participants. The price data provided was used to analyse relative benefits to Tanzania and Kenya from the trade.
1.3.3 The sample interviewed
The sampling pattern involved both geographic and socio professional stratification. In the two initial field trips, the team interviewed over 300 people in two of the five zones into which we divided the country, including 20 master dealers, 123 mine owners, 50 brokers and 64 officials and mining community leaders. In Dar es Salaam, wholesale dealers, goldsmiths and jewellers were interviewed, as were, for comparative purposes, dealers and officials in Kenya and Ghana.
In the Tanga Region, all leaders of the Regional Miners Association (REMA) were interviewed. In the Umba River area, in addition to brokers of various types, six mining village leaders were interviewed. In Arusha, the major gem marketing town, we covered all types of participants in the minerals market. We interviewed the top six dealers, who together dominate the market, and other licensed dealers for a total of 18 of the 62 master dealers in Arusha. Leaders of the Tanzania Mineral Dealers Association were interviewed, including the chairman and other members. A group of leaders of the Regional Mines Association in Arusha were interviewed, as well as 40 out of the 3,000 brokers active in Arusha. Out of several operators in the area, fifteen medium scale traders and operators in economic activities other than mining were interviewed. The zonal mines officer of Arusha, Arusha Regional Police commander, officers of Tanzania Revenue Authority, and Officers of the former Tanzania Gemstones Industries (TGI) in Moshi were interviewed. In Dodoma several claim holders and mine workers in the gold mines at Nzunguni were interviewed, as were several mineral claim holders, brokers, master dealers and operators in mineral marketing. In Shinyanga we interviewed two major diamond dealers, and a regional mines officer.
Generally, the topics covered included marketing problems, followed by a history of the participants' role in the market. This included:
The prices they paid and received at each point for each type and quality of goods;
Their estimate of how many goods were going to which markets from their operating base; 10

The estimate of their price margins from one point to another, of monthly income or income from each buying trip, and their operating costs;
How the person got started in the mining sector, the sources and amount of start-up capital, the capital accumulation process, risks and losses experienced, and investment of gains;
Their proposals for improving minerals marketing; and
Relationships with relevant government departments
The team also interviewed persons involved in auxiliary activities, such as retail shops, restaurants, bars, hotels, transport and other services, to determine the variety of secondary activities that are generated by mining. We interviewed about a 10 percent sample of business owners in mining towns to determine their reported gross monthly incomes, operating and inventory costs, number of jobs (owners and employees), income levels, and relationship to mining. We asked about historical and seasonal variations in prices of staples at the same time to check for mining-related local inflation. We also interviewed town residents concerning their assessment of the social costs and benefits of the presence of mining.
Since mining activities are spread throughout the interior zones of the country, the fieldwork exceeded the time and budget limits of the first EAGER grant. Research had to be conducted in two, separately funded, phases. The country was divided into five zones, to be covered in successive fieldwork trips:
(i) the northern zone, including the gem-bearing and trading areas of Tanga, Umba River, Korogwe, Kilimanjaro, Moshi, Merelani and Arusha;
(ii) the Lake zone, including the gold, diamond and gem mining areas of Mwanza, Tarime, Singida and Shinyanga;
(iii) the central zone, including Morogoro, Songea, Mpanda, Kigoma and Chunya;
(iv) the southern zone, including Tunduru and the surrounding Ruvumu River gem rush area, plus the market towns of Mbeya and Mtwara; and
(v) Dar es-Salaam and Zanzibar Island.
Only the first two zones could be covered with the funds available for the first phase of the project. A second phase EAGERITrade grant was received after a delay of more than a year, allowing the team to complete fieldwork in the southern zone, Dar es-Salaam and Zanzibar. While the long period of research was not planned initially, it has proven quite valuable from the policy point of view. Some policy recommendations made after the first fieldwork in 1996 were implemented during the course of the on-going study. Other new policies and external factors

strongly affecting minerals markets also occurred during the study period, which allowed the team to observe market responses to a number of policies and events.
Four sets of economic analyses were conducted during the study, as described in the Economic Analysis and Tax Policy and Administration chapters. The first analyses the impact of the minerals trade on the actual macro-economic situation of Tanzania, including the impact of the liberalisation of minerals trading on employment, income distribution and economic growth (GDP). It also examines the effects of smuggling on GDP and foreign exchange. Two main macro economic calculations are undertaken. First is the impact of undeclared mineral exports on under valuation of the GDP, and on the under valuation of the portion of GDP generated by mining. As precious minerals are almost entirely exported, the balance of trade indicated in the official statistics is also substantially understated, as most of these exports are undeclared. It is known in mineral trade circles that these exports generate foreign exchange used to finance imports. This helps to explain how Tanzania has managed to record an increasingly large negative trade balance for many years, without a corresponding devaluation of its currency (which floats freely). Consumption of imports is clearly higher than official exports could fmance.
The second calculates the value-added from trade at each step in the marketing chain. This allowed us to estimate the distribution of economic benefits from northern Tanzanian mining between Kenya and Tanzania. Our results showed that an estimated 95% of gold and 60% of gems are smuggled out through Kenya. Most policy-makers in Tanzania tend to assume that an equivalent portion of economic benefit is lost to the Tanzanian economy. This turns out not to be true. When the reserve value of minerals and the value-added from mining and the portion of the trade that takes place in Tanzania are cumulated, the great majority of the economic benefit redounds to the Tanzanian economy despite any illicit export channels.
The third analyses the competitiveness of Tanzania's business climate. Microeconomic models were built for two typical operations in the sector: a gem dealer's business and a gold mine. We showed clearly in the first phase of the research that Kenya's willingness to export minerals tax- free, and ask no questions about their source, was helping attract most of the regional mineral trade to Nairobi. The tax reforms implemented during this study in Tanzania attracted some of that trade back to Tanzania. The gem and gold risk models in the chapter on taxation project similar increases in legal trade and government revenue from recommended further tax reforms.
The fourth set of analyses deals with taxation, analysing the impact of current tax policy and practice on both government and operators in the sector. It explores some tax policy alternatives, taking into account revenue yield, costs of compliance and impact on the sector.
1.3.4 Review of available literature
A review of the literature was conducted in the course of the study. Previous literature on artisanal mining includes a series of world-wide studies and workshops financed by the World Bank, as well as surveys designed to attract mineral investment to Tanzania. Background geological mapping and information is the third type of literature, mentioned above (see the introduction).
12
There has been new interest in the minerals sector with the introduction of major changes in Tanzania's socio-economic policies in the mid-eighties. Several studies have reviewed the country's mineral resources and made recommendations to improve the sector's performance. A study was commissioned by the Ministry of Energy and Minerals in 1994 as preparatory work for the Mineral Sector Development Project funded by the World Bank. (Engineering Associates and Tan Discovery 1994). The study examined at length the problems facing mineral sector development in Tanzania. [t signalled small-scale mining, training, and environmental issues as areas needing further study.
Another group of studies aimed at attracting and guiding large-scale mining investors. Examples of these are: "Opportunities for Mineral Resource Development" (Hester 1991 and 1996), and "The Mineral Sector in Tanzania" (Vethouse 1996). These studies both provide summaries of the rich mineral resource base of Tanzania as well as the licensing procedures, the existing fiscal regime and other investment incentives. Hester's work provides details of specific mineral potential areas and government efforts to support mining investors. The Vethouse Associates study, funded by USAID, provides an independent assessment of those efforts and makes recommendations to improve the existing legal and regulatory framework.
From the mid-1980s to the present time, the activities of artisanal and small-scale miners have increased considerably from a few thousand miners to more than 550,000 people. This development was followed. by a number of studies addressing various sub-sectoral issues. In 1994, the UNDP financed studies of "Small-Scale-Mining in Tanzania", the first part involved a Technical Assessment (Hollaway 1994) and the other part concentrated on the Institutional Framework (Lwakatare 1994). There was another UNDP study, "Export Development and Promotion of Mineral Resources" (Twum and Kanza 1992) which reviewed existing data on Tanzania's mineral resources and made some practical recommendations on the problems facing the mineral markets.
Comparative information has come largely through World Bank efforts, as academic and technical mining literature is remarkably silent on artisanal mining. In April, 1994, the World Bank organised a Round Table in Washington on Artisanal and Small Scale Mining with the aim of formulating a global "Comprehensive Strategy Towards Artisanal MiningU(World Bank 1995,1996). Several papers where presented including a study on "Artisanal Mining in Tanzania" (Tan Discovery 1994) which mainly covered the organisational and socio-economic aspects. The round table deliberations also included the "Harare Guidelines for the Development of Small- Scale Mining" (UNDP 1992) and the past experiences in addressing the issues of the sub-sector. Roundtable speakers noted that several million people world-wide earn a living from artisanal mining. They produce an estimated 20 percent of the gold, 40 percent of the diamonds and nearly all of the gemstones mined in Africa. The phenomenon is also widespread in Latin America, although international mining companies are gradually squeezing Brazil's famous small miners out. The small miners produce 50 percent of Brazilian gold today, against 70 percent some years ago.
In connection with the launch of its World Bank-funded mining sector reform, Tanzania's Ministry of Energy and Minerals commissioned a detailed study of the small-scale sub-sector in
13

Tanzania. The Baseline Survey and Development Strategy for artisanal and small-scale mining programme (Tan Discovery 1996) provides basic data and strategies on institutional, organisational, mining and processing, marketing, environmental and socio-economic aspects. The study did not cover some important issues on mineral markets that could help to influence policy changes in legal and fiscal regimes to improve mineral markets.
Work by Kimambo (1984) gives a brief description of Tanzania mineral potential and various mining development activities from the late 1950s to the mid-1970s. Chachage (1994) conducted a study on mining operations and socio-economic aspects from the late 1930s to early 1990s. It examined the mining industry and accumulation in Tanzania, and critiqued the relationship between artisanal miners and formal mining companies.
None of these studies directly addressed marketing operations and related policy issues, thus driving the focus of the current study.

2.0 MARKETING FOR SMALL SCALE MINING IN TANZANIA
2.1 Background of mineral marketing in Tanzania
Mineral marketing processes and structures can be traced back to the colonial era. In the 1930s, a gold rush in the Lupa area stimulated minerals exploration in many areas. Small reef miners with some capital and equipment obtained from other economic sectors emerged and joined in the production and marketing of gold.
Africans pressured the colonial government to grant them licenses because they were victims of low wages and poor conditions. They had experience working in mines, under the settlers and other European miners. A product sharing scheme allowed retired European civil servants, known as "veranda prospectors," to exploit artisanal mines in the late 1930s, contributing to the development of loose mineral marketing. The official market dominated mineral trading although there were some reported cases of smuggling. By the end of the colonial period, mineral products were contributing over 10% to the total export earnings.
After independence, the government continued to issue prospecting licenses on individual bases, but encouraged small operators to form mining co-operatives. Some of these co-operatives, such as Lupa Gold Diggers Association, which was formed in 1963, played a key role in both the mining and marketing of gold from small-scale miners. Later on, many mining properties were taken over by Greek nationals who also dominated the sisal industry.
A 1965 mineral trading ordinance and a gold ordinance regulated mineral trading. Commercial banks supported mineral trading through the provision of credit facilities and mineral custody service. Smuggling was minimal and the few well-established companies handled most of the exports. The main ones were Umba Ventures for Mining and Export of Coloured Stones and Williamson Diamond Mines.
After the Arusha Declaration in 1967, most of the mining companies were nationalised. The government formed Tanzania Gemstone Industries Company (TGI) in 1972, with a monopoly in mining purchasing, producing and exporting coloured gemstones. In 1973, the government formed the State Mining Corporation (STAMICO) which was responsible for overseeing the development of the mining sector, including new exploration and the operation of nationalised mines. Williamson Diamond Mine, which had been a DeBeers subsidiary, was partially nationalised and renamed Mwadui, but continued to operate with private technical management.
STAMICO became the parent company of TGI and Mwadui Diamond Mine. From 1970 to the mid-1980s, the mineral export performance was most unsatisfactory, as there was a drastic fall in gold exports and a gradual decline in diamond exports. Gold exports, for example, dropped from 500 kg in 1969 to 20 kg in 1971.
The comprehensive economic reforms introduced as part of economic recovery programmes of the mid-1980s led to the liberalisation of the minerals markets through the issuing of mineral - dealers licenses to private operators in 1987. Soon after, mineral exports started to increase. The
15

MAP 1. Mineral Trade Routes
MIKERAL MARKETS ROUTES
THE LAKE AND NORTHERN ZONES
Bank of Tanzania established a gold buying system through the National Commercial Bank in 1990. Official exports of gold accelerated to a peak of US$40,38O,OOO in 1992, up from US$1,152,057 in 1989. The buying system was bankrupted by a scam in 1994, and subsequently discontinued. From 1995 to 1997 there was inadequate provision for the legal purchase of gold in the country, and most production in those years was marketed through the informal channels in Kenya. Meremeta, currently the largest gold exporter, was formed in 1998 as a joint venture between a South African company, Executive Outcomes, Inc. and the Tanzanian military. Meremeta markets gold and provides artisanal and small-scale miners with equipment on credit. The South African partner, is now called Triennex Ltd.
By 1994 the currency was allowed to float freely and importers were allowed to use their own sources of foreign exchange. Mineral markets began to flourish in Tanzania, and the influx of capital spurred new exploration. Plots in the Merelani Tanzanite mines were allocated to small miners in two phases in 1995 and 1996, creating a surge in production. In the far south, the Ruvuma River valley, which forms the border with Mozambique, was found to be extraordinarily rich in coloured and precious gemstones of many varieties. This set off a mine rush that has brought over 250,000 people into that isolated enclave, and created a regular traffic of chartered flights, ocean freighter services and overland trips.
The surveys found four levels in most of the regional East African minerals markets: the mining area, the primary market in a nearby town, the secondary market in a major city and the export market (also from that city). Each of these has its own features. There are four levels for gemstones, often only two or three for gold and diamonds. The more valuable the goods sold, the more likely sellers are to try to skip one or more links in the normal marketing chain and keep the mark up themselves. Major mining areas and routes to secondary and export markets are shown in Map 1. Modem communications technology is telescoping the international minerals market chain, eliminating many levels. It is beginning to have a similar impact on the regional minerals markets in East Africa. Dealers in Arusha, who three years ago had trouble getting a call through to Dar es Salaam or Tunduru, can now operate Internet list markets from their offices, bringing even artisanal miners and manufacturers quite close.
2.2 Structure and characteristics of the mineral markets
The marketing chain
Figure 2.1 illustrates the trade relations between different market levels.
+ Market level one: The mining area
The first sale of raw gems or gold ore often takes place immediately at the mining sites. At this market stage, small brokers and mine workers are the main participants. The organisation of artisanal mining favours this arrangement. Tanzanian mine workers refuse to work on salary, preferring the prevailing system of production sharing between worker and the mine claim holder andlor pit owner. Mine workers could market their official shares openly in nearby
17

mining towns until the new Mining Act went into effect in August 1999. Now they must sell to a licensed broker or dealer. One well-used avenue of smuggling, even during the period of open minerals sales, was for mine workers to hide valuable finds and market these stolen goods to mine brokers directly at the mine.


r Market level two: The primary market
In mining villages a short distance from the mines one finds primary markets where production enters quasi-legal channels. Such sales were legal until the new Mining Law went into effect in August 1999, provided the broker is licensed. For reasons explained further on, most of the brokers at this level are not licensed. The degree of market activity in mining villages depends mainly on the quantity and quality of the recovered minerals. The main participants in this market level are brokers and small brokers. The latter frequently shuttle between the mining sites and the primary market.
On local market days mineworkers are active, selling small parcels of good quality stones. Master dealers and large-scale brokers from major towns and even outside the country frequently visit mining villages. The government banned foreigners from mining areas in 1996, but the exclusion is difficult to enforce. Sometimes, participants in other economic activities living in the mining villages and towns, such as retail shop keepers, barbers, owners of guest houses and bars, also participate in this market stage. The market size varies considerably depending on the type of mineral production and the level of international demand. When production is high and dealers have received international orders, market volume swells quickly. In typical mining villages there can be 3 to 5 long-distance brokers and several small mine brokers. In areas where production is small and uncertain, there are few visible signs of the trade. This was noted during the survey at Mabuki diamond mining village, where currently brokers do not stay permanently in the village as they used to do. Trade is still taking place, but only through occasional visits by brokers. On the other hand, in thriving mining towns such as Merelani there were an estimated 3000 small brokers and 50 long-distance brokers in 1996.
+ Market level three: Regional market towns
Regional market towns are where most mineral dealers have established permanent offices. The main market for both gems and gold throughout the region is Nairobi, but several Tanzanian towns are trying to compete, and other regional towns also have a role. The centre for the Tanzanian gem trade is Arusha, although Dar es Salaam also serves as a regional gem market. In the south, since the gem mining rush began in 1995, several towns have alternated as regional markets, as different government authorities altered the places and conditions under which dealers could operate several times. Mtwara served as a thriving regional market for the south in 1996. When allowed to do so, dealers shifted to Tunduru in 1997, but soon were forced back to the coast again. By 1999 gem mining and exporting was less than 10 percent of the 1996 volume. No dealers were registered in Mtwara and those registered in Tunduru, Masasi, or Maji Maji have no permanent presence. Their shops remain, some shuttered, others open but without the owner present and without buying funds.
Mwanza, and Tarime are major gold markets, and Shinyanga dominates the diamond trade. Dar es Salaam also handles some of the gold trade, although most of it continues to Zanzibar for export.
In such markets, the existing infrastructure and facilities allow for easy export and access to foreign buyers. Market towns need to have good road access, airports and

telecommunications, which are essential for dealers to communicate with their international buyers. The major participants in these markets are master dealers, brokers, and organised small-scale miners. Some illegal mineral traders are based here. Legitimate dealers and brokers, those who usually try to abide by the law, also export through Kenya on some occasions, as it is sometimes the only way to do business. There is some specialisation in the coloured gem market, particularly with dealers who buy mainly one type of stone. Most dealers, however, put out buy orders whenever they have an international buyer for a particular type of stone.
Arusha market is the major gem centre in the country, handling high quality goods suitable for faceting. Products traded include Tanzanite from nearby Merelani, tourmaline from Tanga and Arusha, green garnet from Arusha and Kilimanjaro and rhodolite from Tanga, Morogoro and Arusha.
Dar es Salaam is also a secondary market of minerals in the country. This market handles the largest variety of products, minerals of various types and qualities from different mining areas of the country, particularly the center and south. Some of the major mineral types traded in the market are:
1. Ruby and sapphire from Morogoro, Tanga and the southern regions, 2. Alexandrite and chrysobel of all sizes and grades from Mtwara, Ruvurna, and Lindi, 3. Red garnet, rhodolites, tourmaline, amethyst, emerald and aquamarine, and 4. Gold and diamonds, mainly from the central and southern zones.
Tanga was once the major gemstone centre, particularly in the early 1970s. Now the market is barely active. It had two registered dealers in 1996, neither of whom was active, and a number of informal brokers. Tanga now serves as a transit point for materials from other parts of the country that are smuggled into Kenya. Most of the minerals traded in Tanga originate from the Umba valley mining area, situated in the same region. The important minerals traded in this market are sapphire, ruby and all types of garnet and tourmaline. During the survey, it was observed that most of the medium grade ruby from Morogoro is either marketed here or smuggled via Tanga to Kenya. Sapphire bought in Tanga is later marketed in Dar es Salaam before it is exported, while tourmaline and garnet are marketed through Arusha for export. The interviews conducted during the survey revealed that some gold from Singida and Dodoma is marketed in Tanga.
Mwanza is the major secondary market for minerals from the central and lake zone mining areas. Gold is the main commodity traded there. It is collected from the Regions of Singida, Shinyanga, Dodoma, Tabora, Mwanza and Kagera. Participants estimated that 95% of the gold is traded on the parallel market in Mwanza and later smuggled to neighbouring countries. It is sold in Nairobi, Mombasa, Nakuru, and Isibani, all Kenyan towns. Another route for gold from Mwanza is through Dar es Salaam and then to Zanzibar. Some diamonds from Mabuki are sold in the Mwanza market. Foreign diamond buyers occasionally visit the market.
Shinyanga town is famous in East Africa for the informal trading of gem diamonds. Most of the diamonds traded in this market are obtained from Maganzo mining village, including stolen materials from the Mwadui diamond mine, Nyanghwale in Kahama and Mabuki in Kwimba. With the exception of official sales from Mwadui Williamson Diamond Mine, most
of the goods are from artisanal miners and are marketed through informal channels. Fieldwork interviews indicated that foreign buyers obtain diamonds straight from local traders in and around Shinyanga town. Goods from Shinyanga are then transported through Dar es Salaam or Mwanza and smuggled out.
Nairobi has been the main regional market for gems and gold since Tanzania attempted to nationalise mining in the 1960s. Its markets grew rapidly as mining activity increased in all countries in the region in the 1980s and 1990s. Foreign buyers like it because air access is easy, dealers stock all types of products in good quantities, comfortable accommodations are available at reasonable prices, and their business can be done in relative security. Local sellers cited similar factors for taking their products there. Prices are sometimes, but not always better. Even when they are not better, there is the advantage that dealers will buy quickly all types and qualities of goods, so a broker can be in and out in a single day. Northern Tanzanian mining areas are geographically closer to Nairobi than to Dar es Salaam, and the road networks are considerably better. Security had been better in Kenya than in Tanzania during the mid-1990s, which was one reason interviewees gave in the 1996 fieldwork for trading there. In the last two years the security situation in Kenya has deteriorated sharply, while Tanzania has remained stable.
Nairobi alone was estimated by one of its dealers to have about 300 active dealers. A significant number of them are well organised, well capitalised and have family ties in the business that span generations and continents. Many are from the goldsmith caste in India, whose families have invested in commerce and industry in East Africa over several generations. This gives them an advantage in market knowledge and contacts, something that many Tanzanian dealers lack. Some 54 major gem dealers are listed in the Nairobi telephone directow, together with eight minerals dealers. Many have multiple lines, reflecting the fact that international gem dealing requires intensive telecommunications. The Kenyan mineral dealers association had some 85 members before it became inactive a few years back. Some of the major dealers interviewed in this study were not listed in the telephone directory, nor did they participate in the dealers' association, which rends more credible the verbal estimate of 300 active dealers.
In addition to a portion of Tanzania's precious minerals, Nairobi markets handle some artisanal diamonds and gold from Eastern Democratic Republic of Congo (DRC), sapphires from Rwanda and smaller quantities of gems and gold from throughout the Rift Valley area. The Rift Valley, extending from Tanzania to southern Ethiopia, increasingly constitutes a regional market. Dealers throughout the region compete to buy the production, which flows wherever the trade is well organised and relatively secure. Kenya has some gem and gold mining of its own, but its main advantage has come through creating a free market for regional production. Imports are welcomed and pass untaxed, although not always without harassment from officials. Export formalities in Nairobi are well organised, and, for established dealers, done on secure premises. Some Tanzanian production also goes through Mombasa, Kenya's main coastal port.
+ Market Level Four: Export markets
The export market is the final stage of the four market levels and normally depends on the location of transactions as well as the destinations of the purchased minerals. The export market can appear in several forms. The market can appear when a foreign buyer is

purchasing from a dealer at his offices or during a gemstone show. Foreign buyers also like to travel to mining areas to buy directly from miners, although this is prohibited by the new Mining Act of 1998 and by precursor regulations in effect since 1996. For the minerals trade from artisanal production, Tanzania is part of a regional network that covers all three Great Lakes countries (Uganda, Rwanda and Burundi), Eastern Democratic Republic of Congo (Kisangani, Goma, Bukavu and Maniema Regions) and East Africa (Kenya, Uganda and Tanzania). Political leaders of contending factions, armies and even a few participants in relief operations for refugees created by recent conflict in the area have become involved, although most dealers are long-term professionals. Most of the mineral products have been destined for processing centres of Asia and Europe, with a small portion going directly to the main manufacturing and retail jewellery sales markets in the USA, Japan and Europe.
+ Supply, demand anal movements in regional markets
As precious minerals are nearly all produced for export, those on international markets lead prices in regional markets. Regional markets, however, are highly imperfect and those for gems are quite volatile.
Market information is so poor in most places that there can be a significant time lag before international price changes and market conditions are reflected in local markets. Nairobi is the main regional entrepot for a number of reasons. Its policies are designed to attract the trade. No questions are asked of traders bringing in minerals overland, and no duties are paid on export. Nairobi also has the best market information, lowest telecommunications costs and most frequent commercial flight service in the region. It is also centrally located, has the best network of overland feeder roads, regional public transport and the largest, best capitalised private business comrntu~ity. On the other hand, it has relatively few productive mines compared to its neighbours.
While every country along the rift valley has gold and gem deposits, the richest artisanal mining areas supplying the trade in the last two decades are found in Tanzania and the Democratic Republic of Congo (former Zaire, henceforth referred to here as DRC).
The once tightly policed DRC diamond and gold mining sector was liberalised to allow artisanal mining and minerals trading in the early 1980s. The resulting expansion of artisanal mining affected most of the eastern and southern provinces. Maniema, inland from Lake Tanganyika, became a major source of gold. Diamonds and gold were both found in Kisangani, the Kivus and to a lesser extent in other provinces. Private trading networks within DRC (then Zaire) began competing with the State Mining Corporation (MIBA) in the 1980s. Neighbowing coimtries quietly established licensed dealer laws allowing diamond and gold buyers to export in exchange for minimal royalties (0-1.75%), sometimes with a substantial licensing fee andlor annual minimum export quota. Conflicts that escalated throughout the region in the 1990s have been, in part, fought for, and funded by, these minerals trades.
Tanzania's mining sector liberalisation came at the end of the 1980s and in the early 1990s. The artisanal mining sector experienced the same type of mining rushes, but in Tanzania the social fabric is considerably more orderly and harmonious than that of the DRC. Since liberalisation, Tanzanian authorities have been working to create an orderly legal marketing system that would attract the majority of its own minerals. While it has no official policy
encouraging the flow of DRC and other regional minerals exports to its markets, in practice there are no obstacles to attracting that trade as well. Buyers for the Bank of Tanzania gold purchasing system in the early 1990s, and more recently from the parastatal joint venture Meremeta, did a thriving business in the Lake Tanzania port city of Kigoma.
Tanzania has succeeded to the extent of becoming the second major exporter for precious minerals in the region, after Kenya. Its major attraction is that it has no armed conflict, and a relatively low violent crime rate. The creation of a licensed dealer system has also been a factor. Capital and information are the two motors of a viable trading network. Tanzanian dealers and the markets they work lacked both when they started out less than a decade ago. Dealers had to use their own capital, and few Tanzanians had accumulated much. The costs of borrowing were prohibitive, 37-39 percent for a bank loan, and higher for one from the informal sector.
2.3 Participants in the Tanzanian mining marketing chain, profiles and roles
2.3.1 Regulators
The mining sector is regulated by the Ministry of Energy and Minerals, which sets policy and drafts the basic legislation. The top administrators concerned are the Minister, the Permanent Secretary and the Commissioner for Minerals. The Ministry recently prepared and discussed with stakeholders throughout the sector and the country a new mining law, to replace that of 1979. The new law was passed in 1998. The implementing regulations were then drafted, and are considered to be implemented as of August 1999. This study was conducted during a period when the monopoly provisions of the old system had been abrogated and a licensed dealer system was being tested, but provisions had not yet been codified into law. Part of the purpose of the study was to describe what was actually happening on the ground in the marketing system, so that the Ministry could formulate provisions for licensing appropriate actors in the chain.
As the new law had not been implemented when the fieldwork for this study was conducted in 1996 and 1999, what is described below is actual practice. Where provisions of the new law differ substantially enough from current practice to transform the market's function, the relevant provisions and their implications are analysed. The government seeks, with good reason, to create a stable, law-abiding mining sector in which smuggling is minimised. Our working hypothesis was that smuggling is stimulated mainly by inappropriate regulation, by laws that create incentives to use informal channels rather than formal ones.
The team realized that the regulators task is a delicate one, particularly for this sector. Total deregulation would be an unwise option. It would be poor stewardship of a depleting natural resource. Also the minerals trade is subject to abuse by money launderers, arms and drug dealers. To minimize their activities, regulations and constant oversight are necessary.
The Minerals Division (MADINI) has eight zones and a total of 20 offices throughout the country, whose officers and mining engineers are the main day to day administrators of the artisanal mining sector. They peg claims and transmit them to the central registry at Dodoma. They are also responsible for collecting monthly production reports, and conducting safety and environmental inspections. They have long been unable to do much training or inspection
for lack of adequate operating budgets, but recent reforms in the sector have been instituted to improve that situation.
Regulatory practices of the Ministry of Finance (notably Customs and the recently created Tanzania Revenue Authority), the Ministry of Interior (Irnmiaation and Police) also affect -,. - the functioning of the sector.
2.3.2 Formal mining companies
International mining companies have brought an exploration boom to northern Tanzania's gold fields since the early 1990s in response to the same opening that allowed artisanal mining to flourish. Golden Pride, the first major gold mine opened in late 1998, and six more are due to open within the next three years. Another 13 lesser deposits have been identified. If the recent recovery in the price of gold holds, they will probably go into production early in the next decade. This study discusses that development in chapter 4, as those companies have no role in minerals marketing except for their own production. The main interaction between international companies and artisanal miners has been one of conflict over claims. Each tends to regard the other as invading their territory and threatening their livelihood. Tanzania is trying to balance the needs and interests of the two.
A few small and medium-sized formal mines are operating in Tanzania. Most are under foreign management, and are joint ventures with Tanzanian partners. In contrast to the international mines, which generally do not want to encourage artisanal mining in any way, small formal mines sometimes serve as buvers for artisanal miners in the same area. Although it has not been legalised, this arrangement suits all parties. The formal mining companies are out in isolated areas with capital, contacts and motorised transport, all of which the miners generally lack. The ability to make some income from trading helps them finance their exploration and mine construction costs, normally a daunting capital outlay for a small company with no revenue stream.
Two of the four blocks of Tanzanite deposits at Merelani belong to formal mining companies. The other two have been. allocated to artisanal miners. The former Samax mine in Merelani was sold and closed for 1wo years, but is being reopened by a new purchaser, as a joint venture between a South. African entrepreneur and his--as yet unidentified--Tanzanian partner(s). (Cairns, 1999). The South African entrepreneur has laid out a plan that appears to foresee developing a unified marketing system for all Tanzanite similar to the Central Selling Office created by DeBeers for diamonds.
Williamson Diamond Mine has returned to production as a DeBeers subsidiary. A few small- scale formal mines in coloured gems and gold also exist.
2.3.3 Roles in the artisanal sector
A division of labour has arisen spontaneously in the artisanal sector, as have fairly standard patterns of economic agreements, miners organizations and authority structures for mine-rush areas. Lowest in the sector are young would-be miners who have not yet enough money or contacts to get into a mine gang. Next come mine workers, then brokers, next pit owners (or
funders), then claim holders and finally dealers. We use here the terms used in the field, which have now been incorporated into the 1998 Mining ~ a w . ~
(i) Mine workers
Mine workers are mainly young men from rural areas. Some operate seasonally, returning to their farms to sow and harvest their crops. Others work towards the short-term goal of getting a certain amount of income for a dowry or to go into business. Increasingly, however, mining is a year-round activity and one with an attractive career path. Successful mine workers become brokers, then dealers or mine claim holders. They may go into business in a mining related trade or service, while keeping a hand in mining. Pit and shaft mining is dirty, dangerous work. Most of the workers encountered in such sites were men 18 to 30 years old. In alluvial mining, however, where the work is less dangerous, some women, children and older men participate in mining activities, particularly where mining areas are close to their villages.
The team sought to determine mining income levels, in part to analyse mining's economic impact on the country. In order to make responsible recommendations concerning the future of artisanal and small-scale mining, the team also needed to understand whether the motivation that keeps miners working so hard under difficult circumstances comes from the gambling aspect, the need to fill a seasonal niche of underemployment, or from the economically rewarding nature of the occupation. The latter involved understanding minimum income levels as well as feasible career paths for miners.
The reservation wage (minimum customary daily earning) of mine workers is difficult to calculate, as one would have to calculate a shadow wage based on the opportunity cost of their time and the shared costs of food and lodging provided by mine owners andlor more successful co-workers during the unproductive times. According to workers' testimony, however, the mine worker's position is a coveted one that a young man must work his way into. He will work at manual labour jobs in the mining community long enough to build the savings and friendships necessary to join a mine workers' group.
We therefore took the daily wage of a manual labourer in a mining area as a shadow reservation wage. This was found to average 2000 to 3000 TSH (US3.33 to 5.00) per day in the northern, Lake and central zones. In the southern zone, where mining had dropped off sharply in 1999, reservation wages in mining towns were lower than those in thriving towns, but higher than in purely farming areas. Reported reservation wages ranged from TSH 5001day to TSH 10001day (USs0.67 - 1.33). By then the value of the shilling vis-i-vis the dollar had also declined, from TSH 600/1$ in 1996 to TSH 750/1$ in August 1999.
Working conditions are tough, with long hours of hard digging and hauling, pounding and washing. What makes them bearable is that miners are essentially self-employed. Each gang, usually of four or five men, decides its own hours and mining practices. Generally members share the ore or alluvial gravel equally and each processes his own, or supervises the processing closely.
In 1996 and 1997 the terminology was a bit confusing, as "brokers" were expected to apply for a Mineral Dealer's Licence and "dealers" applied for a Master Dealer's Licence. The new law reconciled official language to local usage.
Mine workers unanimously insist on the production-sharing mode of mining. Mine claim holders, and small miners with enough capital to fence their claim areas, prefer to hire salaried mine workers. Tanzanian miners have repeatedly found that it does not work. One of the last interviewees was a quite successful small Tanzanian claim holders who tried to formalise his operations in this way, but saw his operations languishing because he could not attract workers. Mine workers generally receive wages andlor food and expenses only during the period when they are removing unproductive overburden. If the claim holder has the capital, he will fund the start up operations and thus ensure himself a proportionate share of the ore. When, as is often the case, he invests no capital in the mine, or finds that miners have begun working before he: registers his claim, he has to negotiate with the mine gangs for a share. Theft and cheating are widespread in this arrangement. Workers feel somewhat justified in hiding and smuggling out goods, as they are at the bottom of a ladder in which the wealthier seemingly make more money with less effort. Robbery is another matter, a crime that they organise to prevent and suppress.
Mine workers are the main sellers at the bottom of the marketing chain. They are the initial source of many illegally traded minerals. They market their agreed shares through the claim holder, who takes a margin on the trade. Finds that the mine workers conceal on the side, they try to get quickly out of the area. Mine workers were also found illegally mining claims which owners have left unattended for a long time. This was observed in the Umba Valley, a sapphire mining area; Maganzo, a diamond mining area; and Sekenke and Matinje, gold mining areas. In the southern zone, the abandonment of claims after dealers have left resulted in squatter mining on a fairly large scale along the Muhuwesi River. The mining office reported that of 190 claims registered at the peak in 1996-97, only 76 had been renewed this year, and many of those were not being actively mined. Some 70 claims were being mined occasionally by unauthorised individuals.
Mine workers generally sell their products to mine brokers, claim holders or pit funders at the mine site or in a nearby village.
Market knowledge is a critical factor for actors in any market. It is not much of a problem for gold, as workers process their gold to a remarkably standard level of purity (82-85%, or about 20 k) and sell it by the gram at fairly stable prices. Gem miners, on the other hand, suffer great confusion, frustration and mistrust in selling their stones. The mine price of a single large clear sapphire, ruby, tsavorite (green garnet), colour A Tanzanite, can be several thousands of dollars. But miners dig and process kilos and kilos of smaller, cloudier, off- colour and cracked pieces of the same material that they sell only for pennies, or not at all. A worker may waste a lot of time trying to find a buyer for a stone that appears promising to him, but has an inclusion or crack he cannot see. He may also hide imperfections, oil the stone to make it appear clearer or try to pass off a garnet, for example, for a ruby.
The main complaint of mine workers about mining marketing is that it is not reliable. Many work in isolated areas, and cannot afford the time and travel costs to sell their goods. They want brokers and dealers to come to them, as many and as often as possible. Mining provided the best income for them in 1995 and early 1996, before the licensing system was enforced, when brokers and dealers, both Tanzanian and foreign, came to the mining areas.
The 1998 Mining Law provides that only licensed brokers and dealers can possess or sell precious minerals, and that these must all be Tanzanian citizens. The most obvious participants in the current market chain who are thereby excluded are those at the bottom and those at the top of the chain. Mine workers cannot sell and foreign buyers cannot visit mine areas or even buy from urban brokers.
The intent of both provisions seems to be to reduce opportunities for smuggling and increase the proportion of the trade in Tanzanian hands. If all of the mining areas could be fenced and closely supervised, smuggling directly from the mine sites might thus be reduced. Without fencing or supervision, which is the status today, mine workers will continue to sell--only now it will be a legal offence.
Prohibiting mine workers from having and selling minerals would fundamentally change the relationships of production if it were enforced right down to the mine area itself. Mine workers would not be able to share production, or at least they would have to sell only through the claim holder. The claim holder would be in a position to increase his share, without necessarily increasing his fmancial or administrative input into operations. Anyone with a little capital and knowledge of administrative procedures or contacts in the administration would have an incentive to file larger claims than in the past.
Tanzanians' jobs as brokers and dealers would be protected from foreign competition. But everyone else in the sector would lose. Sellers would get lower prices for their production. Miners, workers and brokers understand this situation quite well. They clearly stated that they wanted foreign buyers to come to their areas and to buy as they got better prices from them and could sell their production more quickly. When there are no foreign buyers, the whole sector tends to stagnate. This has been proven on a large scale in the southern zone. The number of active miners on the Muhuwesi River has declined from 41,700 in 1995 to about 610 in 1999. While this is partly due to exhaustion of the easy pickings in the rich alluvial gravels of the riverbed, informants all said that the departure of foreign buyers was the main reason for the decline.
(ii) Brokers
The difficulty of knowing rough stones enhances the role of the independent broker. Mine brokers' main function is to provide a little experienced knowledge to sellers. They generally cannot make a gemological assessment, but they know which dealers are buying which stones and have an idea of what prices they will bring. Nearly all the brokers and dealers interviewed recounted major losses in their learning period, and even after they were established, due to deceptions, mistakes or major price drops in the market.
Mine brokers move the stones from the mine to a nearby village, or from the village to the nearest town with dealers. Several other types of brokers exist. Some buy and sell small quantities of minerals. Others only guide the seller to a dealer, generally taking a 10 percent commission from the seller and sometimes 5-10 percent from the buyer as well. The commission from the seller is standard. That from the dealer is a reward for bringing in a good deal.
Brokers are generally young men in the same age group as mine workers - 18 to 30. Some switch off between mine work and brokering. Many are independent agents, or groups,

buying with their own capital or simply carrying the goods to market and paying the seller only after they are sold. Others are agents, relatives or employees of dealers, buying with the dealer's capital.
The gold trade involves a more standard commodity and fewer independent agents. Most of the brokers in gold are either claim holders or agents of dealers.
Brokers are rarely licensed. The law provided for brokers to obtain a licence beginning in 1996, but the procedures for those who tried were exceedingly cumbersome. Those who spent several weeks of their time and several months' income obtaining them found that carrying a licence brought them neither income, respect or freedom from police harassment.
Moreover, several types of brokering functions are not recognised by the law. Commission- agent work, for example, is not recognised by the law. The fact that the practice is so widespread, however, is evidence that it provides a useful service. If good information were more widely and inexpensively available, this function would dwindle in importance.
The laws, both old and new, also require Tanzanian citizenship to qualify for a broker's licence. This is difficult to enforce in a country where borders are porous and citizenship documentation is not generally carried. In the rich northern mining areas, ethnic groups overlap the border. It is difficult to tell a Kenyan Masai, Kamba, Kurya, Jaluo or Taiga broker from a Tanzanian of the same ethnic group.
Dealers based in Nairobi rely on this ambiguity and send their brokers directly to the Tanzanian mines. At Merelani, of the estimated 3000 brokers active there, over 500 were thought to be Kenyan. If the prohibition on Kenyan brokers were enforceable, it would probably reduce the proportion of the trade going through Kenya. Under current conditions that would depress the gem trade further still, as it would keep capital and buyers out of the market. On the other hand, freer trade, rather than more protective policies are the trend of the future. The East African Co-operation agreement signed in the year 2000 has provisions calling for free movement of people and goods. On the ground, however, officials are reluctant to move quickly on this. If free movement were enforced, Tanzania would have to compete for the trade on an economic basis, by giving Tanzanians incentives to move their goods through Tanzanian channels. In practice this is the most cost-effective strategy in any case
+ Brokers financial position
Depending on the amount of operating capital they can mobilise, brokers fall into different roles. Small traders generally stay in one area, either the mines or the urban trading centers. Most operate in the mining areas, serving as middlemen linking buyers and sellers. Sometimes they are hired by urban-based brokers to act as informers orland security personnel. Small brokers tend to have an initial working capital ranging between TSHlOOOO and TSH 50000 (US $16-83). In most active mining areas one finds a few dozen brokers. At a site with little activity there may be only a few brokers or an occasional visit by brokers. In contrast there were about 3,000 total village brokers at Merelani trading markets in late 1996.
Small-scale brokers also work in urban centers, particularly Arusha and Nairobi. In Arusha, for example, such brokers gather at the OTTU building, where many miners and dealers have

offices. In Nairobi they focus on the Oak Hotel and frequent the streets between the Hilton and New Stanley Hotels, where many dealers have their shops.
There are fewer small brokers in gold compared to gemstones. In most of the gold mining areas visited, the number of small brokers ranged between 10-35 depending on the intensity of mining production. They work mainly as collection agents, buying for dealers.
Brokers with working capital ranging between TSH1,000,000 and TSH5,000,000 (US$1428 and $7143) can be classed as medium-sized, whereas the largest brokers have over TSH5,000,000 in working capital. About 30 to 40 medium-scale brokers were estimated to be operating in the Merelani mining area, including many Kenyans. In Shinyanga, there were about seven medium and three large-scale diamond brokers, while in Mwanza there were 15 large scale gold brokers.
Those who accumulate at least a modest working capital often combine the roles of claim holder and broker. Claim holders serve as brokers, both for their own production and for others. Brokers often file claims, even if thev are not able to work them. Capital is even more fluid. Participants at any level of the market& chain generally finance min& operations, on their own claims and for any active claim where the claim-owner lacks sufficient capital.
Brokers gave straightforward responses when asked what incentives made them choose to sell through legal channels as opposed to smuggling goods out to Kenya. Their decisions are based on price and prompt payment. Because Kenyan dealers and brokers are generally better capitalised than those residing in Tanzania are, they often paid better prices. Or, if the price was the same, there was still the fact that one could be paid cash on the spot in Kenya, while Tanzanian dealers often held the stones until they had sold them and received payment, which could take weeks or months. Since brokers need cash to continue working themselves, this was a major concern. Many were willing to wait a short while for payment in Arusha, because the costs of staying there are less than in Nairobi or Dar es Salaam. But no one was willing to wait more than a few days.
A related comment was that Kenyan dealers would buy both top quality and second quality goods, whereas Tanzanian dealers often wanted only the top quality stones. If a broker sells his top quality stones, he generally cannot unload the second-quality goods at all. The presence of top quality stones is what provides an incentive to the Kenyan dealer to buy the whole lot. Again, the ability to sell the whole lot affected the working capital available to the broker for his next buying trip, andlor the financing of his mining claims.
Brokers' costs
Brokers' main costs of doing business are their own time and travel costs. Because working capital is so critical to their success, they minimise their expenses in order to devote nearly all of their funds to purchases. Very few have personal vehicles. They generally travel by bus for long distances and by bicycle taxi or foot in and around the mining areas. Those who travel to Nairobi will try to conduct their business in a single day, unless they have a relationship with a dealer who will cover their hotel room.
Transportation costs are a major marketing expense at every level, although they vary according to the means of transport chosen by the operator. Brokers who were interviewed in
the Umba mining area for example indicated that those who move to Kenya market were estimating the cost of hiring a bicycle which they normally use in the '&mypa" route, at between TSH2000- TSH3000. From Merelani, on the other hand, brokers spend about TSHlOOO - TSH1500 to take a bus from Merelani to Arusha. When the brokers reach Arusha they incur additional transportation costs by hiring a taxi to get around town. They explained that they use taxis for security, to escape police harassment and extortion. They would walk if they could do so safely. In Tarime, it was revealed that it costs TSH1400 for a broker to cross the border to the Kenya. To the market at Isibani in Tanzania, the same trip from Mwanza costs about TSH20000.
License fees are not an insurmountable cost in themselves, but the conditions imposed by the licenses make it impossible to do business profitably. Brokers, for example, are required to pay a minimum of TSH10000 per month as license fees. When they try to obtain the license, however, they are assessed arbitrarily estimated business taxes and are obliged to meet other requirements, such as group inspections of their premises, that expose them to extortion. The licenses are good only in one region, whereas the work nearly always requires them to operate in more than one region. The license used to be valid only six months, which means time consuming travel and delays had to be confronted regularly. It had to be obtained in Dar es Salaam, far from the mining areas, where transport and accommodations are extraordinarily expensive.
The 1998 Mining Law took account of one of the problems identified in the first phase of research. The brokers licence is now renewable annually, instead of twice a year. But it is still obtained from the Commissioner in Dar es Salaam, which is the main obstacle for applicants, and it is valid for only one zone (there are 8 zones). Application and licence fees the first year cost TSH 110,000. Renewal costs TSH 7,000lyear.
Brokers' preparation of minerals for sale
Valuation, cropping, cleaning and sorting are operations brokers perform in addition to buying and selling. Brokers are ill equipped to take a scientific approach to valuation. Many have small scales, but few have fibrelights that would let them detect inclusions and flaws in the gems. None of the brokers, and only a few of the master dealers, have had formal gemological training. They judge clarity and colour with the naked eye.
The Masai brokers at Merelani have a unique co-operative system of brokering, where 5 to 20 members of the co-operative buying group will each examine the stone before the group comes up with an agreed upon quality and price.
Some gem brokers clean their stones using water or other solvent materials that they think will improve the appearance of their products. They also sort the products by size and quality if they are able. Many Ausha dealers will buy only gem quality stones, so the second quality material has to go to Nairobi. But often the broker will get a better overall price by combining the first and second quality goods in a single package. Also, he has to know his buyer's requirements.
Preparation of gold for market involves purification. Large-scale gold brokers seek the assistance of a gold smith in improving purity to above 95%. There are complaints however that dealers come up with different standards in terms of weight and quality when they use

their scientific equipment. The brokers interviewed feared that sometimes they got cheated by the dealers.
Brokers' concerns
Brokers are faced with a number of problems that increase the transaction costs of doing business, and limit their ability to grow. Licensed brokers, for example, are not comfortable with the procedures for acquiring a license and the operating conditions imposed upon them. Brokers find it very difficult to get through the red tape of licence applications. It requires a journey to Dar es Salaam, and sometimes several days of follow-up, during which time they may have to stay in a hotel and cannot tend to their operations. They would like to have these licenses issued in their areas of operation or at least at zonal headquarters. The other concern of licensed brokers is the condition that they licenses are only valid in one zone. Mining production is highly variable, and they need the flexibility to move from an area where production is declining or the market is saturated to areas where production is good.
Another concern of brokers is security, and in particular, government failure to protect their business. They see no value in having a business license, as unlicensed operators are not penalised by authorities. In fact, by trying to get a license they increase their exposure to arbitrariness and harassment by officials, and sometimes to theft or extortion by the authorities.
Brokers are also faced with the lack of credit facilities. According to most of the brokers interviewed, the lack of working capital seriously limits their operations. Tanzanian brokers complain that foreign brokers who are well financed can offer higher prices to the sellers, and hence are in a better position to buy more good quality materials. Gold and diamond brokers have complained that they fail to formalise their activities due to an inappropriate tax system and cumbersome licensing procedures.
(i) Claim holders
Claim holders are the other group of sellers at the first level of the marketing chain. Most claim holders are mature men with some capital and some standing in the community. A few earned their capital and gained experience through mining, but many come from other sectors. A few are women or young men. How actively involved they are in the operation of their mines varies greatly. Some claim holders are actively involved in the mining and marketing of their minerals while others sublet their titles to pit owners and financiers, who oversee the mining and marketing of the minerals produced and give commission to claim owners. Instead of paying salaries to their workers, 99 percent of claim holders share what is produced with their workers at the end of production. They typically retain between 20% and 40% of the official production.
Claim holders would like to formalise their operations. Many said that the first thing they would do if they could afford it is put the workers on a salaried basis and increase security. Workers, however, do not want to work for a salary. A few claim holders with substantial working capital have been able to establish larger operations that use some modern equipment and mining methods. They have trouble retaining workers, unless they agree to production sharing.

The general pattern of mines visited on the field trips involved the use of simple tools, and sometimes primitive techniques of mining. With shovels, picks and explosives, miners dig pits every few meters in promising areas. They follow hunches and signs they have come to recognise, along with patterns of vegetation growth and geological indicators. Once they locate alluvial deposits, they try to trace them back to a vein. When they find a vein they follow it from the original starting point. Often the resulting pits and shafts are unsafe.
In international mining parlance the better-equipped mines would be classified as small-scale mining, while the hand operated mining that is more widespread is classed as artisanal. The vast majority of indigenous mining is artisanal. Where a legal claim has been registered, artisanal mining is generally classified as legal, even if it does not conform to every provision of the law. The same miners who sometimes mine legally (sharing production with claim- holders), will rush to a new prospecting area when news spreads of a find. Until the situation is legalised, they are considered illegal miners. If the new find is within an existing prospecting or mining claim, no new claim can be filed. To mine legally, artisanals would have to have an agreement with the claim-holder of record.
Environmental impacts are not yet a complaint of local residents in any of the areas visited, but this is likely to be a future issue. Multiple pits throughout an area scar the natural landscape and mercury used to refine goldco~pounds the environmental damage. Pits are particularly a problem at Merelani where the deepest shaft mines are found. Surface land degradation is notable at the Maganzo and Mabuki diamond mining areas, and Misigiri and Nzuguni gold mining areas.
+ Claim holders in the marketing chain
Claim holders play an important role in the mineral market. They are the main sellers to master dealers. Some rniilers are also master dealers so they export their products directly without passing through brokers. Claim holders are the major suppliers to the official market. This, however, does not rnean that all that is possessed by the miners is sold in the official market. The marketing route is sometimes determined by those who support their production. Claim holders who receive substantial financial assistance either from local master dealers, Kenyan or other foreign dealers are expected to sell their products to those who contribute in one way or another during production. This is the main reason why miners may sell outside the official market. When the claim holders receive financial assistance from smugglers or master dealers located outside the country, they are generally obliged to sell to the unofficial market.
Claim holders are much better informed about market conditions than are mine workers. Market information is a valuable asset that is normallv exchan~ed at cost. Some miners assist - their workers by providing them with information or a market for their stones. How closely mine owners are able to supervise their mines affects how much of the production they actually see and market. '&en they are lax and have no trustworthy supervisor in the mine itself, only a small amount of their real production remains for the official market.
r Preparation for the ]market
Miners need to cobble, clean and sort their stones by size, shape and quality. In the case of gold, they purify the ore to accepted market standards. The small-scale gem claim holders
33

generally sell to local dealers, so their information needs and preparation of stones for market are limited. The few who are themselves dealers have to meet much stricter standards of sorting for the export market. The best-organised claim holders have facilities for preparing their mineral products for marketing. Gold miners use mercury retorts that conserve the mercuty, which saves them considerable cost and prevents mercury from escaping into the air and soil. Gem miners have gemological testing kits and weighing tools.
t Claim holders' costs
The expenses of claim holders can be divided into marketing and production costs. Marketing costs differ among the claim holders depending on how they handle their marketing. Claim holders who sell through brokers pay them a commission, normally 10 percent of the sale price. Those who do their own marketing have the same costs as brokers, mainly transportation and the opportunity cost of their own time. Those who commute between mining areas and market towns in any case, often maintain a home with telephone andfor office facilities in town for their mining or other businesses. They probably do better by doing their own marketing, but no one keeps adequate accounts to determine this. It may be mainly a psychological effect, as the unpredictable nature of precious minerals sales creates mistrust and a strong incentive to retain personal control.
Apart from the marketing costs, claim holders also face production costs. These differ depending on the type of mining operation. The costs of production are lowest in alluvial areas and in surface deposits (the first 15 meters or so of pit-mined areas). The main costs are labour, transportation and their own accommodations in mining areas, often a guesthouse. Again accounting systems are virtually unknown, so hard figures could not be obtained.
One figure that is commonly known is the amount of start-up capital one needs to go into a particular line of work in mining. For alluvial mining claim holders, start-up capital was estimated at about TSH 500,000. Small-scale claim holders with semi-mechanized operations mining underground need substantially more.
At Merelani in the north and Muhuwesi and Mbekenyere in the south, it was possible to get some estimates on production costs, but without corresponding revenue figures. In Merelani miners said that where the Tanzanite occurs fairly close to the surface, one could start production with a minimum of TSH 10 million. In areas such as the recently opened block B where production requires shaft mining down to about 200m, between TSH 50-100 million are required. In the green and red garnet mines newly discovered in Mbekenyere in Lindi province, the best-organised miner estimated his start up costs as TSH 4 million. His costs of operation for two shifts of four mine workers per day were TSH 12,000, for food, candles and batteries. This totals about TSH 360,000 per month per pit. A less well-capitalised claim holder estimated that she needed TSH 145,000 per month per pit, for a single shift of four men, to cover food, candles, batteries and ropes. Pits tend to be only fifteen to twenty feet apart, and there may be several hundred on a single active claim. None of the mine claim holders interviewed was able to finance all of them.
These costs of production have implications in the marketingprocess. When such costs are high, they affect both the volume and price of the products. The air compressors and excavation equipment required in Merelani are imported from abroad, as are the water pumps used in both river basin alluvial mining and pits that encounter the water table. Claim holders
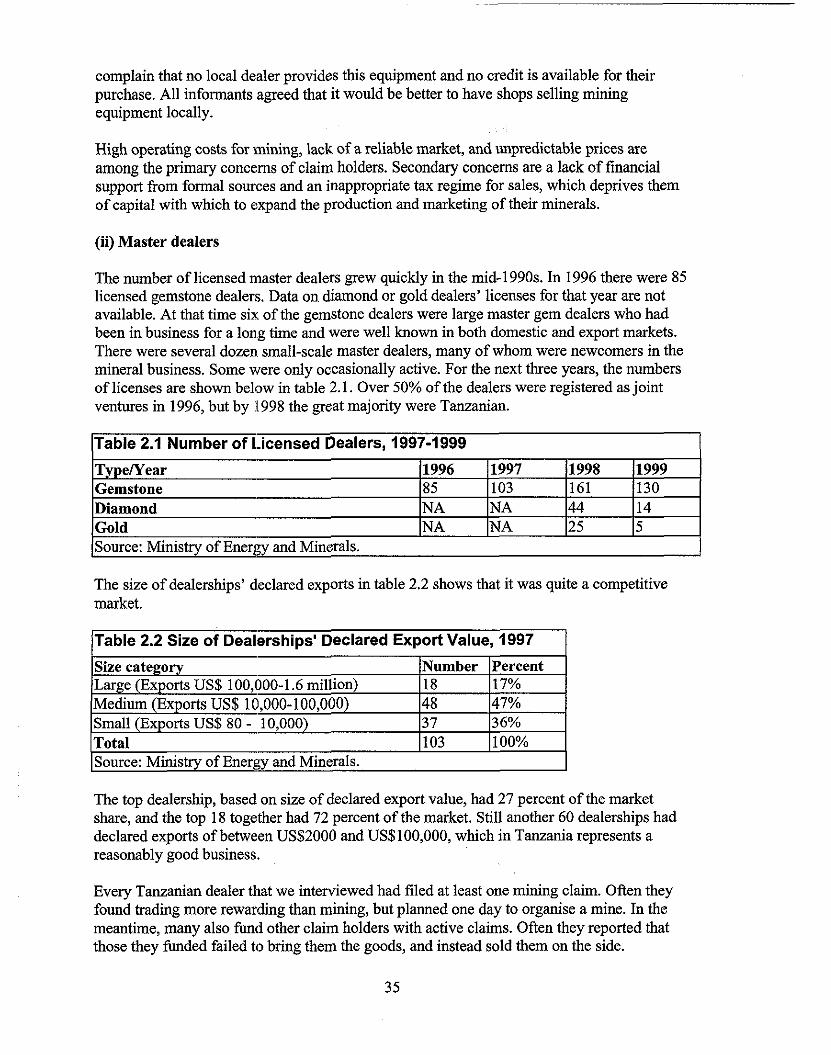
complain that no local dealer provides this equipment and no credit is available for their purchase. All informants agreed that it would be better to have shops selling mining equipment locally.
High operating costs for mining, lack of a reliable market, and unpredictable prices are among the primary concerns of claim holders. Secondary concerns are a lack of financial supPo> from formal sources and an inappropriate tax regime for sales, which deprives them of capital with which to expand the production and marketing of their minerals.
(ii) Master dealers
The number of licensed master dealers grew quickly in the mid-1990s. In 1996 there were 85 licensed gemstone dealers. Data on diamond or gold dealers' licenses for that year are not available. At that time six of the gemstone dealers were large master gem dealers who had been in business for a long time and were well known in both domestic and export markets. There were several dozen small-scale master dealers, many of whom were newcomers in the mineral business. Some were only occasionally active. For the next three years, the numbers of licenses are shown below in table 2.1. Over 50% of the dealers were registered as joint ventures in 1996, but by (998 the great majority were Tanzanian.
a able 2.1 Number of Licensed Dealers, 1997-1999
The size of dealerships' declared exports in table 2.2 shows that it was quite a competitive market.
T eNear Gemstone Diamond
l~able 2.2 Size of Dealerships' Declared Export Value, 1997
Source: Ministry of Energy and Minerals.
The top dealership, based on size of declared export value, had 27 percent of the market share, and the top 18 together had 72 percent of the market. Still another 60 dealerships had declared exports of between US$2000 and US$100,000, which in Tanzania represents a reasonably good business.
1996 85 NA NA
Number million) 18
48
103
Every Tanzanian dealer that we interviewed had filed at least one mining claim. Often they found trading more rewarding than mining, but planned one day to organise a mine. In the meantime, many also fund other claim holders with active claims. Often they reported that those they funded failed to bring them the goods, and instead sold them on the side.
1998 161 44 25
1997 103 NA NA
Percent 17% 47% 36% - 100%
1999 130 14 5
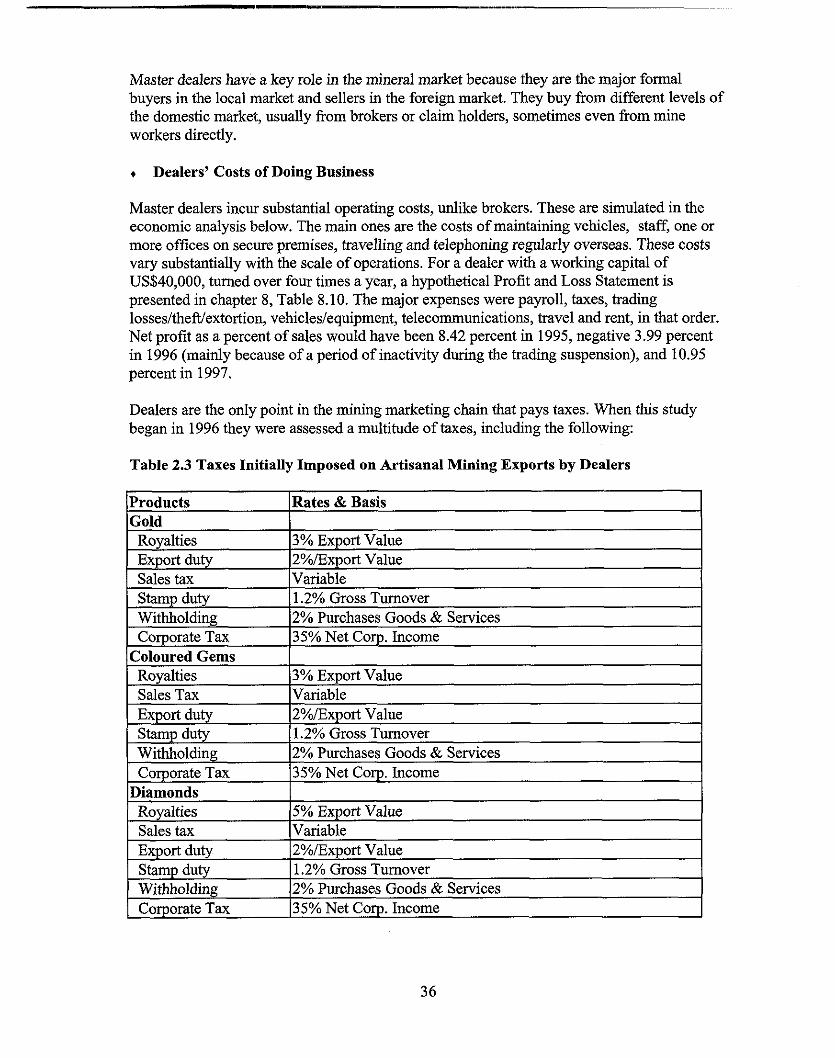
Master dealers have a key role in the mineral market because they are the major formal buyers in the local market and sellers in the foreign market. They buy from different levels of the domestic market, usually from brokers or claim holders, sometimes even from mine workers directly.
Dealers' Costs of Doing Business
Master dealers incur substantial operating costs, unlike brokers. These are simulated in the economic analysis below. The main ones are the costs of maintaining vehicles, staff, one or - more offices on secure premises, travelling and telephoning regularly overseas. These costs vary substantially with the scale of operations. For a dealer with a working capital of ~ ~ $ 4 0 , 0 0 0 , turned over four times ayear, a hypothetical Profit and Loss statement is presented in chapter 8, Table 8.10. The major expenses were payroll, taxes, trading losses/theft/extortion, vehicles/equipment, telecommunications, travel and rent, in that order. Net profit as a percent of sales would have been 8.42 percent in 1995, negative 3.99 percent in 1996 (mainly because of a period of inactivity during the trading suspension), and 10.95 percent in 1997.
Dealers are the only point in the mining marketing chain that pays taxes. When this study began in 1996 they were assessed a multitude of taxes, including the following:
Table 2.3 Taxes Initially Imposed on Artisanal Mining Exports by Dealers
(~roducts l ~ a t e s & Basis
Diamonds Royalties Sales tax Export duty Stamp duty Withholding Corporate Tax
5% Export Value Variable 2%/Export Value 1.2% Gross Turnover 2% Purchases Goods & Services 35% Net Cop. Income

Dealers were then the main source of revenue collected in this sector in the form of tax. The few formal mines in operation then had negotiated tax exemptions. Goods that went directly to visiting international buyers or Kenyan dealers escaped taxation.
Transaction taxes were particularly a problem, as taxes imposed at the time of exports deprived the sector of substantial working capital. Government has since recognised this problem, and eliminated the export duty, sales tax and withholding tax on mineral exports. Royalties on cut stones have been dropped to 0. This appears to have attracted a considerably larger portion of the trade to legal channels.
As sellers, master dealers mainly sell to the export market, a market to which they gain access in various ways. They may sell through foreign buyers who visit their offices, during both local and international gem shows, or by sending a parcel directly to the export market. Sometimes they personally travel to these external markets.
Through the exportation of minerals, dealers connect the domestic mineral market to the world market. At this stage, dealers are faced with different situations. First, not all dealers can operate comfortably in this market. Many dealers lack sufficient market information to operate effectively. Foreign buyers may take advantage of this weakness. Others have more experience and contacts, inspire more trust, have more business acumen, and invest in the necessary market information and skills development. These dealers are generally doing well in the market, although everyone occasionally reported setbacks such as thefts, failure to collect payments, trading at a loss and or being unable to find a buyer for certain goods.
Master dealers complain that almost all of the tax burden in the sector falls on them. While the sector seems to have a lot of people who are very active in various stages of production and marketing, the majority do not pay tax. The only option for the master dealers is to shift at least part of the burden by reducing the prices they pay when buying. This in turn has an effect on the overall market. It discourages those who sell to dealers and makes them look for better prices somewhere else, especially in the unofficial market. The master dealers interviewed in Arusha complained about this heavy burden of tax they carry on behalf of the other participants in the sector. They all see this burden as very detrimental to the mineral market, because those who smuggle get higher benefits compared to those who pass through the official channels. The other problem is that neighbouring countries have either lower tax rates or no tax, which creates a competitive disadvantage fo; those trading legally in Tanzania. Lack of financial services and cumbersome export procedures are also among the concerns of master dealers.
Master dealers selling gems in international markets are weak compared to their situation as buyers in the domestic market. The stock of knowledge that these master dealers have on the export market differs substantially. A few are very knowledgeable and well connected, but most have very limited information about the export market. To a large extent, the export market for various types of minerals is a buyer's market and local master dealers have little influence in determining prices. This is true even for Tanzanite, over which Tanzania could theoretically have a monopoly market. This can partly be explained by the fact that no dealer has enough capital to monopolise the market, and the miners and dealers have been unable to agree to co-ordinate their marketing. Also there are many other sources of supply to these export markets due to smuggling.

2.4 Domestic Mineral Market Performance
2.4.1 Mine and town markets
Price offers at any market level are influenced by both external factors and dynamics of the particular market level. Important external factors necessary to attract serious international mineral traders are prevailing world market prices and a conducive trading environment.
Mineral buyers in any particular mining area depends mainly on stable supply of minerals, quality of the basic infrastructure, and available social amenities including reliable security. The level at which a particular mine location can develop into a mineral trading center depends very much on the above-mentioned factors. Mahenge, Tunduru and Ruangwa are in very remote areas of Tanzania, but these small towns have at different times attracted foreign traders who transform these towns into active local or mineral market centers known world- over for their unique supply of rare coloured stones.
It was observed during the survey that each local or central government intervention in the local mineral trade has had different effects on the performances of individual local mineral trading centers. Trading performances of these markets are affected by the change in profiles of key participants in that particular market. When in 1997 the govemment banned activities of mineral dealers in Tunduru the active gemstone trading activities shifted from Tunduru to Mtwara town. The market of Tunduru was then dominated by mineral brokers and that of Mtwara by registered mineral dealers. The price offer to miners at Tunduru dropped by 30% to 40% soon after the mineral dealers shifted to Mtwara in 1997.
The govemment interventions also affect the volumes of trading channels; and the official mineral export figures always reflect the ratio of formal to informal (smuggling) routes. This can be noted in the sharp increase of gemstone exports from US$2.5 million in 1995 to US$ 9.6 million in 1996. The major govemment intervention of February 1997, is reflected by a decrease in gemstone exports for 1997 to US$7.9 million, despite the fact that this was one of the most active mining years in the southern regions. Decline of official gold exports by gold dealers in 1997 (from US$ 679,611 to US$ 188,859) is mainly due to the high withholding tax (30% of purchase price) imposed on the dealers. A fraction of what was being smuggled out of the country can be compared to what Meremeta gold buying company alone has managed to export in the same year 1998 (US$2.9million).
Price variations
As the world's coloured gem markets are fairly open, prices fluctuate with variations in supply and demand. The same is less true of gold and precious gems (diamond and Alexandrites), where cartels have sought with some success to maintain a market share large enough to stabilise prices. For certain coloured gems, one can see the effect of surges in supply at each level, with a major new strike having repercussions at the mine level and other successive higher levels. Similarly on the demand side, rising or declining world prices and the demand for certain goods, mainly Tanzanites and green garnets, are reflected down the market chain. When demand is high the dealers receive orders from their buyers, pass the orders on to brokers, and on down to the mine level. When orders are off, mining may even stop, only to resume when a new order comes in for that type of stone. This reflects the lack of capital for mining operations. It also shows that artisanal mining is far more flexible than
formal capital-intensive mining, where production and marketing need to be continuous to amortise the equipment.
In a mining area, when a rich lode of gems is struck, prices rise in the beginning when the first few brokers arrive to create competition. If supply continues strong, prices decline rapidly as the market responds to the glut. Continuing strong sufges in supply have affected gem prices in regional market towns and even on international markets. Two major surges in gem supply have taken place in the last five years. Both first led to increases in price, then to decreases in price. The first surge came with the 1995 discovery, of rich and diverse alluvial gem deposits in the Ruvuma River basin around Tunduru in southern Tanzania. The mine rush that followed attracted international attention and drew dealers from all over the world. The response was perhaps particularly rapid because this came at a time when world gem market news was just beginning to be broadcast over the Internet, as well as through traditional dealers' telephone and fax network. Soon dealers were taking charter and making regular weekly flights into what had previously been quite an isolated area.
In the first volatile years, local miners did not know the difference in value between alexandrite, which is quite rare in the world market, and the more common garnets, rubies, sapphires and other semi-precious stones they were finding. A single good alexandrite bought for a few thousand Tanzanian shillings could fetch US$50,000 in Asian markets. Until the Tunduru discoveries, Sri Lanka had been the major world source of alexandrite. Sri Lankan dealers, some of whom had been stocking alexandrite to maintain its high value, were concerned to see this new supply flooding Thai and Japanese markets. They estimate that current prices for alexandrite are 40% below those in effect before the Tunduru discoveries. Meanwhile. miners and brokers in Tunduru learnt to recognise alexandrite and raised their - prices. Margins between buying and selling prices are therefore narrower now throughout the marketing chain. Sapphire prices also have declined in the world markets, but Tanzanian
has beei&ly one of several new sapphire areas to come into production.
The recent mining rush for green garnet, also called tsavorite, is a good example of sharp price swings and shocks of gemstones. Green garnet had been fairly rare and pricey. The first major deposit had been found near Tsavo National Park in Kenya. Kenyan dealers tried to control the production and trade, to maintain a high price, hoping it would be their miracle gem--like Tanzanite was for Tanzania. More recently, deposits have been exploited in Northern Nigeria and Southeast Asia. When good quality pockets of green garnet were found in the Lindi province in southern Tanzania in the spring of 1999, great excitement brought a rush of miners and dealers to the site. Top quality one gram stones were fetching TSHs 200,000 (US$285 @ TSHs 700=$1) in Arusha by April. Within two months the Arusha market had been flooded. The price had dropped to TSHs 30,000-60,000 per gram (US$40-80 @ TSH750=$1). Dealers had not cleared their first stock and had insufficient capital to keep buying. Some miners knew the Nairobi price to still be around TSHs 150,00O/gm and moved their goods there.
For top quality Tanzanite, market shocks can move the price sharply up or down, as surpluses and scarcity reverberate up and down the marketing chain. For example, Tanzanite, which was a rare and very costly stone in the 1970s declined greatly in price in the 1990s when two of the four blocks of the world's only known deposit were opened up to small miners. When the initial rush slowed as pits got deeper and production costs higher, the price began to recover in 1994. Then, the government closed the market for several months in early 1996.
Trading was banned, but mining continued. The result was a glut on the local markets in Arusha and Nairobi. Nairobi dealers, who had been stocking prime stones, panicked and unloaded them. This then hit the international market. Prices of top quality Colour A Tanzanite rough dropped to a third of its 1995 value.
Then came another shock. In 1997 a flash flood hit the valley where Tanzanite is mined and about 200 miners were killed. This time the mines were closed for safety reasons, while trading continued. With no new production entering the market, first Arusha and then world prices shot up again. By 1998 Tanzanite prices were well above their 1995 levels.
Market skills and current trade information greatly influence the ability of participants in any market level to profit, or lose, from their operations. Access to information varies greatly depending on which level of the market chain a participant is active in. In the mineral market, participants who take initiatives to invest in gemological skills and information technology have been found to have a greater advantage in terms of market power and even in determining the price.
Many master dealers who were visited, for example, were found to spend significant amounts of money in telecommunication services such as telex, faxes, telephones, publications and other information services. Travelling abroad and attending international gem shows is another way of acquiring gem trade information; and again the study shows that most active dealers attend several gem shows each year.
Competition especially at lower mineral market levels has considerably favoured upstream value added activities of some coloured stones. Tanzanite marketing is a good example. A piece of gem stone will change hands several occasions before it is sold to a foreign mineral buyers in Arusha or Nairobi, Kenya. The downstream value-added activities are still at infancy stages where gemstone cutting operations are performed by very few operators. Most local gem cutters deal with gem quality stones of sizes above 3mm in diameter. At present there is a shortage of capacity and skills to process low grade and small-size stones. Most facetable but small-size gem materials are exported rough. Most goes to Jaipur, India where Tanzanite stones alone employ 20,000 cutters.
2.4.2 International minerals marketing, manufacturing and jewellery retailing
While there is some overlap between diamond and coloured gem marketing and processing in the international arena, gold, coloured gems, and diamonds can best be understood as three separate chains. Coloured gems from Tanzania go mainly to Thailand and India, diamonds to South Africa and India, and gold to South Africa, Middle Eastern Suqs, London and Switzerland. Diamonds and gold are sold into well-established and fairly stable international markets. Large mining companies dominate their production and sale. Coloured gem mining, however, is a volatile business throughout the world, with lower profit margins and many more small miners, dealers, and jewellery manufacturers. The Internet has had a strong impact on gem trading. Traders use it for sales, sometimes on an open market basis, more often to closed client lists. Customers can buy directly from manufacturers, and manufacturers direct from mine owners. The result is more knowledge, faster movement of information, and reduced margins. All three precious minerals markets are showing long- term growth in demand that has accelerated in the 1980s and 1990s. Surges in supply,

however, have caused price instability and are likely to continue doing so. The result is a cautiously optimistic medium-tem outlook for producing countries.
Figure 2.2 Gemstone Marketing and the Impact of the Internet
+ Coloured gems
When gems leave the mining area, quality largely determines which path they will follow. Mines typically produce a large quantity of non-gem quality stone that will find little or no market. It can be 99 percent pure sapphire, but have too many cracks and inclusions, an unpopular colour or too little clarity to be classified as gem material. Its value per kilo can be less than the value of one carat of top quality gemstone. A small percentage, perhaps 5 percent of mined gemstone will be considered gem quality. Of that a still tinier percentage is considered top quality (Colour A Tanzanite, for example).
The top quality material has a very small market in every developed country. Japan had the biggest of these in the early 1990s until its recession set in. The medium grade .gem quality -- - - stones now go into a rapidly growing mass-market for "fine" jewellery that has developed in the United States in the last decade and is spreading throughout the world. Heat treatments,

crack fillers, and other developed treatments make a much larger proportion of coloured stones have the desired colour and appearance of clarity.
The jewellery is sold by mass-market retailers in the US, and by catalogue, TV sales, and Internet sales. Wal-Mart is now the single largest jewellery retailer in the global market. The liberalisation of mining throughout the world, together with mass manufacturing and marketing techniques brought the prices of "fine" jewellery to a level affordable by the majority of Americans for daily wear. In the 1960s, the only fine jewellery owned by most American families was a diamond engagement ring. While this is still the major market world-wide, there is also a rapidly growing market for coloured stone rings, necklaces, bracelets and broaches. There is also a new tendency in the US and Europe to set engagement rings with stones other than diamonds, or in combination with diamonds. At the same time, the practice of giving a diamond ring in connection with weddings is spreading in Asia. In China, diamond rings were very rare a decade ago; now 10 percent of new brides receive one.
Jewellery manufacturing tends to be concentrated near the major retail markets that it serves. This is primarily because the manufacturers have to understand the final consumers well, and cater to their tastes and price requirements. Japan attracted the majority of the highest quality stones in the early 1990s, although that market is small compared to the mass market because of the rarity of top quality stones. The United States has become the major market for middle quality gemstone and diamond jewellery. Europe is the second most common destination for both of these qualities.
Lower quality stones go into jewellery that finds a market in India, Asia and the Middle East. The jewellery markets in India and the Middle East have traditionally been focused on investment value. Jewellery is usually gold, 22-24 karat. Workmanship is less important than weight and purity, as a piece ofjewellery may be converted within a year or two. If faced with need, the family may sell it. If their fortunes are rising, an existing piece ofjewellery may be brought to the goldsmith to be melted into a more massive one. Adding stones complicates this process. Nevertheless it is happening. Mechanisation is also coming to jewellery industries that for generations have supported large numbers of professional goldsmiths. Africa has a traditional domestic market for gold jewellery, which functions much like those in the Middle East and India, although on a much smaller scale. Here also, gemstones are beginning to find favour.
The volatility of coloured gem markets and their vulnerability to policy fluctuations are well illustrated in Thailand. Thailand briefly dominated the coloured gem markets in the early 1990s. Building on its own and neighbouring Burma's ruby and sapphire mines, it developed a huge cottage industry in cutting, polishing and jewellery making. It developed national quality control mechanisms to which major manufacturers adhered, issuing certificates that helped it sell fine jewellery to tourists as well as to jewellery retailers. It specialised in producing calibrated stones, exactly sized to fit mass-manufactured gold fittings. As the industry grew, however, the costs of production also increased. Meanwhile mechanisation was cutting out the advantage Thailand had in a large skilled labour force of gem faceters. Smaller stones and lesser quality ones began to be cut entirely automatically. Moreover, competing industries sprouted in neighbouring China and in India, where the cost of labour was lower. Just as this was becoming a major problem, the government in 1996 imposed a value-added tax of 7 percent, applicable to sales of both rough and finished goods. Since Thailand had specialised in vertical integration, the tax cascaded through the industry and

escalated its costs of production. At the same time the Asia-wide recession that started in Japan spread to Southeast Asia. Thousands of firms have gone under in the last three years. The Thai gem bubble has burst, and many gemological specialists expect its rivals in India and China to benefit more from the overall Asian economic recovery than Thailand.
Tanzania's 1995-96 gem rush made it a major new actor in international coloured gem markets. It remains a very small actor in world diamond and gold markets. Tanzania's garnets, sapphires, rubies, emeralds, tourmalines went initially to Thailand, Sri Lanka or Mainland China for heat treatment and cutting. There, rubies from Burma, Thailand, and Southeast Asia, sapphires from Sri Lanka, Thailand and Australia, and emeralds from Brazil, Colombia, Zambia, and Madagascar are co-mingled. While it is technically possible to determine the mine origin of such stones, in practice this has little impact on markets. As a result, Tanzania's gemstones, other than Tanzanite, are little known outside of the profession. Because nearly all of the world's known deposits of Tanzanite are concentrated in a four-mile long deposit in Merelani, near Arusha, Tanzania has a unique opportunity for fame and profit from this gem. This sometimes causes people to lose sight of the fact that Tanzania's production of alexandrite, sapphires, rubies, garnets, tourmaline, amethyst, etc. exceeds the value of Tanzanite production substantially.
While the patterns described above represent typical market operations, participants at any of the levels can and do come together and trade. The Internet is already having a major impact on international gem trading. Prices used to move slowly, surging up and down over a period of weeks and months from one region to another as news and stocks moved. Now price movements for gold and gems are signalled to every region of the world instantaneously. Local prices respond within a few days or weeks, even in East Afiica, which has one of the lowest rates of Internet usage in the world. The few dealers who have email and still fewer who can afford to use the Internet regularly, set the tone for the rest of the market. At the June 1999 International Gemological Symposium of the Gemological Institute of America, an event that attracts the top experts in the field once every ten years, the consensus was that electronic marketing is having a major impact that will accelerate over the next few years. It is reducing margins for all participants in the markets, reducing transaction costs and final prices of jewellery. It is likely to squeeze out middlemen in the process, including traders at every level, from rough buyers to brick and mortar retail stores. The different levels will not disappear, but business will be concentrated in fewer and fewer hands, as those with large volumes can serve customers at lower cost.
+ Diamonds
World sales of diamonds in 1998 are estimated at US$ 7 billion total value, 74 percent of which is produced in Africa. (Picton 1999). Russia produces about 20 percent, Canada 6 percent and Australia a small amount.
Demand for diamonds is generated by three uses: (1) industrial use, mainly for sharp cutting instruments, (2) jewellenj as a decoration or symbol of love (particularly engagement and wedding rings), and (3) stones and jewellery as an investment. The latter two are often mingled, but market analysts find it useful to estimate the trends separately. The market for industrial diamonds, which constitute the vast majority of production, is growing rapidly, driven by the growth of precision tooling for optics and miniaturised equipment.

Demand for gem quality stones is increasingly divided into a two-tiered market. The practice of grading diamonds by the four Cs (colour, clarity, cut and carats) has resulted in an easily understandable and comparable price structure. This grading system, which a decade ago was understood only by professional jewellers is now accessible to everyone on the Internet. This electronic information source became widely available almost simultaneously with the spread of mass produced fittings and automated, calibrated cutting and polishing. The result is a commoditized market for the vast majority of goods sold. Even though a small minority of diamonds is actually sold over the Internet, the information provided there has driven down price margins in even the finest retail stores. While the commoditized jewellery market is growing rapidly, it squeezes profit margins and ultimately provides a more difficult income to fewer actors than the post-World War I1 jewellery market.
l ~ a b l e 2.4 World Diamond Markets, 1998
I~ource: Hcrz Hascnfcld, "Diamond Manufacturing and Distnbution," h e m a t K a l Gemological Gemological Svm~osiurn. 21-24 June. 1996
USA Japan Europe Other Asia Other
- - . A
~(GIA, San Diego).
The tiny pinnacle of the luxury market is striving to preserve a sense of uniqueness through branding and laser engraving of stones, and unique designer jewellery presentations. Brand names such as Tiffany and DeBeers and designers Dior and Bulgari still attract premium prices, but from a tiny clientele. Laser engraving is now being used on the girdle of a stone to ensure that future investors can recognise brand names.
36 25 23 16
100
Japan was the largest market for top quality stones until its economic crisis struck in 1994. Diamond imports dropped by half, and between 1994 and 1996 the proportion of couples buying diamond engagement rings shrank from 76% to 64%. As Japan's economy is recovering by fits and starts, jewellery sales have been driven by short fads, in which one brand or design is ragingly popular but by the time production gears up, the fad has passed. Nevertheless, Japan continues to account for 25 percent of the diamond market.
49 29 10 8 4 100
The investment value of diamonds is threatened by the profusion of look-alikes, both man made and natural. Cubic Zirconia and Moissite are difficult for laymen to distinguish from diamonds, although readily recognizable by gemologists. They are increasingly being used, even in engagement rings. More serious over the long term is the fact that a new technology has been developed, in Russia and now by General Electric in collaboration with DeBeers that improves the quality of mediocre natural diamonds. The combination of heat and pressure in the treatment plant replicates those through which diamonds were originally created in the earth's crust. The result is that yellow and brownish stones with imperfections emerge with perfect colour, form and clarity. The hall fell silent in the International Gemological Symposium as top gemologists described their inability to distinguish such stones from naturally occurring ones. This is the first time gemologists have been unable to

detect a treatment. To preserve the value of natural stones, DeBeers issues such treated stones under the brand name Pagassus and has pledged to laser inscribe each stone with that identification.
Supply of diamonds has surged in the last decade. Diamond production, long dominated by South Africa, is today concentrated in Botswana. Two of its mines produce a quarter of world diamond value each year, and are expected to continue to do so in the long term.4 The geology is interesting for Tanzania, because it lies on the edge of the geologic formation that accounts for both South Afn'ca's and Botswana's deposits. On the other hand, Tanzania produces less than 1 percent of world diamond value today, and geologists at the symposium were not optimistic about major future finds in its multitude of Kimberlite pipes.
This outlook may partly reflect the measured approach to diamond exploration favoured by the DeBeers market stra1.egy. DeBeersICentenary and subsidiaries buy about half the world rough diamond production, by value, each year. It created the Central Selling Office in London to unite world diamond markets, control quality and stabilise prices. While demand for diamonds has been growing fairly rapidly, supply has grown even more quickly in the last two decades. First Russia challenged DeBeers monopoly, then Canada and Australia. All of these countries sell outside DeBeers now, although all have sold to DeBeers at various times and benefited from the price support DeBeers provides. Botswana's mines, mostly DeBeers' joint ventures, satisfy DeBeers current demand and have the added advantage of low production costs. African informal sector production, mostly from Angola and Democratic Republic of Congo constitutes a new challenge. DeBeers has been buying most of the informal sector production through a licensed buyer network, but it puts a strain on corporate finances. Since 1989, DeBeers' stockpile has been growing, and its cash surplus declining.' It clearly would be easier to stabilise the market if supply increased more slowly. This reduces its interest in new diamond exploration as well.
This was the consensus of geologists and economists at the GIA International Gemological Symposium in San Diego, CA, June 21-24, 1999. Detailed production statistics and projections were provided by James Picton, "African Diamond Production in the 21" Century."
Ibid. De BeersICentenary's stockpile was valued at US$2.5 billion in 1989 when its net cash position was US$ 1.6 billion. By 1998, stock book value had increased to US$4.8 billion (retail US$7 billion), while net cash had declined to US$O. 15 billion.
45
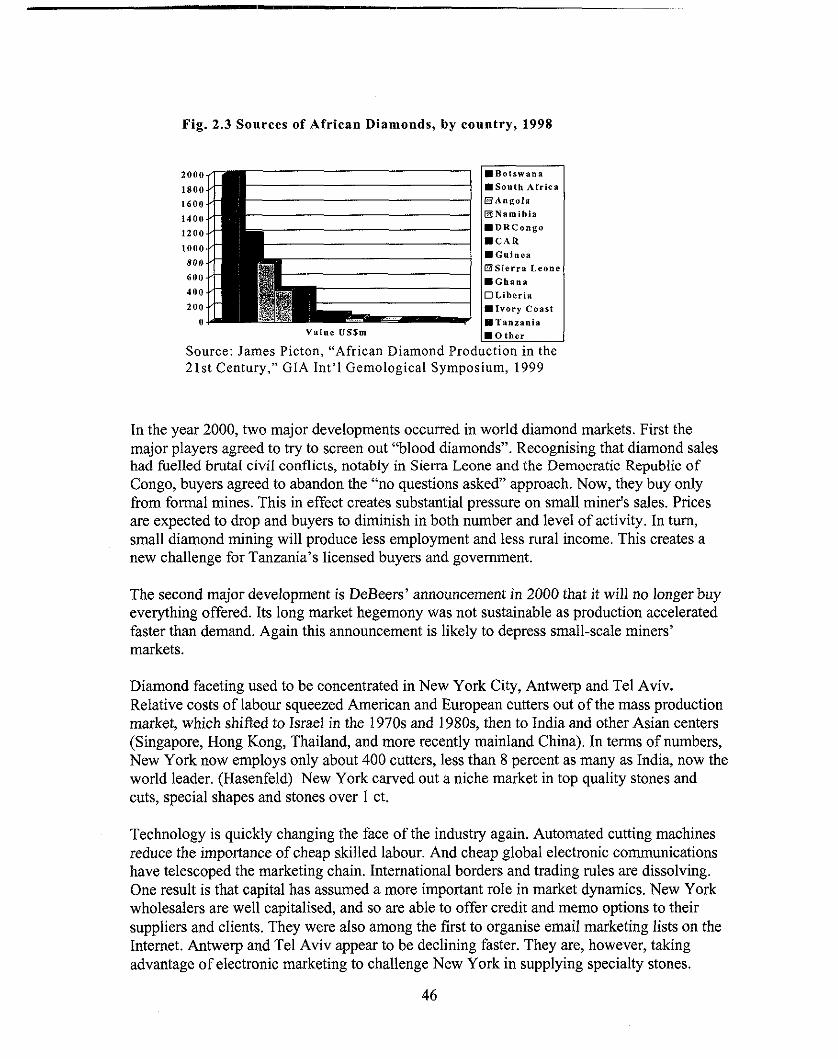
Fig. 2.3 Sources of African Diamonds, by country, 1998
2000
1800 .South Arriea 1600 B A n g o l a
1400 E N a m i b i a
1200 .DRCongo
1000 .Guinea
8 0 0 mSierra Leone 600 .Ghana 400 O L i b e r i a
200 =Ivory Coast
0 .Tanzania V a l u e USSm I-"...C.
Source: James Picton, "African Diamond Production in the 21st Century," GIA Int'l Gemological Symposium, 1999
In the year 2000, two major developments occurred in world diamond markets. First the major players agreed to try to screen out "blood diamonds". Recognising that diamond sales had helled brutaI civil conflicts, notably in Sierra Leone and the Democratic Republic of Congo, buyers agreed to abandon the "no questions asked" approach. Now, they buy only from formal mines. This in effect creates substantial pressure on small miner's sales. Prices are expected to drop and buyers to diminish in both number and level of activity. In turn, small diamond mining will produce less employment and less rural income. This creates a new challenge for Tanzania's licensed buyers and government.
The second major development is DeBeers' announcement in 2000 that it will no longer buy everything offered. Its long market hegemony was not sustainable as production accelerated faster than demand. Again this announcement is likely to depress small-scale miners' markets.
Diamond faceting used to be concentrated in New York City, Antwerp and Tel Aviv. Relative costs of labour squeezed American and European cutters out of the mass production market, which shifted to Israel in the 1970s and 1980s, then to India and other Asian centers (Singapore, Hong Kong, Thailand, and more recently mainland China). In terms of numbers, New York now employs only about 400 cutters, less than 8 percent as many as India, now the world leader. (Hasenfeld) New York carved out a niche market in top quality stones and cuts, special shapes and stones over 1 ct.
Technology is quickly changing the face of the industry again. Automated cutting machines reduce the importance of cheap skilled labour. And cheap global electronic communications have telescoped the marketing chain. International borders and trading rules are dissolving. One result is that capital has assumed a more important role in market dynamics. New York wholesalers are well capitalised, and so are able to offer credit and memo options to their suppliers and clients. They were also among the first to organise email marketing lists on the Internet. Antwerp and Tel Aviv appear to be declining faster. They are, however, taking advantage of electronic marketing to challenge New York in supplying specialty stones.
The development of large-scale cutting industries in India, Thailand and other parts of Asia reflects a type of vertical integration that Tanzanian policy-makers would like to emulate. Close study of the cases suggests that while the process through which it happened is an interesting model, it would be difficult for Tanzania to imitate. In the largest Asian cutting centers, India and Thailand, cutting has become a semi-skilled trade. A core of highly skilled cutters works in the largest factories producing top quality cuts. A vast cottage industry of less skilled cutters, and even peasants working evenings and off-seasons, are called upon when demand is high. The Indian industry started from the traditional goldsmith caste, which has specialised in mining, trading and jewellery for centuries. Russia and Australia initially turned to Indian cutters to help them circumvent the DeBeers dominated network. Australian mining companies initially marketed through DeBeers because, without DeBeers they could not find a market for medium and low quality goods.6 The open market offered higher prices for the few top quality stones, but only DeBeers would buy all grades. Then the Australians experimented with having lower qualities cut in India. With constant interaction, the skills of the top Indian cutters quickly improved to meet world standards. Finally, in the late 1990s, the Australians ended their marketing arrangement with DeBeers and began having all of their goods cut in India. This was a boon to the Indian cutting industry, which now had a regular supply of stones of all qualities. It has rapidly expanded its skilled labour force and trading network.
Unfortunately Tanzania lacks the three building blocks upon which Indian comparative advantage rested: (1) a large semi-skilled labour force, (2) rock bottom skilled labour costs, and (3) an international network of gold, gem and jewellery traders. India has a large, low- paid, highly educated labour force. Thailand could not compete with it, despite its well- developed network, largely because of labour costs. The chart below gives some indicators of the size of the skilled labour force in the two countries that have succeeded in building labour-intensive cutting industries, and of Tanzania and two neighbouring countries that would like to follow that path.
- This history was presented by Michael Mitchell, Argyle Diamonds, Perth, "The Indian Perspective," GIA
International Gemological Symposium, June 21-24, 1999. 47

Table 2.5 Indicators of Low Cost Semi-skilled and Skilled Labour Availability
- Kenya 1 29 1 24 1 78 1 22.62 Madagascar 1 14 1 16 1 93.2 1 13.05
Source: World Bank, World Development Indicators, 1998.
Per Capita Income less than US$2/day, (millions)
846.56
Country
Established competitors
India
Thailand
Tanzania
Potential new Com~etitors
Gold
Demand for physical gold is divided into three markets: (1) currency reserves, (2) private investment, and (3) jewellery. (O'Callaghan 1993) Paper gold instruments, each with their own uses in the market, include gold futures, options, warrants, leverage contracts and other forms of spot paper gold. Gold, like diamonds, holds its value because it is virtually indestructible. An estimated 80 percent of all gold that has ever been mined is still in use. While there is a long-term sharp growth c w e for gold jewellery, the currency and investment markets are less important today and for the future than in the past. Supply of gold, like that of other precious minerals has grown rapidly with the liberalisation of mining throughout the world. This occurred despite a marked decline in production in South Africa, which led the world for most of this century.
Population (millions)
962
6 1
31
Gold exported from Tanzania from formal mines generally goes into one of the major bullion markets in London or Zurich, each of which receives its fresh supplies from refiners accustomed to its standards of purity, bar sizes and shapes. The gold purchased by Meremeta goes to South Africa for refinement before entering the London gold market. Gold exported through unofficial channels from Tanzania and Kenya often goes to India or Dubai. Gold is typically carried in twenty-kilo parcels, which are about the size of a small radio or large book. It may travel on the persons of travellers. Once overseas, it is sold in the gold suqs to be refmed by local goldsmiths or passed on to formal refineries and the established bullion markets. (See Annex 2. Major Bullion Markets)
Education Secondary Enrolment (YO)
49
56
05
Per Capita Income less than US$Z/day, (YO)
88.8
23.5
45.5
14.34
14.10

While Zurich is the dominant entrepot for physical gold storage, the London market still is the major influence on prices. (O'Callaghan 1993) World gold prices are fixed twice a day in London. Once each afternoon Zurich clears its supplies, adjusting London prices. Hong Kong and Singapore hold gold fixings during the Asian business day. New York has no official gold market, but both supply and demand for gold increased in the US in the 1990s, making New York a major over-the-counter market. Gold jewellery, 22 or 24 karats, is sold by the gram in jewellery markets throughout the Middle East and Asia. Prices for gold are published weekly, sometimes daily, and jewellers and clients negotiate only over the labour charge. (For measures of gold weight and purity in use throughout the world, see Annex 1 .)
The world gold price has fluctuated fairly sharply since gold prices ceased to be fixed by monetary authorities in 1968, and began responding to market forces. It rose to a speculative peak in 1980, to over US$ 800 per ounce, then declined again, sharply at first. It fluctuated between US$300 and US $450 per ounce in the 1980s and early 1990s, before declining in the mid-1990s to fluctuate between US$250 and US$300 per ounce. The price dropped largely due to the decline of interest by Central Banks in holding gold as reserves. Announcements by the Bark of England and the IMF in 1999 of plans to sell off major reserve holdings sent the gold price into a steep decline. The major financial institutions thereupon reconsidered their policies in view of the cumulative impact. They agreed to pace their sales so as to stabilise prices, and the IMF proposed to revalue its book value assets closer to market levels rather than selling them. These measures were welcomed by the gold market, which rose from US$257 to US$ 328 per ounce in the space of a week before returning to an equilibrium ofjust under US$300 per ounce.
World gold prices are a major factor in Tanzania's mining markets, present and future. Prices to miners vary much more slowly than the world market, and depend as much on the floating value of the Tanzanian and Kenyan shillings as on gold prices. Miners in the south were getting TSH 4,000 per gram (USS5.33) for about 82-85 percent pure gold during the second phase of field work in June 1999. Claim owners sold it on to dealers at TSH 5,000 per gram, splitting the $1.33 per gram margin with the broker. The dealer's local buying price was thus
about $198 per ounce of 24 karat pure gold at a time when the world price was around US$ 257 per ounce. The dealer splits the thirty percent gross margin with international buyers and refiners, probably earning close to the 17 percent margin we found in the northern Lake Zone in 1996 between mine broker and export sale price.
2.4.3 Value added activities: The impact of volumes and price differentials
Particivants in the minerals sector are determined to increase the value added to the Tanzanian economy generated by minerals. Minerals are a depreciating resource, so every mining country has to consider whether it is exploiting them responsibly. Tanzanians, moreover, have lived a national ethos of self-reliance Hince independence. The country looks attentively for opportunities to vertically or forward integrate. There is, however, a widespread tendency to confuse high value-added with high price mark-up. There is little understanding of the impact of volume on a company's value added, or the national economy. This results in many people trying to enter the most demanding steps in the chain.
Gemstone cutting and polishing is a good example. Before the liberalisation of the sector, the only lapidary operation was a diamond cutting center in Iringa town under the State Mining Corporation. By the early 1990s, it had gone bankrupt and ceased to operate. Since the liberalisation, however, many dealers are trying to develop lapidary operations. They generally invest $5,000 to $10,000 in the necessary equipment. Several have brought in skilled cutters, Thais or Sri Lankans, often with the intent of having them teach Tanzanian workers their skill in cutting and polishing mainly rubies, sapphires, alexandrite and chrysoberyl. Most trainers for other types of coloured stones are Kenyans, who are experienced in cutting stones.
The lapidary owners we interviewed, including quite sophisticated dealers long active in world markets, reported a similar range of problems:
1) Lack of sufficient high quality stones to keep the cutter busy. 2) Relatively high cost of foreign labour to train the local cutters. 3) Lack of training opportunities, and abandonment of the apprenticeship idea. 4) Mediocre quality cutting wastes both value and material; some stones have to be recut.
For most dealers poor cutting is a serious problem only for the first few months of operations. Even the best Tanzanian lapidaries, however, cannot produce world class cutting.
5) Capital tied up in the lapidary operation is unavailable for trading, which cuts into both volumes and profits of the dealership.
A few experienced dealers are overcoming the obstacles and have established marketing networks in major gem centers like New York, Los Angles, Bangkok and Hong Kong. For most, however, expanding into lapidary operations is a distraction from their core business, which drains capital.
In the regulations for dealers in effect from 1996 through 1999, foreign dealers were required to operate a lapidary and also to deposit $50,000 as bond. The rationale was that trading should be reserved for nationals unless foreign investors transfer technology and skills. If these regulations were strictly enforced, such dealerships would not have been economically viable. Officials seem to have sought the advice of TAMIDA, the Tanzanian Mineral Dealers
Association, who has been lenient with those foreign dealers who had lived in the country a long time and were trusted.
In 1997 government excluded mining and lapidary equipment from import duties, to encourage forward and backward integration. Since then, the number of lapidaries has increased rapidly, from 5 in 1996 to 32 in 1999. The question of whether the difficulties listed above are just start-up problems, likely to plague any infant industry, or whether they are structural is taken up in the strategic analysis in chapter 9.
There was growing pressure in late 1999 for the govemment to take action against Indian gem traders who were purchasing gemstones directly from mineral brokers and miners through subleased offices in Arusha town. It is believed that most of their goods were either smuggled out of the country or considerably undervalued. Direct official gemstone exports from Tanzania to India were valued at less than US$4 million in 1998. (Ministry of Energy and Minerals, 1999) In the same year exports of cut Tanzanite from Jaipur, India, were valued at US $27.53 million. (Government of India, 1999) The gap stems partly from the fact that Jaipur draws most of its supply through Nairobi, and partly from the greater value- added created by cutting. Gem industry reports from sources in India indicate that about a third of the 70,000 gem cutters of Jaipur now work only with Tanzanite.
Much gem cutting in Jaipur is done in tiny family-run workshops using simple tools. This contrasts with other major gem centers of Asia, such as Bangkok and Hong Kong, where a big investment is required to operate a modern lapidary.
As mentioned above, there is growing pressure both from researchers and the business community for the government to promote export of cut stones instead of the present practice of selling rough stones at very low prices. This represents a major opportunity for emvlovment creation and value-added to the Tanzanian economy. In 1998 Tanzania's official
A - exports of Tanzanite were only USs6.8 million while the USA retail sales of cut and polished Tanzanite for that year was US$380 million.//(Sources) Export figures for 1999 show that about 5,216.2 kg of rough Tanzanite were exported, mainly to Asia, with invoice value of US$ 7.29 million. The same year about US$4.16 million was realised from export sales of only 11.832 kg of locally cut and polished Tanzanite.
The challenge is for the cutting industry to be developed through incentives rather than legal fiat. Legislating that all foreign dealers had to operate lapidaries was tried in 1996-97, and merely drove out foreign dealers. Government has accordingly shifted to a gentler policy. Lapidary equipment imports were made eligible for an across-the-board duty-exemption as of 1999. Export duties were maintained on rough stones (although reduced), but removed entirely from cut stones. Labour laws now need to be relaxed to make it easier to bring in skilled cutters.
Value-added processing for lower grade material may generate value-added more readily. Some 85-95 percent of the gem material mined is of too low quality to be sold at all. Much stays in the mine area, and more unsold goods accumulate in each rung of the marketing chain. Some of this material can be made into costume jewellery, carvings and crafts objects.
The Ministry is currently remodeling a complex of buildings in Arusha to become a training center where gemology, carving, crafts manufacture and entrepreneurial skills are to be taught.
Tanzania has a cadre of world-renowned wood carvers, particularly among the Makonde in the south, who may be able to retrain for work in stone. One lapidary in Nairobi is already producing such carvings, mainly for sale to the tourist trade. Thailand also succeeded in developing synergies between its gem industry and tourist trades. Tanzania has a ready market in its growing tourist trade. Visitors to Tanzania's famed national parks increased steadily from 156,000 in 1985 to 409,000 in 1995.
Refining gold to bullion quality (0.995% to 0.999% pure, depending on the bullion market) is another form of value-added processing, that is neither very labour intensive nor very capital intensive. World bullion markets are quite concentrated, and each market maker (Bank or other major gold-buyer) in the Zurich and London markets has its established refineries. Jewellers throughout the Middle Eastern and Asian markets, where jewellery is a form of investment, buy their raw gold mainly in refinery bars or as scrap (with a known purity). Goldsmiths buy some "mine gold" in the suqs, but jewellers prefer to deal with a known quality.
Several investment proposals for refineries have been entertained in Tanzania, but to the knowledge of the researchers, none has yet been implemented. Selling to a domestic refinery would be constraining even for legally established buyers in the artisanal sector, unless it were their own, as it would make it much easier for government agents to assess the exact volume of transactions. Interviewees widely reported that much under declaration of value currently takes place, and this would become more difficult. Meremeta is the only buyer with sufficient volume to justify a refinery at present. It currently sends its purchases to South Africa. The large mining companies generally refine their gold at the mine site, and market it through their existing corporate marketing system.
2.4.4 Mineral smuggling
Smuggling of precious minerals is very common in all major gold and gemstone centers, particularly in border areas. Different routes are used by smugglers depending on the convenience, border contacts, and the size and value of the minerals. Except for a small portion that goes out through Zanzibar, Lake zone gold generally goes directly across the border to the Kenyan town of Sirare.
Gems follow more varied routes:
Travelling by public transportation across the border via Horohoro in Tanga Region involves gemstones collected from Tanga, Morogoro and Southern regions. The Taveta route in Kilimanjaro and Namanga border post in Arusha region are normally used by smugglers who operate mainly in Arusha and Kilimanjaro Regions.
Parcels carried in the public transport usually have values between TSH 300,000 to TSH 1.5 million (US $375-1875 @TSH800=$1). The number of people involved varies from time to time. During the survey it was estimated between 25-35 mineral smugglers passed through Tanga town every month to cross Horohoro by bus.

Experienced smugglers, who carry gemstone parcels valued at TSH2.0 million and above use private transport. The cost of smuggling varies depending on the type of assistance smugglers have arranged at the border or how well they have hidden the gemstone parcel. It was not possible to assess the number of people involved in this type of smuggling every month. It costs a smuggler US $300- US $400 to send a parcel to Nairobi from Arusha.
Minerals are also smuggled by small brokers travelling on foot, bicycles or pack animals on panya routes across the border. They generally carry gem parcels valued between TSH50000 and TSH350000 (US $62437).
New popular destinations for smuggled coloured stones and diamonds are Madagascar and Johannesburg, South Africa. Experienced brokers now make frequent visits to these gem centers where it cost less than US$ 1,000 for an air ticket, accommodations and other expenses.
A survey in Dar es Salaam and Zanzibar indicated, that gold smugglers to the Middle-East are usually well connected people who source their gold from specific goldsmiths or experienced gold brokers which means that it is very difficult to expose them
(i) Motives for smuggliing
Price and market environmental convenience are the key factors sellers take into account in choosing where to sell. Tanzanian sellers find that in Kenya they have a better chance of making rapid sales in good conditions, provided by adequately capitalised dealers. As Nairobi has a bigger market, with many dealers who have been in business for decades, it provides sellers with certain advantages. They can sell their goods and obtain cash more quickly. They can sell medium-quality stones as well as top quality ones, whereas in Arusha dealers buy a much smaller volume of stones and only top quality. Gold sellers find their accommodations paid for by the buyer in Nairobi, while in Arusha they must pay their own costs. The Nairobi market also has more diverse and cheaper consumer goods, so traders can buy consumer goods with the proceeds from minerals sales and turn a cyclical profit on both. This, incidentally, increases the loss to the Tanzanian GDP.
Nairobi is also closer to the northern mining areas than Dar es Salaam, and more accessible by road for minerslminerals brokers outside of Arusha. Other reasons for smuggling include fencing other stolen goods, financing imports, and evading taxes on exports and imports. Security during travel ancl selling is also an issue of concern to sellers. According to the mining community's views, security protection is not satisfactory. Miners and brokers who attempted to legalise their operations frequently complained that they were subject to as much or more harassment by the authorities when operating legally as when not licensed. In established mining areas, the community develops informal mechanisms for ensuring security. In mine rush areas, problems include theft, armed robbery and officials taking part or all of one's goods.
The main reasons cited by mining sector operators for the existence of smuggling are:
searching for better mineral markets and prices,

avoiding official bureaucracy, advantage of the presence of many foreign brokers in the mining areas, using the informal credit available to minerals operators, and low marketing costs.
Several dealers argued that the best way to increase mineral exports is for the government to review the present tax rates. Under invoicing of gemstone prices is a form of smuggling where the parcel is exported officially but only a portion of the true value is declared for tax assessment.
The presence of a big number of foreign brokers in the mining areas also increases the chances of mineral smuggling. Kenyan brokers dare not sell in Tanzania for fear of being disclosed to authorities by competing brokers. Also some brokers are only agents of foreign companies in Nairobi and Mombasa, so they are required to send all the minerals purchased to their sponsors.
The presence of strong international illegal buyers in Tundm, believed to be developing a cartel in 1995 to early 1996, forced the government to intervene by issuing new trade regulations and banning foreign traders direct access to mining areas. Tanzanian dealers welcomed this protection from competition. Tanzanian miners and brokers, however, complained that they could sell better when they had more access to international buyers.
Credit from informal sources often forces miners to sell part of their minerals product to creditors, some of whom are foreigners. This form of returning borrowed funds is unofficial. Some of the mining operations, such as the underground mining of Tanzanite, are very costly to run, so miners elicit advances from both local and foreign mineral dealers. Some mineral dealers also get financial support from other traders and usually the interest is paid back in foreign currency. All these factors force some of the mineral operators to smuggle minerals outside the country.
(ii) Why Kenyan dealers offer a better market
There is no tax or VAT charged on minerals imported into or exported from Kenya. Dealers pay only the annual 35% corporate tax on profits. Telecommunications are cheaper and more easily available. Roads from the mines to Nairobi are better. Mineral dealers there have more capital and better international networks. They have accumulated capital over the years, which makes them grow faster than their Tanzanian counterparts. The size of the market is larger and more diverse, and mineral operators are more experienced.
(iii) Nationality and smuggling
There seems to be a complex relationship between the nationality of traders and the economic impact of smuggling. The main determinant of whether a transaction helps Tanzania's GDP and current account balance or those of neighbouring countries is where and in what currency the transaction takes place. In 1991-1995 foreign gem dealers could readily obtain licences in
'See model in the box at the end of Chapter Eight on "The Advantages of Doing Business in Kenya: Comparative Model of Gem Dealer's Accounts."

Tanzania. At the time, they contributed to a substantially higher value-added from trading within Tanzania. They had ample capital and thus attracted trade away from Nairobi to Tanzania. The domestic market for gemstones has been depressed since the new regulations came out in 1996. On the other hand, the greater capital base of foreign dealers made it possible for them to squeeze out Tanzanian dealers. The trade-off is between protecting Tanzanian dealers and slimulating the mining sector as a whole.
Tax compliance on the part of exporters is a more complex issue. At the broker level it has an impact mainly because Tanzanian brokers are more likely to be harassed by Kenyan police than are Kenyan brokers. Many Tanzanians fear travelling to Nairobi. None of the brokers going to Kenya, whether Kenyan or Tanzanian, pays taxes, with rare exceptions. A few dealers pay taxes in Tanzania and then export through Kenya for convenience. In the case of dealers, it seems to depend in the first instance on where the dealer's primary business interests are located.
Persons whose primary business interests are in Tanzania have the greatest incentive to pay taxes and conform to Tanzanian law. Persons whose primary business interests are in another country, whether they themselves are of Tanzanian or foreign nationality, have a greater incentive to evade taxes. In applying the 1996 regulations that set more difficult conditions for foreign dealers than for nationals, Tanzanian gem traders and the Ministry of Energy and Minerals took this factor into account.
Recently Tanzania, Kenya and Uganda revived the idea of an East Africa with free trade and potentially more complete economic co-operation. The East African Co-operation agreement was signed in early 2000. How Tanzania decides to deal with the problem of Kenyan brokers in minerals markets will depend in part on what is negotiated in this regional context. It may or may not change the mining sector. It is common for regional accords to mandate to free movement and for little to change on the ground, because bilateral agreements and national laws are never brought into compliance.

3.0 SECONDARY ECONOMIC ACTIVITIES IN MINING COMMUNITIES
The economic impact of mining on local communities was one of the topics the research team set out to study. The presence of mining activities in any area puts money into circulation and spawns secondary economic activities. These activities grow in number and value as the population increases due to increased mining activities. In other parts of the world mining has been found to impose economic burdens on the population due to rapid influx of miners. Other negative side effects reported elsewhere include:
the spread of diseases such as cholera and HIV-AIDS, environmental consequences of mining such as abandoned pits, and water, and air pollution, and localised inflation.
The team found evidence of each of these problems, but in relatively small forms that the local population reported manageable. These will be discussed in greater detail below.
What surprised the research team, and has not been stressed in earlier studies, is that mining for Tanzania has spurred substantial secondary economic benefits in local communities - new businesses, new access to the outside world, new goods and services, better housing, schools and medical care. The evidence of mining-related secondary economic activities was accumulated over the course of the study. Just to make sure we were not misreading the situation, we asked local residents of all social levels what were the negative and positive consequences of mining in their communities. Nearly all agreed that mining, even in the mine-rush atmosphere they had experienced brought mainly benefits. The main ones were related to having more money in circulation, a chance to earn income, to buy hitherto unknown goods, to improve housing, schools and clinics, and, for a few, to build up capital.
When artisanal miners move into a rural area in response to a new find, their presence creates new communities. Some of these communities are transient camps that last only as long as the local lode can produce while others mature into towns due to the development of mining activities. The first economic effect of the new mining settlement is usually increased demand for food and other goods and services. These services and goods are produced and provided to the local community markets or within the mining camps.
Mining rushes generally take place in rural areas. When there is a rush the population grows more rapidly than the local food supply. The result is localised inflation in the prices of food and other basic services. The aged and other non-producing families in nearby communities suffer particularly from this inflation, as it exacerbates their poverty. This chapter examines various types of secondary economic activities and factors influencing their existence and those hindering their developments.
3.1 Types of secondary economic activities
The types and number of secondary economic activities vary from one mine location to another depending on the mining operations' level of development. However the services can be grouped into two main categories. The first category comprises those directly supporting/supplying mining and ore processing works. These involve supplying mining equipment, custom mills, fuel and ore transportation services. The second category is made
56
up of community services-oriented businesses that provide the mining community with social amenities such as restaurants, bars, guest houses, groceries, butchers, beverages, retail and wholesale shops, nursery schools, dispensaries, pharmacies, street food vending, barbering, beauty salons, laundries, etc. Despite the business opportunities available in the mining area, operators are faced with many challenges.
Bar operation is a common business in almost all of the mining communities. For example, at Merelani, according to the barman interviewed, the bar market is directly influenced by the production of Tanzanite. The market conditions change abruptly, in a matter of hours as soon as the miners hit a nice gem pocket and start selling to mineral brokers. This fact applies to most secondary economic activities. The main problem with shopkeepers, hotel and pubs, is the high cost of transport from wholesalers in district and regional towns to the mining sites, especially during rainy seasons. Shoe shining is an activity that requires small capital but yields high income, especially when combined with brokering. Shoe shining is not a very popular activity in rural areas but there is a big market for this business in mining towns. Shoe-shine comers become informal market news hubs, and some people visiting mining towns stop by two to three times daily.
Another economic activity found in most mining areas is the sale of charcoal and firewood. Charcoal making is done without observing official procedures. There is high demand for it for both cooking and mining itself. Charcoal is burned on a hard rock layer for up to a week, to soften it up for picks. The local people were complaining of dangers of deforestation. Most of those involved in the charcoal business are members of existing local communities.
Farming activities
Farming activities have not been adversely affected by increasing mining activities. The team looked for signs of what economists call "the Dutch disease," where ordinary citizens not involved in mining suffer from mining-related inflation, or abandon farming to go into mining. Tanzanian farmers reported, on the contrary, that they benefit from rising demand for food items and tend to continue with agriculture activities. In the southem zone land is suitable for agriculture act.ivities unlike some places in the northern zone. Northern areas such as Kalalani, Daluni in Tanga, are dry and cannot support serious agricultural activities, so people in these areas have to buy most foodstuffs. These arid areas are particularly susceptible to mining-related impoverishment and food shortages. Southern towns such as Matinje, Tunduru, Songea and Ruangwa are well developed in terms of agriculture related activities. They have a significant number of retail shops, and are surrounded by good arable land. Some people in the mining community also engage in farming part-time. Mine workers who are out of work in the mines may work as farm labourers. They are paid a minimum of TSH 2000 for working one hectare. Some of the farms are owned by claim holders who attend to their farms during farming season or when there is a fall-off in mining activities.
3.2 Factors influencing their existence
Market
As mentioned above, the first economic effect of a mining community settlement is usually increased demand for food and other goods and services. These services and goods are produced and provided to .the markets by and to members of local and mining communities.
Many business people from Shinyanga and other well-established miners follow the miners to new rush areas, and set up shop. The owners of other secondary activities are local villagers, miners or their relatives. Also, mineral brokers (for example, at Mbekenyera village in Ruangwa District) and mineworkers (at Namungo) who are usually very active in selling their gold or gemstones use the proceeds to fund various secondary economic activities. The increase in miners' income causes a rise in demand for normal goods and quality of services in these mining villages. It is common to find well furnished hotels and even hospitals in some mining towns like Merelani that are visited by several mineral dealers and brokers who can afford higher service charges.
Informal sector mode
Another remarkable feature of economic activities found in the mining rush areas is that they are not taxed, or are only partially covered by the tax system. Thus, both mining itself and the secondary economic activities in mining communities constitute a potential tax base. The village and district authorities collect some fixed taxes ranging between TSH 2,000 to TSH 10,000 per month from most small shops and restaurants. Most food vendors and other street traders do not pay any tax. Most traders are not fully taxed and hence make good income despite the high costs of doing business in remote areas. Mineral dealers consider this practice unfair, as dealers are the only link in the mine to market chain affected by both local and central government taxation. This limits their ability to compete with mineral smugglers in purchasing minerals from miners.
Most secondary economic activities are small because of the itinerant nature of small-scale miners, especially in mine rush areas. The mine activities shift from one location to another and traders are forced to erect new mud structures to protect their businesses. Well- established traders cannot set up big operations in these areas. The small traders perform well as it is easier for them to move with miners from one location to another.
8 Free movement of people and goods
The country history and the national unit spirit, allow Tanzanians to enjoy freedom of movement from one part of the country to another without any hindrance of permits or tribal land restrictions. This is not the case in many parts of Africa where local leaders will not allow people from other tribes to settle or work freely in their traditional land, especially when it comes to mining minerals.
3.3 Factors constraining businesses in mining towns
8 Infrastructure
Poor infrastructure is mentioned by participants as the major problem hindering general business in mining areas. Roads are in terrible condition and are sometimes impassable during the rainy seasons, causing some essential goods not to reach the mining areas. Electricity is not available in most mine areas, except for the rare owners of diesel generators. Mining communities then depend mostly on charcoal and firewood. Lack of electricity also limits the duration of food preservation in these remote areas. Cable telephones are not available and operators such as dealers travel with expensive radiophones. A few areas now enjoy the benefits of cellular phone, Merelani, Arusha, Maganzo, and the diamond mine
village in Shinyanga region. Very few mineral dealers and brokers can afford the high rates on these mobile phones.
0 Security
Mining areas also suffer from unreliable security service and very few areas have police stations. Poor security is considered to be one of the major obstacles in developing businesses in mining areas. Although the rate of crime is very low in Tanzania compared to other countries in the region, recently there have been reported robberies in a few mining centers and theft and extortion are common.
Unreliable business
Mining is mobile, and is seasonal in some areas. Secondary economic activities fluctuate according to the varying fortunes of mining itself. There is a lag of a few weeks or months between the start-up of a new mining camp and the arrival of shopkeepers, guest-houses and restaurants. When business drops off, most of the shopkeepers, but not all, move on with the miners. The fact that some businesses stav on becomes a lastine benefit to local communities. . - improving their commerd and service sectors. Interruptions in mining activity also cause business cycle fluctuations. Health and safety problems arising in the crowded and unsanitary - conditionsof mining camps sometimes lead td official suspensions. An outbreak of cholera - forced authorities to close mining operations for weeks in the first rush year in the Tunduru area. In the wake of such closures, businesses in mining areas see sales drop off precipitously. Uncontrolled mining activities and poor technologies are known to cause frequent mine accidents. About 70 miners lost their lives at Merelani Tanzanite mines in April, 1998, when a flash flood came through the mining area and flooded pits. During the months of suspension that followed business owners at Merelani complained of poor trade and some had to close down.
Credit facility
Poor access to credit is one financial constraint, affecting both miners and secondary economic activities. Most small businesses must rely on their own capital accumulation, often with the help of family. Most financial institutions refuse to finance firms operating in mining communities as they fear the loan will be used to fund mining activities, which are viewed as high-risk ventures. Awareness campaigns and training to both micro finance institutions and miners is essential to support growth of secondary economic activities as well as to encourage miners to invest mineral incomes in other productive economic activities.
3.4 Economic and social impact of mining-related businesses
Secondary economic activities and mining
Many secondary economic activities are funded with capital accumulated from mining. Other people outside the mining communities are traders who were doing similar businesses in other parts of Tanzania. Most of the traders found operating in mining communities during the field survey were from Shinyanga, Kilimanjaro and Mara regions. Some local residents who started alluvial mining during the rush used the proceeds of the mining to set up small businesses. There is a synergy between mining and more stable secondary businesses.
Miners invest in secondary businesses, and business owners finance mining operations or market minerals as brokers.
Job creation
Experience in countries with developed mining industry shows that for every one miner there are more than three jobs created in the mining supporting businesses. It was beyond the scope of the present study to conduct a census in mining towns, but that standard ratio appeared to hold based on field observations.
By that calculation, by 1995, supporting businesses for mining accounted for 1.65 million new jobs or enhanced farm incomes (550,000 miners x 3). Nearly all of these were in rural Tanzanian areas where poverty is widespread. This job creation took place in the space of five years. No combination of government or donor-designed development programs and projects has had any comparable impact on rural poverty.
In countries with large-scale mining resources, benefits flow primarily to government. There is a tendency for people to neglect agriculture in favor of civil service. So far the Tanzanian artisanal mining boom seems to have produced the opposite effect, enhancing agriculture. The presence of a mining community creates a good market for foodstuffs and is one of the reasons some youth prefer to be active on their farms instead of joining the mining activities or migrating to big towns. It may be too early to know whether this pattern will persist.
A July 1999 visit by the research team to the southern regions-Mtwara, Lindi and Ruvuma showed that many of the jobs created by the discovery of gemstones there in 1995 had not been sustained. Some of the best-capitalised traders had left after a series of shifts in government policy squeezed them out. So by 1999 miners had trouble selling what they found. It also appeared that mining itself was less lucrative, as the readily accessible alluvial gravels along the riverbanks had been mined out. There are still gems being mined, but they are more difficult to reach with the simple hand tools most miners use. The population of mining communities in Ruvuma and Lindi region dropped considerably from around 250,000 in 1997 to less than 50,000 in August 1999.
Jobs in the small-scale sub sector and supporting services can be sustained if there is technical assistance for appropriate mining technologies and policies that attract reliable and competitive mineral markets, especially at the lower level of trading.
Prospects of widening the tax base
Both small-scale mining itself and secondary economic activities in mining communities constitute a potential tax base. At present, operators with fixed premises pay taxes to the village and local government, but many operate without paying any tax. Thus, it is possible to widen the tax base through formalisation and support for growth of secondary economic activities. Also, it is important to consider the appropriate tax rate for these groups. The adapted tax system should provide incentives to ensure compliance.

Mining-related busiinesses and rural development
The secondary economic activities in the mining communities have transformed villages from poor agricultural villages to relatively modem villages. These transformed villages have public health, education, police stations and business centers. Most of the educational and health amenities were constructed as self-help projects with contributions mainly from the mining community. Central government mineral revenues are not sent to mining communities, and do not contribute to their social and economic development. It was also noted that the sentiment to contribute to the various development projects was higher in well- established mining areas such as Kalalani-Tanga, Merelani-Arusha, Namungo-Mara. Contributions of miners and business owners were lower in new mining rush areas such as Mbekenyela and Ruangwa in Lindi region.
3.5 Prospects for mining-related businesses
Mining and related support businesses provide rare opportunities to rural communities in terms of job creation and income to the local economies. Their growth will support further development of social amenities, which will help to slow the present rapid migration of rural youth to urban areas.

4.0 HEALTH, SAFETY AND ENVIRONMENTAL ASPECTS
4.1 Environmental aspects
The environmental impact of small-scale mining can be attributed mostly to the simple technology and the lack of technical know-how of most miners. The tools and extraction methods employed by most small-scale miners are very basic. The rudimentary technology employed usually results in low rates of recovery that in turn lead to poor earnings and an inability for most miners to invest in appropriate technology. This results in a poor market, a vicious cycle which most miners find difficult to break. This mode of operation affects their ability and willingness to invest in retorts that can process gold without releasing mercury into the environment, to fence pits and to dispose of fill and tailings appropriately. The widespread use of explosives and charcoal are also of concern.
4.1.1 Land disturbance and degradation
Most of the gold mining activities are carried out through pit mining. A single licensed claim is divided into smaller blocks, each of which is allocated by the owner in small sections to pit gangs andlor their funders. Often the gangs have staked out their pit before the claim validation is received, so the claim owner is in the position of negotiating with existing groups and work in progress. During both development and mining, a substantial amount of waste is excavated and piled in the vicinity of each pit. The excavated pits and piles of waste rock left behind after mining ceases have been identified as a severe, but localized, land degradation. As the pits and piles of rubble become obscured by grass, these areas become dangerous to both people and animals. The most common impact is a loss of grazing land. Some agricultural land is lost due to blanketing of the topsoil with the waste rocks. The excavated pits and piles of waste rock also lead to accelerated erosion from both wind scour and surface runoff erosion. The topography of the area seems to determine the extent of the erosion. For example, Mugusu is located on a steep hill and shows severe erosion; the flat areas of Sirori Simba show minimal erosion effects. The erosion of mine tailings has been found to lead to serious siltation problems in rivers located nearby.
4.1.2 Hydrological effects and water pollution
The observed effects of small-scale mining activities on surface and ground water quality is related to erosion, sedimentation, siltation, contamination from toxic elements and poor sanitation from mining camps. Tailings dumps around surface water bodies as a result of ore washing activities and piles of waste rock in mining areas, are eroded into these sources. The increased sediment loads to most nearby rivers have resulted into a change of the river courses. The tailings left behind are usually highly contaminated with toxic elements used in processing (e.g., mercury) which are washed down into water sources especially during the rainy seasons. The other areas that are raising concern are those where sluicing and amalgamation are carried out directly on the lake shores. This is being carried out in Ikungu, Musoma, on the shores of Lake Victoria. It is common to find flocks of livestock and birds drinking next to the washing areas, and neighbouring villagers catching fish within metres from the amalgamation activities. The key concern is the direct release of toxic chemicals like mercury into surface water or the water table. It accumulates and subsequently methylates to organo-mercury, then transfers into the food chain through the marine life. However, the results from a number of studies in the past indicated low contamination levels.
In areas where washing is done far away from water sources, the impact on water quality is limited, especially during the dry season. During the dry season the volume of water used is small, and very little finds its way back to the water sources. Elevated concentrations of heavy metals in surface waters have been found in the Lake Victoria area by different studies, e.g., Ikingura et al, 1996. Underground water contamination can be linked to leakages of contaminated water from the processing areas to acquifers in the area
4.1.3 Air pollution
The impact of small-scale mining on air quality comes from the emissions of dust, hydrocarbons and vapour. In almost all mining areas, dust is emitted into both surface and underground air. Underground drilling, ore loading, surface crushing and grinding, are all dry processes generating a lot of dust. Where jackhammers are in use for underground drilling, water is rarely used for dust suppression. Grinding mills are normally located in open air or in some kind of a grinding house (usually a shed). Grinding houses/areas are generally dusty, as the locally fabricated mills do little to suppress dust. Where manual crushing and grinding is practiced, direct inhalation of dust by the operators, can be observed. Long exposure to any respirable dust is very dangerous to one's health. The exposure to silica dust can cause a serious lung disease, silicosis. In confined spaces like underground workings and grinding houses, this is a problem. Elsewhere the amount of dust generated is relatively small.
The release of hydrocarbons into the air can be associated to those areas that have introduced mechanical equipment 1ik:e compressors, diesel generators and engines, drive mechanisms for the locally produced grinding mills (for example, engines of buses, lories and tractors). The number of these units is still small, and the environmental impact limited.
4.1.4 Noise pollution
The use of explosives in most mining areas is a major contributor to noise and vibrations. In some areas with a large number of pits, blasting is not coordinated such that blasts can be heard one after the other. This is the cause of many mining injuries and deaths among miners. It disturbs those living around mining areas, and sometimes damages to buildings and neighbouring excavations. Government regulations require explosives to be handled only by trained and licensed experts, but the regulations are not enforced.
4.1.5 Other impacts
Other possible impacts resulting from artisanal and small-scale mining are those affecting the biological environment. As the number of miners increases at a particular site, the demand for wood to construct shelters, support the pits and provide energy for cooking increases tremendously. Consequently, the pressure on the surrounding forestry resources increases. However, observations from areas like Mugusu where mining is carried out within a National Forestry Reserve shows that miners can observe the laws as the forest there can be found to be almost intact. In general, the use of timber for mine support is normally negligible compared to those used in shelter construction and cooking. People clearing for agricultural activities clear large areas, whereas mining areas do not involve clear-cutting.
4.2 Health and safety aspects
The poor technology used in extraction and recovery of minerals, the inability to invest in safe working equipment and tools, the lack of technical know-how and the poor sanitary conditions in the mining camps, are some of the factors that threaten the miners' health and safety. Some studies have obsemed that the rate of mining accidents in the pits is low compared to the health hazards and illnesses occurring in the settlements, (Mutagwaba et 41. 1997). Lack of adequate sanitation facilities, use of the same source of water for household use and for mineral processing, and conduct of crushing, grinding and amalgamation operations within living quarters, are some of the visible health hazards.
Once pits are abandoned, they are usually left open. This is a hazard to wandering people and animals, particularly when they are obscured by tall grass. It also allows water to accumulate, providing a breeding ground for mosquitoes. Malaria is a very common disease within the mining areas.
Accidents in most working areas can be attributed to poor technology and lack of technical know-how. Lack of adequate scaffolding leads to accidents from collapsing walls and tunnels. Such collapses are a cause of accidents even in large mines. Stabilizing the pit walls and shafts requires engineering knowledge and the willingness and ability to take adequate measures. Poor ventilation in deep underground pits leads to accidents due to lack of adequate air circulation. Poor circulation of fresh air leads to depletion of oxygen and the build-up of other toxic gases. Suffocation from the accumulation of toxic gases like carbon monoxide, hydrogen sulphide, sulphur dioxides and others, are common incidents. In areas where drilling is carried out using drilling equipment, e.g., jackhammers, there are rarely any measures to suppress the dust. In correct usage, drilling equipment for underground work is provided with a special connection for water that is used to suppress dust and for cooling. Most miners use machines designed for surface work underground, where ventilation is limited and thus are exposed to large amounts of dust. Exposure to dust in small-scale workings can also be observed on the surface during crushing and grinding operations. Women who cany out manual grinding and those reprocessing tailings, are usually exposed to large amounts of dust. The dangers from dust exposure is made worse by the fact that miners usually lack protective gear, in this case, dust masks.
Lack of protective gear makes miners more vulnerable to accidents. Most miners work barefoot, without gloves, safety belts, helmets and even adequate lighting for underground works. Domestic torches are commonly used for underground lighting with their batteries exposed openly. They provide inadequate light, and the used batteries are an environmental hazard, one of the known sources of mercury. The other source of mercury contamination is its use in amalgamating gold. During the amalgamation process, the miners mix mercury with ore with their bare hands. Although it has been argued that due to mercury's high surface - tension its ingestion through unbroken skin is limited, miners usually have cuts-from rocks. Distillation of the amalgam is still camed out in the open air surrounded by a group of miners who in turn inhale the mercury fumes directly.
The introduction of mining equipment such as jackhammers, crushers and grinding mills without provision for protective gear is bound to have negative effects on the miners' health and safety. Apart from exposure to dust, which has been discussed above, noise from such equipment is a health hazard to their operators. Drillers in underground pits usually work in
very confined spaces without any ear protectors. Hearing problems are very common amongst underground drillers. Poor storage and negligence in handling explosives resulted in the death of two mine workers at Merelani in October, 1999. Several nearby mines developed cracks and some tunnels collapsed.
The lack of adequate sanitation facilities within the mining camps is an area of major concern. In certain mining areas pit latrines are very rare. In areas where they exist they are usually shallow and may be located in places that threaten the safety of water sources.
Loose morals and the spendthrift atmosphere in mining settlements make women vulnerable to sexual abuse, and communicable diseases, including sexually transmitted diseases spread easily. This has been found to affect mostly young girls and single women with no permanent attachments.

5.0 INSTITUTIONAL AND SOCIAL RELATIONSHIPS
5.1 Institutional relationships
5.1.1 Administrative structures are in place
The country has put in place a number of business and institutional organizations to support and administer the mining sector in various ways. These include the Ministry of Energy and Minerals (MEM), Chamber of Mines, TAMIDA, FEMATA, REMAS, NGO research institutions and others. Each of these institutions has definite visions and missions and their functions are closely related to the national long-term objectives of the mining sector. The development of the mining sector requires commitment and cooperation among the key stakeholders, to address without delay the sector's development challenges.
+ Policy aspects
With the current reforms, the role of the Government in the mineral sector has been narrowed down to providing clear policy guidelines, stimulating and promoting investment activities at all levels, and regulating activities in the sector. It has withdrawn from its former role in mining production.
5.1.2 MEM faces classical underdevelopment constraints
Since the reforms in the mid-1980s the development of the mineral activities has been influenced by institutional reforms within the government departments (MEM and local government reforms) and the increasing facilitation support given to the mining sector. It is taking time for the organizations to perform new functions effectively. Meanwhile mine operators are without efficient procedures for claim allocation and rarely receive training, guidance on equipment and mining techniques, or on-site mine inspections. In the Umba Valley and Ruangwa for example, artisanal miners invaded unattended gemstone and gold claims and mined in an uncontrolled manner, a common practice in many other parts of the country. There are several reported cases in the Lake Victoria gold fields where exploration programmes of mining companies have been interrupted by illegal mining activities of artisans in mineral properties.
Most of the minerals are still sold to unlicensed small brokers near informal primary markets. There are many areas given to mining companies or individual owners who have failed to operate them. Regular mine inspections could have addressed these problems, as inactive mines revert to the state. The zone mine offices in Mtwara and Arusha, do not have sufficient operating funds to conduct regular mine inspections. Frequent inspections also might have mitigated the collapse of the gemstone markets, which resulted from the allocation of hundreds of tiny plots and a scramble to produce. At present there is dangerous underground mining where several pits cross each other in underground tunnels (for example, Merelani and Ruangwa). Pit owners normally do not go under the pits for safety reasons, which has resulted in the poor custody of recovered gemstone that are stolen by workers and end up in brokers' hands. If minimal safety standards were observed and the claim owners enforced operations supervisions, mineral products could be sustained for a long period and smuggling practices would diminish.
5.1.3 Increased facilitation of mining investment opportunities
The Mineral Resources Department (MRD) is responsible for broad policy direction, co- ordination with other stakeholders, organizing and leading negotiations of mining agreements and monitoring development of the mining sector. The department has facilitated channelling of investments into the mining sector. Both Tanzania Revenue Authority (TRA) and Tanzania Investment Promotion Centre (TIC) have been strong partners in carrying this responsibility. However, it is important to note that complicated processes and involvement of many interested institutions may create uncertainty and provide room for corruption. This may in turn lead to inefficient investment decisions and / or loss of government revenue.
In order to enhance mineral development from the early stages of exploration through mining and processing to marketing, the MEM recognizes that the private sector's investment in the mineral sector is of paramount importance. Hence the Government is determined to attract private investments in the mineral sector by creating an enabling environment for private sector develooment in the sector. Serious investors look to conduct business with government
A - in an orderly and punctual manner. The mining sector is now very open and improved policy environment has facilitated increased investment opportunities and interests from many majo~ mining companies. Stability of the fiscal regime isvery essential to maintain investors; sentiments to operate in Tanzania.
5.1.4 Data and information on mining activities is still very weak.
The collection, storage, analysis and dissemination of data and information on mining activities have not improved despite the ongoing institutional reforms and widespread development of information technology in Tanzania. The present recording system of mineral purchases and exports does not allow easy data processing to monitor the export trends of individual coloured stones, gold, and diamond. This information would enable the Mineral Resources Department (MRD) staff to advise dealers and miners. No serious data and information collection is done at the mining level. No one has exact data and information about the performance of the mining sector. The linle that is done is mostly guess estimates based on case studies or 1 and estimated figures to satisfy administrative procedures and donors. A few foreign buyers visiting the Ministry of Energy and Minerals are usually directed to dealers. In the early mine rush years no foreign market information, service or any training in gemmology has been conducted or organized by the MRD. The country lacks specialized institutions to offer professional services on how to start value-added activities or the choice of appropriate lapidary and jewellery equipments. Very few on the MRD staff have gemmological knowledge, which limits the ability of the field staff to advise mineral operators. It was noted during the survey that MRD has initiated specific projects to address some of the above issues. More than 10 field technicians were sent to Germany, the UK, and Thailand to study gemmology. The first basic gemmological training of small-scale miners was offered in Arusha in December 1999.
5.2 Professional associations
The increasing number of public and private business associations and technical supporting institutions has been fundamental to the success of the mineral sector's growth and development in the 1990s. Duties of mining associations are to fulfil the objectives of their respective association, which reflect interests of members who are the main recipients of

project programs. The MEM has started incorporating these associations as partners in the development of relevant policy strategies and thus forging strategic alliances within the mining sector. This has been very central to accelerated technology transfer, increased market information and knowledge and business opportunities.
Unfortunately, all business supporting organizations suffer from the classical underdevelovment constraints such as lack of skilled and experienced manpower, lack of - A
financial resources and poor facilities. These institutions are loosely connected or there is a weak vertical linkage among mining business supporting institutions. Atmosphere of trust is still limited among members and between different mining associations.
Association and linkages at grassroots (mining site) are weak. Few associations are present or active at the mining sites. Mine workers are poorly represented. Miners any organized village level associations are localized but with poor horizontal linkage with the district and other vertical linkages. Local governments are not well involved or have very little interest in mining activities. Many authorities were not concerned with the use of child labour in gold and gemstone mines. Yet some village boys were found pounding ore for gold miners at Ikungu in Nachingwea. When asked what they thought of this labour, they replied that it paid well and one could work more days than with farm labour. They received TSH 800 per day for pounding ore vs. TSH 400 for farm work, but their main concern was that farm work was available only a few days per year.
At the local level, the mining community generally establishes an internal order almost immediately, with a Chairman and other officers. These officials maintain internal order and serve as liaison with existing village and ward administrative structures. Village councils are mostly concerned with local social, employment, environment and health, security, and legal and regulatory issues. Local government authorities at village, ward and district levels have not been powerful institutions influencing growth of mining activities. They tend to accept what comes. They often negotiate with miners to contribute to local activities, sometimes levying fees for themselves, or for a school, road, bridge or other project of general interest. All of those interviewed regarded mining, on balance, as having brought more positive change to their communities than problems.
There has been weak coordination between the central ministries and the local government - authorities particularly, in the areas of promoting and supervising licensed miners, brokers and dealers, improving revenue collection and environmental and health matters. The central ~.
government has not provided adequate technical assistance and basic social services to mining areas. Mining areas lack police stations, adequate health facilities, and reliable communication services. The central government and zonal mining offices have limited capacity to provide extension services.
5.3 Social linkages
The team found generally positive responses to questions on the local social impact of mining. Unlike some elite opinion holders, local people and their leaders did not perceive mining as a "bad" activity. Both men and women are allowed in alluvial mining. But women are generally prohibited from underground mining by cultural taboos. A few women own and operates mines, but do not go into them. In some places women and young children are very active in grinding ore on a contractual basis and take part in gold recovery processes,

reworking tailings, washing and panning for gold concentrates, and digging in shallow pits for ore and gemstones. Individuals and groups of women have been very active in alluvial mining activities, where they work near rivers and streams in washing and sieving for minerals.
Women participate in the more prestigious aspects of the mineral sector, as claim holders and dealers, albeit they are a minority. There is an active women miners association, TAWOMA, and some women are active mineral dealers. A woman served as President of TAMIDA in 1997 and 1998. Mine workers come from different tribes of Tanzania and with different religious and cultural backgrounds. Many are from the northern and central zones. Very few are from the coastal and southern zones. Most of the miners who have come into the southern zone area are from Shinyanga (Sukuma) and Mara (Kuria) or Mbeya Regions. Very few are from the neighbouring countries, although there are a few from Burundi, Rwanda, DRC and South Africa. Only minimum social cultural conflicts are reported in the new mining areas in the southern zone where most miners are from other regions and are of different tribes.
Many young mine workers and brokers are not married. For those few who are married, their families are either in the villages and are rarely in the mining areas. Because of labour migration, it is common in mining villages to see inter-marriages of people from different tribes and religious background.
Muslims and Christians are the dominant religious groups. Specific religious beliefs or tribalism have not been an issue in the mining communitv. Peoole from different religious - - groups have different spiritual beliefs about mining, and pray or perform rituals before continuing with serious mining activities in all new areas. As a mining community matures, one generally observes a growing number of churches, mosques and social places. These have been very important social institutions enhancing peace and security. Many observers admit that mining communities have contributed to some extent to the sense of national unity among people.

6.0 CO-EXISTENCE OF LARGE AND SMALL SCALE MINING
6.1 Coexistence of large and small-scale mining in Tanzania.
6.1.1 History of large and small-scale mining
Before independence, mining in Tanzania was conducted by large and medium scale mining companies and there was no significant small-scale mining. During this time mining contribution to the GDP was about 10%.
During the period of the state monopoly of mining under STAMICO, artisanal and small- scale mining in Tanzania started as part of the informal rural economy. The only formal mines were Williamson Diamond Mine (renamed Mwadui), Buckreef Gold Mine, Minjingu Phosphate, Pugu Kaolin, and Nyanza Salt Mines, all of which were run by parastatals under STAMICO. During this period contribution of the mining industry to the GDP dropped to below 1.
In the late 1980s when the Government of Tanzania liberalized mining and turning it over to the private sector, two development tracks emerged simultaneously: 1) artisanals went directly to mining, filing claims and developing legally areas that they had often been working informally before; 2) multinational mining companies applied for exploration and prospecting licences. The Bank of Tanzania obliged the commercial banks to set up buying operations for small-miners gold. Raw gold exports reached 4 tonnes in 1994. Coloured gemstones were discovered in many areas of the country, again by artisanals. Legal exports increased from US$ 3.19 million in 1993 to US$6.46 million in 1994 and US$7.28 million in 1995 (Ministry of Energy and Minerals, 1999). Legal diamond exports actually declined in that period, from US$ 10 million in 1991 to US$ 2.9 million in 1994, as the privatisation and renovation of Williamson Diamond Mine was still in progress. Exports have risen strongly since then, to between ten and fifteen million US dollars per year.
Fig. 6.1 Gold, Gem and Diamond Exports, 1989-1999. Declared Value in US$
T O T A L GOLD E X P O R T S
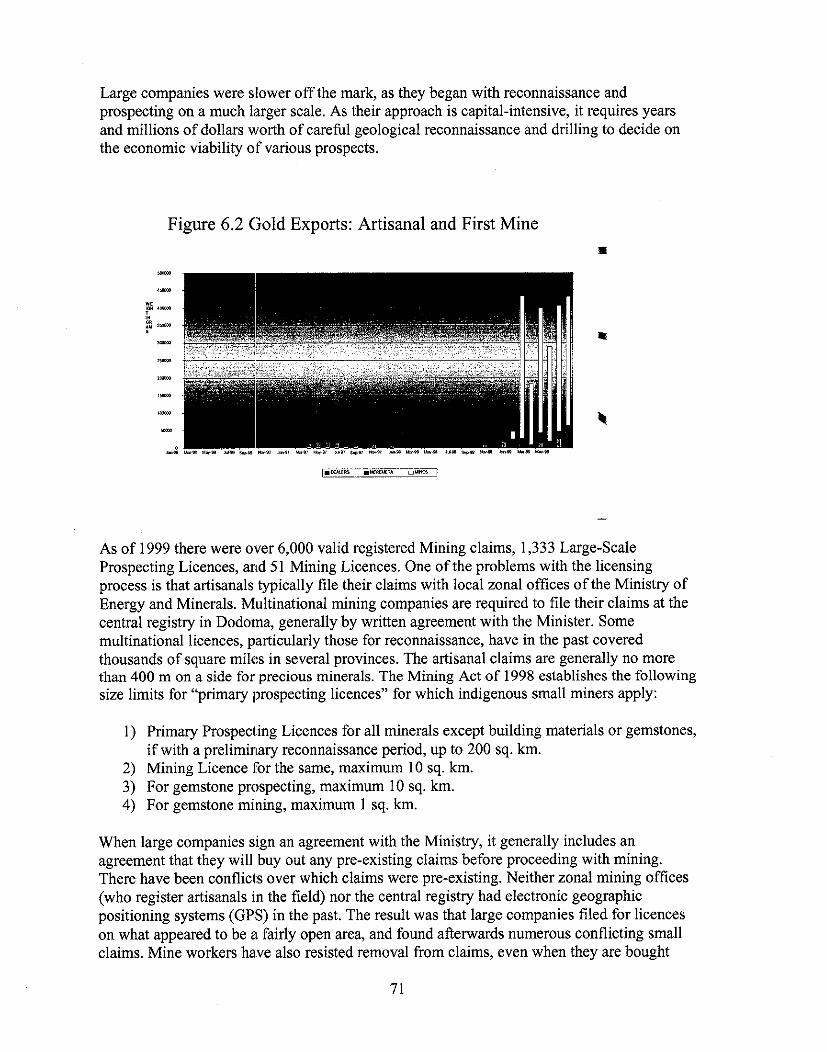
Large companies were slower off the mark, as they began with reconnaissance and prospecting on a much larger scale. As their approach is capital-intensive, it requires years and millions of dollars worth of careful geological reconnaissance and drilling to decide on the economic viability of various prospe&. -
Figure 6.2 Gold Exports: Artisanal and First Mine
As of 1999 there were over 6,000 valid registered Mining claims, 1,333 Large-Scale Prospecting Licences, arid 51 Mining Licences. One of the problems with the licensing process is that artisanals typically file their claims with local zonal offices of the Ministry of Energy and Minerals. Multinational mining companies are required to file their claims at the central registry in Dodoma, generally by written agreement with the Minister. Some multinational licences, particularly those for reconnaissance, have in the past covered thousands of square miles in several provinces. The artisanal claims are generally no more than 400 m on a side for precious minerals. The Mining Act of 1998 establishes the following size limits for "primary prospecting licences" for which indigenous small miners apply:
1) Primary Prospecting Licences for all minerals except building materials or gemstones, if with a preliminary reconnaissance period, up to 200 sq. km.
2) Mining Licence for the same, maximum 10 sq. km. 3) For gemstone prospecting, maximum 10 sq. km. 4) For gemstone mining, maximum 1 sq. km.
When large companies sign an agreement with the Ministry, it generally includes an agreement that they will buy out any pre-existing claims before proceeding with mining. There have been conflicts over which claims were pre-existing. Neither zonal mining offices (who register artisanals in the field) nor the central registry had electronic geographic positioning systems (GPS) in the past. The result was that large companies filed for licences on what appeared to be a fairly open area, and found afterwards numerous conflicting small claims. Mine workers have also resisted removal from claims, even when they are bought

out, as they typically receive no compensation. It all goes to the claim holder of record. Zonal mining officials sometimes side with artisanal claims, to the point that some large companies complain of collusion.
As is common throughout the world, one of the indicators that large companies exploration efforts followed was the presence of artisanal mining. Artisanals generally play the role of discoverers. They are limited by their technology, however, from penetrating more than a couple of hundred meters below the surface. Generally mining is most economically and technically viable for them in the top fifteen to thirty meters. A gang of four or five may remove 1 to 3 T of overburden and ore from a pit in a day, using picks and shovels.
The multinational mining companies work on an incomparably larger scale. Hauling overburden and ore in a steady 24-hour stream of 100-T trucks, they create a pit several miles in diameter and a mile or more deep in the space of a few months. Or they mine in shafts, carefully stabilized to prevent accidents. They can thus mine far more of a rich deposit. They can also mount entirely enclosed leaching operations to extract the ore. The result is faster, safer, higher yield mining, with less damage to the environment. Modern mining companies sign an agreement to refill the pit and restore the topsoil when the mine is closed, and design the operations so that this can be done. It does not always happen, however, as sometimes, instead of being closed, an ever less profitable mine is sold to successively less well capitalized buyers until the last one goes bankrupt. At this point an environmental plan is useless. Tanzania has not yet faced this dilemma.
Proven gold reserves in 10 projects likely to go into production totalled 30.5 million ounces as of 1999. Another five smaller deposits with a total of 6.5-7 million ounces were likely to go ahead, and a dozen smaller ones were feasible if market conditions were favourable. A projection of the combined production schedules shows that Tanzania is likely to experience a sharp acceleration in exports and revenues, followed by a fairly rapid decline. Attention so far has focused on the expected growth. Further strategic planning is required to cope with the windfall aspect of this picture.
Figure 6.3 Projected Production from Formal Gold Mines, 1999-2020

6.1.2 Different deposits interest different groups
There are many localities in Tanzania where the gold veins are concentrated close to the surface, but too small to interest large companies. Multinationals look for deposits over 500,000 million ounces with yields of 2-3 ounces per ton, in order to recover the capital outlay involved in exploration and mining. Small miners look for higher concentrations (3-8 or more ounces per ton) close to the surface, but have little capital invested so are interested even in small veins. Such small deposits are found in places like Nyarugusu, Mugusu, Nyakagwe, Sirori Simba and Chunya, and in outlying veins around major deposits mined by large companies.
On the other hand, there are several large deposits, which are very attractive and can be mined more economically by large-scale mining companies. Such deposits include Bulyanhulu, Golden Pride (Lusu), Geita and Mobrama (Nyabirama). Artisanal miners fought to be able to exploit the very rich deposit at Bulyanhulu on which they had been mining for several years by the time formal mining was ready to begin. Artisanal technology would not begin to be adequate to mine the entire deposit, however. Government had signed an agreement with a multinational, which had designed a complex shaft mine capable of exploiting the narrow core to great depth. Ultimately it enforced the removal of the artisanals. Exploration results suggest that some deposits will prove larger than is now documented, and that other large deposits may be discovered, especially, in the Lake Victoria Gold Fields.
Given government policy and the diverse nature of the deposits, it is evident that the coexistence between small-scale mining and large-scale mining is inevitable. On the ground they are competing for only a small portion of the total mining opportunities in Tanzania, mainly for the top thirty meters of the largest, richest gold and diamond deposits.
Most large-scale mining companies are interested in base and precious metals and diamonds, not coloured gemstones. Thus medium and small-scale miners will likely dominate gemstone mining.
6.1.3 Mining technology
Artisanal and small-scale miners in Tanzania are still using traditional hand tools and processing equipment. Consequently their recovery is poor, often below 40%. That being the case they mine very rich veins and at shallow depths.
Due to lack of modem technology artisanals mine in some concessions up to 25 meters and then stop because it is no longer economic to go deeper. It is also dangerous to continue due to poor ventilation and unsupported shafts, subject to collapse.
The current law fails to provide for some kinds of coexistence between small and large mining that work well elsewhere. Potential modes of coexistence and collaboration include:
0 Exploitation by first one group then the other. Small miners allowed to mine on large-companies' concessions, sometimes with technical assistance and equipment from the large company. There are often uneconomic collateral deposits near the major one that a large company is mining. Large companies provide guidance on safe mining practice. They must, however, be

exempted by written agreement from responsibility for mining accidents incurred by such artisanals. Otherwise the liability risk is too high for large companies to be willing to undertake such arrangements. Large companies market the produce of small-scale miners. Present Tanzanian law does not allow this, apparently to protect the role of Tanzanian mineral dealers. The artisanal miners want more buyers very badly. It would serve the interests of the sector as a whole. Dealers and brokers are not able to reach all mining areas, which is a serious handicap for artisanals. If formal mining companies were allowed to market the produce of artisanals mining on their mining concessions, it would provide just compensation to them for the mining opportunity the forego themselves. It would provide them with cash flow in the start-up period, when their cash flow is negative. A non-productive period of months or years often precedes the beginning of revenue flow for mining companies.
Examples where such arrangements are working include Ghana and Zimbabwe, where small miners in some places are allowed to mine the top twenty-five or thirty meters of a deposit, before or after large companies have a chance at it. When they reach the point that it is either uneconomic or unsafe to continue, large companies can take over. Ghana and Eritrea also reserve large areas exclusively for artisanal miners. In Eritrea, about one fifteenth of the ore- bearing area is set aside for artisanal miners. They are allowed to mine only to fifteen meters depth. In Ghana, when large companies finish one exploration licence and return part of the concession to government, a portion is reclassed for use by artisanals. The exploration reports become part of the public record. Often they document deposits that are too small to be economic for the big companies, but can be mined successfully with less capital-intensive methods.
Tanzania's 1998 Mining Law requires large companies to return half of a prospecting claim after the first period, together with any documentation. There appears, however, to be no provision that specifies that any concessions be resewed for artisanal and small-scale formal mining.
Most of the potentially interesting gold-bearing land is currently allocated to large concessions (See Map 1, below). When the Central Registry becomes computerized and its contents are regularly communicated to zonal offices, it will become very difficult to register a small claim. At present two seemingly legal sets of claims coexist, large ones in the Central Registry and small ones in the zonal offices. Both sets of miners report that they often overlap. If the discrepancies are removed without reserving some lands for artisanals, they will likely be forced into an extra-legal status.

Source: Government of the Republic of Tanzania, Tanzania: Opportunities for mineral resource development. Third ed. 1998.
6.1.4 Mineral Policy
The Mineral Policy of Tanzania was passed by the Parliament in October 1997. The Mineral Policy clearly supports promotion of both large-scale and small-scale investment in the Mining Industry. It states that "the vision for the next 25 to 30 years for the mineral sector is to have a strong, vibrant, well organized private sector led by large and small-scale mining industry, conducted in a safe and environmentally sound manner, contributing in excess of 10% of the GDP". The mineral policy also states that the Government of Tanzania recognizes the positive contribution of the artisanal and small-scale mining sub-sector to the
75

economy which include the discovery of mineral occurrences, mineral production and the creation of employment and incomes in the rural communities. This clearly illustrates the Government's commitment to support the coexistence of small-scale and large-scale mining in an effort to develop the mining industry in Tanzania.
In the Mining Act of 1998, mineral rights are grouped into two categories namely:
Division A and B, exclusively for large scale mining, and Division D, exclusively for small-scale mining.
The Mining (Environmental Management and Protection) Regulations also provides for special conditions to be adhered to by artisanal and small-scale miners apart from general environmental management issues.
The new structure of the Minerals Division has provided for a Special Unit called Coordination and Extension Services for small-scale mining to ensure that this sub-sector is being transformed to improve its productivity and its ability to coexist with large-scale mining activities.
6.1.5 Employment
The Mining Industry is one of the leading employment creating economic sectors in Tanzania. It was estimated that in 1995,550,000 people were involved in artisanal and small- scale mining activities (Tan Discovery - Baseline Survey Report March 1997). Likewise large mining companies involved in exploration and mining have created employment for thousands of people in the country, professionals, semi-skilled, and unskilled workers. For example, Golden Pride at Lusu, a newly commissioned mine, has already employed 650 people, 600 of whom are Tanzanian citizens. Given that the number of exploration and mining companies in Tanzania is more than 1,400, it is obvious that employment has been created for thousands of people. The mining sector also offers opportunities for employment to thousands of workers in the secondary economic activities within and around the several mining communities in the country.
6.2 Current status of relationship
Since large-scale mining companies started their exploration activities in Tanzania they have considered small-scale miners as groups of disorderly people who are encroaching on large- scale mining concessions. Most mine managers never liked the idea of cooperating with them at all. The problem is that these large-scale mining companies tend to lump small-scale miners together with illegal miners, who have no mining rights, and move from one place to the other as fortune seekers, especially in mine rush areas. The Government and the Chamber of Mines have the duty of educating the large-scale miners to accept the fact that small-scale miners who are recognized by the Government are those who own primary licences in accordance with the provisions of the Mining Act. The evacuation of illegal miners in the Bulyankhulu mining area has restored the confidence of large-scale miners that the Government is determined to protect registered mineral operators.
6.2.1 Factors influencing relationship
There are several factors, which influence the relationship between small-scale and large- scale mining companies. Some of these factors are:
Neighbourhood
Many large-scale mining companies apply for concessions covering areas as big as 150Kd for the case of Reconnaissance and Prospecting Licences. In such concessions it is common to find many claims legally licensed to small-scale miners. The mine operators are forced to share common facilities such as access to roads, water, and power sources. In some cases a large-scale mining company may need to dig trenches or make some drilling works through some of these claims during the company's exploration programme in order to ascertain the mineralization trend. Such cases are common and they exacerbate tensions between large and small-scale miners.
Technical support
In cases where small-scale miners are within the licence area of the large-scale mining company, it is a common practice for a large-scale mine to provide technical support. Such support includes: lending of drilling equipment (compressors and jack hammers), water pumps, blasting equipment (exploders and expIosives) and dump trucks for haulage of ore. This kind of support comes in response to requests by the small-scale miners and reflects harmonious coexistence. TANCAN Mines and AAPS companies had programs to support small-scale miners in their licensed areas.
Relationship between mines and local government
There is as yet neither legislation nor standard practice regarding the rights of local government to tax miners. There is an informal expectation on both sides that miners can and should contribute to community development. Each community ends up negotiating how and to whom such benefits should go.
In some districts, local government may introduce by-laws, which require all mining operators to contribute in kind towards development programs in that particular district. some of these conditions might be viewed as a burden to mining operators while some might be good and readily supported by mining operators. In both cases all mining operators may decide to meet and form a common strategy on how to deal with such issues from the local Government. Such meetings always influence the relationship between large and small-scale mining operators.
Mining associations
Established Mining Associations like the Tanzania Chamber of Mines (TCM) Federation of Miners Associations of Tanzania (FEMATA) and Dealers Associations like Tanzania Mineral Dealers Association (TAMIDA) are open to both large and small-scale mineral operators to join. In practice the large companies participate most in the Chamber of Mines, small miners in FEMATA and dealers in TAMIDA. Such associations are established to protect interests of both large-scale and small-scale operators. As a result of such associations

the relationship between large and small-scale mining improves. Tanzania Chamber of Mines (TCM) recently organized a four-day Mining Awareness workshop in Mwanza town where both representatives of other mining associations and the regional leaders of mining areas attended.
7. TAX POLICIES AND ADMINISTRATION
Chapter seven examines the current fiscal regime as applied to the mining sector in Tanzania, keeping in view the dual objectives of: capturing a fair share of the revenues generated in the sector for government; ancl creating an environment that will be attractive both for domestic and foreign investment to the sector. The analysis covers two aspects.
First, it examines the various elements of the present fiscal policy applied to the mining sector. Alternative policy options are analysed in terms of their impact on tax revenues and earnings of the var&us actors in the mining industry. The nature of the gold, nickel, and diamond industries differs from the gemstone industry in terms of the scale of mining, processing facilities and marketing channels, the implications of the current fiscal regime for these two different sectors, large and medium-scale mining on one hand and small-scale gemstone mining on the other, are analysed separately. Small-scale gold mining is another interesting and important activity in Tanzania, but its economics is difficult to model because of the lack of data and the continuous mobility of the small-scale miners.
Second, the current procedures for paying the different kinds of taxes and the processing of tax returns are analysed. The aim is to suggest modifications to the present administrative practices that would improve tax compliance and, at the same time, minimize the cost of compliance both for the taxpayer and the tax administration.
With a proper reform of the current tax policies and administrative practices, it is also expected that the level of compliance will go up and the incentive to hide trade and smuggle the output will be reduced considerably.
7.1 Existing tax system as applied to mining sector in Tanzania
As the Tanzanian govemrnent has realized the potential for greater contribution of the mining sector to economic growth, it has made serious efforts to rationalize the tax system and to reduce the tax burden in this sector. Table 7.1 presents a summary of main changes in the tax regime as applicable to the mining sector.
However, some serious problems still remain with the existing tax system.' The two main problematic areas that emerge from this study are the complexity of the tax structure and lack of transparency in tax administration. The tax system is narrow-based, and heavily dependent on direct taxes. Despite changes in the tax policy adopted in 1998 (new fmance act of 1997) and reorganization of the tax administration (with the creation of Tanzania Revenue Authority [TRA] in 1996), the country still lacks a coherent taxation policy, and the tax system remains complex. There are still multiple taxes and fees that are to be paid to different authorities. The tax code lacks transparency and the process of compliance is cumbersome,
A clear pattern emerged in oix interviews. The large and medium scale miners were generally satisfied with the latest tax policies as enunciated by the government. Their main concern relates to other costs of doing business in mining sector that remain unduly high in comparison to international standards. Also, they have serious problems with tax administration that, according to them, views them as easy cash cows and there is no finality to the taxation process. Assessments are reopened again and again for no valid reasons. The people in gemstone sector have problems both with the multiplicity and complexity of taxes and the compliance process.
79

imposing unnecessarily high compliance costs on taxpayers9. It is not surprising that tax administration is viewed negatively by most investors and businessmen.
At the same time, the Tanzania Revenue Authority (TRA) is concerned about the problem of a widespread tax evasion particularly in the gemstone sector. The extent of tax evasion in this sector is estimated to be anywhere from 30% to 80% of the stipulated tax liability1'.
The important features of the main taxes applicable to the Mining Sector are briefly described below.
7.1.1 Corporate income tax
This tax is administered according to the Income Tax Act (1973), and its subsequent amendments. The latest amendments are in the Finance Act (1997), the Financial Laws (Miscellaneous Amendments) Act (1997) and other Government Notices and Orders.
The existing tax regime:
(i) The new corporate income tax rate is 30%. No windfall tax or additional profits tax is applicable to the mining sector".
(ii) The new depreciation allowance for the mining sector is very generous. A depreciation allowance of 100% of all mining capital expenditures is available at the very outset. In addition, the Amendment of the 1973 Income Tax Act specifies that an additional capital allowance of 15% per year will be applied to the balance of unredeemed "qualifying capital expenditure"12. The term "qualifying capital expenditure" for the purposes of additional capital allowances means all development capital expenditure but does not include prospecting capital expenditure or any interest or financing charges.
(ii) Loss carry-forward rule. Losses incurred by a mining company can be carried forward for an unlimited period of time. After a recent amendment, however, losses in the mining sector cannot be adjusted against profits in other sectors (manufacturing or tourism).
(iii) The Commissioner of Income Tax of the Tanzania Revenue Authority (TRA) has the authority to assess and determine the amount of income earned by a company. The commissioner makes provisional assessment of taxable income on the basis of a provisional return of income filed by the corporation.
For a general description of the fiscal problem, see MEM (1997), "Mineral Sector Development Strategy" - Final draft, pp. 22,23. Also see ESRF, Tan Discovery, and IBI (April 1998), "Gemstone and Gold Marketing for Small Scale Mining in Tanzania) -Final report for phase 1, pp. 59,60. l o The estimates of tax evasion vaty widely and depend upon who the interviewee is. Some tax officials in the regional offices of TRA felt that the tax evasion could be as high as 95%.
Currently there is a windfall profits tax applied to petroleum and petroleum products. With effect from September 10, 1990 the windfall profits from petroleum and petroleum products imported or sold by a dealer are taxed at the rate of 100 percent. See the consolidated Income Tax Act (1973) and its amendments (section 13C). l 2 For details, see Financial Laws (Miscellaneous Amendments) Act (1997), part 11, section 18.
80

Table 7.1 - Major changes in tax regime applied to the mining sector in Tanzania
rypes of taxes
Lncome Taxes
Tawduties on inputs
Tax on output
(CIT) rate Depreciation allowance
Additional capital allowance
Treatment of losses
Withholding tax on technical service payments to both resident sub- contractors and non- residentslmanagement fees Withholding tax on interest Withholding tax on dividend and tax on distribution of branch profits to non- residents Royalties
Import duties and sales tax for mining equipment and supplies for project - - . . operation SalesNAT tax
Ring fence
Export duty
Domestic: withholding tax on goods and services supplied
Old Rates 35%
40% fmt year then 10% annually Nil
15% not deductible 20%
5% of export quotation
Various rates
10% deductible
Separate taxation of each mine 2% of sales value
1.2% w Engine for
New Rates 30%
100% depreciation allowance is available on all mining capital expenditures At the end of each tax year, the balance of un-recovered development capital expenditure receives an additional 15% capital allowance each year Loss carry-fonvard for an unlimited period of time 3% of gross payment (or 20% of gross iFmanagement fees exceed 2% of operating costs)
Nil
3% of net-back value. 0% for cut and polished gemstones. 5% for diamonds Exempted up to one year after start of production. Thereafter a cap limil of 5% import duty and 5% sales tax is applicable
Full VAT exemptionlor refund for purchase of inputs and supplies (where product is exported) Ring fencing around the mining sector but not within it
New value added tax (VAT) allows zero rating for all exports. Domestic sales are subject to a VAT rate of 20% Nil
rowth.

(iv) A return of income by any person, for the purposes of tax collection, constitutes a final self-assessment. The taxes charged in any assessment other than provisional assessment are payable within 30 days from the date of notice of such assessment.
(v) Where a provisional assessment is made, the tax liability will be payable in four equal quarterly instalments. These instalments are either (i) no later than 3 months, 6 months, 9 months and 12 months respectively from the beginning of the accounting period; or (ii) no later than 31" March, 30" June, 3oth September and 31'' December respectively.
(vi) Small businesses that do not pay taxes on a quarterly basis but make payments on an annual basis have to pay the entire year's estimated taxes in advance. This clearly puts an excessive burden on the small-scale businesses in the mining sector.
(vii) Payment of tax where notice of objection is issued should be made before the expiry of 30 days after the date of such notice.
(viii) Penalties and interest of 25% on the amount of unpaid tax after due date is immediately due and payable.
(ix) If the amount of tax assessed on the income finally declared by any person is more than 20% of the estimate of the tax chargeable contained in a provisional return of income made by that person, an interest of 1.5% per month is payable on the entire amount of such difference.
Problems with tax regime and tax administration
Currently most gold mines are in the stage of exploration, and are yet to generate taxable corporate income. Presently they are not affected by the corporate income taxI3. The diamond companies and the gemstone dealers and exporters are the ones who are currently paying corporate income tax. There seem to be a variety of problems both with the law and its administration, to wit:
(i) The Income Tax Act is difficult to understand. It is not very user friendly and needs to be re-written.
(ii) The laws or the rules do not matter so much, what matters are the past practices and traditional customs followed in the tax department. This creates uncertainty for taxpayers and makes the conduct of business very difficult. This is also partly due to the fact that the laws and rules are often unclear.
(iii) In spite of the provisions of self-assessment in the law, Tanzania has not yet reached the stage of self-assessment. The current state of affairs, at the best, may be called one of - "quasi-assessment". In the case of brokers and dealers of gemstones, this translates into
l 3 Expected production commencement schedules of major gold mines in Tanzania are as follows. Resolutes' Golden Pride in Lusu is expected to start its production in November 1998. Kaharna Mining Corp. (Barrick Gold) and Ashanti Goldfields Ltd. expected to commence production in mid 2000 in Bulyanhulu and Nayankanga, respectively. Afrika Mashriki Gold Mines Ltd. will commence production in the late 2000 in Nyaligongo (Golden Ridge). Randgold Resources parrick) and Madabdhglo-AmericadF'angea Minerals will start production in 2002.
82
100% probability of audit by the department. Every return is examined, assessed and a notice is issued for final settlement.
(iv) There is a move towards self-assessment but the process is slow. It has to be preceded by a taxpayer education campaign, which is currently underway. Also, at present, the laws applicable to any one sector are scattered in different statutes, which is very inconvenient to the taxpayers. The MEM is fully aware of this problem and is trying to coordinate an effort to consolidate all the laws and regulations on the mining sector, translate them, and make them available for sale before moving to a system of full self- assessment.
(v) In practice, TRA sends a notice to almost every dealer or exporter even when she is in full compliance of the law and completely clean. The notice is very general in nature saying something like the following:
- 10% sales understated, or - 10% purchases overstated.
Generally, the tax implications of this simple notice are substantial. The amount involved in the alleged understatement of revenues or overstatement of costs could be in the order of TSH 56-60 million. This means a great deal in terms of additional tax liability and penalty. The taxpayer has a period of 7 days to respond and then the assessment is finalized and additional tax liability is confirmed. The taxpayer must deposit 50% of the additional tax liability before filing an appeal. The whole process is so hurried and largely arbitrary that the taxpayer has very little option. In practice, the taxpayer sits down with the tax collector and negotiates. This unnecessarily enhances the opportunity for personal contact between the taxpayer and the tax collector that might sometimes result in personal kickbacks. Clearly this is not a desirable situation. During our interviews with representatives of the jewellery business, there appeared to be widespread frustration with the corporate income tax and the way it was administered.
From the perspective of this business, the biggest problem is that the officials in TRA lack a proper understanding of the nature of the business. In a routine assessment, the taxable income assessed by the TRA might be as high as three-times the company's estimated profits. As a result, there is an incentive for taxpayers to underestimate their revenues and overestimate their costs, while the TRA tries to do exactly the opposite. This kind of gaming behaviour is clearly inefficient and increases considerably the compliance cost for the taxpayer.
A specific problem for the gemstone industry is that gemstones do not have any indicative price. This widens the gap between the estimates of revenues and costs by TRA on one hand and by gold/gemstones dealers on the other. Tax payment to TRA is made in advance, based on a provisional self-assessment by the dealer. If at the end of the year, the initial payment proves to have been excessive, there is no provision for refund. The excess payment is kept for next year as a credit. Dealers and exporters lose in terms of the time value of the advance excess tax payment.
The 30% corporate income tax on dealers and exporters adds to an already high tax burden on Tanzanian dealers and exporters and puts them in a disadvantaged position in competition

with their counterparts in other countries. In India and Sri Lanka cutting and polishing exports are wholly exempted from corporate tax, as an export promotion incentive. (Cooper and Lybrand 1998). Tanzania has not taken this step, and yet hopes to see its embryonic lapidary industry compete on the world market.
7.1.2 Value added tax (VAT)
The Value Added Tax Act was passed in 1997 and became effective from the fiscal year of 1998-99. It was meant to replace the Sales Tax Act of 1976, but in practice the sales tax continues to be collected in many areas. The main problems with the new VAT law are summarized below.
The existing tax regime:
The VAT is a consumption tax and is based on the destination principle. The credit or invoice method is used for computing tax liability. Tax rate is 20% and exports are zero-ratedI4. Tax returns are to be filed on a monthly basis, and at the end of the year, an annual return is submitted to the tax department. There is a penalty for late submission of returns. Section 26 of the VAT Act specifies that the taxpayer has to pay a penalty of TSH 50,000 or 1% of tax liability in the accounting period covered by the return, whichever is greater. Also "a further penalty of TSH 100,000 or 2% of the tax shown as payable in respect of the prescribed accounting period covered by the return, whichever is greater, shall be payable for each month or part month thereafter". Penalty is payable immediately on receipt of a notice issued by TRA.
The Third Schedule of the VAT Act lists selected investment items for the mining sector that are given special relief (generally exemption from VAT). The Third Schedule specifies that "importation by a registered licensed drilling, mining, exploration or prospecting company of equipment to be used for drilling, milling, exploration or prospecting activities" is entitled to relief from VAT. However, the relief is subject to procedures that are determined by the Finance Minister. In order to reduce any hassles in getting relief from VAT, the MEM has developed a model agreement between MEM and a mining company. Under this model agreement, the mining company is to be registered for VAT under section 19(4) of the VAT Act. Registration under section 19(4) is considered by the Commissioner for Value Added Tax on "grounds of national economic interest or of the protection of the revenue". If the company is registered under this section, VAT payable on any capital goods imported, purchased, or received by such company/person will be deferred till the date of commencement of production.
0 Problems with tax regime and tax administration
Virtually all products of the mining industry are exported, and hence they are subject to a zero-rated VAT. In general, the producers of zero-rated commodities ultimately do not have to pay any taxes; they are either exempted from VAT on their inputs, or if they have paid VAT on their inputs, they are entitled to claim VAT refunds. To relieve the burden of delay in VAT refund, the VAT Act provides an incentive to the mining industry in the form of VAT exemption of selected inputs. However, the procedures for exemption of VAT input
l4 This may be compared to rates in Kenya (15%), Uganda (17%), and Zambia (20%). Clearly Tanzania has chosen a rate that is one of the highest in the region.
84

and VAT refunds is complex and cumbersome. The whole process often involves several different authorities and takes a lot of time.
The process for getting VAT exemption for imported and domestically purchased inputs is not automatic. For imported inputs, the mining companies have to produce a list of those items that they would like to be exempted. Then, they have to send both the list and their request for exemption to the Department for Minerals (MEM) for approval. The approval will be issued and forwarded to the Customs Department of TRA for clearance of import duties. The decision on exemption from VAT will be taken by the VAT Department after clearance from the Customs Department. If the Customs Department for some reasons determines that the imported items are not exempted from import duties, they will not be exempted from the VAT payment either. For domestic purchases, firms are required to fill the TRA's application form (VAT 223) in duplicate, and then send it to the regional VAT office for approval of exemption. If approved, form VAT 224 will be issued with an authority to procure taxable supplies free of VAT. While filing the application, companies must submit a schedule that shows the quantities and values of the goods or services together with the supporting documents prescribed under each group.
In an effort to simplify the procedures for VAT exemption, the Tanzania Chamber of Mines (TCM) has produced a list of items that are commonly used by the mining industry and a VAT exemption is requested for them. However, the TRA has suggested another list of exempted inputs for all the economic sectors under the harmonization code. The equipment and tools listed in the two lists are quite different. Since the matter has not been resolved, mining companies have to formally submit their request for exemption for each transaction of import or domestic purchase.
In practice, however, whenever mining companies buy inputs from domestic sources, they are required to pay VAT even if they can prove that the items of purchase are VAT exempt. Domestic sellers normally do not care if buyers are VAT-exempt. They would rather collect tax from the buyers irrespective of the latter's tax status and adjust the VAT payment on their own purchases. The main concern of the sellers appears to be to get their own VAT adjustment, a behaviour that is rooted in the general delay and inconvenience of getting a refund from the tax administration. As a result, the mining companies normally have to first pay VAT on all their inputs and then file claim for refunds on VAT exempt items.
All the gemstone dealers/wholesalers have to pay VAT on inputs. Once they export their output, they can file for VAT refunds. A typical return is normally a nil report on the tax liability side and gives the account of taxes paid on inputs for the purposes of reimbursement. There are serious problems with these refunds, however. As of June 1999 no reimbursements had yet been made, a lapse of more than six months in most cases. This undue delay placed a huge financial burden on most of the taxpayers in this sector.
For utilities (like electricity), the mining companies pay VAT and then file claim for refund. Again there is a problem of delays with these refunds.
According to the TRA oficials, the main reason for the delay in VAT refunds for the mining sector is the fact that VAT is new; it was just introduced last year. Poor record keepinglprocessing (basically, every thing is manual), and lack of personnel with proper skills make delays unavoidable. The TRA needs more time to screen and check through all
documents if it wants to properly detennine refunds. This leads to a serious problem. Firms and individuals are required to submit their monthly returns on time and are fined if they fail to do so; but the VAT Department is unable to process all these returns or claims for refund in a timely fashion. This generates huge backlogs and makes delays in r e h d s inevitable.
If experience elsewhere in Africa is any guide, the refund system is likely to continue experiencing problems even after TRA personnel are familiar with the necessary paperwork. The World Bank in the 1980s and 1990s recommended duty drawback schemes throughout the continent, but such systems have consistently failed to perform. Once treasuries have taken in funds, the approval to release them again rarely materializes. The tension between businesses and officials creates opportunities for corruption. Accordingly, drawback schemes are rarely recommended anymore. This may be just one more example of an inappropriately designed system. There is pressure in Tanzania to zero-rate qualified items in the first place instead of collection and crediting back taxes.
Interviews with several large mining companies in Dar es Salaam revealcd that the problem of delayed refunds for VAT paid on inputs is a serious one. According to the representatives of these companies, VAT was introduced in a hurried fashion. Their claim for refund of VAT on inputs has been pending for more than six months with arrears going up to several million US dollars. The delay in VAT refunds adds substantially to the hidden costs of mining companies, due to huge increases in working capital requirements. Apart from the large sums of money locked into these refunds, it is the bureaucratic hassle of claiming the VAT exemption that proves daunting for most mining companies. It was suggested that the TRA should either issue a certificate to each industry or company about the tax exempt items it normally purchases or it should be mandatory for the TRA to refund the VAT on inputs at the end of the month of filing such a claim. In case of failure to do so, the taxpayer should be automatically entitled to interest payment at the market rate. According to the representatives of the mining business, the level of taxes is not a problem; it is the poor administration that is driving existing business and new investments away.
7.1.3 Withholding tax
There is a general withholding tax on goods and services on business transactions in Tanzania. This withholding tax is also applicable to transactions in the mining sector.
(i) A buyer has to withhold 2% of the gross sales from the seller and deposit the money with the TRA. Since it is a withholding tax, the seller should get back this withheld amount when (s)he files the appropriate tax return. In cases where no tax return is filed and taxes withheld are not adjusted, they become the final tax payment. The lower threshold per transaction for this withholding tax is TSH 100,000.
(ii) In the gemstone business, when the miner or broker sells the gemstones to the dealerlexporter, the latter is expected to deduct this 2% from the former. According to the dealers who were interviewed, the minerslbrokers are not prepared to allow this deduction. Thus the dealerslexporters cannot withhold this tax and end up paying it and it becomes a fmal tax on them.
(iii) One tax return has to be filed every month for the withholding tax and then there is one annual return.
7.1.4 Import tariff
The Customs Tariff Act of 1976 has been recently amended by the Financial Laws (miscellaneous amendments) Act of 1997. Some of the main features of this new law as applicable to the mining sector are briefly described below.
(i) Import duty on capital goods imported by the holder of a certificate of incentives issued by the Tanzania Investment Centre is charged at the rate of 5%.
(ii) For mining operations, after the first anniversary of the commencement of commercial production, the rate of import duty on items to be used in carrying out mining operations is capped at 5%. If the company is not yet at the operating stage, imports are exempted from customs duties. However, like the VAT on inputs, the exemption from import duties is not automatic and the company has to claim exemption in every transaction.
7.1.5 Stamp duty
(i) Since the introduction of the VAT system in 1998, those who have not registered for VAT pay stamp duty at the rate of 1.2 percent of gross sales.
(ii) A stamp duty hair to be paid on each receipt issued in the course of a business transaction. It is, therefore, also applicable to the transactions in the mining sector, including gemstone sales.
(iii) At the time of sale, the seller has to fix a stamp of 1.2% of the gross sales on the receipt before issuing it to the buyer. This naturally becomes quite cumbersome for any business. As an alternative, a dealer or any businessman can make a composition agreement with the TRA under which he gets a seal from the tax department that can be used to stamp every receipt issued at the time of making a sale. When the sales return is submitted at the end of the month, the total stamp duty is calculated and deposited.
7.2 Royalty
The new provisions for royalty are specified in the new Mining Act of 1998. Some of the main features of the new law are as follows. The royalty is collected by the MEM. Every authorized miner pays a royalty on the "net back value" of minerals produced under hislher license. "Net back value" is the market value of minerals FOB at the point of export from Tanzania. In the case of domestic consumption, it is the value at the point of domestic delivery minus the cost of transportation from the mining area to the point of export or delivery (including insurance and handling charges), minus processing costs (unless such other processing costs relate to processing normally undertaken in Tanzania in the mining area).
(i) The rate of royalty is 5% for diamonds and 3% for gold and other minerals including rough gemstones. Cut and polished gemstones are not subject to royalty. If the authorized miner of raw gold or rough gemstones sells his production to another licensed dealer, the latter will pay the royalties.

(ii) Every licensed dealer has to pay in lieu of royalty on the net back value of any raw gold or gemstones which are (a) exported by him or (b) in the case of gold sold to a gold refinery in Tanzania; or (c) in the case of gemstones, sold to an authorized lapidary or gemstone cutter and polisher. To avoid double royalty, the Mining Act specifies that this payment does not apply where the licensed dealer is an authorized miner who has paid royalty on those minerals produced by him.
(iii) A provisional royalty may be applied if it is impractical to assess the exact amount of the royalty or any payment in lieu of the royalty.
7.3 Employment taxes
Multiple types of employment taxes apply to all businesses, including those in the mining sector.
7.3.1 Pay as you earn (PAYE)
Miners are expected to collect and deposit PAYE from employees whose tax liability depends upon their particular tax bracket, with the highest bracket at 35%. The Ministry of Finance has proposed some changes in the personal income tax law from the fiscal year of 1999-2000. Changes will include reduction of the number of tax brackets from 11 to 4 and reduction of the highest marginal income tax rate from 35% to 30%. The new proposed rate is equal to the current rate of Corporate Income Tax.
Record keeping for this tax basically implies maintenance of a muster roll. As far as the emvlovees are concerned, PAYE is their final tax and no annual return etc. is required.
A .
However, all employers have to follow a rather complex procedure and have to ise numerous forms for the purpose of PAYE.
About October/November of each year, the TRA sends to employers all the documents and forms to be used for the PAYE in the following year. After remitting the tax deducted, at the end of each month the employer is required to list the names of his employees and their respective amounts of tax. This total tax has to match with the amount remitted under form P.ll (credit slip paying - in book or nil report). In addition, an employer has to provide to each employee a written statement that shows the monthly pay and the tax deducted. At the end of each year, the employer has to complete the P.9 card (the tax deduction card) in detail and fully answer a series of questions listed on the card. In addition, employers are required to fill form P.10 (the end of year certificate), which is used for statistical purposes. To complete this form, employers are encouraged to "exercise maximum diligence".
7.3.2 Benefit (or fringe benefits) tax
Fringe benefits are combined with the employee's salary to form the tax base for personal income tax. Total taxable income of any employee will be estimated as the sum of both official salary and fringe benefits. If the benefits are in kind, the value of these benefits are to be estimated by either employer or assessed by the TRA on the basis of current market prices. The Employment Tax Department of TRA is responsible for the enforcement of this aspect of income tax. There may be cases in which employers do not report fringe benefits. The TRA would send tax officials for random checks on a limited basis. Tax officials also routinely check the annual accounts of expenses of companies to cross check if any fringe benefits
88
were claimed. If f m s fail to report fringe benefits given to employees, they will have to pay an additional fine, which is 25% of the principal tax liability. According to the mining companies, in practice this type of tax is imposed in an arbitrary fashion and is not based on any systematic assessment.
7.3.3 National social security fund (NSSF)
There is a 10% contribution on behalf of the employer in addition to the 10% from employees to the National Social Security Fund (NSSF). NSSF is a sort of pension plan. It is the responsibility of the employer to deposit both the employee's share and his own share. One return has to be filed every month and then there is an annual return at the end of the year.
7.3.4 Director's tax
A 33% Directors' tax has to be paid to the TRA on salary paid to directors of the company and is deducted at source. The gross-of-tax amount of salary is subtracted from gross revenues before profits are calculated. There is a monthly return as withdrawal takes place and then one final annual return.
7.3.5 Tax for vocational1 training
There is a 2% of payroll tax on gross employment payable every month for vocational training if an establishment has more than four employees. The tax is designed for the purposes of training new workers who do not necessarily work for that employer. The money goes to the VETA agency every month. The funds are intended for vocational training of the work force in the country. There is one return every month and one annual return at the end of the year.
7.3.6 House development fees
A house development levy is imposed at 4% of the payroll. It has to be paid by all employers including the mining sector. It used to go to the Tanzania Housing Bank for financing low- income housing. That program is now defunct. The money now goes to the central government coffers. No scheme has come out to replace the previous housing scheme.
7.4 Comparative study of fiscal regimes in the region
7.4.1 Major taxes in Tanzania and other African countries
A regional comparison of tax regimes shows that the major taxes and fiscal incentives applicable to the mining sector in Tanzania are generally comparable to those in other natural-resource-rich African countries. The problems in Tanzania, however, are rooted in the existence of multiple types of "nuisance" taxes (a large number of minor taxes and licensing fees) and the complex design of taxes coupled with the cumbersome and bureaucratic tax administration. These problems have placed Tanzania in an unfavourable position from the viewpoint of mining investors.
Table 7.2 summarizes the different types of taxes that are applicable to the mining sector in selected African countries. Some special features that emerge from this comparison are as follows:
89
Botswana is distinguished in its aggressive change in corporate income tax rates; it has dramatically reduced the effective corporate tax rates from 35 percent to 25 percent for non-manufacturing industries and to as low as 15 percent for approved manufacturing industries. The corporate income tax rate in Zimbabwe for approved manufacturing industries is even lower (only 10 percent). Except for especially low rates of corporate income tax for approved manufacturing industries in Botswana and Zimbabwe, in general the statutory corporate and personal income tax rates in Tanzania are within the range of the respective taxes in other countries like Morocco, South Africa, Kenya, Malawi and Ghana. The fiscal depreciation allowance for the mining sector in Tanzania, Zimbabwe, and South Africa is relatively generous; all these countries allow for 100 percent depreciation allowance, while others seem to be more conservative. With the exception of Ghana, all countries allow corporate losses to be carried forward indefmitely. Only South Africa and Tanzania impose local corporate income taxes. All the countries of the region have a withholding tax on distribution of dividend as well as distribution of branch profits. Application of VAT on sales differs from country to country and there are no clear categories. All the countries of the region no longer tax exports. Only Tanzania applies a general stamp duty. In Zimbabwe, it is applied to transfer of mining locations while in Ghana it is applied to registration of documents only.

Table 7.2 Summary of Major Taxes in Selected African Countries - rypes - nwme M C S
Description
Corporate income tax
Depreciation allowance
Treatment of losses
Whh tax on tech. Selvice payment
Whh tax on dividend and dist. Of branch profits
Penonal income tax
NIA
- NIA
- NIA
- NIA
- Tax rates, payable 14%52%
Botswana
Reduced from zffective 35%. to 25% for "on- manufacmring, and 20% for manufachuing
Straight-line basis with rates ranging from 10% to 25%
Special unlimited loss carry-forward applied in mining
15% on a non- resident. This is final tax; "on- refundable
15% that can be used to offset the 10% additional company tax
Top rate 35% now reduced to 25%
Zimbabwe
CIT 40%, no tax holidavs. Reduced rate ui IU% for appmed manuiirtunng in expon processing zones No CIT for first 5 yean and thereafter 15%
Special for mining: 100% depreciation allowance
Indefinite loss-carry forward - special for minine. Far other
mining lease holders
20% but relief given far tax withheld at source. For special mining leases, all withholding taxes exempted
Tax rates, payable 20%- 45%
Kenya
Fmm July 1, 1998, top rates for individual and local companies reduced from 35% to 32.5%. For branches of "on- resident eo. rate reduced fram 42.5% to 40%
Different rates for different secton (see text for depreciation allowance applied to mining investments)
Loss eanied fonvard indefinitely
20% for non-residents
lo%, and 15% on interest
Top rate far 1998 incorr is 32.5% while 35% in 1997 income year
South Africa
CIT 35%. See text for gold mining and petroleum companies*
Mining capital expenditures allowed in the year it is incurred
"Assessed" loss carried fonvard indefinitely
12%
STC at 12.5% on "net amount" of excess of dividends
Top rate 45%
Uganda
CIT 30%. Branch profit tax of 35%
Special for mining sector: US of capital expendiNres allowed in first year of income and 1/10 of capital expenditures in the six fallowing yean Loss canied forward indefinitely
Top rate of 30%
Malawi
CIT 38%. Branch pmfif lax of 43%. But there are very few foreign branches in Malawi Special rate of 40% depreciation allowed far manufacturing industries
Loss carried forward indefinitely
Top rate of 38%
Ghana
35% except for petroleum companies. Additional profit tax applied to mining sector
Standard accounting is straight-line depreciation. See text for special depreciation treatment far mining sector
Loss earried fonvard for five years following the vear in which lasses incurred 15%
Top rate of 35%
30% Reduced in 1998 from 35%
100% depreciation for mining inveshnents
Loss carried forward indefinitely
3% of gross payment and 20% fo; exceeding management fees
Top rate of 35%, scheduled to reduce to 30%
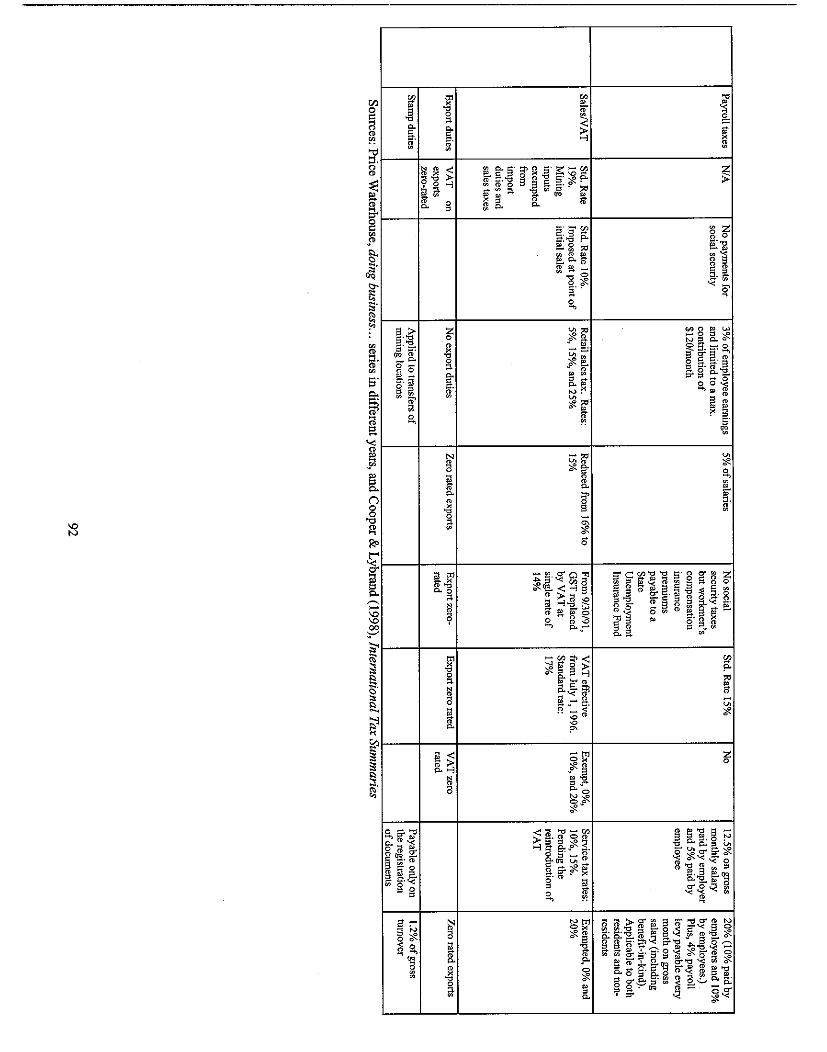

7.5 Problems of the fiscal regime and tax administration in Tanzania from the regional perspective
The regional comparison indicates that the major taxes and incentives applied to mining sector in Tanzania are comparable to, if not more generous than, other countries. However, "nuisance" taxes and the complex tax design and administration put miners and dealers in Tanzania at a disadvantage vis-his their counterparts in other countries of the region. Tanzania imposes multiple "nuisance" taxes like local income taxes and licensing fees payable to several authorities. Table 7.2 shows that among major African natural resource rich countries, only Tanzania and South Africa impose local income taxes. In addition, the local income taxes in Tanzania are complex, and local authorities in different regions may impose their own tax rates arbitrarily. For instance, Dar es Salaam imposes city service levy of 0.3% of turnover effective from January 1, 1997. Other regions in Tanzania also impose this type of tax though tax liability is lower. Also from January 1, 1997, individuals in Dar es Salaam are subject to a development levy of 1% of income. Multiple taxes are ultimately paid by mining companies and add to the total tax burden. Cumulatively, it becomes quite high and creates more uncertainty in the mining business. This does not include the compliance costs in terms of time and money spent on filing the variety of license applications and tax returns. These compliance costs prove to be especially high to small dealers and jewellers.
The more serious problem arises from the complex design of newly adopted value added tax (VAT), the cumbersome procedures, and the lack of experience of the TRA personnel in the administration of VAT. First, compared to other neighbouring countries, the VAT rate in Tanzania is relatively high (20 percent) compared to 15 percent in Kenya and 17 percent in Uganda. These differential VAT rates coupled with administrative complexities create a substantial burden on the mining industry. The output of the mining sector is exported and hence is subject to zero-rating; inputs should be either exempt from VAT or the VAT collected should be credited back in an efficient manner. However, as noted above, at present mining companies have to pay VAT on their inputs and file claim for refunds, which in many cases have been delayed for more than six months. The relatively high VAT rate in combination with the delay in VAT refunds unduly punishes the mining companies by pushing up their operating costs. Many other countries in the region, such as Morocco and CBte D'Ivoire, have substantially simplified their tax regime applied to the mining sector by exempting all duties and related sales taxes for the imports used for a registered mining investment. A policy of VAT exemption rather than VAT refund which is not working efficiently, would certainly make Tanzania more attractive and competitive in the region.
The above comparative study of tax regimes brings out the fact that tax incentives applicable to the mining sector in Tanzania are, in principle, relatively generous. These incentives, however, cannot be realized and investors are still disadvantaged vis-A-vis their competitors in other countries. Unless all nuisance taxes are eliminated, the tax regime is redesigned in a more efficient manner and the tax administration is considerably improved they will continue to be disadvantaged.
7.6 Conclusion and policy recommendations
7.6.1 General recommendations
In view of the enormous potential for growth in the mining sector in Tanzania, including the complete spectrum from large-scale organized mining with foreign investment to small spontaneous artisanal mining, the government has adopted a new policy and regulatory framework for the sector. It has come up with a new package of incentives aimed at simplifying the fiscal regime and attracting new investments. The choice of a moderate level of royalty and a reasonable rate of corporate income tax as the main fiscal instruments is a sensible choice for raising revenues at low-risk to the government. There are, however, a series of other side taxes and fees giving rise to additional burden that are quite onerous. Ofien, the burden of these taxes on the mining industry is comparable to that caused by the principal tax instruments for the sector. Thus the mining sector is subjected to a heavy taxation in spite of the professed policies of overall liberalization and a package of incentives. The main thrust of a fiscal reform, therefore, has to be on the elimination and rationalization of these other taxes.
Also, the mining sector has to bear a series of indirect or hidden operating costs such as fuel taxes that are quite huge. Clearly, some of these costs are specific to the mining sector but most of them are affecting the economic activities in general and are creating large-scale inefficiencies. These costs should be examined in detail and reduced to the extent possible.
The establishment of the Tanzania Revenue Authority (TRA) has been a step in the right direction for better administration of the tax system. This provides the tax administration an opportunity to make a break from the past practices and to do things differently. Two things emerge from this study. First, TRA needs to develop a better understanding of the mining sector so that it may successfully implement the government policies, most of which have been put in place after incorporating their input. Second, some of the past administrative practices still continue and these create hardships and increase the cost of compliance for the mining industry.
Generally there is an apprehension in most tax administrations that further simplification of the tax system and procedures may lead to loss in revenues. First, this is often ill founded. There is overwhelming evidence that just the opposite happensI5. These measures help the economic activity of a sector grow, which leads to more rather than less revenues. Second, the country gains in several other ways, such as more foreign exchange earnings. This helps to maintain a stable currency.
In a nutshell, what is required is a thorough assessment of the existing tax policy as applied to the mining sector rather than trying to fix it piece meal. Also, the current administrative practices in the TRA need to be examined closely and necessary changes need to be made forthwith. At this point, TRA has a fresh outlook and is open to innovative ideas. It is, however, burdened with a system of taxes that is inherently complex. It is more geared towards plugging any possible
l5 In several countries that have gone through the process of tax reform wherein tax policy has been rationalized, tax rates have been reduced and administrative practices have been simplified, tax revenues have either remained unaffected or have, in fact, gone up. See Burgess, R. and N. Stem "Taxation and Development", Journal of Economic Literature, Vol. XXXl (June 1993), (gp 796-818)
94

loopholes in the tax system than promoting economic growth and increasing government revenues. Many of the administrative practices are outdated, cause harassment to tax payers and increase the administrative and compliance costs of taxation. Without bringing in these fundamental reforms, it would be unrealistic to expect TRA to perform its dual tasks of enhancing tax revenues and at the same time create a healthy fiscal environment for businesses in Tanzania. The longer the current situation is allowed to continue, the more difficult it will become to implement any changes in the future.
7.6.2 Policy recommendations
As mentioned above, the present fiscal policy as applied to the mining sector is by and large quite positive. There are some areas, however, which the government and the TRA should re- examine in the context of the mining industry.
(a) Multiplicity of taxes and fees
In addition to the mainstream royalty and the corporate income tax, there is another set of taxes that not only creates a serious burden on the industry, but also adds considerably to the cost of compliance. These taxes need to be rationalized. Some of them may have to be dropped outright, while others would only need adjusting. It may be mentioned, however, that any changes that government decides to make should not be done piecemeal. It should be a part of an overall review of the tax system. Similarly, there are different kinds of fees and other levies that need to be analysed and suitably amended. Some specifics are described below.
(b) Employment related taxes and levies
There are three main taxes that fall into this category: house development levy, VETA (the levy for vocational training) and NSSF (the contribution to the National Social Security Fund). In terms of the compliance cost, the taxpayer unit has to file monthly returns and then an annual return for each tax. The housing scheme is not working, and is simply an additional source of revenue to the government. Both the vocational training and the housing scheme should be funded through government budget and market loans wherever feasible. These should not constitute an additional fiscal burden on the mining or any other industry. If the government faces revenue scarcity for these and other similar programs, it may be a better option to examine the whole fiscal system and to see how these various taxes, often referred to as "nuisance taxes", may be replaced by other stable sources of revenue. We did a simple sensitivity exercise, to see what degree of reduction in underground trade following these proposed changes in the fiscal system and the administrative practices, will generate the additional revenues that would compensate the loss in revenues from abolishing "nuisance" taxes. It turns out that a small reduction of 10-12% in the current level of underground trade will offset the foregone in revenues. If such activities go down further, the government will collect more revenues than the current level of revenue generation. The tax revenues collected centrally may then be passed on to the respective agencies on the basis of a pre-arranged formula. TRA is currently doing this with road tolls. This is by no means to suggest that royalty rates be increased in order to get rid of these taxes, it only suggests that other options that are less burdensome in terms of compliance should be explored.
95

(c) Royalty on sale of rough gemstone
There is no royalty on the export of finished gemstone (cut and polished) but a 3% royalty has to be paid on non-finished stones. This distinction has been, perhaps, maintained to encourage a domestic industry in finishing gemstones so that a greater value added may be captured at home rather than abroad. Other neighbouring countries, Kenya in particular, do not have any such royalties and taxes. This creates a strong incentive for driving the trade underground. The goal of encouraging the cutting and polishing work at home is certainly laudable, but the method used sends wrong signals to the industry. It may be better to abolish this distinction and take concrete steps to establish a finishing industry at home. This kind of industry may or may not finally flourish, but it is not advisable to push the entire trade in the wrong direction. This is particularly important because it affects the artisanal mining sector directly.
(d) Stamp duty
Stamp duty is another tax, which creates both a fiscal and administrative burden on the industry. It was pointed out to us that those units that get registered under VAT, would not be required to pay stamp duty. This is a welcome step. There may still be a problem for sales transactions between artisanal miners and brokers that may not be VAT-registered. It would be more appropriate if the requirement of stamp duty at the rate of 1.2% were done away with for sales as a matter of general policy. Most countries use stamp duty as a means of taxing transactions of immovable property, while sales receipts require no stamp or stamps of nominal value. A comparison of taxes in African countries also indicates that few other countries in the region are using stamp duty as a means of raising revenues from the mining sector.
(e) Rationalizing taxation at the local levels
Local governments, often impose their own local incometaxes on licensed dealers in combination with local business license fees. Local governments must get their fair share of revenues from the industry, since they are the ones that are expected to provide vital local services, and they have a better knowledge of mining activities in their jurisdiction. Presently, however, there is too much arbitrariness in the system. There should be well-defined norms for the level of business fees imposed by the local governments. It is not realistic to expect local governments to have the capacity to impose taxes locally. It may be better for the central government to offer clear guidelines for licensing at the local level, collect all income taxes centrally and then have a revenue sharing arrangement or a system of devolution for revenues to be transferred to local governments.
(0 Fringe Benefit Tax
Currently, fringe benefits are combined with the employee's salary to form the tax base for personal income tax. Thus, total taxable income is the sum of both official salary and fringe benefits. If the benefits are in kind, the market value of these benefits are to be estimated by either employer or assessed by TRA. Both the employer and the employees are liable to be

penalized for not reporting fringe benefits. Presently, TRA makes random checks of company accounts and benefits to employees, for a cross check. In practice, this tax becomes quite arbitrary and is often a source of harassment. It may be more efficient and less cumbersome if the tax were completely shifted to the employers based on the company accounts.
7.6.3 Administrative recommendations
Administrative problems are more crucial to the mining industry than issues of policy. Before going into specific taxes, there are two points to be made. First, the MEM has been trying to coordinate a closer interaction between the industrv and the TRA. As this vrocess makes . headway, the tax administration will develop a better understanding of the special nature of the industry and administrative problems will diminish. Second, as the role of TRA is crucial in economic liberalization in general and implementing fiscal policies, it may be worthwhile to invest in capacity building in the department through a well-planned training program. The senior management level in TRA is aware of this need.
(a) Corporate Income Tax
The provisions of self-assessment in the law should be implemented as soon as possible. According to the current practice, the system translates into 100% audit of brokers and dealers of gemstones. This practice should be changed. Notices issued to taxpayers should be specific and precise.
The current practice of 100% audit is not only a burden to the taxpayers but it is also a problem for the tax administration. First the tax department is overworked and instead of concentrating on sectors and firms where real potential for revenue lies, the department is forced to spread its resources rather thinly. Second, this gives rise to opportunities for corrupt practices and wrong incentives both to businesses and the tax administration.
If a taxpayer is issued a notice, (s) he should be given a reasonable time to comply with it. Presently the process is very hurried and may sometimes lead to undue hardship for the taxpayers.
For implementing the self-assessment system, a sound audit and appeals system should be the main instrument. The audit should be selective and effective. Given the current state of record keeping in Tanzania, this will mean that while major corporations will undergo audits occasionally, smaller businesses and dealers will have to improve their accounting practices. At the same time, a chain of authorized auditors and accountants should develop so that balance sheets and profit loss accounts authenticated by them are generally accepted by the tax administration.
The move towards self-assessment should be accelerated through a sustained campaign of taxpayer education. Also, the laws applicable to any one sector are scattered in different statutes and there is a need to consolidate them for the convenience of taxpayers.

(vi) The income tax act is difficult to understand and needs to be re-written.
(vii) For the gemstone industry, a system to determine indicative prices should be established in consultation with the industry.
(viii) If there is an excess payment at the end of the year, the taxpayer should have the option of getting a refund or adjusting it against tax liability in the following year.
@) Value Added Tax (VAT)
(i) The process for getting VAT exemption for imported and domestically purchased inputs should be streamlined. Currently, it is very complex with too many agencies involved. An agreed list of items between the mining industry and the TRA would be the best solution to this problem.
(ii) Another problem is that of delayed refunds. It is a serious matter because it ties up huge sums of money with the tax department and unnecessarily increases the cost of doing business in the industry. There should be a reasonable time limit set for refunds failing which the taxpayer should be entitled to interest payment from the government.
(iii) The problem of a VAT refund is quite similar to that of duty drawback. In many developing countries, a system of duty drawback exists in principle and it has all the right kind of provisions. The system, however, has not worked in practice. The issue of a VAT refund in Tanzania is likely to meet the same fate. Rather than waiting for years to see what happens, during which period both the mining sector and the tax administration will be forced to waste precious time and resources, it would be better to adopt pragmatic measures early on by switching to a system of blanket exemption under VAT for the mining sector.
c) Import Tariff
The import duty has been considerably simplified. However, like the VAT on inputs, the exemption from import duties is not automatic and has to be claimed for every transaction. Again, an agreed list should be drawn between the mining industry and the tax department in order to further simplify the process.
(d) Employment related taxes
Miners and employers are expected to deduct income taxes from employees under a PAYE system. The paper work required for compliance needs to be simplified.

8. ECONOMIC ANALYSIS
The portrait of the marketing chain that emerged from this study raises several types of economic questions. First, the question we started with from the Ministry: What proportion of the goods is being smuggled? Second, a related question: What is the total value of the trade? Third, a more complex one: What revenue is lost to the government from smuggling? What value added is lost from Tanzanian GDP due to smuggling? Newspapers regularly report foregone revenue from smuggling as if it were a simple matter of multiplying the value of the goods smuggled times the taxes they would have paid in Tanzania. The reality is more complex, because taxes, assessed and applied wrongly, can diminish exports or kill a sector entirely. The more subtle questions of the impact of taxation and smuggling were therefore the subject of a special study, which is integrated here above as chapter 7. It shows that a simpler tax regime will produce as much or more revenue for the government by attracting trade, keeping capital in circulation in the sector and thus favouring growth.
Finally there are income and equity questions raised by this sector. How many jobs have been generated, and are they "good jobs"? Is the employment generation sustainable, or a flash in the pan? Is there a career path for mine workers, or is it dead-end manual labour? To what extent does the income generated go into long-term investment? In chapter 9 the team makes recommendations for a stratem to maximize benefits and minimize the costs of artisanal mining -. - for each stakeholder group: government, mineworkers, mine claim-holders, dealers and communities.
The econometric methods applied here are discussed first. Readers interested in the results of the analysis, and having limited enthusiasm for econometrics may skip directly to section 8.1.2. Results.
8.1 Macroeconomic analysis
8.1.1 Methods Used
To estimate the importance of the trade in the Tanzanian economy, we looked at all three ways of evaluating the contribution of sector as a component in gross domestic product (GDP). GDP can be calculated as follows:
as the value of final goods and services produced in the economy during a given time period, or as the sum of value-added in the economy during a given period (where value-added by a particular firm is equal to the value of revenue from sales minus the cost of intermediate goods), or as the sum of all incomes in the economy during a given period (usually wage income, profits and direct and indirect taxes).
In theory, all three methods should give the same answer. The price paid for final goods is income to others in the economy and so whether we look at the revenue side of the equation or the income side, we should get the same answer. The value-added approach to calculating GDP
99
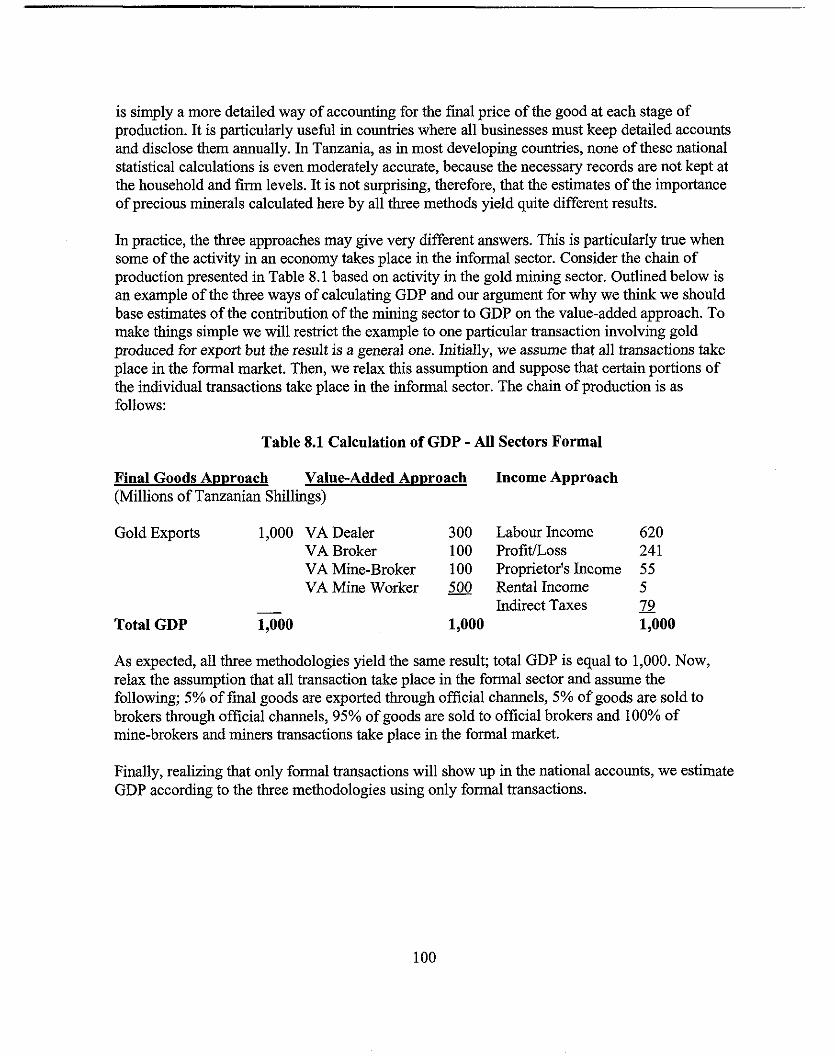
is simply a more detailed way of accounting for the final price of the good at each stage of production. It is particularly useful in countries where all businesses must keep detailed accounts and disclose them annually. In Tanzania, as in most developing countries, none of these national statistical calculations is even moderately accurate, because the necessary records are not kept at the household and firm levels. It is not surprising, therefore, that the estimates of the importance of precious minerals calculated here by all three methods yield quite different results.
In practice, the three approaches may give very different answers. This is particularly true when some of the activity in an economy takes place in the informal sector. Consider the chain of production presented in Table 8.1 based on activity in the gold mining sector. Outlined below is an example of the three ways of calculating GDP and our argument for why we think we should base estimates of the contribution of the mining sector to GDP on the value-added approach. To make things simple we will restrict the example to one particular transaction involving gold produced for export but the result is a general one. Initially, we assume that all transactions take place in the formal market. Then, we relax this assumption and suppose that certain portions of the individual transactions take place in the informal sector. The chain of production is as follows:
Table 8.1 Calculation of GDP - All Sectors Formal
Final Goods Approach Value-Added Approach Income Approach (Millions of Tanzanian Shillings)
Gold Exports 1,000 VA Dealer 300 Labour Income 620 VA Broker 100 Profit/Loss 241 VA Mine-Broker 100 Proprietor's Income 55 VA Mine Worker 500 Rental Income 5
- Indirect Taxes - 79 Total GDP 1,000 1,000 1,000
As expected, all three methodologies yield the same result; total GDP is equal to 1,000. Now, relax the assumption that all transaction take place in the formal sector and assume the following; 5% of final goods are exported through official channels, 5% of goods are sold to brokers through official channels, 95% of goods are sold to official brokers and 100% of mine-brokers and miners transactions take place in the formal market.
Finally, realizing that only formal transactions will show up in the national accounts, we estimate GDP according to the three methodologies using only formal transactions.
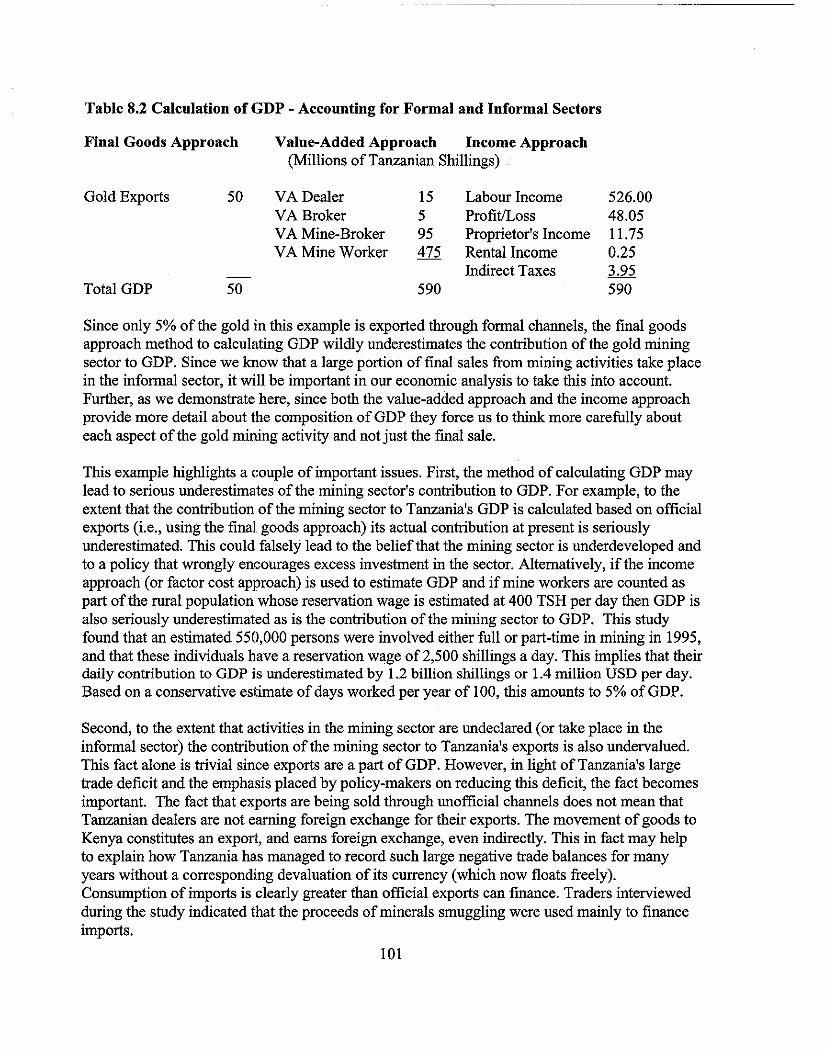
Table 8.2 Calculation of GDP - Accounting for Formal and Informal Sectors
final Goods Approach Value-Added Approach Income Approach (Millions of Tanzanian Shillings)
Gold Exports 50 VA Dealer 15 Labour Income 526.00 VA Broker 5 ProfitLoss 48.05 VA Mine-Broker 95 Proprietor's Income 1 1.75 VA Mine Worker 475 Rental Income 0.25
Indirect Taxes 3.95 - Total GDP 50 590 590
Since only 5% of the gold in this example is exported through formal channels, the final goods approach method to calculating GDP wildly underestimates the contribution of the gold mining sector to GDP. Since we know that a large portion of final sales from mining activities take place in the informal sector, it will be important in our economic analysis to take this into account. Further, as we demonstrate here, since both the value-added approach and the income approach provide more detail about the composition of GDP they force us to think more carefully about each aspect of the gold mining activity and not just the final sale.
This example highlights a couple of important issues. First, the method of calculating GDP may lead to serious underestimates of the mining sector's contribution to GDP. For example, to the extent that the contribution of the mining sector to Tanzania's GDP is calculated based on official exports (i.e., using the final. goods approach) its actual contribution at present is seriously underestimated. This could falsely lead to the belief that the mining sector is underdeveloped and to a policy that wrongly encourages excess investment in the sector. Alternatively, if the income approach (or factor cost approach) is used to estimate GDP and if mine workers are counted as part of the rural population whose reservation wage is estimated at 400 TSH per day then GDP is also seriously underestimated as is the contribution of the mining sector to GDP. This study found that an estimated 550,000 persons were involved either full or part-time in mining in 1995, and that these individuals have a reservation wage of 2,500 shillings a day. This implies that their daily contribution to GDP is underestimated by 1.2 billion shillings or 1.4 million USD per day. Based on a conservative estimate of days worked per year of 100, this amounts to 5% of GDP.
Second, to the extent that activities in the mining sector are undeclared (or take place in the informal sector) the contribution of the mining sector to Tanzania's exports is also undervalued. This fact alone is trivial since exports are a part of GDP. However, in light of Tanzania's large trade deficit and the emphasis placed by policy-makers on reducing this deficit, the fact becomes important. The fact that exports are being sold through unofficial channels does not mean that Tanzanian dealers are not earning foreign exchange for their exports. The movement of goods to Kenya constitutes an export, and earns foreign exchange, even indirectly. This in fact may help to explain how Tanzania has managed to record such large negative trade balances for many years without a corresponding devaluation of its currency (which now floats freely). Consumption of imports is clearly greater than official exports can finance. Traders interviewed during the study indicated that the proceeds of minerals smuggling were used mainly to finance imports.
101
These are important issues because in order to determine the best policy vis-a-vis the mining sector, it is important to have a fairly clear idea of the way in which it benefits the economy. For example, suppose the government wants to raise tax revenue from the mining sector of the economy. Based on the figures in Table 8.2, a 1% tax on the value of final exports (remember the government can only tax those exports that go through the formal market) would yield .5 million shillings in tax revenue. A value-added tax of 1% would yield 5.9 million shillings in total revenues. Or, viewed in another way, a value-added tax of only .08 percent would yield exactly the same tax revenue as a 1% tax on gold exports.
Because the way in which GDP is calculated is so important for accurate policy analysis, we will, where possible, use all three methods of calculating GDP approach, the value added approach and income approach to estimate the mining sector's actual and potential contribution to GDP. Since the type of data we have been able to collect for this project so far lends itself most readily to an accurate estimation of GDP based on the value-added approach, our primarylinitial method of estimating GDP is based on the value-added approach. However, in attempting to estimate spillover benefits from mining activities, we will use the income approach.
Estimates of the contribution of the mining sector to GDP are based on the following formulas:
Tanzanian Miner: (1) VATanzania, mined = Pm * QTanzania, mined
Tanzanian Mine-Broker: (2) VATanzania, mine-broker = (Pmb -Pm )* QTanzania, mine-broker
Kenyan Mine-Broker: (3) VAKenya, mine-broker = (Pmb-Pm)*QKenya, mine-broker
Tanzanian Broker: (4) VATanzania, broker = (Pb-Pmb)*QTanzania, mine-broker
Kenyan Broker: (5) VAKenya, broker = (Pb-Pmb)* QKenya, mine-broker
Tanzanian Dealer : (6) VATanzania, dealer = (Px-Pb)*QTanzania, mine- broker
Kenyan Dealer: (7) VAKenya, dealer = (Px-Pb)*QKenya, mine-broker
Total Value-Added = (I)+ (2)+ (3)+ (4)+ (5)+ (6)+ (7) = (( VAi k = (( Q I k [ Pk - Pk-1]
Where, i stands for the country of transaction and k stands for the point of transaction. Hence, total value-added to the Tanzanian economy is equal to the sum of (I), (2), (4) and (6) and total value-added to the Kenyan economy is equal to the sum of (3), (5) and (7).
Note also, because of the equivalence of the final goods approach and the value-added approach to estimating GDP, total value-added to the Tanzanian economy is exactly equal to the true contribution of the mining sector to Tanzanian exports and hence its overall trade balance. By this same logic, total value-added to the Kenyan economy is precisely equal to lost foreign
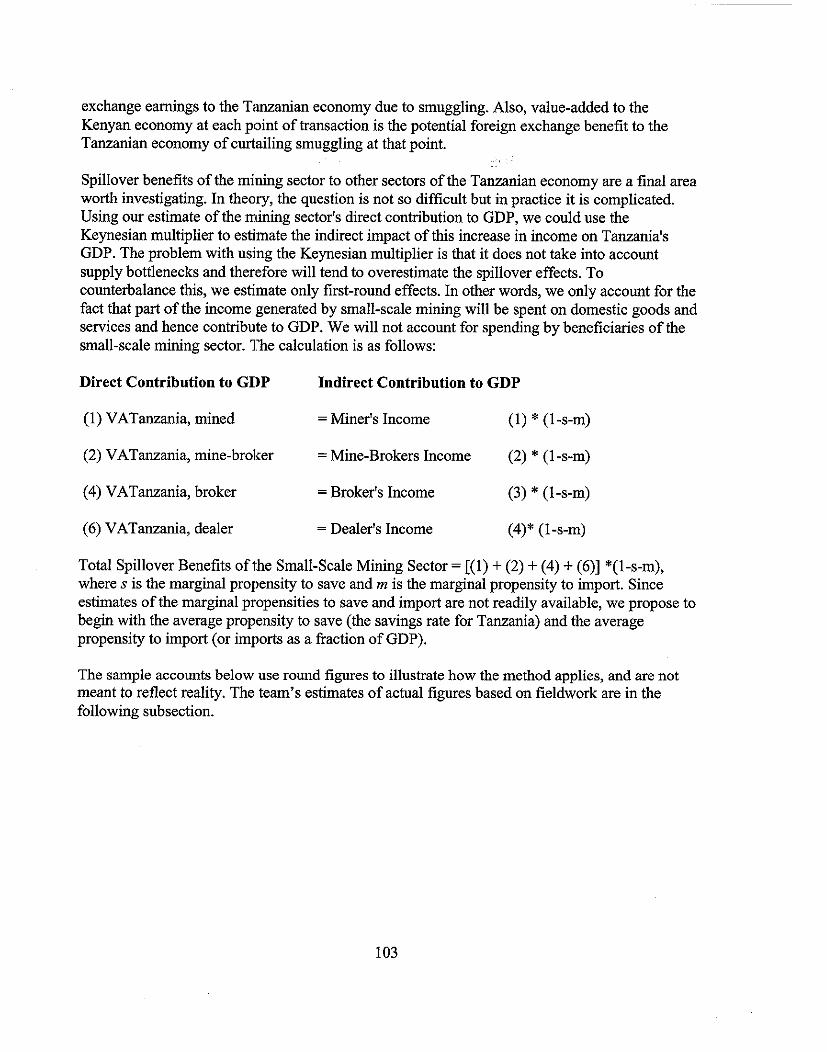
exchange earnings to the Tanzanian economy due to smuggling. Also, value-added to the Kenyan economy at each point of transaction is the potential foreign exchange benefit to the Tanzanian economy of curtailing smuggling at that point.
Spillover benefits of the mining sector to other sectors of the Tanzanian economy are a final area worth investigating. In theory, the question is not so difficult but in practice it is complicated. Using our estimate of the mining sector's direct contribution to GDP, we could use the Keynesian multiplier to estimate the indirect impact of this increase in income on Tanzania's GDP. The problem with using the Keynesian multiplier is that it does not take into account supply bottlenecks and therefore will tend to overestimate the spillover effects. To counterbalance this, we estimate only first-round effects. In other words, we only account for the fact that part of the income generated by small-scale mining will be spent on domestic goods and services and hence contribute to GDP. We will not account for spending by beneficiaries of the small-scale mining sector. The calculation is as follows:
Direct Contribution to GDP Indirect Contribution to GDP
(1) VATanzania, mined = Miner's Income (1) * (1-s-m)
(2) VATanzania, mine-broker = Mine-Brokers Income (2) * (1 -s-m)
(4) VATanzania, broker = Broker's Income (3) * (I-s-m)
(6) VATanzania, dealer = Dealer's Income (4)* (1-s-m)
Total Spillover Benefits of the Small-Scale Mining Sector = [(I) + (2) + (4) + (6)] *(l-s-m), where s is the marginal propensity to save and rn is the marginal propensity to import. Since estimates of the marginal propensities to save and import are not readily available, we propose to begin with the average propensity to save (the savings rate for Tanzania) and the average propensity to import (or imports as a fraction of GDP).
The sample accounts below use round figures to illustrate how the method applies, and are not meant to reflect reality. The team's estimates of actual figures based on fieldwork are in the following subsection.

Table 8.3 Marketing Activities in the Gold Mining Sector (All sectors formal)
DealeriExporter Revenues from sales to Exporter Operating Expenses
Labour Telecommunications Travel & lodging Office premises & supplies Entertainment
Gold Purchase Tax (@ 35% on profits) Profit/Loss
Broker Revenues from sales to Dealer Expenses
Labour Travel & Lodging Gold Purchase
ProfitLoss
Mine-Broker Revenues from sales to Broker Expenses
Labour Travel & Lodging Gold Purchase
Profrtnoss
Mine Worker Revenues from sales to Mine-Broker Expenses
Reservation Wage Travel & Lodging
Profit/Loss
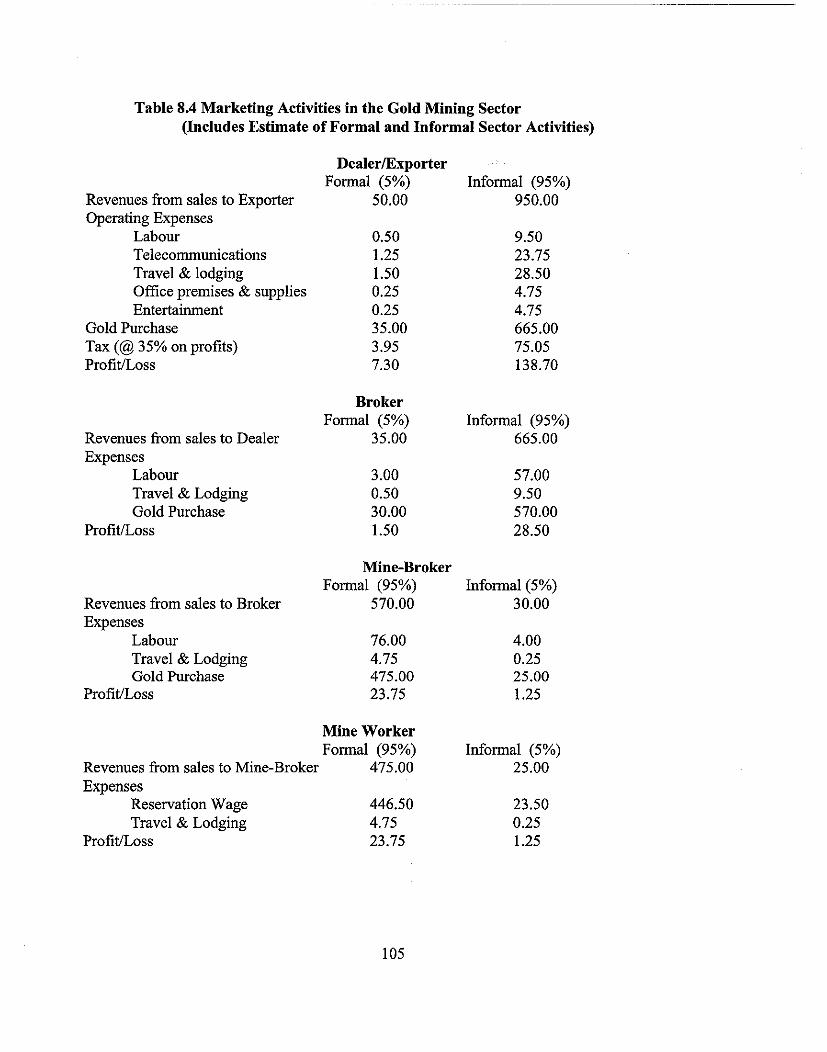
Table 8.4 Marketing Activities in the Gold Mining Sector (Includes Estimate of Formal and Informal Sector Activities)
Revenues from sales to Exporter Operating Expenses
Labour Telecommunications Travel & lodging Office premises & supplies Entertainment
Gold Purchase Tax (@ 35% on profits) ProfitLoss
Dealer/Exporter Formal (5%)
50.00 Informal (95%)
950.00
9.50 23.75 28.50 4.75 4.75 665.00 75.05 138.70
Broker Formal (5%) Informal (95%)
Revenues from sales to Dealer 35.00 665.00 Expenses
Labour 3.00 57.00 Travel & Lodging 0.50 9.50 Gold Purchase 30.00 570.00
ProfWLoss 1.50 28.50
Mine-Broker Formal (95%) Informal (5%)
Revenues from sales to Broker 570.00 30.00 Expenses
Labour 76.00 4.00 Travel & Lodging 4.75 0.25 Gold Purchase 475.00 25.00
Profit/Loss 23.75 1.25
Mine Worker Formal (95%) Informal (5%)
Revenues from sales to Mine-Broker 475.00 25.00 Expenses
Reservation Wage 446.50 23.50 Travel & Lodging 4.75 0.25
Profit/Loss 23.75 1.25

8.1.2 Macroeconomic Results
The preliminary estimates of the value of precious minerals production and trading from artisanal mining show that Tanzania's macroeconomic picture has been distorted by lack of statistics on this trade. Several macroeconomic indicators have been undervalued in official statistics, namely exports, foreign exchange earnings, GDP and middle-income employment. The real economic picture in Tanzania is considerably healthier than the official one, largely due to this invisible trade.
Final goods method based on mining production and exports
Official production statistics show rapid but erratic growth in the last decade. They need to be analysed together with export figures, as the production figures are estimated mainly from export activity. In fact, nearly all gold, saleable diamonds and coloured gems are exported, but the figures for officially declared exports capture only a small portion of the actual exports.
EXPORTS TOTAL PREClOUS 116,150,590 137,182,630 114,890,040 125,621,771 125,576,561 121,936,978 162,644,210
MINERALS PORTS 1 Source: Ministry of Energy and Minerals. Some figures inferred from values, or projected.
Exports of each of the precious commodities have fluctuated substantially, in response to both policies and shocks experienced. The overall picture of production in the mining shows sharp growth from 1989 through 1996, mainly in the artisanal sector. This is the period when mining
lo6

was liberalized and mining rushes developed in many parts of the country. The old rules were out, but new ones were not yet clearly established, so the new freedom tended to be a bit anarchic. After a four-month hiatus in which all legal trading was suspended, from late 1995 through April 1996, new regulations for licensing dealers and brokers were put in place. Since 1996, fieldwork shows that gem mining and trading in the southern zone have declined sharply. Nevertheless, official exports, after a dip in 1997, have resumed their climb. According to the testimony of those in the sector, this is because a more stable set of licensing regulations, and in particular, abolition of the export tax on gemstones in 1997 encouraged more goods to move through legal channels. Statistics on the number of active dealers, and the number who did a substantial business also showed steady growth. The number of licensed gemstone dealers increased from 85 in 1996 to 130 in 1999, and the number doing substantial business (over US$100,000/yr in exports) increased from six to eighteen.
Official gold exports expanded rapidly during the period when the Bank of Tanzania was purchasing it at world market prices, then dropped off sharply after purchases stopped. In the last six months of 1996, there were no official gold exports through Tanzania. After some disputes over tax assessment and collection methods were resolved, licensed gold dealers began exporting again in 1997. Also in 1997 a new buying scheme, a joint venture between a South African company, Executive Outcomes, and the Tanzanian military, began providing artisanal miners with mining equipment on credit and buying their gold. The result was again a sharp increase in Tanzanian gold exports. Meremeta buyers attracted to Tanzania not only a majority of the Tanzanian production, but also some coming across Lake Tanganyika from the Democratic Republic of Congo. Then in late 1998, the first large formal mine, Golden Pride in Nzega, came into production. Formal mining operates on a scale vastly more intensive than artisanal mining. Overburden and ore are hauled out by 100 T trucks, operating 24 hours a day, in contrast to the picks, shovels and buckets used by artisanals. Large mining is capital intensive. It produces minerals much more efficiently, and exploits deposits too much greater depths than artisanal mining can safely do. Artisanal mining, on the other hand, is labour intensive. It provides far more jobs than formal mining, and injects more dispersed capital into rural areas. The incomes are lower and the work harder, but benefits are far more widely dispersed.
Diamond sales fluctuated sharply and shifted between rough, cut and contract sales over the last decade. Formal mine production varied in the mid-1990s as Williamson Diamond Mine was re- privatised, after many years of parastatal status. The new management undertook a major investment and modernizalion of production that is expected to increase output for the next decade or more. Licensed diamond dealers did a fairly substantial legal trade in 1996, but then appear to have been driven again into the parallel market.
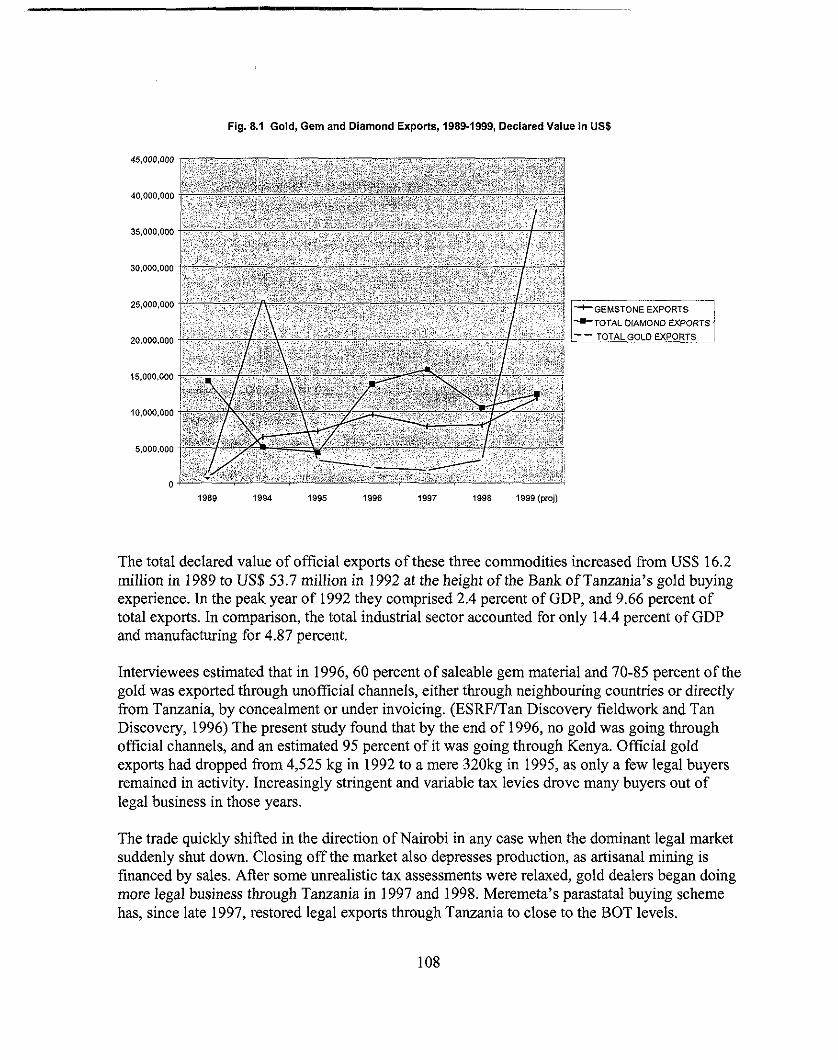
Fig. 8.1 Gold, Gem and Diamond Exports, 19894999, Declared Value in US$
+GEMSTONE EXPORTS 'TOTAL DIAMOND EXPORTS
1 I-- TOTALGOLD EXPORTS
The total declared value of official exports of these three commodities increased from US$ 16.2 million in 1989 to US$53.7 million in 1992 at the height of the Bank of Tanzania's gold buying experience. In the peak year of 1992 they comprised 2.4 percent of GDP, and 9.66 percent of total exports. In comparison, the total industrial sector accounted for only 14.4 percent of GDP and manufacturing for 4.87 percent.
Inte~iewees estimated that in 1996,60 percent of saleable gem material and 70-85 percent of the gold was exported through unofficial channels, either through neighbouring countries or directly from Tanzania, by concealment or under invoicing. (ESRFITan Discovery fieldwork and Tan Discovery, 1996) The present study found that by the end of 1996, no gold was going through official channels, and an estimated 95 percent of it was going through Kenya. Official gold exports had dropped from 4,525 kg in 1992 to a mere 320kg in 1995, as only a few legal buyers remained in activity. Increasingly stringent and variable tax levies drove many buyers out of legal business in those years.
The trade quickly shifted in the direction of Nairobi in any case when the dominant legal market suddenly shut down. Closing off the market also depresses production, as artisanal mining is financed by sales. Afier some unrealistic tax assessments were relaxed, gold dealers began doing more legal business through Tanzania in 1997 and 1998. Meremeta's parastatal buying scheme has, since late 1997, restored legal exports through Tanzania to close to the BOT levels.
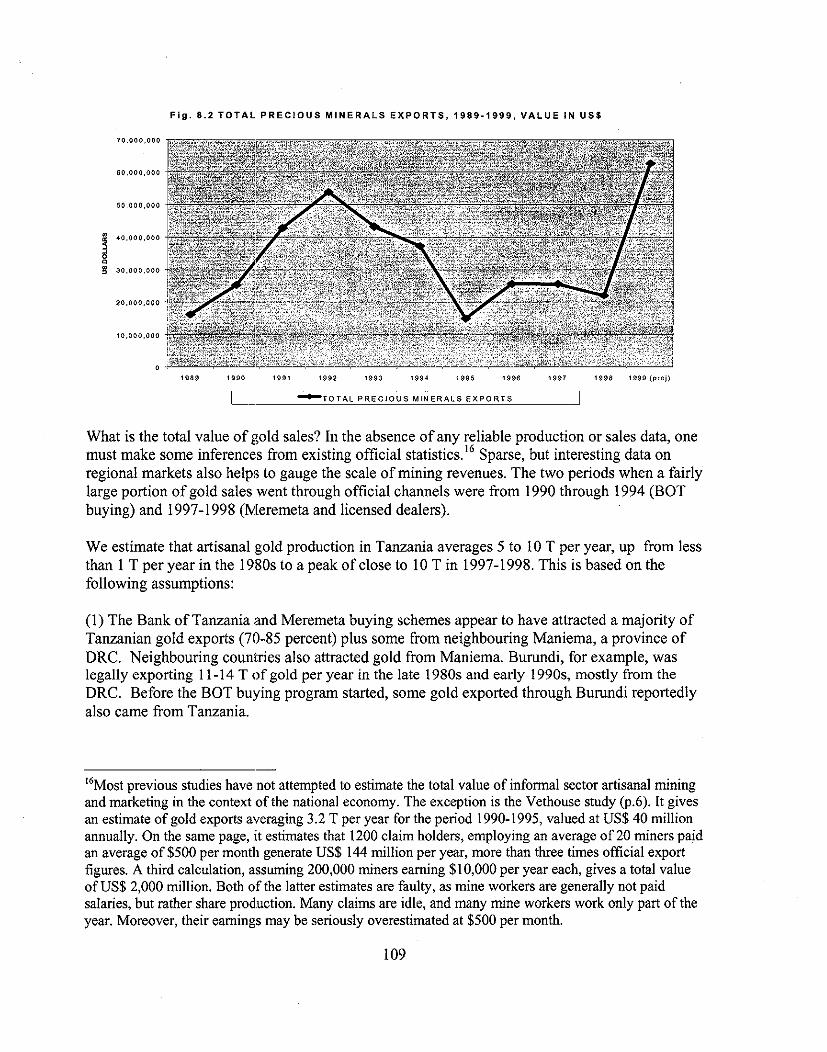
Fig. 8.2 T O T A L P R E C l O U S M I N E R A L S E X P O R T S , 1 9 8 9 - 1 9 9 9 , V A L U E I N U S $
What is the total value of gold sales? In the absence of any reliable production or sales data, one must make some inferences from existing official statistics.16 Sparse, but interesting data on regional markets also helps to gauge the scale of mining revenues. The two periods when a fairly large portion of gold sales went through official channels were from 1990 through 1994 (BOT buying) and 1997-1998 (Meremeta and licensed dealers).
We estimate that artisanal gold production in Tanzania averages 5 to 10 T per year, up from less than 1 T per year in the 1980s to a peak of close to 10 T in 1997-1998. This is based on the following assumptions:
(1) The Bank of Tanzania and Meremeta buying schemes appear to have attracted a majority of Tanzanian gold exports (70-85 percent) plus some from neighbouring Maniema, a province of DRC. Neighbowing countries also attracted gold from Maniema. Burundi, for example, was legally exporting 1 1-14 T of gold per year in the late 1980s and early 1990s, mostly from the DRC. Before the BOT buying program started, some gold exported through Burundi reportedly also came from Tanzania.
I6Most previous studies have not attempted to estimate the total value of informal sector artisanal mining and marketing in the context of the national economy. The exception is the Vethouse study (p.6). It gives an estimate of gold exports averaging 3.2 T per year for the period 1990-1995, valued at US$40 million annually. On the same page, it estimates that 1200 claim holders, employing an average of 20 miners paid an average of $500 per month generate US$ 144 million per year, more than three times official export figures. A third calculation, assuming 200,000 miners earning $10,000 per year each, gives a total value of US$ 2,000 million. Both of the latter estimates are faulty, as mine workers are generally not paid salaries, but rather share production. Many claims are idle, and many mine workers work only part of the year. Moreover, their earnings may be seriously overestimated at $500 per month.
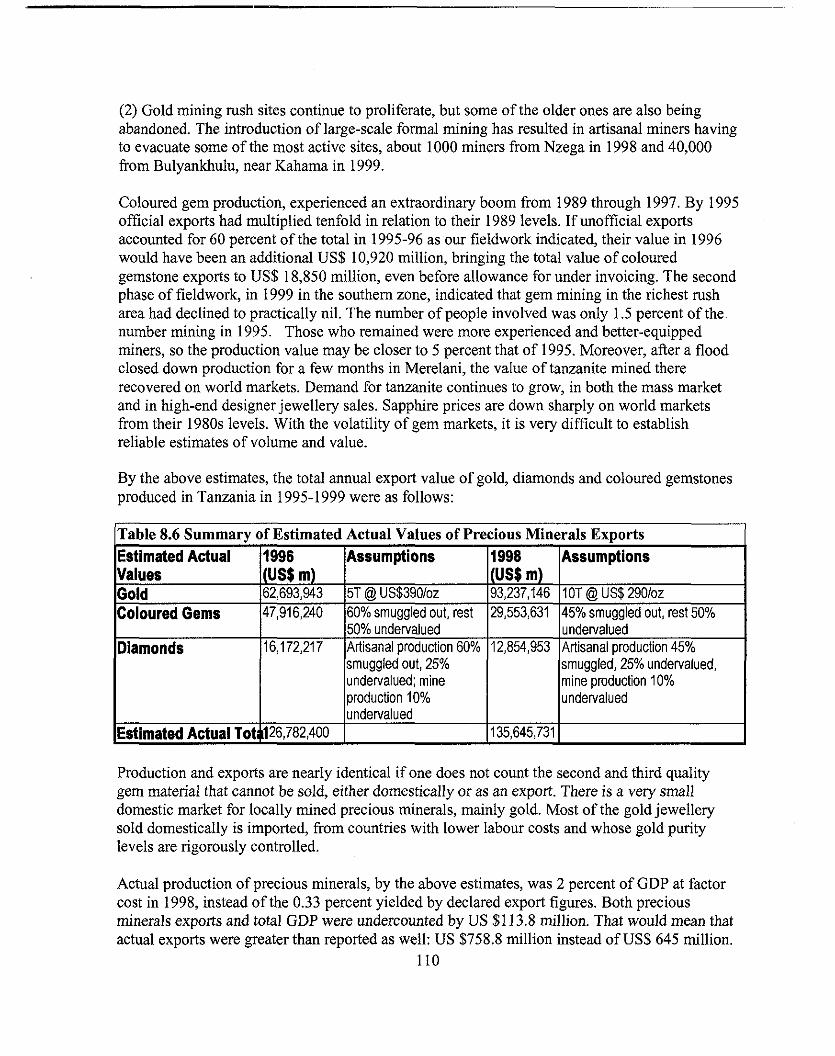
(2) Gold mining rush sites continue to proliferate, but some of the older ones are also being abandoned. The introduction of large-scale formal mining has resulted in artisanal miners having to evacuate some of the most active sites, about 1000 miners from Nzega in 1998 and 40,000 from Bulyankhulu, near Kahama in 1999.
Coloured gem production, experienced an extraordinary boom from 1989 through 1997. By 1995 official exports had multiplied tenfold in relation to their 1989 levels. If unofficial exports accounted for 60 percent of the total in 1995-96 as our fieldwork indicated, their value in 1996 would have been an additional US$ 10,920 million, bringing the total value of coloured gemstone exports to US$ 18,850 million, even before allowance for under invoicing. The second phase of fieldwork, in 1999 in the southern zone, indicated that gem mining in the richest rush area had declined to practically nil. The number of people involved was only 1.5 percent of the number mining in 1995. Those who remained were more experienced and better-equipped miners, so the production value may be closer to 5 percent that of 1995. Moreover, after a flood closed down production for a few months in Merelani, the value of tanzanite mined there recovered on world markets. Demand for tanzanite continues to grow, in both the mass market and in high-end designer jewellery sales. Sapphire prices are down sharply on world markets from their 1980s levels. With the volatility of gem markets, it is very difficult to establish reliable estimates of volume and value.
By the above estimates, the total annual export value of gold, diamonds and coloured gemstones produced in Tanzania in 1995-1999 were as follows:
Table 8.6 Summary of Estimated Actual Values of Precious Minerals Exports Estimated Actual 11996 l~ssumptions 11998 1 Assum~tions Values Gold Coloured Gems
lundervalued Estimated Actual ~ot&6,782,400 I 1135,645,731 1
Diamonds
Production and exports are nearly identical if one does not count the second and third quality gem material that cannot be sold, either domestically or as an export. There is a very small domestic market for locally mined precious minerals, mainly gold. Most of the gold jewellery sold domestically is imported, from countries with lower labour costs and whose gold purity levels are rigorously controlled.
(US$ m) 62,693,943 47,916,240
Actual production of precious minerals, by the above estimates, was 2 percent of GDP at factor cost in 1998, instead of the 0.33 percent yielded by declared export figures. Both precious minerals exports and total GDP were undercounted by US $1 13.8 million. That would mean that actual exports were greater than reported as well: US $758.8 million instead of US$ 645 million.
110
16,172,217
5T @ US$390/oz 60% smuggled out, rest 50% undervalued Artisanal production 60% smuggled out, 25% undervalued; mine production 10%
(US$ m) 93,237,146 29,553,631
1OT @ US$29010z 45% smuggled out, rest 50%
12,854,953 undervalued Artisanal production 45% smuggled, 25% undervalued, mine production 10% undervalued
It would also mean that precious minerals were Tanzania's largest export, accounting for 18 percent of total exports. The next largest export, coffee, accounted for 15 percent, cotton for 12 percent, and manufactures for 9 percent. Similarly precious minerals apparently were the largest source of foreign exchange. This helps to explain how Tanzania could have financed a current account deficit that appears in official statistics as US$1,102 million in 1998. Official statistics have shown such substantial current account deficits for decades that one would expect Tanzania to have experienced hyperinflation and rapid currency devaluation. These invisible exports go a long way to explaining why the real economy is healthier than the official statistics would suggest.
Value-added from1 mine to market trade: Impact of smuggling
One of the goals of the fieldwork for this study was to understand the economic, policy and geographic factors operating at each level in the marketing chain. In this section we use the value-added approach to evaluate the contribution of minerals trading and the effect of smuggling at different levels in the chain to GDP. Total value-added from each firm and organization in the Tanzanian economy equals GDP at factor cost and current prices, US $3.602 billion in 1995. Official minerals exports comprised just 0.4 percent of that, but estimated actual minerals exports at $93.06 million were in US dollars that came to $3,786.77 million, of which minerals exports comprised 1.7 percent (low estimate above) to 7.3 percent (high estimate above).
The valued-added approach to calculating GDP gives a more precise picture of the effects of smuggling, as a certain portion of each type of mineral is diverted at several different levels in the marketing chain. Analysis of price mark-ups at each stage in the marketing chain shows what proportion of the added value is generated at each level. Prices of gemstones from a Northern Tanzanian mine, for example, averaged 8-28 percent of the dealers' purchase prices in Arusha and Nairobi in 1996. This means that, from mine to export level, 72-92 percent of the value added contributed to GDP was generated by trading. In gold the margin was smaller, with the mine price equivalent to US$9.17 per gram being 83.36 percent of the sale price of US $1 1 per gram (as of late 1996 in Nairobi). Only 16.64 percent of value-added was generated by trading between the mine and the export market. The mine price reflects the reserve value of gold as a commodity plus the value-added contributed by mining and initial purification.

Table 8.7 Value-Added in the Gold Marketing Chain, Tanzania and Kenya
Figure 8.3 Regional Value Added from Artisanal Gold 77 Percent of Total Stays inTanzania despite 95 percent Kenyan Exports
Trading margins tend to be higher and markets more volatile for gems than for gold because of the relative difficulty of valuing gems, which makes it a high-risk trade. There is also more volatility in new mining areas and with new commodities than with established gem markets. Some extraordinary margins were recorded in 1995 and 1996 for the highest value stones from Tunduru area. This is typical of new markets where market information is poor, but the situation cannot be expected to last long. Gradually miners, brokers and dealers all have a better idea of the value of their holdings and margins tend to become smaller and more predictable.
World coloured stone markets are also subject to volatile price swings, particularly since mining monopolies have been abandoned throughout the world in the last decade. Stones go in and out of fashion. Those that command a high price one year send miners searching to exploit new
112

deposits (and return to old ones) flooding the market with new production. This happened with sapphire in recent years. First Thai production boomed, creating a mass market for what had been a luxury stone. Then, with the help of Thai dealers, new mines were identified and exploited in Africa (Tanzania, Madagascar and ten other countries) and Southeast Asia (Vietnam, Cambodia and Laos). Chrysoberyl and Alexandrite have suffered similar declines on world markets.
Local and regional markets are even more susceptible to market flooding and price fluctuations, which may or may not be communicated tolfrom world markets. Green garnet's recent (mid- 1999) bubble in Lindi province is a good example. See chapter two, above.
Table 8.8 Value Added in the Tanzanite Marketing Chain, Tanzania and Kenya
Tanzania Kenya Price (% Volume VA
export) Mine broker 41.67% Broker 66.67% Dealer 80.00% Export 100.00% TOTAL
Figure 8.4 Tanzanite Value Added (63% Stays in Tanzania)
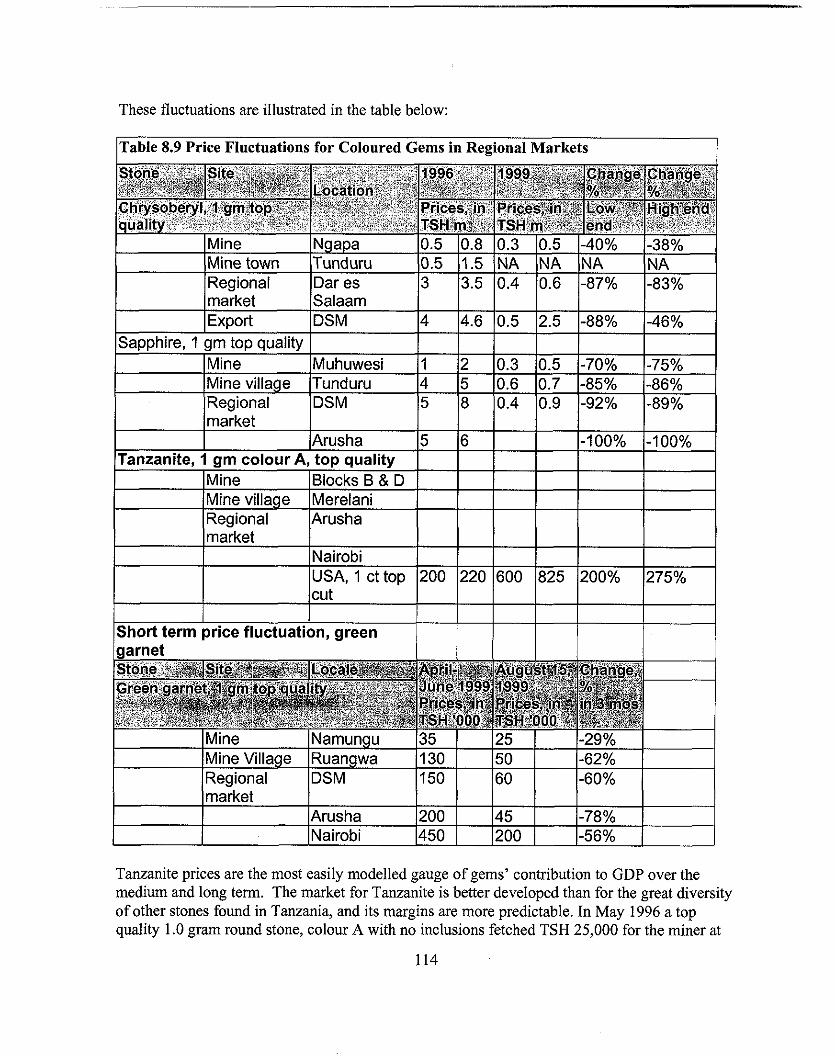
These fluctuations are illustrated in the table below:
l ~ab le 8.9 Price Fluctuations for Coloured Gems in Regional Markets
Tanzanite prices are the most easily modelled gauge of gems' contribution to GDP over the medium and long term. The market for Tanzanite is better developed than for the great diversity of other stones found in Tanzania, and its margins are more predictable. In May 1996 a top quality 1.0 gram round stone, colour A with no inclusions fetched TSH 25,000 for the miner at
market Nairobi USA, 1 ct top cut
200 220 600 825 200% 275%
Mbuguni, TSH 40,000 for the mine broker at Mbuguni, TSH 48,000 for the second broker at Arusha and 60,000 for the dealer1 exporter. In this case 42 percent of the domestic value added, for GDP purposes, was generated through the value of the stone itself and the process of extraction. The remaining 58 percent was generated by marketing: 25 percent of value added (less operating costs in each case) was generated by the mine broker, 13.3 percent by the mine to market broker, and another 20 percent by the dealer.
8.2 Smuggling and GDP
Stones and gold that are traded through Tanzanian mining market towns such as Arusha, Mwanza and Mtwara contribute most of their regional value-added from trade to the Tanzanian economy, even if, from thal: point on they are smuggled. This was the rather surprising conclusion of the first phase of this study. Tax evasion should not be confused with loss to GDP. In fact, forcible efforts to collect taxes can provide a negative incentive structure for the marketing chain. They actually drive out value-added activities and lead both GDP and tax revenues in the artisanal mining sector to decline.
Once stones leave Tanzania they continue to be traded in regional and world markets, with additional value added from trading, cutting and setting in jewellery. Tanzania can maximize the value-added to its own GDI? by keeping the highest volume possible through as many steps as possible within its borders, i.e. by minimizing smuggling and fostering value-added activities upstream and downstream. Three methods of doing this are possible: (1) use of force, (2) creating an incentive structure that attracts trade and related value-added activities, (3) increasing contributions to GDP by developing activities such as cutting and jewellery. Efforts are currently underway to stimulate these.
Because gems and gold are small and easily concealable commodities, it is far more feasible to attract the business to the country through a positive incentive structure for traders than to use force. Coercive policies and procedures<endto drive out the business at ever-lower levels in the marketing chain. This can cost the country more in foregone value added than it gains in tax revenue or in cutting and polishing, which are value-added activities higher in the chain, but with very low volume.
The impact of smuggling on Tanzanian GDP works in the following way. Goods are diverted to Kenya at each point in the marketing chain. They may also be diverted to Thailand, Sri Lanka, the USA or Europe at any point from the brokers on up. The lower down in the chain diversion happens, the more potential. value added is lost to Tanzania.
To illustrate, compare the case of Tanzanite versus that of gold. In 1996 Tanzanite stayed in the Tanzanian marketing chain longer, leaving bit by bit at each level in the chain. In 1996 most gold appeared to leave immediately from the mine level and transit into Kenya. Nevertheless most of the economic value-added stayed in Tanzania.
Almost all Tanzanite stones, for example, were in Tanzanian hands for their first point of sale, either at the mine to a mine broker, or in the village nearby to a larger broker. The same is true
for gold. After that, however, 95 percent of gold left Tanzania in the hands of Tanzanian brokers who sold it in Kenya. Gems followed a more diverse chain.
From Merelani, the team estimated that 40 percent of Tanzanite was sold to Kenya-based brokers in mining towns. At this level, assuming 25 percent of value-added ultimately reflected in the export price was generated by mine brokers, 15 percent stayed in Tanzania (60 % of goods x 25% margin), while 10 percent went to Kenya. At the next level, another estimated 10 percent of Tanzanite production was sold to foreign brokers in mining or market towns. At the dealer level, another estimated 10 percent of goods were sold to Kenyan dealers, either because the dealer here was his agent or because it was easier to turn over the goods in Nairobi than to find an overseas buyer. (See Table 8.9)
In the above scenario, where 60 percent of Tanzanian mine production was ultimately marketed through Kenya, 73 percent of the regional value-added generated by Tanzanian small-scale gem mining nevertheless stayed in Tanzania. Twenty-seven percent went to Kenya. This is because much of the volume of goods traded stayed in the Tanzanian marketing chain until the higher levels. Thus, of the estimated US$47.92 million total regional export value of gems mined in Tanzania in 1996, gems contributed an estimated US$34.98 million to Tanzanian GDP. Figure 8.4 illustrates the proportional distribution of value-added in a typical Tanzanite sale.
In the case of gold, after the Bank of Tanzania stopped buying in early 1995, the measures taken to legalize private trading had not created a viable market in Tanzania in 1996 and early 1997. M O S S ~ O ~ ~ in the Lake zone was in Tanzanian hands only from the mine to the ~ e n ~ k border. Tanzanian brokers sold 95 percent just on the other side of the border. The other 5 percent was smuggled out through Dar es Salaam and Zanzibar. Dealers who used to trade legally found the new regulations too onerous to keep in business. The mine price, as of December 1996, was 83.36 percent of the export price. Value added from the marketing chain was 16.64 percent.
Overall, 77 percent of the value-added by gold mining stayed in Tanzania, even when 95 percent of the gold was sold through Kenya. (See Figure 8.3 above.) Using the estimated gold production figures above, artisanal mining and trading contributed $47.3 1 million per year to Tanzanian GDP, even when 95 percent of it is exported through ~ e n ~ a . ' " Using the high estimate, the contribution is US$172.8 million.
New policies have proven that incentive-based policies work better than force. Removal of the export tax and lowering of royalties has attracted more of the gem trade to Tanzania. The research suggests that the proportion of gems smuggled out to Kenya declined from around 60 percent to about 45 percent. Considering that Tanzania still imposes some royalties and transaction taxes, while Nairobi officially has none, this is considerable progress. Establishment of the Meremeta gold-buying scheme, together with provision of equipment to artisanal miners on credit, have attracted most of the gold trade back through Tanzanian channels. On the other hand, fieldwork in the south showed that shifting government policies, especially vis-his foreign dealers, together with arbitrary local government taxation attempts, contributed to the
" This calculation is based on 77% of the above estimate of US$62.694 world market value of 5 T production, less 2% customary markup to the bullion market.
116
departure of foreign buyers and the collapse of the sector in the south. It proves the negative side of the principle, i.e. that unduly restrictive policies and forcible intervention can backfire and lead to economic decline of a sector. Instead of more opportunities for nationals in gem trading, there are now fewer opportunities for everyone.
8.3 Impact of tax incentives on dealers, business growth and tax revenues
Kenya has turned a blind eye to the import of gems and gold, thereby attracting most of the regional trade. Mozambique, Rwanda and Burundi have at times tried similar approaches. This has created a strong disincentive for Tanzanian dealers, in fact a business climate in which they cannot effectively compete if they fully respect tax laws.
The model business plan below (Table 8.10 and Text Box) shows that the incentive problem for dealers is not just a matter of how much profit they make. The current tax structure in Tanzania would keep Tanzanian dealers consistently less well capitalized than their Kenyan counterparts, giving Kenyan-based businesses more working capital. This allows them to buy a larger range of gem qualities more quickly.
In turn it increases their market share, and decreases the market share of Tanzanian dealers. As the total benefit to the Tanzanian economy (GDP) comprises the cumulative value added of dealers and their clients, the Tanzanian economy loses by this approach.


Table 8.10 Hypothetical Gem Dealerships in Arusha and Nairobi -- Effect of Transac Taxes on Business Growth and Total Taxes
8.4 Job Creation and Poverty Alleviation
The baseline survey found 550,000 active persons living in mining towns and earning at least part of their income from mining (Tan Discovery 1996), but the figure appears to have declined since then. Mining towns are typically segregated from existing indigenous villages, which is convenient for mining sector analysis. The persons counted above were not, however, all residents of such mining villages, only those who claimed to have income directly from mining. This was a phenomenal rate of job creation-far exceeding the number of rural and low-income jobs created by development projects.
The team estimates that the total number of persons earning part of their income from mining has diminished to perhaps 300,000 in 1999. It is not surprising that the growth in jobs did not continue its rapid pace of the early 1990s. Artisanal mining can safely reach only surface deposits. While those attract a big crowd, they are quickly exhausted. Another factor influencing the lower number of artisanal miners is the introduction of formal mining. Two of the rich gold lodes that were being exploited by artisanal miners in the north in 1995 have since been fenced in when formal mine construction began. At the time of the survey some 250,000 of those in mining were involved in the gem rush in the southern zone. That mining activity has collapsed and dispersed, however, since 1998. Less than 5000 (2 percent of the 1995 number) were believed to be actively mining in southern area by August 1999. Interviewees said that the foreign buyers had left, so that there was no point in mining and no money with which to do it. Another factor was that the alluvial gravels began yielding less output. Locals have generally returned to farming, but those who started shops with capital gained from mining are, in the main, still operating. Many of those involved in mining had other economic interests elsewhere in the country, and found the southern zone still too isolated and difficult to access to continue on a part time basis. Full-time miners have dispersed to other new rush areas, some of which are in the south, others in the west and north. The overall effect is probably to reduce the number of full time miners and increase the number for whom it is a seasonal or part-time occupation. The dispersion tends to interest new local populations in mining. For Example, farmers who have once mined often look for mine work in the dry season.
We have been unable to measure the levels of incomes directly from mining activities, as both work and income are too sporadic for even the beneficiaries to calculate. The reservation wage of menial labour in such towns, however, provides a convenient minimum to the typical Lorenz curve of income distribution. According to our survey in August 1996, it was 2,000-3,000 TSH per day. This was the wage earned by construction workers, shoe-shiners and others too poor to work in the mines, according to their own accounts. A shoeshine boy's net earnings averaged TSH 1,500 per day. In contrast, the reservation wage of agricultural labour in non-mining areas is about TSH 400 per day or US $19 per month (Odhiambo, Kristjanson and Kashangaki 1995). We therefore estimate that by 1995 some 550,000 persons, mainly from farm households, had increased their daily earning power five to seven fold for at least part of the year by moving into the mining sector. They also work more days per year, as the best mining season conveniently alternates with the best farming seasons. Mining can be a year-round activity for a core of full- timers. It shifts from alluvial to reef and back, and is hampered by heavy rains temporarily, but continues throughout all seasons. We therefore estimate that active persons in mining
communities, and those combining fanning with mining, work 200 to 250 days per year, in contrast to the approximately 100 worked in agriculture.
The 550,000 active miners found in 1995 represented 3.75 ercent of the entire labour force in ,8P . Tanzania. and 4.4 vercent of the amicultural labour force. Eihtv-six vercent of Tanzanians, - - . 12.6 million people in 1995, work primarily in agriculture. People have moved into mining from diverse occupations, although agriculture clearly predominates.
The average GDP (at factor cost) from agriculture generated by each member of the labour force in agriculture in 1993 was 39,963 TSH (US$98.67) per year. This reflects considerable under employment.
Using the income method of calculating GDP, we estimate that the 300,000 who worked in mining and related activities in 1992 contributed an average of TSH 562,500 per active person per year to GDP (assuming 225 working dayslyear @ TSH 2,500ld). This would total TSH 112.5 billion added to the official GDP. By 1995 when the number of active persons had risen to 550,000, their value-added contribution to GDP is estimated at TSH 309.375 billion. By 1999, current income from the sector was back to 1992 levels. All was not lost, however. Some of the capital built up by earlier participants was now generating income from trade and services (see chapter 3). Others who put their mining money into non-productive investments had improved their standard of living. Mmy built new homes, with corrugated roofs, or put new roofs on their present homes. Others reported benefiting from improved roads, more regular transport, clinics and school improvements that came with mining.
This is an enormous aarallel economv. if these estimates are even close to reality. The entire . . agricultural sector generated only TSH 365.6 billion in 1992, so artisanal mining and related activities generated an amount equivalent to 30.8 percent of all agriculture and 13.3 percent of total G D P Official Tanzanian GDP at factor costin 1995 was TSH 2,196.3 billion.(~ank of Tanzania 1996) The additional TSH 309.375 billion from artisanal mining would suggest that total GDP was underestimated by 14.1 percent, and that artisanal mining in that year contributed 12.4 percent of total GDP. '~ Compare this to the combined value-added and final goods methods of calculating GDP, whereby precious minerals contributed about 4 percent of revised GDP in 1995.
8.5 Foreign exchange and minerals marketing
8.5.1 Impact of minerals exports on foreign exchange earnings
Whether exported through Kenya, through illicit Tanzanian channels, or entirely legally, through the formal banking sector, minerals generate foreign exchange. The amount of foreign exchange
- '8Projected from World Tables figures for labour force and population growth rate.
19The number of days per year worked and the average incomes need to be the subject of fmther questioning--phase two of the study should include this subject.

benefit generated by minerals exports is equal to the proportion of GDP generated. The same methods used above to calculate the proportion of GDP remaining in the Tanzanian economy also indicate the magnitude of the foreign exchange benefits. In the second phase of the study, the team worked with monetary economists to estimate these effects.''
Tanzania has recorded negative trade balances consistently for more than twenty years. From 1973 through 1993, the average dollar value of imports of good and services exceeded exports by 127 percent (World Tables 1995). For the decade from 1983 through 1993, the average was 184 percent. Large official transfers and, to a lesser extent private transfers offset some of the imbalance, particularly from the mid 1980s on. The government budget also consistently ran a substantial deficit. In such circumstances one would expect rapid devaluation of the currency and rampant inflation. Devaluation was indeed close to 100 percent per year in the late 1980s when imports were first liberalized, but over the last two decades, monetaq devaluation vis-his the US dollar and inflation have each averaged only about 24 percent per year. Since the currency was allowed to float freely in 1994, the rate of devaluation initially decreased. Artisanal mining deserved part of the credit. By 1999, however, devaluation again accelerated. The statistics available are not adequate to establish a causal statistical relationship with the artisanal mining recession, but the timing coincides.
8.5.2 Impact of exchange controls and currency fluctuations on the trade
The behaviour of the exchange rate strongly affects the minerals markets in Tanzania. One problematic area for traders is the gap between the official and parallel exchange rates, and another is the transaction cost of two exchanges when exchange with the Kenyan shilling intervenes. Although both Kenyan and Tanzanian shillings are supposed to be floating freely, and are exchanged in Bureaux de Change, values over $10,000 are still subject to exchange rate management through official channels. They receive the lower cheque dollar rate of exchange rather than the cash rate. Most of the master dealers interviewed affirmed that they have been affected by this cheque exchange rate as it makes it hard to compete with smugglers. Dealers reported a difference of 2 to 5 percent between the cash and cheque exchange rates. This exchange rate difference has been a powerful incentive for smuggling the mineral products through the neighbouring Kenya.
The gap in the Bureaux de Change rates is larger in Arusha than in Dar es Salaam, perhaps because dollars are abundant in Arusha due to the combined influences of tourism and the minerals trade. During the field work from August 1996 through February 1997, Bureaux de Change in Dar es Salaam were offering TSH 600-620, while those in Arusha offered 500-550, a 16 percent disadvantage for Arushan importers and mineral dealers.
"The size of the entire informal sector in Tanzania has been estimated by several different methods. Sams and Brink (1993), using the missing income method, estimated it at 60% to 68% of total GDP in 1985 - 88. With the demand-for-currency method, Bagachwa and Naho (1994) calculated that it had increased from 40-45% of GDP in the 1970s to 40-70% of GDP in the 1980s. Both of these were too early to capture the mining boom.
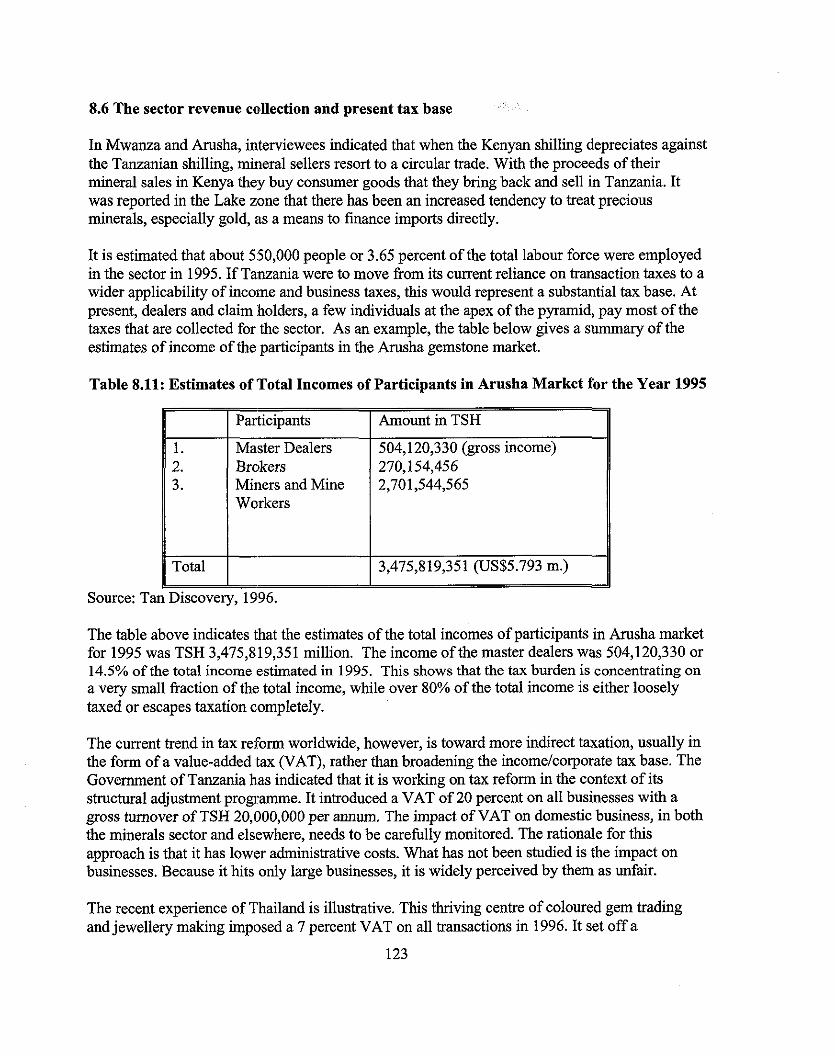
8.6 The sector revenue collection and present tax base
In Mwanza and Arusha, interviewees indicated that when the Kenyan shilling depreciates against the Tanzanian shilling, mineral sellers resort to a circular trade. With the proceeds of their mineral sales in Kenya they buy consumer goods that they bring back and sell in Tanzania. It was reported in the Lake zone that there has been an increased tendency to treat precious minerals, especially gold, as a means to finance imports directly.
It is estimated that about 550,000 people or 3.65 percent of the total labour force were employed in the sector in 1995. If Tanzania were to move from its current reliance on transaction taxes to a wider applicability of income and business taxes, this would represent a substantial tax base. At present, dealers and claim holders, a few individuals at the apex of the pyramid, pay most of the taxes that are collected for the sector. As an example, the table below gives a summary of the estimates of income of the participants in the Arusha gemstone market.
Table 8.11: Estimates of Total Incomes of Participants in Arusha Market for the Year 1995 = Participants - Master Dealers Brokers Miners and Mine Workers
Amount in TSH
504,120,330 (gross income) 270,154,456 2,701,544,565
3,475,819,351 (US5.793 m.)
The table above indicates that the estimates of the total incomes of participants in Arusha market for 1995 was TSH 3,475,819,351 million. The income of the master dealers was 504,120,330 or 14.5% of the total income estimated in 1995. This shows that the tax burden is concentrating on a very small fraction of the total income, while over 80% of the total income is either loosely taxed or escapes taxation completely.
The current trend in tax reform worldwide, however, is toward more indirect taxation, usually in the form of a value-added tax (VAT), rather than broadening the income/corporate tax base. The Government of Tanzania has indicated that it is working on tax reform in the context of its structural adjustment programme. It introduced a VAT of 20 percent on all businesses with a gross turnover of TSH 20,000,000 per annum. The impact of VAT on domestic business, in both the minerals sector and elsewhere, needs to be carellly monitored. The rationale for this approach is that it has lower administrative costs. What has not been studied is the impact on businesses. Because it hits only large businesses, it is widely perceived by them as unfair.
The recent experience of Thailand is illustrative. This thriving centre of coloured gem trading and jewellery making imposed a 7 percent VAT on all transactions in 1996. It set off a
123

depression in gem markets, sparked several bankruptcies and caused some major foreign investors to withdraw (Bangkok Post, Aug. 5, 1996 and Internet gem newsletters). Cutting was particularly affected, as it depended on imported rough (subject to VAT) and was already facing a problem of rising labour costs. The shift of such operations to India and China seems to have accelerated. A core of Thailand's industry appears to be surviving the effects of the VAT, but Tanzania's fledgling gem sector is not so robust. The impacts of any future tax reform need to be explored carefully in advance.
Local taxation authority is currently inadequate, as powers of taxation are concentrated in the central government. Local authorities currently tax businesses a small amount, but there are no guidelines for taxation of mining. Some try to tax dealers andfor miners too heavily, and others not at all. Local communities bear the brunt of the negative externalities of mining, both artisanal and formal. In addition to the economic problems of mining-induced localized inflation, these include strains on existing socials services such as schools and health facilities. Environmental damage in the form of unfilled pits, slag heaps and pollution of the air, soil and water supply is also mainly felt locally. Moreover, local communities know who is mining what where, and would be much better placed than central government authorities to apply reasonable taxes to mining if they had appropriate guidelines and the authority to tax. With that authority should also come transparent procedures for deciding on and administering the resulting local government budgets.
8.7 Policies favouring value added activities
When one mentions value-added, policy makers generally think that upstream and downstream processing activities are the subject. Calculating the economic value added generated in a year by each step in the marketing chain, as we did above, shows the importance of trading as a source of value added, and of volume of business rather than mark up as a source of profits. Both concepts tend to be poorly understood by many policy-makers and even some business people. The price mark-up for cut stones compared to rough may be 2 to 3 times. People therefore tend to equate this with the only "value-added" activity in the chain. In fact, the vast majority of current economic value added is being generated by trade, i.e. collecting, sorting, buying and selling rough stones.
Volume is the main reason that trading is more profitable and generates more value-added for firms than cutting stones. There is a limited market for cut stones, and they must compete with mass production in Thailand and other lesser cutting centres. Traders have a smaller mark-up on rough stones, but make up for it with high volumes. The advantage is greater as one ascends the marketing chain. Small brokers may have a large margin and very low volume of transactions. Dealers rely more on volume of transactions. Contrary to popular opinion, the most successful dealers are not those who have the highest mark-ups. A dealer who sells one parcel per month for which he paid TSH 1 million, and gets TSH 1.5 million has TSH 500,000 in monthly gross profit. Another who pays TSH 1.1 million per parcel and sells five per month at TSH 1.4 million has a monthly gross profit three times that size, at TSH 1.5 million. Only the largest dealers have sufficient volume of gem quality stones to justify investing in lapidary equipment and hiring a qualified cutter.

The relationship between volume and global value-added is also very important in deciding how much policy weight to put on activities such as heat treatment, faceting and polishing of stones and final refinement of gold. These are often called value-added activities, with the imvlication that trade is not adding Galue. They are developing gradually in ~anzania,'with encouragement. They are areas, however, in which Tanzania can only gradually develop a comparative advantage. Some twenty new cutting machines have beenimported in the iast year or two, which shows that dealers are trying to look to the future and develop the capacities needed to be competitive in processing gems. Most are not currently economically viable, however, and dealers must subsidize the cutting through profits on raw stones.
From an economic point of view it is seriously misleading to regard cutting or heat treatment as the most interesting forms of "value added" for precious and semi-precious stones. The reason is that volume is more important than price margins. Price margins appear high for a single stone that is successfully cut and sold. Unfortunately only a tiny proportion of stones can be successfully cut and sold. Two- to three-fifths of the raw stone weight is generally lost, so that a lgram raw stone yields a 1-2 carat faceted stone. The waste portion could be used to make tiny calibrated stones for mass produced jewellery in Thailand. In Tanzania there is not sufficient volume, and very few lapidaries do calibrated cutting. In a certain portion of valuable stones, a less experienced cutter spoils the stone or gets considerably less value from it than could have been obtained, making it sell slower or not at all.
World market dealers often prefer to have stones cut close to their final selling market, so that fashion can determine what cut to give. For the highest value stones, the most valuable cut is often to the final buyer or the jeweller's specifications. This argument is diminishing in weight, however, as market information and fashions are increasingly globalised and rapidly communicated. International gem shows, magazines, and most strikingly the Internet now communicate changing tastes and designs around the world. Tanzania is on the verge of this global market, with some few dealers truly connected, but most having only occasional and/or second hand exposure.
Tanzanian dealers, with government encouragement, are gradually developing a cutting industry. Recently import tariffs on cutting machines and other lapidary equipment were eliminated. Negative incentives for exporting raw stones have also been created for some dealers. In March of 1996, regulations were issued requiring foreign dealers to stay out of mining areas, to work from towns, to establish lapidaries and to have stones over 1 gram cut before exporting. They were also required to deposit a $50,000 bond. These regulations would actually have made a dealership non-viable, particularly the bond requirement. The start-up working capital of the dealerships we modelled in Tanzania and Kenya was only $40,000. If a dealer has to tie up $50,000 at zero interest, most will not go into that business at all. At a time when interest rates were 29%, a potential dealer would have to deduct that as the opportunity cost of his capital and count his rate of return only when it exceeded that amount. Field interviews suggested that those foreigners who most wanted to stay because of long-term residency or family relationships were accommodated by the government, either by being given permission to operate as Tanzanians or through relaxation of the most onerous requirements. A few foreign dealers, some of whom had been pretending to mine in order to be well situated in the trade, decided to abandon their

operations. This deprived the sector of capital, but Tanzanian dealers considered it necessary to protect their ability to compete.
Dealers who cut stones need a different set of buyers from the ones to whom they sell rough stones. They may actually be in competition with their traditional buyers if they start cutting. Add to this the lower volume of business for lapidary activities, the higher costs of operation and the lack of skilled cutters. All these factors may be overcome gradually, but the sudden obligatory transition was judged not to be viable by most foreign dealers. From the point of view of the Tanzanian national economy, a policy forcing dealers to undertake capital-intensive processing leads to waste of resources, capital and labour. Many of them could use their capital and energies to generate more value added if engaged in trading. On a voluntary basis, they are already moving in the right direction, and can be expected to gradually develop some comparative advantage, particularly for the substantial local tourist market.
8.8 Negative externalities from artisanal mining
8.8.1 Environmental damage
Mining, whether large-scale or small, has serious negative impacts on the economy that are not directly measurable in the accounts of the enterprises involved. Chief of these is environmental damage. This is a critical issue, which must be dealt with, in both small and large-scale mining regulatory frameworks. This study does not go into detail, nor attempt to quantify the costs of clean up, as separate environmental and regulatory framework studies have been commissioned by the government for that purpose. As this study finds economic benefits from artisanal mining to the population and the national economy on a scale that was hitherto unheralded, it is important to mention the environmental costs as well.
While, in the past, large-scale mining has caused environmental damage on a scale far beyond the impact of small-scale mining, today the situation is often reversed. Large-scale mining still uses cyanide for leaching and generates acid waste. The industry has developed environmental standards and measures for handling these safely. On most large mines, toxic waste is carefully contained, and the gaping holes left in the past are now refilled and restored to normal use when a mine is closed. Careful supervision is still required to ensure that environmental standards set out in the official environmental plan of each mine are observed. This is particularly true in the late stages of mining, when returns are diminishing and costs of production are rising. The company that originally promised to fill up the hole and restore the site may have sold the operation to another company by then. If the final company goes bankrupt rather than restoring the site, there is little government or local communities can do. Implementing a modem environmental plan is estimated to add 15 to 20 percent to the costs of production over the life of a gold mine.
The environmental problems created by small-scale mining are less easily managed, whether the operation is large or small. For artisanal mining, the environmental risks consist mainly of improper use of explosives, a landscape scarred by myriad small trenches and, in gold mining areas, mercury pollution of air, land and water. Gold miners who regularly handle mercury show

low levels of mercury poisoning in their tissues. Accidental injuries and deaths from improper handling of explosives and collapsed shafts are far too frequent.
The environmental damage caused by small-scale mining needs to be managed primarily at the local level. The role of the central government can be to set environmental and safety standards and create legal prerogatives of local communities, notably to impose an environmental tax and to enforce the standards. For large mining operations the central government is likely to bear responsibility for both setting and enforcing environmental and safety standards.
8.8.2 Health and safety problems
Present mining and processing technologies of small-scale miners are associated with high health risks and frequent mine accidents. These accidents lead to loss of properties, and injuries to workers. Sometimes a productive mine pit is abandoned altogether due to safety and high costs of restoring production.
Frequent epidemic outbreaks in mostly mine rush villages have resulted into losses of many production days and economic burden to the local authorities who have the responsibility of providing medical facilities and security in these areas.

9. STRATEGIC ANALYSIS OF THE MINERALS SECTOR
Recent theories of economic development stress on going strategic analysis of competitive advantage, involving all stakeholders in a sector. (Porter, 1982, 1990; Fairbanks and Stace, 1998) Such participatory analysis and dialogue is what the present study has sought to accomplish. The research process was led by a well-connected think tank (ESRF), and the team were in constant consultation with a stakeholder advisory committee. To cap it off two workshops brought together participants throughout the sector, one in Mwanza organized by the Chamber of Mines in September 1999 and the other at ESRF in December 1999. Fairbanks and Stace stress seven principles for developing countries' sectoral planning:
1. Avoid Overreliance on Basic Factors of Advantage 2. Improve Understanding of Customers 3. Know your Relative Competitive Position 4. Know When and When Not to Forward Integrate 5. Improve Interfirm Cooperation 6. Overcome Defensiveness 7. Avoid Paternalism
Each of these applies to the minerals sector in Tanzania.
9.1 Avoid over reliance of basic factors of advantage
Tanzania's comparative advantage in the minerals sector relies primarily on the existence of rich deposits of valuable minerals.
Sources of dynamic competitive advantage include Tanzania's stable democratic government, relative social harmony, low violent crime rate, and modernizing economic policies.
Constraints, as seen by participants and potential investors include the following:
Poor infrastructure Telecommunications: costly, often unavailable in remote mining areas Roads: poor quality, seasonally impracticable, require expensive vehicles; costly in both travel-time and money Electrical supply: costly and unreliable Port and air infrastructure: adequate but costly for international travel and transport. Port clearance beset by delays that increase transaction costs, raising costs of doing business. Tax structure: For artisanal production and trading, tax policy is becoming more competitive with Kenya, but further reform would attract more formal trade and reduce smuggling. For large mining investors tax policies are competitive, but tax administration is a negative factor. The tax structure applicable to mining is favourable enough to attract investment in mining and processing for both large and small investors. Arbitrary collection practices, a plethora of nuisance taxes, and unpredictability of tax-related costs are serious disincentives.
Overlapping systems of claims allocation: The lack of a unified register of mineral licences, transparently and fairly administered, has created tensions in the past. This is being rectified by the creation of a computerized record in Dar es Salaam.
Administrative arbitrariness: Both artisanals and large companies complain of differing interpretations of regulations, changes in regulations, stoppages, sudden rise in fees, etc. This is a major disincentive for both sets of stakeholders.
Concerns about security: While low violent crime rates have been experienced in the past, Tanzania relies on customary moral authority more than on an adequate police force to provide security in remote rural areas where most exploration and mining takes place. Artisanal traders experience police as an obstacle rather than as an asset to legitimate trading activity. Large companies are concerned about recent acts of armed violence and the presence of refugees from nearby countries with armed conflicts. Thefi is a significant cost throughout the sector. I?ayrolls and trade goods cannot be kept safe for lack of rural banking facilities.
Lack of capital: This is a problem for all Tanzanian participants. Dealers lack enough capital to buy both first and second quality goods, with cash on the spot. Foreign backed dealers have an advantage there. Miners lack capital to operate artisanal mining, and even more so to invest in formal small-scale mining. Lack of indigenous capital also affects large mining companies. It forces them to rely on expensive expatriate partners for outsourcing that they would prefer to do locally, if partners with adequate capital, experience and quality control were available.
9.2 Improve understanding of customers
Customers for Tanzania's precious minerals are the international markets for gold, diamonds and coloured gems, each of which was described previously. Tanzanian stakeholders need to understand and monitor these markets regularly.
At present lack of market information is a major constraint, causing volatility in domestic markets and limiting the development of optimal trading strategies among Tanzanian stakeholders in international markets. Government programs aimed at providing stakeholders low-cost access to journals, the Internet and other sources of information on international precious minerals markets is very important in improving Tanzania's competitive position.
Lack of coherent market information is particularly a problem for the coloured gem markets. Such information is increasingly available on the Internet. Recently the cost of Internet access in Dar es Salaam has decreased sharply, which can be a competitive advantage for Tanzanian dealers. This needs to take place in Arusha as well, and training programs should focus on effective use of the Internet for researching market information and joining trading lists.

Market research on niche markets available to Tanzanian stakeholders should also be encouraged. The concept hardly exists at present. Tourists constitute one "captive" niche market that Tanzanian stakeholders should study.
9.3 Know your relative competitive position
Tanzanian policy-makers have recently visited countries with which Tanzania competes for trade and investment: Ghana, Zimbabwe, Sri Lanka and several other African, Asian and Latin American producing countries. Only a few other Tanzanian stakeholders have any understanding of the international competition. The gold and gem deposits that today seem an immutable source of Tanzanian comparative advantage would interest international trade and investment far less if peace suddenly came to DRC and Angola, and their richer deposits were competing with Tanzania. However, Tanzania can sustain its competitiveness by harnessing peace and stability.
The country's economic image has improved considerably in recent years, but there are few areas that require attention. Tanzania still ranks poorly with international investors on its tax system, tax enforcement, regulatory burden, time for permits, and infrastructure. (World Economic Forum, 1998) Overall it ranks 1 6 ' ~ of 23 African countries surveyed, with a 4 . 2 4 competitiveness index. On the other hand it ranks near the top on improvement between 1992 and 1997, and on investor optimism in 1997-99.
Tanzania's unique Tanzanite deposits could face competition if other sources are discovered. This happened with Tsavorite, to Kenya's disappointment. As the stone and its geology become better known, the search for other deposits is likely to intensify.
9.4 Know when and when not to forward integrate
Forward integration is moving from one of the niches in the chain into those further on, e.g. from mining into dealing/exporting. Backward integration means moving from one niche, such as dealing rough, down the chain into mining. Tanzanian participants at all levels are trying to forward and backward integrate, often with little success and little understanding of their competitive advantage in each niche. Gemstone dealers are now active in mining activities as claim owners or funding mining operations in other claims.
+ Marketing information
New communications technologies have lowered marketing time and costs, making it very easy to forward and backward integrate in the trading aspects. This innovation is driven by technology, not policy. The main factor thus far is the Internet, but other telecommunications innovations are also underway. Daily the pace of business accelerates throughout the world and the imvortance of distance diminishes. Throwhout the world, businesses at everv level - in the chain are putting up full information on their products and services on web sites. They have established semi-private email trading networks that reduce transaction costs and reduce the economic viabilitybf traditional trading/brokering services. The consensus at the recent decennial gemmological symposium was that dealersltraders margins at every level of the

chain have been getting narrower and will continue to do so. Fewer will find employment in dealing, and more in value-added activities.
t Value-added activities
Gold assaying and refining equipment is available for a small capital investment. The main constraint is lack of capital to buy the gold.
Thailand, Sri Lanka, India and now China all compete with Tanzania in cutting gem quality material. All have cheaper labour, experienced cutters, ample supply of gem-quality materials to cut, and established markets for their products.
Tanzania is unlikely to be able to compete with these countries for the mass market. It can rely on its access to deposits to develop a small lapidary and jewellery industry. Participants need to target their marketing, know their customers, improve the quality of their output, and provide customers with reliable quality grading. South Africa is the closest competitor country for this approach. Tanzanian stakeholders could do some research on their competitors quite easily.
Tumbling, carving, and the development of crafts and jewellery from lower quality goods constitute another niche market worth developing. One finds ample supply of materials at no or low cost in mining areas. The equipment is inexpensive and skills are readily acquirable. Manufactured findings for jewellery are available, although some procurement research is needed on this. Again South Africa is both a competitor and a potential source of help in developing this niche.
At the top levels of the gems-jewellery chain most Tanzanians lack the capital and knowledge of markets to succeed. These are intemational gem-quality rough trading, top quality gem cutting and international cut-stone trading.
A few individuals are likely to penetrate these markets through exceptional efforts and success. The gem-quality rough collection is dominated by Thais, Sri Lankans and Indians, although forward and backward integration is increasingly found. Through the Internet and gem shows, manufacturers and producing-country dealerslminers tend to trade more often directly, without intermediaries. The Thai stone-cutting industry collapsed in 1997-98 in the face of rising costs (rising wages are a long-term factor, but a 7% VAT was the final blow). Coloured stone trading and cutting is moving to China, India and other lower cost areas. India now dominates diamond cutting, in terms of number of cutters and volume of stones cut. Israel and New York dominate trading and cutting for top quality diamonds leveraging their access to capital. Antwerp's cutting and trading is declining. China is entering the competition at the low end, with much of the cheapest labourlskills ratio. Automated cutting is also impacting the market. This is capital intensive, but is worth investigating for Tanzania, as it offers the fastest route to calibrated stone production. One Tanzanian lapidary has already entered this new area.

Jewellery manufacturing has many niches, some of which Tanzania can enter. Tanzanian jewellers can focus on two promising areas for the future, and one smaller one:
1) Producing moderately priced jewellery for the tourist and domestic markets, using lesser grade stone materials and purchased Asian fittings.
2) Producing middle-quality fine jewellery, which will have a much smaller tourist market and may not be able to compete on the domestic market with imports from Dubai and Asia.
3) A few talented designers may make a living selling their hand-made designs, again focusing on the tourist and domestic markets.
Jewellery distribution: Worldwide jewellery distribution has become compartmentalized. A large proportion of the best diamonds goes to Japan, although the market for coloured stones there is limited. Three years ago, when this study began, it seemed impossible for Tanzania to compete with established marketing networks. Tanzania had neither skilled craftspeople nor experienced, well-capitalized dealers, nor good cheap telecommunications-and it was less likely to attract the capital to develop them than many other countries.
Today the picture has changed. The Internet and the tourist trade offer potential marketing tools for a Tanzanian jewellery industry that barely exists. Knowledge of marketing is extremely scarce, but at least it is possible to see how it can be developed.
Taking advantage of the Internet and tourist marketing contacts, Tanzania has the potential to develop jewellery with its own cachet and market it internationally.
9.5 Improve interfirm cooperation
Stakeholders in any sector tend to focus on their rivalries with one another, e.g. large mines vs. artisanals, dealer vs. dealer, dealer vs. broker. They complain of their problems with government regulators and with people or firms in other parts of the chain, usually immediately above or below the niche that they occupy. This has to stop in order for a sector to grow. Stakeholders need to see their common interests, and focus on how best to maximize their national position vis-A-vis the world situation. If they can set a common goal and keep focused on it, they will be better able to define the strategies and policies contributing to realize it or inhibiting it.
Two major opportunities for growth through interfirm cooperation emerged from this study:
Cooperative mining and marketing of tanzanite: Competition between mineral brokers and dealers in tanzanite at present is so intense it is counterproductive. Prices rise and fall on world markets largely due to market shocks, such as a ban on dealing or on mining. The fact that deposits are concentrated in a small area invites efforts to monopolize the market. Fencing the area would have to be the first step. Then miners and dealers could get enough control of production to organize a cooperative approach. Cooperation between mineral dealers and tanzanite claim holders is growing steadily. Of the 90 operating tanzanite pits in blocks B and D, about 60 pits are under direct financial
132

assistance of mineral dealers. The new monopoly thrust proposed by a South African entrepreneur (see chapter 2) would likely concentrate benefits in a few hands. The company, Mererani Mining Limited (MML) is to go public starting with floating its shares on the Johannesburg Stock Exchange and later on the Dar es Salaam Stock Exchange (DSE). This will provide opportunities for more people to have direct economic interest in tanzanite mining through the stock markets. Today, despite the anarchic market, the benefits are quite widely dispersed.
Adopting a policy to encourage large mines to work with artisanals who seek to mine on the large company's property licence. Outside the prime mining area, most mining companies hold areas on which artisanals are currently mining. They generally ignore them, although there are occasionally conflicts. If mining companies were allowed to buy the products of the artisanals and enforce at least minimal safe practices, it would be a win:win situation. This is currently being done in Zimbabwe, Mali, and several other countries, and both sides are generally happier with it than with conflict. Small-scale miners should have access to exploration reports of areas that have being relinquished by mining companies due to low reserve data's or small mineral rich deposits.
9.6 Overcome defensiveness
Defensiveness comes when stakeholders complain about rivals, regulators, suppliers and customers, instead of focusing on what they can accomplish if they work together toward a common goal. Umoja ni nguvu is the watchword here-united we are strong. When firms and/or governments sit back and complain about one another or their customers, they have no clear goal and so their energies are dispersed and ineffective.
9.7 Avoid paternalism
Paternalism leads government to intervene in a sector too intensively. Sometimes such intervention is an overreaction to abuses observed in market operations, or to health, safety or environmental problems. Other times it is to artificially protect their nationals in one or more sectors or to exclude foreign competition through policies. The protected firms can then function for a while, relying on basic comparative advantage (presence of minerals).
Protection generally fails as a long -term strategy, leading to decline of the sector as a whole, as capital is less and less available, markets and investment decline, and so production also is forced to decline. Protection policies have been used successfully only a few times, most recently in Southeast Asia from the 1970s to 1990s, before the collapse in 1997. Protectedfsubsidized industries and dealers were given five years to become competitive on the world market, with declining rates of effective protection andfor subsidy each year. This time-limited approach is generally regarded as the most successful form of protection. To adopt this approach for the minerals sector, Tanzania should regard the reservation of trading licenses to nationals as a temporary, rather than a permanent strategy. While the Internet will facilitate growth of legitimate trade, it can also be used to smuggle more effectively. Using closed lists, dealers now can trade with neither their nationalities nor their license status being a consideration: all that counts is the quality and price of the goods one can deliver.
133
10 SUMMARY OF RECOMMENDATIONS
This study has come at a time of sweeping changes in Tanzania's mining sector, and in the larger national economy. Tanzanian policy-makers face a unique opportunity in the swelling mining boom. They also have to prepare for its inevitable subsequent decline. The liberalization of mining has brought poverty alleviation to rural areas in the 1990s on a scale far surpassing the impact of donor-funded job-creation efforts. Working with that trend, future donor-funded efforts can multiply their impact. On the other hand, if this sudden growth is neglected or misunderstood, the benefits of sudden growth in mining could be transitory. The impact could be negative if future inflation and other economic distortions are not controlled, if arms or drug dealers, or money launderers infiltrate the trade, or if greed, corruption or ethnic tensions are allowed to build around resource riches. None of these negative situations is currently an imminent trend in Tanzania, but all have occurred in other mineral-rich countries.
This chapter summarizes policy and program implications of the study, including issues that stakeholders brought out in the two workshops sponsored in connection with the study. Each recommendation is given together with its rationale. All are time sensitive and we believe that these recommendations fit the situation today. As the sector evolves, policy has to be fine tuned in order to stay targeted on the same strategic goals of economic growth with equity.
The Government of Tanzania has adopted the goal of creating economic growth in mining, while balancing the development of large-scale mining by multinationals with continued support for indigenous mining. It foresees the latter gradually transitioning from the present artisanal mode to small-scale formalized mining. The government of Tanzania's objectives are: (1) that fiscal and export revenues from mining be maximized, and (2) that mining generates 10 percent of GDP by 2025. The strategic guidelines in chapter 9 are the main source of the following detailed recommendations.
10.1 Create a conducive environment for mining and mineral market development
All stakeholders need to collaborate on this. Currently business expansion, in both mining and supporting business opportunities, is hindered by the same handicaps that make mining costly and less than optimally efficient. The specific recommended priority actions to address the encountered problems include:
10.1.1 Create and enforce competitive formal minerals markets at all levels
This includes elaborating new fair trade legislation (for the benefits of the economy as a whole) and liberalizing the dealer licensing redations. The Ministrv of Enerw and Minerals monitors - - - -- dealer activity, providing a good gauge of the level of competition in legal trading. Also, Tanzania has established business court to enforce fair trade legislation and market regulation. Trading at the mine level should be reserved for local stakeholders only. There is a legitimate security and free-trade argument for confining the operations of foreign dealers to towns. Also, foreign dealers are still allowed to team up with local stakeholders in mining and other activities.

10.1.2 Take additional measures to discourage smuggling
Insist that all government authorities protect and respect licensed dealers, brokers and miners who conduct business legally. At present most participants in the sector expect harassment and sometimes extortion rather than protection from government authorities. There are complaints that even extraordinary efforts t i operate legally receive no recognition from local authkrities. Local authorities need to be instructed in the new mining law and its application, and to enforce a sharp distinction between legal and illegal operations. Create a special minerals law-enforcement unit, knowledgeable in the ways of minerals smugglers and vigilant in preventing arms or drug trading, or money laundering. This unit should liaise regularly with Interpol to prevent the intrusion of international criminal elements.
10.1.3 Continue attractiug investment in mining and minerals trading
To do this, govemment needs to maintain a dialogue with current investors, domestic and foreign, to eliminate or reduce remaining constraints in the business climate. Also, it is important to ensure a stable political and good governance environment. Delays, red tape, and any measures that tie up capital are constraints that raise transaction costs for all businesses. Satisfied current investors are the cores of a successful investment strategy.
10.1.4 Improve basic infrastructure and reduce usage costs
A top priority for reinvestment of the govemment revenues generated by mining should be infrastructure. Infrastructure is the most glaring deficiency in Tanzania's otherwise favorable investment climate, for both foreign and domestic investors. The following specific problems were encountered:
a) Lack of telephone service and expensive telephone rates create problems for security, procurement, marketing and other business operations. The pending privatisation of the national Telephone Company offers an opportunity for Tanzanians to benefit more from competition in the sector if properly structured. Currently Tanzania Telecommunications Company charges private telecom companies a high base rate for services that they could provide internationally at much lower rates. While government revenues are one of the legitimate stakeholder concerns in the sector, very high tariffs are often not the best means of guaranteeing a stable revenue stream. Mining organizations would legitimately seek to be represented, along with other stakeholders, on an autonomous body charged with regulating the newly privatised sector.
b) Poor roads cut mines off from markets and raise the costs of doing business. Miners, both large and small, often have to build their own roads and bridges. Government is working on a program of rural road development, but it needs to move faster and provide more regular maintenance. Investment in rural roads is needed not just for mining, but also for business diversification upcountry. The private sector should be encouraged to participate in this endeavour.

10.1.5 Assist miners to improve security
a) Encourage banks to create branches in mining areas with safe-deposit boxes. The government has to provide police security for such banks.
b) There is a delay in authorization of claim titles during the mine rush. Thus, it is necessary to create a mobile task force to go immediately to new mine rush areas, peg claims, brief local authorities, ensure law and order and supervise the election of authorities among the miners themselves. Such a mobile task force could mitigate smuggling and other abuses in artisanal mining, which tend to occur at the beginning of each rush. Such a task force should be trained and mobilized by the central Ministry of Energy and Minerals, in close cooperation with Regional and District authorities who are better equipped and easier to mobilizethan regional mining offices. This would deter wildcat mining and smuggling, which occur now during periods of administrative delay. Under present practice, the richest surface deposits on a claim are often depleted by the time the pegging of claims and authority to mine are confirmed by central authorities. Such delays are costly for claim-filers, and the illegal production is more likely to be smuggled than legally mined production.
10.2 Improve the fiscal regime and the tax administration
10.2.1 Fiscal policy issues
As outlined in Chapter 7, the present fiscal policy as applied to the mining sector is by and large quite positive. There are some specific areas, however, which the government and the TRA should re-examine in the context of the mining industry:
Multiplicity of taxes and fees
In addition to the main stream royalty and the corporate income tax, there are many minor taxes such as fringe benefit tax and stamp duty, etc. that not only create a serious burden on the industry, but also add considerably to the cost of compliance. These taxes need to be rationalized. Some of them may have to be dropped outright, while others would only need adjusting. It may be mentioned, however, that any changes that government decides to make should not be done piecemeal. It should be a part of an overall review of the tax system. Similarly, there are different kinds of fees and other levies that need to be analysed and suitably amended.
\
Many Employment related taxes and levies
There are three main taxes that fall into this categov: house development levy, VETA (the levy i
for vocational training) and NSSF (the contribution to the National Social Security Fund). These L
should not constitute an additional fiscal burden on the mining or any other industry. If the government faces revenue scarcity for these and other similar programs, it may be a better option \
to examine the whole fiscal system and to see how these various taxes, often referred to as i
"nuisance taxes" by tax payers, may be replaced by other stable sources of revenue. For example, a royalty rate of slightly less than 5% adequately covers the revenue generated from these taxes

and levies. This is by no means to suggest that royalty rates be increased in a hurry in order to get rid of these taxes, it only suggests that other options that are less burdensome in terms of compliance should be explored. Also, the paper work required for compliance on the part of the employers is lengthy and needs to be simplified.
Royalty on sale of raw gemstone
There is no royalty on the export of finished gemstone (cut and polished) but a 3% royalty has to be paid on rough stones. The method used sends wrong signals to the industry and creates a strong incentive for driving the trade underground. It may be a better to abolish this royalty. This is particularly important because it affects the artisanal mining sector directly.
Duplication of Licensing
The dealers of gemstones who are already licensed with the Ministry of Energy and Minerals (MEM) have to get a second business license from the Ministry of Industry and Commerce (MIC) before they can undertake any trading activity. This is viewed as double licensing and seems to have no apparent purpose behind it except raising more revenues. If that is the case, it may be better to enhance the dealer or broker license fees and share revenues internally rather than create a system of duplicate licensing.
Also, the mining sector has to bear a series of indirect or hidden operating costs that are quite huge. Clearly, some of these costs are specific to the mining sector but most of them affect economic activities in genera1 and create large-scale inefficiencies. These costs should be examined in detail and reduced to the extent possible.
Rationalising taxation at the local levels,
Local governments, often, impose their own local income taxes on licensed dealers in combination with local business license fees. Currently, there is too much of arbitrariness in the system. There should be well-defined norms for the level of business fees imposed by the local governments. It may be better for the central government to offer clear guidelines for licensing at the local level, collect all income taxes centrally and then have a revenue sharing arrangement or a system of devolution for revenues to be transferred to local governments.
10.2.2 Tax administration issues
Administrative problems are more crucial to the mining industry than issues of policy. For instance, the tax administration will develop a better understanding of the special nature of the industry and administrative problems will diminish. Two things emerge from this study. First, the TRA needs to develop a better understanding of the mining sector, so that it may successfully implement the government policies, legislations and regulations most of which have been put in place after incorporating their input. Second, some of the past administrative practices are still in effect and these are creating hardships and increasing the cost of compliance for the mining industry. There is a need to examine these practices closely and make necessary changes. The longer it is postponed, the more difficult it will become to implement any changes. Thus, it may

be worthwhile to invest in capacity building in the department through a well-planned training program. The senior management level in TRA is aware of this need.
Generally, further reductions in tax exemptions, rationalisation of tax regime and improvement in tax administration to curb tax evasion are some of the important measures that are required to help broaden the tax base and increase tax revenue collection. Also, as the economic analysts show, the economy benefits considerably through a gain in the foreign exchange premium.
10.3 Provide essential support services
Countries with active minerals trading must have trustworthy sources of appraisal and market information, provided either by competent government laboratories, licensed private laboratories, or both. Unless such laboratories exist, and have the bust of dealers and consumers, mistrust and/or confusion discount the value placed on precious minerals. Presently, transaction times and costs are increased enormously by the lack of standards of appraisal. Mineral dealers and the government need to work together to develop a system of quality control. It would include, at a minimum the following:
10.3.1 Improve market and technical information
a) Gem appraisal and certification: Gemmological appraisal is part science, part art. The Gemological Institute of America has established scientific methodology for appraising the main indices of value of a stone, carats, colour, clarity, and cut (the four Cs). These used to be understood only by trained jewellers, but the Internet has educated a much wider consuming public. Tanzania lacks certified appraisers at present, and this is felt throughout the chain, from consumer to miner. TAMIDA is the most appropriate organization to remedy this situation, by establishing criteria and certifymg appraisers. Government may also have a role.
b) Gold assaying: Fodate ly , gold assaying is much easier. The necessary training and equipment are available in the US, the Middle East, India or Europe for less than $500. Gold assaying offices of the governments can and do operate successfully throughout the world, including in many African countries.
c) Access to Internet sites providing world market prices for relevant precious minerals.
d) The MEM plans to remodel and equip a Minerals Centre in Arusha, which would be one place in which appraisal services and Internet access could be provided. The world price of gold and of the major locally produced gems should be printed out daily, and posted for all to see. It should be provided to radio stations and print media who should be encouraged to include coverage of world price benchmarks and trends for key minerals in the daily business news.
e) Establish and publish periodic1 frequent newspapers on the domestic price for gold jewellery. Require it to be posted in every goldsmith and jeweller's shop. Countries with any significant jewellery sector do this, with one price for 18 carat gold, another for 22 carat and a third for 24 carat. Jewellers then negotiate with customers over the labour price that should be added onto the base price established by weighing a piece of jewellery. This system establishes confidence for
138

tourists and other inexperienced buyers, and is in effect in gold markets throughout the world. Accompanying measures include periodic inspection of scales, and reliable gold assaying.
10.3.2 Support gem shows and other promotional activities
This does not have to meark subsidizing costs, but it should include facilitating efforts to publicize the event and easy access to visas for those attending. The objective is to promote or trigger investments.
10.3.3 Training and extelnsion
a) While large mining companies undertake extensive training programs out of their own budgets, artisanal miners lack all types of training and information. Potential sources of training and extension for indigenous miners are many, including bilateral donor-funded training, UNDO funded training offered through the SADC regional centre, and the government's current World Bank loan program. Training and equipment were the number one priorities of small miners attending both workshops, as well as those interviewed in the field. The govemment could also create incentives to formal mining companies to provide training to artisanal miners.
b) The government should facilitate visas for skilled gem cutters, trainers, business and community development specialists. They are a necessary part of developing a diversified mining-based economy, and immigration provisions designed to protect Tanzanian labour are actually hindering the growth of jobs in this sector.
c) Extension services are being introduced by the MEM, which is training zonal officials as trainers. Much more needs to be done in this regard. Each zonal minine office should have - - certain basic types of information available, including samples of different types of ore and typical surrounding bedrock, together with written instructions on how to recognize and . - diiferentiate them.-1t should also include price information and information on-appraisal services. Every zonal officer visiting a mining site should carry a kit of basic information and samples with him. Moreover, the trained officers have no funding or program for providing training to miners, who repeatedly ask for it, and little incentive to take such an initiative.
10.4 Ensure sustainable economic development
Capital, economic activity and tax revenues are beginning to pour into Tanzania. It is hard for a poor country experiencing its first boom to decide on wise investment, economic diversification, education, and infrastructure improvements. A little celebratory splurging is a far more common response. Often a few prosper and jealousy becomes endemic. And then when the boom ends, come recriminations, in fiphting and poverty again. There needs to be monitoring and control of negative externalities such as environmental and health impacts, and awareness of the need to keep out money laundering, arms and drug trading using precious minerals. The urgent task facing stakeholders is to devise a strategy to maximize sustainable development benefits of mining while it lasts. Thus, the govemment should expand the objectives to include, strengthening and enhancing targets for poverty alleviation, creating jobs and diversifyrng the economy.

We recommend a national planning commission to devise a growth management strategy. Tanzania has the moral fibber and leadership to avoid the common response to sudden wealth and to take the high road. It needs to determine in more detail than was possible in this study the pattern of growth in mining, GDP, and government revenues that can be expected. It should make concrete recommendations as to how a deeper and broader mining sector can be facilitated, so that the decline in production is not as steep as current plans would suggest. Most importantly it needs to recommend ways to diversify economic growth, to create synergies between the two major growth sectors, mining and tourism, and the economic base in agriculture, construction and trade.
Among the themes on which it should expand is the legal and regulatory structure for balancing the growth of artisanal mining and large-scale mining by multi-nationals. From a technical point of view there is little overlap in their competencies, and therefore little reason for them to see one another as competitors. With hand tools, artisanals can profitably and safely mine only surface deposits and very rich subsurface veins-to a depth of about 30 meters. Large companies, on the other hand, have huge initial overhead costs for exploration and mine construction. This is only justified when the deposit totals at least 500,000 ounces at reasonable production costs. So, large companies do not exploit many smaller deposits. Yet they often lie on their legal mining claims. In some countries large mining companies provide more effective training to small miners than government programs, and provide them with a living while doing so. Companies are often willing to allow, or even train and facilitate small miners working on unexploited sections of their claim. They need, however, assurance that such miners will not be considered their employees for liability purposes. They may also need authorization to buy and export the produce. The new mining law does not provide for this in Tanzania. Quick amendment could prevent Tanzania from missing a chance to save thousands of small mining jobs, and provide a future for small miners.

BIBLIOGRAPHY
"A chat with Ole Naiko." 1996. The Express, November 7-13:29.
African Mining Bulletin. 1997. African Mining Bulletin #12, March 26. Johannesburg: Resource Publications.
American Embassy, Bangkok. 1995. "County Commercial Guide: Thailand 1996." US. Department of Commerce, National Technical Information Service, Springfield, Virginia. June.
. 1996. "Country Commercial Guide: Thailand 1997." U.S. Department of Commerce, National Technical Information Service, Springfield, Virginia. August.
Andrews, Craig B. 1992. "Mineral Sector Technologies: Policy Implications for Developing Countries." Industry and Energy Division Note No. 19. Africa Technical Department, The World Bank. November.
Anyango, Gordon J. 1995. Executive Summary of the USAIDIComparative Transportation Cost Analysis in East Africa Project. The Management Centre, Nairobi.
Atkinson, Dan. 1997. "Rocks and Rackets." Business in Africa, no. 1365-1560. January-March: 17-20.
Bagachawa, M.S.D., and A. Naho. 1994. A Review of Recent Developments in the Second Economy in Tanzania. AERC Special Paper 16. African Economic Research Consortium.
Bangkok Bank. 1995. "Thailand's Trade Partners." www.verdi.inet.co.th:8Ol-putt/BBt/econ~tha~ Internet Thailand Service.
"Bangkok Post economic Review Year-End 1994." 1995. www.nectec.or.tWbureaux/bkkpost: The Bangkok Post.
Bank of Tanzania, Economic and Operations Report for the year ended 30th June 1996, Dar es Salaam, p. 71-72.
Barry, Mamadou, ed., 1996. "Regularizing Informal Mining," A Summary of the Proceedings of the International Roundtable on Artisanal Mining Organized by The World Bank, Washington, D.C., May 17-19, 1995. Industry and Energy Department Occasional Paper No. 6. April.
Beesley, Cap. 1996. "Burma Report." www.primenet.corn/-rgenis/Forecasters.htrn The Gemstone Forecaster 14, no. 2, part one.
"BET: Facilitator of export drive." 1996. The Express, November 7-13:30.
Beyani, Chaloka. 1997. "Legal safeguards in Africa." Mining Journal 328, no. 8414:15.
Bezerra, Oswaldo, Adalberto Verissimo, and Christopher Uhl. 1996. "The Regional impacts of small- scale gold mining in Amazonia." Natural Resources Forum 20, no.4:305-317.
Blamey, Chris. 1996. "One Company, 50 million carats of sapphire a year." www.gemstone.org: International Colored Gem Association.
Bray, John. 1997. "Political risk in Africa." Mining Journal 328, no. 8414:6,9,
"Burma Mining Industry Profile." 1994. www.tradeport.org: Tradeport.
Cairns, Luise. May 21-27, 1999. Joint Venture to Mine World's Only Known Tanzanite Reserve. Mining Weekly, Johannesburg.
Chachage 1994. Study on Mining Operations and Socio-economic aspects from Late 1930's to early 1990's.
"Comparing privatisation in Tanzania and Uganda." 1996. The Express, November 7-13:30.
Cooper & Lybrand 1998, International Tax Summaries.
C8te d'lvoire, Republic of, Office of the Prime Minister, Centre de Promotion des Investissements en C6te d'Ivoire (CEPICI). 1996. Informational brochures: "Mining Code," "Investment Code," "Formalities Relating to the Life of the Enterprise," "Factor Costs."
C6te d'Ivoire, Republic of. 1995. "The Mining Code." Law No. 95-553, July 18.
Davies, C., and R.J. Chase. 1994. "The Merelani Graphite-Tanzanite Deposit, Tanzania: An Exploration Case History." Exploration Mining Geology, 3, no. 4:371-82.
De Silva, Errol. 1996. "Thai Jewelry Industry Formulating 'Master Plan'." www.diarnonds.com: Martin Rapaport.
Dissanayake, C.B., and MS. Rupasinghe. 1995. "Classification of gem deposits of Sri Lanka." Geologie en Mijnbouw 74:79-88.
Economic and Social Research Foundation (ESRF) in collaboration with Tan Discovery. 1997. "Mineral Sector Development Strategy." Ministry of Energy and Minerals, Dar es Salaam. January 29.
Economic and Social Research Foundation, in collaboration with Tan Discovery and International Business Initiatives 1998. "Gemstone and Gold Marketing for Small-Scale Mining in Tanzania." Final Report for Phase I USAID Equity and Growth through Economic Research Trade Policy Studies. Rossyln, VA.
Economic and Social Research Foundation. The Parallel Economy in Tanzania: Magnitude, Causes and Policy Implications. Economic and Social Research Foundation, The Business Centre.
Eliezri, LZ., and Cheryl Kremkow. 1996. "The 1995 ICA World Gemstone Report." www.gemstone.org: International Colored Gem Association.
Engineering Associates (T) Limited. 1991. Study of Investment in Small and Medium Mining in Tanzania. SADCC Mining Coordination Unit, Dar es Salaam.
Ephson, Ben. 1989. "Galamsey goes legal." West Africa, May 1-7:680.
Fairbanks and Stace. 1998. Plowing the Sea: Nurturing Hidden Sources of Growth in Developing Economies.
142
"Four anti-Mobutu parties unite." 1996. The Guardian, November 7:ll.
Gems & Jewelry. A sparkling performance". 1995. www.nectec.or.th/bureaux/bkkpost: The Bangkok Post.
Genis, Robert. 1995. Sapphires: "The Prince of Gems." www.primenet.com/-rgenis/Forecasters.html: The Gemstone Forecaster 13, no. 4, part one.
. 1996a. "Colored Diamonds: Australian Pink." www.primenet.com/-rgenis/ Forecasters.htm1: The Gemstone Forecaster 14, no. 4, part one.
. 1996b. "Tsavorite: The Green Fire Garnet." www.primenet.com/-rgenis/Forecasters.html: The Gemstone Forecaster 14, no. 3, part one.
Ghana, Republic of. "Diamonds (Amendment) Law, 1989." Ghana Publishing Corporation, Printing Division. Accra 1989.
"Minerals and Mining Law, 1986." Ghana Publishing Corporation, Printing Division. Accra
. "Minerals (Royalties) Regulations, 1987." Ghana Publishing Corporation, Printing Division. Accra 1987.
. "Mercury Law, 1989." Ghana Publishing Corporation, Printing Division. Accra 1989.
. "Small-Scale Gold Mining Law, 1989." Ghana Publishing Corporation, Printing Division. Accra 1989.
. "Minerals and Mining (Amendment) Act, 1994." Ghana Publishing Corporation, Printing Division. Accra 1994.
Goldman, Anthony. 1996. "Oil Boom May turn Tiny African State Around." The East African, November 4-10:13.
Goransson, Bo. 1996. "Sweden spearheads new relations with the world's developing countries." The Guardian, November 7:6.
Government of Kenya, Commissioner of Mines and Geology, Mines and Geological Department, Ministry of Environment. 1996. "Mining Investment Opportunity in Kenya."
Hansfeld, Herz. "Diamond Manufacturing and Distribution." International Gemological Symposium June 21-24, 1996 (GIA, San Diego).
Haonga, Michael. 1996. "Mrema, Lamwai to face charges." The Guardian, November 7:ll.
Harris 1958
Haule, John. 1996. "Information on minerals computerized at Dodoma." The Guardian, November 22:3.
143
Hester 1991 and 1996. "Opportunities for Mineral Resource Development."
Hollaway 1994. "Small-Scale Mining in Tanzania" Technical Assesment of UNDP Financial Study.
Ikingura et a1 1996. Study on Heavy Metals Found in Lake Victoria Area.
International Colored Gem Association. 1996a. "Gem Import & Export Statistics." www.gemstone.org: International Colored Gem Association.
. 1996b. "Thailand Gem Supply Update." www.gemstone.org: International Colored Gem Association.
. 1996c. "The 1995 ICA World Gemstone Mining Report." www.gemstone.org: International Colored Gem Association.
International Conference on Development, Environment and Mining. 1994. "Development, Environment, and Mining: Enhancing the Contribution of the Mineral Industry to Sustainable Development," Post Conference Summary. Washington, D.C., June 1-3.
"International Market Updates." 1995. www.primenet.com/-rgenis/Forecasters.htm The Gemstone Forecaster 13, no. 4, part two.
"International Market Updates." 1996. www.primenet.com/-rgenis/Forecasters.html: The Gemstone Forecaster 14, no. 3, part two.
International Monetary Fund (IMF). 1995a. Tanzania - StaffReport for the 1995 Article IV Consultation. Washington, D.C. International Monetary Fund. November.
. 1995b. Tanzania - Statistical Appendix. Washington, D.C. International Monetary Fund. November.
"International Update." 1996. www.primenet.com/-rgenis/Forecasters.hhn The Gemstone Forecaster 14, no. 2, part two.
"Into the lion's den." 1997. Mining Journal 328, no. 8414:l.
Inyangete, Charles. 1996a. "Fledgling financial markets." The Express, November 7-13:16-17.
. 1996b. "Tanzania's economic climate grows." The Express, November 7-13: 16-17.
Janowski, Ben.1996. "What is the future of the US. jewelry market?" www.gemstone.org: International Colored Gem Association.
John Hollaway and Associates for the United Nations Development Programme. 1993. "Small Scale Mining in Tanzania: A Technical Assessment." Harare, April.
Kadiri, Jacqueline. 1996. "Japan donates to Newala Development Foundation." The Guardian, November 22:3.

Keller, Peter C. 1992. Gemstones of East Africa. Phoenix: Geoscience Press.
Kelley, Kevin J. 1997. "Female Cutting Could Mean End to World Bank Loans." The East African, January 13-19:7.
Kigoda, Abdallah 0. 1997. "Towards Attaining Global Mining Competitiveness in Tanzania." Paper presented at the Multilateral Investment Guarantee Agency's Fourth Annual African Mining Investment Symposium, Denver, June 3-5.
Kigoma, Lucas Liganga. 1996. "Do not accommodate refugees - Makarnba." The Guardian, November 21:2.
Kilonzo, Semkae. 1996. "Is there prejudice against artisan miners?" The Guardian, November 11 :6.
Kimambo 1984. Tanzanian Minerals Potential and Various Mining Activities from the Late 1950's to the mid-1970s.
Kithama, Joseph. 1996a. "Sweden Set to Stop Aid for Tanzania." The EastAfrican, November 4-10:l-2.
. 1996b. "Tanzania's Ban on Maize Exports is Likely to Hit Kenya." The East African, November 4-10:21.
. 1997. "Tanzania Writes Up New Laws for Investors." The EastAfrican, January 13-19:l.
Kremkow, Cheryl. 1996. "Estimating the Size of the World Gemstone Market." www.gemstone.org: International Colored Gem Association.
"Lack of stock market hamstrings Tanzania." 1996. The Express, November 7-13:ll.
Liyanage, Din V. 1996a. "Bangkok Market Report - Producers Faltering in Brutal Competition." www.diamonds.com: Martin Rapaport.
. 1996b. "Thailand Back on Track for Gem Trade Supremacy." www.diamonds.com: Martin Rapaport.
Lwakatare 1994. "Small-Scale Mining in Tanzania" Institutional Framework of UNDP Financial Study.
Mabele, R.B. 1995. Transport andAgricultural Development Under Sfructural Adjustment in Tanzania. Dar es Salaam: SAP.
Mankad, H. 1996. "Euroafrican perspective on foreign investment." The Express, November 7-13:25.
Merere, Ahmed. 1996a. "Dar Drafts New Mining Law to Woo Investors." The East African, November 11-17:1,32.
. 1996b. "Tanzania Lowers Port Tariffs In Bid to Woo Shippers." The East African, April 8- 14: 1-2.
. 1996c. "Tanzania Sets Up Oil Import Rules." The East African, November 4-10:6.

. 1996d. "Tanzania to Establish Maritime Authority." The East African, November 4-10:23.
Mineral Sector Development Project funded by World Bank (engineering association and Tan Discovety 1994.)
Minerals Commission. Procedure for the Acquisition of Mineral Prospecting License in Ghana. Accra, Minerals Commission.
Ministry of Energy and Minerals, ed. Brian Hester 1992, 1995.
Ministry of Energy and Minerals 1997
"Monitors dispute fairness of Zambia elections." 1996. The Guardian, November 21: 10.
Mruma, Hayaz H.H. 1994. "Annual Report for the Project URT/90/020: Strengthening of the Mineral Resources Department." UNDP-MADINI, Dodoma, Tanzania. March.
Muiruri, Stephen and Mburu Mwangi. 1996. "Family of three die in tragic flight." Daily Nation, November 15: 1-2.
Murusuri, Dereck. 1996. "Increase non-traditional exports to generate forex." The Guardian, November 22:3.
Mutagwaba et a1 1997.
Mutumba-Lule, A. 1996. "Cement Firms Move to Up Production." The East African, November 4-10:21.
Mwakisyala, James. 1996. "Tanzania to Hawk Public Firms to SADC." The East African, April 15-21 :1- 2.
Mwambande, Lwaga. 1996. "Too early to criticize govt, CCM official says." The Guardian, November 7:3.
Mwamukonda, G.R. 1994. An Appraisal of the Banks Perspective towards the Gold Buying Business in Tanzania. United Republic of Tanzania: The National Bank of Commerce.
Mwandenga, Adam. 1996. "Tanzania's Poor Economic Performance: Intellectuals have not played their part." The Guardian, November 22:5.
Mwapachu, Juma V. 1996. "Investing in Tanzania." The Express, November 7-13:28.
Mwiturnba, Evarist. 1996. "Eastern Africa land valuers gather at UCLAS." The Guardian, March 26:l.
National Mining Awareness Workshop Chamber of Mines in Mwanza September 25-28, 1999.
Ndejembi, Edna. 1996. "Geologist warns on heavy Tanzanite mining." The Guardian, December 5.
"New technology spurs British water industry." 1996. The Express, November 7-13: 11.

Ngimbwa, Yakhub B. 1996. "B. And Associates Prefeasibility Report on Gemstones Mining and Processing Cutting, Polishing & Exporting." Paper presented at the Tanzania International Investors Forum, Dar es Salaam, November 5-8.
Ngonyani, Edwin A. 1996. "Development of Small Scale Gold and Gemstone Mining in Tanzania." Paper presented at the Workqhop in memory of the Late Prof. Dr. J.T. Nanyaro, University of Dar es Salaam, January 16.
O'Callaghan, Gary. 1993. The Structure and Operation of the World Gold Market. International Monetary Fund Occasional Paper, No. 105. Washington D.C.
Odhiambo, M.O., P. Kristjanson, and J. Kashangaki. 1995. Comparative Cost of Production Analysis in East Africa. Summary Report. Mwaniki Associates LTDNSAID Regional Economic Development Services Office/AFR/PSGE PARTS Project.
"Panorama: Namibian model for small-scale mining." 1993. Mining Magazine 169, no. 5:236-7.
"Parastatal privatisation: The process." 1996. The Express, November 7-13: 19.
Picton, James. June 21-24, 1999. "African Diamond Production in the 21" Century," Gemological Institute of America's Intemational Gemological Symposium, San Diego, CA.
"Policy aims at curbing mining sector gaps." 1996. Financial Times, November 20:3.
Price Waterhouse, Doing Business ...... series in different years.
"Privatisation that stirs up doubt." 1996. The Express, November 7-13: 11
"Quality control not observed." 1996. Financial Times, November 20:3.
Rhodesia [now Zimbabwe, Republic of]. "The Gold Trade Act." The Government Printer. Harare 1940.
. "The Gold Trade Amendment Act, 1978." The Government Printer. Harare 1978.
"SADC: Unequal economies and trade pacts." 1996. Financial Times, November 20-26:16.
Sarris, A.H., and R. Van den Brink. 1993. Economic and Household Welfare During Crisis and Adjustment in Tanzania. New York University Press, New York and London.
Schemo, Diana Jean. 1996. "Legally, Now, Venezuelans to Mine Fragile Lands." The New York Times, December 8:22.
Semwaiko, Richard. 1996. "New focus on Agriculture." The Express, November 7-13:24-5.
Sezinga, R., A. Mruma, and It. Nindie. 1995. Report on a Baseline Survey of Artisanal Mining in Tanzania. Tan Discovery Minerals Consulting/The World Bank, Dar es Salaam.
Spriggs, Michael. 1997. "Financing projects in Africa." Mining Journal 328, no. 8414:3-5.
"State Mining Corporation dissolved." 1997. The Express, January 23-29:9.
147
Strongman, John. 1994. "Strategies to attract new investment for African mining." Industry and Energy Department of the vice Presidency for Finance and Private Sector Development, The World Bank, Washington, D.C. June.
Sunguh, George. 1996. "Burundi Barred from Meeting of Top Users of Mombassa Port." The East African, November 4-10:23.
Tan Discovery Minerals Consulting. 1996a. Draft Report of Supplementary Data an Information on Baseline Survey and Preparation of Development Strategy for Small Scale and Artisanal Mining Program. Tan Discovery Minerals ConsultingIThe World Bank, Dar es Salaam.
. 1996b. Preliminary Report on Baseline Survey and Preparation of Development Strategy for Small Scale and Artisanal Mining Program. Tan Discovery Minerals ConsultinglThe World Bank, Dar es Salaam.
Tanganyika [now Tanzania, United Republic of]. "The Diamond Industry Protection Ordinance." The Government Printer. Dares Salaam 1958.
. Gold Trading: Chapter 127 of the Laws (Revised): principal Legislation). The Government Printer. Dares Salaam 1958.
. "The Explosives Act, 1963." The Government Printer. Dares Salaam 1963.
. "The Explosives Regulations, 1964." The Government Printer. Dar es Salaam 1964.
."Mining - Chapter 123 of the Laws (revised)." The Government Printer. Dar es Salaam 1969.
"Tanzania Breweries: A torch bearer." 1996. The Express, November 7-13:20.
Tanzania Chamber of Mines. Constitution. April 1994.
Tanzania, Government of. 1995. Tanzania Export Strategy.
Tanzania, Government of, Ministry of Water, Energy and Minerals. 1995. Opportunities for Mineral Resource Development. Colorado: Knudsen Printing.
. Annual Report of the Mineral Resources Department, 1991.
Tanzania, Government of. Implementation Manual. Ministry of Water, Energy and Minerals~World Bankmineral Sector Development Technical Assistance Project. Dar es Salaam, March 1994.
Tanzania, United Republic of, Intra-Governmental Task Force. 1995. Export Development Strategy and Action Plan (1995-2000).
Tanzania, United Republic of. "The Gemstone Industry (Development and Protection) Act, 1967." The Government Printer. Dar es Salaam 1967.
. "The Gemstone Industry (Development and Protection) Regulations, 1969." The Government Printer. Dares Salaam 1969.
. "The Mining Act, 1979." The Government Printer. Dares Salaam 1979.
. "The Mining (Claims) Regulations, 1980." The Government Printer. Dares Salaam 1980.
. "The Mining (Mineral Rights) Regulations, 1980." The Government Printer. Dar es Salaam 1980.
. "The Mining R.egulations, 1999." The Government Printer. Dar es Salaam 1999
. "The Mining (I?rospecting Rights) Regulations, 1980." The Government Printer. Dar es Salaam 1980.
. "The Mining (Royalty) Regulations, 1980." The Government Printer. Dar es Salaam 1980.
. Speech by H.E. Benjamin William Mkapa, President of the United Republic of Tanzania at the Occasion of Opening the International Investment and Technology Forum; Sheraton Hotel, Dar es Salaam November 5, 1996. The Govemment Printer. Dar es Salaam 1996.
Tasseni, Miki. 1996. "Open letter on development co-operation." The Guardian, November 22:6.
"TCC: A new era sets in." 1996. The Express, November 7-13:24.
"TCCIA: Where 5,000 traders channel their ideas." 1996. The Express, November 7-13:31.
Thailand, Government of. Policies and Statistics on Mining. Faxed by the Office of the Economic Counselor, Royal Thai Government on October 30, 1996; source unknown.
Tindwa, Peter. 1997. "Govt adjusts tax rates for minerals to woo investors." The Guardian. May 12.
"Transition brings economic growth." 1996. The Express, November 7-13:ll.
Twurn and Kanza 1992 UNDP study "Export Development and Promotion of Mineral Resources."
UNDP 1992. Harare Guidelines for the Development of Small-scale Mining.
U.S. & Foreign Commercial Service Country Marketing Plan FY 1994. 1994. Thailand.
US. Department of State. Background Notes Thailand. Bureau of Public Affaires. Washington, D.C. 1996.
United States Agency for International Development (USAID). 1996. A Study on the Cost Structure of Representative Manufacturing Firms in Tanzania, Vol. 1,2. May.
United States Department of Commerce. 1996a. "Country Commercial Guide: Sri Lanka Fiscal Year 1997." U.S. Department of Commerce, National Technical Information Service, Springfield, Virginia. July.

. 1996b. Country Commercial Guide FY 1996: Tanzania." U.S. Department of Commerce, National Technical Information Service, Springfield, Virginia.
. 1997. "Country Commercial Guide: Tanzania, Fiscal Year 1997." U.S. Department of Commerce, National Technical Information Service, Springfield, Virginia.
United States Department of the Interior, Bureau of Mines. World Gold: A Minerals Availability Appraisal. U.S. Government Printing Office. Washington, D.C. 1994.
. Mineral Industries of Africa. U.S. Government Printing Office. Washington, D.C. 1995.
"Unleashing private initiative." 1996. The Express, November 7-13: 19-20.
"USA to foster stronger Trade ties with Africa." 1996. Financial Times, November 20: 10.
Venance, Nick. 1996. "Bright future for miners." Daily News, November 1 4 5
"Venture capital in Tanzania." 1996. The Express, November 7-13: 18.
Vethouse Associates, Inc. for the United States Agency for International Development (USAIDITanzania). 1995. "The Mineral Sector in Tanzania." December.
Wanjala, George. 1996. "UNIDO set to improve mining industry." The Guardian, November 7:3.
Warigi, Gitau. 1996. "Strategic as well as Ethnic Factor in Zaire Fighting." The East African, November 4-10:lS.
"We want investors, say job-seekers." 1997. The Express, November 7-13:4.
Whiteman, Kaye. "Building on Obuasi." West Africa, no. 4136:238-9.
World Bank. 1993. Tanzania Mineral Sector Development Technical Assistance Project, World Bank Project Appraisal Report. Washington, D.C., The World Bank.
. 1994. Memorandum and Recommendation of the President of the International Development Association to the Executive Directors on a Proposed Credit in the amount of SDR 8.9 Million to the United Republic of Tanzania for a Mineral Sector Development Technical Assistance Project. Report No. P-6276-TA, 1994. Washington, D.C., World Bank.
. 1995a. "A Comprehensive Strategy Toward Artisanal Mining." The World Bank, Industry and Mining Division, Industry and Energy Department. August.
. 199%. Argentina Mining Sector Development. World Bank Project Appraisal Report. Washington, D.C., The World Bank.
. 1995c. Burkina Faso Mining Sector Capacity Building and Environmental Management Project. World Bank Project Appraisal Report. Washington, D.C., The World Bank.
. 1995d Proceedings of the International Roundtable on Artisanal Mining, 1995. Washington, D.C.: The World Bank.

World Economic Forum and Harvard Institute for International Development. 1999. The Africa Competitiveness Report 1998.
World Resources. 1997. World Resources: A Guide to the Global Environment, The Urban Environment, 1996-97.
World Tables 1995.
Yarnaguchi, Ryo. 1996. "Understanding the Jewelry Market in Japan." www.gemstone.org: International Colored Gem Association.
"Zairean refugees cross lake into Tanzania." 1996. The Guardian, November 7:lO.
Zimbabwe, Republic of. "Precious Stones Trade Act." The Government Printer. Harare 1996
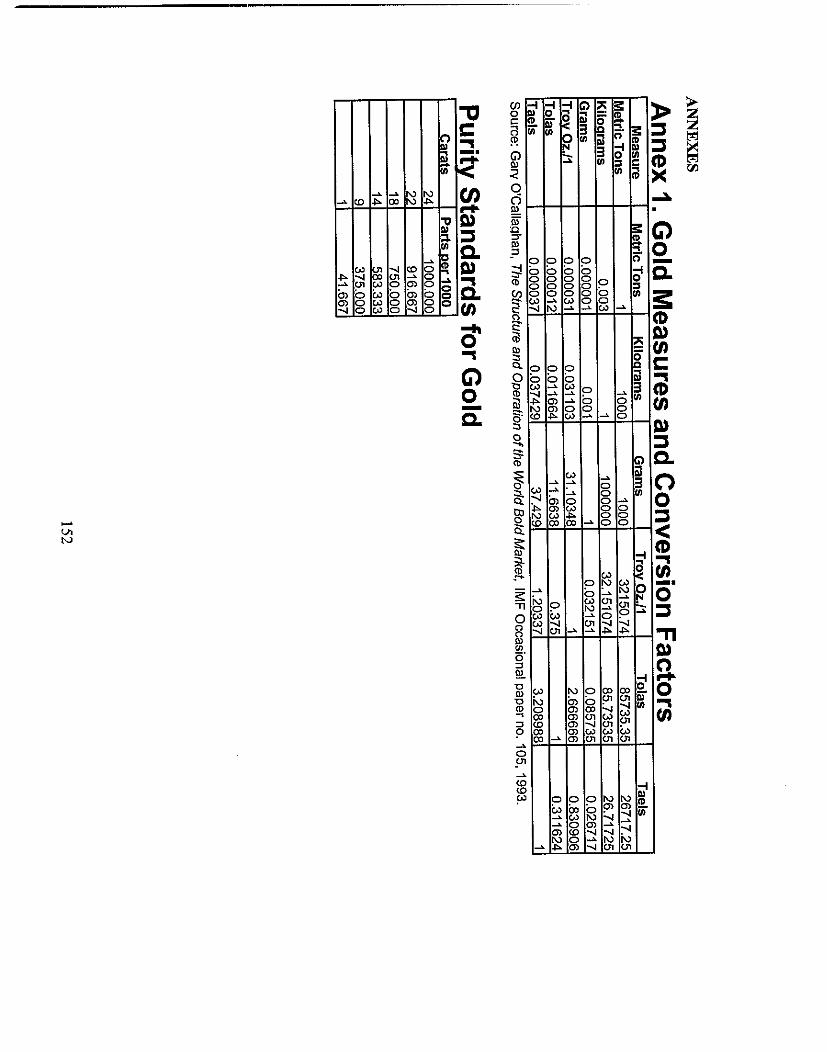
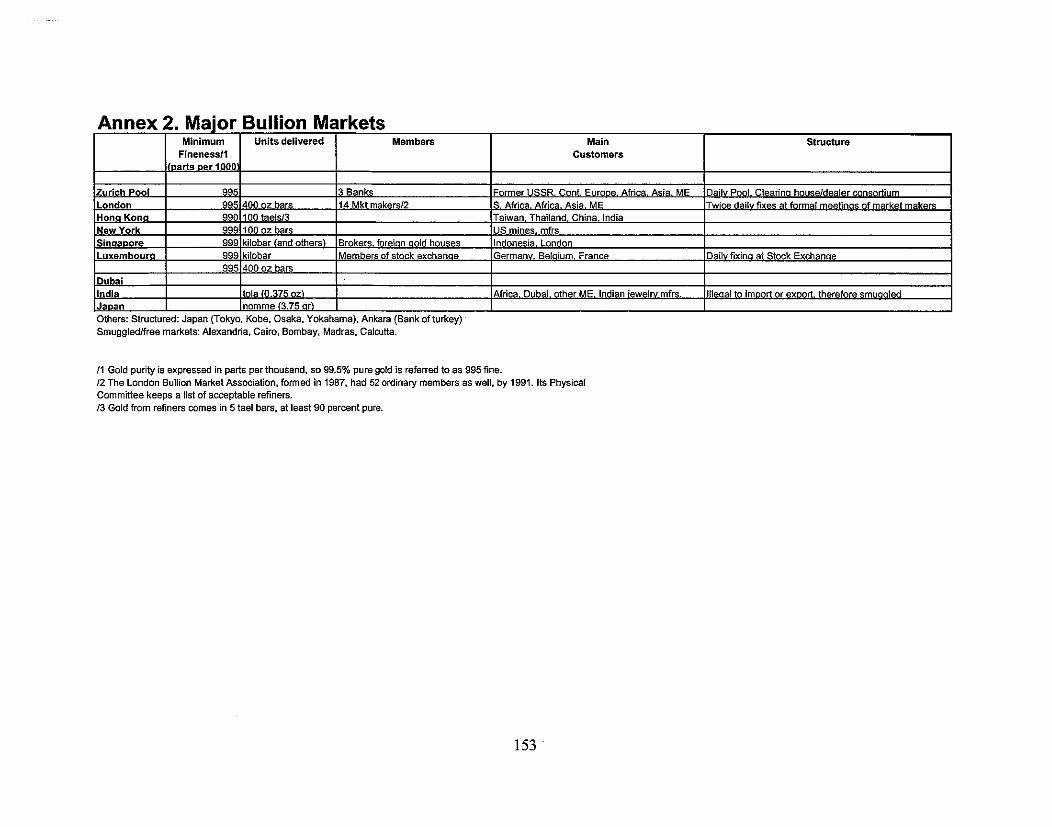
Annex 2. Major Bullion Markets I Minimum I Units delivered I Members I Main I Structure I
Customers
S insa~ore I 9991kilobar land others) IBrokers. foreion oold houses Ilndonesia. London I iiiiernboiiici ! 999!kilobai !:riernbeis of stock exchanqe !~eirnanv. Beigium. iiance !=a;% fixing at Siock ixchanqe
1 9951400 oz bars 1 1 I I I I I
h a 10.375 oz) I~ f r ica . Dubai. other ME. Indian ieweiw mfrs. liiie oa I to irn 0011 or exoort. therefore -led I lnomme (3.75 or) I
Others: Structured: Japan (Tokyo, Kobe. Osaka. Yokaharna), Ankara (Bankof turkey) Srnuggledlfree markets: Alexandria. Cairo. Bombay. Madras, Calcutta
11 Gold purity is expressed in parts per thousand, so 99.5% pure gold is referred to as 995 fine. 12 The London Bullion Market Association. formed in 1987. had 52 ordinary members as well. by 1991. Its Physical Committee keeps a list of acceptable refiners. 13 Gold from refiners wmes in 5 tael bars, at least 90 percent pure.

To Order EAGER Publications
EAGER Publications/BHM P.O. Box 3415
Alexandria, Virginia 22302 Tel: (703) 299-0650 Fax: (703) 299-0651
e-mail: svriddv~eagemroiect.com
EAGER Publications can be downloaded from www.eagerproject.com or through USAID's website at www.dec.org
Policy Briefs based on EAGER research funded by the U.S. Agency for International Development:
1. Can Mali Increase Red Meat Exports? Metzel, Jeffrey, Abou Doumbia, Lamissa Diakite, and N'Thio Alpha Diarra. Prospects for Developing Malian Livestock Exports. Cambridge, MA: Associates for International Resources and Development, 1997. Available in French.
2. The Livestock Sector in Mali - Potential for the Future. Metzel, Jefiey, Abou Doumbia, Lamissa Diakite, and N'Thio Alpha Diarra. Prospects for Developing Malian Livestock Exports. Cambridge, MA: Associates for International Resources and Development, 1997. Available in French.
3. Mali's Manufacturing Sector: Policy Reform for Success. Cockburn, John, Eckhard Siggel, Massaoly Coulibaly, and Sylvain Vkina. Manufactwing Competitiveness and the Structure of Incentives in Mali. Cambridge, MA: Associates for International Resources and Development, 1997. Available in French.
4. Growth and Equity: Gemstone and Gold Mining in Tanzania. Phillips, Lucie Colvin, Rogers Sezinga, Haji Semboja, and Godius Kahyarara. Gemstone and Gold Marketing for Small-Scale Mining in Tanzania. Arlington, VA: International Business Initiatives, 1997. Available in French.
5. Financial Services and Poverty in Senegal. Ndour, Hamet, and Aziz Wane. Financial Intermediation for the Poor. Cambridge, MA: Harvard [nstitute for International Development, 1997. Available in French.
6. Need to Promote Exports of Malian Rice. Barry, Abdoul W., Salif B. Diarra, and Daouda Diarra. Promotion of the Regional Export of Malian Rice. Cambridge, MA: Associates for International Resources and Development, 1997. Available in French.
7. Trade Policy Reform: A Success? Metzel, Jeffrey, and Lucie C. Phillips. Bringing Down Barriers to Trade: The Experience of Trade Policy Refbrm. Cambridge, MA: Associates for International Resources and Development, 1997. Available in French.
8. Excise Taxes: A Greater Role in Sub-Saharan Africa? Bolnick, Bruce, and Jonathan Haughton. Tax Policy in Sub-Saharan Africa: Reexamining the Role of Excise Taxation. Cambridge, MA: Harvard Institute for International Development, 1997. Available in French.

9. Status of Financial Intermediation for the Poor in Africa. Nelson, Eric. Financial Intermediation for the Poor: Survey of the State of the Art. Bethesda, MD: Development Alternatives Incorporated, 1997. Available in French.
10. Foreign Direct Investment and Institutions. Wilhelms, Saskia K.S. Foreign Direct Investment and Its Determinants in Emerging Economies. Cambridge, MA: Associates for International Resources and Development, 1997. Available in French.
11. Strong Institutions Support Market-Oriented Policies. Goldsmith, M u r . Institutions and Economic Growth in Afn'ca. Cambridge, MA: Harvard Institute for International Development, 1997. Available in French.
12. Reducing Tax Evasion. Wadhawan, Satish, and Clive Gray. Enhancing Transparency in Tax Administration: A Survey. Cambridge, MA: Harvard Institute for International Development, 1997. Available in French.
13. Can Africa Take Lessons from the U.S. Approach to Tax Evasion? Gray, Clive. Enhancing Transparency in Tax Administration: United States Practice in Estimating and Publicizing Tax Evasion. Cambridge, MA: Harvard Institute for International Development, 1997. Available in French.
14. Estimating Tax Buoyancy, Elasticity and Stability. Haughton, Jonathan. Estimating Tax Buoyancy, Elasticity, and Stability. Cambridge, MA: Harvard Institute for International Development, 1997. Available in French.
15. Estimating Demand Curves for Goods Subject to Excise Taxes. Jonathan Haughton. Estimating Demand Curves for Goods Subject to Excise Taxes. Cambridge, MA: Harvard Institute for International Development, 1997. Available in French.
16. Fixed or Floating Exchange Rates? Amvouna, Anatolie Marie. Determinants of Trade and Growth Performance in Africa: A Cross-Country Analysis of Fixed Versus Floating Exchange Rate Regimes. Cambridge, MA: Associates for International Resources and Development, 1997. Available in French.
17. Trade and Development in Africa. Stryker, J. Dirck. Trade and Development in Africa. Cambridge, MA: Associates for International Resources and Development, 1997. Available in French.
18. Increasing Demand for Labor in South Africa. Stryker, J. Dirck, Fuad Cassim, Balakanapathy Rajaratnam, Haroon Bhorat, and Murray Leibbrandt. Increasing Demand for Labor in South Africa. Cambridge, M A : Associates for International Resources and Development, 1998.
19. Structural Adjustment: Implications for Trade. Barry, Abdoul W., B. Lynn Salinger, and Selina Pandolfi. Sahelian West Africa: Impact of Structural Adjustment Programs on Agricultural Competitiveness and Regional Trade. Cambridge, MA: Associates for International Resources and Development, 1998. Available in French.
20. The Uruguay Round: Impact on Africa. Hertel, Thomas W., William A. Masters, and Aziu Elbehri. The Uruguay Round and Africa: A Global, General Equilibrium Analysis. Cambridge, MA: Associates for International Resources and Development, 1998. Available in French.
21. Are Formal Trade Agreements the Right Strategy? Radelet, Steven. Regional Integration and Cooperation in Sub-Saharan Africa: Are Formal Trade Agreements the Right Strategy? Cambridge, MA: Harvard Institute for International Development, 1997.
22. Textiles in South Africa. Flaherty, Diane P., and B. Lynn Salinger. Learning to Compete: Innovation and Gender in the South African Clothing Industry. Cambridge, MA: Associates for International Resources and Development, 1998. Available in French.

23. Barriers to Business Expansion in a New Environment: The Case of Senegal. Beltch'ka-St. Juste, Ndaya, Mabousso Thiam, J. Dirck SQker, with assistance from Pape Ibrahima Sow. Barriers to Business Expansion in a New Environment: The Case of Senegal. Cambridge, MA: Associates for Intemational Resources and Development, 1999. Available in French.
24. Government and Bureaucracy. Goldsmith, Arthur. Africa's Overgrown State Reconsidered: Bureaucracy and Economic Growth. Cambridge, M A : Harvard Institute for International Development, 1998.
25. What Can We Do To Stop Smuggling in Tanzania? Phillips, Lucie Colvin, Rogers Sezinga, and Haji Semboja. Based on EAGER research in Tanzania on gold and gems marketing. Arlington, VA: International Business Initiatives, 1997.
26. Financial Programming in East and Southern Africa. Workshop held in Lilongwe, Malawi. June, 1999.
27. Restarting and Sustaining Growth and Development in Africa: A Framework for Action. Duesenberry, James S., Arthur A. Goldsmith, and Malcolm F. McPherson. Restarting and Sustaining Growth and Development in Africa. Cambridge, M A : Harvard Institute for International Development, 2000.
28. Restarting and Sustaining Growth and Development in Africa: Enhancing Productivity. Duesenberry, James S., Arthur A. Goldsmith, and Malcolm F. McPherson. Restarting and Sustaining Growth and Development in Africa. Cambridge, MA: Haward Institute for International Development, 2000.
29. A Pragmatic Approach to Policy Change. Duesenberry, James S., and Malcolm F. McPherson. Restarting and Sustaining Growth and Develoj>ment in Afn'ca: The Role of Macroeconomic Management. Cambridge, MA: Haward Institute for International Development, forthcoming in 2000.
30. Finance Capital and Real Resources. Duesenbeny, James S., and Malcolm F. McPherson. Restarting and Sustaining Growth and Development in Africa: The Role ofMacroeconomic Management. Cambridge, M A : Harvard Institute for International Development, forthcoming in 2000.
31. The Role of Central Bank Independence in Improved Macroeconomic Management. Duesenbemy, James S., and Malcolm F. McPherson. Restarting and Sustaining Growth and Development in Africa: The Role of Macroeconomic Management. Cambridge, MA: Harvard Institute for International Development, forthcoming in 2000.
32. Governance and Macroeconomic Management. Duesenbeny, James S., and Malcolm F. McPherson. Restarting and Sustaining Growth and Development in Afn'ca: The Role of Improved Macroeconomic Management. Cambridge, MA: Harvard Instihlte for Intemational Development, 2000.
33. The Benefits and Costs of Seignorage. McPherson, Malcolm F. Seignorage in Highly indebted Developing Countries. Cambridge, MA: Harvard Institute for International Development, 2000.
35. Global Trade Analysis for Southern Africa. Masters, William A. Based on EAGERresearch in Southern Africa. West Lafayette, M: Purdue University, 2000.
36. Modeling Long-Term Capacity Expansion Options for the Southern African Power Pool (SAPP). Sparrow, F. T., Brian H. Bowen, and Zuwei Yu. Modeling Long-Term Capacity Expansion Options for the Southern Afn'can Power Pool (SAPP). West Lafayette, M: Purdue University, 1999.
38. Africa's Opportunities in the New Global Trading Scene. Salmger, B. Lynn, Anatolie Marie Amvouna, and Deirdre Murphy Savarese. New Trade Opportunities for AjXca. Cambridge, MA: Associates for Intemational Resources and Development, 1998. Available in French.

39. Implications for Africa of Initiatives by WTO, EU and US. Plunkett, Daniel. Implications for Africa of Initiatives by WTO, EU and US. Cambridge, MA: Associates for International Resources and Development, 1999.
40. Domestic Vanilla Marketing in Madagascar. Metzel, Jeffrey, Emilienne Raparson, Eric Thosun Mandrara. The Case of Vanilla in Madagascar. Cambridge, MA: Associates for International Resources and Development, 1999.
41. The Transformation of Microfinance in Kenya. Rosengard, Jay, Ashok S. Rai, Aleke Dondo, and Henry 0. Oketch. Microfinance Development in Kenya: Transforming K-Rep 's Microenterprise Credit Program into a Commercial Bank. Cambridge, MA: Harvard Institute for International Development, 1999.
42. Africans Trading with Africans: Cross-Border Trade - The Case of Ghana. Morris, Gayle A., and John Dadson. Ghana: Cross Border Trade Issues. Arlington, Virginia: International Business Initiatives, 2000.
43. Trade Liberalization and Growth in Kenya. Glenday, Graham, and T. C. I. Ryan. Based on EAGER Research. Cambridge, MA: Belfer Center for Science &International Affairs, 2000.
46. Labor Demand and Labor Productivity in Ghana. Gyan-Baffour, George, and Charles Betsey, in collaboration with Kwadwo Tutu and Kwabia Boateng. Increasing Labor Demand and Labor Productivity in Ghana. Cambridge, MA: Belfer Center for Science &International Affairs, 2000.
47. Foreign & Local Investment in East Africa. Phillips, Lucie C., Marios Obwona, Margaret McMillan, with Aloys B. Ayako. Foreign and Local Investment In East Africa, Interactions and Policy Implications: Case Studies on Mauritius, Uganda and Kenya. Arlington, Virginia: International Business Initiatives, 2000.
48. Does it pay to court foreign investment? Phillips, Lucie C., Marios Obwona, Margaret McMillan, with Aloys B. Ayako. Foreign and Local Investment in East Africa: Interactions and Policy Implications. Arlington, Virginia: International Business Initiatives, 2000.
49. Ethnicity & Investment Promotion: A Thorny Path for Policy Makers. Phillips, Lucie C., Marios Obwona, Margaret McMillan, with Aloys B. Ayako. Foreign and Local Investment in East Africa: Interactions and Policy Implications. Arlington, Virginia: International Business Initiatives, 2000.
50. Monetary and Exchange Rate Policy in Uganda. Musinguzi, Polycarp, with Marios Obwona, and J. Dirck Swker. Monetary and Exchange Rate Policy in Uganda. Cambridge, MA: Associates for International Resources and Development, 2000.
55. The Impact of Policy Reforms on Bank Efficiency and Savings Mobilization in Ghana. Ziorklui, Sam, in collaboration with Philip Fanara, Jr., Charlie Mahone, C.W.K. Ahiakpor, Fritz Gockel, Sam Mensah, Steven Ameyaw, and Anthony Doku. The Impact of Financial Sector Reform on Bank Efficiency and Financial Deepening for Savings Mobilization in Ghana. Washington, DC: Howard University, 2001.
56. Constraints to Capital Market Development and Growth in Sub-Saharan Africa: The Case of Tanzania. Ziorklui, Sam, in collaboration with Lemma W. Senbet, Abdiel G. Abayo, Flora Musonda, Bartholomew Nyagetera, Longinus Rutasitara, and Gabriel D. Kitua. Capital Market Development and Growth in Sub-Saharan Africa: The Case of Tanzania. Washington, DC: Howard University, 2001.
57. Constraints to Capital Market Development and Growth in Snb-Saharan Africa: The Case of Ghana. Ziorklui, Sam, in collaboration with Lemma W. Senbet, Philip Fanara, Jr., William Barbee, Jr., Kofi Osei, Fritz Gockel, John Kwakye, John Aheto, Ekow Afedzie, and Anthony Doku. The Development of Capital Markets and Growth in Sub-Saharan Africa: The Case of Ghana. Washington, DC: Howard University, 2001.
58. Contract Enforcement. K;ihkonen, Satu and Patrick Meagher. Contract Enforcement and Economic Performance. College Park, Maryland: IRIS, 1998.

African Economic Policy Discussion Papers
1. Kihkonen, S., and P. Meagher. July 1998. Contract Enforcement and Economic Performance. Available in French.
2. Bolnick, B., and J. Haughton. July 1998. Tax Policy in Sub-Saharan Africa: Examining the Role ofExcise Taxation. Available in French.
3. Wadhawan, S. C., and C. Gray. July 1998. Enhancing Transparency in Tax Administration: A Survey. Available in French.
4. Phillips, L. C. July 1998. The Political Economy ofPolicy Making in Africa.
5. Metzel, J., and L. C. Phillips. July 1998. Bringing Down Barriers to Trade: The Experience of Trade Policy Reform. Available in French.
6. Salinger, B. L., A.M. Amvouna, and D. M. Savarese. July 1998. New Trade Opportunities for Africa. Available in French.
7. Goldsmith, Arthur. July 1998. Institutions and Economic Growth in Africa. Available in French.
8 . Flaherty, D. P., and B. L. Salinger. July 1998. Learning to Compete: Innovation and Gender in the South African Clothing Industry.
9. Wilhelms, S. K. S. July 1998. Foreign Direct Investment and Its Determinants in Emerging Economies Available in French.
10. Nelson, E. R. August 1998. Financial Intermediation for the Poor: Survey of the State of the Art. Available in French.
11. Haughton, J. August 1998. Estimating Tax Buoyancy, Elasticity, andStability.
12. Haughton, J. August 1998. Estimating Demand Curves for Goods Subject to Excise Taxes.
13. Haughton, J. August 1998. Calculating the Revenue-Maximizing Excise Tax.
14. Haughton, J. August 1998. Measuring the Compliance Cost ofExcise Taxation.
15. Gray, C. August 1998. United States Practice in Estimating and Publicizing Tax Evasion
16. Cockbum, J., E. Siggel, M. Coulibaly, and S. Vkina. August 1998. Measuring Competitiveness and its Sources: The Case of Mali's Manufacturing Sector. Available in French.
17. Bany, A. W., S. B. Diana, and D. Diarra. April 1999. Promotion of Regional Exports of Malian Rice. Available in French.
18. Amvouna, A. M. July 1998. Determinants of Trade and Growth Performance in Africa: A Cross-Country Analysis of Fixed verus Floating Exchange Rate Regimes. Available in French.
19. Stryker, J. D. June 1999. Dollarization and Its Implications in Ghana. Available in French
20. Radelet, S. July 1999. Regional Integration and Cooperation in Sub-Saharan Africa: Are Formal Trade Agreements the Right Strategy?
21. Plunken, D. September 1999. Implications for Africa of Initiatives by the WTO, EU and US.
22. Moms, G. A. and J. Dadson. March 2000. Ghana: Cross-Border Trade Issues.
23. Musinguzi, P., with M. Obwona and J. D. Stryker. April 2000. Monetary and Exchange Rate Policy in Uganda.
24. Siggel, E., and G. Ssemogerere. June 2000. Uganda's Policy Reforms, Industry Competitiveness and Regional Integration: A comparison with Kenya.
25. Siggel, E., G. Ikiara, and B. Nganda. June 2000. Policy Reforms, Competitiveness and Prospects of Kenya's Manufacturing Industries: 1984-1997 and Comparisons with Uganda.
26. McPherson, M. F. July 2000. Strategic Issues in Infrastructure and Trade Policy.
27. Sparrow, F. T., B. H. Bowen, and Z. Yu. July 1999. Modeling Long-Term Capacity Expansion Options for the Southern African Power Pool (SAPP). Available in French.
28. Goldsmith, A,, M. F. McPherson, and 3. Duesenbeny. January 2000. Restarting and Sustaining Growth and Development in Africa.
29. Gray, C., and M. F. McPherson. January 2000. The Leadership Factor in Afn'can Policy Reform and Growth.
30. Masters, W. A,, R. Davies, and T. W. Hertel. November 1998 revised June 1999. Europe, South Africa, and Southern Africa: Regional Integration in a Global Context. Available in French.
31. Beltchika-St. Juste, N., M. Thiam, J. D. Stryker, with assistance from P. I. Sow. 1999. Barriers to Business Expansion in a New Environment: The Case of Senegal. Available in French.
32. Salinger, B. L., D. P. Flaherty, and M. Keswell. September 1999. Promoting the Competitiveness of Textiles and Clothing Manufacture in South Africa.
33. Block, S. A. August 1999. Does Afn'ca Grow Differently?
34. McPherson, M. F. and T. Rakovski. January 2000. A SmaN Econometric Model of the Zambian Economy.
37. Barry, A. W., Saliiger, B. L., and S. Pandolfi. December 2000. Sahelian West Africa: Impact of Structural Adjustment Programs on Agricultural Competitiveness and Regional Trade.
40. B~utigam, D. July 2000. Interest Groups, Economic Policy, and Growth in Sub-Saharan Africa.
42. Duesenbeny, J. S., and M. F. McPherson. March 2001. Financial Reform as a Component of a Growth-Oriented Strategv in Africa.
43. Glenday, G., and D. Ndii. July 2000. Export Platforms in Kenya.
44. Glenday, G. July 2000. Trade Liberalization and Customs Revenues: Does trade liberalization lead to lower customs revenues? The Case of Kenya.
46. Goldsmith, A. June 2000. Risk, Rule, and Reason in Africa.
47. Goldsmith, A. June 2000. Foreign Aid and Statehood in Africa.
49. McPherson, M. F., and C. Gray. July 2000. An 'Aid Exit' Strategy for African Countries: A Debate.
50. Gym-BafFour, G. and C. Betsey, with K. Tutu and K. Boateng. February 2001. Increasing Labor Demand and Labor Productivity in Ghana.
51. Isimbabi, M. J . December 2000. Globalization and the WTO Agreement on Financial Services in African Countries.
53. McPherson, M. F., and C. B. Hill. June 2000. Economic Growth and Development in Zambia: The Way Forward.
54. McPherson, M. F., and T. Ralcovski. March 2001. Understanding the Growth Process in Sub-Saharan Africa: Some Empirical Estimates.
56. McPherson, M. F., and T . Ralcovski. July 2000. Exchange Rates and Economic Growth in Kenya: An Econometric Analysis.
57. McPherson, M. F. July 2000. Exchange Rates and Economic Growth in Kenya.
58. McPherson, M. F. July 2000. Seignorage in Highly Indebted Developing Countries.
59. McCulloch, R., and M . F. McPhersou. March 2001. Promoting and Sustaining Trade and Exchange Reform in Africa: An Analytical Framework.
60. McPherson, M. F. March 2001. Growth and Poverty Reduction in Mozambique: A Framework for Analysis.
62. McPherson, M. F. March 2001. Restarting and Sustaining Growth and Development in Afn'ca: A Framework for Improving Productivity.
67. Phillips, L. C., M. Obwona, M. McMillan, with A. B. Ayako. December 2000. Foreign and Local Investment in East Africa: Interactions and Policy Implications.
79. Ziorklui, Sam Q. with collaboration from L. W. Senbet, A. G. Abayo, F. Musonda, B. Nyagetera, L. Rutasitma, and G. D. Kitua. Febmary 2001. Capital Market Development and Growth in Sub-Saharan Afn'ca: The Case of Tanzania.
80. Ziorklui, Sam Q. with collaboration from L. W . Senbet, P. Fanara, Jr., W . Barbee, Jr., K. Osei, F. Gockel, J . Kwakye, J. Aheto, E. Afedzie, and A. Doku. February 2001. The Development of Capital Markets and Growth in Sub-Saharan Africa: The Case of Ghana.
81. Ziorklui, Sam Q. with collaboration from F. Gockel, P. Fanara, Jr., C. Mahone, C.W.K. Ahiakpor, S . Mensah, S. Ameyaw, and A. Doku. February 2001. The Impact of Financial Sector Reform on Bank Efficiency and Financial Deepening for Savings Mobilization in Ghana.
EAGER Research Reports
Cockburn, John, E. Siggel, M. Coulibaly, and S. Vkina. October 1998. Measuring Competitiveness and its Sources: The Case of Mali's Manufacturing Sector. Available in French.
McEwan, Tom et al. A Report on Six Studies of Small, Medium and Micro Enterprise Developments in Kwuzuh- Natal.
McPherson, Malcolm F. Sustaining Trade and Exchange Rate Reform in Africa: Lessons for Macroeconomic Management.
Meeel, Jefftey, A. Doumbia, L. Diakite, andN. A. Diana. July 1998. Prospects for Developing Malian Red Meat and Livestock Exports. Available in French.
Phillips, Lucie C., M. Obwona, M. McMillan, with A. B. Ayako. December 2000. Foreign and Local Investment In East Afn'ca, Interactions and Policy Implications: Case Studies on Mauritius, Uganda and Kenya.
Salinger, Lynn B., H. Bhorat, D. P. Flaherty, and M. Keswell. August 1999. Promoting the Competitiveness of Textiles and Clothing Manufacture in South Africa.
Sparrow, F. T., and B. H. Bowen. July 1999. Modeling Electricity Trade in South Africa: User Manual for the Long-Term Model.
Other Publications
McPherson, Malcolm F., and Arthur Goldsmith. Summer-Fall 1998. Africa: On the Move? SAIS Review, A Journal of International Affairs, The Paul H. Nitze School of Advanced International Studies, The John Hopkins University, Volume XVIII, Number Two, p. 153.
EAGER All Africa Conference Proceedings. October 18-20,1999.
EAGER Regional Workshop Proceedings on the Implementation of Financial Programming. Lilongwe, Malawi. June 10-11, 1999.
EAGER Workshop Proceedings Senegal. November 4-6,1998.
EAGER Workshop Proceedings South Africa. February 4-6,1998.
EAGER Workshop Proceedings Tanzania. August 13-16, 1997.
EAGER Workshop Proceedings Ghana. February 5-8, 1997,
EAGER Workshop Proceedings. Howard University. July 17-19,1996.
EAGER Workshop Proceedings Uganda. June 19-22, 1996.


![“BOOM, BOOM, BOOOOOM! Notes on a Giant [neoliberal] Implosion” in Ibraaz Magazine. Issue 8th. January 2015](https://static.fdokumen.com/doc/165x107/63459845596bdb97a909007a/boomboom-booooom-notes-on-a-giant-neoliberal-implosion-in-ibraaz-magazine.jpg)