3.3 Water audit: Water is our most precious resource. Without it no ...
62
Green Audit : 2014-15 Yashwantrao Chavan Warana Mahavidyalaya,Warananagar 63 3.3 Water audit: Water is our most precious resource. Without it no plant or animal can survive. India is predicted to become drier, because of rising population and urban demand so the need to save water and ensure sustainability will grow. We all have a role to play by reducing our usage of water. We can secure our water supply for generations to come. We have to find new ways of source and preserve our precious water and we need educational institute to help by saving as much water as they can. This will save the money and reduce the impact on the environment. Now-a-day colleges have become more aware regarding usage of water .The water audit of educational institute provide a fun and educational way to investigate ways that water is used every day, determine which areas of the campus may be causing problems and to spread the message of water conservation. These investigations will help to minimize water loss by detecting leakages and faulty fixtures so they can be repaired as soon as possible. This guideline will help to understand where and how more water is being used in our institute. It is divided into three parts; Part 1: Assessment of Water requirement in institute campus, Part 2 :Water storages in campus and Part 3 : collect information about water losses in campus. We all have a role to play so we can reduce our water usage and we can secure our water supply for generations to come. The Water Corporation has been finding new ways to preserve our precious water, and we need educational institutes to help by saving as much water as they can. 3.3.1 Water and waste water audit: A water audit is an on-site survey and assessment of water using hardware, fixtures, equipment, landscaping, and management practices to determine the efficiency of water and to develop recommendations for improving water use efficiency. In simple words, a water audit is a systematic review of a site that identifies the quantities and characteristics of all water uses. The site may vary from a public water utility, facility (institutional or commercial properties like malls, office, schools etc.) or a household. The overall objective of conducting a water audit is to identify opportunities to preserve and save water more efficiently. Since, water uses vary greatly from one type of business or institution to another and from site to site, water audit is crucial to determine quantity, nature and quality of water consumption. Water audit for water utility refers to tracking, assessing and validating all components of flow from the site of withdrawal or treatment through the water distribution system and into the consumer's properties. On the other hand, water audit of an office building would review direction and quantity of water used for domestic, cooling/heating, sanitary and landscaping processes. Whereas usage of water for domestic purpose , audit examines the major areas in which a facility uses water, including human consumption, personal hygiene and sanitation, washing, cleaning, laundry, gardening etc.
-
Upload
khangminh22 -
Category
Documents
-
view
1 -
download
0
Transcript of 3.3 Water audit: Water is our most precious resource. Without it no ...

Green Audit : 2014-15
Yashwantrao Chavan Warana Mahavidyalaya,Warananagar
63
3.3 Water audit:
Water is our most precious resource. Without it no plant or animal can survive. India is predicted
to become drier, because of rising population and urban demand so the need to save water and ensure
sustainability will grow. We all have a role to play by reducing our usage of water. We can secure
our water supply for generations to come. We have to find new ways of source and preserve our
precious water and we need educational institute to help by saving as much water as they can. This
will save the money and reduce the impact on the environment.
Now-a-day colleges have become more aware regarding usage of water .The water audit of
educational institute provide a fun and educational way to investigate ways that water is used every
day, determine which areas of the campus may be causing problems and to spread the message of
water conservation. These investigations will help to minimize water loss by detecting leakages and
faulty fixtures so they can be repaired as soon as possible. This guideline will help to understand
where and how more water is being used in our institute. It is divided into three parts; Part 1:
Assessment of Water requirement in institute campus, Part 2 :Water storages in campus and Part 3 :
collect information about water losses in campus. We all have a role to play so we can reduce our
water usage and we can secure our water supply for generations to come. The Water Corporation
has been finding new ways to preserve our precious water, and we need educational institutes to help
by saving as much water as they can.
3.3.1 Water and waste water audit: A water audit is an on-site survey and assessment of
water using hardware, fixtures, equipment, landscaping, and management practices to determine
the efficiency of water and to develop recommendations for improving water use efficiency. In
simple words, a water audit is a systematic review of a site that identifies the quantities and
characteristics of all water uses. The site may vary from a public water utility, facility (institutional
or commercial properties like malls, office, schools etc.) or a household. The overall objective of
conducting a water audit is to identify opportunities to preserve and save water more efficiently.
Since, water uses vary greatly from one type of business or institution to another and from site to
site, water audit is crucial to determine quantity, nature and quality of water consumption. Water
audit for water utility refers to tracking, assessing and validating all components of flow from the
site of withdrawal or treatment through the water distribution system and into the consumer's
properties. On the other hand, water audit of an office building would review direction and quantity
of water used for domestic, cooling/heating, sanitary and landscaping processes. Whereas usage of
water for domestic purpose , audit examines the major areas in which a facility uses water,
including human consumption, personal hygiene and sanitation, washing, cleaning, laundry,
gardening etc.

Green Audit : 2014-15
Yashwantrao Chavan Warana Mahavidyalaya,Warananagar
64
Water audit comprises of preparation of layout of water sources, distribution network, and
service / delivery points to water users and return flow of waste or excess water. The layout should
include locations and capacities of flow measurement devices installed at key points, dimensions of
pipes and fittings in the water supply system, locations and particulars of flow control devices and
history sheets of all measuring and control devices including pipes and fittings. A study of the availability
of water sources and past consumption patterns for various sectors is necessary to understand the
present water utilization and projecting future requirement. Data on development of sustainable
source of water through rainwater harvesting and effluent recycling should also be taken into
consideration.
3.3.2 Water Audit of college: Data related the water audit is collected by circulating questionnaires
(Annexure–C), from water user profiles of it there are roughly 4000 students, 141 employers, 63
visitors on an average come each day in campus.
3.3.2.1 Assessment of water requirement at different sites in college: It includes Bathroom ,
Toilet, Laboratory, Kitchen, Garden , Shower , Drinking , Washing etc sites in college campus and
water consumption on these sites were studied .
Table No.3.1 Monthly Average Water Consumption at different sites of collage
Site Bathroom Toilet Laboratory Kitchen Garden Shower Drinking Washing Others
Total
Total use of
water in
lit/month
527614 366039 39978 47606 375778 5284 134052 219749 4080 1720180
Percentage
with total
30.67 % 21.27% 2.32% 2.76% 21.84% 0.31% 7.79% 12.77% 0.24% 100%
Graph No. 3.1 Monthly Average Water Consumption at different sites of collage

Green Audit : 2014-15
Yashwantrao Chavan Warana Mahavidyalaya,Warananagar
65
Monthly average water consumption at different sites of all departments at college premises is as
below:
The total water consumption at different sites in college preemies is 1720180 liters/ Month.
The maximum water used for bathroom is 527614 liters/ month ( 30.67%) followed by gardens on
the premise are lush green throughout the year by using 375778 liters of water which is around(
21.40%) and to keep the toilets clean 366039 liters/ month which is 21.27%. In the laboratories
39978 liters water is used every month. i.e. 2.32%. The use of water in kitchen is 47606 liters and it
is 2.76%.The for the showers 5284 liters of water is used which is 0.31%. The use of water for
drinking is 134052 liters which is 7.79% and 12.77% water i.e.219749 is used for washing purpose.
Water consumption at different site in percent is as shown below:

Green Audit : 2014-15
Yashwantrao Chavan Warana Mahavidyalaya,Warananagar
66
Graph No.3.2 Monthly Average Water Consumption at different site of collage
Collected and analyzed data in above graph clears that about the same (i.e.21 to 22 %) water
consumption observed at Toilet and garden sites of college and very small water is used for Kitchen
as well as shower purposes.

Green Audit : 2014-15
Yashwantrao Chavan Warana Mahavidyalaya,Warananagar
67
Table No.3.2 Department wise and site wise Total Assessment of water requirement in college
in liters
Sr.
No.
Departments Sites Total per
month
Total per
Year Bathroom Toilet Laborator
y
Kitchen Garden Shower Drinking Washing Other
1 Science 48000 141029 431728 000000 2063202 000000 45400 9160 0000 228210 2738519
2 Arts 48800 32000 48000 24000 000000 000000 67064 95864 0000 26311 315728
3 Commerce 000000 000000 000000 000000 000000 0000 79200 000000 0000 6600 79200
4 Computer
Lab.
59440 46560 0000 0000 0000 00000 57840 32580 0000 16369 196420
5 Office 4032000 984960 000 000 0000 0000 748800 984960 000 562560 6750720
6 Gymkhana 112000 1722000 0000 0000 0000 0000 122500 119000 000 172958 2075500
7 Exterior 0000 0000 0000 0000 2446080 000 57840 32580 000 211375 2536500
8 Common
Facility
Centers
2031120 1465896 0000 547248 0000 63360 430136 136284
0
48960 495797 5949560
Total 6331360 4392445 479728 571248 4509282 63360 160878
0
263698
4
48960 172018
0
2064214
7
Above table reveals that the requirement of water for Toilet, Laboratory and Garden is maximum
while water consumption at kitchen and shower site is very less.
Table No.3.3 Department wise Total Assessment of water requirement in college in liters per
month
Departments Science
Arts
Commerce
I.T.
Lab.
Office
Gymkhana
Exterior
Common
Facility
Centers
Total
water
consumed
Average
water
consumed
liters/
Month
228210 26311 6600 16369 562560 172958 211375 495797 1720180
Average
water
consumed
liters / Year
2738519
315728 79200 196420 6750720 2075500 2536500 5949560 20642147

Green Audit : 2014-15
Yashwantrao Chavan Warana Mahavidyalaya,Warananagar
68
Graph No.3.3 Department wise Total Assessment of water requirement in college in liters per
month
Above Table No. 3.3 and Graph No. 3.3 shows Department wise Total Assessment of water
requirement in college in liters per month from it water consumption in office and CFC department is
5 to 6 lakh liters /Month, while water consumption at Arts and I.T. laboratory is 16 to 26 thousands
liters /Month, is minimum ,water is required for Commerce department is very minimum, it is only
for drinking purpose.
Data of water leakages and loss of water due to leakages is collected from each department with help
of questionnaires (Annexure C - Table -2), its analyzed form is shown in following table.

Green Audit : 2014-15
Yashwantrao Chavan Warana Mahavidyalaya,Warananagar
69
Table No.3.4 Department wise and Site wise Average Water Losses (Leakages) per month in
college:
Data shows that water loss due to leakages seen in Science at Toilet and Laboratory site. In
Exterior at drinking, Garden, Kitchen and toilet site water loss due to leakages is observed. Average
water loss due to leakage is 17436liter/month or 209232 liter/month, is maximum at garden (140400
liter/year).
Sr.
No.
Departments Water loss site Total
water
loss per
Year in
Lit.
Total
water
loss
per
Month
in Lit.
Bathroom Toilet Laboratory Kitchen Garden Shower Drinking Washing
1 Science -- 4320 24936 -- -- -- -- -- 29256 2438
2 Gymkhana -- 00 -- -- -- -- -- -- 00 00
3 Office -- 00 -- -- -- -- -- -- 00 00
4 Common
Facility
Centers
-- 00 -- -- -- -- -- -- 00 00
5 Exterior 1680 8520 -- 8640 140400 -- 20736 -- 179976 14998
Total 1680 12840 24936 8640 140400 00 20736 00 209232 17436

Green Audit : 2014-15
Yashwantrao Chavan Warana Mahavidyalaya,Warananagar
70
Table No.3.5 Site wise Average Water Losses (Leakages) per month in college
Graph No.3.4. Site wise Average Water Losses (Leakages) per Year in college
Water loss due to leakages is maximum (i.e.140400 liters/year) at garden site while water loss at
bathroom site of college is negligible.
Water loss site
Bathroom Toilet Laboratory Kitchen Garden Shower Drinking Washing Total
water
loss
per
Year in
Liter
Total
water
loss
per
Month
in Lit.
Total Water
loss due to
Leakages per
Year in Liter
1680 12840 24936 8640 140400 -- 20736 -- 209232 17436
Total Water
loss due to
Leakages per
Month in Liter
140 1070 2078 720 11700 00 1728 -- -- 17436

Green Audit : 2014-15
Yashwantrao Chavan Warana Mahavidyalaya,Warananagar
71
Table No.3.6. Department wise Average Water Losses (Leakages) per month in college
Departments Science
Arts
Commerce
I.T.
Lab.
Office
Gymkhana
Exterior
Common
Facility
Centers
Total water
loss due to
leakages
2438 00 00 00 00 00 14998 00
Graph No. 3.5. Department wise Average Water Losses (Leakages) per month in college
Graph No.3.5 shows that in science department water losses due to leakages is 2438 liters/month and
in Exterior is 14998 liters/month.
Information/ data of water loss in campus due overflow at water storage is collected through
questionnaires (Annexure -C- Table -3), again data is verified by Green Audit Committee Member
with periodically visiting and monitoring the sites. To record water loss due to overflow Audit
committee arranged number of drills and visits. Committee monitored, personally measure, kept the
record of time ( in minute ) of water flowing, flow rates (liter/minute) and recorded water loss at
each visit. Taking an average following water structure of over flow is shown.

Green Audit : 2014-15
Yashwantrao Chavan Warana Mahavidyalaya,Warananagar
72
Table No.3 .7.Deprtment wise Water Storage (Department wise details of water structures of
overflow) ( Data from Annexure-3 Table-2 )
Sr.
No
.
Depart-
ments
Storage
Tank Site
Capaci
ty in
liters
Number
of
Tanks
Number
of
Times
it is
filled
Daily
Daily
Averag
e time
of water
over
flowing
min
Flow
Rate
Liter
/ min
(Average)
Daily
Water
losses
due to
overflow
liter
(Average)
Water
loss in
week
liter
(Average)
Water
loss liter
per month
(Average)
Water
loss liter
in Year
(Average)
1. Science a)Science
building
b)F.M.Filter
house tank
20265
19477
9687
01
02
one
418 44.28 4235 29645 118580 1422960
03
2. Gymkha
na
a)Shivneri
b)Gymkhana
New-1
c)Gymkhana
New-1
8950
5094
5094
01
01
01
one
34 154.42 1642 11494 45976 551772
03
3. Office Office-1 47250 01 one 15 64.85 973 6811 27244 326928
4. CFC a)YCWM
Library-1
b)YCWM
Library-2
c)Canteen -1
d)Canteen -2
1097
3119
5074
5074
01
01
01
01
one
56 251.28 3550 24850 99400 1192800
04
5. Exterior Quarters
Total 6
6536
each
06 one 144 394 9461 66227 264908 3178896
Total
17 667 908.83 19861 139027 556108 6673356
Table shows at Exteriors water loss by overflow is maximum 264908 lit./month and at office it is
minimum 27244 lit./month .

Green Audit : 2014-15
Yashwantrao Chavan Warana Mahavidyalaya,Warananagar
73
Table No. 3.8. Department wise Loss of water due to overflow in lit./Month
Departments Science
Arts
Commerce
I.T.
Lab.
Office
Gymkhana
Exterior
Common
Facility
Centers
Total
loss due to
Overflow in
Liters/Month
118580 00 00 00 27244 45976 264908 99400 556108
Graph No. 3.6 Department wise Loss of water due to overflow in lit./Month
At exterior, Science and CFC departments of college water loss by overflow of tanks is maximum
respectively it is 264908lit./month, 118580 lit./month,99400lit./month while at Arts, Commerce and
I.T.lab. is zero.
Total water used from each storage tank is recorded by measuring the storage tank measurements
and daily monitoring the height before filling the tank. With the help of questionnaire (Annexure –
C table -4) we calculate total water used per month in liters. Data recorded of total used water from
monitoring the water tanks and water consumed at each department in college is shown bellow.

Green Audit : 2014-15
Yashwantrao Chavan Warana Mahavidyalaya,Warananagar
74
Table No.3.9 Total Average Water Used per Month in the college (by monitoring the tanks)
Sr.No. Storage
Tank Site
Total Average Water
Used Per Year(Lit.)
Total Average Water
Used Per Month(Lit.)
1 Science 3333930 277827
2 Arts -- --
3 Commerce -- --
4 Computer Lab/I.T. -- --
5 Office 10126513 843876
6 Gymkhana 1943664 161972
7 Exterior 2217327 1847777
8 Common Facility
Centers
18804463 1567038
Table No.3.10 Total water consumed at each department from assessment of water
requirement (From above Table No. 3.3)
Sr.No. Storage
Tank Site
Total Average Water
Used Per Year(Lit.)
Total Average Water
Used Per Month(Lit.)
1 Science 2738519 228210
2 Arts 315728 26311
3 Commerce 79200 6600
4 Computer Lab/I.T. 196420 16369
5 Office 6750720 562560
6 Gymkhana 2075500 172958
7 Exterior 2536500 211375
8 Common Facility
Centers
5949560 495797
Actually Arts, Commerce and I.T departments water user, use water from Office tank, if we add the
water requirement of these three departments in office consumption and compared above two tables
we see in following.

Green Audit : 2014-15
Yashwantrao Chavan Warana Mahavidyalaya,Warananagar
75
Table No.3.11 Comparison of Table No.3.9 and Table No.3.10
Sr.
No
Storage
Tank Site
Total Average Water Used (by
monitoring the tanks) Table No.3.9
Total water consumed at each
department from assessment of water
Table No.3.10
Total Average
Water Used Per
Year(Lit.)
Total Average
Water Used Per
Month(Lit.)
Total Average
Water Used Per
Year(Lit.)
Total Average
Water Used Per
Month(Lit.)
1 Science 3333930 277827 2738520 228210
2 Arts -- -- -- --
3 Commerce -- -- -- --
4 Computer Lab/I.T. -- -- -- --
5 Office 10126513 843876 7342080 611840
6 Gymkhana 1943664 161972 2075496 172958
7 Exterior 2217327 1847777 2536500 211375
8 Common Facility
Centers
18804463 1567038 5949564 495797
Thus from above table the figures for all the departments (Science, Office, Gymkhana and Exterior )
are nearly matched except CFC because in CFC (canteen, Boys and girls hostel etc) data of water
requirement collected by questionnaire and data from actually tank monitoring are mismatched.
3.3.2.2 Science Department
Total number of water user in the science department is roughly 1800 (students, employers,
visitors etc) their water consumption is as fallows.
Table.No.3.12 Yearly Water Consumption at different sites of Science Department
Sites Bathroom Toilet Laboratory Kitchen Garden Drinking Washing Total
Total Water
consumption
(liters / year)
48000 141029 431728 000 2063202 45400 9160 2738519
% with total
consumption
1.75 5.14 15.76 0.0 75.34 1.65 0.33 100.00

Green Audit : 2014-15
Yashwantrao Chavan Warana Mahavidyalaya,Warananagar
76
Graph no. 3.7 Yearly Water Consumption at different sites of Science Department
Graph no. 3.8 Percentage of Yearly Water Consumption at different sites of Science
Department
Yearly water consumption by Science department is about 2738519 liters , water is consumed by
the garden use is major source utilization comprising 75.34 % (2063202 liters/year). While 15.76 %
(431728 lit./year) and 5.14% (141029Lit./year) consumed for Laboratory and toilet purpose. Only
1.65% water is consumed for drinking and 1.75% for bathroom purpose.
Green Audit : 2014-15
Yashwantrao Chavan Warana Mahavidyalaya,Warananagar
77
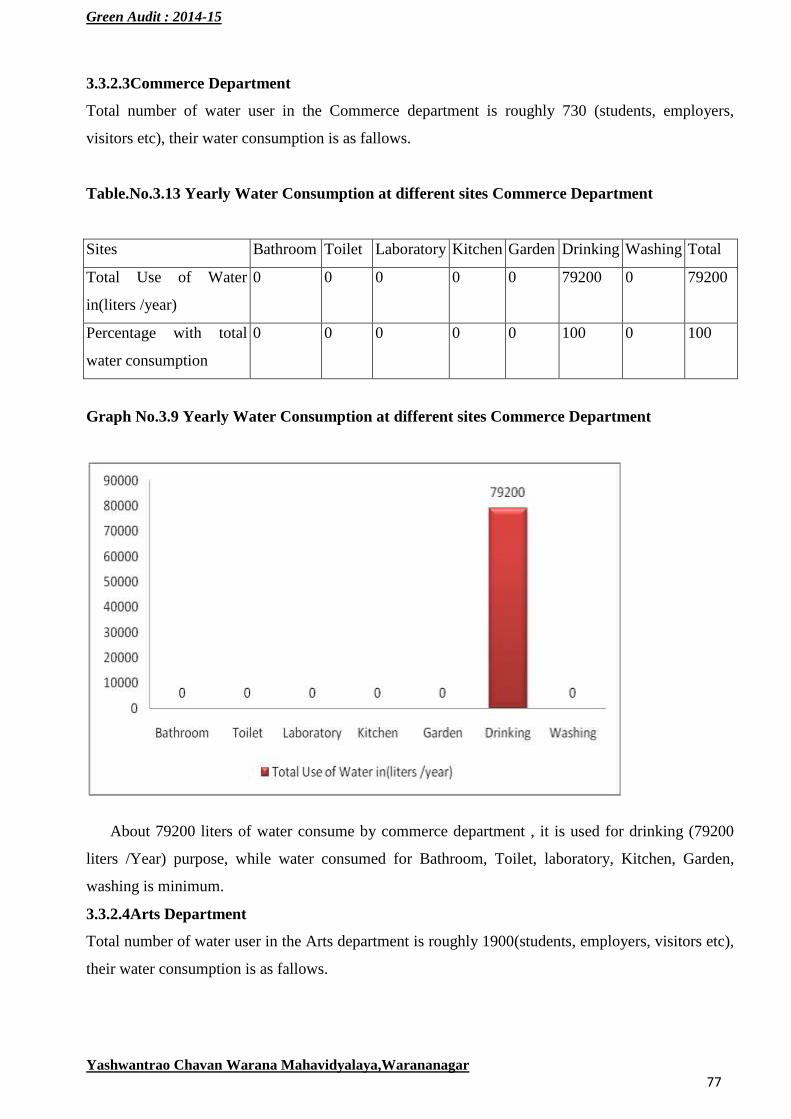
3.3.2.3Commerce Department
Total number of water user in the Commerce department is roughly 730 (students, employers,
visitors etc), their water consumption is as fallows.
Table.No.3.13 Yearly Water Consumption at different sites Commerce Department
Sites Bathroom Toilet Laboratory Kitchen Garden Drinking Washing Total
Total Use of Water
in(liters /year)
0 0 0 0 0 79200 0 79200
Percentage with total
water consumption
0 0 0 0 0 100 0 100
Graph No.3.9 Yearly Water Consumption at different sites Commerce Department
About 79200 liters of water consume by commerce department , it is used for drinking (79200
liters /Year) purpose, while water consumed for Bathroom, Toilet, laboratory, Kitchen, Garden,
washing is minimum.
3.3.2.4Arts Department
Total number of water user in the Arts department is roughly 1900(students, employers, visitors etc),
their water consumption is as fallows.

Green Audit : 2014-15
Yashwantrao Chavan Warana Mahavidyalaya,Warananagar
78
Table No.3.14 Yearly Water Consumption at different sites of Arts department
Graph No. 3.10. Yearly Water Consumption at different sites of Arts department
Graph No.3.11. Percentage of Yearly Water Consumption at different sites of Arts department
Water sites
Bathroom Toilet Laboratory Kitchen Garden Drinking Washing Total water
Consumption
Lit. /Year
Total Use of Water
in (liters / year)
48800 32000 48000 24000 0 67064 95864 315728
Percentage 15.45 10.13 15.20 7.60 0 21.24 30.36 100
Green Audit : 2014-15
Yashwantrao Chavan Warana Mahavidyalaya,Warananagar
79
Yearly water consumption at Arts department is about 315728 liters. Consumption of water for
washing is 30.36% (95864liters/year), for drinking 21.24%(67064 liters/year), for bathroom and
Laboratory water consumption is same (≈ 15%).
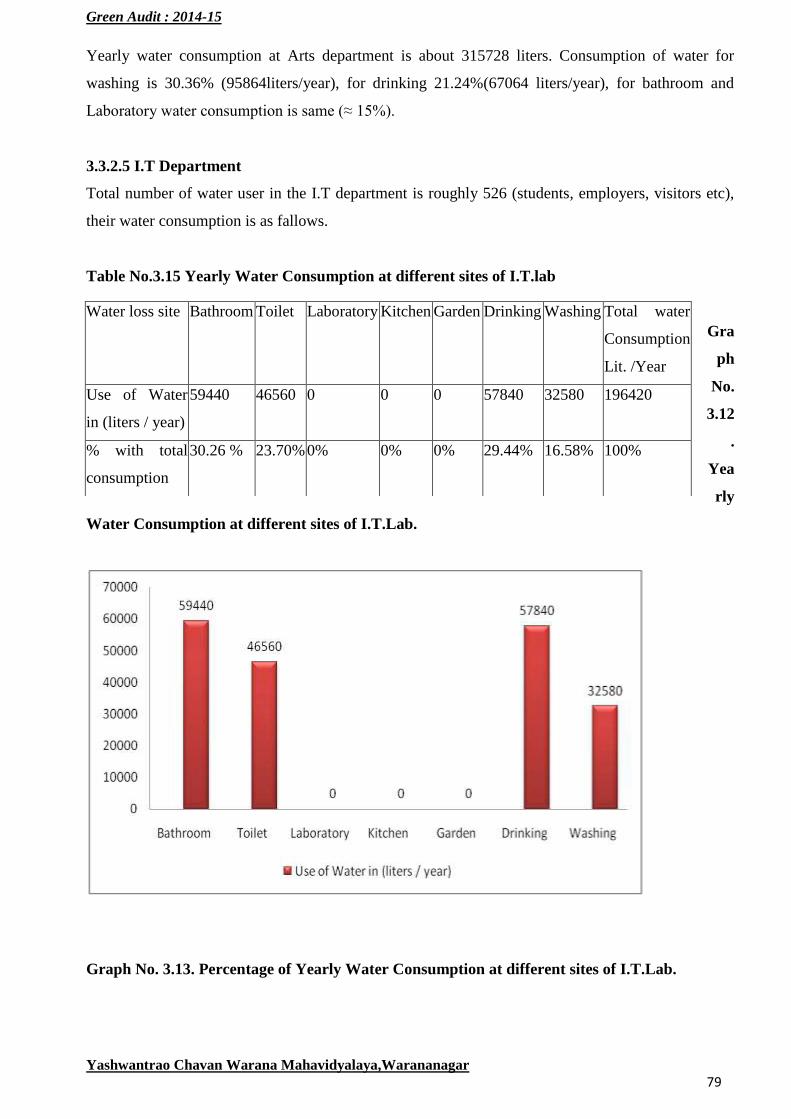
3.3.2.5 I.T Department
Total number of water user in the I.T department is roughly 526 (students, employers, visitors etc),
their water consumption is as fallows.
Table No.3.15 Yearly Water Consumption at different sites of I.T.lab
Gra
ph
No.
3.12
.
Yea
rly
Water Consumption at different sites of I.T.Lab.
Graph No. 3.13. Percentage of Yearly Water Consumption at different sites of I.T.Lab.
Water loss site
Bathroom Toilet Laboratory Kitchen Garden Drinking Washing Total water
Consumption
Lit. /Year
Use of Water
in (liters / year)
59440 46560 0 0 0 57840 32580 196420
% with total
consumption
30.26 % 23.70% 0% 0% 0% 29.44% 16.58% 100%

Green Audit : 2014-15
Yashwantrao Chavan Warana Mahavidyalaya,Warananagar
80
About 196420 liters of water is consumed by computer lab (IT), of which the use of
bathroom and toilet is major source of utilization comprising 59440 liters/year, i.e. 30.26 % and
57840 liters/year i.e. 29.44% respectively . While water consumed for Laboratory, Kitchen and
garden purpose is negligible.
3.3.2.6 Office Department
Total number of water user in the office department is roughly 745(students, employers, visitors etc),
their water consumption is as fallows.
Table no. 3.16 Yearly Water Consumption at different sites of Office.
Graph No. 3.14 Yearly Water Consumption at different sites of Office
Water used site
Bathroom Toilet Laboratory Kitchen Garden Drinking Washing Total water
Consumption
Lit. /Year
Use of Water
in (liters / year)
4032000 984960 0 0 0 748800 984960 6750720
% with total
consumption
59.72 14.59 0 0 0 11.09 14.59 100

Green Audit : 2014-15
Yashwantrao Chavan Warana Mahavidyalaya,Warananagar
81
Graph No. 3.15. Percentage of Yearly Water Consumption at different sites of office
About 6750720 liters of water per year is consumed by office of which the bathroom and toilet
use is major source of utilization comprising 4032000 liters/year, i.e. 59.72 % and 984960. liter/year
i.e. 14.59% respectively . While for Washing and drinking purpose less water and it is consumed
about 984960 liter/year (i.e.14,59%) and 748800 (i.e. 11.09%.) respectively.
3.3.2.7 Gymkhana
Total number of water user in the Gymkhana department is roughly 185(students, employers etc),
their water consumption is as fallows.

Green Audit : 2014-15
Yashwantrao Chavan Warana Mahavidyalaya,Warananagar
82
Table.No.3.17 Yearly Water Consumption at different sites of Gymkhana
Graph No.3.16. Yearly Water Consumption at different sites of Gymkhana
Water used site
Bathroom Toilet Laboratory Kitchen Garden Drinking Washing Total water
Consumption
Lit. /Year
Use of Water
in (liters /
years)
112000 172000 0000 0000 0000 122500 119000 2075500
% with total
consumption
5.40 82.97 0 0 0 5.90 5.73 100

Green Audit : 2014-15
Yashwantrao Chavan Warana Mahavidyalaya,Warananagar
83
Graph No. 3.17. Percentage of Yearly Water Consumption at different sites of Gymkhana.
About 2075500 liter of water is consumed per year by Gymkhana. Bathroom and Toilet use is
major source of utilization i.e. 112000 i.e. 5.4% while for toilet 1722000 i.e. 82.97% while drinking
purpose 122500 liters/year, 5.90% while for washing purpose 119000 liters/year i.e. 5.73% water is
used. The average figures are shown but maximum consumption of water at time of sports camp
(like taluka, university, state and national level competitions).
3.3.2.7 Exterior
Total number of water user in the Exterior is roughly 546 (students, employers, visitors etc), their
water consumption is as fallows.
Table.No.3.18 Yearly Water Consumption at different sites of Exterior
Water used site
Bathroom Toilet Laboratory Kitchen Garden Drinking Washing Total water
Consumption
Lit. /Year
Use of Water
in (liters /
years)
00 00 00 00 2446080 57840 32580 2536500
% with total
consumption
00 00 00 00 96.43 2.28 1.29 100

Green Audit : 2014-15
Yashwantrao Chavan Warana Mahavidyalaya,Warananagar
84
Graph No.3.18. Yearly Water Consumption at different sites of Exteriors
Graph No. 3.19. Percentage of Yearly Water Consumption at different sites of Exteriors
About 2536500 liters of water consumed by exteriors per year of which garden use is maximum
2446080 liter/year(i.e. 96.43% of total) while drinking purpose is minimum i.e. 57840 liter per year
(i.e. 2.2% of total use).
3.3.2.8 Common Facility Centers (CFC)

Green Audit : 2014-15
Yashwantrao Chavan Warana Mahavidyalaya,Warananagar
85
Total number of water user in the CFC is roughly 1423 (students, employers, visitors etc), their
water consumption is as fallows
Table.No.3.19 Yearly Water Consumption at different sites of CFC
Graph No.3.20. Yearly Water Consumption at different sites of CFC
Graph No. 3.21. Percentage of Yearly Water Consumption at different sites of CFC
Water
used site
Bathroom Toilet Labora-
tory
Kitchen Garden Shower Drinking Washing Other Total water
Consum-
ption Lit.
/Year
Use of
Water in
(liters /
years)
2031120 1465896 00 547248 00 63360 430136 1362840
48960
5949560
% with
total
consump-
tion
34.14 24.64 00 9.20 00 1.06 6.72 22.90 0.82 100

Green Audit : 2014-15
Yashwantrao Chavan Warana Mahavidyalaya,Warananagar
86
About 5949560 liter of water per month is consumed by Common facility center of which use of
water in bathroom and toilet is maximum, 2031120 liter/year i.e. 34.13% for bathroom and 1465896
liter/year i.e. 24.63% for toilet purpose. While shower and other purpose use of water is minimum,
63360 liters/year i.e. 1.06% and 48960 liter/year i.e. 0.82 % respectively.
3.3.3Water Management Practices at college Campus.
Yashwantrao Chavan Warana Mahavidyalaya, Warananagar has become good runner in water
conservation, water harvesting and management of water available on campus.
a)Rain Water recharge:
The wells in campus located at such natural geographical places where the peculation of rain is
trapped in these. As the wells in the campus are located down, the rain water and peculated water
from campus is easily collected in it.
The waste water from drinking and washing sites is directly send in the nearby garden and lawns.
b)Roof Top Rain water Harvesting –
The Roof Top Rain water from buildings of Arts , commerce, Science, Library, B.Ed / D.Ed, TKIET
Library recharge the campus well which is backward of library helps the rain water harvesting .
The Roof Top Rain water from buildings of Boys hostels, Mess, Staff quarters , I.T.I recharge the
well in hostel campus.
c)College well-

Green Audit : 2014-15
Yashwantrao Chavan Warana Mahavidyalaya,Warananagar
87
The water from recharged well is used for watering gardens, lawns, road side lawns which fulfills
need of college campus. YCMM campus is partly self- sufficient in water ,because for drinking
purpose water of Warana river is used.
d)College well behind boy’s hostel.-
Water from boys hostels bathrooms are collected in it which is supplied to college campus gardens
& lawns.
e)Water filtration plant-
The college campus has a small water filtration plant in side of botanical garden which fulfills
drinking water need.
f)Plantation in campus-
College has green campus of 27 acres. Efforts have been made on to bring part of land under
cultivation of medicinal plants as well as other productive plants through NSS , NCC students,
Seniors students, teaching and nonteaching staff in college. In campus total 5021 trees of 152
varieties are present in which 3087 are trees, 1424 are shrubs, 473 are herbs and 37 are
climbers.
g)Use of Sprinklers:
For irrigating the gardens and lawns drip/ sprinklers are installed in campus for water
consumption and electricity.

Green Audit : 2014-15
Yashwantrao Chavan Warana Mahavidyalaya,Warananagar
88
3.4 Hazardous Waste Audit
3.4.1Chemical Waste:
Hazardous waste is waste that poses substantial or potential threats to public health or
the environment. These wastes may be found in different physical states such as gaseous, liquids, or
solids. A hazardous waste is a special type of waste because it cannot be disposed of by common
means like other by-products of our everyday life. Depending on the physical state of the waste,
treatment and solidification processes might be required. The four characteristics are Ignitability,
Corrosivity, Reactivity, and Toxicity.
. For simplicity Y.C.Warana Mahavidyalaya Warananagar college campus divided into eight
parts includes Science, Arts, Commerce, Gymkhana, Computer Lab., Office, Exterior and CFC. Out
of these small quantity of Hazardous waste is observed only in Department of Chemistry, which is
generated due to various chemicals handled in the department. It is in the form of solid as well as in
liquid state. Data of Hazardous waste recorded is given below:
Table No.4.1: Hazardous Waste Generated at College
Sr. No. Department Type of Hazardous Waste Hazardous
Waste in
(kg)
Hazardous
Waste in
(liters)
1 VKCA/ MPSC Laboratory Chemicals and other Nil Nil
2 Botany Laboratory Chemicals and other Nil Nil
3 Department of
Garden
Laboratory Chemicals and other Nil Nil
4 HSVC Laboratory Chemicals and other Nil Nil
5 Library Laboratory Chemicals and other Nil Nil
6 Gymkhana Laboratory Chemicals and other Nil Nil
7 Sociology Laboratory Chemicals and other Nil Nil
8 Hindi Laboratory Chemicals and other Nil Nil
9 Economics Laboratory Chemicals and other Nil Nil
10 Histiry Laboratory Chemicals and other Nil Nil

Green Audit : 2014-15
Yashwantrao Chavan Warana Mahavidyalaya,Warananagar
89
Sr. No. Department Type of Hazardous
Waste
Hazardous
Waste in
(kg)
Hazardous
Waste in (liters)
11 English Laboratory Chemicals and
other
Nil Nil
12 Geography Laboratory Chemicals and
other
Nil Nil
13 Marathi Laboratory Chemicals and
other
Nil Nil
14 Commerce Laboratory Chemicals and
other
Nil Nil
15 Computer (IT) Laboratory Chemicals and
other
Nil Nil
16 Mathematics Laboratory Chemicals and
other
Nil Nil
17 Zoology Laboratory Chemicals and
other
Nil Nil
18 Chemistry Laboratory Chemicals and
other
4.320 11.500
19 Cap-Centre Laboratory Chemicals and
other
Nil Nil
20 Physics Laboratory Chemicals and
other
Nil Nil
Total 4.320 11.500
Above Table no. 4.1 shows that data is recorded from 20 different departments in college but
hazardous Chemical Waste is generated only in Chemistry department. No other department ( i.e. 19
departments) generate any type of Hazardous Waste. Here solid hazardous waste is 4.320 Kg and
liquid hazardous waste is 11.5 liters.
Green Audit : 2014-15
Yashwantrao Chavan Warana Mahavidyalaya,Warananagar
90
3.5. E-Waste :-
Generation of E-waste is apparent at every colleges. In academic colleges there are several
equipments and instruments running in administrative as well as in various departments used for
educational activities. Computers, Printers, Scanners, Xerox machines are mostly used for
administrative work..At time of teaching, learning and evaluation in academic college we deal with
electric material, electric equipments/ instruments ,measuring instruments, different electric circuits,
wires, ICs, Microprocessors, PCBs, electronic components(like resistors, diodes, transistors,
transformers, inductances, relays, etc),damages instruments, hardware‟s and peripherals of computer
system, lighting equipments(like Bulbs, tube), fans all these include in E-wastes. The more use of
such listed materials generates E- waste when these instrument/ equipments get worn out with time.
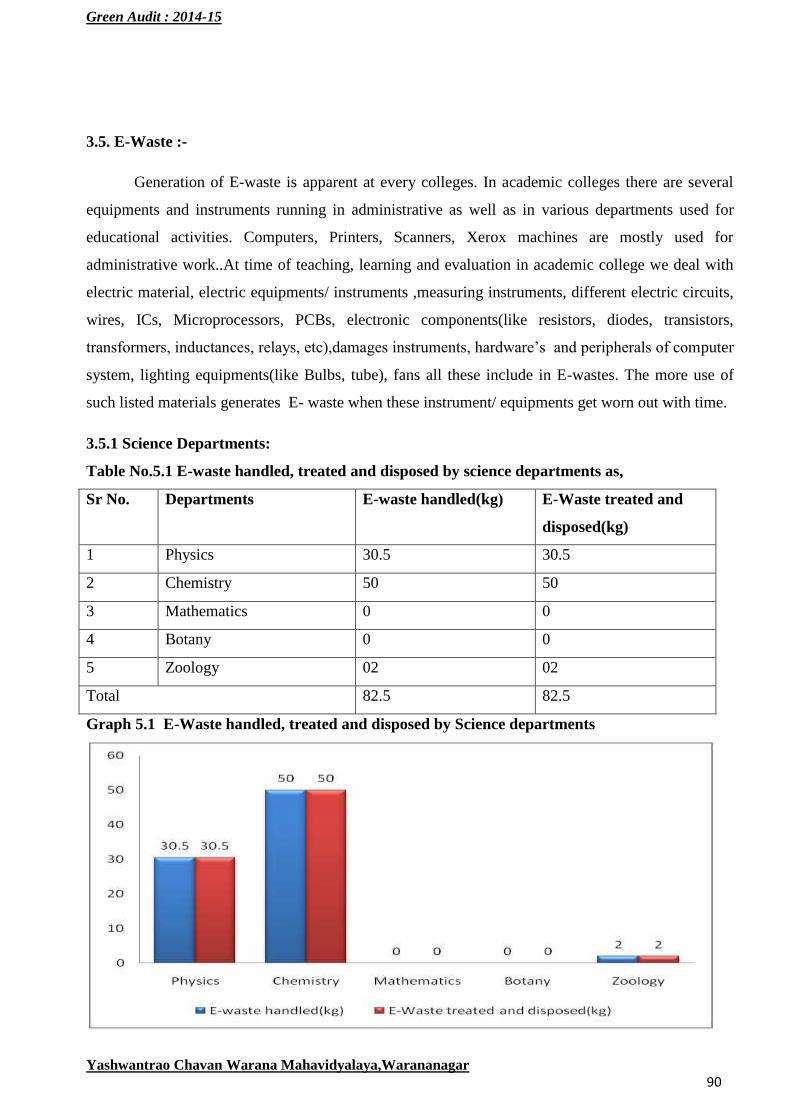
3.5.1 Science Departments:
Table No.5.1 E-waste handled, treated and disposed by science departments as,
Sr No. Departments E-waste handled(kg) E-Waste treated and
disposed(kg)
1 Physics 30.5 30.5
2 Chemistry 50 50
3 Mathematics 0 0
4 Botany 0 0
5 Zoology 02 02
Total 82.5 82.5
Graph 5.1 E-Waste handled, treated and disposed by Science departments

Green Audit : 2014-15
Yashwantrao Chavan Warana Mahavidyalaya,Warananagar
91
Data collected shown in above table reveals that, major source of e-waste are generated in Science
department. Chemistry department generated highest amount of e-waste as compared to other
departments .It is followed by Physics department which generated 30.500 kgs of e-waste which is
treated and disposed in proper manner. other science departments generates negligible amount of e-
waste.
3.5.2 Commerce Departments :
Table 5.2 E-waste handled, treated and disposed by Commerce departments as,
Sr No. Departments E-waste handled(kg) E-Waste treated and
disposed(kg)
1 Commerce 0 0
The Commerce department of our college has no any type of e-waste material.
3.5.3 Arts Departments:
3.5.3. 1 Language Department :
Table 5.3 E-waste handled, treated and disposed by Language departments as,
Sr No. Departments E-waste handled(kg) E-Waste treated and
disposed(kg)
1 Marathi 0 0
2 Hindi 0 0
3 English 0 0
The Language department of our college doesn‟t generate any E- waste.
3.5.3.2 Social Science and HSVC Department :-
Table 5.4 E-waste handled,treated and disposed by Social science and HSVC departments as,
Sr No. Departments E-waste handled(kg) E-Waste treated and
disposed(kg)
1 Economics 0 0
2 History 0 0
3 Geography 0 0
4 HSVC 0 0
In Social Science and HSVC Department, there is no e-waste material.

Green Audit : 2014-15
Yashwantrao Chavan Warana Mahavidyalaya,Warananagar
92
3.5.4 Computer Department/ I.T. Lab. :
Table 5.5 E-waste handled,treated and disposed by Computer departments as,
Sr No. Departments E-waste handled(kg) E-Waste treated and
disposed(kg)
1 Information Technology 51 51
In Department of Computer Science 51 kg e-waste is generated in last year, it is treated and
disposed in proper manner.
3.5.5 Office department
Table 5.6 : E-waste handled,treated and disposed by Administrative Office as,
Sr No. Departments E-waste handled(kg) E-Waste treated and
disposed(kg)
1 Administrative Office 0 0
2 Principal Chamber 0 0
3 Enquiry room 0 0
4 Staff Room 0 0
5 Ladies Room 0 0
6 Meeting Room 0 0
7 NAAC Room 0 0
8 Store Room 0 0
9 Strong Room 0 0
10 Gents Room 0 0
11 Gents Lavatory 0 0
12 Cultural Hall 0 0
Administrative Office and other Sections has no e-waste material.

Green Audit : 2014-15
Yashwantrao Chavan Warana Mahavidyalaya,Warananagar
93
3.5.6 Gymkhana :
Table 5.7 : E-waste handled, treated and disposed by Gymkhana as
Sr No. Departments E-waste handled(kg) E-Waste treated and
disposed(kg)
1 Gymnasium Hall 0 0
2 Office 0 0
3 Ground 0 0
4 Doctor Room 0 0
Gymkhana and in other parts of Gymkhana has no e-waste material.
3.5.7 Exteriors :-
Table 5.8 : E-waste handled, treated and disposed by Exteriors as,
Sr No. Departments E-waste handled(kg) E-Waste treated and
disposed(kg)
1 Exteriors and Botanical garden 0 0
In Exteriors college there is no e-waste material.
3.5.8 Common Facility Center :
Table 5.9: E-waste handled, treated and disposed by Common Facility Center as,
Sr No. Departments E-waste handled(kg) E-Waste treated and
disposed(kg)
1 Canteen 0 0
2 Mess 0 0
3 Library 10 10
4 MPSC Center 0 0
5 Boys Hostel 0 0
6 Girls Hostel 0 0
7 Staff Quarters 0 0
8 Health Center 0 0

Green Audit : 2014-15
Yashwantrao Chavan Warana Mahavidyalaya,Warananagar
94
Graph 5.2 : E-Waste handled, treated and disposed by Common Facility Center
There are various common facility centers in our college campus like canteen, mess ,hostels, MPSC
center, Library, Health Center and staff Quarters but only Library handled 10 kg e-waste material,
which is disposed in last year.

Green Audit : 2014-15
Yashwantrao Chavan Warana Mahavidyalaya,Warananagar
95
Table 5,10. Department wise E-waste generation and its disposal in college:
Sr No. Departments E-waste handled(kg) E-Waste treated and
disposed(kg)
1 Science Departments 82.500 82.500
2 Commerce Departments 0 0
3 Arts
a) Language Department
b) Social Science and
HSVC Department
0
0
0
0
4 Computer Department 51 51
5 Office 0 0
6 Gymkhana 0 0
7 Exteriors 0 0
8 Common Facility Center 10 10
Total 143.500 143.500
Graph No. 5.3 Department wise E-waste generation and its disposal in college:

Green Audit : 2014-15
Yashwantrao Chavan Warana Mahavidyalaya,Warananagar
96
The total amount of e-waste generated by various departments of college is about 143.5 kg
per year. .Science department generates maximum of e-waste about 82.5 kg in year, followed by
Computer department generates 51kg and Common facility centers generate 10 kg e-waste. All other
departments generate 0 kg e-waste.

Green Audit : 2014-15
Yashwantrao Chavan Warana Mahavidyalaya,Warananagar
97
3.6. Air Environment
Air pollution has long term and short term impact on the biotic and abiotic component of the
environment. The ambient air quality with respect to the core zone around the periphery of
Yashwantrao Chavan Warana Mahavidyalaya, Warananagar, was monitored. The study area represents
both rural and industrial environment. The chief sources of air pollution in the study area are mainly
due to existing sugar factory unit of Tatyasaheb Kore Sugar Industry, other industrial units (like
Wagpos, Manugraph, Biltube milk products etc) and vehicular activities and domestic firewood
burning, fuel burning etc. The major pollutants released in the atmosphere will be PM10, PM2.5. SO2
NOx and CO etc.
This section describes the selection of sampling locations, methodology adopted for sampling,
analytical techniques and frequency of sampling.
3.6.1 Methodology
Selection of sampling locations
Selection of ambient air quality monitoring stations is based on the Meteorological conditions
of the area.
Ambient Air Quality Monitoring (AAQM) stations were establish at Six locations with due
consideration to the Meteorological conditions of the area.
Table- 6.1 Ambient Air Quality Monitoring Locations

Green Audit : 2014-15
Yashwantrao Chavan Warana Mahavidyalaya,Warananagar
98
Sr.
No. Code No. Station Name Description
1. AAQ1 Near Main Gate Sensitive zone
2. AAQ2 Near Sugar Factory Industrial area
3. AAQ3 Near main Building Sensitive zone
4. AAQ4 Near Library Sensitive zone
5. AAQ5 Near Gymnastic Hall Sensitive zone
6. AAQ6 Near Bus Stop Rural area
The ambient air quality monitoring has been done twice in month for every location.
The air environment data is generated for the following parameters:
PM2.5 : Respirable Particulate Matter (RPM);
PM10 : Respirable Particulate Matter (RPM);
Sulphur dioxide (SO2); and
Oxides of Nitrogen (NOx)
Carbon monoxide (CO);
3.6.2 Sampling Duration
Twenty-four hourly samples, twice a month at all air-monitoring stations.
3.6.3 Instruments Used
Respirable Dust Samplers (APM-451) of “Envirotech” make are used for sampling PM2.5, PM10
and gaseous pollutants like SO2, NOx. The gases are collected in a sampling tray attached to the
Respirable Dust Sampler.
3.6.4 Methodology for Analysis
The air samples are analyzed as per IS: 5182 "Method for Measurement of Air Pollution".
PM2.5/ PM10: Gravimetric Method (IS: 5182, Part IV)
SO2: Modified West and Gaeke Method (IS: 5182, Part II)
NOx: Jacobs and Hochheiser Method (IS: 5182, Part VI)
CO: NDIR spectroscopy method
3.6.5 Presentation of Results
The ambient Air quality monitoring data analyzed and tabulated in the Table - 6.2 to Table-6.7 which
is compared with National Ambient Air Quality Standards as tabulated in Table – 6.8 (Annexure-Q)
Table- 6.2 Ambient Air Quality Monitoring Results
Near Main Gate (A1)
Date of
sampling SO2 (g/m
3)
NOx
(g/m3)
PM2.5
(g/m3)
PM10
(g/m3)
CO (ppm)

Green Audit : 2014-15
Yashwantrao Chavan Warana Mahavidyalaya,Warananagar
99
06.01.2015 15.6 20.3 22.8 50.6 BDL
20.01.2015 14.6 18.8 21.3 48.3 BDL
03.02.2015 13.9 19.1 20.9 45.9 BDL
17.02.2015 15.1 18.9 19.7 44.8 BDL
10.03.2015 14.4 19.4 20.4 39.5 BDL
24.03.2015 11.3 19.0 21.7 40.7 BDL
14.04.2015 12.8 20.1 19.6 49.2 BDL
28.04.2015 13.6 18.7 18.4 46.8 BDL
13.05.2015 10.9 19.2 20.2 48.3 BDL
27.05.2015 14.2 18.0 20.7 47.2 BDL
09.10.2015 10.3 18.6 16.7 37.4 BDL
23.10.2015 13.1 18.9 16.9 42.4 BDL
06.11.2015 12.4 19.4 17.9 43.2 BDL
20.11.2015 11.8 18.7 18.4 44.8 BDL
08.12.2015 12.1 20.2 19.5 46.5 BDL
22.12.2015 13.6 19.3 20.4 41.3 BDL
Table- 6.3 Ambient Air Quality Monitoring Results
Near Sugar Factory (A2)
Date of
sampling
SO2 (g/m3)
NOx
(g/m3)
PM2.5
(g/m3)
PM10
(g/m3)
CO (ppm)
06.01.2015 22.4 28.3 26.8 58.9 BDL
20.01.2015 15.9 26.9 22.7 53.4 BDL
03.02.2015 16.8 24.8 24.6 56.2 BDL
17.02.2015 18.3 27.3 25.5 52.3 BDL
10.03.2015 17.9 26.2 23.9 54.7 BDL
24.03.2015 16.8 22.8 20.8 48.6 BDL
14.04.2015 20.4 24.1 24.7 51.7 BDL
28.04.2015 16.4 23.3 25.9 46.9 BDL
Green Audit : 2014-15
Yashwantrao Chavan Warana Mahavidyalaya,Warananagar
100
13.05.2015 19.8 24.9 24.8 53.1 BDL
27.05.2015 20.3 21.8 26.1 52.8 BDL
09.10.2015 11.2 19.8 18.7 40.1 BDL
23.10.2015 14.4 20.7 22.1 47.9 BDL
06.11.2015 13.8 22.3 23.9 49.9 BDL
20.11.2015 16.7 19.9 21.8 50.4 BDL
08.12.2015 19.3 23.6 24.2 52.6 BDL
22.12.2015 18.7 24.2 22.6 51.3 BDL
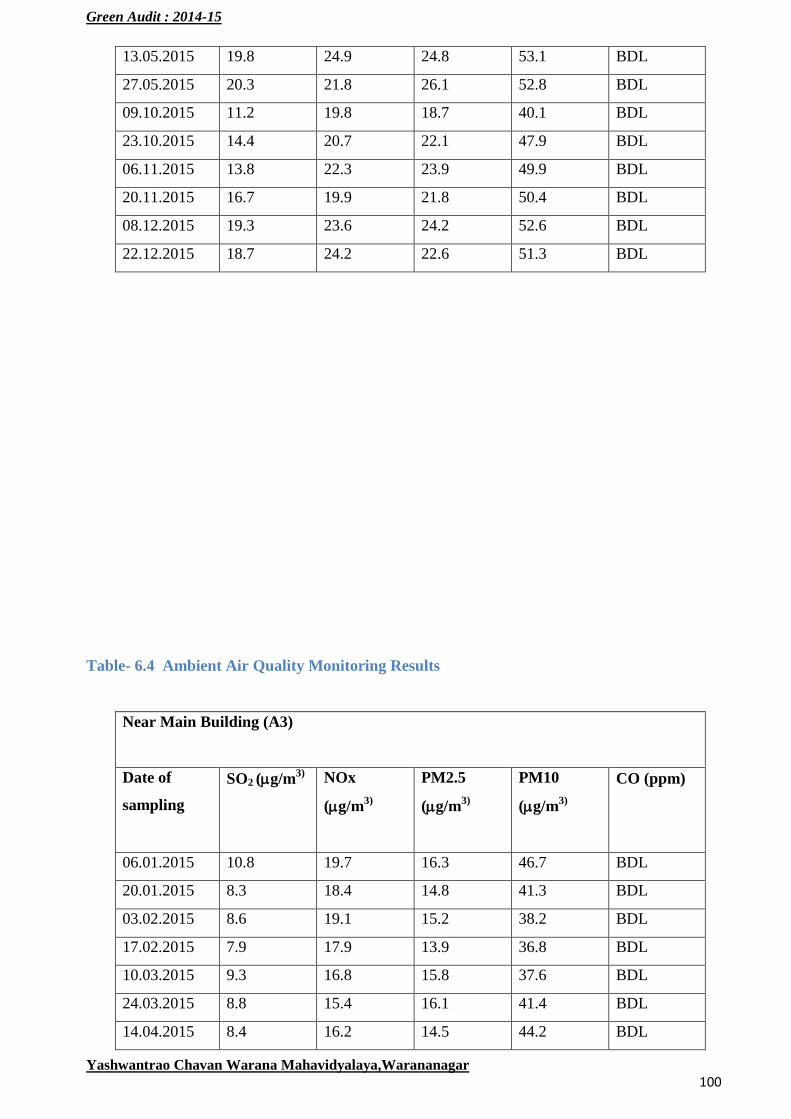
Table- 6.4 Ambient Air Quality Monitoring Results
Near Main Building (A3)
Date of
sampling
SO2 (g/m3)
NOx
(g/m3)
PM2.5
(g/m3)
PM10
(g/m3)
CO (ppm)
06.01.2015 10.8 19.7 16.3 46.7 BDL
20.01.2015 8.3 18.4 14.8 41.3 BDL
03.02.2015 8.6 19.1 15.2 38.2 BDL
17.02.2015 7.9 17.9 13.9 36.8 BDL
10.03.2015 9.3 16.8 15.8 37.6 BDL
24.03.2015 8.8 15.4 16.1 41.4 BDL
14.04.2015 8.4 16.2 14.5 44.2 BDL

Green Audit : 2014-15
Yashwantrao Chavan Warana Mahavidyalaya,Warananagar
101
28.04.2015 9.3 18.7 14.3 40.8 BDL
13.05.2015 8.0 17.3 15.1 39.6 BDL
27.05.2015 8.2 18.2 14.9 41.8 BDL
09.10.2015 7.8 13.6 11.3 29.6 BDL
23.10.2015 8.3 15.9 14.4 32.2 BDL
06.11.2015 8.1 16.4 15.2 34.8 BDL
20.11.2015 8.8 17.5 13.1 38.4 BDL
08.12.2015 7.9 16.2 14.8 40.2 BDL
22.12.2015 8.0 18.1 16.0 42.8 BDL
Table- 6.5 Ambient Air Quality Monitoring Results
Near Library (A4)
Date of
sampling
SO2 (g/m3)
NOx
(g/m3)
PM2.5
(g/m3)
PM10
(g/m3)
CO (ppm)
06.01.2015 11.8 20.3 17.6 45.9 BDL
20.01.2015 9.9 18.4 14.3 39.8 BDL
03.02.2015 10.1 19.2 16.8 40.2 BDL
17.02.2015 9.6 17.7 15.2 41.6 BDL
10.03.2015 8.9 16.9 16.4 39.9 BDL
24.03.2015 8.7 19.4 15.9 42.8 BDL
14.04.2015 10.2 19.8 14.2 43.7 BDL
Green Audit : 2014-15
Yashwantrao Chavan Warana Mahavidyalaya,Warananagar
102
28.04.2015 9.3 18.4 13.8 41.4 BDL
13.05.2015 11.0 17.8 15.7 36.9 BDL
27.05.2015 9.6 16.9 14.4 38.6 BDL
09.10.2015 8.4 14.1 11.6 30.1 BDL
23.10.2015 9.3 15.4 13.9 40.5 BDL
06.11.2015 8.4 17.2 15.2 38.4 BDL
20.11.2015 8.7 18.1 14.3 39.4 BDL
08.12.2015 9.1 18.4 16.8 41.8 BDL
22.12.2015 9.3 19.2 17.1 42.7 BDL
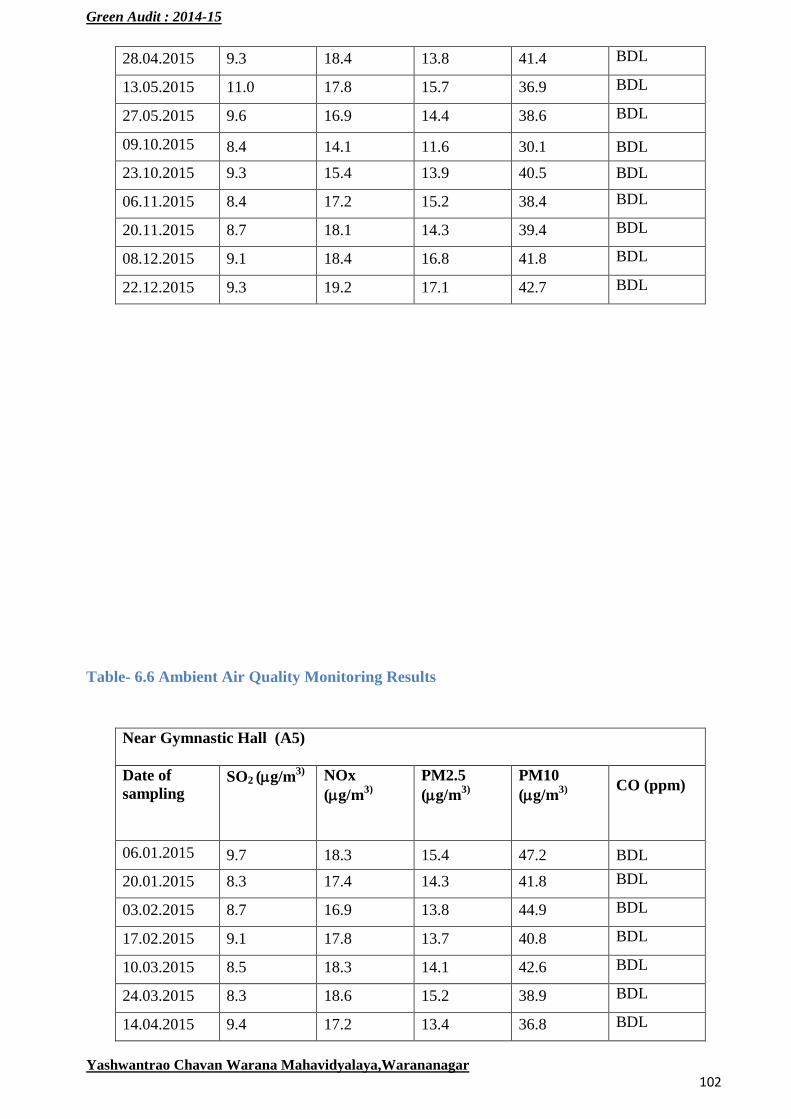
Table- 6.6 Ambient Air Quality Monitoring Results
Near Gymnastic Hall (A5)
Date of
sampling SO2 (g/m
3)
NOx
(g/m3)
PM2.5
(g/m3)
PM10
(g/m3)
CO (ppm)
06.01.2015 9.7 18.3 15.4 47.2 BDL
20.01.2015 8.3 17.4 14.3 41.8 BDL
03.02.2015 8.7 16.9 13.8 44.9 BDL
17.02.2015 9.1 17.8 13.7 40.8 BDL
10.03.2015 8.5 18.3 14.1 42.6 BDL
24.03.2015 8.3 18.6 15.2 38.9 BDL
14.04.2015 9.4 17.2 13.4 36.8 BDL

Green Audit : 2014-15
Yashwantrao Chavan Warana Mahavidyalaya,Warananagar
103
28.04.2015 8.6 15.8 13.8 40.7 BDL
13.05.2015 8.2 16.2 12.9 41.9 BDL
27.05.2015 8.0 17.3 13.6 42.3 BDL
09.10.2015 8.1 14.9 12.3 32.8 BDL
23.10.2015 8.4 15.8 13.1 40.9 BDL
06.11.2015 9.1 15.9 14.8 39.5 BDL
20.11.2015 9.2 16.1 14.2 42.7 BDL
08.12.2015 8.7 17.4 13.7 40.2 BDL
22.12.2015 8.6 17.9 14.1 43.1 BDL
Table- 6.7 Ambient Air Quality Monitoring Results
Near Bus Stop (A6)
Date of
sampling SO2 (g/m
3)
NOx
(g/m3)
PM2.5
(g/m3)
PM10
(g/m3)
CO (ppm)
06.01.2015 21.2 27.4 28.3 60.4 BDL
20.01.2015 20.6 25.2 25.2 55.3 BDL
03.02.2015 19.9 24.8 26.8 51.6 BDL
17.02.2015 18.4 26.3 27.3 54.8 BDL
10.03.2015 20.7 25.7 28.1 53.2 BDL
24.03.2015 20.9 22.9 24.2 50.7 BDL
14.04.2015 19.8 24.7 21.6 52.9 BDL

Green Audit : 2014-15
Yashwantrao Chavan Warana Mahavidyalaya,Warananagar
104
28.04.2015 18.4 23.1 22.9 58.4 BDL
13.05.2015 20.3 25.8 20.5 53.6 BDL
27.05.2015 19.2 24.9 25.2 56.9 BDL
09.10.2015 14.9 20.8 17.4 44.8 BDL
23.10.2015 17.6 23.4 22.4 51.3 BDL
06.11.2015 18.4 26.5 26.2 53.4 BDL
20.11.2015 19.8 22.7 23.8 55.1 BDL
08.12.2015 20.1 23.6 21.4 50.8 BDL
22.12.2015 19.7 21.9 20.9 53.2 BDL
Ambient air quality analysis results for the six monitoring locations which were selected to represent
condition of the region are given below.
3.2.6 Near Main Gate (A1)
The location comes under Sensitive zone. The concentration of PM2.5 ranged from 16.7-22.8 µg/m3
while that of PM10 was in the range of 37.4-50.6 µg/m3, SO2 and NOx were in the range of 10.3-
15.6 µg/m3 and 18.6-20.3 µg/m3 respectively. The CO values were observed in the Below
Detectable Limit.
3.2.7 Near Sugar Factory (A2)
The location comes under Industrial zone. The concentrations of PM2.5 and PM10 at this location
were in the range of 18.7-26.8 µg/m3 and 40.1-58.9 µg/m3 respectively. While the values of SO2
and NOX were observed in the range of 11.2-22.4 µg/m3 and 19.8-28.3 µg/m3 respectively. The CO
values were observed in the Below Detectable Limit.
3.2.8 Near Main Building (A3)
The location comes in the Sensitive zone. Here the PM2.5 and PM10 concentrations were in the
range of 11.3-16.3 µg/m3 and 29.6-46.7 µg/m3 respectively. The concentrations of SO2 and NOx
were observed in the range of 7.8-10.8 µg/m3 and 13.6-19.7 µg/m3 respectively. The CO values
were observed in the Below Detectable Limit.
3.2.9 Near Library (A4)
This location comes within the Sensitive zone. The concentrations of PM2.5 and PM10 at this
location were in the range of 11.6-17.6 µg/m3 and 30.1-45.9 µg/m3 respectively. While the values of
SO2 and NOX were observed in the range of 8.4-11.8 µg/m3 and 14.1-20.3 µg/m3 respectively. The
CO values were observed in the Below Detectable Limit.

Green Audit : 2014-15
Yashwantrao Chavan Warana Mahavidyalaya,Warananagar
105
3.2.10 Near Gymnastic Hall (A5)
The location comes under Sensitive Zone. The concentration of PM2.5 ranged from 12.3-15.4 µg/m3
while that of PM10 was in the range of 32.8-47.2 µg/m3. SO2 and NOx concentrations were in the
range of 8.1-9.7 µg/m3 and 14.9-18.3 µg/m3 respectively. The CO values were observed in the
Below Detectable Limit.
3.2.11 Near Bus Stop (A6)
The location comes under Rural Area Zone. The concentration of PM2.5 ranged from 17.4-28.3
µg/m3 while that of PM10 was in the range of 44.8-60.4 µg/m3. SO2 and NOx concentrations were
in the range of 14.9-21.2 µg/m3 and 20.8-27.4 µg/m3 respectively. The CO values were observed in
the Below Detectable Limit.
The summary of the monitoring results including minimum, maximum and average levels are
presented in Table 1.2. The results obtained were compared for 24hrs average standards for
residential areas prescribed by the National Ambient Air Quality Standards (NAAQS). The National
Ambient Air Quality Standards are presented in Table 6.8
Table 6.8: National Ambient Air Quality Standards (NAAQS)
Sr.
No. Pollutant
Time Weighted
Average
Concentration in Ambient Air
(µg/m3 except indicated)
Industrial
Area
Residential,
Rural and
Other Areas
Sensitive
Area
1 Sulphur Dioxide
(SO2)
Annual Average * 80 60 15
24 Hours** 120 80 30
2 Oxides of
Nitrogen (NOx)
Annual Average * 80 60 15
24 Hours** 120 80 30
3 Suspended Annual Average * 360 140 70

Green Audit : 2014-15
Yashwantrao Chavan Warana Mahavidyalaya,Warananagar
106
Particular Matter
(SPM) 24 Hours** 500 200 100
4
Respirable
Particular Matter
(RPM)
Annual Average * 120 60 50
24 Hours** 150 100 75
5 Carbon
Monoxide (CO)
8 Hourly
Average* 5.0 mg/m
3 2.0 mg/m
3 1.0 mg/m
3
1 Hour Average** 10.0
mg/m3
4.0 mg/m3 2.0 mg/m
3
* Annual arithmetic mean of minimum 104 measurements in a year
taken twice a week 24 hourly at uniform interval
** 24 hourly /8 hourly values should be met 98% of the time in a year.
However, 2% of the time it may exceed but not on two consecutive days
The salient observations of the results and their compliance to the 24 hourly average NAAQ
standards are as follows:
The maximum concentration of PM2.5 observed was 28.3 µg/m3 near Bus Stop site. The
peak PM10 value of 60.4 µg/m3 was also observed near Bus Stop site.
The Sulphur Dioxide levels monitored at all the locations confirms to the standards of 80
µg/m3, with highest value of 22.4 µg/m
3 observed Near sugar Factory.
The Oxides of Nitrogen levels monitored at all the locations also complies with the
stipulated standards of 80 µg/m3.
The Carbon Monoxide levels also complied with the stipulated standards of 2.0 mg/m3,
The CO levels at all the locations were within the stipulated limit.
Sampling location which are in campus shows sensitive zone standards while Sampling
location which are out campus shows industrial area , Rural area zone standards.

Green Audit : 2014-15
Yashwantrao Chavan Warana Mahavidyalaya,Warananagar
107
3.7 WATER ENVIRONMENT
The purpose of this study is to:
Assess the waste water characteristics of the laboratory waste;
Waste water sample was examined for physico-chemical parameters in order to assess the
characteristics of the laboratory waste. The sample was collected and analyzed as per the procedures
specified in „Standard Method for the Examination of Water and Wastewater‟ published by
American Public Health Association (APHA).

Green Audit : 2014-15
Yashwantrao Chavan Warana Mahavidyalaya,Warananagar
108
Sample for chemical analysis was collected in polyethylene cans. Selected physico-chemical
parameters have been analyzed to identify the laboratory waste water quality.
The results of sample are as given below Table 7.1.
Table 7.1: Laboratory waste analysis Results
Sr.
No.
Parameters Results Unit
1 pH 7.2 ---
2 Total Dissolved Solids (TDS) 264 mg/l
3 Bio-chemical Oxygen Demand (BOD) 80 mg/l
4 Chemical Oxygen Demand (COD) 840 mg/l
5 Oil and Grease 0.03 mg/l
From the analysis report of laboratory waste it is observed that Chemical Oxygen Demand (COD) is
higher.
From above report the COD of laboratory waste water sample is observed to be high (
840mg/L ), hence it is not suitable for irrigation purpose. It can be decreased and make suitable for
irrigating by adding coagulants like Fecl3 and Fe2(So4 ) and then passing the sample through the filter
made up of sands, charcoal, activated carbon.
3.8. NOISE ENVIRONMENT
The noise levels measurements were carried out using precision noise level meter. The noise
level survey was carried out at six locations, located within the in campus and out campus of
Yashwantrao Chavan Warana Mahavidyalaya, Warananagar. The major source of noise identified in
the study area has been predominantly the vehicular movement, and the transportation activities.

Green Audit : 2014-15
Yashwantrao Chavan Warana Mahavidyalaya,Warananagar
109
3.8.1Selection of Locations for Monitoring
Noise monitoring has been undertaken for the duration of 24 hrs at each location to cover up all the
periods of the day to establish the noise levels and assess the impact of the total noise generated at
the study area. The environment setting of each noise monitoring location is given in Table 8.1.
Table 8.1: Details of Noise Monitoring Locations
Location Code Monitoring Location Criteria
N1 Near main gate Sensitive zone
N2 Near sugar factory Industrial area
N3 Near main building Sensitive zone
N4 Near library Sensitive zone
N5 Near gymnastic hall Sensitive zone
N6 Near bus stop Rural area
3.8.2 Instrument Used for Monitoring
Sound pressure level (SPL) measurements were automatically recorded with the help of an
Integrated Sound Level Meter to give the equivalent noise level for every hour continuously for 24
hours in a day
3.8.3 Results
Equivalent noise levels viz., L day and L night, at the noise monitoring locations are provided in
Table 8.2 while noise standards are given in Table 83.
Table 8.2: Noise Monitoring Results in the Study area
Name of Station
Noise Levels (dBA) Ambient Noise Standard (dBA)
Day Night Day Night Category of
area

Green Audit : 2014-15
Yashwantrao Chavan Warana Mahavidyalaya,Warananagar
110
Near main gate 65.0 51.2 50 40 Silent zone
Near sugar factory 68.8 55.5 75 70 Industrial
Near main building 58.5 46.2 50 40 Silent zone
Near library 55.7 41.3 50 40 Silent zone
Near gymnastic hall 54.0 41.0 50 40 Silent zone
Near bus stop 71.5 61.5 65 55 Urban area
From the monitoring survey of noise levels it was observed that the day time noise levels
were observed in the range of 54.0-71.5 dB(A). The higher noise levels are due to vehicular traffic in
the area. The night time noise levels observed at all the 6 locations were found to be in the range of
41.0-61.5 dB(A), which are found to be higher due to the transportation.
Table 8.3: Ambient Noise Quality Standards
Category of Area/Zone
Limits in dB(A) Leq*
Day Time Night Time
Industrial area 75 70
Commercial area 65 55
Residential area 55 45
Silence Zone 50 40
Day time shall mean from 6.00 a.m. to 10.00 p.m.
Night time shall mean from 10.00 p.m. to 6.00 a.m.
Silence zone is defined as an area comprising not less than 100 meters around hospitals,
educational institutions and courts. The silence zones are zones, which are declared as such
by the competent authority.
Mixed categories of areas may be declared as one of the four above-mentioned categories by
the competent authority.
Green Audit : 2014-15
Yashwantrao Chavan Warana Mahavidyalaya,Warananagar
111
Chapter-IV
Aware of the suffering caused by the destruction of life, I undertake to cultivate compassion and
learn ways to protect the lives of people, animals, plants, and minerals.
- Thich Nhat Hanh, Buddhist monk
Our task must be to free ourselves by widening our circle of compassion to embrace all living
creatures and the whole of nature and its beauty.
- Albert Einstein
We share the earth not only with our fellow human beings, but with all the other creatures.
- Dalai Lama
OUR CAMPUS

Green Audit : 2014-15
Yashwantrao Chavan Warana Mahavidyalaya,Warananagar
112
College Well
Solar Water heater at Boys hostel
Vermicomposting Plant.

Green Audit : 2014-15
Yashwantrao Chavan Warana Mahavidyalaya,Warananagar
113
Botanical garden
„Shivneri Ground‟
Ramps for Disabled students
Green Lawn Behind Science Building
Green Audit : 2014-15
Yashwantrao Chavan Warana Mahavidyalaya,Warananagar
114
`
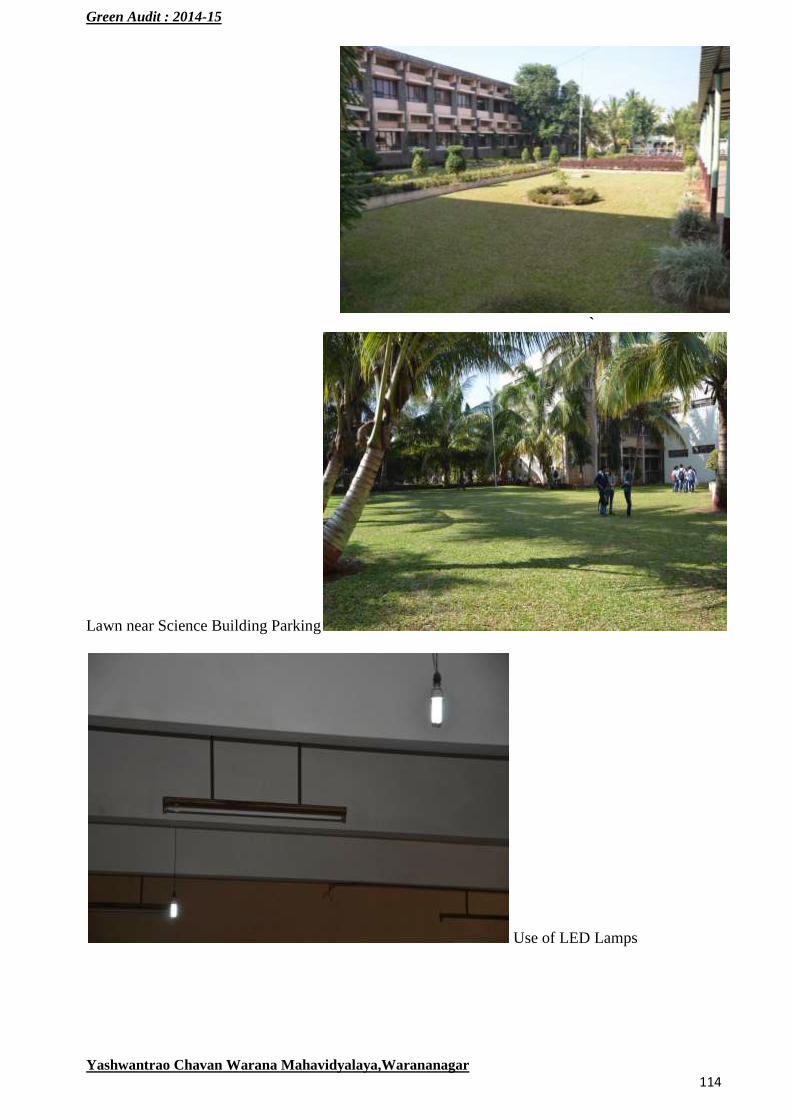
Lawn near Science Building Parking
Use of LED Lamps

Green Audit : 2014-15
Yashwantrao Chavan Warana Mahavidyalaya,Warananagar
115
Lawn in Front of Library
Roof top Rain Water Harvesting
(Back Side of Library Building)
Roof Top Water Harvesting
(New Building)

Green Audit : 2014-15
Yashwantrao Chavan Warana Mahavidyalaya,Warananagar
116
Green Lawn: Study Area
Lawn In Front of College
Lawns: Near Main Stage
Green Audit : 2014-15
Yashwantrao Chavan Warana Mahavidyalaya,Warananagar
117
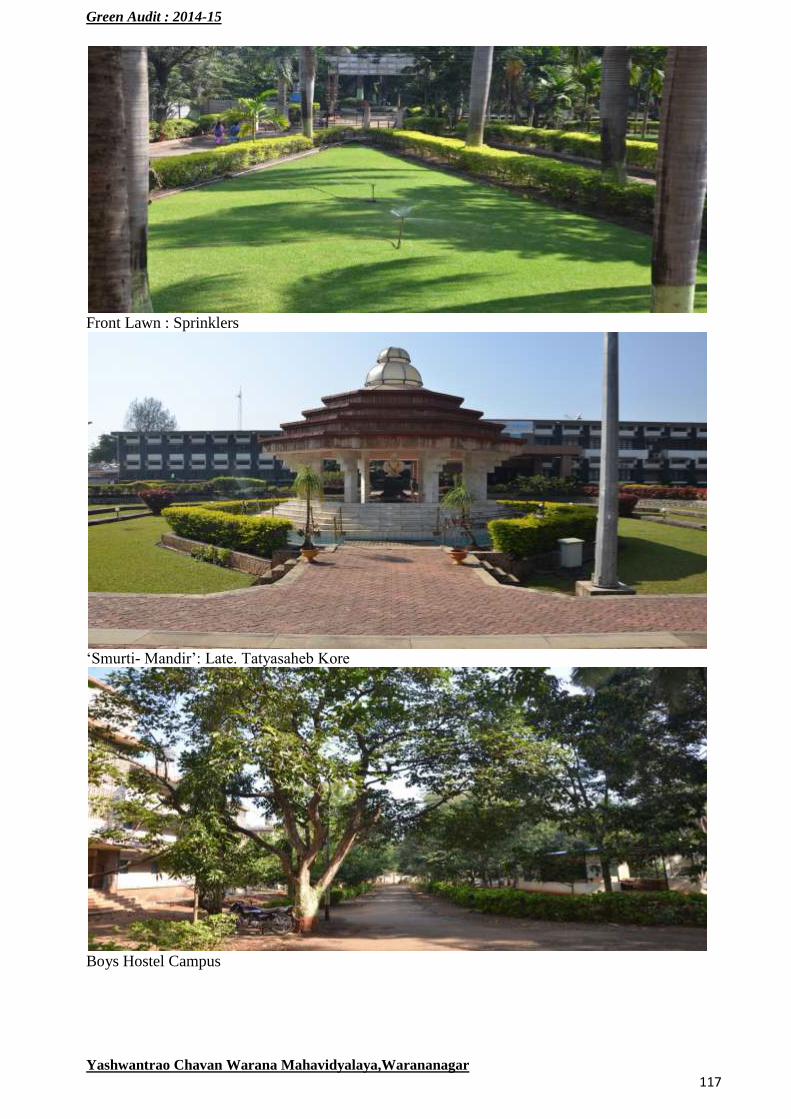
Front Lawn : Sprinklers
„Smurti- Mandir‟: Late. Tatyasaheb Kore
Boys Hostel Campus

Green Audit : 2014-15
Yashwantrao Chavan Warana Mahavidyalaya,Warananagar
118
Boys Hostel Campus
Trees in Hostel Campus

Green Audit : 2014-15
Yashwantrao Chavan Warana Mahavidyalaya,Warananagar
119
Greenery on both sides of Road In Boys Hostel Campus
Medical facility center & Greenery around the road

Green Audit : 2014-15
Yashwantrao Chavan Warana Mahavidyalaya,Warananagar
120
Lawn :Nilkantheshaver Garden
View near Nilkantheshaver

Green Audit : 2014-15
Yashwantrao Chavan Warana Mahavidyalaya,Warananagar
121
Waste Collector
College Roads

Green Audit : 2014-15
Yashwantrao Chavan Warana Mahavidyalaya,Warananagar
122
Gymnasium Hall
Top View of Entrance
Solid Waste Collection
Collection of Chemical Waste from Laboratory

Green Audit : 2014-15
Yashwantrao Chavan Warana Mahavidyalaya,Warananagar
123
Arrangement of coloured bench for disabled students
College- Rose Garden
College farm

Green Audit : 2014-15
Yashwantrao Chavan Warana Mahavidyalaya,Warananagar
124