The K2 parallel processor: architecture and hardware implementation
Upload
khangminh22Category
view
1download
0
MNRAS 480, 2976–2984 (2018) doi:10.1093/mnras/sty2053Advance Access publication 2018 July 31
K2 observations of the rapidly oscillating Ap star 33 Lib (HD 137949): newfrequencies and unique non-linear interactions
Daniel L. Holdsworth,1,2‹ M. S. Cunha,3 H. Shibahashi,4 D. W. Kurtz1 andD. M. Bowman5
1Jeremiah Horrocks Institute, University of Central Lancashire, Preston PR1 2HE, UK2Department of Physics, North-West University, Mafikeng Campus, Private Bag X2046, Mmabatho 2745, South Africa3Instituto de Astrofısica e Ciencias do Espaco, Universidade do Porto, CAUP, Rua das Estrelas, Porto PT4150-762, Portugal4Department of Astronomy, The University of Tokyo, Tokyo 113-0033, Japan5Instituut voor Sterrenkunde, KU Leuven, Celestijnenlaan 200D, Leuven B-3001, Belgium
Accepted 2018 July 25. Received 2018 July 24; in original form 2018 July 6
ABSTRACTWe present the analysis of K2 short cadence data of the rapidly oscillating Ap (roAp) star,33 Librae (HD 137949). The precision afforded to the K2 data allow us to identify at least 11pulsation modes in this star, compared to the three previously reported. Reoccurring separationsbetween these modes lead us to suggest a large frequency separation, �ν, of 78.9 μ Hz, twicethat reported in the literature. Other frequency separations we detect may represent the smallfrequency separation, δν, but this is inconclusive at this stage due to magnetic perturbationof the frequencies. Due to the highly non-linear pulsation in 33 Lib, we identify harmonics tofour times the principal frequency. Furthermore, we note a unique occurrence of non-linearinteractions of the 11 identified modes. The frequency separations of the modes around theprincipal frequency are replicated around the first harmonic, with some interaction with thesecond harmonic also. Such a phenomenon has not been seen in roAp stars before. Withrevised stellar parameters, linear non-adiabatic modelling of 33 Lib shows that the pulsationsare not greater than the acoustic cutoff frequency, and that the κ-mechanism can excite theobserved modes. Our observations are consistent with 33 Lib having a rotation period muchlarger than 88 d as presented in the literature.
Key words: asteroseismology – techniques: photometric – stars: chemically peculiar – stars:individual: 33 Lib – stars: magnetic field – stars: oscillations.
1 IN T RO D U C T I O N
There exists a rare subclass of the chemically peculiar A stars,which shows rapid oscillations in short-cadence photometric andspectroscopic observations. These stars, known as roAp stars, werediscovered by Kurtz (1982) through targeted photometry of a se-lection of Ap stars. Since then, only 61 of these objects have beendiscussed in the literature (for catalogues see Smalley et al. 2015;Joshi et al. 2016).
The chemical peculiarities in the Ap stars are a result of radiativeelevation of, most significantly, singly and doubly ionized rare-earthelements in the presence of a strong, stable, global, magnetic field(up to about 30 kG, e.g. Babcock 1960), which suppresses convec-tion. Typically, but not always, the radiatively elevated elementsform chemical spots in the atmosphere of the star around the mag-netic poles, and can show abundances of some elements greater than
� E-mail: [email protected]
one million times solar (Ryabchikova et al. 2004). Due to the highstability of the magnetic field, these spots are also stable, whichcan allow for the rotation period of the star to be measured throughmodulation of its mean light curve. A further property of the mag-netic field in Ap stars is that it is misaligned with the rotation axisleading to an observed variable magnetic field strength as the starrotates. This model of understanding the observations of Ap stars isknown as the oblique or rigid rotator model (Stibbs 1950). Finally,the strong magnetic field in the Ap stars is thought to be the rea-son for their slow rotation when compared to their non-magneticcounter parts (Abt & Morrell 1995; Stpien 2000); rotation periodsof a few of days to decades or centuries are not uncommon (Mathys2015).
The pulsations in the rapidly oscillating Ap stars are apparentin the period range 5–24 min with amplitudes up to 34 mmag inB-band observations (Holdsworth et al. 2018a). Their variability isthought to be driven by the κ-mechanism acting in the H I ionizationzone causing the excitement of high-overtone pressure modes (p
C© 2018 The Author(s)Published by Oxford University Press on behalf of the Royal Astronomical Society
Dow
nloaded from https://academ
ic.oup.com/m
nras/article/480/3/2976/5062818 by guest on 06 July 2022
K2 observations of 33 Lib 2977
modes, Balmforth et al. 2001; Saio 2005). However, work by Cunhaet al. (2013) has shown that turbulent pressure is also a viabledriving mechanism, especially for those roAp stars pulsating withfrequencies above their theoretical acoustic cutoff frequency. Theever increasing number of roAp stars with pulsations higher thanthe cutoff frequency (see fig. 12 of Holdsworth et al. 2018b, forcases) shows a need for an improved understanding of the drivingmechanisms in the roAp stars.
One of the goals of asteroseismology is the determination of fun-damental stellar parameters through precise stellar models. This isachieved through the measurement of the large and/or small fre-quency separations (�ν and δν, respectively). To first order, theasymptotic relation for high-order p modes, which applies to theroAp stars, is given by Tassoul (1980) as νn� ≈ �ν0(n + �/2 +ε), where n is the radial overtone of the mode, � is the angulardegree of the mode, �ν0 is the inverse of the sound traveltimeacross the stellar diameter and ε is a correction term that de-pends essentially on the properties of the surface layers. Gabrielet al. (1985) expressed �ν as a function of stellar parameters suchthat �ν = 0.205[GM/R3]1/2 Hz where G is the gravitational con-stant. However, the application of this relation to the roAp starsis complicated by the presence of a magnetic field. Even a ‘weak’field of only a few kG can perturb a pulsation frequency by be-tween 10 and 30 μHz ( 0.864–2.592 d−1, Dziembowski & Goode1996; Bigot et al. 2000; Cunha & Gough 2000; Saio & Gautschy2004; Saio 2005; Cunha 2006). The �ν value has been measuredfor about 15 roAp stars, with varying degrees of agreement withspectroscopic and/or interferometric fundamental parameters (e.g.Martinez, Kurtz & Kauffmann 1991; Mkrtichian & Hatzes 2005;Bruntt et al. 2009; Sachkov et al. 2011; Perraut et al. 2013).
In this paper we present our analysis of Kepler/K2 observationsof the well-known roAp star 33 Librae.
2 3 3 L I B R A E ( H D 1 3 7 9 4 9 )
33 Librae is a bright (V = 6.69), well studied roAp star. We present acompilation of 33 Lib’s properties in Table 1. The parameters shownin this table are mostly found in the work of Shulyak, Ryabchikova,and Kochukhov (2013), where a detailed study of several bright Apstars was conducted. We note that Kochukhov and Bagnulo (2006)also presented parameters of many chemically peculiar stars, butderive their results through a homogeneous study rather than froma star-by-star study, which is preferable. The radius, and thereforeluminosity, provided by Shulyak et al. (2013) were calculated usingthe Hipparcos parallax of 11.28 ± 0.67 mas from van Leeuwen(2007). Given the release of Gaia DR2 data on this star, we providean updated estimation of the radius and luminosity using the newparallax of 12.48 ± 0.06 mas (Gaia Collaboration et al. 2016, 2018).We use the updated values throughout the remainder of this paper.
Observations of 33 Lib presented by Kurtz (1982) revealed thepresence of only one pulsation mode, with a period of 8.27 min(ν = 174.08 d−1). However, later observations made in 1987 pro-vided enough evidence for Kurtz (1991) to suggest a second fre-quency at about 170.66 d−1 and also gave the first detection of theharmonic to the principal frequency. In discovering this second fre-quency, Kurtz (1991) suggested that the large frequency separation,the frequency difference between modes of the same angular degreebut consecutive overtone, in this star is about 40 μ Hz.
Later, Hatzes, Kanaan, and Mkrtichian (1999) and Mkrtichian,Hatzes, and Kanaan (2003) observed 33 Lib spectroscopically forthe first time with the 2 d coude spectrograph at the McDonald Ob-servatory. They found that, as with other roAp stars, the pulsation
radial velocity (RV) amplitude varied with spectral region and linestrength. Furthermore, Mkrtichian et al. (2003) found at least oneradial node in the upper atmosphere of 33 Lib; a conclusion drawnfrom the antiphase relation between pulsations measured predomi-nantly in NdII and Nd III. Those findings were confirmed by Kurtz,Elkin, and Mathys (2005a) and Ryabchikova et al. (2007), withKurtz et al. detecting a further frequency in spectroscopic obser-vations at 152.84 d−1. An attempt to verify that new frequency inphotometry was presented by Kurtz, Handler, and Ngwato (2005c)but to no avail.
Through a spectroscopic study of 10 roAp stars, Kochukhov et al.(2007) highlighted 33 Lib as atypical for showing double wave RVvariations in its pulsation frequency and a significant amplitude inits harmonic. Our photometric observations may provide a reasonfor this atypical behaviour.
Sachkov et al. (2011) performed an analysis of spectroscopicdata spanning over 5 yr. They were able to confirm the second fre-quency at 170.974 ± 0.005 d−1 and find a different third frequencyat 155.75 ± 0.01 d−1. With the inclusion of this third frequency, theauthors claimed to have a ‘perfect’ solution to the 5 yr RV curvesuggesting mode stability.
Most recently, Ofodum and Okeke (2018) presented the resultsof a 39 h B-band photometric campaign of 33 Lib from 2013. Theysuggested there is significant amplitude modulation on a night-by-night basis, however, they do not have the resolution to resolveclosely spaced modes to discount beating. Analysis of their full dataset showed a significant decrease in the amplitude of the principalmode when compared to the results of Kurtz (1982, 1991), whichcould be indicative of a long period rotational modulation. Finally,they presented a new frequency in 33 Lib at 173.9233 ± 0.0012 d−1,a frequency split from the principal by 0.1578 ± 0.0013 d−1. Theyproposed this second frequency could be a rotationally split sidelobe, suggesting a rotation period of 6.34 ± 0.05 d.
Most of the detailed work published on 33 Lib is a result ofspectroscopic observations. It is well known that spectroscopic ob-servations of roAp stars are able to detect lower amplitude modesthan photometric campaigns as a result of the atmospheric loca-tion of the pulsation. However, Holdsworth (2016) showed that K2observations have the necessary precision to detect low-amplitudepulsation modes usually only seen spectroscopically. This providesus with confidence that the data presented in this work will be thedefinitive data set of 33 Lib for many years.
3 K2 O BSERVATI ONS
33 Lib was observed by the Kepler Space Telescope (Borucki et al.2010) during campaign 15 of its K2 mission (Howell et al. 2014) inthe short-cadence (SC) mode. The campaign started on 2017 August23 and ended 2017 November 19, covering a total of 88.02 d.
3.1 Data reduction
To construct the light curve, we retrieved the target pixel file fromthe MAST server and created our own custom mask for the targetfollowing the method of Bowman et al. (2018). Our mask is largerthan the standard to account for spacecraft motion and the targetmoving on the CCD. Although this has the disadvantage of poten-tially contaminating the light curve with background stars, 33 Libis by far the brightest star in the frame at over 2 000 times brighterthan the second brightest star within a 50 arcsec radius accordingto the SIMBAD data base. Once created, we used the custom mask to
MNRAS 480, 2976–2984 (2018)
Dow
nloaded from https://academ
ic.oup.com/m
nras/article/480/3/2976/5062818 by guest on 06 July 2022
2978 D. L. Holdsworth et al.
Table 1. Properties of 33 Lib.
Parameter Value Reference
Mass (M�) 1.66 ± 0.58 Shulyak et al. (2013)Radius (R�) 2.13 ± 0.13 Shulyak et al. (2013)
1.92 ± 0.16 This work∗Temperature (K) 7400 ± 50 Shulyak et al. (2013)Luminosity (L�) 12.27 ± 1.83 Shulyak et al. (2013)
9.97 ± 1.23 This work∗Surface gravity (log g) 4.0 ± 0.1 Shulyak et al. (2013)Parallax (mas) 12.48 ± 0.06 Gaia Collaboration et al. (2016, 2018)B (kG) 4.67 ± 0.03 Mathys (2017)Rotation period (d) 7.0187 Romanyuk, Semenko & Kudryavtsev (2014)
∼5195 Mathys (2017)
Note. ∗Scaled from Shulyak et al. (2013) results using the Gaia DR2 parallax.
extract the light curve using KEPEXTRACT routine from the PYKE tools(Still & Barclay 2012).
Due to the nature of the K2 mission, the light curve is dominatedby the drift of the telescope, which is corrected for every ∼6.5 h. Inan attempt to remove these signatures, we employed the KEPSFF taskin the PYKE tools which implements the technique of Vanderburgand Johnson (2014) to correct for the motion systematics of thespacecraft. This successfully reduced the effect, but did not com-pletely remove it. To arrive at our final data set, we cleaned the lightcurve of obvious outliers which were uncorrected by the KEPSFF task,and then iteratively pre-whitened the light curve to remove most ofthe low-frequency noise. Our final science light curve consists of118 728 points.
Our treatment of the low-frequency signals also removes any as-trophysical information in this frequency range too, i.e. signals fromrotational variations or low-frequency pulsation modes. However,33 Lib is a well-studied star with an estimated rotational period of,in most cases, several years (Mathys et al. 1997; Mathys 2017). Weshow, in Table 1, another estimate of the rotation period of 7.0187 dby Romanyuk et al. (2014) and find that Wolff (1975) suggested aperiod of 23.26 d. Neither of these measurements includes an errorand as such we are dubious of their validity. Most recently, Ofodumand Okeke (2018) suggested a rotation period of 6.34 ± 0.05 d,however, this was conjecture based on the possible detection of onerotationally split side lobe to the pulsation. Furthermore, our laterpulsation analysis is in favour of the longer estimates of the rotationperiod for 33 Lib.
4 PULSATION A NA LY SIS
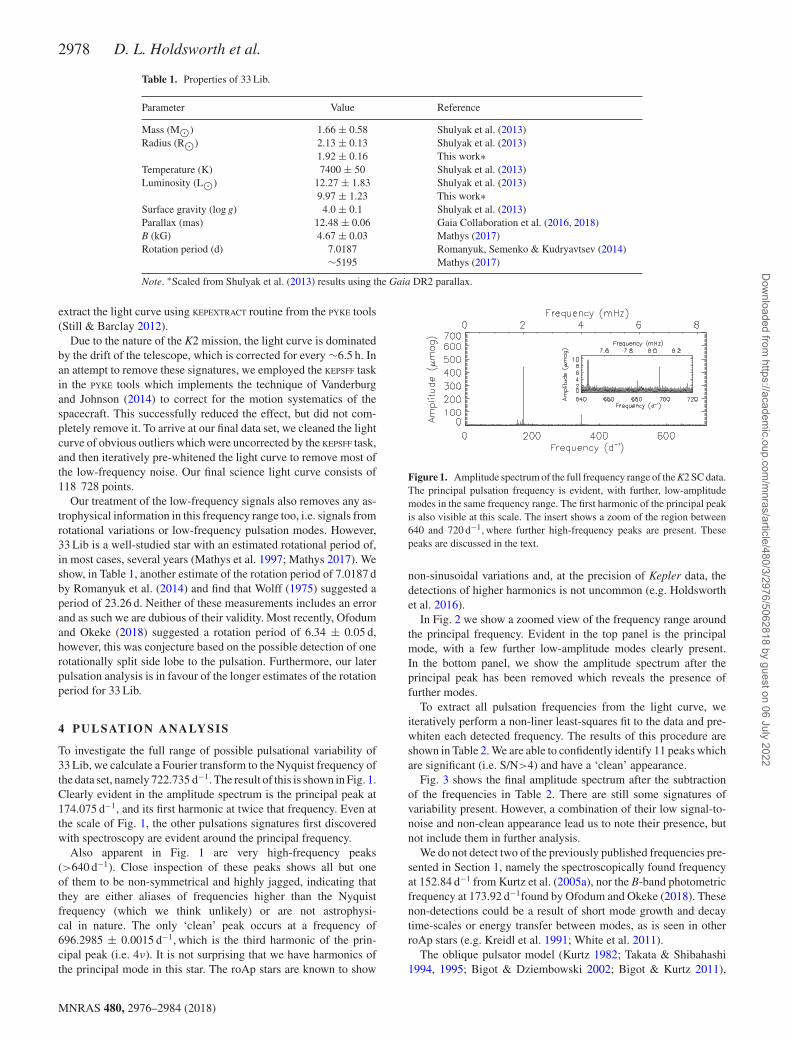
To investigate the full range of possible pulsational variability of33 Lib, we calculate a Fourier transform to the Nyquist frequency ofthe data set, namely 722.735 d−1. The result of this is shown in Fig. 1.Clearly evident in the amplitude spectrum is the principal peak at174.075 d−1, and its first harmonic at twice that frequency. Even atthe scale of Fig. 1, the other pulsations signatures first discoveredwith spectroscopy are evident around the principal frequency.
Also apparent in Fig. 1 are very high-frequency peaks(>640 d−1). Close inspection of these peaks shows all but oneof them to be non-symmetrical and highly jagged, indicating thatthey are either aliases of frequencies higher than the Nyquistfrequency (which we think unlikely) or are not astrophysi-cal in nature. The only ‘clean’ peak occurs at a frequency of696.2985 ± 0.0015 d−1, which is the third harmonic of the prin-cipal peak (i.e. 4ν). It is not surprising that we have harmonics ofthe principal mode in this star. The roAp stars are known to show
Figure 1. Amplitude spectrum of the full frequency range of the K2 SC data.The principal pulsation frequency is evident, with further, low-amplitudemodes in the same frequency range. The first harmonic of the principal peakis also visible at this scale. The insert shows a zoom of the region between640 and 720 d−1, where further high-frequency peaks are present. Thesepeaks are discussed in the text.
non-sinusoidal variations and, at the precision of Kepler data, thedetections of higher harmonics is not uncommon (e.g. Holdsworthet al. 2016).
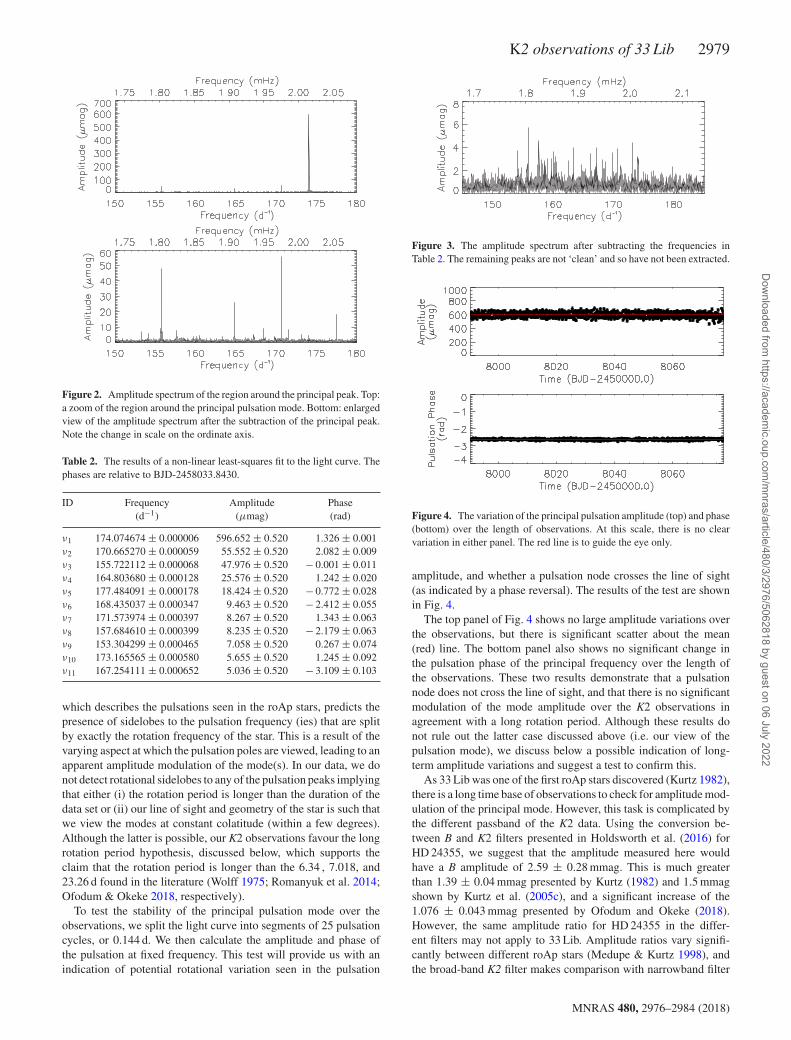
In Fig. 2 we show a zoomed view of the frequency range aroundthe principal frequency. Evident in the top panel is the principalmode, with a few further low-amplitude modes clearly present.In the bottom panel, we show the amplitude spectrum after theprincipal peak has been removed which reveals the presence offurther modes.
To extract all pulsation frequencies from the light curve, weiteratively perform a non-liner least-squares fit to the data and pre-whiten each detected frequency. The results of this procedure areshown in Table 2. We are able to confidently identify 11 peaks whichare significant (i.e. S/N>4) and have a ‘clean’ appearance.
Fig. 3 shows the final amplitude spectrum after the subtractionof the frequencies in Table 2. There are still some signatures ofvariability present. However, a combination of their low signal-to-noise and non-clean appearance lead us to note their presence, butnot include them in further analysis.
We do not detect two of the previously published frequencies pre-sented in Section 1, namely the spectroscopically found frequencyat 152.84 d−1 from Kurtz et al. (2005a), nor the B-band photometricfrequency at 173.92 d−1found by Ofodum and Okeke (2018). Thesenon-detections could be a result of short mode growth and decaytime-scales or energy transfer between modes, as is seen in otherroAp stars (e.g. Kreidl et al. 1991; White et al. 2011).
The oblique pulsator model (Kurtz 1982; Takata & Shibahashi1994, 1995; Bigot & Dziembowski 2002; Bigot & Kurtz 2011),
MNRAS 480, 2976–2984 (2018)
Dow
nloaded from https://academ
ic.oup.com/m
nras/article/480/3/2976/5062818 by guest on 06 July 2022
K2 observations of 33 Lib 2979
Figure 2. Amplitude spectrum of the region around the principal peak. Top:a zoom of the region around the principal pulsation mode. Bottom: enlargedview of the amplitude spectrum after the subtraction of the principal peak.Note the change in scale on the ordinate axis.
Table 2. The results of a non-linear least-squares fit to the light curve. Thephases are relative to BJD-2458033.8430.
ID Frequency Amplitude Phase(d−1) (μmag) (rad)
ν1 174.074674 ± 0.000006 596.652 ± 0.520 1.326 ± 0.001ν2 170.665270 ± 0.000059 55.552 ± 0.520 2.082 ± 0.009ν3 155.722112 ± 0.000068 47.976 ± 0.520 − 0.001 ± 0.011ν4 164.803680 ± 0.000128 25.576 ± 0.520 1.242 ± 0.020ν5 177.484091 ± 0.000178 18.424 ± 0.520 − 0.772 ± 0.028ν6 168.435037 ± 0.000347 9.463 ± 0.520 − 2.412 ± 0.055ν7 171.573974 ± 0.000397 8.267 ± 0.520 1.343 ± 0.063ν8 157.684610 ± 0.000399 8.235 ± 0.520 − 2.179 ± 0.063ν9 153.304299 ± 0.000465 7.058 ± 0.520 0.267 ± 0.074ν10 173.165565 ± 0.000580 5.655 ± 0.520 1.245 ± 0.092ν11 167.254111 ± 0.000652 5.036 ± 0.520 − 3.109 ± 0.103
which describes the pulsations seen in the roAp stars, predicts thepresence of sidelobes to the pulsation frequency (ies) that are splitby exactly the rotation frequency of the star. This is a result of thevarying aspect at which the pulsation poles are viewed, leading to anapparent amplitude modulation of the mode(s). In our data, we donot detect rotational sidelobes to any of the pulsation peaks implyingthat either (i) the rotation period is longer than the duration of thedata set or (ii) our line of sight and geometry of the star is such thatwe view the modes at constant colatitude (within a few degrees).Although the latter is possible, our K2 observations favour the longrotation period hypothesis, discussed below, which supports theclaim that the rotation period is longer than the 6.34 , 7.018, and23.26 d found in the literature (Wolff 1975; Romanyuk et al. 2014;Ofodum & Okeke 2018, respectively).
To test the stability of the principal pulsation mode over theobservations, we split the light curve into segments of 25 pulsationcycles, or 0.144 d. We then calculate the amplitude and phase ofthe pulsation at fixed frequency. This test will provide us with anindication of potential rotational variation seen in the pulsation
Figure 3. The amplitude spectrum after subtracting the frequencies inTable 2. The remaining peaks are not ‘clean’ and so have not been extracted.
Figure 4. The variation of the principal pulsation amplitude (top) and phase(bottom) over the length of observations. At this scale, there is no clearvariation in either panel. The red line is to guide the eye only.
amplitude, and whether a pulsation node crosses the line of sight(as indicated by a phase reversal). The results of the test are shownin Fig. 4.
The top panel of Fig. 4 shows no large amplitude variations overthe observations, but there is significant scatter about the mean(red) line. The bottom panel also shows no significant change inthe pulsation phase of the principal frequency over the length ofthe observations. These two results demonstrate that a pulsationnode does not cross the line of sight, and that there is no significantmodulation of the mode amplitude over the K2 observations inagreement with a long rotation period. Although these results donot rule out the latter case discussed above (i.e. our view of thepulsation mode), we discuss below a possible indication of long-term amplitude variations and suggest a test to confirm this.
As 33 Lib was one of the first roAp stars discovered (Kurtz 1982),there is a long time base of observations to check for amplitude mod-ulation of the principal mode. However, this task is complicated bythe different passband of the K2 data. Using the conversion be-tween B and K2 filters presented in Holdsworth et al. (2016) forHD 24355, we suggest that the amplitude measured here wouldhave a B amplitude of 2.59 ± 0.28 mmag. This is much greaterthan 1.39 ± 0.04 mmag presented by Kurtz (1982) and 1.5 mmagshown by Kurtz et al. (2005c), and a significant increase of the1.076 ± 0.043 mmag presented by Ofodum and Okeke (2018).However, the same amplitude ratio for HD 24355 in the differ-ent filters may not apply to 33 Lib. Amplitude ratios vary signifi-cantly between different roAp stars (Medupe & Kurtz 1998), andthe broad-band K2 filter makes comparison with narrowband filter
MNRAS 480, 2976–2984 (2018)
Dow
nloaded from https://academ
ic.oup.com/m
nras/article/480/3/2976/5062818 by guest on 06 July 2022
2980 D. L. Holdsworth et al.
Table 3. Frequency differences between modes, where the same differencehas multiple occurrences. We take the modulus of the difference and quotethe highest amplitude peak first. We do not include peaks separated by aninteger multiple of the noted separations (i.e. we do not list ν2–ν5).
ID Frequency Frequency(d−1) (μ Hz)
ν1–ν2 3.40940 ± 0.00006 39.46066 ± 0.00069ν1–ν5 3.40941 ± 0.00018 39.46081 ± 0.00207ν2–ν11 3.41116 ± 0.00065 39.48104 ± 0.00758
ν1–ν7 2.50070 ± 0.00040 28.94328 ± 0.00461ν2–ν10 2.50034 ± 0.00058 28.93913 ± 0.00677
ν1–ν10 0.90906 ± 0.00058 10.52154 ± 0.00674ν2–ν7 0.90870 ± 0.00040 10.51739 ± 0.00466
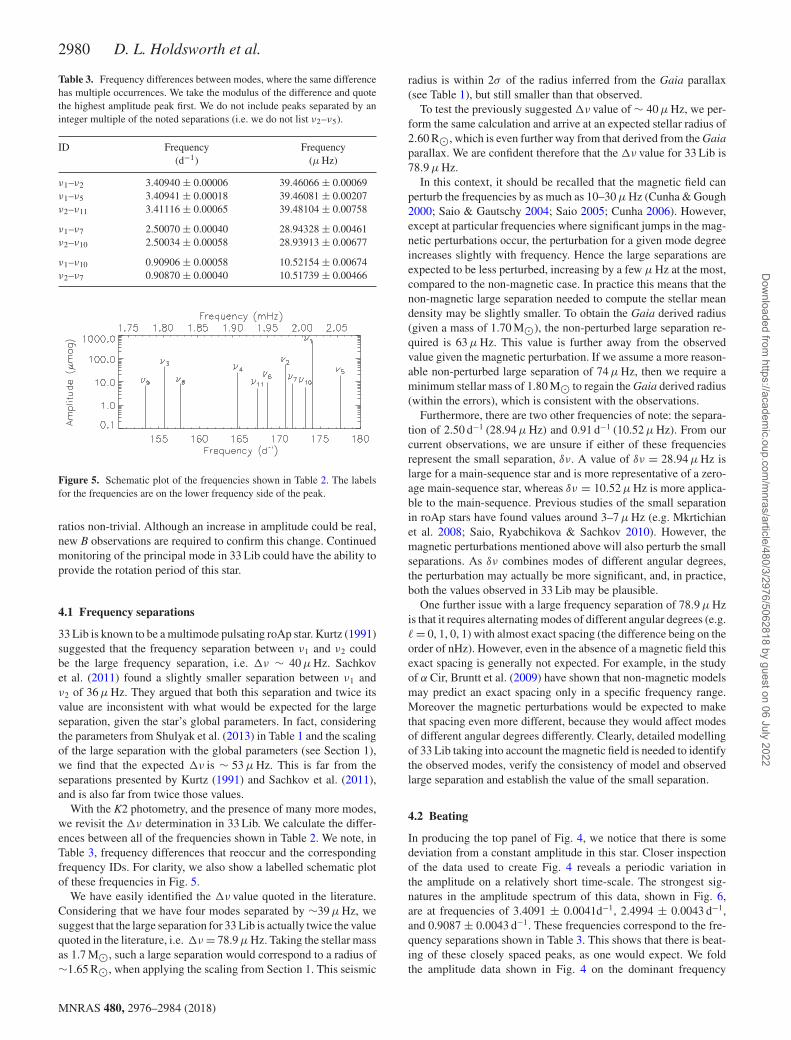
Figure 5. Schematic plot of the frequencies shown in Table 2. The labelsfor the frequencies are on the lower frequency side of the peak.
ratios non-trivial. Although an increase in amplitude could be real,new B observations are required to confirm this change. Continuedmonitoring of the principal mode in 33 Lib could have the ability toprovide the rotation period of this star.
4.1 Frequency separations
33 Lib is known to be a multimode pulsating roAp star. Kurtz (1991)suggested that the frequency separation between ν1 and ν2 couldbe the large frequency separation, i.e. �ν ∼ 40 μ Hz. Sachkovet al. (2011) found a slightly smaller separation between ν1 andν2 of 36 μ Hz. They argued that both this separation and twice itsvalue are inconsistent with what would be expected for the largeseparation, given the star’s global parameters. In fact, consideringthe parameters from Shulyak et al. (2013) in Table 1 and the scalingof the large separation with the global parameters (see Section 1),we find that the expected �ν is ∼ 53 μ Hz. This is far from theseparations presented by Kurtz (1991) and Sachkov et al. (2011),and is also far from twice those values.
With the K2 photometry, and the presence of many more modes,we revisit the �ν determination in 33 Lib. We calculate the differ-ences between all of the frequencies shown in Table 2. We note, inTable 3, frequency differences that reoccur and the correspondingfrequency IDs. For clarity, we also show a labelled schematic plotof these frequencies in Fig. 5.
We have easily identified the �ν value quoted in the literature.Considering that we have four modes separated by ∼39 μ Hz, wesuggest that the large separation for 33 Lib is actually twice the valuequoted in the literature, i.e. �ν = 78.9 μ Hz. Taking the stellar massas 1.7 M�, such a large separation would correspond to a radius of∼1.65 R�, when applying the scaling from Section 1. This seismic
radius is within 2σ of the radius inferred from the Gaia parallax(see Table 1), but still smaller than that observed.
To test the previously suggested �ν value of ∼ 40 μ Hz, we per-form the same calculation and arrive at an expected stellar radius of2.60 R�, which is even further way from that derived from the Gaiaparallax. We are confident therefore that the �ν value for 33 Lib is78.9 μ Hz.
In this context, it should be recalled that the magnetic field canperturb the frequencies by as much as 10–30 μ Hz (Cunha & Gough2000; Saio & Gautschy 2004; Saio 2005; Cunha 2006). However,except at particular frequencies where significant jumps in the mag-netic perturbations occur, the perturbation for a given mode degreeincreases slightly with frequency. Hence the large separations areexpected to be less perturbed, increasing by a few μ Hz at the most,compared to the non-magnetic case. In practice this means that thenon-magnetic large separation needed to compute the stellar meandensity may be slightly smaller. To obtain the Gaia derived radius(given a mass of 1.70 M�), the non-perturbed large separation re-quired is 63 μ Hz. This value is further away from the observedvalue given the magnetic perturbation. If we assume a more reason-able non-perturbed large separation of 74 μ Hz, then we require aminimum stellar mass of 1.80 M� to regain the Gaia derived radius(within the errors), which is consistent with the observations.
Furthermore, there are two other frequencies of note: the separa-tion of 2.50 d−1 (28.94 μ Hz) and 0.91 d−1 (10.52 μ Hz). From ourcurrent observations, we are unsure if either of these frequenciesrepresent the small separation, δν. A value of δν = 28.94 μ Hz islarge for a main-sequence star and is more representative of a zero-age main-sequence star, whereas δν = 10.52 μ Hz is more applica-ble to the main-sequence. Previous studies of the small separationin roAp stars have found values around 3–7 μ Hz (e.g. Mkrtichianet al. 2008; Saio, Ryabchikova & Sachkov 2010). However, themagnetic perturbations mentioned above will also perturb the smallseparations. As δν combines modes of different angular degrees,the perturbation may actually be more significant, and, in practice,both the values observed in 33 Lib may be plausible.
One further issue with a large frequency separation of 78.9 μ Hzis that it requires alternating modes of different angular degrees (e.g.� = 0, 1, 0, 1) with almost exact spacing (the difference being on theorder of nHz). However, even in the absence of a magnetic field thisexact spacing is generally not expected. For example, in the studyof α Cir, Bruntt et al. (2009) have shown that non-magnetic modelsmay predict an exact spacing only in a specific frequency range.Moreover the magnetic perturbations would be expected to makethat spacing even more different, because they would affect modesof different angular degrees differently. Clearly, detailed modellingof 33 Lib taking into account the magnetic field is needed to identifythe observed modes, verify the consistency of model and observedlarge separation and establish the value of the small separation.
4.2 Beating
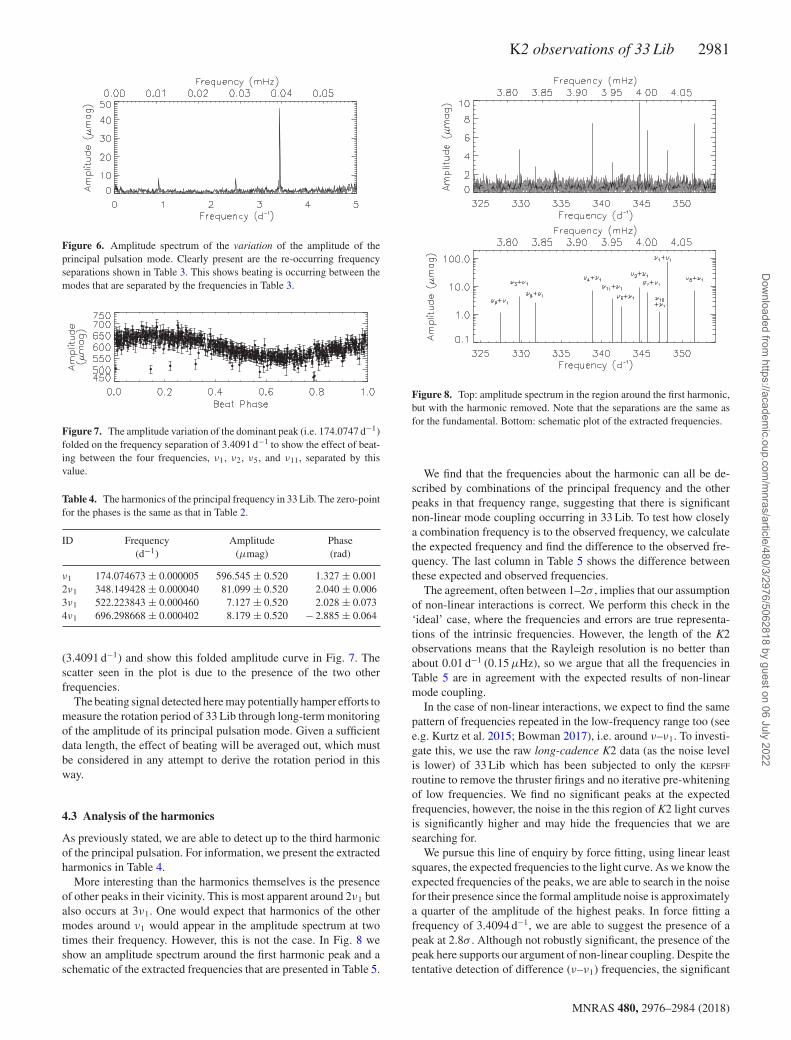
In producing the top panel of Fig. 4, we notice that there is somedeviation from a constant amplitude in this star. Closer inspectionof the data used to create Fig. 4 reveals a periodic variation inthe amplitude on a relatively short time-scale. The strongest sig-natures in the amplitude spectrum of this data, shown in Fig. 6,are at frequencies of 3.4091 ± 0.0041d−1, 2.4994 ± 0.0043 d−1,and 0.9087 ± 0.0043 d−1. These frequencies correspond to the fre-quency separations shown in Table 3. This shows that there is beat-ing of these closely spaced peaks, as one would expect. We foldthe amplitude data shown in Fig. 4 on the dominant frequency
MNRAS 480, 2976–2984 (2018)
Dow
nloaded from https://academ
ic.oup.com/m
nras/article/480/3/2976/5062818 by guest on 06 July 2022
K2 observations of 33 Lib 2981
Figure 6. Amplitude spectrum of the variation of the amplitude of theprincipal pulsation mode. Clearly present are the re-occurring frequencyseparations shown in Table 3. This shows beating is occurring between themodes that are separated by the frequencies in Table 3.
Figure 7. The amplitude variation of the dominant peak (i.e. 174.0747 d−1)folded on the frequency separation of 3.4091 d−1 to show the effect of beat-ing between the four frequencies, ν1, ν2, ν5, and ν11, separated by thisvalue.
Table 4. The harmonics of the principal frequency in 33 Lib. The zero-pointfor the phases is the same as that in Table 2.
ID Frequency Amplitude Phase(d−1) (μmag) (rad)
ν1 174.074673 ± 0.000005 596.545 ± 0.520 1.327 ± 0.0012ν1 348.149428 ± 0.000040 81.099 ± 0.520 2.040 ± 0.0063ν1 522.223843 ± 0.000460 7.127 ± 0.520 2.028 ± 0.0734ν1 696.298668 ± 0.000402 8.179 ± 0.520 − 2.885 ± 0.064
(3.4091 d−1) and show this folded amplitude curve in Fig. 7. Thescatter seen in the plot is due to the presence of the two otherfrequencies.
The beating signal detected here may potentially hamper efforts tomeasure the rotation period of 33 Lib through long-term monitoringof the amplitude of its principal pulsation mode. Given a sufficientdata length, the effect of beating will be averaged out, which mustbe considered in any attempt to derive the rotation period in thisway.
4.3 Analysis of the harmonics
As previously stated, we are able to detect up to the third harmonicof the principal pulsation. For information, we present the extractedharmonics in Table 4.
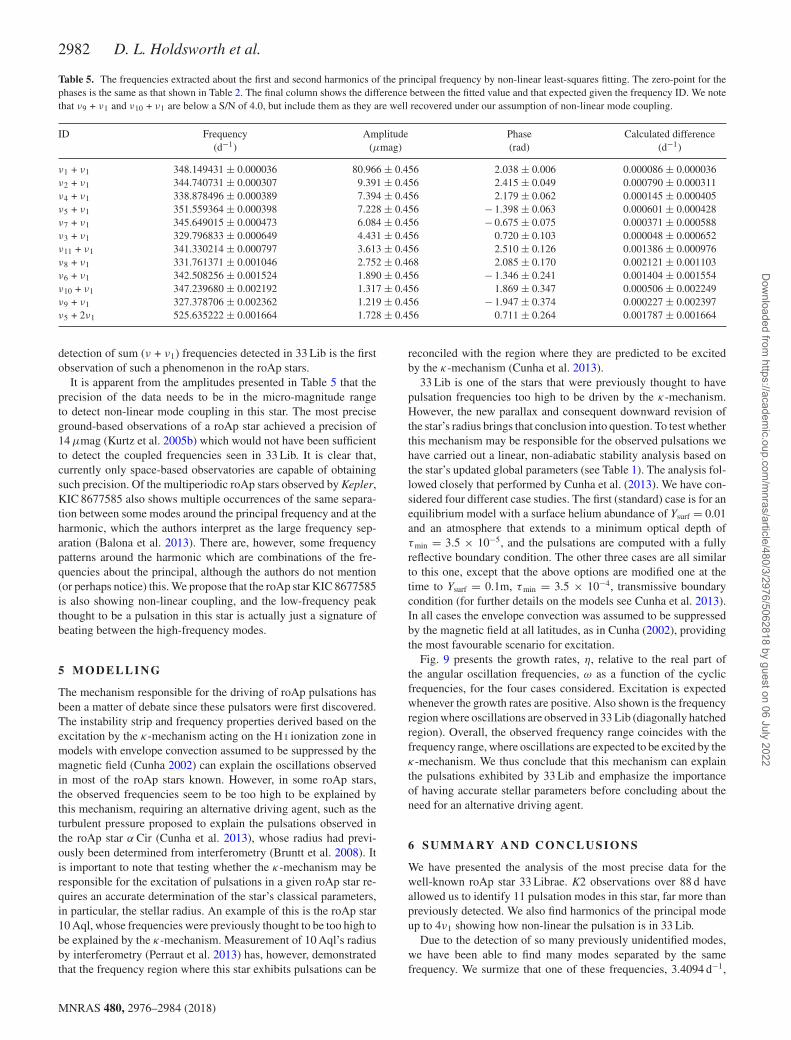
More interesting than the harmonics themselves is the presenceof other peaks in their vicinity. This is most apparent around 2ν1 butalso occurs at 3ν1. One would expect that harmonics of the othermodes around ν1 would appear in the amplitude spectrum at twotimes their frequency. However, this is not the case. In Fig. 8 weshow an amplitude spectrum around the first harmonic peak and aschematic of the extracted frequencies that are presented in Table 5.
Figure 8. Top: amplitude spectrum in the region around the first harmonic,but with the harmonic removed. Note that the separations are the same asfor the fundamental. Bottom: schematic plot of the extracted frequencies.
We find that the frequencies about the harmonic can all be de-scribed by combinations of the principal frequency and the otherpeaks in that frequency range, suggesting that there is significantnon-linear mode coupling occurring in 33 Lib. To test how closelya combination frequency is to the observed frequency, we calculatethe expected frequency and find the difference to the observed fre-quency. The last column in Table 5 shows the difference betweenthese expected and observed frequencies.
The agreement, often between 1–2σ , implies that our assumptionof non-linear interactions is correct. We perform this check in the‘ideal’ case, where the frequencies and errors are true representa-tions of the intrinsic frequencies. However, the length of the K2observations means that the Rayleigh resolution is no better thanabout 0.01 d−1 (0.15 μHz), so we argue that all the frequencies inTable 5 are in agreement with the expected results of non-linearmode coupling.
In the case of non-linear interactions, we expect to find the samepattern of frequencies repeated in the low-frequency range too (seee.g. Kurtz et al. 2015; Bowman 2017), i.e. around ν–ν1. To investi-gate this, we use the raw long-cadence K2 data (as the noise levelis lower) of 33 Lib which has been subjected to only the KEPSFF
routine to remove the thruster firings and no iterative pre-whiteningof low frequencies. We find no significant peaks at the expectedfrequencies, however, the noise in the this region of K2 light curvesis significantly higher and may hide the frequencies that we aresearching for.
We pursue this line of enquiry by force fitting, using linear leastsquares, the expected frequencies to the light curve. As we know theexpected frequencies of the peaks, we are able to search in the noisefor their presence since the formal amplitude noise is approximatelya quarter of the amplitude of the highest peaks. In force fitting afrequency of 3.4094 d−1, we are able to suggest the presence of apeak at 2.8σ . Although not robustly significant, the presence of thepeak here supports our argument of non-linear coupling. Despite thetentative detection of difference (ν–ν1) frequencies, the significant
MNRAS 480, 2976–2984 (2018)
Dow
nloaded from https://academ
ic.oup.com/m
nras/article/480/3/2976/5062818 by guest on 06 July 2022
2982 D. L. Holdsworth et al.
Table 5. The frequencies extracted about the first and second harmonics of the principal frequency by non-linear least-squares fitting. The zero-point for thephases is the same as that shown in Table 2. The final column shows the difference between the fitted value and that expected given the frequency ID. We notethat ν9 + ν1 and ν10 + ν1 are below a S/N of 4.0, but include them as they are well recovered under our assumption of non-linear mode coupling.
ID Frequency Amplitude Phase Calculated difference(d−1) (μmag) (rad) (d−1)
ν1 + ν1 348.149431 ± 0.000036 80.966 ± 0.456 2.038 ± 0.006 0.000086 ± 0.000036ν2 + ν1 344.740731 ± 0.000307 9.391 ± 0.456 2.415 ± 0.049 0.000790 ± 0.000311ν4 + ν1 338.878496 ± 0.000389 7.394 ± 0.456 2.179 ± 0.062 0.000145 ± 0.000405ν5 + ν1 351.559364 ± 0.000398 7.228 ± 0.456 − 1.398 ± 0.063 0.000601 ± 0.000428ν7 + ν1 345.649015 ± 0.000473 6.084 ± 0.456 − 0.675 ± 0.075 0.000371 ± 0.000588ν3 + ν1 329.796833 ± 0.000649 4.431 ± 0.456 0.720 ± 0.103 0.000048 ± 0.000652ν11 + ν1 341.330214 ± 0.000797 3.613 ± 0.456 2.510 ± 0.126 0.001386 ± 0.000976ν8 + ν1 331.761371 ± 0.001046 2.752 ± 0.468 2.085 ± 0.170 0.002121 ± 0.001103ν6 + ν1 342.508256 ± 0.001524 1.890 ± 0.456 − 1.346 ± 0.241 0.001404 ± 0.001554ν10 + ν1 347.239680 ± 0.002192 1.317 ± 0.456 1.869 ± 0.347 0.000506 ± 0.002249ν9 + ν1 327.378706 ± 0.002362 1.219 ± 0.456 − 1.947 ± 0.374 0.000227 ± 0.002397ν5 + 2ν1 525.635222 ± 0.001664 1.728 ± 0.456 0.711 ± 0.264 0.001787 ± 0.001664
detection of sum (ν + ν1) frequencies detected in 33 Lib is the firstobservation of such a phenomenon in the roAp stars.
It is apparent from the amplitudes presented in Table 5 that theprecision of the data needs to be in the micro-magnitude rangeto detect non-linear mode coupling in this star. The most preciseground-based observations of a roAp star achieved a precision of14 μmag (Kurtz et al. 2005b) which would not have been sufficientto detect the coupled frequencies seen in 33 Lib. It is clear that,currently only space-based observatories are capable of obtainingsuch precision. Of the multiperiodic roAp stars observed by Kepler,KIC 8677585 also shows multiple occurrences of the same separa-tion between some modes around the principal frequency and at theharmonic, which the authors interpret as the large frequency sep-aration (Balona et al. 2013). There are, however, some frequencypatterns around the harmonic which are combinations of the fre-quencies about the principal, although the authors do not mention(or perhaps notice) this. We propose that the roAp star KIC 8677585is also showing non-linear coupling, and the low-frequency peakthought to be a pulsation in this star is actually just a signature ofbeating between the high-frequency modes.
5 MO D E L L I N G
The mechanism responsible for the driving of roAp pulsations hasbeen a matter of debate since these pulsators were first discovered.The instability strip and frequency properties derived based on theexcitation by the κ-mechanism acting on the H I ionization zone inmodels with envelope convection assumed to be suppressed by themagnetic field (Cunha 2002) can explain the oscillations observedin most of the roAp stars known. However, in some roAp stars,the observed frequencies seem to be too high to be explained bythis mechanism, requiring an alternative driving agent, such as theturbulent pressure proposed to explain the pulsations observed inthe roAp star α Cir (Cunha et al. 2013), whose radius had previ-ously been determined from interferometry (Bruntt et al. 2008). Itis important to note that testing whether the κ-mechanism may beresponsible for the excitation of pulsations in a given roAp star re-quires an accurate determination of the star’s classical parameters,in particular, the stellar radius. An example of this is the roAp star10 Aql, whose frequencies were previously thought to be too high tobe explained by the κ-mechanism. Measurement of 10 Aql’s radiusby interferometry (Perraut et al. 2013) has, however, demonstratedthat the frequency region where this star exhibits pulsations can be
reconciled with the region where they are predicted to be excitedby the κ-mechanism (Cunha et al. 2013).
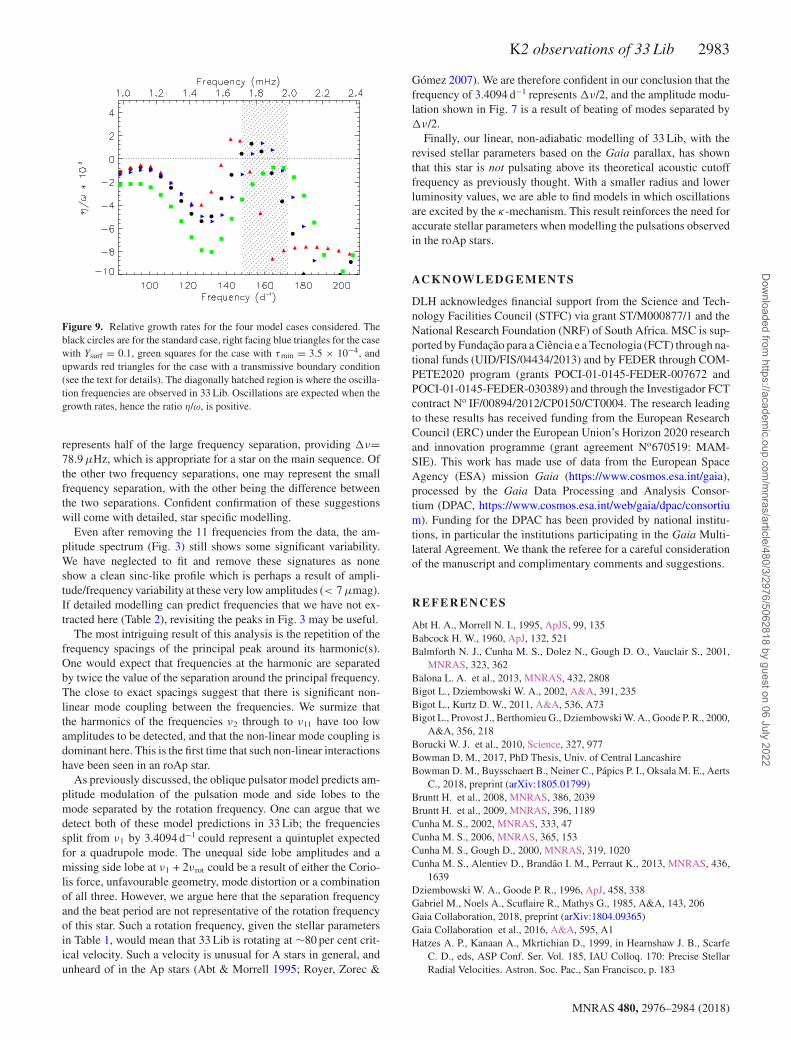
33 Lib is one of the stars that were previously thought to havepulsation frequencies too high to be driven by the κ-mechanism.However, the new parallax and consequent downward revision ofthe star’s radius brings that conclusion into question. To test whetherthis mechanism may be responsible for the observed pulsations wehave carried out a linear, non-adiabatic stability analysis based onthe star’s updated global parameters (see Table 1). The analysis fol-lowed closely that performed by Cunha et al. (2013). We have con-sidered four different case studies. The first (standard) case is for anequilibrium model with a surface helium abundance of Ysurf = 0.01and an atmosphere that extends to a minimum optical depth ofτmin = 3.5 × 10⁻⁵, and the pulsations are computed with a fullyreflective boundary condition. The other three cases are all similarto this one, except that the above options are modified one at thetime to Ysurf = 0.1m, τmin = 3.5 × 10⁻⁴, transmissive boundarycondition (for further details on the models see Cunha et al. 2013).In all cases the envelope convection was assumed to be suppressedby the magnetic field at all latitudes, as in Cunha (2002), providingthe most favourable scenario for excitation.
Fig. 9 presents the growth rates, η, relative to the real part ofthe angular oscillation frequencies, ω as a function of the cyclicfrequencies, for the four cases considered. Excitation is expectedwhenever the growth rates are positive. Also shown is the frequencyregion where oscillations are observed in 33 Lib (diagonally hatchedregion). Overall, the observed frequency range coincides with thefrequency range, where oscillations are expected to be excited by theκ-mechanism. We thus conclude that this mechanism can explainthe pulsations exhibited by 33 Lib and emphasize the importanceof having accurate stellar parameters before concluding about theneed for an alternative driving agent.
6 SU M M A RY A N D C O N C L U S I O N S
We have presented the analysis of the most precise data for thewell-known roAp star 33 Librae. K2 observations over 88 d haveallowed us to identify 11 pulsation modes in this star, far more thanpreviously detected. We also find harmonics of the principal modeup to 4ν1 showing how non-linear the pulsation is in 33 Lib.
Due to the detection of so many previously unidentified modes,we have been able to find many modes separated by the samefrequency. We surmize that one of these frequencies, 3.4094 d−1,
MNRAS 480, 2976–2984 (2018)
Dow
nloaded from https://academ
ic.oup.com/m
nras/article/480/3/2976/5062818 by guest on 06 July 2022
K2 observations of 33 Lib 2983
Figure 9. Relative growth rates for the four model cases considered. Theblack circles are for the standard case, right facing blue triangles for the casewith Ysurf = 0.1, green squares for the case with τmin = 3.5 × 10⁻⁴, andupwards red triangles for the case with a transmissive boundary condition(see the text for details). The diagonally hatched region is where the oscilla-tion frequencies are observed in 33 Lib. Oscillations are expected when thegrowth rates, hence the ratio η/ω, is positive.
represents half of the large frequency separation, providing �ν=78.9 μHz, which is appropriate for a star on the main sequence. Ofthe other two frequency separations, one may represent the smallfrequency separation, with the other being the difference betweenthe two separations. Confident confirmation of these suggestionswill come with detailed, star specific modelling.
Even after removing the 11 frequencies from the data, the am-plitude spectrum (Fig. 3) still shows some significant variability.We have neglected to fit and remove these signatures as noneshow a clean sinc-like profile which is perhaps a result of ampli-tude/frequency variability at these very low amplitudes (< 7 μmag).If detailed modelling can predict frequencies that we have not ex-tracted here (Table 2), revisiting the peaks in Fig. 3 may be useful.
The most intriguing result of this analysis is the repetition of thefrequency spacings of the principal peak around its harmonic(s).One would expect that frequencies at the harmonic are separatedby twice the value of the separation around the principal frequency.The close to exact spacings suggest that there is significant non-linear mode coupling between the frequencies. We surmize thatthe harmonics of the frequencies ν2 through to ν11 have too lowamplitudes to be detected, and that the non-linear mode coupling isdominant here. This is the first time that such non-linear interactionshave been seen in an roAp star.
As previously discussed, the oblique pulsator model predicts am-plitude modulation of the pulsation mode and side lobes to themode separated by the rotation frequency. One can argue that wedetect both of these model predictions in 33 Lib; the frequenciessplit from ν1 by 3.4094 d−1 could represent a quintuplet expectedfor a quadrupole mode. The unequal side lobe amplitudes and amissing side lobe at ν1 + 2νrot could be a result of either the Corio-lis force, unfavourable geometry, mode distortion or a combinationof all three. However, we argue here that the separation frequencyand the beat period are not representative of the rotation frequencyof this star. Such a rotation frequency, given the stellar parametersin Table 1, would mean that 33 Lib is rotating at ∼80 per cent crit-ical velocity. Such a velocity is unusual for A stars in general, andunheard of in the Ap stars (Abt & Morrell 1995; Royer, Zorec &
Gomez 2007). We are therefore confident in our conclusion that thefrequency of 3.4094 d−1 represents �ν/2, and the amplitude modu-lation shown in Fig. 7 is a result of beating of modes separated by�ν/2.
Finally, our linear, non-adiabatic modelling of 33 Lib, with therevised stellar parameters based on the Gaia parallax, has shownthat this star is not pulsating above its theoretical acoustic cutofffrequency as previously thought. With a smaller radius and lowerluminosity values, we are able to find models in which oscillationsare excited by the κ-mechanism. This result reinforces the need foraccurate stellar parameters when modelling the pulsations observedin the roAp stars.
AC K N OW L E D G E M E N T S
DLH acknowledges financial support from the Science and Tech-nology Facilities Council (STFC) via grant ST/M000877/1 and theNational Research Foundation (NRF) of South Africa. MSC is sup-ported by Fundacao para a Ciencia e a Tecnologia (FCT) through na-tional funds (UID/FIS/04434/2013) and by FEDER through COM-PETE2020 program (grants POCI-01-0145-FEDER-007672 andPOCI-01-0145-FEDER-030389) and through the Investigador FCTcontract No IF/00894/2012/CP0150/CT0004. The research leadingto these results has received funding from the European ResearchCouncil (ERC) under the European Union’s Horizon 2020 researchand innovation programme (grant agreement No670519: MAM-SIE). This work has made use of data from the European SpaceAgency (ESA) mission Gaia (https://www.cosmos.esa.int/gaia),processed by the Gaia Data Processing and Analysis Consor-tium (DPAC, https://www.cosmos.esa.int/web/gaia/dpac/consortium). Funding for the DPAC has been provided by national institu-tions, in particular the institutions participating in the Gaia Multi-lateral Agreement. We thank the referee for a careful considerationof the manuscript and complimentary comments and suggestions.
REFERENCES
Abt H. A., Morrell N. I., 1995, ApJS, 99, 135Babcock H. W., 1960, ApJ, 132, 521Balmforth N. J., Cunha M. S., Dolez N., Gough D. O., Vauclair S., 2001,
MNRAS, 323, 362Balona L. A. et al., 2013, MNRAS, 432, 2808Bigot L., Dziembowski W. A., 2002, A&A, 391, 235Bigot L., Kurtz D. W., 2011, A&A, 536, A73Bigot L., Provost J., Berthomieu G., Dziembowski W. A., Goode P. R., 2000,
A&A, 356, 218Borucki W. J. et al., 2010, Science, 327, 977Bowman D. M., 2017, PhD Thesis, Univ. of Central LancashireBowman D. M., Buysschaert B., Neiner C., Papics P. I., Oksala M. E., Aerts
C., 2018, preprint (arXiv:1805.01799)Bruntt H. et al., 2008, MNRAS, 386, 2039Bruntt H. et al., 2009, MNRAS, 396, 1189Cunha M. S., 2002, MNRAS, 333, 47Cunha M. S., 2006, MNRAS, 365, 153Cunha M. S., Gough D., 2000, MNRAS, 319, 1020Cunha M. S., Alentiev D., Brandao I. M., Perraut K., 2013, MNRAS, 436,
1639Dziembowski W. A., Goode P. R., 1996, ApJ, 458, 338Gabriel M., Noels A., Scuflaire R., Mathys G., 1985, A&A, 143, 206Gaia Collaboration, 2018, preprint (arXiv:1804.09365)Gaia Collaboration et al., 2016, A&A, 595, A1Hatzes A. P., Kanaan A., Mkrtichian D., 1999, in Hearnshaw J. B., Scarfe
C. D., eds, ASP Conf. Ser. Vol. 185, IAU Colloq. 170: Precise StellarRadial Velocities. Astron. Soc. Pac., San Francisco, p. 183
MNRAS 480, 2976–2984 (2018)
Dow
nloaded from https://academ
ic.oup.com/m
nras/article/480/3/2976/5062818 by guest on 06 July 2022
2984 D. L. Holdsworth et al.
Holdsworth D. L., 2016, Inf. Bull. Var. Stars, 6185Holdsworth D. L., Kurtz D. W., Smalley B., Saio H., Handler G., Murphy
S. J., Lehmann H., 2016, MNRAS, 462, 876Holdsworth D. L. et al., 2018a, MNRAS, 473, 91Holdsworth D. L., Saio H., Bowman D. M., Kurtz D. W., Sefako R. R.,
Joyce M., Lambert T., Smalley B., 2018b, MNRAS, 476, 601Howell S. B. et al., 2014, PASP, 126, 398Joshi S. et al., 2016, A&A, 590, 36Kochukhov O., Bagnulo S., 2006, A&A, 450, 763Kochukhov O., Ryabchikova T., Weiss W. W., Landstreet J. D., Lyashko D.,
2007, MNRAS, 376, 651Kreidl T. J., Kurtz D. W., Bus S. J., Kuschnig R., Birch P. B., Candy M. P.,
Weiss W. W., 1991, MNRAS, 250, 477Kurtz D. W., 1982, MNRAS, 200, 807Kurtz D. W., 1991, MNRAS, 249, 468Kurtz D. W., Elkin V. G., Mathys G., 2005a, MNRAS, 358, L6Kurtz D. W. et al., 2005b, MNRAS, 358, 651Kurtz D. W., Handler G., Ngwato B., 2005c, Inf. Bul. Var. Stars, 5647, 1Kurtz D. W., Shibahashi H., Murphy S. J., Bedding T. R., Bowman D. M.,
2015, MNRAS, 450, 3015Martinez P., Kurtz D. W., Kauffmann G. M., 1991, MNRAS, 250, 666Mathys G., 2015, in Balega Y. Y., Romanyuk I. I., Kudryavtsev D. O., eds,
ASP Conf. Ser. Vol. 494, Physics and Evolution of Magnetic and RelatedStars. Astron. Soc. Pac., San Francisco, p. 3
Mathys G., 2017, A&A, 601, A14Mathys G., Hubrig S., Landstreet J. D., Lanz T., Manfroid J., 1997, A&AS,
123, 353Medupe R., Kurtz D. W., 1998, MNRAS, 299, 371Mkrtichian D. E., Hatzes A. P., 2005, A&A, 430, 263Mkrtichian D. E., Hatzes A. P., Kanaan A., 2003, MNRAS, 345, 781Mkrtichian D. E., Hatzes A. P., Saio H., Shobbrook R. R., 2008, A&A, 490,
1109
Ofodum C. N., Okeke P. N., 2018, New Astron., 65, 67Perraut K. et al., 2013, A&A, 559, A21Romanyuk I. I., Semenko E. A., Kudryavtsev D. O., 2014, Astrophys. Bull.,
69, 427Royer F., Zorec J., Gomez A. E., 2007, A&A, 463, 671Ryabchikova T., Nesvacil N., Weiss W. W., Kochukhov O., Stutz C., 2004,
A&A, 423, 705Ryabchikova T., Sachkov M., Kochukhov O., Lyashko D., 2007, A&A, 473,
907Sachkov M., Hareter M., Ryabchikova T., Wade G., Kochukhov O., Shulyak
D., Weiss W. W., 2011, MNRAS, 416, 2669Saio H., 2005, MNRAS, 360, 1022Saio H., Gautschy A., 2004, MNRAS, 350, 485Saio H., Ryabchikova T., Sachkov M., 2010, MNRAS, 403, 1729Shulyak D., Ryabchikova T., Kochukhov O., 2013, A&A, 551, A14Smalley B. et al., 2015, MNRAS, 452, 3334Stibbs D. W. N., 1950, MNRAS, 110, 395Still M., Barclay T., 2012, Astrophysics Source Code Library, record
ascl:1208.004Stpien K., 2000, A&A, 353, 227Takata M., Shibahashi H., 1994, PASJ, 46, 301Takata M., Shibahashi H., 1995, PASJ, 47, 219Tassoul M., 1980, ApJS, 43, 469van Leeuwen F., 2007, A&A, 474, 653Vanderburg A., Johnson J. A., 2014, PASP, 126, 948White T. R., Bedding T. R., Stello D., Kurtz D. W., Cunha M. S., Gough D.
O., 2011, MNRAS, 415, 1638Wolff S. C., 1975, ApJ, 202, 127
This paper has been typeset from a TEX/LATEX file prepared by the author.
MNRAS 480, 2976–2984 (2018)
Dow
nloaded from https://academ
ic.oup.com/m
nras/article/480/3/2976/5062818 by guest on 06 July 2022
Copyright © 2022 FDOKUMEN