4 CHIBULUMA MINE - HKEXnews
59
APPENDIX V COMPETENT PERSON’S REPORT AND VALUATION REPORT V - 131 4 CHIBULUMA MINE 4.1 Introduction [SR1.5A(i)] Metorex has an 85% interest in Chibuluma, which has as its main operating asset the Chibuluma South mine. The Chibuluma East and Chibuluma West mines are now depleted, but Chibuluma remains liable for environmental rehabilitation. The remaining 15% interest is held by ZCCM-IH and the GRZ. The Chifupu Project, located approximately 1.7 km southwest of Chibuluma South mine, forms part of the Chibuluma South mine licence. Chibuluma South mine is an underground, mechanised mine capable of treating 50 ktpm of RoM ore, which is located near Kalulushi in Zambia. 4.2 Location, Climate, Access and Infrastructure [SR1.4A, SR1.5A(i), SR1.6, SV2.3] The Chibuluma South mine is located at latitude 12 o 53’S and longitude 28 o 05’E, and approximately 15 km west of Kitwe. Kitwe is the second largest town on the Zambian Copperbelt and is approximately 300 km north of the capital city, Lusaka (Figure 4.1). The Chifupu deposit is located approximately 1.7 km southwest of the Chibuluma South mine. The topography of the area is generally flat and lies at an altitude of 1 220 – 1 300 m above mean sea level. The Zambian Copperbelt is located in a sub-tropical zone characterised by distinct wet and dry seasons. Annual rainfall is approximately 1 200 mm and occurs during a wet season (summer) lasting from October to March with the heaviest rainfall occurring in December and January. Rainfall generally occurs as short thunderstorms any time during the day or night, and it is not uncommon to have 50 mm of rain in the space of a few hours. The average air temperature remains fairly constant at between 17°C and 22°C throughout the year and there is no distinct winter and summer temperature regime. Average temperatures peak during September and October at 30°C. The coldest month is July with an average daily minimum temperature of 10°C. The vegetation in the area is deciduous tropical woodland generally referred to as Miombo Woodland, characterised by woodland interspersed with broad grassy and seasonally waterlogged areas known as dambos in Zambia. Trees seldom grow to heights exceeding 20 m, with the majority less than 8 m high. In recent years, the area has been heavily impacted by charcoal burners. The town of Kalulushi was developed in the 1950s by Roan Selection Trust (“RST”) to support the Chibuluma East and West mines. It is a mining town with approximately 3 300 houses with its own hospital and clinic, schools and recreational facilities. The town is accessed by a tarred road from Kitwe which was repaired and paid for by donor funding from China in 2007. The town is supplied with electricity by the ZESCO and fresh water from local drill holes and a pipeline from Kitwe by Nkana Water and Sewerage Company. The town has its own sewage works and internal water reticulation and is linked to the National Zamtel telephone network. The South Downs airstrip is approximately 8 km from the Chibuluma South mine and is a tarred strip capable of handling light aircraft. The Copperbelt itself is well serviced by rail, road and air services with daily international flights from Johannesburg landing at Ndola International Airport, an hour’s drive from Kitwe. The T3 road to Lusaka is all tar and in sound condition. This road network also serves as the main logistics servitude for mines in the DRC. All major towns on the Copperbelt are served by rail links to Lusaka, Dar es Salaam (Tanzania) and South Africa but in general, this network is inefficient and rolling stock and locomotives are not in a satisfactory condition. The Chibuluma South orebody lies 10 km to the south of Kalulushi, and the Chifupu deposit is located approximately 1.7 km to the southwest of the Chibuluma South mine. The Chibuluma East and West mines are located to the north of the town of Kalulushi. The Chibuluma South mine is accessed via a service road off the South Downs access road. This road was upgraded in 2007 from gravel to a tarred surface. Concentrate and other heavy trucks are however routed via an alternate back road to avoid damage to the new tar road.
-
Upload
khangminh22 -
Category
Documents
-
view
3 -
download
0
Transcript of 4 CHIBULUMA MINE - HKEXnews
APPENDIX V COMPETENT PERSON’S REPORT AND VALUATION REPORT
V - 131
4 CHIBULUMA MINE
4.1 Introduction [SR1.5A(i)]
Metorex has an 85% interest in Chibuluma, which has as its main operating asset the Chibuluma South mine.
The Chibuluma East and Chibuluma West mines are now depleted, but Chibuluma remains liable for
environmental rehabilitation. The remaining 15% interest is held by ZCCM-IH and the GRZ. The Chifupu
Project, located approximately 1.7 km southwest of Chibuluma South mine, forms part of the Chibuluma South
mine licence.
Chibuluma South mine is an underground, mechanised mine capable of treating 50 ktpm of RoM ore, which is
located near Kalulushi in Zambia.
4.2 Location, Climate, Access and Infrastructure [SR1.4A, SR1.5A(i), SR1.6, SV2.3]
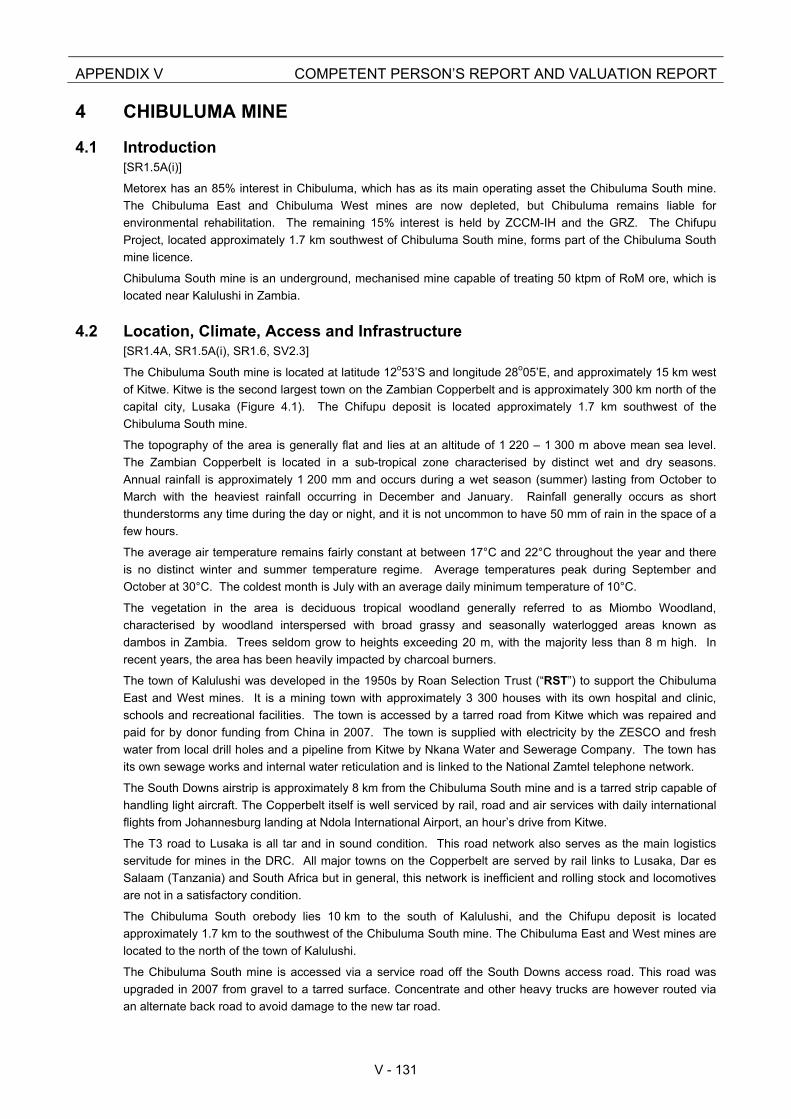
The Chibuluma South mine is located at latitude 12o53’S and longitude 28o05’E, and approximately 15 km west
of Kitwe. Kitwe is the second largest town on the Zambian Copperbelt and is approximately 300 km north of the
capital city, Lusaka (Figure 4.1). The Chifupu deposit is located approximately 1.7 km southwest of the
Chibuluma South mine.
The topography of the area is generally flat and lies at an altitude of 1 220 – 1 300 m above mean sea level.
The Zambian Copperbelt is located in a sub-tropical zone characterised by distinct wet and dry seasons.
Annual rainfall is approximately 1 200 mm and occurs during a wet season (summer) lasting from October to
March with the heaviest rainfall occurring in December and January. Rainfall generally occurs as short
thunderstorms any time during the day or night, and it is not uncommon to have 50 mm of rain in the space of a
few hours.
The average air temperature remains fairly constant at between 17°C and 22°C throughout the year and there
is no distinct winter and summer temperature regime. Average temperatures peak during September and
October at 30°C. The coldest month is July with an average daily minimum temperature of 10°C.
The vegetation in the area is deciduous tropical woodland generally referred to as Miombo Woodland,
characterised by woodland interspersed with broad grassy and seasonally waterlogged areas known as
dambos in Zambia. Trees seldom grow to heights exceeding 20 m, with the majority less than 8 m high. In
recent years, the area has been heavily impacted by charcoal burners.
The town of Kalulushi was developed in the 1950s by Roan Selection Trust (“RST”) to support the Chibuluma
East and West mines. It is a mining town with approximately 3 300 houses with its own hospital and clinic,
schools and recreational facilities. The town is accessed by a tarred road from Kitwe which was repaired and
paid for by donor funding from China in 2007. The town is supplied with electricity by the ZESCO and fresh
water from local drill holes and a pipeline from Kitwe by Nkana Water and Sewerage Company. The town has
its own sewage works and internal water reticulation and is linked to the National Zamtel telephone network.
The South Downs airstrip is approximately 8 km from the Chibuluma South mine and is a tarred strip capable of
handling light aircraft. The Copperbelt itself is well serviced by rail, road and air services with daily international
flights from Johannesburg landing at Ndola International Airport, an hour’s drive from Kitwe.
The T3 road to Lusaka is all tar and in sound condition. This road network also serves as the main logistics
servitude for mines in the DRC. All major towns on the Copperbelt are served by rail links to Lusaka, Dar es
Salaam (Tanzania) and South Africa but in general, this network is inefficient and rolling stock and locomotives
are not in a satisfactory condition.
The Chibuluma South orebody lies 10 km to the south of Kalulushi, and the Chifupu deposit is located
approximately 1.7 km to the southwest of the Chibuluma South mine. The Chibuluma East and West mines are
located to the north of the town of Kalulushi.
The Chibuluma South mine is accessed via a service road off the South Downs access road. This road was
upgraded in 2007 from gravel to a tarred surface. Concentrate and other heavy trucks are however routed via
an alternate back road to avoid damage to the new tar road.
APPENDIX V COMPETENT PERSON’S REPORT AND VALUATION REPORT
V - 132
Metorex Locality of Chibuluma and extent of Mineral Rights
Project No. 453459
Figure 4.1: Locality of Chibuluma and extent of Mineral Rights
An 11.4 km power line was constructed by CEC in 2000 for the Chibuluma South mine and supplies power at
66 kV which is stepped down at the Mine to 11 kV.
4.3 Mining History
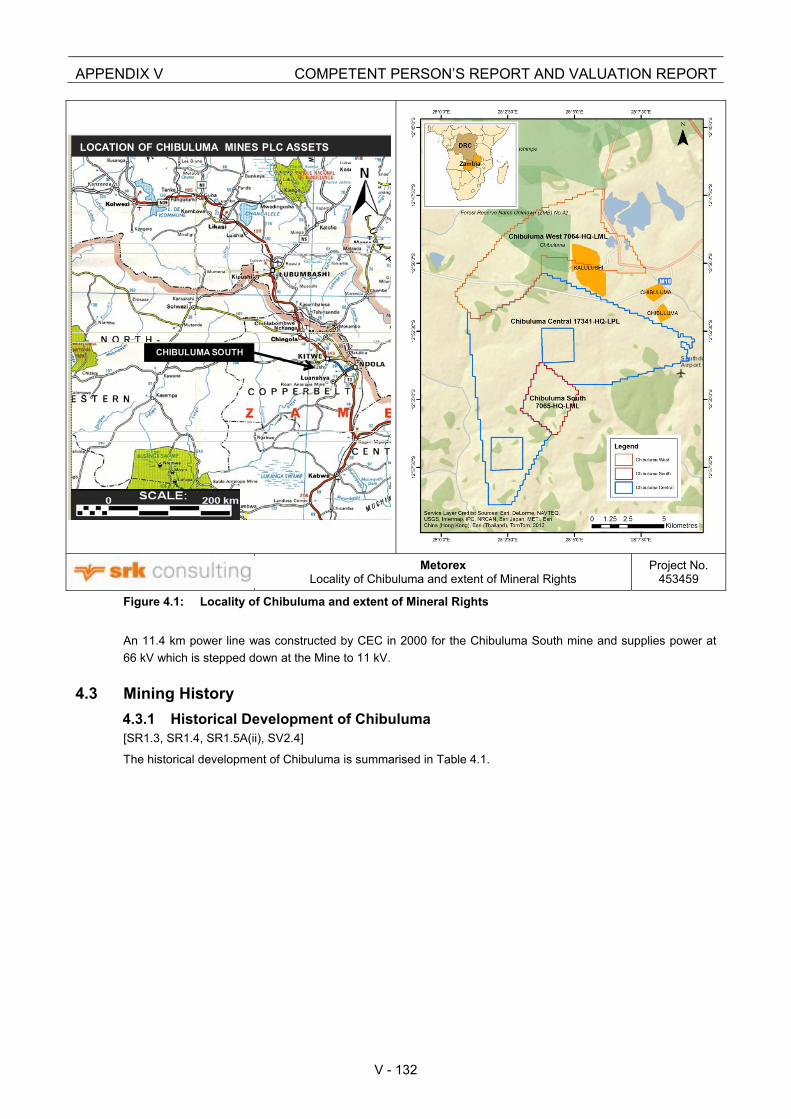
4.3.1 Historical Development of Chibuluma [SR1.3, SR1.4, SR1.5A(ii), SV2.4]
The historical development of Chibuluma is summarised in Table 4.1.
CHIBULUMA SOUTH
LOCATION OF CHIBULUMA MINES PLC ASSETS
APPENDIX V COMPETENT PERSON’S REPORT AND VALUATION REPORT
V - 133
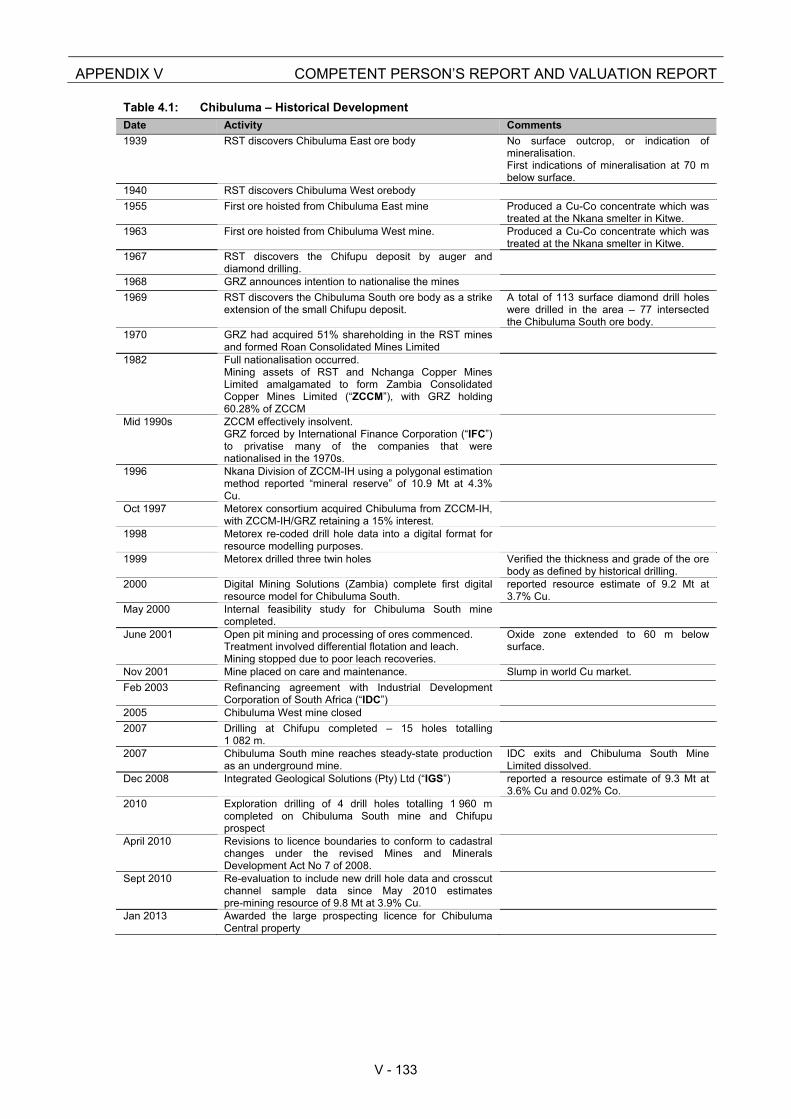
Table 4.1: Chibuluma – Historical Development
Date Activity Comments
1939 RST discovers Chibuluma East ore body No surface outcrop, or indication of mineralisation. First indications of mineralisation at 70 m below surface.
1940 RST discovers Chibuluma West orebody
1955 First ore hoisted from Chibuluma East mine Produced a Cu-Co concentrate which was treated at the Nkana smelter in Kitwe.
1963 First ore hoisted from Chibuluma West mine. Produced a Cu-Co concentrate which was treated at the Nkana smelter in Kitwe.
1967 RST discovers the Chifupu deposit by auger and diamond drilling.
1968 GRZ announces intention to nationalise the mines
1969 RST discovers the Chibuluma South ore body as a strike extension of the small Chifupu deposit.
A total of 113 surface diamond drill holes were drilled in the area – 77 intersected the Chibuluma South ore body.
1970 GRZ had acquired 51% shareholding in the RST mines and formed Roan Consolidated Mines Limited
1982 Full nationalisation occurred. Mining assets of RST and Nchanga Copper Mines Limited amalgamated to form Zambia Consolidated Copper Mines Limited (“ZCCM”), with GRZ holding 60.28% of ZCCM
Mid 1990s ZCCM effectively insolvent. GRZ forced by International Finance Corporation (“IFC”) to privatise many of the companies that were nationalised in the 1970s.
1996 Nkana Division of ZCCM-IH using a polygonal estimation method reported “mineral reserve” of 10.9 Mt at 4.3% Cu.
Oct 1997 Metorex consortium acquired Chibuluma from ZCCM-IH, with ZCCM-IH/GRZ retaining a 15% interest.
1998 Metorex re-coded drill hole data into a digital format for resource modelling purposes.
1999 Metorex drilled three twin holes Verified the thickness and grade of the ore body as defined by historical drilling.
2000 Digital Mining Solutions (Zambia) complete first digital resource model for Chibuluma South.
reported resource estimate of 9.2 Mt at 3.7% Cu.
May 2000 Internal feasibility study for Chibuluma South mine completed.
June 2001 Open pit mining and processing of ores commenced. Treatment involved differential flotation and leach. Mining stopped due to poor leach recoveries.
Oxide zone extended to 60 m below surface.
Nov 2001 Mine placed on care and maintenance. Slump in world Cu market.
Feb 2003 Refinancing agreement with Industrial Development Corporation of South Africa (“IDC”)
2005 Chibuluma West mine closed
2007 Drilling at Chifupu completed – 15 holes totalling 1 082 m.
2007 Chibuluma South mine reaches steady-state production as an underground mine.
IDC exits and Chibuluma South Mine Limited dissolved.
Dec 2008 Integrated Geological Solutions (Pty) Ltd (“IGS”) reported a resource estimate of 9.3 Mt at 3.6% Cu and 0.02% Co.
2010 Exploration drilling of 4 drill holes totalling 1 960 m completed on Chibuluma South mine and Chifupu prospect
April 2010 Revisions to licence boundaries to conform to cadastral changes under the revised Mines and Minerals Development Act No 7 of 2008.
Sept 2010 Re-evaluation to include new drill hole data and crosscut channel sample data since May 2010 estimates pre-mining resource of 9.8 Mt at 3.9% Cu.
Jan 2013 Awarded the large prospecting licence for Chibuluma Central property
APPENDIX V COMPETENT PERSON’S REPORT AND VALUATION REPORT
V - 134
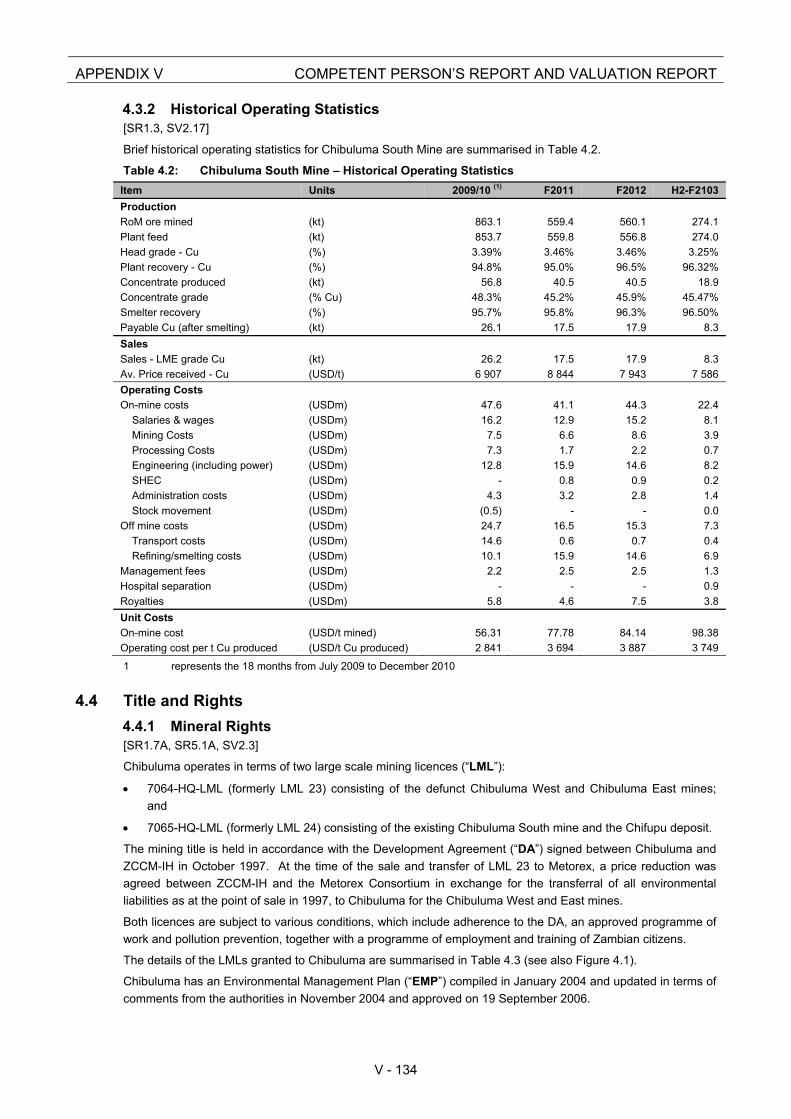
4.3.2 Historical Operating Statistics [SR1.3, SV2.17]
Brief historical operating statistics for Chibuluma South Mine are summarised in Table 4.2.
Table 4.2: Chibuluma South Mine – Historical Operating Statistics
Item Units 2009/10 (1) F2011 F2012 H2-F2103
Production
RoM ore mined (kt) 863.1 559.4 560.1 274.1
Plant feed (kt) 853.7 559.8 556.8 274.0
Head grade - Cu (%) 3.39% 3.46% 3.46% 3.25%
Plant recovery - Cu (%) 94.8% 95.0% 96.5% 96.32%
Concentrate produced (kt) 56.8 40.5 40.5 18.9
Concentrate grade (% Cu) 48.3% 45.2% 45.9% 45.47%
Smelter recovery (%) 95.7% 95.8% 96.3% 96.50%
Payable Cu (after smelting) (kt) 26.1 17.5 17.9 8.3
Sales
Sales - LME grade Cu (kt) 26.2 17.5 17.9 8.3
Av. Price received - Cu (USD/t) 6 907 8 844 7 943 7 586
Operating Costs
On-mine costs (USDm) 47.6 41.1 44.3 22.4
Salaries & wages (USDm) 16.2 12.9 15.2 8.1
Mining Costs (USDm) 7.5 6.6 8.6 3.9
Processing Costs (USDm) 7.3 1.7 2.2 0.7
Engineering (including power) (USDm) 12.8 15.9 14.6 8.2
SHEC (USDm) - 0.8 0.9 0.2
Administration costs (USDm) 4.3 3.2 2.8 1.4
Stock movement (USDm) (0.5) - - 0.0
Off mine costs (USDm) 24.7 16.5 15.3 7.3
Transport costs (USDm) 14.6 0.6 0.7 0.4
Refining/smelting costs (USDm) 10.1 15.9 14.6 6.9
Management fees (USDm) 2.2 2.5 2.5 1.3
Hospital separation (USDm) - - - 0.9
Royalties (USDm) 5.8 4.6 7.5 3.8
Unit Costs
On-mine cost (USD/t mined) 56.31 77.78 84.14 98.38
Operating cost per t Cu produced (USD/t Cu produced) 2 841 3 694 3 887 3 749
1 represents the 18 months from July 2009 to December 2010
4.4 Title and Rights
4.4.1 Mineral Rights [SR1.7A, SR5.1A, SV2.3]
Chibuluma operates in terms of two large scale mining licences (“LML”):
7064-HQ-LML (formerly LML 23) consisting of the defunct Chibuluma West and Chibuluma East mines;
and
7065-HQ-LML (formerly LML 24) consisting of the existing Chibuluma South mine and the Chifupu deposit.
The mining title is held in accordance with the Development Agreement (“DA”) signed between Chibuluma and
ZCCM-IH in October 1997. At the time of the sale and transfer of LML 23 to Metorex, a price reduction was
agreed between ZCCM-IH and the Metorex Consortium in exchange for the transferral of all environmental
liabilities as at the point of sale in 1997, to Chibuluma for the Chibuluma West and East mines.
Both licences are subject to various conditions, which include adherence to the DA, an approved programme of
work and pollution prevention, together with a programme of employment and training of Zambian citizens.
The details of the LMLs granted to Chibuluma are summarised in Table 4.3 (see also Figure 4.1).
Chibuluma has an Environmental Management Plan (“EMP”) compiled in January 2004 and updated in terms of
comments from the authorities in November 2004 and approved on 19 September 2006.
APPENDIX V COMPETENT PERSON’S REPORT AND VALUATION REPORT
V - 135
Chibuluma was awarded a large scale prospecting licence (“LPL”) over an area of 93 km2, which surrounds the
Chibuluma South tenement and abuts against the Chibuluma West tenement along its north-western boundary
(Figure 4.1). The prospecting rights to two small square tenements, situated north and south of the Chibuluma
South tenement, within the Chibuluma Central Tenement, are held by a third party.
The Environmental Project Brief for the Chibuluma Central area still needs to be approved by the Zambian
Environmental Management Agency (“ZEMA”),
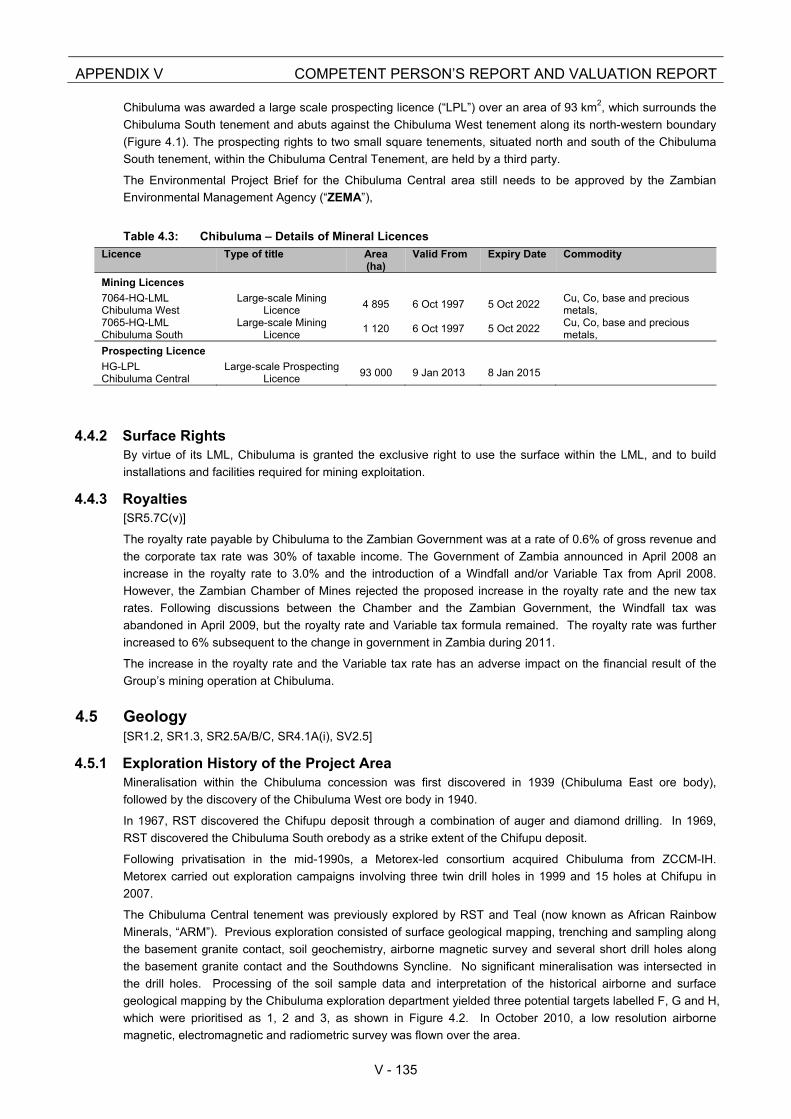
Table 4.3: Chibuluma – Details of Mineral Licences
Licence Type of title Area (ha)
Valid From Expiry Date Commodity
Mining Licences
7064-HQ-LML Chibuluma West
Large-scale Mining Licence
4 895 6 Oct 1997 5 Oct 2022 Cu, Co, base and precious metals,
7065-HQ-LML Chibuluma South
Large-scale Mining Licence
1 120 6 Oct 1997 5 Oct 2022 Cu, Co, base and precious metals,
Prospecting Licence
HG-LPL Chibuluma Central
Large-scale Prospecting Licence
93 000 9 Jan 2013 8 Jan 2015
4.4.2 Surface Rights By virtue of its LML, Chibuluma is granted the exclusive right to use the surface within the LML, and to build
installations and facilities required for mining exploitation.
4.4.3 Royalties [SR5.7C(v)]
The royalty rate payable by Chibuluma to the Zambian Government was at a rate of 0.6% of gross revenue and
the corporate tax rate was 30% of taxable income. The Government of Zambia announced in April 2008 an
increase in the royalty rate to 3.0% and the introduction of a Windfall and/or Variable Tax from April 2008.
However, the Zambian Chamber of Mines rejected the proposed increase in the royalty rate and the new tax
rates. Following discussions between the Chamber and the Zambian Government, the Windfall tax was
abandoned in April 2009, but the royalty rate and Variable tax formula remained. The royalty rate was further
increased to 6% subsequent to the change in government in Zambia during 2011.
The increase in the royalty rate and the Variable tax rate has an adverse impact on the financial result of the
Group’s mining operation at Chibuluma.
4.5 Geology [SR1.2, SR1.3, SR2.5A/B/C, SR4.1A(i), SV2.5]
4.5.1 Exploration History of the Project Area Mineralisation within the Chibuluma concession was first discovered in 1939 (Chibuluma East ore body),
followed by the discovery of the Chibuluma West ore body in 1940.
In 1967, RST discovered the Chifupu deposit through a combination of auger and diamond drilling. In 1969,
RST discovered the Chibuluma South orebody as a strike extent of the Chifupu deposit.
Following privatisation in the mid-1990s, a Metorex-led consortium acquired Chibuluma from ZCCM-IH.
Metorex carried out exploration campaigns involving three twin drill holes in 1999 and 15 holes at Chifupu in
2007.
The Chibuluma Central tenement was previously explored by RST and Teal (now known as African Rainbow
Minerals, “ARM”). Previous exploration consisted of surface geological mapping, trenching and sampling along
the basement granite contact, soil geochemistry, airborne magnetic survey and several short drill holes along
the basement granite contact and the Southdowns Syncline. No significant mineralisation was intersected in
the drill holes. Processing of the soil sample data and interpretation of the historical airborne and surface
geological mapping by the Chibuluma exploration department yielded three potential targets labelled F, G and H,
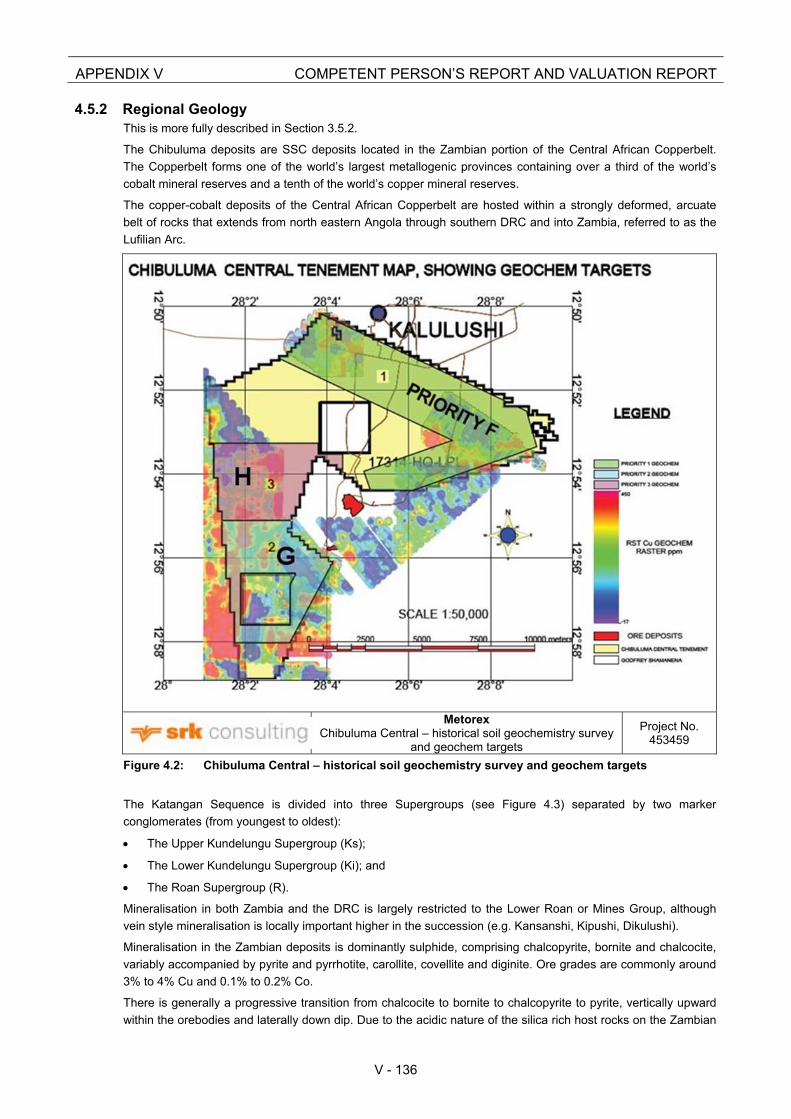
which were prioritised as 1, 2 and 3, as shown in Figure 4.2. In October 2010, a low resolution airborne
magnetic, electromagnetic and radiometric survey was flown over the area.
APPENDIX V COMPETENT PERSON’S REPORT AND VALUATION REPORT
V - 136
4.5.2 Regional Geology This is more fully described in Section 3.5.2.
The Chibuluma deposits are SSC deposits located in the Zambian portion of the Central African Copperbelt.
The Copperbelt forms one of the world’s largest metallogenic provinces containing over a third of the world’s
cobalt mineral reserves and a tenth of the world’s copper mineral reserves.
The copper-cobalt deposits of the Central African Copperbelt are hosted within a strongly deformed, arcuate
belt of rocks that extends from north eastern Angola through southern DRC and into Zambia, referred to as the
Lufilian Arc.
MetorexChibuluma Central – historical soil geochemistry survey
and geochem targets
Project No. 453459
Figure 4.2: Chibuluma Central – historical soil geochemistry survey and geochem targets
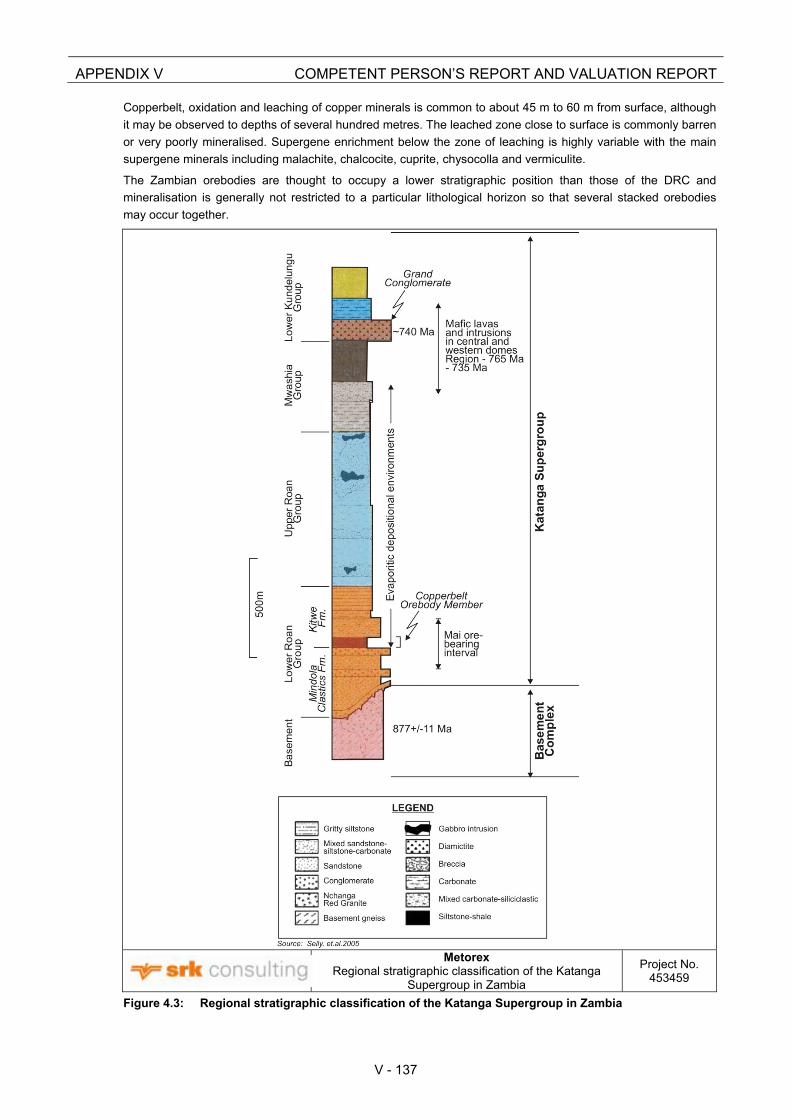
The Katangan Sequence is divided into three Supergroups (see Figure 4.3) separated by two marker
conglomerates (from youngest to oldest):
The Upper Kundelungu Supergroup (Ks);
The Lower Kundelungu Supergroup (Ki); and
The Roan Supergroup (R).
Mineralisation in both Zambia and the DRC is largely restricted to the Lower Roan or Mines Group, although
vein style mineralisation is locally important higher in the succession (e.g. Kansanshi, Kipushi, Dikulushi).
Mineralisation in the Zambian deposits is dominantly sulphide, comprising chalcopyrite, bornite and chalcocite,
variably accompanied by pyrite and pyrrhotite, carollite, covellite and diginite. Ore grades are commonly around
3% to 4% Cu and 0.1% to 0.2% Co.
There is generally a progressive transition from chalcocite to bornite to chalcopyrite to pyrite, vertically upward
within the orebodies and laterally down dip. Due to the acidic nature of the silica rich host rocks on the Zambian
APPENDIX V COMPETENT PERSON’S REPORT AND VALUATION REPORT
V - 137
Copperbelt, oxidation and leaching of copper minerals is common to about 45 m to 60 m from surface, although
it may be observed to depths of several hundred metres. The leached zone close to surface is commonly barren
or very poorly mineralised. Supergene enrichment below the zone of leaching is highly variable with the main
supergene minerals including malachite, chalcocite, cuprite, chysocolla and vermiculite.
The Zambian orebodies are thought to occupy a lower stratigraphic position than those of the DRC and
mineralisation is generally not restricted to a particular lithological horizon so that several stacked orebodies
may occur together.
Metorex
Regional stratigraphic classification of the Katanga Supergroup in Zambia
Project No. 453459
Figure 4.3: Regional stratigraphic classification of the Katanga Supergroup in Zambia
APPENDIX V COMPETENT PERSON’S REPORT AND VALUATION REPORT
V - 138
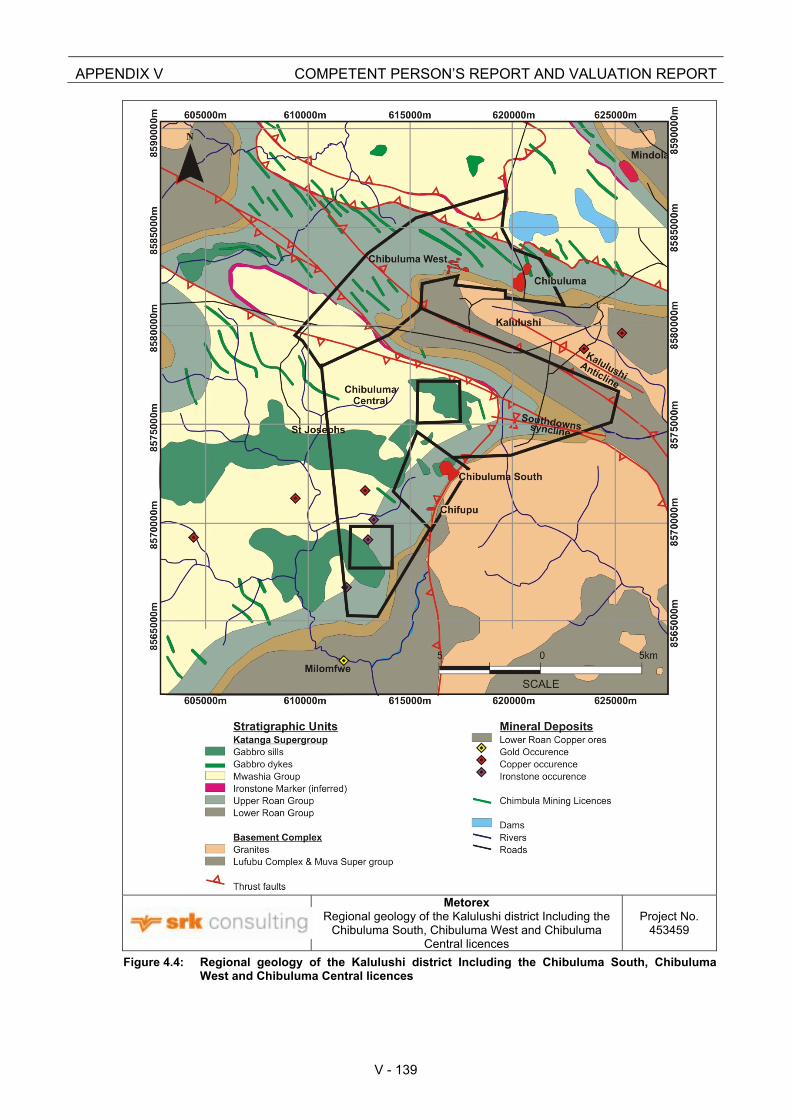
4.5.3 Local Geology and Mineralisation (Chibuluma South West) The Chibuluma South and West deposits are typical of the Zambian Copperbelt deposits and are geologically
similar to the Chambishi and Mufulira mines. The Regional geology of Kalulushi District is shown in Figure 4.4.
As the Chibuluma West mine has been depleted, the following discussion will refer only to the Chibuluma South
mine and satellite deposits.
The Ore Shale facies which hosts the mega deposits (e.g. Konkola, Nchanga and Nkana) of the Copperbelt is
absent on the Chibuluma South property, and the host formation of the orebody is correlated with the footwall
formations found beneath the Ore Shale. Consequently, the Chibuluma South orebody has been termed a
“footwall orebody” in the context of the Zambian Copperbelt, forming small (<10 Mt), HG (~4% Cu) deposits
within a coarse grained quartzite.
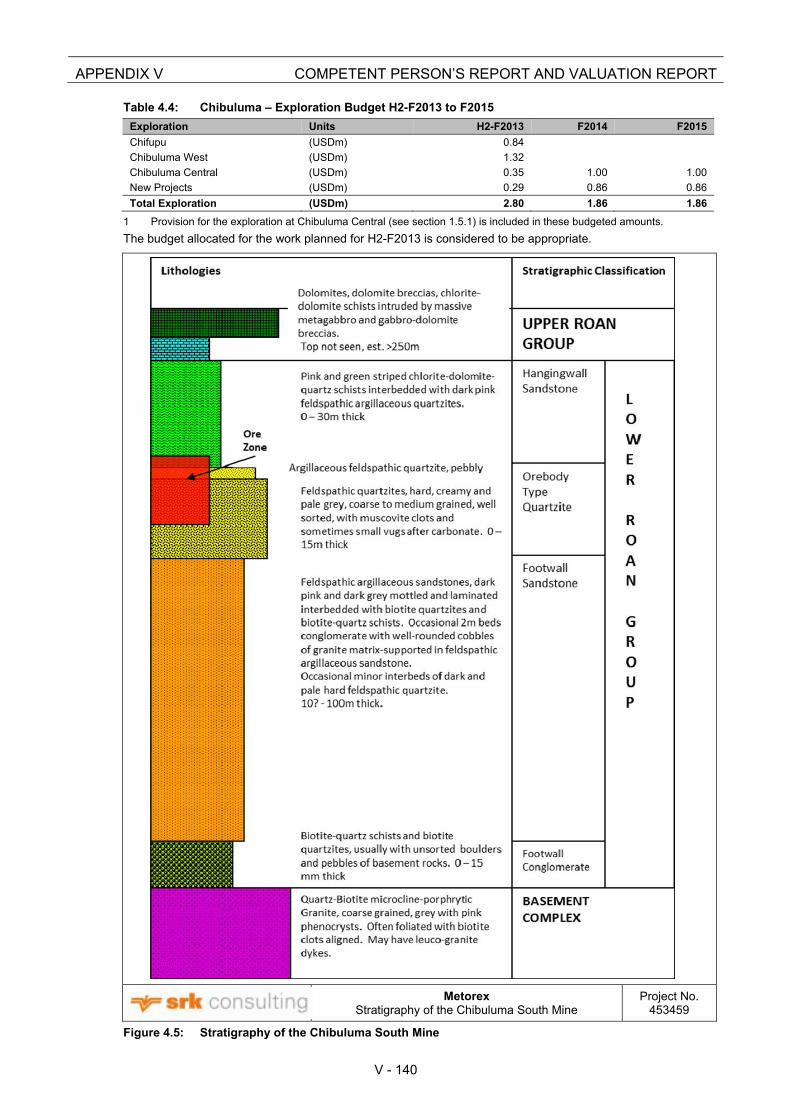
Mineralisation in the Chibuluma South orebody is predominantly Cu with very minor Co and is hosted in detrital
conglomerates, sandstones and argillaceous siltstones of the Lower Roan Group (see Figure 4.5). The orebody
is hosted by a competent quartzite horizon overlain by a sequence of argillites and dolomites of the Upper Roan
Group. Mineralisation is hosted in a mineralised quartzite known locally as the Orebody Quartzite (“OBQ”) with
the unmineralised quartzite below the OBQ referred to as the Footwall Quartzite.
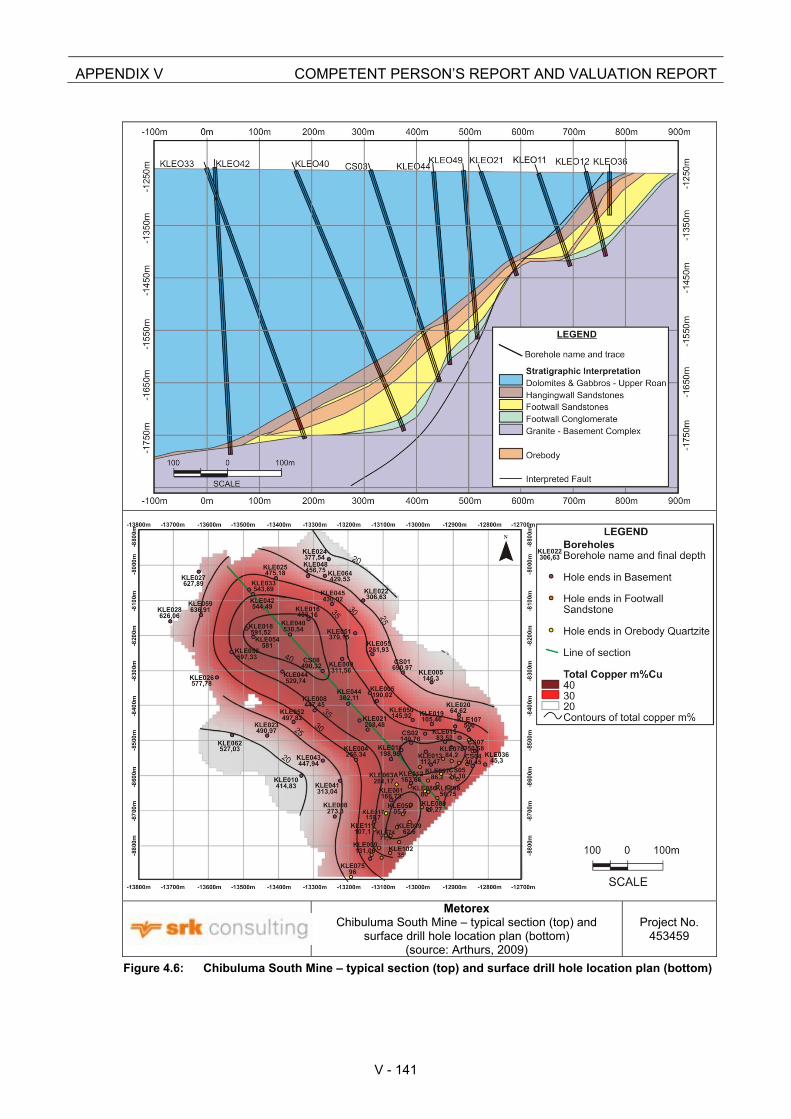
The Chibuluma South orebody occurs over a strike length of 300 m, dipping at approximately 38° towards the
north-west and varies in thickness from a few metres to over 30 m in places (see Figure 4.6) for a typical
section through the ore body). Drilling has defined the orebody to a maximum depth of 600 m where it pinches
out against a basement high. While drilling has closed off the orebody at depth, it is feasible that the ore boby
opens up down-dip of the basement high.
Mineralisation occurs as oxide to a depth of 60 m and as sulphides below the 60 m level. Malachite is the
dominant oxide mineral while bornite, chalcopyrite and chalcocite constitute the sulphides. Chalcocite is found
immediately below the oxide cap in the sulphide zone. Bornite dominates in the thickest and richest central
portion of the orebody and is the predominant sulphide mineral with chalcocite below the 400 m level currently
being developed by the Mine. Chalcopyrite accounts for approximately 20% of the sulphides and becomes more
evident towards the fringes. Pyrite dominates in barren fringe areas.
Cobalt mineralisation in the Chibuluma South orebody is patchy and was only found in a few drill hole
intersections.
The Chifupu deposit is similar to the Chibuluma South orebody and consists of two shallow dipping zones, each
approximately 5 m in width, separated by a waste parting of 20 m to 30 m. A strike length of 150 m has been
defined with a maximum depth of 300 m.
4.5.4 Exploration Programme and Budget The intensity of surface exploration activities carried out in the 1960s preclude the likelihood of a near surface
discovery, and future exploration activities on and adjacent to the licence area will focus on buried targets at
depth associated with the identification of basement structures and redox trap sites. Metorex expects that
exploration will be expensive due to the need for high resolution geophysics and deep diamond drilling. A high
ratio of non-mineralised holes is expected in the early period while the exploration model is being refined.
By the end of December 2010, 1 960 m of exploration drilling, 1 497 line-km of airborne electromagnetics and
79 line-km of ground gravity surveys were conducted by various contractors. These works were undertaken as
follow-up to a regional desk top study conducted in 2009 where a number of high potential target areas were
identified.
The previous programme located on Chibuluma West licence gave disappointing results, so this has been
downgraded. The number of drill holes allocated to Chibuluma West will be used to test the Chabara Gabbro
Field and the Southdown thrust fault area during H2-F2013.
Metorex’s plans for Chibuluma Central include compilation of a GIS database and GEMS 3D model of historical
data, soil sampling, ground geophysics and drilling of anomalous areas.
Chibuluma’s exploration budget for H2-F2013 to F2015 is set out in Table 4.4.
APPENDIX V COMPETENT PERSON’S REPORT AND VALUATION REPORT
V - 139
Metorex
Regional geology of the Kalulushi district Including the Chibuluma South, Chibuluma West and Chibuluma
Central licences
Project No. 453459
Figure 4.4: Regional geology of the Kalulushi district Including the Chibuluma South, Chibuluma West and Chibuluma Central licences
APPENDIX V COMPETENT PERSON’S REPORT AND VALUATION REPORT
V - 140
Table 4.4: Chibuluma – Exploration Budget H2-F2013 to F2015
Exploration Units H2-F2013 F2014 F2015
Chifupu (USDm) 0.84
Chibuluma West (USDm) 1.32
Chibuluma Central (USDm) 0.35 1.00 1.00
New Projects (USDm) 0.29 0.86 0.86
Total Exploration (USDm) 2.80 1.86 1.86
1 Provision for the exploration at Chibuluma Central (see section 1.5.1) is included in these budgeted amounts.
The budget allocated for the work planned for H2-F2013 is considered to be appropriate.
Metorex Stratigraphy of the Chibuluma South Mine
Project No. 453459
Figure 4.5: Stratigraphy of the Chibuluma South Mine
APPENDIX V COMPETENT PERSON’S REPORT AND VALUATION REPORT
V - 141
MetorexChibuluma South Mine – typical section (top) and
surface drill hole location plan (bottom) (source: Arthurs, 2009)
Project No. 453459
Figure 4.6: Chibuluma South Mine – typical section (top) and surface drill hole location plan (bottom)
APPENDIX V COMPETENT PERSON’S REPORT AND VALUATION REPORT
V - 142
4.6 Mineral Resources and Mineral Reserves [SR1.1A(iii), SR2.5A/B/C, SR7B, SR9A/B/C, SV2.6]
4.6.1 Data Quality and Quantity [SR3.1, SR4.1]
The Chibuluma resource model is based largely on surface drill hole data collected between 1969 and 1975 by
RST with limited data collected from underground drilling with the development of the underground mine.
Additional information collected and used in the refinement of the resource model consists of underground
mapping and channel sampling. This information is not included in the drill hole database.
About 100 drill holes, prefixed KLE, from the RST drilling were found to be proximate to Chibuluma South out of
a combined database of 113 holes available within the area.
The current database contains 276 drill hole entries of which 97 are KLE holes from the RST drilling and the
rest is made up of limited surface drilling and drill hole data collected from the underground developments
together with channel sampling information. The count of holes is 138 prefixed KP, 7 prefixed CS, 33 prefixed
CB and 1 prefixed UGCS.
There are limited down-the-hole surveys done on the RST holes with end-of holes varying from 35 m to 640 m
and average 220 m. Also the underground holes are not routinely surveyed down-the-hole.
This has an impact on the spatial locations of the intersections of the mineralised zones and is reflected in the
modelling discussed later in this section.
4.6.2 Verification of Historical Drilling As a check on the integrity of the RST geological information, 8 of the original drill holes, (KLE 11, 16, 21, 51, 54,
61, 63 and 63a) were drawn from the Chamber of Mines core shed in Kalulushi and re-logged by a Chibuluma
mine geologist shortly after acquisition by Metorex in 1997. The remaining half cores were selected to match as
far as possible the original sampling widths, split into quarters and re-assayed at the ZCCM Technical Services
Laboratory. The resulting grade distributions within the newly assayed cores were compared with the original
grades. The grade distribution correlated extremely well with a +8 % grade variance in the re-assay.
Two holes were drilled by Metorex in 1998 to confirm previous intersections and local geology, and to provide
material for metallurgical test work. Drill hole CS2 was drilled to twin KLE 2. Set up was adjacent to the collar
and with the same inclination and azimuth. Drill hole CS3 served as an infill hole between original holes KLE 40
and 44. Holes were stopped in basement at depths of 140 m and 420 m respectively. Diamond drilling was
carried out at NQ size (47.6 mm) and core was logged by mine geologists. Mineralised core was sampled at
approximately 0.5 m intervals and assayed at the ZCCM Technical Services laboratory (now AH Knight
Laboratories) in Kalulushi.
Both drill holes confirmed the depth and mineral distribution patterns indicated by earlier exploration drilling.
Histograms of total copper in drill holes CS2 and KLE 2 are almost identical over core lengths of 16 m, with a
grade of 3.6 % TCu in CS2 compared to 4.05 % TCu in KLE 2. However, drill hole CS2 has a further 6 m of
mineralised core below this, half of which is low grade followed by 2.5 m with grades of up to 4.35 % TCu,
implying additional mineable tonnage. Drill hole CS3 broadly confirmed the depth and distribution patterns of
flanking drill holes KLE 40 and 44, and the grade of 3.34 % TCu over 29.3 m is similar to the overall grade of
3.38% TCu over 31.9 m of KLE 44.
The ZCCM Technical Services laboratory was not an accredited laboratory although it was used extensively by
ZCCM prior to privatisation. There is limited information available as to the level of QA/QC carried out during
this programme and whether any repeat samples were assayed by an independent referee. Until this can be
verified in the form of a written document, it must be assumed that this was limited to the use of instrument
calibration standards by the laboratory.
Whilst the new holes confirmed the presence of copper mineralisation as predicted in previous reports, they
also highlighted the undulations of the footwall contact and the variation in mineral distribution across the
orebody.
APPENDIX V COMPETENT PERSON’S REPORT AND VALUATION REPORT
V - 143
4.6.3 Sampling Method and Approach [SR3.2, SR3.3]
There are no details on the sampling method and approach for the RST drilled holes.
4.6.4 Sample Analytical Methods [SR3.3, SR3.4]
There are no details on the sample analytical methods adopted during the analyses of the RST drilled holes.
Analyses of the samples from verification work undertaken by Metorex in 1997 on the re-sampling the old core
and the twin drilling of selected RST drill holes were done by AAS at the RST Research and Development
Laboratory. The laboratory was not accredited during the period of the analyses.
The RST/ZCCM work was undertaken at the time when there was no emphasis on QA/QC and laboratory
accreditation. This is included in the CPVR in the interests of transparency related to the historical activities.
The production reconciliation data (see Figure 4.8) provided by Metorex show good performance of the block
model, which is based on these historical data supplemented with additional and more recent drilling.
4.6.5 Quality Assurance and Quality Control [SR2.1, SR3.1, SR3.2, SR4.1]
No QA/QC procedures or results were available for the RST exploration drill holes.
No QA/QC information is available prior to 2009 for the surface and underground drilling and channel samples
analysed at the company’s laboratory at Chibuluma South mine. From January 2009 a total of 247 “blanks”
have been inserted the sample stream as part of a limited QA/QC programme.
4.6.6 Geological Modelling [SR4.1A(ii)(iv), SR4.1A/B, SR4.2A, SR4.2B]
The resource estimate for Chibuluma South Mine was conducted in-house using the Surpac version 6.1.3
geological and mine planning software package. The bench plans for the open pit and underground level plans
to 350mL used in the 2008 estimate by IGS were used together with data from channel sampling and diamond
drilling. The basement contact, orebody and the waste parting outlines used in the 2008 IGS estimate were
updated with the new drill hole and channel sampling data. A combination of slices and drill hole/channel
sampling intersections produced 3D wireframes. The orebody was projected up to and then truncated against
the basement wireframe. The waste parting was modelled separately and projected through the orebody
wireframe using the mapped horizontal slices as well as interpreted drill hole intersections at depth.
Where there is conflict in the contact position, channel sampling data was given precedence over underground
drill hole data which was also given precedence over surface drill hole data. No changes to the basement
surface were made. The orebody outline is based on an assay grade cut-off of 1% TCu.
A section through the orebody model is given in Figure 5.5. The orebody truncates against the basement in the
north-east but moves away from the basement and eventually pinches out in the south west. The orebody
model is well constrained in the areas close to the open pit, and in the mapping in the underground workings
down to the 457m level. Below the current workings the orebody model is only defined by surface drill holes
and while some variations in the exact geometry of the orebody are likely, they are not expected to be material.
The modelling of waste parting is done separately based on drill hole, channel sampling data and underground
mapping.
4.6.7 Grade Estimation [SR4.2]
An additional 4 219 samples were added to the Chibuluma database between December 2007 and November
2008, with the bulk of these samples representing underground channel samples. A total of 224 surface and
underground drill holes and 9 channel crosscuts were used in the geological interpretation. Composites were
selected within the modelled orebody envelope at a 1% TCu assay grade cut-off, and include surface,
underground drill holes and channel samples.
For the purposes of geostatistical modelling and grade interpolation, all samples were composited to lengths of
1 m, with a minimum composite length of 0.75 m. A top-cut grade of 8.00 % TCu was applied. Sample statistics
are presented in Table 4.5.
APPENDIX V COMPETENT PERSON’S REPORT AND VALUATION REPORT
V - 144
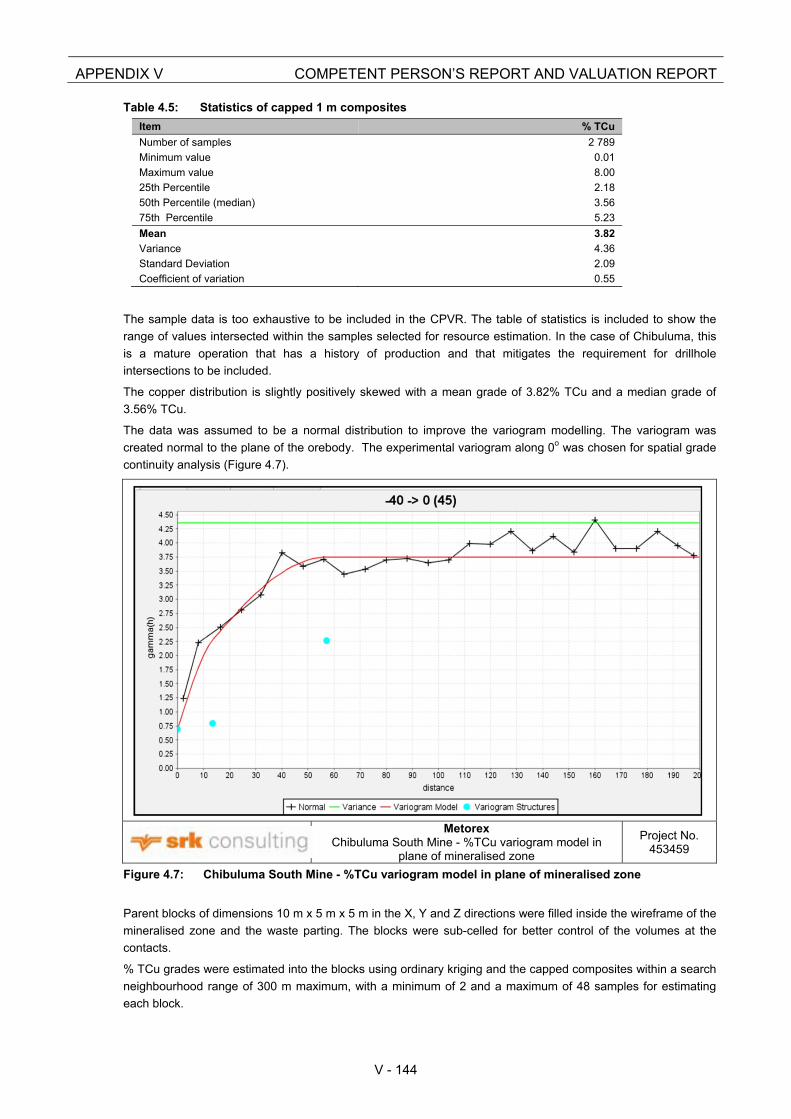
Table 4.5: Statistics of capped 1 m composites
Item % TCu
Number of samples 2 789
Minimum value 0.01
Maximum value 8.00
25th Percentile 2.18
50th Percentile (median) 3.56
75th Percentile 5.23
Mean 3.82
Variance 4.36
Standard Deviation 2.09
Coefficient of variation 0.55
The sample data is too exhaustive to be included in the CPVR. The table of statistics is included to show the
range of values intersected within the samples selected for resource estimation. In the case of Chibuluma, this
is a mature operation that has a history of production and that mitigates the requirement for drillhole
intersections to be included.
The copper distribution is slightly positively skewed with a mean grade of 3.82% TCu and a median grade of
3.56% TCu.
The data was assumed to be a normal distribution to improve the variogram modelling. The variogram was
created normal to the plane of the orebody. The experimental variogram along 0o was chosen for spatial grade
continuity analysis (Figure 4.7).
MetorexChibuluma South Mine - %TCu variogram model in
plane of mineralised zone
Project No. 453459
Figure 4.7: Chibuluma South Mine - %TCu variogram model in plane of mineralised zone
Parent blocks of dimensions 10 m x 5 m x 5 m in the X, Y and Z directions were filled inside the wireframe of the
mineralised zone and the waste parting. The blocks were sub-celled for better control of the volumes at the
contacts.
% TCu grades were estimated into the blocks using ordinary kriging and the capped composites within a search
neighbourhood range of 300 m maximum, with a minimum of 2 and a maximum of 48 samples for estimating
each block.
APPENDIX V COMPETENT PERSON’S REPORT AND VALUATION REPORT
V - 145
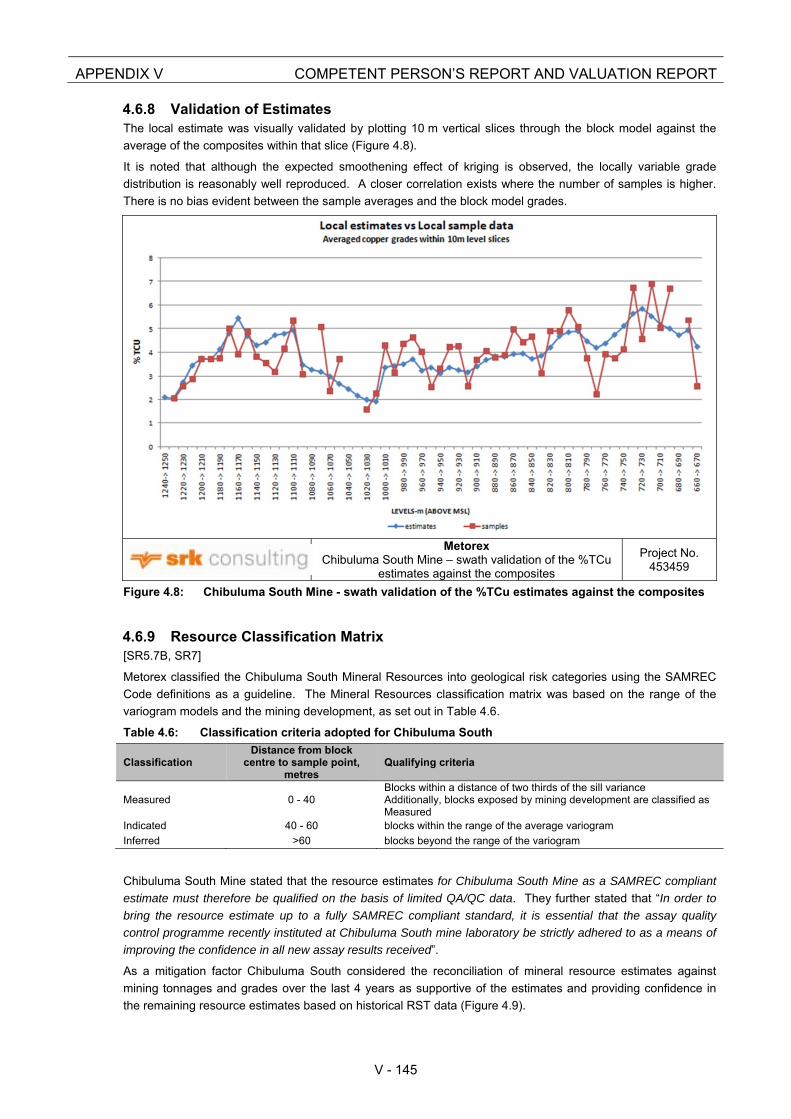
4.6.8 Validation of Estimates The local estimate was visually validated by plotting 10 m vertical slices through the block model against the
average of the composites within that slice (Figure 4.8).
It is noted that although the expected smoothening effect of kriging is observed, the locally variable grade
distribution is reasonably well reproduced. A closer correlation exists where the number of samples is higher.
There is no bias evident between the sample averages and the block model grades.
MetorexChibuluma South Mine – swath validation of the %TCu
estimates against the composites
Project No. 453459
Figure 4.8: Chibuluma South Mine - swath validation of the %TCu estimates against the composites
4.6.9 Resource Classification Matrix [SR5.7B, SR7]
Metorex classified the Chibuluma South Mineral Resources into geological risk categories using the SAMREC
Code definitions as a guideline. The Mineral Resources classification matrix was based on the range of the
variogram models and the mining development, as set out in Table 4.6.
Table 4.6: Classification criteria adopted for Chibuluma South
Classification Distance from block
centre to sample point, metres
Qualifying criteria
Measured 0 - 40 Blocks within a distance of two thirds of the sill variance Additionally, blocks exposed by mining development are classified as Measured
Indicated 40 - 60 blocks within the range of the average variogram
Inferred >60 blocks beyond the range of the variogram
Chibuluma South Mine stated that the resource estimates for Chibuluma South Mine as a SAMREC compliant
estimate must therefore be qualified on the basis of limited QA/QC data. They further stated that “In order to
bring the resource estimate up to a fully SAMREC compliant standard, it is essential that the assay quality
control programme recently instituted at Chibuluma South mine laboratory be strictly adhered to as a means of
improving the confidence in all new assay results received”.
As a mitigation factor Chibuluma South considered the reconciliation of mineral resource estimates against
mining tonnages and grades over the last 4 years as supportive of the estimates and providing confidence in
the remaining resource estimates based on historical RST data (Figure 4.9).
APPENDIX V COMPETENT PERSON’S REPORT AND VALUATION REPORT
V - 146
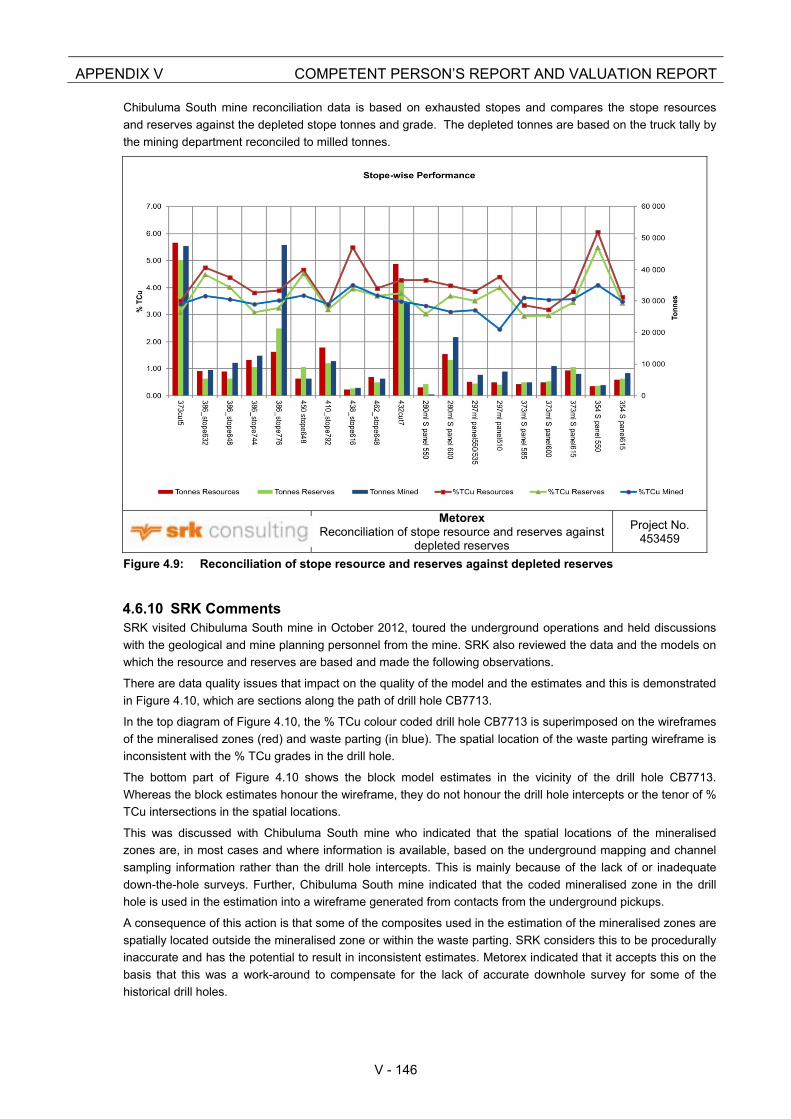
Chibuluma South mine reconciliation data is based on exhausted stopes and compares the stope resources
and reserves against the depleted stope tonnes and grade. The depleted tonnes are based on the truck tally by
the mining department reconciled to milled tonnes.
MetorexReconciliation of stope resource and reserves against
depleted reserves
Project No. 453459
Figure 4.9: Reconciliation of stope resource and reserves against depleted reserves
4.6.10 SRK Comments SRK visited Chibuluma South mine in October 2012, toured the underground operations and held discussions
with the geological and mine planning personnel from the mine. SRK also reviewed the data and the models on
which the resource and reserves are based and made the following observations.
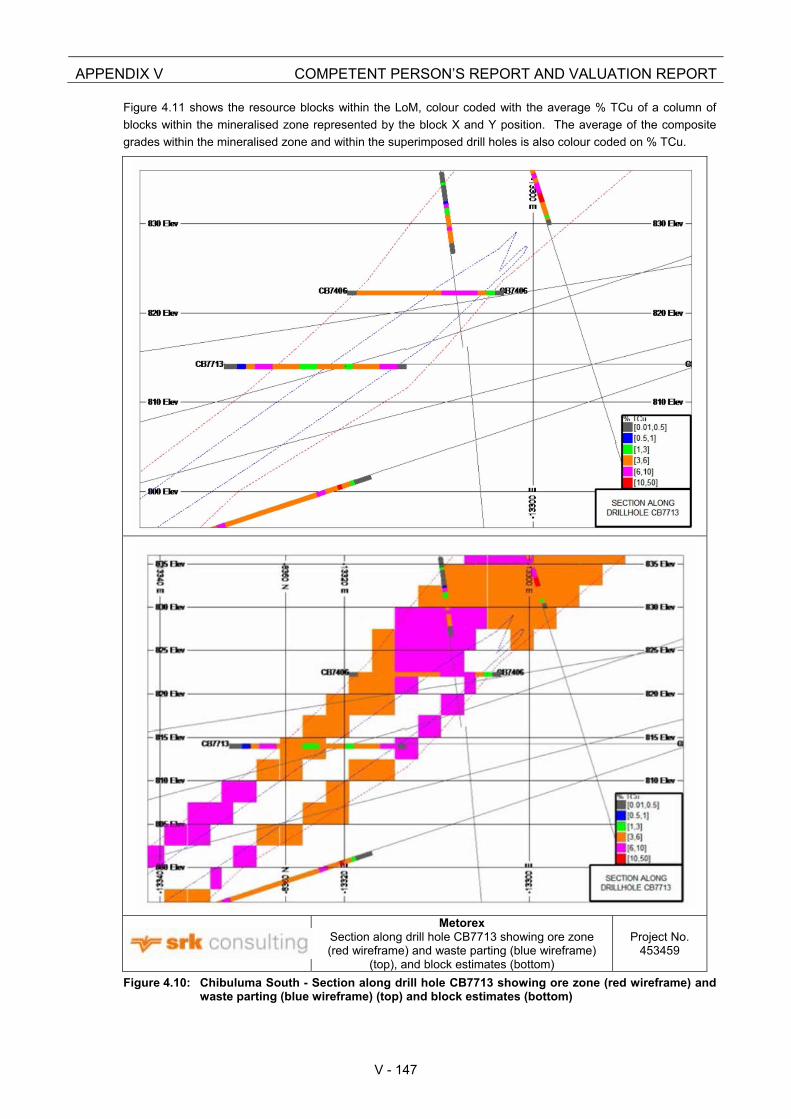
There are data quality issues that impact on the quality of the model and the estimates and this is demonstrated
in Figure 4.10, which are sections along the path of drill hole CB7713.
In the top diagram of Figure 4.10, the % TCu colour coded drill hole CB7713 is superimposed on the wireframes
of the mineralised zones (red) and waste parting (in blue). The spatial location of the waste parting wireframe is
inconsistent with the % TCu grades in the drill hole.
The bottom part of Figure 4.10 shows the block model estimates in the vicinity of the drill hole CB7713.
Whereas the block estimates honour the wireframe, they do not honour the drill hole intercepts or the tenor of %
TCu intersections in the spatial locations.
This was discussed with Chibuluma South mine who indicated that the spatial locations of the mineralised
zones are, in most cases and where information is available, based on the underground mapping and channel
sampling information rather than the drill hole intercepts. This is mainly because of the lack of or inadequate
down-the-hole surveys. Further, Chibuluma South mine indicated that the coded mineralised zone in the drill
hole is used in the estimation into a wireframe generated from contacts from the underground pickups.
A consequence of this action is that some of the composites used in the estimation of the mineralised zones are
spatially located outside the mineralised zone or within the waste parting. SRK considers this to be procedurally
inaccurate and has the potential to result in inconsistent estimates. Metorex indicated that it accepts this on the
basis that this was a work-around to compensate for the lack of accurate downhole survey for some of the
historical drill holes.
APPENDIX V COMPETENT PERSON’S REPORT AND VALUATION REPORT
V - 147
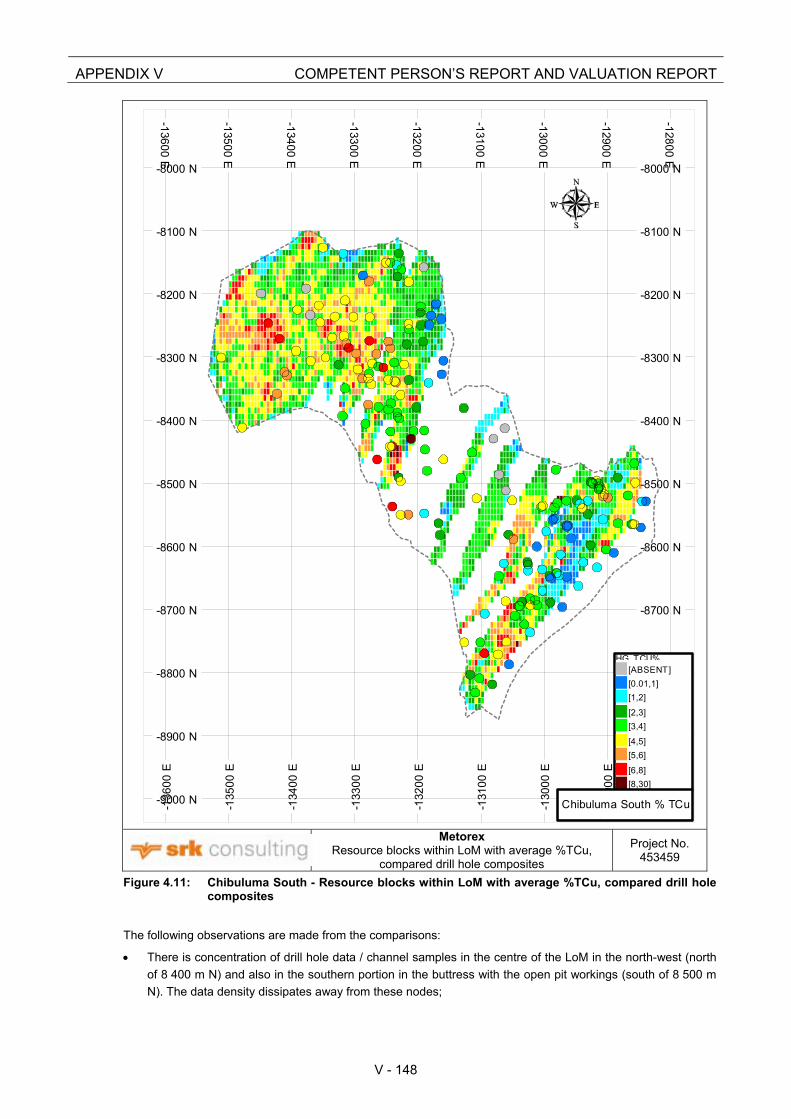
Figure 4.11 shows the resource blocks within the LoM, colour coded with the average % TCu of a column of
blocks within the mineralised zone represented by the block X and Y position. The average of the composite
grades within the mineralised zone and within the superimposed drill holes is also colour coded on % TCu.
MetorexSection along drill hole CB7713 showing ore zone (red wireframe) and waste parting (blue wireframe)
(top), and block estimates (bottom)
Project No. 453459
Figure 4.10: Chibuluma South - Section along drill hole CB7713 showing ore zone (red wireframe) and waste parting (blue wireframe) (top) and block estimates (bottom)
APPENDIX V COMPETENT PERSON’S REPORT AND VALUATION REPORT
V - 148
MetorexResource blocks within LoM with average %TCu,
compared drill hole composites
Project No. 453459
Figure 4.11: Chibuluma South - Resource blocks within LoM with average %TCu, compared drill hole composites
The following observations are made from the comparisons:
There is concentration of drill hole data / channel samples in the centre of the LoM in the north-west (north
of 8 400 m N) and also in the southern portion in the buttress with the open pit workings (south of 8 500 m
N). The data density dissipates away from these nodes;
-1
360
0 E
-136
00 E
-1
350
0 E
-135
00 E
-1
340
0 E
-134
00 E
-1
330
0 E
-133
00 E
-1
320
0 E
-132
00 E
-1
310
0 E
-131
00 E
-1
300
0 E
-130
00 E
-1
290
0 E
-129
00 E
-1
280
0 E
-128
00 E
-9000 N -9000 N
-8900 N -8900 N
-8800 N -8800 N
-8700 N -8700 N
-8600 N -8600 N
-8500 N -8500 N
-8400 N -8400 N
-8300 N -8300 N
-8200 N -8200 N
-8100 N -8100 N
-8000 N -8000 N
HG TCU%[ABSENT]
[0.01,1]
[1,2]
[2,3]
[3,4]
[4,5]
[5,6]
[6,8]
[8,30]
Chibuluma South % TCu
APPENDIX V COMPETENT PERSON’S REPORT AND VALUATION REPORT
V - 149
In terms of grade distributions, generally the block estimates are consistent with the distribution of the
composite grades in areas of high data density and less comparable in the fringe areas which appear to
have been over-estimated;
There are drill holes that are contained within the mineralised wireframe that do not contain copper
mineralisation either as they were not sampled or are considered barren and not worthy of sampling.
From inspection of Figure 4.10, SRK observes that:
Blocks are classified on the basis of proximity to a drill hole and annular rings are drawn around drill holes
describing Measured, Indicated and Inferred as proportions of the variogram range.
Isolated drill hole data points have annular rings of classification without accounting for proximity to other
data points, geological continuity and grade domaining and continuity.
SRK is of the opinion that classification criteria should take into account the relationships between adjacent drill
hole grade intersections, consistent with the SAMREC Code which requires that the locations are spaced
closely enough to confirm geological and grade continuity. Isolated drill hole data points do not demonstrate
continuity of any form and therefore cannot be used as a basis for classification.
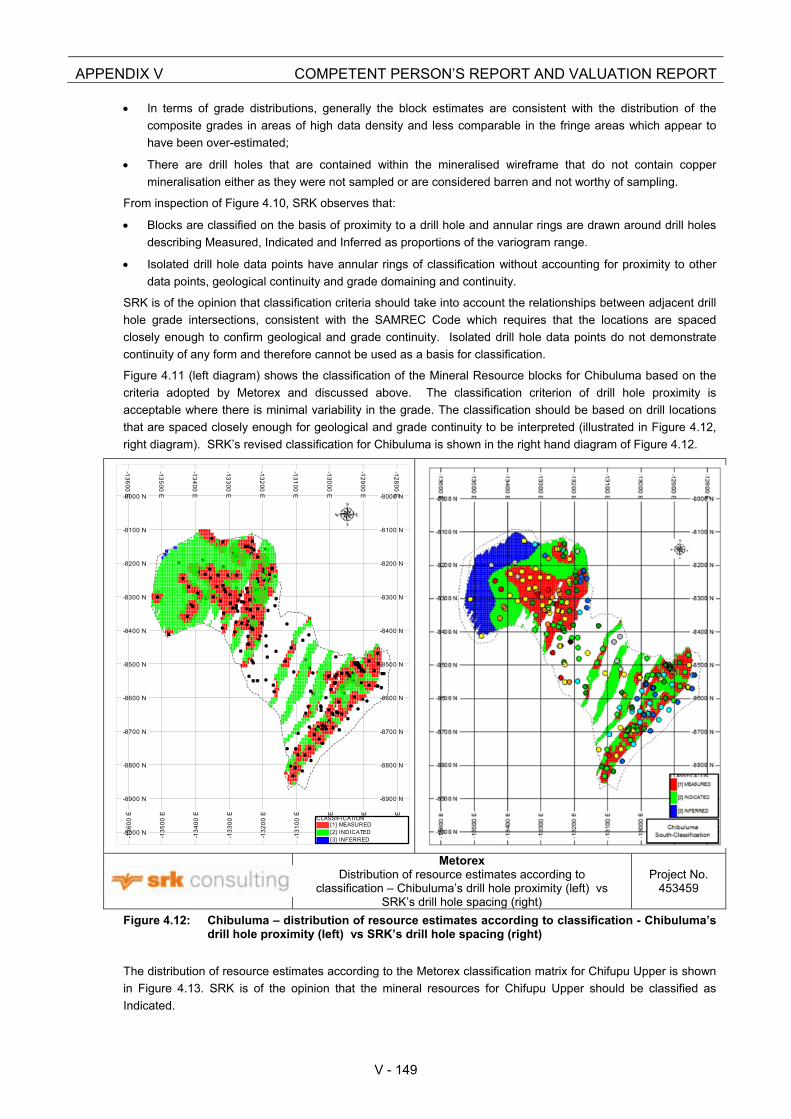
Figure 4.11 (left diagram) shows the classification of the Mineral Resource blocks for Chibuluma based on the
criteria adopted by Metorex and discussed above. The classification criterion of drill hole proximity is
acceptable where there is minimal variability in the grade. The classification should be based on drill locations
that are spaced closely enough for geological and grade continuity to be interpreted (illustrated in Figure 4.12,
right diagram). SRK’s revised classification for Chibuluma is shown in the right hand diagram of Figure 4.12.
MetorexDistribution of resource estimates according to
classification – Chibuluma’s drill hole proximity (left) vs SRK’s drill hole spacing (right)
Project No. 453459
Figure 4.12: Chibuluma – distribution of resource estimates according to classification - Chibuluma’s drill hole proximity (left) vs SRK’s drill hole spacing (right)
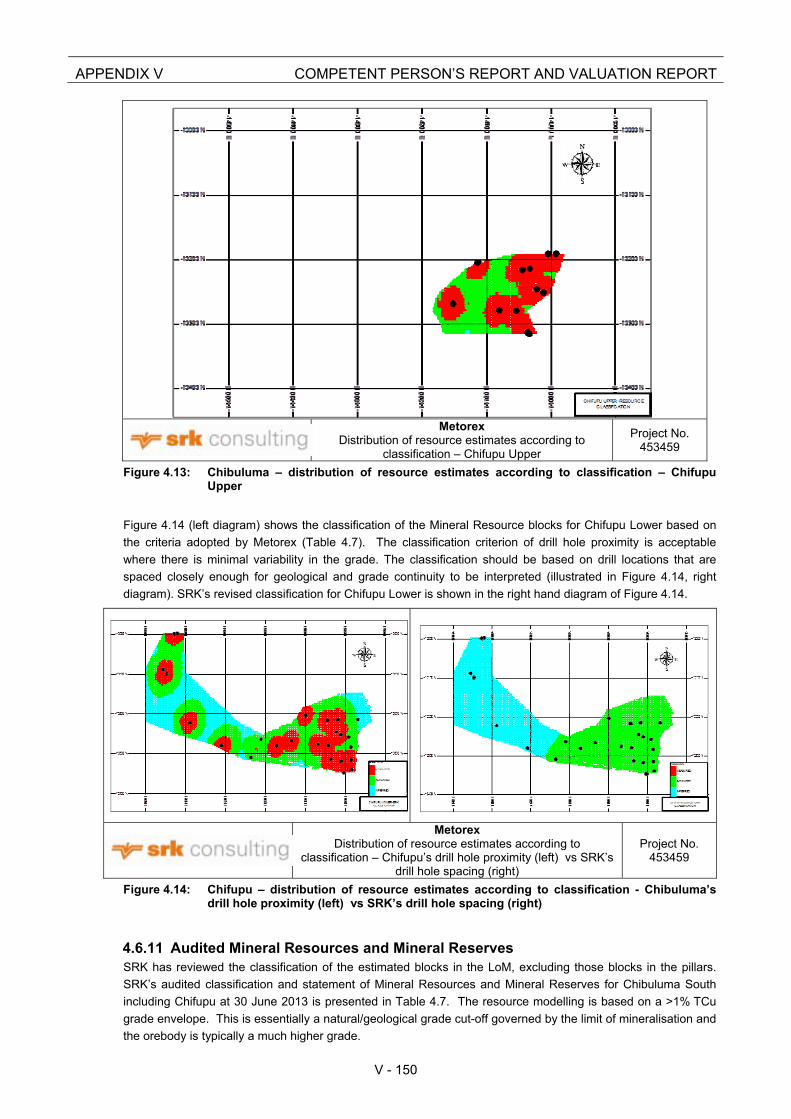
The distribution of resource estimates according to the Metorex classification matrix for Chifupu Upper is shown
in Figure 4.13. SRK is of the opinion that the mineral resources for Chifupu Upper should be classified as
Indicated.
-1
36
00
E
-13
60
0 E
-1
35
00
E
-13
50
0 E
-1
34
00
E
-13
40
0 E
-1
33
00
E
-13
30
0 E
-1
32
00
E
-13
20
0 E
-1
31
00
E
-13
10
0 E
-1
30
00
E
-13
00
0 E
-1
29
00
E
-12
90
0 E
-1
28
00
E
-12
80
0 E
-9000 N -9000 N
-8900 N -8900 N
-8800 N -8800 N
-8700 N -8700 N
-8600 N -8600 N
-8500 N -8500 N
-8400 N -8400 N
-8300 N -8300 N
-8200 N -8200 N
-8100 N -8100 N
-8000 N -8000 N
CLASSIFICATION[1] MEASURED[2] INDICATED[3] INFERRED
APPENDIX V COMPETENT PERSON’S REPORT AND VALUATION REPORT
V - 150
MetorexDistribution of resource estimates according to
classification – Chifupu Upper
Project No. 453459
Figure 4.13: Chibuluma – distribution of resource estimates according to classification – Chifupu Upper
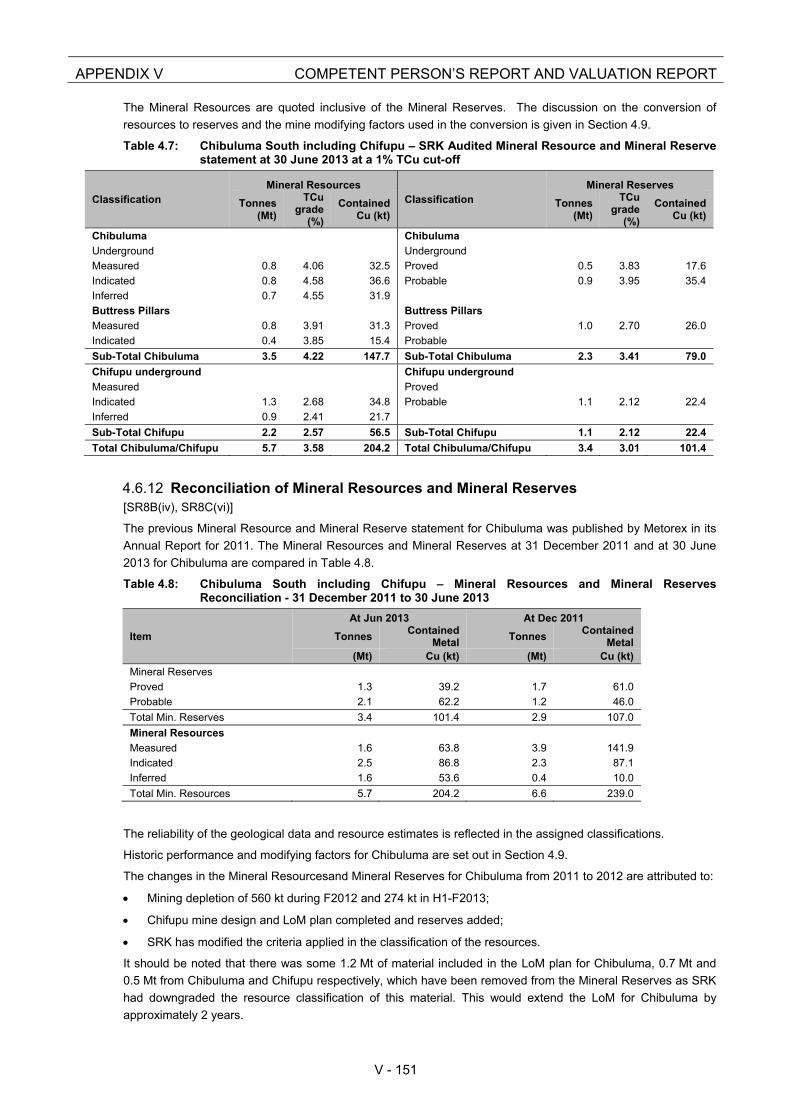
Figure 4.14 (left diagram) shows the classification of the Mineral Resource blocks for Chifupu Lower based on
the criteria adopted by Metorex (Table 4.7). The classification criterion of drill hole proximity is acceptable
where there is minimal variability in the grade. The classification should be based on drill locations that are
spaced closely enough for geological and grade continuity to be interpreted (illustrated in Figure 4.14, right
diagram). SRK’s revised classification for Chifupu Lower is shown in the right hand diagram of Figure 4.14.
MetorexDistribution of resource estimates according to
classification – Chifupu’s drill hole proximity (left) vs SRK’s drill hole spacing (right)
Project No. 453459
Figure 4.14: Chifupu – distribution of resource estimates according to classification - Chibuluma’s drill hole proximity (left) vs SRK’s drill hole spacing (right)
4.6.11 Audited Mineral Resources and Mineral Reserves SRK has reviewed the classification of the estimated blocks in the LoM, excluding those blocks in the pillars.
SRK’s audited classification and statement of Mineral Resources and Mineral Reserves for Chibuluma South
including Chifupu at 30 June 2013 is presented in Table 4.7. The resource modelling is based on a >1% TCu
grade envelope. This is essentially a natural/geological grade cut-off governed by the limit of mineralisation and
the orebody is typically a much higher grade.
APPENDIX V COMPETENT PERSON’S REPORT AND VALUATION REPORT
V - 151
The Mineral Resources are quoted inclusive of the Mineral Reserves. The discussion on the conversion of
resources to reserves and the mine modifying factors used in the conversion is given in Section 4.9.
Table 4.7: Chibuluma South including Chifupu – SRK Audited Mineral Resource and Mineral Reserve statement at 30 June 2013 at a 1% TCu cut-off
Classification Mineral Resources
Classification Mineral Reserves
Tonnes (Mt)
TCu grade
(%)
Contained Cu (kt)
Tonnes (Mt)
TCu grade
(%)
Contained Cu (kt)
Chibuluma Chibuluma
Underground Underground
Measured 0.8 4.06 32.5 Proved 0.5 3.83 17.6
Indicated 0.8 4.58 36.6 Probable 0.9 3.95 35.4
Inferred 0.7 4.55 31.9
Buttress Pillars Buttress Pillars
Measured 0.8 3.91 31.3 Proved 1.0 2.70 26.0
Indicated 0.4 3.85 15.4 Probable
Sub-Total Chibuluma 3.5 4.22 147.7 Sub-Total Chibuluma 2.3 3.41 79.0
Chifupu underground Chifupu underground
Measured Proved
Indicated 1.3 2.68 34.8 Probable 1.1 2.12 22.4
Inferred 0.9 2.41 21.7
Sub-Total Chifupu 2.2 2.57 56.5 Sub-Total Chifupu 1.1 2.12 22.4
Total Chibuluma/Chifupu 5.7 3.58 204.2 Total Chibuluma/Chifupu 3.4 3.01 101.4
4.6.12 Reconciliation of Mineral Resources and Mineral Reserves [SR8B(iv), SR8C(vi)]
The previous Mineral Resource and Mineral Reserve statement for Chibuluma was published by Metorex in its
Annual Report for 2011. The Mineral Resources and Mineral Reserves at 31 December 2011 and at 30 June
2013 for Chibuluma are compared in Table 4.8.
Table 4.8: Chibuluma South including Chifupu – Mineral Resources and Mineral Reserves Reconciliation - 31 December 2011 to 30 June 2013
Item
At Jun 2013 At Dec 2011
TonnesContained
MetalTonnes
Contained Metal
(Mt) Cu (kt) (Mt) Cu (kt)
Mineral Reserves
Proved 1.3 39.2 1.7 61.0
Probable 2.1 62.2 1.2 46.0
Total Min. Reserves 3.4 101.4 2.9 107.0
Mineral Resources
Measured 1.6 63.8 3.9 141.9
Indicated 2.5 86.8 2.3 87.1
Inferred 1.6 53.6 0.4 10.0
Total Min. Resources 5.7 204.2 6.6 239.0
The reliability of the geological data and resource estimates is reflected in the assigned classifications.
Historic performance and modifying factors for Chibuluma are set out in Section 4.9.
The changes in the Mineral Resourcesand Mineral Reserves for Chibuluma from 2011 to 2012 are attributed to:
Mining depletion of 560 kt during F2012 and 274 kt in H1-F2013;
Chifupu mine design and LoM plan completed and reserves added;
SRK has modified the criteria applied in the classification of the resources.
It should be noted that there was some 1.2 Mt of material included in the LoM plan for Chibuluma, 0.7 Mt and
0.5 Mt from Chibuluma and Chifupu respectively, which have been removed from the Mineral Reserves as SRK
had downgraded the resource classification of this material. This would extend the LoM for Chibuluma by
approximately 2 years.
APPENDIX V COMPETENT PERSON’S REPORT AND VALUATION REPORT
V - 152
4.7 Rock Engineering [SR5.4]
4.7.1 Geotechnical considerations The general rock mass is highly weathered from surface to a depth of approximately 80 m. Above the orebody
hangingwall, a competent amphibolite sill is present. The immediate hangingwall comprises calcareous
sandstone to the north grading into a generally weaker argillite to the south. The orebody comprises quartzite,
gritstone and conglomerate layers and, generally, is competent. The competent footwall consisting of siliceous
and micaceous quartzites, grits and conglomerates hosts most of the development infrastructure.
The mining sequence is planned not to expose hanging wall argillite during ore body development. During
stoping, the drill sequence is designed to leave a skin of ore, 0.5 m thick, against the argillite to maintain a
competent hanging wall and reduce the risk of waste dilution.
Rock strength results obtained from laboratory testing are variable, but indicate that the orebody, footwall and
basement rocks are generally strong with a uniaxial compressive strength of greater than 150 MPa. Three
prominent, steep dipping joint sets (including the bedding) and a fourth random joint set have been identified.
This structure creates a blocky rock mass and support systems have been designed using a combination of
structural information and experience to reduce the potential for hanging wall and sidewall failures.
The near surface weathered zone forms an aquifer. Water occurs locally in the hangingwall (Upper Roan) and
to a lesser extent in the fracture and joint systems of the immediate hangingwall, orebody and footwall
quartzites. Dewatering has been undertaken by extending underground exploration holes into the hangingwall in
areas where water has been encountered on an upper level. The majority of water encountered underground
derives from short and long term drainage of backfilled stopes. The majority of water encountered underground
derives from short and long term drainage of backfilled stopes.
Regional support for the Long Hole Stoping (“LHS”) method consists of 4.5 m wide rib pillars, oriented along dip
and spaced 11.5 m apart along strike (skin to skin spacing). Within any stope a pillar is over 11 m high with a
height to width ratio of less than 0.4. After loading of ore, stopes are backfilled using cyclone classified tailings
which provides lateral support to the pillars. The rib pillars are formed within each cut and superimposed on the
previously formed pillars.
A critical element of the LHS method involves providing support to pillars by introducing backfill into stopes as
soon as ore extraction has been completed. Cyclone Classified Tailings (“CCT”) form the primary backfill
product, which is reported to drain very efficiently and provide early support to the pillars. Bulkheads are
constructed using an innovative geotextile bag system. CCT is supplemented by development waste when
available.
Buttress pillars used previously in the cut and fill method will not be incorporated into the LHS method below
432mL.
The stope back within the 11.5 m wide rooms is supported with split sets to ensure the safety of personnel
working in these excavations. No major rockfalls have been experienced, while this practice has been followed.
A number of rockfall incidents that have resulted in minor equipment damage and injury to two personnel, have
been reported since January 2013. Currently Chibuluma has implemented a rockfall awareness campaign and
is actively reviewing all support standards.
The LHS method is appropriate at the current depths, but may need to be modified for greater depth to cater for
increased stress levels.
The portal for the primary access ramp has been constructed from the existing pit highwall, through highly
weathered ground. This section of the ramp is well supported with steel sets, concreted timber shuttering and
does not exhibit any significant deterioration. Mesh support has been installed on the highwall above the portal.
Subsidence monitoring of the highwall above the portal is carried out. Split sets, which have been installed in
the granitic footwall rocks of the 5 m-wide decline, generally are effective in controlling the blocky rock mass.
The split set faceplates are monitored for signs of deterioration and indications of anomalous rock loading.
There have been minor rock falls in the decline ramp primarily associated with weathered ground and faulting.
More recently a pattern of grouted rebar has been introduced in all long term excavations. Providing the quality
of the grouting is controlled, this system will be more effective than split set support in the long term. The need
for quality control has been identified and is being addressed.
APPENDIX V COMPETENT PERSON’S REPORT AND VALUATION REPORT
V - 153
Support and layout designs have been carried out by AMC in April 2006, June 2007 and December 2008. The
2006 design incorporates a wedge analysis for development excavations at various orientations, stope stability
analysis using the Matthews/Potvin Stability Graph method and an empirical pillar analysis. SRK concurred
with the conclusions and recommendations drawn from this analysis in an Independent Engineer’s Report dated
8 November 2007. The design covers the current shallow portion of the orebody adequately. Support standards
were drawn up taking into consideration the recommendations from the report. Additional support is installed on
an ad-hoc basis where necessitated by local variations in ground conditions.
An in-house rock engineering service is available at Chibuluma South mine. Strata control functions are
addressed on an on-going basis by in-house strata control and production staff, while rock engineering services
are provided on a regular basis by external rock engineering consultants. This level of rock engineering
services and input to mine planning and operation is considered adequate for this operation.
The 2008 report completed by AMC covers the re-evaluation of anticipated mining induced stresses using
numerical modelling as well as physical rock mechanics aspects observed underground. The conclusions led to
the revision of support recommendations and advice on optimising future mine planning.
The mining induced stresses used the 2008 report were calculated using the Examin Tab, a RocScience
computer modelling program. The Hoek-Brown failure criterion was used for pillar evaluation. The analysis
showed an increase in pillar stress as mining progressed and when panels between buttress pillars are
completely mined out. The model assumed 4 m pillars and 14 m stopes. The current support standard for
panels was also evaluated using the Phase2D RocScience program. This support incorporates 2.4 m split-sets
at 1.5 by 1.5 m grid pattern as primary support and later with 6 m Swellex and 9 m hydrabolts at 1.5 m and
4.5 m on either side of the centre line of intersections.
It is presumed that the change to the LHS system will largely eliminate the risk associated with highly stressed
buttress pillars. Closure of mining faces against the 432mL buttress pillar and abutments will however remain a
risk.
No modelling of the revised LHS layout has been undertaken. In SRK’s opinion, this exercise should be carried
out to assist with understanding the interaction between mining faces, abutments and the 432mL buttress pillar
and to identify any areas which may require additional support or a variation to the routine layout.
Development of the decline shaft system to access the Chifupu deposit has commenced with excavation of the
box cut. A design for side and back wall slopes has been prepared and compared with slopes existing in the
South Mine box cut.
Geological exploration has indicated that strata within the ore body sequence are similar to those encountered
at South Mine. It can reasonably be expected that, for application of LHS, mining conditions will be similar to
those experienced at South Mine.
4.7.2 SRK Comments [SR6C]
The LHS method is appropriate at the current depths, but may need minor modifications at greater depth to
cater for increased stress levels. Modelling of the revised LHS layout should be undertaken to examine the
interaction between mining faces, abutments and buttress pillars and identify where support layouts may need
to be changed.
The level of rock engineering services and input to mine planning and operation is considered by SRK to be
adequate for Chibuluma.
SRK concludes that the LHS method is feasible in the prevailing mining environment. Detailed planning is
essential to ensure that production and backfilling targets are achieved as the LHS method is implemented on a
wider scale.
APPENDIX V COMPETENT PERSON’S REPORT AND VALUATION REPORT
V - 154
4.8 Hydrogeology and Hydrology [SR5.4]
The comments which follow are based on a review of a CPR compiled by Metorex in 2010 and any additional
hydrogeological data that may have been collected since that report. This review also aims to identify the most
significant risks to ground and surface water, given the available data. No site visit was conducted as part of
the hydrogeological review.
4.8.1 Baseline description
Surface Water
For Chibuluma South raw water is obtained from water pumped to surface and potable water is abstracted from
the Kalulushi Stream.
Groundwater
Hydrogeological Units – Besides stating that “the near surface weathered zone forms an aquifer” and
“water occurs locally in the hybrid rocks and sporadic dolomites in the hangwall (Upper Roan) and to a
lesser extent in the fracture and joint systems of the immediate hangingwall, orebody and footwall
quartzites”, no detailed description is given of the hydrogeological units.
Groundwater Use - As far as could be ascertained from available data, no hydrocensus has been
conducted around the Mine to capture information on existing drill holes, springs, dugwells, etc. The radius
of the hydrocensus should be determined from the predicted radius of influence of both mine dewatering
(water level drawdown) and groundwater contamination. Similarly, no numerical or hydrochemical
modelling has been done to determine the predicted cone of dewatering or potential impact of
contaminated groundwater (if any) on surrounding communities.
Groundwater levels and flow directions - No groundwater contour map that indicates the groundwater
flow directions could be found in the data provided to SRK.
Recharge - No data available.
Water use and supply - Chibuluma has built a water tank at a local village (Chief Nkana’s village), and
installed drill holes and hand pumps at the school and in the nearly communities.
The report further states that the process plant and underground section uses 4 000 m3 of water per day,
which is supplied from a stream 3 km from the mine. Service water for the process plant is available from
the clear water dam on surface (supplied from the underground section).
Water Quality
A report by Metorex, dated January 2010 notes the following:
Mining activities at Chibuluma South have the potential of polluting ground water;
Pollutants released on surface can impact on groundwater.
Monitoring boreholes have been positioned both upstream and downstream of the site in order to monitor
pollutants spreading from the site. Ground water monitoring at the mine is a commitment in the Chibuluma
South Mine Environmental Management Plan of April 2009;
Monitoring of the ground water should, ideally, continue even after closure of the mine.
AMC issued a report in 2012, in which sampling of standing pools in the stockpile area and different depths in
Shaft 3 and 4 were done. Based on this work they state that the Co-concentrate is the obvious source of
pollution of surface water, the underlying soils and most probably the underlying groundwater aquifer. AMC has
therefore identified the stockpile area as a source of historical pollution. They note that all contaminated soil or
waste rock samples have significant potential to generate acidic drainage with no or a very low neutralisation
potential and the storage and release of acidity by secondary minerals can cause acid drainage to continue
even after sulphides are depleted. The status of the groundwater in the area was not determined, but AMC
expected that any receptor of seepage would be impacted upon. In their conclusions they predicted that the site
would be unfit for residential or commercial use as it might pose serious health risks to humans even if the
surface contamination is removed.
In March 2013 eight water samples were collected by Metorex and sent to Alfred H Knight laboratory for
analysis. No comparisons against any standards were shown on the laboratory results. Since this is a once off
APPENDIX V COMPETENT PERSON’S REPORT AND VALUATION REPORT
V - 155
sample run and is not linked to any assessment of possible receptors it should not be used as an indication of
potential risks and liabilities.
4.8.2 Groundwater Model There is no evidence of conceptual and/or numerical groundwater models for the mine.
Surface water and groundwater monitoring have been identified by Metorex as necessary and which must be
implemented. Although water samples are being collected by Metorex, no information was supplied to SRK to
confirm whether a formal groundwater and surface water programme has been developed.
4.8.3 Legal Framework The following licences related to water and waste, as required by Section 3.1.3 of the environmental
authorisation, are in place:
The Waste Management (licensing of Transporters of Waste and Waste Disposal Site) Regulations, 1993;
The Hazardous Waste Management Regulations, Statutory Instrument No 125 of 2001;
Pollution Control Regulations, 1994 (Pesticides and Toxic Substances); and
The Water Pollution (Effluent and Waste Water) Regulations 1993 - license to discharge effluent
(Regulation 5).
4.8.4 Risks to Surface and Groundwater Chibuluma has water monitoring drill holes and monitors groundwater quality on a monthly basis. This is done
internally, and no external report could be made available at the time of the site visit and assessment of trends
could not be done. SRK understands external checking of monitoring and assessment of trends is now to be
implemented, and included as a module in the mine’s Environmental Management System. In addition, Metorex
reports that external consultants have been commissioned to investigate the potential for Acid Mine Drainage
(“AMD”) and initial results indicate that there is a potential for AMD but that, post closure, the impact of this
could be negated by rapid inflows of water.
Groundwater contamination at Chibuluma West can be expected, given soil contamination and seepage from
the tailings dam that has been detected. The extent of this has not been quantified but ground water monitoring
is taking place. Due to the nature of the sulphide ore mined, AMD can be expected.
Five monitoring drill holes were drilled upstream and downstream of the tailings dam at Chibuluma South.
Concern was raised over possible groundwater contamination that may affect Kaputula Village, which is located
approximately 500 m from the tailings dam. According to Metorex, arrangements are in place for people
potentially affected by this to be moved.
Dewatering of the underground operations is being done at present. There is no indication in the information
provided what the impact this may have on drawdown and other water users.
4.9 Mining Engineering [SR5.4]
4.9.1 Introduction Chibuluma
Chibuluma South mine commenced underground mining operations in 2005. The mine reached a production
rate of 40 ktpm by June 2007 and has been operating since then at a production rate of between 45 ktpm and
50 ktpm. The mine is designed for use of trackless mechanised equipment for development, stoping and rock
handling including hauling ore to surface. Equipment sizing is matched to the development dimensions. The
ADT and Load Haul and Dump (“LHD”) units are diesel powered, while the drill rigs are electro-hydraulically
powered.
Secondary mining equipment includes the following items:
Long hole hydro-power drill rig for drop raising of vertical development ends; and
Mobile hydraulic rock breaker.
Pumping of dirty water to surface is via four Warman dirty water pumps with two dedicated pump columns.
Underground ventilation is affected by three main axial fans located on surface.
APPENDIX V COMPETENT PERSON’S REPORT AND VALUATION REPORT
V - 156
Ongoing LoM planning is carried out as part of an annual planning cycle. Short term planning is carried out
on-mine and monitored to ensure adherence to a strict mining echelon. On site discussions revealed that
planning meetings are held monthly with planning and production staff in attendance. The mine plan is
generated by the planning department and is then agreed to and signed by all present. SRK considers this to
be a sound process.
LoM planning is based on a detailed 3-dimensional mine design with Gantt chart schedule. Chibuluma South
mine uses Gemcom Surpac Version 6.1.3 software for all geological modelling and mine design, and the
Minesched module for scheduling requirements.
Chifupu
The Chifupu deposit is located about 1.7 km south of Chibuluma. The deposit consists of two orebodies
separated by a 23 m thick waste parting or barren quartzite. The ore bodies dip at approximately 40° with
average thicknesses of 9 m and 15 m for the footwall and hangingwall ore bodies respectively.
The Chibuluma Mine Planning Department completed a feasibility study on the deposit in order for production
from there to supplement tonnage from Chibuluma as Chibuluma nears the end of its life, currently planned for
2021, when the crown pillar is extracted. Development of a decline at Chifupu is planned to commence in the
fourth quarter of 2013, with stoping commencing in 2015.
Sound Mining Solution (Pty) Ltd (“SMS”) reviewed the Chifupu feasibility study (a copy of which was provided to
SRK) and submitted a report entitled “Chifupu Project Review” to Metorex in June 2012. SRK has considered
two subsequent reports, “Chifupu Project - Technical Review Report”, SMS Report SMS/081/13, March 2013
and “Chifupu Project - Board Document Notes”, March 2013” in the compilation of this CPVR.
4.9.2 Access Chibuluma
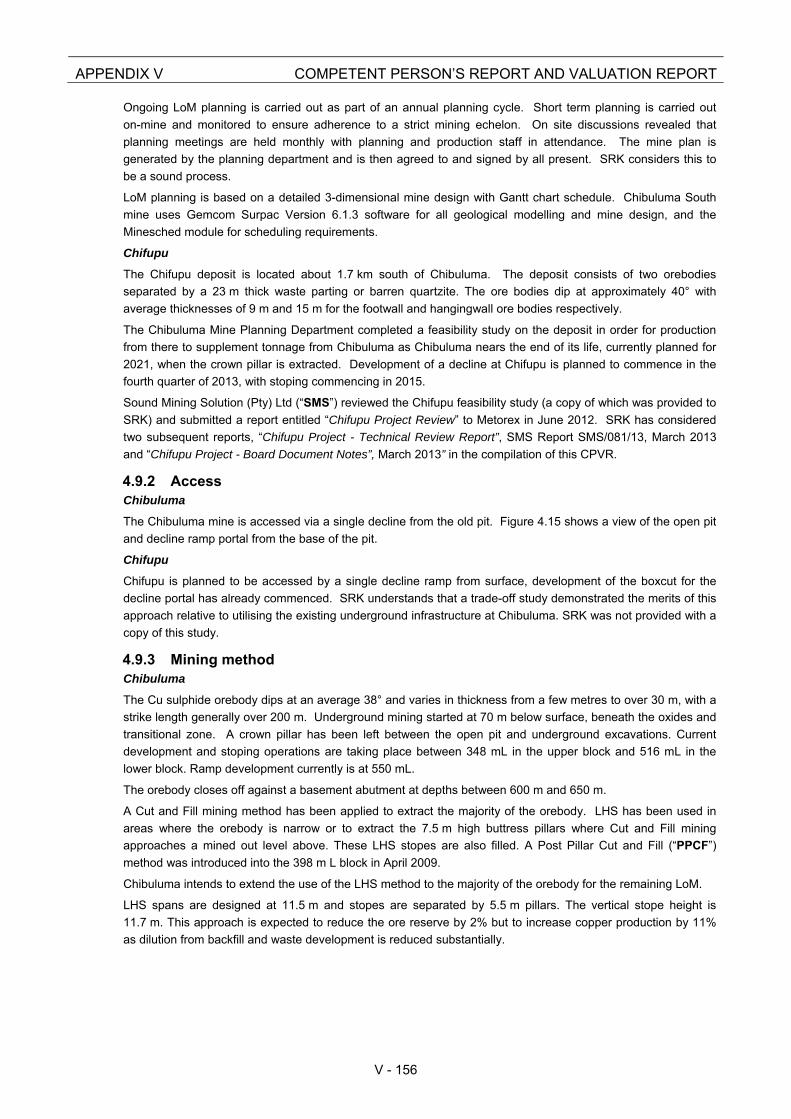
The Chibuluma mine is accessed via a single decline from the old pit. Figure 4.15 shows a view of the open pit
and decline ramp portal from the base of the pit.
Chifupu
Chifupu is planned to be accessed by a single decline ramp from surface, development of the boxcut for the
decline portal has already commenced. SRK understands that a trade-off study demonstrated the merits of this
approach relative to utilising the existing underground infrastructure at Chibuluma. SRK was not provided with a
copy of this study.
4.9.3 Mining method Chibuluma
The Cu sulphide orebody dips at an average 38° and varies in thickness from a few metres to over 30 m, with a
strike length generally over 200 m. Underground mining started at 70 m below surface, beneath the oxides and
transitional zone. A crown pillar has been left between the open pit and underground excavations. Current
development and stoping operations are taking place between 348 mL in the upper block and 516 mL in the
lower block. Ramp development currently is at 550 mL.
The orebody closes off against a basement abutment at depths between 600 m and 650 m.
A Cut and Fill mining method has been applied to extract the majority of the orebody. LHS has been used in
areas where the orebody is narrow or to extract the 7.5 m high buttress pillars where Cut and Fill mining
approaches a mined out level above. These LHS stopes are also filled. A Post Pillar Cut and Fill (“PPCF”)
method was introduced into the 398 m L block in April 2009.
Chibuluma intends to extend the use of the LHS method to the majority of the orebody for the remaining LoM.
LHS spans are designed at 11.5 m and stopes are separated by 5.5 m pillars. The vertical stope height is
11.7 m. This approach is expected to reduce the ore reserve by 2% but to increase copper production by 11%
as dilution from backfill and waste development is reduced substantially.
APPENDIX V COMPETENT PERSON’S REPORT AND VALUATION REPORT
V - 157
MetorexChibuluma South Mine – the Chibuluma South pit
showing the ramp decline portal
Project No. 453459
Figure 4.15: Chibuluma South Mine – the Chibuluma South pit showing the ramp decline portal
SRK reviewed a comprehensive report detailing the LHS method prepared by Chibuluma, which included
recommendations to further increase confidence in the method as follows:
additional numerical modelling of the layout and mining sequence to investigate stress changes on the
centre access cross cuts;
careful consideration of backfill sequencing and reticulation system requirements;
further review of stope drilling layouts and blast designs to confirm their practicality and to minimise blast
induced damage to rib pillars and stope backs.
SRK concludes that the LHS method has been trialled sufficiently and is feasible in the prevailing mining
environment. Detailed planning is essential to ensure that production targets are achieved as the LHS method is
implemented on a wider scale.
The PPCF method was selected on account of depth and resultant stress, width of orebody, availability of
mining faces, pillar width-height ratio and extraction factor. The design for the method is 10.5 m wide rooms
and 5.5 m pillars, and 5 m wide drives through pillars.
The orebody is mined in 40 m vertical sections as soon as they become available. Mining takes place from the
bottom up, while development is from the top down.
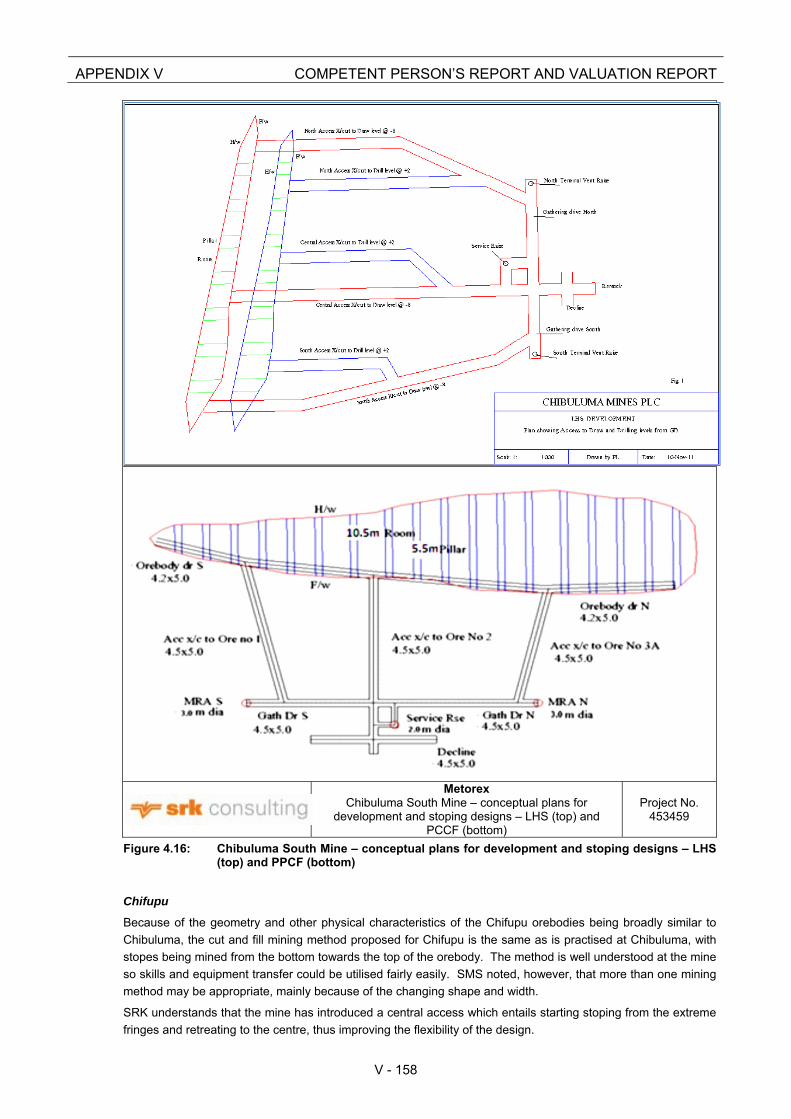
Typical LHS and PPCF layouts are compared in plan (Figure 4.16) and section (Figure 4.17).
APPENDIX V COMPETENT PERSON’S REPORT AND VALUATION REPORT
V - 158
Metorex
Chibuluma South Mine – conceptual plans for development and stoping designs – LHS (top) and
PCCF (bottom)
Project No. 453459
Figure 4.16: Chibuluma South Mine – conceptual plans for development and stoping designs – LHS (top) and PPCF (bottom)
Chifupu
Because of the geometry and other physical characteristics of the Chifupu orebodies being broadly similar to
Chibuluma, the cut and fill mining method proposed for Chifupu is the same as is practised at Chibuluma, with
stopes being mined from the bottom towards the top of the orebody. The method is well understood at the mine
so skills and equipment transfer could be utilised fairly easily. SMS noted, however, that more than one mining
method may be appropriate, mainly because of the changing shape and width.
SRK understands that the mine has introduced a central access which entails starting stoping from the extreme
fringes and retreating to the centre, thus improving the flexibility of the design.
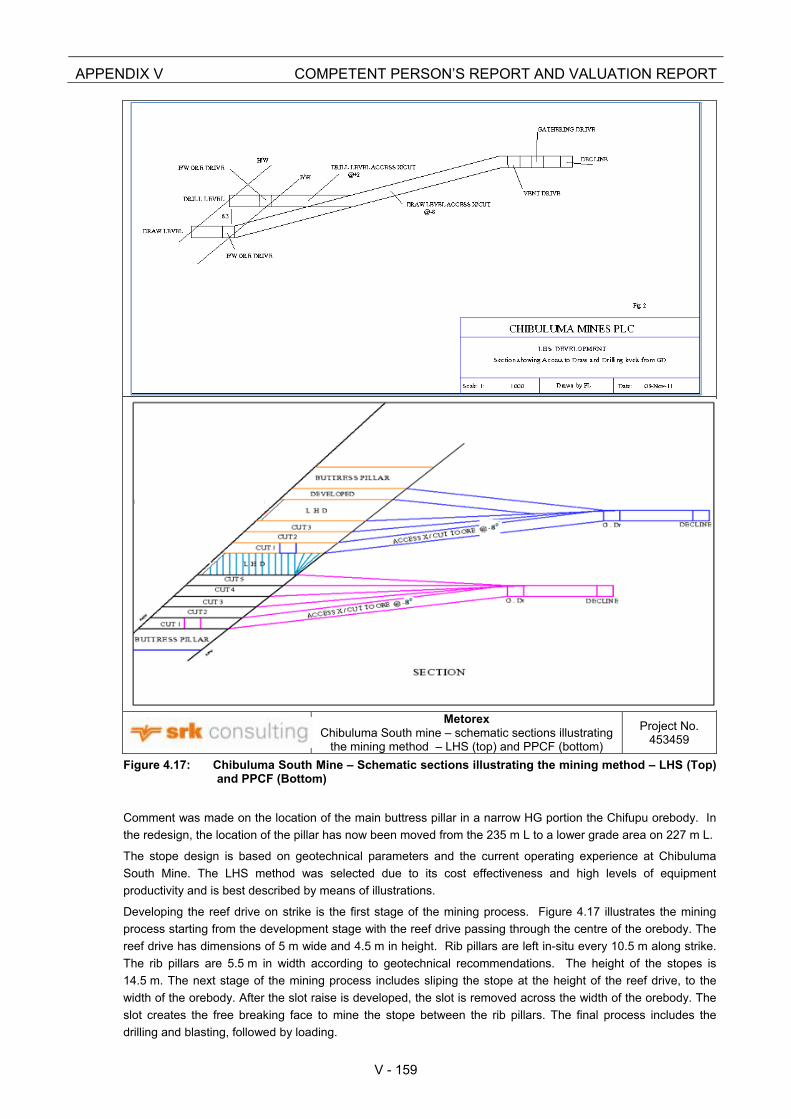
APPENDIX V COMPETENT PERSON’S REPORT AND VALUATION REPORT
V - 159
MetorexChibuluma South mine – schematic sections illustrating
the mining method – LHS (top) and PPCF (bottom)
Project No. 453459
Figure 4.17: Chibuluma South Mine – Schematic sections illustrating the mining method – LHS (Top) and PPCF (Bottom)
Comment was made on the location of the main buttress pillar in a narrow HG portion the Chifupu orebody. In
the redesign, the location of the pillar has now been moved from the 235 m L to a lower grade area on 227 m L.
The stope design is based on geotechnical parameters and the current operating experience at Chibuluma
South Mine. The LHS method was selected due to its cost effectiveness and high levels of equipment
productivity and is best described by means of illustrations.
Developing the reef drive on strike is the first stage of the mining process. Figure 4.17 illustrates the mining
process starting from the development stage with the reef drive passing through the centre of the orebody. The
reef drive has dimensions of 5 m wide and 4.5 m in height. Rib pillars are left in-situ every 10.5 m along strike.
The rib pillars are 5.5 m in width according to geotechnical recommendations. The height of the stopes is
14.5 m. The next stage of the mining process includes sliping the stope at the height of the reef drive, to the
width of the orebody. After the slot raise is developed, the slot is removed across the width of the orebody. The
slot creates the free breaking face to mine the stope between the rib pillars. The final process includes the
drilling and blasting, followed by loading.
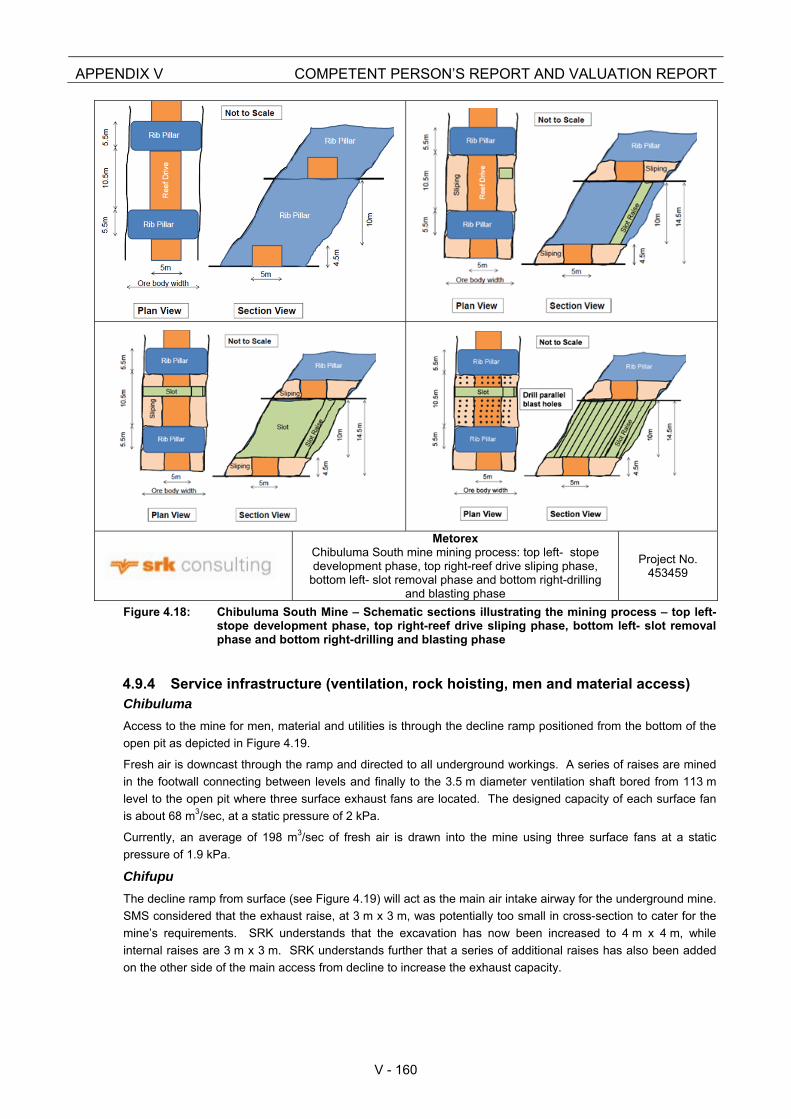
APPENDIX V COMPETENT PERSON’S REPORT AND VALUATION REPORT
V - 160
MetorexChibuluma South mine mining process: top left- stope development phase, top right-reef drive sliping phase,
bottom left- slot removal phase and bottom right-drilling and blasting phase
Project No. 453459
Figure 4.18: Chibuluma South Mine – Schematic sections illustrating the mining process – top left- stope development phase, top right-reef drive sliping phase, bottom left- slot removal phase and bottom right-drilling and blasting phase
4.9.4 Service infrastructure (ventilation, rock hoisting, men and material access) Chibuluma
Access to the mine for men, material and utilities is through the decline ramp positioned from the bottom of the
open pit as depicted in Figure 4.19.
Fresh air is downcast through the ramp and directed to all underground workings. A series of raises are mined
in the footwall connecting between levels and finally to the 3.5 m diameter ventilation shaft bored from 113 m
level to the open pit where three surface exhaust fans are located. The designed capacity of each surface fan
is about 68 m3/sec, at a static pressure of 2 kPa.
Currently, an average of 198 m3/sec of fresh air is drawn into the mine using three surface fans at a static
pressure of 1.9 kPa.
Chifupu
The decline ramp from surface (see Figure 4.19) will act as the main air intake airway for the underground mine.
SMS considered that the exhaust raise, at 3 m x 3 m, was potentially too small in cross-section to cater for the
mine’s requirements. SRK understands that the excavation has now been increased to 4 m x 4 m, while
internal raises are 3 m x 3 m. SRK understands further that a series of additional raises has also been added
on the other side of the main access from decline to increase the exhaust capacity.
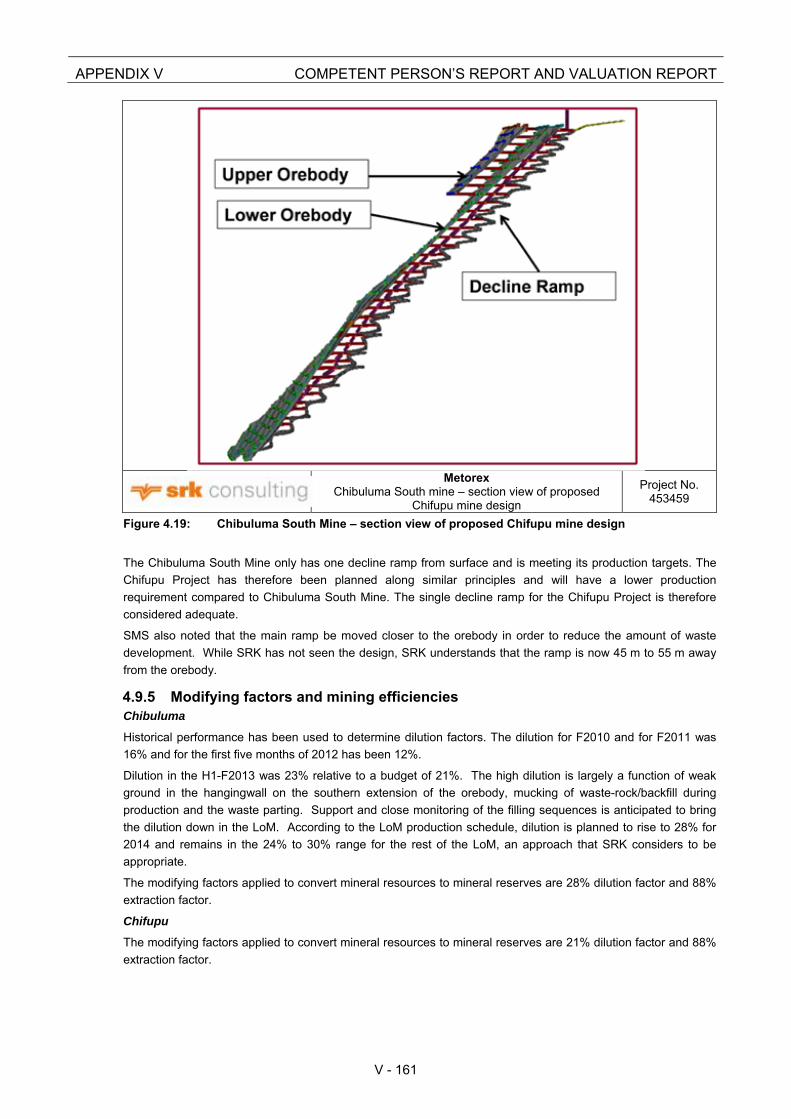
APPENDIX V COMPETENT PERSON’S REPORT AND VALUATION REPORT
V - 161
MetorexChibuluma South mine – section view of proposed
Chifupu mine design
Project No. 453459
Figure 4.19: Chibuluma South Mine – section view of proposed Chifupu mine design
The Chibuluma South Mine only has one decline ramp from surface and is meeting its production targets. The
Chifupu Project has therefore been planned along similar principles and will have a lower production
requirement compared to Chibuluma South Mine. The single decline ramp for the Chifupu Project is therefore
considered adequate.
SMS also noted that the main ramp be moved closer to the orebody in order to reduce the amount of waste
development. While SRK has not seen the design, SRK understands that the ramp is now 45 m to 55 m away
from the orebody.
4.9.5 Modifying factors and mining efficiencies Chibuluma
Historical performance has been used to determine dilution factors. The dilution for F2010 and for F2011 was
16% and for the first five months of 2012 has been 12%.
Dilution in the H1-F2013 was 23% relative to a budget of 21%. The high dilution is largely a function of weak
ground in the hangingwall on the southern extension of the orebody, mucking of waste-rock/backfill during
production and the waste parting. Support and close monitoring of the filling sequences is anticipated to bring
the dilution down in the LoM. According to the LoM production schedule, dilution is planned to rise to 28% for
2014 and remains in the 24% to 30% range for the rest of the LoM, an approach that SRK considers to be
appropriate.
The modifying factors applied to convert mineral resources to mineral reserves are 28% dilution factor and 88%
extraction factor.
Chifupu
The modifying factors applied to convert mineral resources to mineral reserves are 21% dilution factor and 88%
extraction factor.
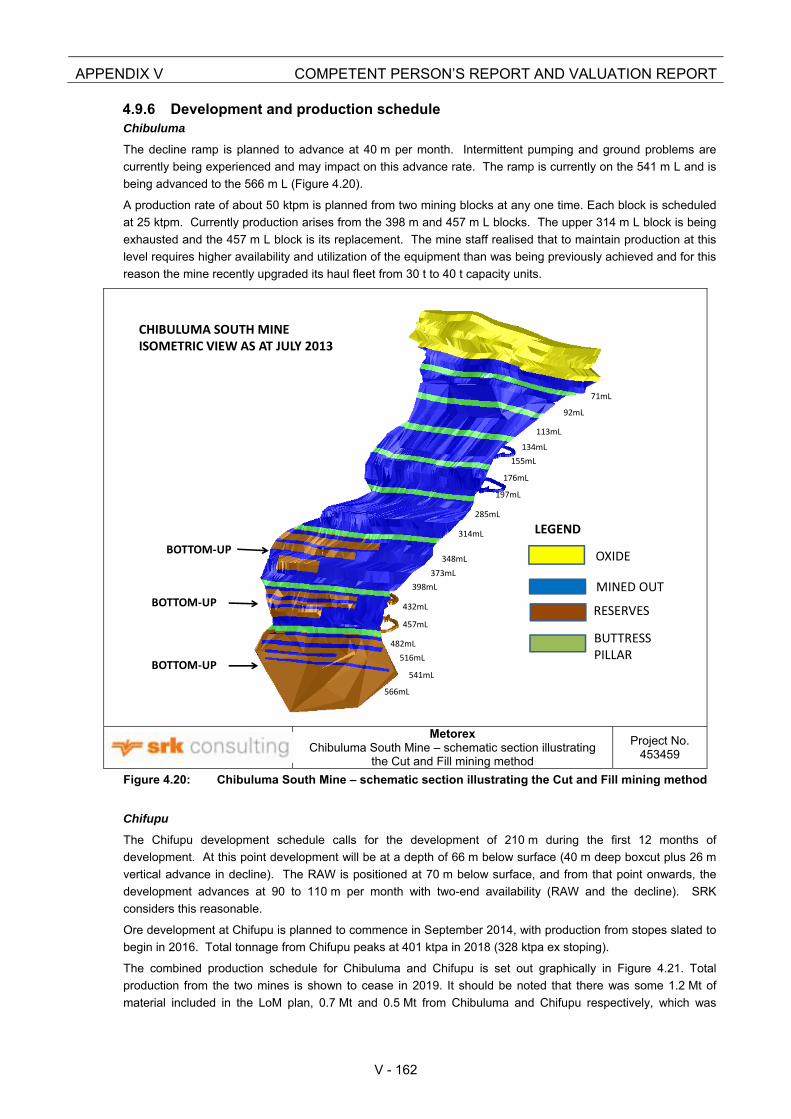
APPENDIX V COMPETENT PERSON’S REPORT AND VALUATION REPORT
V - 162
4.9.6 Development and production schedule Chibuluma
The decline ramp is planned to advance at 40 m per month. Intermittent pumping and ground problems are
currently being experienced and may impact on this advance rate. The ramp is currently on the 541 m L and is
being advanced to the 566 m L (Figure 4.20).
A production rate of about 50 ktpm is planned from two mining blocks at any one time. Each block is scheduled
at 25 ktpm. Currently production arises from the 398 m and 457 m L blocks. The upper 314 m L block is being
exhausted and the 457 m L block is its replacement. The mine staff realised that to maintain production at this
level requires higher availability and utilization of the equipment than was being previously achieved and for this
reason the mine recently upgraded its haul fleet from 30 t to 40 t capacity units.
MetorexChibuluma South Mine – schematic section illustrating
the Cut and Fill mining method
Project No. 453459
Figure 4.20: Chibuluma South Mine – schematic section illustrating the Cut and Fill mining method
Chifupu
The Chifupu development schedule calls for the development of 210 m during the first 12 months of
development. At this point development will be at a depth of 66 m below surface (40 m deep boxcut plus 26 m
vertical advance in decline). The RAW is positioned at 70 m below surface, and from that point onwards, the
development advances at 90 to 110 m per month with two-end availability (RAW and the decline). SRK
considers this reasonable.
Ore development at Chifupu is planned to commence in September 2014, with production from stopes slated to
begin in 2016. Total tonnage from Chifupu peaks at 401 ktpa in 2018 (328 ktpa ex stoping).
The combined production schedule for Chibuluma and Chifupu is set out graphically in Figure 4.21. Total
production from the two mines is shown to cease in 2019. It should be noted that there was some 1.2 Mt of
material included in the LoM plan, 0.7 Mt and 0.5 Mt from Chibuluma and Chifupu respectively, which was
CHIBULUMA SOUTH MINEISOMETRIC VIEW AS AT JULY 2013
71mL
92mL
113mL
155mL
134mL
566mL
314mL
197mL
285mL
398mL
516mL
373mL
176mL
541mL
BOTTOM‐UP
432mL
OXIDE
BUTTRESSPILLAR
MINED OUT
RESERVES
482mL
457mL
LEGEND
348mL
BOTTOM‐UP
BOTTOM‐UP
APPENDIX V COMPETENT PERSON’S REPORT AND VALUATION REPORT
V - 163
removed from the Mineral Reserves as SRK had downgraded the resource classification of this material. This
would extend the LoM for Chibuluma by approximately 2 years.
MetorexChibuluma South Mine – combined production
schedule for Chibuluma and Chifupu
Project No. 453459
Figure 4.21: Chibuluma South Mine – combined production schedule for Chibuluma and Chifupu
The Proved and Probable Mineral Reserves of 3.4 Mt at 3.01% Cu support a 6.5-year LoM plan at a
steady-state production rate of 560 ktpa.
4.9.7 Manpower The Chibuluma manpower complement associated with mining activities consists of management and
supervision to direct and control the mining activities, production personnel, technical support services and
engineering support personnel. The total complement is approximately 227 people.
4.9.8 Capital and Operating Costs Chibuluma has provided a breakdown of the mining capital expenditure from F2013 to F2015 as set out in
Table 4.9. The capital for the decline and underground development at Chifupu in preparation for mining is
included.
Table 4.9: Chibuluma – Mining Capital Expenditure – H2-F2013 to F2015
Mining Units H2-F2013 F2014 F2015
Development (USDm) 1.97 2.85 2.85
Raise development (USDm) 0.02
U/G electrical (USDm) 0.19 0.19 0.14
Power generation (USDm) 0.01
Mining equipment (mechanized) (USDm) 3.90 8.63 5.18
Other mining projects (USDm) 0.37 2.41 0.40
Chifupu Cu project (USDm) 2.47 3.84 7.79
Total Mining (USDm) 8.92 17.93 16.36
The unit mining costs per tonne of RoM ore (excluding manpower) at Chibuluma forecast for H2-F2013 and
remainder of LoM are respectively:
Mining including Technical Services USD13.34/t USD13.73/t;
Mining engineering USD15.79/t USD15.75/t;
Transport of Chifupu ore (estimated) USD2.50/t.
APPENDIX V COMPETENT PERSON’S REPORT AND VALUATION REPORT
V - 164
The budgeted mining cost for F2013 showed a 3.1% overall increase relative to the forecast mining cost for,
F2012, which is seen to be reasonable. The budgeted mining operating costs for H2-F2013 to F2015 are set
out in Table 4.10.
Table 4.10: Chibuluma – Mining Operating Cost – H2-F2013 to F2015
Mining Costs Units H2-F2013 F2014 F2015
Production (USDm) 3.7 7.4 7.4
Technical Services (USDm) 0.0 0.3 0.3
Mechanical Engineering (USDm) 0.0 0.1 0.5
Ore transport (Chifupu) (USDm) 4.4 8.8 8.8
Salaries & wages (USDm) 3.5 6.9 6.9
Total Mining Opex (USDm) 11.7 23.5 23.9
Unit mining cost USD/t RoM 41.66 41.91 42.67
4.9.9 SRK Comments Ongoing LoM planning is carried out as part of an annual planning cycle. The short term mine plan is generated
by the planning department on the mine and is then agreed to and signed by all planning and production staff in
attendance at a monthly meeting. SRK considers this to be a sound process.
SRK concludes that the LHS method has been trialled sufficiently and is feasible in the prevailing mining
environment. Detailed planning is essential to ensure that production targets are achieved as the LHS method is
implemented on a wider scale.
The Chifupu development schedule calls for the development of 210 m during the first 12 months of
development. At this point development will be at a depth of 66 m below surface (40 m deep boxcut plus 26 m
vertical advance in decline). The RAW is positioned at 70 m below surface, and from that point onwards, the
development advances at 90 to 110 m per month with two-end availability (RAW and the decline). SRK
considers this reasonable.
4.10 Mineral Processing [SR5.5]
4.10.1 Introduction The Chibuluma concentrator was commissioned in 2000. Originally copper oxide and copper sulphide ores
were treated. The % copper recovery and silica content of the copper oxide ore made it uneconomical to treat
and currently only copper sulphide ore is treated.
The concentrator is currently receiving ore from the Chibuluma South section. The ore supply from the
Chibuluma West section ceased in April 2005. The concentrator rated capacity is 48 ktpm. The average
treatment rates for F2012 and H1-F2013 were 46.4 ktpm and 45.7 ktpm respectively, at average grades of
3.46% and 3.25% Cu and overall Cu recoveries of 96.5% and 96.3% resepctively. The budget for H2-F2013
allows for an average grade of 3.52% Cu and a 96.0% Cu recovery. The ore reserve report states an average of
3.04% Cu for LoM, which reflects the influence of the lower grade Chifupu ores.
4.10.2 Metallurgical Testwork The bulk of the total Cu is derived from bornite while contributions from chalcocite and chalcopyrite are
subordinate. Bismuthunite occurs as an intergrowth with bornite and increases with depth. Bismuth in the Cu
concentrate attracts a smelter penalty at levels greater than 300 ppm. Currently, bismuth levels in the
concentrate are at 1 000 ppm to 1 200 ppm. This mineralogical relationship is unique to Chibuluma South in the
context of other Zambian Copperbelt mines.
Carollite and native Cu are minor contributors to the total Cu while the contribution from Co oxides in the form of
malachite or chrysocolla remains negligible. The gangue mineralogy is composed of mostly quartz and
feldspars with comparatively minor micas and carbonates. Other gangue constituents are negligible.
Laboratory test work indicates that the concentrator should expect recovery for Chifupuu ores. This is in line
with current performance at Chibuluma South mine, and the LoM recovery rate.
Additional metallurgical testwork on 6 drill core samples showed that the Cu recovery for Chifupu ore would be
93% (versus 96% of Chibuluma), but yield a lower concentrate grade. The mineralogical analysis revealed that:
APPENDIX V COMPETENT PERSON’S REPORT AND VALUATION REPORT
V - 165
The copper sulphides, which account for the acid insoluble copper, were represented by major chalcopyrite,
subordinate bornite and minor to negligible chalcocite and carrolite,
The copper “oxides” which were responsible for the acid soluble copper, were negligible,
The pyrite and pyrrhotite content was negligible,
The gangue mineralogy was similar in all the samples with the major gangue constituents, being
quartz/feldspars. Micas and carbonates were minor while other constituents were negligible.
This mineralogy confirms that this material can be successfully processed by the current Chibuluma flow sheet.
4.10.3 Process Description The simplified process plant flow sheet for Chibuluma is described in the following section and shown in
Figure 4.22.
The ore from the South section is stockpiled on a ramp with a capacity of 20 kt. The ore with a size grading of -
700 mm is fed by front-end loader directly into a jaw crusher. The product from the jaw crusher is –100 mm and
is further crushed by the Hazemac impact crusher to a size of 60% -13.5 mm. This product is then deposited on
a 6 kt tonne capacity stockpile. This crusher increased the concentrator capacity from 42 ktpm to 48 ktpm. The
crusher can be operated in or out of circuit.
A series of conveyors feed a secondary cone crusher (which acts as a standby unit for the Hazemac impact
crusher) via a vibrating scalping screen. The scalping screen undersize and the secondary crusher products
are fed to a sizing screen which is in closed circuit with a tertiary cone crusher.
The product from the sizing screen is 85% –13.5 mm and is deposited on a 3 kt capacity stockpile. A conveyor
fitted with a weightometer feeds a 20 t mill feed bin and two mill feeder conveyor belts fitted with weightometers
feed the two ball mills at a similar rate. A cyclone is in closed circuit with each mill. The cyclone overflow is 52-
55% -75 μm and feeds directly into the first rougher flotation cell. The flotation chemicals (collectors), Sodium
Normal Propyl Xanthate (“SNPX”) and Potassium Amyl Xanthate (“PAX”), and the frother Beta-froth are added.
A combination of rougher, middling, scavenger and cleaner flotation cells produce a Cu concentrate with a
grade of 46.0% Cu.
The concentrated is de-watered in a thickener and pumped to a filter press. The overflow from the thickener is
recycled to the process water tank. Water from the tailings dam is also returned to the process water tank. The
fresh water make-up comes from a local stream located 3 km from the processing facility. The concentrate with
a moisture content of 10% is deposited on a stockpile. Trucks take the concentrate to the Chambishi Copper
Smelter (“CCS”).
The tailings from the plant go through a backfill plant with a cyclone arrangement. The cyclone underflow (20% -
75 µm) is re-deposited underground with the overflow (60% -75 µm) to the tailings dam.
The single largest constraint in the process plant is the milling capacity with the two ball mills running at
approximately 20% over their designed capacity. The milling plant utilisation runs at 95% with availability at
90%, giving overall plant running time of 85.5%.
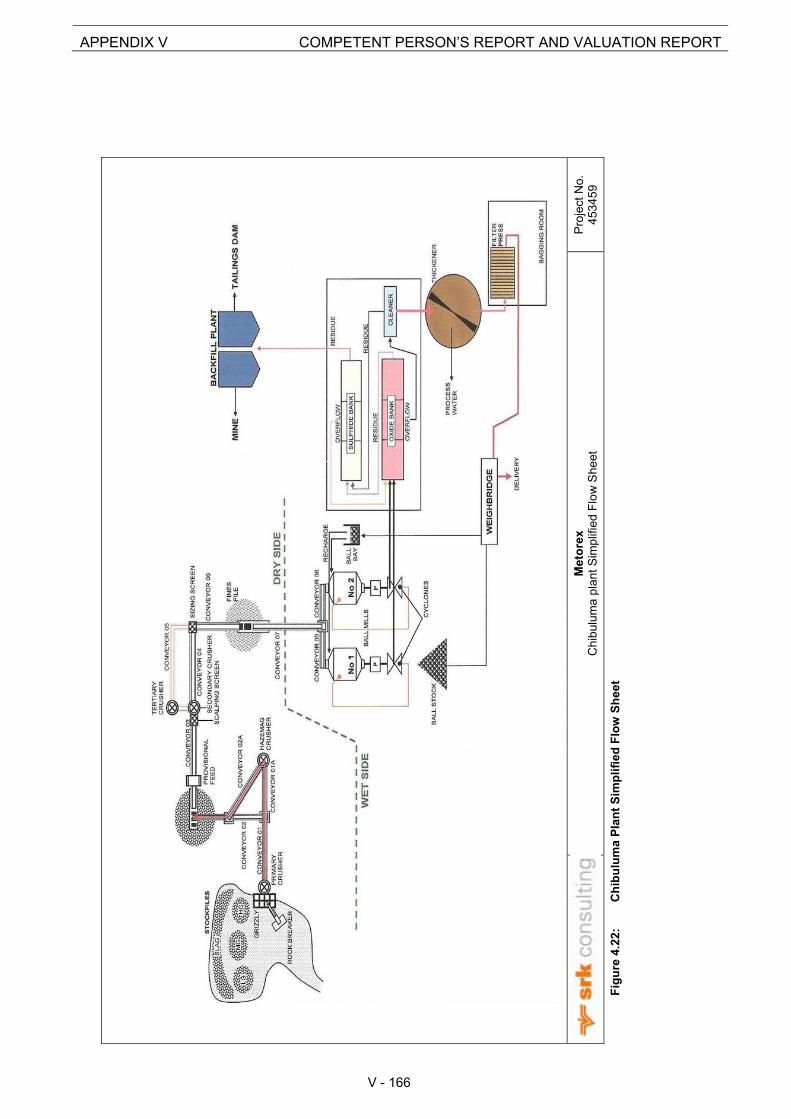
Met
ore
x C
hib
ulum
a pl
ant
Sim
plifi
ed F
low
She
et
Pro
ject
No.
45
345
9
Fig
ure
4.2
2:
Ch
ibu
lum
a P
lan
t S
imp
lifi
ed F
low
Sh
eet
APPENDIX V COMPETENT PERSON’S REPORT AND VALUATION REPORT
V - 166
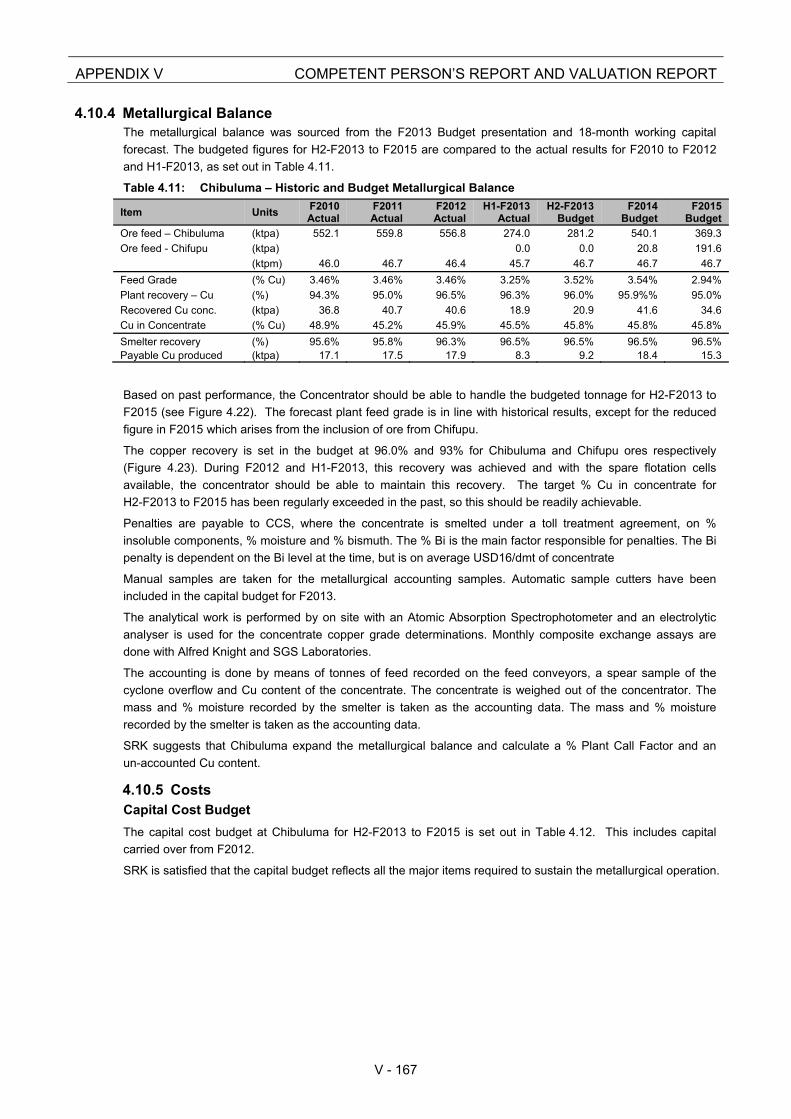
APPENDIX V COMPETENT PERSON’S REPORT AND VALUATION REPORT
V - 167
4.10.4 Metallurgical Balance The metallurgical balance was sourced from the F2013 Budget presentation and 18-month working capital
forecast. The budgeted figures for H2-F2013 to F2015 are compared to the actual results for F2010 to F2012
and H1-F2013, as set out in Table 4.11.
Table 4.11: Chibuluma – Historic and Budget Metallurgical Balance
Item Units F2010 Actual
F2011 Actual
F2012 Actual
H1-F2013 Actual
H2-F2013 Budget
F2014 Budget
F2015 Budget
Ore feed – Chibuluma (ktpa) 552.1 559.8 556.8 274.0 281.2 540.1 369.3
Ore feed - Chifupu (ktpa) 0.0 0.0 20.8 191.6
(ktpm) 46.0 46.7 46.4 45.7 46.7 46.7 46.7
Feed Grade (% Cu) 3.46% 3.46% 3.46% 3.25% 3.52% 3.54% 2.94%
Plant recovery – Cu (%) 94.3% 95.0% 96.5% 96.3% 96.0% 95.9%% 95.0%
Recovered Cu conc. (ktpa) 36.8 40.7 40.6 18.9 20.9 41.6 34.6
Cu in Concentrate (% Cu) 48.9% 45.2% 45.9% 45.5% 45.8% 45.8% 45.8%
Smelter recovery (%) 95.6% 95.8% 96.3% 96.5% 96.5% 96.5% 96.5%Payable Cu produced (ktpa) 17.1 17.5 17.9 8.3 9.2 18.4 15.3
Based on past performance, the Concentrator should be able to handle the budgeted tonnage for H2-F2013 to
F2015 (see Figure 4.22). The forecast plant feed grade is in line with historical results, except for the reduced
figure in F2015 which arises from the inclusion of ore from Chifupu.
The copper recovery is set in the budget at 96.0% and 93% for Chibuluma and Chifupu ores respectively
(Figure 4.23). During F2012 and H1-F2013, this recovery was achieved and with the spare flotation cells
available, the concentrator should be able to maintain this recovery. The target % Cu in concentrate for
H2-F2013 to F2015 has been regularly exceeded in the past, so this should be readily achievable.
Penalties are payable to CCS, where the concentrate is smelted under a toll treatment agreement, on %
insoluble components, % moisture and % bismuth. The % Bi is the main factor responsible for penalties. The Bi
penalty is dependent on the Bi level at the time, but is on average USD16/dmt of concentrate
Manual samples are taken for the metallurgical accounting samples. Automatic sample cutters have been
included in the capital budget for F2013.
The analytical work is performed by on site with an Atomic Absorption Spectrophotometer and an electrolytic
analyser is used for the concentrate copper grade determinations. Monthly composite exchange assays are
done with Alfred Knight and SGS Laboratories.
The accounting is done by means of tonnes of feed recorded on the feed conveyors, a spear sample of the
cyclone overflow and Cu content of the concentrate. The concentrate is weighed out of the concentrator. The
mass and % moisture recorded by the smelter is taken as the accounting data. The mass and % moisture
recorded by the smelter is taken as the accounting data.
SRK suggests that Chibuluma expand the metallurgical balance and calculate a % Plant Call Factor and an
un-accounted Cu content.
4.10.5 Costs Capital Cost Budget
The capital cost budget at Chibuluma for H2-F2013 to F2015 is set out in Table 4.12. This includes capital
carried over from F2012.
SRK is satisfied that the capital budget reflects all the major items required to sustain the metallurgical operation.
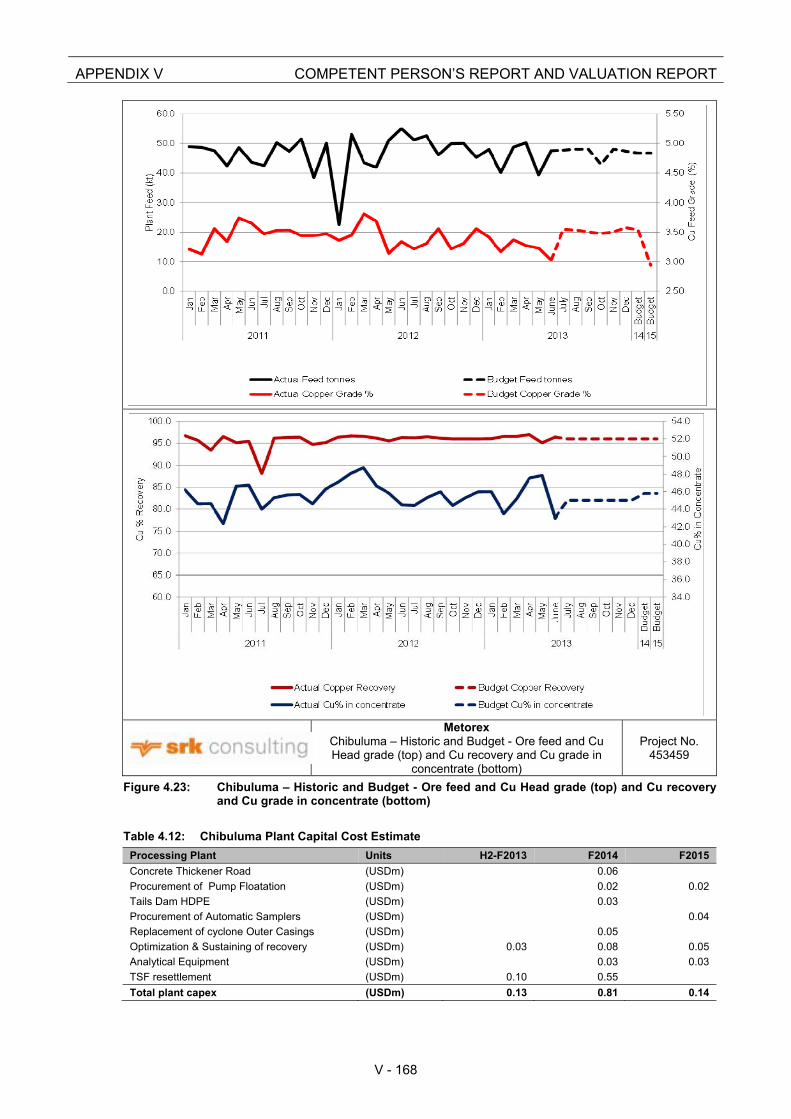
APPENDIX V COMPETENT PERSON’S REPORT AND VALUATION REPORT
V - 168
Metorex
Chibuluma – Historic and Budget - Ore feed and Cu Head grade (top) and Cu recovery and Cu grade in
concentrate (bottom)
Project No. 453459
Figure 4.23: Chibuluma – Historic and Budget - Ore feed and Cu Head grade (top) and Cu recovery and Cu grade in concentrate (bottom)
Table 4.12: Chibuluma Plant Capital Cost Estimate
Processing Plant Units H2-F2013 F2014 F2015
Concrete Thickener Road (USDm) 0.06
Procurement of Pump Floatation (USDm) 0.02 0.02
Tails Dam HDPE (USDm) 0.03
Procurement of Automatic Samplers (USDm) 0.04
Replacement of cyclone Outer Casings (USDm) 0.05
Optimization & Sustaining of recovery (USDm) 0.03 0.08 0.05
Analytical Equipment (USDm) 0.03 0.03
TSF resettlement (USDm) 0.10 0.55
Total plant capex (USDm) 0.13 0.81 0.14
APPENDIX V COMPETENT PERSON’S REPORT AND VALUATION REPORT
V - 169
Operating Cost
The unit plant operating cost per tonne of plant feed at Chibuluma forecast for H2-F2013 and remainder of LoM
are respectively:
Process plant operations USD2.80/t USD2.88/t;
Metallurgical engineering USD8.95/t USD9.53/t.
The budget plant operating cost for F2013 showed an increase of 6.2% relative to the actual cost for F2012,
which is seen to be reasonable. The budgeted plant operating costs for H2-F2013 to F2015 are set out in
Table 4.13.
Table 4.13: Chibuluma Plant Operating Cost Estimate
Process Plant/Metallurgy H2-F2013 F2014 F2015
Production (USDm) 0.8 1.3 1.3
Backfill plant (USDm) 0.0 0.1 0.1
Mobile equipment maintenance (USDm) 0.3 0.5 0.5
Engineering (USDm) 2.2 5.3 5.3
TSF (USDm) 0.0 0.1 0.1
Salaries & wages (USDm) 1.4 2.6 2.6
Total Plant opex (USDm) 4.8 10.0 10.0
Unit plant cost (USD/t feed) 16.88 17.84 17.84
Off-mine / Realisation Costs
The off mine / realisation costs comprise transport, smelting, refining, realisation charge and penalties. The
transport and smelting costs are applied to the concentrate tonnage. The refining cost and realisation charge is
calculated on the payable copper after smelting. The penalty is a percentage applied to the gross sales revenue
and is dependent on certain impurities and moisture content of the concentrate sent to the refinery.
The off-mine / realisation costs for Chibuluma for H2-F2013 to F2017 are shown in Table 4.14.
Table 4.14: Chibuluma Mine – Off-mine / realisation costs for H2-F2013 to F2017
Item Units H2-F2013 F2014 F2015 F2016 F2017
Transport costs (USDm) 0.4 0.9 0.7 0.7 0.7Smelting/refining/realisation costs
(USDm) 7.5 14.9 12.4 12.5 12.6
Penalties (USDm) 0.4 0.8 0.6 0.6 0.6
Total off-mine/realisation costs (USDm) 8.3 16.5 13.7 13.9 14.0
4.10.6 SRK Comments Development of the Chifupu copper sulphide deposit will supply additional ore, extending the LoM of
Chibuluma;
The metallurgical balance can be accepted, as it is in line with actual results of the past few years. The
major assumptions are:
o The feed grade must be realised.
o The recoveries of 96% and 93% for Chibuluma and Chifupu ores resepectively should be feasible with
the additional flotation cells introduced into the circuit as envisaged.
The operating and capital cost estimates for the plant look realistic in view of past performance and
envisaged enhancements to the operating process. Allowances are made for critical spares.
The risks identified are:
o Metorex indicated that the Chifupu ore has more chalcopyrite compared to the Chibuluma South
orebody, but this has been factored into the Chifupu evaluation;
o Engineering maintenance competency- The maintenance system is being developed on the Delta
platform and critical and strategic spares are available on site;;
o The concentrator crushing circuit is a single line plant. A breakdown of any of the major equipment
pieces can stop the whole plant. The two stockpiles in the plant provide some buffer. Metorex
APPENDIX V COMPETENT PERSON’S REPORT AND VALUATION REPORT
V - 170
confirmed that it will give attention to improve the availability of critical equipment such as the crushers
and conveyors;
o The stockpiles are a source of dust. Metorex has confirmed that dust suppression measures will be
implemented as required;
o Increasing the back fill production to meet the mining requirements.
4.11 Tailings Storage Facilities [SR5.6]
4.11.1 Vegetation and Rehabilitation No untoward phenomena were seen with regard to the physical condition of the Chibuluma Tailings Dam. No
toe-line seepage, cracking, bulging, sagging due to differential settlement or wet spots were observed. The
outer side slopes of the starter wall and the rising tailings outer wall have been mulched in areas, grass sods
and tree planted with limited success, bearing in mind the site inspection took place at the end of the dry season
and as the vegetation is not irrigated. With the onset of the summer rains the vegetation coverage might
improve.
During the previous 2 years, outer catchment paddocks were installed around the entire perimeter of the facility
to minimise side slope erosion migrating into the surrounding environs, which were built using labour intensive
methods with labour being sourced from the neighbouring communities.
4.11.2 Geometry The top operational surface area of the tailings dam is approximately 15 ha, has a current maximum height of
approximately 22 m and is operated using a day wall paddock and basin configuration. Underground backfill is
currently being practised, that results currently in 70% to 75% of the 48 ktpm of tailings produced reporting to
the tailings dam facility. Approximately 43% of the tailings deposited on the tailings dam has a -75µm grading.
In the LoM plan, it suggests that 50% of the total tailings stream will report as underground backfill. SRK has
assessed the LoM tailings dam storage requirements on both the 30% and 50% backfill requirements. The pool
is operated within the confines of a pool wall and wing walls. The pool was relatively large in relation to the
available basin. Freeboard was adequate and the condition and operation of the catwalk structure and decant
structure meets industry requirements. The dam has adequate freeboard and the majority of the day walls were
dry, indicating good deposition strategy.
4.11.3 Seepage Even though no toe-line seepage was observed, the historical minutes indicate that seepage has been
observed in the past necessitating the installation of sub-surface seepage collection drains to the western and
most recently to the south western flank. Subsurface drains and piezometers are read on a monthly basis and
results uploaded into the SSMS’s standard risk management system. Generally the tailings dam facility is in
good condition. Nevertheless, continual good operational and monitoring procedures must be maintained at all
times.
4.11.4 Pumping and Distribution System The tailings pumping and distribution system is adequate with no constraints.
4.11.5 Return Water The Tailings Dam complex does not contain an adequately sized RWD complex. All supernatant water, storm
water and collected seepage water either report into an unlined silt trap dam, which is highly silted and covered
with reeds, or directly into the small HDPE lined RWD. Both the silt trap and the HDPE lined RWD are desilted
on a regular basis and evidence of this is present adjacent to the dams. Overflow water from the silt trap dam,
when operational, gravitates directly into a small HDPE lined dam from where the recovered water is pumped
back to the plant. Observations made during the site inspection confirmed that the HDPE lined dam has some
degree of tailings siltation, while the penstock outfall pipe discharge point located immediately upstream of both
dams was almost completely submerged as a result of the high water level in the HDPE lined return water dam.
One of the contributing factors to why the HDPE lined RWD is subjected to siltation is due to the development of
informal fines (tailings) storage containment facilities to the south of the tailings dam and the installation of a
storm water cut-off drain to the outside of the overburden dumps which capture and transport all side slope
APPENDIX V COMPETENT PERSON’S REPORT AND VALUATION REPORT
V - 171
erosion into the return water dam complex. It is reported that the informal fines (tailings) storage facilities
contain HG material that will be ultimately processed through the plant. However these facilities consist of
pushed up, possibly uncompacted, containment walls, no under-drainage system nor formal decanting water
system or formal protected spillways, therefore any major storm event could, and has, resulted in the breaching
of the perimeter wall/s that in turn allows uncontrolled release of fines/tailings into the silt trap dam and the
HDPE lined water dam. Any major storm event will, and has, resulted in dirty water being released into the
clean water dambo located to the south of the HDPE lined dam and silt trap dam. During the inspection at the
end of the dry season, the HDPE lined return water dam was overflowing, via a V notch weir, into the dambo at
an estimated rate of 50 litres/second with virtually no freeboard on the return water dam. The overflow water
was not clear indicating some sedimentation, however, historical documentation reviewed stated “Effluent from
the return water dam is tested monthly and complies with Zambian discharge standards - constant PH of 7 is
required”. Underground water and return water exceed the plant requirements and continued overflow into the
clean water dambo will continue.
4.11.6 Capacity and Rate of Rise Based on the expected LoM tonnage, assuming that between 30% and 50% of the tailings stream will be used
for mine backfill, the existing Tailings Dam has the capacity to cater for a worst case scenario of 70% of the
expected LoM tonnage reporting to the tailings dam based on a target dry density of 1.6 t/m3. It is therefore
imperative that all future operations ensure that a minimum of 30% of all tailings produced reports as
underground backfill. The tailings dam is not expected to rise more than 18.0 m over the projected LoM above
the current top surface elevation. The termination rate of rise would be approximately 2.15 m/annum and the
termination day wall to basin ratio would be in the order of 1:5.5, all of which is acceptable. As the dam
approached termination elevation the management of the tailings dam will become more difficult and additional
supervision and stability investigations will be required.
4.11.7 Capital and Operating costs The capex that should be allowed for the desilting of the HDPE lined water dam, repairs to the HDPE lining, the
construction of additional sub-surface seepage collection drain and if required buttressing the side slopes of the
tailings dam towards the end of life of the facility is USD1.0 million.
The tailings depositional operating costs, including the internal tailings dam operators would be approximately
USD0.15/t - USD0.20/t. This would equate to an annual opex of USD0.1 million.
4.11.8 SRK Comments SRK has reviewed the current Chibuluma Mine tailings disposal system and is of the opinion that there is
sufficient capacity on the Chibuluma tailings dam to accommodate the 4.83 Mt of tailings from the Chibuluma
Mine Concentrator for the projected 9 years LoM.
The tailings dam is currently being operated by apparently competent mine personnel and is reviewed annually
by the external designer.
No inspections were made of the old historical (Chibuluma North) tailings dam located approximately 10 km
north of the Chibuluma South tailings dam.
4.12 Infrastructure and Engineering [SR5.6]
The general layout of the surface infrastructure is shown in Figure 4.24.
4.12.1 Bulk Services Electrical Supply
CEC installed an 11.5 km 66 kV overhead transmission line to Chibuluma in 2000. The mine steps this supply
down to 11 kV at its
main consumer substation. The power supply from CEC and ZESCO has recently been upgraded and is a
stable, reliable supply to the operations.
Chibuluma South mine has an adequate power supply to ensure continuous operations. In addition to an 11 kV
CEC grid connection supplying up to 5 MW power to the mine, the mine has recently procured two backup
diesel generators capable of producing 2 MW which is sufficient to provide emergency power for underground
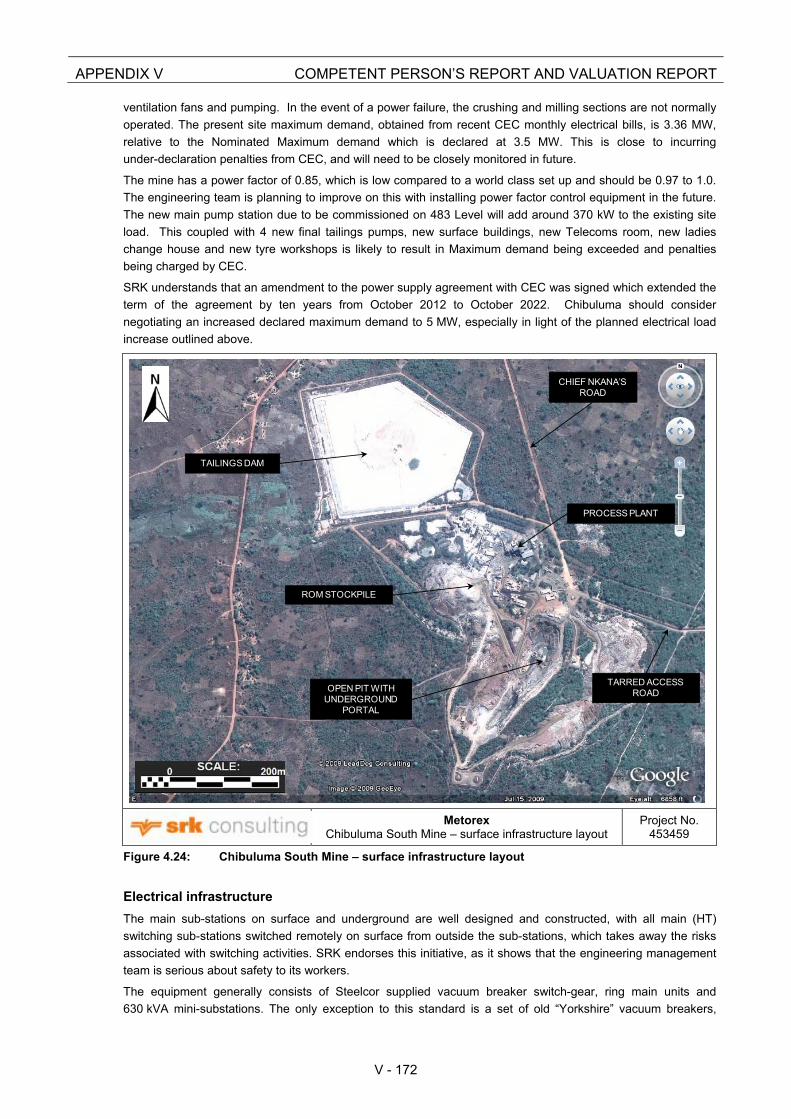
APPENDIX V COMPETENT PERSON’S REPORT AND VALUATION REPORT
V - 172
ventilation fans and pumping. In the event of a power failure, the crushing and milling sections are not normally
operated. The present site maximum demand, obtained from recent CEC monthly electrical bills, is 3.36 MW,
relative to the Nominated Maximum demand which is declared at 3.5 MW. This is close to incurring
under-declaration penalties from CEC, and will need to be closely monitored in future.
The mine has a power factor of 0.85, which is low compared to a world class set up and should be 0.97 to 1.0.
The engineering team is planning to improve on this with installing power factor control equipment in the future.
The new main pump station due to be commissioned on 483 Level will add around 370 kW to the existing site
load. This coupled with 4 new final tailings pumps, new surface buildings, new Telecoms room, new ladies
change house and new tyre workshops is likely to result in Maximum demand being exceeded and penalties
being charged by CEC.
SRK understands that an amendment to the power supply agreement with CEC was signed which extended the
term of the agreement by ten years from October 2012 to October 2022. Chibuluma should consider
negotiating an increased declared maximum demand to 5 MW, especially in light of the planned electrical load
increase outlined above.
Metorex Chibuluma South Mine – surface infrastructure layout
Project No. 453459
Figure 4.24: Chibuluma South Mine – surface infrastructure layout
Electrical infrastructure
The main sub-stations on surface and underground are well designed and constructed, with all main (HT)
switching sub-stations switched remotely on surface from outside the sub-stations, which takes away the risks
associated with switching activities. SRK endorses this initiative, as it shows that the engineering management
team is serious about safety to its workers.
The equipment generally consists of Steelcor supplied vacuum breaker switch-gear, ring main units and
630 kVA mini-substations. The only exception to this standard is a set of old “Yorkshire” vacuum breakers,
PROCESS PLANT
OPEN PIT WITH UNDERGROUND
PORTAL
TAILINGS DAM
CHIEF NKANA’S ROAD
TARRED ACCESS ROAD
ROM STOCKPILE
APPENDIX V COMPETENT PERSON’S REPORT AND VALUATION REPORT
V - 173
which have become obsolete with spares no longer available for ongoing maintenance. The engineering
department plans to replace this in the near future.
The transformer oils are sampled and tested for insulation properties and water content on a 6 monthly basis,
for all surface and underground transformers. Also, this is further enhanced with 6 monthly injection tests on all
the HT switchgear on site.
The mine has upgraded its surface and underground electrical infrastructure over the last 2 to 3 years.
Bulk water supply
The process plant and underground section uses 4 000 m3 of water per day. This is supplied from the Kalulushi
stream 3 km from the mine which in the 9 years of operation at Chibuluma South has always delivered. Four
reservoir tanks with a total capacity of 600 m3 have recently been installed on the mine to mitigate pump failure
or downtime related to pipeline maintenance. Service water for the process plant is also available from the clear
water dam on surface (supplied from the underground section) should it be required. The surface dam is also
supplemented with additional water from the tailings dam return and 3 drill holes on the site.
The surface treatment plant has recently been upgraded and potable water was available to the work force from
18 October 2012.
The engineering team has recently purchased HDPE cutting and welding equipment and trained operators to
make up piping on site. This ensures that pipes and fittings are available when required at a much cheaper
price.
4.12.2 Underground pumping system The mine dewaters up the decline in staged pumping to the plant surface water storage dams. Each pump
station is equipped with four Warman PCH 150 centrifugal pumps fitted with 185 kW drive motors. Initially the
dirty water sumps were horizontal, and due the high volumes of suspended solids reporting to the sumps,
resulting in the fines building up in the sumps. The maintenance teams struggled to keep the sump fines build
up away from the pump suction pipes, which resulted in poor pumping performance and premature pump
failures of bearing housings due to high levels of cavitation. The mine engineers redesigned the sumps, recently
commissioning a series of 29 m long, 6 m diameter vertical sumps, that are agitated to reduce fines build up in
the base of the sumps, the pumping operations have been drastically improved by the introduction of the
vertical sumps-which has increased pumping volumes due to improved pump suction pressures and better
pump availabilities due to the improved suction heads and no cavitation due to pump blockages on the suction
side.
4.12.3 Backfill system A cut and backfill mining method is used to extract the bulk of the ore-body, with mining taking place in vertical
40 m sections which are mined from the bottom upwards. To achieve this and ensure flexibility of mining
operations, the mine operates a backfill plant that uses classified tailings as the fill material. The average daily
placement of backfill has improved significantly to around 900 tpd due mainly to the employment of an
experienced backfill specialist. The daily placement rates prior to engaging the backfill specialist were in the
region of 250 - 400 tpd.
The main operational challenge presently is the premature wearing out of the delivery columns from the plant on
surface to the underground sections. The pipes are installed at various degrees of inclination, with horizontal
sections on the working levels. The changes in inclination are seen as a major contributor to pipe failures. In
September 2012, the mine replaced 42 6-m long pipe sections of 75 mm bore piping, at a cost of around USD2
500.
Work is underway, to find an alternative pipe to the HDPE used presently. SRK advised that Chibuluma should
consult with Patterson and Cooke, based in Cape Town, South Africa, to gain guidance on alternative pipes.
They are the leaders in flow testing and specifying pipes that will guarantee laminar flow in the distribution lines.
The backfill specialist is also planning to send backfill directly to the working levels via a vertical drill hole, which
will significantly shorten the delivery columns and the number of changes in line inclination. SRK supports this
initiative.
4.12.4 Underground mobile equipment The mine owns and operates its own fleet of underground equipment, comprising:
APPENDIX V COMPETENT PERSON’S REPORT AND VALUATION REPORT
V - 174
Toro 6m³ front end loaders (“FELs”) 5;
EJC 533 truck 1;
Toro 40 t ADT 7;
single boom drill rig 5;
long hole drill 2.
As a general comment, the equipment appeared to be well maintained with very little, if any, damage seen to
the machinery. The stopes did have a lot of pooled water present on all the working levels from its backfilling
operations, and recent torque convertor and transmission failures on loaders and trucks were as a result of
water ingress into the units. The water on the roadways will adversely affect the tyre life on machinery. SRK
suggests that a better road drainage system is implemented and operated in the main haulages and panel
access roadways.
The mine has both surface and underground workshops fully equipped to support the maintenance effort on the
mobile plant. The underground workshops are for minor repairs and are supplemented with a fully equipped
hose repair bay. The hose crimping equipment and associated consignment stock for hoses and fittings is
managed by a hose supply company. Monthly stock checks confirm the monthly usage and agreed on by the
mine and the contractor, prior to the monthly invoice being sent through to the mine. This system undoubtedly
reduces equipment downtime waiting for a replacement hose to be delivered from surface. In addition to this,
the hose specification and length can be exactly copied, ensuring that the ‘as built’ hose routing is not altered
with incorrectly sized hoses.
All machine services are carried out on surface, with 125 hour, 500 hour and 1 000 hour services carried out in
the surface workshops. All main component replacements are carried out in the surface workshops.
The main production machines receive a full overhaul after 17 000 hours of operation. This allows a second
operating life for the production machines of 14 000 hours, after which time the machine is sold to third parties.
4.12.5 Planned maintenance systems Planned maintenance (“PM”) runs a detailed time-based preventative maintenance plan, based on the
experience of running and maintaining the equipment at Chibuluma. The Delta system is used here, but is
suffers with the lack of reporting on engineering aspects outlined for Ruashi (see Section 4.12.4). Historical
reporting of work done on equipment by work centre is presently not possible.
The engineering department does report on individual equipment costs. This information is used to run a very
detailed operational replacement indicator (“ORI”) whereby the operating hours since commissioning and the
monthly operating costs are combined to indicate the optimum operating hours (Life of equipment) for each
piece of main underground production equipment. The ORIs for the entire fleet are used to drive the 4 year
capital replacement strategy. Asset management of equipment and major component tracking is used, but
needs improving. In terms of utilising the Delta CMMS, Chibuluma is well advanced when compared to Ruashi.
An indicator of how effective the scheduled PM plans are - is the equipment availability. The processing plant
availability is between 85% and 96%. The production equipment availability for drills, loaders and dump trucks
are consistently above the planned budget of 80% which is a very good performance when benchmarked with
other mechanised mines.
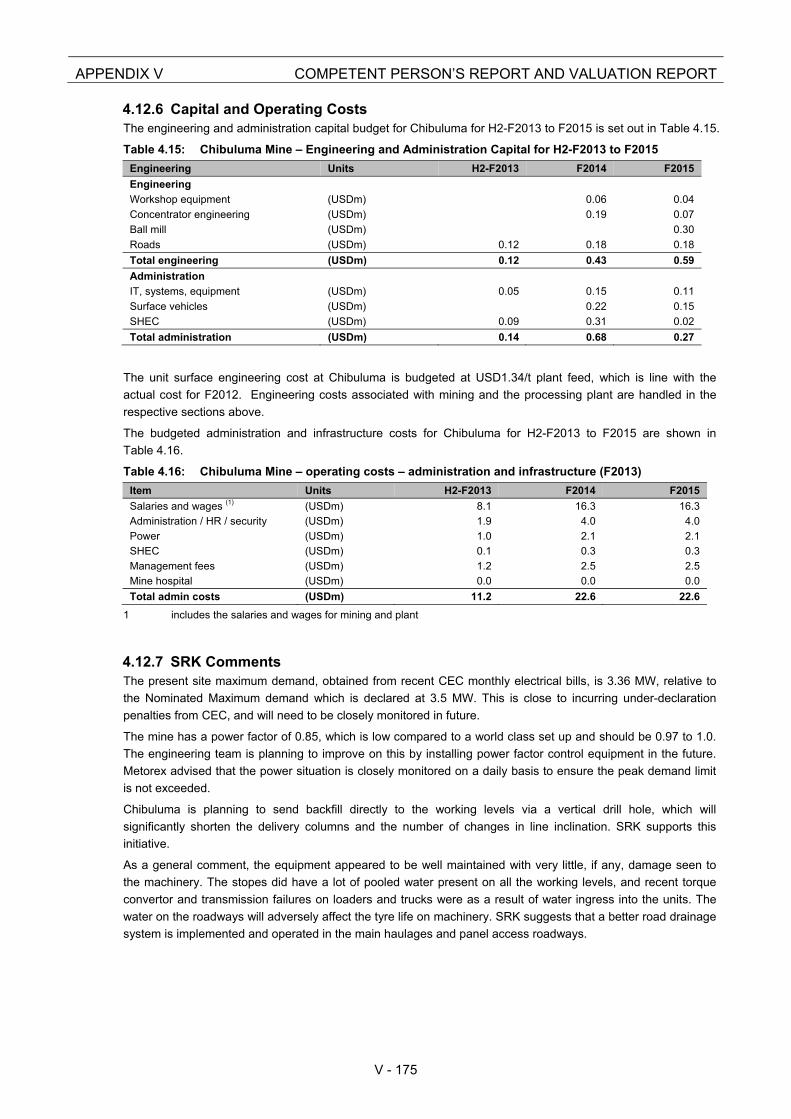
APPENDIX V COMPETENT PERSON’S REPORT AND VALUATION REPORT
V - 175
4.12.6 Capital and Operating Costs The engineering and administration capital budget for Chibuluma for H2-F2013 to F2015 is set out in Table 4.15.
Table 4.15: Chibuluma Mine – Engineering and Administration Capital for H2-F2013 to F2015
Engineering Units H2-F2013 F2014 F2015
Engineering
Workshop equipment (USDm) 0.06 0.04
Concentrator engineering (USDm) 0.19 0.07
Ball mill (USDm) 0.30
Roads (USDm) 0.12 0.18 0.18
Total engineering (USDm) 0.12 0.43 0.59
Administration
IT, systems, equipment (USDm) 0.05 0.15 0.11
Surface vehicles (USDm) 0.22 0.15
SHEC (USDm) 0.09 0.31 0.02
Total administration (USDm) 0.14 0.68 0.27
The unit surface engineering cost at Chibuluma is budgeted at USD1.34/t plant feed, which is line with the
actual cost for F2012. Engineering costs associated with mining and the processing plant are handled in the
respective sections above.
The budgeted administration and infrastructure costs for Chibuluma for H2-F2013 to F2015 are shown in
Table 4.16.
Table 4.16: Chibuluma Mine – operating costs – administration and infrastructure (F2013)
Item Units H2-F2013 F2014 F2015
Salaries and wages (1) (USDm) 8.1 16.3 16.3
Administration / HR / security (USDm) 1.9 4.0 4.0
Power (USDm) 1.0 2.1 2.1
SHEC (USDm) 0.1 0.3 0.3
Management fees (USDm) 1.2 2.5 2.5
Mine hospital (USDm) 0.0 0.0 0.0
Total admin costs (USDm) 11.2 22.6 22.6
1 includes the salaries and wages for mining and plant
4.12.7 SRK Comments The present site maximum demand, obtained from recent CEC monthly electrical bills, is 3.36 MW, relative to
the Nominated Maximum demand which is declared at 3.5 MW. This is close to incurring under-declaration
penalties from CEC, and will need to be closely monitored in future.
The mine has a power factor of 0.85, which is low compared to a world class set up and should be 0.97 to 1.0.
The engineering team is planning to improve on this by installing power factor control equipment in the future.
Metorex advised that the power situation is closely monitored on a daily basis to ensure the peak demand limit
is not exceeded.
Chibuluma is planning to send backfill directly to the working levels via a vertical drill hole, which will
significantly shorten the delivery columns and the number of changes in line inclination. SRK supports this
initiative.
As a general comment, the equipment appeared to be well maintained with very little, if any, damage seen to
the machinery. The stopes did have a lot of pooled water present on all the working levels, and recent torque
convertor and transmission failures on loaders and trucks were as a result of water ingress into the units. The
water on the roadways will adversely affect the tyre life on machinery. SRK suggests that a better road drainage
system is implemented and operated in the main haulages and panel access roadways.
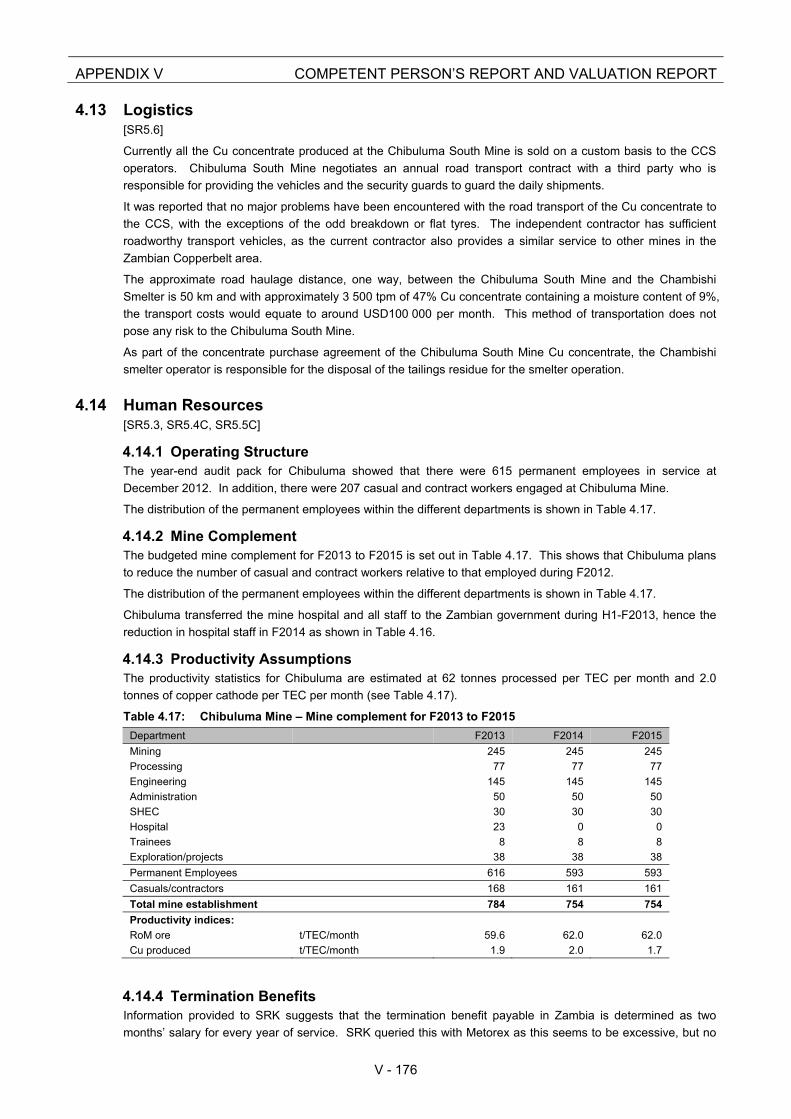
APPENDIX V COMPETENT PERSON’S REPORT AND VALUATION REPORT
V - 176
4.13 Logistics [SR5.6]
Currently all the Cu concentrate produced at the Chibuluma South Mine is sold on a custom basis to the CCS
operators. Chibuluma South Mine negotiates an annual road transport contract with a third party who is
responsible for providing the vehicles and the security guards to guard the daily shipments.
It was reported that no major problems have been encountered with the road transport of the Cu concentrate to
the CCS, with the exceptions of the odd breakdown or flat tyres. The independent contractor has sufficient
roadworthy transport vehicles, as the current contractor also provides a similar service to other mines in the
Zambian Copperbelt area.
The approximate road haulage distance, one way, between the Chibuluma South Mine and the Chambishi
Smelter is 50 km and with approximately 3 500 tpm of 47% Cu concentrate containing a moisture content of 9%,
the transport costs would equate to around USD100 000 per month. This method of transportation does not
pose any risk to the Chibuluma South Mine.
As part of the concentrate purchase agreement of the Chibuluma South Mine Cu concentrate, the Chambishi
smelter operator is responsible for the disposal of the tailings residue for the smelter operation.
4.14 Human Resources [SR5.3, SR5.4C, SR5.5C]
4.14.1 Operating Structure The year-end audit pack for Chibuluma showed that there were 615 permanent employees in service at
December 2012. In addition, there were 207 casual and contract workers engaged at Chibuluma Mine.
The distribution of the permanent employees within the different departments is shown in Table 4.17.
4.14.2 Mine Complement The budgeted mine complement for F2013 to F2015 is set out in Table 4.17. This shows that Chibuluma plans
to reduce the number of casual and contract workers relative to that employed during F2012.
The distribution of the permanent employees within the different departments is shown in Table 4.17.
Chibuluma transferred the mine hospital and all staff to the Zambian government during H1-F2013, hence the
reduction in hospital staff in F2014 as shown in Table 4.16.
4.14.3 Productivity Assumptions The productivity statistics for Chibuluma are estimated at 62 tonnes processed per TEC per month and 2.0
tonnes of copper cathode per TEC per month (see Table 4.17).
Table 4.17: Chibuluma Mine – Mine complement for F2013 to F2015
Department F2013 F2014 F2015
Mining 245 245 245
Processing 77 77 77
Engineering 145 145 145
Administration 50 50 50
SHEC 30 30 30
Hospital 23 0 0
Trainees 8 8 8
Exploration/projects 38 38 38
Permanent Employees 616 593 593
Casuals/contractors 168 161 161
Total mine establishment 784 754 754
Productivity indices:
RoM ore t/TEC/month 59.6 62.0 62.0
Cu produced t/TEC/month 1.9 2.0 1.7
4.14.4 Termination Benefits Information provided to SRK suggests that the termination benefit payable in Zambia is determined as two
months’ salary for every year of service. SRK queried this with Metorex as this seems to be excessive, but no
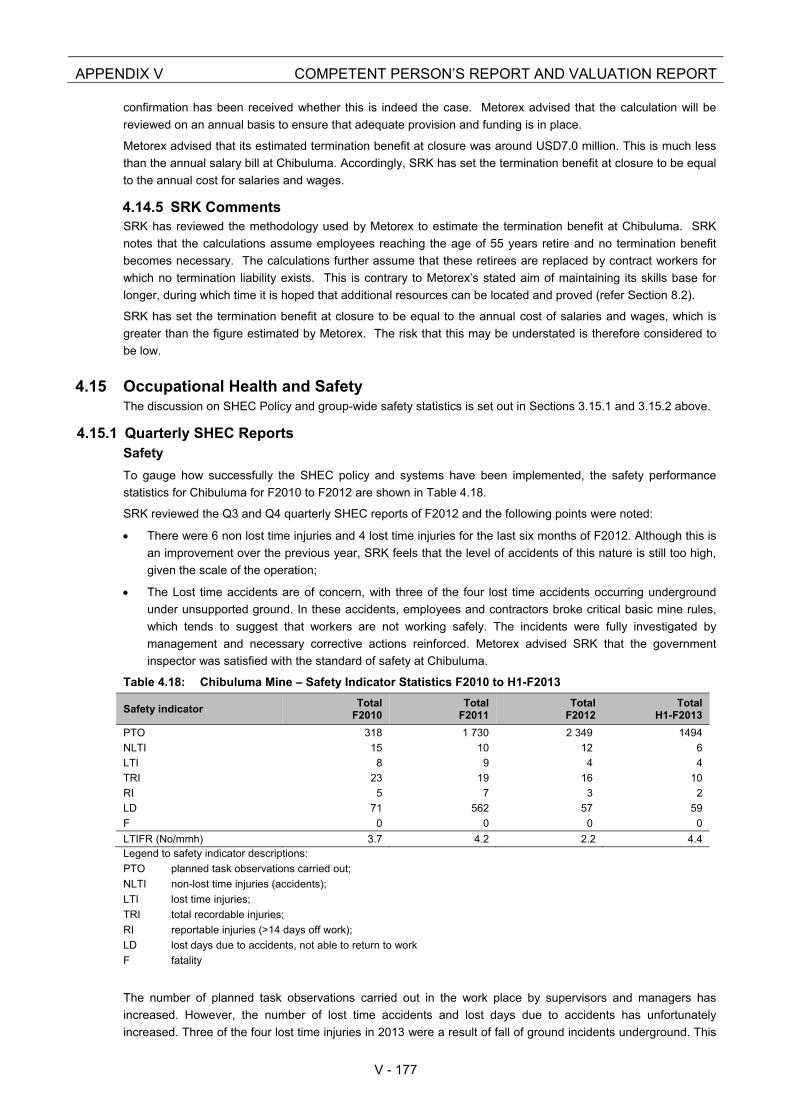
APPENDIX V COMPETENT PERSON’S REPORT AND VALUATION REPORT
V - 177
confirmation has been received whether this is indeed the case. Metorex advised that the calculation will be
reviewed on an annual basis to ensure that adequate provision and funding is in place.
Metorex advised that its estimated termination benefit at closure was around USD7.0 million. This is much less
than the annual salary bill at Chibuluma. Accordingly, SRK has set the termination benefit at closure to be equal
to the annual cost for salaries and wages.
4.14.5 SRK Comments SRK has reviewed the methodology used by Metorex to estimate the termination benefit at Chibuluma. SRK
notes that the calculations assume employees reaching the age of 55 years retire and no termination benefit
becomes necessary. The calculations further assume that these retirees are replaced by contract workers for
which no termination liability exists. This is contrary to Metorex’s stated aim of maintaining its skills base for
longer, during which time it is hoped that additional resources can be located and proved (refer Section 8.2).
SRK has set the termination benefit at closure to be equal to the annual cost of salaries and wages, which is
greater than the figure estimated by Metorex. The risk that this may be understated is therefore considered to
be low.
4.15 Occupational Health and Safety The discussion on SHEC Policy and group-wide safety statistics is set out in Sections 3.15.1 and 3.15.2 above.
4.15.1 Quarterly SHEC Reports Safety
To gauge how successfully the SHEC policy and systems have been implemented, the safety performance
statistics for Chibuluma for F2010 to F2012 are shown in Table 4.18.
SRK reviewed the Q3 and Q4 quarterly SHEC reports of F2012 and the following points were noted:
There were 6 non lost time injuries and 4 lost time injuries for the last six months of F2012. Although this is
an improvement over the previous year, SRK feels that the level of accidents of this nature is still too high,
given the scale of the operation;
The Lost time accidents are of concern, with three of the four lost time accidents occurring underground
under unsupported ground. In these accidents, employees and contractors broke critical basic mine rules,
which tends to suggest that workers are not working safely. The incidents were fully investigated by
management and necessary corrective actions reinforced. Metorex advised SRK that the government
inspector was satisfied with the standard of safety at Chibuluma.
Table 4.18: Chibuluma Mine – Safety Indicator Statistics F2010 to H1-F2013
Safety indicator Total
F2010Total
F2011Total
F2012 Total
H1-F2013
PTO 318 1 730 2 349 1494
NLTI 15 10 12 6
LTI 8 9 4 4
TRI 23 19 16 10
RI 5 7 3 2
LD 71 562 57 59
F 0 0 0 0
LTIFR (No/mmh) 3.7 4.2 2.2 4.4Legend to safety indicator descriptions:
PTO planned task observations carried out;
NLTI non-lost time injuries (accidents);
LTI lost time injuries;
TRI total recordable injuries;
RI reportable injuries (>14 days off work);
LD lost days due to accidents, not able to return to work
F fatality
The number of planned task observations carried out in the work place by supervisors and managers has
increased. However, the number of lost time accidents and lost days due to accidents has unfortunately
increased. Three of the four lost time injuries in 2013 were a result of fall of ground incidents underground. This
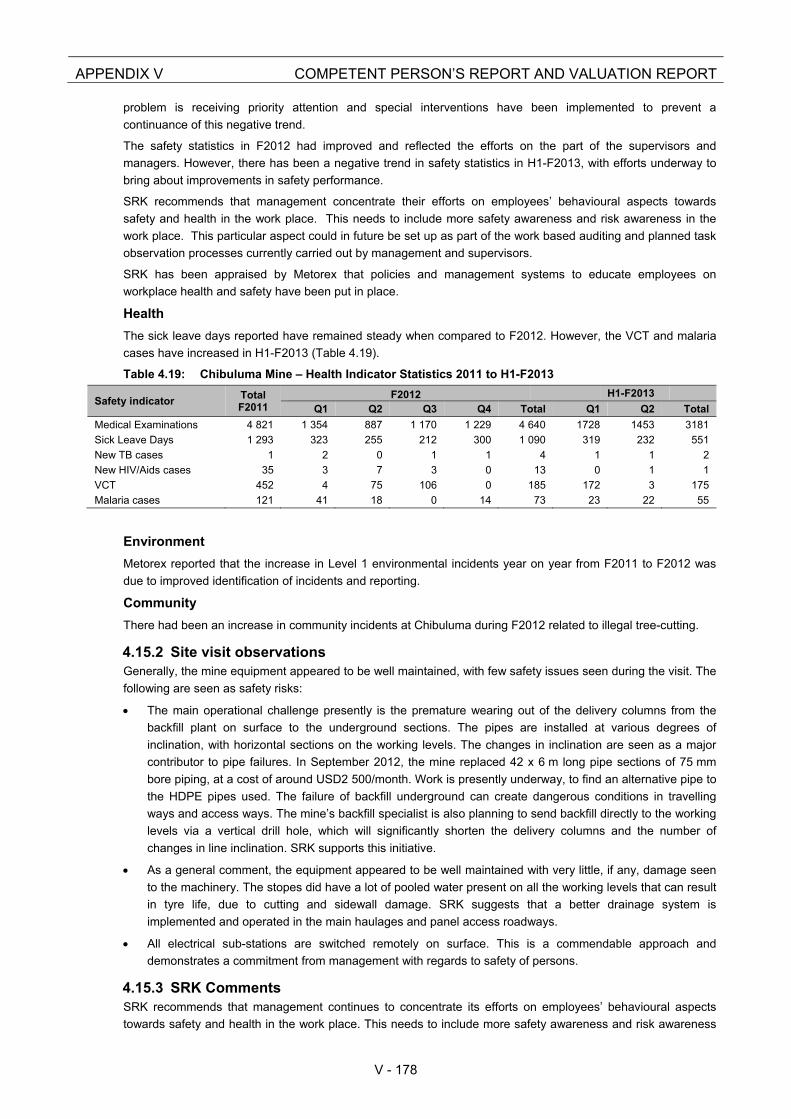
APPENDIX V COMPETENT PERSON’S REPORT AND VALUATION REPORT
V - 178
problem is receiving priority attention and special interventions have been implemented to prevent a
continuance of this negative trend.
The safety statistics in F2012 had improved and reflected the efforts on the part of the supervisors and
managers. However, there has been a negative trend in safety statistics in H1-F2013, with efforts underway to
bring about improvements in safety performance.
SRK recommends that management concentrate their efforts on employees’ behavioural aspects towards
safety and health in the work place. This needs to include more safety awareness and risk awareness in the
work place. This particular aspect could in future be set up as part of the work based auditing and planned task
observation processes currently carried out by management and supervisors.
SRK has been appraised by Metorex that policies and management systems to educate employees on
workplace health and safety have been put in place.
Health
The sick leave days reported have remained steady when compared to F2012. However, the VCT and malaria
cases have increased in H1-F2013 (Table 4.19).
Table 4.19: Chibuluma Mine – Health Indicator Statistics 2011 to H1-F2013
Safety indicator Total F2011
F2012 H1-F2013
Q1 Q2 Q3 Q4 Total Q1 Q2 Total
Medical Examinations 4 821 1 354 887 1 170 1 229 4 640 1728 1453 3181
Sick Leave Days 1 293 323 255 212 300 1 090 319 232 551
New TB cases 1 2 0 1 1 4 1 1 2
New HIV/Aids cases 35 3 7 3 0 13 0 1 1
VCT 452 4 75 106 0 185 172 3 175
Malaria cases 121 41 18 0 14 73 23 22 55
Environment
Metorex reported that the increase in Level 1 environmental incidents year on year from F2011 to F2012 was
due to improved identification of incidents and reporting.
Community
There had been an increase in community incidents at Chibuluma during F2012 related to illegal tree-cutting.
4.15.2 Site visit observations Generally, the mine equipment appeared to be well maintained, with few safety issues seen during the visit. The
following are seen as safety risks:
The main operational challenge presently is the premature wearing out of the delivery columns from the
backfill plant on surface to the underground sections. The pipes are installed at various degrees of
inclination, with horizontal sections on the working levels. The changes in inclination are seen as a major
contributor to pipe failures. In September 2012, the mine replaced 42 x 6 m long pipe sections of 75 mm
bore piping, at a cost of around USD2 500/month. Work is presently underway, to find an alternative pipe to
the HDPE pipes used. The failure of backfill underground can create dangerous conditions in travelling
ways and access ways. The mine’s backfill specialist is also planning to send backfill directly to the working
levels via a vertical drill hole, which will significantly shorten the delivery columns and the number of
changes in line inclination. SRK supports this initiative.
As a general comment, the equipment appeared to be well maintained with very little, if any, damage seen
to the machinery. The stopes did have a lot of pooled water present on all the working levels that can result
in tyre life, due to cutting and sidewall damage. SRK suggests that a better drainage system is
implemented and operated in the main haulages and panel access roadways.
All electrical sub-stations are switched remotely on surface. This is a commendable approach and
demonstrates a commitment from management with regards to safety of persons.
4.15.3 SRK Comments SRK recommends that management continues to concentrate its efforts on employees’ behavioural aspects
towards safety and health in the work place. This needs to include more safety awareness and risk awareness
APPENDIX V COMPETENT PERSON’S REPORT AND VALUATION REPORT
V - 179
in the work place. Metorex advised that policies and procedures are in place to educate employees on
workplace health and safety and monitor compliance.
The level of total reportable injuries has increased in 2013 and needs to be targeted as part of a safety drive, to
ensure that the rest of this year does not see the same levels of reportable injuries.
With health, the sick leave days reported have remained steady when compared to F2012. However, the VCT
and malaria cases have increased in H1-F2013.
4.16 Environmental [SR5.2B/C]
4.16.1 Regional Setting Chibuluma South is situated in a rural area with 86 households comprising over 400 people living on the lease
area while Chibuluma West and East is adjacent to the town of Kalalushi with industrial activities in the area.
The mine employs some 600 people full time as well as 200 contractors. All staff lives in Kalalushi.
4.16.2 Project Description Chibuluma South
The pit at Chibuluma South is 30 m deep, about 550 m long and 210 m wide at its maximum. The open pit
sump acts as a sedimentation pond which settles solids from slope runoff during the rainy season. Clear water
is pumped to the surface settling pond for further settling and used as raw water in the plant. Excess water is
discharged to the natural environment. Storm water cut-off drains and bund walls have been constructed around
the open pit perimeter to prevent surface run-off flowing into the pit.
Tailings is disposed of on a ring dyke tailings dam which has a footprint area of some 25 ha.
Potable water for Chibuluma South is abstracted from the Kalulushi stream. Water from the RWD at the tailings
dam is returned to the process water system or discharged into the Nseleki stream. The EMP makes provision
for the treatment of this water if necessary.
Chibuluma West
De-commissioned infrastructure which has been addressed in a Closure Plan for Chibuluma West includes 2
tailings dams, a waste rock dump, old stockpile areas and Kalalushi Business Park. The latter incorporates
redundant mine infrastructure that has been purchased for the development of the business park.
The total tailings dam footprint area is some 55 ha of which more than 40 ha is not vegetated. The height of the
larger of the two dams is 7 m and the EMP identifies ponding water on the dam as a risk to its stability. Storm
water runoff control measures therefore have to be planned and implemented, in addition to rehabilitation
measures which will be required for air pollution control.
The rock dump footprint area is approximately 2.5 ha while old low grade stockpiles cover an area of some 13
ha and the plant area requiring rehabilitation covers an area of nearly 6 ha. Apart from these areas, the EMP
states that soil contamination affecting certain other areas has been remediated but the closure plan provides
for soil contamination studies in other areas, notably the old stockpile area and the area within the Kalalushi
Business Park.
4.16.3 Potentially Material Environmental risks Metorex acknowledges that rehabilitation costs could increase if ground water pollution problems are
encountered. The possibility that water treatment following mine closure may be required therefore represents a
significant potentially material liability. The significance of this potential risk has been reduced by the proactive
financial provision, by Metorex on a group wide basis, for possible post closure water treatment.
4.16.4 General Observation Regarding Environmental Management According to the 2012 SHEC report, sulfides in waste rock and in-situ rock in the underground workings pose a
risk of AMD. An existing water treatment plant at Chibuluma West 7 Shaft area is being rehabilitated to treat
water from 5 Shaft. Metorex advised that Nkana Water (state owned water utility) will manage this treatment
plant with the intention of using the water for domestic use and distribution. Low pH water in 4 Shaft is noted as
a concern. Effluent quality leaving the mine at the control point is monitored but a more intense monitoring
APPENDIX V COMPETENT PERSON’S REPORT AND VALUATION REPORT
V - 180
programme would provide a better understanding of impacts on the mine site. Metorex indicated that the extent
of the pollution and treatment methods are being evaluated by AMC.
Observations during the site visit confirmed that there is a positive water balance and that discharges to the
stream are common if not continuous. In addition to water abstracted from the river, process water is recycled
as much as possible and water is made underground. Because of the excess water, use is made of settling
dams which receive this water prior to its release but these are unlined dams of insufficient capacity. Local
people use water flowing out of the RWD for the irrigation of vegetables.
It is reported on the mine that no problems with salinity or heavy metals content are experienced for water
discharged from the mine. Results made all refer to the water quality at the mines effluent discharge control
point, the Emerald Road Bridge. Compliance at this point will not necessarily address possible liabilities
associated with other discharges, such as the overflow at the RWD.
Storm water management systems require, and are receiving attention.
Re-vegetation of the tailings dam at Chibuluma South is continuing. It was observed during the site visit that the
need for this has been recognized and acted upon by the mine. While this is generally a routine matter, it has
some significance in that dust is an issue that has been raised by stakeholders in the vicinity of the tailings dam.
It is not expected to have a significant impact on the overall environmental liability in the light of the approved
RAP and the fact that land has been made available by a local chief.
4.16.5 Potentially Material Social Risks No potentially material risks were identified in this review.
4.16.6 General Observations Regarding Social Considerations People living in close proximity to the TSF at Chibuluma South have expressed concern regarding impacts,
including air quality and possible AMD. A RAP has been approved for the resettlement of these people and a
local chief has made alternative land available for the purpose. Metorex reports that the mine has embarked on
the RAP process. There are 80 households involved who reside in close proximity to the tailings dam. A budget
of US$1 million has been set aside for this purpose. The suitability of this land for agriculture is being
determined. Indications are therefore that this issue can be satisfactorily addressed. No other social issues have
been identified.
Metorex reports that there are currently no land claims over Metorex mining properties.
Legal Compliance
A draft EIA for Chibuluma South has been submitted to the Zambian Environmental Management Authority
(“ZEMA”) for consideration. It is unlikely that there will be any problems associated with permission to mine.
Environmental licences for 2012 had been issued by ZEMA.
The RAP for Chibuluma South with respect to the community in proximity to the tailings dam is approved.
It is SRK’s view that provided the mine adheres to the remedial measures and obligations of the EIA, there
should be no reason that would prevent the MR from being renewed. This does not constitute a legal review
and SRK does not make any claim or state any opinion as to the ability of the mine to obtain or renew the
necessary permits. It must also be noted that this opinion by SRK does not imply that the mine is in strict
compliance with all the requirements of the EIA or other permits.
The EIS for Chifupu was approved in June 2013
4.16.7 Mine Closure Planning and Cost Estimate [SR5.2C]
Mine closure costs have been estimated by AMC for both Chibuluma West (including Chibuluma East) and
Chibuluma South. SRK used AMC’s itemised cost estimates to develop spreadsheets in order to make certain
adjustments to the estimates, which are discussed separately below. AMC deducted amounts of USD119 000
and USD264 000 from the gross closure cost estimate for Chibuluma South and West respectively, as a
reduction to reflect work already completed. While this work is clearly of some benefit and the mine SHEC
department is clearly committed to the rehabilitation work, onsite observations did not indicate that all work
carried out was of a sufficient standard to provide comfort that the rehabilitation achieved would be maintenance
free and hence possibly need to be redone on closure. It is SRK’s view therefore, that it would be prudent not
to apply this correction and the figures quoted below are the gross cost estimates.
APPENDIX V COMPETENT PERSON’S REPORT AND VALUATION REPORT
V - 181
Other differences between the AMC cost estimate and the reworked calculations are attributable to the following:
Differences between the unit costs for re-vegetation of the tailings dams and waste rock dumps as
calculated by AMC and SRK.
Inflation at 5%.
The re-vegetation costs for the tailings dams and waste rock dumps are based on labour intensive hand
planting, without the use of topsoil. Consideration of the provision for topsoil at Ruashi suggests that this
requirement could increase the re-vegetation cost by up to 60%. At Chibuluma the haulage costs are likely
to be less than that but a provision of 50% of the re-vegetation costs has been allowed for.
The contingency has been increased from 10% used by AMC to 20% to be consistent with that applied for
Ruashi.
A provision of 30% of the total to cover EPCM costs which were not included in the AMC estimate.
Chibuluma South
The total closure cost estimate by AMC in 2011 amounted to some USD1.9 million. The closure cost estimate
obtained by reworking the AMC estimate as described above is USD4.1 million.
Chibuluma West
The total cost estimate by AMC in 2011 amounted to some USD1.3 million. The closure cost estimate obtained
by reworking the AMC estimate and taking into account the differences noted above is USD2.9 million. This
figure includes a 10% contingency, which is also included in the AMC report.
Chibuluma East
No cost estimate has been seen for Chibuluma East. Based on the finding that the legal opinion obtained in this
respect has been shown to be incorrect, a provision of USD1 million is proposed to address this deficiency.
SRK did not visit Chibuluma East and has no way of calculating a more accurate estimate.
Total cost and residual risk
The possibility that on-going water treatment may be required in the post closure scenario and that closure
liabilities at Chibuluma East may be greater that the provision suggested, remain a risk. Omissions identified by
SRK in the report are regarded as possibilities and not certainties. Of these, in terms of environmental risk,
ongoing water treatment following closure is regarded as potentially material. Neither the likelihood nor the
quantum associated with this risk can be ascertained at this stage. The mine is actively assessing the situation
regarding ground water contamination and has implemented measures for its control in the operational phase.
Metorex has a group-wide provision for post-closure water treatment of around USD5 million. In SRK’s
experience, this figure is likely to be considerably more. In the absence of any proper evaluation of the extent
(quantities) and severity (pH or TDS) of water to be treated, SRK has in agreement with Metorex increased this
provision for post closure water treatment to USD25 million for the group for evaluation purposes, of which
USD5 Million is allocated to Chibuluma.
SRK’s total closure cost estimate for Chibuluma, is therefore USD13.0 million.
4.17 Material Contracts
4.17.1 Concentrate Sale Agreement [SR5.8]
Chibuluma sells all its copper concentrate to CCS. The agreement covers the period from 21 December 2012 to
20 December 2013 and can be extended by mutual agreement.
Chibuluma is required to provide quarterly forecasts of concentrate tonnes to CCS and to endeavour to deliver
concentrate evenly on a monthly basis.
The concentrates should be free of deleterious impurities that would prevent CCS from employing its smelting
and refining process. Maximum acceptable contents in the sulphide flotation concentrate are specified for
moisture content, insoluble (SiO2 and Al2O3) As, Bi and Se. Penalty charges are levied on each daily lot of
concentrate where the content of As, Pb, Zn, Bi, Hg, Se and moisture exceeds prescribed values.
The price paid for the final copper content after smelting and refining is a percentage of the LME Grade A
settlement price as published in the London Metal Bulletin (published by Metal Bulletin Journals Ltd), less
APPENDIX V COMPETENT PERSON’S REPORT AND VALUATION REPORT
V - 182
treatment and refining charges according to the 2013 Annual Benchmark between concentrate producers and
custom smelting companies in Japan. Chibuluma receives credit for final agreed Au and Ag content subject to
certain deductions and realisation charges.
Payment for the contained copper is made in Zambian Kwacha, with Standard Chartered Bank’s 5-day average
buying and selling exchange rate used to convert USD invoice value into Zambia Kwacha.
4.17.2 Power Supply [SR5.7, SR5.8]
SRK understands that an amendment to the power supply agreement with CEC was signed which extended the
term of the agreement by ten years from October 2012 to October 2022. Chibuluma should consider
negotiating an increased declared maximum demand to 5 MW, especially in light of the planned electrical load
increase outlined above.
4.18 Financial Model The key TEPs from the Chibuluma FM are summarised in this section.
4.18.1 Financial / Economic Criteria Incorporated into the Chibuluma FM are the following financial / economic criteria:
The final deliveries in terms of a hedging contract were made in F2012. There are no hedging contracts in
place for F2013;
Capital allowances for tax purposes were recently changed so that capital expenditure in any given year
can be offset against income at 25% per year for that plus the following three years;
Metallurgical recovery for Cu for Chibuluma ore is set at 96.0% for H2-F2013, in line with the actual for
F2012 and H1-F2013, and kept at this level for the LoM. A 93% Cu recovery is applied for Chifupu ore;
The concentrate grade was set at 45.8% Cu in F2013, in line with the actual for F2012, and kept at this
level for the LoM;
A cost of USD2.50/t RoM allowed to transport the Chifupu ore to the Chibuluma processing facility;
Company tax is a variable rate determined according to the formula Y=30%+[a-(ab/c)], where a=15%,
b=8% and c=% ratio of assessable income to sales.
4.18.2 Changes to Metorex’s model SRK has incorporated certain adjustments into the Chibuluma LoM FM, as follows:
Removed the RoM production from Chibuluma and Chifupu for F2020 to F2022, plus adjusted the tonnage
and pro-rata contained copper in F2019 to match the aggregate Mineral Reserves reported in Table 4.7;
Adjusted the process recovery on a weighted tonnage basis to incorporate the lower recovery for Chifupu
ore;
The annual safety and training budget was increased to USD0.31 million per annum, which was in line with
the actual cost for H1-F2013;
In F2019, which is when production ceases in the adjusted LoM plan for Chibuluma, maintained the
following costs:
o Security at full cost for the whole year, to prevent theft of any items;
o Management fees for 6/12th of the whole year’s cost (due to equivalent of six month’s production);
o All other costs (administration, power, human resources, environment, community, IT, sundry) set at
8/12th of the annual cost, to cater for downsizing, demolition, closure/rehabilitation activities;
o Removed the operational capital of USD5.0 million per annum in each of F2018 to F2021, but
maintained the sustaining capital of USD1.5 million in F2018.
4.18.3 Financial model summary The key TEPs for the revised LoM FM for Chibuluma are summarised in Table 4.20.
The production schedule is as provided by Metorex and audited by SRK.
APPENDIX V COMPETENT PERSON’S REPORT AND VALUATION REPORT
V - 183
The process recoveries are supported by historical performance, metallurgical testwork and plant upgrade
projects.
The cost components for Chibuluma are based on the strategic business plans and detailed one-year budgets
as compiled by Metorex. SRK has reviewed these costs for reasonableness in relation to the actual costs
incurred in F2012 and H1-F2013. Where deemed necessary, SRK has adjusted the forecast costs as used in
the financial models.
The capital expenditures are as per the detailed budgets and forecasts supplied by Metorex and reviewed by
SRK. Based on its review, SRK has added capital amounts as deemed necessary.
SRK reviewed the terms of the off-take agreement and confirmed these were correctly incorporated into the
Chibuluma LoM FM.
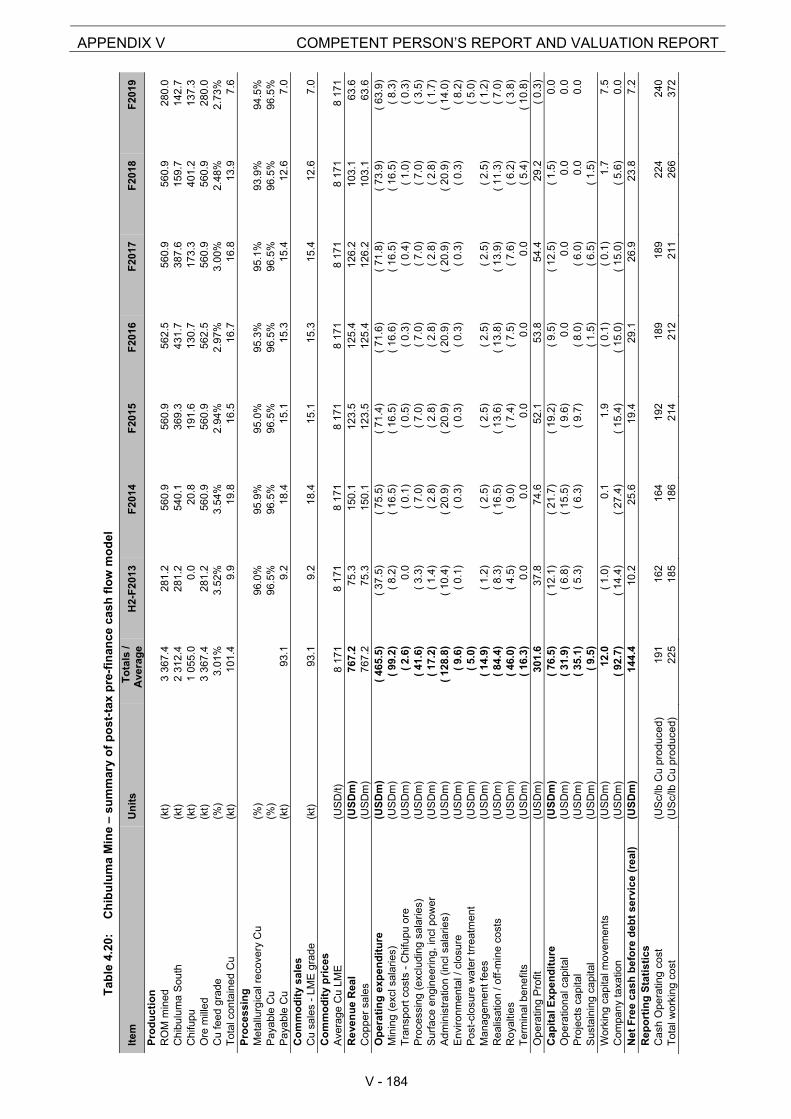
Tab
le 4
.20:
C
hib
ulu
ma
Min
e –
sum
mar
y o
f p
ost
-tax
pre
-fin
ance
cas
h f
low
mo
del
Item
U
nit
s
To
tals
/ A
vera
ge
H2-
F2
013
F20
14
F20
15F
2016
F20
17F
2018
F20
19
Pro
du
cti
on
R
OM
min
ed
(kt)
3
367.
428
1.2
560.
9
560.
956
2.5
560.
956
0.9
280.
0
Chi
bulu
ma
Sou
th
(kt)
2
312.
428
1.2
540.
1
369.
343
1.7
387.
615
9.7
142.
7
Chi
fupu
(kt)
1 05
5.0
0.0
20.8
19
1.6
130.
717
3.3
401.
213
7.3
Ore
mill
ed
(kt)
3
367.
428
1.2
560.
9
560.
956
2.5
560.
956
0.9
280.
0
Cu
feed
gra
de
(%)
3.01
%3.
52%
3.54
%
2.94
%2.
97%
3.00
%2.
48%
2.73
%
Tot
al c
onta
ined
Cu
(kt)
10
1.4
9.9
19.8
16
.516
.716
.813
.97.
6 P
roce
ssin
g
Met
allu
rgic
al r
ecov
ery
Cu
(%
) 96
.0%
95.9
%95
.0%
95.3
%95
.1%
93.9
%94
.5%
Pa
yabl
e C
u
(%)
96.5
%96
.5%
96.5
%96
.5%
96.5
%96
.5%
96.5
%P
aya
ble
Cu
(k
t)
93.1
9.2
18.4
15
.115
.315
.412
.67.
0 C
om
mo
dit
y s
ales
C
u sa
les
- LM
E g
rade
(k
t)
93.1
9.2
18.4
15
.115
.315
.412
.67.
0 C
om
mo
dit
y p
ric
es
Ave
rage
Cu
LME
(U
SD
/t)
8 17
18
171
8 17
18
171
8 17
18
171
8 17
18
171
Re
ven
ue
Rea
l (U
SD
m)
767
.2 7
5.3
150
.1
123
.5 1
25.4
126
.2 1
03.1
63.
6
Cop
per
sale
s (U
SD
m)
767
.2 7
5.3
150
.1
123
.5 1
25.4
126
.2 1
03.1
63.
6
Op
era
tin
g e
xpe
nd
itu
re
(US
Dm
) (
465.
5)(
37.5
)(
75.5
) (
71.4
)(
71.6
)(
71.8
)(
73.9
)(
63.9
) M
inin
g (e
xcl s
alar
ies)
(U
SD
m)
( 99
.2)
( 8.
2)(
16.5
) (
16.5
)(
16.6
)(
16.5
)(
16.5
)(
8.3)
T
rans
port
cos
ts -
Chi
fupu
ore
(U
SD
m)
( 2.
6) 0
.0(
0.1)
(
0.5)
( 0.
3)(
0.4)
( 1.
0)(
0.3)
P
roce
ssin
g (e
xclu
ding
sal
arie
s)
(US
Dm
) (
41.6
)(
3.3)
( 7.
0)
( 7.
0)(
7.0)
( 7.
0)(
7.0)
( 3.
5)
Sur
face
eng
inee
ring
, inc
l pow
er
(US
Dm
) (
17.2
)(
1.4)
( 2.
8)
( 2.
8)(
2.8)
( 2.
8)(
2.8)
( 1.
7)
Adm
inis
trat
ion
(incl
sal
arie
s)
(US
Dm
) (
128.
8)(
10.4
)(
20.9
) (
20.9
)(
20.9
)(
20.9
)(
20.9
)(
14.0
) E
nviro
nmen
tal /
clo
sure
(U
SD
m)
( 9.
6)(
0.1)
( 0.
3)
( 0.
3)(
0.3)
( 0.
3)(
0.3)
( 8.
2)
Pos
t-cl
osur
e w
ate
r tr
reat
men
t (U
SD
m)
( 5.
0)(
5.0)
M
anag
emen
t fe
es
(US
Dm
) (
14.9
)(
1.2)
( 2.
5)
( 2.
5)(
2.5)
( 2.
5)(
2.5)
( 1.
2)
Rea
lisat
ion
/ off-
min
e co
sts
(US
Dm
) (
84.4
)(
8.3)
( 16
.5)
( 13
.6)
( 13
.8)
( 13
.9)
( 11
.3)
( 7.
0)
Ro
yalti
es
(US
Dm
) (
46.0
)(
4.5)
( 9.
0)
( 7.
4)(
7.5)
( 7.
6)(
6.2)
( 3.
8)
Ter
min
al b
enef
its
(US
Dm
) (
16.3
) 0
.0 0
.0
0.0
0.0
0.0
( 5.
4)(
10.8
) O
pera
ting
Pro
fit
(US
Dm
) 3
01.6
37.
8 7
4.6
5
2.1
53.
8 5
4.4
29.
2(
0.3)
C
apit
al E
xpe
nd
itu
re
(US
Dm
) (
76.5
)(
12.1
)(
21.7
) (
19.2
)(
9.5)
( 12
.5)
( 1.
5) 0
.0
Ope
ratio
nal c
apita
l (U
SD
m)
( 31
.9)
( 6.
8)(
15.5
) (
9.6)
0.0
0.0
0.0
0.0
P
roje
cts
capi
tal
(US
Dm
) (
35.1
)(
5.3)
( 6.
3)
( 9.
7)(
8.0)
( 6.
0) 0
.0 0
.0
Sus
tain
ing
capi
tal
(US
Dm
) (
9.5)
( 1.
5)(
6.5)
( 1.
5)W
orki
ng c
apita
l mov
emen
ts
(US
Dm
) 1
2.0
( 1.
0) 0
.1
1.9
( 0.
1)(
0.1)
1.7
7.5
C
ompa
ny
taxa
tion
(US
Dm
) (
92.7
)(
14.4
)(
27.4
) (
15.4
)(
15.0
)(
15.0
)(
5.6)
0.0
N
et F
ree
cash
bef
ore
deb
t se
rvic
e (r
eal)
(U
SD
m)
144
.4 1
0.2
25.
6
19.
4 2
9.1
26.
9 2
3.8
7.2
R
epo
rtin
g S
tati
stic
s
Cas
h O
pera
ting
cost
(U
Sc/
lb C
u pr
odu
ced)
1
91 1
62 1
64
192
189
189
224
240
T
otal
wor
king
co
st
(US
c/lb
Cu
prod
uce
d)
225
185
186
2
14 2
12 2
11 2
66 3
72
APPENDIX V COMPETENT PERSON’S REPORT AND VALUATION REPORT
V - 184
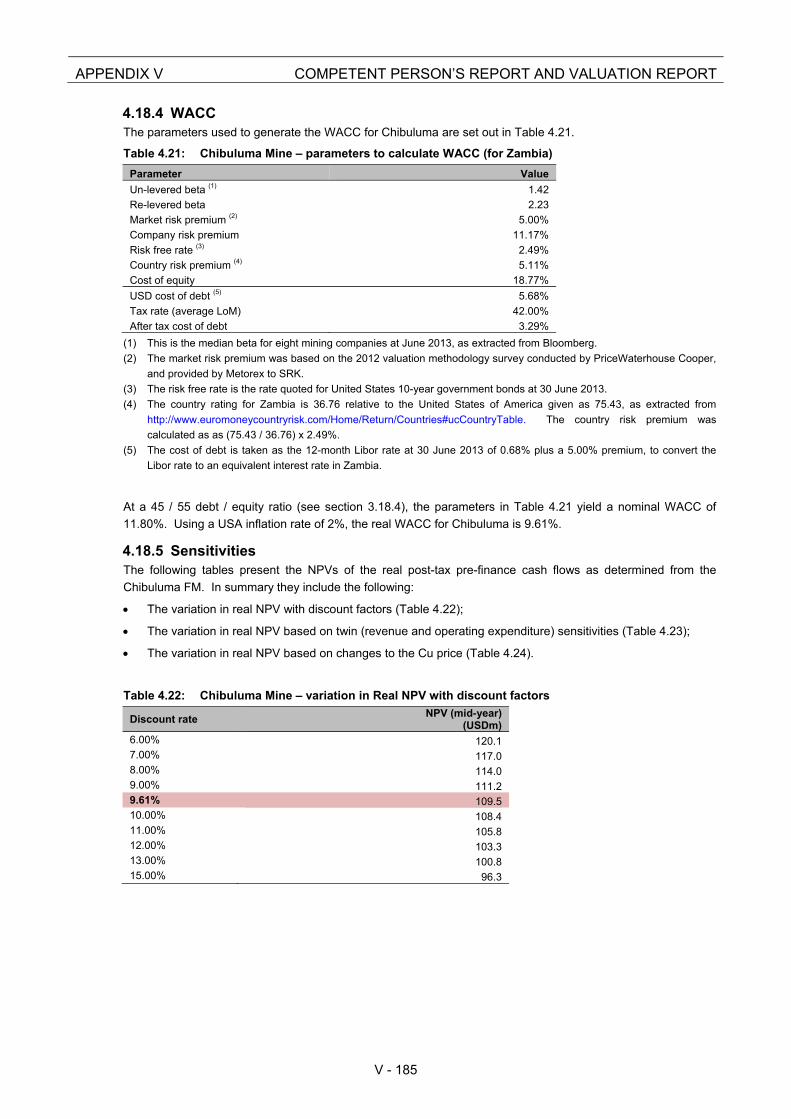
APPENDIX V COMPETENT PERSON’S REPORT AND VALUATION REPORT
V - 185
4.18.4 WACC The parameters used to generate the WACC for Chibuluma are set out in Table 4.21.
Table 4.21: Chibuluma Mine – parameters to calculate WACC (for Zambia)
Parameter Value
Un-levered beta (1) 1.42
Re-levered beta 2.23
Market risk premium (2) 5.00%
Company risk premium 11.17%
Risk free rate (3) 2.49%
Country risk premium (4) 5.11%
Cost of equity 18.77%
USD cost of debt (5) 5.68%
Tax rate (average LoM) 42.00%
After tax cost of debt 3.29%
(1) This is the median beta for eight mining companies at June 2013, as extracted from Bloomberg.
(2) The market risk premium was based on the 2012 valuation methodology survey conducted by PriceWaterhouse Cooper,
and provided by Metorex to SRK.
(3) The risk free rate is the rate quoted for United States 10-year government bonds at 30 June 2013.
(4) The country rating for Zambia is 36.76 relative to the United States of America given as 75.43, as extracted from
http://www.euromoneycountryrisk.com/Home/Return/Countries#ucCountryTable. The country risk premium was
calculated as as (75.43 / 36.76) x 2.49%.
(5) The cost of debt is taken as the 12-month Libor rate at 30 June 2013 of 0.68% plus a 5.00% premium, to convert the
Libor rate to an equivalent interest rate in Zambia.
At a 45 / 55 debt / equity ratio (see section 3.18.4), the parameters in Table 4.21 yield a nominal WACC of
11.80%. Using a USA inflation rate of 2%, the real WACC for Chibuluma is 9.61%.
4.18.5 Sensitivities The following tables present the NPVs of the real post-tax pre-finance cash flows as determined from the
Chibuluma FM. In summary they include the following:
The variation in real NPV with discount factors (Table 4.22);
The variation in real NPV based on twin (revenue and operating expenditure) sensitivities (Table 4.23);
The variation in real NPV based on changes to the Cu price (Table 4.24).
Table 4.22: Chibuluma Mine – variation in Real NPV with discount factors
Discount rate NPV (mid-year)
(USDm)6.00% 120.1 7.00% 117.0 8.00% 114.0 9.00% 111.2 9.61% 109.5 10.00% 108.4 11.00% 105.8 12.00% 103.3 13.00% 100.8 15.00% 96.3
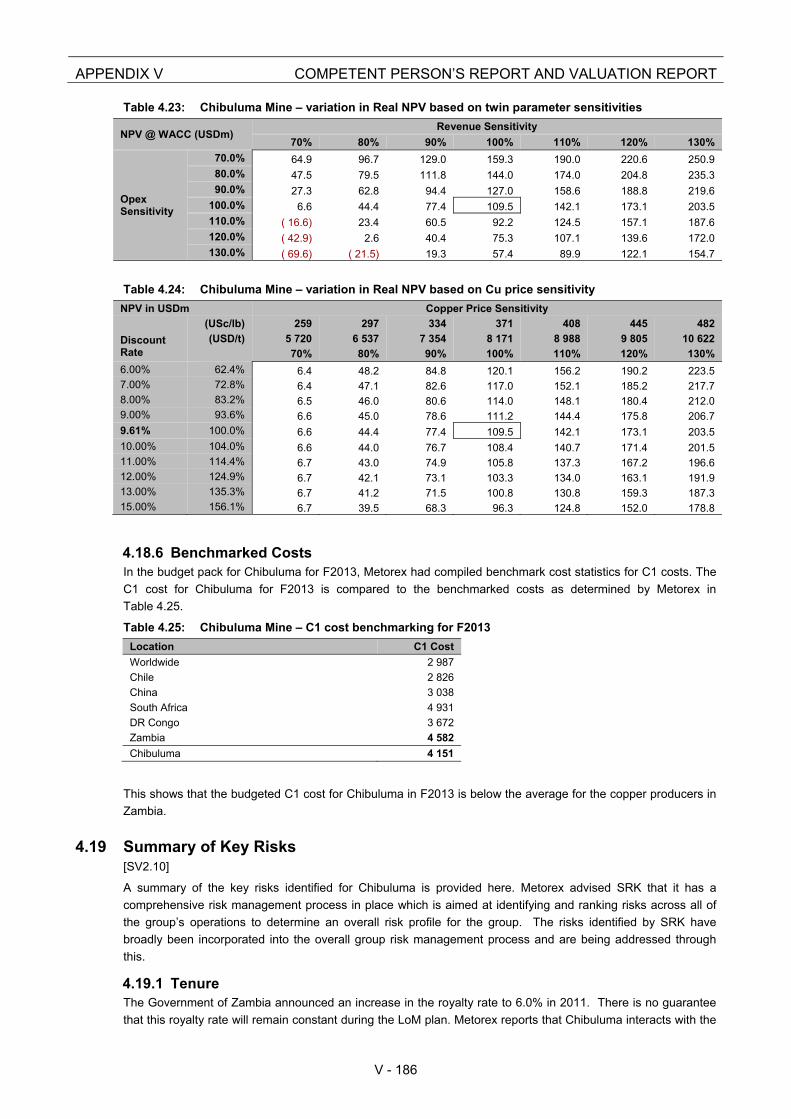
APPENDIX V COMPETENT PERSON’S REPORT AND VALUATION REPORT
V - 186
Table 4.23: Chibuluma Mine – variation in Real NPV based on twin parameter sensitivities
NPV @ WACC (USDm) Revenue Sensitivity
70% 80% 90% 100% 110% 120% 130%
Opex Sensitivity
70.0% 64.9 96.7 129.0 159.3 190.0 220.6 250.980.0% 47.5 79.5 111.8 144.0 174.0 204.8 235.390.0% 27.3 62.8 94.4 127.0 158.6 188.8 219.6
100.0% 6.6 44.4 77.4 109.5 142.1 173.1 203.5110.0% ( 16.6) 23.4 60.5 92.2 124.5 157.1 187.6120.0% ( 42.9) 2.6 40.4 75.3 107.1 139.6 172.0130.0% ( 69.6) ( 21.5) 19.3 57.4 89.9 122.1 154.7
Table 4.24: Chibuluma Mine – variation in Real NPV based on Cu price sensitivity
NPV in USDm Copper Price Sensitivity
(USc/lb) 259 297 334 371 408 445 482
Discount Rate
(USD/t) 5 720 6 537 7 354 8 171 8 988 9 805 10 622
70% 80% 90% 100% 110% 120% 130%
6.00% 62.4% 6.4 48.2 84.8 120.1 156.2 190.2 223.57.00% 72.8% 6.4 47.1 82.6 117.0 152.1 185.2 217.78.00% 83.2% 6.5 46.0 80.6 114.0 148.1 180.4 212.09.00% 93.6% 6.6 45.0 78.6 111.2 144.4 175.8 206.79.61% 100.0% 6.6 44.4 77.4 109.5 142.1 173.1 203.510.00% 104.0% 6.6 44.0 76.7 108.4 140.7 171.4 201.511.00% 114.4% 6.7 43.0 74.9 105.8 137.3 167.2 196.612.00% 124.9% 6.7 42.1 73.1 103.3 134.0 163.1 191.913.00% 135.3% 6.7 41.2 71.5 100.8 130.8 159.3 187.315.00% 156.1% 6.7 39.5 68.3 96.3 124.8 152.0 178.8
4.18.6 Benchmarked Costs In the budget pack for Chibuluma for F2013, Metorex had compiled benchmark cost statistics for C1 costs. The
C1 cost for Chibuluma for F2013 is compared to the benchmarked costs as determined by Metorex in
Table 4.25.
Table 4.25: Chibuluma Mine – C1 cost benchmarking for F2013
Location C1 Cost
Worldwide 2 987
Chile 2 826
China 3 038
South Africa 4 931
DR Congo 3 672
Zambia 4 582
Chibuluma 4 151
This shows that the budgeted C1 cost for Chibuluma in F2013 is below the average for the copper producers in
Zambia.
4.19 Summary of Key Risks [SV2.10]
A summary of the key risks identified for Chibuluma is provided here. Metorex advised SRK that it has a
comprehensive risk management process in place which is aimed at identifying and ranking risks across all of
the group’s operations to determine an overall risk profile for the group. The risks identified by SRK have
broadly been incorporated into the overall group risk management process and are being addressed through
this.
4.19.1 Tenure The Government of Zambia announced an increase in the royalty rate to 6.0% in 2011. There is no guarantee
that this royalty rate will remain constant during the LoM plan. Metorex reports that Chibuluma interacts with the
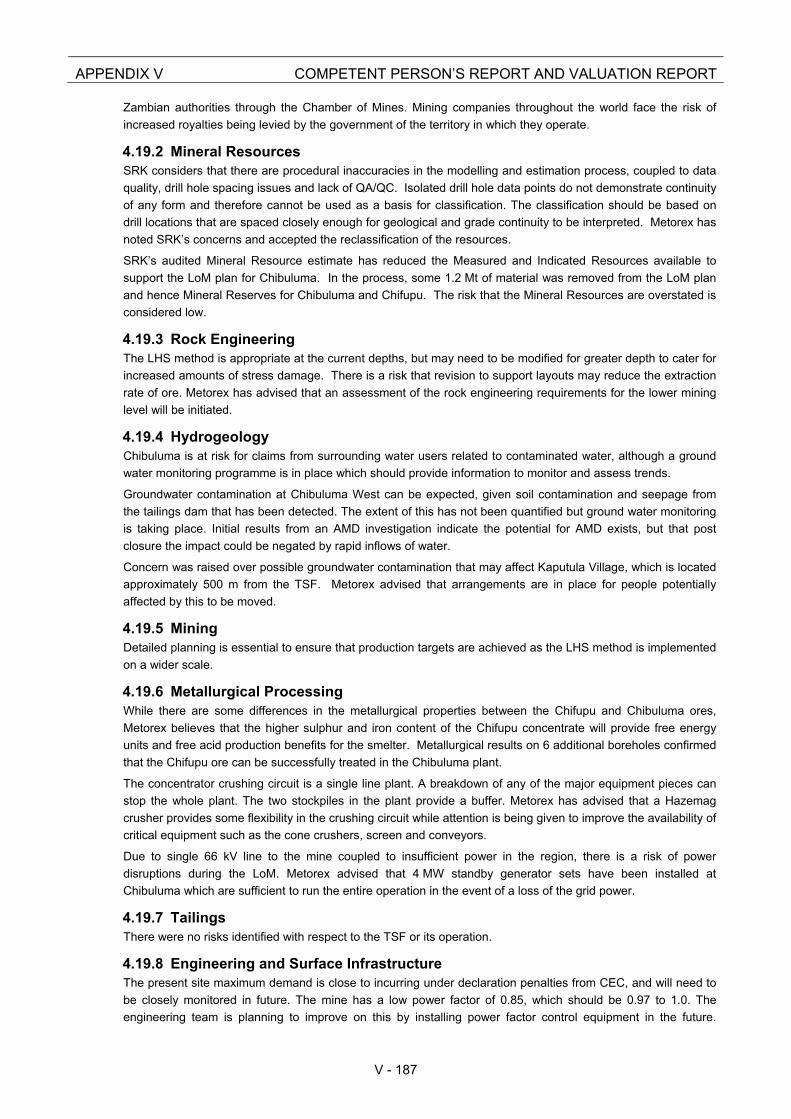
APPENDIX V COMPETENT PERSON’S REPORT AND VALUATION REPORT
V - 187
Zambian authorities through the Chamber of Mines. Mining companies throughout the world face the risk of
increased royalties being levied by the government of the territory in which they operate.
4.19.2 Mineral Resources SRK considers that there are procedural inaccuracies in the modelling and estimation process, coupled to data
quality, drill hole spacing issues and lack of QA/QC. Isolated drill hole data points do not demonstrate continuity
of any form and therefore cannot be used as a basis for classification. The classification should be based on
drill locations that are spaced closely enough for geological and grade continuity to be interpreted. Metorex has
noted SRK’s concerns and accepted the reclassification of the resources.
SRK’s audited Mineral Resource estimate has reduced the Measured and Indicated Resources available to
support the LoM plan for Chibuluma. In the process, some 1.2 Mt of material was removed from the LoM plan
and hence Mineral Reserves for Chibuluma and Chifupu. The risk that the Mineral Resources are overstated is
considered low.
4.19.3 Rock Engineering The LHS method is appropriate at the current depths, but may need to be modified for greater depth to cater for
increased amounts of stress damage. There is a risk that revision to support layouts may reduce the extraction
rate of ore. Metorex has advised that an assessment of the rock engineering requirements for the lower mining
level will be initiated.
4.19.4 Hydrogeology Chibuluma is at risk for claims from surrounding water users related to contaminated water, although a ground
water monitoring programme is in place which should provide information to monitor and assess trends.
Groundwater contamination at Chibuluma West can be expected, given soil contamination and seepage from
the tailings dam that has been detected. The extent of this has not been quantified but ground water monitoring
is taking place. Initial results from an AMD investigation indicate the potential for AMD exists, but that post
closure the impact could be negated by rapid inflows of water.
Concern was raised over possible groundwater contamination that may affect Kaputula Village, which is located
approximately 500 m from the TSF. Metorex advised that arrangements are in place for people potentially
affected by this to be moved.
4.19.5 Mining Detailed planning is essential to ensure that production targets are achieved as the LHS method is implemented
on a wider scale.
4.19.6 Metallurgical Processing While there are some differences in the metallurgical properties between the Chifupu and Chibuluma ores,
Metorex believes that the higher sulphur and iron content of the Chifupu concentrate will provide free energy
units and free acid production benefits for the smelter. Metallurgical results on 6 additional boreholes confirmed
that the Chifupu ore can be successfully treated in the Chibuluma plant.
The concentrator crushing circuit is a single line plant. A breakdown of any of the major equipment pieces can
stop the whole plant. The two stockpiles in the plant provide a buffer. Metorex has advised that a Hazemag
crusher provides some flexibility in the crushing circuit while attention is being given to improve the availability of
critical equipment such as the cone crushers, screen and conveyors.
Due to single 66 kV line to the mine coupled to insufficient power in the region, there is a risk of power
disruptions during the LoM. Metorex advised that 4 MW standby generator sets have been installed at
Chibuluma which are sufficient to run the entire operation in the event of a loss of the grid power.
4.19.7 Tailings There were no risks identified with respect to the TSF or its operation.
4.19.8 Engineering and Surface Infrastructure The present site maximum demand is close to incurring under declaration penalties from CEC, and will need to
be closely monitored in future. The mine has a low power factor of 0.85, which should be 0.97 to 1.0. The
engineering team is planning to improve on this by installing power factor control equipment in the future.
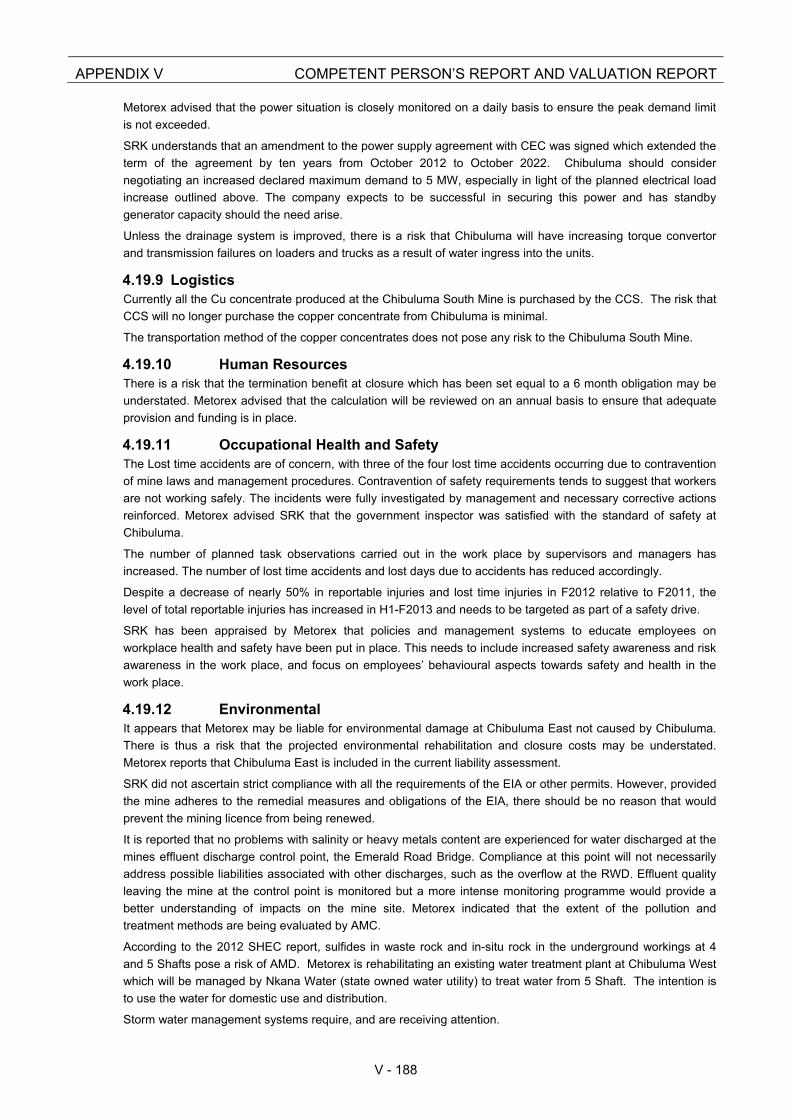
APPENDIX V COMPETENT PERSON’S REPORT AND VALUATION REPORT
V - 188
Metorex advised that the power situation is closely monitored on a daily basis to ensure the peak demand limit
is not exceeded.
SRK understands that an amendment to the power supply agreement with CEC was signed which extended the
term of the agreement by ten years from October 2012 to October 2022. Chibuluma should consider
negotiating an increased declared maximum demand to 5 MW, especially in light of the planned electrical load
increase outlined above. The company expects to be successful in securing this power and has standby
generator capacity should the need arise.
Unless the drainage system is improved, there is a risk that Chibuluma will have increasing torque convertor
and transmission failures on loaders and trucks as a result of water ingress into the units.
4.19.9 Logistics Currently all the Cu concentrate produced at the Chibuluma South Mine is purchased by the CCS. The risk that
CCS will no longer purchase the copper concentrate from Chibuluma is minimal.
The transportation method of the copper concentrates does not pose any risk to the Chibuluma South Mine.
4.19.10 Human Resources There is a risk that the termination benefit at closure which has been set equal to a 6 month obligation may be
understated. Metorex advised that the calculation will be reviewed on an annual basis to ensure that adequate
provision and funding is in place.
4.19.11 Occupational Health and Safety The Lost time accidents are of concern, with three of the four lost time accidents occurring due to contravention
of mine laws and management procedures. Contravention of safety requirements tends to suggest that workers
are not working safely. The incidents were fully investigated by management and necessary corrective actions
reinforced. Metorex advised SRK that the government inspector was satisfied with the standard of safety at
Chibuluma.
The number of planned task observations carried out in the work place by supervisors and managers has
increased. The number of lost time accidents and lost days due to accidents has reduced accordingly.
Despite a decrease of nearly 50% in reportable injuries and lost time injuries in F2012 relative to F2011, the
level of total reportable injuries has increased in H1-F2013 and needs to be targeted as part of a safety drive.
SRK has been appraised by Metorex that policies and management systems to educate employees on
workplace health and safety have been put in place. This needs to include increased safety awareness and risk
awareness in the work place, and focus on employees’ behavioural aspects towards safety and health in the
work place.
4.19.12 Environmental It appears that Metorex may be liable for environmental damage at Chibuluma East not caused by Chibuluma.
There is thus a risk that the projected environmental rehabilitation and closure costs may be understated.
Metorex reports that Chibuluma East is included in the current liability assessment.
SRK did not ascertain strict compliance with all the requirements of the EIA or other permits. However, provided
the mine adheres to the remedial measures and obligations of the EIA, there should be no reason that would
prevent the mining licence from being renewed.
It is reported that no problems with salinity or heavy metals content are experienced for water discharged at the
mines effluent discharge control point, the Emerald Road Bridge. Compliance at this point will not necessarily
address possible liabilities associated with other discharges, such as the overflow at the RWD. Effluent quality
leaving the mine at the control point is monitored but a more intense monitoring programme would provide a
better understanding of impacts on the mine site. Metorex indicated that the extent of the pollution and
treatment methods are being evaluated by AMC.
According to the 2012 SHEC report, sulfides in waste rock and in-situ rock in the underground workings at 4
and 5 Shafts pose a risk of AMD. Metorex is rehabilitating an existing water treatment plant at Chibuluma West
which will be managed by Nkana Water (state owned water utility) to treat water from 5 Shaft. The intention is
to use the water for domestic use and distribution.
Storm water management systems require, and are receiving attention.
APPENDIX V COMPETENT PERSON’S REPORT AND VALUATION REPORT
V - 189
There are 80 affected households living in close proximity to the TSF at Chibuluma South that have expressed
concern regarding impacts, including air quality and possible AMD. Metorex reports that it has allocated a
budget of USD1 million for the resettlement of these people according to an approved RAP.
Metorex has a group-wide provision for post-closure water treatment of around USD5 million. In SRK’s
experience, this figure is likely to be considerably more. In the absence of any proper evaluation of the extent
(quantities) and severity (pH or TDS) of water to be treated, SRK has in agreement with Metorex increased this
provision for post closure water treatment to USD25 million for the group for evaluation purposes, of which
USD5 Million is allocated to Chibuluma.
Metorex is actively assessing the situation regarding ground water contamination and has implemented
measures for its control in the operational phase.