Siloxane additive as modifier in cationic UV curable coatings

[Ebere M., 3(6): June, 2014] ISSN: 2277-9655
Scientific Journal Impact Factor: 3.449
(ISRA), Impact Factor: 1.852
http: // www.ijesrt.com(C)International Journal of Engineering Sciences & Research Technology
[589-605]
IJESRT INTERNATIONAL JOURNAL OF ENGINEERING SCIENCES & RESEARCH TECHNOLOGY
Brown Sea Bean (Mucuna Sloanei) Shell, an Effective Adsorbent for Cationic Dye Removal Ejikeme, Ebere M. 1, Ejikeme, P. C. N. 1, Abalu, Benjamin. N. 2
1 Chemical Engineering Department, Enugu State University of Science and Technology, Enugu, Enugu State Nigeria. 2 Chemical Engineering Department, Institute of Management and Technology, Enugu, Enugu State Nigeria
Abstract
Brown sea bean (mucuna sloanei) shell has been used as an alternative adsorbent for removing cationic dye from aqueous medium. The effects of pH, initial dye
concentration, temperature, and contact time were investigated using the batch technique. The result indicated that the adsorption was strongly dependent on the
four factors. The FTIR analysis of the functional groups present on both the precursor and the activated carbon revealed that many peaks present on the precursor
disappeared on the activated carbon while those remaining were weak. This is as a result of breakage of many bonds on the KOH impregnated precursor leading
to the liberation of volatile species. The kinetic data were fitted to first order model, second order model and Boyd model. Dye uptake process followed the Boyd
kinetic model more appropriately. The isotherm data were fitted to Langmuir and Freundlich isotherm models, the Freundlich isotherm best fitted the process.
Thermodynamic parameters such as: Gibb’s free energy change (G), standard enthalpy change (H), standard entropy change (S) calculated, indicated
spontaneous and endothermic nature of the process.
Keywords: Activated carbon, Brown sea bean (mucuna sloanei), Cationic dye, Methylene blue, Thermodynamic study
Introduction
Dyes used in textile industries have complex aromatic molecular
structures which make them inert and biodegradably difficult when
discharged into the environment [1]. When discharged into water bodies,
they are harmful to aquatic lives. Even at very low concentration, it can be
highly toxic to aquatic systems. They can hinder light penetration and may
in consequence disturb biological processes in water bodies [1].
Methylene blue (MB) is a cationic dye that is most commonly used for
colouring among all other dyes of its category and is generally used for
dying cotton and silk [3]. This dye has been studied because of its known
strong adsorption onto solids, and it often serves as a model compound for
removing organic contaminants and coloured bodies from aqueous
[Ebere M., 3(6): June, 2014] ISSN: 2277-9655
Scientific Journal Impact Factor: 3.449
(ISRA), Impact Factor: 1.852
http: // www.ijesrt.com(C)International Journal of Engineering Sciences & Research Technology
[589-605]
solutions [4,5,6]. Due to the harmful impacts of such dye, it is
environmentally important to remove them from waste streams before
discharge the public water sources.
In the last few decades, adsorption has been proved to be a well-
established and cheap pollutant removal process among other types of
existing effluent treatment techniques due to its easy applicability, and
good efficiency.
From different available adsorbents, activated carbons are one of the most
popular for both liquid and gas purification due to their unique properties,
including porous structure, high specific surface areas and large sorption
capacities [7]. In spite of its extensive use in waste water treatment,
commercial activated carbon remains an expensive material [8]. This has
lead many researchers to find out cheaper sources to prepare activated
carbon.
Previously, coal, lignite and wood which are carbonaceous sources are
commonly used precursors for production of activated carbon, but recently,
agricultural by-products have been successfully used to produce activated
carbon due to their high carbon and low ash content [8].
Mucuna belongs to the enormous legume family fabaceae. There are
many species of Mucuna throughout tropical regions of the world,
including M.Urens, M. Pruriens and M. Sloanei. Most species of Mucuna
are climbing woody wines called lianas that twine through the rain forest
trees like “botanical boa constrictors” [9]. It is found in the tropical and
sub-tropical regions of the world. The seeds are brown in colour,
commonly polished and are known as “sea beans because they are
commonly carried by rivers into ocean.
The edible inner part of Mucuna solanei is used in preparing various soups
as soup thickeners. In addition to their thickening property, it has gelatin
properties and imparts a gummy texture when used in soup [10]. The
frequent use of this legume as a thicker in soups results in pollution of the
environment with the inedible shells.
In this study, the inedible part of the sea bean (mucuna sloanei) shell was
used as a precursor in the production of activated carbon for MB removal .
Materials and methods
Preparation of sea bean (mucuna sloanei) shell.
The seeds were sorted to remove dirts and stalks. The cleaned seeds were
cut open to remove the shell from the inner edible part. The shell was
washed and dried. The dried sample was stored for further use.
Adsorbate
Methylene Blue (MB) (C1. 52015) with empirical formular C16H18N3SC1
and formular weight of 319.9g/mol was supplied by De Cliff Integrated Ltd
Ogbete Enugu, Enugu State Nigeria (97% purity). It has maximum
absorbance at wavelength 661nm.
Preparation of Activated Carbon
The preparation of the adsorbent was in accordance of the method used by
[11] with slight modification.
[Ebere M., 3(6): June, 2014] ISSN: 2277-9655
Scientific Journal Impact Factor: 3.449
(ISRA), Impact Factor: 1.852
http: // www.ijesrt.com(C)International Journal of Engineering Sciences & Research Technology
[589-605]
Preparation of Methylene Blue Solution
Double distilled water supplied by Pymotech Research Center Abakpa
Enugu State of Nigeria was used for the preparation of the solutions. A
1000mg/l stock solution was prepared and from there, necessary dilutions
were made to obtain the desired concentration.
Characterization of Activated Carbon
The surface functional groups and structure were studied by fourier
transform infrared spectroscopy [ Buck 530 IR ]. The FTIR spectra of the
raw material and activated carbon were scanned at a wavelength of 600–
4000nm to obtain its spectra lines.
Effect of pH on MB Adsorption
To study effect of pH on adsorption of MB on hamburger seed shell
activated carbon, the experiments were carried out at 30mg/l, 50mg/l and
80mg/l initial concentration with 0.02g of the adsorbent per 50ml of the
adsorbate at room temperature for 4 hours equilibrium time. The initial pH
values were adjusted to 2,4,6,8,10 with 0.1M Hcl or 0.1m NaOH using pH
meter (Jenway Model 3510, England). At the end of the process, the
suspension was centrifuged and the residual dye was analysed using
Shimadzu UV-Vis 1601 spectrophotometer. All the measurements were
made at 661nm, a wavelength corresponding to the maximum adsorbance.
Effect of Dosage
The effect of adsorbent dosage on equilibrium uptake of MB was studied at
initial MB concentration of 30mg/l, 50mg/l 80mg/l and 110mg/l at
adsorbent dosage of 0.02g, 0.05g, 0.08g, 0.11g, 0.14g, 0.17g and 2g per
50mls of the solutions. The experiments were performed by shaking the
different adsorbent concentration with the above different adsorbent dosage
for 3 hours. After centrifugation the residual MB was analyzed.
Effect of Initial Concentration
The effect of different initial concentration of MB was analyzed using
initial concentration of 30mg/l, 50mg/l, 80mg/l, 110mg/l, 140mg/l and
180mg/l at adsorbent dosage of 0.02g and pH of 4 and 10. The solutions
were equilibrated for 4 hours after which they were centrifuged. The
residual dye was analyzed.
Adsorption Isotherm
Batch isotherm studies were carried out in 250ml conical flask at different
temperature of 303K, 313K, 323Km 343K on an Isothermal sheker for 6
hours to ensure equilibrium. 0.02g of the adsorbent was mixed with 50ml of
30mg/l, 50mg/l, 80mg/l and 110mg/l of the solution at different pH of 4, 8
and 10. The pH was adjusted using 0.1M Hcl or 0.1M NaOH before
addition of the adsorbent. At the end of equilibrium time of 6 hours, the
reaction mixture was centrifuged and the residual MB concentration
analysed. The amount of MB adsorbent at equilibrium qe(mg/g) was
calculated from the following equation (3).
𝑞𝑒 = (𝐶𝑜 − 𝐶𝑒
𝑊) 𝑉 (1)
[Ebere M., 3(6): June, 2014] ISSN: 2277-9655
Scientific Journal Impact Factor: 3.449
(ISRA), Impact Factor: 1.852
http: // www.ijesrt.com(C)International Journal of Engineering Sciences & Research Technology
[589-605]
Results and discussion
Infrared Spectroscopy Analysis
The well known activity, reactively and adsorption efficiency of activated
carbon and other carbonaceous sorbents are mainly based and dependent on
the various loaded functional groups on the surface of these sorbents [17].
FTIR spectroscopy is an important technique used to identify characteristics
surfaces functional groups on the adsorbent, which in some cases are
responsible for the binding of the adsorbent molecules.
The functional groups on the adsorbent surface were identified by analyzing
the spectra using available literature [12], [13], [14], [15], [16].
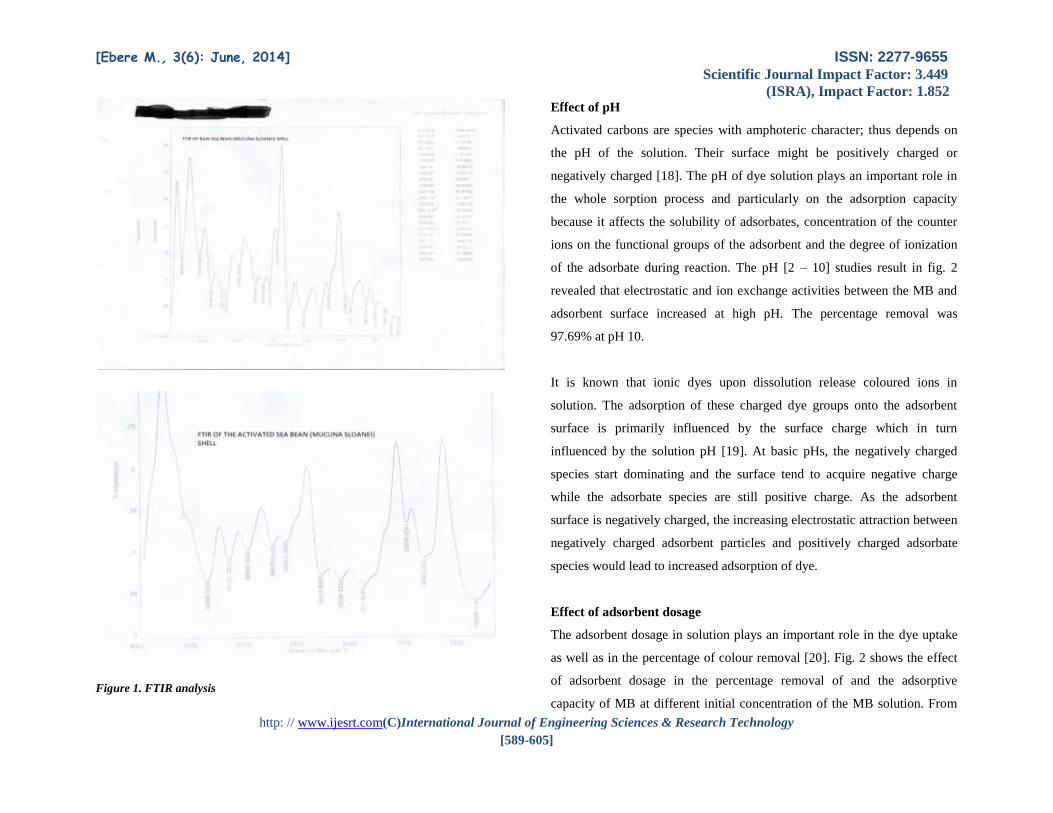
Fig. 1 shows the FTIR spectra of the activated carbon and it’s precursor in
the range of 600-4000cm-1. Several distinct and sharp absorption bands
were observed as well as relatively low intensity peaks for all sample
spectra.
The raw hamburger-shell shows indication of various surface
functional groups. The wide peaks between 3185.033 – 3803.987 cm-1
indicates 0-H stretching vibration of hydroxyl functional groups including
hydrogen bonding or adsorbed water. The peak at 2972.8 can be ascribed to
C-H stretching which described the presence of –CH and ≡CH groups
present in the lignin structure of the hamburger shell. The trichotomous
peaks at 2743.85325, 2628.28106 and 2531.97435 cm-1 are attributed to C-
OH stretching vibrations in carboxylic acid derivatives. The peaks in the
ranges of 2266.137 – 2425.026cm-1 can be linked to the C≡C stretching
vibration in alkyne groups. The peak at 1794.616cm-1 depicts –C ꞊ O
stretching from carboxylic acid group. The band located at 1678.55cm-1
corresponds to the formation of oxygen functional groups based on highly
conjugated C = O stretching in carboxylic or carboxylate group as well as
carbonyl group. The skeletal C꞊C vibration in aromatic rings cause band at
1438.687cm-1. The appearance of a band at 1364.13cm-1 can be attributed to
C – O stretching vibration in carboxylate groups. The band at 1140.975cm-1
and band at about 1008.632cm-1 can be assigned to C-O stretching vibration
in alcohols, phenols, or ether or ester groups. The bands at 867.49412cm-1
and relatively intense band at 773.2506cm-1 are C-H out of plane bending of
benzene derivatives. Finally, the band caused by O-H out of plane bending
vibrations band is located at 672.5205cm-1.
The FTIR spectra of activated carbon are equally shown in fig. 1. Fewer
functional groups were detected, indicating that the surface functional
groups of hamburger shell experienced chemical changes during
carbonization. Many peaks present in the raw hamburger shell spectrum
absolutely disappeared in the activated carbon spectrum while those
remaining were weak to a great extent. This is consistent with the breaking
of many bonds in the KOH impregnated raw hamburger shell leading to the
libration and elimination of volatile species and partial aromatization during
carbonization [13], [17].
[Ebere M., 3(6): June, 2014] ISSN: 2277-9655
Scientific Journal Impact Factor: 3.449
(ISRA), Impact Factor: 1.852
http: // www.ijesrt.com(C)International Journal of Engineering Sciences & Research Technology
[589-605]
Figure 1. FTIR analysis
Effect of pH
Activated carbons are species with amphoteric character; thus depends on
the pH of the solution. Their surface might be positively charged or
negatively charged [18]. The pH of dye solution plays an important role in
the whole sorption process and particularly on the adsorption capacity
because it affects the solubility of adsorbates, concentration of the counter
ions on the functional groups of the adsorbent and the degree of ionization
of the adsorbate during reaction. The pH [2 – 10] studies result in fig. 2
revealed that electrostatic and ion exchange activities between the MB and
adsorbent surface increased at high pH. The percentage removal was
97.69% at pH 10.
It is known that ionic dyes upon dissolution release coloured ions in
solution. The adsorption of these charged dye groups onto the adsorbent
surface is primarily influenced by the surface charge which in turn
influenced by the solution pH [19]. At basic pHs, the negatively charged
species start dominating and the surface tend to acquire negative charge
while the adsorbate species are still positive charge. As the adsorbent
surface is negatively charged, the increasing electrostatic attraction between
negatively charged adsorbent particles and positively charged adsorbate
species would lead to increased adsorption of dye.
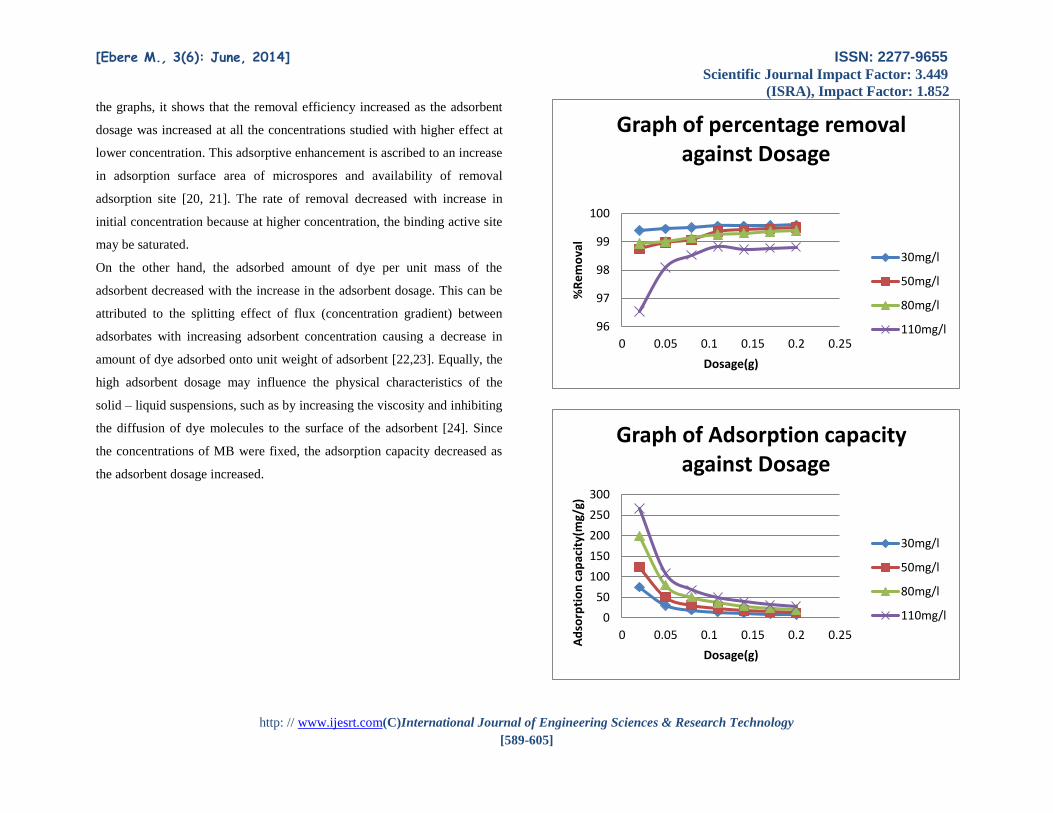
Effect of adsorbent dosage
The adsorbent dosage in solution plays an important role in the dye uptake
as well as in the percentage of colour removal [20]. Fig. 2 shows the effect
of adsorbent dosage in the percentage removal of and the adsorptive
capacity of MB at different initial concentration of the MB solution. From
[Ebere M., 3(6): June, 2014] ISSN: 2277-9655
Scientific Journal Impact Factor: 3.449
(ISRA), Impact Factor: 1.852
http: // www.ijesrt.com(C)International Journal of Engineering Sciences & Research Technology
[589-605]
the graphs, it shows that the removal efficiency increased as the adsorbent
dosage was increased at all the concentrations studied with higher effect at
lower concentration. This adsorptive enhancement is ascribed to an increase
in adsorption surface area of microspores and availability of removal
adsorption site [20, 21]. The rate of removal decreased with increase in
initial concentration because at higher concentration, the binding active site
may be saturated.
On the other hand, the adsorbed amount of dye per unit mass of the
adsorbent decreased with the increase in the adsorbent dosage. This can be
attributed to the splitting effect of flux (concentration gradient) between
adsorbates with increasing adsorbent concentration causing a decrease in
amount of dye adsorbed onto unit weight of adsorbent [22,23]. Equally, the
high adsorbent dosage may influence the physical characteristics of the
solid – liquid suspensions, such as by increasing the viscosity and inhibiting
the diffusion of dye molecules to the surface of the adsorbent [24]. Since
the concentrations of MB were fixed, the adsorption capacity decreased as
the adsorbent dosage increased.
96
97
98
99
100
0 0.05 0.1 0.15 0.2 0.25
%R
em
ova
l
Dosage(g)
Graph of percentage removal against Dosage
30mg/l
50mg/l
80mg/l
110mg/l
0
50
100
150
200
250
300
0 0.05 0.1 0.15 0.2 0.25
Ad
sorp
tio
n c
apac
ity(
mg/
g)
Dosage(g)
Graph of Adsorption capacity against Dosage
30mg/l
50mg/l
80mg/l
110mg/l

[Ebere M., 3(6): June, 2014] ISSN: 2277-9655
Scientific Journal Impact Factor: 3.449
(ISRA), Impact Factor: 1.852
http: // www.ijesrt.com(C)International Journal of Engineering Sciences & Research Technology
[589-605]
0
100
200
300
400
0 50 100 150 200
Ad
sorp
tio
n c
apac
ity(
mg/
g)
Initial concentration(mg/l)
Graph of Adsorption capacity against Initial concentration
PH4
PH10
0
20
40
60
80
100
120
0 50 100 150 200
%R
em
ova
l
Initial concentration(mg/l)
Graph of percentage removal against initial concentration
PH4
PH10
0
50
100
150
0 5 10 15
%R
em
ova
l
PH
Graph of percentage removal against PH
30mg/l
50mg/l
80mg/l

[Ebere M., 3(6): June, 2014] ISSN: 2277-9655
Scientific Journal Impact Factor: 3.449
(ISRA), Impact Factor: 1.852
http: // www.ijesrt.com(C)International Journal of Engineering Sciences & Research Technology
[589-605]
Figure 2. Effect plots
Effect of initial dye concentration
The study of effect of initial dye concentration on the adsorbent adsorption
capacity is a useful aspect of adsorption process. The initial concentration
played an important role in the adsorption capacity of MB on the adsorbent.
From the figure 2, the result shows that the removal efficiency decreased
from 99.4% to 82.58% as the initial concentrations were increased from
30mg/l to 80mg/l. This phenomenon is because at higher initial
concentrations, outrageous MB molecules were in solution as compared
with the available active vacant sites of the adsorbent. At lower initial MB
concentration, the possibility of absolute uptake of limited MB molecule
was higher leading to higher removal efficiency.
But in terms of adsorptive capacity, the reverse was the case because
increase in initial concentration increased the driving force to overcome the
mass transfer resistance for MB transfer between the solution and the
surface of the activated carbon [25]. The MB molecule countered the
boundary layer effect and then diffused from the boundary layer film onto
adsorbent surface and finally diffused into the porous structure of the
adsorbent [26].
Effect of contact time
The adsorption of MB onto the adsorbent was studied as a function of
contact time in order to decide the sufficient equilibrium time. Equilibrium
time is one of the most important parameters in the design of economical
wastewater treatment system (24,27]. The effect of contact time is shown in
fig. 2. The removal of MB by adsorption on the adsorbent was found to be
0
20
40
60
80
100
120
0 50 100 150 200 250 300
%R
em
ova
l
Time(mins)
PH2
PH4
PH6
PH8
PH10
96
97
98
99
100
0 20 40 60 80
% r
em
ova
l
Temperature (oC)
Effect of Temperature at different concentrations
30mg/l
50mg/l
80mg/l
110mg/l
[Ebere M., 3(6): June, 2014] ISSN: 2277-9655
Scientific Journal Impact Factor: 3.449
(ISRA), Impact Factor: 1.852
http: // www.ijesrt.com(C)International Journal of Engineering Sciences & Research Technology
[589-605]
rapid at the initial period and then to become slow and stagnate with the
increase in contact time. This is as a result of large number of vacant sites
on the surface of the adsorbent available during the initial stage of
adsorption, and afterward, it becomes difficult to occupy the remaining
vacant sites dye to the repulsive force between the adsorbed molecules on
the solid and bulk phases.
Effect of temperature
The temperature influence is an important controlling factor in the real
applications of the proposed adsorptive dye removal process since most of
the textile dye effluents are produced at relatively high temperature [26].
From the result, it can be seen that there was increase in the adsorption
capacity of MB from the bulk solution as temperature was increased.
Increase in temperature increased the entropy of the system resulting to
more successful collision of solute and adsorbent which yielded more
chances of adsorption [28]. There was an increase of mobility in the MB
solution and decrease of resistance on the diffusion particles at higher
temperature consequently boosting the adsorption capacity. In addition, the
higher mobility of molecules facilitates the formation of a surface mono
layer at higher temperature [29, 30].
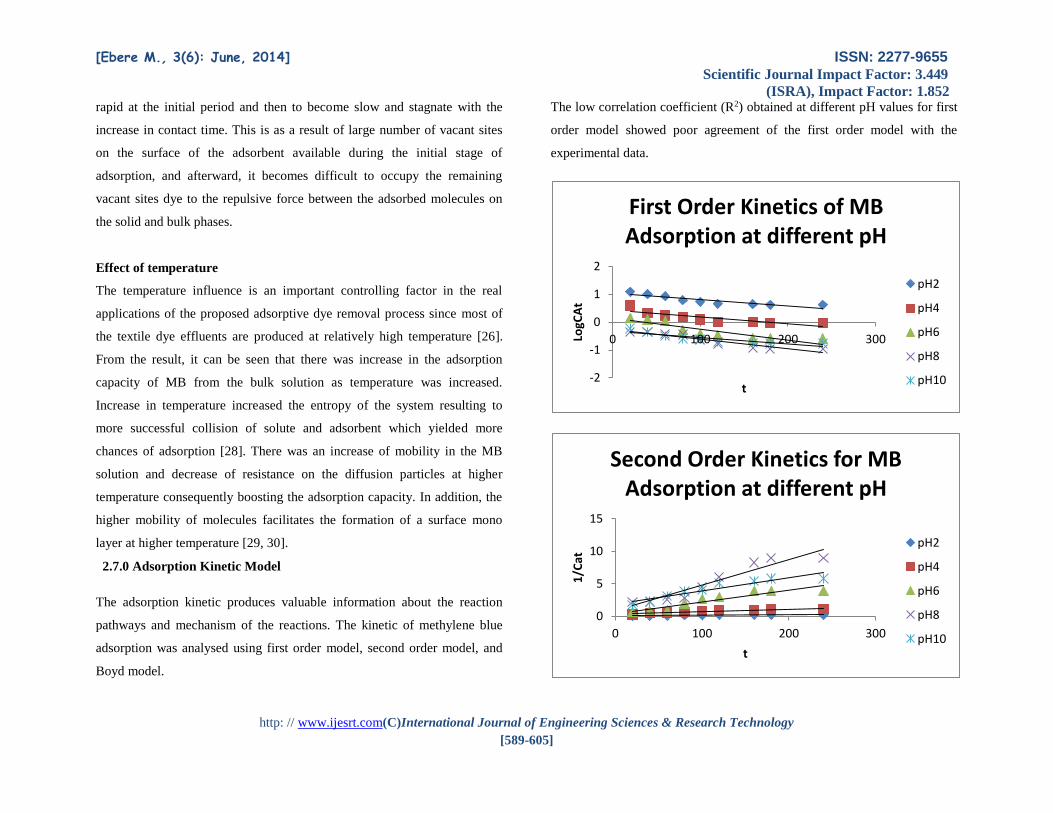
2.7.0 Adsorption Kinetic Model
The adsorption kinetic produces valuable information about the reaction
pathways and mechanism of the reactions. The kinetic of methylene blue
adsorption was analysed using first order model, second order model, and
Boyd model.
The low correlation coefficient (R2) obtained at different pH values for first
order model showed poor agreement of the first order model with the
experimental data.
-2
-1
0
1
2
0 100 200 300LogC
At
t
First Order Kinetics of MB Adsorption at different pH
pH2
pH4
pH6
pH8
pH10
0
5
10
15
0 100 200 300
1/C
at
t
Second Order Kinetics for MB Adsorption at different pH
pH2
pH4
pH6
pH8
pH10
[Ebere M., 3(6): June, 2014] ISSN: 2277-9655
Scientific Journal Impact Factor: 3.449
(ISRA), Impact Factor: 1.852
http: // www.ijesrt.com(C)International Journal of Engineering Sciences & Research Technology
[589-605]
Figure 3. Kinetics graphs
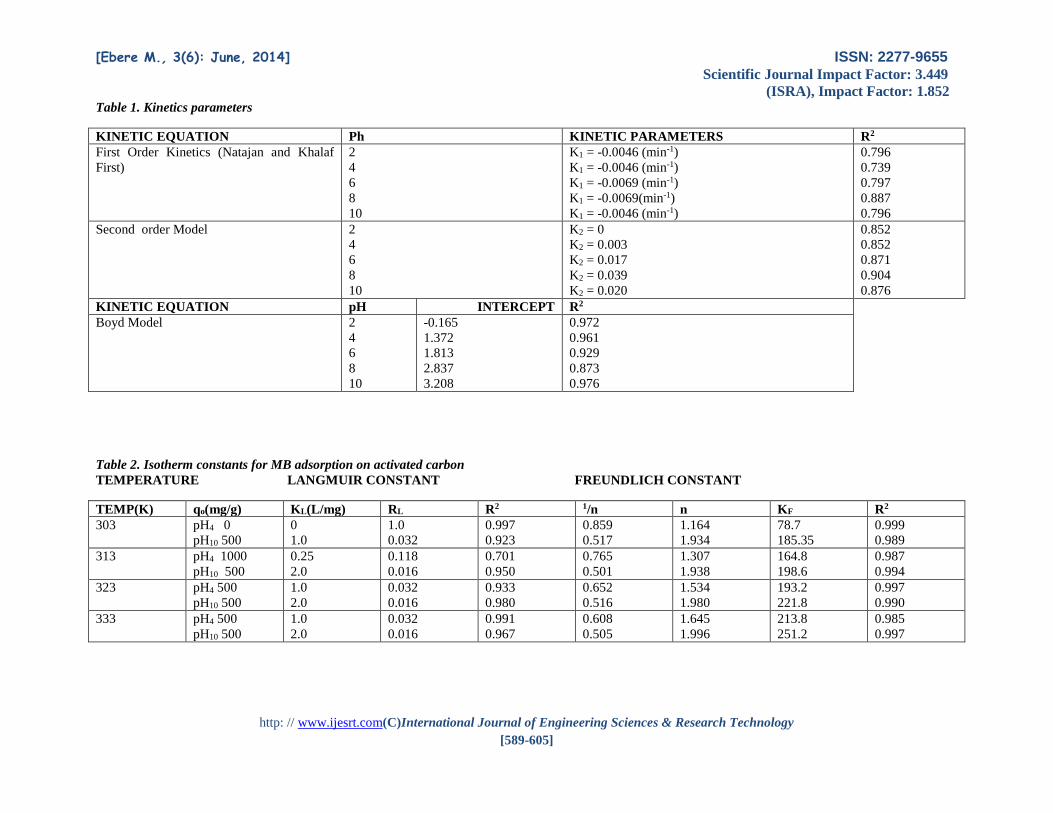
The values of K2 obtained for the second order model are presented in table
(1) at different pH with their equivalent correlation coefficients (R2). The
values of the correlation coefficient were relatively small compared to that
of the Boyd model meaning that the model did not fit the experimental
values well.
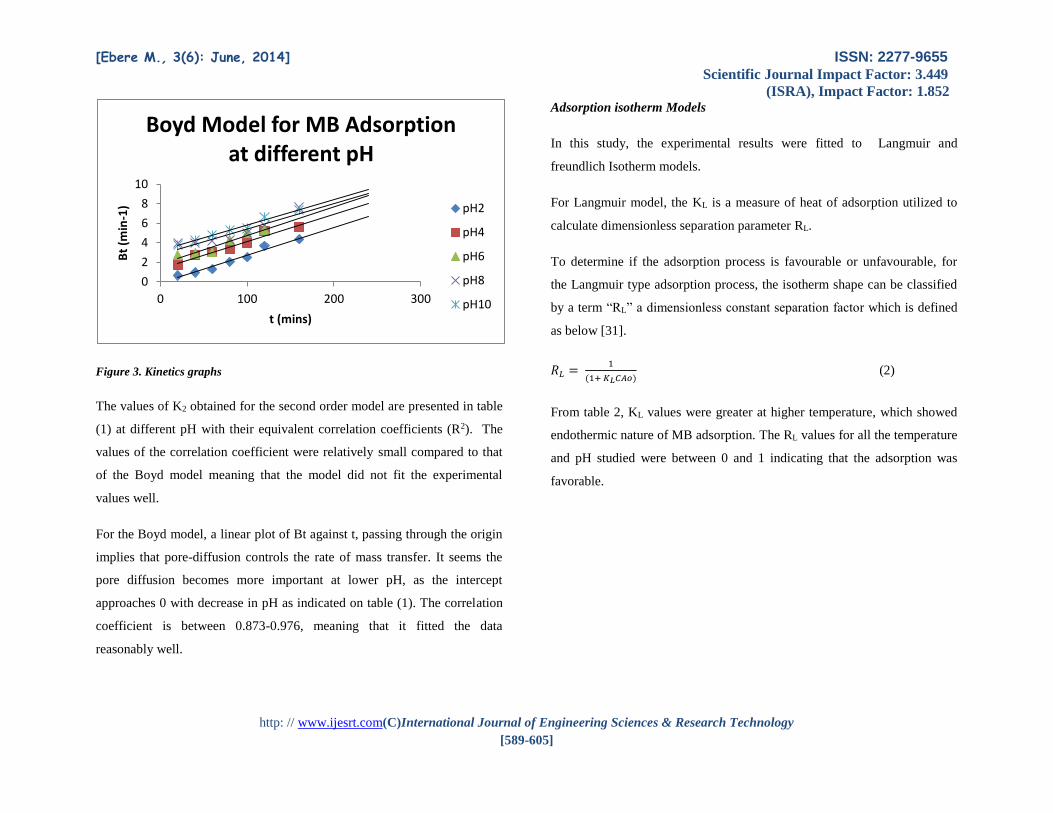
For the Boyd model, a linear plot of Bt against t, passing through the origin
implies that pore-diffusion controls the rate of mass transfer. It seems the
pore diffusion becomes more important at lower pH, as the intercept
approaches 0 with decrease in pH as indicated on table (1). The correlation
coefficient is between 0.873-0.976, meaning that it fitted the data
reasonably well.
Adsorption isotherm Models
In this study, the experimental results were fitted to Langmuir and
freundlich Isotherm models.
For Langmuir model, the KL is a measure of heat of adsorption utilized to
calculate dimensionless separation parameter RL.
To determine if the adsorption process is favourable or unfavourable, for
the Langmuir type adsorption process, the isotherm shape can be classified
by a term “RL” a dimensionless constant separation factor which is defined
as below [31].
𝑅𝐿 = 1
(1+ 𝐾𝐿𝐶𝐴𝑜) (2)
From table 2, KL values were greater at higher temperature, which showed
endothermic nature of MB adsorption. The RL values for all the temperature
and pH studied were between 0 and 1 indicating that the adsorption was
favorable.
0
2
4
6
8
10
0 100 200 300
Bt
(min
-1)
t (mins)
Boyd Model for MB Adsorption at different pH
pH2
pH4
pH6
pH8
pH10
[Ebere M., 3(6): June, 2014] ISSN: 2277-9655
Scientific Journal Impact Factor: 3.449
(ISRA), Impact Factor: 1.852
http: // www.ijesrt.com(C)International Journal of Engineering Sciences & Research Technology
[589-605]
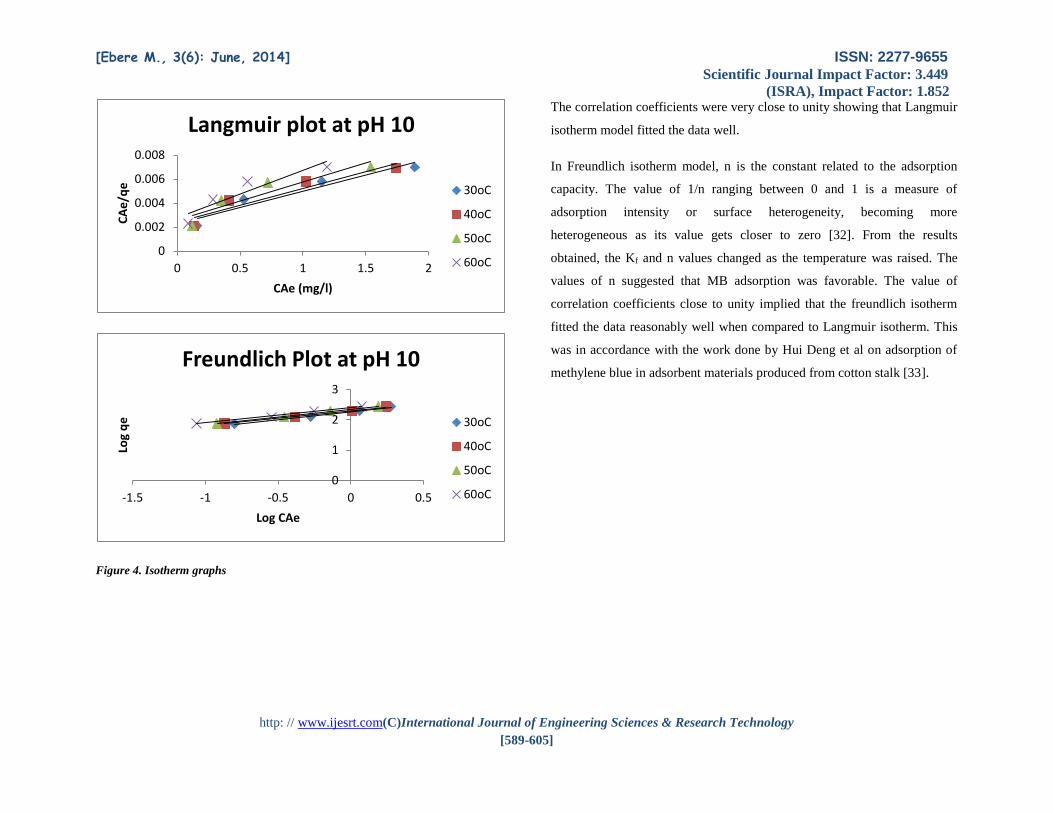
Figure 4. Isotherm graphs
The correlation coefficients were very close to unity showing that Langmuir
isotherm model fitted the data well.
In Freundlich isotherm model, n is the constant related to the adsorption
capacity. The value of 1/n ranging between 0 and 1 is a measure of
adsorption intensity or surface heterogeneity, becoming more
heterogeneous as its value gets closer to zero [32]. From the results
obtained, the Kf and n values changed as the temperature was raised. The
values of n suggested that MB adsorption was favorable. The value of
correlation coefficients close to unity implied that the freundlich isotherm
fitted the data reasonably well when compared to Langmuir isotherm. This
was in accordance with the work done by Hui Deng et al on adsorption of
methylene blue in adsorbent materials produced from cotton stalk [33].
0
0.002
0.004
0.006
0.008
0 0.5 1 1.5 2
CA
e/q
e
CAe (mg/l)
Langmuir plot at pH 10
30oC
40oC
50oC
60oC
0
1
2
3
-1.5 -1 -0.5 0 0.5
Log
qe
Log CAe
Freundlich Plot at pH 10
30oC
40oC
50oC
60oC
[Ebere M., 3(6): June, 2014] ISSN: 2277-9655
Scientific Journal Impact Factor: 3.449
(ISRA), Impact Factor: 1.852
http: // www.ijesrt.com(C)International Journal of Engineering Sciences & Research Technology
[589-605]
Table 1. Kinetics parameters
KINETIC EQUATION Ph KINETIC PARAMETERS R2
First Order Kinetics (Natajan and Khalaf
First)
2
4
6
8
10
K1 = -0.0046 (min-1)
K1 = -0.0046 (min-1)
K1 = -0.0069 (min-1)
K1 = -0.0069(min-1)
K1 = -0.0046 (min-1)
0.796
0.739
0.797
0.887
0.796
Second order Model 2
4
6
8
10
K2 = 0
K2 = 0.003
K2 = 0.017
K2 = 0.039
K2 = 0.020
0.852
0.852
0.871
0.904
0.876
KINETIC EQUATION pH INTERCEPT R2
Boyd Model 2
4
6
8
10
-0.165
1.372
1.813
2.837
3.208
0.972
0.961
0.929
0.873
0.976
Table 2. Isotherm constants for MB adsorption on activated carbon
TEMPERATURE LANGMUIR CONSTANT FREUNDLICH CONSTANT
TEMP(K) qo(mg/g) KL(L/mg) RL R2 1/n n KF R2
303 pH4 0
pH10 500
0
1.0
1.0
0.032
0.997
0.923
0.859
0.517
1.164
1.934
78.7
185.35
0.999
0.989
313 pH4 1000
pH10 500
0.25
2.0
0.118
0.016
0.701
0.950
0.765
0.501
1.307
1.938
164.8
198.6
0.987
0.994
323 pH4 500
pH10 500
1.0
2.0
0.032
0.016
0.933
0.980
0.652
0.516
1.534
1.980
193.2
221.8
0.997
0.990
333 pH4 500
pH10 500
1.0
2.0
0.032
0.016
0.991
0.967
0.608
0.505
1.645
1.996
213.8
251.2
0.985
0.997
[Ebere M., 3(6): June, 2014] ISSN: 2277-9655
Scientific Journal Impact Factor: 3.449
(ISRA), Impact Factor: 1.852
http: // www.ijesrt.com(C)International Journal of Engineering Sciences & Research Technology
[589-605]
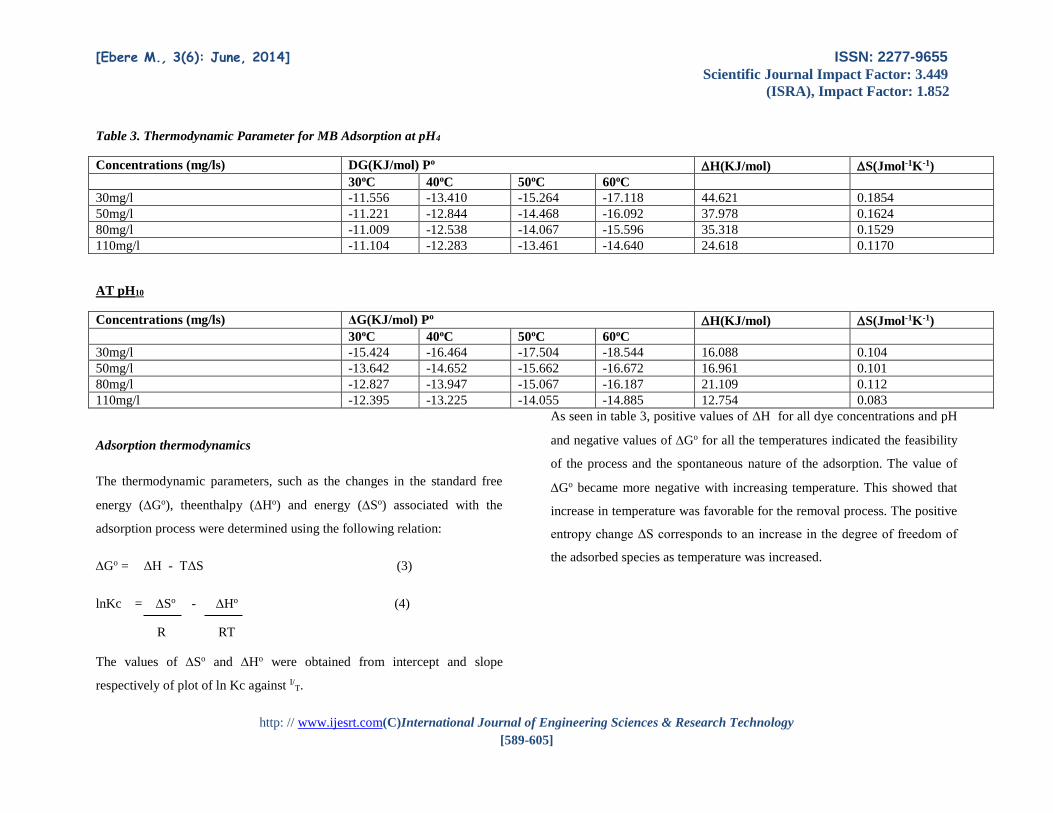
Table 3. Thermodynamic Parameter for MB Adsorption at pH4
Concentrations (mg/ls) DG(KJ/mol) Po H(KJ/mol) S(Jmol-1K-1)
30oC 40oC 50oC 60oC
30mg/l -11.556 -13.410 -15.264 -17.118 44.621 0.1854
50mg/l -11.221 -12.844 -14.468 -16.092 37.978 0.1624
80mg/l -11.009 -12.538 -14.067 -15.596 35.318 0.1529
110mg/l -11.104 -12.283 -13.461 -14.640 24.618 0.1170
AT pH10
Concentrations (mg/ls) ΔG(KJ/mol) Po H(KJ/mol) S(Jmol-1K-1)
30oC 40oC 50oC 60oC
30mg/l -15.424 -16.464 -17.504 -18.544 16.088 0.104
50mg/l -13.642 -14.652 -15.662 -16.672 16.961 0.101
80mg/l -12.827 -13.947 -15.067 -16.187 21.109 0.112
110mg/l -12.395 -13.225 -14.055 -14.885 12.754 0.083
Adsorption thermodynamics
The thermodynamic parameters, such as the changes in the standard free
energy (Go), theenthalpy (Ho) and energy (So) associated with the
adsorption process were determined using the following relation:
Go = ΔH - TΔS (3)
lnKc = So - Ho (4)
R RT
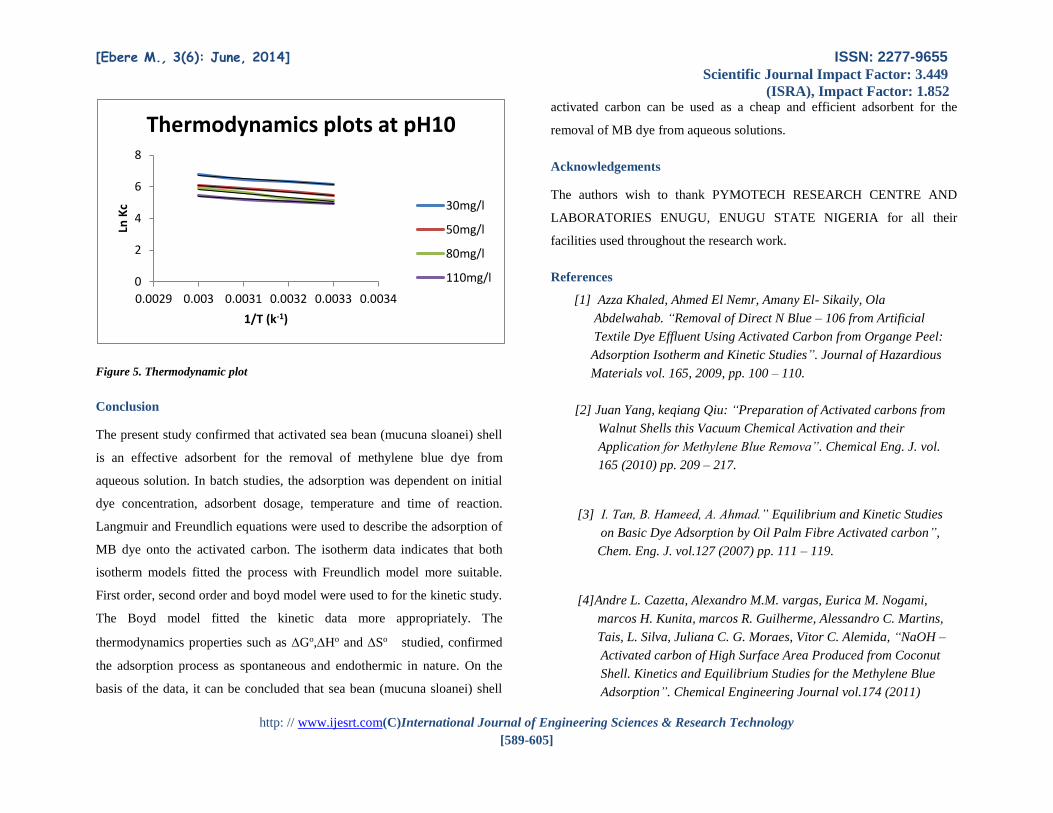
The values of So and Ho were obtained from intercept and slope
respectively of plot of ln Kc against I/T.
As seen in table 3, positive values of ΔH for all dye concentrations and pH
and negative values of Go for all the temperatures indicated the feasibility
of the process and the spontaneous nature of the adsorption. The value of
Go became more negative with increasing temperature. This showed that
increase in temperature was favorable for the removal process. The positive
entropy change ΔS corresponds to an increase in the degree of freedom of
the adsorbed species as temperature was increased.
[Ebere M., 3(6): June, 2014] ISSN: 2277-9655
Scientific Journal Impact Factor: 3.449
(ISRA), Impact Factor: 1.852
http: // www.ijesrt.com(C)International Journal of Engineering Sciences & Research Technology
[589-605]
Figure 5. Thermodynamic plot
Conclusion
The present study confirmed that activated sea bean (mucuna sloanei) shell
is an effective adsorbent for the removal of methylene blue dye from
aqueous solution. In batch studies, the adsorption was dependent on initial
dye concentration, adsorbent dosage, temperature and time of reaction.
Langmuir and Freundlich equations were used to describe the adsorption of
MB dye onto the activated carbon. The isotherm data indicates that both
isotherm models fitted the process with Freundlich model more suitable.
First order, second order and boyd model were used to for the kinetic study.
The Boyd model fitted the kinetic data more appropriately. The
thermodynamics properties such as Go,Ho and So studied, confirmed
the adsorption process as spontaneous and endothermic in nature. On the
basis of the data, it can be concluded that sea bean (mucuna sloanei) shell
activated carbon can be used as a cheap and efficient adsorbent for the
removal of MB dye from aqueous solutions.
Acknowledgements
The authors wish to thank PYMOTECH RESEARCH CENTRE AND
LABORATORIES ENUGU, ENUGU STATE NIGERIA for all their
facilities used throughout the research work.
References
[1] Azza Khaled, Ahmed El Nemr, Amany El- Sikaily, Ola
Abdelwahab. “Removal of Direct N Blue – 106 from Artificial
Textile Dye Effluent Using Activated Carbon from Organge Peel:
Adsorption Isotherm and Kinetic Studies”. Journal of Hazardious
Materials vol. 165, 2009, pp. 100 – 110.
[2] Juan Yang, keqiang Qiu: “Preparation of Activated carbons from
Walnut Shells this Vacuum Chemical Activation and their
Application for Methylene Blue Remova”. Chemical Eng. J. vol.
165 (2010) pp. 209 – 217.
[3] I. Tan, B. Hameed, A. Ahmad.” Equilibrium and Kinetic Studies
on Basic Dye Adsorption by Oil Palm Fibre Activated carbon”,
Chem. Eng. J. vol.127 (2007) pp. 111 – 119.
[4]Andre L. Cazetta, Alexandro M.M. vargas, Eurica M. Nogami,
marcos H. Kunita, marcos R. Guilherme, Alessandro C. Martins,
Tais, L. Silva, Juliana C. G. Moraes, Vitor C. Alemida, “NaOH –
Activated carbon of High Surface Area Produced from Coconut
Shell. Kinetics and Equilibrium Studies for the Methylene Blue
Adsorption”. Chemical Engineering Journal vol.174 (2011)
0
2
4
6
8
0.0029 0.003 0.0031 0.0032 0.0033 0.0034
Ln K
c
1/T (k-1)
Thermodynamics plots at pH10
30mg/l
50mg/l
80mg/l
110mg/l

[Ebere M., 3(6): June, 2014] ISSN: 2277-9655
Scientific Journal Impact Factor: 3.449
(ISRA), Impact Factor: 1.852
http: // www.ijesrt.com(C)International Journal of Engineering Sciences & Research Technology
[589-605]
pp.117 – 125.
[5] S. Senthi Ikumaar, P.R. Varadarajan, K. Porkodi, C.V. Sabbhuraam,
“Adsorption of Methylene Blue onto Jute Fibre carbon. Kinetics and
Equilibrium Studies”, J. Colloid Interface Sci. vol.284 (2005) pp.78 –
82.
[6] B.H. Hameed, A. A.T.M. Din, A.L. Amhad, “Adsorption of Methylene
Blue onto Bamboo-based Activated carbon: Kinetics and Equilibrium
Studies, “ J. Hazard mat, vol. 141 (2007) pp. 819 – 825.
[7] Mehmet Ulas Dural, Levent Cavas, Sergios K. papageorgious, Fotis K.
Katsaros. “Methylene Blue Adsorption on Activated carbon Prepared
from Posidonia Oceanica (L) Dead leaves” Chemical Eng. J. vol. 168
(2011) pp. 77-85.
[8] Zaria Zaman Chowdhury, Shanfuddin Mohd. Zain, Rashid Atta Khan
and Muhammad Aqeel Ashraf, “Preparation, Characterization and
Adsorption Performance of the KOH – Activated carbons Derived from
Kenaf Fiber for Lead(II) Removal from Wastewater”. Scientific
Research and Essays Vol. 6 (29), pp. 6185 – 6196 (2011).
[9] Armstrong W.P. Bat- Pollination Mucuna Flowers, 2010.
[10] Nwosu Justina: “The Effect of Storage Condition on the Rheological
(Functional Properties of Soup Thickner Mucuna Sloanei Cukpo)”.
Researcher,vol. 3, no. 6, 2011.
[11] I. A.W. Tan, A.L. Ahmad, B.H. Hamead, (2008). “Optimization of
Preparation Conditions for Activated Carbon from coconut Husk
Using Response Surface methodology”. Chemical Engineering Journal.
Vol. 137, 2008, pp. 462-470.
[12] Juan, Yang, Keqiang Qju.” Preparation of Activated carbon
from Walnut Shell Via Application for Methylene Blue
Removal.” Chemical Engineering Journal 162, 2010, pp. 209 –
219.
[13] J.M. Salman, V.O. Njoku, B.H. Hameecl. “Batch
and Fixed – Bed Adsorption of 2,4-dichloro
Phenoxyaxetic Acid onto Oil Palm Frond
Activated carbon”. Chemical Engineering Journal, vol.174, pp.33 –
40,2011.
[14] A.A. Ahmad, B.H. Hameecl. “Reduction of COD
and Colour of Dyeing Effluent from a Cotton
Textile Mill by Adsorption onto Bamboo-based
Activated carbon.” J. Hazard. Mater. Vol.172, 2009,
pp. 1538 – 1543.
[15] W. Tongpothorn, M. Sriuttha, P. Homchan, S.
Chanthai, C. Ruangviri Yachai. “Preparation of
Activated Carbon Derived from Jatropha Curcas
Fruit Shell by Simple Thermo-Chemical
Activated and Characterization of Their Physico
Chemical Properties”, Chem. Engr. Res. Des. Vol. 89,

[Ebere M., 3(6): June, 2014] ISSN: 2277-9655
Scientific Journal Impact Factor: 3.449
(ISRA), Impact Factor: 1.852
http: // www.ijesrt.com(C)International Journal of Engineering Sciences & Research Technology
[589-605]
2011, pp. 335 – 340.
[16] Z. Zhang, M.XU, H. Wang, Z.Li.” Enhancement
of CO2 Adsorption on High Surface Area
Activated carbon Modified by N2, H2 and
Ammonia or Production of Activated carbon from
Waste Tea by Chemical Activated with
MICRON Ave”. Energy. Fuel vol. 87, 208, pp. 3278 –
3285.
[17] Z.A. AL – Othman, R. Ali, MU. Naushad “Hexavalent Chromium
Removal from Aqueous Medium by Activated carbon Prepared from
peanut Shell. Adsorption Kinetics, Equilibrium and Thermodynamic
Studies”. Chem. Engineering Journal vol.184, 2012, pp.238 – 247.
[18] Hui, Deng, Jianjiang LU, Guoxue W. Genlin Shang Nugin Wang.
Adsorption of Methylene Blue on Adsorbent Materials produced
from Cotton Stalk. Chemicall Engr. Journal vol.172, 2011, pp.326-
334.
[19] Vipasiri Vimonses, Shaomin lei, Bojin, Chris W.K. Choro. Chris
Saint. “Kinetic Study and Equilibrium isotherm Analysis of Cobngo
Red Adsorption by Clay materials”. Chem. Engineering Journal vol.
148, 2009, pp.354 – 364.
[20] I.D. Mall, V.C. Srivastava, N.K. Agarwal, I.M. Mishra, “Removal of
Congo Red from Aqueous Solution by Bagasse Fly Ash and Activated
carbon Kinetic Study and Equilibrium Isotherm Analysis”,
Chemosphere vol. 61, pp.492 – 501.
[21] I.J. Yu, S.S. Skukla, K.L. Dorris, A. Shukla, J.I. Margrave
“Adsorption of Chromium from Aqueous Solution by Maple
Sawdust”. J. Hazard mater. B. vol. 100, 2003, pp.53 – 63.
[22] A Shukla, Y.H. Zhang, P. Dubey. J.I. Margrailt, S.S. Shukla.” The
role of Sawdust in the Removal of Unwanted Materials from Water”,
J. Hazard. Mater. B vol.95, 2003, pp.137 – 152.
[23] Yunjin, Yao, Bing He, Feifei XU, Xiaofeng Chem.” Equilibrium and
Kinetic Studies of methyl Orange Adsoprtion on Multiwalled Carbon
Nanotubes”. Chemical Engr. Journal.vol 68, 2011, pp. 186-179
[24] Y.S. Ho. G. McKey, “Sorption of Dye from Aqueous Solution by
Peat”; Chem. Eng. J. vol. 70, 1998, pp. 115 – 124.
[25] M. Ghaedi, B. Sadeghian, A. Amiri pebdani, R. Sahraei, A.
Daneshfa-C. Duran. “Kinetics, Thermodynamic and Equilibrium
Evaluation of Direct yellow 12 Removal by Adsorption onto Silver
Nanoparticles Washed Activated carbon”. Chemical Engineering
Journal vol. 187, 2012, pp. 133 – 141.
[26] S. Chen. J. Zhang, C. Zhang, Q. Yaae, Y. Li, C. Li, “Equilibrium and
Kinetic Studies of methyl Orange and Methyl Violet Adsorption on
Activation carbon Derived from Phragnites Australis, B.H. Hameed.
Modified Mesoporous Clay Adsorbent for Adsorption isotherm and
Kinetics of Methlene Blue”. Chem. Eng. J. 198 – 199 ,2012,pp. 219 –
227.

[Ebere M., 3(6): June, 2014] ISSN: 2277-9655
Scientific Journal Impact Factor: 3.449
(ISRA), Impact Factor: 1.852
http: // www.ijesrt.com(C)International Journal of Engineering Sciences & Research Technology
[589-605]
[27] Dan FU, Yihe Zhang, Fengzhu Lu, paul K. Chu. Jiwu Shang.
“Removal of organic materials from TNT Red Water by Bamboo
Charcoal Adsorption”. Chem. Eng. J. vol.193, 2012,pp. 39 – 49.
[28] N. Nasuba, B.H. Hameed, T. Azam, M.Din, “Rejected Area as a
Potential Low Cost Adsorbent for the Removal of methylene Blue”,
J. Hazard mater. Vol.175, 2010, pp. 126 – 132.
[29]. E. Malkoc, Y. Nuhoglu.” Determination of
kinetic and Equilirium Parameters of the Batch
Adsoprtion of Cr(VI) onto Waste Acorn of Quercus
Ithaburensis,” Chemical Eng. Process. 46, 2007, pp. 1020-1029.
[30] E. Zeynep, N.A. Filiz .” Equilibrium and kinetic
Mechanism for Reactive Black 5 Sorption onto high
Lime Soda Fly Ash.” J. hazard mater. Vol.143, 2007, pp. 226 – 232.
[31] Hui Deng, Jianjang, Lu, Guoxue LI, Genli Zhang
and Xugen Wang. “Adsorption of Methylene Blue
on Adsorbent Materials produced from Cotton
Stalk”vol. . Chemical Engineering Journal 172, 2011,
pp.326-334.
Copyright © 2022 FDOKUMEN