Formulation of adsorbent based on natural materials and their ...
252
HAL Id: tel-03702986 https://hal.univ-lorraine.fr/tel-03702986 Submitted on 23 Jun 2022 HAL is a multi-disciplinary open access archive for the deposit and dissemination of sci- entific research documents, whether they are pub- lished or not. The documents may come from teaching and research institutions in France or abroad, or from public or private research centers. L’archive ouverte pluridisciplinaire HAL, est destinée au dépôt et à la diffusion de documents scientifiques de niveau recherche, publiés ou non, émanant des établissements d’enseignement et de recherche français ou étrangers, des laboratoires publics ou privés. Formulation of adsorbent based on natural materials and their combinations to the electrochemical process for treating industrial effluents Amina Lissaneddine To cite this version: Amina Lissaneddine. Formulation of adsorbent based on natural materials and their combinations to the electrochemical process for treating industrial effluents. Chemical and Process Engineer- ing. Université de Lorraine; Université Cadi Ayyad (Marrakech, Maroc), 2021. English. NNT : 2021LORR0296. tel-03702986
-
Upload
khangminh22 -
Category
Documents
-
view
1 -
download
0
Transcript of Formulation of adsorbent based on natural materials and their ...

HAL Id: tel-03702986https://hal.univ-lorraine.fr/tel-03702986
Submitted on 23 Jun 2022
HAL is a multi-disciplinary open accessarchive for the deposit and dissemination of sci-entific research documents, whether they are pub-lished or not. The documents may come fromteaching and research institutions in France orabroad, or from public or private research centers.
L’archive ouverte pluridisciplinaire HAL, estdestinée au dépôt et à la diffusion de documentsscientifiques de niveau recherche, publiés ou non,émanant des établissements d’enseignement et derecherche français ou étrangers, des laboratoirespublics ou privés.
Formulation of adsorbent based on natural materialsand their combinations to the electrochemical process
for treating industrial effluentsAmina Lissaneddine
To cite this version:Amina Lissaneddine. Formulation of adsorbent based on natural materials and their combinationsto the electrochemical process for treating industrial effluents. Chemical and Process Engineer-ing. Université de Lorraine; Université Cadi Ayyad (Marrakech, Maroc), 2021. English. NNT :2021LORR0296. tel-03702986

AVERTISSEMENT
Ce document est le fruit d'un long travail approuvé par le jury de soutenance et mis à disposition de l'ensemble de la communauté universitaire élargie. Il est soumis à la propriété intellectuelle de l'auteur. Ceci implique une obligation de citation et de référencement lors de l’utilisation de ce document. D'autre part, toute contrefaçon, plagiat, reproduction illicite encourt une poursuite pénale. Contact : [email protected]
LIENS Code de la Propriété Intellectuelle. articles L 122. 4 Code de la Propriété Intellectuelle. articles L 335.2- L 335.10 http://www.cfcopies.com/V2/leg/leg_droi.php http://www.culture.gouv.fr/culture/infos-pratiques/droits/protection.htm

1, rue Grandville – BP 20451
54001 Nancy Cedex, France
B. P 511, Av. Abdelkrim
Elkhattabi
40000 Marrakech, Maroc
Thèse
Présentée et soutenue publiquement pour l’obtention du titre de
DOCTEUR DE L’UNIVERSITÉ DE LORRAINE
ET DE L’UNIVERSITE CADI AYYAD-MAROC
Mentions : GÉNIE DES PROCÉDÉS ET DES PRODUITS ET DES
MOLÉCULES (SIMPPE)
ET
CHIMIE ET GENIE DE L’ENVIRONNEMENT (CED)
par
Amina LISSANEDDINE
Formulation d’adsorbant à base de matériaux naturels et
leurs combinaisons aux procédés électrochimiques pour
traiter des effluents industriels
le 15 décembre 2021
Membres du jury :
Rapporteurs : Ali ASSABBANE Professeur, Faculté des Sciences, Agadir, Maroc
(Président du jury)
Pierre-Louis TABERNA Directeur de recherche, CNRS - Université de Toulouse
3, France
Examinateurs : Marc CRETIN Professeur, Université de Montpellier, France
Rachid MAMOUNI Professeur, Université Ibn Zohr, Agadir, Maroc.
Directrices de
thèse :
Marie-Noëlle PONS Directrice de recherche, CNRS - Université de Lorraine,
France
Laila MANDI Professeure, Faculté des Sciences Semlalia, Université
Cadi Ayyad, Marrakech, Maroc
Co-directeurs de
thèse :
Emmanuel MOUSSET Chargé de recherche, CNRS - Université de Lorraine,
France
Faissal AZIZ Professeur, Faculté polydisciplinaire de Safi, Université
Cadi Ayyad, Maroc
Invité : Mohammadine EL HADDAD Professeur, Faculté polydisciplinaire de Safi, Université
Cadi Ayyad, Maroc

To my dear parents Abderrahman and Malika
No dedication can express my great love, my esteem, my deep gratitude, my
intimate attachment and my deep affection. I cannot and will not be able to
thank you for all that you do for me, and all that you do until now.
May God protect you.
To my dear husband Soufian
All my love, thank you for supporting and encouraging me to finish this work
and for being there when I needed advice.
To my dear brothers, my sister-in-law and my niece Soufiya
For their patience and comfort in moments of doubt and discouragement. They
have advised me, supported me and put up with me throughout these years.
To my dearest friends Fadwa, Sana, Ahlam and Chaima
You are the only ones who can understand me, advise me and support me in a
complicity that is ours, thank you for the moral support during all these long
years.
To all those who have helped me from near or far in the realization of this work.

Scientific Publications
Publications:
Lissaneddine, A., Mandi, L., Achaby, M. El, Mousset, E., Eldon, R., Ouazzani, N., Pons,
M.-N., Aziz, F. (2021). Performance and dynamic modeling of a continuously operated
pomace olive packed bed for olive mill wastewater treatment and phenol recovery.
Chemosphere, 130797.https://doi.org/10.1016/j.chemosphere.2021.130797.
Lissaneddine, A., Pons, M.-N., Aziz, F., Ouazzani, N., Mandi, L., Mousset, E. (2021). A
critical review on the electrosorption of organic compounds in aqueous effluent –
Influencing factors and engineering considerations, Environmental Research, 112128.
https://doi.org/10.1016/j.envres.2021.112128.
Lissaneddine, A., Pons, M.-N., Aziz, F., Ouazzani, N., Mandi, L., Mousset, E. (2022).
Electrosorption of phenolic compounds from olive mill wastewater: Mass transport
consideration under a transient regime through an alginate-activated carbon fixed-bed
electrode, Journal of Hazardous Materials, 128480.
https://doi.org/10.1016/j.jhazmat.2022.128480.
Communications:
Lissaneddine, A., Aziz, F., Pons, M.-N., Ouazzani, N., Mandi, L., Mousset, E. Key
criteria for selective electrosorption of phenolic compounds on a novel biosourced material
for olive mill wastewater treatment, 72nd
Annual Meeting of the International Society of
Electrochemistry held in Jeju Island, South Korea (online), August 29- September 3,2021.
(Oral presentation)
Lissaneddine, A., Aziz, F., Pons, M.-N., Ouazzani, N., Mandi, L., Mousset, E.
Electrosorption using new biosourced porous electrode material for phenolic compounds
removal and valorization – electrochemical engineering aspects, 12th
European symposium on
electrochemical engineering, Leeuwarden, The Netherlands (online), June 14-17, 2021. (Oral
presentation)
Lissaneddine, A., Aziz, F., El Achaby, M., Ouazzani, N., Mandi, L. Adsorption of
chromium from highly concentrated tannery wastewater with novel porous composite beads:
Central composite design optimization study, Water Resources in the Mediterranean Basin
(WATMED9), Marrakech, Morocco, May 26-28, 2021. (Oral presentation)

Lissaneddine, A., Aziz, F., Ouazzani, N., Mandi, L., Mousset, E., Pons, M.-N.
Formulation of adsorbents based on natural materials and their combinations with
electrochemical processes to treat industrial effluents, Seminar of SIMPEE doctoral school,
Nancy, France, March 12, 2019. (Poster)
Lissaneddine, A., Aziz, F., Pons, M.-N., Ouazzani, N., Mousset, E., Mandi, L.
Formulation of adsorbent based on natural materials and their combinations to the
electrochemical process for treating industrial effluents, CNEREE PhD Students Day, Faculty
of Sciences and Techniques of Marrakech, Marrakech, Morocco, July 11, 2019. (Poster)
Lissaneddine, A., Aziz, F., El Achaby, M., Ouazzani, N., Mandi, L. Removal of
chromium (Cr(VI)) of tannery effluent by adsorption using beads based on natural materials,
Africa sustainable solid waste management workshop, Marrakech, Morocco, November 7-9,
2018. (Poster)
Lissaneddine, A., Aziz, F., El Achaby, M., Ouazzani, N., Mandi, L. Formulation of
adsorbents based on natural materials for the removal of heavy metals from industrial
effluents, CNEREE PhD Students Day, Faculty of Sciences and Techniques of Marrakech,
Morocco, June 27, 2018. (Poster)
Lissaneddine, A., Aziz, F., El Achaby, M., Ouazzani, N., Mandi, L. Bioadsorbents for
tannery water treatment, CNEREE Open House, Marrakech, Morocco, June 5-7, 2018.
(Poster)
Lissaneddine, A., Aziz, F., El Achaby, M., Ouazzani, N., Mandi, L. Valorization of
cultural heritage in Africa: Ecological development of tanneries, 23rd
edition of the scientific
and cultural week of the student, Faculty of Sciences Semlalia of Marrakech, Morocco, April
17-22, 2018. (Poster)
Patent:
Mandi Laila; Ouazzani Naaila; Lissaneddine Amina; Aziz Faissal (2020)."Procédé
à flux continu à base des bioadsorbants pour traiter les effluents industriels" MA 44429 A1,
B01D 15/00; B01J 20/04; C02F 1/288; C02F 1/28; B01J 20/043; B01J 20/24.

Acknowledgments
This work would not have been possible without the contribution of several people. I
want to express my deepest gratitude by thanking all those who helped me to complete this
work.
This PhD was completed as a co-shared thesis (Cotutelle) between the Faculty of
Sciences Semlalia, Cadi Ayyad University, Marrakech, Morocco and Lorraine University,
Nancy, France, under the Partenariat Hubert Curien (PHC) Toubkal/19/84 project (Campus
France: 41525VG). For that reason, I would like to express my gratitude towards the CED
Cadi Ayyad and the ED SIMPEE for facilitating the paperwork and allowing me to join this
program, thus allowing me to benefit from this amazing collaboration.
My sincere thanks to my thesis directors. It has been my good fortune to do my thesis
under the supervision of Pr. Laila MANDI (Cadi Ayyad University, Morocco) and Dr. Marie-
Noëlle PONS (Lorraine University, France) who have supervised this work with great interest
and optimism. Through their professional qualities, they have transmitted to me valuable
knowledge in the field as well as scientific rigor that will be very useful in my professional
future. Their rigor, patience and great efficiency make them irreplaceable supervisors. I am
grateful for all the guidance and sustainably assistance.
I am profoundly grateful to my co-supervisors Pr. Faissal AZIZ (Cadi Ayyad
University, Morocco) and Dr. Emmanual MOUSSET (Lorraine University, France). I want to
thank them for believing in me, providing me with the right advice and giving me the
necessary pep talks whenever I started doubting myself. Without their assistance and
dedicated involvement in every step throughout the process, this thesis would have never been
accomplished. I want to thank you very much for your support and understanding over these
past years. I am deeply thankful to both of them for all their support, guidance and time.
I want to thank Pr. Naaila OUAZZANI, director of the Water, Biodiversity and
Climate Change Laboratory (FSSM). I am deeply grateful for her support, advice and time.
It is important for me also to mention all the National Center for Studies and
Research on Water and Energy staff that helped me get prepared with the thesis world by
showing me the ropes, mainly Dr. HEJJAJ Abdessamad. The deepest appreciations are also

due to all the Water, Biodiversity and Climate change Laboratory members in Cadi Ayyad
Univesity, mainly Aafaf KRIMECH, Khadija ZIDAN, Taoufiq ELHAKIM ELMANSOUR,
and Imane HAYDARI as well as LRGP members of Lorraine University; Bastien JALLY and
Nicolas MAURICE. I cannot forget Mohd Faidzul Hakim Mohd ADNAN for his invaluable
help on many occasions.
I want to show my appreciation to all the members of my thesis committee Mr. Ali
ASSABBANE, Mr. Pierre-Louis TABERNA, Mr. Mohammadine EL HADDAD, Mr. Marc
CRETIN and Mr. Rachid MAMOUNI. I thank them for taking their valuable time to revise
my manuscript carefully.
I warmly thank my dear parents, my dear husband Soufian, my wonderful brothers
(Mohammed, Abdelilah, Zakaria and Abderazaq) and as well as my adorable sister-in-law
Fatima Zahra, my princess Soufiya and my cousin Fatima for their encouragement and their
unconditional support throughout these last years. May they find here the expression of my
high consideration.
Last but not least, I would like to address massive thanks to my dearest friends
Fadwa, Sana, Ahlam and Chaima for always being there as wonderful friends and supporting
me in their way.

I
Abstract
Olive mill technology generates a considerable amount of solid (olive pomace) and liquid
(olive mill wastewater) by-products during olives milling season, usually between November
and March. These wastes represent a great challenge for olive oil producers since they must
find technical, environmental and economical solutions to manage these by-products. The
main objective of this thesis was to explore and propose a complete cycle of olive mill wastes
treatment. This is in the framework of a zero liquid and waste discharge approach and
promotes the circular economy concept. Two sorbents based on olive pomace chemical
activation, i.e., powdered activated carbon within composite alginate beads and granular
activated carbon (GAC), were successfully synthetized. Both materials had a structure and a
porous morphology that revealed their feasibilities as potential and low-cost bio-sorbents.
They were employed in either adsorption or electrosorption for phenolic compounds (PCs)
recovery from olive mill wastewater (OMWW). The adsorption of PCs fitted second-order
kinetics (R2 = 0.997) and Langmuir isotherms (R
2 = 0.995). The thermodynamic parameters
for the PCs adsorption onto the bio-adsorbent suggested a spontaneous nature of adsorption,
an endothermic reaction and a modification of bio-adsorbent surface during the adsorption
process. Thomas model was better at predicting PCs column adsorption (R2 =0.97). Finally,
the investigation of bio-adsorbent regeneration showed that the recovery of phenols from
OMWW could be carried out with ethanol (43% of PCs recovered) or hydrochloric acid (90%
of PCs recovered). The results of electrochemical characterization of the two bio-adsorbent
electrodes showed that the high electroactive surface area, the high value of exchange current
intensity (I0) and the low value of charge transfer resistance (RCT) could be promising
properties for electrosorption studies. Electrosorption improved the adsorption capacity of the
composite beads from 123 to 170 mg g-1
and the removal rate of PCs from 66 to 74% for
GAC. Furthermore, the electrosorption of organic compounds was shown for the first time
with real wastewater. New models were developed to better understand and predict PCs
electrosorption kinetics, including transient mass transport. The remaining organic
compounds in OMWW were then eliminated (91% of chemical oxygen demand (COD)
removed) by advanced electro-oxidation treatment, while the bio-adsorbent was regenerated
(34.5% of PCs recovered) by an electrochemical method.

II
Keywords: Adsorption; Biosourced materials; Electrosorption; Phenolic compounds; Powder
or granular activated carbon; Regeneration.

III
Résumé
Les procédés d’extraction d’huile d’olive génèrent d’énormes quantités de déchets solides
(grignons d’olive) et liquides (margines) pendant la saison de l’extraction de l’huile d’olives,
généralement entre novembre et mars. Ces déchets représentent un grand défi pour les
producteurs d'huile d'olive car ils doivent trouver des solutions techniques, environnementales
et économiques pour gérer ces sous-produits. L'objectif principal de cette thèse était
d'explorer et de proposer un cycle complet de traitement des déchets de l’extraction de l’huile
d’olives. Cette démarche s'inscrit dans le cadre d'une approche zéro rejet liquide et déchets et
promeut le concept d'économie circulaire. Deux adsorbants basés sur l'activation chimique des
grignons d'olive, c'est-à-dire du charbon actif en poudre incorporé au sein de billes d'alginate
composite et du charbon actif en grains (CAG), ont été synthétisés avec succès. Les deux
matériaux avaient une structure et une morphologie poreuse et ont révélé leur applicabilité en
tant que bio-adsorbants potentiels et peu coûteux. Ils ont été utilisés en adsorption ou
électrosorption pour la récupération des composés phénoliques (CPs) des margines.
L'adsorption des CPs correspond à la cinétique de second ordre (R2 = 0.997) et aux isothermes
de Langmuir (R2 = 0.995). Les paramètres thermodynamiques pour l'adsorption des CPs sur le
bio-adsorbant suggèrent une nature spontanée de l'adsorption et une modification de la surface
du bio-adsorbant pendant le processus d'adsorption. Le modèle de Thomas a mieux prédit
l'adsorption sur colonne de CPs (R2 =0.97). Enfin, l'étude de la régénération du bio-adsorbant
a montré que la récupération des phénols à partir des margines peut être effectuée avec de
l'éthanol (43% des CPs récupérés) ou de l'acide chlorhydrique (90% des CPs récupérés). Les
résultats de la caractérisation électrochimique des deux électrodes de bio-adsorbant ont
montré que la surface électro-active élevée, la valeur élevée de l'intensité du courant
d'échange (I0) et la faible valeur de la résistance de transfert de charge (RCT) pourraient être
des propriétés prometteuses pour les études d'électrosorption. L'électrosorption a amélioré la
capacité d'adsorption des billes composites de 123 à 170 mg g-1
et le taux d'élimination des
CPs de 66 à 74% pour le CAG. De plus, l'électrosorption de composés organiques a été
démontrée pour la première fois avec des eaux usées réelles. De nouveaux modèles ont été
développés pour mieux comprendre et prédire la cinétique d'électrosorption des CPs, y
compris le transport de masse transitoire. Les composés organiques restants dans les margines
ont ensuite été éliminés (91% de la demande chimique en oxygène (DCO) éliminée) par un

IV
traitement d'électro-oxydation avancé, tandis que le bio-adsorbant a été régénéré (34,5% des
CPs récupérés) par une méthode électrochimique.
Mots clés : Adsorption ; Charbon actif en poudre ou en grains ; Composés phénoliques ;
Electrosorption ; Matériaux biosourcés ; Régénération.
V
Résumé des travaux de thèse : Formulation d’adsorbants à base de
matériaux naturels et leurs combinaisons aux procédés électrochimiques
pour traiter des effluents industriels
Introduction
La présence de polluants dans l'eau est devenue une préoccupation environnementale
majeure depuis la dernière décennie. Les rejets industriels couvrent un large spectre de
polluants de natures différentes : matières organiques (hydrocarbures, composés phénoliques,
pesticides...) et minérales (métaux lourds, radioéléments, fluorures, ...) à divers degrés de
toxicité (Selvaraj et al., 2018). Parmi ces industries, on trouve les usines de production d'huile
d'olive qui revêtent une grande importance économique dans les pays méditerranéens
puisqu'elles représentent 98% de la production mondiale (Bampalioutas et al., 2019). Les
procédés d’extraction d’huile d’olive génèrent d’énormes quantités de déchets solides
(grignons d’olive) et liquides (margines) dans de courts intervalles de temps (Annab et al.,
2019). Les margines représentent ainsi une source de pollution importante par l’acidification
du milieu, la destruction de la microflore bactérienne du sol, la pollution des oueds, des
retenues d’eau et des nappes souterraines ainsi que par les atteintes portées à la vie aquatique
(Achak, 2016). Les composés phénoliques sont les principaux contributeurs de la pollution
organique des margines ; il s’agit principalement du tyrosol, de l'hydroxytyrosol, de l'acide p-
hydroxyphénylacétique, de l'acide vanillique, de l'acide gallique, de l'acide p-coumarique et
de l'acide caféique (Bressan et al., 2004). En outre, ces composés phénoliques présentent de
fortes propriétés antioxydantes, anti-inflammatoires et antimicrobiennes, et plusieurs effets
positifs sur la santé ont été attribués à la consommation d'aliments riches en polyphénols
(Annab et al., 2019), d’où l’intérêt de récupérer les composés phénoliques présents dans les
margines.
Les procédés physico-chimiques et biologiques traditionnels employés pour le
traitement des margines ont souvent une efficacité limitée. Par conséquent, d'autres méthodes
de traitement sont nécessaires pour fournir une solution satisfaisante pour la récupération de
ces composés (Kilic et al., 2019). Les procédés d’adsorption ont démontré une certaine
efficacité pour une large gamme de polluants à l’échelle du laboratoire et réelle. Dans une
volonté d’amélioration de l’efficacité de cette technologie, des matériaux poreux conducteurs

VI
ont été polarisés par l’application de faibles intensités, selon le procédé dénommé
électrosorption. Cette technologie s’est révélée être une alternative prometteuse aux
techniques traditionnelles. Elle permet d’améliorer la séparation sélective des polluants
organiques, tout en intensifiant les phénomènes de transport et donc d’augmenter les
cinétiques d’électrosorption (Bayram et al., 2018 ; Nainamalai et al., 2018).
Dans ce contexte, l'objectif principal de cette thèse est de proposer une approche
intégrée qui consiste en la formulation d’adsorbants à base de matériaux naturels et leurs
combinaisons aux procédés électrochimiques pour traiter des effluents industriels.
Les déchets de grignons d'olive générés pendant le processus de production d'huile
d'olive sont réutilisés comme bio-adsorbant dans l'adsorption ou l'électrosorption pour la
récupération des composés phénoliques à partir des margines. Les composés organiques
restants dans les margines sont ensuite éliminés par un traitement d'électro-oxydation
avancée, tandis que l'adsorbant est régénéré par une méthode chimique ou électrochimique.
Une approche systématique a été adoptée en augmentant le degré de complexité de l'effluent
jusqu'à la réalisation d'études avec de véritables eaux usées d’usine de production d’huile
d’olive. L'accent est mis sur l'amélioration de la connaissance des mécanismes d'adsorption et
d'électrosorption de l'élimination des composés phénoliques dans des matrices aqueuses
complexes, à travers la proposition de nouveaux modèles comparés à des données
expérimentales cohérentes. Une attention particulière a été accordée à l'influence du transport
de matière et des propriétés physico-chimiques des composés phénoliques sur l'efficacité
d'adsorption et d'électrosorption. Ces considérations ont été prises en compte dans les modèles
pour une meilleure prédiction de l'évolution du système en fonction du temps.
Ce travail de recherche a été réalisé dans le cadre d'une convention de cotutelle entre
l'Université Cadi Ayyad et l'Université de Lorraine, dans le cadre du Partenariat Hubert
Curien (PHC) Toubkal/19/84 (Campus France : 41525VG). La formulation des adsorbants
ainsi que les tests d'adsorption et de désorption ont été réalisés au Maroc (Centre National
d'Etudes et de Recherches sur l'Eau et l'Energie (CNEREE) et Laboratoire Eau, Biodiversité
et Changements Climatiques, Faculté des Sciences Semlalia). La conception de l'électrode
tridimensionnelle ainsi que les expériences d'électrosorption, d'électrodésorption et d'électro-
oxydation ont été réalisées en France (Laboratoire Réactions et Génie des Procédés (LRGP)).

VII
La structure de la thèse est illustrée en Figure R1, et le contenu de chaque partie est
résumé ci-après.
Fig. R1. Approche intégrée innovante de la thèse.
Les différents axes développés dans ce travail ont porté premièrement sur une étude
bibliographique mettant l’accent sur l'adsorption et l'électrosorption. Cette partie commence
par exposer le contexte et le principe des technologies d'adsorption et d'électrosorption.
L'influence des paramètres, tels que les matériaux d'électrode, la densité de courant, la
physico-chimie des électrolytes et la conception du réacteur, est ensuite abordée. Ensuite,
l'identification des principaux facteurs d'influence combinée à la modélisation de
l'électrosorption a permis de définir les stratégies de conception pour la mise en œuvre
d'électrodes poreuses. Enfin, des orientations sont présentées, afin d’apporter de nouvelles
opportunités pour l’optimisation et le développement futur de ces technologies, y compris
dans le cadre de cette thèse.
La deuxième partie de la thèse est focalisée sur la présentation de l'approche
expérimentale, en commençant par l’origine des margines étudiées et les différentes
techniques physico-chimiques appliquées pour les caractériser. Ensuite, la préparation des
adsorbants et électrodes poreuses à base de grignons d'olive a été décrite ainsi que les

VIII
méthodes pour déterminer leurs propriétés physico-chimiques. Enfin, un aperçu sur les
protocoles expérimentaux d'adsorption et d'électrosorption des composés phénoliques a été
donné avec les différentes techniques d'analyse utilisées.
La troisième et dernière partie de ce travail rassemble les résultats et discussions de
cette étude. Cette partie est constituée de deux chapitres :
Le premier chapitre détaille l’étude d'adsorption et d'électrosorption des composés
phénoliques sur des billes composites. Le grignon d'olive est d'abord transformé en un
charbon actif hautement poreux puis en billes composites à base du charbon actif en poudre
qui ont ensuite été utilisées pour le traitement des margines par adsorption. La cinétique, le
mécanisme et les caractéristiques de l'adsorption des composés phénoliques ont été étudiés.
Les expériences ont été réalisées dans différentes conditions expérimentales (temps,
concentration, pH, température) afin de déterminer le comportement de l'adsorbant dans des
réacteurs à lit fixe et à lit agité. La récupération des composés phénoliques et la réutilisation
des billes composites ont été réalisées dans des réacteurs à lit fixe. Ensuite, l'électrosorption
des composés phénoliques avec les billes composites en tant qu’électrode a été étudiée. De
nouveaux modèles théoriques sont proposés pour prédire l'évolution de l'électrosorption des
composés organiques dans des effluents simulés et réels en tenant compte du transport de
matière et de la différence des constantes de dissociation acide (pKa) des composés
phénoliques.
Le deuxième chapitre développe l'adsorption et l'électrosorption des composés
phénoliques sur le charbon actif en grain (CAG). Pour l’adsorption, plusieurs paramètres ont
été explorés tels que la cinétique d'équilibre, l'effet du pH et celui de la concentration initiale
sur l'adsorption. Les effets de la profondeur du lit et du débit sur l'élimination des composés
phénoliques ont également été étudiés. Ensuite une étude sur l'électrosorption des composés
phénoliques sur CAG a été réalisée. La régénération électrochimique des électrodes de CAG
et la dégradation électrochimique des margines ont également été étudiées.

IX
1- Synthèse bibliographique
1.1- Adsorption
Les approches vertes sont devenues primordiales pour résoudre les enjeux actuels
liés à l’eau, dans le but de satisfaire pleinement les trois piliers du développement durable, à
savoir les garanties environnementales et sociales ainsi que la prospérité économique. Parmi
ces procédés, l'adsorption est une des techniques la plus utilisée pour séparer les polluants
organiques des eaux usées (Chkirida et al., 2021). L'adsorption est un processus efficace qui a
été largement exploité dans l'élimination d'ions organiques dans les solutions aqueuses.
L’adsorbant le plus généralement utilisé est le charbon actif. Bien qu’il soit efficace dans
l'élimination des ions organiques à partir des eaux usées, il est coûteux (Pollard et al., 1992) et
nécessite un agent chélateur pour améliorer ses performances, ce qui augmente le coût du
traitement (Oliveira et al., 2005). Ceci a donc encouragé des travaux de recherche orientés
vers des procédés de traitement faisant appel à des matériaux naturels moins coûteux et
largement disponibles (Bailey et al., 1999 ; Fiset et al., 2000). Divers matériaux bio-sourcés
ont été proposés tels que les zéolithes naturelles, les cendres volcaniques, les argiles (Paradas
et al., 1993 ; Aziz et al., 2016), la peau de banane, la paille de blé, la sciure de bois (Jauad et
al., 2016 ; Achak et al., 2016). En effet la performance et l’efficacité de la technique
d’adsorption dépend d’une façon prépondérante de la nature du support utilisé comme
adsorbant, son coût, son abondance, sa facilité de régénération, etc. Les principaux adsorbants
employés dans les applications industrielles sont les charbons actifs, les argiles (terres
décolorantes), les zéolithes, les gels de silice et les alumines activées (Sun & Meunier, 2007).
Divers matériaux bio-sourcés et granulaires ont été employés pour les technologies
d'adsorption.
Il existe plusieurs façons de mettre en œuvre l’adsorption en laboratoire, la manière
la plus couramment utilisée étant la technique en mode batch. C’est une méthode statique qui
consiste à mettre en contact un volume fixe de solution à épurer avec une masse d’adsorbant
donnée, dans des conditions préalablement établies. Aussi efficace soit-elle en terme de
capacité d’adsorption, il reste un problème lié à la récupération de ces adsorbants. Pour
surmonter ce problème, une autre méthode largement utilisée en milieu industriel du fait des
volumes d’eau à traiter, est la méthode dynamique en colonne ouverte qui utilise l’adsorbant

X
sous forme d’un lit filtrant. La solution à traiter est percolée à travers le matériau adsorbant
(McKay, 1996 ; Franca & Oliveira, 2010). Par rapport à l’adsorption discontinue, l’adsorption
sur colonne est plus pratique dans les applications industrielles en raison de sa simplicité,
c’est-à-dire qu’elle ne nécessite aucun procédé supplémentaire, tel que la filtration ou la
centrifugation (Zhang et al., 2002). Les expériences en mode continu dans une colonne aident
à intensifier le processus d'adsorption à des fins pratiques. En procédé continu, le temps de
contact entre l’adsorbant et l’adsorbat est presque instantané par rapport au mode discontinu
où le temps de contact est relativement prolongé. Un dispositif en fonctionnement continu
permet d’éliminer les polluants d'un volume considérable d’eaux usées, contrairement au
procédé discontinu, tout en exploitant au maximum la capacité d'adsorption, ce qui est l'une
des principales exigences des applications industrielles (Gupta & Sankararamakrishnan, 2010
; Chatterjee & Schiewer, 2014). Le grand défi de telles utilisations des adsorbants
pulvérulents dans le traitement des eaux en flux continu (colonne) est que les particules ont
très facilement tendance à s'agglomérer et former des amas qui conduisent au colmatage du
système dans un laps de temps très court et à des pertes de charges très significatives. Pour
surmonter ce problème les chercheurs ont recours à l’encapsulation des adsorbants sous forme
de bille, à l'aide de polymères comme liant (Aziz et al., 2019).
L’encapsulation est un procédé économique pour immobiliser un matériau dans une
matrice d’hydrogel, tout en conservant ses propriétés d’adsorption. Ces billes gélifiées de
taille uniforme offrent des avantages liés non seulement à la teneur élevée en composants
actifs, mais aussi à leur facilité d’utilisation en réacteur (Xu et al., 2021). Les matériaux
encapsulés peuvent être, après usage et saturation, récupérés par une simple séparation dans le
cas de réacteur batch ou régénérés in situ s’ils sont mis en œuvre sous la forme de filtres dans
un réacteur ouvert. L'alginate agit comme un milieu d’encapsulation pour aider à la
préparation d'adsorbants faciles à séparer et à recycler. De nombreux chercheurs utilisent des
billes avec des revêtements d'alginate sur plusieurs types de matériaux adsorbants ou les
fonctionnalisent pour être plus efficaces. Des tests avec les billes composites ont été réalisés
pour l'élimination de polluants organiques dans les eaux usées. L'adsorption dans les billes
composites s'est produite en deux étapes : (i) l'adsorption par film, suivie par (ii) la diffusion
intra-particulaire, comme le décrit le modèle de diffusion intra-particulaire. La capacité
d'adsorption élevée, la capacité de régénération ainsi que la méthode de préparation simple
font des billes composites un adsorbant prometteur pour l'élimination sélective des polluants

XI
organiques dans les applications de traitement des eaux usées (Khan et al., 2021 ; Xu et al.,
2021 ; Chkirida et al., 2021 ; Girijan et al., 2021).
Actuellement, le CAG est utilisé comme adsorbant en raison de sa grande surface et
de sa grande affinité pour l'élimination des polluants organiques dans les eaux usées. Le
modèle cinétique d'adsorption des polluants organiques dans le CAG est un modèle de
pseudo-second ordre et de diffusion intraparticulaire, c'est-à-dire que l'adsorption est
principalement contrôlée par la chimisorption et la diffusion (Islam et al., 2018 ; Díaz-Blancas
et al., 2018 ; Eeshwarasinghe et al., 2019 ; Cai et al., 2020). Le modèle d'isotherme
d'adsorption des polluants organiques dans le CAG suit celui de Langmuir (Islam et al., 2018 ;
Cai et al., 2020). L'utilisation de billes composites et de CAG a montré un énorme potentiel
dans les applications de remédiation environnementale en raison de leurs caractéristiques
uniques (forme granulaire, morphologie poreuse et surface spécifique élevée) et de leur
grande affinité d'adsorption vis-à-vis de divers polluants organiques (Islam et al., 2018 ; Díaz-
Blancas et al., 2018 ; Jamil et al., 2019 ; Piai et al., 2019 ; Barhoumi et al., 2019 ;
Eeshwarasinghe et al., 2019 ; Golovko et al., 2020 ; Cai et al., 2020).
Ainsi, bien qu'un nombre important d'articles de recherche aient été publiés sur
l'adsorption des composés organiques sur des billes composites ou du CAG, il existe encore
de nombreuses lacunes qui nécessitent une plus grande attention. Les faits suivants ont été
pris en compte dans le cadre de cette thèse et peuvent également constituer des pistes pour des
recherches futures :
La recherche sur la sélectivité de l'adsorption et de la désorption est très importante et doit
être étendue, en particulier pour les composés organiques à grande valeur ajoutée (par
exemple les composés phénoliques).
Peu de travaux sont réalisés sur l'utilisation de matériaux de recyclage comme adsorbants
pour éliminer les composés organiques. Cela peut constituer un potentiel pour de futures
recherches.
Des matériaux plus efficaces, réutilisables et respectueux de l'environnement devraient être
développés. Leur efficacité devrait être démontrée plus souvent avec des effluents réels.

XII
La possibilité de combiner la technologie d'adsorption basée sur le CAG ou les billes avec
d'autres technologies de séparation potentiellement plus sélective, comme l’électrosorption,
pourrait également être explorée.
La plupart des articles ont porté sur l'adsorption de composés organiques en mode batch et
continu à l’échelle laboratoire. Seuls quelques chercheurs ont traité le sujet à une échelle
pilote voire industrielle.
1.2- Electrosorption
Au-delà des techniques d’adsorption seule, le couplage entre l’adsorption et
l’électrochimie, dénommée électrosorption, suscite un regain d’intérêt ces dernières années,
bien qu'il s'agisse d'un procédé ancien datant de la fin du 19ème
siècle. Cela s’explique par ses
propriétés et avantages uniques par rapport aux autres technologies de séparation. Le
développement concomitant de nouveaux matériaux d'électrodes poreux a également permis
son nouvel essor. L'électrosorption offre l'avantage de séparer les polluants des eaux usées
avec la possibilité d'adsorber et de désorber sélectivement les composés ciblés. Une revue
complète et critique sur l'électrosorption a été publiée dans le journal Environmental Research
(Elsevier) au cours de cette thèse. Une attention particulière a été accordée à l'électrosorption
des composés organiques, contrairement aux revues existantes sur la déionisation capacitive
qui se concentrent uniquement sur les sels inorganiques. Le contexte et le principe de
l'électrosorption sont d'abord présentés. L'influence des principaux paramètres (par exemple,
les matériaux d'électrode, le potentiel d'électrode, la physico-chimie des solutions
électrolytiques, le type de composés, l'effet de co-sorption, la conception du réacteur, etc.) est
ensuite détaillée. Les aspects de modélisation et d'ingénierie sont discutés par la suite. Enfin,
les principaux résultats et les perspectives d'avenir concernant les études de récupération de
composés à forte valeur ajoutée ainsi que la combinaison entre les procédés d'électro-
sorption/désorption et de dégradation sont exposés. L’analyse bibliographique met
particulièrement en évidence le fait que les matériaux à base de carbone ont été
principalement utilisés (85% des études) comme électrode poreuse dans l'électrosorption des
substances organiques, alors que les études existantes manquent en termes de tests de stabilité
et de durabilité des électrodes en conditions réelles. Ces électrodes ont été mises en œuvre
dans des réacteurs à lit fixe la plupart du temps (43% des études) en raison de l'amélioration

XIII
du transport de matière. De plus, le potentiel d'électrode est un critère majeur : il doit être
appliqué dans le domaine non faradique sinon des réactions indésirables peuvent facilement
se produire, notamment la corrosion du carbone à partir de 0,21 V/électrode standard à
hydrogène ou encore l'oxydation/réduction de l'eau. En outre, il n'existe pas d'études réalisées
avec des effluents réels et sans ajout d'électrolyte support, ce qui est crucial pour tester
l'efficacité réelle du procédé sans rajouter de pollution. Le développement de modèles
prédictifs associés sera nécessaire en considérant l'effet de matrice ainsi que les phénomènes
de transport et les caractéristiques physico-chimiques des composés organiques ciblés. Ces
perspectives font en partie l’objet de cette thèse.
2- Méthodologie
2.1- Échantillonnage et caractérisation des margines
Les margines ont été collectées dans des huileries moderne et traditionnelle situées
dans la région de Marrakech au Maroc pendant la saison d'extraction de l'huile d'olive de
décembre à mars, durant les campagnes successives de 2019/2020 et 2020/2021. Les
échantillons collectés ont été soumis à différentes analyses physico-chimiques. Le pH, la
température, la teneur en solide dissous, la salinité et la conductivité électrique ont été
mesurés par une sonde Hanna HI 9829 (Kallang Road, Singapour). La demande chimique en
oxygène (DCO), les matières en suspension et les matières volatiles en suspension,
l'ammonium, le phosphore total et les orthophosphates ont été analysés selon les normes
AFNOR. Les composés phénoliques ont été dosés par la méthode Folin-Ciocalteu (Singleton
& Rossi, 1965) en utilisant l'acide caféique comme standard.
2.2- Préparation des billes composites
Les grignons d’olive ont été séchés à 105°C pendant une nuit, puis broyés pour avoir
des granulats pas trop fins. Le processus d'activation a été réalisé en utilisant l’activation
chimique. Dix grammes de précurseur (grignons d’olive) ont été physiquement mélangés avec
de l'hydroxyde de sodium 5 M (pureté 98 - 100,5%, Sigma-Aldrich) à un rapport pondéral
(activateur/précurseur) (1 : 1), sous agitation pendant une heure. Le mélange ainsi obtenu a
été lavé à plusieurs reprises avec de l'eau ultrapure jusqu'à pH neutre. La température de
carbonisation a été stabilisée à 700°C pendant 30 min.

XIV
Le procédé de préparation des billes composites d’alginate de sodium/charbon actif a
consisté à suivre les étapes successives suivantes (Figure R2) :
a) réaliser un mélange primaire d’hydrogel de l'alginate de sodium (BioChemica) (1%),
b) ajouter un mélange primaire de poudre de charbon actif (1%),
c) agiter le mélange pendant 24 h,
d) verser le mélange secondaire, goutte à goutte, dans une solution de fer(III) à 20 g L-1
(Iron (III) chloridehexahydrate, 99%, ACROS Organics),
e) réaliser la réticulation des billes.
Fig. R2. Représentation schématique de la préparation des billes composites.
2.3- Préparation du charbon actif en grain
Le processus d'activation des granulats de grignons d'olive a été effectué en utilisant
une méthode d'imprégnation. Dix grammes de précurseur (granulats du grignon d’olive) ont
été mélangés avec de l'hydroxyde de sodium 5 M (pureté 98 - 100,5%, Sigma-Aldrich) à un
rapport massique (activateur/précurseur) (1 : 1, 2 : 1, 3 : 1, 5 : 1), sous agitation pendant une
heure. Après carbonisation, le CAG obtenu a été lavé plusieurs fois avec de l'eau ultra pure
afin de neutraliser le pH.
2.4- Caractérisation des billes composites et du CAG
La spectroscopie infrarouge à transformée de Fourier (FTIR) a été utilisée pour
évaluer les groupes fonctionnels sur la surface du charbon actif, des billes et du CAG. Les
spectres FTIR ont été obtenus sur un spectromètre FT-IR ALPHA (ALPHA-P, Allemagne)
dans la gamme de nombres d'onde comprise entre 400 et 4000 cm-1
. Chaque spectrogramme
était composé d'une moyenne de 60 balayages.

XV
L'examen morphologique des billes composites et de CAG a été réalisé à l'aide de
mesures par microscopie électronique à balayage (MEB) de type TESCAN™ VEGA3
(Fuveau, France), en combinaison avec un système de détection dispersif en énergie (EDS)
(TEAM™ EDS). L’EDS a permis d’analyser les éléments et leur distribution à l'échelle
microscopique à la surface des billes et du CAG. La méthode de Brunauer, Emmett et Teller
(BET) par adsorption d'azote à -196°C (via un système d'analyse de surface Micromeritics
ASAP 2020) a été utilisée pour calculer la surface spécifique (SBET) et le volume total (VT) des
billes et du CAG préalablement dégazés.
Les propriétés électrochimiques de l'électrode constituée de billes composites ou bien
de CAG ont été évaluées à l'aide d'un potentiostat (AMETEK, Massy, France) dans un
système à trois électrodes. Les billes composites ou bien le CAG ont été utilisés comme
électrode de travail, une tige de graphite (Final Advanced Material, Didenheim, France) ou
bien un fil de platine (Ögussa, Vienne, Autriche) comme contre-électrode et une électrode de
référence de type Ag/AgCl. La surface électroactive du matériau poreux a été déterminée par
voltampérométrie cyclique (CV) avec -0,2 à 0,8 V comme plage de tension et 0,01 V s-1
comme vitesse de balayage, suivie de l'utilisation de l'équation de Randles-Sevcik pour
déterminer la surface à partir du pic d'intensité du courant (Mousset et al., 2016a). Les droites
de Tafel ont été obtenues à partir de la voltampérométrie à balayage linéaire (LSV) avec une
plage de tension variant de -2 à 2 V et une vitesse de balayage de 0,01 V s-1
. Elles ont été
utilisées pour calculer l’intensité de courant d'échange (I0) de l'électrode poreuse (Mousset et
al., 2016b ; Fang et al., 2017 ; Adnan et al., 2021b). Des mesures de spectroscopie
d'impédance électrochimique (EIS) utilisant la gamme de fréquences de 50 000 à 0,1 Hz avec
une amplitude de 10 mV ont été réalisées pour caractériser l'interface électrode de
travail/électrolyte en utilisant la méthode du circuit électrique équivalent (EEC) (Mousset et
al., 2016a). Les données EIS ont été ajustées à l'aide du logiciel d'analyse de données
ZSimpWin (AMETEK, Massy, France).
2.5- Adsorption
2.5.1- Billes composites
Les capacités d'adsorption du charbon actif préparé à base de grignons ont été
étudiées en mode batch (réacteur fermé parfaitement agité) et en colonne (réacteur fermé

XVI
recirculé à flux ascendant). Lors des essais sur batch, les échantillons ont été agités pendant 4
h à la température ambiante (20°C) et avec une vitesse d’agitation de 200 tr min-1
. Les
expériences en système continu ont été réalisées dans une colonne de 4 cm de diamètre
intérieur et de 30 cm de hauteur. Les billes à base de charbon actif (140 g) ont été introduites
dans la colonne. L'effluent a été introduit en flux ascendant à l’aide d’une pompe
péristaltique, en appliquant un débit constant de 25 mL min-1
. Les échantillons de la solution
d'effluent ont été recueillis à des intervalles de temps définis (1 h) et analysés par la méthode
colorimétrique de Folin–Ciocalteu (Singleton et Rossi, 1965) en utilisant l’acide caféique
comme standard.
2.5.2- Charbon actif en grain
Des expériences en batch ont été réalisées en ajoutant 5 g de CAG à 5 mL
d'échantillon de margines, pendant un temps optimisé dans des tubes sous agitation continue
dans un mélangeur rotatif (KS 3000 i control, Allemagne) tournant à 200 tr min-1
. Les études
d’isothermes ont été réalisées sur le CAG préparé avec des margines de différentes
concentrations (20, 50, 100, 250, 1000, 2000, 3000, 4000 et 5000 mg L-1
) pendant 24 h et à
pH 4, ce qui correspondait à celui de l'effluent réel. Dans un sous-ensemble d'expériences, le
pH de la solution des margines a été ajusté de 2 à 6 en utilisant du HCl ou du NaOH à 1 M.
Des tests de contrôle ont été effectués dans les mêmes conditions mais en absence de CAG.
Toutes les expériences ont été réalisées à température ambiante (entre 20°C et 25°C) et ont été
effectuées en double.
Une colonne de 1 cm de diamètre et de hauteur variant entre 10, 15 et 20 cm a été
remplie de CAG dont la masse variait entre 3 et 6 g. Les margines ont été introduites en flux
ascendant en utilisant une pompe péristaltique (Antlia - 3C Dutscher, France) et en appliquant
un débit constant de 0,5, 0,8 ou 1,5 mL min-1
. Les margines ont été collectées à la sortie de la
colonne à intervalles réguliers et la concentration des composés phénoliques a été mesurée.
Toutes les expériences ont été réalisées en double.

XVII
2.6- Electrosorption
2.6.1- Billes composites
La performance de l'électrosorption avec l'électrode de travail composée de billes
composites a été testée sur un réacteur à colonne à lit fixe (diamètre intérieur de 2,6 cm et
hauteur de 15 cm) en utilisant une tige de graphite (210 mm de longueur et 12 mm de
diamètre) comme collecteur de courant pour connecter en mode monopolaire les billes de
composites (35 g) avec le potentiostat. La contre-électrode était constituée d’une tige de
graphite (100 mm de longueur et 8 mm de diamètre) et a servi en tant qu’anode. Dans toutes
les expériences, 100 mL d'effluent ont été introduits en flux ascendant à l'aide d'une pompe
péristaltique (Fisher Scientific, Illkirch-Graffenstaden, France) à un débit constant de 10 mL
min-1
. Le potentiel de la cathode a été varié de -0,8 à -1,3 V/(Ag/AgCl) et une expérience a été
réalisée en tant que contrôle en l'absence de courant électrique.
2.6.2- Charbon actif en grain
L'électrosorption avec le CAG a été réalisée avec une colonne à lit fixe, suivant un
montage similaire à celui employé avec les billes d'alginate. 10 g de CAG ont été introduits
dans la colonne avec une tige de graphite (210 mm de longueur et 12 mm de diamètre)
comme collecteur de courant entre le générateur de courant et le CAG poreux, en considérant
un mode de connexion monopolaire. La contre-électrode était une tige de platine (80 mm de
longueur et 1 mm de diamètre). L'intensité du courant appliqué a été variée de 1 à 150 mA.
Dans toutes les expériences, 100 mL d'effluent ont été introduits en flux ascendant à l'aide
d'une pompe péristaltique à un débit constant de 10 mL min-1
. A la sortie de la colonne,
l'effluent a été échantillonné à intervalles de temps réguliers, et la concentration en composés
phénoliques a été mesurée.

XVIII
3- Résultats et discussions
3.1- Billes composites
3.1.1- Performance et modélisation dynamique du lit fixe de grignons d'olives
fonctionnant en continu pour le traitement des margines et la récupération du phénol.
Les résultats des caractéristiques physico-chimiques des margines étudiées ont
montré que les composés phénoliques sont fortement présents dans les margines (4 et 10 g L-1
pour l’huilerie moderne et huilerie traditionnelle, respectivement). Une concentration élevée
en matière organique a été notée, avec une valeur de DCO très élevée (110 g-O2 L-1
pour
l’huilerie traditionnelle). Elles avaient un pH acide de l’ordre de 4 : cette faible valeur rend le
traitement biologique des margines brutes très difficile. La concentration en matières sèches
totales était relativement élevée, soit 128,5 g L-1
. La conductivité électrique enregistrée dans
cette étude était de l’ordre de 24 mS cm-1
, ce qui constitue un avantage pour conduire une
électrolyse.
De nouvelles billes composites à base de grignons d'olive et d'hydrogel d'alginate ont
été formulées avec succès pour l'élimination des composés phénoliques des margines. La
structure et la morphologie poreuse des billes ont été confirmées par FTIR, MEB et EDS, ce
qui a révélé la faisabilité des billes d’alginate en tant que biosorbants potentiels et peu
coûteux. L'adsorption des composés phénoliques par les billes correspond à la cinétique de
second ordre et à l’isotherme de Langmuir. Les résultats indiquent que l'adsorption des
composés phénoliques sur les billes dépend fortement du pH et de la solubilité des phénols.
L'analyse thermodynamique indique que l'adsorption des composés phénoliques est
spontanée. Les modèles de Thomas et de Yoon-Nelson ont été choisis pour ajuster les
données expérimentales. Le modèle de Thomas modifié a été le meilleur pour prédire
l'adsorption des composés phénoliques en colonne (Figure R3). Enfin, l'étude de la
régénération des billes a montré que la récupération des phénols à partir des margines pouvait
être effectuée avec de l'éthanol.

XIX
Fig. R3. Chromatogrammes (HPLC) des margines avant (a) et après (b) traitement.
3.1.2- Electrosorption des composés phénoliques des margines : considération
du transport de matière en régime transitoire à travers une électrode à lit fixe en
charbon actif-alginate.
Cette étude a permis de proposer une nouvelle approche pour éliminer les composés
phénoliques des eaux usées simulées et réelles en mettant en œuvre l'électrosorption avec des
billes en tant qu’électrode poreuse. Les impacts des paramètres clés (agent de réticulation (fer
et calcium), teneur en charbon actif en poudre et potentiel de la cathode) sur l'efficacité de
l'élimination des composés phénoliques ont été explorés. Les principaux résultats obtenus sont
résumés ci-après (Figure R4). La conductivité plus élevée obtenue avec le fer comme agent de
réticulation a conduit à une efficacité d'électrosorption légèrement supérieure par rapport à la
présence de calcium. La teneur en charbon actif dans les billes a eu un impact sur le transfert
de matière et les coefficients de diffusion ainsi que sur la résistance ohmique interne. Une
quantité optimale de charbon actif a été déterminée (1% p/v), car une concentration trop

XX
élevée induisait une agglomération des particules. Un potentiel cathodique de -1,1
V/(Ag/AgCl) a été trouvé optimal en considérant à la fois la capacité d'électrosorption et les
besoins énergétiques. Une tension trop élevée a conduit à des réactions faradiques qui
entravaient le mécanisme d'électrosorption. De plus, l'efficacité de l'électrosorption était plus
élevée avec les eaux usées réelles qu'avec les effluents simulés. Cela peut être dû à la
présence de nombreux composés organiques qui ont des pKa différents. De nouveaux
modèles discrets ont été proposés pour comprendre et prédire l'efficacité d'électrosorption. La
cinétique est principalement limitée par la diffusion en régime transitoire dans l'effluent
synthétique, tandis que l'électromigration des composés phénoliques ioniques a également eu
un impact sur l'électrosorption avec les eaux usées réelles. Les résultats obtenus, le modèle de
circuit électrique équivalent ainsi que les modèles cinétiques ont permis de confirmer que
l'électrosorption se produisait principalement à l'intérieur des billes et non à l'interface
électrode/électrolyte, contrairement à ce qui est souvent supposé.
La bonne efficacité de l'électrosorption obtenue pour l'élimination des composés
phénoliques des margines est prometteuse pour leur récupération en vue d'une valorisation
ultérieure. Une autre possibilité serait de combiner l'électrosorption pour la récupération des
composés phénoliques avec un procédé de dégradation pour l'élimination des composés
indésirables, ce qui a fait l'objet de recherche d’une partie de la thèse.

XXI
Fig. R4. Représentation schématique des résultats de l'électrosorption des composés
phénoliques avec des billes en tant qu’électrode poreuse.
3.2- Charbon actif en grain
3.2.1- Charbon actif en grain à base de grignons d'olive pour le traitement des
margines et la récupération des composés phénoliques
Dans le cadre de nos recherches, une tentative a été faite pour optimiser les
paramètres du procédé qui conduisent à un CAG ayant de bonnes caractéristiques. Les
XXII
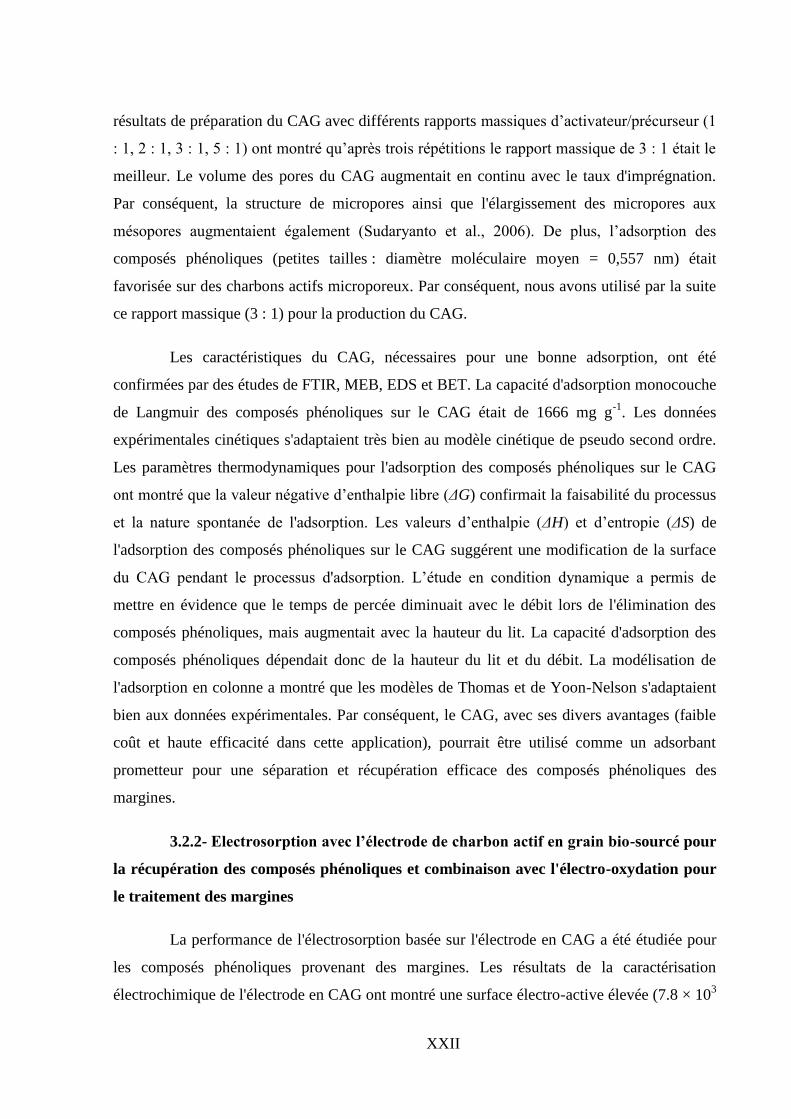
résultats de préparation du CAG avec différents rapports massiques d’activateur/précurseur (1
: 1, 2 : 1, 3 : 1, 5 : 1) ont montré qu’après trois répétitions le rapport massique de 3 : 1 était le
meilleur. Le volume des pores du CAG augmentait en continu avec le taux d'imprégnation.
Par conséquent, la structure de micropores ainsi que l'élargissement des micropores aux
mésopores augmentaient également (Sudaryanto et al., 2006). De plus, l’adsorption des
composés phénoliques (petites tailles : diamètre moléculaire moyen = 0,557 nm) était
favorisée sur des charbons actifs microporeux. Par conséquent, nous avons utilisé par la suite
ce rapport massique (3 : 1) pour la production du CAG.
Les caractéristiques du CAG, nécessaires pour une bonne adsorption, ont été
confirmées par des études de FTIR, MEB, EDS et BET. La capacité d'adsorption monocouche
de Langmuir des composés phénoliques sur le CAG était de 1666 mg g-1
. Les données
expérimentales cinétiques s'adaptaient très bien au modèle cinétique de pseudo second ordre.
Les paramètres thermodynamiques pour l'adsorption des composés phénoliques sur le CAG
ont montré que la valeur négative d’enthalpie libre (ΔG) confirmait la faisabilité du processus
et la nature spontanée de l'adsorption. Les valeurs d’enthalpie (ΔH) et d’entropie (ΔS) de
l'adsorption des composés phénoliques sur le CAG suggérent une modification de la surface
du CAG pendant le processus d'adsorption. L’étude en condition dynamique a permis de
mettre en évidence que le temps de percée diminuait avec le débit lors de l'élimination des
composés phénoliques, mais augmentait avec la hauteur du lit. La capacité d'adsorption des
composés phénoliques dépendait donc de la hauteur du lit et du débit. La modélisation de
l'adsorption en colonne a montré que les modèles de Thomas et de Yoon-Nelson s'adaptaient
bien aux données expérimentales. Par conséquent, le CAG, avec ses divers avantages (faible
coût et haute efficacité dans cette application), pourrait être utilisé comme un adsorbant
prometteur pour une séparation et récupération efficace des composés phénoliques des
margines.
3.2.2- Electrosorption avec l’électrode de charbon actif en grain bio-sourcé pour
la récupération des composés phénoliques et combinaison avec l'électro-oxydation pour
le traitement des margines
La performance de l'électrosorption basée sur l'électrode en CAG a été étudiée pour
les composés phénoliques provenant des margines. Les résultats de la caractérisation
électrochimique de l'électrode en CAG ont montré une surface électro-active élevée (7.8 × 10³

XXIII
cm2), une valeur élevée de I0 (5.5 × 10
-3 A), et une faible valeur de RCT (4 Ω) comparées à la
littérature. Ainsi les propriétés de l'électrode en CAG promettaient une grande efficacité
d'électrosorption. L'étude de l'électrosorption qui a suivi en présence de composés
phénoliques a été réalisée à différentes intensités de courant pour les margines artificielles (1
à 200 mA) et pour les margines réelles (1 à 100 mA). L'intensité de courant la plus appropriée
était de 1 mA (potentiel de cathode : 0,26 V/(Ag/AgCl)) pour l'effluent artificiel et de 10 mA
(potentiel de cathode : -0,05 V/(Ag/AgCl)) pour les margines réelles, enregistrant la plus
grande efficacité d'électrosorption de 72% et de 68%, respectivement. L'effet du pKa des
composés phénoliques a ensuite été étudié. L'efficacité d'électrosorption ne dépendait pas
seulement du pKa vis-à-vis du pH de la solution, mais également de la taille des molécules
adsorbées par rapport à la distribution de la taille des pores du CAG.
D'autre part, la méthode électrochimique a été testée pour récupérer les composés
phénoliques de l'électrode en CAG en inversant la polarité. Le pourcentage de composés
phénoliques récupérés était de 34,5% en conditions optimales, c’est-à-dire avec 0,1 g L-1
de
KCl et une intensité du courant de 10 mA pour une durée maximale de 120 min sur un seul
cycle.
Bien que l'électrosorption puisse être utilisée comme une technique de séparation, la
combinaison de l'électrosorption avec un procédé de dégradation pourrait être une stratégie
efficace pour le traitement des margines. Après des tests d’électro-oxydation en sortie de
l’électrosorption de l’effluent, l'efficacité d'élimination de la DCO était de 92% après
filtration préalable ( 10 µm) de l’effluent.
Conclusions et perspectives
L'objectif de ce travail était de réaliser un cycle complet de traitement des déchets
d’extraction d’huile d’olive dans lequel le grignon d'olive est d'abord transformé en un
adsorbant hautement poreux, puis en une électrode poreuse qui peut ensuite être utilisée pour
le traitement des margines par adsorption ou électrosorption. Les résultats du travail effectué
ont montré que les deux technologies explorées présentaient une capacité d'élimination élevée
des composés phénoliques des margines. L’électrosorption a permis d’améliorer la capacité
d’adsorption des billes composites de 123 à 170 mg g-1
et le taux d’éliminations des composés
phénoliques de 66 à 74% pour le CAG. Par ailleurs, l'électrosorption de composés organiques

XXIV
a pu faire ses preuves pour la première fois avec des eaux usées réelles. La combinaison de
l'électrosorption avec un procédé de dégradation parait être une stratégie prometteuse pour le
traitement des margines, mais nécessite encore des ajustements. De plus, certains aspects
doivent être intégrés pour valider ces procédés et leurs usages pour le traitement des
margines :
Il faudrait tester d’autres activateurs chimiques plus puissants afin d'éviter la carbonisation
pour produire un charbon actif encore plus efficace, c’est-à-dire moins cher, plus rigide, et
contenant plus de mésopores et de micropores ; l’activation thermique pourrait aussi être
tentée en absence d’oxygène pour éviter la perte en carbone,
La sélectivité des composés organiques vis-à-vis des technologies de séparation pourrait
être étudiée de manière plus détaillée, en développant des protocoles analytiques
suffisamment élaborés. Cela permettrait de distinguer les différents types de composés
phénoliques (et organiques de manière générale) présents dans des matrices complexes
comme les effluents réels, avant, pendant et après adsorption/électrosorption et
désorption/électrodésorption,
Le traitement des margines résiduelles par électro-oxydation pourrait être optimisé après
avoir bien identifié les problèmes liés à l’encrassement de l’anode,
L’efficacité des divers traitements (adsorption / désorption, électrosorption /
électrodésorption, électrooxydation) doit être testée sur des procédés à l’échelle pilote puis
industrielle ; l’optimisation doit également se faire à plus grande échelle pour ensuite
estimer les coûts qui seront plus représentatifs avec des conditions réelles ; cela permettra
également de pouvoir mieux comparer l’efficacité de ces technologies par rapport à
d’autres procédés existants.

XXV
Références
Achak, M. (2016). Essais de traitement des rejets liquides issus d’une huilerie d’olive
moderne (margines) par differents procédés : coagulation-floculation, adsorption,
infiltration-percolation, phyto-epuration. Thèse de Doctorat, Université Cadi Ayyad,
faculté des sciences Semlalia, Marrakech.
Annab, H., Fiol, N., Villaescusa, I., Essamri, A. (2019) A proposal for the sustainable
treatment and valorisation of olive mill wastes. Journal of Environmental Chemical
Engineering, 7, 102803.
Aziz, F., El Achaby, M., Lissaneddine, A., Aziz, K., Ouazzani, N., Mamouni R., Mandi L.,
(2019) Composites with alginate beads: A novel design of nano-adsorbents
impregnation for large-scale continuous flow wastewater treatment pilots, Saudi Journal
of Biological Sciences, 27(10), 2499-2508.
Aziz, F., Mamoun M., Ouazzani N., Uheida A., Mandi, L. (2017) Composites Nanofibers of
Polyacrylonitrile/Natural Clay for Decontamination of Waters Containing Pb(II),
Cu(II), Zn(II) and Pesticides. Separation Science and Technology, 52, 58-70.
Bampalioutas, K., Vlysidis, A., Lyberatos, G., Vlyssides, A. (2019) Detoxification and
methane production kinetics from three‐phase olive mill wastewater using Fenton's
reagent followed by anaerobic digestion. Journal of Chemical Technology &
Biotechnology, 94, 265-275.
Barhoumi, A., Ncib, S., Chibani, A., Brahmi, K., Bouguerra, W., Elaloui, E. (2019) High-rate
humic acid removal from cellulose and paper industry wastewater by combining
electrocoagulation process with adsorption onto granular activated carbon. Ind. Crops
Prod.140, 111715.
Bayram, E., Kizil, Ç., & Ayranci, E. (2018) Flow-through electrosorption process for removal
of 2,4-D pesticide from aqueous solutions onto activated carbon cloth fixed-bed
electrodes. Water Science and Technology, 77(3), 848–854.
Bressan, M., Liberatore, L., d’Alessandro, N., Tonucci, L., Belli, C., Ranalli G. (2004)
Improved combined chemical and biological treatments of olive oil mill wastewaters, J.
Agric. Food Chem., 52, 1228-1233.
Cai, Z., Deng, X., Wang, Q., Lai, J., Xie, H., Chen, Y., Huang, B., Lin, G. (2020) Core-shell
granular activated carbon and its adsorption of trypan blue. J. Clean. Prod. 242, 118496.
Chatterjee, A., S. Schiewer (2014) Effect of competing cations (Pb, Cd, Zn, and Ca) in fixed-
bed column biosorption and desorption from citrus peels. Water, Air & Soil Pollution
225 (2), 1-13.
Chkirida, S., Zari, N., Achour, R., Hassoune, H., Lachehab, A., Qaiss, A. el kacem, Bouhfid,
R. (2021) Highly synergic adsorption/photocatalytic efficiency of Alginate/Bentonite
impregnated TiO2 beads for wastewater treatment. J. Photochem. Photobiol. A Chem.
412, 113215.
Díaz-Blancas, V., Ocampo-Pérez, R., Leyva-Ramos, R., Alonso-Dávila, P.A., Moral-
Rodríguez, A.I. (2018) 3D modeling of the overall adsorption rate of metronidazole on
granular activated carbon at low and high concentrations in aqueous solution. Chem.
Eng. J. 349, 82–91.
Eeshwarasinghe, D., Loganathan, P., Vigneswaran, S. (2019) Simultaneous removal of
polycyclic aromatic hydrocarbons and heavy metals from water using granular activated
carbon. Chemosphere 223, 616–627.
Franca, A.S.; L.S. Oliveira, Fixed-Bed Adsorption Studies. In: Sorption Processes and
Pollution. Ed.: Presses Universitaires de Franche-Comté, chapitre 3, p. 79-106, 2010.

XXVI
Girijan, S., Kumar, M., Gomber, S. (2021) Starch and powdered activated carbon amended
alginate-biomass beads for metronidazole and bulk organic matter removal: Synthesis,
optimization, reaction kinetics and reusability. J. Environ. Chem. Eng. 9, 106102.
Gupta A, Sankararamakrishnan, N. (2010) Column studies on the evaluation of novel spacer
granules for the removal of arsenite and arsenate from contaminated water. Bioresour.
Technol 101, 2173–2179.
Khan, A.S., Ibrahim, T.H., Khamis, M.I., Nancarrow, P., Iqbal, J., Al Nashef, I., Jabbar, N.A.,
Hassan, M.F., Mjalli, F.S. (2021) Preparation of sustainable activated carbon-alginate
beads impregnated with ionic liquid for phenol decontamination. J. Clean. Prod.
128899.
Kilic, M. Y., Abdelraheem, W. H., He, X., Kestioglu, K., Dionysiou, D. D. (2019)
Photochemical treatment of tyrosol, a model phenolic compound present in olive mill
wastewater, by hydroxyl and sulfate radical-based advanced oxidation processes
(AOPs). Journal of Hazardous Materials, 367, 734-742.
Li, W., Yan, J., Yan, Z., Song, Y., Jiao, W., Qi, G., Liu, Y. (2018) Adsorption of phenol by
activated carbon in rotating packed bed: Experiment and modeling. Applied Thermal
Engineering, 142, 760–766.
Łosiewicz, B., Birry, L., Lasia, A. (2007) Effect of adsorbed carbon monoxide on the kinetics
of hydrogen electrosorption into palladium. Journal of Electroanalytical Chemistry,
611(1-2), 26–34.
McKay, G. Use of Adsorbents for the Removal of Pollutants from Wastewaters. Ed.: CRC
Press, Boca Raton, USA, 186 p., 1996.
Mousset, E., Wang, Z., Hammaker, J., Lefebvre, O., 2016a. Physico-chemical properties of
pristine graphene and its performance as electrode material for electro-Fenton treatment
of wastewater. Electrochim. Acta 214, 217–230.
Mousset, E., Wang, Z., Hammaker, J., Lefebvre, O., 2016b. Physico-chemical properties of
pristine graphene and its performance as electrode material for electro-Fenton treatment
of wastewater. Electrochim. Acta 214, 217–230.
Nainamalai, M., Palani, M., Soundarajan, B., Allwin, A. E. (2018) Decolorization of synthetic
dye wastewater using packed bed electro-adsorption column. Chemical Engineering and
Processing - Process Intensification, 130, 160–168.
Paradas E.G, Sanchez M.V., Cicciana M.S., Sanchez J.C, Perez M.F. (1993) Removal of 3—
(3,4—dichlorophenyl)—1, 1 dimethylurea from aqueous solution by natural and
activated bentoniteChem. Technol. Biotechnol., 56, 67-71.
Selvaraj, H., Aravind, P., Sundaram, M. (2018) Four compartment mono selective
electrodialysis for separation of sodium formate from industry wastewater. Chemical
Engineering Journal, 333, 162-169.
Sudaryanto, Y., Hartono, S. B., Irawaty, W., Hindarso, H., Ismadji, S. (2006) High surface
area activated carbon prepared from cassava peel by chemical activation. Bioresource
Technology, 97(5), 734–739.
Sun, M. L., Meunier, F., Adsorption : aspects théoriques. Techniques de l’ingénieur, J 2 730,
2007.
Xu, S., Jin, Y., Li, R., Shan, M., Zhang, Y. (2022) Amidoxime modified polymers of intrinsic
microporosity/alginate composite hydrogel beads for efficient adsorption of cationic
dyes from aqueous solution. J. Colloid Interface Sci. 607 890-899.
Zhang, L.M., D.Q. Chen, (2002) An investigation of adsorption of lead (II) and copper (II)
ions by water-insoluble starch graft copolymers. Colloids and Surfaces A:
Physicochemical and Engineering Aspects 205, 231-236.

XXVII

XXVIII
Table of Contents
GENERAL INTRODUCTION ................................................................................. 1
REFERENCES ........................................................................................................... 6
PART I: BIBLIOGRAPHY ....................................................................................... 8
1. Adsorption ................................................................................................................................. 9
1.1. Definition and types of adsorption ......................................................................................... 9
1.2. Adsorption of organic pollutants .......................................................................................... 12
1.3. Current stage and future prospects ....................................................................................... 14
2. Electrosorption ........................................................................................................................ 15
2.1. Electrosorption: background and principle .......................................................................... 15
2.2. Influence of the main parameters ......................................................................................... 20
2.3. Reactor design ...................................................................................................................... 46
2.4. Factors influencing the electrodesorption step ..................................................................... 52
2.5. Long-term efficiency of electrosorption............................................................................... 53
2.6. Modeling .............................................................................................................................. 54
2.7. Current developments and future prospects ......................................................................... 59
References ........................................................................................................................................... 65
PART II: MATERIAL AND METHODS.............................................................. 79
1. Adsorption ............................................................................................................................... 80
1.1. Sample collection and characterization ................................................................................ 80
1.2. Preparation of activated carbon ............................................................................................ 81
1.3. Preparation of the beads ....................................................................................................... 81
1.4. Characterization of beads and GAC ..................................................................................... 82
1.5. Stirred batch and column sorption experiments ................................................................... 83
1.6. Batch and fixed-bed column data analysis ........................................................................... 85
1.7. Analytical methods .............................................................................................................. 88
2. Electrosorption ........................................................................................................................ 89
2.1. Effluents preparation and characterization ........................................................................... 89
2.2. Preparation and characterization of the 3D porous electrode ............................................... 89
2.3. Electrochemical setup and procedure ................................................................................... 90
2.4. Electrochemical regeneration of the GAC electrode ............................................................ 93
2.5. Electrochemical degradation of OMWW ............................................................................. 94
References ........................................................................................................................................... 96
PART III: RESULTS AND DISCUSSIONS ......................................................... 98
CHAPTER I: COMPOSITE BEADS ..................................................................... 99

XXIX
I. Performance and dynamic modeling of a continuously operated pomace olive packed-bed
for olive mill wastewater treatment and phenol recovery .............................................................................. 100
1. Introduction ........................................................................................................................... 100
2. Results and discussion .......................................................................................................... 101
2.1. Physicochemical properties of the effluent ........................................................................ 101
2.2. Characterization of the adsorbent ....................................................................................... 103
2.3. Adsorption efficiency ......................................................................................................... 107
3. Conclusions ............................................................................................................................ 122
References ......................................................................................................................................... 123
II. Electrosorption of phenolic compounds from olive mill wastewater: mass transport
consideration under transient regime through alginate-activated carbon fixed-bed electrode .................. 129
1. Introduction ........................................................................................................................... 129
2. Modeling ................................................................................................................................ 130
3. Results and discussion .......................................................................................................... 131
3.1. Electrochemical characterization of the 3D porous electrodes .......................................... 131
3.2. Electrosorption efficiency .................................................................................................. 134
4. Conclusions ............................................................................................................................ 147
References ......................................................................................................................................... 148
CHAPTER II: GRANULAR ACTIVATED CARBON ..................................... 153
I. Granular activated carbon based on pomace olive for olive mill wastewater treatment and
phenol recovery.................................................................................................................................................. 154
1. Introduction ........................................................................................................................... 154
2. Results and discussion .......................................................................................................... 154
2.1. Physicochemical properties of effluent .............................................................................. 154
2.2. Preparation and characterization of GAC .......................................................................... 155
2.3. Adsorption efficiency ......................................................................................................... 159
2.3.1. Adsorption equilibrium study ........................................................................................... 159
2.3.2. Modeling of adsorption kinetics ....................................................................................... 161
2.3.3. Effect of pH ...................................................................................................................... 162
2.3.4. Effect of temperature ........................................................................................................ 163
2.3.5. Fixed-bed column ............................................................................................................. 164
2.4. Desorption .......................................................................................................................... 167
3. Conclusions ............................................................................................................................ 169
References ......................................................................................................................................... 170
II. Electrosorption with bio-sourced granular activated carbon electrode for phenols
recovery and combination with electrooxidation for residual olive mill wastewater treatment ................ 175
1. Introduction ........................................................................................................................... 175
2. Results and discussion .......................................................................................................... 176
2.1. Characterization of GAC.................................................................................................... 176

XXX
2.1.1. Influence of electrochemical conditioning on GAC characteristics ................................. 176
2.1.2. Electrochemical characterization of the conditioned GAC .............................................. 179
2.2. Electrosorption ................................................................................................................... 182
2.2.1. Phenol electrosorption ...................................................................................................... 182
2.2.2. Effect of phenolic compounds properties ......................................................................... 186
2.2.3. OMWW electrosorption ................................................................................................... 188
2.3. Electrochemical regeneration of the GAC electrode .......................................................... 191
2.4. Electrochemical degradation of OMWW ........................................................................... 194
3. Conclusions ............................................................................................................................ 195
References ......................................................................................................................................... 197
GENERAL CONCLUSION AND PERSPECTIVES ......................................... 202

XXXI
List of Figures
Fig. 1. The innovative integrated approach of the thesis. ............................................................... 3
Fig. 2. Some basic terms used in adsorption science and technology (Tran et al., 2017). ............ 10
Fig. 3. Schematic representation of the adsorption processes (Peng & Guo, 2020). .................... 11
Fig. 4. Schematic representation of the physical adsorption and chemical adsorption (Cuong,
2020). ............................................................................................................................................. 12
Fig. 5. Schematic representation of the EDL at positively charged electrode materials in the
presence of anions, cations and solvent. ....................................................................................... 17
Fig. 6. Schematic diagram illustrating the principle of electrosorption, including anion, cation
and uncharged compounds, as well as transport phenomena (δa and δc: diffusion layer thickness
at the anode and cathode, respectively). ........................................................................................ 19
Fig. 7. (a) Electrode materials used in the literature, (b) SEM image of ACF (Han et al., 2006b),
(c) SEM image of the prGO/SWCNT film (Yue et al., 2019). ..................................................... 30
Fig. 8. (a) Range of the specific surface area of the electrode implemented for organics
electrosorption in literature, (b) SBET and Vme evolutions as a function of modified (AC-NA, AC-
Am, AC-HT) and AC-NM (Biniak et al., 2013), (c) EDL drawings representing solvated ions
within different negatively charged pore sizes in carbon material: higher than 2 nm (A), between
1 and 2 nm (B) and smaller than 1 nm (Chmiola et al., 2006), (d) Schematic diagrams of a
positively charged porous carbon material and the associated model of the EDL: sandwich-type
model for micropores, electric double-cylinder model for mesopores, planar model for
macropores (Huang et al., 2008; Feng et al., 2010; Dai et al., 2020). ........................................... 33
Fig. 9. (a) Electrical conductivity of rGO, prGO and prGO/SWCNT materials (b) Surface
wettability of rGO, prGO and prGO/SWCNT materials (Yue et al., 2019b). .............................. 34
Fig. 10. (a) Occurrence percentages of electrode polarity configurations tested for electrosorption
in the literature, (b) effect of the working electrode potential on AO7 electrosorption (Han et al.,
2008). ............................................................................................................................................. 38
Fig. 11. Effect of (a) the initial concentration of the electrolyte on aniline electrosorption in the
Na2SO4 electrolyte (Han et al., 2006a), (b) pH on the aniline electrosorption (Han et al., 2006a)
(c) temperature on the phenol electrosorption (Han et al., 2006b). .............................................. 39
Fig. 12. (a) Type of effluent studied in the literature, i.e., artificial or real contamination and the
presence of either aromatic or aliphatic compounds during electrosorption processes, (b) effect of
acid red 88, orange II, and MB co-sorption (Sun et al., 2016), (c) schematic representation of MB

XXXII
molecule orientation on the prGO/SWCNT surface (Yue et al., 2019), (d) influence of the initial
concentration on MB electrosorption (Nainamalai et al., 2018), (e) overscreening versus
crowding models of EDL in the presence of concentrated electrolyte (e.g., ionic liquids) (Bazant
et al., 2011), (f) impact of the flow rate on 2,4-dichlorophenoxyacetic acid electrosorption
(Bayram et al., 2018). .................................................................................................................... 45
Fig. 13. Occurrence frequency of different electrosorption reactor designs found in the literature.
....................................................................................................................................................... 47
Fig. 14. Scheme of the main electrosorption reactor designs applied in the literature: STR (a),
flow-by (b) and flow-through (c) parallel-plate cells, fixed-bed reactor (d, e) and fluidized-bed
reactor (f, g) arranged in co-current (d, f) and counter-current (e, g) configurations. .................. 50
Fig. 15. General overview of the main parameters and phenomena involved in the electrosorption
efficiency associated with a modeling approach. .......................................................................... 61
Fig. 16. Images of modern (a) and traditional (b) oil mills, OMWW (c) and olive pomace (d). .. 80
Fig. 17. Schematic representation of the SA-AC beads preparation. ............................................ 82
Fig. 18. Fixed-bed adsorption setup. ............................................................................................. 84
Fig. 19. Fixed-bed electrosorption image setup. ........................................................................... 91
Fig. 20. Fixed-bed electrosorption schematic setup. ..................................................................... 92
Fig. 21. Scheme of the fixed-bed electrosorption setup. ............................................................... 93
Fig. 22. An exploded view of the parallel-plate electrochemical reactor. A: anode in BDD, B:
spacer, C: cathode in stainless steel. ............................................................................................. 95
Fig. 23. Chromatographic spectrum (HPLC) of the used OMWW. ........................................... 103
Fig. 24. FTIR spectra of AC (a), SA-AC beads before (b) and after (c) adsorption. .................. 104
Fig. 25. SEM of AC (a) and SA-AC beads (b). .......................................................................... 105
Fig. 26. EDS spectra of AC (a) and SA-AC beads (b). ............................................................... 106
Fig. 27. Effect of contact time (a) on PCs removal by SA-AC beads (Conditions: 5 g of the
adsorbent, 4000 mg L−1
of PCs, 540 min contact time under optimum conditions of other
variables), Adsorption isotherm (b): (c) Langmuir and (d) Freundlich (PCs concentration, 20 –
4000 mg L−1
; volume of OMWW, 5 mL; temperature, 19°C; pH = 4.0; and contact time, 24 h).
..................................................................................................................................................... 110
Fig. 28. Adsorption kinetics: pseudo-first-order (a) and pseudo-second-order (b) kinetic models
of PCs adsorption onto SA-AC beads. ........................................................................................ 113
Fig. 29. Variation of the adsorption capacity of beads with pH (at 19 °C; adsorbent = 5 g; C0 =
4,000 mg L−1
) (a) Kc as function of 1/T (R2 = 0.959) (b). ........................................................... 115

XXXIII
Fig. 30. Experimental and predicted breakthrough curves for PCs adsorption onto the SA-AC
beads. ........................................................................................................................................... 117
Fig. 31. Chromatograms(HPLC) of OMWW before (a) and after (b) treatment. ....................... 119
Fig. 32. Electrochemical properties of the prepared SA-AC beads electrode using CV (a), LSV
(b) and EIS (c). ............................................................................................................................ 133
Fig. 33. Scheme of the EEC model integrated into the 3D porous electrodes. ........................... 134
Fig. 34. Effect of the presence of iron (100 % w/v) or calcium (100% w/v) in the beads
preparation: on the electrosorption efficiency of phenol (a) and on electrode conductivity
estimated from the Nyquist plot (b). Operating conditions: anode: graphite rod, cathode: graphite
rod and 35 g SA-1% w/v AC beads, cathode potential: -1.2 V/(Ag/AgCl), electrolyte: 6 g L-1
KCl, pH 4 and 4 g L-1
phenol, flow rate: 10 mL min-1
, m/V = 0.35 g mL-1
. ............................... 136
Fig. 35. Effect of AC percentage (% w/v) on: the evolution of electrosorption capacity of phenol
(a), the mass transport (b) and internal ohmic resistance (c). Operating conditions: anode:
graphite rod, cathode: graphite rod and 35 g SA (100% w/v Fe)-AC beads, cathode potential: -
1.2 V/(Ag/AgCl), electrolyte: 6 g L-1
KCl, pH 4 and 4 g L-1
phenol, flow rate: 10 mL min-1
, m/V
= 0.35 g mL-1
. .............................................................................................................................. 138
Fig. 36. Mechanism of phenol electrosorption in SA-AC beads with increasing AC content. ... 140
Fig. 37. Effect of Ecat (V/(Ag/AgCl)) considering the contact time (a) and the specific charge (b)
on the electrosorption of phenol. Operating conditions: anode: graphite rod, cathode: graphite
rod and 35 g SA (100% w/v Fe)-1% w/v AC beads, electrolyte: 6 g L-1
KCl, pH 4 and 4 g L-1
phenol, flow rate: 10 mL min-1
, m/V = 0.35 g mL-1
. ................................................................... 142
Fig. 38. Effect of contact time on the electrosorption of PCs from real OMWW at optimal
operating conditions. Operating conditions: anode: graphite rod, cathode: graphite rod and 35 g
SA (100% w/v Fe)-1% w/v AC beads, cathode potential: -1.1 V/(Ag/AgCl), flow rate: 10 mL
min-1
, m/V ratio = 0.35 g mL-1
. .................................................................................................... 144
Fig. 39. Experimental (symbol) versus theoretical correlations (continuous line) as a function of
t1/2
in simulated OMWW as function of AC content (a) and of PCs in real OMWW (b), effect of
the percentage of AC on the diffusion coefficient (c). ................................................................ 146
Fig. 40. Effect of the mass ratio of activator / precursor on the adsorption of phenol in batch.
Phenol concentration = 4,000 mg L-1
, pH = 4, stirring = 200 rpm-1
. .......................................... 156
Fig. 41. FTIR spectra of GAC. .................................................................................................... 157
Fig. 42. SEM spectra of GAC at different magnification. .......................................................... 158

XXXIV
Fig. 43. Effect of the initial concentration on the adsorption of PCs (a), adsorption isotherm: (b)
Langmuir and (c) Freundlich. Initial concentration, 20-4,000 mg L−1
; volume of OMWW, 5 mL;
temperature, 19°C; pH=4; and contact time, 24h. ....................................................................... 160
Fig. 44. Effect of the contact time on the adsorption of PCs (a), kinetic adsorption models:
pseudo-first-order (b) and pseudo-second-order (c). Initial concentration, 4,000 mg L−1
; volume
of OMWW, 5 mL; temperature, 19°C; pH=4; and contact time, 480 min). ............................... 162
Fig. 45. Variation of the adsorption capacity of GAC with pH (at 19 °C; adsorbent = 5 g;
C0 = 4,000 mg L−1
). ...................................................................................................................... 163
Fig. 46. Plot of Ln(Kc) as a function of 1/T (R2
= 0.97). .............................................................. 164
Fig. 47. Effects of operating parameters on breakthrough curves: (a) effect of flowrate and (b)
effect of bed height. ..................................................................................................................... 166
Fig. 48. Effects of different solvents on PCs desorption efficiency. ........................................... 168
Fig. 49. Fraction of desorbed PCs from GAC by HCl (0.05 M). ................................................ 169
Fig. 50. SEM images: (a) GAC before conditioning, (b) GAC after conditioning. .................... 177
Fig. 51. Electrosorption of phenol into GAC before conditioning and GAC after
conditioning.Operating conditions: anode: platinum wire, cathode: graphite rod and 10 g of
GAC, electrolyte: 6 g L-1
KCl, pH 4 and 4 g L-1
phenol, flow rate: 10 mL min-1
, m/V = 0.1 g mL-
1. ................................................................................................................................................... 179
Fig. 52. Electrochemical properties of GAC electrode using CV (a), LSV (b) and EIS (c). ...... 181
Fig. 53. Scheme of the EEC model integrated into the GAC porous electrodes. ....................... 182
Fig. 54. Effect of the current intensity considering the contact time (a) and the specific charge (b)
on the electrosorption of phenol. Operating conditions: cathode: platinum wire, anode: graphite
rod and 10 g of GAC, electrolyte: 6 g L-1
KCl, pH 4 and 4 g L-1
phenol, flow rate: 10 mL min-1
,
m/V = 0.1 g mL-1
. ........................................................................................................................ 183
Fig. 55. Effect of the current intensity considering the contact time (a) and the specific charge (b)
on the electrosorption of phenol. Operating conditions: anode: platinum wire, cathode: graphite
rod and 10 g of GAC, electrolyte: 6 g L-1
KCl, pH 4 and 4 g L-1
phenol, flow rate: 10 mL min-1
,
m/V = 0.1 g mL-1
. ........................................................................................................................ 185
Fig. 56. SEM images conditioned GAC cathode after 8 h of electrosorption at 1 mA. .............. 186
Fig. 57. Effect of the kinds of PCs on the electrosorption at cathode. Operating conditions:
anode: platinum wire, cathode: graphite rod and 10 g of GAC, electrolyte: 6 g L-1
KCl, pH 4 and
PC, current intensity: 1 mA, flow rate: 10 mL min-1
, m/V = 0.1 g mL-1
. .................................... 188

XXXV
Fig. 58. Effect of the current intensity considering the contact time (a) the specific charge (b) on
the electrosorption of PCs from real OMWW and internal resistance (c) at optimal operating
conditions. Operating conditions: anode: platinum wire, cathode: graphite rod and 10 g of GAC,
flow rate: 10 mL min-1
, m/V = 0.1 g mL-1
. .................................................................................. 190
Fig. 59. Effect of the current intensity on the electro-desorption of PCs from GAC. Operating
conditions: cathode: platinum wire, anode: graphite rod and 10 g of GAC, electrolyte: 0.1 g L-1
KCl, flow rate: 10 mL min-1
, m/V = 0.1 g mL-1
. ......................................................................... 192
Fig. 60. Pictures about three successive electro-desorption cycles of PCs from GAC electrode.
..................................................................................................................................................... 193
Fig. 61. Scaling on BDD anode after electrooxidation experiments of OMWW. ...................... 195

XXXVI
List of Tables
Table 1. Main studies performed on the electrosorption of organic compounds reviewed in the
literature. ....................................................................................................................................... 21
Table 2. Optimal initial solution pH during the electrosorption of selected pollutants. ............... 41
Table 3. Advantages and drawbacks of the different types of reactor designs implemented for the
electrosorption of organic compounds. ......................................................................................... 51
Table 4. Successive electrosorption cycle studies with organic compounds reported in the
literature. ....................................................................................................................................... 54
Table 5. Main dimensionless numbers involved in the literature about the electrosorption. ........ 58
Table 6. Summary of the main emerging processes combinations with electrosorption applied in
treatment of organic pollutants. ..................................................................................................... 63
Table 7. Standard methods for determining physicochemical parameters. ................................... 81
Table 8. Physicochemical parameters of the OMWW. ............................................................... 102
Table 9. Textural characteristics for AC and SA-AC beads. ...................................................... 107
Table 10. Isotherm parameters of PCs adsorption onto the SA-AC beads (Conditions: 5 g of the
adsorbent, 20 – 4,000 mg L−1
of PCs, pH = 4, contact time 24 h). ............................................. 108
Table 11. Kinetic parameters of PCs adsorption onto SA-AC beads (Conditions: 5 g of the
adsorbent, 4,000 mg L−1
of PCs, 540 min contact time under optimum conditions of other
variables). .................................................................................................................................... 112
Table 12. Thermodynamic parameters of the adsorption process of PCs on beads at various
temperatures. ............................................................................................................................... 115
Table 13. Parameters of breakthrough curves of the packed bed column for PCs adsorption onto
the SA-AC beads. ........................................................................................................................ 118
Table 14. Physicochemical parameters of the OMWW before and after adsorption. ................. 120
Table 15. Parameters of Yoon-Nelson and Thomas models for the adsorption of PCs by SA-AC
in a fixed-bed column. ................................................................................................................. 121
Table 16. Physicochemical parameters of OMWW. ................................................................... 155
Table 17. EDS of GAC. .............................................................................................................. 159
Table 18. Isotherm parameters of PCs adsorption onto the GAC (Conditions: 5 g of the
adsorbent, 20-5,000 mg L−1
of PCs, pH=4, contact time 24h). .................................................... 160
Table 19. Kinetic parameters of PCs adsorption onto GAC (Conditions: 5 g of the adsorbent,
4,000 mg L−1
of PCs, 480 min contact time under optimum conditions of other variables). ...... 162

XXXVII
Table 20. Thermodynamic parameters of the adsorption process of PCs on GAC at various
temperatures. ............................................................................................................................... 164
Table 21. Thomas model parameters for PCs adsorption into GAC in a fixed-bed column at
different conditions using linear regression analysis. ................................................................. 167
Table 22. Yoon–Nelson model parameters for PCs adsorption into GAC in a fixed-bed column at
different conditions using linear regression analysis. ................................................................. 167
Table 23. EDS of GAC before and after conditioning. ............................................................... 178
Table 24. EDS of conditioned GAC cathode after electrosorption at 1 mA for 8 h. .................. 186
Table 25. OMWW characterization before and after electrochemical degradation. ................... 195

XXXVIII
List of abbreviations and symbols
Abbreviation Definition 3D three-dimensional AC activated carbon
AC-Am ammonia-treated ACC activated carbon cloth
ACCO oxidized activated carbon cloth ACE activated carbon electrode ACF activated carbon fibers
AC-HT annealed activated carbon AC-NA nitric acid oxidized activated carbon AC-NM non-modified activated carbon
AO7 acid orange 7 AO8 acid orange 8
AR151 acid red 151 AY14 acid yellow 14
BA benzoic acid CB-W carbon black CFP carbon fiber paper
CNT-c multiwalled carbon nanotubes - short carboxyl CNT-h multiwalled carbon nanotubes - short hydroxyl CNTs carbon nanotubes COD chemical oxygen demand CV cyclic voltammetry
DFT density functional theory EDL electric double layer EEC equivalent electrical circuit EIS electrochemical impedance spectroscopy
GAC granular activated carbon IHP inner Helmholtz plane KKT Kramers-Kronig transform LSV
MAE linear sweep voltammetry
mean absolute error MB methylene blue MSE mercury/mercurous sulfate electrode MW molar weight
MWCNTs multiwalled carbon nanotubes NA nicotinic acid
NHE normal hydrogen electrode NMO Na0.7MnO2 OC open circuit
OMWW olive mill wastewater OHP outer Helmholtz plane PCs phenolic compounds
PrGO porous reduced graphene oxide RE regeneration efficiency Rga reduced graphene oxide aerogel
rGA-Cu Cu nanoparticles loaded rGA rGA-F F-doped rGA
rGA-F/Cu F and Cu nanoparticles modified rGA

XXXIX
Rgo reduced graphene oxide RHE
RMSE reversible hydrogen electrode
root-mean-square error SCE saturated calomel electrode SEM scanning electron microscopy STR stirred tank reactor
SWCNTs single-walled carbon nanotubes
Symbol Definition
%𝑅 total PCs removal efficiency (%)
𝐶𝑖𝑛 targeted compound concentration in the inlet flow
𝐶𝑜𝑢𝑡 targeted compound concentration in the outlet flow
𝑑𝑝 particle diameter
𝑞𝐴 electrosorption capacity
𝑞𝐷 electrodesorption capacity
𝑦𝑖 model value
𝑦𝑖′ experimental value
A cross-sectional area
a interfacial area per unit void volume
a0 effective radius of the counterions
Bim mass transfer Biot number
C differential capacitance
C0 initial concentration of the pollutant
CDL specific double layer capacitance
Ce equilibrium concentration of the pollutant
CGAC internal capacitance of GAC
CR concentration of PCs removal (mg L-1
)
Cst sandwich-type capacitance for micropores
D diffusion coefficient of the targeted compound
d electrode thickness
De effective diffusivity
deff effective separation between the electrode surface and the counterions
Ean anode potential
Ecat cathode potential
G dimensionless time constant representing competition between electrical potential wave
and sorption wave
H bed height
I0 exchange current intensity
J current density
K number of iterated values
k1 pseudo-first-order rate constants
k2 pseudo-second-order rate constants
𝐾𝑐 thermodynamic distribution coefficient
kf external mass transfer coefficient
Kf Freundlich constant that presents the adsorption capacity of the adsorbent
KL Langmuir constant related to the energy of adsorption (L g-1
)
kTH Thomas rate constant, (mL min-1
mg-1
)
kYN rate constant that is related to the diffusion characteristics of the mass transfer zone
(min-1
).
L characteristic length
L0 distance between two parallel electrodes having the same polarity
M mass of the working electrode

XL
M total amount of PCs sent to the column (g)
mtotal amount of PCs sent to the column (g)
N constant that presents the greatness of the relationship between PCs and SA-AC beads
or GAC.
qe amounts of PCs adsorption onto SA-AC beads or GAC at equilibrium
qe(calc) Values of amounts using the pseudo-second-order kinetic model experimental
qe(exp) Values of amounts using the experimental data
qm maximum PCs adsorption capacity (mg g-1
)
qt amounts of PCs adsorption onto SA-AC beads or GAC time t
qtotal total mass of PCs adsorbed
QV inlet flow rate
R1 outer radii of the cylinder
R2 inner radii of the cylinder
RCT charge transfer resistance
Re Reynolds number
Rf faradaic resistance of the electrochemical reaction
RGAC internal resistance of GAC
Rs difference in the resistance of the solution between two points of interest in the system
RSol resistance of the bulk electrolyte
SBET specific surface area estimated by the Brunauer-Emmett-Teller method
Sc Schmidt number
Sh Sherwood number
Sr scan rate
T dimensionless time
T reaction time
tdl double layer charging time
tsc scan time
tst stoichiometric time of sorption
tt0 turnover time
ttotal total time (min)
U linear velocity of the liquid through the void space of the adsorbent
V volume of solution
Vef volume of the effluent
Vme volume of mesopore
W bed width
Wa Wagner number
Greek letters δa diffusion layer thickness at anode δc diffusion layer thickness at cathode
∆𝐸 potential difference ∆𝐺 Gibbs free energy of adsorption ∆𝐻 enthalpy of adsorption ∆𝑆 entropy of adsorption
𝜀𝐵 bed porosity
Overpotential Κ effective electrolyte conductivity 𝜏 time required for 50% adsorbate breakthrough
kinematic viscosity of the solution
𝜌𝐵 bed density
𝜎 electrical conductivity of the porous material χ
2 chi-squared residue

1
General Introduction
Water is an essential element for the life existence. Its role is fundamental for the
economic development of human civilization, given its use in many sectors, including industry
and agriculture. However, this vital resource is well known for being easily contaminated.
Hence, there is the need to improve effective means for its protection against pollution.
In recent decades, the increasing industrial expansion and domestic activities
haveproduced significant volumes of wastewater containing undesirable toxic contaminants
(e.g., fine suspended solids, metals, dissolved organic and inorganic compounds, and other
impurities). Water pollution is therefore becoming a serious concern in the environmental field
(Crini et al., 2019; Crini & Lichtfouse, 2019; Bagheri et al., 2020; Li et al., 2020), and the
demand for freshwater represents one of the most critical global challenges of the 21st century
(Zhang et al., 2018). The United Nations Educational, Scientific and Cultural Organization
(UNESCO) approximates that nearly over two billion people live in countries experiencing high
water stress, which tends to be globalized (UNESCO, 2019). In addition, numerous studies of
industrial wastewater treatment have been reported among the olive mill wastewater (OMWW)
effluents, which is a liquid effluent generated during olive oil extraction (Al-Bsoul et al., 2020;
Amine et al., 2020; Enaime et al., 2020; Ntaikou et al., 2020; Haddad et al., 2021; Soria &
Madeira, 2021). More than 30 × 106 m
3 of OMWW are produced annually by Mediterranean
countries (Al-Bsoul et al., 2020). OMWW is an environmentally critical effluent due to its high
complexity and its wide variety of pollutants (Amine et al., 2020). Additionally, their acidic pH,
high electrical conductivity, high concentration of total solids, high chemical oxygen demand
(COD 60-185 g L−1
), low ratio of biochemical oxygen demand after 5 days (BOD5) over COD
(0.23-0.40) and high polyphenols content (up to 8 g L−1
) could noticeably affect the soil and
underground water quality (Achak, 2008; Al-Bsoul et al., 2020; Haddad et al., 2021; Soria &
Madeira, 2021). In particular, phenolic compounds (PCs) create a major environmental issue in
the main olive-producing countries due to the significant alteration of microbial activities in the
water and soil ecosystems (Haddad et al., 2021). However, the PCs also represent added-value
molecules that could be recovered for subsequent valorization in the pharmaceutical, cosmetic
and food industries (Annab et al., 2019). They have strong antioxidant, anti-inflammatory and
antimicrobial properties, and several good health effects have been attributed to consuming food
rich in polyphenols (Annab et al., 2019). Thus, there is the need to propose combined

2
technologies that are able to recover these compounds from the wastewater while eliminating the
remaining organic compounds in solution (Kilic et al., 2019; El Ghadraoui et al., 2020;
Elmansour et al., 2020).
Many processes have recently been investigated to recover PCs from OMWW, such as
physical, thermal, physicochemical and biological technologies (Rahmanian et al., 2013). Azzam
and Hazaimeh (2021) used liquid-liquid extraction to recover PCs from OMWW using ethyl
acetate as a solvent. Zagklis et al. (2015) used resin adsorption/desorption to recover
hydroxytyrosol from OMWW and Achak et al. (2009) used adsorption followed by desorption
for the recovery of total PCs from OMWW using banana peel as a biosorbent. Among these
processes, adsorption is the most widely used and effective technique to separate organic
pollutants from wastewater (Sun et al., 2019). In recent years, many adsorbents, such as activated
carbons (AC), have been used to eliminate PCs (Annab et al., 2019). AC is commonly used
because of its microporous texture, high surface reactivity, consistency in pore size distribution,
a wide spectrum of functional surface groups, and thermal steadiness (Baçaoui et al., 1998;
Baçaoui et al., 2001; Shim et al., 2019). Moreover, electrosorption offers several advantages
compared to adsorption, such as high removal efficiency (i.e., a high adsorption capacity), fast
adsorption kinetics, and the possibility to control the selectivity and the sorption/desorption steps
(Han et al., 2006a; Rong & Xien, 2009; Gao et al., 2017). It is particularly suitable for removing
charged and/or polar pollutants by polarizing high surface area electrodes at a given electric
current or potential (Bayram et al., 2018; Nainamalai et al., 2018). Furthermore, the hypersaline
characteristic of OMWW makes those effluents good candidates for electrochemical processes
by avoiding high internal ohmic resistance. Nevertheless, the lack of experimental data obtained
with real effluents is a handicap for validating adsorption models and improving system
performance. This is also necessary for a thorough understanding of the interactions at the
sorbent/solution interface. Moreover, the experimental data, as well as their adequate
interpretation, are required for the synthesis of new and better performing bio-sourced materials.
In this context, the main objective of this thesis is to propose an integrated approach of
waste management of the olive industry, valorizing their solid waste in the treatment of their
liquid waste, as presented in Fig. 1.

3
Fig. 1. The innovative integrated approach of the thesis.
The olive pomace waste generated during the olive oil production process is reused as
bio-adsorbent (i.e., powdered AC within composite alginate beads or granular AC (GAC)) in
either adsorption or electrosorption for PCs recovery from OMWW. The remaining organic
compounds in OMWW are then proposed to be eliminated by advanced electrooxidation
treatment, while the adsorbent is regenerated by chemical or electrochemical methods. A
systematic approach has been adopted by increasing the degree of complexity of the effluent
until studies with real OMWW. Emphasis improves the knowledge of adsorption and
electrosorption mechanisms of PCs removal from OMWW, through the proposition of new
models compared with consistent experimental data. Particular attention has been given to the
influence of mass transport and PCs physico-chemical properties on the efficiency of adsorption
and electrosorption. These considerations have been taken into account in the models for a better
prediction of the system evolution as a function of time. This research work has been performed
in the framework of a cotutelle agreement between Cadi Ayyad University and Lorraine
University, under the Partenariat Hubert Curien (PHC) Toubkal/19/84 project (Campus France:
41525VG). The formulation of the adsorbents as well as adsorption and desorption tests were
carried out in Morocco (National Center for Research and Studies on Water and Energy
(CNEREE) and Laboratory of Water, Biodiversity, and Climate Change, Faculty of Sciences
Semlalia), while the 3D electrode conception along with electrosorption, electro-desorption and
electro-oxidation experiments were performed in France (Laboratoire Réactions et Génie des
Procédés (LRGP)).

4
The structure of the thesis is illustrated in Fig. 1, and the related content of each part is
summarized herein after:
- The first part includes a state-of-the-art section about both adsorption and electrosorption.
It begins by exposing the background and principles of adsorption and electrosorption
technologies. The influence of parameters, such as electrode materials, current density, physico-
chemistry of electrolytes and reactor design, is then addressed. Next, identifying of the main
influencing factors combined with electrosorption modeling allows the design strategies for
implementing porous electrodes to be defined. Finally, future directions for electrosorption
processes are presented, which bring new opportunities for their optimization and future
development as proposed in this thesis.
- The second part offers a description of the experimental approach. It starts with the
location of OMWW used and the different techniques employed to determine the
physicochemical properties of OMWW. Then, the preparation of the adsorbents and porous
electrodes based on olive pomace has been described, along with their physicochemical and
electrochemical characterization. Finally, an overview of the experimental setup of adsorption
and electrosorption of PCs was made, along with the different analytical techniques for effluent
characterization.
- The third part is about the results and discussion. It is divided into two chapters:
The first chapter is devoted to composite beads experiments and is divided into two
sub-chapters:
The first sub-chapter presents a study about the PCs adsorption onto composite
beads. The olive pomace is first converted into a highly porous AC and then a
composite bead using alginate (SA-AC beads). It can be subsequently used for the
treatment of OMWW by adsorption. The kinetics, mechanism and adsorption
characteristics of PCs adsorption were investigated. The experiments were carried
out under different operational conditions (time, concentration, pH, temperature) to
determine the adsorbent behavior in stirred batch and fixed-bed reactors. PCs
recovery and the process reusability of SA-AC beads were carried out in fixed-bed
reactors.
The second sub-chapter is devoted to the PCs electrosorption with SA-AC beads as
a three-dimensional (3D) electrode. Novel theoretical models are proposed to
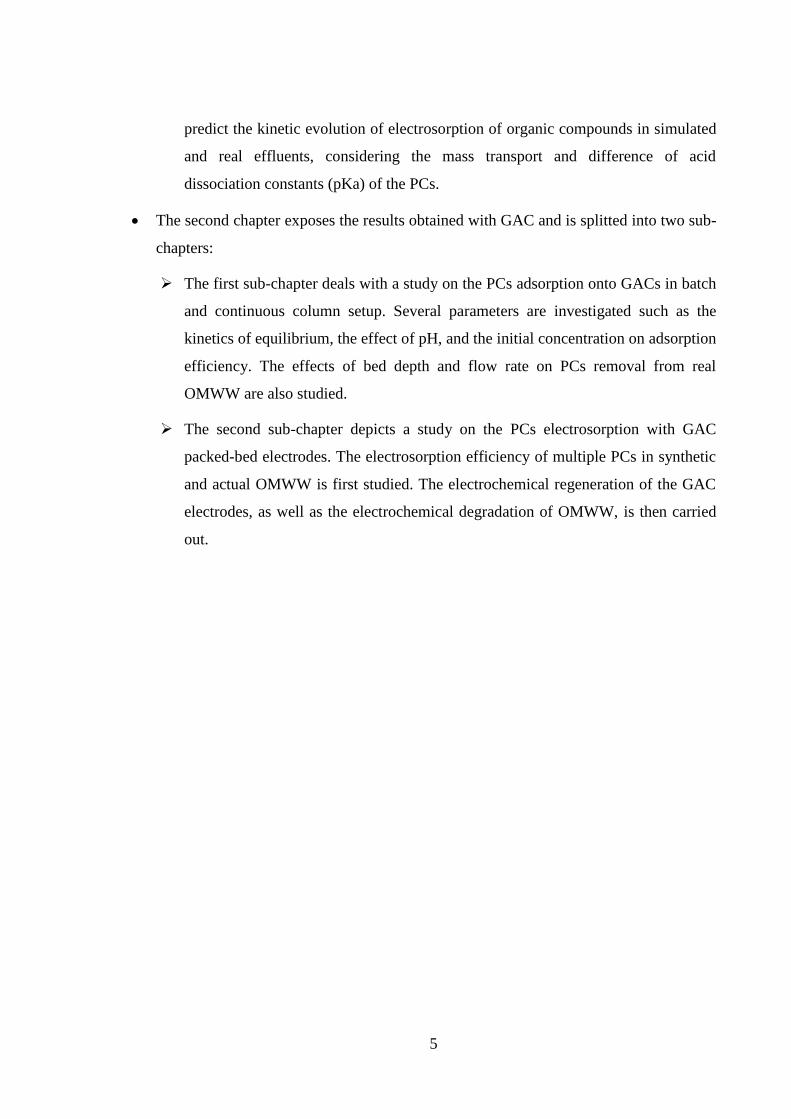
5
predict the kinetic evolution of electrosorption of organic compounds in simulated
and real effluents, considering the mass transport and difference of acid
dissociation constants (pKa) of the PCs.
The second chapter exposes the results obtained with GAC and is splitted into two sub-
chapters:
The first sub-chapter deals with a study on the PCs adsorption onto GACs in batch
and continuous column setup. Several parameters are investigated such as the
kinetics of equilibrium, the effect of pH, and the initial concentration on adsorption
efficiency. The effects of bed depth and flow rate on PCs removal from real
OMWW are also studied.
The second sub-chapter depicts a study on the PCs electrosorption with GAC
packed-bed electrodes. The electrosorption efficiency of multiple PCs in synthetic
and actual OMWW is first studied. The electrochemical regeneration of the GAC
electrodes, as well as the electrochemical degradation of OMWW, is then carried
out.

6
References
Achak, M., Hafidi, A., Ouazzani, N., Sayadi, S., Mandi, L., 2009. Low cost biosorbent “banana
peel” for the removal of phenolic compounds from olive mill wastewater: Kinetic and
equilibrium studies. J. Hazard. Mater. 166, 117–125.
https://doi.org/10.1016/j.jhazmat.2008.11.036
Achak, M., Ouazzani, N., Yaacoubi, A., & Mandi, L., 2008. Caractérisation des margines issues
d’une huilerie moderne et essais de leur traitement par coagulation-floculation par la chaux
et le sulfate d’aluminium. Revue des sciences de l'eau/Journal of Water Science, 21(1), 53-
67.
Al-Bsoul, A., Al-shannag, M., Tawalbeh, M., Al-taani, A.A., Lafi, W.K., Al-othman, A.,
Alsheyab, M., 2020. Optimal conditions for olive mill wastewater treatment using
ultrasound and advanced oxidation processes. Sci. Total Environ. 700, 134576.
https://doi.org/10.1016/j.scitotenv.2019.134576
Amine, A., Jeguirim, M., Kinigopoulou, V., Doulgeris, C., Goddard, M., Jellali, S., Matei, C.,
2020. Olive mill wastewater: From a pollutant to green fuels , agricultural and water source
and bio-fertilizer – Hydrothermal carbonization. Sci. Total Environ. 733, 139314.
https://doi.org/10.1016/j.scitotenv.2020.139314
Annab, H., Fiol, N., Villaescusa, I., Essamri, A., 2019. Journal of Environmental Chemical
Engineering A proposal for the sustainable treatment and valorisation of olive mill wastes.
J. Environ. Chem. Eng. 7, 102803. https://doi.org/10.1016/j.jece.2018.11.047
Baçaoui, A., Yaacoubi, A., Dahbi, A., Bennouna, C., Luu, R. P. T., Maldonado-Hodar, F.
Rivera-Utrilla J., J., Moreno-Castilla, C., 2001. Optimization of conditions for the
preparation of activated carbons from olive-waste cakes. Carbon, 39(3), 425-432.
Baçaoui, A., Yaacoubi, A., Dahbi, A., Bennouna, C., Ayele, J., & Mazet, M., 1998. Activated
Carbon Production from Moroccan Olive Wastes - Influence of Some Factors.
Environmental Technology, 19(12), 1203–1212.
Bagheri, H., Fakhri, H., Ghahremani, R., Karimi, M., Madrakian, T., Afkhami, A., 2020.
Nanomaterial-based adsorbents for wastewater treatment, Smart nanocontainers. Elsevier
Inc. https://doi.org/10.1016/b978-0-12-816770-0.00028-9
Bayram, E., Kizil, Ç., Ayranci, E., 2018. Flow-through electrosorption process for removal of
2,4-D pesticide from aqueous solutions onto activated carbon cloth fixed-bed electrodes.
Water Sci. Technol. 77, 848–854. https://doi.org/10.2166/wst.2017.598
Crini, G., Lichtfouse, E., 2019. Advantages and disadvantages of techniques used for
wastewater treatment. Environ. Chem. Lett. 17, 145–155. https://doi.org/10.1007/s10311-
018-0785-9
Crini, G., Lichtfouse, E., Wilson, L.D., Morin-Crini, N., 2019. Conventional and non-
conventional adsorbents for wastewater treatment. Environ. Chem. Lett. 17, 195–213.
https://doi.org/10.1007/s10311-018-0786-8
El Ghadraoui, A., Ouazzani, N., Ahmali, A., El Mansour, T.E.H., Aziz, F., Hejjaj, A., Del
Bubba, M., Mandi, L., 2020. Treatment of olive mill and municipal wastewater mixture by
pilot scale vertical flow constructed wetland. Desalin. Water Treat. 198, 126–139.
https://doi.org/10.5004/dwt.2020.26009
Elmansour, T.E., Mandi, L., Ahmali, A., Elghadraoui, A., Aziz, F., Hejjaj, A., Del Bubba, M.,
Ouazzani, N., 2020. Effect of polyphenols on activated sludge biomass during the
treatment of highly diluted olive mill wastewaters: biomass dynamics and purifying
performances. Water Sci. Technol. 82, 1416–1429. https://doi.org/10.2166/wst.2020.423
Enaime, G., Baçaoui, A., Yaacoubi, A., Belaqziz, M., Wichern, M., & Lübken, M. (2020).
Phytotoxicity assessment of olive mill wastewater treated by different technologies: effect

7
on seed germination of maize and tomato. Environmental Science and Pollution Research.
doi:10.1007/s11356-019-06672-z
Gao, T., Li, H., Zhou, F., Gao, M., Liang, S., Luo, M., 2017. Mesoporous carbon derived from
ZIF-8 for high efficient electrosorption. Desalination 451, 133–138.
https://doi.org/10.1016/j.desal.2017.06.021
Haddad, K., Jeguirim, M., Jellali, S., Thevenin, N., Ruidavets, L., Limousy, L., 2021. Biochar
production from Cypress sawdust and olive mill wastewater: Agronomic approach. Sci.
Total Environ. 752, 141713. https://doi.org/10.1016/j.scitotenv.2020.141713
Han, Y., Quan, X., Chen, S., Zhao, H., Cui, C., Zhao, Y., 2006. Electrochemically enhanced
adsorption of aniline on activated carbon fibers. Sep. Purif. Technol. 50, 365–372.
https://doi.org/10.1016/j.seppur.2005.12.011
Kilic, M.Y., Abdelraheem, W.H., He, X., Kestioglu, K., Dionysiou, D.D., 2019. Photochemical
treatment of tyrosol, a model phenolic compound present in olive mill wastewater, by
hydroxyl and sulfate radical-based advanced oxidation processes (AOPs). J. Hazard.
Mater. 367, 734–742. https://doi.org/10.1016/j.jhazmat.2018.06.062
Li, Z., Shen, C., Liu, Y., Ma, C., Li, F., Yang, B., Huang, M., Wang, Z., Dong, L., Wolfgang,
S., 2020. Carbon nanotube filter functionalized with iron oxychloride for flow-through
electro-Fenton. Appl. Catal. B Environ. 260, 118204.
https://doi.org/10.1016/j.apcatb.2019.118204
Nainamalai, M., Palani, M., Soundarajan, B., Allwin, A.E., 2018. Decolorization of synthetic
dye wastewater using packed bed electro-adsorption column. Chem. Eng. Process. -
Process Intensif. 130, 160–168. https://doi.org/10.1016/j.cep.2018.06.013
Ntaikou, I., Antonopoulou, G., Vayenas, D., Lyberatos, G., 2020. Assessment of
electrocoagulation as a pretreatment method of olive mill wastewater towards alternative
processes for biofuels production. Renew. energy 154, 1252–1262.
https://doi.org/10.1016/j.renene.2020.03.108
Rong, C., Xien, H., 2009. Reversible electrosorption of thiocyanate anions by active carbon felt.
Sep. Sci. Technol. 44, 3984–3999. https://doi.org/10.1080/01496390903182453
Shim, J., Kumar, M., Goswami, R., Mazumder, P., Oh, B.T., Shea, P.J., 2019. Removal of p-
cresol and tylosin from water using a novel composite of alginate, recycled MnO2 and
activated carbon. J. Hazard. Mater. 364, 419–428.
https://doi.org/10.1016/j.jhazmat.2018.09.065
Soria, M.A., Madeira, L.M., 2021. Screening of commercial catalysts for steam reforming of
olive mill wastewater. Renew. energy 169, 765-779.
https://doi.org/10.1016/j.renene.2020.12.139
Sun, J., Liu, X., Zhang, F., Zhou, J., Wu, J., Alsaedi, A., Hayat, T., Li, J., 2019. Insight into the
mechanism of adsorption of phenol and resorcinol on activated carbons with different
oxidation degrees. Colloids Surfaces A Physicochem. Eng. Asp. 563, 22–30.
https://doi.org/10.1016/j.colsurfa.2018.11.042
UNESCO, 2019. The United Nations world water development report 2019: leaving no one
behind. UN Educ. Sci. Cult. Organ.
Zagklis, D.P., Vavouraki, A.I., Kornaros, M.E., Paraskeva, C.A., 2015. Purification of olive
mill wastewater phenols through membrane filtration and resin adsorption/desorption. J.
Hazard. Mater. 285, 69–76. https://doi.org/10.1016/j.jhazmat.2014.11.038
Zhang, C., He, D., Ma, J., Tang, W., Waite, T.D., 2018. Faradaic reactions in capacitive
deionization (CDI) - Problems and possibilities: A review 128, 314–330.
https://doi.org/10.1016/j.watres.2017.10.024

8
Part I: Bibliography

Part I Bibliography
9
1. Adsorption
1.1.Definition and types of adsorption
Adsorption is a well-known surface phenomenon by which molecules of gas or
liquids attach themselves to the solid surfaces of adsorbents according to various more or less
intense processes (El-Naas & Alhaija, 2013; Zheng et al., 2021). The adsorbed molecules are
called adsorbate, and the solid onto which the molecules are adsorbed is generally called
adsorbent (Cuong, 2020). Some basic adsorption terms are schematized in Fig. 2 to better
understand the technical terms used in the adsorption process (Tran et al., 2017).
Adsorption is a spontaneous phenomenon that occurs as soon as a solid surface
comes into contact with a gas or a liquid, based on the difference in affinity of an adsorbent
for the constituents of a mixture (Sarkar & Paul, 2016). This results in a difference in
adsorbed amounts of the constituents at equilibrium. However, the difference in adsorption
rate can also be exploited to separate the constituents of a mixture having similar adsorbed
amounts at equilibrium (Feng et al., 2021). The reverse phenomenon by which molecules
break off is desorption.

Part I Bibliography
10
Fig. 2. Some basic terms used in adsorption science and technology (Tran et al., 2017).
The adsorption mechanism of pollutants onto the surface of solids generally occurs
through four successive phenomena (Fig. 3) (Peng & Guo, 2020):
Bulk transport, which corresponds to the transport of contaminants in the solution
phase,
Film transport, which corresponds to the transport of contaminant from the bulk liquid
phase to the adsorbent's external surface through a hydrodynamic boundary layer or film,
Intraparticle transport, which corresponds to the diffusion of the contaminant from the
vicinity of the adsorbent into the pores of the adsorbent,
Adsorption, which corresponds to the attachment of contaminant molecules to the
surface of the solid.

Part I Bibliography
11
Fig. 3. Schematic representation of the adsorption processes (Peng & Guo, 2020).
The nature of the bonds, as well as the amount of energy, exchanged during the
retention of a molecule on the surface of a solid allow distinguishing two types of adsorption
(Fig. 4) (Sarkar & Paul, 2016; Cuong, 2020):
Physical adsorption, also called physisorption, is due to electrostatic forces between
the solute and the solid surface; it is characterized by low binding energy (< 40 kJ.mol-1
) and
corresponds to the establishment of Van der Waals type bonds. As a result, the retention time
of the adsorbed substance is short and the adsorbent surface can be covered with multiple
molecular layers of the adsorbed product. Furthermore, this adsorption type is reversible and
exothermic (Basuki et al., 2019; Cuong, 2020).
Chemical adsorption, also called chemisorption, involves covalent or hydrogen-like
chemical bonds between the adsorbate and the adsorbent molecule; it involves high energy (>
40 kJ mol-1
). The retention time is long and only the first layer linked to the adsorbent surface
is chemisorbed; if they exist, the additional layers are retained by physisorption. Unlike
physical adsorption, chemisorption is irreversible as high energies are involved (Basuki et al.,
2019; Cuong, 2020).

Part I Bibliography
12
Fig. 4. Schematic representation of the physical adsorption and chemical adsorption (Cuong,
2020).
1.2.Adsorption of organic pollutants
Green approaches have become a trend to solve ongoing aquatic environmental
problems in a condition that they fully satisfy the three pillars of sustainability: environmental
and social protection as well as economic prosperity (Chkirida et al., 2021).
The reactor design is one of the parameters that can address this issue. A column
adsorption device is a practical and simple setup that reduces the costs and energy needed for
water treatment by exploiting the concentration gradient between the adsorbent and
pollutants. This permits the production of high-quality treated effluents with a minimum
pollutant concentration on an ongoing basis (Basu et al., 2019; Aziz et al., 2020). The main
advantage of the column setup is that it can handle large volumes of contaminated effluents
requiring a very short contact time between the adsorbent and the pollutants (Aziz et al.,
2020). Nonetheless, this operation at the real scale requires granular materials of controlled
size (Basu et al., 2019; Aziz et al., 2020).
Various bio-sourced and granular materials have been employed for adsorption
technologies. Alginate acts as an embedding medium to assist the preparation of easy
separating and recycling adsorbents (Xu et al., 2021). Many researchers use beads with
alginate coatings on several kinds of adsorbent materials or functionalize them to be more
efficient and test the obtained composites to remove organic pollutants in wastewater. Among
the composite beads used in the literature, we find amidoxime modified polymers of intrinsic
microporosity/alginate composite hydrogel beads for removal of malachite green (Xu et al.,
2021), AC-alginate beads for phenol removal (Khan et al., 2021), starch and powdered AC
amended alginate-biomass beads for removal of metronidazole and organic matter from

Part I Bibliography
13
synthetic wastewater (Girijan et al., 2021) as well as alginate/bentonite impregnated TiO2
beads for removal of methylene blue (Chkirida et al., 2021).
Xu et al. (2021) investigated the amidoxime modified polymers of intrinsic
microporosity/alginate composite hydrogel beads to remove malachite green. The adsorption
capacity increased with the increase of contact time, temperature and initial concentration of
malachite green, and decreased with the increase of the adsorbent dose. Isotherm data were
well described by both Freundlich isotherm and Langmuir isotherm models, and pseudo-
second-order could fit the adsorption kinetics. The composite beads demonstrated outstanding
regeneration properties for malachite green adsorption and they can maintain more than 90%
of their original adsorption capacity after ten adsorption/regeneration cycles. Alternatively,
Khan et al. (2021) studied the phenol adsorption into AC-alginate beads. The maximum
adsorption capacity of composite beads for phenol was 78 mg g-1
. The kinetic study
concluded that phenol adsorption on composite beads followed a pseudo-second-order kinetic
model. The adsorption of phenol on composite beads fitted well to both the Freundlich and
Langmuir isotherms. The synthesized composite beads were easily recycled and reused for
phenol adsorption. The adsorption of organic pollutants from aqueous solution into composite
beads occurred in two successive steps, i.e., film adsorption followed by intraparticle
diffusion, as demonstrated by the intra-particle diffusion model. The high adsorption capacity,
exceptional regeneration capacity, as well as simple preparation method make composite
beads a promising adsorbent for the selective removal of organic pollutants in wastewater
treatment applications.
Recently, GAC was used as adsorbent due to its high surface area and high affinity
towards the removal of organic pollutants in wastewater (Fazal et al., 2020), such as humic
acid (Barhoumi et al., 2019), trypan blue (Cai et al., 2020), naphthenic acids (Islam et al.,
2018), metronidazole (Díaz-Blancas et al., 2018), acenaphthylene and phenanthrene
(Eeshwarasinghe et al., 2019) as well as organic micropollutants (Jamil et al., 2019; Jaria et
al., 2019; Piai et al., 2019; Golovko et al., 2020). Cai et al. (2020) investigated the removal of
trypan blue by adsorption. The authors used core-shell GAC with a specific surface area of
1,128 m2 g
-1 and an abrasive resistance of 99%. The removal efficiency of trypan blue was
116 mg g-1
under the optimal conditions. Islam et al. (2018) studied the adsorption of
naphthenic acids. The results indicated that the pseudo-second-order controlled the adsorption
kinetics of naphthenic acids to GACand intraparticle diffusion models and the maximum

Part I Bibliography
14
adsorption capacities obtained from Langmuir adsorption isotherm was 60 mg g-1
. In addition,
the adsorption rate of acenaphthylene and phenanthrene on GAC was also studied by
Eeshwarasinghe et al. (2019). The adsorption kinetics indicated that intraparticle diffusion
was the main limiting phenomenon with acenaphthylene and phenanthrene adsorptions into
the mesopores and micropores of the GAC. The Langmuir adsorption capacities of
acenaphthylene (0.31–2.63 mg g-1
) and phenanthrene (0.74–7.36 mg g-1
) on GAC decreased
with increased heavy metals concentration. To conclude, the GAC adsorbent had a high
specific surface area and a higher abrasion resistance compared to composite beads. The
adsorption kinetics of organic pollutants into GAC followed a pseudo-second-order model
and an intraparticle diffusion model, i.e., the adsorption was mainly controlled by
chemisorption and diffusion. The main adsorption isotherm model of organic pollutants into
GAC was the Langmuir adsorption model. Thus, composite beads and GAC have shown great
potential in environmental remediation applications due to their unique characteristics
(granular form, porous morphology and high surface area) and their high adsorption affinity
with various organic pollutants.
Further studies could be useful for modeling, designing and optimizing adsorption
technologies for organic pollutants recovery and evaluating the performance of new bio-
adsorbents as exposed in the following sub-section.
1.3.Current stage and future prospects
Although a significant number of research articles have been published on the
adsorption of organic compounds onto composite beads and GAC, there are still numerous
gaps that need particular attention. The following facts can be considered, but not restricted
to, for future research, including in this PhD thesis:
Research on the selectivity of adsorption and desorption is very important especially
for high-value organic compounds (for example, PCs),
Little work is done on the use of recycling materials as adsorbents to remove organic
compounds. This could have potential for future research,
More effective, reusable and eco-friendly materials should be developed, and tested
with real effluents,
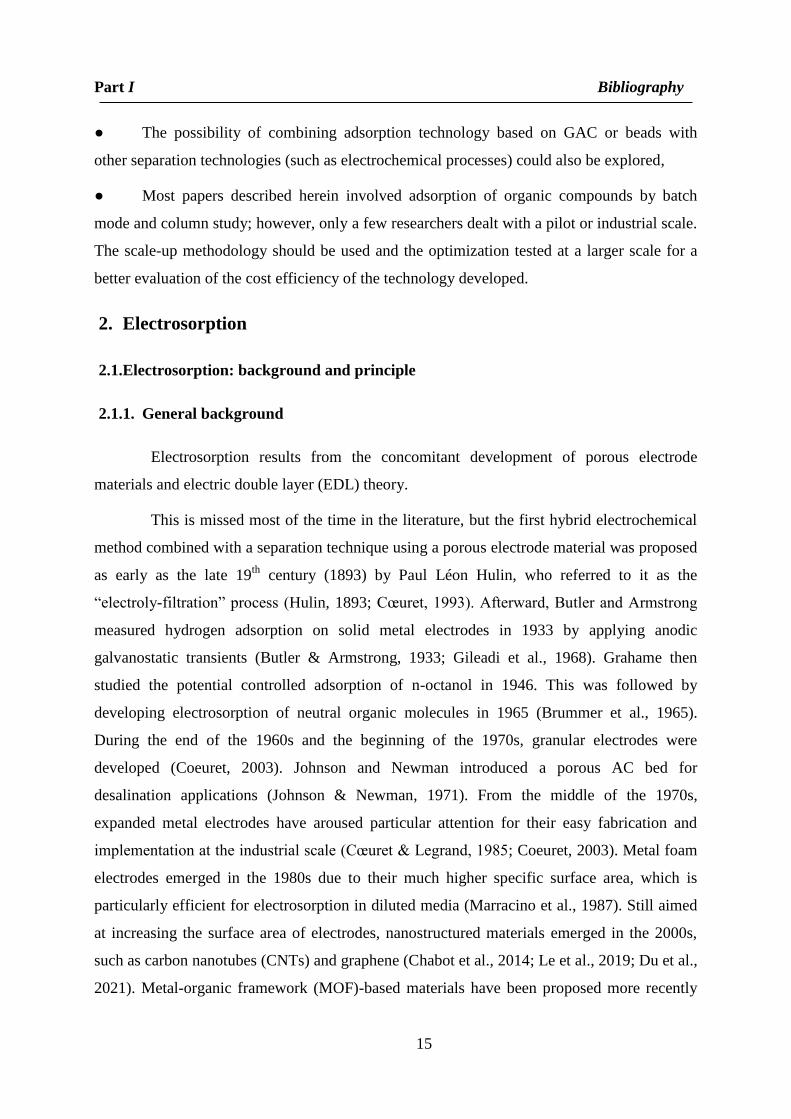
Part I Bibliography
15
The possibility of combining adsorption technology based on GAC or beads with
other separation technologies (such as electrochemical processes) could also be explored,
Most papers described herein involved adsorption of organic compounds by batch
mode and column study; however, only a few researchers dealt with a pilot or industrial scale.
The scale-up methodology should be used and the optimization tested at a larger scale for a
better evaluation of the cost efficiency of the technology developed.
2. Electrosorption
2.1.Electrosorption: background and principle
2.1.1. General background
Electrosorption results from the concomitant development of porous electrode
materials and electric double layer (EDL) theory.
This is missed most of the time in the literature, but the first hybrid electrochemical
method combined with a separation technique using a porous electrode material was proposed
as early as the late 19th
century (1893) by Paul Léon Hulin, who referred to it as the
“electroly-filtration” process (Hulin, 1893; Cœuret, 1993). Afterward, Butler and Armstrong
measured hydrogen adsorption on solid metal electrodes in 1933 by applying anodic
galvanostatic transients (Butler & Armstrong, 1933; Gileadi et al., 1968). Grahame then
studied the potential controlled adsorption of n-octanol in 1946. This was followed by
developing electrosorption of neutral organic molecules in 1965 (Brummer et al., 1965).
During the end of the 1960s and the beginning of the 1970s, granular electrodes were
developed (Coeuret, 2003). Johnson and Newman introduced a porous AC bed for
desalination applications (Johnson & Newman, 1971). From the middle of the 1970s,
expanded metal electrodes have aroused particular attention for their easy fabrication and
implementation at the industrial scale (Cœuret & Legrand, 1985; Coeuret, 2003). Metal foam
electrodes emerged in the 1980s due to their much higher specific surface area, which is
particularly efficient for electrosorption in diluted media (Marracino et al., 1987). Still aimed
at increasing the surface area of electrodes, nanostructured materials emerged in the 2000s,
such as carbon nanotubes (CNTs) and graphene (Chabot et al., 2014; Le et al., 2019; Du et al.,
2021). Metal-organic framework (MOF)-based materials have been proposed more recently

Part I Bibliography
16
for electrosorption due to their exceptional surface area with controllable porosity (Chang et
al., 2015).
In the meantime, the understanding of the EDL mechanism aroused specific attention
within the electrochemistry community. It began with studies about the potential drops at the
electrode/electrolyte interface and the so-called “Volta problem”. Many known scientists have
attempted to explain this phenomenon, such as Volta, Nernst, Ostwald, Planck, Langmuir and
Lorenz (Damaskin & Petrii, 2011). Several EDL theories have been developed (Pilon et al.,
2015), mainly through phenomenological models that could be supported by experimental
data obtained by two kinds of electrochemical techniques: (i) electrocapillary curves, first
developed by Lippmann (Lippmann, 1875) and (ii) EDL differential capacitance plots, first
proposed by Varley (Varley, 1871). Helmholtz was the first to formalize the EDL concept in
1879 (Helmholtz, 1879), suggesting the existence of a compact layer made of a monolayer of
counterions inducing a linear decrease in the potential in the vicinity of an oppositely charged
conductive surface (Helmholtz, 1879). In contrast to the assumption of a continuous
distribution of ions in the electrolyte upon the Poisson-Boltzmann relation at thermodynamic
equilibrium, Gouy (Gouy, 1910) and Chapman (Chapman, 1913) proposed an alternative in
the 1910s, introducing the existence of a diffuse double layer, which induces a nonlinear
decrease in the potential in the vicinity of the electrode. The Gouy-Chapman approach was
still not convincing at the closest distance of the electrode. The ions concentration was
overestimated at the electrode surface because the ions were taken as point charges instead of
finite size. Thus, in 1924 Stern proposed juxtaposing both the Helmholtz and Gouy-Chapman
models (Stern, 1924), in which the EDL is composed of a compact layer close to the surface
of the electrode and a diffuse layer in the outer region. In 1947, Grahame proposed dividing
the compact layer (i.e., Stern layer) into the inner Helmholtz plane (IHP) and the outer
Helmholtz plane (OHP). The IHP consists of a layer of ions and solvent adsorbed by covalent
bonds and/or van der Waals forces on the interface. In the OHP, ions are driven by
electromigration effects to produce an ionic environment (Grahame, 1947). Figure 1
schematizes the EDL considering the so-called Gouy-Chapman-Stern model, including IHP
and OHP (Helmholtz, 1879; Gouy, 1910; Chapman, 1913; Stern, 1924; Grahame, 1947). This
polarized interface induces a capacitance whose values usually range between a few µF cm-2
to several tens of µF cm-2
(Simon & Gogotsi, 2008).

Part I Bibliography
17
Fig. 5. Schematic representation of the EDL at positively charged electrode materials in the
presence of anions, cations and solvent.
2.1.2. Principle
Electrosorption is a heterogeneous process defined as the species adsorption induced
by electric current or a polarization potential on the surface of a conductive material without
involving faradaic reactions, i.e., without electron transfer reactions (Fig. 6) (Frumkin et al.,
1974; Gerçel, 2016). The electrosorption efficiency is usually quantified by estimating the
equilibrium electrosorption capacity (qA in mg g-1
), according to Eq. 1 (Li et al., 2016):
𝑞𝐴 = (𝐶0− 𝐶𝑒) 𝑉
𝑚 (1)
where C0 and Ce are the initial and equilibrium concentrations of the pollutant,
respectively (g L-1
), V is the volume of the solution (L), and m is the mass of the working
electrode (g).
The higher the electrosorption capacity is, the higher the electrosorption efficiency is
(Alencherry et al., 2017).
The electric potential or current is the third driving force of the electrosorption
phenomenon and ion exchange mechanism (Jung et al., 2005). The transport steps remain
essential in the process efficiency (Schultze & Vetter, 1973; Vetter & Schultze, 1974).

Part I Bibliography
18
Diffusion (i.e., species subjected to a concentration gradient in the vicinity of the electrode),
electromigration (i.e., ions subjected to a gradient of the electrostatic potential) and
convection (i.e., global fluid movement in bulk) phenomena can occur in the electrochemical
reactor, which has been formalized by the Nernst-Planck equation (Bard & Faulkner, 2001).
Most of the time, organic species' diffusion and/or electromigration in diluted media are
limited steps before subsequent electrosorption (Panizza et al., 2001; Coeuret, 2003; Mousset,
et al., 2019; Adnan et al., 2021a; Alagesan et al., 2021). Electromigration represents an
interesting feature when organic ionic species are present in a solution since it can facilitate
their selective transport toward the oppositely charged electrode for electrosorption.
Nevertheless, the electrosorption of uncharged organic compounds remains feasible by
following replacement reactions at an equivalent volume between water molecules adsorbed
on the electrode and the organic compound (Gileadi, 1966a).
Apart from transport phenomena, the behavior at the electrode/electrolyte interface is
another important concern for efficient electrosorption. This can be characterized by the EDL,
which usually needs to be maximized. EDLs have been shown to depend on electrode
material properties (i.e., electronic structure of the metal surface, electrode surface roughness,
porosity and pore size distribution), interelectrode distances and electrolyte characteristics
(i.e., electrolyte concentration, viscosity and polarity, distribution of ions and solvent
molecules) (Trasatti, 1992; Schmickler, 1996; Conway, 1999; Yan et al., 2017; Oleinick et al.,
2019). The influence of parameters on the organic electrosorption efficiency is discussed in
more detail in section 2.2 of part I.

Part I Bibliography
19
Fig. 6. Schematic diagram illustrating the principle of electrosorption, including anion, cation
and uncharged compounds, as well as transport phenomena (δa and δc: diffusion layer
thickness at the anode and cathode, respectively).

Part I Bibliography
20
2.2.Influence of the main parameters
The effect of the main parameters (i.e., the properties of the electrode materials, the
experimental conditions (applied electrode potential, pH, concentration, electric conductivity,
residence time, flow rate) and the reactor design) on the electrosorption/desorption kinetics
and capacity have been reviewed in detail. The main research articles dealing with the
electrosorption of organic compounds in the literature are listed in Table 1.

21
Table 1. Main studies performed on the electrosorption of organic compounds reviewed in the literature.
Working electrode Specific surface
area
Reactor
design
Organic
pollutant
(concentration)
Electrolyte
(concentra
tion)
Current
intensity/Electr
ode potential
Studied parameters
Maximum
electrosorption
capacity
Reference
Granular activated
carbon (GAC)
1,180 m2 g
−1 Fixed-bed
reactor
Metribuzin
(50,150, 300 and
450 mg L−1
)
KCl (3 mol
L−1
)
−0.050 V/SCE Electrode potential,
flow rate and initial
concentration of
pollutant
22 mg g−1
(Kitous et al.,
2009)
GAC 950 m2 g
−1 Fixed-bed
reactor
Naphthalenesulfo
nic acid, benzyl
alcohol, naphthoic
acid,
methylquinoliniu
m chloride
(2 mg L-1
)
KCl
(0.1 mol
L−1
)
0.60
V/(Ag/saturated
KCl)
Initial concentration
of pollutant and pH
of the initial solution
100 mg g-1
(Bán et al., 1998)
GAC - Fixed-bed
reactor
Benzene
(1 mmol L−1
)
KCl
(0.2 mol
L−1
)
-2 and 2 V/SCE Electrode potential - (Plaisance et al.,
1996)
GAC 1,100 m2 g
−1 Fixed-bed
reactor
Ethylenediamine
(500 mg L-1
)
NaCl (20
wt. %) and
NaHCO3
(0.025 mol
L−1
)
0 to -1 V/SCE Initial concentration
of pollutant and
electrode potential
- (Eisinger &
Keller, 1990)
GAC and platinum
wire
- Fixed-bed
reactor
Chloroform
(2.5-10 mmol L-1
)
KNO3
(0.1 mol
L−1
)
0, 1, 2 and 2.5
V/SCE
Electrode potential - (Hazourli et al.,
1996a)
GAC and activated
carbon electrode
(ACE)
GAC: 1,062 m2 g
−1
ACE: 862 m2 g
−1
Flow-
through
parallel-
plate cell
Benzoic acid
(BA) and
nicotinic acid
(NA)
(1 mmol L−1
)
Na2SO4
(0.1 mol
L−1
)
0.5, 1.5 and 2
V/(Ag/AgCl)
Time, flow rate and
electrode potential
- (Bayram, 2016)
Activated carbon
cloth (ACC)
1,870 m2 g
−1 Flow-
through
parallel-
BA
(0.22 mmol L−1
)
Na2SO4
(0.01 mol
L−1
)
0.60
V/(Ag/AgCl)
Flow rate, electrode
potential and pH of
initial solution
180 mg g−1
(Bayram &
Ayranci, 2012b)

22
plate cell
ACC ACC:926 m2 g
−1
ACCO: 960 m2 g
−1
Flow-
through
parallel-
plate cell
Bentazone
(20 mg L-1
)
Na2SO4
(0.01 mol
L−1
)
5 mA Time, initial
concentration of
pollutant, pH of the
initial solution
ACC: 127 mg g−1
ACCO: 57 mg g−1
(Ania & Béguin,
2007)
ACC 1,870 m2 g
−1 STR Acid orange 8
(AO8), acid
yellow 14
(AY14), and acid
red 151 (AR151)
(0.05 mmol L−1
)
Na2SO5
(0.1 mol
L−1
)
1 V/(Ag/AgCl) Time and initial
concentration of
pollutant
AO8: 20 mg g-1
AY14: 25 mg g-1
AR151: 24 mg g-1
(Sahin et al.,
2020)
ACC 1,870 m2 g
−1 Flow-
through
parallel-
plate cell
2,4-
dichlorofenoxy-
acetic acid
(0.2 mmol L−1
)
Na2SO4
(0.01 mol
L−1
)
0.90
V/(Ag/AgCl)
Flow rate, electrode
potential, and
electrolyte
concentration
729 mg g−1
(Bayram et al.,
2018)
ACC 1,186 m2 g
−1 Flow-
through
parallel-
plate cell
Mercury (II)
acetate
NaCl
(0.01 mol
L-1
)
−1 V/SCE Flow rate, initial
concentration of
pollutant, electrode
potential and pH of
the initial solution
637 mg g-1
(Jayson et al.,
1987)
ACC 596 m2 g
−1 Fluidized-
bed reactor
8-
quinolinecarboxyl
ic acid
(50 mg L-1
)
Na2SO4
(0.5 mol
L−1
)
3 V (cell
potential)
Time and cell
potential
24 mg g−1
(López-Bernabeu
et al., 2016)
ACC 2,500 m2 g
-1 Flow-
through
parallel-
plate cell
Aniline and
pyridine
LiClO4 (0.1
mol L−1
)
0.1, 0.2 and 0.4
V/(Ag/AgO)
Electrode potential - (Niu & Conway,
2003)
AC bed and platinum
wire
- Fixed-bed
reactor
Phenol
(0 to 100 mg L-1
)
Na2SO4
(0.5 mol
L−1
)
- 0.60 V/SCE Time, initial
concentration of the
pollutant and
electrode potential
- (McGuire et al.,
1985)

23
Powdered carbon bed AC-NM: 1,390 m2
g−1
AC-NA: 1,296 m2
g−1
AC-Am: 1,212 m2
g−1
AC-HT:363 m2 g
−1
CB-W: 227 m2 g
−1
CNT-h: 156 m2 g
−1
CNT-c: 209 m2 g
−1
Fixed-bed
reactor
4-chlorophenols
(10, 25, 50 mmol
L−1
)
Na2SO4
(0.1 mol
L−1
)
0.4 V/SCE Electrode potential
and initial
concentration of the
pollutant
- (Biniak et al.,
2013)
AC 678 m2 g
−1 Fluidized-
bed reactor
Burdem orange II
(30 and 100 mg L-
1)
Na2SO4
and NaNO3
(5 mg L-1
)
50, 75 and 100
V (cell
potential)
pH of the initial
solution, initial
concentration of
pollutant, flow rate,
cell potential, and
electrolyte
concentration
179 mg g-1
(Gerçel, 2016)
AC –perlite mixture
(8:1)
- Fixed-bed
reactor
Acilan blau dye
(30, 40 and 100
mg L-1
)
NaCl
(0.1 and 0.3
mol L−1
)
5, 10, 15 and 20
V (cell
potential)
Initial concentration
of the pollutant, bed
height, cell potential,
flow rate, and
electrolyte
concentration
17 mg g -1
(Koparal et al.,
2002)
Carbon bed and the
platinum mesh
screen
1,010 m2 g
−1 Fixed-bed
reactor
Pentanol and
heptanol
(0.01, 0.02, 0.1
mol L−1
)
Na2SO4
(1 mol L−1
)
)
-0.65 V to -0.20
V/(Hg/Hg2SO4
in 1 M H2S04)
Electrode potential
and initial
concentration of the
pollutant
- (Zabasajja &
Savinell, 1989)
Graphite powder 0.048 m2 g
−1 Fixed-bed
reactor
β-naphthol
(1 mmol L−1
)
K2SO4
(0.5 mol
L−1
)
-0.17, -0.27, -
0.50, -0.76, -
1.12 and -1.44
V/MSE
Time, initial
concentration of the
pollutant and
electrode potential
- (Eisinger &
Alkire, 1980)
Porous Vycor glass
tubing packed with
graphite particles
- Fixed-bed
reactor
Quinones
(0.1 mmol L−1
)
KCl
(0.1 mol
L−1
)
1 V/(Ag/AgCl) Initial concentration
of the pollutant and
cell potential
- (Strohl & Dunlap,
1972)

24
Activated carbon
fibers (ACF)
1,335 m2 g
−1 STR Phenol
(0.4, 1, and 2
mmol L−1
)
Na2SO4
(0.001,
0.01, and
0.1 mol
L−1
)
0.70 V/SCE Electrode potential,
initial concentration
of the pollutant,
temperature and
electrolyte
concentration
350 mg g−1
(Han et al.,
2006b)
ACF 1,335 m2 g
−1 STR Aniline
(2 mmol L−1
)
Na2SO4
(0.01 mol
L−1
)
0.60 V/SCE Electrode potential,
electrolyte
concentration,
temperature and pH
of the initial solution
316 mg g-1
(Han et al.,
2006a)
ACF connected by
platinum wire
1,335 m2 g
−1 STR Acid orange 7
(AO7)
(1 mmol L-1
)
Na2SO4
(0.01 mol
L−1
)
0.60 V/SCE Time, electrode
potential and initial
concentration of the
pollutant
- (Han et al., 2008)
ACF - STR Aniline
(0.05 mg L−1
)
Na2SO4
(0.01 mol
L−1
)
0.20 to 0.40
V/SCE
Electrolyte
concentration,
temperature and pH
of the initial solution
- (Chai et al., 2007)
AC felt 27 m2 g
−1 Flow-
through
parallel-
plate cell
Thiocyanate
anions
(0.1-0.6 mmol
L−1
)
H2SO4
(0.5 mol
L−1
)
0.5, 0.8, and 1.2
mA
Electrode potential
and pH of the initial
solution
4 mg g-1
(Rong & Xien,
2005)
AC felt and Pt wire 1,367 m2 g
−1 Flow-
through
parallel-
plate cell
Thiocyanate
(0.1-0.2 mmol L-
1)
HNO3 or
NaOH
(0.01 mol
L-1
)
0.5 to 1.2 mA pH of the initial
solution, electrode
polarization and
current intensity
- (Rong & Xien,
2009)
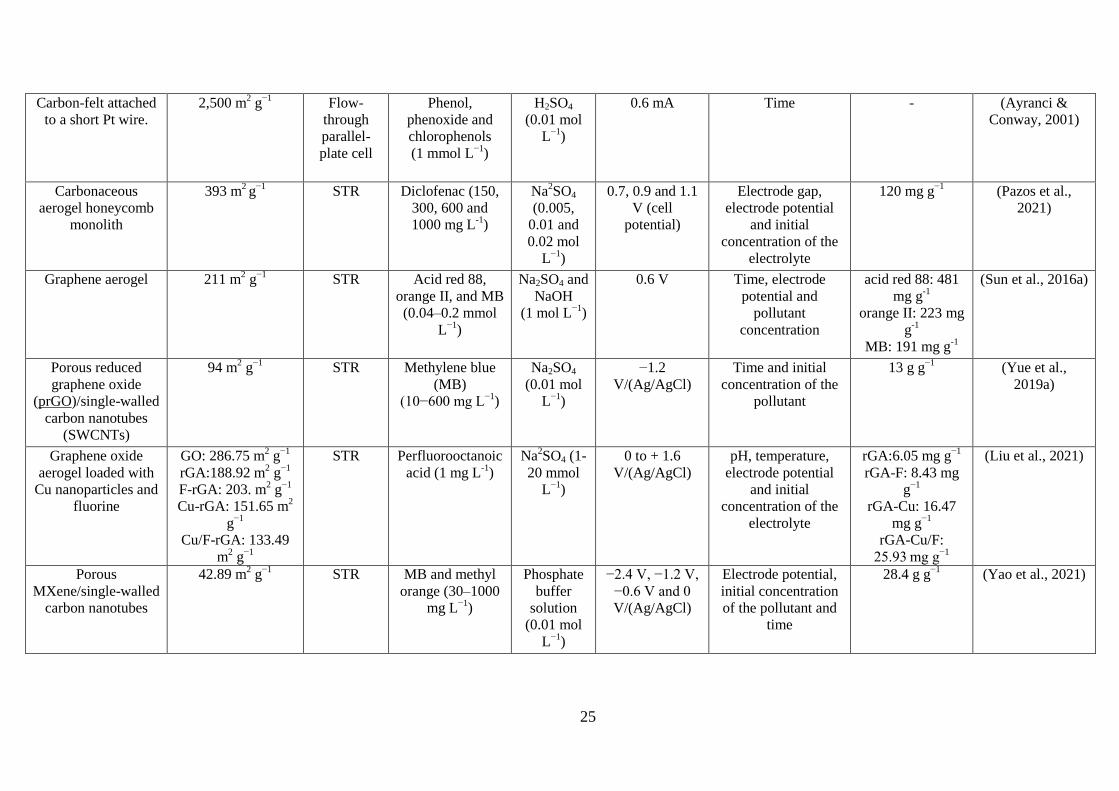
25
Carbon-felt attached
to a short Pt wire.
2,500 m2 g
−1 Flow-
through
parallel-
plate cell
Phenol,
phenoxide and
chlorophenols
(1 mmol L−1
)
H2SO4
(0.01 mol
L−1
)
0.6 mA Time - (Ayranci &
Conway, 2001)
Carbonaceous
aerogel honeycomb
monolith
393 m2 g
−1 STR Diclofenac (150,
300, 600 and
1000 mg L-1
)
Na2SO4
(0.005,
0.01 and
0.02 mol
L−1
)
0.7, 0.9 and 1.1
V (cell
potential)
Electrode gap,
electrode potential
and initial
concentration of the
electrolyte
120 mg g−1
(Pazos et al.,
2021)
Graphene aerogel 211 m2 g
−1 STR Acid red 88,
orange II, and MB
(0.04–0.2 mmol
L−1
)
Na2SO4 and
NaOH
(1 mol L−1
)
0.6 V Time, electrode
potential and
pollutant
concentration
acid red 88: 481
mg g-1
orange II: 223 mg
g-1
MB: 191 mg g-1
(Sun et al., 2016a)
Porous reduced
graphene oxide
(prGO)/single-walled
carbon nanotubes
(SWCNTs)
94 m2 g
−1 STR Methylene blue
(MB)
(10−600 mg L−1
)
Na2SO4
(0.01 mol
L−1
)
−1.2
V/(Ag/AgCl)
Time and initial
concentration of the
pollutant
13 g g−1
(Yue et al.,
2019a)
Graphene oxide
aerogel loaded with
Cu nanoparticles and
fluorine
GO: 286.75 m2 g
−1
rGA:188.92 m2 g
−1
F-rGA: 203. m2 g
−1
Cu-rGA: 151.65 m2
g−1
Cu/F-rGA: 133.49
m2 g
−1
STR Perfluorooctanoic
acid (1 mg L-1
)
Na2SO4 (1-
20 mmol
L−1
)
0 to + 1.6
V/(Ag/AgCl)
pH, temperature,
electrode potential
and initial
concentration of the
electrolyte
rGA:6.05 mg g−1
rGA-F: 8.43 mg
g−1
rGA-Cu: 16.47
mg g−1
rGA-Cu/F:
25.93 mg g−1
(Liu et al., 2021)
Porous
MXene/single-walled
carbon nanotubes
42.89 m2 g
−1 STR MB and methyl
orange (30–1000
mg L−1
)
Phosphate
buffer
solution
(0.01 mol
L−1
)
−2.4 V, −1.2 V,
−0.6 V and 0
V/(Ag/AgCl)
Electrode potential,
initial concentration
of the pollutant and
time
28.4 g g−1
(Yao et al., 2021)

26
Glassy carbon - Fixed-bed
reactor
B-naphthol
(0.02 mmol L−1
)
K2SO4
(0.5 or 0.2
mol L−1
)
-0.26 V/MSE Time and initial
concentration of the
pollutant
- (Eisinger, 1983)
AC and two copper
circular plates
- Fixed-bed
reactor
MB
(1, 10 and 15 mg
L-1
)
- 5 V (cell
potential)
Bed height, flow rate
and initial
concentration of the
pollutant
81 mg g-1
(Nainamalai et al.,
2018)
Pt small spherical of
Pt
- STR Benzene
(2 × 10⁻⁶
- 4 × 10⁻⁴
mol L−1
)
-
0.4-0.5 V/RHE Electrode potential,
temperature
- (Gileadi et al.,
1968)
Platinum-plated gold - STR Benzene
(2 × 10⁻⁶
- 4 × 10⁻⁴
mol L−1
)
H2SO4 and
H3PO4 (1
N)
0.4-0.5 V/NHE Electrode potential,
pH of the initial
solution, and time
- (Heiland et al.,
1966)
Platinum-plated gold - STR Ethylene H2SO4 (1
N)
0.4-0.46 V/MSE Electrode potential,
initial concentration
of the pollutant and
temperature
- (Gileadi et al.,
1965)
Stainless steel wire
coated with
monolithic porous
polymer micro-
column
- STR Cresol red
(5 mg L-1
)
NaCl
(0.005, 0.5
and 0.1 mg
L-1
)
0.3 mA Cell potential,
extraction and
desorption time, pH
of the initial solution
and ionic strength
- (Wang et al.,
2012)

27
Redox polymer
polyvinylferrocene
/conducting polymer
polypyrrole doped
with a large anionic
surfactant
- Flow-
through
parallel-
plate cell
Benzoate (0.25
mmol L−1
)
NaClO4
(12.5 mol
L−1
)
0.35 V and −0.1
V/(Ag/AgCl)
Electrode potential - (He et al., 2020)
Abbreviations: AC: activated carbon; AC-Am: ammonia-treated activated carbon; ACC: activated carbon cloth; ACCO: activated carbon cloth
oxidized; ACE: activated carbon electrode; ACF: activated carbon fibers; AC-HT: annealed activated carbon; AC-NA: nitric acid oxidized activated
carbon; AC-NM: nonmodified activated carbon; AO7: acid orange 7; AO8: acid orange 8; AR151: acid red 151; AY14: acid yellow 14; BA: benzoic
acid; CB-W: carbon black; CFP: carbon fiber paper; CNT-c: multiwalled carbon nanotubes - short carboxyl; CNT-h: multiwalled carbon nanotubes -
short hydroxyl; MB: methylene blue; MSE: mercury/mercurous sulfate electrode; NA: nicotinic acid; NHE: normal hydrogen electrode; NMO:
Na0.7MnO2; prGO: porous reduced graphene oxide; RHE: reversible hydrogen electrode; rGA: reduced graphene oxide aerogel; rGA-Cu: Cu
nanoparticles loaded rGA; rGA-F: F-doped reduced graphene oxide aerogel; rGA-Cu/F: F and Cu nanoparticles modified rGA; SCE: saturated calomel
electrode; STR: stirred tank reactor; SWCNTs: single-walled carbon nanotubes.

Part I Bibliography
28
2.2.1. Electrode materials
The electrosorption efficiency partly depends on the nature of the electrode materials
and their characteristics, i.e., specific surface area, porosity, conductivity, surface functions
and surface wettability.
2.2.1.1. Nature and surface morphology of the electrode materials
Various electrode materials have been employed for electrosorption technologies,
and Fig. 7a shows the occurrence frequency regarding the electrode materials used in the
literature (Table 1). These materials are proposed for classification into the following
categories (percentage of occurrence in brackets): carbon-based electrodes (85%), metal-
based electrodes (9%) and polymer/resin-based electrodes (6%). Under the carbon electrodes,
the following subcategories can be found: carbon-based composites (19%), GAC (32%),
carbon cloth (19%), carbon fiber (7%), carbon felt (7%), graphite (13%) and graphene (3%).
Metal-based materials have barely been studied in the literature (Fig. 7a), probably
due to their usually high cost compared to carbon materials and their lower flexibility in
shape, surface area and porosity. The crystallographic orientation of the single-crystal planes
(Lust, 1997) and the electronic structure of the metal surface impact the EDL, and therefore
the electrosorption efficiency (Schmickler, 1996). It has been further demonstrated that the
dipole orientation of water, often used as a solvent, can be impacted by the surface chemistry
of metal-based materials (Conway, 1999). In addition, the point of zero charges of metals
influences the specific orientation of H2O molecules, which then impacts H2O adsorbability
(Trasatti, 1972). Therefore, the adsorbability of solvated ions on metals is also impacted,
along with their electrosorption efficiency.
In contrast, it is obvious that carbon represents the majority of electrode materials
used in the literature (Fig. 7a). Despite their availability and low prices, this enthusiasm
toward carbon materials can be explained by their adequate properties for electrosorption,
which are discussed more in detail in sections 2.2.1.2 to 2.2.1.5 of part I. Among their
important characteristics, they have a particularly high surface area, high porosity, high
electrical conductivity and high electrochemical stability, especially for cathodic reduction
(Frackowiak, 2001; Hou et al., 2012). Graphene has notably attracted attention as an emerging
two-dimensional material composed of sp2-hybridized carbon atoms arranged in a honeycomb

Part I Bibliography
29
structure, and its characteristics have benefited environmental electrochemistry (Geim &
Novoselov, 2007; Le et al., 2015; Mousset et al., 2016a, 2016b; Mousset et al., 2017; Le et al.,
2019; Du et al., 2021).
The surface morphology of electrode materials is often inspected using microscope
devices as a qualitative approach to roughly evaluate the adsorption ability. Microscopic
views obtained via scanning electron microscopy (SEM) are displayed in Figs. 7b and 7c for
activated carbon fiber (ACF) (Han et al., 2006b) and single-walled carbon nanotube
(SWCNT) films (Yue et al., 2019b), respectively. Fig. 7b depicts the fine structure of ACF,
which involves numerous uniform open pores on the surface (Han et al., 2006b), while the
SEM image of the prGO/SWCNT film displays a rough surface and corrugated structures,
which should provide a large accessible surface area (Fig. 7c) (Yue et al., 2019b).

Part I Bibliography
30
Fig. 7. (a) Electrode materials used in the literature, (b) SEM image of ACF (Han et al.,
2006b), (c) SEM image of the prGO/SWCNT film (Yue et al., 2019).
2.2.1.2. Specific surface area, porosity, and roughness
A large surface area and an optimal pore size distribution of the electrode are
essential requirements for reaching a high electrosorption capacity. In addition, they result in
a high capability for charge accumulation at the active sites of the electrode/electrolyte
interface (Zaharaddeen et al., 2016). From Fig. 8a, it can be seen that the specific surface area
of the electrode used in the literature reached 2000 m2 g
-1, while a majority of articles (36%)
applied materials with specific surface areas within the range of 0-500 m2 g
-1 (Table 1).
One of the most common methods employed to modify the surface area and pore size
distribution of carbon materials is their activation via chemical and/or thermal treatment. The

Part I Bibliography
31
electrosorption of 4-chlorophenol was studied by testing AC with different treatments, i.e.,
nonmodified AC (AC-NM), AC oxidation with nitric acid (AC-NA), AC treated with
ammonia (AC-Am), and annealed AC (AC-HT) (Fig. 8b) (Biniak et al., 2013). The results
highlighted a decrease in the specific surface area (SBET) estimated by the well-known
Brunauer-Emmett-Teller method when the AC was modified. Additionally, the total volume
of mesopores (Vme) increased with the chemical treatment (AC-NA and AC-Am) (Fig. 8b),
while the electrosorption efficiencies were better with these materials. It is important to note
that increasing the surface area of materials does not systematically lead to a higher
electrosorption efficiency, unlike many studies intend to show. Therefore, the distribution of
pores remains an essential factor to consider, along with the specific surface area. The pore
size has previously been shown to induce a change in the EDL. Fig. 8c depicts the EDL
within different pore sizes of the carbon material, i.e., higher than 2 nm, between 1 and 2 nm
and smaller than 1 nm. It has been emphasized that the existence of an optimal pore size gives
an optimal capacitance when the pore size is close to the ion size (Largeot et al., 2008). This
feature further highlights the impact of microporosity on the EDL and electrosorption
efficiency. Due to these differences in the behavior of EDLs in porous materials, a multiscale
model has been proposed according to the pore size for better accuracy of capacitance
prediction: a sandwich-type model for micropores (< 2 nm), an electric double-cylinder model
for mesopores (2-50 nm)), and a planar model for macropores (> 50 nm) (Fig. 8d) (Huang et
al., 2008; Feng et al., 2010; Dai et al., 2020).
A more recent approach for modifying the material properties involves carbonaceous
nanostructured materials, such as graphene and/or carbon nanotubes (CNTs). A comparison
between the specific surface area and porosity of three graphene-based materials, namely,
prGO/SWCNTs, prGO and reduced graphene oxide (rGO), used for MB electrosorption has
been performed (Yue et al., 2019b). The specific surface areas of rGO (5.5 m2 g
-1) and prGO
(29 m2 g
-1) were much smaller than that of prGO/SWCNT (94 m
2 g
-1), and the same trend was
obtained for the total pore volume. The prGO/SWCNT electrode material depicted a higher
electrosorption capacity (13 g−1
). The increase in the specific surface area and total porosity
could have explained the higher electrosorption capacity (Yue et al., 2019b).
In addition, many electrode materials used in electrosorption can be considered to
have a nonidealized electrode geometry, which then affects the EDL and consequently the
electrosorption efficiency (Fan et al., 2014). For example, curvature effects are frequently

Part I Bibliography
32
encountered in cylindrical shapes (e.g., CNTs) and porous materials, which breaks with the
linearity of models developed for planar electrode systems (Henstridge et al., 2010; Lian et
al., 2016). Moreover, differences have been predicted by using density functional theory
(DFT) between concave and convex shapes. Concave induces a lower curvature effect than
convex interfaces, leading to higher capacitances in the latter (Lian et al., 2016), and better
electrosorption.

Part I Bibliography
33
Fig. 8. (a) Range of the specific surface area of the electrode implemented for organics
electrosorption in literature, (b) SBET and Vme evolutions as a function of modified (AC-NA,
AC-Am, AC-HT) and AC-NM (Biniak et al., 2013), (c) EDL drawings representing solvated
ions within different negatively charged pore sizes in carbon material: higher than 2 nm (A),
between 1 and 2 nm (B) and smaller than 1 nm (Chmiola et al., 2006), (d) Schematic

Part I Bibliography
34
diagrams of a positively charged porous carbon material and the associated model of the
EDL: sandwich-type model for micropores, electric double-cylinder model for mesopores,
planar model for macropores (Huang et al., 2008; Feng et al., 2010; Dai et al., 2020).
2.2.1.3. Material conductivity
It is well known that the electrical conductivity of electrode materials increases the
rate of electron transfer at the material/electrolyte interface (Du et al., 2021). The effect of
electrical conductivity on electrosorption efficiency has been particularly emphasized. It has
been shown that the higher electrosorption capacity obtained with prGO/SWCNTs compared
to prGO and rGO was partly related to the electrical conductivity of prGO/SWCNTs (74 S
cm-1
), which was far larger than that of prGO (20 S cm-1
) and rGO (30 S cm-1
) (Fig. 9a) (Yue
et al., 2019b). The electrical conductivity increased with the introduction of SWCNTs in the
samples. Other authors have also reported the positive effect of increasing the electrical
conductivity on the kinetics and capacity of electrosorption (Alencherry et al., 2017).
Fig. 9. (a) Electrical conductivity of rGO, prGO and prGO/SWCNT materials, (b) Surface
wettability of rGO, prGO and prGO/SWCNT materials (Yue et al., 2019b).
2.2.1.4. Surface functions
The type of surface function on the porous electrode can affect the electrosorption
process. A comparison of electrosorption efficiencies using AC with different surface
functions (Biniak et al., 2013) has been reported. AC-Am produced basic nitrogen-containing
functional groups on the surface, while AC-NA increased the number of acidic oxygen
functional groups bound to the surface. The more acidic the carbon surface, the more oxygen
bound to it and the lower the efficiency of 4-chlorophenol electrosorption (Biniak et al.,

Part I Bibliography
35
2013). In another study, incorporating spherical polystyrene and SWCNTs into graphene
oxide (prGO/SWCNTs) led to a higher electrosorption capacity than that of rGO and porous
rGO films (Yue et al., 2019b). Spherical polystyrene generated 3D macropores, while
SWCNTs created efficient pathways for the transfer of ions and electrons.
2.2.1.5. Surface wettability
The surface wettability of the electrode is a parameter that can be obtained by
measuring the contact angle. If the contact angle is greater than 90°, the electrode is
hydrophobic; while it is less than 90°, itis considered hydrophilic (Yue et al., 2019b). This
factor has barely been quantified in electrosorption studies, although it has been established
that poor wettability generally hampers ion (hydrophilic) transport within the electrode's
pores. This is unfavorable for the electrosorption process (Chang et al., 2014). Nevertheless, a
recent study stated the influence of the wettability of three graphene-based materials
(prGO/SWCNTs, rGO and prGO) on MB electrosorption (Yue et al., 2019b). The surface
wettabilities were 60°, 113° and 101° for prGO/SWCNTs, rGO and prGO, respectively (Fig.
9b) (Yue et al., 2019b). The prGO/SWCNTs showed higher hydrophilicity, and the
electrosorption capacity (up to 13 g g−1
) was higher than that of the two other materials. The
introduction of SWCNTs improved the hydrophilicity of the prGO/SWCNTs. Therefore, the
surface wettability also influences the electrosorption capacity of organic compounds, and
should not be neglected in investigation studies.
2.2.1.6. Applied electrode potential/current density and electrode polarity
The electrode polarity related to the applied current intensity sign is known to
influence the electrosorption capacity of the porous surface, while the electrosorption rate can
be increased. According to the reviewed papers (Table 1), the occurrence percentages of
electrode polarity configurations tested for electrosorption are as follows: cathode (23%),
anode (41%) and both polarities (i.e., cathode and anode) (36%) (Fig. 10a). Most of the time,
the electrode polarity can induce electromigration effects that need to be considered according
to the charge in the targeted compounds. Since many organic compounds are negatively
charged, the reason why more electrosorption studies have been performed with a positively
charged anode material could be explained (Fig. 10a). For instance, the electrode polarity was
studied using metal wire coated with an epoxy resin-based polymer as the working electrode
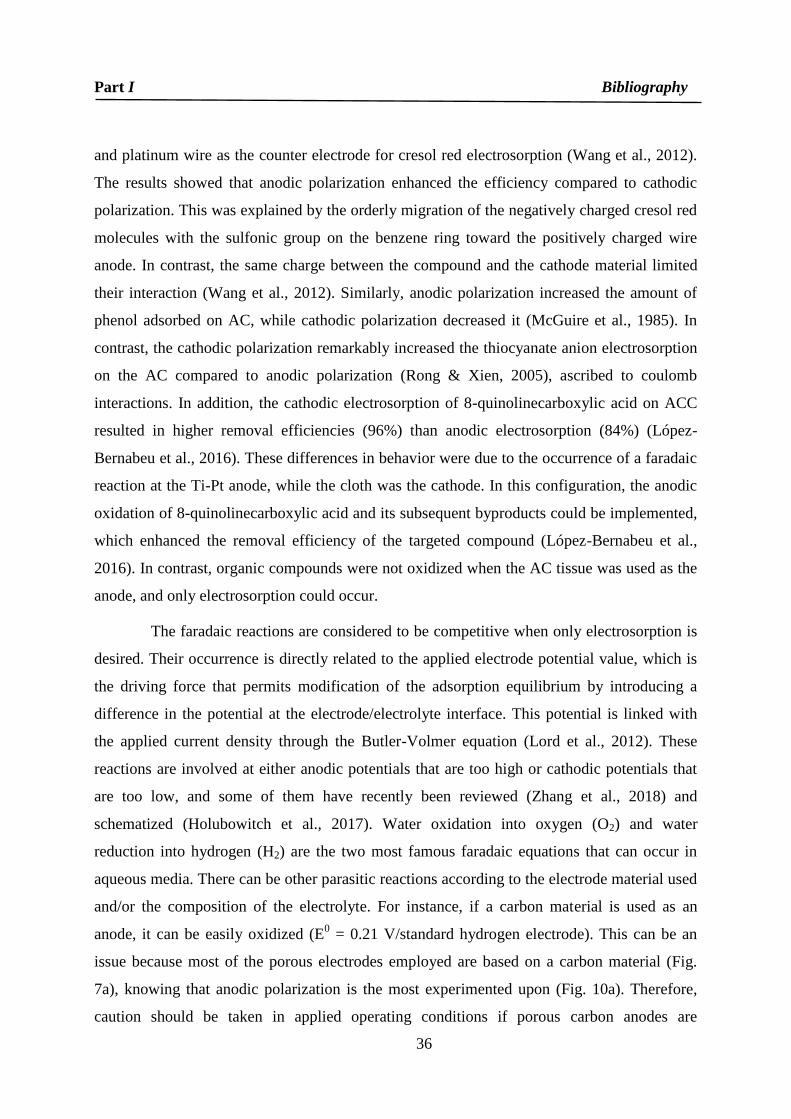
Part I Bibliography
36
and platinum wire as the counter electrode for cresol red electrosorption (Wang et al., 2012).
The results showed that anodic polarization enhanced the efficiency compared to cathodic
polarization. This was explained by the orderly migration of the negatively charged cresol red
molecules with the sulfonic group on the benzene ring toward the positively charged wire
anode. In contrast, the same charge between the compound and the cathode material limited
their interaction (Wang et al., 2012). Similarly, anodic polarization increased the amount of
phenol adsorbed on AC, while cathodic polarization decreased it (McGuire et al., 1985). In
contrast, the cathodic polarization remarkably increased the thiocyanate anion electrosorption
on the AC compared to anodic polarization (Rong & Xien, 2005), ascribed to coulomb
interactions. In addition, the cathodic electrosorption of 8-quinolinecarboxylic acid on ACC
resulted in higher removal efficiencies (96%) than anodic electrosorption (84%) (López-
Bernabeu et al., 2016). These differences in behavior were due to the occurrence of a faradaic
reaction at the Ti-Pt anode, while the cloth was the cathode. In this configuration, the anodic
oxidation of 8-quinolinecarboxylic acid and its subsequent byproducts could be implemented,
which enhanced the removal efficiency of the targeted compound (López-Bernabeu et al.,
2016). In contrast, organic compounds were not oxidized when the AC tissue was used as the
anode, and only electrosorption could occur.
The faradaic reactions are considered to be competitive when only electrosorption is
desired. Their occurrence is directly related to the applied electrode potential value, which is
the driving force that permits modification of the adsorption equilibrium by introducing a
difference in the potential at the electrode/electrolyte interface. This potential is linked with
the applied current density through the Butler-Volmer equation (Lord et al., 2012). These
reactions are involved at either anodic potentials that are too high or cathodic potentials that
are too low, and some of them have recently been reviewed (Zhang et al., 2018) and
schematized (Holubowitch et al., 2017). Water oxidation into oxygen (O2) and water
reduction into hydrogen (H2) are the two most famous faradaic equations that can occur in
aqueous media. There can be other parasitic reactions according to the electrode material used
and/or the composition of the electrolyte. For instance, if a carbon material is used as an
anode, it can be easily oxidized (E0 = 0.21 V/standard hydrogen electrode). This can be an
issue because most of the porous electrodes employed are based on a carbon material (Fig.
7a), knowing that anodic polarization is the most experimented upon (Fig. 10a). Therefore,
caution should be taken in applied operating conditions if porous carbon anodes are

Part I Bibliography
37
implemented to avoid corrosion. Moreover, undesirable nitrogenous and/or chlorinated
oxyanions (NO2-, NO3
-, ClOH, ClO3
-) can be initially generated at a sufficiently high anodic
potential in the presence of nitrogenous species and/or chloride ions (Brito et al., 2015;
Mousset et al., 2018; Mousset et al., 2020a). When a high O2 overvoltage anode is employed,
such as boron-doped diamond (BDD), to cite the most frequently studied anode, perchlorate
(ClO4-) can even be produced (Bergmann et al., 2009). Often missing in the literature and
especially in reviews dealing with faradaic reactions involved in capacitive deionization
(Zhang et al., 2018): the local alkalization at the cathode from O2 reduction and H2O
reduction reactions should not be overlooked. Under this condition, magnesium, calcium
and/or carbonate are present in solution, which is the case in many actual aqueous effluents
(Belarbi et al., 2016; Adnan et al., 2021a), and electroprecipitation phenomena can occur by
forming Mg(OH)2 and/or CaCO3 at the cathode surface (Belarbi et al., 2016; Adnan et al.,
2021a). These deposits then progressively passivate the cathode and hamper electrolysis.
Thus, faradaic reactions can be avoided if a sufficiently short potential window is
applied, whose range can be verified by a voltammetric analysis. This is a further advantage
in terms ofenergy consumption because the cell potential remains low. In this capacitive
voltage range, it has been shown that an increase in the applied potential from the open circuit
(OC) to 600 mV involved increases in the rate and capacity of AO7 electrosorption into ACF
(OC: 1.12 mmol g−1
, 200 mV: 1.17 mmol g−1
, 400 mV: 1.39 mmol g−1
, and 600 mV: 1.84
mmol g−1
)) (Fig. 10b) (Han et al., 2008). Similarly, an intensification of polarization caused
an increase in the percentage of BA electrosorption onto ACC (OC: 52%, -200 mV: 50%, -
600 mV: 44%, -900 mV: 15%, +200 mV: 72%, +600 mV: 75%, +900 mV: 74%). This was
explained by an amplification of the electrostatic interaction between the ACC surface
(positively charged) and benzoate anion (negatively charged) with rising potentials (Bayram
& Ayranci, 2012a).

Part I Bibliography
38
Fig. 10. (a) Occurrence percentages of electrode polarity configurations tested for
electrosorption in the literature, (b) effect of the working electrode potential on AO7
electrosorption (Han et al., 2008).
2.2.2. Physico-chemistry of the electrolyte solutions
2.2.2.1 Type and concentration of the inorganic electrolyte
In most synthetic solution studies, an inorganic supporting electrolyte is added to
increase the electrical conductivity of the wastewater to be treated (Koparal et al., 2002; Han
et al., 2006b; Gerçel, 2016). Although electrolytes should not be added in the context of
wastewater depollution to avoid external contamination, studies in their presence have
emphasized the antagonist role of the electrosorption efficiency in organics according to their
types and concentrations.
It has been highlighted that the equilibrium electrosorption capacity of phenol on
ACF was reduced, whereas the electrosorption rate was enhanced with increased sodium
sulfate (Na2SO4) electrolyte concentration from 1 to 100 mM (Han et al., 2006b). In addition,
Na2SO4 increased the solution conductivity, which contributed to an increase in ion transport.
However, the adsorption sites for phenol on the surface of the adsorbent were occupied by the
competitive electrosorption of the Na2SO4 electrolyte (Han et al., 2006b). Similar results have
been obtained in other studies involving the electrosorption of aniline on ACF in Na2SO4
electrolyte (Fig. 11a) (Han et al., 2006a), of 2,4-dichlorofenoxyacetic acid on ACC in Na2SO4
electrolyte (Bayram et al., 2018), and of acilan blau dye on AC-perlite mixtures in sodium
chloride (NaCl) electrolyte (Han et al., 2006b). This trend was confirmed by the study of 1-
adamantanol in the presence of halide (F-, Cl
-, Br
-)-based electrolytes. This further

Part I Bibliography
39
emphasized the decrease in the organic adsorption when the electrolyte concentrations
increased from 5 to 100 mM, regardless of the types of halide anions (Stenina et al., 2001). It
was thus reported that organic-inorganic attraction could occur during concurrent adsorption,
which the strong hydrogen bonds could explain between the OH- group of the organic
compound and the halide anions.
The effect of the electrolyte type on the electrosorption efficiency was more
emphasized by Gerçel (2016), who compared two different electrolytes, either sodium nitrate
(NaNO3) or Na2SO4, for the electrosorption of burdem orange II textile dye by using AC
prepared from a waste material. The highest dye removals of 95% and 88% were achieved
with 0.2 M Na2SO4 and 0.2 M NaNO3, respectively. The differences in removal percentages
could be attributed to the different hydrated radii and valences of the electrolyte, regardless of
the initial solution concentration (Gerçel, 2016).
Fig. 11. Effect of (a) the initial concentration of the electrolyte on aniline
electrosorption in the Na2SO4 electrolyte (Han et al., 2006a), (b) pH on the aniline
electrosorption (Han et al., 2006a) (c) temperature on the phenol electrosorption (Han et al.,
2006b).

Part I Bibliography
40
2.2.2.2 pH
The initial pH of the electrolyte solution is an important factor since it can influence
the ionization state of the outer electrode surface and the surface electrical charge
characteristics of pollutants, as well as the electrosorption mechanism. Therefore, it also
influences the electrosorption capacity of the organic compounds.
Table 3 summarizes the optimum pH for various organic pollutants whose acid
dissociation constants (pKa) have been reported. The effect of pH within the range of 4 to 12
on the electrosorption capacity of cresol red using electrodes made of stainless steel wire
coated with a nonconductive polymer was studied (Wang et al., 2012). Compound
electrosorption was optimal at pH 6.0 due to the respective protonation and deprotonation of
cresol red in acidic and basic media considering its pKa values of 0.5 (pKa1) and 8.5 (pKa2).
Protonation in a strong acid medium would lead to the molecular ionization of cresol red,
which explains the weak electrosorption in acidic media. Conversely, deprotonation would
lead to the electrosorption of cresol red anions. The influence of the initial pH values covering
a range from 3.1 to 10.6 on aniline (pKa = 4.6) electrosorption on ACF was also investigated
(Han et al., 2006a). The electrosorption capacity of aniline rose with an increasing pH, as
shown in Fig. 11b. This was attributed to the electrostatic interaction caused by protonation or
deprotonation according to the pH changes, but could also be due to the electron donor ability
of the amino group that increased in a basic solution. Similar results have been obtained in
other studies regarding the electrosorption of aniline (Chai et al., 2007) and mercury (II)
acetate (Jayson et al., 1987).
In contrast, the electrosorption capacity decreased with an increasing pH from 4 to
12 when bentazone (pKa = 3.3) was removed from aqueous solutions using an ACC electrode
(Ania & Béguin, 2007). This trend was due to the pH dependence of the charges on the
carbon cloth surface and the bentazone ionization. At an acidic pH, the bentazone is mainly
nondissociated, and all acidic groups are protonated (neutralization of the negative charges),
which minimizes the repulsive electrostatic interactions, and the electrosorption is improved.
At a higher pH, the anionic form predominates in the solution, which implies a weaker
interaction of the carbon cloth surface with deprotonated bentazone than with its neutral form.
Similarly, the electrosorption of BA was lower at a basic pH than at an acidic pH, which was
ascribed to the competition between the benzoate (formed at basic pH) and OHˉ anions for the

Part I Bibliography
41
positively charged ACC anode material (Bayram & Ayranci, 2012b). A similar trend was
obtained with the electrosorption of thiocyanate (pKa = 0.5) (Rong & Xien, 2005, 2009),
benzene (pKa = 43) (Heiland et al., 1966), naphthalene sulfonic acid (pKa = 0.2), benzyl
alcohol (pKa = 15.4), naphthoic acid (pKa = 4.2), methylquinolinium chloride (Bán et al.,
1998) and burdem orange II (pKa = 11.4) (Gerçel, 2016) (Table 2).
Table 2. Optimal initial solution pH during the electrosorption of selected pollutants.
Pollutant pH range Optimum pH pKa Reference
Cresol red 4.0 – 12.0 6.0 pKa1 = 0.5; pKa2
= 8.5 (Wang et al., 2012)
Bentazone 2.0 – 7.0 2.0 3.3 (Ania & Béguin,
2007)
Aniline 3.1 – 10.6 10.6 4.6 (Han et al., 2006a)
Thiocyanate 0 – 11.0 3.0 0.5 (Rong & Xien,
2005)
Burden
orange II 2.0 – 6.5 2.0 11.4 (Gerçel, 2016)
BA
Phthalic acid
NA
2.93 – 10.54
4.28
3.98
3.62
4.2
pKa1 = 2.92;
pKa2 = 5.41
pKa1 = 2.05;
pKa2 = 5.81
(Bayram & Ayranci,
2012b)
Benzene 0.5 – 11.0 0.5 43 (Heiland et al.,
1966)
2.2.2.3 Temperature
Generally, the temperature affects the electrosorption capacity. Many different
enthalpies of adsorption (∆H) values have been presented in the literature that attests to the
variabilities of thermodynamic processes and the influence of temperature. For example,
ethylene electrosorption on platinum was studied at temperatures varying from 303 to 343 K
(Gileadi et al., 1965). The equilibrium adsorption constant was essentially independent of the
temperature; consequently, ∆H equaled 0. In contrast, the electrosorption of phenol on ACF at
three temperatures, 273, 293, and 303 K, was temperature-dependent (Fig. 11c) (Han et al.,
2006b). The electrosorption process was more favorable at lower temperatures, and ∆𝐻 was
negative, which showed that phenol was exothermally adsorbed by ACF. This further
highlights that electrostatic interactions and dipole-dipole interactions might be the main
adsorption mechanism for phenol electrosorption on ACF (Han et al., 2006b). The
temperature also affected aniline electrosorption on the ACF electrolyte temperature varying

Part I Bibliography
42
from 293 to 343 K (Chai et al., 2007). The electrosorption efficiency increased with an
increasing temperature until reaching a peak at 313 K and then gradually decreased. This was
due to the increase in the diffusion rate of aniline through the static aqueous layer at the
fiber/solution interface. At temperatures higher than the optimal value, the efficiency did not
increase since aniline electrosorption was an exothermic process (Chai et al., 2007). Another
study varied the temperature of the electrolyte from 283 to 323 K for butanol and 1-
oxyadamantane electrosorption (Stenina et al., 2009). An increase in the temperature led to an
increase in the capacitance from 4.9 to 5.5 µF cm–2
, resulting in the electrosorption efficiency
(Stenina et al., 2009). Thus, the increase in the temperature either decreased or increased the
electrosorption capacity, according to the nature of the pollutants and the active sites on the
electrodes.
2.2.3. Types of organic pollutants, their co-sorption, and the initial concentration
effects
According to the papers reviewed, 92% of the electrosorption studies focused on
aromatic compounds, while only 8% focused on aliphatic pollutants (Fig. 12a). Surprisingly,
100% of the articles dealt with artificial contamination. This highlights the crucial need to
deal with actual wastewater to consider other matrix effects in the electrosorption efficiency,
such as competition with co-sorption, clogging, etc.
In real matrices, the presence of multiple compounds is unavoidable; therefore, co-
sorption studies remain essential. Several articles focused on these aspects, but in simulated
wastewater. The co-sorption effect in the presence of three organic pollutants (acid red 88,
orange II, and MB) on a three-dimensional (3D) graphene aerogel electrode was studied (Sun
et al., 2016b). The electrosorption rate of the dyes ranked as follows (with an increasing rate):
acid red 88 < orange II < MB (Fig. 12b). This was inversely correlated with the size of the
dye molecules (with increasing size): MB < orange II < acid red 88. Thus, smaller molecules
would find more pores accessible for electrosorption. The influence of the charge of the dyes
must also be considered because it affects the electrostatic force between the adsorbent and
the molecules and controls the electrosorption process. For instance, – interactions have
been shown to play an important role since dyes with more aromatic rings showed stronger
interactions with the adsorbent (Sun et al., 2016b). In addition, the charge dipole and
dispersion interactions between the adsorbent and the aromatic organic acids have also

Part I Bibliography
43
depicted an influence on electrosorption. The electrosorptive behavior of aromatic organic
acids (i.e., benzoic, phthalic and NA) onto the ACC electrode was further examined (Bayram
& Ayranci, 2012b). The rate constants of electrosorption of the acids decreased in the
following order: NA > phthalic acid > BA (Bayram & Ayranci, 2012b). A more recent study
schematized the material/solution interface in the presence of MB sorption on a
prGO/SWCNT surface (Fig. 12c) (Yue et al., 2019b). In the absence of an electric current,
i.e., under OC conditions, the dye randomly adsorbed on the material leading to a lower
adsorption capacity. In contrast, the positively charged pollutant could adsorb onto the
negatively charged material under cathodic polarization, which enhanced the sorption
efficiency. The importance of the electrode potential and intermolecular interaction was also
emphasized in co-electrosorption studies from Damaskin’s group (Damaskin & Baturina,
1999; Stenina et al., 2001; Damaskin & Baturina, 2001a, 2001b; Damaskin et al., 2003;
Damaskin, 2008; Damaskin, 2009, 2011). Furthermore, all these trends corroborated the
behavior at the electrode/electrolyte interface. The characteristics of anions and cations (e.g.,
radii, interactions with solvent, charge, etc.) of the electrolyte have been identified as the key
role parameters for controlling the distribution and concentrations of ions in EDL, and
therefore greatly impact the electrosorption efficiency (Kornyshev, 2007; Waegele et al.,
2019).
The influence of the initial concentration of organic compounds on the
electrosorption efficiency has been widely reported in the literature, especially in batch mode
configurations. The electrosorption efficiency was studied by varying the initial MB
concentration from 10 to 600 mg L−1
(Yue et al., 2019b). The increase in the pollutant
concentration up to 100 mg L−1
led to an increase in the electrosorption capacity at a given
time and thereafter remained constant at higher initial concentrations. Similarly, in a kinetic
study it was observed an increase in the rate of metribuzin electrosorption on GAC with an
increase in the initial concentration from 0.23 to 2.1 mmol L-1
, leading to a higher capacity at
identical times (Kitous et al., 2009). Similar trends have been obtained with the
electrosorption of acilan blau dye (Koparal et al., 2002), phenol (Han et al., 2006b), AO7
(Han et al., 2008), β-naphthol (Eisinger & Alkire, 1980), AO8, AY14, AR151 (Sahin et al.,
2020), bentazone (Ania & Béguin, 2007), naphthalenesulfonic acid, benzyl alcohol, naphthoic
acid, methylquinolinium chloride (Bán et al., 1998) and MB (Fig. 12d) (Nainamalai et al.,
2018). These studies were performed in batch mode, meaning that not only the kinetics of

Part I Bibliography
44
electrosorption were quicker, but also the capacities were higher with an increasing initial
concentration. This is formally disclosed with isotherm models discussed in section 2.6.1 of
part I. This trend might be explained by the decrease in the driving force of the concentration
gradient of pollutants toward the surface of the working electrode during an increase in
loading rate (Han et al., 2006b). Moreover, the affinity between the pollutant and the
electrode surface was significantly increased by polarization, allowing the enhanced
adsorption capacity of pollutants on the electrode (Yue et al., 2019b). Furthermore, different
EDL behaviors at high concentrations of organic electrolytes have been highlighted since
conventional concepts of EDLs, such as the Gouy-Chapman-Stern representation, remain
suitable only for diluted media. In dense mixtures, nonlinear polarization at the interface has
been noticed, while a capacitance-voltage dependence was emphasized (Bazant et al., 2011).
At a low voltage, a so-called overscreening model is assumed, which is formed by a
monolayer of ions and an excess of counterions in the second monolayer (Fig. 12e) (Bazant et
al., 2011). In contrast, at a medium voltage, there is a condensed layer formation of
counterions, and at even higher voltages, complete lattice saturation is expected (i.e., the
formation of two monolayers at the interface), which is defined as the crowding model (Fig.
12e) (Bazant et al., 2011).
From a practical point of view, the continuous mode is preferred, and the variation in
the initial concentration will mainly affect the kinetics of electrosorption, while the maximum
capacity of the adsorbent can be reached by adapting the contact time. Furthermore, the
reactor volume and/or the adsorbent quantity can also be adjusted to reach the maximum
electrosorption efficiency, as discussed in section 2.2.4 of part I.

Part I Bibliography
45
Fig. 12. (a) Type of effluent studied in the literature, i.e., artificial or real
contamination and the presence of either aromatic or aliphatic compounds during
electrosorption processes, (b) effect of acid red 88, orange II, and MB co-sorption (Sun et al.,
2016), (c) schematic representation of MB molecule orientation on the prGO/SWCNT surface
(Yue et al., 2019), (d) influence of the initial concentration on MB electrosorption
(Nainamalai et al., 2018), (e) overscreening versus crowding models of EDL in the presence
of concentrated electrolyte (e.g., ionic liquids) (Bazant et al., 2011), (f) impact of the flow rate
on 2,4-dichlorophenoxyacetic acid electrosorption (Bayram et al., 2018).

Part I Bibliography
46
2.2.4. Residence time, flow rate, reactor volume, and adsorbent load
The electrosorption efficiency is also controlled by the residence time and volume
flow rate, which are related to the reactor volume. All previous works reported an
enhancement in the electrosorption capacity with an increasing residence time and a
decreasing flow rate by maintaining the contact of the pollutants with the active sites of the
porous electrode. For example, a decrease in the MB electrosorption onto AC was reported
with increased flow rates from 3 to 9 mL min-1
(Nainamalai et al., 2018). Similar trends have
been observed with 2,4-dichlorophenoxyacetic acid (Fig. 12f) (Bayram et al., 2018), acilan
blau dye (Koparal et al., 2002), burden orange II (Gerçel, 2016), BA and NA (Bayram, 2016),
metribuzin (Kitous et al., 2009) and BA (Bayram & Ayranci, 2012a) electrosorptions. It was
assumed that the EDL thickness at the polarized adsorbent surface decreased with an
increasing flow regime (Bayram et al., 2018). Consequently, the specific double-layer
capacitance (CDL) value was reduced along with the electrosorption capacity.
The adsorbent load is another way to increase the electrosorption capacity. The
influence of the bed heights, and therefore the adsorbent load, on MB electrosorption was
studied (Nainamalai et al., 2018). When the bed height increased from 3 to 9 cm, the MB
electrosorption capacity increased from 54 mg g-1
to 81 mg g-1
caused by an increase in the
residence time and the accessible binding sites. Similar trends have been obtained with the
electrosorption of β-naphthol (Eisinger, 1983) and acilan blau dye (Koparal et al., 2002).
2.3.Reactor design
An ideal reactor design for electrosorption needs to meet the requirements to make
full use of the electrode surface area while minimizing the mass transfer limitations and
maintaining a homogeneous potential distribution. The typical reactor designs developed in
generally applied electrochemistry have been tested for electrosorption (Table 1). They
include systems with fixed-bed or fluidized beds, flow-by or flow-through parallel plate cells
and stirred tank reactors (STRs). According to the reviewed papers (Table 1), fixed-bed
reactors have been more implemented for organic electrosorption (43%), followed by the
flow-through parallel-plate cell design (21%) (Fig.13). This could be attributed to their
adapted design when porous electrode materials are employed. This then enhances the
efficiency by benefitting from the internal surface area.

Part I Bibliography
47
Fig. 13. Occurrence frequency of different electrosorption reactor designs found in the
literature.
The reactor design description and their comparison are described as follows, while
Table 3 summarizes the advantages and drawbacks of each type of reactor design. Further
detailed information regarding the electrochemical reactor design performance for general
applications can be found in prominent textbooks in the field (Newman, 1968; Pletcher &
Walsh, 1982; Goodridge & Wright, 1983; Cœuret & Storck, 1984).
In STR, the electrode materials are placed in parallel, and the solution is
magnetically (lab-scale) or mechanically (pilot-scale) stirred in a tank (Fig. 14a) (Monteil et
al., 2019; Mousset & Dionysiou, 2020). The STR configuration was implemented most of the
time in batch mode, as opposed to continuous mode. Thus, the STR can be useful for
laboratory batch studies, especially for troubleshooting or development works. However,
mass transfer is the worst in these systems. This also leads to a higher foot print area due to
theelectrode's higher required total surface area. Consequently, an alternative reactor design is
preferred for commercial use.
Conventional flow-by and flow-through parallel plate cells have typically been
proposed (Figs. 10b and 10c). Two configurations are possible concerning the direction of the
effluent flow with respect to the direction of the current flow. In the flow-by cell, the current

Part I Bibliography
48
and flow of the effluent are perpendicular (Adnan, et al., 2021). The effluent circulates
between the electrodes, with a variant with a "channel", similar to a flow-by cell in series, i.e.,
a succession of cathode and anode materials (Mousset & Dionysiou, 2020). In the flow-
through cell, the current and flow of the effluent are parallel, and the effluent flows through
the porous electrode. This electrode is considered to be thin, which does not constitute beads
or particles, and differentiates the flow-through cell from a "bed reactor". An advantage of
parallel-plate cells is that they can be implemented in stacks of cells arranged in series and/or
in parallel in order to enhance the conversion yield and/or the treatment capacity, respectively.
This is adapted for applications at an industrial scale (Langlois & Cœuret, 1990; Kakhi,
2009). The flow-through cell has a distribution of potentials that tends to be less
homogeneous than in the flow-by cell. However, the flow-by cell induces mass transfer
limitations compared to the flow-through cell, and has therefore been less implemented for
electrosorption purposes (Fig. 13). Another possibility with parallel-plate design is the
variation in the inter-electrodes distances that decreases the cell resistance and increases the
mass transfer at a shortened gap, and affects the EDL behavior. In more conventional cells,
i.e., at millimetric distances, it is considered that an excess charge can occur only at the
surface of the material, according to Gauss theory. In nanofluidic thin-film cells, i.e., at
nanometric gaps, the assumption of electroneutrality in the double layer may be inappropriate.
This is because the OHP in EDL theory becomes highly dynamic due to very high mass
transport rates of redox ions (Fan et al., 2014).
In parallel, fixed- and fluidized-bed reactors have been suggested as substitute
designs. They consist of systems where the effluent is circulating through a bed constituted by
a volume electrode, i.e., a 3D porous polarized material (Figs. 10d-10g). In the fixed-bed
reactor, the electrode particles are all in permanent contact, which defines a monopolar
connection mode. In this case, the particulate electrodes constitute a single electron-
conducting particle that is either completely positively (anode) or negatively (cathode)
charged (Goodridge & Wright, 1983). In the fluidized-bed reactor, the electrode particles are
not in contact with each other, which leads to a bipolar mode (López-Bernabeu et al., 2016).
This means that one side of each particle is positively charged, while the other side of the
particle is negatively charged (Goodridge & Wright, 1983). Most of the time, these bed
designs are akin to column reactors. Two configurations can be proposed according to the
direction of the electric current compared to the hydraulic flow direction. In co-current mode,

Part I Bibliography
49
they are both parallel (Figs. 10d and 10f), while in counter-current mode, they are
perpendicular (Figs. 10e and 10g). The co-current condition is useful for testing different
porous materials in lab-scale studies (Coeuret, 2003). However, this configuration has not
been adapted for a larger scale because of the low applied flow rate range. In contrast, the
counter-current approach is compatible with industrial-scale applications due to the possibility
of arrangements in series and parallel (Coeuret, 2003). Additionally, the electrode
performance is mainly governed by diffusion polarization in the fixed-bed electrode (Matsuno
et al., 1996). This phenomenon is minimized in the fluidized-bed electrode due to the high
mass transfer rate induced by the turbulence of the moving particles (Matsuno et al., 1996).
However, the fluidized-bed reactor exhibits a number of inherent limitations. The most
significant drawback is the range of spatially distributedpotentials within the bed, leading to a
high heterogeneity distribution. In addition, the effective resistance of the particle phase in the
fluidized-bed electrode was found to be three to four times greater than that of the fixed-bed
device (Matsuno et al., 1996). Moreover, the conditions under which the fluidized bed is
operated are often unknown (Cheng et al., 2020).
Nevertheless, the fixed-bed presents numerous advantages over other reactor designs,
such as very high mass transfer intensification, a high specific area of the working electrode,
and feasibility of electrosorption processes for the large-scale plant. This justifies why it has
been studied more (Fig. 13).

Part I Bibliography
50
Fig. 14. Scheme of the main electrosorption reactor designs applied in the literature:
STR (a), flow-by (b) and flow-through (c) parallel-plate cells, fixed-bed reactor (d, e) and
fluidized-bed reactor (f, g) arranged in co-current (d, f) and counter-current (e, g)
configurations.

Part I Bibliography
51
Table 3. Advantages and drawbacks of the different types of reactor designs implemented for
the electrosorption of organic compounds.
Reactor design Advantages Drawbacks
STR
Easy to manufacture
Flexibility to meet
different treatment objectives
Limitations for industrial
scale development
High mass transfer
limitations
Require a higher
conductivity of solutions (often
needs a supporting electrolyte
added)
High footprint area
Flow-by parallel-
plate cell
Regenerate electrodes
Offers the operational
flexibility of a variable flow
rate and conversion
Easy control of
interelectrodes gap
Industrial scale
applicability by
implementation in stacks of
cells arranged in series and
parallel
Good homogeneity of
current and potential
distributions
Mass transfer limitations
Flow-through
parallel-plate cell
Regenerate electrodes
Enhancement of mass
transfer
Easy control of
interelectrodes gap
Industrial scale
applicability by
implementation in stacks of
cells arranged in series and
parallel
Suitable for effluent
with low target compounds
concentrations and low electric
conductivity
Low flow rates range
Clogging effect
Pressure drop
Fixed-bed reactor
Enhancement of mass
transfer
Easy operating
conditions
High treatment capacity
Industrial scale
applicability
High intragranular
Higher energy
requirements
Clogging effect
Pressure drop

Part I Bibliography
52
electric conductivity
Suitable for effluent
with low target compounds
concentrations and low electric
conductivity
Fluidized-bed
reactor
Rapid mixing rate of
the bed solids
Easy operating
conditions
Treatment of municipal
and industrial wastewaters with
concentrations up to a ppb
level
High treatment capacity
Industrial scale
applicability
Limit clogging effect
Higher energy
requirements
Low intra-granular
electric conductivity
High heterogeneity of
current and potential
distributions
Low acquisition of
knowledge about operating
parameters (conductivity,
potential, etc.) for kinetic
modeling
2.4.Factors influencing the electrodesorption step
An electrodesorption step is required to recover the electrosorbed pollutants for either
subsequent degradation or valorization. This further facilitates the regeneration of the porous
electrode material for successive electrosorption cycles, as discussed in more detail in section
2.5 of part I (Bain et al., 2010). It consists of reversing the electrode polarity, and the charged
contaminants are then released from the interface and diffuse back into the bulk solution
(McQuillan et al., 2018).
Electrode polarity and applied current or potential value are the main factors governing the
electrodesorption efficiency. For instance, the desorption study of ethylenediamine from AC
at a more positive potential (0 V/SCE) than for the electrosorption step (-0.5 V/SCE)
provoked significant electrodesorption of the ethylenediamine back into the solution (Eisinger
& Keller, 1990). However, the recovery was not complete, as it was approximately 66%,
which was attributed to irreversible electrosorption of a fraction of the organic compound on
the most active sites. Similarly, thiocyanate anions were desorbed from AC by applying a
negative polarization and then neutralizing or basifying the solution pH (Rong & Xien, 2009).
Thus, the pH can also play a role in the desorption process according to the pKa of organic
compounds. Another parameter that has been shown to influence the desorption efficiency is
the solvent. The increase in methyl quinolinium chloride desorption from AC was due not
only to the increase in the potential from 0 mV/(Ag/saturated KCl) to 600 mV/(Ag/saturated
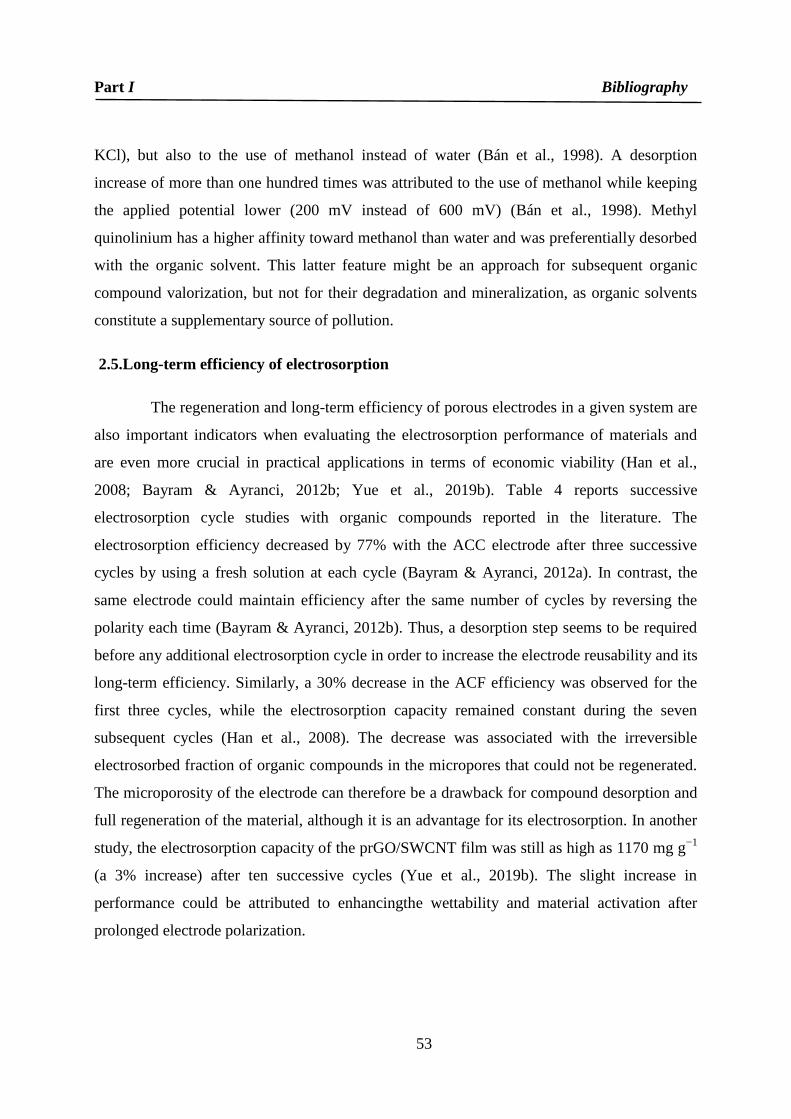
Part I Bibliography
53
KCl), but also to the use of methanol instead of water (Bán et al., 1998). A desorption
increase of more than one hundred times was attributed to the use of methanol while keeping
the applied potential lower (200 mV instead of 600 mV) (Bán et al., 1998). Methyl
quinolinium has a higher affinity toward methanol than water and was preferentially desorbed
with the organic solvent. This latter feature might be an approach for subsequent organic
compound valorization, but not for their degradation and mineralization, as organic solvents
constitute a supplementary source of pollution.
2.5.Long-term efficiency of electrosorption
The regeneration and long-term efficiency of porous electrodes in a given system are
also important indicators when evaluating the electrosorption performance of materials and
are even more crucial in practical applications in terms of economic viability (Han et al.,
2008; Bayram & Ayranci, 2012b; Yue et al., 2019b). Table 4 reports successive
electrosorption cycle studies with organic compounds reported in the literature. The
electrosorption efficiency decreased by 77% with the ACC electrode after three successive
cycles by using a fresh solution at each cycle (Bayram & Ayranci, 2012a). In contrast, the
same electrode could maintain efficiency after the same number of cycles by reversing the
polarity each time (Bayram & Ayranci, 2012b). Thus, a desorption step seems to be required
before any additional electrosorption cycle in order to increase the electrode reusability and its
long-term efficiency. Similarly, a 30% decrease in the ACF efficiency was observed for the
first three cycles, while the electrosorption capacity remained constant during the seven
subsequent cycles (Han et al., 2008). The decrease was associated with the irreversible
electrosorbed fraction of organic compounds in the micropores that could not be regenerated.
The microporosity of the electrode can therefore be a drawback for compound desorption and
full regeneration of the material, although it is an advantage for its electrosorption. In another
study, the electrosorption capacity of the prGO/SWCNT film was still as high as 1170 mg g−1
(a 3% increase) after ten successive cycles (Yue et al., 2019b). The slight increase in
performance could be attributed to enhancingthe wettability and material activation after
prolonged electrode polarization.

Part I Bibliography
54
Table 4. Successive electrosorption cycle studies with organic compounds reported in the
literature.
Working
electrode
Organic
pollutant
Number of
successive
cycles
Electrosorption
capacity Reference
prGO/SWCNT
s film MB 10
1st cycle: 1133 mg g
−1
10th
cycle: 1170 mg
g−1
(3% increase)
(Yue et al.,
2019b)
ACF AO7 10
1st cycle: RE
* = 95%
10th
cycle: RE* = 70%
(26% decrease)
(Han et al.,
2008)
ACC BA, phthalic
acid and NA 3
1st cycle: 15 mmol g
−1
3rd
cycle: 15 mmol g−1
(0% decrease)
(Bayram &
Ayranci,
2012b)
ACC BA 4
1st cycle: 77.5 mmol
g−1
4th
cycle: 5 mmol g−1
(93% decrease)
(Bayram &
Ayranci,
2012a)
*RE: regeneration efficiency percentage
2.6.Modeling
In addition to the electrosorption parameters, mathematical modeling of the
electrosorption process can be an effective tool for understanding the mechanisms involved,
optimizing the system, predicting the efficiency, designing the reactor, and increasing the
scale via dimensional analysis. Over the years, many electrosorption models have been
developed, but these models remain more challenging than those for adsorption reactors due
to the involvement of an electric current in the transfer phenomena and reactions. The main
models to improve the operating strategies for electrosorption are briefly presented from batch
to continuous modes. Dimensionless numbers and scaling considerations are also discussed.
2.6.1 Modeling in batch and continuous modes
Kinetics provides information about the residence time required for the completion
of electrosorption. Thus, it constitutes the basis to determine and predict the performance of
systems during the optimization step in batch mode and for the subsequent scale-up phase.
The kinetic data for electrosorption of many organic species onto carbon electrodes fit quite
well with the pseudo-first-order kinetic model (Ayranci & Conway, 2001; Han et al., 2006b;
Bayram & Ayranci, 2012a, 2012b). However, since high surface areas of the electrodes (e.g.,

Part I Bibliography
55
porous carbon materials) are used most of the time in electrosorption, the kinetic rate is often
limited by the electric current and not by diffusion. This could explain the good fitting with
the pseudo-first-order model (Ayranci & Conway, 2001; Han et al., 2006b; Bayram &
Ayranci, 2012a, 2012b).
The electrosorption isotherm remains a typical studied behavior. Numerous
propositions have been made to formalize the electrosorption isotherms mathematically. The
model that better fits the experimental data obtained in the electrosorption of organic
compounds was the Freundlich isotherm (Wang et al., 2012; Biniak et al., 2013; Sahin et al.,
2020). It can be explained by organic electrosorption onto carbon electrodes that occurs on a
heterogeneous surface with a continuum of electrosorption sites with different ∆𝐻𝑎𝑑𝑠 values.
Dynamic models, also known as breakthrough curves, have been proposed to explain
the design performance and ensure the successful operation of electrosorption in continuous
mode. The Adam Boharts, Thomas and Yoon-Nelson models are the main dynamic models
tested in the literature regarding the electrosorption of organic compounds (Nainamalai et al.,
2018).
2.6.2 Dimensionless numbers and sizing considerations
In general, a dimensional analysis combined with a similarity assessment is
commonly used to scale up electrochemical reactors by keeping dimensionless numbers
constant for better and faster optimization. Table 5 summarizes the main dimensionless
numbers employed in the literature regarding electrosorption processes. Three dimensionless
numbers are well known to relate the hydrodynamic conditions by involving the mass-
transport coefficient: the Reynolds number (Re), the Schmidt number (Sc) and the Sherwood
number (Sh) (Ibl, 1959; Vilar & Cœuret, 1999; Cañizares et al., 2006; López-Bernabeu et al.,
2016). The mass transfer Biot number (Bim) is an additional number that allows considering
the difference between the internal and external mass transfers rates in porous media (López-
Bernabeu et al., 2016). Mass transport phenomena are important in terms of the efficiency of
electrosorption systems. Numerous correlations, as well as the values of dimensionless
numbers, have been proposed in the literature according to the type of electrochemical reactor
design and to the operating conditions involved (Newman, 1968; Goodridge & Wright, 1983;
Cœuret & Storck, 1984; Pletcher & Walsh, 1993). It is important to note that in a fixed-bed

Part I Bibliography
56
reactor, the mass transport increases with the length of the bed and decreases with the
diameter of the particles from the bed (Storck et al., 1975).
Another valuable parameter is the Wagner number (Wa), which represents the ratio
between the polarization resistance of the electrode and the ohmic resistance in the electrolyte
(Table 5) (Wagner, 1951). It also defines the uniformity of the current density distribution and
remains an essential feature when porous electrode materials are implemented (J. S. Newman
& Tobias, 1962). It is well established that a drop in the potential is expected in porous
polarized materials, which induces a heterogeneous distribution within the electrode.
Therefore, a compromise needs to be made between a high surface area electrode for high
electrosorption capacity (i.e., a large thickness of material), while keeping the potential
distribution as homogeneous as possible for a good selectivity and efficiency (i.e., a small
material thickness) (Coeuret, 2003). In practice, it is preferable to implement porous electrode
materials with thicknesses in the direction of a current no higher than 0.5-1 cm while
maximizing the material length instead of its thickness (Cœuret et al., 1976; Eisinger &
Keller, 1990; Coeuret, 2003).
Dimensionless times have also been proposed in the literature, such as G, T and θ
(Chue et al., 1993; Sene et al., 2019). G refers to the competition between the electrical
potential wave and the sorption wave (Chue et al., 1993), whose value is compared to T,
which is the reduced time (Chue et al., 1993). When G<T, the final potential of the porous
material is more rapidly reached than the electrosorption equilibrium, while 90% of the final
potential in the electrode is reached at G = T (Chue et al., 1993). At T>G, the potential is
almost constant in the material, and the concentration of the targeted compound(s) in the
effluent begins to decrease. More recently, θ has been suggested as a dimensionless time to
define the flow regime, i.e., either the permanent or non-permanent domains (Sene et al.,
2019). It allows for estimating the optimal flow rate that will give an optimal charge transfer
(Table 5).
Since fixed-bed reactors have been the most widely designed reactors applied in the
literature for organic electrosorption (Fig. 13), it is interesting to present a method for scaling
estimation. More details can be read in textbooks in the field (Newman, 1968; Pletcher &
Walsh, 1982; Goodridge & Wright, 1983; Cœuret & Storck, 1984). A four-time-period
method has been proposed to size fixed-bed reactors, namely, the residence time (𝜏𝑅) (Eq. 2),

Part I Bibliography
57
breakthrough time (𝑡𝐵𝑇) (Eq. 3), diffusion time (𝑡𝐷) (Eq. 4) and 𝑡𝑑𝑙 (Eq. 5) (Eisinger &
Keller, 1990).
𝜏𝑅 =𝜀𝐵𝐴𝑑
𝑄𝑉 (2)
𝑡𝐵𝑇 = (𝑞𝐴 − 𝑞𝐷)𝜌𝐵𝐴𝑑
(𝐶𝑖𝑛−𝐶𝑜𝑢𝑡)𝑄𝑉 (3)
𝑡𝐷 =(
𝑑𝑝
2)2
2𝐷 (4)
𝑡𝑑𝑙 = 𝑎𝜀𝐵𝐶𝑑2 (+𝜎)
𝜎 (5)
where 𝜀𝐵 is the bed porosity, d is the electrode thickness (cm), A is the cross-
sectional area (𝐴 = 𝐻 × 𝑊, where H is the bed height and W is the bed width) (cm2), 𝑞𝐷 is
the electrodesorption (at the desorption potential) capacity (mg g-1
), 𝜌𝐵 is the bed density (g of
material per cm-3
of bed)), 𝐶𝑖𝑛 and 𝐶𝑜𝑢𝑡 are the targeted compound concentrations in the inlet
and outlet flows, respectively (mg cm-3
), QV is the inlet flow rate (cm3 s
-1), a is the interfacial
area per unit void volume (cm2 cm
-3), C is the differential capacitance (F cm
-2), κ and 𝜎 are
the effective electrolyte conductivity and electrical conductivity of the porous material,
respectively ((Ω-cm)-1
), 𝑑𝑝 is the particle diameter (cm), and D is the diffusion coefficient of
the targeted compound (cm2 s
-1).
For an optimal sizing, the following criteria must be considered (Eisinger & Keller,
1990):
𝑡𝑑𝑙 ≪ 𝑡𝐵𝑇 (6)
𝑡𝐷 < 𝜏𝑅 ≪ 𝑡𝐵𝑇 (7)
Equation 6 allows us to consider the fact that the bed needs to be completely charged
at a given potential before reaching the maximum electrosorption capacity (Eisinger & Keller,
1990). Equation 7 avoids being limited by diffusion (Eisinger & Keller, 1990). At a given A
and L, the procedure is first to estimate 𝑡𝑑𝑙 then 𝑡𝐵𝑇 , followed by the calculation of Q to be
implemented (Eisinger & Keller, 1990). From Q, 𝜏𝑅 is evaluated, and the condition from Eq.
7 needs to be then verified (Eisinger & Keller, 1990).

Part I Bibliography
58
There is a need to consider these dimensionless numbers for scale-up studies with
dimensional analysis as this type of consideration is lacking in literature.
Table 5. Main dimensionless numbers involved in the literature about the electrosorption.
Dimensionless
number Equation Signification
Re 𝑅𝑒 = 𝑢 𝑑𝑓
Ratio between the inertial forces and
viscous forces in the liquid. It defines
the hydrodynamic regime (laminar or
turbulent)
Sc 𝑆𝑐 =
𝐷𝑚
Ratio between the momentum
diffusivity and the mass diffusivity. It
defines the extension of the diffusion
layer
Sh 𝑆ℎ = 𝑘𝑓𝐿
𝐷
Ratio between the convective mass
transfer rate and the diffusion rate
Bim 𝐵𝑖𝑚 = 𝑆ℎ 𝐷
𝐷𝑒
Ratio of the rates of internal to
external mass transfers
Wa 𝑊𝑎 =
𝐿
𝑑
𝑑𝑗
Ratio between the polarization
resistance of the electrode to ohmic
resistance in electrolyte. It defines the
uniformity of the current density
distribution
𝐺 𝐺 = 𝑡𝑑𝑙
𝑡𝑠𝑡
This defines the competition between
the electrical potential wave and the
sorption wave
T 𝑇 = 𝑡
𝑡𝑠𝑡 Reduced time
Θ 𝜃 =
𝑡𝑠𝑐
𝑡𝑡0
with 𝑡𝑠𝑐 = ∆𝐸
𝑠𝑟 and 𝑡𝑡0 =
𝐿
𝑢
This defines the different flowing
regimes, either the permanent or non-
permanent domain
Abbreviations:
u is the linear velocity of the liquid through the void space of the adsorbent (m s−1
),is the
kinematic viscosity of the solution (m2
s−1
), kf denotes the external mass transfer coefficient
(m s-1
), L is the characteristic length (m), D is the molecular diffusivity of the pollutant (m2
s−1
), Deis the effective diffusivity (m2
s−1
), tdl is the double layer charging time (s), tstis the
stoichiometric time of sorption (s), t is the reaction time (s), κ is the effective electrolyte
conductivity ((Ω-m)-1
), is the overpotential (V), j is the current density (A m-2
), tscis the scan

Part I Bibliography
59
time (s), tt0 is the turnover time (s), ∆𝐸 is the potential difference (V), and sr is the scan rate
(V s-1
).
2.7.Current developments and future prospects
2.7.1 Current challenges to overcome
A general overview of the main factors and phenomena involved in the
electrosorption efficiency is proposed and schematized in Fig. 15. This scheme allows for the
identification of which parameters affect each phenomenon that then governs the
electrosorption efficiency. The importance of the EDL and mass transport is influenced by
most of the main parameters. Therefore, future efforts should be made to enhance both EDL
and mass transport. The main output and future improvements in the electrosorption process
efficiency are addressed as follows and determine part of the orientation of the PhD thesis:
- Electrode material: The high specific surface area of the material is insufficient to
obtain a high electrosorption capacity since the pore size also appears to be a crucial
parameter. The presence of mesopores tends to improve efficiency. Therefore, the specific
surface area and the pore size distribution of materials should be determined before
experiments to ensure a maximum electrosorption of the pollutants. Moreover, the material
conductivity and wettability should not be neglected in the mechanisms. Material stability and
reusability are other essential criteria for long-term use in practical applications. Existing
studies lack life span and regeneration tests, which are representative of real conditions.
- Electrode potential and polarity: An optimal electrode potential is required for optimal
electrosorption, while values that are too high or too low lead to faradaic reactions that need
to be avoided. The electrode polarity plays a role in the electrosorption efficiency according to
the types of targeted compounds, but the porous material can be damaged if it does not
support either oxidative or reductive potentials. Carbon-based materials have been widely
employed in electrosorption, although they can be easily corroded as anodes. Therefore,
caution should be taken in the applied conditions to preserve the lifetime of the electrode
material.
- Electrolyte concentration and properties: Although an increase in the electrolyte
concentration increases the solution conductivity and, therefore the ohmic resistance, co-

Part I Bibliography
60
sorption with either inorganic or organic compounds occurs. Thus, it can decrease the
electrosorption of the targeted compounds as well as the selectivity. In addition, the pKa of
organic compounds can influence their electrosorption efficiency and selectivity according to
the solution pH. However, there is an important need to operate with more complex matrices
until actual wastewater is tested in order to better assess the viability of the technique in
experimentalconditions. Moreover, high concentrations of supporting electrolytes have often
been added, which should be avoided in wastewater treatment.
- Reactor design: A fixed-bed reactor has been implemented the most extensively,
which is ascribed to the high mass transfer, the high specific area of the porous electrode and
the scale-up ability. A still pressure drop and clogging effect can occur with this type of
reactor. A less conventional design that was recently proposed could also be tested by
combining micro-reactors with macro-reactors to avoid these drawbacks (Mousset, 2020).
Moreover, an adapted design should be used to operate with low solution conductivity
without adding a supporting electrolyte.
- Modeling: Interface phenomena represented by EDL theory is still not well understood
under specific conditions (e.g., highly concentrated electrolytes and dense electrolytes). DFT
models are gaining an increasing interest. However, their single-use induces scale-level
heterogeneity: the atomic level at the electrode surface is considered, while a simple
continuum model for the electrolyte is taken into account without considering the discrete
form (e.g., dipoles) (Schmickler, 2020). Complete models of the interfaces should describe
electrons, solvents, ions and interactions between one another (Schmickler, 2020). Coupling
DFT with molecular dynamics (Oleinick et al., 2019) or combining DFT with a reference
interaction site model (Schmickler, 2020) have recently been suggested to obtain a complete
overview of the mechanisms at the interface. Moreover, kinetic models in either batch or
continuous modes should incorporate the matrix effect, the transport phenomena, and the
physico-chemical properties of compounds on the electrosorption rates and yields of organics
to better understand and predict the efficiency. This will further benefit scale-up studies that
include dimensional analysis and a similarity assessment. This is an important tool to reach
higher technology readiness level.

Part I Bibliography
61
Fig. 15. General overview of the main parameters and phenomena involved in the
electrosorption efficiency associated with a modeling approach.
2.7.2 Emerging processes combinations with electrosorption
Electrosorption was initially proposed for separation purposes to remove selected
compounds from wastewater, but the treatment strategy could be extended. The recovery of
added-value organic compounds in wastewater would be another option after optimizing the
electrosorption and electrodesorption conditions for optimal selectivity. An alternative
strategy would be to combine electrosorption as a separation technology with a degradation
process required for a more integrated treatment of the wastewater. Many researchers studied
emerging processes (photocatalytic, electrooxidation, electrically conductive ultrafiltration,
electro-Fenton, advanced oxidation processes, electrocatalysis, peroxi-coagulation, solid-
phase microextraction,...) combinations with electrosorption using several kinds of electrode
materials for the removal of various organic pollutants (Jin et al., 2011a; Wang et al., 2013;
Ayoubi-Feiz et al., 2014b, 2014c, 2018a; Chen et al., 2018; Fan et al., 2018a; Nie et al., 2019;

Part I Bibliography
62
Xu et al., 2019; Mantel et al., 2021; Chai et al., 2021; Yang et al., 2021). Table 6 provides an
overview of the main studies in literature illustrating these processes combination. It was
noticed that the photoelectrocatalysis had been the most employed process in combination
with electrosorption for the removal of nonylphenol (Fan et al., 2018b), alizarin red (Jin et al.,
2011a), diazinon (Ayoubi-Feiz et al., 2018a), reactive yellow 39 (Ayoubi-Feiz et al., 2014b)
and lanasol red 5B (Ayoubi-Feiz et al., 2014c). Electrooxidation/electroreduction processes
have particularly demonstrated a high ability to remove pollutants from wastewater
(Martinez-Huitle et al., 2015; Moreira et al., 2017; Mousset et al., 2018; Garcia-Rodriguez et
al., 2020; Mousset & Doudrick, 2020; Trellu et al., 2021) by implementing a BDD anode with
a high O2 evolution overvoltage (Mousset et al., 2019; Nidheesh et al., 2019). The degradation
and mineralization efficiencies are notably due to the involvement of hydroxyl radicals that
have very high reactivity and quasi non-selectivity toward organic compounds (Brillas et al.,
2009; Panizza & Cerisola, 2009; Mousset al., 2018). In combination with electrosorption
techniques, the global performance is enhanced by maintaining a high degradation yield. For
instance, electrooxidation combined with electrosorption was tested in the removal of BA
(Chen et al., 2018), acyclovir and phenol (Nie et al., 2019), while the combination with
peroxi-coagulation was investigated for the removal of Orange II (Yang et al., 2021). In
addition, Chai et al. (2021) investigated the combination of electro-Fenton with
electrosorption in removing toluene and trichloromethane (Chai et al., 2021). The authors
used a flow-through electro-Fenton treatment (anode: pure iron and cathode: Ti mesh),
followed by the electrosorption treatment (anode and cathode were ACF). The removal
efficiency is 96% for COD, 98% for NH3-N, and 46% for salinity under the optimal
conditions (voltage intensity of 1.5 V, initial pH of 4, plate spacing of 1 cm, flow rate of 40
mL min-1
, H2O2 concentration of 50 mM). A similar study was performed by Wang et al.
(2013) with imidacloprid. Another advantage of such combinations is the synergy obtained by
limiting the amount of potentially formed toxic byproducts (e.g., chlorate and perchlorate), as
recently published (Norra & Radjenovic, 2021). Therefore, these combinations seem to offer
promising results in the near future for a reliable development at a real scale. This is also the
reason why electrooxidation has been proposed in combination with electrosorption in the last
chapter of the PhD thesis.

63
Table 6. Summary of the main emerging processes combinations with electrosorption applied in treatment of organic pollutants.
Combined process
with
electrosorption
Working electrode Organic pollutant Efficiency Reference
Photoelectrocatalysi
s Bi2WO6/Carbon aerogel Nonylphenol
Combined processes:
99% (Fan et al., 2018a)
Photoelectrocatalysi
s
Nano N-
TiO2/graphene/titanium
grid sheet
Diazinon Electrosorption: 24%
Photocatalytic: 28%
(Ayoubi-Feiz et al.,
2018a)
Photoelectrocatalysi
s
α-Fe2O3/TiO2/AC plate
nanocomposite Reactive yellow 39
Adsorption: 28%
Electrosorption: 43%
Photocatalytic: 38%
(Ayoubi-Feiz et al.,
2014b)
Electro-Fenton Iron oxide grown AC
aerogel Imidacloprid
Combined processes:
90% (Wang et al., 2013)
Electro-Fenton AC felt Toluene and
trichloromethane
Combined process:
96% of COD removal (Chai et al., 2021)
Electrooxidation MWCNTs/peroxydisulfat
e
Acyclovir and
phenol
Combined processes:
Acyclovir: 97%
Phenol: 61%
(Nie et al., 2019)
Electrooxidation TiO2-NTs/3D-SnO2-Sb
electrode BA
Combined processes:
89% (Chen et al., 2018)
Peroxi-coagulation ACF and iron sheet Orange II
Combined processes:
Removal efficiency:
93%
Removal capacity:
1043 mg g-1
(Yang et al., 2021)

64
Electrically
conductive
ultrafiltration
Conductive membrane
River natural
organic matter,
Hohloh lake natural
organic matter,
humic acid and
brilliant blue ionic
dye
Combined processes:
River natural organic
matter: 70%
Hohloh lake natural
organic matter: 75%
Humic acid: 93%
Brilliant blue ionic
dye: 99%
(Mantel et al., 2021)
Electrocatalysis Layer-by-layer
CNT/PbO2
Sodium
pentachlorophenate
Combined processes:
74% (Xu et al., 2019)
Photocatalysis Nanosized TiO2/AC plate
electrode Lanasol red 5B
Photocatalytic: 66%
Combined processes:
86%
(Ayoubi-Feiz et al.,
2014c)
Photocatalysis TiO2/carbon aerogel Alizarin red
Electrosorption: 31%
Combined processes:
97%
(Jin et al., 2011a)

Chapter I Bibliography
65
References
Adnan, F.H., Mousset, E., Pontvianne, S., Pons, M., 2021a. Mineral cathodic electro-
precipitation and its kinetic modelling in thin-film microfluidic reactor during advanced
electro-oxidation process. Electrochim. Acta 387, 138487.
https://doi.org/10.1016/j.electacta.2021.138487
Adnan, F.H., Pons, M.-N., Mousset, E., 2021b. Mass transport evolution in microfluidic thin
film electrochemical reactors: New correlations from millimetric to submillimetric
interelectrode distances. Electrochem. commun. 130, 107097.
https://doi.org/10.1016/j.elecom.2021.107097
Ahmad, T., Guria, C., Mandal, A., 2020. Journal of water process engineering a review of
oily wastewater treatment using ultrafiltration membrane: a parametric study to enhance
the membrane performance. J. water Process Eng. 36, 101289.
https://doi.org/10.1016/j.jwpe.2020.101289
Alagesan, J., Jaisankar, M., Muthuramalingam, S., Mousset, E., Chellam, P.V., 2021.
Influence of number of azo bonds and mass transport limitations towards the
elimination capacity of continuous electrochemical process for the removal of textile
industrial dyes. Chemosphere 262. https://doi.org/10.1016/j.chemosphere.2020.128381
Alencherry, T., Naveen, A.R., Ghosh, S., Daniel, J., Venkataraghavan, R., 2017. Effect of
increasing electrical conductivity and hydrophilicity on the electrosorption capacity of
activated carbon electrodes for capacitive deionization. Desalination 415, 14–19.
https://doi.org/10.1016/j.desal.2017.04.001
Ania, C.O., Béguin, F., 2007. Mechanism of adsorption and electrosorption of bentazone on
activated carbon cloth in aqueous solutions. Water Res. 41, 3372–3380.
https://doi.org/10.1016/j.watres.2007.03.031
Ayoubi-Feiz, B., Aber, S., Khataee, A., Alipour, E., 2014a. Electrosorption and
photocatalytic one-stage combined process using a new type of nanosized
TiO₂/activated charcoal plate electrode. Environ. Sci. Pollut. Res. Int. 21, 8555–64.
https://doi.org/10.1007/s11356-014-2777-z
Ayoubi-Feiz, B., Aber, S., Khataee, A., Alipour, E., 2014b. Preparation and application of α-
Fe2O3/TiO2/activated charcoal plate nanocomposite as an electrode for electrosorption-
assisted visible light photoelectrocatalytic process. J. Mol. Catal. A Chem. 395, 440–
448. https://doi.org/10.1016/j.molcata.2014.09.006
Ayoubi-Feiz, B., Mashhadizadeh, M.H., Sheydaei, M., 2018. Preparation of reusable nano
N-TiO2/graphene/titanium grid sheet for electrosorption-assisted visible light
photoelectrocatalytic degradation of a pesticide: Effect of parameters and neural
network modeling. J. Electroanal. Chem. 823, 713–722.
https://doi.org/10.1016/j.jelechem.2018.07.020
Ayranci, E., Conway, B.E., 2001. Removal of phenol, phenoxide and chlorophenols from
waste-waters by adsorption and electrosorption at high-area carbon felt electrodes. J.
Electroanal. Chem. 513, 100–110.
Aziz, F., Achaby, M. El, Lissaneddine, A., Aziz, K., Ouazzani, N., Mamouni, R., Mandi, L.,
2020. Composites with alginate beads: A novel design of nano-adsorbents impregnation
for large-scale continuous flow wastewater treatment pilots. Saudi J. Biol. Sci. 27,
2499–2508. https://doi.org/10.1016/j.sjbs.2019.11.019
Bagheri, H., Fakhri, H., Ghahremani, R., Karimi, M., Madrakian, T., Afkhami, A., 2020.
Nanomaterial-based adsorbents for wastewater treatment. Smart nanocontainers,
Elsevier Inc. 467-485. https://doi.org/10.1016/b978-0-12-816770-0.00028-9

Chapter I Bibliography
66
Bain, E.J., Calo, J.M., Spitz-Steinberg, R., Kirchner, J., Axén, J., 2010.
Electrosorption/electrodesorption of arsenic on a granular activated carbon in the
presence of other heavy metals. Energy and fuels 24, 3415–3421.
https://doi.org/10.1021/ef901542q
Bán, A., Schäfer, A., Wendt, H., 1998. Fundamentals of electrosorption on activated carbon
for wastewater treatment of industrial effluents. J. Appl. Electrochem. 28, 227–236.
https://doi.org/10.1023/A:1003247229049
Bard, A.J., Faulkner, L.R., 2001. Electrochemical methods - fundamentals and applications,
2nd Ed. ed. John Wiley & Sons, Inc. https://doi.org/10.1016/B978-0-12-381373-
2.00056-9
Barhoumi, A., Ncib, S., Chibani, A., Brahmi, K., Bouguerra, W., Elaloui, E., 2019. High-rate
humic acid removal from cellulose and paper industry wastewater by combining
electrocoagulation process with adsorption onto granular activated carbon. Ind. Crops
Prod. 140, 111715. https://doi.org/10.1016/j.indcrop.2019.111715
Basu, M., Guha, A.K., Ray, L., 2019. Adsorption of lead on lentil husk in fixed bed column
bioreactor. Bioresour. Technol. 283, 86–95.
https://doi.org/10.1016/j.biortech.2019.02.133
Basuki, K.T., Hasnowo, L.A., Jamayanti, E., 2019. Adsorption of uranium simulation waste
using bentonite: Titanium dioxide. Urania J. Ilm. Daur Bahan Bakar Nukl. 25, 19–31.
https://doi.org/10.17146/urania.2019.25.1.4527
Bayram, E., 2016. Electrosoption of aromatic organic acids from aqueous solutions onto
granular activated carbon electrodes for water purification. Hacettepe J. Biol. Chem. 3,
273–273. https://doi.org/10.15671/hjbc.20164420570
Bayram, E., Ayranci, E., 2012a. Structural effects on electrosorptive behavior of aromatic
organic acids from aqueous solutions onto activated carbon cloth electrode of a flow-
through electrolytic cell. J. Electroanal. Chem. 683, 14–20.
https://doi.org/10.1016/j.jelechem.2012.07.028
Bayram, E., Ayranci, E., 2012b. Electrosorption based waste water treatment system using
activated carbon cloth electrode: Electrosorption of benzoic acid from a flow-through
electrolytic cell. Sep. Purif. Technol. 86, 113–118.
https://doi.org/10.1016/j.seppur.2011.10.032
Bayram, E., Kizil, Ç., Ayranci, E., 2018. Flow-through electrosorption process for removal
of 2,4-D pesticide from aqueous solutions onto activated carbon cloth fixed-bed
electrodes. Water Sci. Technol. 77, 848–854. https://doi.org/10.2166/wst.2017.598
Bazant, M.Z., Storey, B.D., Kornyshev, A.A., 2011. Double layer in ionic liquids:
Overscreening versus crowding. Phys. Rev. Lett. 106.
https://doi.org/10.1103/PhysRevLett.106.046102
Belarbi, Z., Sotta, B., Makhloufi, L., Tribollet, B., Gamby, J., 2016. Modelling of delay
effect of calcium carbonate deposition kinetics on rotating disk electrode in the presence
of green inhibitor. Electrochim. Acta 189, 118–127.
https://doi.org/10.1016/j.electacta.2015.12.089
Bergmann, M.E.H., Rollin, J., Iourtchouk, T., 2009. The occurrence of perchlorate during
drinking water electrolysis using BDD anodes. Electrochim. Acta 54, 2102–2107.
https://doi.org/10.1016/j.electacta.2008.09.040
Biniak, S., Światkowski, A., Pakuła, M., Sankowska, M., Kuśmierek, K., Trykowski, G.,
2013. Cyclic voltammetric and FTIR studies of powdered carbon electrodes in the
electrosorption of 4-chlorophenols from aqueous electrolytes. Carbon 51, 301–312.
https://doi.org/10.1016/j.carbon.2012.08.057

Chapter I Bibliography
67
Brillas, E., Sirés, I., Oturan, M.A., 2009. Electro-Fenton process and related electrochemical
technologies based on Fenton’s reaction chemistry. Chem. Rev. 109, 6570–6631.
https://doi.org/10.1007/s00894-008-0358-0
Brito, C.D.N., de Araújo, D.M., Martínez-Huitle, C.A., Rodrigo, M.A., 2015. Understanding
active chlorine species production using boron doped diamond films with lower and
higher sp3/sp
2 ratio. Electrochem. commun. 55, 34–38.
https://doi.org/10.1016/j.elecom.2015.03.013
Brummer, S.B., Ford, J.I., Turner, M.J., 1965. The adsorption and oxidation of hydrocarbons
on noble metal electrodes. I. Propane adsorption on smooth platinum electrodes. J.
Phys. Chem. 69, 3424–3433. https://doi.org/10.1021/j100894a031
Butler, J.A.., Armstrong, G., 1933. The kinetics of electrode processes. Part II.―Reversible
reduction and oxidation processes. Proceeding R. Soc. A 139, 406–416.
https://doi.org/10.1524/zpch.1972.80.1_2.110a
Cai, Z., Deng, X., Wang, Q., Lai, J., Xie, H., Chen, Y., Huang, B., Lin, G., 2020. Core-shell
granular activated carbon and its adsorption of trypan blue. J. Clean. Prod. 242, 118496.
https://doi.org/10.1016/j.jclepro.2019.118496
Cañizares, P., Marcos, I.F. De, Rodrigo, M.A., Lobato, J., 2006. Measurement of mass-
transfer coefficients by an electrochemical technique. J. Chem. Educ. 83, 1204–1207.
https://doi.org/10.1021/ed083p1204
Chabot, V., Higgins, D., Yu, A., Xiao, X., Chen, Z., Zhang, J., 2014. A review of graphene
and graphene oxide sponge: Material synthesis and applications to energy and the
environment. Energy Environ. Sci. 7, 1564. https://doi.org/10.1039/c3ee43385d
Chai, X., He, Y., Ying, D., Jia, J., Sun, T., 2007. Electrosorption-enhanced solid-phase
microextraction using activated carbon fiber for determination of aniline in water. J.
Chromatogr. A 1165, 26–31. https://doi.org/10.1016/j.chroma.2007.07.048
Chai, Y., Qin, P., Wu, Z., Bai, M., Li, W., Pan, J., Cao, R., Chen, A., Jin, D., Peng, C., 2021.
A coupled system of flow-through electro-Fenton and electrosorption processes for the
efficient treatment of high-salinity organic wastewater. Sep. Purif. Technol. 267,
118683. https://doi.org/10.1016/j.seppur.2021.118683
Chang, L., Li, J., Duan, X., Liu, W., 2015. Porous carbon derived from Metal-Organic
Framework (MOF) for capacitive deionization electrode. Electrochim. Acta 176, 956–
964. https://doi.org/10.1016/j.electacta.2015.07.130
Chang, L., Zhou, Y., Duan, X., 2014. Kinetics and equilibrium studies on the electrosorption
of anions with activated carbon electrodes. Desalin. water Treat. 52, 6549–6555.
https://doi.org/10.1080/19443994.2013.816873
Chapman, D.L., 1913. A contribution to the theory of electrocapillary. Philos. Mag. 25, 475–
481. https://doi.org/10.1016/0304-3975(85)90090-8
Chen, Y., Tu, Y., Bai, Y., Li, J., Lu, J., 2018. Electrosorption enhanced electrooxidation of a
model organic pollutant at 3D SnO2-Sb electrode in superimposed pulse current mode.
Chemosphere 195, 63–69. https://doi.org/10.1016/j.chemosphere.2017.12.074
Cheng, J., Yang, H., Fan, C., Li, R., Yu, X., Li, H., 2020. Review on the applications and
development of fluidized bed electrodes. J. solid state Electrochem.
Chkirida, S., Zari, N., Achour, R., Hassoune, H., Lachehab, A., Qaiss, A. El Kacem,
Bouhfid, R., 2021. Highly synergic adsorption/photocatalytic efficiency of
Alginate/Bentonite impregnated TiO2 beads for wastewater treatment. J. Photochem.
Photobiol. A Chem. 412, 113215. https://doi.org/10.1016/j.jphotochem.2021.113215
Chmiola, J., Yushin, G., Gogotsi, Y., Portet, C., Simon, P., Taberna, P.L., 2006. Anomalous
increase in carbon at pore sizes less than 1 nanometer. Science (80-. ). 313, 1760–1763.

Chapter I Bibliography
68
https://doi.org/10.1126/science.1132195
Chue, K.T., Grévillot, G., Tondeur, D., 1993. Electrosorption an activated carbon bed. Stud.
Surf. Sci. Catal. 80, 97–104.
Coeuret, F., 2003. Ingénierie des procédés électrochimiques. Ellipses, Paris (France).
Cœuret, F., 1993. A flow-through porous electrode patented 100 years ago: The Hulin
process. J. Appl. Electrochem. 23, 853–855.
Cœuret, F., Hutin, D., Gaunand, A., 1976. Study of the effectiveness of fixed flow-through
electrodes. J. Appl. Electrochem. 6, 417–423. https://doi.org/10.1007/BF00616541
Cœuret, F., Legrand, J., 1985. Mass transfer at the electrodes of the “falling-film cell.” J.
Appl. Electrochem. 15, 181–190.
Cœuret, F., Storck, A., 1984. Eléments de génie électrochimique, 1st Ed. ed. Tec & Doc,
Paris (France).
Conway, B.E., 1999. Theoretical treatment and modeling of the double layer at electrode
interfaces, in: Electrochemical Supercapacitors. pp. 125–168.
https://doi.org/10.1007/978-1-4757-3058-6_7
Crini, G., Lichtfouse, E., 2019. Advantages and disadvantages of techniques used for
wastewater treatment. Environ. Chem. Lett. 17, 145–155.
https://doi.org/10.1007/s10311-018-0785-9
Crini, G., Lichtfouse, E., Wilson, L.D., Morin-Crini, N., 2019. Conventional and non-
conventional adsorbents for wastewater treatment. Environ. Chem. Lett. 17, 195–213.
https://doi.org/10.1007/s10311-018-0786-8
Cuong, D.V., 2020. Eco-friendly biochar-based materials in removal of contaminants from
aqueous solutions: Fabrication, characterization and applications.
https://doi.org/10.6342/NTU202003877
Dai, G., Zhang, L., Liao, Y., Shi, Y., Xie, J., Lei, F., Fan, L., 2020. Multi-scale model for
describing the effect of pore structure on carbon-based electric double layer. J. Phys.
Chem. C 124, 3952–3961. https://doi.org/10.1021/acs.jpcc.9b10587
Damaskin, B. B., Baturina, O.A., 1999. Co-adsorption of anions and low-adsorbing cations
within the Alekseev-Popov-Kolotyrkin model. Russ. J. Electrochem. 35(11), 1182–
1185.
Damaskin, B.B., 2011. Modeling of co-adsorption of cations and anions localized in different
layers of the dense part of electrical double layer under the conditions of linear charge
dependence of the adsorption energy. Russ. J. Electrochem. 47, 988–994.
https://doi.org/10.1134/S1023193511090047
Damaskin, B.B., 2009. Mechanism of coadsorption of two organic substances on electrodes
at strong attractive interaction between their molecules in the adsorption layer. Russ. J.
Electrochem. 45, 241–245. https://doi.org/10.1134/S102319350903001X
Damaskin, B.B., 2008. Modeling of synergism effect at different orientation of co-adsorbing
molecules. Russ. J. Electrochem. 44, 1411–1417.
https://doi.org/10.1134/S102319350812001X
Damaskin, B. B., Baturina, O.A., 2001. Some anomalies in coadsorption of two organic
substances due to differences in molecular interaction of species undergoing
coadsorption. Russ. J. Electrochem. 37, 1292–1299.
https://doi.org/10.1023/A:1013239813826
Damaskin, B B, Baturina, O.A., 2001a. Simulating coadsorption of surface active anions and
organic molecules capable of forming two-dimensional condensed layers on the
electrode. Russ. J. Electrochem. 37, 121–126.
Damaskin, B B, Baturina, O.A., 2001b. Simulation of coadsorption of inorganic ions and

Chapter I Bibliography
69
organic molecules on electrodes. Russ. J. Electrochem. 37, 73–79.
Damaskin, B.B., Petrii, O.A., 2011. Historical development of theories of the
electrochemical double layer. J. solid state Electrochem. 15, 1317–1334.
https://doi.org/10.1007/s10008-011-1294-y
Damaskin, B.B., Safonov, V.A., Safonov, N. V, 2003. Adsorption of an organic compound
in two different positions: Simulation taking into account all three parameters of
intermolecular interaction. Russ. J. Electrochem. 39, 814–819.
Díaz-Blancas, V., Ocampo-Pérez, R., Leyva-Ramos, R., Alonso-Dávila, P.A., Moral-
Rodríguez, A.I., 2018. 3D modeling of the overall adsorption rate of metronidazole on
granular activated carbon at low and high concentrations in aqueous solution. Chem.
Eng. J. 349, 82–91. https://doi.org/10.1016/j.cej.2018.05.076
Du, X., Oturan, M.A., Zhou, M., Belkessa, N., Su, P., Cai, J., Trellu, C., Mousset, E., 2021.
Nanostructured electrodes for electrocatalytic advanced oxidation processes: From
materials preparation to mechanisms understanding and wastewater treatment
applications. Appl. Catal. B Environ. 296, 120332.
https://doi.org/10.1016/j.apcatb.2021.120332
Eeshwarasinghe, D., Loganathan, P., Vigneswaran, S., 2019. Simultaneous removal of
polycyclic aromatic hydrocarbons and heavy metals from water using granular activated
carbon. Chemosphere 223, 616–627.
https://doi.org/10.1016/j.chemosphere.2019.02.033
Eisinger, R.S., 1983. Separation by electrosorption of organic compounds in a flow-through
porous electrode. J. Electrochem. Soc. 130, 93. https://doi.org/10.1149/1.2119689
Eisinger, R.S., Alkire, R.C., 1980. Electrosorption of b-naphthol on graphite. J
Electroanal.Chem. 112, 327–337.
Eisinger, R.S., Keller, G.E., 1990. Electrosorption: A case study on removal of dilute
organics from water. Environ. Prog. 9, 235–244. https://doi.org/10.1002/ep.670090418
El-Naas, M.H., Alhaija, M.A., 2013. Modelling of adsorption processes. Math. Model. 579–
600.
Fan, L., Liu, Y., Xiong, J., White, H.S., Chen, S., 2014. Electron-transfer kinetics and
electric double layer effects in nanometer-wide thin-layer cells. ACS Nano 8, 10426–
10436. https://doi.org/10.1021/nn503780b
Fan, Z., Shi, H., Zhao, H., Cai, J., Zhao, G., 2018a. Application of carbon aerogel
electrosorption for enhanced Bi2WO6 photoelectrocatalysis and elimination of trace
nonylphenol. Carbon N. Y. 126, 279–288. https://doi.org/10.1016/j.carbon.2017.10.009
Feng, C., E, J., Han, W., Deng, Y., Zhang, B., Zhao, X., Han, D., 2021. Key technology and
application analysis of zeolite adsorption for energy storage and heat-mass transfer
process: A review. Renew. Sustain. Energy Rev. 144, 110954.
https://doi.org/10.1016/j.rser.2021.110954
Feng, G., Qiao, R., Huang, J., Sumpter, B.G., Meunier, V., 2010. Ion distribution in
electrified micropores and its role in the anomalous enhancement of capacitance. ACS
Nano 4, 2382–2390. https://doi.org/10.1021/nn100126w
Folaranmi, G., Bechelany, M., Sistat, P., Cretin, M., Zaviska, F., 2020. Towards
electrochemical water desalination techniques: a review on capacitive deionization,
membrane capacitive deionization and flow capacitive deionization. Membranes
(Basel).
Foo, K.Y., Hameed, B.H., 2009. A short review of activated carbon assisted electrosorption
process : An overview , current stage and future prospects. J. Hazard. Mater. 170, 552–
559. https://doi.org/10.1016/j.jhazmat.2009.05.057

Chapter I Bibliography
70
Frackowiak, E., 2001. Carbon materials for the electrochemical storage of energy in
capacitors. Carbon N. Y. 39, 937–950
Frumkin, A., Damaskin, B., Petrii, O., 1974. On the charge transfer in the process of
adsorption at the electrode/solution interface. Electroanal. Chem. interfacial
Electrochem. 53, 57–65.
Ganzenko, O., Huguenot, D., Hullebusch, E.D. Van, Esposito, G., Oturan, M.A., 2014.
Electrochemical advanced oxidation and biological processes for wastewater treatment :
a review of the combined approaches. Env. Sci Pollut Res.
https://doi.org/10.1007/s11356-014-2770-6
Gao, T., Li, H., Zhou, F., Gao, M., Liang, S., Luo, M., 2017. Mesoporous carbon derived
from ZIF-8 for high efficient electrosorption. Desalination 451, 133–138.
https://doi.org/10.1016/j.desal.2017.06.021
Garcia-Rodriguez, O., Mousset, E., Olvera-Vargas, H., Lefebvre, O., 2020. Electrochemical
treatment of highly concentrated wastewater: A review of experimental and modeling
approaches from lab-to full-scale. Crit. Rev. Environ. Sci. Technol. 0, 1–70.
https://doi.org/10.1080/10643389.2020.1820428
Geim, A., Novoselov, K., 2007. The rise of graphene. Nat. Mater. 6, 183–191
Gerçel, Ö., 2016. Removal of textile dye from aqueous solution by electrochemical method.
Sep. Sci. Technol. 51, 711–717. https://doi.org/10.1080/01496395.2015.1088870
Gileadi, E., 1966. Electrosorption of uncharged molecules on solid electrodes. J. Electroanal.
Chem. 11, 137–151. https://doi.org/10.1016/0022-0728(66)80073-6
Gileadi, E., Duić, L., Bockris, J.O.M., 1968. A comparison of radiotracer and
electrochemical methods for the measurement of the electrosorption of organic
molecules. Electrochim. Acta 13, 1915–1935. https://doi.org/10.1016/0013-
4686(68)80103-3
Gileadi, E., Rubin, B.T., Bockris, J.O.M., 1965. Electrosorption of ethylene on platinum as a
function of potential, concentration, and temperature. J. Phys. Chem. 69, 3335–3345.
https://doi.org/10.1021/j100894a019
Girijan, S., Kumar, M., Gomber, S., 2021. Starch and powdered activated carbon amended
alginate-biomass beads for metronidazole and bulk organic matter removal: Synthesis,
optimization, reaction kinetics and reusability. J. Environ. Chem. Eng. 9, 106102.
https://doi.org/10.1016/j.jece.2021.106102
Golovko, O., Anton, L. de B., Cascone, C., Ahrens, L., Lavonen, E., Köhler, S.J., 2020.
Sorption characteristics and removal efficiency of organic micropollutants in drinking
water using Granular Activated Carbon (GAC) in pilot-scale and full-scale tests. Water
(Switzerland) 12, 1–14. https://doi.org/10.3390/w12072053
Goodridge, F., Wright, A.R., 1983. Porous flow-through and fluidized-bed electrodes.
Compr. Treatise Electrochem. 393–443
Gouy, M., 1910. Charge électrique à la surface d’un électrolyte. J. Phys 9, 457–468
Grahame, D.C., 1947. The electrical double layer and the theory of electrocapillarity. Chem.
Rev. 41, 441–501. https://doi.org/10.1021/cr60130a002
Grahame, D.C., 1946. Properties of the electrical double layer at a mercury surface. II. the
effect of frequency on the capacity and resistance of ideal polarized electrodes. J. Am.
Chem. Soc. 68, 301–310. https://doi.org/10.1021/ja01206a045
Han, Y., Quan, X., Chen, S., Zhao, H., Cui, C., Zhao, Y., 2006a. Electrochemically enhanced
adsorption of aniline on activated carbon fibers. Sep. Purif. Technol. 50, 365–372.
https://doi.org/10.1016/j.seppur.2005.12.011
Han, Y., Quan, X., Chen, S., Zhao, H., Cui, C., Zhao, Y., 2006b. Electrochemically enhanced

Chapter I Bibliography
71
adsorption of phenol on activated carbon fibers in basic aqueous solution. J. Colloid
Interface Sci. 299, 766–771. https://doi.org/10.1016/j.jcis.2006.03.007
Han, Y., Quan, X., Ruan, X., Zhang, W., 2008. Integrated electrochemically enhanced
adsorption with electrochemical regeneration for removal of acid orange 7 using
activated carbon fibers. Sep. Purif. Technol. 59, 43–49.
https://doi.org/10.1016/j.seppur.2007.05.026
Hazourli, S., Bonnecaze, G., Astruc, M., 1996. Adsorption et electrosorption de composes
organiques sur charbon actif en grains partie I - Influence du potentiel imposé et du
nombre de cycles adsorption and electrosorption of organic compounds on granular
activated carbon part I- Influence of applied. Environ. Technol. 17, 1275–1283.
https://doi.org/10.1080/09593330.1996.9618457
He, F., Hemmatifar, A., Bazant, M.Z., Hatton, T.A., 2020. Selective adsorption of organic
anions in a flow cell with asymmetric redox active electrodes. Water Res. 182, 115963.
https://doi.org/10.1016/j.watres.2020.115963
Heiland, W., Gileadi, E., Bockris, J.O.M., 1966. Kinetic and thermodynamic aspects of the
electrosorption of benzene on platinum electrodes. J. Phys. Chem. 70, 1207–1216.
https://doi.org/10.1021/j100876a040
Helmholtz, H. von, 1879. Studien über electrische grenzschichten. Ann. der Phys. und
chemie 243, 22–382.
Henstridge, M.C., Dickinson, E.J.F., Compton, R.G., 2010. On the estimation of the diffuse
double layer of carbon nanotubes using classical theory: Curvature effects on the Gouy-
Chapman limit. Chem. Phys. Lett. 485, 167–170.
https://doi.org/10.1016/j.cplett.2009.12.034
Holubowitch, N., Omosebi, A., Gao, X., Landon, J., Liu, K., 2017. Quasi-steady-state
polarization reveals the interplay of capacitive and faradaic processes in capacitive
deionization. ChemElectroChem 4, 2404–2413. https://doi.org/10.1002/celc.201700082
Hou, C.H., Huang, J.F., Lin, H.R., Wang, B.Y., 2012. Preparation of activated carbon sheet
electrode assisted electrosorption process. J. Taiwan Inst. Chem. Eng. 43, 473–479.
https://doi.org/10.1016/j.jtice.2011.12.003
Huang, J., Sumpter, B.G., Meunier, V., 2008. Theoretical model for nanoporous carbon
supercapacitors. Angew. chemie - Int. Ed. 47, 520–524.
https://doi.org/10.1002/anie.200703864
Hulin, P.L., 1893. Procédés et appareil électrolytiques pour la séparation immédiate des
produits d’électrolyse liquides ou dissous.
Huong Le, T.X., Dumée, L.F., Lacour, S., Rivallin, M., Yi, Z., Kong, L., Bechelany, M.,
Cretin, M., 2019. Hybrid graphene-decorated metal hollow fibre membrane reactors for
efficient electro-Fenton - Filtration co-processes. J. Memb. Sci. 587, 117182.
https://doi.org/10.1016/j.memsci.2019.117182
Ibl, N., 1959. The use of dimensionless groups in electrochemistry. Electrochim. Acta 1,
117–129. https://doi.org/10.1016/0013-4686(59)85001-5
Islam, M.S., McPhedran, K.N., Messele, S.A., Liu, Y., Gamal El-Din, M., 2018. Isotherm
and kinetic studies on adsorption of oil sands process-affected water organic compounds
using granular activated carbon. Chemosphere 202, 716–725.
https://doi.org/10.1016/j.chemosphere.2018.03.149
Jamil, S., Loganathan, P., Listowski, A., Kandasamy, J., Khourshed, C., Vigneswaran, S.,
2019. Simultaneous removal of natural organic matter and micro-organic pollutants
from reverse osmosis concentrate using granular activated carbon. Water Res. 155, 106–
114. https://doi.org/10.1016/j.watres.2019.02.016

Chapter I Bibliography
72
Jaria, G., Calisto, V., Silva, C.P., Gil, M.V., Otero, M., Esteves, V.I., 2019. Fixed-bed
performance of a waste-derived granular activated carbon for the removal of
micropollutants from municipal wastewater. Sci. Total Environ. 683, 699–708.
https://doi.org/10.1016/j.scitotenv.2019.05.198
Jayson, G.G., Sangster, J.A., Thompson, G., Wilkinson, M.C., 1987. Adsorption and
electrosorption of mercury (II) acetate onto activated charcoal cloth from aqueous
solution. Carbon N. Y. 25, 523–531. https://doi.org/10.1016/0008-6223(87)90193-X
Jin, Y., Wu, M., Zhao, G., Li, M., 2011. Photocatalysis-enhanced electrosorption process for
degradation of high-concentration dye wastewater on TiO2/carbon aerogel. Chem. Eng.
J. 168, 1248–1255. https://doi.org/10.1016/j.cej.2011.02.026
Johnson, A.M., Newman, J., 1971. Desalting by means of porous carbon electrodes. J.
Electrochem. Soc. 118, 510. https://doi.org/10.1149/1.2408094
Jung, C., Oh, W., Lee, Y., Park, S., 2005. Electrosorption of U(IV) by electochemically
modified activated carbon fibers. Carbon Sci. 6, 25–30.
Kakhi, M., 2009. Classification of the flow regimes in the flow-through cell. Eur. J. Pharm.
Sci. 37, 531–544. https://doi.org/10.1016/j.ejps.2009.04.003
Khan, A.S., Ibrahim, T.H., Khamis, M.I., Nancarrow, P., Iqbal, J., AlNashef, I., Jabbar,
N.A., Hassan, M.F., Mjalli, F.S., 2021. Preparation of sustainable activated carbon-
alginate beads impregnated with ionic liquid for phenol decontamination. J. Clean.
Prod. 128899. https://doi.org/10.1016/j.jclepro.2021.128899
Kitous, O., Cheikh, A., Lounici, H., Grib, H., Pauss, A., Mameri, N., 2009. Application of
the electrosorption technique to remove Metribuzin pesticide. J. Hazard. Mater. 161,
1035–1039. https://doi.org/10.1016/j.jhazmat.2008.04.091
Koparal, A.S., Yavuz, Y., Bakir Öğütveren, Ü., 2002. Electroadsorption of Acilan Blau dye
from textile effluents by using activated carbon-perlite mixtures. Water Environ. Res.
74, 521–525. https://doi.org/10.2175/106143002x140314
Kornyshev, A.A., 2007. Double-layer in ionic liquids: Paradigm change? J. Phys. Chem. B
111, 5545–5557.
Langlois, S., Cœuret, F., 1990. Flow-through and flow-by porous electrodes of nickel foam
Part III: theoretical electrode potential distribution in the flow-by configuration. J. Appl.
Electrochem. 20, 740–748.
Largeot, C., Portet, C., Chmiola, J., Taberna, P.L., Gogotsi, Y., Simon, P., 2008. Relation
between the ion size and pore size for an electric double-layer capacitor. J. Am. Chem.
Soc. 130, 2730–2731. https://doi.org/10.1021/ja7106178
Le, T.X.H., Bechelany, M., Lacour, S., Oturan, N., Oturan, M.A., Cretin, M., 2015. High
removal efficiency of dye pollutants by electron-Fenton process using a graphene-based
cathode. Carbon N. Y. 94, 1003–1011. https://doi.org/10.1016/j.carbon.2015.07.086
Li, Y., Zhang, C., Jiang, Y., Wang, T., Wang, H., 2016. Effects of the hydration ratio on the
electrosorption selectivity of ions during capacitive deionization. Desalination 399,
171–177. https://doi.org/10.1016/j.desal.2016.09.011
Li, Z., Shen, C., Liu, Y., Ma, C., Li, F., Yang, B., Huang, M., Wang, Z., Dong, L.,
Wolfgang, S., 2020. Carbon nanotube filter functionalized with iron oxychloride for
flow-through electro-Fenton. Appl. Catal. B Environ. 260, 118204.
https://doi.org/10.1016/j.apcatb.2019.118204
Lian, C., Jiang, D.E., Liu, H., Wu, J., 2016. A generic model for electric double layers in
porous electrodes. J. Phys. Chem. C 120, 8704–8710.
https://doi.org/10.1021/acs.jpcc.6b00964
Lippmann, M.G., 1875. Relations entre les phénomènes électriques et capillaires. Ann.

Chapter I Bibliography
73
Chim. Phys. 5, 494–549.
Liu, L., Liu, Y., Che, N., Gao, B., Li, C., 2021. Electrochemical adsorption of
perfluorooctanoic acid on a novel reduced graphene oxide aerogel loaded with Cu
nanoparticles and fluorine. J. Hazard. Mater. 416, 125866.
https://doi.org/10.1016/j.jhazmat.2021.125866
López-Bernabeu, S., Ruiz-Rosas, R., Quijada, C., Montilla, F., Morallón, E., 2016. Enhanced
removal of 8-quinolinecarboxylic acid in an activated carbon cloth by electroadsorption
in aqueous solution. Chemosphere 144, 982–988.
https://doi.org/10.1016/j.chemosphere.2015.09.071
Lord, H.L., Zhan, W., Pawliszyn, J., 2012. Fundamentals and Applications of Needle Trap
Devices, Comprehensive Sampling and Sample Preparation: Analytical Techniques for
Scientists. Elsevier. https://doi.org/10.1016/B978-0-12-381373-2.10056-0
Lust, E., Jänes, A., Lust, K., Pullerits, R., 1997a. Adsorption of organic compounds and
hydrophilicity of bismuth, cadmium and antimony electrodes. J. Electroanal. Chem.
431, 183–201. https://doi.org/10.1016/S0022-0728(97)00150-2
Lust, E., Jänes, A., Lust, K., Väärtnõu, M., 1997b. Electric double layer structure and
adsorption of cyclohexanol on single crystal cadmium, antimony and bismuth
electrodes. Electrochim. Acta 42, 771–783. https://doi.org/10.1016/s0013-
4686(96)00339-8
Mantel, T., Jacki, E., Ernst, M., 2021. Electrosorptive removal of organic water constituents
by positively charged electrically conductive UF membranes. Water Res. 201, 117318.
https://doi.org/10.1016/j.watres.2021.117318
Marracino, J.M., Cœuret, F., Langlois, S., 1987. A first investigation of flow-through porous
electrodes made of metallic felts or foams. Electrochim. Acta 32, 1303–1309.
https://doi.org/10.1016/0013-4686(87)85059-4
Martinez-Huitle, C.A., Rodrigo, M.A., Sires, I., Scialdone, O., 2015. Single and coupled
electrochemical processes and reactors for the abatement of organic water pollutants: A
critical review. Chem. Rev. 115, 13362–13407.
https://doi.org/10.1021/acs.chemrev.5b00361
Matsuno, Y., Yoshida, K., Tsutsumi, A., 1996. Electrode electrodes performance of fixed
and fluidized bed carbonate. Int. J. Hydrog. energ 21.
McGuire, J., Dwiggins, C.F., Fedkiw, P.S., 1985. The electrosorption of phenol onto
activated carbon. J. Appl. Electrochem. 15, 53–62. https://doi.org/10.1007/BF00617740
McQuillan, R. V., Stevens, G.W., Mumford, K.A., 2018. The electrochemical regeneration
of granular activated carbons: A review. J. Hazard. Mater. 355, 34–49.
https://doi.org/10.1016/j.jhazmat.2018.04.079
Monteil, H., Péchaud, Y., Oturan, N., Oturan, M.A., 2019. A review on efficiency and cost
effectiveness of electro- and bio-electro-Fenton processes: Application to the treatment
of pharmaceutical pollutants in water. Chem. Eng. J. 376, 1–30.
https://doi.org/10.1016/j.cej.2018.07.179
Moreira, F.C., Boaventura, R.A.R., Brillas, E., Vilar, V.J.P., 2017. Electrochemical advanced
oxidation processes: A review on their application to synthetic and real wastewaters.
Appl. Catal. B Environ. 202, 217–261. https://doi.org/10.1016/j.apcatb.2016.08.037
Mousset, E., 2020. Unprecedented reactive electro-mixing reactor: Towards synergy between
micro- and macro-reactors? Electrochem. commun. 118, 106787.
https://doi.org/10.1016/j.elecom.2020.106787
Mousset, E., Dionysiou, D.D., 2020a. Photoelectrochemical reactors for treatment of water
and wastewater: a review. Environ. Chem. Lett. https://doi.org/10.1007/s10311-020-

Chapter I Bibliography
74
01014-9
Mousset, E., Doudrick, K., 2020b. A review of electrochemical reduction processes to treat
oxidized contaminants in water. Curr. Opin. Electrochem. 22, 221–227.
https://doi.org/10.1016/j.coelec.2020.07.008
Mousset, E., Ko, Z.T., Syafiq, M., Wang, Z., Lefebvre, O., 2016a. Electrocatalytic activity
enhancement of a graphene ink-coated carbon cloth cathode for oxidative treatment.
Electrochim. Acta. https://doi.org/http://dx.doi.org/10.1016/j.electacta.2016.11.151
Mousset, E., Loh, W.H., Lim, W.S., Jarry, L., Wang, Z., Lefebvre, O., 2021a. Cost
comparison of advanced oxidation processes for wastewater treatment using
accumulated oxygen-equivalent criteria. Water Res. 200, 117234.
https://doi.org/https://doi.org/10.1016/j.electacta.2021.138466
Mousset, E., Oturan, N., Oturan, M.A., 2018a. An unprecedented route of OH radical
reactivity evidenced by an electrocatalytical process: Ipso-substitution with
perhalogenocarbon compounds. Appl. Catal. B Environ. 226, 135–146.
https://doi.org/10.1016/j.apcatb.2017.12.028
Mousset, E., Pechaud, Y., Oturan, N., Oturan, M.A., 2019a. Charge transfer/mass transport
competition in advanced hybrid electrocatalytic wastewater treatment: Development of
a new current efficiency relation. Appl. Catal. B Environ. 240, 102–111.
https://doi.org/10.1016/j.apcatb.2018.08.055
Mousset, E., Pontvianne, S., Pons, M.-N., 2018b. Fate of inorganic nitrogen species under
homogeneous Fenton combined with electro-oxidation/reduction treatments in synthetic
solutions and reclaimed municipal wastewater. Chemosphere 201, 6–12.
https://doi.org/10.1016/j.chemosphere.2018.02.142
Mousset, E., Puce, M., Pons, M.N., 2019b. Advanced electro-oxidation with boron-doped
diamond for acetaminophen removal from real wastewater in a microfluidic reactor:
Kinetics and mass-transfer studies. ChemElectroChem 6, 2908–2916.
https://doi.org/10.1002/celc.201900182
Mousset, E., Quackenbush, L., Schondek, C., Gerardin-Vergne, A., Pontvianne, S., Kmiotek,
S., Pons, M.N., 2020. Effect of homogeneous Fenton combined with electron transfer
on the fate of inorganic chlorinated species in synthetic and reclaimed municipal
wastewater. Electrochim. Acta 334, 135608.
https://doi.org/10.1016/j.electacta.2019.135608
Mousset, E., Trellu, C., Olvera-Vargas, H., Pechaud, Y., Fourcade, F., Oturan, M.A., 2021b.
Electrochemical technologies coupled with biological treatments. Curr. Opin.
Electrochem. 26, 100668. https://doi.org/https://doi.org/10.1016/j.coelec.2020.100668
Mousset, E., Wang, Z., Hammaker, J., Lefebvre, O., 2017. Electrocatalytic phenol
degradation by a novel nanostructured carbon fiber brush cathode coated with graphene
ink. Electrochim. Acta 258, 607–617. https://doi.org/10.1016/j.electacta.2017.11.104
Mousset, E., Wang, Z., Hammaker, J., Lefebvre, O., 2016b. Physico-chemical properties of
pristine graphene and its performance as electrode material for electro-Fenton treatment
of wastewater. Electrochim. Acta 214, 217–230.
https://doi.org/10.1016/j.electacta.2016.08.002
Mousset, E., Wang, Z., Olvera-Vargas, H., Lefebvre, O., 2018c. Advanced electrocatalytic
pre-treatment to improve the biodegradability of real wastewater from the electronics
industry — A detailed investigation study. J. Hazard. Mater. 360, 552–559.
https://doi.org/10.1016/j.jhazmat.2018.08.023
Nainamalai, M., Palani, M., Soundarajan, B., Allwin, A.E., 2018. Decolorization of synthetic
dye wastewater using packed bed electro-adsorption column. Chem. Eng. Process. -

Chapter I Bibliography
75
Process Intensif. 130, 160–168. https://doi.org/10.1016/j.cep.2018.06.013
Nan, X., Lavrni, S., Toscano, A., 2020. Potential of constructed wetland treatment systems
for agricultural wastewater reuse under the EU framework. J. Environ. Manage. 275.
https://doi.org/10.1016/j.jenvman.2020.111219
Newman, J., 1968. Engineering design of electrochemical systems. Ind. Eng. Chem. 60, 12–
27. https://doi.org/10.1021/ie50700a005
Newman, J.S., Tobias, C.W., 1962. Theoretical analysis of current distribution in porous
electrodes. J. Electrochem. Soc. 109, 1183. https://doi.org/10.1149/1.2425269
Nidheesh, P. V., Divyapriya, G., Oturan, N., Trellu, C., Oturan, M.A., 2019. Environmental
applications of boron-doped diamond electrodes: 1. Applications in water and
wastewater treatment. ChemElectroChem 6, 1–20.
https://doi.org/10.1002/celc.201801876
Nie, C., Dai, Z., Meng, H., Duan, X., Qin, Y., Zhou, Y., Ao, Z., Wang, S., An, T., 2019.
Peroxydisulfate activation by positively polarized carbocatalyst for enhanced removal
of aqueous organic pollutants. Water Res. 166, 115043.
https://doi.org/10.1016/j.watres.2019.115043
Niu, J., Conway, B.E., 2003. Adsorption of organics onto an high-area C-cloth electrode
from organic solvents and organic solvent/water mixtures. J. Electroanal. Chem. 546,
59–72. https://doi.org/10.1016/S0022-0728(03)00146-3
Norra, G.F., Radjenovic, J., 2021. Removal of persistent organic contaminants from
wastewater using a hybrid electrochemical-granular activated carbon (GAC) system. J.
Hazard. Mater. 415, 125557. https://doi.org/10.1016/j.jhazmat.2021.125557
Oleinick, A., Svir, I., Amatore, C., 2019. A few key theoretical issues of importance in
modern molecular electrochemistry. Curr. Opin. Electrochem. 13, 33–39.
https://doi.org/10.1016/j.coelec.2018.10.008
Oller, I., Malato, S., Sánchez-Pérez, J.A., 2011. Combination of advanced oxidation
processes and biological treatments for wastewater decontamination-A review. Sci.
Total Environ. 409, 4141–4166. https://doi.org/10.1016/j.scitotenv.2010.08.061
Panizza, M., Cerisola, G., 2009. Direct and mediated anodic oxidation of organic pollutants.
Chem. Rev. 109, 6541–6569. https://doi.org/10.1021/cr9001319
Panizza, M., Michaud, P.A., Cerisola, G., Comninellis, C., 2001. Anodic oxidation of 2-
naphthol at boron-doped diamond electrodes. J. Electroanal. Chem. 507, 206–214.
https://doi.org/10.1016/S0022-0728(01)00398-9
Pazos, M., Rosales, E., Sanrom, M.A., 2021. Electro-reversible adsorption as a versatile tool
for the removal of diclofenac from wastewater 280.
https://doi.org/10.1016/j.chemosphere.2021.130778
Peng, H., Guo, J., 2020. Removal of chromium from wastewater by membrane filtration,
chemical precipitation, ion exchange, adsorption electrocoagulation, electrochemical
reduction, electrodialysis, electrodeionization, photocatalysis and nanotechnology: a
review. Environ. Chem. Lett. 18, 2055–2068. https://doi.org/10.1007/s10311-020-
01058-x
Piai, L., Dykstra, J.E., Adishakti, M.G., Blokland, M., Langenhoff, A.A.M., van der Wal, A.,
2019. Diffusion of hydrophilic organic micropollutants in granular activated carbon
with different pore sizes. Water Res. 162, 518–527.
https://doi.org/10.1016/j.watres.2019.06.012
Pilon, L., Wang, H., D’Entremont, A., 2015. Recent advances in continuum modeling of
interfacial and transport phenomena in electric double layer capacitors. J. Electrochem.
Soc. 162, A5158–A5178. https://doi.org/10.1149/2.0211505jes

Chapter I Bibliography
76
Plaisance, H., Mocho, P., Bonnecaze, G., 1996. Adsorption et electrosorption de benzene sur
charbon actif en grains adsorption and electrosorption of benzene on granular activated
carbon. Environ. Technol. 17, 1313–1325. https://doi.org/10.1080/09593331708616501
Pletcher, D., Walsh, F.C., 1993. Industrial electrochemistry, Springer netherlands.
https://doi.org/10.1007/978-94-011-2154-5
Pletcher, D., Walsh, F.C., 1982. Industrial electrochemistry, 1st Ed. ed. Chapman and Hall,
London. https://doi.org/10.1179/bcj.1983.18.2.70
Rezakazemi, M., Maghami, M., Mohammadi, T., 2018. High loaded synthetic hazardous
wastewater treatment using lab- scale submerged ceramic membrane bioreactor. Period.
Polytech. Chem. Eng. 62, 299–304.
Rizzo, L., Gernjak, W., Krzeminski, P., Malato, S., McArdell, C.S., Perez, J.A.S., Schaar, H.,
Fatta-Kassinos, D., 2020. Best available technologies and treatment trains to address
current challenges in urban wastewater reuse for irrigation of crops in EU countries. Sci.
Total Environ. 710, 136312. https://doi.org/10.1016/j.scitotenv.2019.136312
Rong, C., Xien, H., 2009. Reversible electrosorption of thiocyanate anions by active carbon
felt. Sep. Sci. Technol. 44, 3984–3999. https://doi.org/10.1080/01496390903182453
Rong, C., Xien, H., 2005. Electrosorption of thiocyanate anions on active carbon felt
electrode in dilute solution. J. Colloid Interface Sci. 290, 190–195.
https://doi.org/10.1016/j.jcis.2005.04.022
Sahin, E.M., Tongur, T., Ayranci, E., 2020. Removal of azo dyes from aqueous solutions by
adsorption and electrosorption as monitored with in-situ UV-visible spectroscopy. Sep.
Sci. Technol. 55, 3287–3298. https://doi.org/10.1080/01496395.2019.1676786
Sarkar, A., Paul, B., 2016. The global menace of arsenic and its conventional remediation -
A critical review. Chemosphere 158, 37–49.
https://doi.org/10.1016/j.chemosphere.2016.05.043
Schmickler, W., 2020. Double layer theory. J. solid state Electrochem. 24, 2175–2176.
https://doi.org/10.1007/s10008-020-04597-z
Schmickler, W., 1996. Electronic effects in the electric double layer. Chem. Rev. 96, 3177–
3200. https://doi.org/10.1021/cr940408c
Schultze, J.W., Vetter, K.J., 1973. Experimental determination and interpretation of the
electrosorption valency gamma. Electroanal. Chem. interfacial Electrochem. 44, 63–81.
Sene, A., Daffos, B., Taberna, P.L., Simon, P., 2019. Characterization of the mass transfer
fluxes in a capacitive desalination cell by using FeIII(CN)63−
/FeII(CN)64−
redox couple
as an electrochemical probe. J. Electroanal. Chem. 842, 127–132.
https://doi.org/10.1016/j.jelechem.2019.04.060
Simon, P., Gogotsi, Y., 2008. Materials for electrochemical capacitors. Nat. Mater. 7, 845–
854.
Stenina, E. V., Sviridova, L.N., Damaskin, B.B., 2009. Comparison of temperature
dependences of adsorption parameters for secondary butanol and 1-oxyadamantane at
their adsorption on the Hg electrode/aqueous solution interface. Russ. J. Electrochem.
45, 847–854. https://doi.org/10.1134/S1023193509080023
Stenina, E. V, Baturina, O.A., Sviridova, L.N., Damaskin, B.B., 2001. Coadsorption of
halide anions and 1-adamantanol molecules on a mercury electrode. Russ. J.
Electrochem. 37, 931–938.
Stern, O., 1924. Zur Theorie der Elektrolytischen Doppelschicht. Zeitschrift fur
Elektrochemie 30, 508–516.
Storck, A., Vergnes, F., Le Goff, P., 1975. Transfert de matière entre un électrolyte et une
paroi cylindrique immergée dans un lit fixe ou fluidisé de grains isolants. Powder

Chapter I Bibliography
77
Technol. 12, 215–223.
Strohl, J.H., Dunlap, K.L., 1972. Electrosorption and separation of quinones on a column of
graphite particles. Anal. Chem. 44, 2166–2170. https://doi.org/10.1021/ac60321a012
Su, S.X., Hatton, T.A., 2017. As featured in: Electrosorption at functional interfaces : from
molecular-level interactions to electrochemical. Phys. Chem. Chem. Phys. 19, 23570–
23584. https://doi.org/10.1039/C7CP02822A
Su, S.X., Hatton, T.A., 2016. Electrosorption 1. Kirk-Othmer Encycl. Chem. Technol. 1–11.
https://doi.org/10.1002/0471238961.koe00022
Sun, X.-F., Guo, B.-B., He, L., Xia, P.-F., Shu-Guang Wang, 2016. Electrically accelerated
removal of organic pollutants by a three-dimensional graphene aaerogel. AIChE J. 59,
215–228. https://doi.org/10.1002/aic
Tran, H.N., You, S.J., Hosseini-Bandegharaei, A., Chao, H.P., 2017. Mistakes and
inconsistencies regarding adsorption of contaminants from aqueous solutions: A critical
review. Water Res. 120, 88–116. https://doi.org/10.1016/j.watres.2017.04.014
Trasatti, S., 1992. Adsorption of organic substances at electrodes: Recent advances.
Electrochim. Acta 37, 2137–2144. https://doi.org/10.1016/0013-4686(92)85104-S
Trasatti, S., 1972. Work function, electronegativity, and electrochemical behaviour of metals.
III. Electrolytic hydrogen evolution in acid solutions. J. Electroanal. Chem. 39, 163–
184. https://doi.org/10.1016/S0022-0728(72)80485-6
Trellu, C., Olvera Vargas, H., Mousset, E., Oturan, N., Oturan, M.A., 2021. Electrochemical
technologies for the treatment of pesticides. Curr. Opin. Electrochem. 26, 100677.
https://doi.org/10.1016/j.coelec.2020.100677
UNESCO, 2019. The United Nations world water development report 2019: leaving no one
behind. UN Educ. Sci. Cult. Organ.
Vafakhah, S., Beiramzadeh, Z., Saeedikhani, M., Ying, H., 2020. A review on free-standing
electrodes for energy-e ff ective desalination: Recent advances and perspectives in
capacitive deionization. Desalination 493, 114662.
https://doi.org/10.1016/j.desal.2020.114662
Varley, C.F., 1871. Polarization of metallic surfaces in aqueous solutions. On a new method
of obtaining electricity from mechanical force, and certain relations between
electrostatic induction and the decomposition of water. Philos. Trans. R. Soc. London
161, 129–136. https://doi.org/10.1098/rstl.1871.0008
Vetter, K.J., Schultze, J.W., 1974. General aspects of the electrosorption valency.
Electroanal. Chem. Interfacial Electrochem. 53, 67–76.
Vilar, E.O., Cœuret, F., 1999. Détermination électrochimique du nombre de sherwood
minimum pour un milieu macro-poreux (fritté - Lit fixe de grains). Can. J. Chem. Eng.
77, 855–862. https://doi.org/10.1002/cjce.5450770510
Volfkovich, Y.M., 2020. Capacitive deionization of water (a review). Russ. J. Electrochem.
56, 18–51. https://doi.org/10.1134/S1023193520010097
Wadhawan, S., Jain, A., Nayyar, J., Kumar, S., 2020. Journal of water process engineering
role of nanomaterials as adsorbents in heavy metal ion removal from waste water: a
review. J. water Process Eng. 33, 101038. https://doi.org/10.1016/j.jwpe.2019.101038
Waegele, M.M., Gunathunge, C.M., Li, J., Li, X., 2019. How cations affect the electric
double layer and the rates and selectivity of electrocatalytic processes. J. Chem. Phys.
151, 1DUMMT. https://doi.org/10.1063/1.5124878
Wagner, C., 1951. Theoretical analysis of the current density distribution in electrolytic cells.
J. Electrochem. Soc. 98, 116. https://doi.org/10.1149/1.2778113
Wang, S., Deng, A.N., Wei, J., Guo, Z., Zhang, N., Guo, Z.Y., 2012. Electrosorption-

Chapter I Bibliography
78
enhanced micro-column solid-phase extraction of traces of cresol red in water using
electrodes of stainless steel wire coated with non-conductive polymer. Adsorpt. Sci.
Technol. 30, 241–253. https://doi.org/10.1260/0263-6174.30.3.241
Wang, Yujing, Zhao, H., Chai, S., Wang, Yabo, Zhao, G., Li, D., 2013. Electrosorption
enhanced electro-Fenton process for efficient mineralization of imidacloprid based on
mixed-valence iron oxide composite cathode at neutral pH. Chem. Eng. J. 223, 524–
535. https://doi.org/10.1016/j.cej.2013.03.016
Xu, F., Chang, L., Duan, X., Bai, W., Sui, X., Zhao, X., 2019. A novel layer-by-layer
CNT/PbO2 anode for high-efficiency removal of PCP-Na through combining
adsorption/electrosorption and electrocatalysis. Electrochim. Acta 300, 53–66.
https://doi.org/10.1016/j.electacta.2019.01.090
Xu, S., Jin, Y., Li, R., Shan, M., Zhang, Y., 2021. Amidoxime modified polymers of intrinsic
microporosity/alginate composite hydrogel beads for efficient adsorption of cationic
dyes from aqueous solution. J. Colloid Interface Sci.
https://doi.org/10.1016/j.jcis.2021.08.157
Yan, J.W., Tian, Z.Q., Mao, B.W., 2017. Molecular-level understanding of electric double
layer in ionic liquids. Curr. Opin. Electrochem. 4, 105–111.
https://doi.org/10.1016/j.coelec.2017.09.008
Yang, W., Zhou, M., Ma, L., 2021. A continuous flow-through system with integration of
electrosorption and peroxi-coagulation for efficient removal of organics. Chemosphere
274, 129983. https://doi.org/10.1016/j.chemosphere.2021.129983
Yao, C., Zhang, W., Xu, L., Cheng, M., Su, Y., Xue, J., Liu, J., 2021. A facile synthesis of
porous MXene-based freestanding film and its spectacular electrosorption performance
for organic dyes. Sep. Purif. Technol. 263, 118365.
https://doi.org/10.1016/j.seppur.2021.118365
Yue, F., Zhang, Q., Xu, L., Zheng, Y., Yao, C., Jia, J., Leng, W., Hou, S., 2019. Porous
reduced graphene oxide/single-walled carbon nanotube film as freestanding and flexible
electrode materials for electrosorption of organic dye. ACS Appl. nano Mater. 2, 6258–
6267. https://doi.org/10.1021/acsanm.9b01236
Zabasajja, J., Savinell, R.F., 1989. Electrosorption of n‐alcohols on graphite particles. AIChE
J. 35, 755–763. https://doi.org/10.1002/aic.690350507
Zaharaddeen S. Iro, Subramani, C., Dash, S.S., 2016. A brief review on electrode materials
for supercapacitor. Int. J. Electrochem. Sci. 11, 10628–10643.
https://doi.org/10.20964/2016.12.50
Zhang, C., He, D., Ma, J., Tang, W., Waite, T.D., 2018. Faradaic reactions in capacitive
deionization (CDI) - problems and possibilities: A review 128, 314–330.
https://doi.org/10.1016/j.watres.2017.10.024
Zhang, W., Liu, N., Cao, Y., Lin, X., Liu, Y., Feng, L., 2017. Superwetting porous materials
for wastewater treatment: from immiscible oil / water mixture to emulsion separation.
Adv. Mater. interfaces 4(10). https://doi.org/10.1002/admi.201700029
Zheng, Y., Cheng, B., Fan, J., Yu, J., Ho, W., 2021. Review on nickel-based adsorption
materials for Congo red. J. Hazard. Mater. 403, 123559.
https://doi.org/10.1016/j.jhazmat.2020.123559

79
Part II: Materials and Methods

Part II Material and Methods
80
1. Adsorption
1.1.Sample collection and characterization
OMWW was sampled from modern and traditional oil mills (Fig. 16.) located in the
region of Marrakech in Morocco. The olive oil extraction season was from December to
March during 2019/2020 and 2020/2021 campaigns. The collected samples were subjected to
various physicochemical analyses according to the analysis methods as indicated in Table 7.
The pH, temperature, total dissolved solids, salinity and electrical conductivity, were
measured by a Hanna HI 9829 probe (Kallang Road, Singapore). The COD suspended matter
and volatile matter in suspension, ammonium, total phosphorus and orthophosphates were
analyzed according to AFNOR standards. The PCs were measured using the Folin-Ciocalteu
method (Singleton & Rossi, 1965) using caffeic acid as a standard.
Fig. 16. Images of modern (a) and traditional (b) oil mills, OMWW (c) and olive pomace (d).

Part II Material and Methods
81
Table 7. Standard methods for determining physicochemical parameters.
Parameters Method
pH, temperature, total dissolved solids,
salinity, electrical conductivity Measured by a probe Hanna HI 9829 (Kallang Road,
Singapore) COD A dichromate open reflux method measures the
amount of oxygen required to oxidize the organic
matter in the sample by a redox reaction, AFNOR
T90-101. Suspended matter and volatile matter in
suspension Filtration method on filter, AFNOR T90-105.
Nitrite Colorimetric determination of nitrite ions, AFNOR
T90-013. Ammonium Ammonium ions react with phenol and hypochlorite.
In alkaline medium, the indophenol blue is
determined spectrophotometrically, AFNOR T90-015. Total phosphorus and ortho-phosphates Spectrometric methods of phosphorus present in water
in various forms from concentrations expressed as
phosphorus (P), greater than 0.01 mg L-1
, AFNOR
T90-023 PCs Folin-Ciocalteu colorimetric method (Singleton &
Rossi, 1965) using caffeic acid as standard.
1.2.Preparation of activated carbon
The olive pomace was collected from modern oil mills located in the region of
Marrakech in Morocco. It was dried at 105°C overnight and then ground to a coarse
aggregate. The activation process was performed using chemical activation. Ten grams of
precursor (olive pomace) was physically mixed with 5 M sodium hydroxide (98-100.5%
purity, Sigma-Aldrich) at a weight ratio (activator/precursor) of 1:1 for AC powder and 1: 1;
2: 1; 3: 1; 5: 1 for GAC by stirring for 1 h. Then, the material was thoroughly washed and
filtered using deionized ultrapure water until a pH of 7.0 was obtained. Finally, the material
was placed in a furnace at room temperature. The adsorbent was heated to 700°C with a
temperature increase rate of 10°C per minute. The material was then kept in the furnace
(SF7/S Stuart, United Kingdom) at 700°C for 30 min.
The GAC obtained with different mass ratios (activator/precursor) was tested as an
adsorbent for PC, and the greatest mass ratio (activator/precursor) was determined.
1.3.Preparation of the beads
Composite beads (sodium alginate (SA)-AC) were prepared via the crosslinking
process (Fig. 17). The process for preparing the composite beads consisted of first producing

Part II Material and Methods
82
a primary mixture of the hydrogel of sodium alginate (BioChemica) (1%) at 60°C. Next, the
AC powder (1%) was added to the alginate hydrogel under constant stirring to prepare a
homogeneous dispersion (24 h). In the second step, the secondary mixture was poured
dropwise into a crosslinking iron solution at 20 g L-1
(iron (III) chloride hexahydrate, 99%,
ACROS Organics). Bead solidification was performed for 24 h. Finally, the aggregated SA-
AC beads were thoroughly washed with ultrapure water and stored in ultrapure water.
.
Fig. 17. Schematic representation of the SA-AC beads preparation.
1.4.Characterization of beads and GAC
FTIR was used to assess the functional groups on the surface of the AC, beads and
GAC. The FTIR spectra were obtained by ALPHA FT-IR Spectrometer (ALPHA-P,
Germany) in the wave number range of 400 to 4,000 cm−1
. Each spectrogram consisted of an
average of 60 scans.
Morphological examination of the SA-AC beads and GAC was performed using
SEM measurements taken with a TESCAN™ VEGA3 scanning electron microscope (Fuveau,
France). An EDS analyzer (TEAM™ EDS) enabled the analysis of elements on the micro-
scale and element distribution on the SA-AC beads and GAC. In addition, the BET method
was used to calculate the specific surface area (SBET) and the total volume (VT) of AC and SA-
AC beads that had been previously outgassed and assessed by nitrogen adsorption at −196°C
(via a Micromeritics ASAP 2020 surface analyzer system).
The average pore radius (r-) was calculated from Eq. 8 (Lawal et al., 2020):
𝑟−(𝑛𝑚) =2𝑉𝑇
𝑆𝐵𝐸𝑇
× 103 (8)
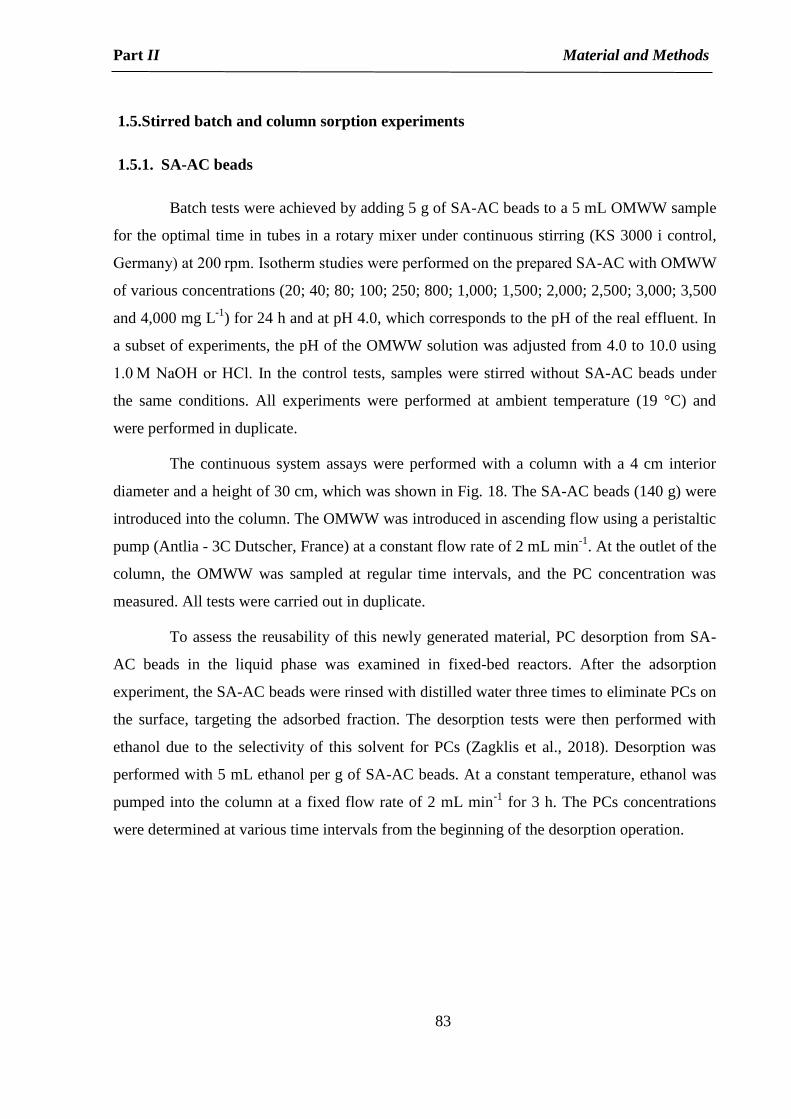
Part II Material and Methods
83
1.5.Stirred batch and column sorption experiments
1.5.1. SA-AC beads
Batch tests were achieved by adding 5 g of SA-AC beads to a 5 mL OMWW sample
for the optimal time in tubes in a rotary mixer under continuous stirring (KS 3000 i control,
Germany) at 200 rpm. Isotherm studies were performed on the prepared SA-AC with OMWW
of various concentrations (20; 40; 80; 100; 250; 800; 1,000; 1,500; 2,000; 2,500; 3,000; 3,500
and 4,000 mg L-1
) for 24 h and at pH 4.0, which corresponds to the pH of the real effluent. In
a subset of experiments, the pH of the OMWW solution was adjusted from 4.0 to 10.0 using
1.0 M NaOH or HCl. In the control tests, samples were stirred without SA-AC beads under
the same conditions. All experiments were performed at ambient temperature (19 °C) and
were performed in duplicate.
The continuous system assays were performed with a column with a 4 cm interior
diameter and a height of 30 cm, which was shown in Fig. 18. The SA-AC beads (140 g) were
introduced into the column. The OMWW was introduced in ascending flow using a peristaltic
pump (Antlia - 3C Dutscher, France) at a constant flow rate of 2 mL min-1
. At the outlet of the
column, the OMWW was sampled at regular time intervals, and the PC concentration was
measured. All tests were carried out in duplicate.
To assess the reusability of this newly generated material, PC desorption from SA-
AC beads in the liquid phase was examined in fixed-bed reactors. After the adsorption
experiment, the SA-AC beads were rinsed with distilled water three times to eliminate PCs on
the surface, targeting the adsorbed fraction. The desorption tests were then performed with
ethanol due to the selectivity of this solvent for PCs (Zagklis et al., 2018). Desorption was
performed with 5 mL ethanol per g of SA-AC beads. At a constant temperature, ethanol was
pumped into the column at a fixed flow rate of 2 mL min-1
for 3 h. The PCs concentrations
were determined at various time intervals from the beginning of the desorption operation.

Part II Material and Methods
84
Fig. 18. Fixed-bed adsorption setup.
1.5.2. Granular activated carbon
Batch experiments were performed by adding 5 g of GAC into 5 mL of OMWW
sample for an optimized time in tubes under continuous stirring in a rotary mixer (KS 3000 i
control, Germany) at 200 rpm. The isotherm studies were done on the prepared GAC with
OMWW of various concentrations (20; 50; 100; 250; 1,000; 2,000; 3,000; 4,000 and 5,000
mg L-1
) for 24 h and at pH 4, corresponds to the pH of real effluent. In a subset of
experiments, the pH of the OMWW solution was adjusted from 2 to 6 using 1.0 M HCl or
NaOH. Control tests, in which samples were stirred without GAC, were performed in the
same conditions. All experiments were carried out at ambient temperature (between 20 °C and
25 °C) and were performed in duplicate.
A 1 cm diameter and 10, 15 or 20 cm height column filled with GAC (3, 4.5 and 6 g)
was used in this study. The OMWW was introduced in ascending flow using a peristaltic
pump (Antlia - 3C Dutscher, France), applying a constant flow rate of 0.5, 0.8 or 1.5 mL min-

Part II Material and Methods
85
1. The OMWW at the column outlet was collected at regular time intervals, and the PCs'
concentrations were measured. All experiments were performed in duplicate.
In order to assess the reusability of GAC, the PCs desorption from the GAC in the
liquid phase was examined in batch and fixed-bed reactors. In batch mode, the desorption
experiments were carried out with distilled water, ethanol or a mixture of methanol and
ethanol (1V/1V) and HCl (0.05 M) due to the selectivity of these solvents for PCs. The
desorption experiments were carried out in a fixed-bed device with the most efficient solvent
determined in batch. The desorption has been done with 5 mL of solvents per g of GAC.
From the start of the desorption process, samples were collected at different time intervals,
and the PCs' concentrations were determined.
1.6.Batch and fixed-bed column data analysis
To understand and explain the adsorption process of PCs onto beads and GAC,
Langmuir and Freundlich's adsorption isotherm models were presented in this study,
according to many references (Badawi et al., 2017; Olusegun et al., 2018; Es-Sahbany et al.,
2019). Therefore, these two models are considered compatible with describing the sorption
phenomena.
The Langmuir isotherm equation (Eq. 9) shows an adsorption model of a
homogeneous system with a single layer and it is expressed as follows (Langmuir, 1916):
𝐶𝑒
𝑞𝑒=
1
𝐾𝐿×𝑞𝑚+
𝐶𝑒
𝑞𝑚 (9)
where qe (mg g-1
) is the PCs amount adsorbed at equilibrium, KL is the Langmuir constant
related to the energy of adsorption (L g-1
) and qm (mg g-1
) is the maximum PCs adsorption
capacity.
The Freundlich adsorption isotherm model is applied for multiple layer adsorption
founded on a heterogeneous process. The Freundlich adsorption isotherm equation (Eq. 10) is
given as follows (Freundlich, 1906):
𝑙𝑛 𝑞𝑒 = 𝑙𝑛 𝐾𝑓 +1
𝑛× 𝑙𝑛 𝐶𝑒 (10)

Part II Material and Methods
86
where Kf is a Freundlich constant that presents the adsorption capacity of the adsorbent and n
is a constant that presents the greatness of the relationship between PCs and SA-AC beads or
GAC.
Two kinetic models were investigated to further explain the elimination process of
PCs onto SA-AC beads and GAC. The adsorption kinetics data have been compared with the
pseudo-first-order and pseudo-second-order rate equations; according to many references,
these two models are used to define the sorption mechanisms (Lagergren, 1898; Ho &
McKay, 1999) (Eqs. 11 and 12):
𝑙𝑜𝑔 (𝑞𝑒 − 𝑞𝑡) = 𝑙𝑜𝑔 (𝑞𝑒) −𝐾1
𝐼𝐼.303× 𝑡 (11)
𝑡
𝑞𝑡=
1
𝐾2×𝑞𝑒2 +
𝑡
𝑞𝑒
𝑡
𝑞𝑡=
1
𝐾2𝑞𝑒2
+𝑡
𝑞𝑒 (12)
where qe and qt are the amounts of PCs adsorption onto SA-AC beads or GAC at equilibrium
and time t, respectively, and k1 and k2 are the pseudo-first-order and pseudo-second-order rate
constants, respectively.
A temperature study on the adsorption of PCs on alginate beads and GAC at various
temperatures (19-35°C) was performed. The thermodynamic parameters, i.e., the Gibbs
energy (Δ𝐺 in kJ mol-1
), standard entropy (ΔS in J mol-1
K-1
) change, and standard enthalpy
(Δ𝐻 in kJ mol-1
) change, of the adsorption process were calculated from the following
equations (Eqs. 13-15) (Li et al., 2019):
∆𝐺 = −𝑅 × 𝑇 × 𝑙𝑛 𝐾𝑐 (13)
∆𝐺 = ∆𝐻 − 𝑇 × ∆𝑆 (14)
𝑙𝑛𝐾𝑐 = −∆𝐻
𝑅×𝑇+
∆𝑆
𝑅 (15)
where 𝐾𝑐 is the thermodynamic distribution coefficient calculated using Eq. 16:
𝐾𝑐 =𝑞𝑒
𝐶𝑒 (16)
The values of the important design parameters of the breakthrough curves of the
column for PCs adsorption onto the SA-AC beads were calculated. The volume of the effluent
(Vef) (mL), was calculated using the following equation (Eq. 17):
𝑉𝑒𝑓 = 𝑄 × 𝑡𝑡𝑜𝑡𝑎𝑙 (17)

Part II Material and Methods
87
where ttotal is the total time (min) and Qv is the flow rate circulating through the column (mL
min-1
).
The peak area of the breakthrough curve signifies the total mass of PCs biosorbed,
qtotal (mg), for a specific feed concentration and flow rate and can be calculated by integration
as follows (Eq. 18):
𝑞𝑡𝑜𝑡𝑎𝑙 =𝑄𝑣
1000× ∫ 𝐶𝑅 × 𝑑𝑡
𝑡𝑡𝑜𝑡𝑎𝑙
0 (18)
where CR is the concentration of PCs removal (mg L-1
).
The total amount of PCs sent to the column (mg) can be determined from Eq. (19):
𝑚𝑡𝑜𝑡 =𝐶𝑖×𝑄𝑣×𝑡𝑡𝑜𝑡𝑎𝑙
1000 (19)
The total PC removal efficiency (%) can be determined from the ratio of PCs mass
adsorbed (qtotal) to the total amount of PCs sent to the column (mtotal) (Eq. 20):
%𝑅 =𝑞𝑡𝑜𝑡𝑎𝑙
𝑚𝑡𝑜𝑡𝑎𝑙× 100 (20)
The amount of PCs adsorbed at equilibrium or adsorption capacity (qe) (mg of
adsorbed PCs/g of SA-AC beads), and the equilibrium PCs concentration (Ce) (mg L-1
), can
be determined from Eqs. 21 and 22:
𝑞𝑒 =𝑞𝑡𝑜𝑡𝑎𝑙
𝑚 (21)
𝐶𝑒 =𝑚𝑡𝑜𝑡𝑎𝑙−𝑞𝑡𝑜𝑡𝑎𝑙
𝑉𝑒𝑓× 1000 (22)
where mtotal is the amount of PCs sent to the column (g) and Vef (mL) is the volume of the
effluent.
The dynamic behavior of the column is approached by the following models:
Thomas and Yoon-Nelson.
Thomas model
The Thomas model is one of the most extensively used breakthrough models in
fixed-bed column performance theory. It assumes Langmuir kinetics for adsorption and
desorption with no axial dispersion. The model can be presented using Eq. 23 (Thomas,
1944):

Part II Material and Methods
88
𝐶
𝐶0=
1
1+𝑒𝑥𝑝 (𝐾𝑇𝐻×𝑞0×𝑚
𝑄−𝐾𝑇𝐻×𝐶0×𝑡)
(23)
where kTH (mL min-1
mg-1
) is the Thomas rate constant, q0 (mg g-1
) is the adsorption capacity,
m total amount of PCs sent to the column (g), and Q is the flow rate that circulates through the
column (mL min-1
).
Yoon-Nelson model
The Yoon-Nelson model (Eq. 24) involves no detailed data about the physical
properties of the adsorbent in the fixed-bed column (Yoon & Nelson, 1984):
𝐶
𝐶0=
𝑒𝑥𝑝 (𝐾𝑌𝑁×𝑡−𝜏×𝐾𝑌𝑁)
1+𝑒𝑥𝑝 (𝐾𝑌𝑁×𝑡−𝜏×𝐾𝑌𝑁) (24)
where 𝜏 is the time required for 50% adsorbate breakthrough (min) and kYN is a rate constant
that is related to the diffusion characteristics of the mass transfer zone (min-1
).
The fittings of the models with experimental results were evaluated with the mean
absolute error (MAE) and the root-mean-square error (RMSE) as written in Eq. 25 and Eq.
26, respectively:
𝑀𝐴𝐸 = ∑ |𝑦𝑖− 𝑦𝑖
′|𝐾𝑖=1
𝐾 (25)
𝑅𝑀𝑆𝐸 = √∑ (𝑦𝑖− 𝑦𝑖′)
2𝐾𝑖=1
𝐾 (26)
where 𝑦𝑖′ the experimental value, 𝑦𝑖 the model value and K is the number of iterated values.
The lower the MAE and RMSE value are, the more suitable the model.
1.7.Analytical methods
The phenolic extracts were analyzed by high-performance liquid chromatography
(HPLC). A Knauer-HPLC chromatography equipped with a diode array detector was used for
processing the data. The column had a reversed-phase polarity (Eurospher II 100-5 C-18,
250×4.6). The mobile phase was a gradient of acetonitrile and bidistilled water acidified to pH
2.6 with O-phosphoric acid. The separation lasted 1 h according to a linear gradient program
of acetonitrile/water and was performed at a temperature of 25°C, a pressure of 400 bar and a
flow rate of 1 mL min-1
.

Part II Material and Methods
89
2. Electrosorption
2.1. Effluents preparation and characterization
The simulated OMWW was prepared using potassium chloride (KCl) (6 g L-1
) and
phenol (4 g L-1
) adjusted to pH 4 using hydrochloric acid (HCl) (Sigma Aldrich, Saint-
Quentin-Fallavier, France), which was representative of the average characteristics in actual
OMWW (Lissaneddine et al., 2021a). The phenol content was determined by UV-visible
spectrophotometry (Shimadzu UV-2600 spectrophotometer) at the maximum absorption
wavelength of 269 nm (Adebayo & Areo, 2021). In the case of the influence of the properties
of PCs (Part III, sub-chapter II.II), other PCs were studied such as gallic acid (4,000 mg L-1
),
caffeic acid (500 mg L-1
), coumaric acid (500 mg L-1
) and quercetin (60 mg L-1
), and they
were also quantified by UV-visible spectrophotometry.
The real OMWW was collected from modern oil mills located in the region of
Marrakech in Morocco during the olive oil extraction season from December to March during
the 2019/2020 and 2020/2021 campaigns, during which the main products were PCs
(Lissaneddine et al., 2021a). Meta-phosphoric acid, petroleum ether, ethyl acetate and
methanol (Sigma Aldrich, Saint-Quentin-Fallavier, France) were employed to measure the
total PCs using the Folin-Ciocalteu method (Singleton & Rossi, 1965). All commercially
available reagents were used without further purification, while ultrapure water (18.2 mΩ cm)
was used in all experiments and analyses (PureLab ELGA Classic, Veolia Water, Antony,
France).
2.2.Preparation and characterization of the 3D porous electrode
The porous material (SA-AC beads) was prepared based on AC of olive pomace
according to the protocol described in section 1.3 of part II (Lissaneddine, et al., 2021a). Two
crosslinking agents (iron and calcium) have been used in beads preparation (100% w/v Fe and
100% w/v Ca). The proportions in weight per volume (% w/v) of AC (0%, 0.5%, 0.75%, 1%,
2%, 3%) have been varied in the SA-AC beads preparation.
The new porous GAC was prepared based on olive pomace according to section 1.2
of part II. An electrochemical condition step has been added to further improve the GAC
properties. The GAC was implemented in the setup detailed in section 2.3 of part II. Then an

Part II Material and Methods
90
anodic current of 200 mA (anode potential (Ean) = 1.8V/(Ag/AgCl)) was applied for 1 h,
while 100 mL of KCl (6 g L-1
) was used as electrolyte.
The electrochemical properties of the prepared SA-AC beads and GAC electrode
were evaluated using a potentiostat (AMETEK, Massy, France) in a three-electrode system
whose design is described in section 2.3 of part II. The SA-AC beads or GAC were employed
as a working electrode, a graphite rod (Final Advanced Material, Didenheim, France) or
platinum wire (Ögussa, Vienna, Austria) as a counter electrode and Ag/AgCl as a reference
electrode. The electroactive surface of the porous material was determined by cyclic
voltammetry (CV) with -0.2 to 0.8 V/(Ag/AgCl) of voltage range and 0.01 V s−1
as scan rate,
followed by the use of the Randles-Sevcik equation to determine the surface from the current
intensity peak (Mousset, et al., 2016a). Tafel slopes were obtained from linear sweep
voltammetry (LSV) with -2 to 2 V/(Ag/AgCl) of voltage range and 0.01 V s−1
as scan rate and
were used to calculate the exchange current intensity (I0) of the 3D porous electrode (Mousset
et al., 2016b; Fang et al., 2017; Adnan et al., 2021b). Electrochemical impedance
spectroscopy (EIS) using the frequency range from 50,000 to 0.1 Hz with an amplitude of 10
mV have been performed to characterize the working electrode/electrolyte interface using the
equivalent electrical circuit (EEC) method (Mousset et al., 2016c). The EIS data were fitted
using ZSimpWin data analysis software (AMETEK, Massy, France).
2.3.Electrochemical setup and procedure
2.3.1. SA-AC beads
The performance of electrosorption with SA-AC beads working electrode was tested
on a fixed-bed column reactor (Figs. 19 and 20) using a graphite rod (210 mm length, 12 mm
diameter) as current collector to connect in a monopolar mode the SA-AC beads (35 g) with
the potentiostat. The counter electrode was a graphite rod (100 mm length, 8 mm diameter)
and was ascribed to the anode. In all experiments, 100 mL of effluent was introduced in
ascending flow using a peristaltic pump (Fisher Scientific, Illkirch-Graffenstaden, France) at a
constant flow rate of 10 mL min−1
. The cathode potential (Ecat) was varied from -0.8 to -1.3
V/(Ag/AgCl) and the open circuit (OC) was tested for a blank experiment in the absence of
applied voltage. The electrosorption capacity (qA in mg g-1
) was calculated according to Eq. 1
(Yingzhen Li et al., 2016):

Part II Material and Methods
91
Fig. 19. Fixed-bed electrosorption image setup.
The mass transfer coefficients (km) within the column were determined by LSV using
the limiting-current technique with solutions containing 0.05 M K3Fe(CN)6, 0.10 M
K4Fe(CN)6 and 0.50 M Na2CO3 (Sigma Aldrich, Saint-Quentin-Fallavier, France) (Selman &
Tobias, 1978; Cañizares et al., 2006; Adnan et al., 2021). The internal ohmic resistance were
determined according to the Eq. 27 (Miller et al., 2019):
∑𝑅 = 𝐸𝑐𝑒𝑙𝑙 − |𝐸𝐶| − |𝐸𝐴| (27)
where ∑R is the ohmic drop, 𝐸𝑐𝑒𝑙𝑙 is the cell voltage, |𝐸𝐴| and |𝐸𝐶| are the absolute values of
anode and cathode potentials, respectively.

Part II Material and Methods
92
Fig. 20. Fixed-bed electrosorption schematic setup.
2.3.2. Granular activated carbon
The PCs electrosorption tests were performed with a fixed-bed column with a 2.6 cm
interior diameter and a height of 15 cm (Fig. 21). This setup is similar to the one employed
with alginate beads, except that instead of filling with SA-AC beads it was filed by GAC
prepared according to the protocol developed in Part III, Chapter II. 10 g of GAC were
introduced into the column connected by graphite rod (210 mm length, 12 mm diameter) as a
current collector between the power supply and the porous GAC, considering a monopolar
connection mode. The counter electrode was a platinum wire (80 mm length, 1 mm diameter).

Part II Material and Methods
93
The applied current intensities were varied from 1 to 150 mA. In all experiments, 100 mL of
effluent was introduced in ascending flow using a peristaltic pump at a constant flow rate of
10 mL min-1
. At the column outlet, the effluent was sampled at regular time intervals, and the
PCs concentration was measured.
A possible way for quantitative comparison of the extent of electrosorption could be
made by calculating the percentage of PCs removed at equilibrium (%Req), through Eq. 28
(Bayram, 2016):
%𝑅𝑒𝑞 = (𝐶0− 𝐶𝑒)
𝐶0 × 100 (28)
Fig. 21. Scheme of the fixed-bed electrosorption setup.
2.4.Electrochemical regeneration of the GAC electrode
The electrochemical regeneration of GAC was performed with 100 mL KCl (Sigma
Aldrich, Saint-Quentin-Fallavier, France) solution (0.1 g L-1
) (Hou et al., 2012) using the
reactor used for the electrosorption experiment. The regeneration currents were 1 then 10 mA
at anodic polarization during 6 h. The regeneration process was evaluated using the
percentage of regeneration efficiency (RE) (Han et al., 2008):

Part II Material and Methods
94
𝑅𝐸 = 𝐶𝑟
𝐶𝑒 × 100 (29)
where Cr is the adsorptive capacity of regenerated GAC.
2.5.Electrochemical degradation of OMWW
After electrosorption, electro-oxidation was implemented to further treat the organic
compounds that remained in the OMWW solution. The anodic oxidation experiments were
performed in a cell described elsewhere (Fig. 22) (Adnan et al., 2021a), with a working
volume of 94 mL. The cathode used in this work was in stainless steel (Gantois Industries,
Saint-Dié-des-Vosges, France) and the anode was a double-sided BDD coated on Niobium
(Nb) substrate (DiaCCon, Fürth, Germany). The stainless steel and BDD had an effective
surface area of 50 cm2. A peristaltic pump (Masterflex, Cole-Parmer, Vernon Hills, IL, USA)
was used to circulate the OMWW at a constant flow rate of 0.68 L min-1
. A non-conductive
polytetrafluoroethylene spacer (3 mm) (Bohlender, Grünsfeld, Germany) was placed between
the cathode and the anode to avoid contact in-between. The applied current was 1 A. The
effluent was sampled before and after electrooxidation, and the COD and PCs concentrations
were measured.

Part II Material and Methods
95
Fig. 22. An exploded view of the parallel-plate electrochemical reactor. A: anode in BDD, B:
spacer, C: cathode in stainless steel.

Part II Material and Methods
96
References
Adebayo, M.A., Areo, F.I., 2021. Removal of phenol and 4-nitrophenol from wastewater
using a composite prepared from clay and Cocos nucifera shell: Kinetic, equilibrium
and thermodynamic studies. Resour. Environ. Sustain. 3, 100020.
https://doi.org/10.1016/j.resenv.2021.100020
Adnan, F.H., Mousset, E., Pontvianne, S., Pons, M., 2021a. Mineral cathodic electro-
precipitation and its kinetic modelling in thin-film microfluidic reactor during advanced
electro-oxidation process. Electrochim. Acta 387, 138487.
https://doi.org/10.1016/j.electacta.2021.138487
Adnan, F.H., Pons, M.-N., Mousset, E., 2021b. Mass transport evolution in microfluidic thin
film electrochemical reactors: New correlations from millimetric to submillimetric
interelectrode distances. Electrochem. commun. 130, 107097.
https://doi.org/10.1016/j.elecom.2021.107097
Badawi, M.A., Negm, N.A., Abou Kana, M.T.H., Hefni, H.H., Abdel Moneem, M.M., 2017.
Adsorption of aluminum and lead from wastewater by chitosan-tannic acid modified
biopolymers: Isotherms, kinetics, thermodynamics and process mechanism. Int. J. Biol.
Macromol. 99, 465–476. https://doi.org/10.1016/j.ijbiomac.2017.03.003
Bayram, E., 2016. Electrosoption of aromatic organic acids from aqueous solutions onto
granular activated carbon electrodes for water purification. Hacettepe J. Biol. Chem. 3,
273–273. https://doi.org/10.15671/hjbc.20164420570
Cañizares, P., Marcos, I.F. De, Rodrigo, M.A., Lobato, J., 2006. Measurement of mass-
transfer coefficients by an electrochemical technique. J. Chem. Educ. 83, 1204–1207.
https://doi.org/10.1021/ed083p1204
Es-Sahbany, H., Berradi, M., Nkhili, S., Hsissou, R., Allaoui, M., Loutfi, M., Bassir, D.,
Belfaquir, M., El Youbi, M.S., 2019. Removal of heavy metals (nickel) contained in
wastewater-models by the adsorption technique on natural clay. Mater. Today Proc. 13,
866–875. https://doi.org/10.1016/j.matpr.2019.04.050
Fang, Z., Cao, X., Li, Xuexiao, Wang, H., Li, Xianning, 2017. Electrode and azo dye
decolorization performance in microbial-fuel-cell- coupled constructed wetlands with
different electrode size during long- term wastewater treatment. Bioresour. Technol.
238, 450–460. https://doi.org/10.1016/j.biortech.2017.04.075
Freundlich, H.M.F., 1906. Über die adsorption in lösungen. Z. Phys. Chem. 57, 385–470.
Han, Y., Quan, X., Ruan, X., Zhang, W., 2008. Integrated electrochemically enhanced
adsorption with electrochemical regeneration for removal of acid orange 7 using
activated carbon fibers. Sep. Purif. Technol. 59, 43–49.
https://doi.org/10.1016/j.seppur.2007.05.026
Ho, Y.S., McKay, G., 1999. Pseudo-second-order model for sorption processes. Process
Biochem. 451–465. https://doi.org/10.1021/acs.oprd.7b00090
Lagergren, S. Sven, K., 1898. Vetenskapsakad, Citation review of lagergren kinetic rate
equation on adsorption reactions. Handl 24, 1–39.
Langmuir, I., 1916. The constitution and fundamental properties of solids and liquids. Part-I.
Solids. J. Am. Chem. Soc. 38, 2221–2295.
Li, Y., Fu, F., Cai, W., Tang, B., 2019. Synergistic effect of mesoporous feroxyhyte
nanoparticles and Fe(II) on phosphate immobilization: Adsorption and chemical
precipitation. Powder Technol. 345, 786–795.
https://doi.org/10.1016/j.powtec.2019.01.075
Li, Y., Zhang, C., Jiang, Y., Wang, T., Wang, H., 2016. Effects of the hydration ratio on the

Part II Material and Methods
97
electrosorption selectivity of ions during capacitive deionization. Desalination 399,
171–177. https://doi.org/10.1016/j.desal.2016.09.011
Lissaneddine, A., Mandi, L., Achaby, M. El, Mousset, E., Eldon, R., Ouazzani, N., Pons, M.,
Aziz, F., 2021. Performance and dynamic modeling of a continuously operated pomace
olive packed bed for olive mill wastewater treatment and phenol recovery.
Chemosphere 130797. https://doi.org/10.1016/j.chemosphere.2021.130797
Miller, A., Singh, L., Wang, L., Liu, H., 2019. Linking internal resistance with design and
operation decisions in microbial electrolysis cells. Environ. Int. 126, 611–618.
https://doi.org/10.1016/j.envint.2019.02.056
Mousset, E., Wang, Z., Hammaker, J., Lefebvre, O., 2016. Physico-chemical properties of
pristine graphene and its performance as electrode material for electro-Fenton treatment
of wastewater. Electrochim. Acta 214, 217–230.
https://doi.org/10.1016/j.electacta.2016.08.002
Olusegun, S.J., de Sousa Lima, L.F., Mohallem, N.D.S., 2018. Enhancement of adsorption
capacity of clay through spray drying and surface modification process for wastewater
treatment. Chem. Eng. J. 334, 1719–1728. https://doi.org/10.1016/j.cej.2017.11.084
Selman, J.R., Tobias, C.W., 1978. Mass-transfer measurements by the limiting-current
technique. Adv. Chem. Eng. 10, 211–318.
Singleton, V. L., & Rossi, J.A., 1965. Colorimetry of total phenolic substances. US Am.
Chem. Soc. Symp. Ser. 26, 47–70.
Singleton, V.L., Rossi, J.A., 1965. Colorimetry of total phenolics with phosphomolybdic-
phosphotungstic acid reagents. Am. J. Enol. Vitic. 16(3), 144–158.
Thomas, C., 1944. Heterogeneous ion exchange in a flowing system. J. Am. Chem. Soc.
1664–1666.
Yoon, Y.H.E.E., Nelson, J.H., 1984. Application of gas adsorption kinetics I. A theoretical
model for respirator cartridge service life. Am. Ind. Hyg. Assoc. J. ISSN 8894, 509–
516. https://doi.org/10.1080/15298668491400197

98
Part III: Results and Discussion

99
Chapter I: Composite beads

Part III Results and Discussion
100
I. Performance and dynamic modeling of a continuously operated pomace
olive packed-bed for olive mill wastewater treatment and phenol
recovery
1. Introduction
In recent years, many adsorbents, such as AC, have been used to eliminate PCs
(Annab et al., 2019). AC is commonly used because of its microporous texture, high surface
reactivity, consistency in the distribution of pore size, wide spectrum of functional surface
groups and thermal steadiness (Shim et al., 2019).
A column reactor is a practical and simple device that reduces the costs of the energy
needed for water treatment by exploiting the concentration gradient between the adsorbent
and pollutants, producing high-quality treated effluents with a minimum pollutant
concentration on an ongoing basis (Basu et al., 2019). However, due to the small particle size
of AC, its application in continuous flow adsorption systems has some disadvantages, such as
bed compaction and a high-pressure drop in fixed bed column systems (Aziz et al., 2020). To
avoid such drawbacks, the encapsulation of AC in alginate hydrogels is an attractive
alternative with high applicability for continuous flow adsorption processes (Aziz et al., 2020;
Quesada et al., 2020). Alginate gels are highly permeable due to their porous texture and
hydrophilicity, providing important advantages due to their high affinity and adsorption
potential for several micropollutants, such as heavy metal ions and dyes (Arenales-Sierra et
al., 2019; Quesada et al., 2020). However, the wastewater treatment operation at the real scale
requires granular materials of controlled size. Numerous researchers had to generate those
materials by encapsulating diverse adsorbents in the alginate composite to improve their
potentials (Aziz et al., 2020).
Currently, many researchers use beads with alginate coatings on several kinds of
sorbent materials or functionalize them to be more efficient and test the obtained composites
for OMWW PCs or synthetic effluent. Duarte et al. (2014) used silica-alginate-fungi
biocomposites; Nadavala et al. (2009) investigated chitosan-calcium (CS/Ca) alginate blended
beads; Kim et al. (2008) used an alginate-activated carbon (AAC) bead and Jodra and
Mijangos (2003) used a calcium alginate-AC composite bead. Although numerous studies
exist on applyingof alginate composite beads for the treatment of PCs of OMWW or synthetic

Part III Results and Discussion
101
phenol from water, this is the first work on the combined use of olive mill wastes and alginate
for the adsorption and recovery of PCs from real OMWW.
In a similar work, Annab et al. (2019) investigated beads based on AC encapsulated
in calcium alginate to adsorb polyphenols from OMWW. This work succeeded in attaining a
high level of adsorption capacity of their synthesized material for polyphenols. In addition,
the activation of the pomace used in this work was accomplished with KOH. Furthermore,
these beads were tested under batch and column conditions on only synthetic effluent and
OMWW diluted in ultrapure water, i.e., without the high concentrations that are characteristic
of real effluents. All these reasons make their results not easily applicable to industrial
applications. Therefore, it is suggested in the present work to use raw effluent and AC treated
with NaOH before transforming it into beads for the first time and characterizes the PCs
adsorbed from OMWW by liquid chromatography.
The objective of this study was to perform a cycle of olive mill waste treatment in
which the OP is first converted into a highly porous AC that can be subsequently used for the
treatment of OMWW by adsorption. The kinetics, mechanism and adsorption characteristics
of PCs adsorption were investigated. The experiments were carried out under different
operational conditions (time, concentration, pH, temperature) to determine the adsorbent
behavior in stirred batch and fixed-bed reactors. PCs recovery and the process reusability of
SA-AC beads were carried out in fixed-bed reactors.
2. Results and discussion
2.1.Physicochemical properties of the effluent
Table 8 presents the physicochemical properties of the studied OMWW. The results
showed that OMWW has acidic pH values equal to 4.8 and 4.7 for modern oil mills and
traditional oil mills, respectively, due to the presence of organic acids and PCs. The latter
constitute a large proportion of OMWW (4 and 10 g L-1
for modern oil mills and traditional
oil mills, respectively). This high content of PCs leads to the toxicity of this effluent. It is
further associated with a high concentration of organic matter, indicated by a very high COD
value (110 g-O2 L-1
for traditional oil mills). Furthermore, inorganic loads such as sodium
(0.13 g L-1
), potassium (5.9 g L-1
), calcium (0.24 g L-1
) and chloride (3.5 g L-1
) are high for
modern oil mills. These high organic and inorganic loads can make biological treatment

Part III Results and Discussion
102
extremely difficult and justify implementingalternative physicochemical processes such as
adsorption. In addition, the concentration of total solids is relatively high (128 g L-1
).
Table 8. Physicochemical parameters of the OMWW.
Parameters Traditional oil mills Modern oil mills
pH 4.86 ± 0.01 4.7 ± 0.005
Electrical conductivity (mS cm-1
) 25.0 ± 0.4 23.3 ± 0.02
Total dissolved solids (g L-1
) 11.5 ± 0.6 12.0 ± 0.07
Salinity (practical salinity unit) 14.0 ± 0.02 14.3 ± 0.01
Total dry matter (g L-1
) 128 ± 18 105 ± 11
Suspended matter (g L-1
) 2.6 ± 0.08 2.1 ± 0.06
Alkalinity (mg-CaCO3 L-1
) 444 ± 32 336 ± 22
COD (g-O2 L-1
) 110 ± 8 66 ± 3
Total phosphorus (mg L-1
) 0.57 ± 0.09 0.53 ± 0.02
Orthophosphate (mg L-1
) 0.37 ± 0.01 0.30 ± 0.001
Nitrite (mg L-1
) 0.09 ± 0.01 0.08 ± 0.005
Ammonia nitrogen (mg L-1
) 2 ± 0.5 2 ± 0.1
Total phenol (g L-1
) 10.7 ± 0.05 4.7 ± 0.2
Total sugars (g L-1
) 4.7 ± 0.003 4.5 ± 0.02
Sodium (g L-1
) 0.13 ± 0.03 0.13 ± 0.01
Potassium (g L-1
) 5.5 ± 0.05 5.9 ± 0.02
Calcium (g L-1
) 0.24 ± 0.04 0.24 ± 0.01
Chloride (g L-1
) 2.4 ± 0.08 3.5 ± 0.03
The analysis of the phenolic composition of this effluent by HPLC (Fig. 23) revealed
the presence of a varied phenolic pool composed mainly of gallic acid, tyrosol, ferulic acid,
caffeic acid, cinnamic acid, and coumaric acid. Magdich et al. (2012) found protocatechuic
acid, tyrosol, benzoic acid, ferulic acid and p-coumaric acid. In addition, Tafesh et al. (2014)

Part III Results and Discussion
103
showed the presence of hydroxytyrosol, acetic acid, 3,4-dihydroxyphenyl, tyrosol,
protocatechuic acid, vanillic acid, verbascoside, caffeic acid, p-coumaric acid and ferulic acid.
However, Leouifoudi et al. (2014) identified tyrosol and hydroxytyrosol as the main PCs in
OMWW, which is similar to the results reported by Achak et al. (2009). PCs do not have the
same organic functions; therefore, the adsorption mechanism should not be selective for the
organic structure of only one type of PC.
Fig. 23. Chromatographic spectrum (HPLC) of the used OMWW.
2.2.Characterization of the adsorbent
FTIR spectra of AC and SA-AC beads before and after adsorption are displayed in
Figs. 24a, 24b and 24c. FTIR spectra were obtained in the wavenumber range of 4000 - 400
cm−1
. The peaks of the FTIR spectrum of AC (Fig. 24 a) at 3457 cm−1
could be the -OH
stretching vibration mode of hydroxyl functional groups. The band at approximately 3032
cm−1
corresponds to the stretching mode of aromatic unsaturated hydrocarbon groups
(Iwanow et al., 2020). The symmetrical stretching vibrations of -CH2- and -C=O groups are
represented by the bands at1435 cm−1
and 1683 cm-1
, respectively (Wang et al., 2019). In the
FTIR spectrum of the SA-AC beads (Fig. 24b), the band at approximately 3308 cm−1
corresponds to the hydroxyl group (-OH group). The stretching vibration of the carbonyl (-
C=O) group appears at 1590 cm-1
; the symmetrical stretching vibration of -CH2- is located at
1402 cm−1
(Allwar et al., 2020). The absorption band at 1037 cm-1
is attributed to the bending
vibration of the O-H group (Nasrullah et al., 2018). There were no significant differences in
FTIR spectra between SA-AC beads after adsorption of PCs and SA-AC beads before
adsorption. This result is in accordance with the work previously reported by Shim et al.
(2018). These researchers speculated that weak electrostatic interactions and ionic adsorption
are prevalent among the studied contaminants and beads.

Part III Results and Discussion
104
Fig. 24. FTIR spectra of AC (a), SA-AC beads before (b) and after (c) adsorption.

Part III Results and Discussion
105
The textural characteristics of AC and SA-AC beads were evaluated by SEM, and
images at the same magnifications are shown in Figs. 25a and 25b. In the SEM photograph,
the AC surface has a porous morphology caused by the effect of sodium hydroxide as an
activating agent at higher temperatures, and the surface of SA-AC beads has a porosity less
than that of a pure AC sample. However, SA-AC beads still have a rough and porous surface.
Similar texture characteristics were observed by Iqbal et al. (2019), Nasrullah et al. (2018)
and Hassan et al. (2014). Nasrullah et al. (2018) and Hassan et al. (2014) used alginate/AC
composite beads and AC based on apricot stones, respectively. The SEM of these composite
beads shows that the surface of the bead composite has a porosity less than that of pure AC,
which is similar to the results of the present study.
Fig. 25. SEM of AC (a) and SA-AC beads (b).
Figs. 26a and 26b show the EDS spectra of AC and SA-AC beads. EDS analysis
revealed the presence of C, O and Na on the AC surface. After crosslinking (Fig. 26b), Fe, Al
and Cl appeared on the surface. These results confirm the existence of a crosslinking agent on
the bead surface. Iqbal et al. (2019) used nano-zero valent copper and AC on hydroxyapatite-
alginate beads and CaCl2 as a crosslinking agent, and EDS analysis showed Ca and Cl
elements in the prepared beads. In addition, Huixue et al. (2016) used CaCl2 and FeCl3

Part III Results and Discussion
106
solutions to synthesize SA-carboxymethyl cellulose beads and showed that Fe, Ca, and Cl
exist on the bead surface and are important for the formation of beads.
The textural characteristics of the raw AC and SA-AC beads are shown in Table 9.
The specific surface areas (SBET) of AC and SA-AC were 758 and 523 m2 g
-1, respectively. In
addition, the total pore volume (VT) values were 0.805 cm3 g
-1 for AC and 0.308 cm
3 g
-1 for
SA-AC beads, which are almost analogous to those reported by other researchers. Kwak et al.
(2018) reported VT values of 0.710 cm3 g
-1 for AC and 0.358 cm
3 g
-1 for composite beads.
Fig. 26. EDS spectra of AC (a) and SA-AC beads (b).
The average r−
values were 2.124 nm and 1.179 nm for the AC and SA-AC beads,
respectively. The decrease in the r- of AC when mixed with sodium alginate polymer to
generate SA-AC beads indicates pore encapsulation by sodium alginate. These results show
the feasibility of agglomerating the adsorbent (powder) into the macroparticles (beads),
thereby maintaining higher adsorption capacities and avoid clogging problems during
continuous column operation. By overcoming the operational problems such as pressure drop
and clogging, the process life cycle increases resulting in a decrease in the operational costs.
Besides, in order to promote the concept of a circular greeneconomy, it is important to move
in the direction of resource recovery rather than following the traditional end of pipe
treatment approach. The application of resource-efficient technologies such as adsorption
using locally available materials and resource recovery to obtain value-added products (e.g.
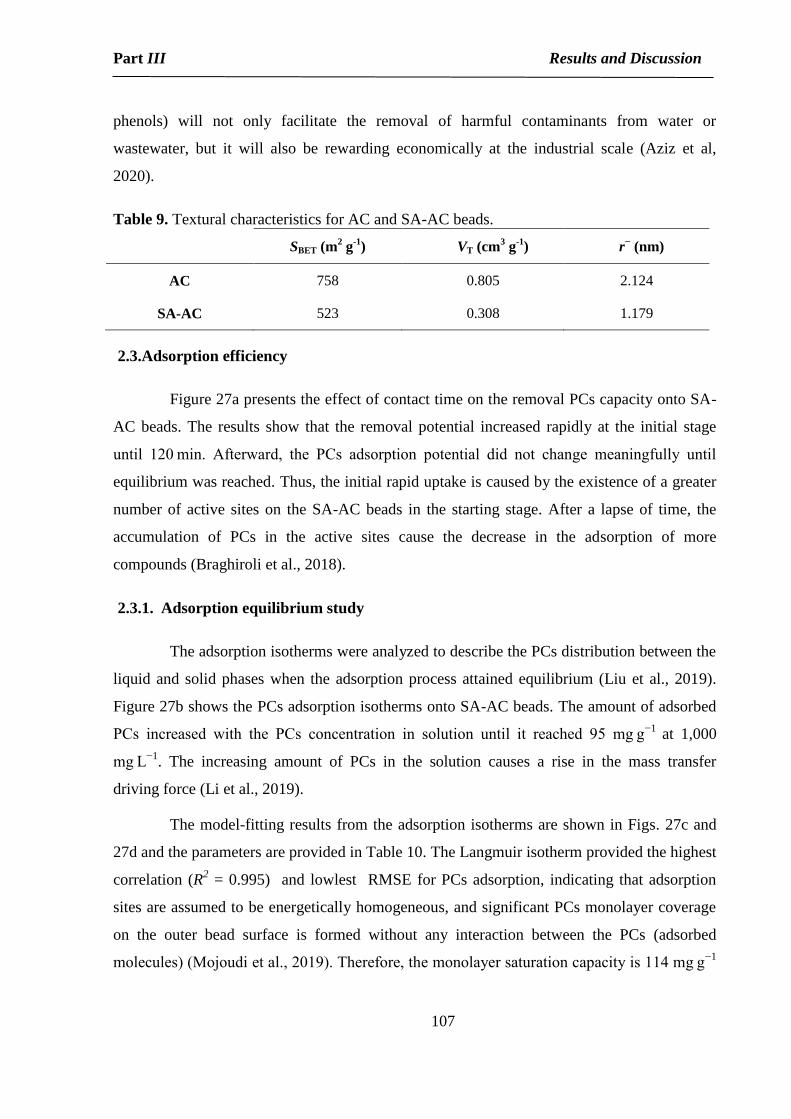
Part III Results and Discussion
107
phenols) will not only facilitate the removal of harmful contaminants from water or
wastewater, but it will also be rewarding economically at the industrial scale (Aziz et al,
2020).
Table 9. Textural characteristics for AC and SA-AC beads.
SBET (m2 g
-1) VT (cm
3 g
-1) r
− (nm)
AC 758 0.805 2.124
SA-AC 523 0.308 1.179
2.3.Adsorption efficiency
Figure 27a presents the effect of contact time on the removal PCs capacity onto SA-
AC beads. The results show that the removal potential increased rapidly at the initial stage
until 120 min. Afterward, the PCs adsorption potential did not change meaningfully until
equilibrium was reached. Thus, the initial rapid uptake is caused by the existence of a greater
number of active sites on the SA-AC beads in the starting stage. After a lapse of time, the
accumulation of PCs in the active sites cause the decrease in the adsorption of more
compounds (Braghiroli et al., 2018).
2.3.1. Adsorption equilibrium study
The adsorption isotherms were analyzed to describe the PCs distribution between the
liquid and solid phases when the adsorption process attained equilibrium (Liu et al., 2019).
Figure 27b shows the PCs adsorption isotherms onto SA-AC beads. The amount of adsorbed
PCs increased with the PCs concentration in solution until it reached 95 mg g−1
at 1,000
mg L−1
. The increasing amount of PCs in the solution causes a rise in the mass transfer
driving force (Li et al., 2019).
The model-fitting results from the adsorption isotherms are shown in Figs. 27c and
27d and the parameters are provided in Table 10. The Langmuir isotherm provided the highest
correlation (R2 = 0.995) and lowlest RMSE for PCs adsorption, indicating that adsorption
sites are assumed to be energetically homogeneous, and significant PCs monolayer coverage
on the outer bead surface is formed without any interaction between the PCs (adsorbed
molecules) (Mojoudi et al., 2019). Therefore, the monolayer saturation capacity is 114 mg g−1

Part III Results and Discussion
108
beyond which no further adsorption can occur. Still, full-scale, supplementary experiments
(adsorption kinetics) are needed to predict the adsorption capacity of PCs accurately.
Table 10. Isotherm parameters of PCs adsorption onto the SA-AC beads (Conditions: 5 g of
the adsorbent, 20 – 4,000 mg L−1
of PCs, pH = 4, contact time 24 h).
Isotherm Parameters Value
Langmuir
Qm (mg g−1
) 114
KL (L mg−1
) 15 10-3
R2 0.995
RMSE 1.65 10-6
Freundlich
1/n 0.87
KF (L mg−1
) 4.21
R2 0.967
RMSE 174 10-6

Part III Results and Discussion
109
0
10
20
30
40
50
60
70
80
0 100 200 300 400 500 600
qt(m
g g
-1)
t (min)
0
20
40
60
80
100
120
0 200 400 600 800 1000
qe
(mg
g-1
)
Ce (mg L -1)
(a)
(b)

Part III Results and Discussion
110
Fig. 27. Effect of contact time (a) on PCs removal by SA-AC beads (Conditions: 5 g of the
adsorbent, 4000 mg L−1
of PCs, 540 min contact time under optimum conditions of other
variables), Adsorption isotherm (b): (c) Langmuir and (d) Freundlich (PCs concentration, 20 –
4000 mg L−1
; volume of OMWW, 5 mL; temperature, 19°C; pH = 4.0; and contact time, 24
h).
0
0.05
0.1
0.15
0.2
0.25
0.3
0 0.01 0.02 0.03 0.04 0.05 0.06
1/q
e
1/Ce
0
0.5
1
1.5
2
2.5
0.5 1 1.5 2 2.5 3 3.5
log (
qe
)
log (Ce)
(c)
(d)

Part III Results and Discussion
111
2.3.2. Modeling of adsorption kinetics
The rate constants and R2 values were calculated from the linearized plots shown as
in Fig. 28 and summarized in Table 11. Considering the reported R2 and RMSE values, PCs
adsorption onto SA-AC beads followed pseudo-second-order kinetics, and the correlation
coefficients were higher (0.997) than those of pseudo-first-order kinetics (0.701). The amount
of PCs adsorption for pseudo-first-order kinetics was 28 mg g−1
, whereas pseudo-second-
order kinetics was 68 mg g−1
. The calculated qe(calc) values using the pseudo-second-order
kinetic model are much closer to the experimental qe(exp)values, further suggesting that the
adsorption of PCs onto SA-AC beads best fits pseudo-second-order kinetics. This model
supposes that PCs adsorption is principally controlled by chemisorption, which includes
valency changes through sharing or exchanging electrons between the SA-AC beads and the
PCs, and external adsorption occurs more often than micropore adsorption (Abdelhay et al.,
2017; Tao et al., 2017). Analogous results have also been reported for biochars prepared from
olive oil processing waste, CuO-coated olive cake nanocomposites, granular and powdered
AC encapsulated in calcium alginate (beads), and shrimp shell chitin (Annab et al., 2019;
Elayadi et al., 2020; El Hanandeh et al., 2020; Yuney et al., 2020).
The SA-AC beads used in the present study for PCs adsorption from a batch test,
removed 68 mg g−1
PCs, yielded more promising results than other reported adsorbents. In
comparison to biochar prepared from olive oil processing waste (51 mg g−1
), granular and
powdered AC encapsulated in calcium alginate beads (14 and 36 mg g−1
, respectively), SA-
AC composite beads showed a higher removal capacity. However, in using shrimp shell chitin
(1,045 mg g−1
), the adsorption potential was higher than that of the adsorbent used in our
study because the initial phenol concentration tested was also higher (10-12 g L−1
). In
addition, information on the kinetics of PCs adsorption is necessary to determine the optimum
conditions for full-scale PCs removal procedures.

Part III Results and Discussion
112
Table 11. Kinetic parameters of PCs adsorption onto SA-AC beads (Conditions: 5 g of the
adsorbent, 4,000 mg L−1
of PCs, 540 min contact time under optimum conditions of other
variables).
Model Parameters Value
Pseudo-first-order k1 (min−1
) 41 10-3
qe (Calc.) (mg g−1
) 28
R2 0.701
RMSE 3.90 10-4
Pseudo-second-order k2 (min−1
) 50 10-4
qe (Calc.) (mg g−1
) 68
R2 0.997
RMSE 3.90 10-4

Part III Results and Discussion
113
Fig. 28. Adsorption kinetics: pseudo-first-order (a) and pseudo-second-order (b) kinetic
models of PCs adsorption onto SA-AC beads.
0
1
2
3
4
5
6
7
8
9
0 100 200 300 400 500 600
1/q
t
t (min)
0
0.5
1
1.5
2
2.5
0 100 200 300 400 500
log (
qe
-q
t)
t (min)
(a)
(b)

Part III Results and Discussion
114
2.3.3. Effect of pH
The PCs adsorption ability of the SA-AC beads at different pH values is shown in
Fig. 29a. The adsorption capacity of PCs declined from 65 to 12 mg g-1
as the pH increased
from 2 to 10. This is due to the solubility of PCs that increases when the pH values decrease.
Thus, there was an inverse relationship between the adsorption and solubility of PCs.
However, pH values influenced the augmentation of oxygen-containing functional groups of
SA-AC beads, inducing the effects of pH on the zeta potentials of SA-AC beads
(Tahermansouri et al., 2015; Sun et al., 2019; Al Bsoul et al., 2020). These authors studied the
effect of pH on phenol adsorption using carboxylated multi-walled carbon nanotubes, AC,
and Ziziphus leaves, respectively. The same results were also reported for the effect of pH.
The main PCs identified in the effluent are mentioned in Section 2.1 of Part III, sub-
chapter I.I. The pKa of PCs varies from ~ 3.0-4.0 to 10.0-11.0, while for most of them it is
around 10.0. Thus, the protonated forms of PCs are predominant from acidic to neutral pH.
This form is more prone to be adsorbed on SA-AC beads than the unprotonated form. This is
one of the possible reasons for an increase in the adsorption capacity when the pH decreases.
The adsorption capacity is higher at an acidic pH than at a basic pH, which is advantageous
since the pH of real effluent is acidic and thus, pH adjustment would not be required during
the treatment. Therefore, in full-scale systems, OMWW can be used directly, which will
minimize costs during treatment. Alwan (2008) showed that pH control in industrial
wastewater treatment plants affects the treatment efficiency, which subsequently increases the
cost of treating the wastewater and meeting regulatory discharge guidelines.
2.3.4. Effect of temperature
The thermodynamic parameters, i.e., ΔG, ΔS and ΔH values, were obtained from the
plot of ln(KD) versus 1/T (Fig. 29b and Table 12). The positive values of ΔH suggest an
endothermic reaction. In addition, the value of ΔH was 29 kJ mol-1
(higher than 20 kJ mol-1
),
suggesting that PCs adsorption onto SA-AC beads involves some chemisorption. The ΔG
values for different temperatures were found to be negative and decreased as the temperature
decreased; the negative values of ΔG (19°C: -255; 25°C: -1,183; 30°C: -1,460; 35°C: -1,946 J
mol-1
) indicate a spontaneous reaction. On the other hand, the positive value of ΔS (74 J mol-1
K-1
) corresponds to a dissociative mechanism. Moreover, the positive value of ΔS also

Part III Results and Discussion
115
indicates an increased degree of freedom of the PCs in the solution and randomness at the
solid/solution interface with some structural variations in the PCs and SA-AC beads during
the PCs adsorption process, while the PCs molecules can displace the adsorbed molecules of
water (Srivastava et al., 2006; Cheng et al., 2016).
Table 12. Thermodynamic parameters of the adsorption process of PCs on beads at various
temperatures.
∆𝑯 (kJ mol-1
) ∆𝑺 (J mol-1
K-1
) ∆𝑮 (J mol
-1)
19°C 25°C 30°C 35°C
29 74 -255 -1,183 -1,460 -1,946
Fig. 29. Variation of the adsorption capacity of beads with pH (at 19 °C; adsorbent = 5 g; C0 =
4,000 mg L−1
) (a) Kc as function of 1/T (R2 = 0.959) (b).
0
0.1
0.2
0.3
0.4
0.5
0.6
0.7
0.8
0.9
0.0032 0.00325 0.0033 0.00335 0.0034 0.00345 0.0035
ln (
Kc)
1/T
0
10
20
30
40
50
60
70
80
0 2 4 6 8 10
qe
(mg g
-1)
pH
(b)
(a)

Part III Results and Discussion
116
2.3.5. Fixed-bed column modeling
During the first 40 min, all the PCs were adsorbed, resulting in a PCs concentration
of zero in the outlet water (treated water). As adsorption proceeded, the PCs concentration in
the treated water gradually increased. In the up-flow mode, as PCs solution is inserted at the
bottom of a clean bed of the SA-AC bead medium, most PCs are first eliminated in a closed
layer at the bottom. As the adsorption proceeded, the lower compartment of the SA-AC beads
became saturated with PCs, and the adsorption area advanced vertically through the column
(Kundu et al., 2016). Finally, the adsorption area reached the top of the column, and the PCs
concentration in the treated water began to increase. A breakthrough curve was generated by
plotting the PCs concentration (in mg L-1
) in the treated water against time (in min). Fig. 30
shows the breakthrough curve of the adsorption of the phenolic compound onto SA-AC
beads. The instant breakthrough time observed was 40 min, and the exhaustion time was 25
min. Different column parameters were determined.

Part III Results and Discussion
117
Fig. 30. Experimental and predicted breakthrough curves for PCs adsorption onto the SA-AC
beads.
The values of the important design parameters of the breakthrough curves of the bed
column for PCs adsorption onto the SA-AC beads were calculated and are shown in Table 13.
As shown in this table, for Ci = 4,700 mg L-1
and Q = 2 mL min-1
, the value of qe reached 159
mg g-1
, while the R was 41.6%. Thus, the SA-AC beads tested in this study for PCs removal
using a fixed-bed column yielded promising results than other reported adsorbents (Kumar
and Jena, 2016; Víctor-Ortega et al., 2016; Annab et al., 2019). The adsorbent SA-AC beads
were able to remove 159 mg g-1
PCs. In comparison to Amberlyst A26 exchange resin (148
mg g-1
), AC (76 mg g-1
) and bead-AC with calcium alginate (16 mg g-1
), SA-AC beads
showed higher removal capacity. Furthermore, the adsorbent (SA-AC beads) used in the
present study was easily prepared at a rather low cost than traditional adsorbents.
0
0.1
0.2
0.3
0.4
0.5
0.6
0.7
0.8
0.9
1
0 30 60 90 120 150 180 210 240 270 300
Ct/C
0
t (min)
0
0.2
0.4
0.6
0.8
1
1.2
0 30 60 90 120 150 180 210 240 270 300
Ct/C
0
t (min)
Ct/C0
Thomas
Yoon-Nelson
(b)
(a)
Ct/C0

Part III Results and Discussion
118
Table 13. Parameters of breakthrough curves of the packed-bed column for PCs adsorption
onto the SA-AC beads.
Ci (mg L-1
) Q (mL min-1
) Vef (mL) qtotal (mg) mtotal (mg) R (%) qe (mg g-1
)
4700 2 570 704 1,692 41.6 159
Data from HPLC analysis of PCs adsorption onto the SA-AC beads before and after
treatment in a fixed-bed column are depicted in Fig. 31. HPLC analysis of the PCs of
OMWW after adsorption on the SA-AC beads at 10 min of treatment (Fig. 31a) showed the
removal of 100% tyrosol (361 mg L-1
), caffeic acid (99 mg L-1
), ferulic acid (8.4 mg L-1
),
coumaric acid (9.1 mg L-1
), and cinnamic acid (264 mg L-1
). It can be noted that the
adsorption capacity of tyrosol, caffeic acid, coumaric acid, ferulic acid and cinnamic acid is
greater than that of gallic acid (40 mg L-1
). This could be due to the effect of the structure and
pKa of PCs present in the OMWW.

Part III Results and Discussion
119
Fig. 31. Chromatograms (HPLC) of OMWW before (a) and after (b) treatment.
OMWW contains a considerable quantity of mineral ions and organic matter. The
physicochemical parameters of the OMWW before and after treatment in a fixed-bed column
are described in Table 14. In addition to removing PCs, the SA-AC beads were able to adsorb
several ions and colloidal and soluble organic particles with an average of approximately
50%. These contaminants can compete for the adsorption sites and interfere with the removal
efficiency. This finding indicates that the surface of the SA-AC bead is highly attractive to
multiple elements of OMWW contaminants, which was confirmed by the greater decrease in

Part III Results and Discussion
120
electrical conductivity after treatment. SA-AC was also efficient in raising the pH from 4.79
to 6.12, so we could use it directly without pH adjustment after treatment.
Table 14. Physicochemical parameters of the OMWW before and after adsorption.
Parameters Before adsorption After adsorption
pH 4.79 6.12
Electrical conductivity (mS cm-1
) 23 12
COD (g-O2 L-1
) 66 36
Sodium (mg L-1
) 130 40
Potassium (mg L-1
) 5,900 2,950
Calcium (mg L-1
) 240 130
The parameters given by modeling the experimental breakthrough curves with the
Thomas and Yoon-Nelson models for PCs adsorption into SA-AC are presented in Table 15.
The R2
values (0.977) demonstrated that the Yoon-Nelson model was compatible and
coulddescribe the PCs in SA-AC continuous mode. Furthermore, it is shown in Table 15 that
the 50% breakthrough time () for 50% adsorbate breakthrough from the Yoon-Nelson model
complies with the experimental values ((exp) = 141 min). Moreover, error analysis was
based on obtaining the best model among the models used for this study. The MAE values
equaled 0.0619 and 0.0710 for the Thomas model and Yoon-Nelson model, respectively, as
shown in Table 15. In contrast, both models' root-mean-square error (RMSE) values were
calculated as 0.073 and 0.090, respectively. The MAE and RMSE for the Thomas model were
lower than those for the Yoon-Nelson model. The Thomas model fit the experimental data
well, meaning that the results followed the kinetics of Langmuir with the hypothesis
applicable in a system with a constant flow and a negligible axial dispersion in the adsorption
of the column because the motive force of speed follows the reversible reaction of the second-
order (Chue, 2010). These results are consistent with those obtained previously in batch
experiments.
In addition to their utility in terms of kinetics and isotherms obtained with real
effluents, these data will allow us to design an OMWW treatment system by simulating a full-
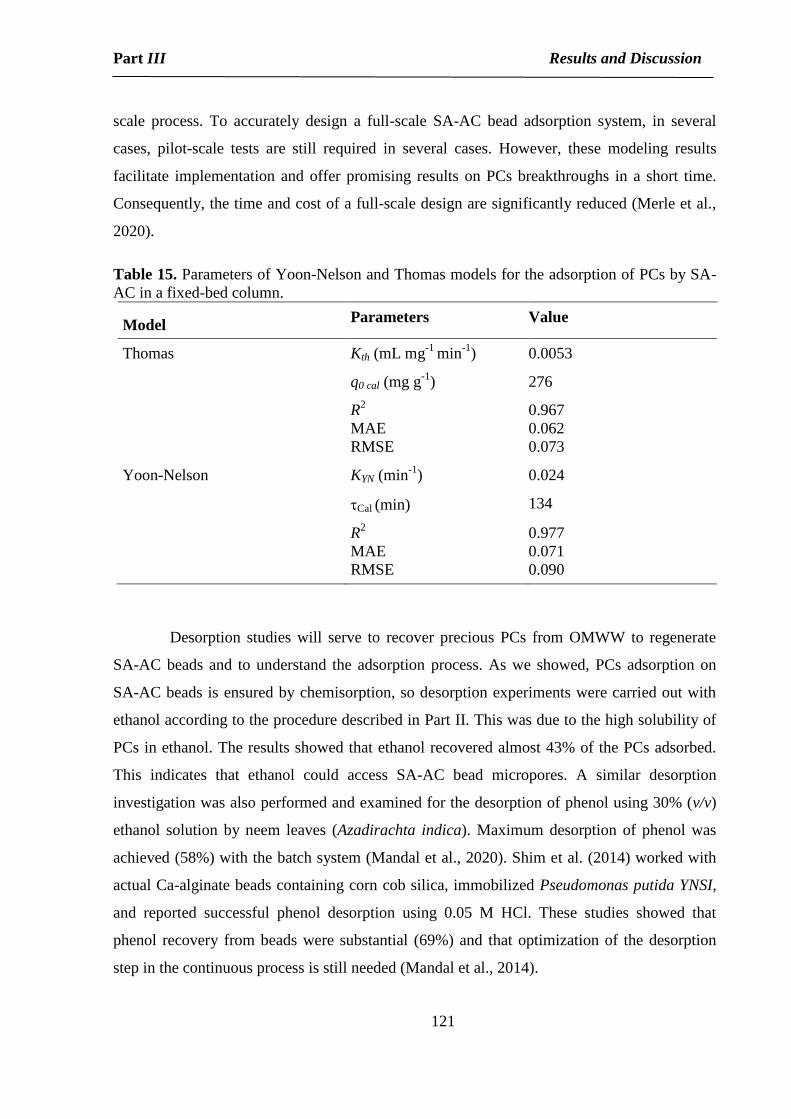
Part III Results and Discussion
121
scale process. To accurately design a full-scale SA-AC bead adsorption system, in several
cases, pilot-scale tests are still required in several cases. However, these modeling results
facilitate implementation and offer promising results on PCs breakthroughs in a short time.
Consequently, the time and cost of a full-scale design are significantly reduced (Merle et al.,
2020).
Table 15. Parameters of Yoon-Nelson and Thomas models for the adsorption of PCs by SA-
AC in a fixed-bed column.
Model Parameters Value
Thomas Kth (mL mg-1
min-1
) 0.0053
q0 cal (mg g-1
) 276
R2
MAE
RMSE
0.967
0.062
0.073
Yoon-Nelson KYN (min-1
) 0.024
Cal (min) 134
R2
MAE
RMSE
0.977
0.071
0.090
Desorption studies will serve to recover precious PCs from OMWW to regenerate
SA-AC beads and to understand the adsorption process. As we showed, PCs adsorption on
SA-AC beads is ensured by chemisorption, so desorption experiments were carried out with
ethanol according to the procedure described in Part II. This was due to the high solubility of
PCs in ethanol. The results showed that ethanol recovered almost 43% of the PCs adsorbed.
This indicates that ethanol could access SA-AC bead micropores. A similar desorption
investigation was also performed and examined for the desorption of phenol using 30% (v/v)
ethanol solution by neem leaves (Azadirachta indica). Maximum desorption of phenol was
achieved (58%) with the batch system (Mandal et al., 2020). Shim et al. (2014) worked with
actual Ca-alginate beads containing corn cob silica, immobilized Pseudomonas putida YNSI,
and reported successful phenol desorption using 0.05 M HCl. These studies showed that
phenol recovery from beads were substantial (69%) and that optimization of the desorption
step in the continuous process is still needed (Mandal et al., 2014).

Part III Results and Discussion
122
Solvent regeneration has numerous advantages for SA-AC bead regeneration since. It
requires less energy, enables the recovery of PCs and SA-AC beads, and avoids the loss of
SA-AC beads. Adsorbent regeneration allows the feasibility of recycling beads for several
cycles of OMWW treatment and phenol recovery. However, the regeneration of adsorbent is
affected by several physico-chemical parameters, including the pressure drop. Shen et al.
(2010) highlighted that an increase of feed pressure from 131.32 to 202.65 kPa, increases the
adsorbate recovery rate from 49% to 78%. The pressure drop is impacted by the beads bed
thickness (i.e. column height), the bed porosity, as well as the friction at the surface of the
beads (Franchin et al., 2020). The pressure drop across the column increases approximately
linearly with the breakthrough time (Kratochvil et al., 1998). For this reason and in order to
reduce the pressure drop across the bed, it is recommended to periodically backwash the
column (Cooney et al., 1998). To selectively desorb PCs, electrosorption/desorption
experiments will be carried out in the future using a fixed bed column reactor. Specific
attention will be given to study the influence of the acidity constants of PCs on the efficiency
of electrosorption to desorb the PCs selectively.
3. Conclusions
New composite beads based on olive pomace with alginate hydrogel were formulated
successfully for PCs elimination from OMWW. The structure and porous morphology of SA-
AC beads was confirmed by FTIR, SEM and EDS, which revealed the feasibility of SA-AC
beads as potential and low-cost biosorbents. The adsorption of PCs by the SA-AC bead
composite fits second-order kinetics and Langmuir isotherms. The results indicated that PC
adsorption on SA-AC beads is strongly dependent on pH and phenol solubility.
Thermodynamic analysis indicated that PCs adsorption was spontaneous and endothermic.
Thomas and Yoon-Nelson models were selected to fit the experimental data, and the modified
Thomas model was better at predicting PCs column adsorption. Finally, the regeneration
investigation of SA-AC beads showed that the recovery of phenols from OMWW can be
carried out with ethanol.

Part III Results and Discussion
123
References
Abdelhay, A., Al Bsoul, A., Al-Othman, A., Al-Ananzeh, N. M., Jum’h, I., Al-Taani, A. A.,
2017. Kinetic and thermodynamic study of phosphate removal from water by adsorption
onto (Arundodonax) reeds. Adsorpt. Sci. Technol. 36, 46-61.
https://doi.org/10.1177/0263617416684347
Achak, M., Hafidi, A., Ouazzani, N., Sayadi, S., Mandi, L., 2009. Low cost biosorbent
“banana peel” for the removal of PCs from olive mill wastewater: Kinetic and
equilibrium studies. J. Hazard. Mater. 166, 117-125.
https://doi.org/10.1016/j.jhazmat.2008.11.036
Al-Bsoul, A., Hailat, M., Abdelhay, A., Tawalbeh, M., Al-Othman, A., Al-kharabshehIsra’
Nawaf, Al-Taani, A. A., 2020. Efficient removal of phenol compounds from water
environment using ziziphus leaves adsorbent. Sci. Total Environ., 143229.
https://doi.org/10.1016/j.scitotenv.2020.143229
Al-Bsoul, A., Al-Shannag, M., Tawalbeh, M., Al-Taani, A. A., Lafi, W. K., Al-Othman, A.,
Alsheyab, M., 2020. Optimal conditions for olive mill wastewater treatment using
ultrasound and advanced oxidation processes. Sci. Total Environ. 700, 134576.
https://doi.org/10.1016/j.scitotenv.2019.134576
Allwar, A., 2020. Preparation and characterizations of activated carbon from banana fruit
bunch with chemical treatments using hydrothermal processes. In: AIP Conf. Proc. AIP
Publishing LLC, 030028. https://doi.org/10.1063/5.0002794
Alwan, Ghanim. (2008). pH control problems of a wastewater treatment plant. Al-
Khawarizmi Eng. J. 4, 37-45.
Annab, H., Fiol, N., Villaescusa, I., Essamri, A., 2019. A proposal for the sustainable
treatment and valorisation of olive mill wastes.J. Environ. Chem. Eng., 7, 102803.
https://doi.org/10.1016/j.jece.2018.11.047
Arenales-Sierra, I. M., Lobato-Calleros, C., Vernon-Carter, E. J., Hernández-Rodríguez, L.,
Alvarez-Ramirez, J., 2019. Calcium alginate beads loaded with Mg(OH)2 improve L.
casei viability under simulated gastric condition. LWT - Food Sci Technol, 112,
108220. https://doi.org/10.1016/j.lwt.2019.05.118
Aziz, F., El Achaby, M., Lissaneddine, A., Aziz, K., Ouazzani, N., Mamouni, R., Mandi, L.,
2020. Composites with alginate beads: A novel design of nano-adsorbents impregnation
for large-scale continuous flow wastewater treatment pilots. Saudi J. Biol. Sci. 27,
2499-2508. https://doi.org/10.1016/j.sjbs.2019.11.019
Azzam, M. O., Hazaimeh, S. A., 2021. Olive mill wastewater treatment and valorization by
extraction/concentration of hydroxytyrosol and other natural phenols. Process SAF
Environ. 148, 495-523. https://doi.org/10.1016/j.psep.2020.10.030
Badawi, M. A., Negm, N. A., Abou Kana, M. T. H., Hefni, H. H., Abdel Moneem, M. M.,
2017. Adsorption of aluminum and lead from wastewater by chitosan-tannic acid
modified biopolymers: Isotherms, kinetics, thermodynamics and process mechanism.
Int. J. Biol. Macromol. 99, 465-476. https://doi.org/10.1016/j.ijbiomac.2017.03.003
Baierle, F., John, D. K., Souza, M. P., Bjerk, T. R., Moraes, M. S., Hoeltz, M., Schneider, R.
C., 2015. Biomass from microalgae separation by electroflotation with iron and
aluminum spiral electrodes. Chem. Eng. J, 267, 274-281.
https://doi.org/10.1016/j.cej.2015.01.031
Bampalioutas, K., Vlysidis, A., Lyberatos, G., Vlyssides, A., 2019. Detoxification and
methane production kinetics from threephase olive mill wastewater using Fenton's
reagent followed by anaerobic digestion. J. Chem. Technol. 94, 265-275.

Part III Results and Discussion
124
https://doi.org/10.1002/jctb.5772
Basu, M., Guha, A. K., Ray, L., 2019. Adsorption of lead on lentil husk in fixed bed column
bioreactor. Bioresour. Technol. 283, 86-95.
https://doi.org/10.1016/j.biortech.2019.02.133
Braghiroli, F. L., Bouafif, H., Hamza, N., Neculita, C. M., Koubaa, A., 2018. Production,
characterization, and potential of activated biochar as adsorbent for PCs from leachates
in a lumber industry site. Environ. Sci. Pollut. Res. 25, 26562-26575.
https://doi:10.1007/s11356-018-2712-9
Cheng, W. P., Gao, W., Cui, X., Ma, J. H., Li, R. F., 2016. Phenol adsorption equilibrium
and kinetics on zeolite X/activated carbon composite. J. Taiwan Inst. Chem. Eng. 62,
192-198. https://doi.org/10.1016/j.jtice.2016.02.004
Chu, K. H., 2010. Fixed bed sorption: setting the record straight on the Bohart-Adams and
Thomas models. J. Hazard. Mater. 177, 1006-1012.
https://doi.org/10.1016/j.jhazmat.2010.01.019
Cooney, E., Stevens, G., Booker, N., Shallcross, D., 1999. Ammonia removal from
wastewaters using natural Australian zeolite. II. Pilot-scale study using continuous
packed column process. Sep. Sci. Technol. 34, 2741-2760. https://doi:10.1081/ss-
100100802
Duarte, K. R., Justino, C., Panteleitchouk, T., Zrineh, A., Freitas, A. C., Duarte, A. C.,
Rocha-Santos, T. A. P., 2014. Removal of PCs in olive mill wastewater by silica-
alginate-fungi biocomposites. Int. J. Environ. Sci. Technol. 11, 589-596.
https://doi:10.1007/s13762-013-0268-2
El Ghadraoui, A., Ouazzani, N., Ahmali, A., El Mansour, T. E. H., Aziz, F., Hejjaj, A.,
Mandi, L., 2020. Treatment of olive mill and municipal wastewater mixture by pilot
scale vertical flow constructed wetland. Desalin. Water Treat. 198, 126-139. https://doi:
10.5004/dwt.2020.26009
El Hanandeh, A., Albalasmeh, A., Gharaibeh, M., Alajlouni, M. 2020. Modification of
biochar prepared from olive oil processing waste to enhance phenol removal from
synthetic and olive mill wastewater. Sep. Sci. Technol. 1-13, 1659-
1671.https://doi.org/10.1080/01496395.2020.1794897
El Moudden, H., El Idrissi, Y., El Yadini, A., Harhar, H., Tabyaoui, B., Tabyaoui, M., 2019.
Effect of filtration of olive mill wastewater on the phenolic composition and its
influence on antioxidant activity. Pharmacology OnLine.2, 161-176.
Elayadi, F., Achak, M., Beniich, N., Belaqziz, M., El Adlouni, C., 2020. Factorial design for
optimizing and modeling the removal of organic pollutants from olive mill wastewater
using a novel low-cost bioadsorbent. Water Air Soil Pollut. 231, 1-16.
https://doi:10.1007/s11270-020-04695-8
Elmansour, T. E., Mandi, L., Ahmali, A., Elghadraoui, A., Aziz, F., Hejjaj, A., Ouazzani, N.,
2020. Effect of polyphenols on activated sludge biomass during the treatment of highly
diluted olive mill wastewaters: Biomass dynamics and purifying performances. Water
Sci. Technol. 82, 1416-1429. https://doi.org/10.2166/wst.2020.423
Es-Sahbany, H., Berradi, M., Nkhili, S., Hsissou, R., Allaoui, M., Loutfi, M., El Youbi, M.
S., 2019. Removal of heavy metals (nickel) contained in wastewater-models by the
adsorption technique on natural clay. Mater. Today: Proc. 13, 866-875.
https://doi.org/10.1016/j.matpr.2019.04.050
Franchin, G., Pesonen, J., Luukkonen, T., Bai, C., Scanferla, P., Botti, R., Colombo, P.,
2020. Removal of ammonium from wastewater with geopolymer sorbents fabricated via
additive manufacturing. Mater. Des. 195, 109006.

Part III Results and Discussion
125
https://doi.org/10.1016/j.matdes.2020.109006
Hassan, A. F., Abdel-Mohsen, A. M., Elhadidy, H., 2014. Adsorption of arsenic by activated
carbon, calcium alginate and their composite beads. Int. J. Biol. Macromol. 68, 125-
130. https://doi.org/10.1016/j.ijbiomac.2014.04.006
Ho, Y. S., McKay, G., 1999. Pseudo-second-order model for sorption processes. Process
Biochem. 34, 451-465. https://doi.org/10.1016/S0032-9592(98)00112-5
Iqbal, J., Shah, N. S., Sayed, M., Imran, M., Muhammad, N., Howari, F. M.,
Polychronopoulou, K., 2019. Synergistic effects of activated carbon and nano-
zerovalent copper on the performance of hydroxyapatite-alginate beads for the removal
of As3+
from aqueous solution. J. Clean. Prod. 235, 875-886.
https://doi.org/10.1016/j.jclepro.2019.06.316
Iwanow, M., Gärtner, T., Sieber, V., König, B., 2020. Activated carbon as catalyst support:
precursors, preparation, modification and characterization. Beilstein J. Org. Chem. 16,
1188-1202. https://doi.org/10.3762/bjoc.16.104
Ji, M., Jiang, X., Wang, F., 2015. A mechanistic approach and response surface optimization
of the removal of oil and grease from restaurant wastewater by electrocoagulation and
electroflotation. Desalin. Water Treat. 55, 2044-2052.
https://doi.org/10.1080/19443994.2014.929034
Jodra, Y., Mijangos, F., 2003. Phenol adsorption in immobilized activated carbon with
alginate gels. Sep. Sci. Technol. 38, 1851-1867. https://doi.org/10.1081/SS-120019412
Kaleh, Z., Geißen, S. U., 2016. Selective isolation of valuable biophenols from olive mill
wastewater. J. Environ. Chem. Eng. 4, 373-384.
https://doi.org/10.1016/j.jece.2015.11.010
Kilic, M. Y., Abdelraheem, W. H., He, X., Kestioglu, K., Dionysiou, D. D., 2019.
Photochemical treatment of tyrosol, a model phenolic compound present in olive mill
wastewater, by hydroxyl and sulfate radical-based advanced oxidation processes (AOPs.
J. Hazard. Mater. 367, 734-742. https://doi.org/10.1016/j.jhazmat.2018.06.062
Kim, T. Y., Jin, H. J., Park, S. S., Kim, S. J., Cho, S. Y., 2008. Adsorption equilibrium of
copper ion and phenol by powdered activated carbon, alginate bead and alginate-
activated carbon bead. J. Ind. Eng. Chem. 14, 714-719.
https://doi.org/10.1016/j.jiec.2008.07.004
Kratochvil, D., Volesky, B., 1998. Biosorption of Cu from ferruginous wastewater by algal
biomass. Water Res. 32, 2760-2768. https://doi.org/10.1016/S0043-1354(98)00015-3
Kumar, A., Jena, H. M., 2016. Removal of methylene blue and phenol onto prepared
activated carbon from Fox nutshell by chemical activation in batch and fixed-bed
column. J. Clean. Prod. 137, 1246-1259. https://doi.org/10.1016/j.jclepro.2016.07.177
Kundu, S. Gupta, A. K. 2005. Analysis and modeling of fixed bed column operations on
As(V) removal by adsorption onto iron oxide-coated cement (IOCC). J. Colloid
Interface Sci. 290(1), 52-60. https://doi.org/10.1016/j.jcis.2005.04.006
Kwak, H. W., Hong, Y., Lee, M. E., Jin, H. J., 2018. Sericin-derived activated carbon-loaded
alginate bead: An effective and recyclable natural polymer-based adsorbent for
methylene blue removal. Int. J. Biol. Macromol. 120, 906-914.
https://doi.org/10.1016/j.ijbiomac.2018.08.116
Lagergren, S., 1898. Zur Theorie der Sogenannten Adsorption Gelöster Stoffe, Kongl.
Vetensk. Acad. Handl. 24, 1-39.
Lawal, A. A., Hassan, M. A., Farid, M. A. A., Yasim-Anuar, T. A. T., Yusoff, M. Z. M.,
Zakaria, M. R., Shirai, Y., 2020. One-step steam pyrolysis for the production of
mesoporous biochar from oil palm frond to effectively remove phenol in facultatively

Part III Results and Discussion
126
treated palm oil mill effluent. Environ. Technol. Innov. 18, 100730.
https://doi.org/10.1016/j.eti.2020.100730
Leouifoudi, I., Zyad, A., Amechrouq, A., Oukerrou, M. A., Mouse, H. A., Mbarki, M., 2014.
Identification and characterization of PCs extracted from Moroccan olive mill
wastewater. Food Sci. Technol. 34, 249-257. http://dx.doi.org/10.1590/fst.2014.0051
Li, W., Yan, J., Yan, Z., Song, Y., Jiao, W., Qi, G., Liu, Y., 2018. Adsorption of phenol by
activated carbon in rotating packed bed: Experiment and modeling. Appl. Therm. Eng.
142, 760-766. https://doi.org/10.1016/j.applthermaleng.2018.07.051
Li, Y., Fu, F., Cai, W., Tang, B., 2019. Synergistic effect of mesoporous feroxyhyte
nanoparticles and Fe(II) on phosphate immobilization: Adsorption and chemical
precipitation. Powder Technol. 345, 786-795.
https://doi.org/10.1016/j.powtec.2019.01.075
Liu, S., Cheng, G., Xiong, Y., Ding, Y., Luo, X., 2020. Adsorption of low concentrations of
bromide ions from water by cellulose-based beads modified with TEMPO-mediated
oxidation and Fe(III) complexation. J. Hazard. Mater. 384, 121195.
https://doi.org/10.1016/j.jhazmat.2019.121195
Magdich, S., Jarboui, R., Rouina, B. B., Boukhris, M., Ammar, E., 2012. A yearly spraying
of olive mill wastewater on agricultural soil over six successive years: impact of
different application rates on olive production, phenolic compounds, phytotoxicity and
microbial counts. Sci. Total Environ. 430, 209-216.
https://doi.org/10.1016/j.scitotenv.2012.05.004
Mandal, A., Bar, N., Das, S. K., 2020. Phenol removal from wastewater using low-cost
natural bioadsorbent neem (Azadirachtaindica) leaves: Adsorption study and MLR
modeling. Sustain. Chem. Pharm. 17, 100308.
https://doi.org/10.1016/j.scp.2020.100308
Merle, T., Knappe, D. R., Pronk, W., Vogler, B., Hollender, J., von Gunten, U., 2020.
Assessment of the breakthrough of micropollutants in full-scale granular activated
carbon adsorbers by rapid small-scale column tests and a novel pilot-scale sampling
approach. Environ. Sci. Water Res. Technol. 6, 2742-2751.
https://doi.org/10.1039/D0EW00405G
Mojoudi, N., Soleimani, M., Mirghaffari, N., Belver, C., Bedia, J., 2019. Removal of phenol
and phosphate from aqueous solutions using activated carbons prepared from oily
sludge through physical and chemical activation. Water Sci. Technol. 80, 575-586.
https://doi.org/10.2166/wst.2019.305
Nadavala, S. K., Swayampakula, K., Boddu, V. M., Abburi, K., 2009. Biosorption of phenol
and o-chlorophenol from aqueous solutions on to chitosan-calcium alginate blended
beads. J. Hazard. Mater. 162, 482-489. https://doi.org/10.1016/j.jhazmat.2008.05.070
Nasrullah, A., Bhat, A. H., Naeem, A., Isa, M. H., Danish, M., 2018. High surface area
mesoporous activated carbon-alginate beads for efficient removal of methylene blue.
Int. J. Biol. Macromol. 107, 1792-1799. https://doi.org/10.1016/j.ijbiomac.2017.10.045
Olusegun, S. J., de Sousa Lima, L. F., Mohallem, N. D. S., 2018. Enhancement of adsorption
capacity of clay through spray drying and surface modification process for wastewater
treatment. Chem. Eng. J. 334, 1719-1728. https://doi.org/10.1016/j.cej.2017.11.084
Pinto, R. T. P., Lintomen, L., Luz Jr, L. F. L., Wolf-Maciel, M. R., 2005. Strategies for
recovering phenol from wastewater: thermodynamic evaluation and environmental
concerns. Fluid Phase Equilib. 228, 447-457. https://doi.org/10.1016/j.fluid.2004.09.005
Quesada, H. B., de Araújo, T. P., Vareschini, D. T., de Barros, M. A. S. D., Gomes, R. G.,
Bergamasco, R., 2020. Chitosan, alginate and other macromolecules as activated carbon

Part III Results and Discussion
127
immobilizing agents: A review on composite adsorbents for the removal of water
contaminants. Int. J. Biol. Macromol. 164, 2535-2549.
https://doi.org/10.1016/j.ijbiomac.2020.08.118
Rahmanian, N., Jafari, S. M., Galanakis, C. M., 2014. Recovery and removal of PCs from
olive mill wastewater. J. Am. Oil Chem. Soc. 91, 1-18.
Ren, H., Gao, Z., Wu, D., Jiang, J., Sun, Y., Luo, C., 2016. Efficient Pb(II) removal using
sodium alginate-carboxymethyl cellulose gel beads: Preparation, characterization, and
adsorption mechanism. Carbohydr. Polym. 137, 402-409.
https://doi.org/10.1016/j.carbpol.2015.11.002
Shen, C., Yu, J., Li, P., Grande, C. A., Rodrigues, A. E., 2010. Capture of CO2 from flue gas
by vacuum pressure swing adsorption using activated carbon beads. Adsorption 17,
179-188. https://doi.org/10.1007/s10450-010-9298-y
Shim, J., Kumar, M., Goswami, R., Mazumder, P., Oh, B. T., Shea, P. J., 2019. Removal of
p-cresol and tylosin from water using a novel composite of alginate, recycled MnO2 and
activated carbon. J. Hazard. Mater. 364, 419-428.
https://doi.org/10.1016/j.jhazmat.2018.09.065
Shim, J., Lim, J.-M., Shea, P. J., Oh, B.-T., 2014. Simultaneous removal of phenol, Cu and
Cd from water with corn cob silica-alginate beads. J. Hazard. Mater. 272, 129-136.
https://doi.org/10.1016/j.jhazmat.2014.03.010
Soto, M. L., Moure, A., Domínguez, H., Parajó, J. C., 2011. Recovery, concentration and
purification of PCs by adsorption: A review. J. Food Eng. 105, 1-27.
https://doi.org/10.1016/j.jfoodeng.2011.02.010
Srivastava, V. C., Swamy, M. M., Mall, I. D., Prasad, B., Mishra, I. M., 2006. Adsorptive
removal of phenol by bagasse fly ash and activated carbon: equilibrium, kinetics and
thermodynamics. Colloids Surf. A Physicochem. Eng. 272, 89-104.
https://doi.org/10.1016/j.colsurfa.2005.07.016
Sun, J., Liu, X., Zhang, F., Zhou, J., Wu, J., Alsaedi, A., Li, J., 2019. Insight into the
mechanism of adsorption of phenol and resorcinol on activated carbons with different
oxidation degrees. Colloids Surf. A Physicochem. Eng. 563, 22-30.
https://doi.org/10.1016/j.colsurfa.2018.11.042
Tafesh, A., Najami, N., Jadoun, J., Halahlih, F., Riepl, H., Azaizeh, H., 2011. Synergistic
antibacterial effects of poly PCs from olive mill wastewater. Evid.-Based
Complementary Altern. Med. 2011, 1-9. https://doi.org/10.1155/2011/431021
Tahermansouri, H., Dehghan, Z., Kiani, F., 2015. Phenol adsorption from aqueous solutions
by functionalized multiwalled carbon nanotubes with a pyrazoline derivative in the
presence of ultrasound. RSC Adv., 5, 44263-44273.
https://doi.org/10.1039/C5RA02800K
Tao, J., Huo, P., Fu, Z., Zhang, J., Yang, Z., Zhang, D., 2019. Characterization and phenol
adsorption performance of activated carbon prepared from tea residue by NaOH
activation. Environ. Technol. 40, 171-181.
https://doi.org/10.1080/09593330.2017.1384069
Víctor-Ortega, M. D., Ochando-Pulido, J. M., Martínez-Ferez, A., 2016. Performance and
modeling of continuous ion exchange processes for phenols recovery from olive mill
wastewater. Process Saf. Environ. Prot. 100, 242-251.
https://doi.org/10.1016/j.psep.2016.01.017
Wang, W., Xu, S., Wang, K., Liang, J., Zhang, W., 2019. De-intercalation of the intercalated
potassium in the preparation of activated carbons by KOH activation. Fuel Process.
Technol. 189, 74-79. https://doi.org/10.1016/j.fuproc.2019.03.001

Part III Results and Discussion
128
Yuney, K., Oladipo, A. A., Gazi, M., Younis, D. Z., 2020. CuO coated olive cake
nanocomposites for rapid phenol removal and effective discoloration of high strength
olive mill wastewater. Chemosphere 253, 126703.
https://doi.org/10.1016/j.chemosphere.2020.126703
Zagklis, D. P., Vavouraki, A. I., Kornaros, M. E., Paraskeva, C. A., 2015. Purification of
olive mill wastewater phenols through membrane filtration and resin
adsorption/desorption. J. Hazard. Mater. 285, 69-76.
https://doi.org/10.1016/j.jhazmat.2014.11.038

Part III Results and Discussion
129
II. Electrosorption of phenolic compounds from olive mill wastewater:
mass transport consideration under transient regime through alginate-
activated carbon fixed-bed electrode
1. Introduction
The electrode material is of primary importance in such an electrochemical
systembecause it impacts the electrosorption rates and yields. It depends on the specific
surface area, pore size distribution, electric conductivity, surface function, and wettability
(Sun et al., 2016b; Yue et al., 2019c; Lissaneddine et al., 2021b). Three-dimensional (3D)
particle electrodes provide high electroactive surface area and can be easily implemented in
fixed-bed reactors to favor mass transfer (Andrés García et al., 2018; Macías-García et al.,
2019; Yue et al., 2019c; Lissaneddine et al., 2021b). Different studies have already
demonstrated the performance of 3D electrodes for the electrosorption of organic compounds
(e.g., acid red 88, orange II, methylene blue and metribuzin) from wastewater (Lissaneddine
et al., 2021b). However, it has been recently reviewed that no studies have reported the
electrosorption efficiency of organic pollutants from real aqueous effluents, while a
supporting electrolyte has always beenadded (Lissaneddine et al., 2021b). Matrix effects are
known to interfere with the electrochemical process efficiency and the addition of salts
constitutes a supplementary source of pollution (Mousset et al., 2018, 2020a, 2020b;
Lissaneddine et al., 2021b). Moreover, the few existing models about organics electrosorption
do not include physico-chemical properties of the compounds as well as mass transport
phenomena. However, though they are of primary importance in process efficiency
(Lissaneddine et al., 2021b).
Within this context, a detailed investigation has been carried out for the first time to
understand and predict the electrosorption of PCs from simulated and actual OMWW. The
bio-sourced SA-AC beads have been implemented as a packed-bed electrode. In addition,
novel theoretical models have been proposed to predict the evolution of electrosorption of
organic compounds in simulated and real effluents considering the mass transport and
difference of pKa of the PCs.

Part III Results and Discussion
130
2. Modeling
A new model is proposed to predict the rate of phenol electrosorption onto the beads
by incorporating the transport phenomena defined by the Nernst-Planck equation (Jasielec,
2021) that include diffusion electro-migration and convection. Electro-migration was
neglected with the simulated effluent since the phenol molecule (pKa = 9.95) is uncharged at
the applied pH of 4. Though the setup is under forced convection within the column, the low
flow rate would imply that the diffusion of phenol towards the 3D porous material is not
occurring in a stationary regime. Supposing that the beads are all spherical with the same
diameter (∼ 3.5 mm), the phenol rate towards the 3D porous material (𝑟𝑐) can obey the Fick's
law under transient regime according to Eq. 30 (Miomandre et al., 2005):
𝑟𝑐 = −1
𝑆
𝑑𝐶
𝑑𝑡=
1
𝑉(𝐶𝑡 − 𝐶𝑡
𝑒𝑙)√𝐷
𝜋𝑡 (30)
where 𝐷 is the diffusion coefficient of phenol, 𝑆 is the specific surface area of the beads, t is
the time, 𝐶𝑡 and 𝐶𝑡𝑒𝑙 are the concentrations of phenol in the solution and at electrode surface at
time t, respectively.
𝐶𝑡𝑒𝑙 can be expressed as a function of 𝐶0, as follow:
𝐶𝑡𝑒𝑙 = 𝐶0 − 𝐶𝑡−1 (31)
where 𝐶𝑡−1and 𝐶0are the phenol concentrations at time t-1 and t = 0 (in min), respectively, in
the discrete model.
Then 𝐶𝑡 − 𝐶𝑡𝑒𝑙 can be expressed according to Eq. 32:
𝐶𝑡 − 𝐶𝑒𝑙 = 𝐶𝑡 + 𝐶𝑡−1−𝐶0 (32)
After incorporating Eq. 32 into Eq. 30 and integrating Eq. 30 from 𝐶𝑡 = C0 to 𝐶𝑡, Eq.
33 can be obtained:
𝑙𝑛 (𝐶𝑡 + 𝐶𝑡−1−𝐶0) = 2𝑆√𝐷
𝜋𝑉𝑡
1
2 + 𝑙𝑛 (𝐶0) (33)
When dealing with real effluents (OMWW), a mixture of PCs with different pKa
(3.0–4.0 to 10.0–11.0) should be considered (Lissaneddine et al., 2021a). Therefore, the
influence of electromigration of ionic PCs must be added into Eq. 34:

Part III Results and Discussion
131
𝑟𝑐 = −1
𝑆
𝑑𝐶
𝑑𝑡=
1
𝑉(𝐶𝑡 − 𝐶𝑡
𝑒𝑙)√𝐷
𝜋𝑡+ 𝑗𝑘 (34)
With
𝑗𝑘 = 𝐹
𝑅𝑇𝑍𝑘𝐷𝑘𝐶𝑘𝐸 =
𝐹
𝑅𝑇𝑍𝑘𝐷𝑘𝐶𝑘𝜌𝑠𝑗𝑎𝑝𝑝 (35)
where 𝑗𝑘, 𝐷𝑘,𝑍𝑘 𝑎𝑛𝑑 𝐶𝑘 are the flux, the diffusion coefficient, the valence and the
concentration of the charged PCs (k), respectively, 𝑅 is the gas constant, 𝑇 is the absolute
temperature, 𝐹 is the Faraday constant, 𝐸 is the electric field, 𝜌𝑠 is the solution resistivity,
𝑗𝑎𝑝𝑝 is the applied current density.
After integrating Eq. 34 from 𝐶𝑡 = C0 to Ct, the following Eq. 36 can be obtained:
𝑡1
2 = 𝑋+√𝑋2−4𝑌𝑍
2𝑌 (36)
With
𝑋 = 2𝑆√𝐷
𝜋𝑉 (37)
𝑌 = 𝐹𝑍𝑘𝐷𝑘𝜌𝑠𝑗𝑎𝑝𝑝
𝑅𝑇 (38)
𝑍 = 𝑙𝑛 (𝐶𝑡+𝐶𝑡−1−𝐶0
𝐶0(𝐶𝑡−𝐶0)) (39)
The fittings of the models with experimental results were evaluated with the RMSE
as written in Eq. 26.
3. Results and discussion
3.1.Electrochemical characterization of the 3D porous electrodes
The electrochemical properties of the initial SA-AC beads electrodes have been
determined to evaluate their electrochemical performance as an active electrode material. It
has been shown that the electroactive surface area, I0, the charge transfer resistance (RCT) and
the CDL values were not impacted by the content of AC in the beads. Therefore, only their
average values have been reported.
The electroactive surface area of porous electrodes determines the amount of
polarized active sites, which in turn determines the rate and yield of electrosorption. Besides,

Part III Results and Discussion
132
the electroactive surface area is a key parameter for the electrosorption efficiency (Zhu &
Zhao, 2019a). The CV showed that the beads possess a high electroactive surface area that
equaled 23 × 103
± 5.5 × 10³
cm2
(Fig. 32). Comparatively, surfaces of 0.14 cm2 with an
oxidized AC electrode (Deryło-Marczewska et al., 2019), 0.93 cm2
with an AC nanotubes-
supported palladium electrode (Wang et al., 2010) and 531 cm2 with an ACF electrode (Ergan
& Gengec, 2020) were previously estimated. The value obtained with SA-AC emphasized
that the encapsulation of AC in the beads allowed maintaining a high electroactive surface
compared to porous electrodes proposed in the literature. This is of prime interest to reach
high electrosorption capacity.
I0 was determined to evaluate the electrode's catalyst performance and the electron
transfer across the electrode (Sharma et al., 2013; Situmorang et al., 2020). The calculated I0
obtained from Tafel slopes was 3.24 mA (Fig. 32b). This value was high compared to
electrodes based on other materials and described in the literature, such as AC derived from
rice husk (0.06 to 0.17 mA) (Jiao et al., 2020) and ammonium bicarbonate and AC (0.084 to
1.5 mA) (Li et al., 2014). Knowing that a higher I0 leads to a quicker response towards a
change in potential (Sharma et al., 2013; Sun & Chen, 2016), better electrode performance
would be expected.
To further characterize the porous electrode/electrolyte interface, EIS data have been
obtained after validation of impedance spectra with the linear Kramers-Kronig transform
(KKT) technique (Fasmin & Srinivasan, 2015) (Fig. 32c). The chi-squared residues (𝜒2)
calculated for KKT fitting with experimental spectra as well as for Randle’s type EEC model
fitting with KKT were determined to be 1.5 10-5
and 9.3 10-7
, respectively. The good
agreement with EIS spectra could validate the Randle’s type circuit model that is drawn in
Fig. 33. This model further demonstrated that the electrolyte exchangesoccur directly within
the SA-AC beads and not at the beads and current collector surfaces. This could also explain
why the parameters related to electrode/electrolyte interface (electroactive surface area, I0,
RCT and CDL) were relatively constant, whatever the load of AC within the beads. The
associated RCT and CDL values of the EEC model were 1.7± 0.7 Ω and 0.15± 0.084 µF cm-2
,
respectively. The RCT was low compared with other reported porous electrodes such as
almond shell-based activated nanoporous carbon (5.8 Ω) (Jain & Tripathi, 2014), AC (4.2 Ω)
(Tian et al., 2020) and Cu2O doped AC (9.39 Ω) (Zhang et al., 2015). This trend of RCT
compared with other porous materials corroborated with the higher I0 value in the present

Part III Results and Discussion
133
case. This would therefore promote the electrosorption on the SA-AC beads electrodes. In
addition, a higher CDL value was found compared to AC (0.0058 µF cm-2
) (Tian et al., 2020),
which should increase the electric double layer and, therefore, the electrosorption efficiency
(Lissaneddine, et al., 2021b). This is discussed in the next sub-section.
Fig. 32. Electrochemical properties of the prepared SA-AC beads electrode using CV (a),
LSV (b) and EIS (c).

Part III Results and Discussion
134
Fig. 33. Scheme of the EEC model integrated into the 3D porous electrodes.
3.2.Electrosorption efficiency
3.2.1. Effect of iron and calcium contents in the beads
To optimize the stability of the bio-sourced adsorbent during the electrosorption, iron
or calcium has been added in beads preparation (Fig. 34). The results showed that the
electrosorption capacities were almost similar, in the order of 204 ± 3 mg g-1
and 197 ± 10 mg
g-1
after 240 min for 100% w/v Fe and 100% w/v Ca, respectively.
In order to be able to select the optimal element, the electrical conductivities of the
two porous electrodes (100% w/v Fe and 100% w/v Ca) were compared by EIS
measurements. Fig. 34b illustrates the Nyquist representations. The RCT values ranked as
follows: 100% w/v Fe (1.7 Ω) < 100% w/v Ca (2.6 Ω). The RCT values decreased by 1.5-fold
between 100% w/v Ca and 100% w/v Fe, highlighting an increase of electrode conductivity
with the 100% w/v Fe. This trend was assumed to be due to differences in electron hopping,
polaron and ionic radii. The transition energy between Fe2+
and Fe3+
is 0.2 eV (Iqbal &
Farooq, 2007), indicating pronounced electron hopping and, hence, a rapid increase in
conductivity with iron. Similar results have been observed in a previous study involving
divalent and trivalent metal ions' doping on magnesium aluminate. The magnesium aluminate
doped by Fe3+
had lower resistivity, i.e. higher conductivity, than the one doped by Ca2+
(Iqbal & Farooq, 2007). This was explained by the fact that the ionic radii of Ca2+
(0.99 Å)

Part III Results and Discussion
135
was larger than that of Fe3+
(0.64 Å) along with the small polaron and electron hopping with
iron (Iqbal & Farooq, 2007).
This could further explain why in this study, beads preparation with 100% w/v Fe
displayed slightly higher electrosorption capacitiesin this study. Since the increase of material
conductivity has previously been demonstrated to increase the electrosorption efficiency
(Lissaneddine et al., 2021b), the selected optimal content of crosslinking agent used for the
beads preparation was 100% w/v Fe.

Part III Results and Discussion
136
Fig. 34. Effect of the presence of iron (100% w/v) or calcium (100% w/v) in the beads
preparation: on the electrosorption efficiency of phenol (a) and on electrode conductivity
estimated from the Nyquist plot (b). Operating conditions: anode: graphite rod, cathode:
graphite rod and 35 g SA-1% w/v AC beads, cathode potential: -1.2 V/(Ag/AgCl), electrolyte:
6 g L-1
KCl, pH 4 and 4 g L-1
phenol, flow rate: 10 mL min-1
, m/V = 0.35 g mL-1
.

Part III Results and Discussion
137
3.2.2. Influence of AC percentage
The influence of AC percentage, i.e., the adsorbent dose, on phenol electrosorption
kinetics in simulated OMWW is illustrated in Fig. 35a. Firstly, it can be observed that the
electrosorption capacity increased rapidly over time as the active sites were accessible. This is
because with increasing time, the active sites tend to be saturated so that the electrosorption
capacity slowly increases until finally reaching adsorption equilibrium. Secondly, the
electrosorption capacity increased for all percentages of AC tested with increasing time. In
addition, there was an increase in electrosorption capacity with increasing percentages of AC
up to 1% w/v (183 mg g-1
). This trend was in agreement with literature in which the phenol
adsorption capacity increased with the increase of powder-AC in alginate gels (Jodra &
Mijangos, 2003). Moreover, a further increase in the percentage of AC (3% w/v) led to a
declined electrosorption capacity of phenol to 178 mg g-1
.
Interestingly, the trend of km evolution with AC percentages (Fig. 35b) was similar to
the behavior of phenol electrosorption (Fig. 35a). km values increased from 0% w/v AC (8.9
10-5
m s-1
) to 1% w/v AC (9.7 10-5
m s-1
) and decreased at 3% w/v AC (8.1 10-5
m s-1
). This
further confirmed that the electrosorption occurred mainly within the beads as suggested by
the EEC model (section 3.1 of Part III, sub-chapter I.II) and not at the graphite rod and beads
interfaces. Moreover, this suggests that the electrosorption capacity strongly depended on the
diffusivity of the phenol within the beads. It has been previously shown that when the AC
particles were trapped in a SA gel, the PCs diffused into the micropores of the SA gels and
were adsorbed by the AC enveloped in the SA matrix (Chung et al., 2003). The increase of
AC could then increase the diffusivity and, therefore the mass transport. At too high content
of AC (3% w/v), agglomeration of AC may occur, which could lead to a reduction in the
elasticity of the hydrogel network and the formation of a denser network (Tiwari et al., 2012;
Thakur, 2018). In a previous adsorption work, AC was agglomerated in the beads, which
increased the diffusional path length and the decreased adsorption capacity (Iqbal et al., 2016;
Araga et al., 2017). In addition, the mass transfer coefficient has been shown to decrease with
the increase in adsorbent particle size (Krishna et al., 1966). These statements agree with the
declined electrosorption capacity of phenol at 3% w/v AC. To better visualize the mechanism
of electrosorption with an increase of AC content within the beads, a scheme has been
proposed in Fig. 36. This drawing highlights the constant external diffusion layer, whatever

Part III Results and Discussion
138
the AC content, while the internal diffusion within the beads is affected. The mass transport is
then influenced along with the electrosorption efficiency.
Fig. 35. Effect of AC percentage (% w/v) on: the evolution of electrosorption capacity of
phenol (a), the mass transport (b) and internal ohmic resistance (c). Operating conditions:
anode: graphite rod, cathode: graphite rod and 35 g SA (100% w/v Fe)-AC beads, cathode
potential: -1.2 V/(Ag/AgCl), electrolyte: 6 g L-1
KCl, pH 4 and 4 g L-1
phenol, flow rate: 10
mL min-1
, m/V = 0.35 g mL-1
.

Part III Results and Discussion
139
Furthermore, increasing the percentage of AC might have decreased the internal
ohmic resistance of the SA-AC beads electrode from 2.9 V (0% w/v AC) to 2.2 V (1% w/v
AC) (Fig. 35c), which subsequently resulted in a higher electrosorption capacity. A further
increase of AC content (3% w/v AC) led to an increase of ∑𝑅𝐼 to 2.7 V. The reasons for this
latter trend could be explained as follows. First, the mass transport decreased at 3% w/v AC
(Fig. 35b). According to the results of Fang et al. (2005, 2006) the delayed transport of the
ions into electrode (modified AC aerogel) pores increased internal ohmic resistance (Fang et
al., 2005; Fang & Binder, 2006). Consequently, the AC percentage influenced the ion's
transport and, next the internal ohmic resistance. Bian et al. (2016) demonstrated that the
electrosorption performance significantly improved with a decrease in the electrode's internal
ohmic resistance (14 to 3.6 Ω) for inorganic compounds on a membrane capacitive
deionization reactor (Bian et al., 2016). This was further evidenced in this study for organic
compounds electrosorption on a fixed-bed column reactor with beads electrode. To conclude,
∑𝑅𝐼 seemed, therefore, to be correlated with the mass transport as well as the AC content in
the beads and the related electrosorption efficiency.
Upon these results, the optimum percentage of AC was taken as 1% w/v for the next
electrosorption experiments.

Part III Results and Discussion
140
Fig. 36. Mechanism of phenol electrosorption in SA-AC beads with increasing AC content.
4.2.1. Effect of cathode potential
The influence on phenol electrosorption efficiency of Ecat varying from -0.8 to -1.3
V/(Ag/AgCl) compared to OC condition is shown in Fig. 37. The electrosorption capacity
increased with decreasing applied potential from -0.8 to -1.2 V/(Ag/AgCl), reaching a
maximum electrosorption capacity of 170 mg g-1
at equilibrium (Fig. 37a). It has been
previously demonstrated that the potential could impact the electrosorption capacity of
uncharged molecules (Gileadi, 1966b), which was the case of phenol (pKa = 9.95)
considering the solution pH of 4. The electrode pola rization induces the replacement of
solvent molecules with the organic compound at the interface, enhancing its electrosorption.
However, the electrosorption capacity decreased to 73 mg g-1
, when the applied potential
equaled -1.3 V/(Ag/AgCl). At this range of cathode potential, the reduction of water (H2O)
starts occurring according to Eq. (40), in which hydrogen gas (H2) is produced on the surface
of the 3D electrode (Ziati & Hazourli, 2019).

Part III Results and Discussion
141
2𝐻2𝑂 + 2𝑒ˉ → 𝐻2 + 2𝑂𝐻ˉ (40)
This H2 electrogeneration limit the availability of the active sites on the cathode
surface (Hazourli et al., 1996b; Adnan et al., 2021b). Therefore, the involvement of this
faradaic reaction strongly reduced the electrosorption capacity to 73 mg g-1
, which was even
lower than in OC condition (123 mg g-1
). In this latter case, the absence of electric current
emphasized the gain (38%) obtained with electrosorption at optimal voltage compared with
the sole adsorption.
The energy requirement is an important economic parameter to take into account in
the electrosorption process optimization. Considering the electrosorption efficiency as
function of specific charge values (Fig. 37b), decreasing the applied potential increased the
specific charge. The maximum electrosorption capacity (around 170 mg g-1
) was reached after
only 0.28 Ah L-1
at -1.1 V/(Ag/AgCl), compared to 2 Ah L-1
at -1.2 V/(Ag/AgCl). Thus, the
applied Ecat was taken as -1.1 V/(Ag/AgCl) for the next electrosorption experiment with real
OMWW.

Part III Results and Discussion
142
Fig. 37. Effect of Ecat (V/(Ag/AgCl)) considering the contact time (a) and the specific charge
(b) on the electrosorption of phenol. Operating conditions: anode: graphite rod, cathode:
graphite rod and 35 g SA (100% w/v Fe)-1% w/v AC beads, electrolyte: 6 g L-1
KCl, pH 4
and 4 g L-1
phenol, flow rate: 10 mL min-1
, m/V = 0.35 g mL-1
.

Part III Results and Discussion
143
4.2.2. Multi-components effect with actual effluent
Electrosorption experiment with real OMWW has been carried out under optimal
conditions: 1% w/v of AC, 100% w/v of Fe and -1.1 V/(Ag/AgCl) of Ecat (Fig. 38). The
results showed that the maximum electrosorption capacity of PCs was higher (307 mg g-1
)
than with phenol solutions (164 mg g-1
) in simulated OMWW. This difference could be
explained by the presence of multiple PCs having different physico-chemical properties, such
as diverse pKa values. The main PCs identified in actual OMWW have been listed in a
previous paper (Lissaneddine et al., 2021a) and their pKa ranged from 3.0-4.0 to 10.0-11.0. It
is usually assumed that the acidic forms of the PCs remain uncharged, while their basic forms
are ionized due to the presence of many hydroxyl (OH/O-) and carboxyl (COOH/COO
-)
functions in these molecules (Baransi et al., 2012; Liu et al., 2020). The charged PCs were
therefore subjected to electro-migration in supplement to diffusion. Though the surface of the
SA-AC beads was negatively charged (cathode), electrostatic repulsion between the PCs
negatively charged and negative charge of the surface of the SA-AC beads could still promote
contact with the beads (Parida & Pradhan, 2010). In addition, since the hydraulic flow is
ascending, from the negative fixed-bed electrode to the positive counter electrode, the electro-
migration could also favor the contact of PCs already within the fixed-bed electrode.
Therefore, their electrosorption rates and yields were maximized. The influence of electro-
migration was previously noticed with other organic compounds (e.g., acid red 88, orange II,
and methylene blue) in simulated effluents (Sun et al., 2016b; Yue et al., 2019c; Lissaneddine
et al., 2021b). The present results newly demonstrated the influence of electro-migration with
a multi-component system containing organics in an actual effluent.
Based on this trend, the SA-AC beads electrode could be used to separate not only
phenol but also other PCs (47%) from actual OMWW by electrosorption for subsequent
valorization upon further research studies.

Part III Results and Discussion
144
Fig. 38. Effect of contact time on the electrosorption of PCs from real OMWW at optimal
operating conditions. Operating conditions: anode: graphite rod, cathode: graphite rod and 35
g SA (100% w/v Fe)-1% w/v AC beads, cathode potential: -1.1 V/(Ag/AgCl), flow rate: 10
mL min-1
, m/V ratio = 0.35 g mL-1
.
4.2.3. Theoretical evolution of organic compounds electrosorption in simulated and
actual effluents
The models developed in section 2 of Part III, sub-chapter I.II have been used to
predict the electrosorption evolution of phenol in simulated OMWW as a function of AC
content (Fig. 39a) and of PCs in real OMWW (Fig. 39b). All the RMSE values were lower
than 2.95 × 10⁻²
, which confirmed the good agreement of the model with the experimental
data. Thus, the diffusion in simulated effluent and diffusion along with electro-migration in
real effluent would be the main phenomena involved in the kinetics of organic compounds
electrosorption.
The good fitting with real effluent further supported the estimated average value of
valence of ionic PCs that was estimated to be 3.8. This value was obtained by weighting the
valence of each PC supposed to be charged under the solution pH of 4.8 by the proportion of
their basic form and their average concentrations in real effluent. The main ionic PCs
identified in actual OMWW were gallic acid (valence of 5), ferulic acid (valence of 5), caffeic
acid (valence of 4), cinnamic acid (valence of 2), and coumaric acid (valence of 3), according
to a previous study (Lissaneddine et al., 2021a).

Part III Results and Discussion
145
Furthermore, based on slopes values (2𝑆√𝐷
𝜋𝑉) of 𝑙𝑛 (𝐶𝑡 + 𝐶𝑡−1−𝐶0) = f(t
1/2) (Eq. 33),
the diffusivity constant for phenol could be estimated as function of AC content (𝐷𝑋%) as
follows (Eq. 41):
𝐷𝑋% =𝜋𝑉2
4𝑆2 (41)
The evolution of 𝐷𝑋% as a function of AC content has been plotted in Fig. 39c. The
trend was following the electrosorption capacity of phenol at different AC percentages (Fig.
35a), i.e. optimal diffusion (7.3 10-9
m2 s
-1) at 1% w/v AC. This was also in agreement with
km values evolution (Fig. 35b). This further corroborated that the electrosorption capacity
strongly depended on the diffusivities of the PCs within the beads.

Part III Results and Discussion
146
Fig. 39. Experimental (symbol) versus theoretical correlations (continuous line) as a function
of t1/2
in simulated OMWW as function of AC content (a) and of PCs in real OMWW (b),
effect of the percentage of AC on the diffusion coefficient (c).
Part III Results and Discussion
147
4. Conclusions
This study proposed a novel approach to remove the PCs from simulated and actual
OMWW by implementing electrosorption onto SA-AC beads as a porous electrode. The
impacts of key parameters (crosslinking agent (iron and calcium), AC content and cathode
potential) on the removal efficiency of PCs were explored. The main new insights can be
listed as follows:
The higher conductivity obtained with Fe crosslinking agent led to slightly higher
electrosorption efficiency compared to Ca.
The AC content within the beads impacted the mass transfer and the diffusion
coefficients as well as the internal ohmic resistance. An optimal AC amount was noticed (1%
w/v), because too high a concentration implied agglomeration.
An Ecat of -1.1 V/(Ag/AgCl) was found optimal considering the electrosorption
capacity and energy requirements. However, too high voltage leads to faradaic reactions that
hamper the electrosorption mechanism.
The electrosorption efficiency was higher with real wastewater compared to simulated
effluent. This could be due to the presence of multiple organic components that have different
pKa.
New discrete models have been proposed to understand and predict electrosorption
efficiency. The kinetics were mainly limited by diffusion in transient regime in synthetic
effluent, while electro-migration of ionic PCs also impacted the electrosorption with real
OMWW.
The results, the EEC model and the kinetic models could confirm that electrosorption
mainly occurred within the beads and not at the 3D electrode/electrolyte interface, unlike
often assessed.
The good electrosorption efficiency obtained for PCs removal from OMWW is
promising for PCs recovery for subsequent valorization. A further possibility would be to
combine electrosorption for recovery with a degradation process to eliminate unwanted
compounds, which is the subject of ongoing research.

Part III Results and Discussion
148
References
Adebayo, M.A., Areo, F.I., 2021. Removal of phenol and 4-nitrophenol from wastewater
using a composite prepared from clay and Cocos nucifera shell: Kinetic, equilibrium
and thermodynamic studies. Resour. Environ. Sustain. 3, 100020.
https://doi.org/10.1016/j.resenv.2021.100020
Adnan, F.H., Mousset, E., Pontvianne, S., Pons, M., 2021a. Mineral cathodic electro-
precipitation and its kinetic modelling in thin-film microfluidic reactor during advanced
electro-oxidation process. Electrochim. Acta 387, 138487.
https://doi.org/10.1016/j.electacta.2021.138487
Adnan, F.H., Pons, M.-N., Mousset, E., 2021b. Mass transport evolution in microfluidic thin
film electrochemical reactors: New correlations from millimetric to submillimetric
interelectrode distances. Electrochem. commun. 130, 107097.
https://doi.org/10.1016/j.elecom.2021.107097
Aharonov-Nadborny, R., Raviv, M., Graber, E.R., 2016. Soil spreading of liquid olive mill
processing wastes impacts leaching of adsorbed terbuthylazine. Chemosphere 156, 220–
227. https://doi.org/10.1016/j.chemosphere.2016.04.104
Andrés García, E., Agulló-Barceló, M., Bond, P., Keller, J., Gernjak, W., Radjenovic, J.,
2018. Hybrid electrochemical-granular activated carbon system for the treatment of
greywater. Chem. Eng. J. 352, 405–411. https://doi.org/10.1016/j.cej.2018.07.042
Araga, R., Soni, S., Sharma, C.S., 2017. Fluoride adsorption from aqueous solution using
activated carbon obtained from KOH-treated jamun (Syzygium cumini) seed. J.
Environ. Chem. Eng. 5, 5608–5616. https://doi.org/10.1016/j.jece.2017.10.023
Azzam, M.O.J., Hazaimeh, S.A., 2021. Olive mill wastewater treatment and valorization by
extraction/concentration of hydroxytyrosol and other natural phenols. Process Saf.
Environ. Prot. 148, 495–523. https://doi.org/10.1016/j.psep.2020.10.030
Baransi, K., Dubowski, Y., Sabbah, I., 2012. Synergetic effect between photocatalytic
degradation and adsorption processes on the removal of phenolic compounds from olive
mill wastewater. Water Res. 46, 789–798. https://doi.org/10.1016/j.watres.2011.11.049
Bian, Y., Liang, P., Yang, X., Jiang, Y., Zhang, C., Huang, X., 2016. Using activated carbon
fiber separators to enhance the desalination rate of membrane capacitive deionization.
Desalination 381, 95–99. https://doi.org/10.1016/j.desal.2015.11.016
Brillas, E., Garcia-Segura, S., 2020. Benchmarking recent advances and innovative
technology approaches of Fenton, photo-Fenton, electro-Fenton, and related processes:
A review on the relevance of phenol as model molecule. Sep. Purif. Technol. 237,
116337. https://doi.org/10.1016/j.seppur.2019.116337
Cañizares, P., Marcos, I.F. De, Rodrigo, M.A., Lobato, J., 2006. Measurement of mass-
transfer coefficients by an electrochemical technique. J. Chem. Educ. 83, 1204–1207.
https://doi.org/10.1021/ed083p1204
Chai, Y., Qin, P., Wu, Z., Bai, M., Li, W., Pan, J., Cao, R., Chen, A., Jin, D., Peng, C., 2021.
A coupled system of flow-through electro-Fenton and electrosorption processes for the
efficient treatment of high-salinity organic wastewater. Sep. Purif. Technol. 267,
118683. https://doi.org/10.1016/j.seppur.2021.118683
Chung, T., Tseng, H., Juang, R., 2003. Mass transfer effect and intermediate detection for
phenol degradation in immobilized Pseudomonas putida systems 38, 1497–1507.
https://doi.org/10.1016/S0032-9592(03)00038-4
Deryło-Marczewska, A., Skrzypczyńska, K., Kuśmierek, K., Świątkowski, A., Zienkiewicz-
Strzałka, M., 2019. The adsorptive properties of oxidized activated carbons and their

Part III Results and Discussion
149
applications as carbon paste electrode modifiers. Adsorption 25, 357–366.
https://doi.org/10.1007/s10450-019-00016-6
Ergan, B.T., Gengec, E., 2020. Dye degradation and kinetics of online electro-Fenton system
with thermally activated carbon fiber cathodes. J. Environ. Chem. Eng. 8, 104217.
https://doi.org/10.1016/j.jece.2020.104217
Esteves, B.M., Morales-Torres, S., Maldonado-Hódar, F.J., Madeira, L.M., 2021. Integration
of olive stones in the production of Fe/AC-catalysts for the CWPO treatment of
synthetic and real olive mill wastewater. Chem. Eng. J. 411.
https://doi.org/10.1016/j.cej.2021.128451
Fang, B., Binder, L., 2006. A modified activated carbon aerogel for high-energy storage in
electric double layer capacitors. J. Power Sources 163, 616–622.
https://doi.org/10.1016/j.jpowsour.2006.09.014
Fang, B., Wei, Y.Z., Maruyama, K., Kumagai, M., 2005. High capacity supercapacitors
based on modified activated carbon aerogel. J. Appl. Electrochem. 35, 229–233.
https://doi.org/10.1007/s10800-004-3462-6
Fang, Z., Cao, X., Li, Xuexiao, Wang, H., Li, Xianning, 2017. Electrode and azo dye
decolorization performance in microbial-fuel-cell- coupled constructed wetlands with
different electrode size during long-term wastewater treatment. Bioresour. Technol.
238, 450–460. https://doi.org/10.1016/j.biortech.2017.04.075
Fasmin, F., Srinivasan, R., 2015. Detection of nonlinearities in electrochemical impedance
spectra by Kramers–Kronig transforms. J. Solid State Electrochem. 19, 1833–1847.
https://doi.org/10.1007/s10008-015-2824-9
Genethliou, C., Kornaros, M., Dailianis, S., 2020. Biodegradation of olive mill wastewater
phenolic compounds in a thermophilic anaerobic upflow packed bed reactor and
assessment of their toxicity in digester effluents. J. Environ. Manage. 255, 109882.
https://doi.org/10.1016/j.jenvman.2019.109882
Gileadi, E., 1966. Electrosorption of uncharged molecules on solid electrodes. J. Electroanal.
Chem. 11, 137–151. https://doi.org/10.1016/0022-0728(66)80073-6
Haddad, K., Jeguirim, M., Jellali, S., Thevenin, N., Ruidavets, L., Limousy, L., 2021.
Biochar production from Cypress sawdust and olive mill wastewater: Agronomic
approach. Sci. Total Environ. 752, 141713.
https://doi.org/10.1016/j.scitotenv.2020.141713
Hazourli, S., Bonnecaze, G., Astruc, M., 1996. Adsorption et electrosorption de composes
organiques sur charbon actif en grains partie i - influence du potentiel imposé et du
nombre de cycles adsorption and electrosorption of organic compounds on granular
activated carbon part i - influence of applied. Environ. Technol. (United Kingdom) 17,
1275–1283. https://doi.org/10.1080/09593330.1996.9618457
He, F., Hemmatifar, A., Bazant, M.Z., Hatton, T.A., 2020. Selective adsorption of organic
anions in a flow cell with asymmetric redox active electrodes. Water Res. 182, 115963.
https://doi.org/10.1016/j.watres.2020.115963
Iqbal, M., Iqbal, N., Bhatti, I.A., Ahmad, N., Zahid, M., 2016. Response surface
methodology application in optimization of cadmium adsorption by shoe waste: A good
option of waste mitigation by waste. Ecol. Eng. 88, 265–275.
https://doi.org/10.1016/j.ecoleng.2015.12.041
Iqbal, M.J., Farooq, S., 2007. Effect of doping of divalent and trivalent metal ions on the
structural and electrical properties of magnesium aluminate. Mater. Sci. Eng. B Solid-
State Mater. Adv. Technol. 136, 140–147. https://doi.org/10.1016/j.mseb.2006.09.009
Jain, A., Tripathi, S.K., 2014. Almond shell-based activated nanoporous carbon electrode for

Part III Results and Discussion
150
EDLCs. https://doi.org/10.1007/s11581-014-1282-1
Jasielec, J.J., 2021. Electrodiffusion Phenomena in neuroscience and the Nernst–Planck–
Poisson equations. Electrochem 2, 197–215.
https://doi.org/10.3390/electrochem2020014
Jiao, Y., Hu, Y., Han, L., Zhou, M., 2020. Activated carbon derived from rice husk as
efficient oxygen reduction catalyst in microbial fuel cell. Electroanalysis 32, 2969–
2975. https://doi.org/10.1002/elan.202060409
Jodra, Y., Mijangos, F., 2003. Phenol adsorption in immobilized activated carbon with
alginate gels phenol adsorption in immobilized activated. Sep. Sci. Technol. 37–41.
https://doi.org/10.1081/SS-120019412
Krishna, M. S., Raju, G. J., & Rao, C. V., 1966. Mass transfer in packed beds in annuli
electrolytic redox reactions. Period. Polytech. Chem. Eng. 11, 95–102.
Li, D., Qu, Y., Liu, J., He, W., Wang, H., Feng, Y., 2014. Using ammonium bicarbonate as
pore former in activated carbon catalyst layer to enhance performance of air cathode
microbial fuel cell. J. Power Sources 272, 909–914.
https://doi.org/10.1016/j.jpowsour.2014.09.053
Li, Y., Zhang, C., Jiang, Y., Wang, T., Wang, H., 2016. Effects of the hydration ratio on the
electrosorption selectivity of ions during capacitive deionization. DES 399, 171–177.
https://doi.org/10.1016/j.desal.2016.09.011
Lissaneddine, A., Mandi, L., Achaby, M. El, Mousset, E., Rene, E.R., Ouazzani, N., Pons,
M.-N., Aziz, F., 2021a. Performance and dynamic modeling of a continuously operated
pomace olive packed bed for olive mill wastewater treatment and phenol recovery.
Chemosphere 280, 130797. https://doi.org/10.1016/j.chemosphere.2021.130797
Lissaneddine, A., Pons, M.-N., Aziz, F., Ouazzani, N., Mandi, L., Mousset, E., 2021b. A
critical review on the electrosorption of organic compounds in aqueous effluent –
Influencing factors and engineering considerations. Environ. Res. J. 204, 112128.
https://doi.org/10.1016/j.envres.2021.112128
Liu, B., Zhong, F., Yokoyama, W., Huang, D., Zhu, S., Li, Y., 2020. Interactions in starch
co-gelatinized with phenolic compound systems: Effect of complexity of phenolic
compounds and amylose content of starch. Carbohydr. Polym. 116667.
https://doi.org/10.1016/j.carbpol.2020.116667
Macías-García, A., Carrasco-Amador, J.P., Encinas-Sánchez, V., Díaz-Díez, M.A., Torrejón-
Martín, D., 2019. Preparation of activated carbon from kenaf by activation with H3PO4.
Kinetic study of the adsorption/electroadsorption using a system of supports designed in
3D, for environmental applications. J. Environ. Chem. Eng. 7, 103196.
https://doi.org/10.1016/j.jece.2019.103196
Miller, A., Singh, L., Wang, L., Liu, H., 2019. Linking internal resistance with design and
operation decisions in microbial electrolysis cells. Environ. Int. 126, 611–618.
https://doi.org/10.1016/j.envint.2019.02.056
Miomandre, F., Sadki, S., Audebert, P., Méallet-Renault, R., 2005. Electrochimie - Des
concepts aux applications. Dunod, Paris. (in French), Paris.
Mousset, E., 2020a. Unprecedented reactive electro-mixing reactor: Towards synergy
between micro- and macro-reactors? Electrochem. Commun. 118, 106787.
https://doi.org/10.1016/j.elecom.2020.106787
Mousset, E., Frunzo, L., Esposito, G., Hullebusch, E.D. van, Oturan, N., Oturan, M.A.,
2016a. A complete phenol oxidation pathway obtained during electro-Fenton treatment
and validated by a kinetic model study. Appl. Catal. B Environ. 180, 189–198.
https://doi.org/10.1016/j.apcatb.2015.06.014

Part III Results and Discussion
151
Mousset, E., Huang Weiqi, V., Foong Yang Kai, B., Koh, J.S., Tng, J.W., Wang, Z.,
Lefebvre, O., 2017. A new 3D-printed photoelectrocatalytic reactor combining the
benefits of a transparent electrode and the Fenton reaction for advanced wastewater
treatment. J. Mater. Chem. A 5, 24951–24964. https://doi.org/10.1039/c7ta08182k
Mousset, E., Loh, W.H., Lim, W.S., Jarry, L., Wang, Z., Lefebvre, O., 2021. Cost
comparison of advanced oxidation processes for wastewater treatment using
accumulated oxygen-equivalent criteria. Water Res. 200, 117234.
https://doi.org/https://doi.org/10.1016/j.electacta.2021.138466
Mousset, E., Pontvianne, S., Pons, M.-N., 2018. Fate of inorganic nitrogen species under
homogeneous Fenton combined with electro-oxidation/reduction treatments in synthetic
solutions and reclaimed municipal wastewater. Chemosphere 201, 6–12.
https://doi.org/10.1016/j.chemosphere.2018.02.142
Mousset, E., Quackenbush, L., Schondek, C., Gerardin-Vergne, A., Pontvianne, S., Kmiotek,
S., Pons, M.N., 2020b. Effect of homogeneous Fenton combined with electron transfer
on the fate of inorganic chlorinated species in synthetic and reclaimed municipal
wastewater. Electrochim. Acta 334, 135608.
https://doi.org/10.1016/j.electacta.2019.135608.
Mousset, E., Wang, Z., Hammaker, J., Lefebvre, O., 2016b. Physico-chemical properties of
pristine graphene and its performance as electrode material for electro-Fenton treatment
of wastewater. Electrochim. Acta 214, 217–230.
https://doi.org/10.1016/j.electacta.2016.08.002
Parida, K.M., Pradhan, A.C., 2010. Removal of phenolic compounds from aqueous solutions
by adsorption onto manganese nodule leached residue. J. Hazard. Mater. 173, 758–764.
https://doi.org/10.1016/j.jhazmat.2009.09.003
Sahin, E.M., Tongur, T., Ayranci, E., 2020. Removal of azo dyes from aqueous solutions by
adsorption and electrosorption as monitored with in-situ UV-visible spectroscopy. Sep.
Sci. Technol. 55, 3287–3298. https://doi.org/10.1080/01496395.2019.1676786
Selman, J.R., Tobias, C.W., 1978. Mass-Transfer Measurements by the limiting-current
technique. Adv. Chem. Eng. 10, 211–318.
Sharma, M., Jain, P., Varanasi, J.L., Lal, B., Rodríguez, J., Lema, J.M., Sarma, P.M., 2013.
Enhanced performance of sulfate reducing bacteria based biocathode using stainless
steel mesh on activated carbon fabric electrode. Bioresour. Technol. 150, 172–180.
https://doi.org/10.1016/j.biortech.2013.09.069
Singleton, V. L., & Rossi, J.A., 1965. Colorimetry of total phenolic substances. US Am.
Chem. Soc. Symp. Ser. 26, 47–70.
Situmorang, R.S., Seri, O., Kawai, H., 2020. Estimation of exchange current density for
hydrogen evolution reaction of copper electrode by using the differentiating polarization
method. Appl. Surf. Sci. 505, 144300. https://doi.org/10.1016/j.apsusc.2019.144300
Sun, D., Chen, Y., 2016. Electrode Kinetics of CO2 Electroreduction.
https://doi.org/10.1201/b20177-4
Sun, X.-F., Guo, B.-B., He, L., Xia, P.-F., Shu-Guang Wang, 2016. Electrically accelerated
removal of organic pollutants by a three-dimensional graphene aerogel. AIChE J. 59,
215–228. https://doi.org/10.1002/aic
Taylor, P., Ji, M., Jiang, X., Wang, F., 2015. Desalination and water treatment a mechanistic
approach and response surface optimization of the removal of oil and grease from
restaurant wastewater by electrocoagulation and electroflotation. Desalin. water Treat.
37–41. https://doi.org/10.1080/19443994.2014.929034
Thakur, S., Arotiba, O., 2018. Synthesis, characterization and adsorption studies of an acrylic

Part III Results and Discussion
152
acid-grafted sodium alginate-based TiO2 hydrogel nanocomposite. Adsorption Science
and Technology 36. https://doi.org/10.1177/0263617417700636
Tian, X., Bao, S., Zhang, Y., 2020. Adsorption properties of V(IV) on the resin-activated
carbon composite electrodes in capacitive deionization. International Journal of
Minerals, Metallurgy and Materials. 28(11),, 1777-1787.
https://dx.doi.org/10.1007/s12613-020-2100-6
Tiwari, A., Soni, A., Bajpai, A.K., 2012. Nanoparticles loaded alginate beads as potential
adsorbent for removal of phenol from aqueous solution. Synth. React. Inorganic, Met.
Nano-Metal Chem. 42, 1158–1166. https://doi.org/10.1080/15533174.2012.682835
Tundis, R., Conidi, C., Loizzo, M.R., Sicari, V., Cassano, A., 2020. Olive mill wastewater
polyphenol-enriched fractions by integrated membrane process: A promising source of
antioxidant, hypolipidemic and hypoglycaemic compounds. Antioxidants, 9(7), 602.
Ververi, M., Goula, A.M., 2019. Pomegranate peel and orange juice by-product as new
biosorbents of phenolic compounds from olive mill wastewaters. Chem. Eng. Process.
Process Intensif. 138, 86–96. https://doi.org/10.1016/j.cep.2019.03.010
Wang, Y., Sheng, Z.M., Yang, H., Jiang, S.P., Li, C.M., 2010. Electrocatalysis of carbon
black- or activated carbon nanotubes-supported Pd-Ag towards methanol oxidation in
alkaline media. Int. J. Hydrogen Energy 35, 10087–10093.
https://doi.org/10.1016/j.ijhydene.2010.07.172
Yang, W., Zhou, M., Ma, L., 2021. A continuous flow-through system with integration of
electrosorption and peroxi-coagulation for efficient removal of organics. Chemosphere
274, 129983. https://doi.org/10.1016/j.chemosphere.2021.129983
Yao, C., Zhang, W., Xu, L., Cheng, M., Su, Y., Xue, J., Liu, J., Hou, S., 2021. A facile
synthesis of porous MXene-based freestanding film and its spectacular electrosorption
performance for organic dyes. Sep. Purif. Technol. 263, 118365.
https://doi.org/10.1016/j.seppur.2021.118365
Yue, F., Zhang, Q., Xu, L., Zheng, Y., Yao, C., Jia, J., Leng, W., Hou, S., 2019. Porous
reduced graphene oxide/single-walled carbon nanotube film as freestanding and flexible
electrode materials for electrosorption of organic dye. ACS Appl. Nano Mater. 2, 6258–
6267. https://doi.org/10.1021/acsanm.9b01236
Zhang, X., Li, K., Yan, P., Liu, Z., Pu, L., 2015. N-type Cu2O doped activated carbon as
catalyst for improving power generation of air cathode microbial fuel cells. Bioresour.
Technol. 187, 299–304. https://doi.org/10.1016/j.biortech.2015.03.131
Zhu, P., Zhao, Y., 2019. Cyclic voltammetry measurements of electroactive surface area of
porous nickel: Peak current and peak charge methods and diffusion layer effect. Mater.
Chem. Phys. 233, 60–67. https://doi.org/10.1016/j.matchemphys.2019.05.034
Ziati, M., Hazourli, S., 2019. Experimental investigation of activated carbon prepared from
date stones adsorbent electrode for electrosorption of lead from aqueous solution.
Microchem. J. 146, 164–169. https://doi.org/10.1016/j.microc.2018.12.041

153
Chapter II: Granular activated
carbon

Part III Results and Discussion
154
I. Granular activated carbon based on pomace olive for olive mill
wastewater treatment and phenol recovery
1. Introduction
Generally, the OMWW treatment by adsorption on GAC is mostly used after coagulation,
flocculation, sedimentation and advanced oxidation processes (Bertin et al., 2004; Yonar &
Azbar, 2005; Ena et al., 2009; Enaime et al., 2019). Unfortunately, few researchers have
studied the treatment of OMWW by adsorption alone without combining it with any other
method except the work of Ena et al. (2012). The latter investigated the GAC of PCs
adsorption at concentrations in the 12.5–200 g L−1
range, which showed the GAC had a great
adsorbing capacity, starting from the lowest concentration tested (12.5 g L-1
) (Ena et al.,
2012). Also, Garcia-Araya et al. (2003) studied the adsorption of three PCs on a GAC with a
relatively small surface area (Alvarez & Ingenier, 2003). To the authors' knowledge, GAC
used in these works is commercial GAC.
This chapter investigates the production of high surface GAC from olive pomace and
studies in more detail the removal of PCs from real OMWW in fixed-bed column adsorption
using the developed GAC. These works provide a fundamental understanding of the real
OMWW effects on adsorption and its impact on the adsorptive properties of PCs on GAC. In
addition, the effects of bed depth influent and flow rate on PCs removal are studied. Finally,
the Thomas and the Yoon-Nelson kinetic models are employed to simulate experimental data
to evaluate their column performance on PCs.
2. Results and discussion
2.1.Physicochemical properties of effluent
The OMWW exhibited a brown to reddish-brown coloring, cloudy appearance and a
strong olive oil smell. Table 16 shows the physicochemical properties of the investigated raw
OMWW. The OMWW has shown an acidic pH (4.54) caused by the presence of organic acids
(Elabdouni et al., 2020). The pH value recorded in our study was in the same range (between
4.2 and 5.9) as the one cited in the literature (Bagheri et al., 2020). The effluent was also
characterized by a high electrical conductivity value (16.2 mS cm-1
); this high value was

Part III Results and Discussion
155
ascribed to the high content of salts in OMWW. The predominance of toxic substances also
characterized the OMWW; mostly, the content of PCs in OMWW was 10.6 g L-1
.
Table 16. Physicochemical parameters of OMWW.
Parameters Value
pH 4.54 ± 0.004
Electrical conductivity (mS cm-1
) 16.2 ± 0.04
Total dry matter (g L-1
) 80.6 ± 3.8
Mineral matter (g L-1
) 17.3 ± 2.3
Suspended matter (g L-1
) 14.4 ± 2.1
COD (g-O2 L-1
) 192 ± 12
Total phosphorus (g L-1
) 2.1 ± 0.03
Orthophosphate (g L-1
) 0.31 ± 0.004
Nitrite (g L-1
) 0.21 ± 0.004
Ammonia nitrogen (g L-1
) 0.20 ± 0.09
Total PCs (g L-1
) 10.6 ± 0.04
Total sugars (g L-1
) 20.2 ± 1.2
Chloride (g L-1
) 8.5 ± 0.94
2.2.Preparation and characterization of GAC
The results about the GAC preparation with different mass ratios of
activator/precursor (1: 1, 2: 1, 3: 1, 5: 1) have been shown in Fig. 40. It was observed after
three repetitions that the 3: 1 mass ratio was the best. This is because the pore volume of the
GAC increased continuously with the rate of impregnation. As a result, it created a micropore
structure and increased the enlargement of the micropores to the mesopores (Sudaryanto et al.,
2006). In addition, the adsorption of PCs (small sizes: average molecular diameter = 0.557
nm) was favored on microporous AC. Therefore, the optimum mass ratio was taken as (3: 1)
for GAC production by considering these results.

Part III Results and Discussion
156
Fig. 40. Effect of the mass ratio of activator / precursor on the adsorption of phenol in batch.
Phenol concentration = 4,000 mg L-1
, pH = 4, stirring = 200 rpm-1
.
FTIR was used to determine the functional groups on the GAC’s surface before and
after adsorption by the infrared spectra transmission (Fig. 41). It can be observed that many
absorption bands belong to the –OH groups. The broadbands at 3400 and 3600 cm−1
were
assigned to –OH stretching, corresponding to the water as moisture (Orha et al., 2017). Both
bands around 2957 and 2878 cm−1
represented the (C–H) asymmetric, symmetric vibrations in
methyl and methylene groups, respectively (Alhamed & Bamufleh, 2009). A major band was
observed at 1444 cm−1
(asymmetric vibrations), representing the aqueous carboxylates
(COO−) (Shafeeyan et al., 2011; Orha et al., 2017). A small shoulder at 1118 cm
−1 could be
assigned to alcohol (R–OH) groups (Alhamed & Bamufleh, 2009).
0
100
200
300
400
500
600
700
800
1:1 2:1 3:1 5:1
q (
mg g
-1)
Mass ratios (activator / precursor)

Part III Results and Discussion
157
Fig. 41. FTIR spectra of GAC.
The surface morphology of GAC was characterized by SEM (Fig. 42). It is observed
that GAC had a porous surface and rough areas with pores of different sizes. EDS results of
GAC are shown in Table 17, the semiquantitative elemental analysis of the GAC surface
indicating the major elements on the GAC were C (81.48 W%) and O (14.62 W%). In
addition, traces of Na (1.96 W%), P (0.15 W%), Cl (0.25 W%), K (0.91 W%) and Ca (0.63
W%) species were identified as impurities of the olive pomace material and activation.
Under optimal conditions, the generated AC had a specific surface area of 1,012 m2
g-1
with an average pore size of 1.5 nm.
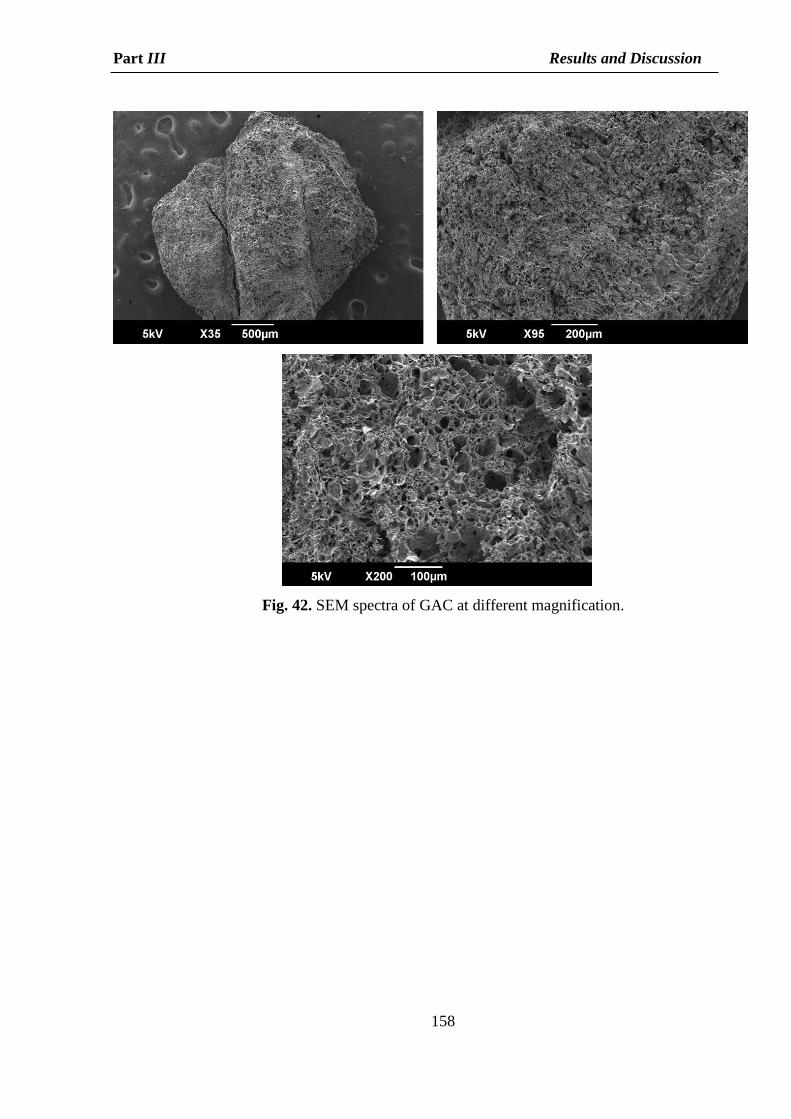
Part III Results and Discussion
158
Fig. 42. SEM spectra of GAC at different magnification.

Part III Results and Discussion
159
Table 17. EDS of GAC.
Element W% at.%
C 81.48 86.58
O 14.62 11.68
Na 1.96 1.09
P 0.15 0.06
Cl 0.25 0.09
K 0.91 0.30
Ca 0.63 0.20
100.00 100.00
2.3.Adsorption efficiency
2.3.1. Adsorption equilibrium study
The initial concentration of PCs effect on the GAC adsorbent was examined at 20–
5,000 mg L−1
. The results obtained are given in Fig. 43a. The adsorption capacity of PCs
increased with the concentration of PCs in solution from 20 to 1,733 mg g−1
at 20 and 5,000
mg L−1
, respectively. The curves were favorable, presenting an inclined shape at a low
equilibrium concentration of PCs. A plateau was observed at higher concentrations of PCs,
indicating the saturation of the GAC surface. This behavior indicates the high active
adsorption sites and the high efficiency of the GAC to remove PCs.
In order to clarify and understand the sorption process of PCs onto GAC, Langmuir
and Freundlich's adsorption isotherm models were investigated in this study. The adsorption
isotherms for adsorption of PCs on GAC from different adsorption models are shown in Figs.
43b and 43c. It was found that the R2 values of the Langmuir isotherm were higher than those
of the Freundlich isotherm, with R2
of 0.997. These results demonstrate that the adsorption of
PCs by GAC was better, followed by the Langmuir isotherm model. Accordingly, the
monolayer maximum adsorption capacity of PCs was 1,666 mg g−1
. This result indicated that
the adsorption of PCs behaviors over GAC was mainly a monolayer adsorption reaction,
which involved chemical-physical adsorption equilibrium mechanism (Dong et al., 2021;
Lissaneddine et al., 2021a). Furthermore, the KLvalue, which usually describes adsorption
energy, equaled 6.10-4
L mg−1
. This suggests that the spontaneity of the adsorption of PCs

Part III Results and Discussion
160
could easily occur on the GAC surface (Dong et al., 2021; Franco et al., 2021). Moreover, it
was notable that the value of 1/n from the Freundlich isotherm model was in range of 0–1,
suggesting that chemical adsorption was favored on the surface of GAC (Dong et al., 2021).
Fig. 43. Effect of the initial concentration on the adsorption of PCs (a), adsorption isotherm:
(b) Langmuir and (c) Freundlich. Initial concentration, 20-4,000 mg L−1
; volume of OMWW,
5 mL; temperature, 19°C; pH=4; and contact time, 24h.
Table 18. Isotherm parameters of PCs adsorption onto the GAC (Conditions: 5 g of the
adsorbent, 20-5,000 mg L−1
of PCs, pH=4, contact time 24h).
Isotherm Parameters Value of parameters
Langmuir
Qm (mg g−1
) 1667
KL (L mg−1
) 6 10-4
R2 0.997
RMSE 1.15 10-6
Freundlich
1/n 0.83
KF (L mg−1
) 1.87
R2 0.988
RMSE 2.35 10-3
0
200
400
600
800
1000
1200
1400
1600
1800
2000
0 1000 2000 3000 4000 5000
qe
(mg g
-1)
Ce (mg L -1)
0
0.5
1
1.5
2
2.5
3
3.5
4
1 1.5 2 2.5 3 3.5
log(q
e)
log(Ce)
0
0.01
0.02
0.03
0.04
0.05
0.06
0 0.01 0.02 0.03 0.04 0.05 0.06
1/q
e
1/Ce
(a)
(c)(b)

Part III Results and Discussion
161
2.3.2. Modeling of adsorption kinetics
The effect of contact time on the adsorption of PCs on the GAC was examined
between 0 and 480 min. The results obtained are given in Fig. 44a. The adsorption capacity of
PCs increased rapidly over time as the active sites were accessible. With increasing time, the
active sites tend to be saturated so that the adsorption capacity slowly increases until finally
reaching adsorption equilibrium of 1,753 mg g−1
at 480 min.
To further study the removal process of PCs onto GAC, two kinetic models were
presented. The sorption kinetics data have been compared with the pseudo-first-order and
pseudo-second-order rate equations. The kinetic plots for adsorption of PCs onto GAC are
shown in Figs. 44b and 44c, while kinetic parameters and correlation coefficients are listed in
Table 19. The pseudo-second-order model expressed a lowest RMSE and a higher R2
of 0.996
than 0.919 of the pseudo-first-order model, indicating the good fitting of the pseudo-second-
order model. Specifically, the theoretical adsorption capacity value equaled 1,785 mg g−1
,
which was not that far from the one obtained in the experimental study (1,753 mg g−1
). It was
concluded that the adsorption of PCs onto the GAC process obeyed the pseudo-second-order
model. This further indicated that the interactions between PCs molecules and the GAC active
sites were governed by chemisorption phenomena, i.e. the valence changed by sharing or
exchanging electrons between the GAC and the PCs (Kong et al., 2020; Lissaneddine et al.,
2021a; Dehmani et al., 2021).

Part III Results and Discussion
162
Fig. 44. Effect of the contact time on the adsorption of PCs (a), kinetic adsorption models:
pseudo-first-order (b) and pseudo-second-order (c). Initial concentration, 4,000 mg L−1
;
volume of OMWW, 5 mL; temperature, 19°C; pH=4; and contact time, 480 min).
Table 19. Kinetic parameters of PCs adsorption onto GAC (Conditions: 5 g of the adsorbent,
4,000 mg L−1
of PCs, 480 min contact time under optimum conditions of other variables).
Model Parameters Value of parameters
Pseudo-first-order k1 (min−1
) 87.10-4
qe (Calc.) (mg g−1
) 1438
R2 0.919
RMSE 3,48.10-1
Pseudo-second-order k2 (min−1
) 10-5
qe (Calc.) (mg g−1
) 1785
R2 0.996
RMSE 3,24.10-3
2.3.3. Effect of pH
The initial pH of the solution is an important factor, since it can influence the
ionization state of the outer GAC surface and the charge characteristics of PCs, and the
0
200
400
600
800
1000
1200
1400
1600
1800
2000
0 100 200 300 400 500
qt(m
g g
-1)
t (min)
0
0.05
0.1
0.15
0.2
0.25
0.3
0 100 200 300 400 500
t/q
t
t (min)
0
0.5
1
1.5
2
2.5
3
3.5
0 100 200 300 400
log (
qe
-qt)
t (min)
(a)
(b) (c)

Part III Results and Discussion
163
adsorption mechanism. Therefore, it also influences the adsorption capacity of the PCs.
Therefore, the effect of pH was studied over a pH range of 2 to 6 under optimum operating
conditions. Fig. 45 shows the pH effect on adsorption of PCs onto the GAC. By increasing the
pH from 2 to 6, adsorption of PCs onto GAC decreased from 1,010 to 639 mg g−1
,
respectively. This could be due to the protonated forms of PCs thatwere predominant from
acidic to neutral pH (effect of pKa) (Lissaneddine et al., 2021a). This form is more prone to
be adsorbed on GAC than the unprotonated form. A similar trend was also observed in the
study conducted by Annab et al. (2019) to remove PCs from OMWW onto beads based on
AC (Annab et al., 2019). This was also in agreement with Ziati et al. (2017), who studied the
adsorption of PCs from OMWW onto AC prepared with peach stones (Ziati et al., 2017).
Fig. 45. Variation of the adsorption capacity of GAC with pH (at 19 °C; adsorbent = 5 g;
C0 = 4,000 mg L−1
).
2.3.4. Effect of temperature
The temperature effect (19-35°C) on the adsorption of PCs on GAC was performed.
The thermodynamic properties ΔG, ΔH and ΔS values were calculated from the slope and the
intercept of the linear correlation between Ln(Kc) and 1/T known as the Van’t Hoff plot (Fig.
46) and listed in Table 20. The results revealed the endothermic nature of the overall process
(ΔH > 0). In addition, the values of ΔG were negatives, which indicated that the process was
spontaneous. However, the absolute values of ΔG increased with the temperature
enhancement, suggesting that the adsorption was favorable at higher temperature. The
obtained positive ΔS for GAC suggested a modification of their surface during the adsorption
0
200
400
600
800
1000
1200
2 4 6
q (
mg g
-1)
pH

Part III Results and Discussion
164
process. Similar results have been obtained in other studies regarding the adsorption of PCs
into the olive pit–derived AC (Eder et al., 2021), AC beads (Lissaneddine et al., 2021a), AC
coated with milk proteins (Yangui & Abderrabba, 2018) and amine-modified mesoporous
silica (Yangui et al., 2017).
Fig. 46. Plot of Ln(Kc) as a function of 1/T (R2
= 0.97).
Table 20. Thermodynamic parameters of the adsorption process of PCs on GAC at various
temperatures.
∆𝑯 (KJ mol-1
) ∆𝑺 (J mol-1
K-1
) ∆𝑮 (J mol
-1)
19°C 25°C 35°C
2,303 9.62 -464 -582 -656
2.3.5. Fixed-bed column
Different flow rates (0.5, 0.8 and 1.5 mL min-1
) were investigated in order to study
its effect on the breakthrough curve of PCs. In these experiments, all the parameters (initial
concentration, bed height, pH and temperature) were kept constant. The effect of flow rates on
the breakthrough curves is presented in Fig. 47a. It could be observed that an increase in flow
rate from 0.5 to 1 mL min-1
gave rise to steeper breakthrough curves and reduced
breakthrough and saturation times. These trends were due to the residence time of the
OMWW in the column, which was not long enough to reach adsorption equilibrium at a high
flow rate (Abdelkreem, 2013). Iheanacho et al. (2021) and Abdelkreem et al. (2013) reported
a similar observation in the recovery of phenol (Abdelkreem, 2013; Iheanacho et al., 2021).
0
0.05
0.1
0.15
0.2
0.25
0.3
0.0032 0.00325 0.0033 0.00335 0.0034 0.00345 0.0035
Ln (
Kc)
1/T

Part III Results and Discussion
165
The influence of bed heights (10, 15 and 20 cm) on the breakthrough curves of PCs
has also been carried out. In these experiments, all the parameters (initial concentration, flow
rates, pH and temperature) were also kept constant. The effect of bed height on the
breakthrough curves is presented in Fig. 47b. It could be observed that the higher the bed
heights, the more contact time of PCs with the GAC. This made increase PCs removal
efficiency in the column. This was also due to the fact that the longer bed had more amount of
GAC and, therefore more active sites for PCs adsorption. Moreover, more time was required
for the bed saturation for higher bed heights, as previously reported (Abdelkreem, 2013;
Iheanacho et al., 2021).

Part III Results and Discussion
166
Fig. 47. Effects of operating parameters on breakthrough curves: (a) effect of flowrate and (b)
effect of bed height.
The experimental data resulting from different flow rates and different bed heights
variation were fitted with two empirical models Thomas and Yoon-Nelson column kinetic
models and analyzed via linear regression tools. The results of the linear regression analysis
are presented in Tables 21 and 22. The models were in good agreement with the experimental
data, based on R2 values (R
2 > 0.9). This meant that both Thomas and Yoon–Nelson models
could be used to describe the dynamic behavior of the column.
(a)
(b)

Part III Results and Discussion
167
Thomas model follows the kinetics of Langmuir with a hypothesis applicable in a
system with a constant flow and a negligible axial dispersion in the column. This is because
the motive force of speed follows a reversible reaction of second-order (Lissaneddine et al.,
2021b). Thomas kinetic constants increased with improved in flow rate and bed height, but
adsorption capacity decreased, maybe due to mass transfer resistance being greater as bed
height increased (Satya et al., 2021). The application of Yoon–Nelson model to the
experimental data resulted in KYN and τ values that adequately described the fixed-bed
adsorption of PCs onto the GAC layer. Yoon–Nelson constants increased with the flow rate
and bed height. However, the time required for the breakthrough of 50% of adsorbate
decreased, which was probably due to the broadened mass transfer zone (Lai et al., 2021).
Table 21. Thomas model parameters for PCs adsorption into GAC in a fixed-bed column at
different conditions using linear regression analysis.
GAC bed height
(cm)
Flow rate
(mL min-
1)
KTh
(mL min-1
mg-1
)
q0
(mg g-1
) R
2
10 0.5 12 10-4
265 0.97
10 0.8 12 10-4
189 0.94
10 1.5 13 10-4
143 0.96
10 1 45 10-5
655 0.98
15 1 84 10-5
425 0.93
20 1 12 10-4
247 0.97
Table 22. Yoon–Nelson model parameters for PCs adsorption into GAC in a fixed-bed
column at different conditions using linear regression analysis.
GAC bed height
(cm)
Flow rate
(mL min-1
)
KYN
(min-1
)
Τ
(min) R
2
10 0.5 51 10-5
385 0.97
10 0.8 53 10-5
171 0.94
10 1.5 57 10-5
103 0.96
10 1 18 10-5
500 0.98
15 1 36 10-5
447 0.93
20 1 43 10-5
423 0.97
2.4.Desorption
Desorption studies allow clarifying the mechanism of adsorption and of value-added PCs
recovering. The results of the desorption experiments in a stirred batch reactor with different
kinds of solvents, i.e., distilled water, ethanol, a mixture of methanol and ethanol (50%/50%
M) and HCl (0.05 M), are presented in Fig. 48. The solvent efficiency for PCs desorption was

Part III Results and Discussion
168
following this rank (from the best to the worse): HCl (0.05 M) > mixture of methanol and
ethanol (50%/50% M) > ethanol > distilled water. Thus, HCl (0.05 M) led to the highest
enhancement of PCs desorption from GAC and was used for the desorption experiments in
column (Fig. 49), according to the procedure described in part II, section 1.5.1. Figure 49
show the concentration of PCs accumulated over 360 min in HCl (0.05 M) solution. The
results showed that HCl could recover almost 90% of the compounds adsorbed in the GAC
packed-bed column.
Fig. 48. Effects of different solvents on PCs desorption efficiency.
0
5
10
15
20
25
30
35
40
Distilled water Ethanol Ethanol andMethanol
HCl (0.05 M)
%
de
so
rbe
d

Part III Results and Discussion
169
Fig. 49. Fraction of desorbed PCs from GAC by HCl (0.05 M).
3. Conclusions
Olive pomace was effectively converted into GAC. The reliability of the adsorbent
properties for adsorption was confirmed using FTIR, SEM, EDS and BET studies. The
Langmuir monolayer adsorption capacity was 1,666 mg g-1
. The experimental kinetic data
fitted well with the pseudo-second-order kinetic model. The thermodynamic parameters for
the PCs adsorption onto the GAC highlighted that the negative value of ΔG confirmed the
feasibility of the process and the spontaneous nature of adsorption. The values of ΔH and ΔS
suggested an endothermic reaction and a modification of GAC surface during the adsorption
process. In the dynamic mode, the breakthrough time for PCs adsorption decreased with the
flow rate but increased with the bed height. Therefore, the adsorption capacity of PCs
depended on the bed height and the flow rate. The modeling about the adsorption in the
column indicated that both Thomas and Yoon-Nelson models fitted well with the
experimental data. Finally, considering the several advantages of GAC (i.e., low cost and high
efficiency in this application), it could be used as a promising adsorbent for PCs adsorption
and desorption from OMWW.

Part III Results and Discussion
170
References
Adnan, F.H., Mousset, E., Pontvianne, S., Pons, M., 2021. Mineral cathodic electro-
precipitation and its kinetic modelling in thin-film microfluidic reactor during advanced
electro-oxidation process. Electrochim. Acta 387, 138487.
https://doi.org/10.1016/j.electacta.2021.138487
Ania, C.O., Béguin, F., 2007. Mechanism of adsorption and electrosorption of bentazone on
activated carbon cloth in aqueous solutions. Water Res. 41, 3372–3380.
https://doi.org/10.1016/j.watres.2007.03.031
Ayoubi-Feiz, B., Aber, S., Khataee, A., Alipour, E., 2014a. Preparation and application of α-
Fe2O3/TiO2/activated charcoal plate nanocomposite as an electrode for electrosorption-
assisted visible light photoelectrocatalytic process. J. Mol. Catal. A Chem. 395, 440–
448. https://doi.org/10.1016/j.molcata.2014.09.006
Ayoubi-Feiz, B., Aber, S., Khataee, A., Alipour, E., 2014b. Electrosorption and
photocatalytic one-stage combined process using a new type of nanosized
TiO2/activated charcoal plate electrode. Environ. Sci. Pollut. Res. 21, 8555–8564.
https://doi.org/10.1007/s11356-014-2777-z
Ayoubi-Feiz, B., Mashhadizadeh, M.H., Sheydaei, M., 2018. Preparation of reusable nano
N-TiO2/graphene/titanium grid sheet for electrosorption-assisted visible light
photoelectrocatalytic degradation of a pesticide: Effect of parameters and neural
network modeling. J. Electroanal. Chem. 823, 713–722.
https://doi.org/10.1016/j.jelechem.2018.07.020
Ayranci, E., Conway, B.E., 2001. Removal of phenol, phenoxide and chlorophenols from
waste-waters by adsorption and electrosorption at high-area carbon felt electrodes. J.
Electroanal. Chem. 513, 100–110. https://doi.org/10.1016/S0022-0728(01)00529-0
Bán, A., Schäfer, A., Wendt, H., 1998. Fundamentals of electrosorption on activated carbon
for wastewater treatment of industrial effluents. J. Appl. Electrochem. 28, 227–236.
https://doi.org/10.1023/A:1003247229049
Barhoum, A., El-Maghrabi, H.H., Iatsunskyi, I., Coy, E., Renard, A., Salameh, C., Weber,
M., Sayegh, S., Nada, A.A., Roualdes, S., Bechelany, M., 2020. Atomic layer
deposition of Pd nanoparticles on self-supported carbon-Ni/NiO-Pd nanofiber
electrodes for electrochemical hydrogen and oxygen evolution reactions. J. Colloid
Interface Sci. 569, 286–297. https://doi.org/10.1016/j.jcis.2020.02.063
Bayram, E., 2016. Electrosoption of aromatic organic acids from aqueous solutions onto
granular activated carbon electrodes for water purification. Hacettepe J. Biol. Chem. 3,
273–273. https://doi.org/10.15671/hjbc.20164420570
Bayram, E., Ayranci, E., 2012a. Structural effects on electrosorptive behavior of aromatic
organic acids from aqueous solutions onto activated carbon cloth electrode of a flow-
through electrolytic cell. J. Electroanal. Chem. 683, 14–20.
https://doi.org/10.1016/j.jelechem.2012.07.028
Bayram, E., Ayranci, E., 2012b. Electrosorption based waste water treatment system using
activated carbon cloth electrode: Electrosorption of benzoic acid from a flow-through
electrolytic cell. Sep. Purif. Technol. 86, 113–118.
https://doi.org/10.1016/j.seppur.2011.10.032
Bayram, E., Kizil, Ç., Ayranci, E., 2018. Flow-through electrosorption process for removal
of 2,4-D pesticide from aqueous solutions onto activated carbon cloth fixed-bed
electrodes. Water Sci. Technol. 77, 848–854. https://doi.org/10.2166/wst.2017.598
Bousba, S., Meniai, A.H., 2014. Removal of phenol from water by adsorption onto sewage

Part III Results and Discussion
171
sludge based adsorbent. Chem. Eng. Trans. 40, 235–240.
https://doi.org/10.3303/CET1440040
Chen, Q., Wang, L., Xu, Y., Li, P., Wang, X., Wang, M., Kong, Y., 2018. Electrochemical
investigation of phenol oxidation by a TiO2/GAC based packed-bed electrode reactor.
Int. J. Electrochem. Sci. 13, 7301–7309. https://doi.org/10.20964/2018.08.59
Chen, Y., Tu, Y., Bai, Y., Li, J., Lu, J., 2018. Electrosorption enhanced electrooxidation of a
model organic pollutant at 3D SnO2-Sb electrode in superimposed pulse current mode.
Chemosphere 195, 63–69. https://doi.org/10.1016/j.chemosphere.2017.12.074
Damaskin, B. B., Baturina, O.A., 1999. Co-adsorption of anions and low-adsorbing cations
within the Alekseev-Popov-Kolotyrkin model. Russ. J. Electrochem. 35(11), 1182–
1185.
Damaskin, B.B., 2011. Modeling of co adsorption of cations and anions localized in different
layers of the dense part of electrical double layer under the conditions of linear charge
dependence of the adsorption energy. Russ. J. Electrochem. 47, 988–994.
https://doi.org/10.1134/S1023193511090047
Damaskin, B.B., 2008. Modeling of synergism effect at different orientation of co-adsorbing
molecules. Russ. J. Electrochem. 44, 1411–1417.
https://doi.org/10.1134/S102319350812001X
Damaskin, B.B., Baturina, O.A., 2001a. Some anomalies in coadsorption of two organic
substances due to differences in molecular interaction of species undergoing
coadsorption. Russ. J. Electrochem. 37, 1482–1489.
Damaskin, B.B., Baturina, O.A., 2001b. Simulating coadsorption of surface active anions
and organic molecules capable of forming two-dimensional condensed layers on the
electrode. Russ. J. Electrochem. 37, 121–126.
Damaskin, B.B., Baturina, O.A., 2001c. Simulation of coadsorption of inorganic ions and
organic molecules on electrodes. Russ. J. Electrochem. 37, 73–79.
Damaskin, B.B., Safonov, V.A., Safonov, N. V, 2003. Adsorption of an organic compound
in two different positions: Simulation taking into account all three parameters of
intermolecular interaction. Russ. J. Electrochem. 39, 814–819.
Eisinger, R.S., Alkire, R.C., 1980. Electrosorption of b-naphthol on graphite. J
Electroanal.Chem. 112, 327–337.
Eisinger, R.S., Keller, G.E., 1990. Electrosorption: A case study on removal of dilute
organics from water. Environ. Prog. 9, 235–244. https://doi.org/10.1002/ep.670090418
Gennero, M.R., Chialvo, A.C., 2012. Exchange current density, electrocatalytic activity and
volcano curve for the hydrogen electrode reaction: theoretical analysis 17.
Gileadi, E., 1966. Electrosorption of uncharged molecules on solid electrodes. J. Electroanal.
Chem. 11, 137–151. https://doi.org/10.1016/0022-0728(66)80073-6
Haider, S.S., Iqbal, M.Z., Zakar, S., Afzal, A.M., Yaqoob, K., Aftab, S., 2021. Superior
performance of electrodeposited CoMnS as novel electrode material for supercapattery
devices. J. Energy Storage 39, 102608. https://doi.org/10.1016/j.est.2021.102608
Han, Y., Quan, X., Chen, S., Zhao, H., Cui, C., Zhao, Y., 2006a. Electrochemically enhanced
adsorption of phenol on activated carbon fibers in basic aqueous solution. J. Colloid
Interface Sci. 299, 766–771. https://doi.org/10.1016/j.jcis.2006.03.007
Han, Y., Quan, X., Chen, S., Zhao, H., Cui, C., Zhao, Y., 2006b. Electrochemically enhanced
adsorption of aniline on activated carbon fibers. Sep. Purif. Technol. 50, 365–372.
https://doi.org/10.1016/j.seppur.2005.12.011
Han, Y., Quan, X., Ruan, X., Zhang, W., 2008. Integrated electrochemically enhanced
adsorption with electrochemical regeneration for removal of acid orange 7 using

Part III Results and Discussion
172
activated carbon fibers. Sep. Purif. Technol. 59, 43–49.
https://doi.org/10.1016/j.seppur.2007.05.026
Hazourli, S., Bonnecaze, G., Astruc, M., 1996. Adsorption et electrosorption de composes
organiques sur charbon actif en grains partie I - Influence du potentiel imposé et du
nombre de cycles adsorption and electrosorption of organic compounds on granular
activated carbon part I- Influence of applied. Environ. Technol. 17, 1275–1283.
https://doi.org/10.1080/09593330.1996.9618457
Hou, C.H., Huang, J.F., Lin, H.R., Wang, B.Y., 2012. Preparation of activated carbon sheet
electrode assisted electrosorption process. J. Taiwan Inst. Chem. Eng. 43, 473–479.
https://doi.org/10.1016/j.jtice.2011.12.003
Jayson, G.G., Sangster, J.A., Thompson, G., Wilkinson, M.C., 1987. Adsorption and
electrosorption of mercury (II) acetate onto activated charcoal cloth from aqueous
solution. Carbon N. Y. 25, 523–531. https://doi.org/10.1016/0008-6223(87)90193-X
Jiang, D., Li, B., 2009. Granular activated carbon single-chamber microbial fuel cells (GAC-
SCMFCs): A design suitable for large-scale wastewater treatment processes. Biochem.
Eng. J. 47, 31–37. https://doi.org/10.1016/j.bej.2009.06.013
Jin, Y., Wu, M., Zhao, G., Li, M., 2011. Photocatalysis-enhanced electrosorption process for
degradation of high-concentration dye wastewater on TiO2/carbon aerogel. Chem. Eng.
J. 168, 1248–1255. https://doi.org/10.1016/j.cej.2011.02.026
Kitous, O., Cheikh, A., Lounici, H., Grib, H., Pauss, A., Mameri, N., 2009. Application of
the electrosorption technique to remove Metribuzin pesticide. J. Hazard. Mater. 161,
1035–1039. https://doi.org/10.1016/j.jhazmat.2008.04.091
Lissaneddine, A., Pons, M.-N., Aziz, F., Ouazzani, N., Mandi, L., Mousset, E., 2021b. A
critical review on the electrosorption of organic compounds in aqueous effluent –
Influencing factors and engineering considerations. Environ. Res. J. 204, 112128.
https://doi.org/10.1016/j.envres.2021.112128
Liu, L., Liu, Y., Che, N., Gao, B., Li, C., 2021. Electrochemical adsorption of
perfluorooctanoic acid on a novel reduced graphene oxide aerogel loaded with Cu
nanoparticles and fluorine. J. Hazard. Mater. 416, 125866.
https://doi.org/10.1016/j.jhazmat.2021.125866
López-Bernabeu, S., Ruiz-Rosas, R., Quijada, C., Montilla, F., Morallón, E., 2016. Enhanced
removal of 8-quinolinecarboxylic acid in an activated carbon cloth by electroadsorption
in aqueous solution. Chemosphere 144, 982–988.
https://doi.org/10.1016/j.chemosphere.2015.09.071
Mcquillan, A.R. V, Stevens, G.W., Mumford, A., 2018. The Electrochemical regeneration of
granular activated carbons: A review. J. Hazard. Mater.
https://doi.org/10.1016/j.jhazmat.2018.04.079
Meng, H.-S., Liu, Y., Liu, P.-X., Zhou, L.-L., Chen, C., Wang, W.-K., Xu, J., 2021.
Development of a three-dimensional photoelectrocatalytic reactor packed with granular
sludge carbon photoelectrocatalyst for efficient wastewater treatment, Sep. Purif.
Technol. 277, 119642. https://doi.org/10.1016/j.seppur.2021.119642
Moeini, B., Avval, T.G., Linford, M.R., Ghalkhani, M., Kaykhaii, M., Abdullah Mirzaie, R.,
2021. Surface-orientated platinum nanoparticles electrodeposited on a carbon substrate
as a high performance electrocatalyst for glucose oxidation reaction in alkaline media.
Mater. Sci. Eng. B Solid-State Mater. Adv. Technol. 268, 115147.
https://doi.org/10.1016/j.mseb.2021.115147
Mohamed, E.F., Andriantsiferana, C., Wilhelm, A.M., Delmas, H., 2011. Competitive
adsorption of phenolic compounds from aqueous solution using sludge-based activated

Part III Results and Discussion
173
carbon. Environ. Technol. 32, 1325–1336.
https://doi.org/10.1080/09593330.2010.536783
Mohanraj, R., Brindha, R., Kandeeban, R., Mahendhar, M., Saminathan, K., Ayyappadasaa,
G., 2021. Electrochemical detection of 5-hydroxytryptamine using sustainable SnO2-
Graphite nanocomposite modified electrode. Mater. Lett. 305, 130796.
https://doi.org/10.1016/j.matlet.2021.130796
Niamlaem, M., Boonyuen, C., Sangthong, W., Limtrakul, J., Zigah, D., Kuhn, A.,
Warakulwit, C., 2020. Highly defective carbon nanotubes for sensitive, low-cost and
environmentally friendly electrochemical H2O2 sensors: Insight into carbon supports.
Carbon 170, 154–164. https://doi.org/10.1016/j.carbon.2020.07.081
Nie, C., Dai, Z., Meng, H., Duan, X., Qin, Y., Zhou, Y., Ao, Z., Wang, S., An, T., 2019.
Peroxydisulfate activation by positively polarized carbocatalyst for enhanced removal
of aqueous organic pollutants. Water Res. 166, 115043.
https://doi.org/10.1016/j.watres.2019.115043
Niu, J., Conway, B.E., 2003. Adsorption of organics onto an high-area C-cloth electrode
from organic solvents and organic solvent/water mixtures. J. Electroanal. Chem. 546,
59–72. https://doi.org/10.1016/S0022-0728(03)00146-3
Pierpaoli, M., Jakobczyk, P., Sawczak, M., Łuczkiewicz, A., Fudala-Książek, S.,
Bogdanowicz, R., 2021. Carbon nanoarchitectures as high-performance electrodes for
the electrochemical oxidation of landfill leachate. J. Hazard. Mater. 401, 123407.
https://doi.org/10.1016/j.jhazmat.2020.123407
Plaisance, H., Mocho, P., Bonnecaze, G., 1996. Adsorption et electrosorption de benzene sur
charbon actif en grains - Adsorption and electrosorption of benzene on granular
activated carbon. Environ. Technol. 17, 1313–1325.
https://doi.org/10.1080/09593331708616501
Rong, C., Xien, H., 2009. Reversible electrosorption of thiocyanate anions by active carbon
felt. Sep. Sci. Technol. 44, 3984–3999. https://doi.org/10.1080/01496390903182453
Rong, C., Xien, H., 2005. Electrosorption of thiocyanate anions on active carbon felt
electrode in dilute solution. J. Colloid Interface Sci. 290, 190–195.
https://doi.org/10.1016/j.jcis.2005.04.022
Sahin, E.M., Tongur, T., Ayranci, E., 2020. Removal of azo dyes from aqueous solutions by
adsorption and electrosorption as monitored with in-situ UV-visible spectroscopy. Sep.
Sci. Technol. 55, 3287–3298. https://doi.org/10.1080/01496395.2019.1676786
Sekar, S., Aqueel Ahmed, A.T., Pawar, S.M., Lee, Y., Im, H., Kim, D.Y., Lee, S., 2020.
Enhanced water splitting performance of biomass activated carbon-anchored WO3
nanoflakes. Appl. Surf. Sci. 508, 145127. https://doi.org/10.1016/j.apsusc.2019.145127
Stenina, E. V, Baturina, O.A., Sviridova, L.N., Damaskin, B.B., 2001. Coadsorption of
halide anions and 1-adamantanol molecules on a mercury electrode. Russ. J.
Electrochem. 37, 931–938.
Strohl, J.H., Dunlap, K.L., 1972. Electrosorption and separation of quinones on a column of
graphite particles. Anal. Chem. 44, 2166–2170. https://doi.org/10.1021/ac60321a012
Sun, X.-F., Guo, B.-B., He, L., Xia, P.-F., Shu-Guang Wang, 2016. Electrically accelerated
removal of organic pollutants by a three-dimensional graphene aerogel. AIChE J. 59,
215–228. https://doi.org/10.1002/aic
Wang, X., Hu, Y., Min, J., Li, S., Deng, X., Yuan, S., Zuo, X., 2018. Adsorption
characteristics of phenolic compounds on graphene oxide and reduced graphene oxide:
A batch experiment combined theory calculation. Appl. Sci. 8, 1–13.
https://doi.org/10.3390/app8101950

Part III Results and Discussion
174
Yue, F., Zhang, Q., Xu, L., Zheng, Y., Yao, C., Jia, J., Leng, W., Hou, S., 2019. Porous
reduced graphene oxide/single-walled carbon nanotube film as freestanding and flexible
electrode materials for electrosorption of organic dye. ACS Appl. nano Mater. 2, 6258–
6267. https://doi.org/10.1021/acsanm.9b01236
Zhu, P., Zhao, Y., 2019. Cyclic voltammetry measurements of electroactive surface area of
porous nickel: Peak current and peak charge methods and diffusion layer effect. Mater.
Chem. Phys. 233, 60–67. https://doi.org/10.1016/j.matchemphys.2019.05.034
Ziati, M., Khemmari, F., Cherifi, O., & Didouche, F. Y., 2017. Removal of polyphenols from
olive mill wastewater by adsorption on activated carbon prepared from peach stones.
Rev. Roum. Chim., 62(11), 865-874.

Part III Results and Discussion
175
II. Electrosorption with bio-sourced granular activated carbon electrode
for phenols recovery and combination with electrooxidation for residual
olive mill wastewater treatment
1. Introduction
Electrode materials have a great impact on the performance of electrosorption.
Electrosorption efficiency partly depends on the nature of the electrode materials and their
characteristics (Lissaneddine et al., 2021b). Various carbonaceous materials such as GAC
(Eisinger & Keller, 1990; Hazourli et al., 1996a; Plaisance et al., 1996; Bán et al., 1998;
Kitous et al., 2009; Bayram, 2016; ), carbon cloth (Jayson et al., 1987; López- Niu &
Conway, 2003; Ania & Béguin, 2007; Bayram & Ayranci, 2012b; Bernabeu et al., 2016;
Bayram et al., 2018; Sahin et al., 2020), carbon fiber (Strohl & Dunlap, 1972; Han et al.,
2006b, 2006a, 2008), carbon felt (Ayranci & Conway, 2001; Rong & Xien, 2005, 2009),
graphite (Strohl & Dunlap, 1972; Eisinger & Alkire, 1980) and graphene (Sun et al., 2016a;
Yue et al., 2019b; Liu et al., 2021) have been commonly utilized as electrode materials for the
removal of organics. GAC is frequently used as an adsorbent in water and wastewater
treatment processes due to its high surface area with values usually ranging between 600 and
1,200 m2 g
-1 (Jiang & Li, 2009).
The results reported by many authors in the literature showed that the GAC electrode
has high efficiency for eliminating different organic pollutants. This was the case for instance
with the removal of BA (90.6%) and nicotinic acid (91%) (Bayram, 2016), metribuzin (22 mg
g−1
) (Kitous et al., 2009), naphthalenesulfonic acid (100 mg g-1
), benzyl alcohol (100 mg g-1
),
naphthoic acid (100 mg g-1
), methylquinolinium chloride (100 mg g-1
) (Bán et al., 1998),
benzene (238 mg g−1
) (Plaisance et al., 1996) and chloroform (340 mg g-1
) (Hazourli et al.,
1996a). However, GAC has never been used for the PCs elimination from OMWW. In
addition, the production of GAC can be obtained directly from natural raw materials (biomass
waste), while preserving great stability. Contrastingly, it is necessary to add an additive
(alginate) for composite beads. These latters are also less stable, since they can be degraded
easier at high current intensity. Therefore, GAC has some advantages compared to the
composite beads.

Part III Results and Discussion
176
In this context, the GAC was implemented as an electrode material for the
electrosorption of PCs from OMWW. The electrochemical characterization of the GAC
electrode was studied in order to determine its performance. The objective of this study is to
investigate the effect of electrode polarization on the electrosorption of phenol and explore the
relationship between the PCs properties and their electrosorption efficiency. The
electrochemical regeneration of GAC electrodes and the electrochemical organic degradation
of residual OMWW were also studied.
2. Results and discussion
2.1.Characterization of GAC
2.1.1. Influence of electrochemical conditioning on GAC characteristics
Additional electrochemical conditioning of the GAC has been tested to further
enhance its properties compared to the GAC manufactured in Part III, sub-chapter II.I. The
morphologies of GAC before and after electrochemical conditioning were analyzed by SEM,
as shown in Fig. 50. Before conditioning, it wasobserved large voids and rifts made the
surface quite heterogeneous and porous. However, the GAC after conditioning had rough
surfaces with smaller irregular and interspatial pores within the matrix of the GAC, which
could facilitate the diffusion of more PCs molecules into the pores structure. The difference of
morphologies of GAC before and after conditioning could be explained by the pitting
corrosion that may occur during the application of high anode potential (Ean = 1.8
V/(Ag/AgCl)). This potential was higher than the standard potential (0.011 V/(Ag/AgCl)) at
which corrosion of carbon started to occur (Lissaneddine et al., 2021b).

Part III Results and Discussion
177
Fig. 50. SEM images: (a) GAC before conditioning, (b) GAC after conditioning.
EDS results of both GAC are shown in Table 23. The semi-quantitative elemental
analysis of the GAC surfaces indicated that the major elements on both GAC were C and O.
The carbon content was slightly decreased (from 86.6 to 85.6 at.%) after electrochemical
treatment, which could be ascribed to the localized corrosion of the GAC. In the meantime,
the oxygen content slightly increased (from 11.7 to 12.2 at.%). This could be explained by the
electrooxidation of GAC that occurred at a potential higher than the oxygen evolution
potential (1.03 V/(Ag/AgCl)) and might contribute to the slight oxygenation. In addition,
traces of Na, P, Cl, K and Ca species were identified in both GAC and should be attributed to
the impurities of the raw olive pomace material. They could also come from the chemical
activation stage.

Part III Results and Discussion
178
Table 23. EDS of GAC before and after conditioning.
GAC-Before conditioning GAC-After conditioning
Element W% at.% W% at.%
C 81.48 86.58 80.33 85.61
O 14.62 11.68 15.28 12.25
Na 1.96 1.09 3.01 1.68
P 0.15 0.06 0.13 0.05
Cl 0.25 0.09 0.15 0.05
K 0.91 0.3 0.3 0.1
Ca 0.63 0.2 0.81 0.26
100 100 100 100
The results of phenol electrosorption of into GAC before conditioning and GAC after
conditioningare represented in the Fig. 51. The phenol removal increased from 72% for GAC
before conditioning to 75% for GAC after conditioning. These properties indicated that the
conditioned GAC electrode should have significant electrosorption efficiency and was
therefore employed in the subsequent electrosorption experiments.

Part III Results and Discussion
179
Fig. 51. Electrosorption of phenol into GAC before conditioning and GAC after conditioning.
Operating conditions: anode: platinum wire, cathode: graphite rod and 10 g of GAC,
electrolyte: 6 g L-1
KCl, pH 4 and 4 g L-1
phenol, flow rate: 10 mL min-1
, m/V = 0.1 g mL-1
.
2.1.2. Electrochemical characterization of the conditioned GAC
The electrochemical performance of the GAC electrode was studied with CV, LSV
and EIS. The CV curve of GAC is shown in Fig. 52a. The electroactive surface area for the
GAC electrode was found to be 7.8 × 103 cm
2. This value was high compared to other porous
carbon-based electrodes used in literature such as AC-anchored WO3 nanoflakes electrode
(299 cm2) (Sekar et al., 2020), SnO2-Graphite nanocomposite modified electrode (0.291 cm
2)
(Mohanraj et al., 2021), composite carbon nanofiber electrodes (1,750 to 2,125 cm2)
(Barhoum et al., 2020) and hybrid Au-(polyvinylpyrrolidone and 4-
dimethylaminopyridine)/carbon electrode (0.007 to 0.206 cm2) (Niamlaem et al., 2020). High
electroactive surface area leads to high number of active sites, and consequently high
electrosorption capacity would be expected (Zhu & Zhao, 2019b).
In addition, a value of I0 was found to be around 5.5 × 10⁻³
A from Tafel slopes (Fig.
52b). The performance of GAC electrode is much better than those of the most reported
carbon-based electrodes in literature. For example, I0 of graphene before and after
electrochemical oxidation were 7 × 10⁻⁵
and 4 × 10⁻³
A, respectively (Pierpaoli et al., 2021).
Other values of I0 with platinum nanoparticles electrodeposited on a carbon substrate were
varying from 0.41 to 2.1 × 10⁻³
A (Moeini et al., 2021). The lower I0 values obtained in

Part III Results and Discussion
180
literature would imply a lower electrosorption efficiency compared to the GAC employed in
this work.
Figure 52c illustrates the Nyquist plot of the GAC electrode, which showed two
regions with different characteristic of impedance. The inclined straight lines approximating
45° angle demonstrated that diffusion process mechanism should occur on GAC electrode
(Chen et al., 2018). EIS data have been obtained after validation of impedance spectra with
linear KKT method (Fig. 51c). The χ2 calculated for KKT fitting with experimental spectra as
well as for EEC model fitting with KKT were determined to be 5.6 10-5
and 1.1 10-6
,
respectively. The best EEC model of GAC electrode was demonstrated to be R (Q (R (QR)))
as shown in Fig. 52. The first one was the resistance of the bulk electrolyte (RSol) whose value
approximated 33 Ω. The parallel combination of CDL and RCT reached values of 2.5 µF cm-2
and 4 Ω, respectively. Compared to other porous electrodes used in the literature RCT had a
lower value than TiO2/GAC based packed-bed electrode (206 Ω) (Chen et al., 2018), granular
sewage sludge carbons (94 Ω) (Meng et al., 2021) and platinum nanoparticles
electrodeposited on a carbon substrate (89 Ω) (Moeini et al., 2021). This lower value of RCT is
beneficial to efficient electrosorption. Another interesting feature is that a
capacitance/resistance couple was connected in series to RCT (Fig. 53). The respective values
of the internal capacitance of GAC (CGAC), in parallel to the internal resistance of GAC
(RGAC) were 0.38 µF cm-2
and 1.2 Ω, respectively. Based on the values of electroactive
surface area, I0, resistances and capacitances, the GAC electrode would depict good
performance of electrosorption.
When the GAC was compared with the composite beads (Part III, sub-chapter I.II), it
could be noticed that the electroactive surface area of composite beads (23 × 103 cm
2) was
greater than the one of GAC. Moreover, the values of I0 (3.24 × 10⁻³
A), CDL (0.15 µF cm-2
)
and RCT (1.7 Ω) were lower with the composite beads compared to the GAC. These trends
mean that SA-AC beads had better electrochemical performance than GAC. Therefore, lower
electrosorption efficiency with the GAC could be expected. Still, GAC has interesting
advantages over composite beads: (i) easy to manufacture, (ii) higher stability at high current
intensity, (iii) possibility of regeneration. These statements further justify the interest to
pursue with GAC as electrode in the following sections.

Part III Results and Discussion
181
Fig. 52. Electrochemical properties of GAC electrode using CV (a), LSV (b) and EIS (c).

Part III Results and Discussion
182
Fig. 53. Scheme of the EEC model integrated into the GAC porous electrodes.
2.2.Electrosorption
2.2.1. Phenol electrosorption
Electrode polarity and applied current are the main factors prevailing the
electrosorption efficiency (Lissaneddine et al., 2021b). The effects of current intensity on the
electrosorption of phenol have been therefore investigated for the 3D electrode when used as
either cathode or anode. Figure 54a illustrates the effect of current intensity as a function of
contact time on the percentage of phenol electrosorbed in anode configuration. The phenol
removal increased with the applied current from 69% at 5 mA (Ean = 0.65 V/(Ag/AgCl)) to
74% at 100 mA (Ean = 1.70 V/(Ag/AgCl)). This trend could be explained by the increase of
phenol diffusion from the bulk solution into the mesopores and micropores of the GAC
according to the results of EIS and EEC. Similar results have been observed by Rong and
Xien (2009) for electrosorption of thiocyanate into active carbon felt (Rong & Xien, 2009).
Then the efficiency of electrosorption decreased to 68%, when the applied current equaled
150 mA (Ean = 1.90 V/(Ag/AgCl)). This could be ascribed to the O2 production from H2O
electrooxidation that could occur in this range of current (150 mA), considering the higher Ean

Part III Results and Discussion
183
value (1.70 V/(Ag/AgCl)) compared to the potential of oxygen evolution reaction (1.03
V/(Ag/AgCl)). The O2 generation limited the GAC surface availability for phenol
electrosorption. Therefore, the gas electrogeneration strongly reduced the electrosorption
efficiency, which was even lower than in adsorption (66%). Still, the optimal electrosorption
led to higher efficiency (74%) than adsorption itself.
Fig. 54. Effect of the current intensity considering the contact time (a) and the specific charge
(b) on the electrosorption of phenol. Operating conditions: cathode: platinum wire, anode:
graphite rod and 10 g of GAC, electrolyte: 6 g L-1
KCl, pH 4 and 4 g L-1
phenol, flow rate: 10
mL min-1
, m/V = 0.1 g mL-1
.

Part III Results and Discussion
184
Figure 55a showed the effect of the current intensity on the percentage of phenol
removed when the GAC was employed as a cathode. The maximum removal percentage of
phenol was 72%, when the applied current equaled 1 mA (Ecat = 0.26 V/(Ag/AgCl)). Then the
efficiency decreased with the increasing current until 100 mA (Ecat = -1.1 V/(Ag/AgCl)),
where the efficiency of electrosorption was 65%. Similar to the anode configuration, the
gaseous H2 electrogeneration from H2O reduction started at a higher current intensity and it
subsequently reduced the electrosorption efficiency.
In addition to the improved electrosorption capacity, another necessary feature of the
process is the low energy requirements. The influence of current intensity considering the
specific charge on phenol removal percentage in both anode and cathode setups are shown in
Fig. 54b and Fig. 55b, respectively. The specific charge increased by increasing the applied
current from 1 to 150 mA at both cathode and anode configurations. The maximum removal
percentage of phenol was reached after only 0.08 Ah L-1
at 1 mA with GAC cathode,
compared to 8 Ah L-1
at 100 mA with GAC anode. The specific charge with GAC anode was
found to be a hundred times greater than that of GAC cathode system. Upon these results, the
applied current of 1 mA with GAC as cathode was applied for the subsequent electrosorption
experiments. This was to prevent the formation of faradaic reactions (gaseous H2 and O2
evolutions) at the GAC surface and to keep the energy demand as low as possible.
The morphology of conditioned GAC cathode after 8 h of electrosorption at 1 mA
was analyzed by SEM, as shown in Fig. 56. Morphological changes on the surface of GAC
after electrosorption were observed. The surfaces were smoother after electrosorption. This
could be primarily due to the pores saturation with a high amount of phenolelectrosorbed.
Differences were also noticed with EDS results (Table 24). The semi-quantitative elemental
analysis of the GAC surface indicated that the major elements on the GAC were still carbon
and oxygen. However, after electrosorption, the weight percentages of C decreased from
80.3% to 72.7 %, respectively, while the weight percentage of O increased from 12.2% to
19.8%. The oxygenation could be maybe due to the oxygen adsorption on the cathode before
its subsequent reduction since it is known that oxygen can be easily reduced on carbon
cathode materials (Du et al., 2021).

Part III Results and Discussion
185
Fig. 55. Effect of the current intensity considering the contact time (a) and the specific charge
(b) on the electrosorption of phenol. Operating conditions: anode: platinum wire, cathode:
graphite rod and 10 g of GAC, electrolyte: 6 g L-1
KCl, pH 4 and 4 g L-1
phenol, flow rate: 10
mL min-1
, m/V = 0.1 g mL-1
.

Part III Results and Discussion
186
Table 24. EDS of conditioned GAC cathode after electrosorption at 1 mA for 8 h.
Conditioned GAC-After electrosorption (1 mA, 8 h)-Cathode
Element W% at.% C 72.71 79.04 O 24.27 19.80 Na 0.55 0.31 P 0.20 0.08 Cl 0.29 0.11 K 1.39 0.46
Ca 0.60 0.20
100 100
Fig. 56. SEM images conditioned GAC cathode after 8 h of electrosorption at 1 mA.
2.2.2. Effect of phenolic compounds properties
The effect of the kinds of PCs on their electrosorption efficiency was studied
considering the following PCs having different pKa and molar weight (MW): phenol (pKa =
9.9, MW = 94 g mol-1
), gallic acid (pKa = 3.1, MW = 170 g mol-1
), caffeic acid (pKa = 4.6,
MW = 180 g mol-1
), coumaric acid (pKa = 4.0, MW = 164 g mol-1
) and quercetin (pKa = 6.4,
MW = 302 g mol-1
).
The kinetics of PCs electrosorptions at 1 mA (Ecat = 0.26 V/(Ag/AgCl)) with GAC as
cathode and initial solution pH of 4 are illustrated in Fig. 56. The PCs removal increased
rapidly over time as the active sites were accessible until saturation of active sites leading to
equilibrium. The removal percentages of phenol, gallic acid, caffeic acid, coumaric acid and

Part III Results and Discussion
187
quercetin were 72.3%, 36.8%, 72.5%, 60.6% and 26.5%, respectively, after 360 min. In
addition, the trend clearly highlighted the fact that PCs removal was not dependent only on
the pKa values of PCs. The high performance of caffeic acid could be attributed to its pKa
value (4.6) that is close to the initial solution pH (4). In this condition, the basic form of
caffeic acid also presents in solution, meaning that part of the molecules (23%) were
preferentially negatively charged. Therefore, these charged molecules were subjected to
electro-migration in addition to diffusion phenomena. Then electrostatic repulsion between
the negatively charged GAC surface (cathode) and caffeic acid ionic form could increase the
contact of caffeic acid with the adsorbent. This was also stated in the experiments with SA-
AC beads electrode with real OMWW (Part III, sub-chapter I.II). The high electrosorption
efficiency with coumaric acid could be also explained by this mechanism since its pKa (4)
was also close to the initial pH. However, the high removal efficiency of phenol compared to
quercetin could not be explained by the single influence of pKa. Both compounds had a pKa
value much higher than the initial pH and therefore their uncharged acidic forms
predominated. The efficiency difference could be ascribed to the different MW and size of the
PCs compared to the GAC pore size distribution (Mohamed et al., 2011; Lissaneddine et al.,
2021a). The average pore size of GAC was 1.5 nm (Part III, sub-chapter II.I), while the
quercetin size was around 0.9 nm. Contrastingly, the phenol size was lower (0.557 nm),
considering its MW value. Therefore, less numbers of potential active sites were available for
the quercetin electrosorption. It subsequently decreased its electrosorption efficiency
compared to phenol.

Part III Results and Discussion
188
Fig. 57. Effect of the kinds of PCs on the electrosorption at cathode. Operating conditions:
anode: platinum wire, cathode: graphite rod and 10 g of GAC, electrolyte: 6 g L-1
KCl, pH 4
and PC, current intensity: 1 mA, flow rate: 10 mL min-1
, m/V = 0.1 g mL-1
.
2.2.3. OMWW electrosorption
The PCs electrosorption from actual OMWW has been investigated to understand the
mechanism of co-electrosorption into GAC electrodes. From the previous section it could be
expected that the optimal current intensity should vary with the type of PC. The current has
been therefore varied from 1 mA to 100 mA with GAC as a cathode in order to optimize the
electrosorption efficiency with the real effluent (Fig. 57). After 6 h, the PCs removal
increased by raising the applied current from 1 mA (Ecat = 0.26 V/(Ag/AgCl)) (42.6%) to 10
mA (Ecat = -0.05 V/(Ag/AgCl)) (68.1%). The electric current should promote the ionic PCs
electro-migration from the bulk solution to the pores of the GAC. The uncharged molecules
could be also impacted by the electric potential (Gileadi, 1966a), which enhanced the
electrosorption efficiency of PCs as already stated in Part III, sub-chapter I.II. Then the PCs
removal dropped down to 44% at 100 mA (Ecat = -1.1 V/(Ag/AgCl)). This should be due to
the H2 electrogeneration that hamper the electrosorption, as previously explained in section
2.2.1 of Part III, sub-chapter II.II.

Part III Results and Discussion
189
Moreover, the PCs removal at 1 mA (0.26 V/(Ag/AgCl)) was lower (42%) in actual
OMWW compared with simulated OMWW (72%). This could be explained by the
intermolecular interaction between the mixture of PCs in the actual OMWW (Damaskin,
Baturina, 1999; Stenina et al., 2001; Damaskin, 2001c, 2001a, 2001b, 2003, 2008, 2011;
Lissaneddine et al., 2021b).
Additionally, the specific charge increased with the applied current, from 1 mA (0.06
Ah L-1
) to 100 mA (6 Ah L-1
) after 6 h (Fig. 57b). The maximum removal percentage of PCs
was reached after 0.6 Ah L-1
at 10 mA, which made this applied current as of the optimal one
for subsequent experiments. Furthermore, the internal ohmic resistance of the GAC electrode
increased by increasing the applied current from 0.7 Ω (1 mA) to 4.6 Ω (100 mA) (Fig. 57c).
The increases in internal ohmic resistance limited the electrochemical performance of GAC
electrode (Haider et al., 2021). This could explain the decrease of electrosorption efficiency at
50 mA (4.3 Ω) on the contrary to 10 mA (1.6 Ω). Since an increase of resistance usually leads
to higher energy requirement, this trend is also in agreement with the specific charge
evolution in Fig. 57b that showed an optimal value of 10 mA.

Part III Results and Discussion
190
Fig. 58. Effect of the current intensity considering the contact time (a) the specific charge (b)
on the electrosorption of PCs from real OMWW and internal resistance (c) at optimal
operating conditions. Operating conditions: anode: platinum wire, cathode: graphite rod and
10 g of GAC, flow rate: 10 mL min-1
, m/V = 0.1 g mL-1
.

Part III Results and Discussion
191
2.3.Electrochemical regeneration of the GAC electrode
Electrochemical regeneration of the porous electrodes refers to the regeneration in
electrolyte solution by a given potential or current through an electrodesorption step
(Mcquillan et al., 2018; Lissaneddine et al., 2021b). One advantage of electrochemical
regeneration is the reduction of energy consumption compared with the thermal processes
(Bayram & Ayranci, 2012a).
The regeneration of GAC electrode aims to restore the original active sites of the
GAC electrode by removing and recovering PCs that have accumulated into the different pore
sizes of the GAC electrodes. The 3D material was employed as an anode by reversing the
polarity. The influence of applied current was evaluated and the results of PCs electro-
desorption are shown in Fig. 58. The percentage of PCs recovered increased by rising the
applied current from 1 mA (Ean = 0.35 V/(Ag/AgCl)) (21.4%) to 10 mA (Ean =
1.25V/(Ag/AgCl)) (34.5%), after 360 min. This was explained by the fact that current density
is the driving force for contaminant degradation (Mcquillan et al., 2018). Similar results have
been obtained in other studies involving the desorption of methylquinolinium chloride from
AC by increasing the potential from 0 mV/(Ag/saturated KCl) to 600 mV/(Ag/saturated KCl)
(Bán et al., 1998). However, a further increase of current should damage too much the GAC
material, since carbon can be already oxidized at a potential of 0.407 V/(Ag/AgCl)
(Lissaneddine et al., 2021b). This is why higher current intensity was not tested.
Moreover, the experimental results showed that the electrodesorption efficiency
achieved an equilibrium after only 2 h (Fig. 58), while it was barely reached after 6 h in
electrosorption experiments (Fig. 57a). Therefore, 120 min was sufficient for
electrodesorption tests. In the aim of further increasing the desorption efficiency, successive
electrodesorption cycles have been performed with the same GAC electrode and with fresh
electrolyte at each cycle. The results showed that the second and third cycles were less
colorful in comparison with cycle 1 (Fig. 59). This suggested that less molecules absorbing
visible light were extracted from the GAC. However, there were no PCs recovery from the
electrode at the second and third cycles (Figs. 59a and 59b), which means that this color was
not an indicator for PCs recovery. It further exhibited the fact that all the recoverable PCs
from the GAC were completed after only one cycle. This further means that the reversible
electrosorbed PCs fraction was already recovered at the first cycle. Subsequent cycles could

Part III Results and Discussion
192
not remove the fractions within the micro- and meso- pores that are more irreversible, which
represented around 65%. It is also important to note that applying a higher current than 10 mA
would have improved the recovery efficiency, but this would be to the detriment of the
electrode integrity. As shown in section 2.1.1 of Part III, sub-chapter II.II, applying higher
current intensity led to pitting corrosion of the GAC anode, which could therefore increase the
release of PCs initially electrosorbed.
Fig. 59. Effect of the current intensity on the electro-desorption of PCs from GAC. Operating
conditions: cathode: platinum wire, anode: graphite rod and 10 g of GAC, electrolyte: 0.1 g L-
1 KCl, flow rate: 10 mL min
-1, m/V = 0.1 g mL
-1.

Part III Results and Discussion
193
Fig. 60. Pictures about three successive electro-desorption cycles of PCs from GAC electrode.

Part III Results and Discussion
194
2.4.Electrochemical degradation of OMWW
For a more integrated treatment of OMMW, the combination of electrosorption as a
separation technology with a degradation process should be an effective strategy. This would
permit to recover the value-added compounds, while the residual effluent would be treated
before disposal. Some studies investigated the electrooxidation combined with electrosorption
to remove BA (Chen et al., 2018), acyclovir and phenol (Nie et al., 2019) in simulated
effluents. The results were promising and it has been therefore decided to apply this
combination in this study, but with actual effluent (OMWW).
The COD and PCs removal efficiencies for the electrosorption combined with
advanced electrooxidation process compared with the electrosorption are shown in Table 25.
The COD removal efficiency obtained were 84% and 91% for the combined processes before
and after filtration of the actual OMWW, respectively. Contrastingly, it was 40% for the sole
electrosorption process. The coupling, therefore, led to two times higher removal efficiency.
This could be partly explained by the BDD scaling with maybe soluble and insoluble organic
compounds as shown in the picture in Fig. 60. In addition, the PCs that could not be
electrosorbed during the first step were subsequently removed during the electrooxidation
experiments. The PCs removal efficiencies were around 97% with the combined process with
or without filtration of the initial effluent, while 77% was removed during the preliminary
electrosorption. This trend was in agreement with literature in which the removal efficiency
increased with the combined process for various organic pollutants in synthetic solution, such
as reactive yellow 39 (Ayoubi-Feiz et al., 2014b), diazinon (Ayoubi-Feiz et al., 2018b),
alizarin red (Jin et al., 2011b) and lanasol red 5B (Ayoubi-Feiz et al., 2014a).

Part III Results and Discussion
195
Fig. 61. Scaling on BDD anode after electrooxidation experiments of OMWW.
To conclude, the electrosorption combined with electrooxidation could offer
promising results for the actual OMWW, only after better understanding the scaling issue on
the BDD anode and after optimizing then the electrooxidation process.
Table 25. OMWW characterization before and after electrochemical degradation.
Kind of effluent pH COD (g-O2 L-1
) (removal %)
Total PCs (mg L-1
) (removal %)
OMWW 5.0 163 4,801
OMWW after electrosorption (480
min) 5.0 98 (40%) 1,083 (77%)
OMWW after electrosorption (480
min) followed by electrooxidation (420
min)
4.6 26 (84%) 134 (97%)
OMWW after filtration (≈ 10 µm) and
electrosorption (480 min) followed by
electrooxidation (420 min)
4.4 13 (91%) 102 (97.7%)
3. Conclusions
Performance of biosourced GAC electrode in an electrosorption technology has been
investigated for PCs removal from OMWW for the first time. The results of electrochemical
characterization of GAC electrode showed that the high electroactive surface area (7.8 × 10³
cm2), high value of I0 (5.5 × 10
-3 A), and low value of RCT (4 Ω), could be promising
properties for electrosorption studies. Still, the properties of GAC seemed less performant

Part III Results and Discussion
196
than the AS-AC beads, but the other advantages of GAC (i.e., stability, regeneration,
manufacturing) could overcome the expected higher electrosorption efficiency of the beads.
The electrosorption study of PCs was performed at different current intensities for Artificial
OMWW (1 to 200 mA) for actual OMWW (1 to 100 mA). The most suitable current
intensities were 1 mA (0.26 V/(Ag/AgCl)) for artificial OMWW and 10 mA (-0.05
V/(Ag/AgCl)) for actual OMWW, recording the highest electrosorption efficiencies of 72%
and 68%, respectively. The influence of kinds of PCs having different pKa and molecular size
has shown that both parameters impacted, according to the solution pH and the GAC pore size
distribution.
Moreover, the PCs recovery from the GAC electrode by using the electrochemical
regeneration method was carried out. The percentage of PCs recovered was 34.5% at optimal
conditions, i.e., 0.1 g L-1
of KCl and a current intensity of 10 mA during 120 min after one
cycle. Further cycles could not permit the recovery of electrosorbed fractions, while higher
current should lead to corrosion of the GAC material.
The combination of electrosorption as a separation technique for PCs recovery and
advanced electro-oxidation as degradation process for the treatment of residual OMWW was
finally studied. The removal efficiency of COD was 84% and 91% for the combined
processes before and after filtration, respectively. This combination could be suitable for the
future, but the scaling issues need to be overcome and the optimization should be then
performed.

Part III Results and Discussion
197
References
Adnan, F.H., Mousset, E., Pontvianne, S., Pons, M., 2021. Mineral cathodic electro-
precipitation and its kinetic modelling in thin-film microfluidic reactor during advanced
electro-oxidation process. Electrochim. Acta 387, 138487.
https://doi.org/10.1016/j.electacta.2021.138487
Ania, C.O., Béguin, F., 2007. Mechanism of adsorption and electrosorption of bentazone on
activated carbon cloth in aqueous solutions. Water Res. 41, 3372–3380.
https://doi.org/10.1016/j.watres.2007.03.031
Ayoubi-Feiz, B., Aber, S., Khataee, A., Alipour, E., 2014a. Preparation and application of α-
Fe2O3/TiO2/activated charcoal plate nanocomposite as an electrode for electrosorption-
assisted visible light photoelectrocatalytic process. J. Mol. Catal. A Chem. 395, 440–
448. https://doi.org/10.1016/j.molcata.2014.09.006
Ayoubi-Feiz, B., Aber, S., Khataee, A., Alipour, E., 2014b. Electrosorption and
photocatalytic one-stage combined process using a new type of nanosized
TiO2/activated charcoal plate electrode. Environ. Sci. Pollut. Res. 21, 8555–8564.
https://doi.org/10.1007/s11356-014-2777-z
Ayoubi-Feiz, B., Mashhadizadeh, M.H., Sheydaei, M., 2018. Preparation of reusable nano
N-TiO2/graphene/titanium grid sheet for electrosorption-assisted visible light
photoelectrocatalytic degradation of a pesticide: Effect of parameters and neural
network modeling. J. Electroanal. Chem. 823, 713–722.
https://doi.org/10.1016/j.jelechem.2018.07.020
Ayranci, E., Conway, B.E., 2001. Removal of phenol, phenoxide and chlorophenols from
waste-waters by adsorption and electrosorption at high-area carbon felt electrodes. J.
Electroanal. Chem. 513, 100–110.
Bán, A., Schäfer, A., Wendt, H., 1998. Fundamentals of electrosorption on activated carbon
for wastewater treatment of industrial effluents. J. Appl. Electrochem. 28, 227–236.
https://doi.org/10.1023/A:1003247229049
Barhoum, A., El-Maghrabi, H.H., Iatsunskyi, I., Coy, E., Renard, A., Salameh, C., Weber,
M., Sayegh, S., Nada, A.A., Roualdes, S., Bechelany, M., 2020. Atomic layer
deposition of Pd nanoparticles on self-supported carbon-Ni/NiO-Pd nanofiber
electrodes for electrochemical hydrogen and oxygen evolution reactions. J. Colloid
Interface Sci. 569, 286–297. https://doi.org/10.1016/j.jcis.2020.02.063
Bayram, E., 2016. Electrosoption of aromatic organic acids from aqueous solutions onto
granular activated carbon electrodes for water purification. Hacettepe J. Biol. Chem. 3,
273–273. https://doi.org/10.15671/hjbc.20164420570
Bayram, E., Ayranci, E., 2012a. Structural effects on electrosorptive behavior of aromatic
organic acids from aqueous solutions onto activated carbon cloth electrode of a flow-
through electrolytic cell. J. Electroanal. Chem. 683, 14–20.
https://doi.org/10.1016/j.jelechem.2012.07.028
Bayram, E., Ayranci, E., 2012b. Electrosorption based waste water treatment system using
activated carbon cloth electrode: Electrosorption of benzoic acid from a flow-through
electrolytic cell. Sep. Purif. Technol. 86, 113–118.
https://doi.org/10.1016/j.seppur.2011.10.032
Bayram, E., Kizil, Ç., Ayranci, E., 2018. Flow-through electrosorption process for removal
of 2,4-D pesticide from aqueous solutions onto activated carbon cloth fixed-bed
electrodes. Water Sci. Technol. 77, 848–854. https://doi.org/10.2166/wst.2017.598
Bousba, S., Meniai, A.H., 2014. Removal of phenol from water by adsorption onto sewage

Part III Results and Discussion
198
sludge based adsorbent. Chem. Eng. Trans. 40, 235–240.
https://doi.org/10.3303/CET1440040
Chen, Q., Wang, L., Xu, Y., Li, P., Wang, X., Wang, M., Kong, Y., 2018. Electrochemical
investigation of phenol oxidation by a TiO2/GAC based packed-bed electrode reactor.
Int. J. Electrochem. Sci. 13, 7301–7309. https://doi.org/10.20964/2018.08.59
Chen, Y., Tu, Y., Bai, Y., Li, J., Lu, J., 2018. Electrosorption enhanced electrooxidation of a
model organic pollutant at 3D SnO2-Sb electrode in superimposed pulse current mode.
Chemosphere 195, 63–69. https://doi.org/10.1016/j.chemosphere.2017.12.074
Damaskin, B. B., Baturina, O.A., 1999. Co-adsorption of anions and low-adsorbing cations
within the Alekseev-Popov-Kolotyrkin model. Russ. J. Electrochem. 35(11), 1182–
1185.
Damaskin, B.B., 2011. Modeling of co adsorption of cations and anions localized in different
layers of the dense part of electrical double layer under the conditions of linear charge
dependence of the adsorption energy. Russ. J. Electrochem. 47, 988–994.
https://doi.org/10.1134/S1023193511090047
Damaskin, B.B., 2008. Modeling of synergism effect at different orientation of co-adsorbing
molecules. Russ. J. Electrochem. 44, 1411–1417.
https://doi.org/10.1134/S102319350812001X
Damaskin, B.B., Baturina, O.A., 2001a. Some anomalies in coadsorption of two organic
substances due to differences in molecular interaction of species undergoing
coadsorption. Russ. J. Electrochem. 37, 1482–1489.
Damaskin, B.B., Baturina, O.A., 2001b. Simulating coadsorption of surface active anions
and organic molecules capable of forming two-dimensional condensed layers on the
electrode. Russ. J. Electrochem. 37, 121–126.
Damaskin, B.B., Baturina, O.A., 2001c. Simulation of coadsorption of inorganic ions and
organic molecules on electrodes. Russ. J. Electrochem. 37, 73–79.
Damaskin, B.B., Safonov, V.A., Safonov, N. V, 2003. Adsorption of an organic compound
in two different positions: Simulation taking into account all three parameters of
intermolecular interaction. Russ. J. Electrochem. 39, 814–819.
Du, X., Oturan, M.A., Zhou, M., Belkessa, N., Su, P., Cai, J., Trellu, C., Mousset, E., 2021.
Nanostructured electrodes for electrocatalytic advanced oxidation processes: From
materials preparation to mechanisms understanding and wastewater treatment
applications. Appl. Catal. B Environ. 296, 120332.
https://doi.org/10.1016/j.apcatb.2021.120332
Eisinger, R.S., Alkire, R.C., 1980. Electrosorption of b-naphthol on graphite. J
Electroanal.Chem. 112, 327–337.
Eisinger, R.S., Keller, G.E., 1990. Electrosorption: A case study on removal of dilute
organics from water. Environ. Prog. 9, 235–244. https://doi.org/10.1002/ep.670090418
Gileadi, E., 1966. Electrosorption of uncharged molecules on solid electrodes. J. Electroanal.
Chem. 11, 137–151. https://doi.org/10.1016/0022-0728(66)80073-6
Haider, S.S., Iqbal, M.Z., Zakar, S., Afzal, A.M., Yaqoob, K., Aftab, S., 2021. Superior
performance of electrodeposited CoMnS as novel electrode material for supercapattery
devices. J. Energy Storage 39, 102608. https://doi.org/10.1016/j.est.2021.102608
Han, Y., Quan, X., Chen, S., Zhao, H., Cui, C., Zhao, Y., 2006a. Electrochemically enhanced
adsorption of phenol on activated carbon fibers in basic aqueous solution. J. Colloid
Interface Sci. 299, 766–771. https://doi.org/10.1016/j.jcis.2006.03.007
Han, Y., Quan, X., Chen, S., Zhao, H., Cui, C., Zhao, Y., 2006b. Electrochemically enhanced
adsorption of aniline on activated carbon fibers. Sep. Purif. Technol. 50, 365–372.

Part III Results and Discussion
199
https://doi.org/10.1016/j.seppur.2005.12.011
Han, Y., Quan, X., Ruan, X., Zhang, W., 2008. Integrated electrochemically enhanced
adsorption with electrochemical regeneration for removal of acid orange 7 using
activated carbon fibers. Sep. Purif. Technol. 59, 43–49.
https://doi.org/10.1016/j.seppur.2007.05.026
Hazourli, S., Bonnecaze, G., Astruc, M., 1996. Adsorption et electrosorption de composes
organiques sur charbon actif en grains partie I - Influence du potentiel imposé et du
nombre de cycles adsorption and electrosorption of organic compounds on granular
activated carbon part I- Influence of applied. Environ. Technol. 17, 1275–1283.
https://doi.org/10.1080/09593330.1996.9618457
Hou, C.H., Huang, J.F., Lin, H.R., Wang, B.Y., 2012. Preparation of activated carbon sheet
electrode assisted electrosorption process. J. Taiwan Inst. Chem. Eng. 43, 473–479.
https://doi.org/10.1016/j.jtice.2011.12.003
Jayson, G.G., Sangster, J.A., Thompson, G., Wilkinson, M.C., 1987. Adsorption and
electrosorption of mercury (II) acetate onto activated charcoal cloth from aqueous
solution. Carbon N. Y. 25, 523–531. https://doi.org/10.1016/0008-6223(87)90193-X
Jiang, D., Li, B., 2009. Granular activated carbon single-chamber microbial fuel cells (GAC-
SCMFCs): A design suitable for large-scale wastewater treatment processes. Biochem.
Eng. J. 47, 31–37. https://doi.org/10.1016/j.bej.2009.06.013
Jin, Y., Wu, M., Zhao, G., Li, M., 2011. Photocatalysis-enhanced electrosorption process for
degradation of high-concentration dye wastewater on TiO2/carbon aerogel. Chem. Eng.
J. 168, 1248–1255. https://doi.org/10.1016/j.cej.2011.02.026
Kitous, O., Cheikh, A., Lounici, H., Grib, H., Pauss, A., Mameri, N., 2009. Application of
the electrosorption technique to remove Metribuzin pesticide. J. Hazard. Mater. 161,
1035–1039. https://doi.org/10.1016/j.jhazmat.2008.04.091
Lissaneddine, A., Pons, M.-N., Aziz, F., Ouazzani, N., Mandi, L., Mousset, E., 2021b. A
critical review on the electrosorption of organic compounds in aqueous effluent –
Influencing factors and engineering considerations. Environ. Res. J. 204, 112128.
https://doi.org/10.1016/j.envres.2021.112128
Liu, L., Liu, Y., Che, N., Gao, B., Li, C., 2021. Electrochemical adsorption of
perfluorooctanoic acid on a novel reduced graphene oxide aerogel loaded with Cu
nanoparticles and fluorine. J. Hazard. Mater. 416, 125866.
https://doi.org/10.1016/j.jhazmat.2021.125866
López-Bernabeu, S., Ruiz-Rosas, R., Quijada, C., Montilla, F., Morallón, E., 2016. Enhanced
removal of 8-quinolinecarboxylic acid in an activated carbon cloth by electroadsorption
in aqueous solution. Chemosphere 144, 982–988.
https://doi.org/10.1016/j.chemosphere.2015.09.071
Mcquillan, A.R. V, Stevens, G.W., Mumford, A., 2018. The electrochemical regeneration of
granular activated carbons: A review. J. Hazard. Mater.
https://doi.org/10.1016/j.jhazmat.2018.04.079
Meng, H.-S., Liu, Y., Liu, P.-X., Zhou, L.-L., Chen, C., Wang, W.-K., Xu, J., 2021.
Development of a three-dimensional photoelectrocatalytic reactor packed with granular
sludge carbon photoelectrocatalyst for efficient wastewater treatment, Sep. Purif.
Technol. 277, 11964. https://doi.org/10.1016/j.seppur.2021.119642
Moeini, B., Avval, T.G., Linford, M.R., Ghalkhani, M., Kaykhaii, M., Abdullah Mirzaie, R.,
2021. Surface-orientated platinum nanoparticles electrodeposited on a carbon substrate
as a high performance electrocatalyst for glucose oxidation reaction in alkaline media.
Mater. Sci. Eng. B Solid-State Mater. Adv. Technol. 268, 115147.

Part III Results and Discussion
200
https://doi.org/10.1016/j.mseb.2021.115147
Mohamed, E.F., Andriantsiferana, C., Wilhelm, A.M., Delmas, H., 2011. Competitive
adsorption of phenolic compounds from aqueous solution using sludge-based activated
carbon. Environ. Technol. 32, 1325–1336.
https://doi.org/10.1080/09593330.2010.536783
Mohanraj, R., Brindha, R., Kandeeban, R., Mahendhar, M., Saminathan, K., Ayyappadasaa,
G., 2021. Electrochemical detection of 5-hydroxytryptamine using sustainable SnO2-
graphite nanocomposite modified electrode. Mater. Lett. 305, 130796.
https://doi.org/10.1016/j.matlet.2021.130796
Niamlaem, M., Boonyuen, C., Sangthong, W., Limtrakul, J., Zigah, D., Kuhn, A.,
Warakulwit, C., 2020. Highly defective carbon nanotubes for sensitive, low-cost and
environmentally friendly electrochemical H2O2 sensors: Insight into carbon supports.
Carbon 170, 154–164. https://doi.org/10.1016/j.carbon.2020.07.081
Nie, C., Dai, Z., Meng, H., Duan, X., Qin, Y., Zhou, Y., Ao, Z., Wang, S., An, T., 2019.
Peroxydisulfate activation by positively polarized carbocatalyst for enhanced removal
of aqueous organic pollutants. Water Res. 166, 115043.
https://doi.org/10.1016/j.watres.2019.115043
Niu, J., Conway, B.E., 2003. Adsorption of organics onto an high-area C-cloth electrode
from organic solvents and organic solvent/water mixtures. J. Electroanal. Chem. 546,
59–72. https://doi.org/10.1016/S0022-0728(03)00146-3
Pierpaoli, M., Jakobczyk, P., Sawczak, M., Łuczkiewicz, A., Fudala-Książek, S.,
Bogdanowicz, R., 2021. Carbon nanoarchitectures as high-performance electrodes for
the electrochemical oxidation of landfill leachate. J. Hazard. Mater. 401, 123407.
https://doi.org/10.1016/j.jhazmat.2020.123407
Plaisance, H., Mocho, P., Bonnecaze, G., 1996. Adsorption et electrosorption de benzene sur
charbon actif en grains adsorption and electrosorption of benzene on granular activated
carbon. Environ. Technol. 17, 1313–1325. https://doi.org/10.1080/09593331708616501
Rong, C., Xien, H., 2009. Reversible electrosorption of thiocyanate anions by active carbon
felt. Sep. Sci. Technol. 44, 3984–3999. https://doi.org/10.1080/01496390903182453
Rong, C., Xien, H., 2005. Electrosorption of thiocyanate anions on active carbon felt
electrode in dilute solution. J. Colloid Interface Sci. 290, 190–195.
https://doi.org/10.1016/j.jcis.2005.04.022
Sahin, E.M., Tongur, T., Ayranci, E., 2020. Removal of azo dyes from aqueous solutions by
adsorption and electrosorption as monitored with in-situ UV-visible spectroscopy. Sep.
Sci. Technol. 55, 3287–3298. https://doi.org/10.1080/01496395.2019.1676786
Sekar, S., Aqueel Ahmed, A.T., Pawar, S.M., Lee, Y., Im, H., Kim, D.Y., Lee, S., 2020.
Enhanced water splitting performance of biomass activated carbon-anchored WO3
nanoflakes. Appl. Surf. Sci. 508, 145127. https://doi.org/10.1016/j.apsusc.2019.145127
Stenina, E. V, Baturina, O.A., Sviridova, L.N., Damaskin, B.B., 2001. Coadsorption of
halide anions and 1-adamantanol molecules on a mercury electrode. Russ. J.
Electrochem. 37, 931–938.
Strohl, J.H., Dunlap, K.L., 1972. Electrosorption and separation of quinones on a column of
graphite particles. Anal. Chem. 44, 2166–2170. https://doi.org/10.1021/ac60321a012
Sun, X.-F., Guo, B.-B., He, L., Xia, P.-F., Shu-Guang Wang, 2016. Electrically accelerated
removal of organic pollutants by a three-dimensional graphene aerogel. AIChE J. 59,
215–228. https://doi.org/10.1002/aic
Wang, X., Hu, Y., Min, J., Li, S., Deng, X., Yuan, S., Zuo, X., 2018. Adsorption
characteristics of phenolic compounds on graphene oxide and reduced graphene oxide:

Part III Results and Discussion
201
A batch experiment combined theory calculation. Appl. Sci. 8, 1–13.
https://doi.org/10.3390/app8101950
Yue, F., Zhang, Q., Xu, L., Zheng, Y., Yao, C., Jia, J., Leng, W., Hou, S., 2019. Porous
reduced graphene oxide/single-walled carbon nanotube film as freestanding and flexible
electrode materials for electrosorption of organic dye. ACS Appl. Nano Mater. 2, 6258–
6267. https://doi.org/10.1021/acsanm.9b01236
Zhu, P., Zhao, Y., 2019. Cyclic voltammetry measurements of electroactive surface area of
porous nickel: Peak current and peak charge methods and diffusion layer effect. Mater.
Chem. Phys. 233, 60–67. https://doi.org/10.1016/j.matchemphys.2019.05.034

202
General conclusion and Perspectives
The objective of this work was to perform a cycle of olive mill waste treatment in
which the olive pomace was first converted into a highly porous adsorbent and then into a
porous electrode that could be subsequently used for the treatment of OMWW by adsorption
or electrosorption. This is in the framework of a zero liquid and waste discharge approach and
promotes the circular economy concept.
The composite beads are a promising adsorbent for the selective removal of organic
pollutants in wastewater treatment; due to its high adsorption capacity, exceptional
regeneration capacity as well as the simple preparation method. First of all, the solid waste of
olive oil extraction processes (i.e., olive pomace) was converted into AC by treating it with
NaOH and then encapsulating it within SA in beads by crosslinking. Then, the prepared SA-
AC beads were applied as an adsorbent for the recovery of PCs from OMWW. The structure
and porous morphology of SA-AC beads was confirmed by FTIR, SEM and EDS, which
revealed the feasibility of SA-AC beads as potential and low-cost biosorbents. The adsorption
performance of these beads was evaluated in batch and fixed-bed reactors operated in a
concurrent flow system. The results revealed that an adsorption capacity of 68 mg g-1
was
reached with initial total PCs concentration of 4,000 mg L-1
. The kinetics of the adsorption
process of the PCs fitted a pseudo-second-order model, and the most likely mechanism took
place in two stages. The adsorption isotherm was in agreement with the Langmuir model,
representing a monolayer adsorption of the PCs. The dynamic models could also accurately
represent the breakthrough curves. Considering PC recovery, a regeneration experiment of
SA-AC beads was carried out in fixed-bed reactors. SA-AC beads depicted a higher
percentage of desorption (> 40%) using ethanol as solvent and they could be reused for
subsequent cycles for OMWW treatment and phenol recovery.
Then the electrosorption of PCs from simulated and real OMWW has been studied
with SA-AC beads packed-bed electrode. 100% w/v Fe crosslinking agents led to slightly
higher electrosorption efficiency (204 mg g-1
) and higher conductivity of the fixed-bed
electrode compared with 100% w/v Ca. The AC content was then varied from 0% w/v to 3%
w/v, while an optimal value was found to be around 1% w/v. At this percentage, the internal
ohmic drop voltage was lower (2.26 V), the mass transport was higher (9.7 10-5
m s-1
) and

203
the diffusivity was higher (7.3 10-9
m2 s
-1) as well, which led to enhanced electrosorption
rates. The applied electrode potential variation from -0.8 to -1.2 V/(Ag/AgCl) led to an
increase in electrosorption efficiency. At too high voltage (-1.3 V/(Ag/AgCl)), faradaic
reaction started to occur. Therefore, the Ecat of -1.1 V/(Ag/AgCl) was found optimal. At an
open circuit, the adsorption capacity was lower (123 mg g-1
against 170 mg g-1
),
demonstrating the interest of electrosorption over adsorption. Comparing the electrosorption
between simulated and real OMWW, the electrosorption capacity was found higher (307 mg
g-1
) with actual effluents. Upon these results, new models were developed to better understand
and predict the PCs electrosorption kinetics, including mass transport in transient regime.
Electro-migration was added to diffusion in the model with real effluent as an explanation
about the superiority of efficiency. The evolution of estimated diffusivity constant values
allowed confirming that the electrosorption efficiency depended mainly on the diffusion
within the beads and not at interfaces.
On the way to manufacture low-cost adsorbent directly from olive pomace waste, by
limiting the preparation steps and adding chemicals, GAC was proposed to recover PCs from
simulated and actual OMWW during either adsorption or electrosorption process. The
suitability of GAC properties to ensure good separation efficiency was confirmed using FTIR,
SEM, EDS and BET studies. Batch and fixed-bed column studies were used to understand the
OMWW adsorption into GAC. For batch equilibrium studies, the adsorption of PCs onto the
optimized GAC showed a strong dependence on the pH, temperature, contact time, and initial
PCs concentration. The adsorption isotherm models followed the Langmuir and pseudo-
second-order kinetic models. The Langmuir monolayer adsorption capacity of PCs adsorption
onto GAC was 1,666 mg g-1
. Adsorption capacity of PCs depended on the bed height and the
flow rate in column experiments. Both the Thomas and the Yoon-Nelson kinetic models fitted
well the experimental data in the column. The desorption experiments of PCs from GAC have
been realized. Therefore, the GAC could be used as a promising adsorbent for PCs adsorption
and desorption from OMMW.
Afterward, the electrosorption of PCs from simulated and real OMWW has been
studied with GAC packed-bed electrodes. The electrochemical characterization of GAC
electrode showed that a high electroactive surface area (7.8 × 103 cm
2), a high value of I0 (5.5
× 10-3
A), and low value of RCT (4 Ω) could be advantages for electrosorption studies. The
electrosorption study of PCs was performed at different current intensities for artificial

204
OMWW (1 to 200 mA) and for actual OMWW (1 to 100 mA). The highest electrosorption
efficiencies were found at 1 mA (0.26 V/(Ag/AgCl)) for artificial OMWW and 10 mA (-0.05
V/(Ag/AgCl)) for actual OMWW, 72% and 68%, respectively. The influence of PCs types
with different pKa and molecular sizes showed that both parameters had an impact on the
electrosorption efficiency, depending on the solution pH and GAC pore size distribution. In
addition, the recovery of PCs from the GAC electrode using the electrochemical regeneration
method was performed and the percentage of PCs recovered was 34.5%. Finally, the
combination of electrosorption as a separation technique for PCs recovery and advanced
electrooxidation as a degradation process for OMWW was investigated. The COD removal
efficiency was 84% and 91% for the combined processes before and after filtration,
respectively.
The combination of electrosorption with a degradation process appears to be a
promising strategy for treating OMWW, but still requires adjustments. In addition, some
aspects need to be integrated to validate these processes and their uses for the treatment of
OMWW:
Other more powerful chemical activators should be tested to avoid carbonization to
produce an even more efficient activated carbon, i.e. cheaper, stiffer, and containing more
mesopores and micropores; thermal activation could also be tried in the absence of oxygen to
avoid carbon loss,
The selectivity of organic compounds with respect to separation technologies could be
studied in more details by developing sufficiently elaborate analytical protocols. This would
allow distinguishing the different types of PCs (and organic compounds in general) present in
complex matrices such as real effluents, before, during and after adsorption/electrosorption
and desorption/electrodesorption,
The treatment of residual margines by electro-oxidation could be optimized after
having well identified the problems related to the fouling of the anode,
The efficiency of the various treatments (adsorption/desorption,
electrodesorption/electrodesorption, electro-oxidation) must be tested on pilot scale processes
and then on an industrial scale; the optimization must also be done on a larger scale in order
to estimate the costs which will be more representative with real conditions. This will also
allow a better comparison of the efficiency of these technologies compared to other existing
processes.