Cationic Microbubbles and Antibiotic-free miniplasmid for ...

Chemical Engineering Journal 254 (2014) 571–578
Contents lists available at ScienceDirect
Chemical Engineering Journal
journal homepage: www.elsevier .com/locate /cej
Kinetic model for the immobilised biosorbents: Uptake of cationic dyes
http://dx.doi.org/10.1016/j.cej.2014.05.0641385-8947/� 2014 Elsevier B.V. All rights reserved.
⇑ Corresponding author. Tel.: +91 11 25691239.E-mail addresses: [email protected] (N.S. Maurya), [email protected]
(A.K. Mittal).
Nityanand Singh Maurya a, Atul Kumar Mittal b,⇑a Department of Civil Engineering, National Institute of Technology Patna, 800 005, Indiab Department of Civil Engineering, Indian Institute of Technology Delhi, Hauz Khas, New Delhi 110 016, India
h i g h l i g h t s
� A kinetic model has been developed using the concept of Chemically Active Available Binding Sites.� It has been validated using immobilized F. carnea in polyvinyl alcohol (PVA) matrix and two cationic dyes.� It is compared with first order kinetic, Pore diffusion, single resistance and pseudo second order kinetic models.� Effect of temperature, mixing speed and sorbent dose has shown applicability of the model.
a r t i c l e i n f o
Article history:Received 18 April 2014Received in revised form 14 May 2014Accepted 15 May 2014Available online 12 June 2014
Keywords:BiosorptionImmobilizationMacro fungusSafranin OPolyvinyl alcoholKinetic model
a b s t r a c t
A sorption kinetic model has been developed using concept of Chemically Active Available Binding Sites(CAABS). Dead ‘‘Fomitopsis carnea’’ immobilized on polyvinyl alcohol (PVA) matrix has been employed asthe immobilized sorbent. Safranin O and Alcian Blue are the representative sorbates. Results indicate thatCAABS model described the kinetics with high degree of correlation coefficient (R2 P 0.99) for under dif-ferent environmental conditions, viz., mixing speed (60, 200 and 500 revolutions per minutes), and bio-sorbent doses. Student’s t-test also revealed that the predicted data using Chemically Active AvailableBinding Sites (CAABS) model were significantly correlated with the experimental data. The CAABS modelwas also compared with well known kinetic models such as Lagergren’s model (first order kinetic model),Single resistance model, Pore diffusion model, and Pseudo-second order kinetic model. The comparativestudy of these models also confirmed high efficacy of the CAABS model to depict the experimental data.
� 2014 Elsevier B.V. All rights reserved.
1. Introduction
Biosorption of inorganic [1–4] and organic species [5–7] hasbeen extensively reported in the literature. However, field applica-tion of the biosorptive processes remained very limited. It may bedue to poor engineering properties of the biosorbents. Immobilisa-tion process has been quoted to improve the improve engineeringproperties of virgin biomass [8].
To design and/or to evaluation a biosorption system, suitablesorption kinetic model is warranted, which could simulate actualbiosorption kinetics efficiently. Therefore, various sorption kineticmodels have been proposed, i.e., Lagergrn’s model (first orderkinetic model) [9], Single resistance model [10,11], Pore diffusionmodel [12] and Pseudo-second order model [13]. These modelswere developed for metal surfaces, different types of coals andactivated carbons. Physical and chemical characteristics of a
biosorbent differ from the activated carbon. Surface of a biosorbentgenerally consists of biopolymers studded with a number ofcomplex functional groups. Many researchers have indicated thatthe biosorptive processes involve chemical complexation, ionexchange, covalent and hydrogen bonds, and physio-sorption,besides involving oxidation–reduction and micro precipitationetc. The kinetic model proposed by Mittal [14] is based on virginbiomass without considering immobilization process. Immobilisa-tion of a biomass may affect the surface of the biosorbent and itsmorphology. There is no study available in the literature whichhas specifically developed a sorption kinetic model for the immo-bilized biosorbent.
This paper reports a sorption kinetic model which is based onthe basic principles of chemi-sorption and physi-sorption. Datagenerated from sorption kinetic experiments, employing immobi-lized biomass of a dead macro fungus namely ‘‘Fomitopsis carnea’’in polyvinyl alcohol (PVA) matrix as a biosorbent and two cationicdyes namely Safranin O and Alcian Blue as sorbate under variousenvironmental conditions viz., mixing speed and bisorbent dose,have been used to validate the developed kinetic model.

Glossary
CAABS Chemically Active Available Binding SitesQe Quantity of dye transferred (mg g�1) onto the biosorbent
at equilibrium conditionM Dose of the biosorbent (g L�1)C0 Initial liquid phase concentration (mg L�1) of the sorbateCe Liquid phase concentration (mg L�1) of the sorbate (dye)
at equilibrium,Ct Sorbate concentration (mg L�1) in bulk solution at time tQt Solid phase concentration (mg g�1) of the dye (sorbate)
at time t
Nt Number of Chemically Active Available Binding Sites,CAABS present on the surface of the biosorbent
Kpm Kinetic coefficient, (L g�1 h�1)Kpm max Maximum possible mass transfer rate per unit time per
unit weight of the biosorbentE Model constant related to the mixing speedF Model constant related to the dose of the biosorbentN Mixing speed in rpmKpm min Minimum possible mass transfer rate coefficient per
unit time per unit weight of biosorbent
572 N.S. Maurya, A.K. Mittal / Chemical Engineering Journal 254 (2014) 571–578
2. Materials and methods
2.1. Biosorbent preparation
Dried powdered biomass of F. carnea – a macro fungus, wasimmobilized as per the method described elsewhere [15,16].5.0 g PVA (average molecular weight 89,000–98,000, Aldrich,USA) was dissolved in 50 mL distilled water at 80 ± 2 �C. After16 h of stirring, pre-determined powder biomass was added tothe cooled PVA solution. The completely mixed solution of PVAand biomass was extruded in the liquid nitrogen. As soon as solu-tion drop came in contact with liquid nitrogen, instantly bead wasformed. Beads were kept in liquid nitrogen overnight, and thenwere frozen and thawed for four cycles. Beads were kept at40 ± 2 �C till the difference in weight between two consecutivedays became negligible.
2.2. Sorbate
Cationic dye namely Safranin O (Basic Red 2, CI 50240) andAlcian Blue (C.I. No. 74240) were used as sorbate. Aqueous solutionhaving dye concentration of 100 mg/L were used in all theexperiments.
2.3. Batch biosorption kinetic experiments
Kinetic experiments were carried out in an acrylic vessel having140.0 mm internal diameter and 180.0 mm height as describedelsewhere [17]. At predetermined time intervals, samples werewithdrawn from the adsorber and were analysed for residual dyeconcentration. Mass of dye transferred from the aqueous phaseto the sorbent was determined by applying the mass balance onthe reaction vessel as follows:
Q e�M ¼ ðC0 � CeÞ ð1Þ
Liquid film boundary
Biosorbent particle
Biosorption siteboundaryBulk solution concentration, Ct
(C varies from C to C )
or Q e ¼ ðC0 � CeÞ=M ð2Þ
where Qe is quantity of sorbate transferred (mg g�1) onto the bio-sorbent (or solid phase sorbate concentration) at equilibrium condi-tion, C0 and Ce are initial and equilibrium liquid phase sorbateconcentration (mg L�1) respectively and M is dose of the biosorbent(g L�1).
t 0 e
Fig. 1. Conceptual diagram for sorbate transport and attachment on to the sorbentparticle.
2.3.1. Effect of mixing speedA number of kinetic experiments were undertaken at various
mixing speeds, i.e., 60, 200 and 500 rpm. Biosorbent doses were1.05 and 5.00 g L�1 for Safranin O and for Alcian Blue respectively.
2.3.2. Effect of doseBiosorbent doses were 0.50, 1.05, 1.50 g L�1 for Safranin O and
2.00, 5.00, 9.24 g L�1 for Alcian Blue. Mixing speed in all theseexperiments was 500 rpm.
3. Model development
Biosorption could be considered as a result of unbalance forcesacting upon the sorbate molecule. The unbalance forces may arisedue to (1) liquid phase concentration gradient at the time of equi-librium, and (2) presence of Chemically Active Available BindingSites (CAABS) on the outer surface of immobilised biomass andwithin the pores (micro and macro) of the biosorbent. Finally,the attachment of the sorbate occurs at these Chemically ActiveSites (CAABS). So, biosorption rate for a specific sorbatan can beconsidered as a combined effect of the concentration gradientand CAABS. Graphically, this concept is presented in Fig. 1.
The total dye uptake by the sorbent can be considered as aresult of (1) physi-sorption which is a function of liquid phase con-centration gradient of the sorbate, and (2) chemi-sorption which isassumed to be the function of CAABS. Surface of the immobilisedbiosorbent can be considered as studded with CAABS, graphicallyshown in Fig. 1. Chemi-sorption including chemical complexation,ion exchange, electrical forces, and different types of chemicalbonding occurs at the CAABS.
3.1. Physi-sorption
Rate of change in concentration of the sorbate on the solidphase (biosorbent) is directly proportional to the liquid phase con-centration difference, which is assumed as the first order reaction.Mathematically, it can be represented as follows:

N.S. Maurya, A.K. Mittal / Chemical Engineering Journal 254 (2014) 571–578 573
dQ t=dt aðCt � CeÞ ð3Þ
where, dQt/dt is the mass transfer rate of the sorbate (dye). It woulddepend on several factors, including physical and chemical charac-teristics of biosorbent, chemical structure of sorbate (dye), initialliquid phase sorbate concentration, pH, ionic strength and temper-ature of the sorbate solution. Apart from these, mixing speed andbiosorbent dose are also an important factor affecting equilib-rium-dye-concentration [18].
3.2. Chemi-sorption
Finally, the dye molecule (sorbate) is transferred at the CAABS.Rate of change of the solid phase concentration of the sorbate isdirectly related to the CAABS. Assuming that numbers of CAABSat any time t are Nt, the rate of change in sorbate concentrationon the sorbent can be expressed as:
dQ t=dt aNt ð4Þ
where Nt is the number of Chemically Active Available Binding Sites(CAABS) present on the surface of the biosorbent.
A number of functional groups which may constitute the bio-polymers, are present on the surface of the biosorbent, which inturn interact with the dye cation (sorbate). These groups couldbe phosphate, carboxyl, amine, hydroxyl, chitin (R2-NH), chitosan(R-NH2), melanins and other pigments [19]. It is also evident fromFig. 2 (FT-IR of the biomass used in the preparation of immobilisedbiosorbent of the present study) that a number of surface groupslike OH (K1), methylene (K2), carbonyl (K3), amides/nitro (K4),methyl/nitro (K5), amines (K7), C-O bond (K8 & K9), sulfoxides(K11 & K12), C-X (K13) etc are present on the surface of the biosor-bent. Sorption of the dye onto the biosorbent is a result of variousinteractions between the dye (sorbate) and the sorbent, such asion-exchange, chemical complexation and different types of ban-dage due to electrostatic forces, hydrogen bonding etc. CAABS are
Wave num
Abs
orba
nce
Fig. 2. FTIR of the biosorbe
basically sites, which represent various types of all such interac-tions between the dye and the sorbent.
It is assumed that the CAABS are proportional to the sorptioncapacity of the biosorbent at any given time, t. For a given doseof the biosorbent, maximum sorption capacity of the biosorbentcould be measured in terms of the solid phase concentration(mg g�1) of the sorbate at equilibrium, Qe. If the solid phaseconcentration of the biosorbate at a given time t is Qt, than thefractional sorption capacity of the biosorbent at time t, could berepresented by Qt/Qe. Thus, the remaining sorption capacity wouldbe (1 � Qt/Qe). Hence,
Nt að1� Q t=Q eÞ ð5Þ
Combining, Eqs. (4) and (5),
dQ t=dt a ð1� Qt=Q eÞ ð6Þ
Eq. (3) can also be presented as follows,
dQ t=dt a MðQe � QtÞ ð7Þ
where, M is the dose of biosorbent in g L�1.Combining Eqs. (6) and (7),
dQ t=dt ¼ Kpm�M�ðQ e � Q tÞ�ð1� Q t=QeÞ ð8Þ
where, Kpm is the kinetic coefficient, (L g�1 h�1).Separating the variables in Eq. (8),
dQ t=ðQ e � Q tÞ2 ¼ ðKpm�M=Q eÞdt ð9Þ
Integrating Eq. (9) for the boundary conditions, at a = t, Qt = 0,and t = t, Qt = Qt
1=ðQe � QtÞ ¼ ðKpm�M=Q eÞ�t þ 1=Q e ð10Þ
Eq. (10) can be rearranged as follows,
Qt ¼ t=ð1=ðKpm�M�Q eÞ � t=Q eÞ ð11Þ
which can be linearized as follows:
bers (cm-1)
nt, Fomitopsis carnea.

20
40
60
80
100
0 20 40 60 80 100
Ct (
mg/
L)
t (h)
(a)
20
40
60
80
100
0 20 40 60 80 100
Ct (
mg/
L)
t (h)
(b)
20
40
60
80
100
0 20 40 60 80
Ct (
mg/
L)
t (h)
(c )
Fig. 3. Variation in mixing speed (a) 60 (b) 200 (c) 500 rpm; Experimental data (N),Pore diffusion ( ), Furusawa and Smith ( ), Lagergren’model ( ) and CAABS model ( ) for the sorption of SafraninO.
20
40
60
80
100
0 20 40 60 80
Ct (
mg/
L)
t (h)
(a)
20
40
60
80
100
0 20 40 60 80
Ct (
mg/
L)
t (h)
(b)
20
40
60
80
100
0 20 40 60 80
Ct (
mg/
L)
t (h)
(c )
Fig. 4. Variation in mixing speed (a) 60 (b) 200 (c) 500 rpm; Experimental data (N),Pore diffusion ), Furusawa and Smith ( ), Lagergren’smodel ( ) and CAABS model ( ) for the sorption of AlcianBlue.
574 N.S. Maurya, A.K. Mittal / Chemical Engineering Journal 254 (2014) 571–578
t=Q t ¼ 1=ðKpm�M�Q eÞ þ t=Q e ð12Þ
t/Qt could be plotted against t. The linear fit of the kinetic data to thisplot (t/Qt vs t) could be used to obtain the kinetic coefficient, Kpm.
Expression for the Pseudo-second order kinetic model asdescribed by Ho et al. [13] is given below:
t=Q t ¼ 1=ðKso�Q 2
e Þ þ t=Q e ð13Þ
Mathematically, Pseudo-second order model (Eq. (13)) is verysimilar to the proposed biosorption kinetic model, CAABS(Eq. (12)). Linearised solutions of both the models (Eqs. (12) and(13)) consist of plotting same parameters as ordinate (t/Q) andabscissa (t). However, the constant term of the CAABS model isdifferent from the Psuedo-second order model. The kineticconstant (Kpm) of the CAABS model is a function of the dose ofthe biosorbent (M), whereas the coefficient of the Pseudo-secondorder model does not use the biosorbent dose. It is obvious thatthe biosorption kinetics will must be affected by the dose of thebiosorbent for a given set of system parameters. Thus, the kineticcoefficient obtained from the CAABS would be a better representa-tive of the biosorption kinetics.
4. Results and discussion
4.1. Model validation: determination of mass transfer coefficient
The kinetic profiles generated at different mixing speeds andbiosorbent doses using the CAABS model were compared with
the widely used models namely the Lagergren’s model [9], Porediffusion model [12], Single resistance model [10] and Pseudo-second order model [13]. These models are based on the differentmechanism of the sorption. Lagergren’s model is the most fre-quently cited kinetic models involving first order reaction kinetics;the Single resistance model proposed by Furusawa and Smith in1973 [10] considers film diffusion along with the equilibrium data;Pore diffusion model is based on the rate limiting resistance to thediffusion of the sorbate within the pores of the sorbent; andPseudo-second order model is the second order model which isthe latest in the series of sorption kinetic models.
4.1.1. Lagergren’s modelThe Lagergren’s model is based on first order reaction kinetics
[9,20]. It is given below:
lnðQ e � Q tÞ ¼ ln Qe � kad�t ð14Þ
Here, Qt and Qe are the solid phase concentration of sorbate at anytime and at equilibrium, respectively. kad is the Lagergren’s kineticconstant.
4.1.2. Pore diffusion modelPore diffusion model [2,12] is given below:
Qt ¼ Kp�t0:5 ð15Þ
Here, Kp is pore diffusion kinetic constant.
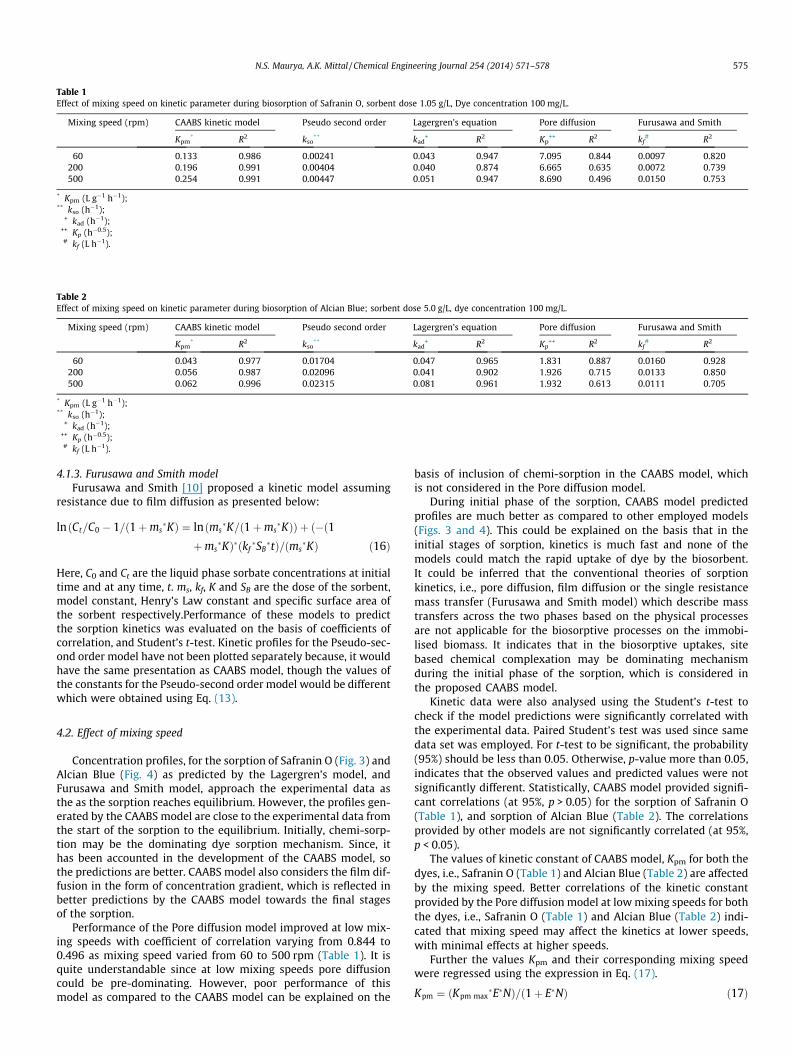
Table 1Effect of mixing speed on kinetic parameter during biosorption of Safranin O, sorbent dose 1.05 g/L, Dye concentration 100 mg/L.
Mixing speed (rpm) CAABS kinetic model Pseudo second order Lagergren’s equation Pore diffusion Furusawa and Smith
Kpm* R2 kso
** kad+ R2 Kp
++ R2 kf# R2
60 0.133 0.986 0.00241 0.043 0.947 7.095 0.844 0.0097 0.820200 0.196 0.991 0.00404 0.040 0.874 6.665 0.635 0.0072 0.739500 0.254 0.991 0.00447 0.051 0.947 8.690 0.496 0.0150 0.753
* Kpm (L g�1 h�1);** kso (h�1);
+ kad (h�1);++ Kp (h�0.5);# kf (L h�1).
Table 2Effect of mixing speed on kinetic parameter during biosorption of Alcian Blue; sorbent dose 5.0 g/L, dye concentration 100 mg/L.
Mixing speed (rpm) CAABS kinetic model Pseudo second order Lagergren’s equation Pore diffusion Furusawa and Smith
Kpm* R2 kso
** kad+ R2 Kp
++ R2 kf# R2
60 0.043 0.977 0.01704 0.047 0.965 1.831 0.887 0.0160 0.928200 0.056 0.987 0.02096 0.041 0.902 1.926 0.715 0.0133 0.850500 0.062 0.996 0.02315 0.081 0.961 1.932 0.613 0.0111 0.705
* Kpm (L g�1 h�1);** kso (h�1);
+ kad (h�1);++ Kp (h�0.5);# kf (L h�1).
N.S. Maurya, A.K. Mittal / Chemical Engineering Journal 254 (2014) 571–578 575
4.1.3. Furusawa and Smith modelFurusawa and Smith [10] proposed a kinetic model assuming
resistance due to film diffusion as presented below:
ln ðCt=C0 � 1=ð1þms�KÞ ¼ lnðms
�K=ð1þms�KÞÞ þ ð�ð1
þms�KÞ�ðkf
�SB�tÞ=ðms
�KÞ ð16Þ
Here, C0 and Ct are the liquid phase sorbate concentrations at initialtime and at any time, t. ms, kf, K and SB are the dose of the sorbent,model constant, Henry’s Law constant and specific surface area ofthe sorbent respectively.Performance of these models to predictthe sorption kinetics was evaluated on the basis of coefficients ofcorrelation, and Student’s t-test. Kinetic profiles for the Pseudo-sec-ond order model have not been plotted separately because, it wouldhave the same presentation as CAABS model, though the values ofthe constants for the Pseudo-second order model would be differentwhich were obtained using Eq. (13).
4.2. Effect of mixing speed
Concentration profiles, for the sorption of Safranin O (Fig. 3) andAlcian Blue (Fig. 4) as predicted by the Lagergren’s model, andFurusawa and Smith model, approach the experimental data asthe as the sorption reaches equilibrium. However, the profiles gen-erated by the CAABS model are close to the experimental data fromthe start of the sorption to the equilibrium. Initially, chemi-sorp-tion may be the dominating dye sorption mechanism. Since, ithas been accounted in the development of the CAABS model, sothe predictions are better. CAABS model also considers the film dif-fusion in the form of concentration gradient, which is reflected inbetter predictions by the CAABS model towards the final stagesof the sorption.
Performance of the Pore diffusion model improved at low mix-ing speeds with coefficient of correlation varying from 0.844 to0.496 as mixing speed varied from 60 to 500 rpm (Table 1). It isquite understandable since at low mixing speeds pore diffusioncould be pre-dominating. However, poor performance of thismodel as compared to the CAABS model can be explained on the
basis of inclusion of chemi-sorption in the CAABS model, whichis not considered in the Pore diffusion model.
During initial phase of the sorption, CAABS model predictedprofiles are much better as compared to other employed models(Figs. 3 and 4). This could be explained on the basis that in theinitial stages of sorption, kinetics is much fast and none of themodels could match the rapid uptake of dye by the biosorbent.It could be inferred that the conventional theories of sorptionkinetics, i.e., pore diffusion, film diffusion or the single resistancemass transfer (Furusawa and Smith model) which describe masstransfers across the two phases based on the physical processesare not applicable for the biosorptive processes on the immobi-lised biomass. It indicates that in the biosorptive uptakes, sitebased chemical complexation may be dominating mechanismduring the initial phase of the sorption, which is considered inthe proposed CAABS model.
Kinetic data were also analysed using the Student’s t-test tocheck if the model predictions were significantly correlated withthe experimental data. Paired Student’s test was used since samedata set was employed. For t-test to be significant, the probability(95%) should be less than 0.05. Otherwise, p-value more than 0.05,indicates that the observed values and predicted values were notsignificantly different. Statistically, CAABS model provided signifi-cant correlations (at 95%, p > 0.05) for the sorption of Safranin O(Table 1), and sorption of Alcian Blue (Table 2). The correlationsprovided by other models are not significantly correlated (at 95%,p < 0.05).
The values of kinetic constant of CAABS model, Kpm for both thedyes, i.e., Safranin O (Table 1) and Alcian Blue (Table 2) are affectedby the mixing speed. Better correlations of the kinetic constantprovided by the Pore diffusion model at low mixing speeds for boththe dyes, i.e., Safranin O (Table 1) and Alcian Blue (Table 2) indi-cated that mixing speed may affect the kinetics at lower speeds,with minimal effects at higher speeds.
Further the values Kpm and their corresponding mixing speedwere regressed using the expression in Eq. (17).
Kpm ¼ ðKpm max�E�NÞ=ð1þ E�NÞ ð17Þ

0
0.1
0.2
0.3
0 200 400 600
Kpm
Mixing speed (rpm)
Expt. data
Model fit
Fig. 5. Effect of mixing speed on the Kpm: Sorbate–Safranin O.
0.02
0.03
0.04
0.05
0.06
0.07
0 200 400 600
Kpm
Mixing speed (rpm)
Expt. data
Model fit
Fig. 6. Effect of mixing speed on the Kpm: Sorbate–Alcian Blue.
30
50
70
90
110
0 20 40 60 80
Ct (
mg/
L)
t (h)
(a)
20
40
60
80
0 20 40 60 80
Ct (
mg/
L)
t (h)
(b)
0
20
40
60
80
100
0 20 40 60 80
Ct (
mg/
L)
t (h)
(c)
Fig. 7. Effect of biosorbent dose (a) 0.5 (b) 1.05 (c) 1.5 g/L; Experimental data (N) Porediffusion ( ), Furusawa and Smith ( ), Lagergren’s model( ) and CAABS model ( ) for the sorption of Safranin O.
576 N.S. Maurya, A.K. Mittal / Chemical Engineering Journal 254 (2014) 571–578
where, Kpm max represents the maximum possible mass transfer rateper unit time per unit weight of the biosorbent, E is the model con-stant, and N is the mixing speed in rpm. Figs. 5 and 6 present changein Kpm values as mixing speed varies from 60 to 500 rpm for Safra-nin O and Alcian Blue respectively. It is evident from the Figs. 5 and6, Kpm increases to a maximum value, ‘Kpm max’ at high speeds, andbecomes asymptotic for both the dyes. Thus, it is assumed that afunction as described in Eq. (17) can be used to describe the effectof the mixing speed on the kinetic constant of the CAABS model.Kpm max and E for Safranin O are 0.272 and 0.0157 respectively atcoefficient of correlation as 0.985. For Alcian Blue, Kpm max and Eare 0.066 and 0.0132 at coefficient of correlation as 0.998. Highervalue of Kpm max for Safranin O as compared to the Alcian Blue issupported from the observations that Safranin O is better sorbed(Figs. 3 and 4), further validating the physical significance of theKpm max.
4.3. Effect of biosorbent dose
CAABS model assumes that transfer of sorbate from aqueousphase to the solid surface of the biosorbent depends upon thenumber of CAABS. These sites are proportional to the mass of thebiosorbent. Thus, at higher sorbent dose, the rate of sorption wouldbe high.
10
30
50
70
90
110
0 20 40 60 80
Ct (
mg/
L)
t (h)
(a)
10
30
50
70
90
110
0 20 40 60 80
Ct (
mg/
L)
t (h)
(b)
0
20
40
60
80
100
0 20 40 60 80
Ct (
mg/
L)
t (h)
(c)
Fig. 8. Effect of biosorbent dose (a) 2.0 (b) 5.0 (c) 9.24 g/L, Experimental data (N), Porediffusion ( ), Furusawa and Smith ( ), Lagergren’s model( ) and CAABS model ( ) for the sorption of Alcian Blue.

Table 3Effect of biosorbent dose on kinetic parameters during biosorption of the Safranin O, mixing speed 500 rpm, dye concentration 100 mg/L.
Dose (g/L) CAABS model Pseudo second order Lagergren’s equation Pore diffusion Furusawa and Smith
Kpm* R2 kso
** kad+ R2 Kp
++ R2 kf# R2
0.5 0.323 0.993 0.002571 0.063 0.985 8.869 0.800 0.0040 0.7361.05 0.254 0.991 0.004473 0.051 0.947 8.690 0.496 0.0150 0.7531.5 0.216 0.996 0.005589 0.066 0.957 7.771 0.707 0.0219 0.858
* Kpm (L g�1 h�1);** kso (h�1);
+ kad (h�1);++ Kp (h�0.5);# kf (L h�1).
Table 4Effect of biosorbent dose on kinetic parameter during the biosorption of Alcian Blue, mixing speed 500 rpm, dye concentration 100 mg/L.
Dose (g/L) CAABS model Pseudo second order Lagergren’s equation Pore diffusion Furusawa and Smith
Kpm* R2 kso
** kad+ R2 Kp
++ R2 kf# R2
2.0 0.083 0.979 0.008533 0.060 0.978 1.926 0.715 0.0064 0.8275.0 0.062 0.996 0.023152 0.081 0.961 1.932 0.613 0.0111 0.7059.24 0.067 0.999 0.060307 0.106 0.949 1.696 0.369 0.0425 0.837
* Kpm (L g�1 h�1);** kso (h�1);
+ kad (h�1);++ Kp (h�0.5);# kf (L h�1).
0.04
0.06
0.08
0.1
0.0 5.0 10.0
Kpm
Dose (g/L)
Expt. dataModel fit
Fig. 10. Effect of biosorbent dose on the Kpm: sorbate–Alcian Blue.
N.S. Maurya, A.K. Mittal / Chemical Engineering Journal 254 (2014) 571–578 577
Figs. 7 and 8 present the experimental data along with thekinetic profiles generated employing all kinetic models consideredin the study at various doses for Safranin O and Alcian Blue respec-tively. At all sorbent doses, the CAABS model generated kinetic pro-files correlated with the experimental data better as compared toother models. Observed correlation coefficients were greater than0.99 (Table 3), and 0.97 (Table 4) for Safranin O and Alcian Bluerespectively. High correlation coefficients for the CAABS model ascompared to other models indicate the applicability of the CAABSmodel at high as well as at low biosorbent doses. Thus, it validatesthe concept of CAABS.
The Student’s t-test showed that kinetic profiles, generated bythe CAABS model are significantly correlated (p > 0.05 at 95%) withthe experimental data for all dosage. In general, other models werenot statistically significant (p < 0.05 at 95%).
Variation of Kpm (rate constant of the CAABS model) with bio-sorbent dose is presented in Figs. 9 and 10 for Safranin O andAlcian Blue respectively. In all cases, as biosorbent doses increases,Kpm decreases, and finally gets asymptotic. This could be explainedon the basis that initially, at a low dose, the CAABS are limited innumbers, so the dye to CAABS ratio is high, thus rate of dye uptake
0.1
0.2
0.3
0.4
0.0 0.5 1.0 1.5 2.0
Kpm
Dose (g/L)
Expt. dataModel fit
Fig. 9. Effect of biosorbent dose on the Kpm: sorbate–Safranin O.
is high. But, when CAABS have been increased to a level whereCAABS are not rate limiting, any further increase in the CAABSwould not increase the rate of transfer of the biosorbate, i.e., therate constant becomes asymptotic, and kinetic constant rate Kpm
approaches a minimum value Kpm min (Figs. 9 and 10). This phe-nomenon may be well described by the Eq. (18) as given bellow:
Kpm ¼ ðKpm min�F�MÞ=ð1þ F�MÞ ð18Þ
where, Kpm min represents the minimum possible mass transfer ratecoefficient per unit time per unit weight of biosorbent, F is a modelconstant and M is the biosorbent dose in g L�1.
Kpm min and F for Safranin O are 0.193 and �4.882 respectivelywith coefficient of correlation as 0.937. For Alcian Blue, Kpm min andF are 0.059 and 11.868 with coefficient of correlation as 0.800. Themaximum of the minimum rate constant corresponds to the sor-bate–sorbent system which shoed maximum sorption capacity,i.e., Safranin O, and the least of the minimum rate constant corre-sponds to the sorbate–sorbent system which shoed minimumsorption capacity, i.e., Alcian Blue. Probably, the minimum rateconstant could be used as indicator to compare the biosorptionintensity of different sorbate–sorbent systems.

578 N.S. Maurya, A.K. Mittal / Chemical Engineering Journal 254 (2014) 571–578
5. Conclusions
The CAABS kinetic model developed in this study showed bettercorrelation with the experimental data as compared to other mod-els. Model constants are well correlated at various mixing speedand sorbent dose. Existing models like Lagergren model, Pore diffu-sion model and Furusawa and Smith model are not able to corre-late from start of the kinetics to the end. It may be attributed tothe fact these models consider only one of the characteristic ofthe sorption process, i.e., either film diffusion or pore diffusion.The CAABS model showed its superiority over others as it is basedon the concept of Chemically Active Available Binding Sites besidesconsidering the concentration gradient. The developed CAABSmodel formulations can be used for the design of an adsorberwhich uses immobilised biomass as the biosorbent.
References
[1] J.C. Crittenden, R.P.S. Suri, D. Perram, D. Hand, Decontamination of water usingadsorption and photocatalysis, Water Res. 31 (1997) 411–418.
[2] Y.P. Ting, A.K. Mittal, An evaluation of equilibrium and Kinetic models for Goldbiosorption, Resour. Environ. Biotechnol. 2 (1999) 311–326.
[3] E. Guibal, C. Milot, J. Roussy, Influence of hydrolysis mechanisms on molybdatesorption isotherms using chitosan, Sep. Sci. Technol. 35 (2000) 1021–1038.
[4] M. Jain, V.K. Garg, K. Kadirvelu, Cadmium (II) sorption and desorption in a fixedbed column using sunflower waste carbon calcium–alginate beads, Bioresour.Technol. 129 (2013) 242–248.
[5] Z. Aksu, A._I. Tatlı, Ö. Tunç, A comparative adsorption/biosorption study of AcidBlue 161: effect of temperature on equilibrium and kinetic parameters, Chem.Eng. J. 142 (2008) 23–39.
[6] K.R. Ramakrishna, T. Viraraghavan, Dye removal using low cost adsorbents,Water Sci. Technol. 36 (1997) 189–196.
[7] N.S. Maurya, A.K. Mittal, Removal mechanism of cationic dye (Safranin O) fromaqueous phase by dead macro fungus biosorbent, Water Sci. Technol. 68(2013) 1048–1054.
[8] K.-M. Khoo, Y.-P. Ting, Biosorption of gold by immobilized fungal biomass,Biochem. Eng. J. 8 (2001) 51–59.
[9] S. Lagergren, Zur theorie der sogenannten adsorption geloster stoffe, KungligaSevenska Vetenskapsakademiens, Handlingar. 24 (1898) 1–39.
[10] T. Furusawa, J.M. Smith, Fluid-particle and intra-particle mass transport inslurries, Ind. Eng. Chem. Fund. 12 (1973) 197–203.
[11] S. Allen, P. Brown, G. McKay, O. Flynn, An evaluation of single resistancetransfer models in the sorption of metal ions by peat, J. Chem. Technol.Biotechnol. 54 (1992) 271–276.
[12] W.J. Weber Jr., J.C. Morris, Kinetics of adsorption on carbon from solution, J.Environ. Eng. ASCE 89 (1963) 31–60.
[13] Y.S. Ho, D.A.J. Wase, C.F. Foster, Kinetic studies of competitive heavy metaladsorption by sphagnum moss peat, Environ. Technol. 17 (1996) 71–77.
[14] A.K. Mittal, Development of a kinetic model for the biosorption of cationic dyesby dead macrofungi, J. Environ. Eng. ASCE 136 (2010) 487–492.
[15] O. Ariga, H. Takagi, H. Nishizawa, Y. Sano, Immobilisation of microorganismswith PVA hardened by iterative freezing and thawing, J. Fermentation Technol.65 (1987) 651–658.
[16] N.S. Maurya, A.K. Mittal, Immobilisation of the dead fungal biomass for thetreatment of colored wastewater, Environ. Eng. Manag. J. 5 (2006) 189–202.
[17] A.K. Mittal, S.K. Gupta, Biosorption of Cationic dyes by dead macro fungusFomitomitopsis carnea: batch studies, Water Sci. Technol. 34 (1996) 81–87.
[18] N.S. Maurya, A.K. Mittal, Biosorptive color removal: applicability of isothermmodels, Pract. Period. Hazard. Toxic Radioact. Waste Manage. ASCE 14 (2010)25–36.
[19] G.M. Gadd, The uptake of heavy metals by fungi and yeasts: the chemistry andphysiology of the process and applications for biotechnology, in: H. Eccles, S.Hunt (Eds.), Immobilisation Ions Bio-Sorption, Horwood Publications,Chichester, UK, 1986, pp. 149–158.
[20] Q. Sun, L. Yang, The adsorption of basic dyes from aqueous solution onmodified peat-resin particle, Water Res. 37 (2003) 1535–1544.
Copyright © 2022 FDOKUMEN


![Impedance spectroscopic investigations of ITO modified by new Azo-calix[4]arene immobilised into electroconducting polymer (MEHPPV)](https://static.fdokumen.com/doc/165x107/634532ab596bdb97a908d170/impedance-spectroscopic-investigations-of-ito-modified-by-new-azo-calix4arene.jpg)