how Fe3O4 thin films evade polar catastrophe for epitaxy - arXiv
30
Dynamic atomic reconstruction: how Fe 3 O 4 thin films evade polar catastrophe for epitaxy Authors: C. F. Chang, 1 Z. Hu, 1 S. Klein, 2,† X. H. Liu, 1 R. Sutarto, 2,† A. Tanaka, 3 J. C. Cezar, 4,† N. B. Brookes, 4 H.-J. Lin, 5 H. H. Hsieh, 6 C. T. Chen, 5 A. D. Rata, 1,† and L. H. Tjeng 1 Affiliations: 1 Max Planck Institute for Chemical Physics of Solids, No ¨thnitzerstr. 40, 01187 Dresden, Germany 2 II. Physikalisches Institut, Universita ¨t zu Ko ¨ln, Zu ¨lpicher Str. 77, 50937 Ko ¨ln, Germany 3 Department of Quantum Matter, ADSM, Hiroshima University, Higashi-Hiroshima 739-8530, Japan 4 European Synchrotron Radiation Facility, 71 Avenue des Martyrs, Grenoble, France 5 National Synchrotron Radiation Research Center, 101 Hsin-Ann Road, Hsinchu 30077, Taiwan 6 Chung Cheng Institute of Technology, National Defense University, Taoyuan 335, Taiwan † Current address; S. Klein: Institute of Materials Physics in Space, German Aerospace Center, Linder Hohe, 51147 Ko ¨ln, Germany; R. Sutarto: Canadian Light Source, Saskatoon, Saskatchewan S7N 2V3, Canada; J. C. Cezar: Laborato ´rio Nacional de Luz S´ ıncrotron, C.P. 6192, 13083-970 Campinas, SP, Brazil; A. D. Rata: Institute for Physics, Martin-Luther-University, Halle-Wittenberg, 06099 Halle, Germany;
-
Upload
khangminh22 -
Category
Documents
-
view
2 -
download
0
Transcript of how Fe3O4 thin films evade polar catastrophe for epitaxy - arXiv

Dynamic atomic reconstruction:
how Fe3O4 thin films evade polar catastrophe for epitaxy
Authors:
C. F. Chang,1 Z. Hu,1 S. Klein,2,† X. H. Liu,1 R. Sutarto, 2,† A. Tanaka,3 J. C. Cezar,4,†
N. B. Brookes,4 H.-J. Lin,5 H. H. Hsieh,6 C. T. Chen,5 A. D. Rata,1,† and L. H. Tjeng1
Affiliations: 1Max Planck Institute for Chemical Physics of Solids, Nothnitzerstr. 40, 01187 Dresden,
Germany 2II. Physikalisches Institut, Universitat zu Koln, Zulpicher Str. 77, 50937 Koln, Germany 3Department of Quantum Matter, ADSM, Hiroshima University, Higashi-Hiroshima 739-8530,
Japan 4European Synchrotron Radiation Facility, 71 Avenue des Martyrs, Grenoble, France 5National Synchrotron Radiation Research Center, 101 Hsin-Ann Road, Hsinchu 30077, Taiwan 6Chung Cheng Institute of Technology, National Defense University, Taoyuan 335, Taiwan
† Current address;
S. Klein: Institute of Materials Physics in Space, German Aerospace Center, Linder Hohe,
51147 Koln, Germany;
R. Sutarto: Canadian Light Source, Saskatoon, Saskatchewan S7N 2V3, Canada;
J. C. Cezar: Laboratorio Nacional de Luz Sıncrotron, C.P. 6192, 13083-970 Campinas, SP, Brazil;
A. D. Rata: Institute for Physics, Martin-Luther-University, Halle-Wittenberg, 06099 Halle,
Germany;

Abstract:
Polar catastrophe at the interface of oxide materials with strongly correlated electrons has
triggered a flurry of new research activities. The expectations are that the design of such
advanced interfaces will become a powerful route to engineer devices with novel
functionalities. Here we investigate the initial stages of growth and the electronic structure of
the spintronic Fe3O4/MgO (001) interface. Using soft x-ray absorption spectroscopy we have
discovered that the so-called A-sites are completely missing in the first Fe3O4 monolayer. This
allows us to develop an unexpected but elegant growth principle in which during deposition the
Fe atoms are constantly on the move to solve the divergent electrostatic potential problem,
thereby ensuring epitaxy and stoichiometry at the same time. This growth principle
provides a new perspective for the design of interfaces.
Subject areas: Condensed Matter Physics, Magnetism, Strongly Correlated Materials, Materials
Science, Spintronics, Chemical Physics, Nanophysics
Main Text:
Physical properties of surfaces and interfaces of solids could markedly differ from those in
the bulk, especially in cases when the surface or interface involves non-neutral crystal planes. For
insulators, these polar planes cause the electrostatic potential to diverge, and thus to destabilize the
system dramatically. The surface or interface is then forced to reconstruct, for example, by forming
facets or defects. Or more spectacular, it could give up a substantial amount of charge, thereby
altering its electronic structure completely [1–3]. Recently, claims have been made that such
happens at the SrTiO3/LaAlO3 interface since the interface is conducting while the two
constituents separately are good insulators [4, 5]. In fact, the formation of a two-dimensional
electron gas and the occurrence of superconductivity in this interface has generated frantic efforts
worldwide to explore the potential of these interfaces for device applications [6–12] as well as to
search for new emergent phenomena such as quantum criticality in 2-dimensional electron gas
systems [13–15]. However, the growth process of these interfaces and polar interfaces in general
is a mystery. How do the atoms rearrange themselves during the deposition or growth such that a
well ordered and smooth interface is formed, despite the destabilizing forces due to the catastrophic
electrostatic potential? Understanding the growth principles will widen the scope of interfaces that
2

one may want to design: interfaces which appear impossible to grow at first sight may now be tried
out.
Here, we investigate the polar interface between Fe3O4 and the MgO (001) substrate, one of
the most used interfaces in the research field of spintronics. [16-24] This interface is completely
not understood in terms of atomic structure, electronic structure and growth mode. Figs. 1 (a), and
(b) illustrate how the Fe3O4 inverse spinel crystal structure consisting of Fe3+ ions in tetrahedral
coordination (A-sites), Fe2+ and Fe3+ ions (or on average Fe2.5+) in octahedral coordination (B-
sites) with O2- ions in an fcc-lattice builds up the polar catastrophe problem. We have prepared
the system using molecular beam epitaxy (MBE). This deposition method allows for a layer-by-
layer growth of the Fe3O4 under ultra high vacuum conditions which facilitates the use of in-
situ characterization techniques with surface monolayer sensitivity. The MBE growth of Fe3O4 on
MgO (001) is also known to produce films with excellent physical properties [22]. In order to
obtain direct insight into the atomic and electronic structure of the interface, we utilize soft x-ray
absorption spectroscopy (XAS) at the Fe L2,3 edges. This spectroscopic technique is extremely
sensitive to the local coordination and charge state of the Fe ions [25–28].
Fe3O4 thin films with thicknesses varying between 0.67 and 8 monolayers (ML) were grown
on MgO (001). Each film has been grown on a new and freshly annealed substrate. The substrate
temperature was kept at 250 °C during the growth in order to avoid the Mg inter-diffusion at the
Fe3O4/MgO interface [29,30]. Details about the film growth are given in the Supplementary
Materials [31]. One ML consists of one (001)-oriented layer of oxygen anions together with the
appropriate number of Fe cations to maintain charge neutrality and stoichiometry, and has a
thickness of 2.1 A . In Fig. 1 (c), and (d) we present representative reflection high energy electron
diffraction (RHEED) and low energy electron diffraction (LEED) patterns, respectively, of a 200
nm thick Fe3O4 film to demonstrate that the surface is still smooth for very long deposition times.
The typical �√2 × √2�R45° surface reconstruction is also clearly visible. Fig. 1 (e) shows the
regular oscillations with time in the intensity of the specularly reflected RHEED beam during
growth, indicating a two-dimensional layer-by-layer growth mode. Fig. 1 (f) displays the resistivity
as a function of temperature from a 10 nm and a 200 nm film, showing the presence of the
characteristic Verwey transition [22].
Figure 2 depicts the room temperature Fe L3 XAS spectra of Fe3O4 films with thicknesses
varying from 0.67 ML to 8 ML, and of a Fe3O4 bulk single crystal. A Fe2O3 single crystal was
3

measured simultaneously in a separate chamber to serve as energy reference for Fe L3 edge.
Further XAS experimental details and display of the entire Fe L2,3 spectral range are given in the
Supplementary Materials [31, Fig. S1]. We also include in Fig. 2 the spectra of bulk YBaCo3FeO7 [28], bulk FeO (reproduced from Ref. 32) and bulk Fe2O3 as references for Fe3+ ions in tetrahedral
coordination, Fe2+ ions in octahedral coordination, and Fe3+ ions in octahedral coordination,
respectively. The line shapes of the spectra strongly depend on the multiplet structure given by
the atomic like Fe 3d–3d and 2p–3d Coulomb and exchange interactions, as well as by local crystal
fields and the hybridization with the O 2p ligands [25–28]. Here we note the striking similarities of
the spectral features of the 8 ML Fe3O4 thin film and the bulk magnetite, which confirms that our
Fe3O4 films have the correct stoichiometry.
We now focus on the thickness dependence of the spectra. Clear and systematic changes can be
observed, in particular in the peak position of the spectral feature labeled as (I) and in the intensity
of the spectral feature labeled as (II) relative to that of peak (I), see Fig. 2. The position of peak
(I) of the thinnest Fe3O4 films, i.e. of the 0.67, 0.75 and 1 ML films, is the same as that of bulk
Fe2O3, while for the thicker films, i.e. 2 ML and beyond, it is more similar to that of bulk
YBaCo3FeO7. This gives a first indication that the thinnest films contain only tiny amounts of
Fe3+ ions in tetrahedral coordination and implies that such A-site Fe ions could essentially only
be present for films of 2 ML thickness and beyond. This then would also explain why for the
thinnest films one can see two separate peaks (I) and (II) like in bulk Fe2O3 (green curve), while
for thicker films the appearance of an in-between peak associated with the Fe3+ ions in tetrahedral
coordination (red curve) will fill up the valley between peak (I) and (II), making peak (II) to
become a shoulder and the position of the larger peak (I) to shift to lower energies. Important is
to note that the foot at the onset of the Fe L3 edge, i.e. the feature between 706 and 707.7 eV,
which is part of the spectral feature characteristic for Fe2+ ions in octahedral B sites (see blue
curve), are thickness independent. All these strongly suggest that the spectral weight of the A-site
and the B-site Fe3+ ions varies strongly with thickness.
To interpret and better understand the XAS spectra and their thickness dependence we have
performed calculations using the well established configuration interaction cluster model that
includes the full atomic multiplet theory and the local effects of the solid [25–28]. We have
simulated each of the XAS spectra shown in Fig. 2 and obtained the spectral weight of the
different Fe sites; computational details and fits are given in the Supplementary Materials [31,
4

Figs. S2, S3, and S4, 33]. The results are plotted as closed squares in the top panel of Fig. 3,
where the error bars reflect the deviations of the fits to the experimental data. From the relative
concentrations of the constituents we have calculated the average valence or equivalently, by
taking the oxygen lattice to be complete, we have determined the Fe content y in our FeyO films.
These y values are plotted as black closed squares in the bottom panel of Fig. 3. We can observe
that all points are very close to the Fe3/4O (gray) line, which confirms the correct stoichiometry of
our films through the entire thickness range and very consistent with the RHEED intensity
oscillations which have a constant time period, i.e. independent of the film thickness.
An important aspect that emerges directly from the simulations is the strong thickness
dependence of the different Fe constituents, see Fig. 3. We recall that bulk Fe3O4 has 1/3 (33%)
Fe3+ ions in tetrahedral coordination (A-sites), 1/3 (33%) Fe2+ and 1/3 (33%) Fe3+ ions in
octahedral coordination (B-sites). We found to our surprise that the amount of A-site Fe3+ ions
is practically negligible for the thinnest films, i.e. 2-3% instead of the 33% bulk value. At the same
time, the amount of B-site Fe3+ in the thinnest films is between 60-68%, much larger than the
33% bulk value. We also observe that with increasing film thickness the A-site Fe3+ amount
increases and the B-site Fe3+ decreases, both to approach the 33% bulk value, see for example the
8 ML results in Fig. 3. Interestingly, the amount of B-site Fe2+ is rather constant and independent
of the film thickness, it fluctuates around the 33% bulk value.
These spectroscopic findings provide crucial data for the determination of the actual growth
process and the interface structure. Especially the observation that the first monolayer of the
Fe3O4 film has essentially no A-sites is a surprising piece of information. In fact, as far as the
monolayer is concerned, the choice of ’nature’ not to have A-sites is the simplest manner to solve
the planar electrostatic potential problem. As can be seen from Figs. 1 (a) and (b), it is indeed the
presence of the A-sites that causes the polar catastrophe to occur as there are no negative ions in
those A-site planes to neutralize the charges. So by not having A sites for the first monolayer, there
is also no electrostatic problem. What we then have is that the first monolayer constitutes basically
of a charge-neutral non-polar rocksalt FeO layer with 25% Fe vacancies. All Fe ions are occupying
the B-site with 33% of them having the 2+ valence and 67% the 3+ state and the vacancies are not
ordered since we did not observe any superstructure. We have also carried out polarization
dependent XAS measurements, and we are able to indeed verify in detail that also the dichroic
spectrum is consistent with the 33% Fe2+ and 67% Fe3+ B-site occupation. See Supplemental
5

Materials [31, Figs. S5]. Please note that these XAS spectra and the dichroism therein are very
different from those of Fe atoms on MgO [34]. Moreover, capping this monolayer with a thick
layer of MgO induces spectral weight changes that are fully consistent with the presence of 25%
Fe vacancies. See Supplemental Materials [31, Fig. S6, 33].
For the second monolayer, we observe in the experiment the appearance of some amount of
A-sites, about 16.7%, see top panel of Fig. 3. We now can arrive at the following model, see Fig.
4 where the left panel shows the growth process and the right panels the corresponding net charges,
electric field, and electric potential of each plane. Since in bulk magnetite, a monolayer per unit cell
includes 2 A-site Fe3+, 2 B-site Fe2+, 2 B-site Fe3+, and 8 oxygen ions, we will use the formula
notation Fe6O8 instead of Fe3/4O to describe each monolayer. When deposited, the second
monolayer will first form a non-polar monolayer, like the first monolayer. Then, both the first
and the second layers give away one Fe3+ ion as shown in Fig. 4 (b) to the space in between them
to form a layer with two A-site Fe3+ ions. The entire film remains then also non-polar: a 6+
charge-layer is sandwiched by two 3- charge-layers. The electric field oscillates symmetrically
around zero, and the electric potential remains nullified. In this model, there are two A-sites per 2
ML formula unit, i.e. the A-site concentration is 2/(2×6) = 16%, which is very close to the
experiment. The remaining outer Fe5O8 (defective rocksalt) layers contain each three Fe3+ and
two Fe2+ B-site ions. The concentration of the Fe2+ B-site ions is thus (2×2)/(2×6) = 33%, i.e.
the same as for the first monolayer and consistent with the experiment, see top panel of Fig. 3.
For a 3-ML film, the layer added will again form a non-polar monolayer first. This monolayer
and the subsurface monolayer then carry out the same process in which both give away one Fe3+
ion to the space in between. See Fig. 4 (c). Again, the potential divergence remains nullified after
this process as shown on the most right panel of Fig. 4 (c). One complete bulk Fe6O8 layer now
is formed. This growth process is repeated for the subsequent layers, and the model predicts that
the concentration of the A-site ions will increase following the geometrical series 2(n-1)/6n, while
the concentration of the Fe2+ B-site ions will remain constant at 2n/6n = 33% and that of the Fe3+
B-site ions will decrease following 2(n+1)/6n, where n denotes the number of monolayers. These
predictions of the model are also presented in Fig. 3. We can see that the essential behavior observed
in the experiment is well reproduced with convergence to the bulk values for thicker films. We
also would like to note that an ordering in the outer Fe5O8 layer can be made consistent with the
often observed �√2 × √2�R45° surface reconstruction in thicker (001) Fe3O4 films, please see the
6

Supplementary Materials for details [31].
We thus have found that the A-sites are absent in the first monolayer or interface, and that
Fe ions are on the move while the films is growing to accommodate for the presence of A-sites
inside the film having the proper crystal structure and stoichiometry. We clearly have a ’dynamic
atomic reconstruction’ taking place here.
It is interesting to note that the Fe3O4 thin films are insulating and that the interface does
not induce metallicity as shown by the resistivity measurements displayed in Fig. 1 (f). This is
obviously in contrast with the resistivity measurements on SrTiO3/LaAlO3 [5,35–37] and
SrTiO3/RETiO3 [13–15]. In principle, the Fe5O8 interface layer could have been conducting since
this layer can be considered as a defective and doped rocksalt FeO layer. Yet, considering the fact
that small polaron effects in bulk Fe3O4 are strong and hamper the conductivity [38–40], we may
expect that this will also be the case for the interface layer. Its resistivity will then be dominated
by strong scattering effects due to disorder.
Our findings have direct and important implications for the field of Fe3O4 spintronics. There
are some reports concerning the possible existence of a magnetically dead layer at the interface
[41–43], but others ascribe the decrease of the magnetization in the thin films to the presence of
antiphase boundaries leading to superparamagnetic behavior of the domains [44–46]. Our
findings may give credit to the proponents of the dead magnetic layer model. In view of the
absence or low amount of A-sites in the interface region, some of the superexchange paths which
determine the ferrimagnetism in Fe3O4 are certainly missing. This then would also explain why
tunneling experiments have spin-polarizations different than expected from the properties of bulk
Fe3O4 [47]. We now can propose that the insertion of a monolayer of magnetic metals like Fe, Co,
Ni, or even noble metals like Cu, Ag, Au or Pt between the Fe3O4 and the insulating oxide
substrate will drastically change the situation: the metal layer inserted will act as a charge reservoir
that can accommodate the flow of planar charges required to stabilize a Fe3O4 interface layer which
has A-sites like in the bulk. The occurrence of a magnetically dead layer can then be prevented and
also the spin polarization at the interface may be increased. A hint that the latter is not unrealistic
can be found in an early work by Dedkov et al. [48] on oxidized Fe films deposited on metal
substrates.
To summarize, using soft x-ray absorption spectroscopy we find that nature provides us with
an unexpected but elegant solution for the polar catastrophe problem at the Fe3O4/MgO (001)
7

interface: the A-site Fe3+ ions are missing in the first Fe3O4 layer and the growth process involves
movements of not only the surface but also the subsurface Fe ions, securing epitaxy and
stoichiometry at the same time. Having identified this ‘dynamic atomic reconstruction’ growth
principle, we conclude that we really have to think differently and openly about how polar
interfaces can grow. Apparently, ‘nature’ offers us a much wider range of opportunities to prepare
unstable polar interfaces. It would be interesting to put effort to grow a monolayer or a few
monolayer of Fe3O4 film where the defects are ordered, so that diffraction techniques can confirm
the growth model.
Acknowledgments:
The research in Koln was supported by the Deutsche Forschungsgemeinschaft through SFB 608.
The research of X. H. L. was supported by the Max Planck-POSTECH Center for Complex Phase
Materials.
References:
1. A. Zangwill, Physics at surfaces (Cambridge University Press) (1988).
2. C. Noguera, Physics and chemistry at oxide surfaces (Cambridge University Press) (1996).
3. R. Hesper, L. H. Tjeng, A. Heres, and G. A. Sawatzky, Photoemission evidence of electronic
stabilization of polar surfaces in K3C60, Phys. Rev. B 62, 16046 (2000).
4. Satoshi Okamoto and Andrew J. Millis, Electronic reconstruction at an interface between a Mott
insulator and a band insulator, Nature 428, 630 (2004).
5. A. Ohtomo and H.Y. Hwang, A high-mobility electron gas at the LaAlO3/SrTiO3 heterointerface,
Nature 427, 423 (2004).
6. M. Huijben, A. Brinkman, G. Koster, G. Rijnders, H. Hilgenkamp, and D. H. A. Blank,
Structure-Property Relation of SrTiO3/LaAlO3 Interfaces, Adv. Mat. 21, 1665 (2009).
7. J. Mannhart and D.G. Schlom, Oxide Interfaces–An Opportunity for Electronics, Science 327,
1607 (2010).
8. S.A. Chambers, M.H. Engelhard, V. Shutthanandan, Z. Zhu, T.C. Droubay, L. Qiao, P.V. Sushko, 8

T. Feng, H.D. Lee, T. Gustafsson, E. Garfunkel, A.B. Shah, J.-M. Zuo, and Q.M. Ramasse,
Instability, intermixing and electronic structure at the epitaxial LaAlO3/SrTiO3(001)
heterojunction, Surf. Sci. Rep. 65, 317 (2010).
9. S.A. Chambers, Understanding the mechanism of conductivity at the LaAlO3/SrTiO3(001)
interface, Surf. Sci. 605, 1133 (2011).
10. H. Y. Hwang, Y. Iwasa, M. Kawasaki, B. Keimer, N. Nagaosa, and Y. Tokura, Emergent
phenomena at oxide interfaces, Nat. Mat. 11, 103 (2012).
11. M. Salluzzo, S. Gariglio, X. Torrelles, Z. Ristic, R. Di Capua, J. Drnec, M. Moretti Sala, G.
Ghiringhelli, R. Felici, and N. B. Brookes, Structural and Electronic Reconstructions at the
LaAlO3/SrTiO3 Interface, Adv. Mater. 25, 2333 (2013).
12. A. Janotti, L. Bjaalie, L. Gordon, and C. G. Van de Walle, Controlling the density of the two-
dimensional electron gas at the SrTiO3/LaAlO3 interface, Phys. Rev. B 86, 241108 (2012).
13. Pouya Moetakef, Daniel G. Ouellette, James R. Williams, S. James Allen, Leon Balents,
David Goldhaber-Gordon, and Susanne Stemmer, Quantum oscillations from a two-dimensional
electron gas at a Mott/band insulator interface, Appl. Phys. Lett. 101, 151604 (2012).
14. Clayton A. Jackson, Jack Y. Zhang, Christopher R. Freeze, and Susanne Stemmer, Quantum
critical behaviour in confined SrTiO3 quantum wells embedded in antiferromagnetic SmTiO3,
Nat. Commun. 5:4258 doi: 10.1038/ncomms5258 (2014).
15. Santosh Raghavan, Jack Y. Zhang, and Susanne Stemmer, Two-dimensional electron liquid at the
(111) SmTiO3/SrTiO3 interface, Appl. Phys. Lett. 106, 132104 (2015).
16. R. A. de Groot, F. M. Mueller, P. G. van Engen, and K. H. J. Buschow, New Class of Materials:
Half-Metallic Ferromagnets, Phys. Rev. Lett. 50, 2024 (1983).
17. A. Yanase, and K. Siratori, Band Structure in the High Temperature Phase of Fe3O4, J. Phys.
Soc. Japan 53, 312 (1984).
18. S.A. Chambers, Epitaxial growth and properties of thin film oxides, Surf. Sci. Reports 39, 105
(2000).
19. M Ziese, Extrinsic magnetotransport phenomena in ferromagnetic oxides, Rep. Prog. Phys. 65 143
(2002).
9

20. R. Pentcheva, F. Wendler, H. L. Meyerheim, W. Moritz, N. Jedrecy, and M. Scheffler, Jahn-
Teller Stabilization of a Polar Metal Oxide Surface: Fe3O4(001), Phys. Rev. Lett. 94, 126101
(2005).
21. Jean-Baptiste Moussy, From epitaxial growth of ferrite thin films to spin-polarized tunneling, J.
Phys. D: Appl. Phys. 46 143001 (2013).
22. X. H. Liu, A. D. Rata, C. F. Chang, A. C. Komarek, and L. H. Tjeng, Verwey transition in Fe3O4 thin films: Influence of oxygen stoichiometry and substrate-induced microstructure, Phys. Rev. B
90, 125142 (2014).
23. R. Bliem, E. McDermott, P. Ferstl, M. Setvin, O. Gamba, J. Pavelec, M. A. Schneider, M. Schmid,
U. Diebold, P. Blaha, L. Hammer, and G. S. Parkinson, Subsurface cation vacancy stabilization of
the magnetite(001) surface, Science 346, 1215 (2014).
24. Scott A. Chambers, Stability at the surface, Science 346 1186 (2014).
25. F. M. F. de Groot, J. Electron Spectrosc. Relate. Phenom. 67, 529 (1994).
26. A. Tanaka and T. Jo, Phys. Soc. Jpn. 63, 2788 (1994).
27. T. Burnus, Z. Hu, Hua Wu, J. C. Cezar, S. Niitaka, H. Takagi, C. F. Chang, N. B. Brookes, H.-J.
Lin, L. Y. Jang, A. Tanaka, K. S. Liang, C. T. Chen, and L. H. Tjeng, X-ray absorption and x-ray
magnetic dichroism study on Ca3CoRhO6 and Ca3FeRhO6, Phys. Rev. B 770 205111 (2008).
28. N. Hollmann, Z. Hu, M. Valldor, A. Maignan, A. Tanaka, H. H. Hsieh, H.-J. Lin, C. T. Chen,
and L. H. Tjeng, Electronic and magnetic properties of the kagome systems YBaCo4O7 and
YBaCo3MO7 (M=Al, Fe), Phys. Rev. B 80, 085111 (2009).
29. Y. J. Kim, Y. Gao, and S. A. Chambers, Selective growth and characterization of pure, epitaxial
α-Fe2O3 (0001) and Fe3O4 (001) films by plasma-assisted molecular beam epitaxy, Surface
Science 371, 358 (1997).
30. J. F. Anderson, Markus Kuhn, Ulrike Diebold, K. Shaw, P. Stoyanov, and D. Lind, Surface
structure and morphology of Mg-segregated epitaxial Fe3O4 (001) thin films on MgO (001), Phys.
Rev. B. 56, 9902 (1997).
31. See Supplemental Materials at [URL] for details of the thin film growth, the XAS experimental
details and the entire Fe L2,3 spectral range, the XAS spectra computational details, and the
10

�√2 × √2�R45° surface reconstruction which is consistent with the Fe5O8 surface as proposed
from our model.
32. J. H. Park, Ph.D. thesis, University of Michigan (1994).
33. T. Haupricht, R. Sutarto, M. W. Haverkort, H. Ott, A. Tanaka, H. H. Hsieh, H.-J. Lin, C. T. Chen,
Z. Hu, and L. H. Tjeng, Local electronic structure of Fe2+ impurities in MgO thin films:
Temperature-dependent soft x-ray absorption spectroscopy study, Phys. Rev. B 82, 035120
(2010).
34. S. Baumann, F. Donati, S. Stepanow, S. Rusponi, W. Paul, S. Gangopadhyay, I. G. Rau, G. E.
Pacchioni, L. Gragnaniello, M. Pivetta, J. Dreiser, C. Piamonteze, C. P. Lutz, R. M. Macfarlane,
B. A. Jones, P. Gambardella, A. J. Heinrich, and H. Brune, Origin of Perpendicular Magnetic
Anisotropy and Large Orbital Moment in Fe Atoms on MgO, Phys. Rev. Lett. 115, 237202 (2015).
35. M. Huijben, G. Rijnders, D. H. A. Blank, S. Bals, S. V. Aert, J. Verbeeck, G. V. Tendeloo, A.
Brinkman and H. Hilgenkamp, Electronically coupled complementary interfaces between
perovskite band insulators, Nat. Mat. 5, 556 (2006).
36. S. Thiel, G. Hammerl, A. Schmehl, C. W. Schneider, and J. Mannhart, Tunable Quasi-Two-
Dimensional Electron Gases in Oxide Heterostructures, Science 313, 1942 (2006).
37. M.P. Warusawithana, C. Richter, J.A. Mundy, P. Roy, J. Ludwig, S. Paetel, T. Heeg, A.A. Pawlicki,
L.F. Kourkoutis, M. Zheng, M. Lee, B. Mulcahy, W. Zander, Y. Zhu, J. Schubert, J.N. Eckstein,
D.A. Muller, C. Stephen Hellberg, J. Mannhart, and D.G. Schlom, LaAlO3 stoichiometry is key to
electron liquid formation at LaAlO3/SrTiO3 interfaces, Nat. Commun. 4:2351 doi:
10.1038/ncomms3351 (2013).
38. J.-H. Park, L. H. Tjeng, J. W. Allen, P. Metcald, and C. T. Chen, Single-particle gap above the
Verwey transition in Fe3O4, Phys. Rev. B 55, 12813 (1997).
39. D. Schrupp, M. Sing, M. Tsunekawa, H. Fujiwara, S. Kasai, A. Sekiyama, S. Suga, T. Muro,
V. A. M. Brabers, and R. Claessen, High-energy photoemission on Fe3O4: Small polaron physics
and the Verwey transition, Europhys. Lett. 70, 789 (2005).
40. M. Kimura, H. Fujiwara, A. Sekiyama, J. Yamaguchi, K. Kishimoto, H. Sugiyama, G.
Funabashi, S. Imada, S. Iguchi, Y. Tokura, A. Higashiya, M. Yabashi, K. Tamasaku, T. Ishikawa,
11

T. Ito, S. Kimura, and S. Suga, Polaronic Behavior of Photoelectron Spectra of Fe3O4 Revealed
by Both Hard X-ray and Extremely Low Energy Photons, J. Phys. Soc. Jpn. 79, 064710 (2010).
41. P.A.A. van der Heijden, P.J.H. Bloemen, J.M. Gaines, J.T.W.M. van Eemeren, R.M. Wolf, p.j. van
der Zaag, and W.J.M. de Jonge, Magnetic interface anisotropy of MBE-grown ultra-thin (001)
Fe3O4 layers, J. Magn. Magn. Mater. 159, L293 (1996).
42. Y. Zhou, Ciaran McEvoy, R. Ramos, and I. V. Shvets, The magnetic and magnetoresistance
properties of ultrathin magnetite films grown on MgO substrate, J. Appl. Phys. 99, 608J111 (2006).
43. G. F. M. Gomes, T. E. P. Bueno, D. E. Parreiras, G. J. P. Abreu, A. de Siervo, J. C. Cezar, H.-D.
Pfannes, and R. Paniago, Magnetic moment of Fe3O4 films with thicknesses near the unit cell size,
Phys. Rev. B 90, 134422 (2014).
44. M.A. James, F.C. Voogt, L. Niesen, O.C. Rogojanu, and T. Hibma, The role of interfacial structure
in determining magnetic behaviour in MBE-grown Fe3O4/MgO multilayers on MgO(001), Surf.
Sci. 402-404, 332 (1998).
45. F. C. Voogt, T. T. M. Palstra, L. Niesen, O. C. Rogojanu, M. A. James, and T. Hibma,
Superparamagnetic behavior of structural domains in epitaxial ultrathin magnetite films, Phys.
Rev. B 57, R8107 (1998).
46. S. K. Arora, Han-Chun Wu, R. J. Choudhary, I. V. Shvets, O. N. Mryasov, Hongzhi Yao, and W.
Y. Ching, Giant magnetic moment in epitaxial Fe3O4 thin films on MgO(100), Phys. Rev. B 77,
134443 (2008).
47. S. S. P. Parkin, T. Venkatesan, private communication.
48. Yu. S. Dedkov, U. Rudiger, and G. Guntherodt, Evidence for the half-metallic ferromagnetic state
of Fe3O4 by spin-resolved photoelectron spectroscopy, Phys. Rev. B 65, 064417 (2002).
12

Figures:
Fig. 1. Fe3O4 on MgO (001). (a) structure of Fe3O4. (b) build-up of the polar catastrophe of
Fe3O4 on MgO (001): charged planes, and corresponding charge, electric field, and electric
potential. (c) and (d) RHEED and LEED patterns, respectively, of a 200 nm epitaxial Fe3O4 (001)
film showing the characteristic �√2 × √2�R45° superstructure. (e) RHEED intensity oscillations
of the specularly reflected beam. The electron beam was incident along the [100] direction, with
a primary energy of 20 kV. (f) resistivity as a function of temperature of a 10 nm and a 200 nm
thin film, showing the presence of the Verwey transition.
13

Fig. 2. Fe L3 XAS spectra of Fe3O4 films. The film thickness varies from 0.67 to 8 ML. The
reference spectra of bulk Fe3O4, bulk YBaCo3FeO7 (Fe3+ in tetrahedral coordination) [28], bulk
FeO (Fe2+ in octahedral coordination) [32] and bulk Fe2O3 (Fe3+ in octahedral coordination) are
also included. All spectra were measured at 300 K. The gray line indicates the energy position of
the main peak in the spectrum of bulk Fe2O3. The full Fe L2,3 spectral range is presented in the
Supplementary Materials.
14

Fig. 3. The extracted spectral weight of each Fe site versus the film thickness. The spectral
weight of the B-site Fe3+, the B-site Fe2+, and the A-site Fe3+ are given by the green, blue, and red
closed squares, respectively. Green, blue, and red curves depict the concentrations of the B-site
Fe3+, the B-site Fe2+, and the A-site Fe3+, respectively, in our model, see the text. The Fe content
(y) of the FeyO films derived from the average valence are shown in the bottom panel. The error bars
reflect the deviations of the fits to the experimental data.
15

Fig. 4. Model for the growth process of polar Fe3O4 (001) thin films. (a) 1 monolayer, (b) 2
monolayers, and (c) 3 monolayers.
16

Supplementary materials:
Dynamic atomic reconstruction:
how Fe3O4 thin films evade polar catastrophe for epitaxy
C. F. Chang,1 Z. Hu,1 S. Klein,2,† X. H. Liu,1 R. Sutarto, 2,† A. Tanaka,3 J. C. Cezar,4,† N. B. Brookes,4 H.-J. Lin,5 H. H. Hsieh,6 C. T. Chen,5 A. D. Rata,1,† and L. H. Tjeng1
Thin film growth and XAS measurement. Fe3O4 thin films were epitaxially grown by
molecular beam epitaxy (MBE). The base pressure of the MBE system was in the low 10-10 mbar
range. High purity Fe metal was evaporated from an alumina crucible in a pure oxygen
atmosphere of 3×10⁻⁷ mbar onto clean and annealed MgO (001) substrates. The substrate
temperature was kept at 250 °C during growth. In-situ and real-time monitoring of the epitaxial
growth was performed by reflection high energy electron diffraction (RHEED). Oscillations in the
RHEED specular beam intensity, where each oscillation corresponds to the formation of one
new atomic monolayer (ML), allows for precise control of the film thickness. The RHEED
oscillation measurements were done using cleaved MgO substrates, all other thin film results in
this paper were obtained from epi-polished MgO substrates. The XAS measurements were
performed at the 11 A Dragon beamline of the National Synchrotron Radiation Research Center
(NSRRC) in Taiwan using in-situ MBE grown samples. The spectra were recorded at 300 K using
the total electron yield method (TEY) in a chamber with a base pressure of 2×10⁻¹⁰ mbar. The
photon energy resolution at the Fe L2,3 edges (hν ~ 700–740 eV) was set at 0.3 eV and the degree
of linear polarization was 99%. The samples were mounted on a holder which was tilted with
respect to the incoming beam, such that the Poynting vector of the light makes an angle of 70°
with respect to the [001] surface normal. The angle (θ) between the electric field vector E and the
[001] surface normal can be varied between 20° and 90°. Iip and I⊥ are the spectra measured at θ
= 20° and 90°, respectively. The isotropic XAS spectra can be obtained via the formula of I = I|| +
2I⊥, where I|| is the spectrum with the E parallel to the [001] surface normal extracted from I|| =
[Iip − I⊥cos2(70°)]/sin2(70°). Magnetic circular dichroism (MCD) spectra of bulk magnetite
crystals were measured at the ID8 beamline of the European Synchrotron Radiation Facility
(ESRF) in Grenoble. The magnetic field was set at 5 Tesla. Fig. S1 shows the full Fe L2,3 XAS
spectra of the Fe3O4 films together with the spectra of bulk Fe3O4, bulk YBaCo3FeO7 (Fe3+ in 17

tetrahedral coordination) [1], bulk FeO (Fe2+ in octahedral coordination) [2] and bulk Fe2O3 (Fe3+
in octahedral coordination): the spectra are identical to those in Figure 2 in the main text, but with
a wider photon energy window covering both Fe L3 and L2 edges.
Configuration interaction cluster calculation. To interpret and better understand the x-ray
absorption (XAS) spectra and their thickness dependence we have performed simulations using the
well established configuration interaction cluster model that includes the full atomic multiplet
theory and the local effects of the solid [3-5]. It accounts for the intra-atomic Fe 3d–3d and 2p–3d
Coulomb and exchange interactions, the atomic 2p and 3d spin-orbit couplings, the O 2p–Fe 3d
hybridization and the local ionic crystal field. The calculations were done using the program
XTLS 8.3 [5]. The XAS spectra of Fe3O4 can be decomposed into the three sub-spectra of the
three Fe sites, i.e. A-site Fe3+, B-site Fe2+, and B-site Fe3+. We have considered an FeO4 and an
FeO6 cluster for each Fe A-site and B-site, respectively. Parameters for the multipole part of the
Coulomb interactions were given by 75% and 80% of the Hartree-Fock values for the d−d and
p−d Slater integrals, respectively, while the monopole parts (Udd, Ucd) as well as the O 2p–Fe 3d
charge transfer energy (∆) were adopted from typical values for Fe2+ and Fe3+ ions [6,7]. The
hopping integrals between the Fe 3d and O 2p were calculated for the various Fe–O bond lengths
according to Harrison’s description [8]. The Fe–O bond lengths were taken from x-ray single-
crystal structure diffraction data [9]. The crystal field parameter 10Dq was tuned to fit the
experimental spectra. All parameters are listed in Ref. 10.
Figure S2 shows the experimental Fe L2,3 XAS (open circle) and magnetic circular dichroism (MCD,
open diamond) spectrum of bulk Fe3O4 together with the simulation results (magenta and purple
lines, respectively). The three components, the sum of circular polarization spectra of each site,
i.e. B-site Fe2+ (blue line), A-site Fe3+ (red line), and B-site Fe3+ (green line) are also depicted.
The relative energy positions for the three sub-spectra were determined in such a way that the
simulated total MCD spectrum fits by the experimental MCD spectrum best, see Refs. 6, 11, and
12. The fits were done using the “NMimimize” function of the Mathematica software [13].
By making weighted sums with the three isotropic sub-spectra using the “NMimimize” function
18

of the Mathematica software [13] to obtain the best fit to the experimental spectrum of each Fe
film with the different thicknesses, we extract the relative amount of B-site Fe2+, A-site Fe3+, and
B-site Fe3+ ions as a function of film thickness. The XAS simulation results of the Fe3O4 thin films
of 0.67, 0.75, 1, 1.5, 2, 3, 4, 5, 6, and 8 MLs are shown in Fig. S3.
To double check the validity of the three isotropic sub-spectra, we compare them in Figure S4 with
the experimental XAS spectra of the standard references for each Fe site, i.e., bulk YBaCo3FeO7
[1] for the A-site Fe3+, bulk FeO [2] for the B-site Fe2+, and bulk Fe2O3 for the B-site Fe3+ (same
as those shown in Figure 2 in the main text, and in Figure S1 in the supplementary materials). Each
of them reproduces the experimental spectrum of its corresponding reference very well. We
include also in Figure S4 the XAS spectrum from Fe0.04Mg0.96O [14], a system of Fe impurities
embedded in MgO. The identical spectral features of the bulk FeO and of the Fe impurity system
clearly demonstrate that XAS is most sensitive to the presence of the nearest neighbor ligands
only. We have also done calculations for an Fe2+ in FeO5 and an Fe3+ in FeO5 by simply removing
the apical oxygen of the FeO6, but otherwise using the same parameters as those for FeO6, as
shown in Figure S4. Only minor differences can be observed between the isotropic XAS spectra
of an Fe2+ in FeO6 and in FeO5, and of an Fe3+ in FeO6 and FeO5. The large difference between
the isotropic XAS spectra of octahedral Fe3+ and tetrahedral Fe3+ originates from the fact that the
effective 10Dq ligand/crystal field value is positive for the octahedral coordination while it is
negative for the tetrahedral coordination.
1 ML Fe3O4 thin film: polarization dependence. Figure S5 shows the experimental linear
polarization-dependent Fe L2,3 XAS spectra of the 1 ML Fe3O4. In the bottom panel, the
experimental linear dichroic (LD) signal, defined as the difference between two polarizations (E ||
C – E ⊥ C) is displayed, together with the calculated LD spectrum for the scenario of 33 % B-site
Fe2+ and 67 % B-site Fe3+. The LD signal can be well reproduced without including any
contribution from the A-site Fe3+ ion. All this can be very well understood: the isotropic spectrum
is determined mostly by the octahedral part of the ligand/crystal field, while the dichroism is due
to the small tetragonal part of the crystal field in the monolayer. This tetragonal part of the crystal
field makes the orbital occupation of the high-spin d6 ion to become anisotropic, resulting in the
polarization dependence of the intensity of the Fe2+ signal. The tetragonal part of the crystal field
19

does not affect the orbital occupation of the spherical high-spin d5 ion but sets up the energy
splitting in the XAS final states, resulting in the polarization dependence of the Fe3+ peak position.
Please note that these XAS spectra and the dichroism therein are very different from those of Fe
atoms on MgO [15], confirming the notion that L2,3-XAS is indeed an extremely powerful method
to determine the local electronic structure of transition metal systems.
1 ML Fe3O4 thin film capped with 10 ML MgO. Fig. S6 shows the Fe L2,3-XAS spectra of the
1 ML Fe3O4 film, the 1 ML Fe3O4 film capped with 10 ML MgO, and the Fe0.04Mg0.96O system
[14]. One can clearly observe that the spectrum of the 1 ML Fe3O4 changes drastically upon
capping with MgO and that the spectrum becomes identical to that of octahedral Fe2+ in
Fe0.04Mg0.96O. This means that the presence of Mg converts all available Fe3+ into Fe2+,
indicating that the 1 ML Fe2+Fe3+Fe3+O4 film is reacted to 1 ML Mg2+Fe2+Fe2+Fe2+O4. This in
turn establishes that the 1 ML Fe3O4 film is indeed an Fe0.75O monolayer, i.e. an FeO monolayer
with 25% Fe vacancies
(√𝟐𝟐 × √𝟐𝟐)R𝟒𝟒𝟒𝟒° surface reconstruction. The Fe5O8 surface as proposed from our model is
consistent with the �√2 × √2�R45° superstructure of the surface as shown in Fig. S7. Starting
with the nonpolar Fe6O8 monolayer, all Fe ions are in an octahedral coordination. It consists of a
bulk Fe4O8 layer and two extra octahedral Fe cations. Every other extra octahedral Fe cation is
then removed to help to form the A-site layer below. The remaining extra octahedral Fe ions in
the Fe5O8 surface layer can then be arranged as to give the �√2 × √2�R45° superstructure. In Fig.
S7 we also have included the directions (arrows) of the atomic relaxations forming a wavelike
surface patterns along the [110].
20
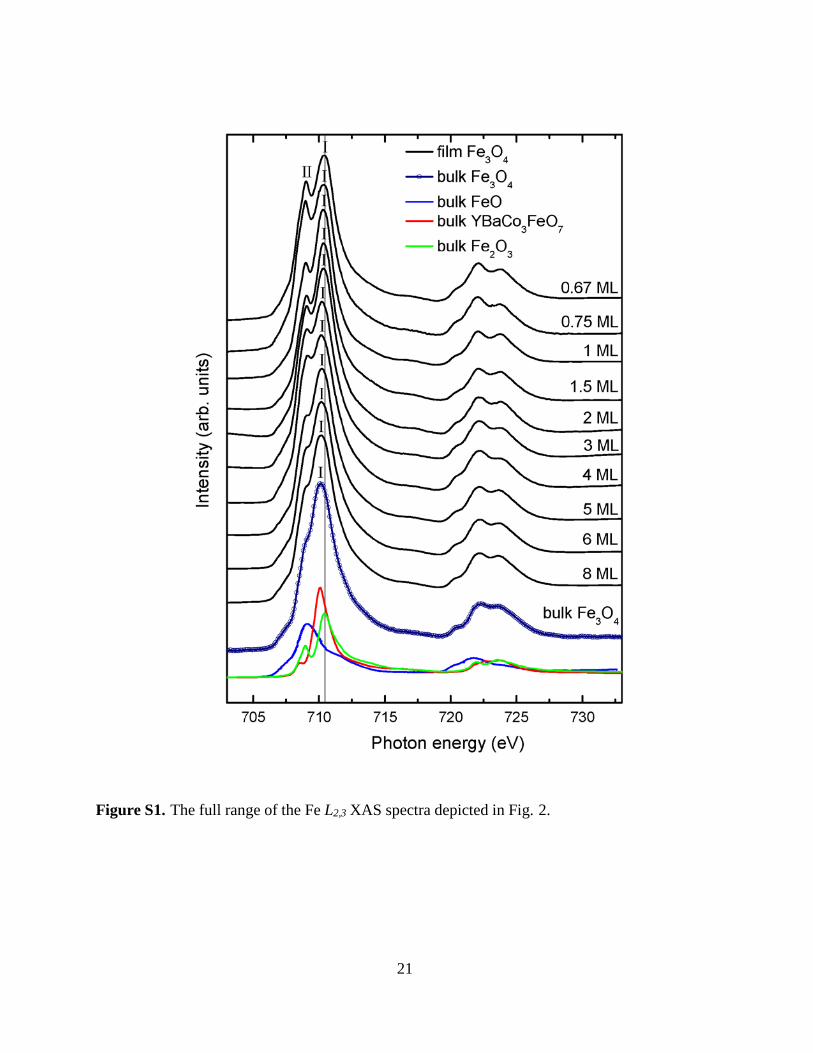
Figure S1. The full range of the Fe L2,3 XAS spectra depicted in Fig. 2.
21

Figure S2. Fe L2,3 XAS and MCD spectra of bulk Fe3O4. The XAS (open circle) and MCD spectra
(open diamond) were taken at 300 K. Magenta and purple curves are the simulated XAS and MCD
spectra, respectively. The gray line is an arctangent like XAS background. Simulations for the three
components are displayed in the bottom panel: B-site Fe2+ (blue line), A-site Fe3+ (red line), and
B-site Fe3+ (green line).
22

23

Figure S3. The XAS simulation results of the Fe3O4 thin films of 0.67, 0.75, 1, 1.5, 2, 3, 4, 5, 6,
and 8 MLs. The experimental XAS (open circle) spectra are those in Fig. S1. The magenta curve is
the simulated XAS spectrum. The gray line is an arctangent like XAS background. Simulations for
the three components are displayed in the bottom panel: B-site Fe2+ (blue line), A-site Fe3+ (red
line), and B-site Fe3+ (green line).
24

Figure S4. Experimental Fe L2,3 XAS spectra of bulk FeO [2] (Fe2+ in octahedral coordination),
thin film Fe0.04Mg0.96O [13] (Fe2+ in octahedral FeO6), bulk Fe2O3 (Fe3+ in octahedral FeO6), and
bulk YBaCo3FeO7 [1] (Fe3+ in tetrahedral FeO4), together with the simulated spectra of an Fe2+
in FeO6 and in FeO5, an Fe3+ in FeO6 and FeO5, and an Fe3+ in FeO4.
25

Figure S5. Experimental linear polarization-dependent Fe L2,3 XAS spectra of 1 ML Fe3O4. The
experimental linear dichroic (LD) signal defined as the difference between two polarizations (E ||
C – E ⊥ C) is shown in the middle, together with the calculated LD spectrum for the scenario of
33 % B-site Fe2+ and 67 % B-site Fe3+ (no A-site Fe3+).
26

Figure S6. Fe L2,3 XAS spectra of the 1 ML Fe3O4, the 1 ML Fe3O4 capped with 10 ML MgO,
and Fe0.04Mg0.96O thin film.
27

Figure S7. Proposed �√2 × √2�R45° surface reconstruction of Fe3O4 (001). The solid-line square
is the conventional cubic unit cell. The dashed-line square is the superstructure unit cell. Also
included are the directions (arrows) of the atomic relaxations forming a wavelike surface patterns
along the [110].
28

References of the Supplementary materials
1. N. Hollmann, Z. Hu, M. Valldor, A. Maignan, A. Tanaka, H. H. Hsieh, H.-J. Lin, C. T. Chen,
and L. H. Tjeng, Electronic and magnetic properties of the kagome systems YBaCo4O7 and
YBaCo3MO7 (M=Al, Fe), Phys. Rev. B 80, 085111 (2009).
2. J. H. Park, Ph.D. thesis, University of Michigan (1994).
3. F. M. F. de Groot, X-ray absorption and dichroism of transition metals and their compounds,
J. Electron Spectrosc. Relate. Phenom. 67, 529 (1994).
4. Theo Thole Memorial Issue, J. Electron Spectrosc. Relate. Phenom. 86, 1 (1997).
5. A. Tanaka and T. Jo, Resonant 3d, 3p and 3s Photoemission in Transition Metal Oxides
Predicted at 2p Threshold, J. Phys. Soc. Jpn. 63, 2788 (1994).
6. J. Chen, D. J. Huang, A. Tanaka, C. F. Chang, S. C. Chung, W. B. Wu, and C. T. Chen,
Magnetic circular dichroism in Fe 2p resonant photoemission of magnetite, Phys. Rev. B 69,
085107 (2004).
7. A. E. Bocquet, T. Mizokawa, K. Morikawa, A. Fujimori, S. R. Barman, K. Maiti, and D. D.
Sarma, Y. Tokura, and M. Onoda, Electronic structure of early 3d-transition-metal oxides by
analysis of the 2p core-level photoemission spectra, Phys. Rev. B 53, 1161 (1996).
8. W. A. Harrison, Electronic Structure and the Properties of Solids (Dover, New York, 1989).
9. Jon P. Wright, J. Paul Attfield, and Paolo G. Radaelli Charge ordered structure of magnetite
Fe3O4 below the Verwey transition, Phys. Rev. B 66, 214422 (2002).
10. Parameters for A-site Fe3+ FeO4 cluster [eV]: Udd= 6.0, Ucd= 7.5, ∆= 3.5, 10Dq= -0.2;
parameters for B-site Fe2+ FeO6 cluster [eV]: Udd= 6.0, Ucd= 7.5, ∆= 7.0, 10Dq= 0.6;
parameters for B-site Fe3+ FeO6 cluster [eV]: Udd= 6.0, Ucd= 7.5, ∆= 3.0, 10Dq= 0.6. 10Dq
is the ionic part of the crystal field splitting which is defined as the energy difference between
the x2-y2 and the xy orbitals. An exchange field of 70 meV was applied to account for the
ferrimagetic order; positive for the B-sites and negative for the A-site.
11. P. Kuiper, B.G. Searle, L.-C. Duda, R.M. Wolf, and P.J. van der Zaag, Fe L2,3 linear and circular
magnetic dichroism of Fe3O4, J. Electron Spectrosc. Relate. Phenom. 86, 107 (1997). 29

12. Alessandro Mirone, Maurizio Sacchi, and Susana Gota, Ligand-field atomic-multiplet
calculations for arbitrary symmetry, Phys. Rev. B 61, 13540 (2000).
13. Wolfram Research, Inc., Mathematica, Version 8.0, Champaign, IL (2010).
14. T. Haupricht, R. Sutarto, M. W. Haverkort, H. Ott, A. Tanaka, H. H. Hsieh, H.-J. Lin, C. T.
Chen, Z. Hu, and L. H. Tjeng, Local electronic structure of Fe2+ impurities in MgO thin films:
Temperature-dependent soft x-ray absorption spectroscopy study, Phys. Rev. B 82, 035120
(2010).
15. S. Baumann, F. Donati, S. Stepanow, S. Rusponi, W. Paul, S. Gangopadhyay, I. G. Rau, G. E.
Pacchioni, L. Gragnaniello, M. Pivetta, J. Dreiser, C. Piamonteze, C. P. Lutz, R. M.
Macfarlane, B. A. Jones, P. Gambardella, A. J. Heinrich, and H. Brune, Origin of
Perpendicular Magnetic Anisotropy and Large Orbital Moment in Fe Atoms on MgO, Phys.
Rev. Lett. 115, 237202 (2015).
30