COVID-19 school response Previous Government Covid 19 non ...
Upload
khangminh22Category
view
0download
0
i
COVID-19: A Catastrophe for Children in Sub-Saharan Africa
UNICEF EASTERN AND SOUTHERN AFRICA
UNICEF WEST AND CENTRAL AFRICA
© U
NIC
EF/
UN
I362
245/
Eve
rett
COVID-19: A Catastrophe for Children in Sub-Saharan AfricaCash Transfers and a Marshall Plan Can Help
NOVEMBER 2020

ii
COVID-19: A Catastrophe for Children in Sub-Saharan Africa
COVID-19: A Catastrophe for Children in Sub-Saharan AfricaCash Transfers and a Marshall Plan Can Help
© United Nations Children’s Fund, Eastern and Southern Africa Regional OfficeP.O. Box 44145, Nairobi, Kenya
© United Nations Children’s Fund, West and Central Africa Regional OfficeP.O. Box 29720, Dakar, Senegal
November 2020

iii
COVID-19: A Catastrophe for Children in Sub-Saharan Africa
Contents
List of Acronyms
Executive Summary
Chapter 1. Introduction
Chapter 2. Child Well-being at the Start of 2020Key findings2.1. The state of multi-dimensional and monetary child poverty2.2. Health + nutrition + education = human capital foundation2.3. Other deprivations2.4. The uber vulnerable2.5. Summary
Chapter 3. The Economic and Poverty OutlookKey findings3.1. From slow growth to historical lows3.2. Downward revisions3.3. Individual income in a free fall3.4. The impact on extreme monetary poverty3.5. Summary
Chapter 4. Child Well-being Six Months LaterKey findings4.1. Monetary poverty4.2. Hunger and malnutrition4.3. Out of school and not learning 4.4. Sickness and death4.5. Violence against children and women4.6. Child mothers and wives4.7. Loss of shelter and unsafe living conditions4.8. Summary
Chapter 5. Cash TransfersKey findings5.1. The power of cash transfers5.2. Cash transfers before the crisis5.3. Cash transfers during the crisis5.4. Increasing cash transfers: Costs and benefits5.5. Funding cash transfers: Closing the gap 5.6. Summary
Chapter 6. A Marshall Plan for Children in Sub-Saharan Africa6.1. The situation6.2. A smart intervention6.3. A global funding facility for children ins Sub-Saharan Africa
Appendix. Additional Figures
References
Databases
iv
01
03
05050506080810
11111213141617
18181919212122232424
2525262728303235
36363637
39
42
46
i

iv
COVID-19: A Catastrophe for Children in Sub-Saharan Africa
Figures
Figure 1. The socioeconomic impacts of COVID-19 on children
Figure 2. Multi-dimensional and monetary child poverty
Figure 3. Child deaths
Figure 4. Incidence of childhood stunting and failure to complete lower secondary education
Figure 5. Children without access to basic water services
Figure 6. Children without access to basic sanitation services
Figure 7. Newly displaced children and child refugees
Figure 8. Children living in slums
Figure 9. Snapshot of key child well-being indicators
Figure 10. The impact of COVID-19 on real per capita GDP growth
Figure 11. GDP growth trends, 1980-2020
Figure 12. The deteriorating economic growth outlook
Figure 13. Per capita GDP trends by income groups, 2000-20
Figure 14. Lost income
Figure 15. Projected impact of the economic shock on extreme monetary poverty
Figure 16. Extreme monetary poverty trends and projections
Figure 17. Monetary child poverty projections
Figure 18. Child population affected by different levels of food insecurity
Figure 19. Missing out on school meals in SSA countries
Figure 20. Number of cash programs in SSA countries
Figure 21. Coverage of cash and at least one safety net program
Figure 22. Coverage of announced expansion of cash transfer programs
Figure 23. Announced funding for the expansion of cash transfer programs
Figure 24. Adequacy of announced cash transfer values
Figure 25. Announced fiscal stimulus
Figure 26. Parameters for scaling up cash transfer support to young children
Figure 27. Cost estimates for providing cash transfers to all young children
Figure 28. Projected economic impact of providing cash transfers to all children under five
Figure 29. Government spending on social safety nets, the military and energy subsidies
Figure 30. Committed external funding and debt relief, by source and type
Figure 31. External funding flows and debt relief
Figure 32. General government total expenditure per capita
04
06
07
07
08
08
09
09
10
12
13
13
14
15
16
17
19
20
21
27
28
29
29
30
30
31
31
32
33
34
34
37
ii

v
COVID-19: A Catastrophe for Children in Sub-Saharan Africa
Acknowledgements
This report was written by Matthew Cummins (Regional Adviser Social Policy, UNICEF Eastern and Southern Africa Regional Office [ESARO]).
It benefitted enormously from contributions and reviews from many colleagues. The author would like to specially thank the following persons (in alphabetical order by first name): Akshay Sinha (Emergency Specialist, UNICEF ESARO), Amna Said Nahdy Silim (Economist, UNICEF Uganda), Ana Gabriela Guerrero Serdan (Chief of Social Policy, UNICEF Kenya), Atif Khurshid (Policy Specialist, UNICEF Headquarters), Beatrice Targa (Chief of Social Policy, UNICEF Malawi), Bob Muchabaiwa (Public Finance Specialist, UNICEF ESARO), Charlotte Taylor (Chief of Social Policy, UNICEF Rwanda), Christiane Rudert (Regional Adviser Nutrition, UNICEF ESARO), Chrystian Solofo-Dimby (Chief of Social Policy, UNICEF Burkina Faso), Debora Camaione (Social Policy Consultant, UNICEF ESARO), Elena Celada (Social Policy Specialist, UNICEF Madagascar), Emmanuel Munyemana (Social Policy and Economic Specialist, UNICEF Rwanda), Erica Mattellone (Chief of Social Policy, UNICEF Madagascar), Gabriele Fontana (Regional Adviser Health, UNICEF ESARO), Grainne Mairead Moloney (Nutrition Specialist, UNICEF ESARO), Guillaume Kobehi Toutou (Chief of Social Policy, UNICEF Mali), Hyun Hee Ban (Chief of Social Policy, UNICEF South Sudan), Ian Mackenzie (Public Finance Consultant, UNICEF South Sudan), James Elder (Regional Chief of Communication, UNICEF ESARO), Jean Dupraz (Consultant), Laurie Gulaid (Regional Adviser HIV/AIDS, UNICEF ESARO), Maki Kato (Chief of Social Policy, UNICEF Mozambique), Maniza Ntekim (Regional Adviser Early Childhood Development, UNICEF ESARO), Mara Nyawo (Nutrition Specialist, UNICEF ESARO), Maren Platzmann (Social Policy Specialist, UNICEF Malawi), Maria Florencia Alejandre (Social Policy Specialist, UNICEF Mozambique), Maria Muñiz (Health Specialist, UNICEF ESARO), Marjorie Volege (Nutrition Specialist, UNICEF ESARO), Mona Aika (Child Protection Specialist, UNICEF ESARO), Natalia Elena Winder-Rossi (Social Policy Associate Director, UNICEF Headquarters), Natalie Fol (Regional Adviser Communication for Development, UNICEF ESARO), Nathalie Meyer (Chief of Social Policy, UNICEF Burundi), Ousmane Niang (Chief of Social Policy, UNICEF Democratic Republic of the Congo), Pamela Dale (Regional Adviser Social Policy, UNICEF Europe and Central Asia Regional Office), Paul Quarles Van Ufford (Regional Adviser Social Policy, West and Central Africa Regional Office), Russell Wildeman (Social Policy Manager, UNICEF South Africa), Samuel Godfrey (Regional Adviser WASH, UNICEF ESARO), Samuel Phiri (Social Policy Specialist, UNICEF Zimbabwe), Sergiu Buruiana (Chief of Social Policy, UNICEF Cote d’Ivoire), Shiraz Chakera (Education Specialist, UNICEF ESARO), Solrun Engilbertsdottir (Policy Specialist, UNICEF Headquarters), Sudhanshu (Ashu) Handa (Lawrence I. Gilbert Distinguished Professor, Department of Public Policy, University of North Carolina at Chapel Hill), Tawanda Chinembiri (Chief of Social Policy, UNICEF Zimbabwe), Tayllor Spadafora (Social Protection Specialist, UNICEF ESARO), Urs Nagel (Regional Adviser Evaluation, UNICEF ESARO), Vincenzo Vinci (Social Policy Specialist, UNICEF Ethiopia) and Yumi Bae (Deputy Regional Director a.i., UNICEF ESARO).
iii

vi
COVID-19: A Catastrophe for Children in Sub-Saharan Africa
List of Acronyms
3F crisis food, finance and fuel crisis
AfDB African Development Bank
COVID-19 coronavirus disease 2019
DHS Demographic and Health Survey
DRC Democratic Republic of Congo
EIU Economist Intelligence Unit
FDI foreign direct investment
G20 Group of Twenty
GBV gender-based violence
GDP gross domestic product
ICPAC IGAD Climate Prediction and Applications Centre
IFPRI International Food Policy Research Institute
IGAD Intergovernmental Authority on Development
IMF International Monetary Fund
IPC Integrated Food Security Phase Classification
LIC low-income country
LMIC lower-middle-income country
MDG Millennium Development Goals
MICS Multiple Indicator Cluster Survey
MIS management information system
PPP purchasing power parity
SADC Southern African Development Community
SAM severe acute malnutrition
SDGs Sustainable Development Goals
SSA Sub-Saharan Africa
UMIC upper-middle-income country
UN Habitat United Nations Human Settlement Programme
UNDESA United Nations Department of Economic and Social Affairs
UNECA United Nations Economic Commission for Africa
UNFPA United Nations Population Fund
UNHCR United Nations High Commissioner for Refugees
UNICEF United Nations Children’s Fund
UNOCHA United Nations Office for the Coordination of Humanitarian Affairs
UNU-WIDER United Nations University World Institute for Development Economics Research
WASH water, sanitation and hygiene
WFP World Food Programme
WHO World Health Organization
iv

1
COVID-19: A Catastrophe for Children in Sub-Saharan Africa
Before COVID-19 arrived, SSA was a challenging place for many of its 550 million children. The situation had improved in previous decades, best captured by the halving of the child mortality rate since 2000. Nonetheless, at the start of 2020, an estimated 40% of children were without access to basic water services or adequate nutrition, while closer to two out of every three lacked a safe place to use the toilet and had little hope of completing enough education to compete in the 21st century labor market. At the same time, up to four out of five children – or approximately 440 million lives – struggled with two or more such challenges with close to half also living in monetary poor households. And, whether recently displaced, living as a refugee or residing in a slum, at least one in four children faced exceptional risks on a daily basis.
As it commenced, 2020 was characterized by intense economic pain across SSA. Before the pandemic surfaced, the economy was moving so slow that it would have taken the average person around 45 years to double their income. Then, almost instantly, more than 6% of per capita economic growth disappeared, on average, and with it 15 years of income progress. The region is now going through its first-ever economic recession, and not a single country has been spared. Upcoming economic forecasts could worsen.
The economic situation is causing poverty records to be shattered. Using the $1.90/day international definition (2011 purchasing power parity [PPP]), an estimated 50 million people have been pushed into extreme poverty in SSA since the start of the year. This is the largest single year change ever recorded in either absolute or percentage terms – and by a wide margin. Compared to the food, finance and fuel (3F) crisis a decade ago, the poverty impacts of the current crisis could be around tenfold greater. The total number of extreme poor living in SSA has now likely crossed the 500 million mark, which is close to double the number in 1990 when progress against the Millennium Development Goals (MDG) started to be measured.
Child poverty has also gotten a lot worse. Based on national definitions, poverty rates among the 0-17-year-old population have likely jumped by 10% since the start of 2020, which could rise to 20% or more in five countries. This translates to an increase of 26 million and points to a regional total of more than 280 million children currently living in monetary poverty. In low-income countries, child poverty rates are around 60%, on average.
This report investigates how COVID-19 and other shocks have impacted child well-being in Sub-Saharan Africa (SSA) during 2020 and the potential role of cash transfers and external resources to help children and economies. It reviews the latest social, economic and financial information from a range of global databases and modelling exercises, draws on emerging country-level reporting and carries out projections where recent data are unavailable. Although information remains incomplete and things are quickly evolving, the outlook is alarming.
Executive Summary
Child well-being is under siege from all directionsBeyond lower consumption, children in SSA have faced many other challenges during 2020. There are, of course, the additional side effects of COVID-19, which include rising prices of basic goods and services, movement restrictions and disruptions to crucial social services. But the list also includes climate shocks (droughts, floods and locust invasions) and conflict (insecurity, instability and displacement), which existed before the pandemic but have intensified since the start of the year. The multitude and reinforcing impacts on most children have led to staggering losses of human capital, starting with malnutrition and lost learning.
In the case of nutrition, an estimated 280 million children – or more than half of the child population – are dealing with some level of food insecurity in the second half of 2020. 48 million of those could be in a severe situation and 7.5 million in an emergency, with risks for famine possibly developing in several places. Compared to the start of the year, the number of children confronting high acute food insecurity may have risen by 14%, on average. School closures have further heightened food insecurity fears. By April 2020, more than 50 million students had lost access to free, daily meals, with more than 40 million of those affected for at least six months.
On the education front, school closures impacted around 250 million students in SSA. Learning completely stopped for most of them, which has already reduced their lifelong earning potential. Even more worrisome, millions of students will end up as permanent dropouts, adding to the 100 million out of school children before the pandemic. School closures have also removed a protective environment for many children. Recent country reporting, although limited, is validating decades of experience and research of increased sexual, physical and emotional abuse when children are out of school for prolonged periods.
Emerging signals raise additional alarm bells. These range from greater vulnerability to basic health threats, like diarrhea and malaria, to rising teenage pregnancies and child marriages, to lost shelter and unsafe living conditions, among others. When bringing the available evidence together, there is no question that COVID-19, climate, conflict and other shocks have jeopardized child well-being during 2020. The important question is: How can we reverse the damage and protect millions more from being impacted?
2
COVID-19: A Catastrophe for Children in Sub-Saharan Africa
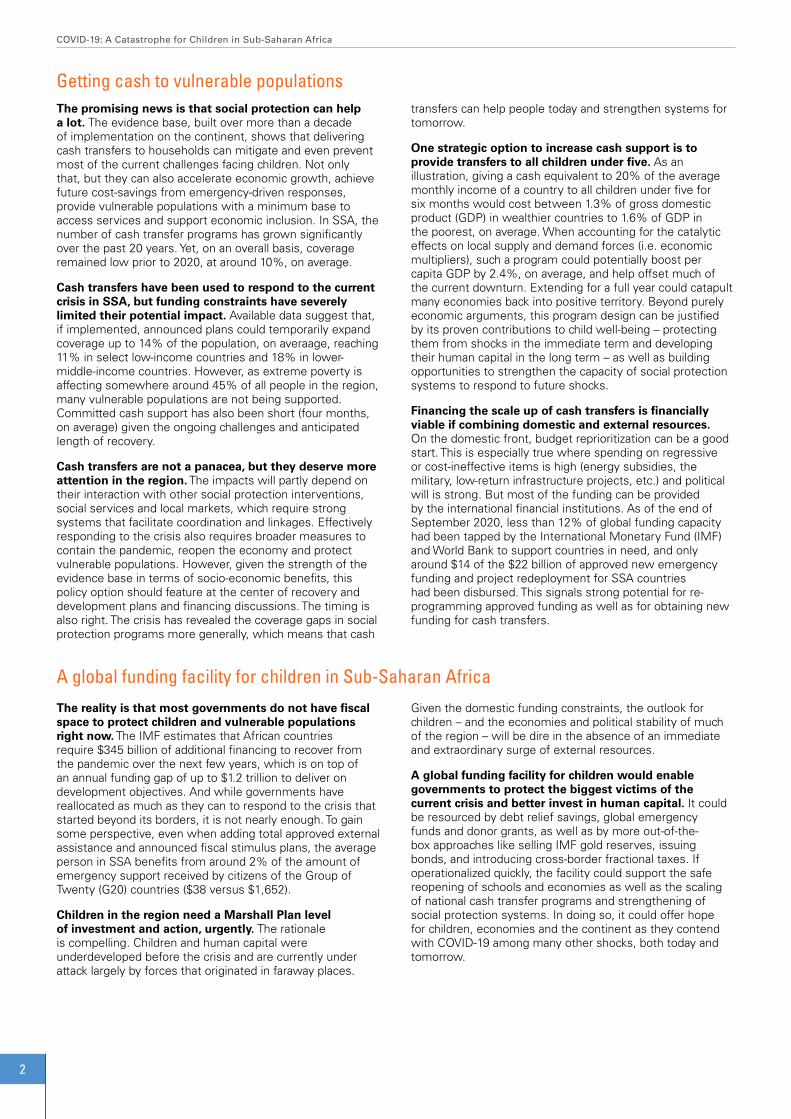
The promising news is that social protection can help a lot. The evidence base, built over more than a decade of implementation on the continent, shows that delivering cash transfers to households can mitigate and even prevent most of the current challenges facing children. Not only that, but they can also accelerate economic growth, achieve future cost-savings from emergency-driven responses, provide vulnerable populations with a minimum base to access services and support economic inclusion. In SSA, the number of cash transfer programs has grown significantly over the past 20 years. Yet, on an overall basis, coverage remained low prior to 2020, at around 10%, on average.
Cash transfers have been used to respond to the current crisis in SSA, but funding constraints have severely limited their potential impact. Available data suggest that, if implemented, announced plans could temporarily expand coverage up to 14% of the population, on averaage, reaching 11% in select low-income countries and 18% in lower-middle-income countries. However, as extreme poverty is affecting somewhere around 45% of all people in the region, many vulnerable populations are not being supported. Committed cash support has also been short (four months, on average) given the ongoing challenges and anticipated length of recovery.
Cash transfers are not a panacea, but they deserve more attention in the region. The impacts will partly depend on their interaction with other social protection interventions, social services and local markets, which require strong systems that facilitate coordination and linkages. Effectively responding to the crisis also requires broader measures to contain the pandemic, reopen the economy and protect vulnerable populations. However, given the strength of the evidence base in terms of socio-economic benefits, this policy option should feature at the center of recovery and development plans and financing discussions. The timing is also right. The crisis has revealed the coverage gaps in social protection programs more generally, which means that cash
transfers can help people today and strengthen systems for tomorrow.
One strategic option to increase cash support is to provide transfers to all children under five. As an illustration, giving a cash equivalent to 20% of the average monthly income of a country to all children under five for six months would cost between 1.3% of gross domestic product (GDP) in wealthier countries to 1.6% of GDP in the poorest, on average. When accounting for the catalytic effects on local supply and demand forces (i.e. economic multipliers), such a program could potentially boost per capita GDP by 2.4%, on average, and help offset much of the current downturn. Extending for a full year could catapult many economies back into positive territory. Beyond purely economic arguments, this program design can be justified by its proven contributions to child well-being – protecting them from shocks in the immediate term and developing their human capital in the long term – as well as building opportunities to strengthen the capacity of social protection systems to respond to future shocks.
Financing the scale up of cash transfers is financially viable if combining domestic and external resources. On the domestic front, budget reprioritization can be a good start. This is especially true where spending on regressive or cost-ineffective items is high (energy subsidies, the military, low-return infrastructure projects, etc.) and political will is strong. But most of the funding can be provided by the international financial institutions. As of the end of September 2020, less than 12% of global funding capacity had been tapped by the International Monetary Fund (IMF) and World Bank to support countries in need, and only around $14 of the $22 billion of approved new emergency funding and project redeployment for SSA countries had been disbursed. This signals strong potential for re-programming approved funding as well as for obtaining new funding for cash transfers.
Getting cash to vulnerable populations
A global funding facility for children in Sub-Saharan Africa
The reality is that most governments do not have fiscal space to protect children and vulnerable populations right now. The IMF estimates that African countries require $345 billion of additional financing to recover from the pandemic over the next few years, which is on top of an annual funding gap of up to $1.2 trillion to deliver on development objectives. And while governments have reallocated as much as they can to respond to the crisis that started beyond its borders, it is not nearly enough. To gain some perspective, even when adding total approved external assistance and announced fiscal stimulus plans, the average person in SSA benefits from around 2% of the amount of emergency support received by citizens of the Group of Twenty (G20) countries ($38 versus $1,652).
Children in the region need a Marshall Plan level of investment and action, urgently. The rationale is compelling. Children and human capital were underdeveloped before the crisis and are currently under attack largely by forces that originated in faraway places.
Given the domestic funding constraints, the outlook for children – and the economies and political stability of much of the region – will be dire in the absence of an immediate and extraordinary surge of external resources.
A global funding facility for children would enable governments to protect the biggest victims of the current crisis and better invest in human capital. It could be resourced by debt relief savings, global emergency funds and donor grants, as well as by more out-of-the-box approaches like selling IMF gold reserves, issuing bonds, and introducing cross-border fractional taxes. If operationalized quickly, the facility could support the safe reopening of schools and economies as well as the scaling of national cash transfer programs and strengthening of social protection systems. In doing so, it could offer hope for children, economies and the continent as they contend with COVID-19 among many other shocks, both today and tomorrow.

3
COVID-19: A Catastrophe for Children in Sub-Saharan Africa
Child well-being is the most important indicator of a country’s vitality today and prospects for tomorrow. If children are doing well, chances are high that parents and caretakers are doing well, and the economy is doing well. It also means that the human capital base is being strengthened, which can drive future productivity, innovation and economic growth, creating opportunities for individuals to further improve their lives and the lives of their families. The opposite, of course, is equally true. Unfortunately, child well-being in Sub-Saharan Africa (SSA)1 has never faced as many simultaneous threats as today.
Before COVID-19 arrived in the region, most families and children were already struggling with a long list of challenges. Start with climate. Cyclones Idai and Kenneth devasted populations along the Indian Ocean in early 2019 (UNOCHA 2019). Repeated and prolonged droughts, floods and landslides wreaked additional havoc on harvests and livelihoods in most sub-regions during the second half of the year (Save the Children 2019), as did a locust invasion across the Horn of Africa (Stone 2020). Then there were protracted conflicts and humanitarian situations. While most had persisted for many years, they continued to destabilize whole or parts of nearly one out of every three countries in SSA, causing displacement, migrants and refugees.2 There was also multi-dimensional poverty, which presented daily hardships for more than half of the population (UNDP and OPHI 2020).
Introduction
COVID-19 introduced a new set of challenges. Through distinct global and national transmission channels (Figure 1), families and children have been negatively impacted by falling income, rising prices and disruptions to social services. These are summarized below.
• Lower income and assets: Household income has been directly impacted by job losses, lower earnings and/or reduced employment benefits as well as fewer remittance flows from friends and relatives. Assets have also been diminished as families spend savings, sell livestock and other valuable items, and/or borrow to meet essential consumption needs.
• Higher costs: Driven by a combination of supply and demand factors, the prices for basic needs like food, water, soap and sanitizer, medicine and transportation have gone up in many places. Since inflation requires more money to purchase the same things over time, higher prices ultimately serve as another type of income shock.
• Reduced access to social goods and services: This has been felt through COVID-19 containment measures, which have closed or limited the availability or quality of early childhood development and childcare services, schools, nutrition programs, immunization campaigns and so on. On the demand side, factors like misinformation, fear and stigmatization, and the inability to pay for user fees have contributed to lower utilization of certain services as well.
CHAPTER 1
1 This report looks at the 46 developing countries in SSA and excludes the two high-income island countries (Mauritius and Seychelles), based on the World Bank’s Country Classification.
2 According to International Rescue Community (2020), these include Burkina Faso, Burundi, Cameroon, Central African Republic, Chad, Democratic Republic of Congo, Ethiopia, Mali, Niger, Nigeria, Somalia, Sudan and South Sudan.
© U
NIC
EF/
UN
I316
643/
Moh
amed

4
COVID-19: A Catastrophe for Children in Sub-Saharan Africa
The impacts of COVID-19 are jeopardizing child well-being. Drawing on the experience of the food, finance and fuel (3F) crisis in 2007-08 where families were impacted by similar transmission channels, it is possible to identify many of the immediate risks to children (Ortiz and Cummins 2012). Among others, these include death, sickness, malnutrition, exposure to various forms of violence, mental health issues and lower educational achievement.
The prevalence, intensity and multiplicity of negative outcomes on children are largely determined by household coping capacity. And this is the concern: The limited capacity that existed at the start of 2020 has already been exhausted by many families. If this is true and shocks continue impacting well-being, then the potential for irreversible harm to the region’s 550 million 0-17-year-olds – and the 101,000 new lives that arrive every day – could be exponentially rising.3
Yet, the reality is that children are suffering COVID-19’s socioeconomic impacts as well as intensifying climate and conflict shocks. For example, erratic weather patterns and migratory pests continue spreading and wreaking havoc in almost all sub-regions (FEWSN 2020a-c), just as many areas that were affected by the cyclones in early 2019 have yet to recover (Save the Children 2020). And a lot of conflict hot spots are getting worse (ACLED 2020).
This report investigates how COVID-19 and other shocks have impacted child well-being in SSA during 2020 and the potential role of cash transfers and external resources to help children and economies. It is motivated by two basic questions: How has child well-being changed during the year? And what can governments and development partners do to prevent further harm and reverse the situation? It answers these questions by: (i) analyzing socioeconomic and financial information extracted from nearly 40 global databases; (ii) interpreting the latest
economic and poverty forecasts; (iii) reviewing recent modelling exercises that focus on different aspects of child well-being; (iv) bringing together emerging country-level reporting; (v) drawing lessons from the Ebola outbreak in West Africa in 2014-16; and (vi) carrying out projections.
The report is structured as follows. Chapter 2 describes the situation of children in SSA at the start of 2020 with the aim of establishing a baseline for overall child well-being prior to the arrival of COVID-19 and the intensification of other shocks. In order to understand the broader context of how child well-being may have evolved during 2020, Chapter 3 analyzes the latest economic and poverty projections. Chapter 4 then looks at the available evidence to see which aspects of child well-being have likely been impacted during the year. In Chapter 5, the report examines possible policy and funding responses with a focus on cash transfers. Chapter 6 concludes by summarizing the key findings and calling for a global funding facility – in the spirit of a Marshall Plan level of investment and action – that would enable governments to protect children in the immediate term while also strengthening the human capital base and economic potential of the continent.
Lastly, there are important caveats about the analysis and conclusions. First, available information on the latest impacts of the crisis on children is extremely limited. As a result, the report heavily relies on modelling exercises that are underpinned by many assumptions. Second, the situation is fast-moving. In fact, at the time of publishing, data on the economy, poverty, food security, school closures, cash responses, financing, etc. have likely changed, and new information could alter the snapshot presented. Lastly, the report assesses trends across SSA and does not account for the immense diversity of sub-regions, countries or communities. The main findings and recommendations must therefore be complemented by local-level information and analysis.
Death
Sickness
Malnutrition
Violence (physical, sexual, emotional)
Anxiety and depression
Lower educational achievement
Impact on economies
Lower production
Higher import/local costs
Lower govt revenue and spending
Greater demand for health and other social services
Impact on households
Lower income
Higher prices
Reduced access to social services
Coping mechanisms
Exhaust savings, sell assets and/or borrow
Consume less food
Stop non-priority spending
Do not seek treatment
Relocate to cheaper housing
Send children to work
Lower demand
for imports
Supply chain
disruptions
Lower supply of exports
Fewer travelers
and tourists
Capital flow
reversals (FDI)
Fewer remittance
flows
Oil price crash
Containment policies
Conflict shocks
Climate shocks
Figure 1. The socioeconomic impacts of COVID-19 on children: Global, national and household level transmission channels
Source: Author’s depiction building on Ortiz and Cummins (2012).
3 Author’s calculation based on UNDESA World Population Prospects (2019 Revision). Note that medium variant estimates are used for all population analyses presented in this report.

5
COVID-19: A Catastrophe for Children in Sub-Saharan Africa
Assessing child well-being requires looking at the basic ingredients of a nurturing childhood and adolescence. For younger children, this can include good health, adequate nutrition, responsive caregiving, security and safety, and opportunities for early learning (WHO 2018). For older children, this could be consuming enough food and clean
water every day, having safe spaces to go to the bathroom and get a good night’s rest, going to school or the doctor’s office when needed, and being protected from sexual, physical and emotional abuse. The way that a shock alters these different aspects of childhood and adolescence is what really matters.
This chapter looks at child well-being in SSA before the arrival of COVID-19 and the intensification of climate and conflict shocks. It starts by reviewing the latest child poverty reports and recent simulation exercises to get a general sense of multi-dimensional and monetary poverty dynamics. It then carries out projections to estimate key well-being indicators across the region as well as the number of children that may have been exposed to extreme vulnerabilities. It concludes by offering a snapshot of the well-being situation at the start of 2020.
Child Well-being at the Start of 2020: Widespread vulnerability and human capital losses
CHAPTER 2
Key findings• ApproximatelyfouroutoffivechildreninSSA(or440million)wereexperiencingdeprivationsinatleasttwoareas
of well-being before the crisis, with one out of every two living in a household that consumed less than the national poverty line.
• Onaverage,around40%ofadolescentsmayhavebeenstuntedwhentheywerechildrenwith60%completingnomore than primary education, which translated into large losses of human capital before any of the new shockwaves emerged in 2020.
• Oneofoutofeverythreechildrenunderfivewaslikelyundernourishedwhilecloseto3millionwereexpectedtodieduring 2020 before the complications of COVID-19.
• Water,sanitationandhygiene(WASH)challengeswerealsopervasive,withanestimated40%ofchildreninSSAunable to access clean water and 70% safe sanitation facilities.
• Thewell-beingofclosetooneinfourchildrenfacedexceptionalriskduetolivingindisplacement,asrefugeesorinurban slums.
2.1. The state of multi-dimensional and monetary child poverty
© U
NIC
EF/
UN
I316
696/
Fran
k D
ejo

6
COVID-19: A Catastrophe for Children in Sub-Saharan Africa
Child well-being in SSA faced many challenges before the pandemic. If looking at the latest child poverty studies from the region, approximately 80% of children may have been deprived in at least two areas of well-being (Figure 2). In 10 countries, 90% or more of children could have been impacted by multiple challenges, including Angola, Burkina Faso, Burundi, Chad, Comoros, Democratic Republic
of Congo (DRC), Eswatini, Ethiopia, Guinea-Bissau and the United Republic of Tanzania (henceforth Tanzania). As expected, there were big variances across income groups, with multi-dimensional poverty affecting just over 50% of children living in upper-middle-income countries (UMICs), on average, and close to 80% in low-income countries (LICs).4
4 Income groups are based on the World Bank’s Country Classification for Fiscal Year 2021 throughout this report.5 This equation is not to be taken literally.
Sources: Multi-dimensional rates are drawn from the latest child poverty reports supported by UNICEF country offices, except for Cabo Verde, Central African Republic, Equatorial Guinea, Eritrea, Gabon, Niger, South Sudan and Sudan, which are based on de Milliano and Plavgo (2014); Monetary rates are based on the author’s estimates using UNICEF and Save the Children (2020).Notes: (i) The multi-dimensional rates reflect a cutoff value of two or more deprivations rather than the official cutoff value, which in some cases is more than two (this information was unavailable for Rwanda or Uganda, whose values reflect the official cutoffs – 3 and 6 deprivations, respectively); (ii) The years in parentheses refer to the year of the underlying household survey and not the year when the study was published (the average year of the household survey data in the sample is 2015); (iii) The multi-dimensional poverty estimates for countries with “predicted” in parentheses are not based on a household survey but rather through regression modelling (see page 28 of de Milliano and Plavgo 2014); (iv) For the monetary poverty rates, the simulation accounts for the proportion of children living in poor households as defined by national standards, which combines the proportion of the population living below the national poverty line with data from Multiple Indicator Cluster Surveys (MICS) and Demographic and Health Survey (DHS) on the distribution of children by deciles; (v) Monetary poverty projections were unavailable for Angola, Central African Republic, Equatorial Guinea, Eritrea and Somalia, although Angola and Somalia were gap filled using the estimate from the latest child poverty report; (vi) Several countries are currently updating their multi-dimensional poverty figures.
3034
3943
48 49
56 5760 60 61 61
6468 68 69 69 70 70 70 71 72 72 73 73
7881 82 82 82 82 83 85 86 86 87 89 90 91 91 92
96 96 96 97 98
7773
53
73
79
3538 39
64
23 23
55
22
76
5458
44
74
52
4649 50
41
85
60
27
73
49
61
48
37
5753
44 46
5753
42
64
4042
66
74
46
72
29
48
26
5449
35
5047
0
10
20
30
40
50
60
70
80
90
100 Multi-dimensional poverty
Monetary poverty
Figure 2. Multi-dimensional and monetary child poverty in SSA countries, 2020 pre-pandemic estimates (% of 0-17-year-olds)
Human capital is the knowledge and skills that people accrue throughout their lives that allow them to maximize their potential and contributions to society and the economy. The human capital base of a country or region is largely determined by the level and quality of investments in people through the social sectors, including healthcare, nutrition and education (World Bank 2020a). Outcomes and progress in these areas broadly indicate overall societal and economic well-being as well as future potential. In SSA, health, nutrition and education were three of the most widespread deprivations experienced by children before COVID-19.
Monetary poverty was also affecting a lot of children in the region and contributing to the high incidence of well-being deprivations. If interpreting a recent modelling exercise carried out by UNICEF and Save the Children (2020), about one out of every two children in SSA may have been living in a household that consumed less than the national poverty line at the start of 2020 (see also Figure 2). This ranges from 35% in UMICs, on average, to 54% in LICs.
Start with death, which is the worst deprivation of all. Projections suggest that around 2.82 million children under five likely died in SSA in 2019 and that another 2.78 million could have been expected to die during 2020 before any of the complications from COVID-19 (Figure 3). The numbers have certainly improved over time, as they reached around 4.1 million in 2000 and 3.3 million in 2010. Nonetheless, the scale of death taking place at the start of 2020 was immense, which amounted to around 100,000 children per year in Angola and Tanzania, close to 200,000 in Ethiopia and 300,000 in the DRC, and more than 850,000 in Nigeria. The tragedy is that most of these are due to birth complications, pneumonia, diarrhea and malaria, which can be prevented or treated with simple and affordable interventions (WHO and UNICEF 2020; UNICEF 2016).
In absolute terms, the number of children impacted by poverty before COVID-19 was huge. Projections indicate that somewhere around 440 out of the 550 million children living in SSA could have been experiencing multi-dimensional poverty at the start of 2020, with close to 260 million affected by monetary poverty. The five countries with the largest populations housed half of all children considered both multi-dimensionally and monetarily poor, which included the DRC, Ethiopia, Kenya, Nigeria and Tanzania. But what about the specific aspects of child well-being?
2.2. Health + nutrition + education = human capital foundation5

7
COVID-19: A Catastrophe for Children in Sub-Saharan Africa
6 This methodology is adapted from Cummins (2019a), pages 16-18.7 Author’s calculations based on UNICEF/WHO/World Bank Joint Malnutrition Estimates Expanded Databases (July 2020 Update) and UNDESA World Population
Prospects (2019 Revision). Note there were an estimated 50.4 million stunted children under the age of five in SSA in 2000.
Sources: UN Inter-agency Group for Child Mortality Estimation (September 2019 Update) and UNDESA World Population Prospects (2019 Revision). Note: The 2020 projections are based on a linear forecast of the number of neonatal, infant and under-5 deaths during the 2015-18 period. This method suggests that total under-5 deaths in SSA would fall from 2,868,891 in 2018 to 2,822,881 in 2019 and 2,778,319 in 2020, which amounts to a 1.6% average annual decline.
0.0%
0.5%
1.0%
1.5%
2.0%
2.5%
3.0%
0
100,000
200,000
300,000
400,000
500,000
600,000
700,000
800,000
900,000
Cabo V
erde
São To
mé and
Prínc
ipe
South
Africa
Rwanda
Botswan
a
Namibi
aKen
yaEri
trea
Seneg
al
Zimba
bweGab
on
Ugand
aGha
na
Malawi
Eswati
ni
Repub
lic of
Congo
Tanza
nia
Ethiop
ia
Madag
ascar
Burund
i
Zambia
Gambia
Sudan
Comoro
sTo
go
Liberi
a
Mozambiq
ue
Burkina
Faso
Camero
on
Maurita
niaAng
ola
Guinea
-Bissau
Lesoth
o
Côte d'
Ivoire
Niger
Equa
torial
Guinea DRC
Benin
Mali
Sierra
Leone
Guinea
South
Sudan
Centra
l Afric
an Rep
ublic
ChadNige
ria
Somali
aLIC
sLM
ICs
UMICsSSA
SSA popu
lation
weig
hted
# of deaths 0-27 days
# of deaths 1-11 months
# of deaths 1-4 years old
U5 deaths as % of U5 population
Figure 3. Child deaths in SSA countries, 2020 pre-pandemic estimates(in # of deaths and as a % of under-5 population)
Sources: UNESCO Institute for Statistics (accessed September 15, 2020), UNICEF/WHO/World Bank Joint Malnutrition Estimates Expanded Databases (July 2020 Update) and UNDESA World Population Prospects (2019 Revision)Notes: (i) Interpolation and nearest neighbor imputation methods used to gap-fill missing values at the country level, where applicable; (ii) The average completion rate among LICs in SSA was used for Somalia since data were unavailable; (iii) Stunting rates were applied to the 0-11 month population in year n+2 and lower secondary completion rates to year n+14 (e.g. the 2003 stunting rate and 2015 completion rate were applied to the group of children born in the year 2001).
0%
10%
20%
30%
40%
50%
60%
70%
80%
90%
100%
Stunted in early childhood
Did not complete lower secondary education
Figure 4. Incidence of childhood stunting and lower secondary education non-completion rates,2020 pre-pandemic estimates (in % of current cohort of 15-19-year-olds)
For children that do survive, nutrition and education were among the most widespread deprivations before COVID-19. As an example, take the five-year cohort of 15-19-year-olds who were born between 2001 and 2005.6 There are 120 million of these adolescents living in SSA today, which account for about 11% of the total population. On average, 40% were stunted during childhood while close to 60% never completed lower secondary education (Figure 4). On the one hand, this implies that 50 million adolescents suffered long-term harm from nutrition deprivations
experienced in early life. On the other hand, having only completed primary education or no education at all, around 70 million adolescents could be considered functionally illiterate and lacking basic numeracy and critical reasoning skills. Combining these deprivations indicates that a large portion of the current generation of adolescents will never reach their full physical, cognitive or innovative potential. This translates into immense human capital losses for the region at the start of 2020.
For the next generation, the nutrition and education situation saw little improvement. Based on the estimates released in July 2020, close to one out of every three children under five in SSA was stunted prior to the arrival of COVID-19, which translates into more than 60 million underdeveloped bodies and brains. On the education front, on average, around 70% of pre-primary school-age children, and 20% of primary school-age children were not in school at the start of 2020 (UNESCO 2019). If looking at the entire
school-age population, this amounts to close to one in three or around 100 million children. And for those children that were attending class regularly, the quality of learning was not good. For example, recent studies show that nearly 88% of children and adolescents in SSA were not achieving minimum proficiency levels in reading and math (UNESCO 2017), while 87% of 10-year-olds could not read and understand a simple story (Azevedo et al. 2019).

8
COVID-19: A Catastrophe for Children in Sub-Saharan Africa
Limited access to basic water and sanitation services added to the list of well-being challenges faced by many children before COVID-19. Projections indicate that around 40% of children in SSA may have not had access to at least basic water services at the start of 2020 (Figure 5). This would mean that 220 million children could not get drinking water from a pipe, a borehole, a protected well or protected spring, or from delivery services. The sanitation situation was even direr. Here, projections suggest that 70% or possibly
400 million children were not able to go to the bathroom using a safe toilet or latrine and were thereby exposed to a wide range of health and nutrition risks (Figure 6). In 10 countries, half or more of the child population may have been without access to basic water and sanitation services at the start of 2020 (Burkina Faso, Central African Republic, Chad, DRC, Eritrea, Ethiopia, Niger, Somalia, South Sudan, Uganda).
2.3. Other deprivations
Sources: WHO/UNICEF Joint Monitoring Programme for Water Supply and Sanitation (July 2019 Update) and UNDESA World Population Prospects (2019 Revision).Note: Estimates are derived by multiplying 100 minus the latest available % of population using basic drinking water services (2017) to the share of children in the population in 2020.
0%
10%
20%
30%
40%
50%
60%
70%
0
5
10
15
20
25
30
35
South
Africa
Botswan
a
Cabo V
erdeGab
on
São To
mé and
Princ
ipe
Namibi
aGha
na
Seneg
al
Comoro
sMali
Gambia
Repub
lic of
CongoLib
eria
Côte d'
Ivoire
Nigeria
Maurita
nia
Eswati
ni
Malawi
Lesoth
o
Guinea
-Bissau
Benin
Togo
Equa
torial
Guinea
Zimba
bweGuin
ea
Burund
i
Sierra
Leone
Camero
onSud
an
Zambia
Kenya
Rwanda
Tanza
nia
Angola
Mozambiq
ue
Madag
ascar
Somali
aEri
treaNige
r
Ugand
a
Burkina
Faso
Centra
l Afric
an Rep
ublic
DRC
Ethiop
ia
South
Sudan
Chad
LICsLM
ICsUMICs
SSA
SSA popu
lation
weig
hted
# of children not using basic drinking water services (left axis)
% of children not using (right axis)
Figure 5. Children without access to basic water services in SSA countries, 2020 pre-pandemic estimates (in millions and % of 0-17-year-olds)
Sources: WHO/UNICEF Joint Monitoring Programme for Water Supply and Sanitation (July 2019 Update) and UNDESA World Population Prospects (2019 Revision).Note: Estimates are derived by multiplying 100 minus the latest available % of population using at least basic sanitation services (2017) to the share of children in the population in 2020.
0%10%20%30%40%50%60%70%80%90%100%
0
10
20
30
40
50
60
70
Botswan
a
South
Africa
Cabo V
erde
Rwanda
Equa
torial
Guinea
Eswati
ni
Seneg
al
Angola
Maurita
niaGab
on
Burund
i
São To
mé and
Princ
ipe
Lesoth
oMali
Gambia
Nigeria
Camero
on
Somali
aSud
an
Zimba
bwe
Comoro
s
Namibi
a
Côte d'
Ivoire
Tanza
nia
Mozambiq
ueKen
ya
Zambia
Malawi
Centra
l Afric
an Rep
ublic
Guinea
Guinea
-Bissau
DRC
Repub
lic of
Congo
Burkina
Faso
Ugand
aGha
naLib
eriaBen
inTo
go
Sierra
Leone
NigerEri
trea
South
Sudan
Madag
ascar
Chad
Ethiop
ia LICsLM
ICsUMICs
SSA
SSA popu
lation
weig
hted
# of children not using basic sanitation services (left axis)
% of children (right axis)
Figure 6. Children without access to basic sanitation services in SSA countries, 2020 pre-pandemic estimates (in millions and % of 0-17-year-olds)

9
COVID-19: A Catastrophe for Children in Sub-Saharan Africa
There were also unique groups of children confronting extreme well-being stressors before COVID-19. Some of these are described below, including victims of displacement, refugees and urban slum dwellers. There are, however, many others, including children with disabilities (African Child Policy Forum 2011), children living with HIV/AIDS (UNAIDS 2020) and children living in remote, hard-to-reach areas (FAO 2019).
Projections indicate some 12 million children in SSA had either been recently displaced due to violence or a natural disaster or were living in a refugee camp at the start of 2020 (Figure 7). These children arguably confront the most powerful set of well-being challenges, as their situation implies no housing stability, very limited access to basic services, and constant emotional and physical stress, among many others. In eight countries, 5% or more of the 0-17 population was living under such circumstances before the pandemic (Burkina Faso, Central African Republic, Comoros, DRC, Gambia, Republic of Congo, Somalia, South Sudan).
Projections further suggest that around 120 million children may have been living in slums before COVID-19 (Figure 8). This amounts to more than 20% of all children in the region, including 40% or more of the child populations of Central African Republic, Equatorial Guinea, Mauritania, and
São Tomé and Príncipe. Children living in these environments are exposed to perpetual risks and hardships, ranging from substandard housing and overcrowding, contaminated water supplies, unsafe sanitation facilities, and limited access to basic social services (UNICEF 2018).
2.4. The uber vulnerable
Sources: The Internal Displacement Monitoring Centre Global Internal Displacement Database (December 31, 2019 Update), United Nations High Commissioner for Refugees (UNHCR) Refugee Population Statistics Database (June 18, 2020 Update) and UNDESA World Population Prospects (2019 Revision).Notes: (i) Child estimates are derived by applying the portion of 0-17 projected population for 2019 with the latest available estimate for internally displaced persons and refugees; (ii) 21 countries are not shown because less than 0.35% of their child population was considered displaced or had refugee status in 2019.
0%
2%
4%
6%
8%
10%
12%
14%
16%
0
500,000
1,000,000
1,500,000
2,000,000
2,500,000
# of children newly displaced due to conflict/violence (left axis)
# of children newly displaced due to disasters (left axis)
# of child refugees by country of asylum (left axis)
% of 0-17 displaced or refugee status (right axis)
Figure 7. Newly displaced children and child refugees in select SSA countries, 2019 estimates (in # and % of 0-17-year-olds)
Sources: United Nations Human Settlement Programme (UN Habitat) Urban Indicators Database (May 19, 2020 Update), UNDESA World Population Prospects (2019 Revision) and UNDESA World Urbanization Prospects (2018 Revision).Notes: (i) Estimates are based on applying the latest available (2018) proportion of the urban population living in slums to the projected number of children living in urban areas in 2020; (ii) Data unavailable for Botswana, Cabo Verde, Eritrea and Lesotho, which were gap filled by applying the average value of the corresponding income group.
0%
10%
20%
30%
40%
50%
60%
70%
0
5
10
15
20
25
30
# of children living in urban slums
% of all children
Figure 8. Children living in slums in SSA countries, 2020 pre-pandemic estimates (in millions and % of 0-17-year-olds)
10
COVID-19: A Catastrophe for Children in Sub-Saharan Africa
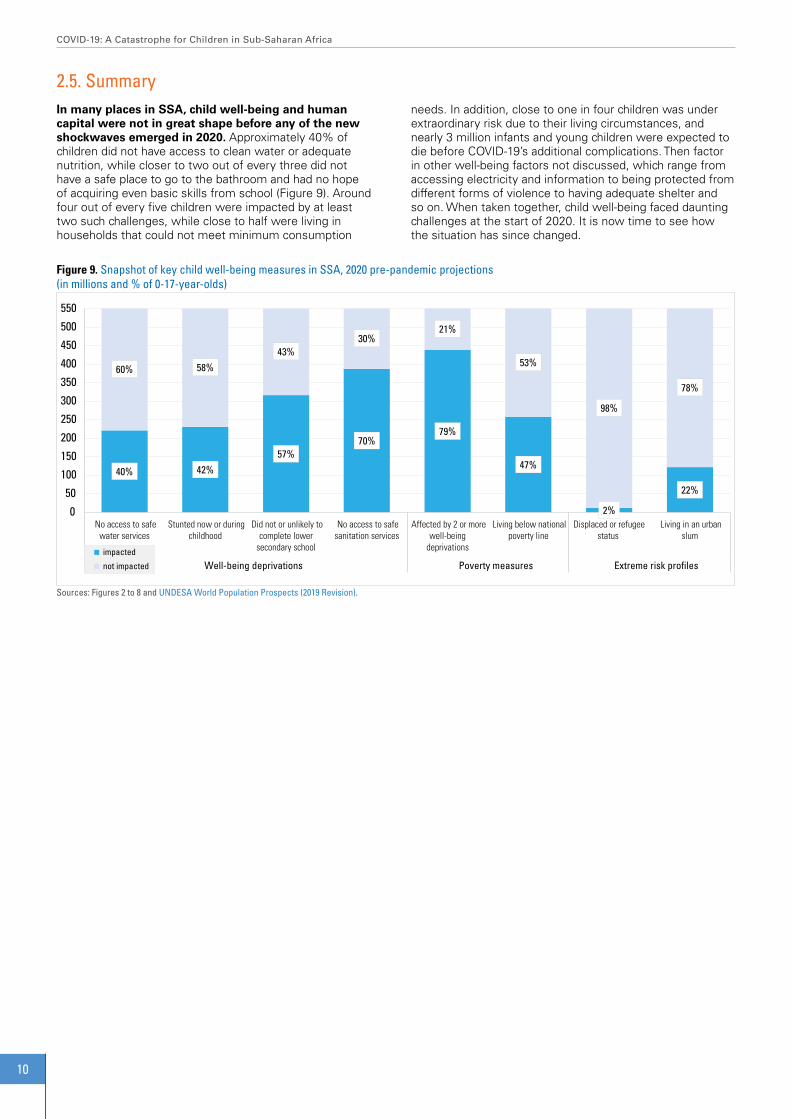
In many places in SSA, child well-being and human capital were not in great shape before any of the new shockwaves emerged in 2020. Approximately 40% of children did not have access to clean water or adequate nutrition, while closer to two out of every three did not have a safe place to go to the bathroom and had no hope of acquiring even basic skills from school (Figure 9). Around four out of every five children were impacted by at least two such challenges, while close to half were living in households that could not meet minimum consumption
needs. In addition, close to one in four children was under extraordinary risk due to their living circumstances, and nearly 3 million infants and young children were expected to die before COVID-19’s additional complications. Then factor in other well-being factors not discussed, which range from accessing electricity and information to being protected from different forms of violence to having adequate shelter and so on. When taken together, child well-being faced daunting challenges at the start of 2020. It is now time to see how the situation has since changed.
2.5. Summary
40% 42%57%
70%79%
47%
2%
22%
60% 58%43%
30%21%
53%
98%
78%
0
50
100
150
200
250
300
350
400
450
500
550
No access to safewater services
Stunted now or duringchildhood
Did not or unlikely tocomplete lower
secondary school
No access to safesanitation services
Affected by 2 or morewell-being
deprivations
Living below nationalpoverty line
Displaced or refugeestatus
Living in an urbanslum
Well-being deprivations Poverty measures Extreme risk profiles impacted
not impacted
Figure 9. Snapshot of key child well-being measures in SSA, 2020 pre-pandemic projections (in millions and % of 0-17-year-olds)
Sources: Figures 2 to 8 and UNDESA World Population Prospects (2019 Revision).

11
COVID-19: A Catastrophe for Children in Sub-Saharan Africa
To understand the broader context of how child well-being may have evolved during 2020, this chapter analyzes the latest economic and poverty projections for SSA. It starts by assessing the severity of the ongoing economic decline, including from a historical perspective, as well as possible interpretations of recent forecasts. It then looks at country and individual level trends to understand which populations may be under the greatest stress. Next, it tries to make sense of the flurry of monetary poverty projections for the region to estimate the total change in 2020. It concludes by summarizing the main trends and their implications for children in the region.
The Economic and Poverty Outlook: 15 years of income progress reversed and the biggest increase in poverty ever recorded
CHAPTER 3
Key findings• Percapitaeconomicgrowthwassluggishbeforethepandemic:ItwouldhavetakentheaveragepersoninSSAaround
45 years to double their income.• Thepandemicandothershockshaveshavedoffmorethan6%ofpercapitaeconomicgrowth,onaverage,with
wealthier countries faring much worse.• 2020representsthefirst-everrecessionforSSAandmarksthebiggestsingle-yearincreaseinextremepoverty
ever recorded, with somewhere around 50 million persons likely consuming less than the international poverty line compared to the start of the year.
• Theprojectedaverageincomelevelintheregionin2020waslastexperiencedin2005,whichequatesto15yearsoflost income; in places like Burundi and the Republic of Congo, the expected average income in 2020 is lower than at any time in the past 40 years.
• Intermsofpovertyimpactsintheregion,thecurrentcrisiscouldbearound10timesbiggerthanthefood,financeandfuel (3F) crisis a decade ago.
© U
NIC
EF/
UN
I326
263/
Otie
no

12
COVID-19: A Catastrophe for Children in Sub-Saharan Africa
The pandemic has significantly reduced economic growth in SSA. Comparing the International Monetary Fund’s (IMF) economic projections for 2020 before COVID-19 (released in October 2019) with its latest projections (released in October 2020) indicates that the crisis removed an average of -6.4% of per capita gross domestic product
The negative economic growth trend is worrisome. Based on the IMF’s October 2020 update, per capita GDP will contract by nearly -5%, on average, in SSA in 2020. Wealthier economies are struggling the most, with per capita growth in UMICs forecast to fall more than -8%, on average, versus -5% in lower-middle-income countries (LMICs) and just under -4% in LICs. Per capita GDP is declining by more than 10% in three countries, including Botswana, Republic of Congo and Zimbabwe, which means they are experiencing depression-like situations. Ten countries are close behind.
But the starting point also matters. Before the pandemic, economic growth was lackluster in most places, with the region on pace for a 1.6% per person gain in 2020. As an illustration, it would have taken around 45 years for the average citizen in SSA to double their income if this growth rate were sustained indefinitely.9 With growth now in negative territory, this outlook has become markedly gloomier.
(GDP) growth from the region (Figure 10). This ranges from an average of around -6% in LICs to -7% in LMICs and close to -8% UMICs. In aggregate terms, approximately $505 billion (in current international dollars) of economic output was lost across the region, which amounts to $450 on a per-person basis.8
The current economic contraction is unlike anything the region has ever experienced. In fact, 2020 marks the first time that SSA has recorded negative GDP growth, at least since 1980 when comprehensive information became available (Figure 11). Even when looking at SSA as a single economic unit, annual growth touched zero percent in 1992 but did not shrink. And if looking at country averages, the lowest pace was 1.3% (in 1983). This means that SSA is going through its first recession in at least four decades. There have, however, been various episodes of economic decline once factoring in population growth, notably in the early 1980s and early 1990s. Yet 2020 still stands far apart. If looking at the latest population-weighted forecast, GDP growth will contract by close to -6% for the average person in SSA, which is more than twice as severe as the worst historical declines (-2.8% in in 1992 and -2.7% in 1983).
3.1. From slow growth to historical lows
8 If using market-based exchange rates rather than purchasing power parity (PPP), this amounts to an estimated loss of US$201 billion or US$180 per person. Author’s calculations based on comparison of GDP projections in the IMF World Economic Outlook Database (October 2019 Edition) and IMF World Economic Outlook Database (October 2020 Edition).
9 Dividing 72 by the projected real per capita GDP growth rate for 2020 (1.58%) results in 45.6 years, which is the approximate number of years it would take for per capita GDP to double. For example, if that rate were unchanged, someone earning $500 in 2020 would earn $1,000 in 2066.
-14%
-12%
-10%
-8%
-6%
-4%
-2%
0%
2%
4%
6%
LICs LMICs UMICs Averages
October 2020 forecast
October 2019 forecast
Figure 10. The impact of COVID-19 on real per capita GDP growth in SSA countries, 2020(October 2019 and October 2020 forecasts by the IMF, as a %)
Sources: IMF World Economic Outlook Database (October 2019 Edition) and IMF World Economic Outlook Database (October 2020 Edition).

13
COVID-19: A Catastrophe for Children in Sub-Saharan Africa
Perhaps more alarming is that the actual economic impact could be worse than the latest projections indicate. The multitude of global, regional and national transmission channels of the crisis on economies across the continent – and their reinforcing impacts – have subjected forecasting exercises to lots of uncertainty. This trend is confirmed when reviewing the succession of estimates produced by different organizations since the start of the crisis. Between the end of April and October 2020, the African Development Bank (AfDB), the Economist Intelligence Unit, the IMF and the World Bank released six unique GDP forecasts for countries in SSA. For many
countries, the economic decline gets progressively worse over time (Figure 12). Comparing the difference of the projections across countries shows that growth was revised down by an additional -2%, on average, between April and October. This signals that the overall magnitude of the crisis on economic growth remains at least partially unknown in some places. It also suggests that future downward revisions are a possibility, especially if global trade, travel and investment flows to the region are further hampered, if economic lockdowns are re-introduced, and/or if climate, conflict or other shocks intensify.
3.2. Downward revisions
Source: IMF World Economic Outlook Database (October 2020 Edition).Notes: (i) Population data from UNDESA World Population Prospects (2019 Revision) were used to fill missing historical values for Eritrea, Guinea, Liberia and Mauritania, while missing GDP values for Eritrea, Guinea, Liberia, Mauritania, Nigeria and Zimbabwe were gap filled by applying the average annual GDP change for all available countries in the sample to the oldest available estimate and projecting backwards to 1980; (ii) The analysis covers 45 developing countries in SSA (Somalia was excluded due to data unavailability).
-6%
-4%
-2%
0%
2%
4%
6%
8%
Real GDP growth (country average) Real GDP growth (all SSA)
Real per capita GDP growth (country average) Real per capita GDP growth (population weighted)
Figure 11. GDP and per capita GDP growth trends in SSA, 1980-2020 (country averages and population-weighted, as a %)
Sources: IMF Regional Economic Outlook for SSA (June 2020 Update), Economist Intelligence Unit (April-May 2020 country projections), World Bank Global Economic Prospects (June 2020 Update), AfDB African Economic Outlook (July 2020 Update) (worst case scenario) and IMF World Economic Outlook Database (October 2020 Edition).
-14%
-12%
-10%
-8%
-6%
-4%
-2%
0%
2%
4%
6%
LICs LMICs UMICs Averages
April (IMF) Apr-May (EIU) early June (World Bank) late June (IMF) July (AfDB) October (IMF)
Figure 12. GDP growth forecasts for SSA countries in 2020, by different organizations between April and October 2020 (as a %)

14
COVID-19: A Catastrophe for Children in Sub-Saharan Africa
The economic growth shock has had devastating consequences for household income. Based on the IMF’s October 2020 update, average per capita GDP in SSA in 2020 is estimated at around $4,100 (in 2017 PPP), which is down from close to $4,360 in 2019. Although regional per capita GDP had been stagnating since 2014, it last reached the current level in 2005, which equates to a 15-year
The income reversal is massive in some places. For example, 14 countries are projected to have lower per capita income levels in 2020 than a decade or more ago (Figure 14). This amounts to two decades equivalent of lost income in Equatorial Guinea and Sudan and at least four in Burundi and Republic of Congo.10
reversal of income progress (Figure 13; see also Appendix, Figure A). The group of LICs have suffered the least so far, with the latest forecasts suggesting a four-year equivalent income loss, on average. In line with the steeper economic contractions in wealthier countries, this jumps to eight years in LMICs and to 19 years in UMICs, on average.
3.3. Individual income in a free fall
Source: IMF World Economic Outlook Database (October 2020 Edition).Note: Using the latest economic forecasts from other institutions (e.g. those presented in Figure 12) will give slightly different results.
90
100
110
120
130
140
2000
2001
2002
2003
2004
2005
2006
2007
2008
2009
2010
2011
2012
2013
2014
2015
2016
2017
2018
2019
2020
LICs LMICs UMICs SSA
8 years15 years
19 years
4 years
Figure 13. Per capita GDP trends in SSA by income groups, 2000-20 (2020=100)
10 The reversal cannot be entirely attributed to the 2020 shock, as growth in some countries had been stagnant or declining in recent years. This applies to 10 countries, mainly consisting of fragile states and UMICs. For instance, Equatorial Guinea has been experiencing a downward trend in per capita GDP since 2012, Liberia since 2013, Angola, Burundi, Chad, Nigeria, Republic of Congo and South Africa since 2014, Namibia since 2015 and Sudan since 2016. Although COVID-19 did not initiate the economic downturn in these cases, its forces magnified the trend.

15
COVID-19: A Catastrophe for Children in Sub-Saharan Africa
0 5 10 15 20 25 30 35 40
SSAUMICsLMICs
LICs
Burundi*Republic of Congo*
SudanEquatorial Guinea
ChadSouth Africa
AngolaLiberia
ComorosNamibiaNigeriaGabon
ZambiaZimbabweBotswana
LesothoSão Tomé and Príncipe
DRCEswatini
MauritaniaMozambique
CameroonMadagascar
Guinea-BissauMalawi
MaliSierra LeoneBurkina Faso
Cabo VerdeCentral African Republic
GambiaNiger
SenegalBenin
Côte d'IvoireEritreaGhanaGuineaKenya
RwandaTanzania
TogoUgandaEthiopia
South Sudan
Upper middle income (UMIC)
Low income country (LIC)
Lower middle income (LMIC)
Figure 14. Number of years since per capita GDP equaled projected levels for 2020 (in 2017 PPP $)
Source: IMF World Economic Outlook Database (October 2020 Edition). * Projected per capita GDP in 2020 is lower than levels in 1980.

16
COVID-19: A Catastrophe for Children in Sub-Saharan Africa
The economic shock has led to a fast and steep rise in extreme monetary poverty across SSA. Since the onset of the crisis, there have been at least eight poverty projections released that either focus on or include an aggregate figure for SSA using the international poverty line ($1.90/day in 2011 PPP).11 The estimates range from 29 million new poor by the United Nations Economic Commission for Africa (UNECA) to 119 million under the extreme scenario of a 20% across-the-
The year 2020 represents the biggest change in extreme monetary poverty ever experienced in SSA. The 50 million estimate amounts to an 11% increase between 2019 and 2020 (Figure 16; see also Appendix, Figures B and C). To put this in perspective, the previous records for the biggest changes in extreme poverty were a 6.5 million absolute increase in 1991 and a 6% year-on-year change in 1982. Comparing the current crisis to the food, finance and fuel
(3F) crisis further demonstrates the extraordinary nature of the 2020 shock. In 2009 and 2010, when the impacts peaked in SSA, the total number of extreme poor increased by 5.1 million persons each year or 1.3% annual increases. This suggests that the 2020 shock could be around 10 times more powerful in terms of its impact on poverty in both absolute and percentage changes.
board consumption shock as modelled by the United Nations University World Institute for Development Economics Research (UNU-WIDER) (Figure 15). However, by taking the average of the best guest estimates of these different exercises (i.e. a “poll of polls” approach), it can be inferred that somewhere around 50 million additional persons in SSA are consuming less than $1.90/day than at the start of 2020 because of the economic downturn.
3.4. The impact on extreme monetary poverty
Sources: Save the Children (April 9, 2020), International Food Policy Research Institute (IFPRI) (April 16, 2020), UNECA (April 24, 2020), World Bank (June 8, 2020), UNU-WIDER (June 12, 2020) and AfDB (July 7, 2020).Note: Does not include previous estimates released by the same institutions, including UNU-WIDER (April 2, 2020) and the World Bank (April 20, 2020).
0102030405060708090
100110120
Save the Children(April 9)
IFPRI(April 16)
UNECA(April 24)
World Bank(June 8)
UNU-WIDER(June 12)
AfDB(July 7)
Average
Medium or best guess estimate
Low estimate
High estimate
Figure 15. Projected impact of the economic shock on extreme monetary poverty in SSA, 2020(in millions of new poor based on $1.90/day in 2011 PPP by different organizations)
11 Among the institutions that have produced forecasts include the AfDB, IFPRI, Save the Children, UNECA, UNU-WIDER and the World Bank.

17
COVID-19: A Catastrophe for Children in Sub-Saharan Africa
40%
42%
44%
46%
48%
50%
52%
54%
56%
58%
60%
0
50
100
150
200
250
300
350
400
450
500
550
1980
1981
1982
1983
1984
1985
1986
1987
1988
1989
1990
1991
1992
1993
1994
1995
1996
1997
1998
1999
2000
2001
2002
2003
2004
2005
2006
2007
2008
2009
2010
2011
2012
2013
2014
2015
2016
2017
2018
2019
2020
# of extreme poor (left axis)
headcount ratio (right axis)
SSA is going through exceptional economic pain. Growth was at a snail’s pace before the pandemic surfaced. Then, over the course of a few months, more than 6% of per capita economic growth disappeared along with 1.5 decades of income progress. The year 2020 represents the first time that the region has gone through an economic recession. No country has been spared from the downturn, with the group of UMICs faring especially bad. Even more troubling is that things could deteriorate further.
The year 2020 may also mark the point in time when the absolute number of extreme poor in SSA surpassed 500 million. The projections presented in Figure 16 indicate that the total number of persons living in extreme monetary poverty may have risen from somewhere around 455 million in 2019 to 505 million in 2020. This would amount to a 3.4 percentage point change in the poverty headcount
The economic situation is impacting monetary poverty. Never has the region experienced such a swift and dramatic rise in extreme poverty. This includes both absolute terms – around 50 million people have likely been pushed into extreme poverty since the start of 2020 – and as a percentage change – an 11% increase. The current crisis is also vastly more destructive than the previous global crisis, with the impact on poverty potentially 10 times larger. The next chapter tries to see how these economic and monetary poverty forces, when combined with other shocks, could be impacting child well-being during 2020.
ratio, from 41.2% to 44.6%. In absolute terms, these estimates further suggest that there are almost twice as many extreme poor today than there were in 1990 when targets for the Millennium Development Goals (MDGs) were established (505 versus 280 million). This trend confirms that poverty reduction progress in SSA is not keeping pace with demographic forces.
3.5. Summary
Sources: Author’s estimates based on Figure 15, World Bank PovcalNet (accessed August 15, 2020) and UNDESA World Population Prospects (2019 Revision).Notes: (i) PovcalNet presents headcount ratios and population estimates for 16 individual years between 1981 and 2018; the other years are estimated through interpolation and nearest neighbor imputation; (ii) The 2019 estimate is based on a linear forecast of the regional headcount ratio for 2013, 2015 and 2018 (this predicts 41.2% in 2019 compared to 41.6% in 2018) and then applying this ratio to 2019 population estimates (this adjusts the 2018 population value in PovcalNet by the population growth rate estimate for 2019 from UNDESA); (iii) The 2020 estimate is derived by applying the average projected increase in the number of extreme poor as presented in Figure 15 (50.6 million persons) to the number of poor estimated for 2019 and again adjusting the total population based on the UNDESA population growth rate estimate.
Figure 16. Extreme monetary poverty trends and projections in SSA, 1980-2020 (in millions and % of persons living below $1.90/day in 2011 PPP)
18
COVID-19: A Catastrophe for Children in Sub-Saharan Africa
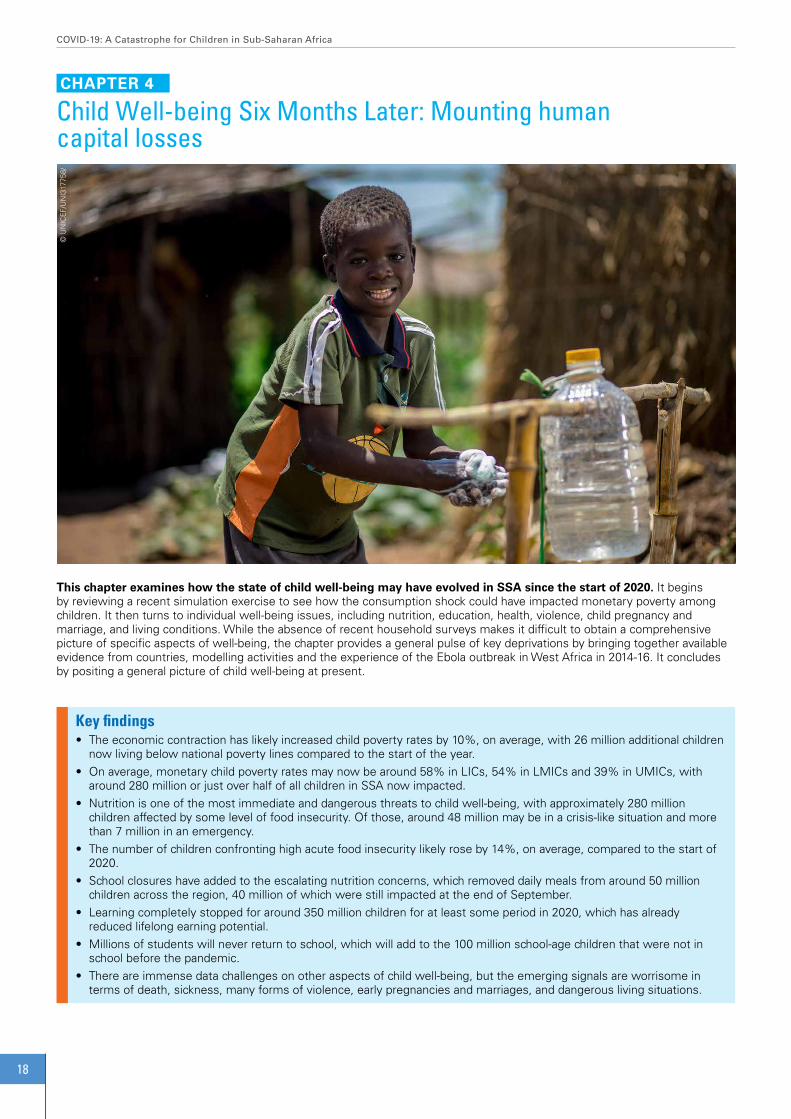
This chapter examines how the state of child well-being may have evolved in SSA since the start of 2020. It begins by reviewing a recent simulation exercise to see how the consumption shock could have impacted monetary poverty among children. It then turns to individual well-being issues, including nutrition, education, health, violence, child pregnancy and marriage, and living conditions. While the absence of recent household surveys makes it difficult to obtain a comprehensive picture of specific aspects of well-being, the chapter provides a general pulse of key deprivations by bringing together available evidence from countries, modelling activities and the experience of the Ebola outbreak in West Africa in 2014-16. It concludes by positing a general picture of child well-being at present.
Child Well-being Six Months Later: Mounting human capital losses
CHAPTER 4
Key findings• Theeconomiccontractionhaslikelyincreasedchildpovertyratesby10%,onaverage,with26millionadditionalchildren
now living below national poverty lines compared to the start of the year.• Onaverage,monetarychildpovertyratesmaynowbearound58%inLICs,54%inLMICsand39%inUMICs,with
around 280 million or just over half of all children in SSA now impacted.• Nutritionisoneofthemostimmediateanddangerousthreatstochildwell-being,withapproximately280million
children affected by some level of food insecurity. Of those, around 48 million may be in a crisis-like situation and more than 7 million in an emergency.
• Thenumberofchildrenconfrontinghighacutefoodinsecuritylikelyroseby14%,onaverage,comparedtothestartof2020.
• Schoolclosureshaveaddedtotheescalatingnutritionconcerns,whichremoveddailymealsfromaround50millionchildren across the region, 40 million of which were still impacted at the end of September.
• Learningcompletelystoppedforaround350millionchildrenforatleastsomeperiodin2020,whichhasalreadyreduced lifelong earning potential.
• Millionsofstudentswillneverreturntoschool,whichwilladdtothe100millionschool-agechildrenthatwerenotinschool before the pandemic.
• Thereareimmensedatachallengesonotheraspectsofchildwell-being,buttheemergingsignalsareworrisomeinterms of death, sickness, many forms of violence, early pregnancies and marriages, and dangerous living situations.
© U
NIC
EF/
UN
I317
758/

19
COVID-19: A Catastrophe for Children in Sub-Saharan Africa
The economic shock has led to record increases in the number of children living in monetary poverty in SSA. To better understand these dynamics, UNICEF and Save the Children developed a methodology that improves on the simulations discussed in Chapter 3.12 Drawing on the available estimates for countries in the region, an additional 26 million 0-17-year-olds may now be living in households that consume less than the national poverty line compared to the start of the year, which amounts to a 10% annual increase, on average (Figure 17; see also Appendix, Figure
Bad weather, pests, trade and transport disruptions, market restrictions, job losses and insecurity have created a nutrition crisis for millions of children in SSA. Taking the latest data from the Integrated Food Security Phase Classification (IPC) and World Food Programme (WFP), an estimated 280 million children – or more than one in every two in the region – could be dealing with some level of food insecurity as a result of different shocks during the second half of 2020 (Figure 18). Of those, around 48 million
The impact on monetary child poverty varies widely across countries. Of the 41 SSA countries included in the UNICEF and Save the Children simulation exercise, 22 are predicted to be experiencing a spike of at least 10% in the number of children now living below national poverty lines, with five countries at 20% or more (Cabo Verde, Mali, Mauritania, Mozambique, Namibia) (see also Figure 17). In line with the biggest economic contractions, the group of
D). These trends would further cause the average child poverty rate in SSA to climb from 49% in 2019 to 54% in 2020 (or from 46% to 51% on a population-weighted basis), pointing to an updated regional total of more than 280 million children. Data on monetary child poverty is unavailable over time. However, in line with the overall poverty trends presented in Chapter 3, it is reasonable to assume that the increase in 2020 is a historical high in both absolute and percentage change terms for children.
children – or just under 10% of the regional total – could be considered in a crisis-like situation, defined as an IPC Phase 3 or higher. In nine countries – five of which are MICs – at least 20% of the child population may be experiencing acute food insecurity.14 Even more worrisome, 7.5 million children across 23 countries could be in an emergency situation (IPC Phase 4), while parts of the Democratic Republic of the Congo, Nigeria and South Sudan have recently shown risks for famine (Lederer 2020).
UMICs is predicted to have the steepest increases in child poverty: 13%, on average, compared to around 10% in both LICs and LMICs. This would push the average rate to 58% of children in LICs, 54% in LMICs and 39% in UMICs (see also Appendix, Figure D). As described at the outset of Chapter 2, monetary poverty is only a small part of the way that shocks impact children, and the following sections turn to specific aspects of child well-being.
4.1. Monetary poverty
4.2. Hunger and malnutrition
12 Compared to the projection exercises presented in Chapter 3.4, this methodology uses national definitions of poverty (rather than the international poverty line), controls for the distributional effects of the shock on the population (recognizing that all consumption deciles are not impacted equally) and presents country-specific estimates (not just regional aggregates).
13 The projections that look at changes in total poverty as presented in Chapter 3 and the changes in child poverty as presented here cannot be compared because of methodological differences, which include different definitions of poverty among others. See previous footnote.
14 These include Central African Republic (LIC), Comoros (LMIC), DRC (LIC), Eswatini (LMIC), Lesotho (LMIC), South Africa (UMIC), South Sudan (LIC), Sudan (LIC) and Zimbabwe (LMIC).
Source: UNICEF and Save the Children (June 29, 2020) and UNDESA World Population Prospects (2019 Revision).Notes: (i) The simulation accounts for the proportion of children living in poor households as defined by national standards (combining the proportion of the population living below the national poverty line with data from MICS and DHS on the distribution of children by deciles); (ii) The country estimates reflect the most pessimistic scenario, which is based on a combination of two factors: (a) the worst per capita GDP projection released by either the IMF or World Bank in their June 2020 updates and (b) a full distribution effect of the GDP shock, which applies actual observed changes of the historical distribution of consumption by decile based on UNU-WIDER’s World Income Inequality Database (May 2020 Update); (iii) Projections are unavailable for five developing countries in SSA (Angola, Central African Republic, Equatorial Guinea, Eritrea, Somalia); (iv) Country-level projections had not been publicly released at the time of publication.
-6.6
2.0 2.7 2.8 3.2 4.0 4.7 5.1 5.3 5.5 5.86.9 7.2 8.0 8.2 8.4 8.5 9.2 9.2 10 10 10 10 10 11 11 11 12 12 13 13
15 15 16 1617
2021 21
2324
10 1013
10 10
-10.0
-5.0
0.0
5.0
10.0
15.0
20.0
25.0
30.0
-1.0
0.0
1.0
2.0
3.0
4.0
5.0
6.0
7.0
8.0
9.0 absolute change (in millions) (left axis)
% change (right axis)
Figure 17. Monetary child poverty projections in SSA countries, 2020 (annual change in millions and % 0-17-year-olds based on national poverty lines)
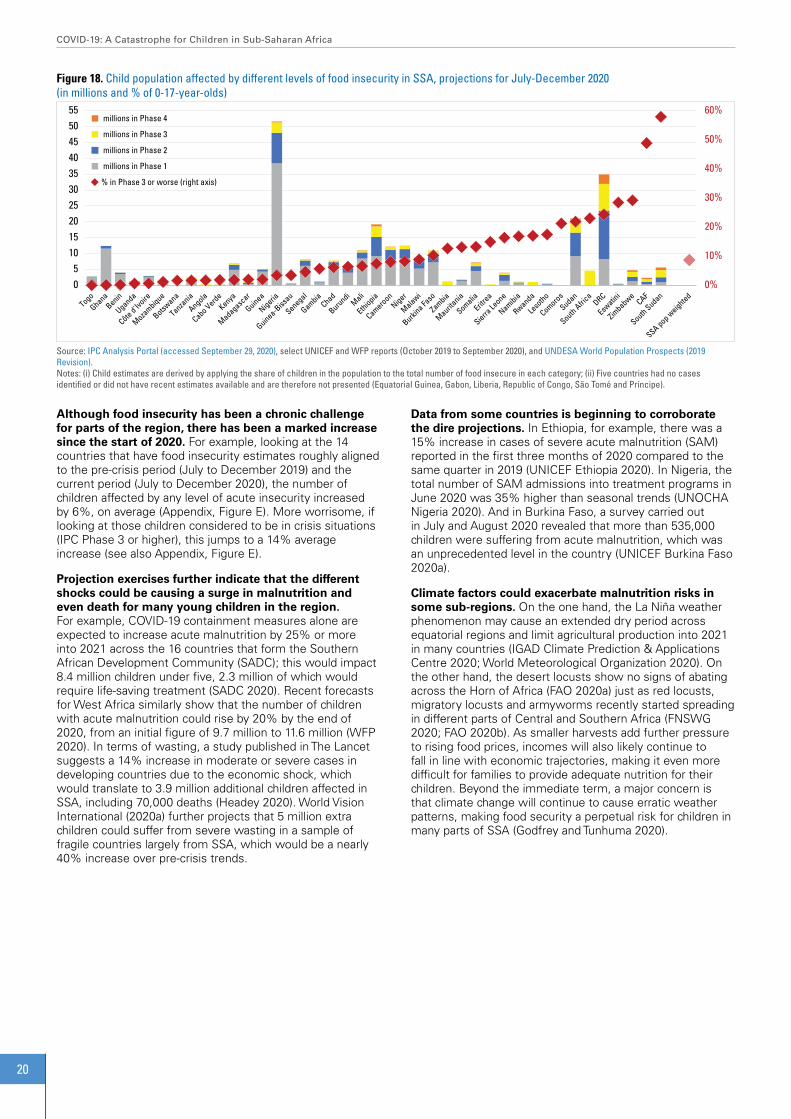
20
COVID-19: A Catastrophe for Children in Sub-Saharan Africa
0%
10%
20%
30%
40%
50%
60%
05
10152025303540455055
millions in Phase 4
millions in Phase 3
millions in Phase 2
millions in Phase 1
% in Phase 3 or worse (right axis)
Figure 18. Child population affected by different levels of food insecurity in SSA, projections for July-December 2020(in millions and % of 0-17-year-olds)
Source: IPC Analysis Portal (accessed September 29, 2020), select UNICEF and WFP reports (October 2019 to September 2020), and UNDESA World Population Prospects (2019 Revision).Notes: (i) Child estimates are derived by applying the share of children in the population to the total number of food insecure in each category; (ii) Five countries had no cases identified or did not have recent estimates available and are therefore not presented (Equatorial Guinea, Gabon, Liberia, Republic of Congo, São Tomé and Príncipe).
Although food insecurity has been a chronic challenge for parts of the region, there has been a marked increase since the start of 2020. For example, looking at the 14 countries that have food insecurity estimates roughly aligned to the pre-crisis period (July to December 2019) and the current period (July to December 2020), the number of children affected by any level of acute insecurity increased by 6%, on average (Appendix, Figure E). More worrisome, if looking at those children considered to be in crisis situations (IPC Phase 3 or higher), this jumps to a 14% average increase (see also Appendix, Figure E).
Projection exercises further indicate that the different shocks could be causing a surge in malnutrition and even death for many young children in the region. For example, COVID-19 containment measures alone are expected to increase acute malnutrition by 25% or more into 2021 across the 16 countries that form the Southern African Development Community (SADC); this would impact 8.4 million children under five, 2.3 million of which would require life-saving treatment (SADC 2020). Recent forecasts for West Africa similarly show that the number of children with acute malnutrition could rise by 20% by the end of 2020, from an initial figure of 9.7 million to 11.6 million (WFP 2020). In terms of wasting, a study published in The Lancet suggests a 14% increase in moderate or severe cases in developing countries due to the economic shock, which would translate to 3.9 million additional children affected in SSA, including 70,000 deaths (Headey 2020). World Vision International (2020a) further projects that 5 million extra children could suffer from severe wasting in a sample of fragile countries largely from SSA, which would be a nearly 40% increase over pre-crisis trends.
Data from some countries is beginning to corroborate the dire projections. In Ethiopia, for example, there was a 15% increase in cases of severe acute malnutrition (SAM) reported in the first three months of 2020 compared to the same quarter in 2019 (UNICEF Ethiopia 2020). In Nigeria, the total number of SAM admissions into treatment programs in June 2020 was 35% higher than seasonal trends (UNOCHA Nigeria 2020). And in Burkina Faso, a survey carried out in July and August 2020 revealed that more than 535,000 children were suffering from acute malnutrition, which was an unprecedented level in the country (UNICEF Burkina Faso 2020a).
Climate factors could exacerbate malnutrition risks in some sub-regions. On the one hand, the La Niña weather phenomenon may cause an extended dry period across equatorial regions and limit agricultural production into 2021 in many countries (IGAD Climate Prediction & Applications Centre 2020; World Meteorological Organization 2020). On the other hand, the desert locusts show no signs of abating across the Horn of Africa (FAO 2020a) just as red locusts, migratory locusts and armyworms recently started spreading in different parts of Central and Southern Africa (FNSWG 2020; FAO 2020b). As smaller harvests add further pressure to rising food prices, incomes will also likely continue to fall in line with economic trajectories, making it even more difficult for families to provide adequate nutrition for their children. Beyond the immediate term, a major concern is that climate change will continue to cause erratic weather patterns, making food security a perpetual risk for children in many parts of SSA (Godfrey and Tunhuma 2020).

21
COVID-19: A Catastrophe for Children in Sub-Saharan Africa
0%10%20%30%40%50%60%70%80%90%100%
0.0
2.0
4.0
6.0
8.0
10.0
12.0 # of children missing school meals (left axis)
children missing meals as % of 5-14 population (right axis)
Figure 19. Students missing out on school meals in SSA countries, end of September 2020 (in millions and as a % of the 5-14 population)
Sources: WFP Global Monitoring of School Meals During COVID-19 School Closures (accessed September 29, 2020) and UNDESA World Population Prospects (2019 Revision).Notes: (i) Countries that do not have data or where school meals were active at the end of September are not shown; (ii) The age range of children that benefit from the school meal programs captured in the database was unavailable, so the 5-14 population was used as a proxy to estimate the relative size of children affected across countries – *Eswatini is the lone exception, which covers the 5-17 population.
Education is another area of child well-being that has been impacted during 2020. School closures have caused the number of children and adolescents not going to school to rise from around 100 million before the pandemic to 350 million (UNICEF 2020a). Two-thirds of those students had no potential to be reached by any type of remote learning method. When considering the low levels of education of most parents (e.g. one of out of every three adults in SSA cannot read or write a short statement15) and the limited availability of resources to support home-based learning (e.g. around half of the population is dealing with extreme poverty as described in Chapter 3.4), it is safe to assume that learning completely stopped for nearly every child in SSA for at least some period. Moreover, at the end of September 2020, schools were fully open in just eight countries, which means that lost learning time was continuing to accumulate for most children.16
Even short-term learning gaps have severe, lifelong consequences. For instance, school interruptions of just a few months can impact the future income-earning potential of a student (Azevedo et al. 2020). But much more alarming is that learning has permanently stopped for many students. This occurred in the aftermath of Ebola, including in Liberia and Sierra Leone where 27% and 13% of students, respectively, never returned once schools reopened. And this was mainly due to economic challenges, including the inability to pay for school fees as well as the need for children to contribute to household income to help make ends meet (Hoogeveen and Pape 2020). These are likely to
COVID-19 has impacted both the supply and demand for healthcare services during 2020. The main causes include: (i) human resources, including staffing availability and heavy workloads; (ii) accessibility, including mobility restrictions, facility closures or repurposing, suspension of outreach
be common challenges in the current context, as indicated in places like Niger where a UNICEF partner identified 162 girls in June 2020 that had not returned to school due to child labor and parental neglect, among other factors (UNICEF Niger 2020).
Modelling exercises underscore the long-term dangers of being out of school even temporarily. At a global level, the World Bank estimated that 7 million primary and secondary students would never go back to school due to the income impacts of the pandemic (Azevedo et al. 2020). And for the students who do eventually return, a three-month learning gap could result in a full year of lost learning over time (Kaffenberger 2020). This suggests that education is likely to be a permanent rather than a temporary deprivation for many children in SSA.
School closures are also aggravating nutrition concerns. Many children and youth in the region rely on free or discounted meals and snacks provided at school. Naturally, nutrition is compromised when schools are not open. At the peak of school closures in April 2020, more than 50 million students in 40 countries were missing out on a daily meal or more of nutrition.17 Six months later, more than 40 million students across 34 countries were still not benefiting from school meals (Figure 19). In places like Burkina Faso, Eswatini, Lesotho, Malawi, Namibia, São Tomé and Príncipe, and Zimbabwe, this nutrition loss was impacting more than 50% of younger students.
services and stockouts; (iii) fear and/or misinformation in communities; and (iv) resources, both government funding constraints to deliver services in hard-to-reach areas as well as the inability of users to cover out of pocket costs.18
4.3. Out of school and not learning
4.4. Sickness and death
15 Reflects latest available adult literacy rates for all countries, which include 65% for SSA, on average, ranging from 53% in LICs to 72% in LMICs and 89% in UMICs. Author’s calculations based on UNESCO Institute for Statistics (accessed September 15, 2020) and UNDESA World Population Prospects (2019 Revision).
16 Based on UNESCO Global Monitoring of School Closure Caused by COVID-19 (accessed September 29, 2020), this included Botswana, Central African Republic, Gambia, Guinea, Mauritania, Rwanda, South Africa and Tanzania; 15 countries were also in academic break.
17 Author’s calculations based on WFP Global Monitoring of School Meals During COVID-19 School Closures (accessed September 29, 2020 and UNDESA World Population Prospects (2019 Revision).
18 Based on insights shared by UNICEF staff and Ministry of Health focal points from select countries in Eastern and Southern Africa as of August 2020.
22
COVID-19: A Catastrophe for Children in Sub-Saharan Africa
The Ebola experience demonstrated the dangers of reduced access on child health. In Liberia, for example, immunization rates fell in half and measles cases spiked (Wesseh et al. 2017). In Guinea, there was a 60% drop in the number of children seen for acute respiratory infections and diarrhea in many public health facilities and hospitals (Barden-O’Fallon 2015). And in high prevalence areas of Sierra Leone, antenatal visits dropped by around 30% and postnatal care visits by more than 20% when comparing peak and pre-outbreak periods (Schwartz 2018).
In the current context, various organizations have tried to predict the potential scale of health risks to children. World Vision International (2020a), for instance, estimated that around 26 million children in a sample of fragile countries largely from SSA could be exposed to fatal diseases due to lower immunization services and difficulties accessing anti-malarial medication due to COVID-19. Zooming in on malaria in endemic regions of Africa, the WHO (2020a) concluded that malaria mortality could double under a scenario of severe disruptions to control efforts, causing an additional 266,000 under-five deaths in one year.19 And a study by the Johns Hopkins University showed that up to 1.8 million children in all LICs and LMICs could die over a 12-month period due to routine healthcare interruptions caused by COVID-19 (Roberton et al. 2020).
Select country-level information suggests that healthcare access challenges are indeed prominent and likely impacting children’s health in the region. A rapid survey carried out in June and July 2020 by Save the Children in 37 developing countries (11 of which are from SSA) offers a general sense. In this, nine in ten respondents reported that their access to healthcare, medicine and medical supplies had been impacted due to the pandemic, with 45% noting that children were unable to access regular health and rehabilitation services (Edwards 2020). More specific examples are presented below.
• Burkina Faso: As of June 2020, around 300 health facilities in five of the most affected regions (or nearly one-quarter) were non-functional or providing only minimum service, which had reduced or stopped access to health services for more than 1.5 million people (UNOCHA Burkina Faso 2020).
• Kenya: Between March and May 2020, health facilities reported a 30% decline in outpatient visits, a 40% decline in attendance of persons with chronic conditions and a
significant drop in gynecology visits (UNOCHA 2020a).
• Malawi: A phone survey carried out during May and June 2020 found that 10% of households that needed medical treatment were unable to access it (Malawi, National Statistical Office and World Bank 2020).
• Mozambique: As of August 2020, 37 of 130 health facilities in Cabo Delgado Province were closed, which left more than 700,000 persons without access, while cholera and vaccination campaigns had also been suspended (UNOCHA Mozambique 2020).
• Nigeria: According to a phone survey conducted in July 2020, around one in five households with children under five who needed or were due for immunizations were unable to get them due to lack of available medical personnel and movement restrictions (World Bank 2020b).
• Sudan: More than 80% of the population did not have access to a functional health center within two hours of their home as of August 2020, with stock outs of medical supplies widely reported and over 110,000 children not receiving essential vaccines (UNOCHA 2020a).
• Uganda: Based on a phone survey conducted in June 2020, one out of three households that needed medicine and 20% of households that needed medical treatment could not access it, mainly due to lack of money and lack of transportation (World Bank 2020c).
• Zimbabwe: The proportion of districts reporting at least 80% of routine immunizations declined from 90% in December 2019 to less than 60% at the end of June 2020, while there was a 45% decline in the number of women’s fourth antenatal care visits when comparing the April to July periods in 2019 and 2020 (UNOCHA Zimbabwe 2020).
• Kenya, Lesotho, Malawi, Nigeria, Sierra Leone, South Africa and Zimbabwe: These are some of the countries whose health services were impacted by striking doctors, nurses and laboratory technicians in response to dangerous working conditions and/or low pay since the start of the year.20 Service availability had also been impacted by illness among healthcare workers. As of August 2020, close to 40,000 professional staff had been infected by COVID-19 (WHO 2020b), which amounted to around 3% of all healthcare workers in SSA.21
19 See also Weiss et al. (2020).20 See Latif Dahir (2020) for Kenya, Momoh (2020) for Nigeria, Mwangi (2020) for Sierra Leone, and UNOCHA (2020b) updates on July 10 for Lesotho, July 31 for Malawi, August 14 for
Zimbabwe and September 11 for South Africa.21 Author’s calculation based on WHO Global Health Workforce Statistics (December 2018 Update) and UNDESA World Population Prospects (2019 Revision). Applies latest available
estimate of physicians and nurses and midwives per 1,000 people for each country to 2020 population projections, which projects approximately 250,000 physicians and 1.1 million nurses and midwives in SSA in 2020.
The pandemic has significantly raised the already elevated risks for violence and abuse against girls and boys in the region. Before the current crisis, somewhere around 57 million acts of sexual, physical and emotional abuse were perpetrated against children in SSA every month, which affected approximately half of the child population (Hillis et al. 2016). Now consider a long list of new risk factors triggered by COVID-19. These range from economic stressors and stay-at-home measures to over-crowded settings and increased consumption of alcohol and other substances, to limited access to support networks as well as prevention and response services. These factors, especially when combined, are likely to increase the
incidence of all types of violent acts along with the amount of time that children are exposed to abusers (Child Rights Now! 2020).
Past evidence and recent modelling suggest that the uptick in violence could be significant. There are similar experiences in West Africa. For example, focus group discussions in Sierra Leone indicated that the levels of violence against children may have risen by 55% during or after Ebola (Risso-Gill and Finnegan 2015). In the current context, the United Nations Population Fund (UNFPA 2020) estimated that an additional 5 million cases of gender-based violence (GBV) could occur globally for each
4.5. Violence against children and women
23
COVID-19: A Catastrophe for Children in Sub-Saharan Africa
22 Further analysis is required before drawing conclusions on the specific impact of COVID-19. On the one hand, teenage pregnancy rates have been historically high in Kenya. On the other hand, most teenage girls do not visit antenatal clinics until the second semester of a suspected pregnancy, which means that more reliable data would not emerge until July/August and onwards.
COVID-19 is exacerbating other important risks to child well-being, including pregnancy and marriage. Experiences from Ebola underscore these concerns. In Sierra Leone, for example, pregnancy rates among girls aged 12 to 17 were 11% higher in villages that were heavily impacted by the Ebola virus compared to those that were only lightly affected (Bandiera et al. 2019). Other reports suggest that the number of adolescent pregnancies doubled due to the outbreak and school closures (UNICEF 2020b), reaching as high as 65% in the regions most affected (UNDP and Irish Aid 2015). Evidence from multiple countries in West Africa further shows that early marriage was a common practice that was exacerbated by the epidemic (Fraser 2020). In many instances, girls were found to marry as a way to generate household income or because of unwanted pregnancy (Risso-Gill and Finnegan 2015), the latter which was at least partly due to school closures (Kostelny 2016).
A variety of modelling exercises shed light on the possible magnitude of these problems in the current context. In terms of pregnancies, UNFPA (2020) predicted that a lockdown of 12 months could leave close to 50 million women in developing countries without access to contraceptives and result in around 15 million additional unintended pregnancies. The Global Financing Facility (2020) ended up with a similar figure: up to 16 million unintended pregnancies across developing countries or 4.5 million in 40 countries in SSA. And with a focus on SSA, World Vision International estimated that the impact of school closures could increase teenage pregnancy by as much as 65% and also block up to 1 million girls from returning to school (Baker 2020). Turning to child marriage, UNFPA (2020) concluded that the impacts of COVID-19 on the economy and prevention programs could lead to 13 million child marriages globally over the next decade, adding to the
month that a lockdown is in place – or more than 30 million cases during a six-month-period. World Vision International (2020b) also predicted that between 11 and 18 million girls and boys in SSA could be exposed to sexual, physical and/or emotional violence due to COVID-19 quarantines.
Although recent data remain scarce, disturbing signs are emerging. The same Save the Children survey referenced in the previous section also presents an overall picture of these protection issues, with one-third of households reporting physical or emotional violence in their home since the start of the pandemic (Edwards 2020). Some country-specific examples are provided below.
• Burkina Faso: An assessment of child protection issues conducted in three regions in June 2020 found that 32% of children perceived an increase in domestic violence against girls and boys as a result of confinement at home (UNICEF Burkina Faso 2020b).
• Ghana: A U-report poll conducted by UNICEF among 1,500 adolescent and young people in May 2020 indicated a 32% increase in the prevalence of abusive and violent behavior at home compared to levels in February 2020 (UNICEF Ghana 2020).
• Kenya: More than 3,500 rape cases against children were recorded in health facilities between March and June 2020, with many of the poorest counties showing a 30% increase compared to the previous year (UNOCHA Kenya 2020). Calls to the national GBV hotline also mushroomed by nearly 800% when comparing pre- and post-COVID containment periods
150 million that are already expected to occur. Of the additional marriages, World Vision International (2020b) expects at least 4 million to take place over the next two years.
Reliable data on early pregnancies and marriages was a challenge before the crisis, but the picture painted by available information is alarming for many girls in the region. Some snapshots are provided below.
Adolescent pregnancies
• Kenya: More than 150,000 teenage girls became pregnant over a three-month-period during the economic lockdown, which amounts to a 40% jump (Partridge-Hicks 2020). Health facilities in select counties also experienced 80% or more increases in teenage pregnancies between March and June 2020 compared to the same period in 2019 (UNOCHA Kenya 2020).22
• Malawi: In July 2020, the Health Principal Secretary noted a potential 35% increase in the number of pregnancies among girls between the ages of 10 and 19 in the first half of 2020 compared to a year earlier (Davies 2020), with worrisome reports in many districts, including Machinga, Mangochi and Phalombe (Agence France Presse 2020).
• Sierra Leone: Teenage pregnancy was identified as a key concern during COVID-19 among close to 30% of respondents to a rapid survey conducted in May 2020 (Street Child 2020).
• Uganda: The number of adolescent pregnancies reportedly doubled in the Nwoya district when comparing January to March and April to June 2020 trends (Edwards 2020).
(United Nations Country Team Kenya 2020). In addition, nearly one in four respondents to a June 2020 phone survey reported having witnessed or heard cases of domestic violence in their communities since the introduction of containment measures (Kenya, National Bureau of Statistics 2020a).
• Madagascar: According to a survey conducted by the Ministry of Population and UNFPA, COVID-19 significantly increased GBV cases, with more than 2,000 claims of physical, psychological, economic violence and sexual violence reported (UNOCHA 2020a).
• Malawi: Calls to the national youth hotline (Child Helpline) regarding child rape jumped by 150% under the lockdown period when compared to 2019 (Rigby 2020).
• South Africa: The GBV command center received more than 7,100 calls in April 2020, which marked a 60% spike compared to March before the national lockdown was imposed (UNOCHA 2020b).
• Uganda: In the Nwoya district, the number of cases of violence against children was reported to significantly increase when schools closed at the end of March 2020 (Edwards 2020).
• Zimbabwe: From the start of the lockdown at the end of March to mid-July 2020, the national GBV Hotline (Musasa) recorded around 4,600 GBV cases, which was a 60% increase compared to pre-lockdown trends (UNOCHA Zimbabwe 2020).
4.6. Child mothers and wives

24
COVID-19: A Catastrophe for Children in Sub-Saharan Africa
Child marriages• DRC: Almost 20% of respondents to a rapid survey
conducted in May 2020 identified forced marriage as a major risk due to the pandemic (Street Child 2020).
• Malawi: Although the country already had one of the highest child marriage rates globally, the Civil Society Coalition on Education noted in July 2020 that the pandemic had led to a surge in underage unions, potentially doubling in some areas
(Agence France Presse 2020). Child Helpline also recorded 669 child marriage cases between April and June, which was an increase of more than 80% compared to 2019 (Rigby 2020).
• Uganda: According to police reports, the number of child marriage cases more than doubled when comparing the three-month periods before and after the lockdown in the first half of 2020 (Edwards 2020).
The pandemic, climate and conflict shocks have also resulted in loss of shelter and forced many children into dangerous living situations. One driver is falling income. In Kenya, for example, around one in three households could not pay rent in May 2020, with less than 7% receiving any type of relief or partial waiver from landlords (Kenya, National Bureau of Statistics 2020b). In Nigeria, the number of eviction cases of households living in informal camps rose between May and June 2020, as COVID-19 restriction measures made it difficult to cover rent (UNOCHA Nigeria 2020). Another report estimated that 75,000 persons were forcibly evicted from their homes in Ethiopia, Kenya, Somalia and South Sudan in the first half of 2020 (Norwegian Refugee Council 2020). In such cases, many families likely moved in with relatives in already crowded spaces or relocated to rural areas where a whole range of child well-being factors would be negatively impacted, especially those linked to accessing basic services.
In other instances, job losses are causing migrants to return to their countries of origin and creating concerns for accompanying children. Zimbabwe is one example. Between June and mid-September 2020, more than 18,000 migrants returned from neighboring countries, which included many boys and girls (UNOCHA Zimbabwe 2020). Nearly 1,000 Malawians also came back from South Africa in August and September 2020, of which at least 15% were children (UNOCHA 2020b).
School closures are another cause. In Niger, for example, since COVID-19 emerged in March 2020, over 7,000 children who had been in Koranic schools in Nigeria arrived at the border when Nigeria closed all schools and sent the children home (UNICEF Nigeria 2020).
The living situation of many more children is being upended by floods and violence. Some illustrations are provided below.
Child well-being has faced a lot of challenges during 2020 in SSA, especially related to consumption, nutrition and education. The economic shock likely increased the percentage of children living in monetary poor households by 10%, on average, pushing the regional total to more than 280 million. On the nutrition front, 280 million children may be dealing with food insecurity, 48 million of which could be in crisis, which represents a big uptick since the start of the year. School closures also meant that around 350 million children were not going to school for at least some time during 2020, with millions of students unlikely to return. The human capital losses from just these channels are staggering for the region.
• Burkina Faso: Around 500,000 internally displaced persons were in critical need of shelter, as of June 2020 (UNOCHA Burkina Faso 2020).
• Burundi: Heavy rains and flooding in April 2020 swept away thousands of homes, businesses and crops, displacing around 18,000 people (UNOCHA Burundi 2020).
• DRC: Between January and May 2020, torrential rains displaced around 60,000 people and destroyed another 30,000 houses in different regions (UNOCHA 2020c). In addition, more than 3,000 Congolese refugees arrived in Uganda in early July 2020, of which two-thirds were children (UNOCHA 2020a).
• Mozambique: Insecurity and violence in Cabo Delgado Province progressively worsened during 2020 and had displaced more than 250,000 persons as of September 2020 (UNOCHA Mozambique 2020).
• Niger: In June 2020, more than 60,000 migrants were stranded in overcrowded reception and transit centers, many of which were children (UNOCHA Niger 2020).
• Somalia: More than 250,000 people were affected by floods between June and August 2020 (UNICEF Somalia 2020).
• South Sudan: Between July and September 2020, some 700,000 people were displaced and considered in crisis due to the worst flooding in 60 years, with reports of significant conflict in many states also causing displacement (UN 2020).
• Sudan: Floods damaged or destroyed homes, affecting more than 860,000 persons, between July and September 2020 (UNOCHA Sudan 2020a). Violence was also recently picking up and affecting housing stability. For example, an attack on July 25, 2020 in Masteri Town resulted in widespread burning of houses and left 1,500 families displaced (UNOCHA Sudan 2020b).
Projections and emerging country-level information present equally troubling images for other areas of child well-being. When factoring in the compounding effects from COVID-19, climate and conflict shocks, alongside the high levels of pre-existing vulnerabilities, there is no question that children are being impacted by basic health threats, like diarrhea and malaria, by sexual, physical and emotional abuse, by early pregnancy and early marriage, by unsafe living conditions, and by negative outcomes not investigated in this chapter, such as depression and child labor. The more important question is: How can the damage be reversed and millions more be protected from these impacts? The hopeful news is that a policy tool exists that – if quickly and effectively utilized – can help mitigate and prevent many of the ongoing threats to child well-being across the region.
4.7. Loss of shelter and unsafe living conditions
4.8. Summary

25
COVID-19: A Catastrophe for Children in Sub-Saharan Africa
This chapter explores the potential for cash transfers to protect child well-being and support economic recovery in SSA. Cash transfers – a critical component of social protection – refer to regular direct payments from a government or development partner to an individual, which could take the form of a deposit into a bank account, a mobile money account or a debit/smart card or the distribution of hard currency or a paper voucher. The chapter starts by summarizing the evidence on the benefits of cash transfers. It then looks at the state of cash programming in the region before the pandemic as well as its role in the crisis response, including in the broader context of fiscal stimulus programs. Next, it presents a simulation exercise that estimates the costs and benefits of providing cash to all households with young children. It then turns to the financing question, looking at both domestic and external funding opportunities. The chapter concludes by summarizing the takeaways.
Cash Transfers: A lifeline for children and economies?CHAPTER 5
Key findings• Asacriticalcomponentofnationalsocialprotectionsystems,cashtransferscangeneratestrongeconomicandsocial
returns, including preventing or minimizing most of the well-being risks facing children, and should be at the center of crisis response and recovery plans.
• Althoughgrowinginrecentyears,onaverage,cashtransferprogramsonlysupported10%ofthepopulationinSSAbefore the crisis. In 24 countries, coverage was even lower, below 5% of the population.
• Theexpansionofcashtransferprogramshasbeenapopularpolicyobjectiveduring2020,buttheimpacthasbeenseverely undermined by the lack of funding. Available data suggest that, if implemented, announced government expansions could temporarily boost coverage by 8%, on average, reaching 11% of the population in select LICs and 18% in select LMICs.
• Apolicystancethatprovidescashtoallchildrenunderfiveforaperiodofsixmonthscouldboostpercapitaeconomicgrowth by 2.4%, on average; 12 months of support could push most economies back into positive territory and safeguard human capital.
• Theexpansionofnationalcashtransferprogramscanbefinancedbycombiningdomesticandexternalresources.However, addressing critical gaps requires that international financial institutions provide most of the support, including by re-programming funding that has not been disbursed, targeting immediate debt relief benefits and approving new emergency funding.
© U
NIC
EF/
UN
I325
790/
Abd
ul

26
COVID-19: A Catastrophe for Children in Sub-Saharan Africa
The global and regional evidence on the benefits of cash transfers, especially unconditional approaches, is overwhelming. Most importantly, this applies both directly and indirectly to all areas of child well-being that are currently under duress in SSA, as presented in Chapter 4. A rapid summary of the main impacts is provided below.23
• Monetary poverty: Cash transfers increase total expenditure, thereby contributing to poverty reduction at the individual and household level.
• Hunger and malnutrition: Cash transfers increase food expenditure, which provides families with the opportunity to increase meal frequency and dietary diversity as well as improve complementary feeding among young children. They also help remove financial barriers to access essential services, including nutrition, health, education and WASH, which further contribute to better nutrition among children.
• Out of school and not learning: Cash transfers help families pay for the direct and indirect costs of sending their children to school (enrolment and recurring fees, transportation, books, uniforms, shoes, etc.), which raises school attendance and supports the transition to higher grades. They can also incentivize the return to school after dropout.
• Sickness and death: Cash transfers increase the likelihood and frequency that family members use healthcare services when sick and that children get immunizations and medicines.
• Violence against children and women: Cash transfers address some of the underlying economic causes of violence, exploitation and abuse and therefore have an indirect effect on child protection outcomes. Cash transfers also reduce physical abuse among women and increase their decision-making power while contributing to better life satisfaction and stronger social support networks.
• Child mothers and wives: Cash transfers improve girls’ and women’s control and choices over their sexual debut, engagement in risky sexual activity and early or forced marriage, among others. These outcomes are further bolstered when cash plays a role in keeping girls in school.
• Loss of shelter and unsafe living conditions: Cash transfers help families strengthen the quality of their homes as well as to rebuild them following destruction or displacement. Where renting, they can also help families avoid eviction during difficult times.
• Other: There is bountiful evidence on the positive impacts of cash transfers on other areas of child well-being not investigated in Chapter 4, such as: (i) improving mental health (e.g. lower stress, higher aspiration); (ii) contributing to HIV/AIDS prevention, treatment adherence and care (by alleviating the underlying causes of infection risk and support); and (iii) increasing birth registration.
Beyond the benefits on monetary poverty and areas of child well-being, cash transfers improve household productivity and catalyze economic activity. On the supply side, the evidence is very strong on their role in increasing savings as well as investing in productive assets, such as livestock and farming equipment. This enables households to produce more goods and services, thereby expanding economic output, and further helps to diversify income sources, which strengthens household resilience to future shocks. At the same time, cash programs give households new resources that can be spent. This creates a new demand for goods and services, thereby boosting the overall consumption base.
Cash transfers can also yield strong economic multiplier effects by impacting supply and demand forces. The magnitude depends on many factors, ranging from program coverage and the size and duration of the transfer to the structure and responsiveness of local markets. Nonetheless, experiences from SSA show that the effects can be substantial. For instance, every $1 transferred to beneficiaries of cash transfer programs in Zambia and Zimbabwe was found to generate around $1.75 of economic activity, which reached $2.50 or more in programs in Ethiopia, Ghana and Kenya.24 Taking the former example, this means that every $1 transferred results in an additional $0.75 of benefits for the local economy, which is largely due to increased demand for goods and services in retail and agriculture sectors that involve other households. In fact, if reviewing available evidence from 10 programs in the region, the average nominal income multiplier is 1.91 – or nearly double the value of the transfer.25 This further underscores an important feature of cash transfers: both program recipients and non-recipients benefit.
Cash transfers can further help governments achieve future savings. For example, proactively investing in resilience programs, including cash transfers, in the early onset of a shock has been estimated to save up to 30% in future emergency assistance needs and avoided losses in several countries in East Africa (Cabot Venton 2018).
The above evidence quashes key myths and concerns about unconditional cash programs. Specifically, cash transfers: (i) are not wasted on alcohol and tobacco; (ii) are not only spent on addressing immediate subsistence needs but also invested in productive activities and the human capital of children; (iii) do not create dependency, induce laziness or discourage work; (iv) do not cause recipients to have more babies in order to maintain eligibility or increase their benefits; (v) do not cause price distortions or inflation in local communities26 but generate strong economic multiplier effects; and (vi) can be fiscally sustainable.27
However, the potential benefits of cash transfers depend on many factors. This starts with the program design, which includes things like the size and duration of the transfer, whether the program includes conditionalities, how transfers reach beneficiaries (e.g. physical cash delivery versus a mobile money credit), institutional capacity and
5.1. The power of cash transfers
23 This summary is based on a rapid review of various meta studies of the impacts of cash transfer programs. These include Beagle et al. (2018), Bastagli et al. (2016), Collins (2015), Davis et al. (2016) and DFID (2011) as well as resources from UNICEF, FAO and University of North Carolina The Transfer Project website.
24 Kenya is based on Egger et al. (2019); all other countries are from Thome et al. (2016).25 Author’s calculation based on above sources.26 Cash transfers have been documented to cause inflation in humanitarian settings where markets are weak, and transfers tend to be large and lumpy. See, for example,
International Policy Centre for Inclusive Growth (2015).27 The myths are all drawn from Handa et al. (2017).
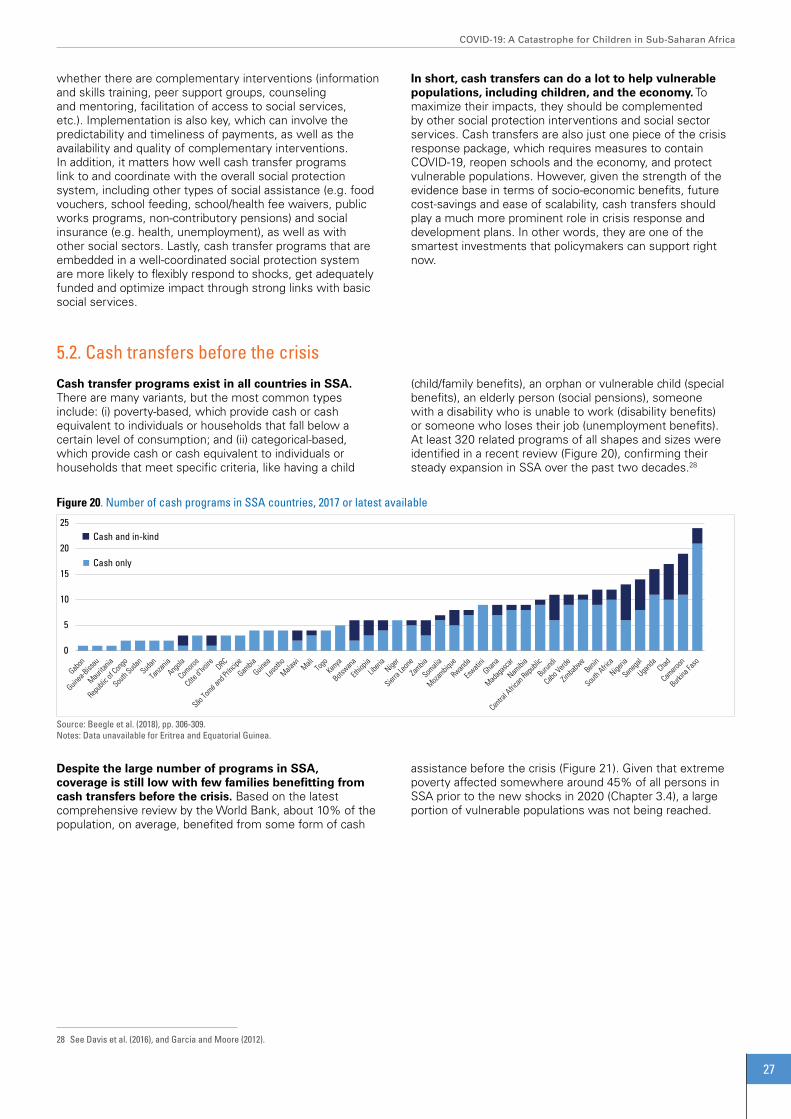
27
COVID-19: A Catastrophe for Children in Sub-Saharan Africa
28 See Davis et al. (2016), and Garcia and Moore (2012).
whether there are complementary interventions (information and skills training, peer support groups, counseling and mentoring, facilitation of access to social services, etc.). Implementation is also key, which can involve the predictability and timeliness of payments, as well as the availability and quality of complementary interventions. In addition, it matters how well cash transfer programs link to and coordinate with the overall social protection system, including other types of social assistance (e.g. food vouchers, school feeding, school/health fee waivers, public works programs, non-contributory pensions) and social insurance (e.g. health, unemployment), as well as with other social sectors. Lastly, cash transfer programs that are embedded in a well-coordinated social protection system are more likely to flexibly respond to shocks, get adequately funded and optimize impact through strong links with basic social services.
In short, cash transfers can do a lot to help vulnerable populations, including children, and the economy. To maximize their impacts, they should be complemented by other social protection interventions and social sector services. Cash transfers are also just one piece of the crisis response package, which requires measures to contain COVID-19, reopen schools and the economy, and protect vulnerable populations. However, given the strength of the evidence base in terms of socio-economic benefits, future cost-savings and ease of scalability, cash transfers should play a much more prominent role in crisis response and development plans. In other words, they are one of the smartest investments that policymakers can support right now.
Cash transfer programs exist in all countries in SSA. There are many variants, but the most common types include: (i) poverty-based, which provide cash or cash equivalent to individuals or households that fall below a certain level of consumption; and (ii) categorical-based, which provide cash or cash equivalent to individuals or households that meet specific criteria, like having a child
Despite the large number of programs in SSA, coverage is still low with few families benefitting from cash transfers before the crisis. Based on the latest comprehensive review by the World Bank, about 10% of the population, on average, benefited from some form of cash
(child/family benefits), an orphan or vulnerable child (special benefits), an elderly person (social pensions), someone with a disability who is unable to work (disability benefits) or someone who loses their job (unemployment benefits). At least 320 related programs of all shapes and sizes were identified in a recent review (Figure 20), confirming their steady expansion in SSA over the past two decades.28
assistance before the crisis (Figure 21). Given that extreme poverty affected somewhere around 45% of all persons in SSA prior to the new shocks in 2020 (Chapter 3.4), a large portion of vulnerable populations was not being reached.
5.2. Cash transfers before the crisis
0
5
10
15
20
25 Cash and in-kind
Cash only
Figure 20. Number of cash programs in SSA countries, 2017 or latest available
Source: Beegle et al. (2018), pp. 306-309.Notes: Data unavailable for Eritrea and Equatorial Guinea.

28
COVID-19: A Catastrophe for Children in Sub-Saharan Africa
Cash and in-kind
Cash only
0%
10%
20%
30%
40%
50%
60%
70%
80%
Figure 21. Coverage of cash programs in SSA countries, 2017 or latest available (as % of total population)
Source: Beegle et al. (2018), pp. 320-323.Notes: (i) There may be some duplication in terms of the same individuals benefiting from both cash and cash and in-kind programs; (ii) The overall coverage rate is approximated by summing the number of direct and indirect beneficiaries of cash transfers, food-based transfers and public works programs; beneficiaries from other programs are excluded to avoid overestimation (see Appendices B.2 and B.3 of Beegle report for details on the methodology); (iii) Data unavailable for Eritrea and Mali.
There were major variances across the region. In terms of income groups, average rates in UMICs were more than four times higher than those in LICs and LMICs: 31% versus around 7%, on average. At the country level, more than half of the population in Namibia and South Africa was supported by cash transfers compared to nominal numbers in places like Angola, Cabo Verde, Côte d’Ivoire, DRC, Gabon, Guinea-Bissau, Mauritania, Somalia and Togo. In 24 countries, less than 5% of the population was supported by cash programs.
The general low coverage of cash transfers is a symptom of underdeveloped social protection systems in many places. The reality is that, even when factoring in non-cash social protection interventions like school feeding and public works programs, social protection coverage rates remain limited in most countries. As a regional average, just over 10% of the population was supported by at least one social safety net program prior to the pandemic, which ranged from around 7-8% in LICs and LMICs, on average, up to nearly 50% in the group of UMICs (Beegle et al. 2018, pp. 320-323).
Social protection, particularly cash-based social assistance, emerged at the fore of global efforts to mitigate the socioeconomic impacts of COVID-19. Between March and September 2020, more than 140 governments made commitments to introduce or scale up around 290 cash transfer programs, 25 social pensions and 15 cash for work programs,29 making cash one of the most widespread policy tools considered (Gentilini et al. 2020). In most countries, the announced cash response has tended to be short term – just over three months, on average, based on a sample of 65 announced programs – but relatively generous – 25% of the average monthly per capita GDP according to a sample of 147 announced programs (Gentilini et al. 2020).
Cash programs were also a popular response to the pandemic in SSA. A rapid review of global databases indicates that 41/46 developing countries in SSA announced 63 new or expanded cash-based programs, either through one-time or recurring payments. This included 56 cash transfers, four cash for work initiatives and three social pensions.30
Despite the policy attention in SSA, some of the announced cash programs have not yet become operational. Findings from a survey carried out by UNICEF in August 2020 suggested that cash-based responses had not started implementation in 14 of the 41 countries where
commitments were made (UNICEF 2020c). In Malawi, for instance, the President announced on April 28, 2020 that around 1 million persons affected by the pandemic would benefit from $40/month through mobile cash transfers (Reuters 2020). However, as of the end of August, the program was not operational due in part to a re-run of the national election in June (UNOCHA 2020b). The delays can be generally attributed to challenges around funding and rapidly identifying beneficiaries as well as varied political commitments within governments.
Even if all commitments are fulfilled, the expansions would be modest. Although it is challenging to get detailed information on cash and social assistance responses more broadly, a review of different databases provides a general indication of the role that cash could be playing in the crisis response. If attempting to isolate the number of persons potentially impacted by announced expansions among a sample of 27 countries, total coverage would expand by 8%, on average, from 6.5% to 14.4% (Figure 22). This suggests that planned temporary expansions could boost the coverage of cash programs to 11% of the population in select LICs, on average, and to 18% in select LMICs. Growing coverage is a positive trend, but still insufficient to support all populations in need. For example, as discussed in Chapter 4, projected monetary poverty rates among children are 58% in LICs and 54% in LMICs, on average, which points to significant gaps.
5.3. Cash transfers during the crisis
29 Most cash for work programs involved the temporary lifting of work requirements to receive cash. 30 Author’s calculations based on sources listed in Figure 22.

29
COVID-19: A Catastrophe for Children in Sub-Saharan Africa
0%5%10%15%20%25%30%35%40%45%50%
0
2
4
6
8
10
12
14
16
# of beneficiaries, after expansion (left axis) # of beneficiaries, before expansion (left axis)
% of population benefiting from cash, before expansion (right axis) % of population benefiting from cash, after expansion (right axis)
Figure 22. Coverage of announced expansion of cash transfer programs in select SSA countries, April-September 2020 (in millions of direct and indirect beneficiaries and % of population)
Sources: Gentilini et al. Global Database on Social Protection and Jobs Responses to COVID-19 (September 18, 2020, version 13), IFPRI COVID-19 Policy Response Portal (September 4, 2020 Update), ILO Social Protection Responses to COVID-19 Crisis Around the World Database (September 1, 2020 Update) and UNDESA World Population Prospects (2019 Revision).Notes: (i) Data refer to the number of persons who may benefit from a transfer (i.e. the number of persons in a household) and not the number of individual transfers; (ii) Some programs may also include persons benefiting from vertical expansion since it is not always possible to differentiate; (iii) Data on horizontal expansions are based on announced or planned expansions, and each individual country requires verification; (iv) The baseline estimates for 2020 are derived by applying the coverage rates of cash programs from Figure 21 to 2020 population projections.
051015202530354045
0
50
100
150
200
250
300 Total funding (left axis)
Per capita (right axis)
2.5 billion
Figure 23. Announced funding for expansion of cash transfer programs in select SSA countries, April-September 2020 (in $ millions and $ per capita)
Sources: Same as Figure 22.
The funding, size and duration of expansions also appear modest. Drawing on available estimates for a group of 18 countries suggests that the planned expansions of cash transfer programs would be supported by around $65 million, on average (Figure 23). This figure excludes South Africa since its total package of cash support was estimated at around $2.5 billion, making it an extreme outlier. Based on this sample, total announced spending on cash programs ranges from around $3 per person in LICs, on average, to $7 in LMICs and $27 in UMICs.31 Turning to the adequacy,
the announced transfer value was 40% of the monthly per capita GDP (based on 2019 values), on average, based on 24 programs where local currency information was available (Figure 24). This varied from less than 7% for programs in Angola, Cameroon and South Africa to more than 140% in Malawi and Sierra Leone. In terms of time, the average length of the planned cash support was just under four months among the programs with data, of which five were one-time payments.32
31 There are not enough data points to allow for meaningful comparison of funding and beneficiaries, which is why total population is used32 Author’s calculation based on sources in Figure 22.

30
COVID-19: A Catastrophe for Children in Sub-Saharan Africa
0%20%40%60%80%
100%120%140%160%
Figure 24. Adequacy of announced cash transfer values in select SSA countries, April-September 2020 (local currency value as % of 2019 monthly per capita GDP)
Sources: Same as Figure 22 and IMF World Economic Outlook Database (October 2020 Edition).
0%
2%
4%
6%
8%
10%
12%
14%
0.0
0.5
1.0
1.5
2.0
2.5
Cash programs (left axis) Health (left axis) Economic (left axis) Total stimulus, % of 2019 GDP (right axis)
37.8 billion
Figure 25. Announced fiscal stimulus in select SSA countries, as of September 2020 (in current $ billions and as % of 2019 GDP)
Sources: Same as Figure 22, Milken Institute COVID-19 Africa Watch: Fiscal Policy Responses Database (September 8, 2020 Update) and IMF World Economic Outlook Database (October 2020 Edition). Note: Countries that have data on cash programs are assumed to be financing them as part of announced fiscal stimulus packages.
The overall limited fiscal response to the crisis has constrained the potential for a stronger cash response. Nearly all countries in the region announced some form of a fiscal stimulus program (Figure 25). Between April and September 2020, close to $55 billion was committed to help fight the health and socioeconomic crises, which amounted to 2.1% of GDP, on average, or 3.3% of regional GDP (based on 2019 values). However, once removing South Africa,
which accounted for 70% of total announced funding in SSA, stimulus support levels fall to about $16.6 billion or 1.2% of regional GDP. This pales in comparison to stimulus packages adopted in Europe and North America, which commonly exceeded 20% of GDP (Anderson et al. 2020). In terms of funding for cash programs, these accounted for just over 10% of announced stimulus spending, on average, among 11 countries with data.
Given the widespread benefits of cash transfers, there is a strong case for transforming temporary needs into national programs. For countries that already have a national program in place, the path forward is clear: Close coverage and adequacy gaps as quickly as possible while also consolidating and solidifying smaller programs. In practice, few countries in the region have that luxury.
One strategic option to increase cash support is to provide transfers to all children under five. This categorical group serves as a good proxy for the most vulnerable populations in a country while ensuring widespread coverage of benefits across households. This approach can
also effectively provide support to those who are in need in the immediate term and strengthen the foundation of the national social protection system over the medium term (UNICEF 2020d). The starting point for understanding the possible implications of providing cash to all children under five is design considerations, which are described below.
First, even though some households are currently benefitting from cash support, all households that have children under five are assumed to need coverage. This would put the number of new beneficiaries in SSA at around 175 million, with 65 million of those located in just three countries – the DRC, Ethiopia and Nigeria (Figure 26).
5.4. Increasing cash transfers: Costs and benefits

31
COVID-19: A Catastrophe for Children in Sub-Saharan Africa
0
20
40
60
80
100
120
140
160
0
3,000,000
6,000,000
9,000,000
12,000,000
15,000,000
18,000,000 0-4 beneficiaries (left axis) Transfer value (25% of monthly GDP per capita) (right axis)
33.9 million
Figure 26. Parameters for scaling up cash transfer support to young children in SSA countries(in # of under five beneficiaries and transfer value in current $ – based on 2019 GDP)
Sources: UNDESA World Population Prospects (2019 Revision) and IMF World Economic Outlook Database (October 2020 Edition).Notes: (i) Assumptions described in the preceding paragraph; (ii) Somalia excluded due to data unavailability.
-
500
1,000
1,500
2,000
2,500
3,000
3,500
0%
1%
2%
3%
4%
5% 12 months (% of GDP) (left axis) 6 months (% of GDP) (left axis) 6 months (current $) (right axis) 12 months (current $) (right axis)
Figure 27. Cost estimates for providing cash transfers to all children under five in SSA countries for 6 and 12 months(as % of 2019 GDP and in millions of current $)
Sources: UNDESA World Population Prospects (2019 Revision) and and IMF World Economic Outlook Database (October 2020 Edition).Notes: (i) Assumptions described in the preceding paragraphs; (ii) Due to the scale, data points not shown for Nigeria ($7.5 and $15.1 billion for 6 and 12 months, respectively) and South Africa ($6.9 billion for 12 months); (iii) Somalia excluded due to data unavailability.
Second, a meaningful transfer value is 20% of the average monthly per capita consumption. Based on evidence from cash programs in SSA, this is the level at which widespread benefits are observed among beneficiaries, with lower amounts generating weaker impacts (The Transfer Project 2016). At the same time, if applying GDP or income as a proxy for consumption (acknowledging the upward bias), this is quite close to the average transfer size of programs that have been announced globally since the start of the crisis (25% as discussed in section 5.3). Applying 20% of monthly per capita income would result in an equivalent average monthly transfer value of $11 in LICs, $34 in LMICs and just under $120 in UMICs (see also Figure 26).
Third, the initial duration of support is at least six months and ideally 12. The length of cash assistance would depend on the economic trajectory and evolution of other shocks, but current projections would indicate one year in most countries. A longer period of regular support would also maximize the economic multipliers and potential for a sustained economic recovery. As the crisis period fades,
the medium-term objective would be to transition to a permanent support while also focusing on complementary interventions and strengthening other social services.
Based on the above assumptions, providing cash transfers to all caretakers that have young children offers a practical way forward. Under a scenario of six months, the total cost of providing a monthly transfer equivalent to 20% of average per capita income to the 0-4 population would be 1.5% of GDP, ranging from 1.6% in LICs, on average, to 1.5% in LMICs and 1.3% in UMICs (Figure 27). Extending the duration to a full year or 12 payments would double the costs to 3.1% of GDP, on average. In terms of government expenditure, six months of transfers would consume around 7% of total spending and 14% for 12 payments (based on 2019 levels).33 Moreover, the total financial requirement for the region would amount to around $26 billion for six months and $52 billion for the full year, which, for the latter program design, would be slightly more than all official development assistance and aid received in 2018 ($44 billion34). These costs are sizeable but must be viewed in terms of their potential returns.
33 Author’s calculation based on 2019 general government total expenditure estimates from IMF World Economic Outlook Database (October 2020 Edition).34 Author’s calculation based on OECD-DAC International Development Statistics Database.

32
COVID-19: A Catastrophe for Children in Sub-Saharan Africa
-12%
-10%
-8%
-6%
-4%
-2%
0%
2%
4%
6% Per capita GDP growth, latest forecast for 2020
Per capita GDP growth, with 6 month transfer
Per capita GDP growth, with 12 month transfer
Figure 28. Projected economic impact of providing cash transfers to all children under five in SSA countries under different scenarios(in 2020 per capita GDP growth based on current $)
Sources: Author’s calculations based on and IMF World Economic Outlook Database (October 2020 Edition) and UNDESA World Population Prospects (2019 Revision). Notes: (i) Assumes that the average nominal income multiplier is 1.53, which is arrived by taking the average value found in 10 child grant programs in SSA (1.91 – see section 5.1) and then adjusting downward by 20% to account for the initial impact of new cash on local markets, whereby supply may be unable to respond immediately and fully to the increase in demand; the downward revision also helps account for the uncertainty of benefits when scaling an intervention nationally; (ii) Somalia is excluded due to data unavailability.
Whether expanding an existing cash transfer program or introducing a new one, such efforts must be complemented by investments in strengthening the social protection system. Core components include: (i) a registry (to capture information on all potential beneficiaries); (ii) targeting criteria (to define who is eligible, if not a universal design); (iii) a payment system (to establish the process for delivering cash benefits, whether in hard currency or other form); (iv) grievance redress mechanisms (to address operational issues or beneficiary questions that arise during implementation); (v) a management information system (MIS) (to support all of the above and enable
robust M&E); (vi) institutional arrangements (to promote coordination and linkages between national and subnational levels, disaster management bodies, etc.); and (vii) human resources (to ensure adequate staffing with the right skills) (Bowen et al. 2020). Strengthening these core aspects, especially as part of a national program, can help minimize delays in expanding support during a crisis, which has been a challenge for some countries in the current context. Building system capacity should also be viewed as a key development objective on its own (O’Brien et al. 2018) and be linked to other social protection goals like abolishing user fees and providing health insurance.
In purely economic terms, providing grants to all children under five holds vast potential to minimize the ongoing contraction. As described in section 5.1, cash transfers generate strong economic multiplier effects in the broader community. If adjusting the average multiplier found in 10 cash programs in SSA for possible inflationary effects and then applying to the volume of cash proposed under both scale-up scenarios, the impacts on growth could be large. Under a six-month intervention, for example, the simulation suggests that cash transfers could boost per capita GDP
growth from -4.8%, on average, to -2.4%, which is a 2.4% improvement (Figure 28 – blue triangles). Under the yearlong scenario, the impact estimate is more than 4.8%, which would likely push per capita growth across the region back into positive territory (0.01%, on average) (Figure 28 – red circles). The economic growth impacts are similar across income groups, although slightly stronger in LICs – 5%, on average, versus 4.7% in LMICs and 4% UMICs under the scenario of 12 payments.
A rapid scale-up of cash programs to support young children is possible through a mix of domestic budget reallocations and emergency funding from external sources. This section explores these different channels, starting with the domestic front.
Many governments could help finance a rapid scale-up of cash transfers by shifting spending priorities. Two commonly cited targets are energy subsidies, whose benefits accrue almost exclusively to wealthier households (Komives et al. 2005), and the military, where large budgets are difficult to justify in the absence of security threats (Archer and Willi 2012). The latest available
spending estimates for the region show that governments have recently spent around 3.7% of GDP, on average, in these combined areas (Figure 29). That amount is more than enough to cover 12 months of cash transfers in most countries. Comparing the ratio of spending on these areas to spending on social safety nets further showcases the potential fiscal space that could be created through reallocation. Here, the latest estimates show that governments were investing eight times more in energy subsidies and the military than in safety nets (8:1), on average. Of course, the ability to reallocate depends on political economy factors and requires strong political will (Cummins 2019b).
5.5. Funding cash transfers: Closing the gap

33
COVID-19: A Catastrophe for Children in Sub-Saharan Africa
0
1
2
3
4
5
0%
2%
4%
6%
8%
10%
12%
14%
Spen
ding
ratio
% o
f GDP
Social safety net spending (left axis)
Military spending and energy subsidies (left axis)
Ratio (right axis)
0
10
20
30
40
50
60
0%
5%
10%
15%
20%
25%
Spen
ding
ratio
% o
f GDP
Social safety net spending (left axis)
Military spending and energy subsidies (left axis)
Ratio (right axis)
Figure 29. Government spending on social safety nets, the military and energy subsidies, 2017 or latest available (% of GDP and ratio)Figure A. Countries with energy/military-to-safety net spending ratios <5
Figure B. Countries with energy/military-to-safety net spending ratios >5
Source: Beegle et al. (2018), pp. 328-330.
On the external side, undisbursed emergency funds could be redirected to support cash transfer programs. A review of the latest available figures suggests that somewhere around $31 billion in external support had been approved to governments in SSA as of mid-October 2020 (Figure 30). This amounts to about 2.7% of GDP, on average (based on the IMF’s latest forecast for 2020), ranging from 3.0% of GDP in LICs to 2.8% in LMICs and 0.9% in UMICs (Figure 31). Commitments include redeploying existing project funding from the World Bank (~$3.6 billion), different debt relief measures from the IMF and World Bank (~$6.9
billion),35 and new lending and grant packages from the AfDB, IMF, World Bank and bilateral donors (~$20.7 billion). Although it remains unclear how much was intended for cash programs, available data from the World Bank indicates that less than 40% of its $6 billion in non-debt relief support had been disbursed as of September 2020, while the IMF had disbursed around 70% of its $16 billion in non-debt relief support.36 This suggests that at least $8 of the $20 billion in total non-debt relief from international financial institutions could have the flexibility for re-programming for cash transfers.
35 Debt relief measures to not amount to new funding but rather government spending commitments that were once earmarked for interest and/or principal debt repayment that can now be directed to other priorities.
36 Author’s calculations based on World Bank Loans and Credit Database (accessed October 15, 2020) and World IMF Financial Data Query Tool (accessed October 15, 2020).

34
COVID-19: A Catastrophe for Children in Sub-Saharan Africa
16.0
0.4
6.5
3.6
2.4
2.2
0.0
5.0
10.0
15.0
20.0
25.0
30.0
By source and type
IMF new lending
IMF debt relief
WB potential debt relief
WB redeploy existing projects
WB new lending and grants
AfDB new lending
Bilateral grants
20.7
6.9
3.6
By type
Redeploy
Debt relief
New lending andgrants
Figure 30. Committed external emergency financial support to SSA, as of September 2020(by source and type, in billions of current $)
Sources: AfDB COVID-19 Response Facility (as of October 15, 2020), IMF COVID-19 Financial Assistance (October 15, 2020 update), IMF Debt Service Relief from the Catastrophe Containment and Relief Trust (October 15, 2020 update), World Bank Operational Response to COVID-19: Projects List (accessed October 15, 2020), World Bank COVID-19: Debt Service Suspension Initiative (September 30, 2020 update) and Devex Funding the Response to COVID-19 Database (October 11, 2020 update).
0%
1%
2%
3%
4%
5%
6%
7%
8%
0.0
5.0
10.0
15.0
20.0
25.0
30.0
35.0
40.0
45.0
50.0
Bilateral new grants AfDB new lending World Bank potential debt relief World Bank redeploying existing projects World Bank new lending and grants IMF debt relief IMF new lending % of GDP, 2020
Figure 31. Committed external emergency financial support to SSA countries, 2020 (in billions of current $ and as % of 2020 GDP)
Sources: Same as Figure 30 and IMF World Economic Outlook Database (October 2020 Edition).Notes: (i) Botswana, Equatorial Guinea, Eritrea, Guinea-Bissau and Sudan not presented because they had received less than $10 million in external support as of mid-October 2020; (ii) Somalia excluded due to data unavailability.
Debt relief can also help. Debt relief measures are not new funding but rather government revenue that was earmarked to make interest payments and/or pay off loan balances that can now be used for other purposes. In practice, this allows spending commitments to be reprioritized. As noted above, potential debt relief to SSA is estimated at around $7 billion, which was slightly over 20% of total emergency support approved as of the end of September 2020. Unfortunately, many of the benefits will not be felt until the future when the bulk of repayments would have been made. Nonetheless, new budgetary space has been created in some places in the immediate term, which can be used to support the scale-up of cash transfer programs.
Perhaps most important, there should be a strong potential for new emergency funding to help cover the costs of cash transfer programs in SSA. The reality is that external funding flows to the region have been very small in
comparison to actual needs and global funding capacity. This presents significant opportunities for at least three reasons.
First, only a fraction of the requested resources by governments in SSA has been made available. In March 2020, long before the severity of the economic shock was known, African Ministers of Finance asked the Group of Twenty (G20) for $100 billion in assistance through a mix of financing, grants and debt relief (UNECA 2020). As described above, only around $31 billion of this had been approved as of the end of September 2020. And of that, an estimated $15.5 billion had been released – or roughly 15% of the original ask. At the same time, vulnerabilities and hence funding needs have continued to escalate. During the October 2020 annual meeting, the IMF indicated that Africa faces a $345 billion financing gap to recover from the pandemic through 2023 (IMF 2020b). This comes on top of the $500 billion to $1.2 trillion estimated annual funding gap

35
COVID-19: A Catastrophe for Children in Sub-Saharan Africa
for the region to deliver on the Sustainable Development Goals (SDGs) (Twinoburyo et al. 2019).
Second, approved emergency funding in SSA pales in comparison to rescue packages in other countries and regions. For instance, as of June 2020, the G20 had announced $7.6 trillion in fiscal stimulus measures in their own countries (Segal and Gerstel 2020). If taking the total value of external support and fiscal stimulus commitments within SSA, this equaled about $40 billion as of September 2020 (excluding South Africa, which is a G20 member37). To illustrate the magnitude of differences, G20 citizens are benefitting from around $1,652 per person in pledged support compared to $38 per person in SSA (about 2%).
Third, global emergency funding potential has barely been scratched. In April 2020, the G20 gave the green light to the IMF to mobilize and use its $1 trillion lending capacity and directed the World Bank and regional development banks to invest at least $200 billion to support developing countries (G20 2020). Yet as of mid-October 2020, the IMF had approved around $100 billion in assistance to 81 countries (IMF 2020a) and the World Bank about $40 billion to 110 countries (World Bank 2020f). This indicates that only around 12% of approved funding capacity ($1.2 trillion) had been accessed more than six months into the crisis, which should present an opportunity for vastly increasing assistance to governments that are most in need, including for cash programs.
37 In addition to being a G20 member, South Africa also accounted for more than 70% of total announced fiscal stimulus funding in SSA, which heavily distorts the regional picture and average reality for most countries and persons (see section 5.3).
Social protection has been a popular crisis response goal in SSA, but funding constraints have limited the impact of cash transfers on vulnerable populations and economies. Even if announced programs were fully implemented, available information suggests that total coverage would increase by 8% and for four months, on average. A major challenge has been the small size of fiscal stimulus programs coupled with limited support from global emergency funding sources.
To expand coverage, a strategic option for many governments is to provide cash transfers to all children under five. A transfer value equal to 20% of monthly per capita income for six months could carry a cost between 1.3% of GDP in wealthier countries to 1.6% of GDP in the poorest. While this is not cheap, the returns are compelling when factoring in the economic multipliers, which could potentially boost overall per capita GDP growth by 2.4%, on average. A one-year design generates even stronger economic returns, not to mention the multitude of benefits in addressing many of the risks facing children and vulnerable populations.
Combining domestic and external resources can make increasing cash support financially viable. On the domestic front, budget reprioritization can be a good start. This is especially true where spending on regressive or cost-ineffective items is high and political will and negotiation powers are strong. However, there should be opportunities to access significant funding from international financial institutions. Given that around $8 billion of approved new emergency funding to the region had not yet been disbursed as of the end of September 2020, it should be possible to re-program at least a portion of these resources for cash transfers. The immediate benefits of debt relief can also help. Moreover, with only around 12% of global funding capacity accessed by the IMF and World Bank to support countries in need, there should be strong potential for governments in SSA to benefit from new emergency funding support.
5.6. Summary

36
COVID-19: A Catastrophe for Children in Sub-Saharan Africa
Before the arrival of COVID-19, most of the 550 million children living in SSA were already facing many challenges. The list included droughts, floods and locust invasions as well as conflict and instability. This was on top of pervasive poverty, which impacted around four out of five children in multi-dimensional terms and one out of every two in monetary terms. Many more were also exposed to exceptional well-being risks due to displacement, migration and the daily realities of life in urban slums and remote areas.
COVID-19 added to these challenges. The disruptions to global trade, finance and travel to the region coupled with domestic lockdowns resulted in the region’s first economic recession and the biggest increase in extreme poverty ever recorded. For children, poverty rates likely spiked by 10%, on
average, with more than 280 million or 54% of all 0-17-year-olds now living in households that consume less than the national poverty line.
Specific aspects of child well-being have also been severely impacted. More than one in every two children may be dealing with food insecurity, with one in ten in a severe situation and risks for famine possibly developing in some places. Around 250 million children also stopped going to school and learning for some period, millions of which have become permanent dropouts. And while specific numbers are unclear, there is little doubt that many children are being impacted by basic health issues, violence and abuse, pregnancy, early marriage and unsafe living conditions, among others, compared to the start of 2020.
The promising news is that social protection can help a lot. The evidence base is very strong that giving cash to households can mitigate and prevent most of the current threats facing children. Additional benefits range from accelerating economic growth and achieving future cost-savings to providing vulnerable populations with a minimum base to access services and supporting economic inclusion.
Cash transfers have been used to respond to the COVID-19 crisis in SSA, but funding constraints have severely limited their impact. Available data suggest that, if implemented, announced plans could temporarily expand
coverage up to 11% in select low-income countries and 18% in lower-middle-income countries. However, the temporary expansions fall far short of supporting all populations in need.
Cash transfers are not a panacea but deserve more attention in SSA. The impacts will partly depend on their interaction with other social protection interventions, social services and local markets. Effectively responding to the crisis also requires broader measures to contain COVID-19, reopen the economy and protect vulnerable populations. However, given the strength of the evidence base in terms of socio-economic benefits, this policy option should feature
A Marshall Plan for Children in Sub-Saharan AfricaCHAPTER 6
6.1. The situation
6.2. A smart intervention
© U
NIC
EF/
UN
I319
837/
Kan
oban
a

37
COVID-19: A Catastrophe for Children in Sub-Saharan Africa
Children and vulnerable populations are being hurt by many shocks that they did not create. This includes COVID-19, the increasing incidence and intensity of cyclones, droughts and floods, which are largely fueled by industrial policies and practices far beyond SSA’s borders, and even the locust invasions, which originated in Middle Eastern deserts. This further applies to the crash in global energy prices in March 2020, which was triggered by a political standoff between Russia and Saudi Arabia and severely undermined government finances in resource-intensive countries.
The reality is that most governments in SSA do not have fiscal space to protect their populations from global shocks. This starts with resource mobilization, which has long been a major challenge. For instance, if channeling the entire national budget to the health sector in 2019 – and that includes all funding from revenue, grants and borrowing – a number of governments in the region would still be unable to provide basic, life-saving health services to their entire populations (Figure 32).38
6.3. A global funding facility for children in Sub-Saharan Africa
at the center of recovery and longer-term development plans and financing discussions.
One strategic option to expand coverage is to provide cash transfers to all young children. For instance, the bill for a year-long intervention would amount to 3.1% of GDP, on average. However, when accounting for the catalytic effects on local supply and demand forces, this approach could propel many economies back into positive growth in addition to the significant impacts on child well-being and contributions to strengthening social protection systems.
Increasing cash support is affordable if combining domestic and external resources. While most governments can contribute through some form of budget reallocation, the international financial institutions should be able to provide the bulk of support. This can include re-programming emergency funding that has been approved but not disbursed, targeting immediate debt relief benefits and approving new emergency funding, especially since the IMF and World Bank have only tapped around 12% of global funding capacity to support governments in need.
38 WHO (2010) estimated that LICs would need to spend $60 per capita, on average, to be able to deliver a set of essential health interventions by 2015. These estimates were then independently updated to 2012 US dollar terms (from 2005), which resulted in an average figure of $86 per capita (Chatham House Centre on Global Health Security Working Group on Health Financing 2014). See also Jowett (2016) and Cummins (2019c), Chapter 7.
050
100150200250300350400450500550600650 1,900
minimum investment requirement ($86)
Figure 32. General government total expenditure per capita in select SSA countries, 2019 (in current $)
Source: IMF World Economic Outlook Database (October 2020 Edition).Notes: (i) Countries that had expenditure per capita >$1,200 in 2019 are not presented (Botswana, Cabo Verde, Equatorial Guinea, Eswatini, Gabon, Namibia, South Africa); (ii) Somalia is excluded due to data unavailability; (iii) See footnote 38 for details on the minimum health investment requirement.
Resource constraints have been magnified during 2020. Even when combining the approved assistance from external sources and announced fiscal stimulus plans, the average person in SSA would benefit from just 2% of the emergency support received by citizens of G20 countries. And while there may be room for reprioritization to support things like cash transfers, the financial gaps to deliver on broader development objectives remain astronomical (Prady and Sy 2019). African countries already require $345 billion of additional financing to recover from the pandemic (IMF 2020b), which is in addition to the annual funding gap of up to $1.2 trillion to deliver on basic development objectives (Twinoburyo et al. 2019).
A new funding initiative in the spirit of a “Marshall Plan for Children in SSA” could go a long way to supporting recovery, strengthening the human capital base and redressing inequalities. The Marshall Plan was an American initiative passed in 1948 to help rebuild the devastated infrastructure and weakened economies of Western Europe following World War II. Over four years, it provided around $150 billion (in equivalent current $) to 16 governments, nearly all in grant form. In practice, the initiative was a regional fiscal stimulus program, which catalyzed a wide range of positive economic outcomes and is argued by some as the most effective foreign assistance program in history (Tarnoff 2018).

38
COVID-19: A Catastrophe for Children in Sub-Saharan Africa
Children in the region need a Marshall Plan level of investment and action, urgently. The rationale is compelling. Children and human capital were underdeveloped before the crisis and are currently under attack largely by forces that originated in faraway places. Given the domestic funding constraints, the outlook for children – and the economies and political stability of much of the region – will be dire in the absence of an immediate surge of external resources.
This idea is not new, but the proposed focus is. In 2017, the German government launched its “Marshall Plan with Africa,” which was intended to serve as a blueprint to increase trade and development on the continent as well as reduce migration flows across the Mediterranean (BMZ 2017). And in recent months, Save the Children (Watkins 2020), the United Nations Conference on Trade and Development (Kituyi 2020), World Vision International (2020c) and notable global economists39 have called for different variants of a Marshall Plan to protect vulnerable populations and the economies in developing countries. The current proposal, however, stands apart in terms of the target population – children and young people in SSA – and investment objectives – develop human rather than physical capital. Operationally, it could take the form of a funding facility overseen by one or more regional and/or global institutions, including UNICEF.
Funding actions would need to be swift. This could start with the recent approval of debt relief for governments in the region as well as transfers from available emergency funds managed by the international financial institutions. It would also need to rely on grants from willing partners.
Here, a lot of funding could be availed if governments, especially from the G20, better delivered on their official development assistance commitments under SDG target 17.2 (0.7% of gross national income) (UNCTAD 2016). Then there are the more controversial options. For example, the IMF held more than $170 billion worth of gold reserves at the end of September 2020, of which a portion could be sold to support the facility (Elliot 2020; IMF 2020c). International financial institutions and select governments could further take advantage of historically low interest rates to issue long-term bonds (e.g. 30-year) to help fund the facility. Interest (coupon) payments – and even principal repayments – could be covered by cross-border innovative financing approaches, like fractional taxes on financial transactions, shipping, arms sales, etc., which have been debated for decades.40
A global funding facility for children in SSA would enable governments to protect the biggest victims of the current crisis and better invest in human capital. Eligibility criteria would guide the distribution of resources, but ultimately governments would be able to significantly increase investment in basic social services, including child protection, education, health, nutrition, social protection, and water and sanitation. If operationalized quickly, the facility could support the safe reopening of schools and economies as well as the scaling of national cash transfer programs and strengthening of social protection systems. In doing so, it could offer hope for children, economies and the continent as they contend with COVID-19 among many other shocks, both today and tomorrow.
39 See, for example, Moyo (2020) and Chu (2020).40 These and other “innovative” options are discussed in Ortiz et al. (2017).

39
COVID-19: A Catastrophe for Children in Sub-Saharan Africa
Additional Figures
APPENDIX
11,000
12,000
13,000
14,000
15,000
16,000
17,000
18,000
19,000
1,000
1,500
2,000
2,500
3,000
3,500
4,000
4,500
5,000
2000
2001
2002
2003
2004
2005
2006
2007
2008
2009
2010
2011
2012
2013
2014
2015
2016
2017
2018
2019
2020
LICs LMICs SSA UMICs (right axis)
41.6%41.2%
44.6%
40%
41%
42%
43%
44%
45%
400
420
440
460
480
500
520
2018 2019 2020
# of extreme poor (left axis)
headcount ratio (right axis)
Figure A. Per capita GDP trends in SSA by income groups, 2000-20 (in 2017 PPP)
Figure B. Extreme monetary poverty projections in SSA, 2018-20 (in millions and % of persons living below $1.90/day in 2011 PPP)
Sources: IMF World Economic Outlook Database (October 2020 Edition).
Source: Figure 15, World Bank PovcalNet and UNDESA World Population Prospects (2019 Revision).Notes: (i) PovcalNet presents headcount ratios and population estimates for 16 individual years between 1981 and 2018; the other years are estimated through interpolation and nearest neighbor imputation; (ii) The 2019 estimate is based on a linear forecast of the regional headcount ratio for 2013, 2015 and 2018 (this predicts 41.2% in 2019 compared to 41.6% in 2018) and then applying this ratio to 2019 population estimates (this adjusts the 2018 population value in PovcalNet by the population growth rate estimate for 2019 from UNDESA); (iii) The 2020 estimate is derived by applying the average projected increase in the number of extreme poor as presented in Figure 15 (50.6 million persons) to the number of poor estimated for 2019 and again adjusting the total population based on the UNDESA population growth rate estimate.

40
COVID-19: A Catastrophe for Children in Sub-Saharan Africa
-1%
0%
1%
2%
3%
4%
5%
6%
7%
8%
9%
10%
11%
12%
-5
0
5
10
15
20
25
30
35
40
45
50
55
1980
1981
1982
1983
1984
1985
1986
1987
1988
1989
1990
1991
1992
1993
1994
1995
1996
1997
1998
1999
2000
2001
2002
2003
2004
2005
2006
2007
2008
2009
2010
2011
2012
2013
2014
2015
2016
2017
2018
2019
2020
# (left axis)
% change (right axis)
0%
10%
20%
30%
40%
50%
60%
70%
80%
90%
100%
0.0
10.0
20.0
30.0
40.0
50.0
60.0 # before crisis (left axis) # change due to crisis (left axis) % of total before crisis (right axis) % of total after crisis (right axis)
Figure C. Annual change in extreme monetary poverty in SSA, 1980-2020(in millions and % of persons living below $1.90/day in 2011 PPP)
Figure D. Monetary child poverty in SSA countries, 2020 projections before/after economic shock (in millions and % 0-17-year-olds based on national poverty lines)
Source: Figure 15, World Bank PovcalNet and UNDESA World Population Prospects (2019 Revision).Notes: (i) PovcalNet presents headcount ratios and population estimates for 16 individual years between 1981 and 2018; the other years are estimated through interpolation and nearest neighbor imputation; (ii) Estimates for 2019 and 2020 are the same as those described in Figure B above.
Source: Author’s estimates based on UNICEF and Save the Children and UNDESA World Population Prospects (2019 Revision).Notes: (i) The simulation accounts for the proportion of children living in poor households as defined by national standards (combining the proportion of the population living below the national poverty line with data from MICS and DHS on the distribution of children by deciles); (ii) The country estimates reflect the most pessimistic scenario, which is based on a combination of two factors: (a) the worst per capita GDP projection released by either the IMF or World Bank in their June 2020 updates and (b) a full distribution effect of the GDP shock, which applies actual observed changes of the historical distribution of consumption by decile based on UNU-WIDER’s World Income Inequality Database; (iii) Projections are unavailable for five developing countries in SSA (Angola, Central African Republic, Equatorial Guinea, Eritrea, Somalia); (iv) Country-level projections had had not been publicly released at the time of publication.
APPENDIX

41
COVID-19: A Catastrophe for Children in Sub-Saharan Africa
-60%
-50%
-40%
-30%
-20%
-10%
0%
10%
20%
30%
40%
50%
-2,000,000
-1,000,000
0
1,000,000
2,000,000
3,000,000
4,000,000
5,000,000
6,000,000
7,000,000 change in millions (left axis)
change as a % (right axis)
-75%
-50%
-25%
0%
25%
50%
75%
100%
-1,000,000
-500,000
0
500,000
1,000,000
1,500,000
2,000,000
2,500,000
3,000,000
3,500,000 change in millions (left axis)
change as a % (right axis)
Figure E. Food insecurity projections among children in select SSA countries, July-December 2019 and July-December 2020 (or as close as possible):
i. Changes in child population facing minimal acute food insecurity, IPC Phase 1 or higher (in millions of 0-17-year olds and as a %)
ii. Changes in child population facing crisis acute food insecurity, IPC Phase 3 or higher (in millions of 0-17-year olds and as a %)
Sources: IPC Population Tracking Tool (the latest reports published between July 2019 and September 2020) and UN DESA World Population Prospects: 2019 Revision.Notes: (i) Child estimates are derived by applying the share of children in the population to the total number of food insecure in each category; (ii) The analysis is restricted to the 14 countries that had food insecurity estimates available for the period directly preceding the pandemic (July to December 2019) and during its impacts (July to December 2020); (iii) The months/years in parentheses refer to the publication of the analysis, not the period being projected.
APPENDIX

42
COVID-19: A Catastrophe for Children in Sub-Saharan Africa
References
ACLED (Armed Conflict Location & Event Data Project). 2020. “Mid-Year Update: 10 Conflicts to Worry About in 2020.” Briefing Note, August 2020, Washington, DC.
African Child Policy Forum. 2011. The Lives of Children with Disabilities in Africa: A Glimpse into a Hidden World. Addis Ababa: African Child Policy Forum.
Agence France Presse. 2020. “Malawi’s Surge In Early Pregnancies Blamed On Pandemic School Closures.” AFP News, July 27, 2020.
Anderson, Julia et al. 2020. “The Fiscal Response to the Economic Fallout from the Coronavirus.” Bruegal Datasets, September 24, 2020 Update, Bruegal, Brussels.
Archer, Colin and Annette Willi. 2012. Opportunity Costs: Military Spending and the UN’s Development Agenda. Geneva: International Peace Bureau.
Azevedo, João Pedro et al. 2020. “Simulating the Potential Impacts of COVID-19 School Closures On Schooling and Learning Outcomes: A Set of Global Estimates.” Conference Edition Working Paper, World Bank, June 2020.
Azevedo, João Pedro et al. 2019. Ending Learning Poverty: What will it Take? Washington, DC: World Bank, p. 17.
Baker, Tony. 2020. COVID-19 Aftershocks: Access Denied Teenage Pregnancy Threatens to Block a Million Girls Across Sub-Saharan Africa from Returning to School. Uxbridge: World Vision International.
Bandiera, Oriana et al. 2019. “The Economic Lives of Young Women in the Time of Ebola: Lessons from an Empowerment Program.” World Bank Policy Research Working Paper, No. 8760, World Bank, Washington, DC.
Barden-O’Fallon, Janine et al. 2015. “Rapid Assessment of Ebola-Related Implications for Reproductive. Maternal. Newborn and Child Health Service Delivery and Utilization in Guinea.” PLoS Curr (1)7, August 4, 2015.
Bastagli, Francesca et al. 2016. “Cash Transfers: What Does the Evidence Say? A Rigorous Review of Programme Impact and of the Role of Design and Implementation Features.” London: Overseas Development Institute (ODI).
Beegle, Kathleen et al. 2018. Realizing the Full Potential of Social Safety Nets in Africa. Washington, DC: World Bank.
BMZ (Federal Ministry for Economic Cooperation and Development). 2017. Africa and Europe – A new partnership for development, peace and a better future, Cornerstones of a Marshall Plan with Africa. Bonn: Federal Republic of Germany.
Bowen, Thomas et al. 2020. Adaptive Social Protection Building Resilience to Shocks. Washington, DC: World Bank, Chapter 1.
Cabot Venton, Courtenay. 2018. Economics of Resilience to Drought in Ethiopia. Kenya and Somalia. Washington, DC: USAID Center for Resilience.
Chatham House Centre on Global Health Security Working Group on Health Financing. 2014. Shared Responsibilities for Health: A Coherent Global Framework for Health Financing. London: The Royal Institute of International Affairs.
Child Rights Now! 2020. “Ending Violence against Children and COVID-19.” Policy Brief, June 2020.
Chu, Ben. 2020. “Coronavirus: Rich Countries must Fund ‘Marshall Plan’ for World’s Poorest Countries, Says Nobel-winning Economist.” The Independent, May 12, 2020.
Collins, Olivia. 2015. “Social Cash Transfers and Children’s Outcomes: A Review of Evidence from Africa.” Nairobi: UNICEF-ESARO and The Transfer Project.
Cummins, Matthew. 2019a. “Population Dynamics and the Demographic Dividend Potential of Eastern and Southern Africa: A Primer.” UNICEF ESARO Social Policy Working Paper, UNICEF, Nairobi.
_______. 2019b. Fiscal Space for Children and Human Capital in Eastern and Southern Africa Options and Strategic Entry Points to Address Investment Gaps in 16 Countries. Nairobi: UNICEF ESARO.
_______. 2019c. The Macroeconomic and Social Investment Outlook for Children in Eastern and Southern Africa. Nairobi: UNICEF ESARO.
Davies, Pascale. 2020. “Teen Pregnancies Rise in Malawi Amid Coronavirus Pandemic.” AfricaNews, September 4, 2020.
Davis, Benjamin et al., eds. 2016. From Evidence to Action: The Story of Cash Transfers and Impact Evaluation in Sub-Saharan Africa. Oxford: FAO, UNICEF and Oxford University Press.
de Milliano, Marlous and Ilze Plavgo. 2014. “Cross Country Multiple Overlapping Deprivation Analysis: Analysing Child Poverty and Deprivation in SSA.” UNICEF Office of Research Working Paper No. 19, UNICEF, Florence.
DFID. 2011. “Cash Transfers.” Evidence Paper, Policy Division, April 2011, DFID, London.
Edwards, Jess. 2020. Protect a Generation: The Impact of COVID-19 on Children’s Lives. London: Save the Children.
Egger, Dennis et al. 2019. “General Equilibrium Effects of Cash Transfers: Experimental Evidence from Kenya.” Maseno University and the University of California, Berkeley Working Paper.
Elliot, Larry. 2020. “Campaigners Urge IMF to Sell Gold to Provide Debt Relief.” The Guardian, October 11, 2020.
FAO (Food and Agriculture Organization). 2020a. “Desert Locust Bulletin.” No. 502, August 3, 2020, FAO, Rome.
_______. 2020b. “Forecasting Threats to the Food Chain Affecting Food Security in Countries and Regions.” Food Chain Crisis Early Warning Bulletin No. 35, April-June 2020, FAO, Rome.
_______. 2019. FAO Framework on Rural Extreme Poverty. Rome: FAO.
FEWSN (Famine Early Warning Systems Network). 2020a. “Southern Africa Food Security Outlook: June 2020 to January 2021.” Briefing Note, August 2020, FEWSN, Washington, DC.
_______. 2020b. “West Africa Food Security Outlook: June 2020 to January 2021.” Briefing Note, August 2020, FEWSN, Washington, DC.
_______. 2020c. “East Africa Food Security Outlook: June 2020 to January 2021.” Briefing Note, July 2020, FEWSN, Washington, DC.
FNSWG (Food and Nutrition Security Working Group). 2020. “Food and Nutrition Security Bulletin: Southern Africa.” Bulletin 2, July 2020, FNSWG, Nairobi.
Fraser, Erika. 2020. “Impact of COVID-19 Pandemic on Violence Against Women and Girls.” VAWG Helpdesk Research Report No. 284, DFID, London.
G20. 2020. “Communiqué.” G20 Finance Ministers and Central Bank Governors Meeting (virtual), April 15, 2020, G20.
Garcia, Marito and Charity Moore. 2012. The Cash Dividend: The Rise of Cash Transfer Programs in Sub-Saharan Africa. Washington, DC: World Bank.
Gentilini, Ugo et al. 2020. “Social Protection and Jobs Responses to COVID-19: A Real-Time Review of Country Measures.” Living Paper Version No. 13, September 18, 2020, World Bank, Washington, DC.
Global Financing Facility. 2020. “Modeling the Impacts of COVID-19 on RH Options.” Micro Modelling Tool, June 9, 2020, Reproductive Health Supplies Coalition, Brussels.

43
COVID-19: A Catastrophe for Children in Sub-Saharan Africa
Godfrey, Sam, and Farai Tunhuma. 2020. The Climate Crisis: Climate Change Impacts. Trends and Vulnerabilities of Children in Sub Saharan Africa. Nairobi: UNICEF ESARO.
Handa, Sudhanshu et al. 2017. “Myth-busting? Confronting Six Common Perceptions about Unconditional Cash Transfers as a Poverty Reduction Strategy in Africa.” The Transfer Project and UNICEF Office of Research - Innocenti Working Paper. No. 11, UNICEF, Florence.
Headey, Derek et al. 2020. “Impacts of COVID-19 on Childhood Malnutrition and Nutrition-related Mortality.” The Lancet 396(10250): 519-521.
Hillis, Sandra et al. 2016. “Global Prevalence of Past-year Violence against Children: A Systematic Review and Minimum Estimates.” Pediatrics 137(3): January 25, 2016.
Hoogeveen, Johannes and Utz Pape, eds. 2020. Data Collection in Fragile States Innovations from Africa and Beyond. Washington, DC: World Bank.
IGAD Climate Prediction & Applications Centre (ICPAC). 2020. “Dry and Warm Season Expected across Eastern Africa (October - December 2020).” Press Release, August 26, 2020.
IMF. 2020a. “COVID-19 Financial Assistance and Debt Service Relief.” September 29, 2020 update, IMF, Washington, DC.
_______. 2020b. “Background Note for Mobilizing Africa II.” High-Level Virtual Event 2020 Annual Meetings, October 9, 2020, Washington, DC.
_______. 2020c. “Gold in the IMF.” Factsheet, March 23, 2020, IMF, Washington, DC.
International Policy Centre for Inclusive Growth. 2015. “The Impact of Cash Transfers on Local Economies.” Policy in Focus 11(1), UNDP.
International Rescue Community. 2020. Emergency Watchlist 2020. New York: International Rescue Community.
Jowett, Matthew et al. 2016. “Spending Targets for Health: No Magic Number.” Health Financing Working Paper No. 1. WHO, Geneva.
Kaffenberger, Michelle. 2020. “Modeling the Long-Run Learning Impact of the COVID-19 Learning Shock: Actions to (More Than) Mitigate Loss.” RISE Insight Series, No. 2020/017, Rise, Oxford.
Kenya, National Bureau of Statistics. 2020a. “Survey on Socio Economic Impact of COVID-19 on Households Report.” Wave 2 Report, June 30, 2020, Government of Kenya, Nairobi.
_______. 2020b. “Survey on Socio Economic Impact of COVID-19 on Households Report.” Wave 1 Report, May 15, 2020, Government of Kenya, Nairobi.
Kituyi, Mukhisa. 2020. “Africa Needs a Marshall Plan to Ride Out COVID-19 Crisis; Prepare for Uncertain Times.” The East African, April 11, 2020.
Komives, Kristin et al. 2005. Water. Electricity. and the Poor: Who Benefits from Utility Subsidies? Washington, DC: World Bank.
Kostelny. K. et al. 2016. “‘Worse than the War’: An Ethnographic Study of the Impact of the Ebola Crisis on Life. Sex. Teenage Pregnancy and a Community-driven Intervention in Rural Sierra Leone.” London: Save the Children.
Latif Dahir, Abdi. 2020. “Kenya’s Health Workers. Unprotected and Falling Ill. Walk Off Job.” New York Times, 21 August 2020.
Lederer, Edith. 2020. “UN Chief Warns of Famine Risk in 4 Countries.” The Washington Post, September 5, 2020.
Malawi, National Statistical Office and World Bank. 2020. “Malawi High-Frequency Phone Survey COVID-19.” July 2020 Baseline Summary Note, World Bank, Washington, DC.
Momoh, Mohammed. 2020. “Nigeria Records High COVID-19 Deaths as Strike by Doctors Bites.” The East African, June 17, 2020.
Moyo, Dambisa. 2020. “Marshall Plan” for Africa: America and Europe should Provide Direct Cash Transfers to Africans to Alleviate the Covid Crisis.” The Economist, May 5, 2020.
Mwangi, Nyawira. 2020. “Sierra Leone Doctors’ Strike Leaves COVID-19 Patients Stranded.” CGTN, July 3, 2020.
Norwegian Refugee Council. 2020. “An Unnecessary Burden: Forced Evictions and COVID-19.” Briefing Note, July 2020, Norwegian Refugee Council, Oslo.
O’Brien, Clare et al. 2018. Shock-Responsive Social Protection Systems: Synthesis Report. London: Overseas Development Institute (ODI).
Ortiz, Isabel et al. 2017. “Fiscal Space for Social Protection and the SDGs: Options to Expand Social Investments in 187 Countries.” ESS Working Paper No. 48, ILO, Geneva.
Ortiz, Isabel and Matthew Cummins, eds. 2012. A Recovery for All: Rethinking Socio-Economic Policies for Children and Poor Households. New York City: UNICEF.
Partridge-Hicks, Sophie. 2020. “Rise in Teenage Pregnancies in Kenya Linked to COVID-19 Lockdown.” Global Citizen, August 19, 2020.
Prady, Delphine and Mouhamadou Sy. 2019. “The Spending Challenge for Reaching the SDGs in Sub-Saharan Africa: Lessons Learned from Benin and Rwanda.” IMF Working Paper No. 19/270, IMF, Washington, DC.
Rigby, Jennifer. 2020. “Child Marriages Skyrocket in Malawi as COVID-19 Closes Schools. Figures Show.” The Telegraph, August 14, 2020.
Risso-Gill, Isabelle, and Leah Finnegan. 2015. Children’s Ebola Recovery Assessment: Sierra Leone. Save the Children, World Vision International, Plan International and UNICEF.
Roberton, Timothy et al. 2020. “Early Estimates of the Indirect Effects of the COVID-19 Pandemic on Maternal and Child Mortality in Low-income and Middle-income Countries: A modelling study.” The Lancet 8(7): E901-E908.
SADC (Southern African Development Community). 2020. Synthesis Report on the State of Food and Nutrition Security and Vulnerability in Southern Africa. Gaborone: SADC.
Save the Children. 2020. “Cyclone Idai One Year On: Southern Africa Still Devastated and Vulnerable to Climate Shocks.” Press Release, March 10, 2020.
_______. 2019. “2019: Natural Disasters Claim More than 1,200 Lives Across East and Southern Africa.” Press Release, December 2, 2019.
Reuters. 2020. “Malawi Launches $40 Monthly Cash Transfers to Combat Coronavirus Impact.” Reuters, April 29, 2020.
Schwartz, David et al. 2018. “Effects of the West African Ebola Epidemic on Health Care of Pregnant Women: Stigmatization with and Without Infection.” Pregnant in the Time of Ebola: Women and Their Children in the 2013-2015 West African Epidemic (August 10, 2018): 11-30.
Segal, Stephanie and Dylan Gerstel. 2020. “Breaking Down the G20 Covid-19 Fiscal Response: June 2020 Update.” Commentary, July 2, 2020, Center for Strategic and International Studies, Washington, DC.
Stone, Madeleine. 2020. “A Plague of Locusts has Descended on East Africa. Climate Change may be to Blame.” National Geographic, February 20, 2020.
Street Child. 2020. COVID-19 Response Rapid Assessment Report, May 2020. London: Street Child.
Tarnoff, Curt. 2018. The Marshall Plan: Design. Accomplishments and
44
COVID-19: A Catastrophe for Children in Sub-Saharan Africa
Significance Specialist in Foreign Affairs. Report No. R45079, U.S. Congressional Research Service, Washington, DC.
The Transfer Project. 2016. “How Much do Programmes Pay? Transfer Size in Selected National Cash Transfer Programmes in sub-Saharan Africa.” Research Brief, University of North Carolina and UNICEF.
Thome, Karen et al. 2016. “The Local Economy Impacts of Social Cash Transfers: A Comparative Analysis of Seven sub-Saharan Countries.” FAO Working Paper, FAO, Rome.
Twinoburyo, Enock Nyorekwa et al. 2019. Africa 2030: Sustainable Development Goals Three-Year Reality Check. Kigali: Sustainable Development Goals Center for Africa.
UN (United Nations). 2020. “Flooding Leaves South Sudan Facing Threat of ‘Catastrophic’ Hunger Levels.” UN News, September 29, 2020.
UN Country Team Kenya. 2020. “Emergency Appeal: Kenya. April-September 2020.” July 2020 Revision, United Nations Country Team Kenya, Nairobi.
UNAIDS (Joint United Nations Programme on HIV/AIDS). 2020. Progress Towards the Start Free, Stay Free, AIDS Free Targets: 2020 Report. Geneva: UNAIDS.
UNCTAD (United Nations Conference on Trade and Development). 2016. Target 17.2: ODA commitments. Development and Globalization Facts and Figures. Geneva: UNCTAD, pp. 160-161.
UNDP (United Nations Development Program) and OPHI (Oxford Poverty and Human Development Initiative. 2020. Charting Pathways out of Multidimensional Poverty: Achieving the SDGs. New York City: UNDP and OPHI.
UNDP and Irish Aid. 2015. Assessing Sexual and Gender Based Violence during the Ebola Crisis in Sierra Leone. Freetown: UNDP.
UNECA (United Nations Economic Commission for Africa). 2020. “Report on African Ministers of Finance Meeting: Emergency Request to the International Community on COVID-19 Response.” Letter to G20, African Development Bank, World Bank and IMF, March 22, 2020.
UNESCO (United Nations Educational, Scientific and Cultural Organization). 2019. “New Methodology Shows that 258 Million Children. Adolescents and Youth Are Out of School.” Fact Sheet No. 56, UNESCO, Paris.
_______. 2017. “More Than One-Half of Children and Adolescents Are Not Learning Worldwide.” Fact Sheet No. 46, UNESCO, Paris.
UNFPA (United Nations Population Fund). 2020. “Impact of the COVID-19 Pandemic on Family Planning and Ending Gender-based Violence. Female Genital Mutilation and Child Marriage.” Interim Technical Note, UNFPA, New York City.
UNICEF (United Nations Children’s Fund). 2020a. “COVID-19: Are Children Able to Continue Learning During School Closures?” Factsheet, August 2020, UNICEF, New York City.
_______. 2020b. “COVID-19: Children at Heightened Risk of Abuse. Neglect. Exploitation and Violence Amidst Intensifying Containment Measures.” Press Release, March 20, 2020.
_______. 2020c. “Tracking the Situation of Children during COVID-19.” Dashboard, August 2020, UNICEF, New York City.
_______. 2020d. Universal Child Benefits: Policy Issues and Options. New York City: UNICEF.
_______. 2018. Advantage or Paradox? The Challenge for Children and Young People of Growing Up Urban. New York City: UNICEF.
_______. 2016. One is too Many: Ending Child Deaths from Pneumonia and Diarrhoea. New York City: UNICEF.
UNICEF Burkina Faso. 2020a. “More than Half a Million Children Under Five in Burkina Faso are Acutely Malnourished.” Press Release, September 9, 2020.
_______. 2020b. “Burkina Faso Country Office COVID-19 Situation Report, No. 4.” 25 June to 22 July 2020 Reporting Period, UNICEF Burkina Faso, Ouagadougou.
UNICEF Ethiopia. 2020. “Ethiopia Country Office Humanitarian Situation Report.” April to May 2020 Reporting Period, UNICEF Ethiopia, Addis Ababa.
UNICEF Ghana. 2020. “Ghana Country Office COVID-19 Situation Report, No. 3.” 01-15 May 2020 Reporting Period, UNICEF Ghana, Accra.
UNICEF Niger. 2020. “Niger Country Office COVID-19 Situation Report, No. 8.” 08-21 June 2020 Reporting Period, UNICEF Niger, Niamey.
UNICEF Nigeria. 2020. “Nigeria Country Office COVID-19 Situation Report, No. 5.” 18-24 April 2020 Reporting Period, UNICEF Nigeria, Abuja.
UNICEF Somalia. 2020. “Somalia Humanitarian Situation Report.” 1-31 August 2020 Report Period, UNICEF Somalia, Mogadishu.
UNICEF and Save the Children. 2020. “Children in Monetary Poor Households and COVID-19.” Technical Note, June 2020, UNICEF and Save the Children, New York City.
UNOCHA (United Nations Office for the Coordination of Humanitarian Affairs). 2020a. “Southern and Eastern Africa COVID-19 Digest.” Situation Report, August 28, 2020, UNOCHA, Nairobi.
_______. 2020b. “Weekly RIASCO Humanitarian Update.” June to September 2020 editions, UNOCHA, Nairobi.
_______. 2020c. “Democratic Republic of the Congo: From One Crisis to Another.” Exposure, July 28, 2020, UNOCHA.
_______. 2019. “Cyclones Idai and Kenneth.” Briefing Note, UNOCHA, Nairobi.
UNOCHA Burkina Faso. 2020. “Burkina Faso Situation Report.” June 30, 2020 Update, UNOCHA Burkina Faso, Ouagadougou.
UNOCHA Burundi. 2020. “Burundi Situation Report.” June 30, 2020 Update, UNOCHA Burundi, Bujumbura.
UNOCHA Kenya. 2020. “Kenya Situation Report.” August 10, 2020 Update, UNOCHA Kenya, Nairobi.
UNOCHA Mozambique. 2020. “Mozambique Situation Report.” September 10, 2020, UNOCHA Mozambique, Maputo.
UNOCHA Niger. 2020. “Niger Situation Report.” July 20, 2020 Update, UNOCHA Niger, Niamey.
UNOCHA Nigeria. 2020. “Nigeria Situation Report.” September 23, 2020 Update, UNOCHA Nigeria, Abuja.
UNOCHA Sudan. 2020a. “Sudan Situation Report.” October 1, 2020 Update, UNOCHA Sudan, Khartoum.
_______. 2020b. “Sudan: Escalation of Violence in Darfur - Flash Update No. 3.” July 28, 2020 Update, UNOCHA Sudan, Khartoum.
UNOCHA Zimbabwe. 2020. “Zimbabwe Situation Report.” August 21, 2020 Update, UNOCHA Zimbabwe, Harare.
Watkins, Kevin. 2020. “How to Prevent the 2020s from Becoming a Lost Decade for Children.” Devex News, May 12, 2020.
Weiss, Daniel et al. 2020. “Indirect Effects of the COVID-19 Pandemic on Malaria Intervention Coverage. Morbidity. and Mortality in Africa: A Geospatial Modelling Analysis.” The Lancet (September 21, 2020).
Wesseh. C.S. et al. 2017. “Did the Ebola Outbreak Disrupt Immunisation Services? A case study from Liberia.” Public Health Action 7(1): S82-S87.

45
COVID-19: A Catastrophe for Children in Sub-Saharan Africa
WFP (World Food Programme). 2020. “COVID-19 Situation Report #2.” WFP Regional Bureau, Dakar, June 30, 2020.
WHO (World Health Organization). 2020a. The Potential Impact of Health Service Disruptions on the Burden of Malaria: A Modelling Analysis for Countries in Sub-Saharan Africa. Geneva: World Health.
_______. 2020b. “COVID-19 Situation Update for the WHO Africa Region.” External Situation Report. No. 26, August 26, 2020, WHO, Geneva.
_______. 2018. Nurturing Care for Early Childhood Development: A Framework for Helping Children Survive and Thrive to Transform. Geneva: World Health Organization.
_______. 2010. Constraints to Scaling up the Health Millennium Development Goals: Costing and Financial Gap Analysis. Background document for the Taskforce on Innovative International Financing for Health Systems, Geneva: WHO.
WHO and UNICEF. 2020. “Ending Preventable Newborn Deaths and Stillbirths by 2030.” Brochure, WHO and UNICEF.
World Bank. 2020a. The Human Capital Index 2020 Update: Human Capital in the Time of COVID-19. Washington, DC: World Bank.
_______. 2020b. “COVID-19 Impact Monitoring: Round 3. July 2020.” Nigeria National Bureau of Statistics and World Bank, Washington, DC.
_______. 2020c. “COVID-19 Impact Monitoring: Round 1. June 2020.”
Uganda Bureau of Statistics and World Bank, Washington, DC.
_______. 2020d. “COVID-19: Debt Service Suspension Initiative.” Brief, September 29, 2020, World Bank, Washington, DC.
_______. 2020e. “World Bank Group’s Operational Response to COVID-19 (coronavirus) – Projects List.” Brief, September 30, 2020, World Bank, Washington, DC.
_______. 2020f. “World Bank COVID-19 Response.” Factsheet, October 14, 2020.
World Meteorological Organization. 2020. “El Niño/La Niña Update: August 2020.” World Meteorological Organization, Geneva.
World Vision International. 2020a. COVID-19 Aftershocks: Secondary Impacts Threaten more Children’s Lives than Disease Itself. Uxbridge: World Vision International.
_______. 2020b. COVID-19 Aftershocks: A Perfect Storm: Millions More Children at Risk of Violence under Lockdown and into the ‘New Normal. Uxbridge: World Vision International.
_______. 2020c. “COVID-19 & Poverty and Hunger.” Policy Brief, World Vision International, Uxbridge.

46
COVID-19: A Catastrophe for Children in Sub-Saharan Africa
Databases
For quick reference, below is a list of all databases used in the report. They are organized by themes and presented in alphabetical order unless stated otherwise.
The economy• AfDB African Economic Outlook (July 2020 Update)• Economist Intelligence Unit (April-May 2020 country
projections)• IMF World Economic Outlook Database (October 2020
Edition)• IMF Regional Economic Outlook for SSA (June 2020
Update)• IMF World Economic Outlook Database (October 2019
Edition)• World Bank Global Economic Prospects (June 2020
Update)
Demography • UNDESA World Population Prospects (2019 Revision)• UNDESA World Urbanization Prospects (2018 Revision)
Social indicators• IPC Analysis Portal (accessed September 29, 2020)• IPC Population Tracking Tool (accessed September 29,
2020)• World Bank PovcalNet (accessed August 15, 2020)• The Internal Displacement Monitoring Centre Global
Internal Displacement Database (December 31, Update)• UN Habitat Urban Indicators Database (May 19, 2020
Update)• UN Inter-agency Group for Child Mortality Estimation
(September 2019 Update)• UNESCO Global Monitoring of School Closure Caused by
COVID-19 (accessed September 29, 2020)• UNESCO Institute for Statistics (accessed September 29,
2020)• UNHCR Refugee Population Statistics Database (June 18,
2020 Update)• UNICEF/WHO/World Bank Joint Malnutrition Estimates
Expanded Databases (July 2020 Update)• WFP Global Monitoring of School Meals During COVID-19
School Closures (accessed September 29, 2020)• WHO Global Health Workforce Statistics (December 2018
Update)• WHO/UNICEF Joint Monitoring Programme for Water
Supply and Sanitation (July 2019 Update)
Poverty estimates (in chronological order)• UNU-WIDER (April 2, 2020)• Save the Children (April 9, 2020)• IFPRI (April 16, 2020) • UNECA (April 24, 2020)• World Bank (April 20, 2020)• World Bank (June 8, 2020)• UNU-WIDER (June 12, 2020)• UNICEF and Save the Children (June 29, 2020)• AfDB (July 7, 2020)
Social protection monitoring• Gentilini et al. Global Database on Social Protection and
Jobs Responses to COVID-19 (September 18, 2020, version 13)
• IFPRI COVID-19 Policy Response Portal (September 4, 2020 Update)
• ILO Social Protection Responses to COVID-19 Crisis Around the World Database (September 1, 2020 Update)
International and domestic finance• AfDB COVID-19 Response Facility (accessed October 15,
2020)• Devex Funding the Response to COVID-19 Database
(October 11, 2020 update)• IMF COVID-19 Financial Assistance (accessed October 15,
2020)• IMF Debt Service Relief from the Catastrophe
Containment and Relief Trust (October 15, 2020 update)• IMF Financial Data Query Tool (accessed October 15,
2020)• Milken Institute COVID-19 Africa Watch: Fiscal Policy
Responses Database (September 8, 2020 update)• UNOCHA COVID-19 Response Tracking Prototype
Database (accessed October 15, 2020)• World Bank COVID-19: Debt Service Suspension Initiative
(September 30, 2020 update)• World Bank Loans and Credit Database (accessed October
15, 2020)• World Bank Operational Response to COVID-19: Projects
List (accessed October 15, 2020)


48
COVID-19: A Catastrophe for Children in Sub-Saharan Africa
UNICEF Eastern and Southern Africa Regional OfficeP.O. Box 44145, Nairobi, Kenya
UNICEF West and Central Africa Regional OfficeP.O. Box 29720, Dakar, Senegal
For more information, please contact:Matthew Cummins, [email protected] or Paul Quarles Van Ufford, [email protected]
© United Nations Children’s Fund (UNICEF)
Copyright © 2022 FDOKUMEN