Contaminated Soils: Pilot-Scale Studies (Phase II)
216
onvl ORNUTM-12960 OAK RIDGE NATIONAL LABORATORY MARTIN MARIETTA Carbonate and Citric Acid Leaching of Uranium from Uranium- Contaminated Soils: Pilot-Scale Studies (Phase II) J. H. Wilson R. Chernikoff W. D. DeMarco C. W. Francis L. L. Stebbins MANAGED BY MARTIN MARIEHA ENERGY SYSTEMS, INC. FOR THE UNITED STATES DEPARTMENT OF ENERGY TER DISTRIBUTION OF THIS DOCUMENT IS UNLMTBD /A
-
Upload
khangminh22 -
Category
Documents
-
view
1 -
download
0
Transcript of Contaminated Soils: Pilot-Scale Studies (Phase II)
onvl ORNUTM-12960
OAK RIDGE NATIONAL LABORATORY
MARTIN MARIETTA
Carbonate and Citric Acid Leaching of Uranium from Uranium-
Contaminated Soils: Pilot-Scale Studies (Phase II)
J . H. Wi lson R. Chernikoff
W. D. DeMarco C. W. Francis L. L. Stebbins
MANAGED BY MARTIN MARIEHA ENERGY SYSTEMS, INC. FOR THE UNITED STATES DEPARTMENT OF ENERGY
TER DISTRIBUTION OF THIS DOCUMENT IS UNLMTBD
/A
This report has been reproduced directly from the best available copy.
Available to DOE and DOE contractors from the Office of Scientific and Technical Information, P.O. Box 62, Oak Ridge, TN 37831; prices available from (615) 576-8401, FTS 626-8401.
Available to the public from the National Technical Information Service, U.S. Department of Commerce, 5285 Port Royal Rd., Springfield, VA 22161.
This report was prepared as an account of work sponsored by an agency of the United States Government. Neither the United States Government nor any agency thereof, nor any of their employees, makes any warranty, express or implied, or assumes any legal liability or responsibility for the accuracy, completeness, or usefulness of any information, apparatus, product, or process disclosed, or represents that its use would not infringe privately owned rights. Reference herein to any specific commercial product, process, or service by trade name, trademark, manufacturer, or otherwise, does not necessarily constitute or imply its endorsement, recommendation, or favoring by the United States Government or any agency thereof. The views and opinions of authors expressed herein do not necessarily state or reflect those of the United States Government or any agency thereof.
ORNL/TM-12960
Chemical Technology Division
CARBONATE AND CITRIC ACID LEACHING OF URANIUM FROM URANIUM-CONTAMINATED SOILS:
PILOT-SCALE STUDIES (PHASE II)
J. H. Wilson R. Chernikoff*
W. D. DeMarco* C. W. Francis+
L. L. Stebbins*
*FERMCO, Fernald, Ohio f Environmental Sciences Division
Date Published: October 1995
Prepared for the Office of Technology Development
(EW 40 10 40 0)
Prepared by the OAK RIDGE NATIONAL LABORATORY
Oak Ridge, Tennessee 37831-6285 managed by
LOCKHEED MARTIN ENERGY SYSTEMS, INC. for the
U.S. Department of Energy under contract DE-AC05-84OR21400
MAST
DISCLAIMER
Portions of this document may be illegible in electronic image products. Images are produced from the best available original document.
CONTENTS
LIST OF FIGURES v
LIST OF TABLES vii
ACRONYMS ix
PROJECT PARTICIPANTS LIST xi
EXECUTIVE SUMMARY xiii
1. INTRODUCTION 1 1.1 DOCUMENT PURPOSE 1 1.2 INTEGRATED DEMONSTRATION PROJECT DESCRIPTION 1 1.3 HOST SITE DESCRIPTION AND NEED FOR URANIUM REMEDIATION 3
2. PROJECT OBJECTIVE AND STRATEGY 5
3. TREATABILITY SOIL DESCRIPTION 7 3.1 SEWAGE TREATMENT PLANT/WASTE INCINERATOR AREA
(INCINERATOR SOIL) 7 3.2 PLANT 1 PAD (STORAGE PAD SOIL) 8 3.3 SOIL PREPARATION 8
4. FERNALD PILOT-SCALE TEST UNIT 10 4.1 BACKGROUND 10 4.2 TEST UNIT DESCRIPTION 10 4.3 CENTRIFUGE OPERATION 14
5. SUMMARY OF EXPERIMENTAL AND SAMPLING PLANS 18 5.1 EXPERIMENTAL DESIGN 18 5.2 SAMPLING AND ANALYSIS PLAN AND PROCESS DATA ACQUISITION . . . 21
6. DATA ANALYSIS PROCEDURES 22 6.1 MATERIAL BALANCE AND REACTOR KINETICS CALCULATIONS 22 6.2 STATISTICAL ANALYSIS PROCEDURES 23
7. EXPERIMENTAL SUMMARY 27 7.1 OPERATIONS SUMMARY 27 7.2 PROCESS DATA 29 7.3 ANALYTICAL DATA 29
8. RESULTS OF DATA ANALYSIS AND DISCUSSION 30 8.1 EXPERIMENTAL VARIANCES 30
Hi
8.2 MATERIAL BALANCES 31 8.2.1 Storage Pad Soil 34 8.2.2 Incinerator Soil 42 8.2.3 Slurry Measurement Problems 43
8.3 REACTOR KINETICS 44 8.3.1 Storage Pad Soil 51 8.3.2 Incinerator Soil 51 8.3.3 Effect of Slurry Measurement Problems 52
8.4 SOIL DECONTAMINATION 54 8.4.1 Storage Pad Soil 54 8.4.2 Incinerator Soil 59
9. RESULTS OF TESTS CARRIED OUT AT "OPTIMUM" CONDITIONS 61 9.1 BASIS FOR EXPERIMENTAL CONDITIONS 61 9.2 EXPERIMENTAL SUMMARY 62 9.3 DISCUSSION OF RESULTS 63
9.3.1 Material Balances 63 9.3.2 Soil Decontamination 65 9.3.3 Decontamination of Trommel Oversize 67
10. CONCLUSIONS 68
11. RECOMMENDATIONS 69
12. REFERENCES 70
APPENDIX A—PROCESS FLOW SHEETS 71
APPENDIX B—PROCESS DATA 97
APPENDIX C—ANALYTICAL RESULTS 137
APPENDIX D—DETAILED MATERIAL BALANCES 181
iv
LIST OF FIGURES
Figure Page
1 Process flow diagram of soil leaching test unit used for Phase II 11 2 Schematic diagram of centrifuge 15 3 Storage pad soils — analysis of feed soils 32 4 Incinerator soils — analysis of feed soils 33 5 Solids balance for storage pad soils 37 6 Solids balance for incinerator soils 38 7 Uranium balance for storage pad soils 39 8 Uranium balance for incinerator soils 40 9 Storage pad soils — uranium concentration in reactor solution vs time 45
10 Incinerator soils — uranium concentration in reactor solution vs time 46 11 Storage pad soils — percent uranium decontamination in reactor vs time 48 12 Incinerator soils — percent uranium decontamination in reactor vs time 49 13 Storage pad soil tests — uranium concentration in treated soil 57 14 Incinerator soil tests — uranium concentration in treated soil 58
v

LIST OF TABLES
Table Page
1 Summary of conditions for Phase II batch tests 19 2 Outlet streams for material balance calculations 23 3 Test summary 28 4 Statistical parameters for feed soils 31 5 Statistical parameters for replicate tests 34 6 Solids and uranium material balances for storage pad soil tests 35 7 Solids and uranium material balances for incinerator soil tests 36 8 Soil decontamination results for storage pad soil tests 55 9 Soil decontamination results for incinerator soil tests 56
10 Summary of final Phase II tests 62 11 Solids and uranium material balances for final Phase II tests 64 12 Soil decontamination results for final Phase II tests 66 13 Uranium concentration in soil from leaching and rinsing steps 67
vii

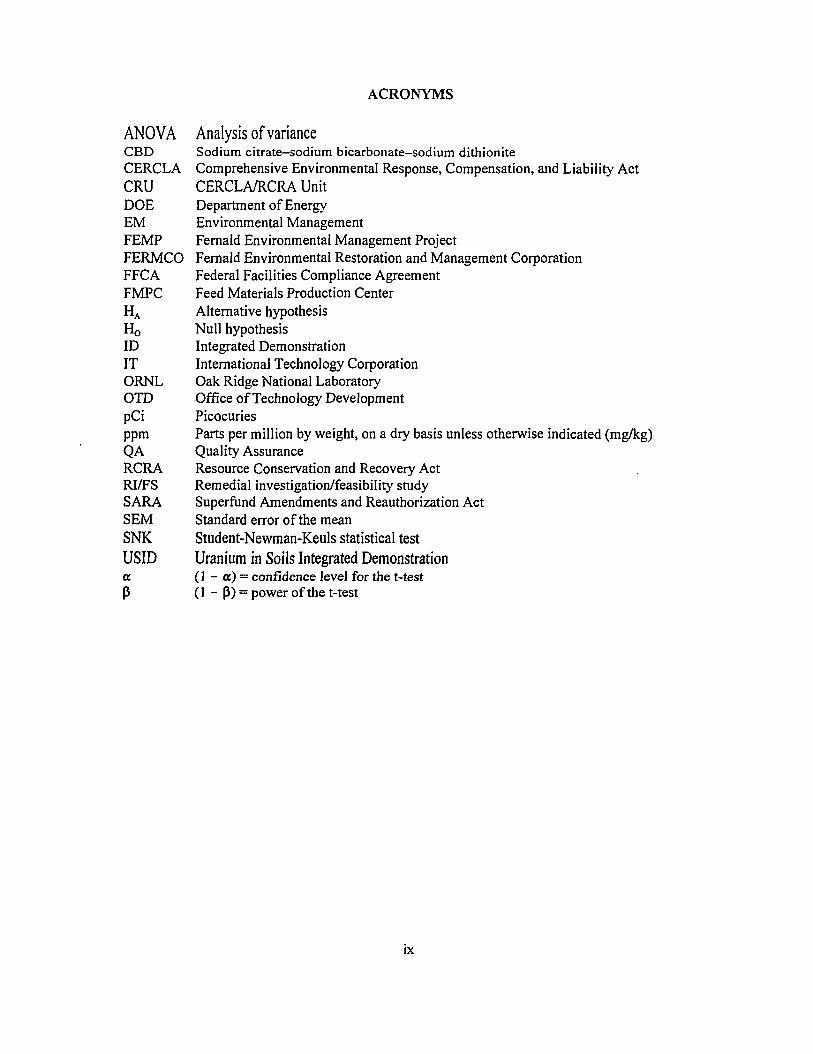
ACRONYMS
ANOVA Analysis of variance CBD Sodium citrate—sodium bicarbonate—sodium dithionite CERCLA Comprehensive Environmental Response, Compensation, and Liability Act CRU CERCLA/RCRA Unit DOE Department of Energy EM Environmental Management FEMP Fernald Environmental Management Project FERMCO Fernald Environmental Restoration and Management Corporation FFCA Federal Facilities Compliance Agreement FMPC Feed Materials Production Center H A Alternative hypothesis Ho Null hypothesis ID Integrated Demonstration IT International Technology Corporation ORNL Oak Ridge National Laboratory OTD Office of Technology Development pCi Picocuries ppm Parts per million by weight, on a dry basis unless otherwise indicated (mg/kg) QA Quality Assurance RCRA Resource Conservation and Recovery Act RI/FS Remedial investigation/feasibility study SARA Superfund Amendments and Reauthorization Act SEM Standard error of the mean SNK Student-Newman-Keuls statistical test USID Uranium in Soils Integrated Demonstration a (1 - a) = confidence level for the t-test P (1 - P) = power of the t-test
IX

PROJECT PARTICIPANTS LIST
ID Project Contacts
R. Chernikoff, ORNL (513)738-6886 W. D. DeMarco, FERMCO (513) 648-6106 K. R. Nuhfer, FERMCO (513) 648-6556 L. L. Stebbins, FERMCO (513) 738-9023
Fernald Test Unit Operations
C. Clinefelter, FERMCO (Co-op) W. D. DeMarco, FERMCO (513) 648-6106 M. J. Geyer, FERMCO (513)648-6111 J. Goines, FERMCO (Co-op) M. Hofacre, FERMCO (Co-op) K. L. Pylka, FERMCO (513)648-6133 M. W. Salisbury, FERMCO (513)648-6138 W. Schmidt, FERMCO (Co-op) J. H. Wilson, ORNL (615)576-4413 S. Wolfe, FERMCO (Co-op)
Fernald Test Unit Sampling
M. A. Arnett, FERMCO (513) 73 8-93 81 W. A. Neyer, FERMCO (513)738-9381 R. Nowlin, FERMCO (513) 738-9381
CRU5 Project Contacts
D. M. Gerrick, FERMCO (513)738-6180 M. A. Krstich, FERMCO (513) 648-6231
ORNL Support
M. P. Elless, ORNL (615) 576-8192 C. W. Francis, ORNL (615)574-7257 M. E. Timpson, ORNL (615) 576-8192
X I

EXECUTIVE SUMMARY
To help meet the Department of Energy (DOE) cleanup goals of the nuclear waste sites such as the Fernald Environmental Management Project (FEMP) in Ohio, one program initiated by the Office of Technology Development (OTD) of DOE was the Integrated Demonstration (ID) of technologies program. The ID program focuses on improving/validating technologies by demonstrating effectiveness, cost savings, risk reduction potential, site applicability, and regulatory and public acceptance. Once such technologies have been demonstrated to embody the above criteria, efforts are then made for the technologies to be transferred for implementation throughout the DOE and the private sector.
One of the major problems facing the DOE Environmental Restoration Program is the remediation of uranium-contaminated soils. In response to this problem, OTD initiated the Uranium in Soils Integrated Demonstration (USID) program to evaluate and compare the versatility, efficiency, and economics of various technologies for the characterization and remediation of uranium-contaminated soils. The FEMP was selected as the host site for the USID program based on its past operating history and known environmental problems. In support of the USID program, soil leaching was to be evaluated at the pilot scale as a viable technology for remediation of contaminated soils at FEMP.
As part of the remedial investigation/feasibility study (RI/FS) for the Fernald facility, treatability studies directed at leaching uranium from several soil samples from the Fernald site were conducted by the International Technology Corporation (IT). Also, as part of the remedial technology selection process of the RI/FS, the Fernald Environmental Restoration and Management Corporation (FERMCO — the site manager for FEMP) CERCLA*/RCRAt Unit 5 constructed and installed a pilot-scale test unit for soil decontamination at Fernald (CRU5 — the technical strategy adopted by the CERCLA program divides the site into distinct operable units, the management team for each unit being known as a CRU). FERMCO CRU5 performed batch leaching studies using the test unit with the support of IT as the final phase of the RI/FS.
Under the USID program, the Oak Ridge National Laboratory (ORNL) has also carried out bench-scale studies on the leaching of uranium from soils. These studies have included tests with various leachants and pretreatment/leachant combinations. The results of the ORNL studies are summarized in the Phase II test plan.1 After completion of the CRU5 work, modifications were made to the Fernald test unit and Phase II leaching studies were then conducted. The experimental design of these pilot-scale tests was based on the ORNL bench-scale results. Operations were performed by FERMCO and ORNL personnel.
The Phase II studies were an outgrowth of the integration of the pilot-scale work of CRU5 and the USID in 1991. The integration of the two programs' operations was organized into three phases. These are as follows:
PHASE I This is the FERMCO CRU5 portion of the soil decontamination studies on the Fernald test unit, cited above.
PHASE II This phase was conducted by the USID group with the support of ORNL, CRU5, and the FERMCO treatability group. This report describes the results of the PHASE II CRU5/USID batch soil leaching treatability studies. Data from this phase may be made available for CRU5 to use in the RI/FS.
* Comprehensive Environmental Response, Compensation, and Liability Act. f Resource Conservation and Recovery Act.
xiii
PHASE III This phase was also to have been conducted by the USID group, with the same supporting organizations as Phase II. Plans were that the tests will be leaching studies with the Femald test unit configuration modified to run in a continuous soil processing mode. This phase was canceled.
The ultimate goal of this project was to develop data on the efficiency and operability of the soil decontamination process that can be used for the design of a full-scale system. The purpose of the Phase II tests on the Fernald test unit was to assess the performance of selected leaching media and engineering process design for removal of uranium from soils in a pilot-scale unit. For the goal to be accomplished, there were several specific project objectives to be satisfied.
• The soil leaching process should produce a clean soil that has an uranium concentration level equal to or less than 52 ppm, the initial technology screening level adopted by the USID.
• The soil leaching process should decontaminate the soil without seriously degrading the soil's physicochemical characteristics (that might require its management or disposal as a waste) or generating a secondary waste form that is difficult to manage and/or dispose.
• Soil leaching tests, previously performed on the bench scale, should be demonstrated at the pilot scale. These results will be useful for full-scale application of the technology.
The results of the CRU5/USID Phases II and III are to be shared with CRU5 and incorporated in the CRU5 RI, as applicable.
The Fernald test unit was operated in a batch mode to demonstrate the removal of uranium from two contaminated soils. These soils had been taken from near the waste incinerator and near the plant 1 storage pad. The soils had been stored as unmodified soils and blended soils. The blended soils, which had been sifted and then processed in a concrete mixer to obtain homogeneity, were used for the final four tests of Phase II. For use in the rest of the Phase II tests, the unmodified soils were screened and then processed through a ribbon blender.
In the Phase II operations of the Fernald test unit, a drum of soil was processed in each test. The standard processing sequence involved (1) removal of coarse material from the soil in a trommel and a vibrating screen, (2) centrifuging the soil slurry to produce a nominal 20-fj.m size cut, (3) treating the coarse soil fraction in an attrition scrubber, and (4) recombining the two soil fractions and leaching with chemicals in a stirred reactor. This was followed by liquid/solid separation by centrifuging the reactor slurry and then rinsing the centrifuge wet cake to remove residual spent leaching solution from the treated soil.
The experimental design in the Phase II Test Plan consisted of 24 tests. Tests 0 through 19 were to be run and the test data analyzed before proceeding with the remaining tests. From the results of the analyses of the pilot-scale data for these first 20 tests and data from concurrent bench-scale tests, "optimum" operating conditions were to be selected for the final four tests.
In Tests 0 through 19, leaching tests were to be run with up to four different leaching agents on each of the two Fernald soils. These leachants, which were used in previous bench-scale studies, were sodium carbonate/sodium bicarbonate (with potassium permanganate in the incinerator soil tests), sodium citrate/sodium bicarbonate/sodium dithionite (CBD), citric acid, and sulfuric acid. Because of modifications required to the Fernald test unit, the two CBD tests were not run. Also, the two sulfuric acid tests were not run because it was determined that adequate data had been
xiv
generated in the Phase I tests. In addition to studying the effect of type of leachant on uranium removal, the experimental design included replicate tests to measure experimental variances and tests to determine the effects of leaching temperature and attrition scrubbing on uranium removal.
The analysis of the data generated in the Phase II tests included material balance calculations for solids and uranium using the analytical and process data. To check for consistency and to better characterize potential losses, three different material balances were made for each test; two were intermediate material balances (around certain sections of the pilot plant) and the third was an overall material balance taken around the entire pilot plant. The kinetics of the leaching reaction was examined by determining the percent of uranium leached from the soil as a function of time in the reactor. Statistical analyses were made to compare the uranium decontamination levels achieved in the tests with the technology screening level and to determine the effects of leachant type, attrition scrubbing, and reaction temperature on uranium leaching efficiency.
Based on the results of the analyses of the experimental data, the conclusions from the USID Phase II studies on the Fernald test unit are as follow:
• The preliminary decontamination target level of 52 ppm uranium was not achieved with either the incinerator area or the storage pad soil.
• In the replicated tests in the experimental design, the average uranium levels in the treated soil that were achieved with carbonate as leachant were 132 and 123 ppm for the storage pad soil and the incinerator area soil, respectively. In the final tests run under "optimum" operating conditions, uranium levels less than 100 ppm were attained. However, because of the lower uranium concentrations in the feed soils, no conclusion can be drawn about an effect of operating conditions.
• The average percent uranium decontamination was 92% for the storage pad soil and 83% for the incinerator area soil.
• Attrition scrubbing had no significant effect on decontamination efficiency.
• Increased reaction temperature significantly increased uranium decontamination for the incinerator area soil. No effect of temperature was observed for the storage pad soil.
• The rates of uranium leaching with carbonate and with citric acid are reasonably fast; within 30-60 min, the uranium removal is 90% or more of that reached at the end of the 120-min reaction period.
• Citric acid was apparently not as effective as sodium carbonate/sodium bicarbonate for leaching the incinerator area soil. However, the comparison was confounded by a significantly higher uranium concentration in the feed soil that was used in the citric acid test. Thus, no conclusion is made concerning the effect of leaching agent in the incinerator soil tests. For the storage pad soil, there was no significant difference between the two leaching agents.
xv
Based on the results from the USID Phase II tests, recommendations for the design and operation of a soil leaching process for uranium decontamination are as follow:
• Perform bench-scale studies to establish whether or not successive leaching steps improve overall leaching efficiency.
• Exclude attrition scrubbing from the soil leaching process, as this unit operation has no significant beneficial effect on leaching efficiency.
• Operate the leaching reactor(s) at 40°C.
• Specify a residence time of at least 1 hr in the design of a soil leaching process.
Although the preliminary decontamination target level of 52 ppm uranium was not achieved in the pilot plant tests, a significant portion of uranium was removed from the soils. The uranium remaining in the soil likely exists in a more refractory form. Because of the lower uranium concentrations and the apparent decreased mobility of the uranium, the soil leaching process may well produce a treated soil capable of meeting levels developed from risk-based analyses.
xvi
1. INTRODUCTION
1.1 DOCUMENT PURPOSE
The purpose of this document is to describe the results of the soil decontamination
demonstration conducted at the Fernald Environmental Management Project (FEMP) site by the
Fernald Environmental Restoration and Management Corporation (FERMCO) and the Oak Ridge
National Laboratory (ORNL). This demonstration, which began in November 1993 and ended in
October 1994, involved the removal of uranium from contaminated soil sampled from two FEMP
sites. The demonstration was conducted so as to meet the requirements of the Fernald Site
Integrated Demonstration program, as well as all environmental, safety, and health requirements of
the site.
1.2 INTEGRATED DEMONSTRATION PROJECT DESCRIPTION
To help meet the Department of Energy (DOE) cleanup goals for nuclear waste sites such as the
FEMP, the Director of Environmental Restoration and Waste Management initiated the Office of
Technology Development (OTD). One program formed by OTD was the Integrated Demonstration
(ID) program. The ID program focuses on improving/validating technologies by demonstrating
effectiveness, cost savings, risk reduction potential, site applicability, and regulatory and public
acceptance.
The FEMP was selected to host an ID program. The FEMP, previously known as the Feed
Materials Production Center (FMPC), is a contractor-operated federal facility for the remediation
of a site which produced high purity uranium metal for the DOE. As such, this ID program, known
as the Uranium in Soil Integrated Demonstration (USID) program, will address the issues from
"cradle to grave" surrounding the characterization and remediation of uranium-contaminated soils,
specifically soils with a high clay/silt content. Reduction of contaminated soil quantity, through the
coupling of real time analysis and precise excavation, along with decontamination techniques
applicable to high clay/silt soils are the major technology areas. Secondary waste reduction, cost
optimization, risk reduction, and user applicability are other important elements in this USID.
Soil leaching is one of the technologies identified as a viable option for remediation of
contaminated soils at Fernald.2 As part of a remedial investigation/feasibility study (RI/FS) for the
Fernald facility, lab-scale treatability studies directed at leaching uranium from several soil samples
from the Fernald site were conducted by the International Technology Corporation (IT).3 Also, as
part of the remedial technology selection process of the RI/FS, FERMCO, the FEMP facility
contractor, constructed a pilot-scale test unit for soil decontamination. This facility included several
engineering unit operations such as size separation, particle attrition, reaction, filtration, and
centrifugation, along with various pumps and storage and holding tanks. The FERMCO CRU5
installed the test unit at Fernald, and FERMCO with the support of IT carried out pilot-scale
leaching studies on Fernald soils using leaching agents selected from the treatability studies.
In support of the USID, ORNL has also been involved in studies on the leaching of uranium
from soils.4,5 Based on the results of these studies, leaching agents were identified for testing on the
Fernald test unit. Modifications were made to the Fernald test unit, and Phase II leaching studies
were then conducted. The experimental design of these pilot-scale tests was based on the ORNL
bench-scale results. Operations were performed by FERMCO and ORNL personnel.
The Phase II studies were an outgrowth of the integration of the pilot-scale work of CRU5 and
the USID in 1991. The pilot-scale work of CRU5 and the USID was integrated in 1991. The
integrated operations of the two programs was organized into three phases:
2
PHASE I This is the FERMCO CRU5 portion of the soil decontamination studies, detailed above. This phase included the Fernald test unit initial constructions and start-up.
PHASE II This phase was conducted by the USID group with the support of ORNL, CRU5, and the FERMCO treatability group. As in Phase I, batch leaching tests were to be performed on the Fernald test unit. Process modifications were made for Phase II operation. The existing Fernald test unit equipment remained the same; routing and the sequence of use of the equipment comprised the process modifications. This report details the results of PHASE IICRU5/USID batch soil leaching studies on the Fernald test unit. Data from this phase may be made available for CRU5 to use in the RI/FS.
PHASE III This phase was to be conducted by the USID group, with the same supporting organizations as in Phase II. Plans were that the tests will be leaching studies with the Fernald test unit modified to run in a continuous soil processing mode. This phase was canceled.
1.3 HOST SITE DESCRIPTION AND NEED FOR URANIUM REMEDIATION
A detailed description of the FEMP is given in the Phase II work plan.1 The Federal Facilities
Compliance Agreement (FFCA) that was entered into and the RI/FS which is in progress pursuant
to the Comprehensive Environmental Response, Compensation, and Liability Act (CERCLA), as
amended by the Superfund Amendments and Reauthorization Act (SARA), are also discussed. The
technical strategy adopted by the CERCLA program divides the site into five distinct operable units.
The components of the operable units are as follows:
Operable Unit 1 — Waste Pits 1- 6, Clearwell, and Burn Pit Operable Unit 2 — Other Waste Units (fly ash pile and Solid waste landfill) Operable Unit 3 — Production Area Operable Unit 4 — Silos 1,2,3, and 4 Operable Unit 5 — Environmental Media
Uranium is the principal soil contaminant of concern at the FEMP, and an acceptable
concentration level for uranium in soils has not been established. Consequently, soil
decontamination technologies were to be evaluated with respect to a level of 52 ppm, the initial
technology screening level adopted by the USID.
Uranium has deposited over the years on the soil from various sources. The stacks in the
production area, dust blown from the disposal pits in the Waste Storage Area, and the incinerator
in the sewage plant were sources of airborne uranium. Also, soil contamination has resulted from
leaks and spills during processing activities in the production areas and from the spreading of
contamination by vehicles. The majority of soils containing uranium exceeding 52 ppm are located
in the top 0.45 m of surficial material.6
One of the major concerns at FEMP relating to uranium contamination in soil is the potential
for uranium to be leached from the soil into the Great Miami aquifer immediately below the FEMP
site. The potential for such a phenomenon to occur is a real one because of the uranium forms in
soil and the soil characteristics. Characterization data have shown that a large fraction
(probably >90%) of the uranium in soil exists as the U(VI) or uranyl form. Over the years of plant
operation, it appears that a considerable amount of carbonate-based material (namely, limestone
containing calcite and dolomite minerals) has been added to the surface soils. Consequently, the pH
of soils within the plant are relatively high (pH values on the order of 7.2 to 8.4) compared with
native soils adjacent to the plant (pH values ranging from 5.4 to 6.3). These carbonate soils tend to
serve as in situ leachants for uranium. For example, dissolution of carbonate minerals yields the
C 0 3
2 - anion that form the di- and tri-carbonate anionic complexes with uranyl, such as
[U0 2 (C0 3 ) 2 ] 2 -
and
[U0 2 (C0 3 ) 3 ] 4 -.
Both of these uranyl-carbonate complexes are highly mobile in soils, creating a potential plume of
uranium-contaminated water that could reach the Great Miami aquifer. Thus, it is critical that the
carbonate-soluble fraction of uranium be removed from these soils to protect against uranium
contamination of drinking water in the Great Miami aquifer.
4
2. PROJECT OBJECTIVE AND STRATEGY
The purpose of the tests on the Fernald test unit was to assess the performance of selected soil
leaching technologies for removal of uranium using FEMP soils. The ultimate goal of this project
was to develop data on the efficiency and operability of the soil decontamination process that can
be used for the design of a full-scale system. For this goal to be accomplished, there were several
specific project objectives to be satisfied.
The soil leaching process should produce a soil that has a uranium concentration level equal to or less than an acceptable contamination level. Soil decontamination will be evaluated with respect to (1) a preliminary technology screening level of 52 mg U/kg of soil or (2) revised target levels based on risk assessment data.
• The soil leaching process should also represent an "earth friendly" approach to the treatment of soil. That is, the process should decontaminate the soil without seriously degrading the soil's physical/chemical characteristics or generating waste forms that are difficult to manage and/or dispose.
• The results of bench-scale soil leaching tests should be further demonstrated at the pilot scale. These results will be useful for full-scale application of the technology.
• The results of the CRU5/USID Phases II and III are to be shared with CRU5 and incorporated in the CRU5 RI as time and funding constraints permit.
The Phase II tests on the Fernaid test unit were conducted based on the results of soil
characterization studies5,6 and experimental leaching studies.4'5 In the latter studies, leaching agents
such as sodium carbonate and citric acid were used to leach uranium from various soil and sediment
samples. The objective of these leaching studies was to determine the effectiveness of these
treatments in reducing uranium concentrations to acceptable regulatory levels without seriously
degrading the physical/chemical characteristics of the soil. The process configuration used for the
Phase II tests was based on the following considerations:
5
• There is no experimental evidence that physical treatment alone, such as treatment with an attrition scrubber and fractionation by particle size, will remove uranium from a particular fraction of Fernald soils (e.g.. uranium concentrations in sand, silt, and clay fractions of the storage pad soil and the incinerator site soil at Fernald were all >52 mg/kg, the proposed screening levels for applicable decontamination technologies4). Consequently, any successful soil decontamination process will likely depend on a chemical leaching process.
• By using an attrition scrubber to treat the entire soil, high leaching efficiencies were obtained at relatively short residence times in bench-scale studies. The bench-scale studies involved (1) a one-step test in which attritioning and leaching were done simultaneously and (2) a two-step test in which attritioning and leaching were done in sequence.
In bench-scale studies, the highest uranium removal efficiencies were obtained in a two-step procedure involving scrubbing of a water/soil slurry at a 0.8/1 weight ratio for 15 min, followed by addition of a leaching agent and water to give a 2/1 water-to-soil weight ratio and leaching for 15 min. These results indicated that attrition scrubbing at high solids loadings and leaching at a higher liquid/solids ratio was an effective procedure for uranium removal.
Multiple rinsings of the leached soil are needed to minimize the amount of spent (i.e., containing dissolved uranium) leaching solution retained by the soil (this procedure is commonly practiced in the uranium milling industry7).
In the process configuration developed for Phase II operation, tests were run in which either the
entire soil or a coarse soil fraction was pretreated in an attrition scrubber and then subjected to
leaching in a stirred tank. This was followed by liquid/solid separation by centrifugation and then
rinsing to remove the spent leaching solution from the treated soil.
The Fernald test unit was operated in a batch mode in Phase II. Phase III plans included soil
leaching in a continuous mode.
6
3. TREATABILITY SOIL DESCRIPTION
Two FEMP soils were selected for this demonstration. The soils were collected from the
Sewage Treatment Plant/Waste Incinerator area and the Plant 1 Pad area. The following describes
the two soils and the method of preparation for their use in the pilot-scale tests.
3.1 SEWAGE TREATMENT PLANT/WASTE INCINERATOR AREA (INCINERATOR SOIL)
The Sewage Treatment Plant, associated facilities, and the abandoned solid waste incinerator
are located on the eastern property line of the FEMP reservation. The incinerator is located in the
northwest corner of the Sewage Treatment Area. This incinerator was operated from November
1954 through December 1979. The incinerator was used to burn contaminated and uncontaminated
combustible trash during its period of operation.
Surface radiological measurements and limited soil samples collected in the vicinity of these
facilities indicated the presence of localized elevated concentrations of radionuclides.6 As a result
of the RI/FS sampling activities, the concentration of a 8 U in surface soils was found to range from
1.8 to 25,670 pCi/g. In addition to surface soil samples, there was a limited number of core samples
taken in this area as part of the RI/FS. The results indicated that uranium contamination is limited
to the upper reaches of the soil column—only one sample exceeded 100 pCi/g, which was taken
from a depth of 0.45-0.91 m. FEMP RCRA determination procedures have established that the
USID incinerator area soils are non-RCRA.
7
3.2 PLANT 1 PAD (STORAGE PAD SOIL)
During the production years at the FEMP, the Plant 1 Pad was used to temporarily store various
residues from the production plants, raw ore, and material from other DOE sites. After Plants 2/3
and 8 were shut down, the pad was used as a permanent storage area for the residues. The Plant 1
Pad did not have a containment barrier until the late 1980s. Numerous releases of material from
deteriorated drums and accidental spills occurred throughout operational history of the pad. The
lack of containment allowed released material to wash off the pad during rainstorms and routine
water spraying of the pad, thereby contaminating the soil on the perimeter of the pad.
The Plant 1 Pad soil has been determined to be a low-level radioactive waste. FEMP RCRA
determination procedures have established that the USID Plant 1 Pad soil is neither a RCRA-listed
waste nor a RCRA characteristic waste.
3.3 SOIL PREPARATION
Soils were removed from the Waste Incinerator and the Plant 1 Pad areas. Two lots of blended
soil were prepared, one lot from each of the areas. After removal from a particular area, the soil was
sifted using a 3/4-in. screen to remove gravel fragments and unwanted debris. The sifted soil was
then processed in a 5 yd3 concrete mixer to obtain homogeneity. The two lots of blended soil were
stored in drums as containerized material, along with metal boxes of unmodified (i.e., not sifted or
blended) soils and residues from the blending process.
The soils used in most of the Phase II demonstration tests were taken from the unmodified soils
in the metal boxes. Again, two lots of blended soil were prepared, one lot from each of the areas.
After removing the metal boxes from storage, drums of each soil were prepared by screening the soil
8
through a 3/4-in. screen. The screened soil was processed through a ribbon blender to obtain
homogeneity and then drummed. The soils blended in this manner were used for all Phase II tests,
with the exception of Tests 20, 21, 22, and 25. The soils that had been previously blended in the
concrete mixer were used in the four final tests.
In preparing the lots of soil with the ribbon blender, each lot was actually blended in two
batches. For the incinerator soil, eight drums were filled from the first batch of blended soil, and
nine drums from the second batch. For the storage pad soil, six drums were filled from the first
batch and the rest of the drums from the second batch. For each soil, the uranium concentrations
in the drums were analyzed to determine if any statistically significant differences between drums
existed. This is discussed later.
The soils that had been blended in the concrete mixer (in 1991) were used for Tests 20,21, and
22 as a demonstration of the best processing method developed in the previous Fernald test unit
tests. These soils will be reference soils that will be tested by all USID investigators of soil
decontamination technologies. A soil from the storage pad area that contained grass and roots was
used for Test 25.
9

4. FERNALD PILOT-SCALE TEST UNIT
4.1 BACKGROUND
As part of the RI/FS for the Fernald facility, lab-scale treatability studies directed at leaching
uranium from several FEMP soil samples were conducted by IT. Also, as part of the remedial
technology selection process of the RI/FS, the FERMCO CRU5 constructed and installed a
pilot-scale test unit for soil decontamination at Fernald. FERMCO CRU5 performed batch leaching
studies using the test unit with the support of IT as the final phase of the RI/FS. These studies were
completed in 1993.
After completion of the CRU5 work, process modifications were made to the Fernald test unit
for the Phase II studies. The same equipment was used; however, routing and the sequence of use
of the equipment were modified. The Phase II uranium leaching tests with Fernald soils were then
conducted by FERMCO and ORNL personnel.
4.2 TEST UNIT DESCRIPTION
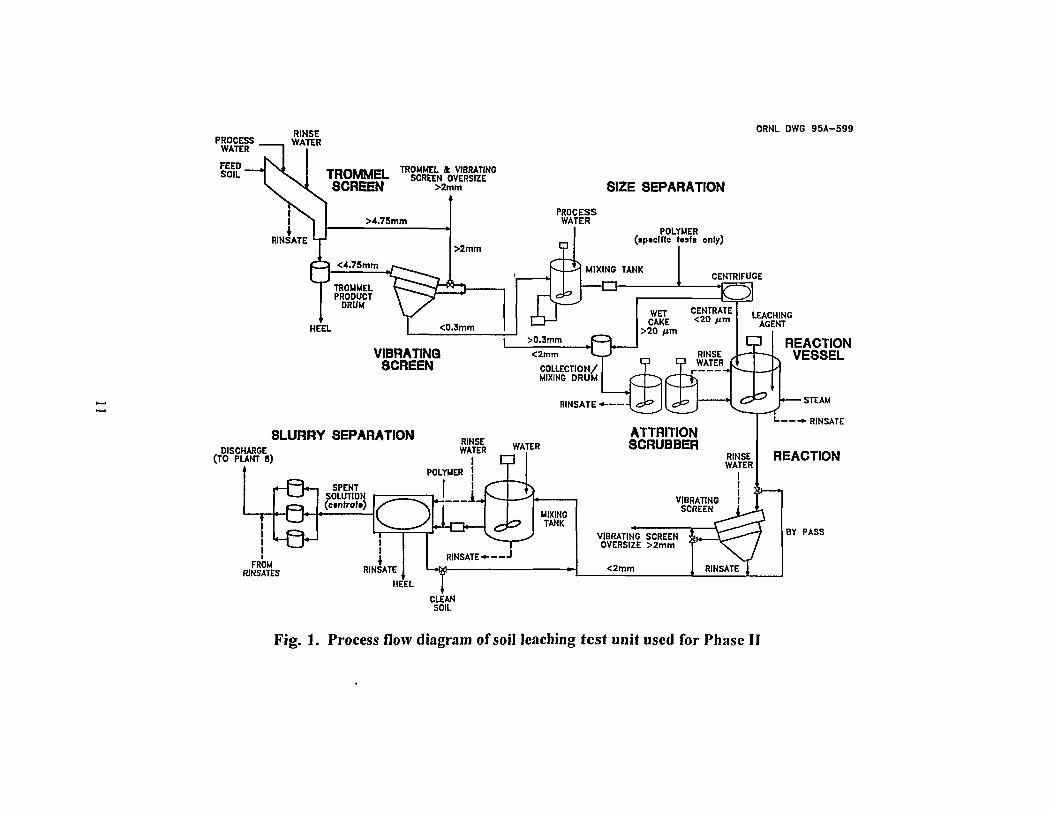
Figure 1 shows the process flow diagram for the Fernald test unit as modified for Phase II. The
process configuration illustrated was used for all replicated tests, as described in Sect. 5. This
process configuration was based on the results of bench-scale studies and a conceptual design for
a commercial-scale soil leaching process. In other tests, modifications were made to the process
flow scheme to study the effects of process variables. Modifications were also made during the
Phase II testing primarily to improve operations. These modifications are discussed later. During
batch operation of the Fernald test unit, the same piece of equipment could be used in different steps.
10
T Q O W M C I TROMMEL 4 VIBRATING 'JMrJEMrr SCREEN OVERSIZE SCREEN >2mm SIZE SEPARATION
POLYMER ( jptctffc faafs only)
ORNL DWG 9 5 A - 5 9 9
, DISCHARGE (TO PLANT 8)
REACTION VESSEL
— STEAM
1 •RINSATE
REACTION
BY PASS
FROM RINSATES
Fig. 1. Process flow diagram of soil leaching test unit used for Phase II
For example, whereas the Fernald test unit equipment included only one centrifuge and one vibrating
screen. Fig. 1 shows that each of these two pieces of equipment was used in more than one process
step. This is of particular significance in the case of the centrifuge, as discussed later. The operation
of the Fernald test unit in the standard configuration of Fig. 1 is outlined below.
In the batch operation of the Fernald test unit, -350 lb from a feed soil drum was processed in
each experimental test. The first step was to manually transfer the feed soil from the drum to a
conveyor. The soil was continuously fed into a trommel screen to remove > 4.75-mm material. This
large size material was made up primarily of small rocks or pebbles. The slurry from the trommel,
which consisted of < 4.75-mm material and the water that was injected at high pressure (1000 psig)
into the trommel, was collected in a surge drum that was equipped with a mixer.
The slurry produced in the trommel operation was continuously pumped from the surge drum
to a vibrating screen deck, which contained a 2-mm screen and a 0.3-mm screen. The material in
the 0.3- to 4.75-mm size range was removed in the screen deck and collected for use later in the
process. The material on the 0.3-mm screen was removed along with the material on the 2-mm
screen to avoid processing particles greater than 2-mm through the centrifuge. Because the 2-mm
® screen was a Harpscreen which had wires running in only one direction rather than two, some of
the >2-mm material passed through to the 0.3-mm screen. The slurry, which now contained
<0.3-mm material, drained from the vibrating screen deck into a mixing tank.
Water was added to the slurry in the mixing tank to adjust the slurry volume to -350 gal
(-10 wt% solids). The slurry in the mixing tank was then processed through the continuous
centrifuge. The centrifuge was operated at conditions determined in Phase I to produce a nominal
20-um-size cut. The centrifuge wet cake, which consisted of the coarse soil fraction (20 urn to
0.3 mm), was combined with the 0.3- to 4.75-mm material that had been collected from the screen
deck. The centrate was collected in a surge tank and then transferred to the leaching reactor. The
12
centrifuge heel (material collected when the centrifuge was stopped, as described later) was also
added to the leaching reactor.
For most tests, the wet solids from the centrifuge operation were treated in an attrition scrubber
for a residence time of 15 min. Attrition scrubbers process high solids content slurries; scrubbing,
polishing, and disintegration of the solid particles result from grain-to-grain contact. The particle
contact occurs as the slurry is pumped within the scrubber by two impellers mounted on a common
shaft. The impellers, which have opposite pitches, are rotated in a direction to produce upward
pumping by the bottom impeller and downward pumping by the top impeller. After attrition
scrubbing, the treated solids were added to the centrate and the centrifuge heel in the leaching
reactor. The leaching agent was added directly to the stirred reactor in powder or granular form.
The soil was then leached in the reactor for 2 hr. At the beginning of and during the leaching step,
samples of the slurry were taken so that the uranium leaching efficiency could be determined as a
function of time.
Upon completion of the leaching step, the reactor slurry was pumped through the vibrating
screen deck (which had been thoroughly rinsed after processing the feed soil), to remove any 0.3- to
4.75-mm material, and into the centrifuge feed tank. The slurry was then processed through the
centrifuge to separate the treated solids from the leaching solution. The centrifuge was operated at
the same conditions as before, except that a polymer solution was continuously injected into the
centrifuge feed to maximize solids recovery.
The solids recovered from centrifuging the treated slurry were subjected to a rinse cycle to
remove residual leaching solution. The rinse cycle involved returning the centrifuge solids to the
mixing tank, adding process water to adjust the slurry volume to 350 gal, and feeding the slurry, with
polymer injection, to the centrifuge. As the last processing step, the recovered solids were subjected
to a second identical rinse cycle to produce a final treated soil.
13
4.3 CENTRIFUGE OPERATION
ecause of a potential for cross-contamination, as discussed below, the centrifuge operation, in
particular the production of the centrifuge heel, is described here. To help visualize the operation,
Fig. 2 shows a schematic of the centrifuge. The centrifuge heel was residual material that discharged
through the wet cake outlet port upon shutdown of the centrifuge. This material, referred to as a
liquid pool, was held on the centrifuge wall by centrifugal force while the centrifuge was running
(the depth of the liquid pool was determined by adjustable liquid overflow weirs). When the
centrifuge stopped, the material dropped to the bottom of the centrifuge and overflowed through the
wet cake and the centrate outlet ports, with the majority of the material passing through the wet cake
port (before the centrifuge was stopped, the wet cake collection drum was replaced by the centrifuge
heel collection drum).
The centrifuge heel from the first centrifuge operation (prior to the reactor) was combined with
the centrate; it did not appear as a separate stream in the material balance calculations. The
centrifuge heel that was collected as a by-product stream was a composite from the last three
centrifuge operations in each test. Polymer was injected into the centrifuge feed during these
operations to maximize solids recovery. The effectiveness of the polymer was evident from the
rapid liquid/solid separation observed in the centrifuge feed samples that were taken immediately
before the centrifuge. Thus, when the centrifuge feed was shut off and the discharge of wet cake and
centrate from the centrifuge had ceased, the liquid pool held on the centrifuge wall, and
consequently, the centrifuge heel would be expected to have a low solids content, perhaps
comparable with the centrate that had been produced. However, during the Phase II tests, the solids
recovered in the centrifuge heel represented a significant fraction of the feed solids.
14

ORNL DWG 95A-651
l ^ a f
^
I / \
WET CAKE OUTLET
LIQUID OUTLET
Fig. 2. Schematic diagram of centrifuge
In addition to the liquid pool, the operation of the centrifuge forms a layer of solids between the
scroll and the inner centrifuge wall. Once formed, this layer is thought to be permanent while the
centrifuge is running.8 However, the unexpected amount of solids in the centrifuge heel suggests
that some of this layer is being removed when the centrifuge is stopped. Once centrifugal force is
lost, the heel is discharged from the centrifuge within a few seconds. Some of the solids layer could
be washed off the wall by the sudden rush of liquid and collected as part of the centrifuge heel.
The use of the centrifuge to process both the feed soil and the treated soil was mentioned
previously. To minimize the possible contamination of the treated soil by residual feed soil in the
centrifuge, the collection of a centrifuge purge began in Test 18. This purge, which was collected
during the centrifuge operation immediately following the leaching reactor operation, began in
Test 18. The rationale for using this purge evolved during examination of the solids material
balance problem in the initial Phase II tests.
In examining the material balance problem, the effect of solids holdup in the centrifuge was
considered. Based on visual observation and experience with manual transfer operations, the
centrifuge wet cake produced with polymer addition, as in the case of the treated soil slurry, was
more viscous than that without polymer. Thus, variations in the thickness of the solids layer on the
centrifuge wall seemed feasible. Due to a lower drag force from the less viscous wet solid, the soil
layer on the centrifuge wall could be expected to be thicker when processing the feed soil slurry than
when processing the treated soil slurry (except in Tests 14 and 16 in which polymer was added to
the feed soil slurry). Consequently, the solids inventory in the centrifuge could increase when
processing the feed soil slurry and then decrease when the treated soil was subsequently processed.
This cycle would be repeated with each test.
Changes in the thickness of the soil layer on the centrifuge wall conceivably could affect the
solids material balance. However, calculations indicated that the effect would not be significant.
16

A more serious problem, though, appeared to be the potential of contamination of the treated soil
by the feed soil. According to the scenario just described, some of the soil layer produced from the
feed slurry would be removed by and mixed with the more viscous treated-soil wet cake. The effect
could be significant; for example, 1 lb of feed soil containing 0.2% (2000 ppm) uranium would add
0.002% (20 ppm) uranium to 100 lb of treated soil. Several options were considered for reducing
this cross-contamination potential. The method selected involved the collection of the first 60 lb of
wet cake produced by centrifuging the leaching reactor slurry.
17
5. SUMMARY OF EXPERIMENTAL AND SAMPLING PLANS
5.1 EXPERIMENTAL DESIGN
The experimental design for the Phase II pilot-scale studies included 24 tests. According to the
experimental plan, 20 tests were to be run and the test data analyzed before proceeding with the
remaining four tests. Tests 0 through 19 are outlined in Table 1. From the results of the analyses
of the pilot-scale data for these first 20 tests and data from concurrent bench-scale tests, "optimum"
operating conditions were to be selected for the final four tests. Sections 7 and 8 report the results
of Tests 0 through 19, while Tests 20, 21, 22, and 25 are discussed in Sect. 9.
In Tests 0 through 19, leaching tests were to be run with up to four different leaching agents on
each of the two Fernald soils. These leachants, which were used in previous bench-scale studies,
were sodium carbonate/sodium bicarbonate, sodium citrate/sodium bicarbonate/sodium dithionite
(CBD), citric acid, and sulfuric acid. The leaching solution molarities used in the Phase II tests were
selected based on ORNL bench-scale results. In the carbonate runs with the incinerator soil,
potassium permanganate was added to oxidize uranium (IV) to uranium (VI). Bench-scale tests
showed this to be effective with the incinerator soil but not with the storage pad soil.
There were some exceptions to the original experimental design of Table 1. Because of
modifications that would have been required to treat gas generated by the reaction of sodium
dithionite, the CBD tests were eliminated. Also, the sulfuric acid tests, which were to depend on the
results obtained in Phase I pilot-scale testing, were not run. It was determined that the Phase I
results were adequate.
Nine tests (Tests 2, 3, 4, 5, 6, 7, 8, 15, and 19) in Table 1 were run at the standard set of
operating conditions outlined in Sect. 4. As indicated in Table 1, replicates were run on each of the
18
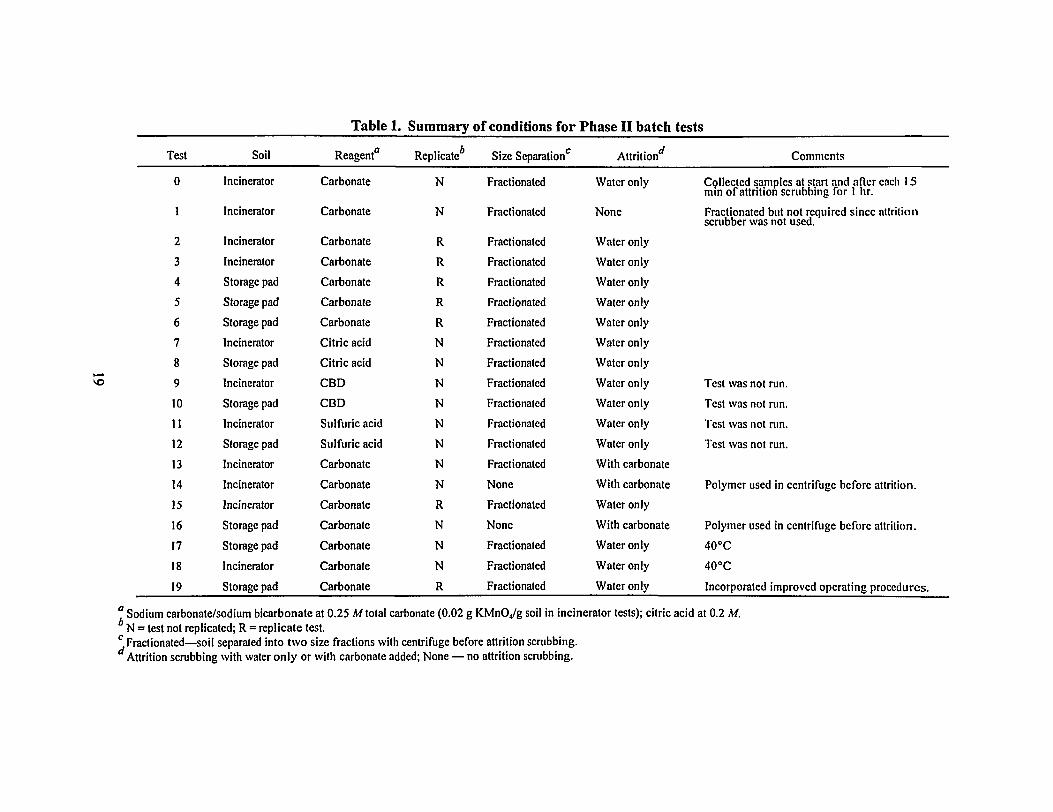
Table 1. Summary of conditions for Phase II batch tests
vo
Test Soil Reagent Replicate Size Separation Attrition** Comments
0 Incinerator Carbonate N Fractionated Water only Collected samples at start and after each 15 min of attrition scrubbing for 1 hr.
1 Incinerator Carbonate N Fractionated None Fractionated but not required since attrition scrubber was not used.
2 Incinerator Carbonate R Fractionated Water only
3 Incinerator Carbonate R Fractionated Water only 4 Storage pad Carbonate R Fractionated Water only
5 Storage pad Carbonate R Fractionated Water only
6 Storage pad Carbonate R Fractionated Water only
7 Incinerator Citric acid N Fractionated Water only
8 Storage pad Citric acid N Fractionated Water only
9 Incinerator CBD N Fractionated Water only Test was not run.
10 Storage pad CBD N Fractionated Water only Test was not run.
11 Incinerator Sulfuric acid N Fractionated Water only Test was not run.
12 Storage pad Sulfuric acid N Fractionated Water only Test was not run.
13 Incinerator Carbonate N Fractionated With carbonate
14 Incinerator Carbonate N None With carbonate Polymer used in centrifuge before attrition.
15 Incinerator Carbonate R Fractionated Water only
16 Storage pad Carbonate N None With carbonate Polymer used in centrifuge before attrition.
17 Storage pad Carbonate N Fractionated Water only 40°C
18 Incinerator Carbonate N Fractionated Water only 40°C
19 Storage pad Carbonate R Fractionated Water only Incorporated improved operating procedures.
a Sodium carbonate/sodium bicarbonate at 0.25 M total carbonate (0.02 g KMn04/g soil in incinerator tests); citric acid at 0.2 M. N = test not replicated; R = replicate test.
^Fractionated—soil separated into two size fractions with centrifuge before attrition scrubbing. Attrition scrubbing with water only or with carbonate added; None — no attrition scrubbing.
Fernald soils using carbonate as the leachant. For each soil, the results from the replicate runs were
used to calculate statistical parameters to be used for the comparison of the decontamination levels
with the technology screening level. The parameters were also used to determine if attrition
scrubbing or reaction temperature significantly affected decontamination level.
Test 0 was intended to be an initial run to check out the system operation. However, this test
was not conducted until later because the drums of incinerator soil were not available at the start of
operations. Test 0 operations followed the standard procedure, with the exception that the attrition
scrubber residence time was 1 hr. During the attrition scrubber operation, samples were collected
at the start and after each 15-min period. These samples were shipped to ORNL to determine the
effect of attrition scrubbing on particle-size distribution and carbonate leaching efficiency.
The following six tests were included to determine the effects of temperature and the attrition
scrubber on leaching efficiency. All six runs were made with sodium carbonate. The conditions for
these runs are described below:
Test 1. Leaching reactor only: The attrition scrubber was bypassed in this test. Although not required, the slurry from the trommel was centrifuged and the centrate and the wet cake were transferred directly to the leaching reactor. When this test was initiated, intentions were to use the attrition scrubber. However, after the first centrifuge operation had been completed, it was learned that the new attrition scrubber was scheduled for installation. The decision was made to bypass the attrition scrubber in this test so that the new scrubber could be used in the remaining tests.
Test 13 Attrition scrubbing of a coarse soil fraction in the presence of sodium carbonate: The standard operating conditions were used for this test, with the exception that sodium carbonate was added to the attrition scrubber feed.
Tests 14 & 16 Attrition scrubbing of the total soil in the presence of sodium carbonate: The procedure for these tests was the same as that for Test 13, with the exception that flocculant was injected into the centrifuge feed (during the centrifuge operation before the attrition scrubber) to maximize the recovery of solids.
Tests 17 & 18 Leaching at elevated temperature: The standard operating conditions were used for these tests, with the exception that the leaching reactor was operated at 40 °C.
20
As discussed previously, in addition to these modifications of the standard procedure to
determine effects of process variables, other modifications were made while carrying out Tests 0
through 19 to improve operations. These modifications are discussed in Sect. 7. The "optimum"
operating conditions for the final four tests are described in Sect. 9.
5.2 SAMPLING AND ANALYSIS PLAN AND PROCESS DATA ACQUISITION
The Sampling and Analysis Plan developed for the Phase II batch experiments is included in the
Phase II test plan.1 Samples were taken of feed, intermediate, and product streams. In the case of
the leaching reactor, samples were taken at several specified times during the 2-hr reaction period.
The samples were submitted to the FEMP analytical laboratory for analyses such as pH, uranium
content, and weight percent solids. The sample points for each run are identified in Sect. 7.
In addition to the acquisition of analytical data, measurements were made of process parameters.
These parameters consisted primarily of the weights and volumes of feed and product streams (such
as feed soil, leaching chemicals, trommel oversize material, centrifuge wet cake, leaching reactor
slurry, spent leaching solutions, etc.).
The analytical and process data were used to calculate material balances and uranium leaching
efficiencies. Variances (equal to the standard deviation squared) were calculated using the analytical
results from replicate samples. These variances were used to compare measured uranium
concentrations in the treated soils with target uranium levels. The results from these data analysis
activities are discussed in Sect. 8.
21
6. DATA ANALYSIS PROCEDURES
6.1 MATERIAL BALANCE AND REACTOR KINETICS CALCULATIONS
Analytical and process data were used to calculate material balances for solids and uranium.
To check for consistency and to better characterize potential losses, three different material balances
were made for each of Tests 0 through 19. Two were intermediate material balances, the first taken
between the feed point and the centrate and the wet cake from the first centrifuge operation and the
second between the feed point and the leaching reactor. The third was an overall material balance
taken around the entire test unit. The inlet stream for the balances was the total amount of soil that
was emptied from the feed drum. The outlet streams for each of the three material balances are
listed in Table 2. Rather than including the chemicals in the inlet stream, the total weight of
chemicals used in the test was subtracted from the total weight of solids calculated in the outlet
streams. Since percent solids in the various streams was determined by evaporation of a sample to
dryness, both soil and soluble chemicals were included in the calculated weight of solid product.
In addition to the material balances, the analytical data were used to examine the kinetics of the
leaching reaction by determining the fraction of uranium leached from the soil as a function of time
in the reactor. Again, this was done for Tests 0 through 19. The fraction of uranium leached at each
sampling time was determined by dividing the measured uranium concentration in the reactor liquid
by the uranium concentration in the reactor liquid that would be attained if the total uranium in the
soil were leached into the liquid, that is, 100% decontamination of the soil. The reactor liquid was
the filtrate obtained by collecting and filtering a sample of the reactor slurry. The uranium
concentration in the liquid that would result at 100% decontamination was calculated by dividing
the measured uranium concentration in the reactor slurry (which was determined on a weight
fraction basis) by the weight fraction of liquid in the reactor slurry.
22
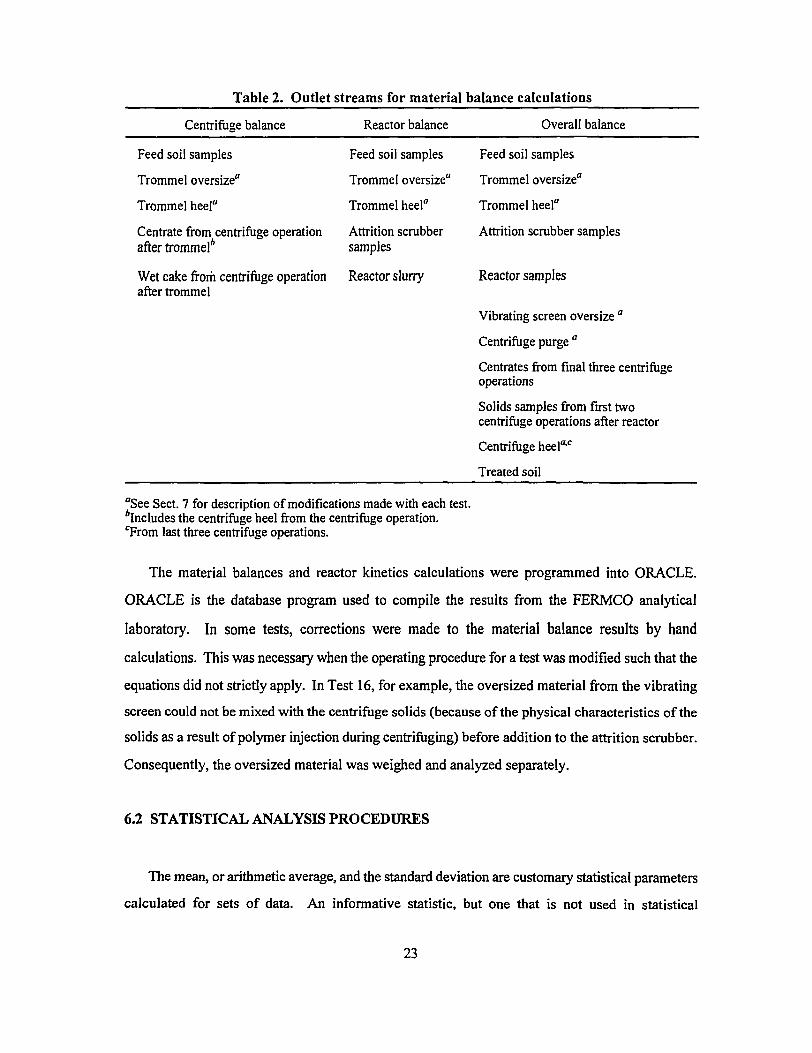
Table 2. Outlet streams for material balance calculations
Centrifuge balance Reactor balance Overall balance
Feed soil samples
Trommel oversize"
Trommel heel"
Centrate from centrifuge operation after trommel*
Wet cake from centrifuge operation after trommel
Feed soil samples
Trommel oversize"
Trommel heel"
Attrition scrubber samples
Reactor slurry
Feed soil samples
Trommel oversize"
Trommel heel"
Attrition scrubber samples
Reactor samples
Vibrating screen oversize "
Centrifuge purge "
Centrates from final three centrifuge operations
Solids samples from first two centrifuge operations after reactor
Centrifuge heel"-c
Treated soil
"See Sect. 7 for description of modifications made with each test, includes the centrifuge heel from the centrifuge operation. cFrom last three centrifuge operations.
The material balances and reactor kinetics calculations were programmed into ORACLE.
ORACLE is the database program used to compile the results from the FERMCO analytical
laboratory. In some tests, corrections were made to the material balance results by hand
calculations. This was necessary when the operating procedure for a test was modified such that the
equations did not strictly apply. In Test 16, for example, the oversized material from the vibrating
screen could not be mixed with the centrifuge solids (because of the physical characteristics of the
solids as a result of polymer injection during centrifuging) before addition to the attrition scrubber.
Consequently, the oversized material was weighed and analyzed separately.
6.2 STATISTICAL ANALYSIS PROCEDURES
The mean, or arithmetic average, and the standard deviation are customary statistical parameters
calculated for sets of data. An informative statistic, but one that is not used in statistical
23
comparisons, is the coefficient of variation. This parameter is defined as the ratio of the standard
deviation to the mean of a set of replicate data. Since this ratio is a dimensionless number, it allows
one to judge the relative precision of test methods regardless of the difference in units. The
coefficient of variation is included in the calculation of descriptive statistics for various sets of data.
For the comparison of uranium decontamination levels with the preliminary technology
screening level, the Student's t-test was used. The t-test was also used to determine if factors such
as attrition scrubbing, type of leachant, or reactor temperature had any significant effect on
decontamination level. This was done by comparing the results from the replicate tests with the
result from each test in which a factor of interest was changed. For these comparisons, the mean and
the standard error of the mean (SEM — equal to the standard deviation divided by the square root
of the number of replicates) of the results from the replicate tests were determined for each soil. The
SEM was then used to calculate confidence limits about the test mean in order to make the desired
comparison. The confidence limits are determined as ±tar2s^n, where slfn is the SEM, n is the
sample size, (1-oc) is the confidence level, and t ^ is the value of the t distribution at n- 1 degrees
of freedom leaving an area of a/2 to the right.9
The t-test comparisons were made using SigmaStat™, a statistical software package. The
procedure used in SigmaStat"' was the paired t-test. For such a comparison of many observations
(the replicate tests) with a single value, the paired t-test procedure is equivalent to the t-test
described above. If statistical comparisons showed that a particular factor had no significant effect,
the results from the test or tests involving changes in that factor were pooled with the results from
the replicate tests. Such a pooling of results when a factor has been shown to have no effect is an
acceptable statistical technique.10 The consequence of this pooling is to increase the sensitivity of
the statistical comparison by reducing the confidence interval about the mean of the replicates. In
this and in the other SigmaStat™ procedures described below, the 95% confidence level was used.
In the Phase II Fernald test unit study, not all tests were replicated due to time and cost
considerations. Consequently, in analyzing the effects of factors such as temperature and attrition
scrubbing, the results of the replicate tests were compared with the result from a single test, as
described above. If a significant difference was detected and the power of the t-test was high, the
conclusion was that there was a high probability that the result from the single test was truly
24
different from the mean result of the replicate tests. However, since the single test was not
replicated, it could not be concluded that the result from the single test belonged to a population that
was significantly different from the result of the replicate tests; that is, it could not be concluded that
the factor being studied actually had an effect. If supported by the results of other studies, though,
one might reasonably infer that the factor being investigated in the single test was the cause of the
deviation from the replicate tests. This is the approach taken in this report in examining the effects
of factors such as temperature and attrition scrubbing.
In the t-test, a is the probability of rejecting the null hypothesis (H0) (i.e., no difference exists)
when it is true. Obviously, it is desirable that a be small. Another statistical parameter is p, the
probability of rejecting the alternative hypothesis (HA) (i.e., a difference does exist) when it is true.
SigmaStat™ calculates the quantity (1 - p), which is known as the power of the test. The power is the
probability of rejecting H 0 when it is false. If H 0 is rejected in a t-test at a particular level of
significance of (1-a), it is important to examine the power of the test. If HQ is to be rejected, it is
desirable that the power of the test be high. That is, one would like to have a high probability of
concluding that a difference exists when it actually does.
Since pre-blended soils were used for feed, drums prepared from each blend would be expected
to be fairly homogeneous. To test this assumption, a statistical comparison was made between the
analytical data on the feed drums for each type of soil. This comparison was also made using
SigmaStat™. The comparison method involved a one-way analysis of variance (ANOVA). This is
a parametric test that assumes that all the samples were drawn from normally distributed populations
with the same standard deviations (variances). The null hypothesis is that there is no difference
among the populations from which the samples were drawn.
If the one-way ANOVA detected a significant difference between populations (drums), the
Student-Newman-Keuls (SNK) test was used in SigmaStat™ to determine which drums were
different. The SNK test is an all pairwise comparison of every combination of group pairs. It is said
to generally be the preferred test for all pairwise comparisons.
The statistical test used for the soil feed drums was a group comparison test. This test compares
random samples from two or more different groups for differences in the mean values that cannot
be attributed to random sampling variation. Statistical tests were also done to compare the percent
25
recoveries calculated for each leaching test by the three different material balances described
previously. Uranium decontamination levels calculated for each leaching test by two different
methods were compared as well. These comparisons of recoveries and decontamination levels were
done by repeated measures procedures. These procedures take into account variation among
individuals, allowing attention on the effect of the treatments rather than the differences between
individuals. A paired t-test is used to compare the effect of a single treatment on the same
individuals. A one-way repeated-measures ANOVA is used to compare the effects of a single series
of treatments or conditions. The repeated-measures procedures in SigmaStat™ were used for the
statistical comparisons.
26
7. EXPERIMENTAL SUMMARY
This section applies to Tests 0 through 19. The final four tests are discussed in Sect. 9.
7.1 OPERATIONS SUMMARY
Table 3 shows the order in which the Phase II Tests 0 through 19 were run, the dates the tests
were run, and the identification number of the drum used in each test. The standard operating
procedure for the Phase II tests was described previously. However, as mentioned, modifications
to this procedure (other than those made to study the effects of process variables) were made on
several occasions, as recorded in the operations logbook. These modifications are summarized as
follows.
Test 16 In this test and in all subsequent tests (after 1/5/94), a trommel heel product was collected. This heel was the material remaining in the bottom of the trommel product drum after completion of the trommel and the first vibrating screen operations. The heel contained large size material (some even > 4.74 mm) that was not suspended by the mixer in the trommel product drum. In previous tests, this material was pumped through the vibrating screen. This was done by using a water jet to mobilize the material while operating the transfer pump. Because of the downstream processing problems, the decision was made to collect the trommel heel as a by-product. Also, in this test and in subsequent tests up to Test 15, the 2- to 4.75-mm material from the first vibrating screen operation was combined with the trommel oversize (> 4.75 mm).
Collecting the trommel heel and the 2- to 4.75-mm material from the vibrating screen as by-products (which represented an average of 4% of the feed soil) removed the large size material that was causing downstream processing problems. By collecting these streams as by-products, it was possible to eliminate the vibrating screen operation after the leaching reactor from this test and from all subsequent tests.
Test 17 Prior to this test (before 1/10/94), the centrifuge heel that was produced by the last three centrifuge operations was collected but was not analyzed. In this test and in all subsequent tests, this centrifuge heel was weighed, sampled, and analyzed for solids and uranium contents. This procedure was initiated when problems with the solids material balance were identified. In Phase II, the centrifuge was usually shut down after each operation. This generated a greater quantity of heel than typically produced in Phase I tests. In Phase I, the procedure was to keep the centrifuge running during a test until all centrifuge processing steps had been completed.
27
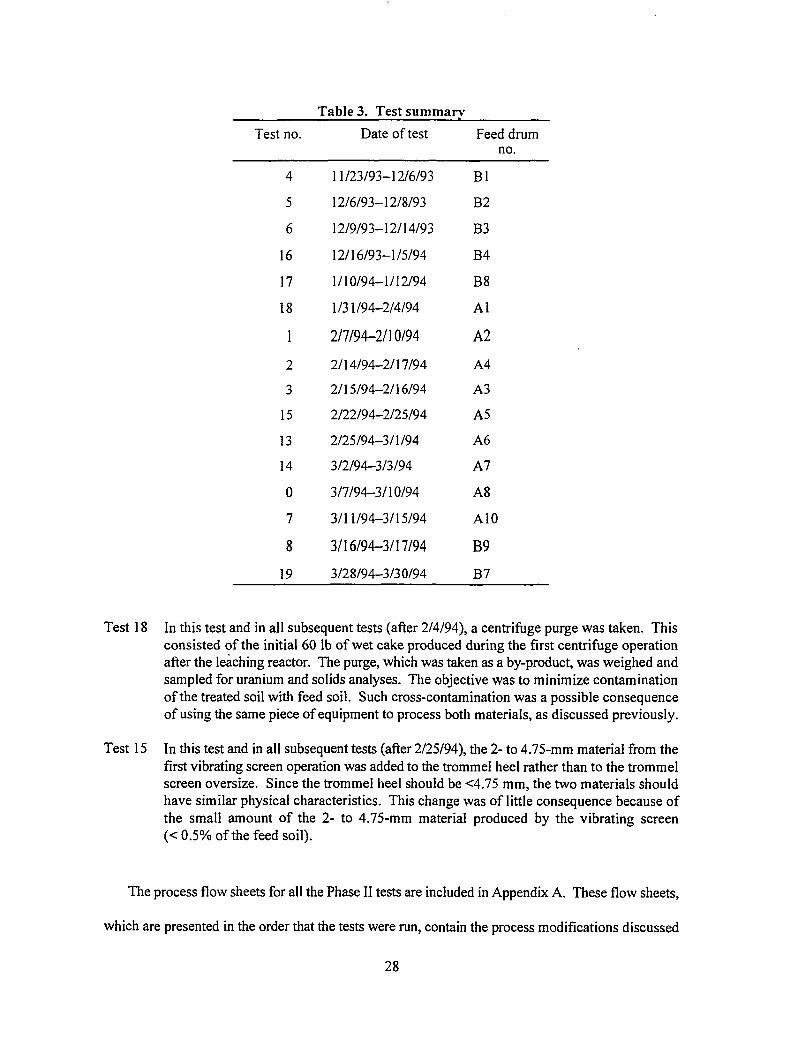
Table 3. Test summary Test no. Date of test Feed drum
no.
4 11/23/93-12/6/93 Bl
5 12/6/93-12/8/93 B2
6 12/9/93-12/14/93 B3
16 12/16/93-1/5/94 B4
17 1/10/94-1/12/94 B8
18 1/31/94-2/4/94 Al
1 2/7/94-2/10/94 A2
2 2/14/94-2/17/94 A4
3 2/15/94-2/16/94 A3
15 2/22/94-2/25/94 A5
13 2/25/94-3/1/94 A6
14 3/2/94-3/3/94 A7
0 3/7/94-3/10/94 A8
7 3/11/94-3/15/94 A10
8 3/16/94-3/17/94 B9 19 3/28/94-3/30/94 B7
Test 18 In this test and in all subsequent tests (after 2/4/94), a centrifuge purge was taken. This consisted of the initial 60 lb of wet cake produced during the first centrifuge operation after the leaching reactor. The purge, which was taken as a by-product, was weighed and sampled for uranium and solids analyses. The objective was to minimize contamination of the treated soil with feed soil. Such cross-contamination was a possible consequence of using the same piece of equipment to process both materials, as discussed previously.
Test 15 In this test and in all subsequent tests (after 2/25/94), the 2- to 4.75-mm material from the first vibrating screen operation was added to the trommel heel rather than to the trommel screen oversize. Since the trommel heel should be <4.75 mm, the two materials should have similar physical characteristics. This change was of little consequence because of the small amount of the 2- to 4.75-mm material produced by the vibrating screen (< 0.5% of the feed soil).
The process flow sheets for all the Phase II tests are included in Appendix A. These flow sheets,
which are presented in the order that the tests were run, contain the process modifications discussed
28
above. Also shown on the flow sheets are the sample points for each test. The process sample
points are described in Table A-1. Samples were taken at these specified locations during each test.
Sample points 12 through 18 were for rinsate samples taken while cleaning equipment after each
test. Sample points 19 through 28 were for any samples that, although not specified in the sampling
plan, could be included in any test. Sample point 29 was for a duplicate sample to be analyzed
onsite, and sample points 101 through 118 were for duplicates for off-site analyses.
7.2 PROCESS DATA
Appendix B summarizes the Phase II process data. The data sheets for each run tabulate the
weights and volumes of feed and product streams, as well as intermediate streams and samples.
7.3 ANALYTICAL DATA
The analytical results for the Phase II tests are presented in Appendix C. As mentioned
previously, the process flow sheets in Appendix A indicate the locations of the sample points.
29
8. RESULTS OF DATA ANALYSIS AND DISCUSSION
This section applies to Tests 0 through 19. Section 9 discusses the final four tests.
8.1 EXPERIMENTAL VARIANCES
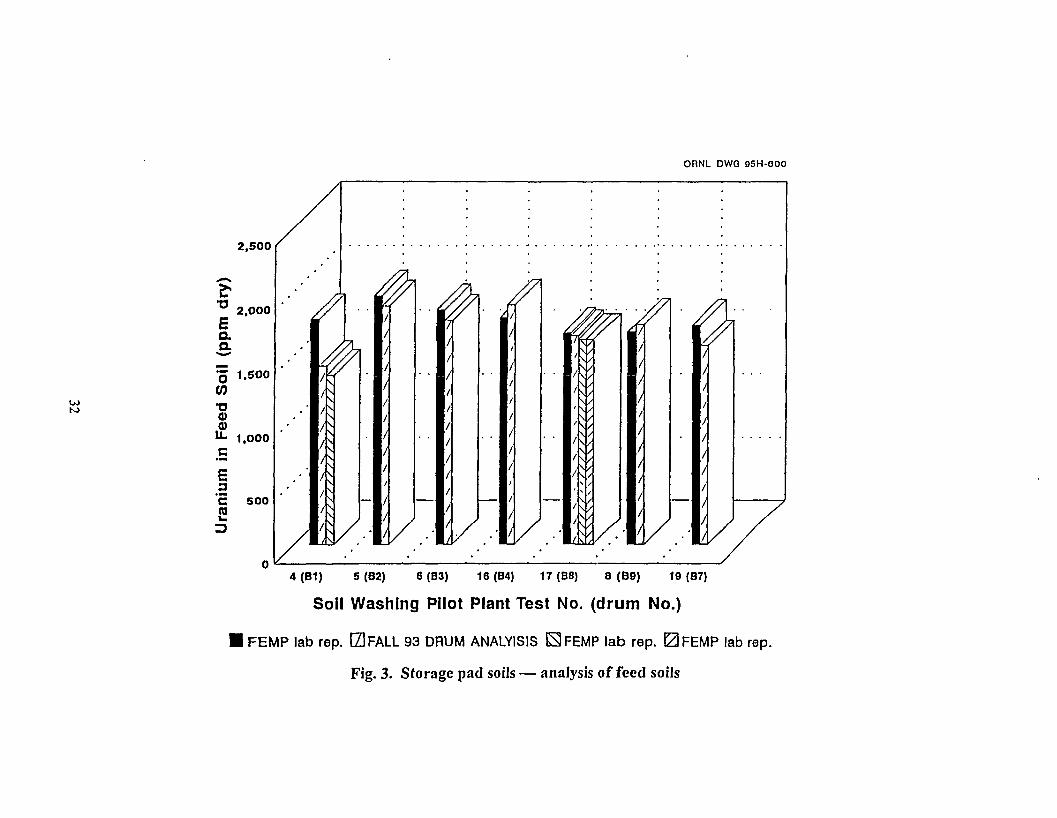
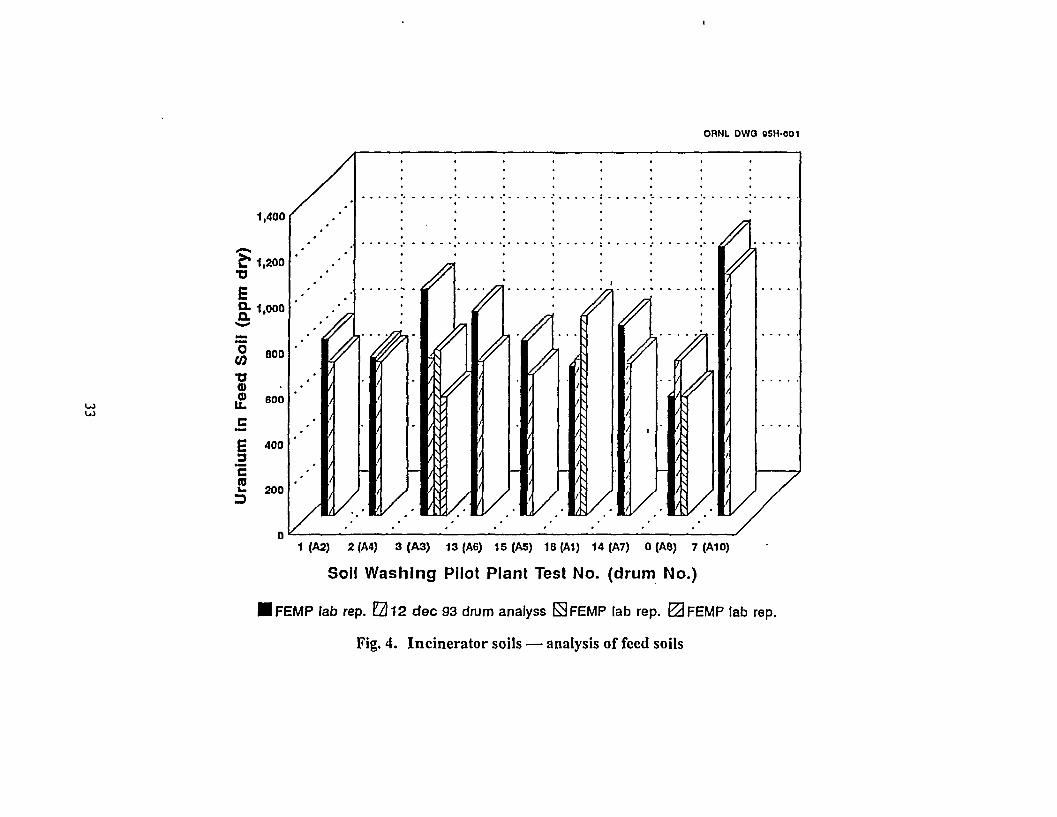
Table 4 shows results from the statistical analyses of the results for uranium concentration in the
feed soils. Figures 3 and 4 show the individual results of the feed soil uranium analyses for each of
the storage pad soil and the incinerator area soil tests, respectively. Included in the figures are
- results from analyses done in December 1993 after the soils had been blended. Results identified
as replicates refer to multiple samples that were taken of the feed soils during the pilot plant tests,
each sample being analyzed only once. The results identified as repeat analyses refer to single
samples that were analyzed more than once.
The SNK test was run on the feed soil data to determine if there were significant differences
between the drums of soil used in the Phase II tests. As discussed previously, each of the feed soils
was blended in two batches. All the tests with the incinerator soil, except for Test 7, were run with
soil blended in the same batch. For these tests, as might be expected, the SNK test showed no
significant differences in uranium content between the drums of incinerator soil. For the storage pad
soil, the SNK test did detect significant differences between drums. Differences would not be
surprising since four tests used soil blended in one batch, and three tests used soil blended in another
batch. An unexpected finding was that the SNK test detected differences not only between drums
from different batches, but also between drums from the same batch. Because of these differences,
uranium material balances for the storage pad soil tests were calculated using the individual feed soil
data rather than the average uranium concentration for all the feed drums. This was also done for
30
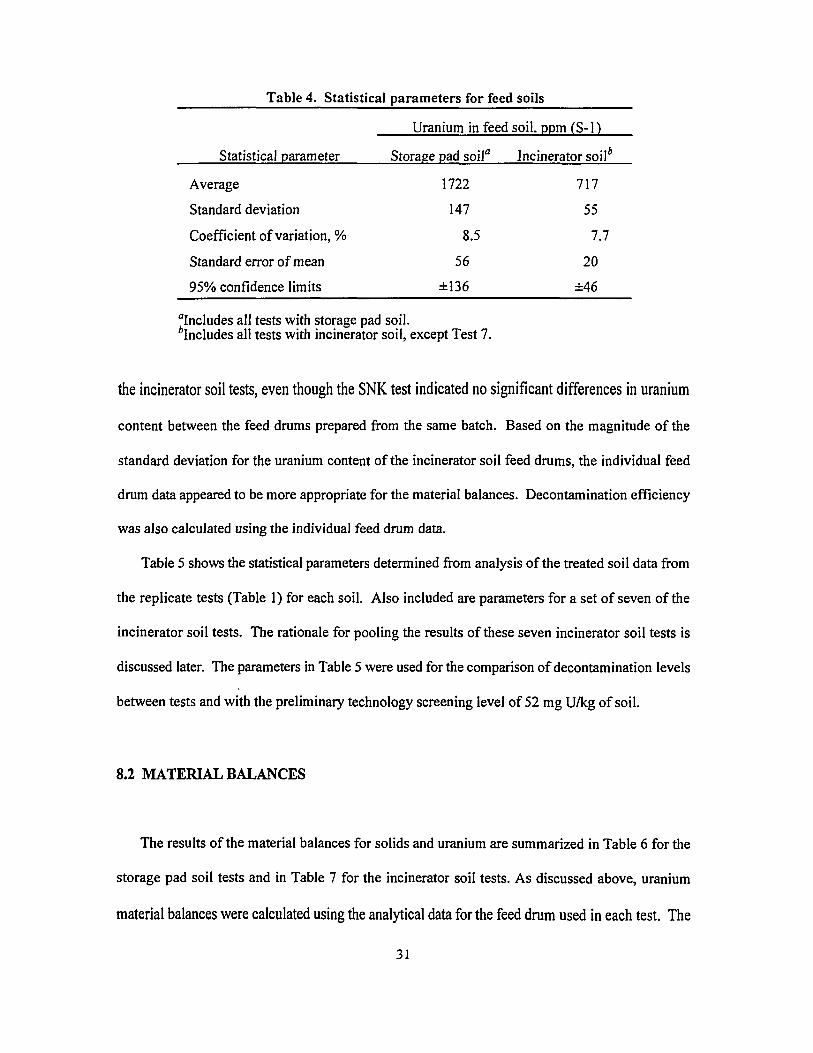
Table 4. Statistical parameters for feed soils
Uranium in feed soil, ppm (S-l)
Statistical parameter Storage pad soila Incinerator soil*
Average 1722 717
Standard deviation 147 55
Coefficient of variation, % 8.5 7.7
Standard error of mean 56 20
95% confidence limits ±136 ±46
includes all tests with storage pad soil. ^Includes all tests with incinerator soil, except Test 7.
the incinerator soil tests, even though the SNK test indicated no significant differences in uranium
content between the feed drums prepared from the same batch. Based on the magnitude of the
standard deviation for the uranium content of the incinerator soil feed drums, the individual feed
drum data appeared to be more appropriate for the material balances. Decontamination efficiency
was also calculated using the individual feed drum data.
Table 5 shows the statistical parameters determined from analysis of the treated soil data from
the replicate tests (Table 1) for each soil. Also included are parameters for a set of seven of the
incinerator soil tests. The rationale for pooling the results of these seven incinerator soil tests is
discussed later. The parameters in Table 5 were used for the comparison of decontamination levels
between tests and with the preliminary technology screening level of 52 mg U/kg of soil.
8.2 MATERIAL BALANCES
The results of the material balances for solids and uranium are summarized in Table 6 for the
storage pad soil tests and in Table 7 for the incinerator soil tests. As discussed above, uranium
material balances were calculated using the analytical data for the feed drum used in each test. The
31
ORNL DWG 95H-BOO
2,500
4 (B1) 5 (B2) 6 (B3) 16 (B4) 17 (B8) 8 (B9) 19 (B7)
Soil Washing Pilot Plant Test No. (drum No.)
FEMP lab rep. GO FALL 93 DRUM ANALYISIS KFEMP lab rep. 0FEMP lab rep.
Fig. 3. Storage pad soils — analysis of feed soils
ORNL DWQ 05H-001
1,400
£* 1,200
E £• 1,000
o CO
•o u. E c to 3
800
600
400
200
1 (A2) 2 (A4) 3 (A3) 13 (A6) 15 (A5) 18 (A1) 14 (A7) 0 (A8) 7 (A10)
Soil Washing Pilot Plant Test No. (drum No.)
I FEMP lab rep. 0 1 2 dec 93 drum analyss 0FEMP lab rep. E2FEMP lab rep.
Fig. 4. Incinerator soils — analysis of feed soils
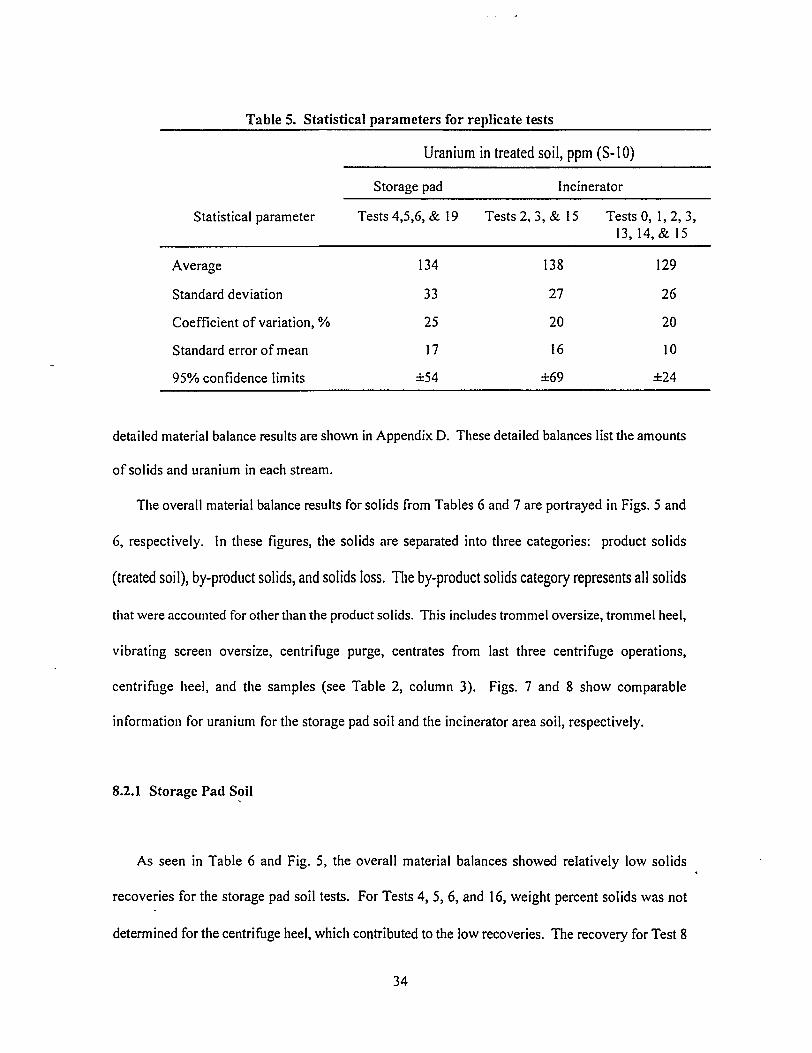
Table 5. Statistical parameters for replicate tests
Uranium in treated soil, ppm (S-10)
Storage pad Incinerator
Statistical parameter Tests 4,5,6, & 19 Tests 2, 3, & 15 Tests 0, 1, 2, 3, 13,14.& 15
Average 134 138 129
Standard deviation 33 27 26
Coefficient of variation, % 25 20 20
Standard error of mean 17 16 10
95% confidence limits ±54 ±69 ±24
detailed material balance results are shown in Appendix D. These detailed balances list the amounts
of solids and uranium in each stream.
The overall material balance results for solids from Tables 6 and 7 are portrayed in Figs. 5 and
6, respectively. In these figures, the solids are separated into three categories: product solids
(treated soil), by-product solids, and solids loss. The by-product solids category represents all solids
that were accounted for other than the product solids. This includes trommel oversize, trommel heel,
vibrating screen oversize, centrifuge purge, centrates from last three centrifuge operations,
centrifuge heel, and the samples (see Table 2, column 3). Figs. 7 and 8 show comparable
information for uranium for the storage pad soil and the incinerator area soil, respectively.
8.2.1 Storage Pad Soil
As seen in Table 6 and Fig. 5, the overall material balances showed relatively low solids
recoveries for the storage pad soil tests. For Tests 4, 5, 6, and 16, weight percent solids was not
determined for the centrifuge heel, which contributed to the low recoveries. The recovery for Test 8
34
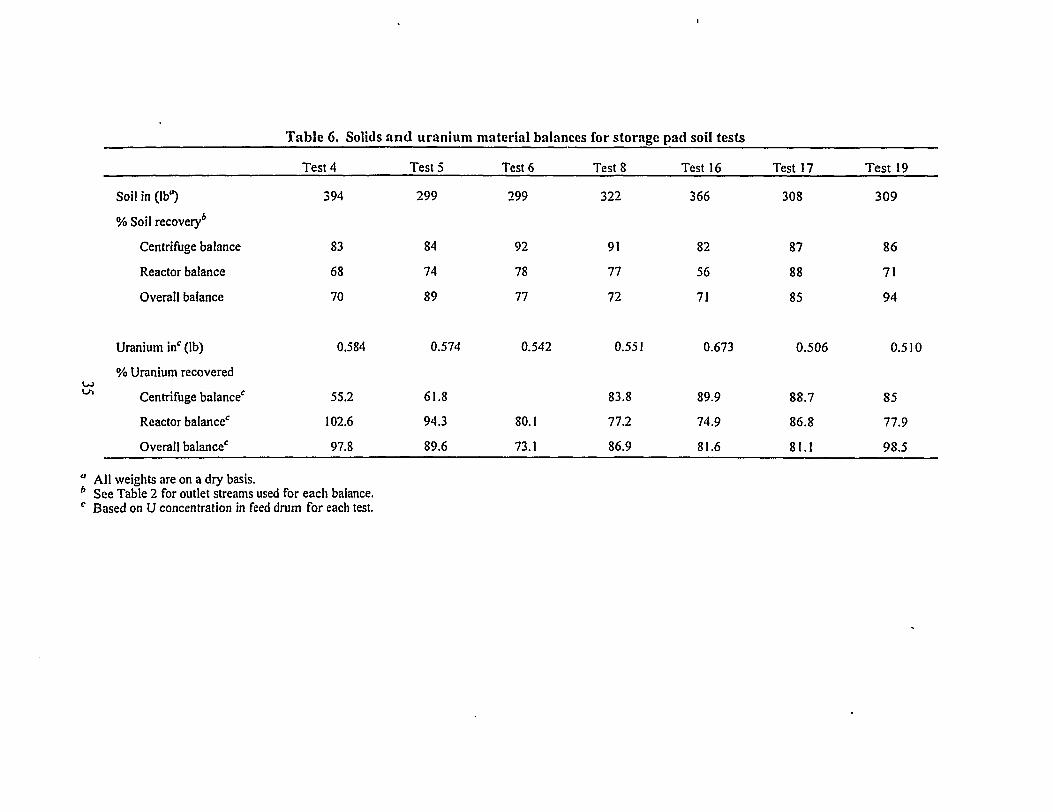
Table 6. Solids and uranium material balances for storage pad soil tests
Test 4 Test5 Test 6 Test 8 Test 16 Test 17 Test 19
Soil in (lb") 394 299 299 322 366 308 309
% Soil recovery*
Centrifuge balance 83 84 92 91 82 87 86
Reactor balance 68 74 78 77 56 88 71
Overall balance 70 89 77 72 71 85 94
Uranium in' (lb) 0.584 0.574 0.542 0.551 0.673 0.506 0.510
% Uranium recovered
Centrifuge balance' 55.2 61.8 83.8 89.9 88.7 85
Reactor balance' 102.6 94.3 80.1 77.2 74.9 86.8 77.9
Overall balance' 97.8 89.6 73.1 86.9 81.6 81.1 98.5
" All weights are on a dry basis. * See Table 2 for outlet streams used for each balance. c Based on U concentration in feed drum for each test.
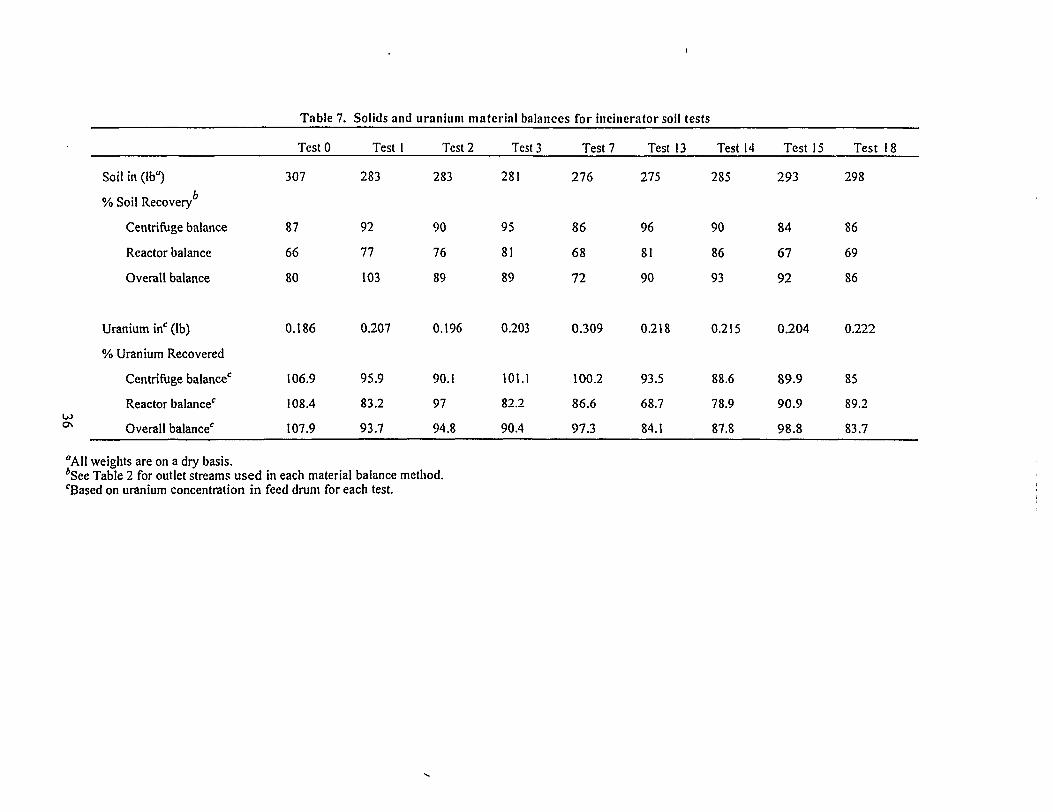
Table 7. Solids and uranium material balances for incinerator soil tests
TestO Test 1 Test 2 Test 3 Test 7 Test 13 Test 14 Test 15 Test 18
Soil in (lb") 307 283 283 281 276 275 285 293 298
% Soil Recovery
Centrifuge balance 87 92 90 95 86 96 90 84 86
Reactor balance 66 77 76 81 68 81 86 67 69
Overall balance 80 103 89 89 72 90 93 92 86
Uranium in0 (lb)
% Uranium Recovered
Centrifuge balance0
Reactor balance0
Overall balance0
0.186 0.207 0.196 0.203 0.309 0.218 0.215 0.204 0.222
106.9 95.9 90.1 101.1 100.2 93.5 88.6 89.9 85
108.4 83.2 97 82.2 86.6 68.7 78.9 90.9 89.2
107.9 93.7 94.8 90.4 97.3 84.1 87.8 98.8 83.7
"All weights are on a dry basis. *See Table 2 for outlet streams used in each material balance method. °Based on uranium concentration in feed drum for each test.
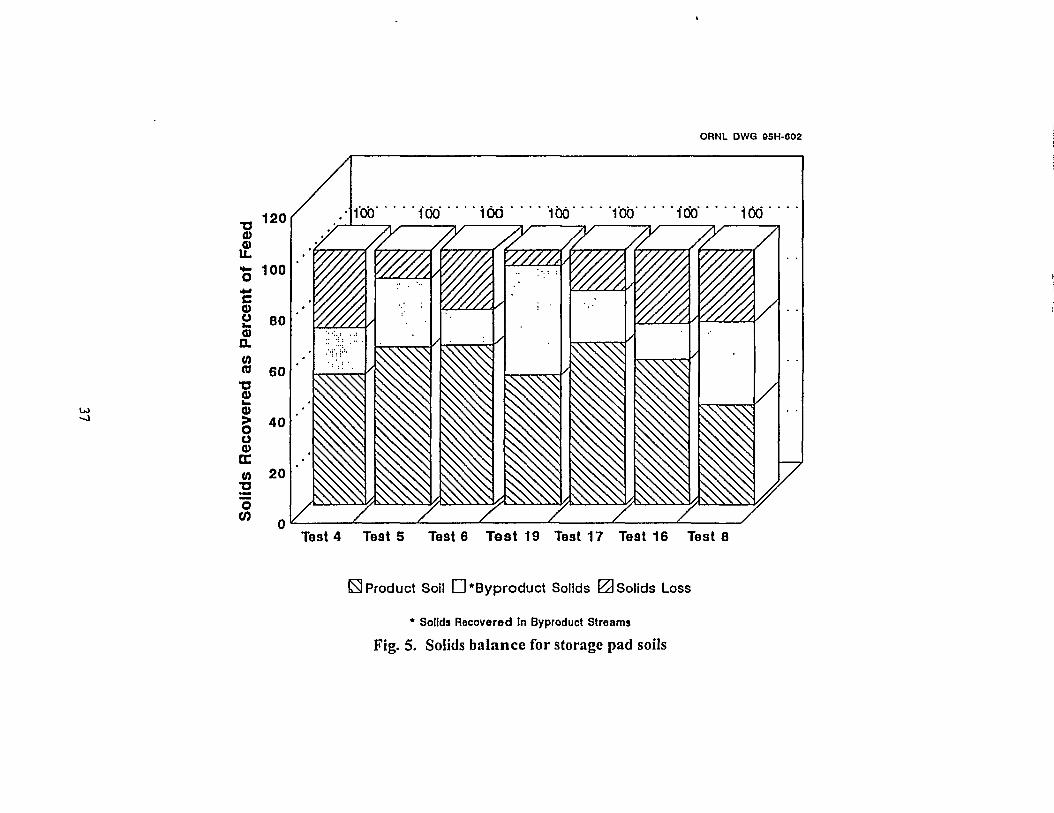
ORNL DWG 05H-602
- J
- 120 0)
•5 1 0 ° c d> H 80 V a W « 60 Q) l _ Q) > 40 a a) DC
OT 2 0
"5
fob 1'co' ioti ' ' ' ' 'ibo 1'ob loo' iod
Test 4 Test 5 Test 6 Tost 19 Te3t 17 Test 16 Test 8
£3 Product Soil D*Byproduc t Solids 0 S o l i d s Loss
* Solids Recovered In Byproduct Streams
Fig. 5. Solids balance for storage pad soils
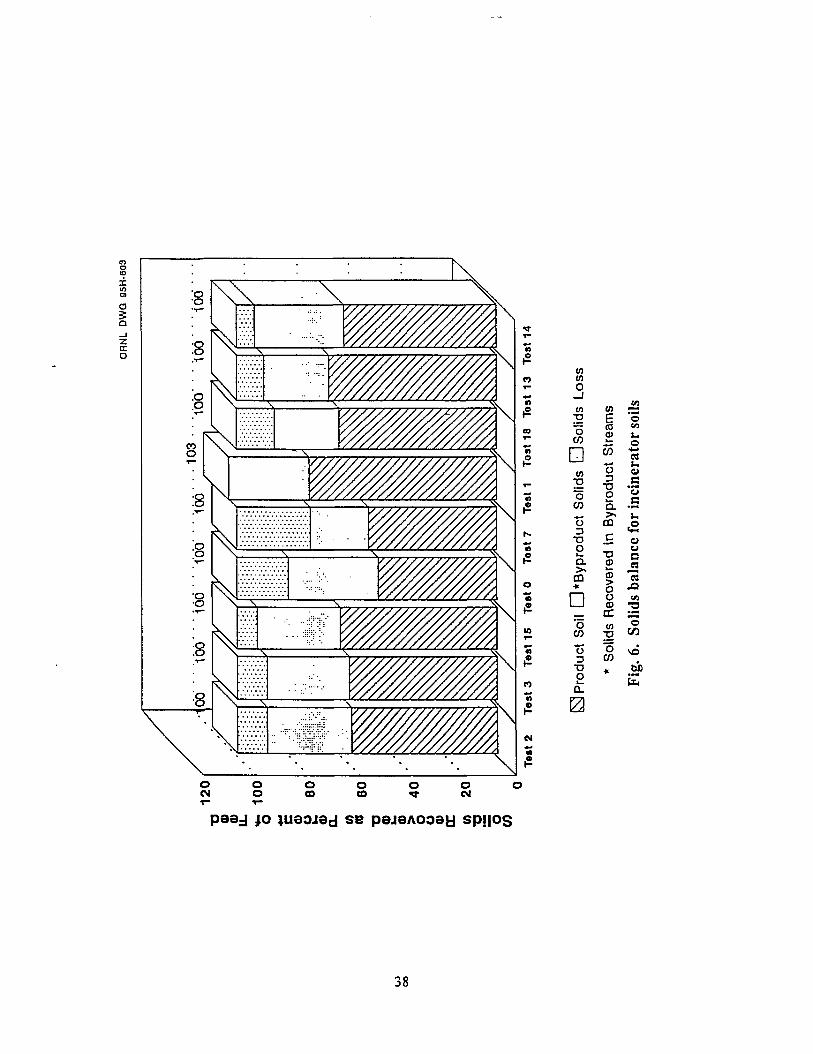
mmmm.
o o o o CM o eo co
o o o V <M
paaj 10 juaoiad se pajeAOoay spijos
38
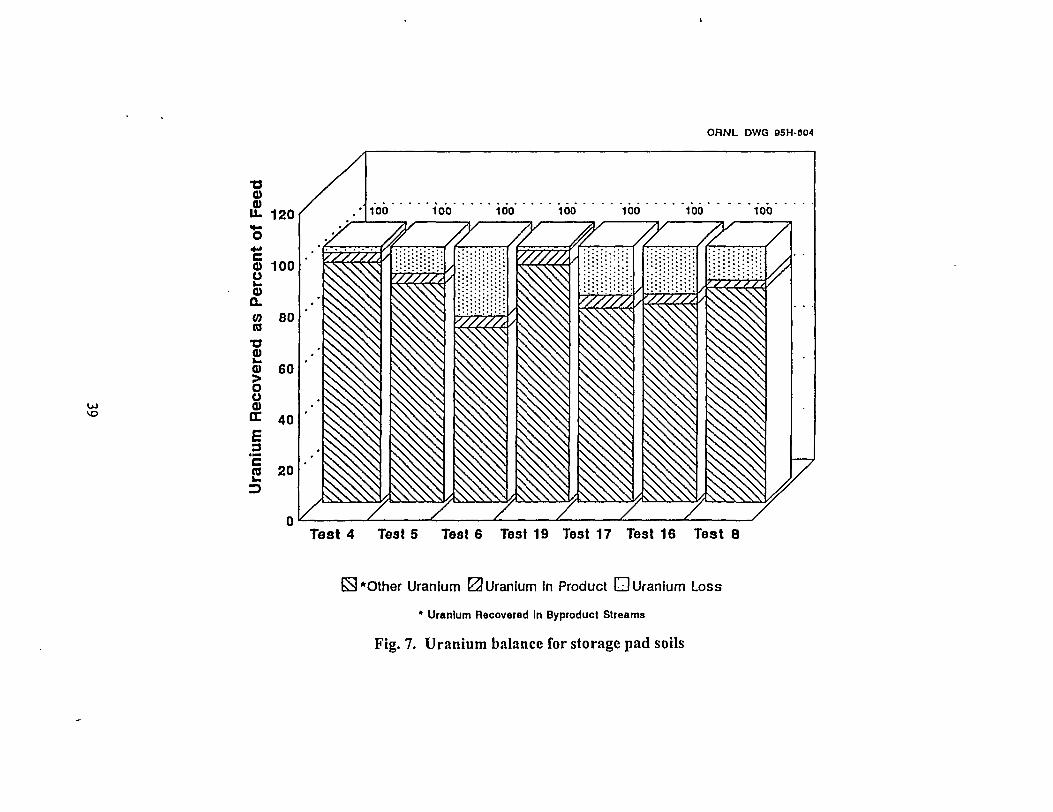
ORNL DWG 95H-604
•a a> a> u. 120 .• 100 100 100 100 100 100
Test 4 Test 5 Test 6 Test 19 Test 17 Test 16 Test 8
H*Other Uranium 0 Uranium In Product CD Uranium Loss
* Uranium Recovered in Byproduct Streams
Fig. 7. Uranium balance for storage pad soils
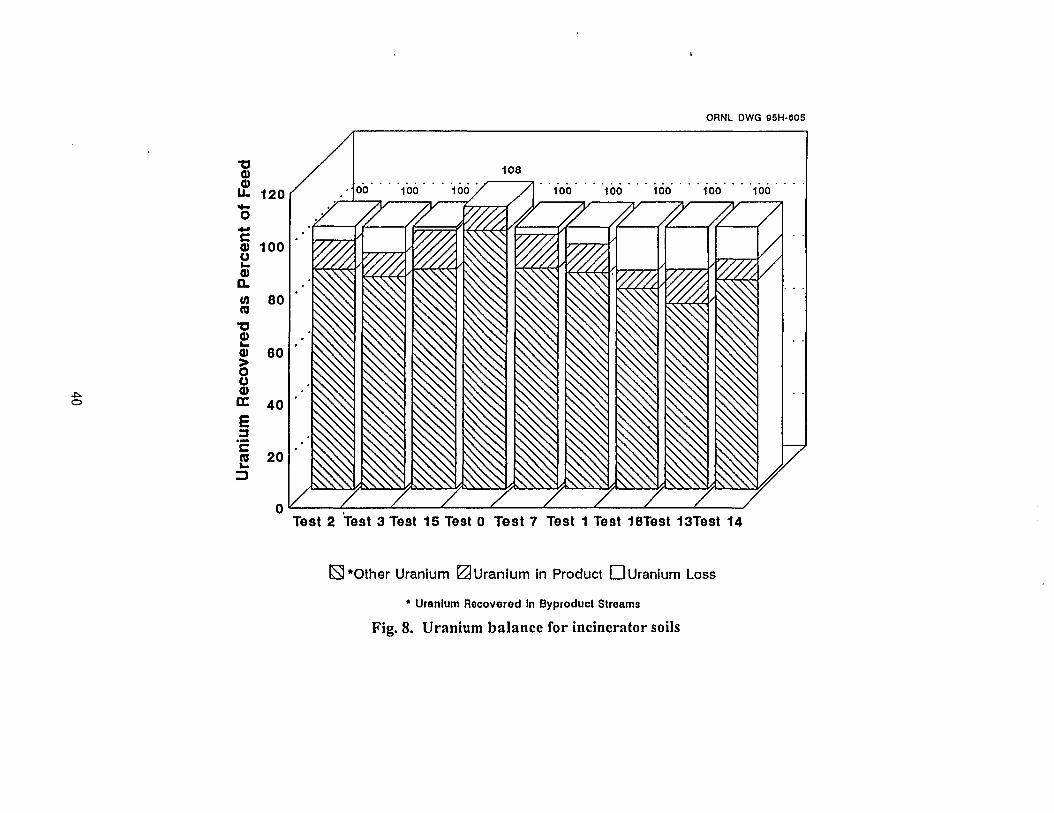
ORNL DWG 05H-605
O
Test 2 Test 3 Test 15 Te3t 0 Test 7 Test 1 Test 18Test 13Test 14
S*Other Uranium 0 Uranium in Product D Uranium Loss
* Uranium Recovered In Byproduct Streams
Fig. 8. Uranium balance for incinerator soils
was low, as was that for Test 7 with the incinerator soil. Citric acid was the leachant in both of these
tests. A possible explanation for the low recoveries with citric acid could be the dissolution of
calcite and dolomite minerals. In secondary waste treatment studies, significant amounts of calcium
and magnesium citrate were found to precipitate over time from citric acid solutions produced by
leaching." Precipitation likely occurred in the Fernald test unit samples that were submitted for
weight percent solids analysis. It is conceivable that the aliquots taken from the samples to be
analyzed for weight percent solids were not representative due to the difficulty of resuspending the
precipitate. This would result in a low value from the analysis of weight percent solids (determined
by evaporation to dryness) in the centrate sample and, consequently, a low solids recovery in the
material balance. An undetermined amount of solids was lost in Test 16 as a result of operational
problems. The solids recovery was acceptable in Test 19. The reason for the low solids recovery
in Test 17, which should have been comparable with that in Test 19, is not known.
For Tests 4, 5, 6, and 16, overall uranium recoveries, as presented in Table 6 and Fig. 7, also
were reduced as a result of not measuring the uranium content of the centrifuge heel. However, as
seen from the detailed balances in Appendix D for the other tests, the uranium recoveries were
reduced by only a few percent. In Test 6 and especially in Test 17, the analytical results for uranium
in the centrate (Sample Point 11 A) are lower than those for uranium in the reactor liquid. As may
be seen from Fig. 1, both samples should have approximately the same uranium concentration.
Since most of the uranium is recovered in this centrate stream, substitution of the uranium
concentration in the reactor liquid for that in the centrate significantly improves the uranium material
balance. The uranium recovery for Test 19 was acceptable.
For the three different material balances, the uranium and solids recoveries for the centrifuge
material balance should be the highest and the overall material balance recoveries the lowest. This
is due primarily to an expected increase in rinsing losses as the soil was processed through the
41

Fernald test unit. An analysis of the solids recovery results in Table 6 by the one-way
repeated-measures ANOVA and the SNK tests showed that the centrifuge material balance
recoveries were significantly greater than those of the reactor vessel material balance. No significant
differences were detected between the overall and the centrifuge material balances or between the
overall and the reactor vessel material balances. For the uranium recovery results in Table 6, the
statistical tests did not detect any significant differences between any of the three material balances.
One might conclude, then, that the statistical tests do not show the expected trends. However, the
calculated recoveries are confounded as a result of not having measured the material in the
centrifuge heel in several tests. Also, during Tests 4 and 5, problems were experienced in
establishing the procedure for generating the samples from the centrifuge centrate and the reactor
slurry. This likely affected the calculated recoveries for the intermediate material balances for these
two tests. Because of these complications, no conclusions are made about the comparisons of the
uranium and the solids recoveries between the different material balances for the storage pad soil
tests.
8.2.2 Incinerator Soil
Table 7 and Fig. 6 show that in most cases the overall material balances for the incinerator soil
tests gave good solids recoveries. A possible cause of the low recovery for Test 7 with citric acid
was discussed above. The reason for the low solids recovery in Test 0 is not known.
For most of the incinerator soil tests, the overall uranium recoveries were satisfactory, as seen
in Table 7 and in Fig. 8. The reason for the low recovery in Test 18 is unknown.
As was done for the storage pad soil tests, the solids and uranium recovery results in Table 7
were analyzed by the one-way repeated-measures ANOVA and the SNK statistical tests. For the
42
solids, both the overall and the centrifuge material balance recoveries were significantly greater than
those of the reactor vessel material balance. There was no significant difference between the
recoveries of the overall and the centrifuge material balances. No significant differences were
detected between the uranium recoveries for any of the three material balances.
8.2.3 Slurry Measurement Problems
Whereas it was inconclusive for the storage pad soil, the statistical analyses of the incinerator
soil tests did not show the expected variation of recoveries with the different material balances (see
the explanation in Sect. 8.2.1). A possible reason for this could be problems with obtaining accurate
measurements of solids and uranium in slurries. For the intermediate material balances, samples of
the centrate from the first centrifuge operation and of the reactor slurry were required. Except for
Tests 14 and 16, this centrate contained the nominal <20-/zm fraction of the feed soil. The reactor
contained the feed soil, less any losses that occurred and samples that were taken up to that point.
Thus, any problems with slurry measurements would be expected to be more likely for the reactor
than for the centrate due to the higher solids content.
Inaccurate measurements could result from (1) nonrepresentative samples that are taken from
the process for submission to the laboratory, (2) nonrepresentative aliquots that are taken from the
laboratory samples for analysis, and (3) inaccuracies in the analytical methods that are utilized.
To examine possible problems with slurry measurements, the results for the reactor slurry
samples taken at the beginning and at the end of the 2-hr reaction period in Test 0 were compared
(three replicate slurry samples were taken at each of the two times). Although uranium is being
transferred from the solid to the liquid phase during the reaction period, the total uranium content,
as well as the total solids content, of the slurry samples does not change with time. A t-test
43
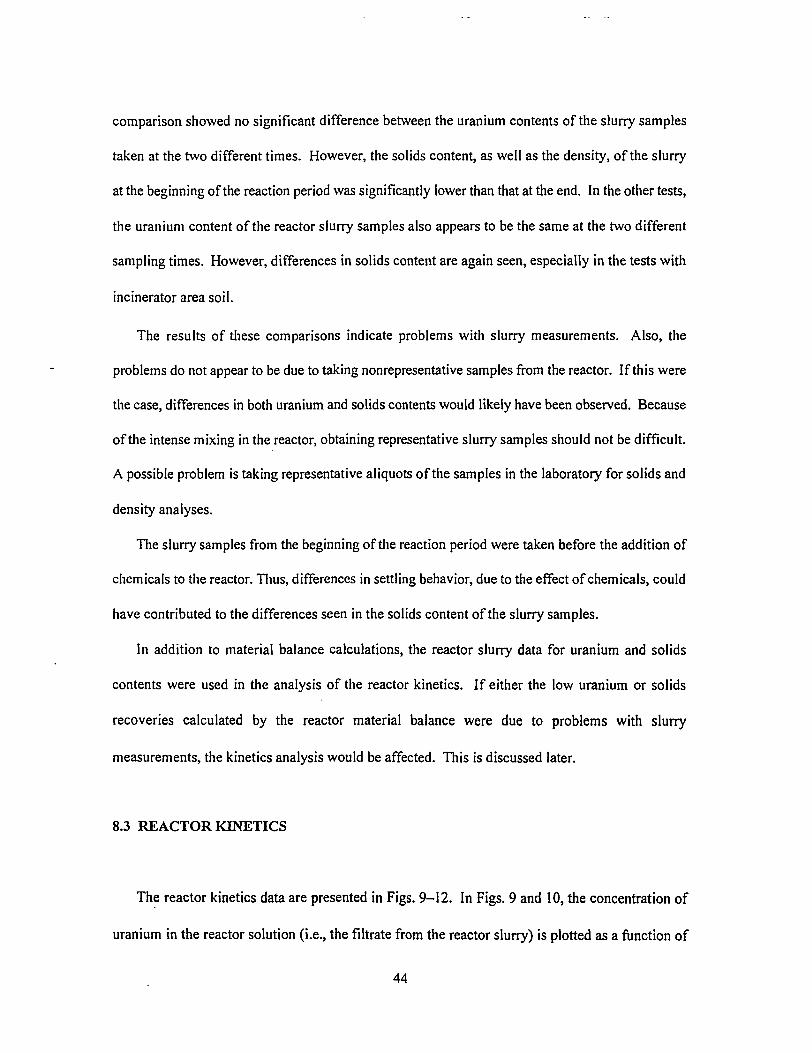
comparison showed no significant difference between the uranium contents of the slurry samples
taken at the two different times. However, the solids content, as well as the density, of the slurry
at the beginning of the reaction period was significantly lower than that at the end. In the other tests,
the uranium content of the reactor slurry samples also appears to be the same at the two different
sampling times. However, differences in solids content are again seen, especially in the tests with
incinerator area soil.
The results of these comparisons indicate problems with slurry measurements. Also, the
problems do not appear to be due to taking nonrepresentative samples from the reactor. If this were
the case, differences in both uranium and solids contents would likely have been observed. Because
of the intense mixing in the reactor, obtaining representative slurry samples should not be difficult.
A possible problem is taking representative aliquots of the samples in the laboratory for solids and
density analyses.
The slurry samples from the beginning of the reaction period were taken before the addition of
chemicals to the reactor. Thus, differences in settling behavior, due to die effect of chemicals, could
have contributed to the differences seen in the solids content of the slurry samples.
In addition to material balance calculations, the reactor slurry data for uranium and solids
contents were used in the analysis of the reactor kinetics. If either the low uranium or solids
recoveries calculated by the reactor material balance were due to problems with slurry
measurements, the kinetics analysis would be affected. This is discussed later.
8.3 REACTOR KINETICS
The reactor kinetics data are presented in Figs. 9-12. In Figs. 9 and 10, the concentration of
uranium in the reactor solution (i.e., the filtrate from the reactor slurry) is plotted as a function of
44
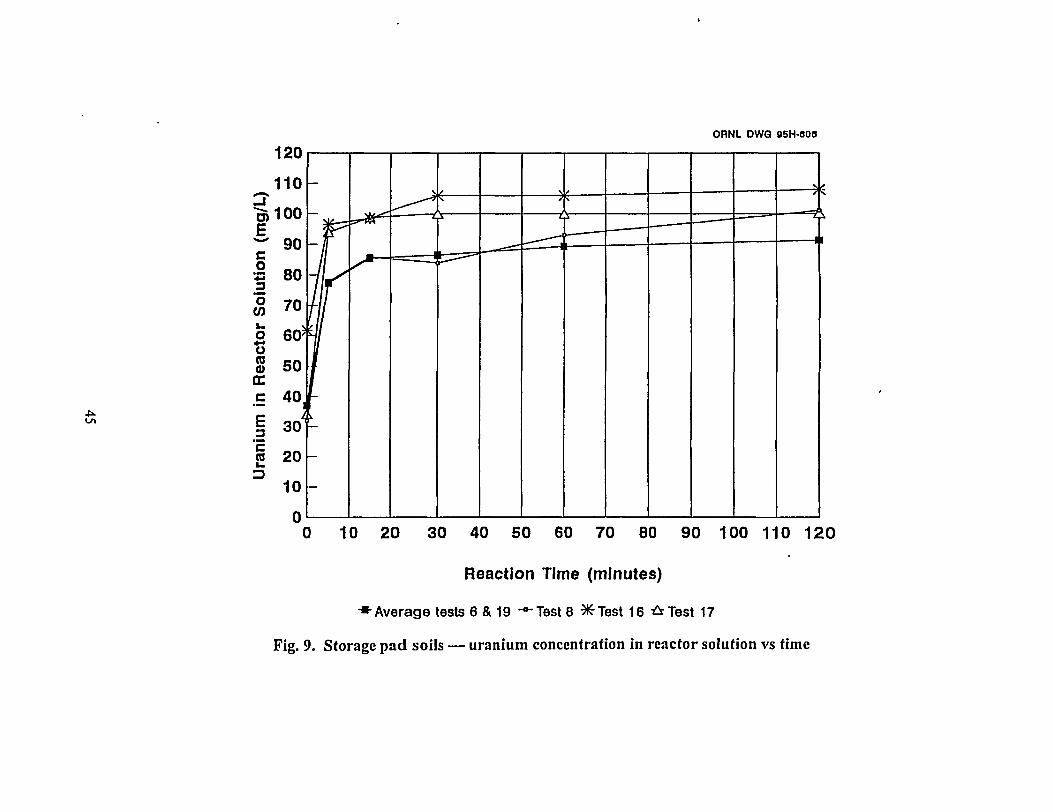
ORNL DWG Q5H-000
Ja>
120
H O h
3) 100 E
w 90 c o "*-• 80 3 O w
70 L .
o 4-»
60 o n a) 50 DC c 40 E 3
30' C ro 20 >_ 3
10
0 10 20 30 40 50 60 70 80 90 100 110 120
Reaction Time (minutes)
•Average tests 6 & 19 -"Test 8 ^Test 16 A Test 17
Fig. 9. Storage pad soils — uranium concentration in reactor solution vs time
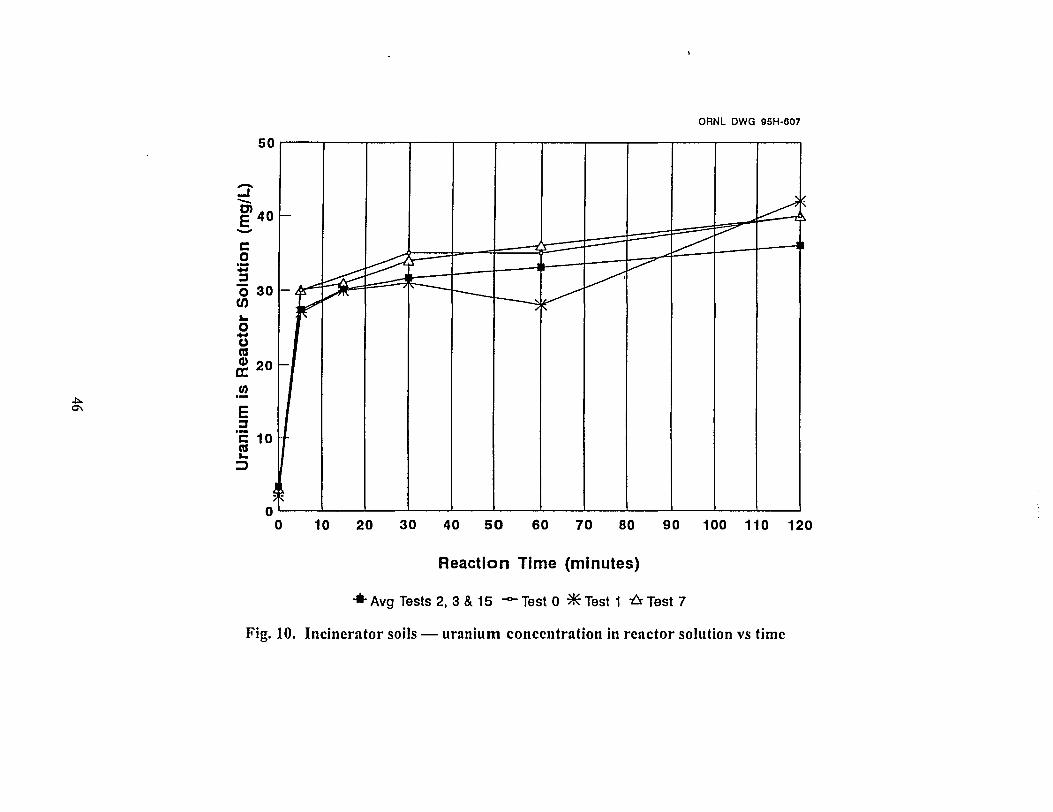
ORNL DWQ 95H-607
4».
10 20 30 40 50 60 70 80 90 100 110 120
Reaction Time (minutes)
•*• Avg Tests 2, 3 & 15 -*- Test 0 * Test 1 A Test 7
Fig. 10. Incinerator soils — uranium concentration in reactor solution vs time
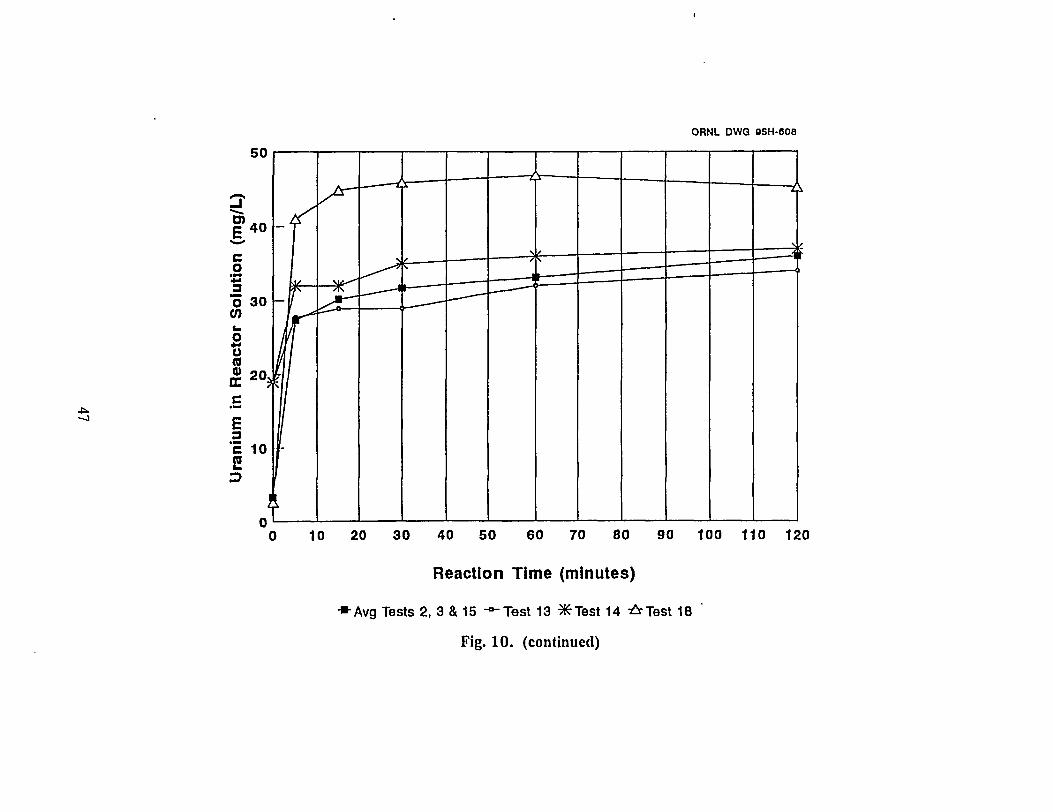
ORNL DWQ 05H-008
50
c O SI "5 w o « £20. E 3 E 10 n I
- * -^
s
I
I
- * -^
s
T
I
- * -^
s )k
I
s )k
10 20 30 40 50 60 70 80 90 100 110 120
Reaction Time (minutes)
• A v g Tests 2, 3 & 15 -°"Test 13 ^Test 14 A Test 18
Fig. 10. (continued)
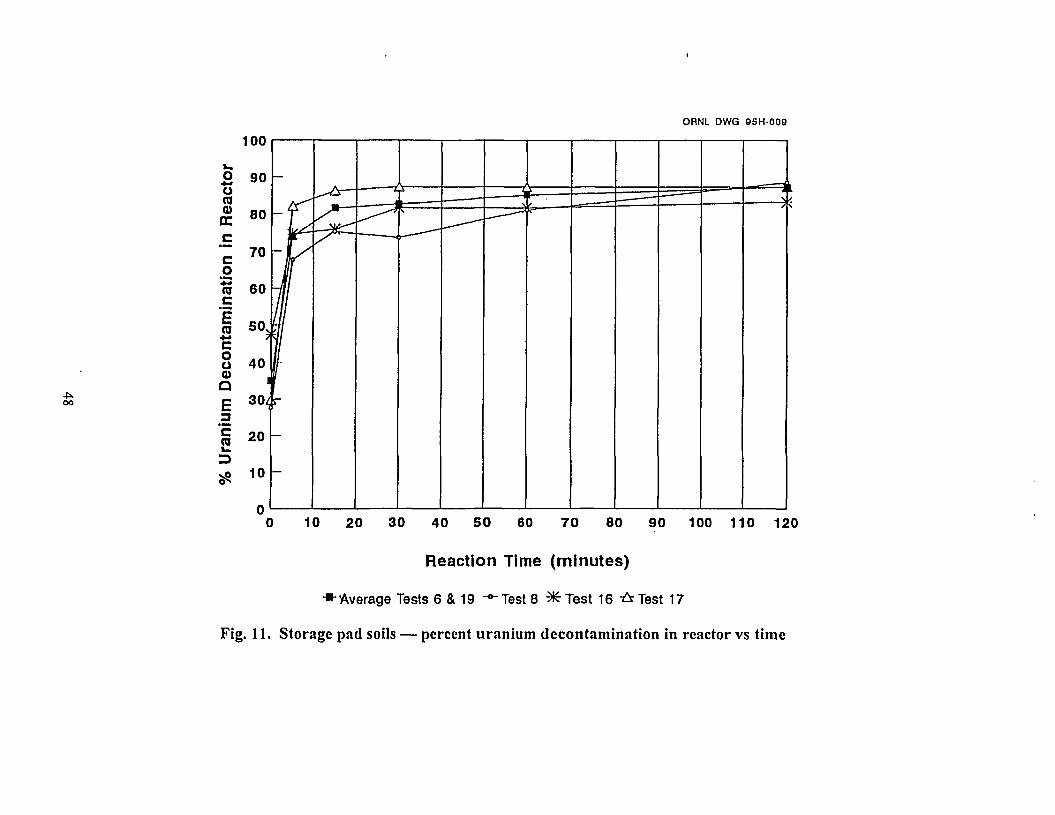
ORNL DWG 05H-600
oo
100
10 20 30 40 50 60 70 80 90 100 110 120
Reaction Time (minutes)
•'Average Tests 6 & 19 -*- Test 8 ^ T e s t 16 A Test 17
Fig. 11. Storage pad soils — percent uranium decontamination in reactor vs time
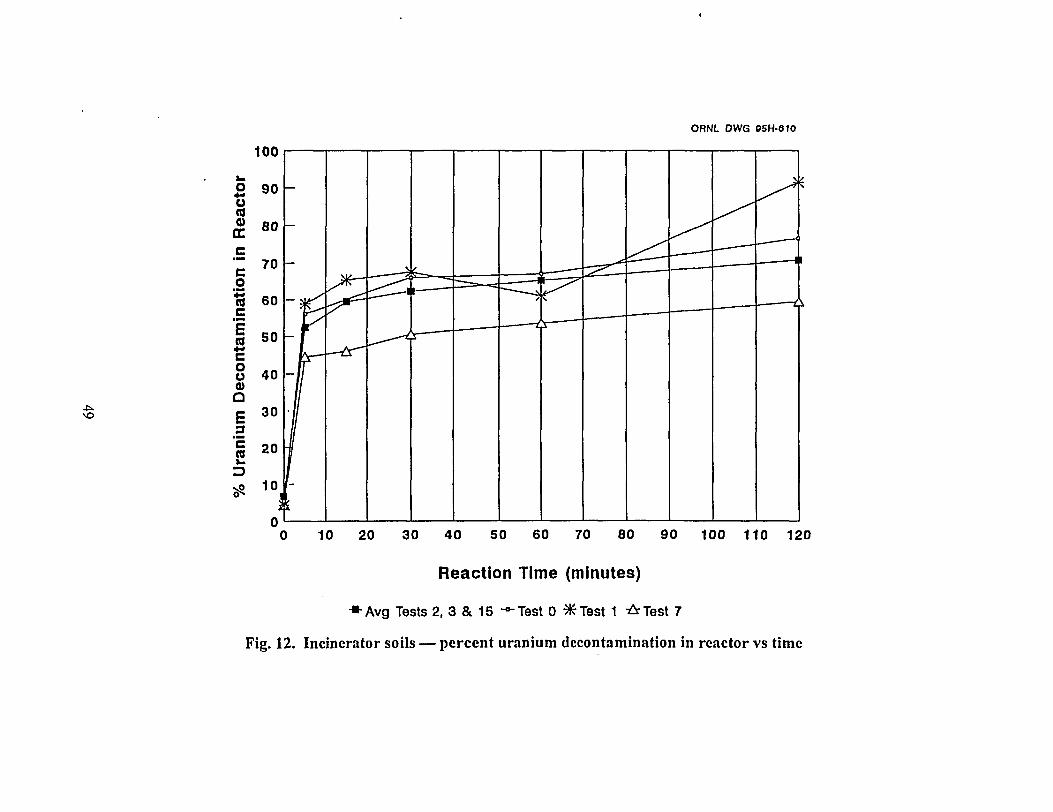
ORNL DWG 05H-810
100
4*.
o 4->
90 o « 0)
DC 80
c •mm 70 C o • mm
H 60 c E n 50 •M
c o u 40 0) Q
E 30 a c n 20 V. D 10
^ ^ ^ J
10 20 30 40 50 60 70 80 90 100 110 120
Reaction Time (minutes)
•Avg Tests 2, 3 & 15 -~ Test 0 *Test 1 A Test 7
Fig. 12. Incinerator soils — percent uranium decontamination in reactor vs time
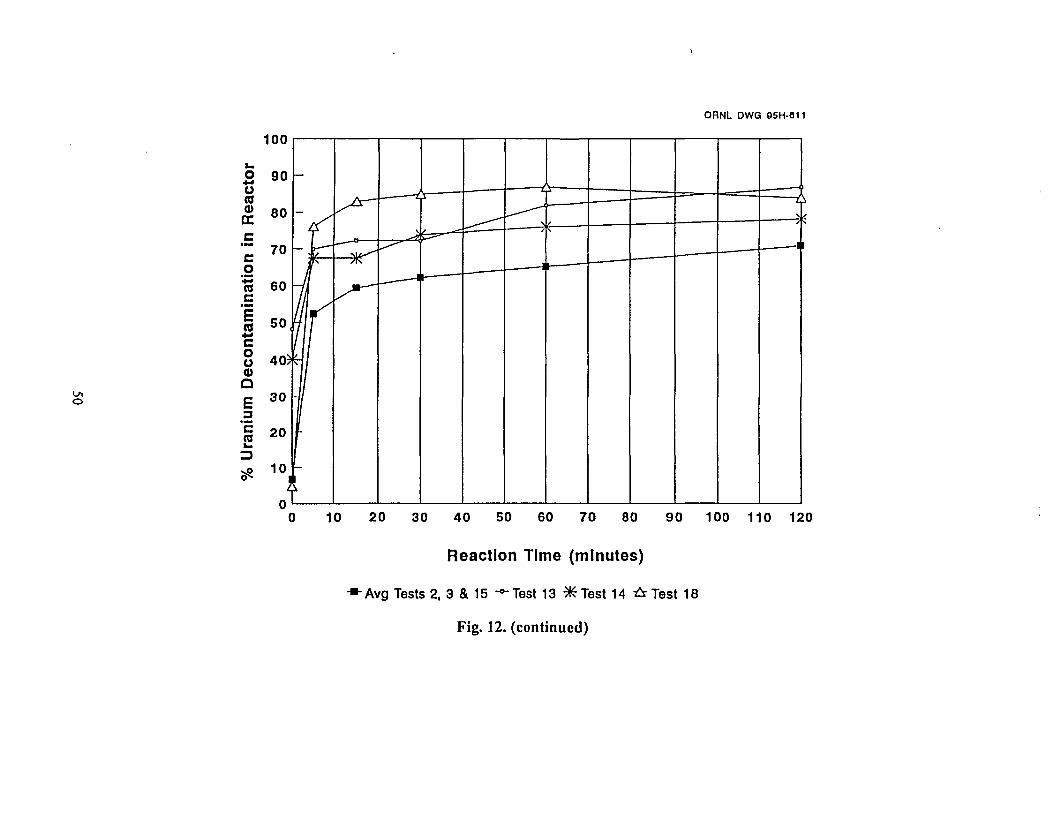
ORNL DWG 05H-611
100
o
50 60 90 100 110 120
Reaction Time (minutes)
Avg Tests 2, 3 & 15 -~Test 13 ^ T e s t 14 A Test 18
Fig. 12. (continued)
time. The percent decontamination ( i.e., percent uranium leached from the soil) vs time is shown
in Figs. 11 and 12. For each soil, the results from the replicate runs are compared with the results
from each of the other tests.
8.3.1 Storage Pad Soil
In Figs. 9 and 11, a composite curve is shown for replicate Tests 6 and 19. The data from Tests
4 and 5, the other two of the four replicate tests for this soil, are not included. During these first two
tests of Phase II, problems were experienced in establishing the procedure for filtering the reactor
slurry. The anomalous data for Tests 4 and 5 likely resulted from these problems. Comparison of
the curve of the replicate tests with those of the other tests does not indicate any effect of attrition
scrubbing, type of leachant, or reaction temperature. For all the storage pad soil tests, the kinetic
data show that the leaching reaction is essentially complete within 30 to 60 min.
8.3.2 Incinerator Soil
In Figs. 10 and 12, a composite curve is shown for replicate Tests 2,3, and 15. Comparison with
the curves of the other tests does not indicate any effect of attrition scrubbing or type of leachant on
leaching rate. As seen in Fig. 12, the percent decontamination curve for Test 7 did lie below the
curve for the replicate tests. Because of the uncertainties in the measurements of uranium
concentration in the reactor slurry, the difference between the curves was not great enough to
indicate an effect. A confounding factor, though, is the high concentration of uranium in the feed
soil in Test 7 (1120 ppm as compared with an average of 717 ppm for the other incinerator tests).
As discussed earlier, the Test 7 feed soil was prepared in a different batch from the other incinerator
feed soils.
51
Test 18 indicates that a higher reactor temperature increases leaching rate (Figs. 10 and 12). At
the 40°C operating temperature, both the concentration and the percent decontamination curves have
greater initial slopes and significantly higher final values than do the curves for the other tests.
The percent decontamination curve for Test 13 is seen to lie noticeably above that of the
replicate tests. However, the Test 13 curve is suspect because of uncertainty about the analytical
results for uranium concentration in the reactor slurry (which is used to calculate percent
decontamination, as described previously). One of the analytical results was obviously in error (a
factor of 10 too low), and the other was significantly lower than those for the other tests.
As with the storage pad soil, the kinetic data show that the leaching reaction is essentially
complete within 30 to 60 min.
8.3.3 Effect of Slurry Measurement Problems
If the low recoveries from the reactor material balance were due to slurry measurement
problems, a likely consequence of the problems would be that the measured uranium and solids
concentrations in the reactor slurry were too low. However, the comparisons of the measurements
on reactor slurry samples taken at different times in Test 0 indicated that there were no significant
problems with uranium determination but that solids content and density results were low. The effect
on the kinetics analysis would be to increase the calculated value of percent decontamination
somewhat (see Sect. 6 for a description of this calculation).
The uranium concentration in the liquid portion of the reactor slurry was another parameter used
in the calculation of the percent decontamination in the reactor. This was determined by filtering
a reactor slurry sample and submitting the filtrate for analysis. Comparison of the measured
uranium concentrations in these filtrate samples with those in samples of the centrate (produced by
52

centrifuging the reactor slurry) indicates problems with the filtration procedure.
The uranium concentration of the centrate should be less than that of the filtrate from the reactor
slurry because of dilution during the centrifuge operation. At the end of the transfer of the reactor
slurry to the centrifuge feed tank, the reactor was rinsed with water. Also, at the end of the
centrifuge operation, the feed tank was rinsed. The water from both rinses was added to the centrate
that was collected. Considering the volume of the rinse water and the fact that a portion of the
centrate, before dilution by the feed tank rinse water, is collected with the centrifuge wet cake, the
uranium concentration in the centrate should be about 90% or less of that in the reactor slurry
filtrate. However, the test results do not exhibit such differences. In several cases, the centrate
uranium concentration was actually higher than that of the reactor slurry filtrate.
A possible explanation for this anomalous behavior is that during the filtration of the reactor
slurry samples, some of the uranium in solution is adsorbed by the filter paper. The measured
concentration of uranium in the filtrate would then be lower than the actual concentration in the
reactor solution. The obvious effect on the kinetics analysis would be to calculate low values for
percent decontamination. This adsorption effect was also apparent in bench-scale studies.'2
When the results of using centrifugation and filtration for separating leaching solution from
solids were compared in these studies, the solutions generated by filtration contained less uranium.
Again, an explanation is the adsorption of the soluble uranium species on the filter paper.
The percent decontamination values from the kinetic analysis were compared with those
calculated from the measurements of uranium in the treated soil. This is discussed later.
53
8.4 SOIL DECONTAMINATION
Tables 8 and 9 list the soil decontamination results for the storage pad soil tests and the
incinerator soil tests, respectively. Percent decontamination is calculated using the uranium
concentration in each feed drum and the uranium concentration in the treated soil. Figures 13 and 14
show the treated soil uranium concentrations corresponding to Tables 8 and 9, respectively. In these
figures, all the analytical results for each test are presented. As discussed previously for the feed
soils, included are results for replicate samples and repeat analyses. The data in Tables 8 and 9 for
the feed and the treated soils are averages of these replicate and repeat analyses.
8.4.1 Storage Pad Soil
As indicated by Table 8 and Fig. 13, except for Test 19, there appeared to be no significant
differences between the treated soil uranium concentrations in the tests that were run with the
storage pad soil. As a first approximation, all the treated soil uranium concentrations, except for
Test 19, lay within two standard deviations from the average. While Test 19, which was a replicate
of Tests 4, 5, and 6, appeared to be an outlier, statistical tests by the Dixon and the Grubbs methods13
could not reject the Test 19 result at a 95% confidence level. Using the paired t-test described
previously, no significant differences were found between the results of the replicate tests and the
results of each of the other three tests. This was the case even when Test 19 was excluded from the
comparison (making the detection of a difference more likely). This agrees with the kinetic data
presented above, which showed no effects of attrition scrubbing (Test 16), type of leachant (Test 8),
or reaction temperature (Test 17). This is also consistent with the results of the ORNL bench-scale
studies. Finally, the storage pad treated soils had significantly higher concentrations of uranium than
54
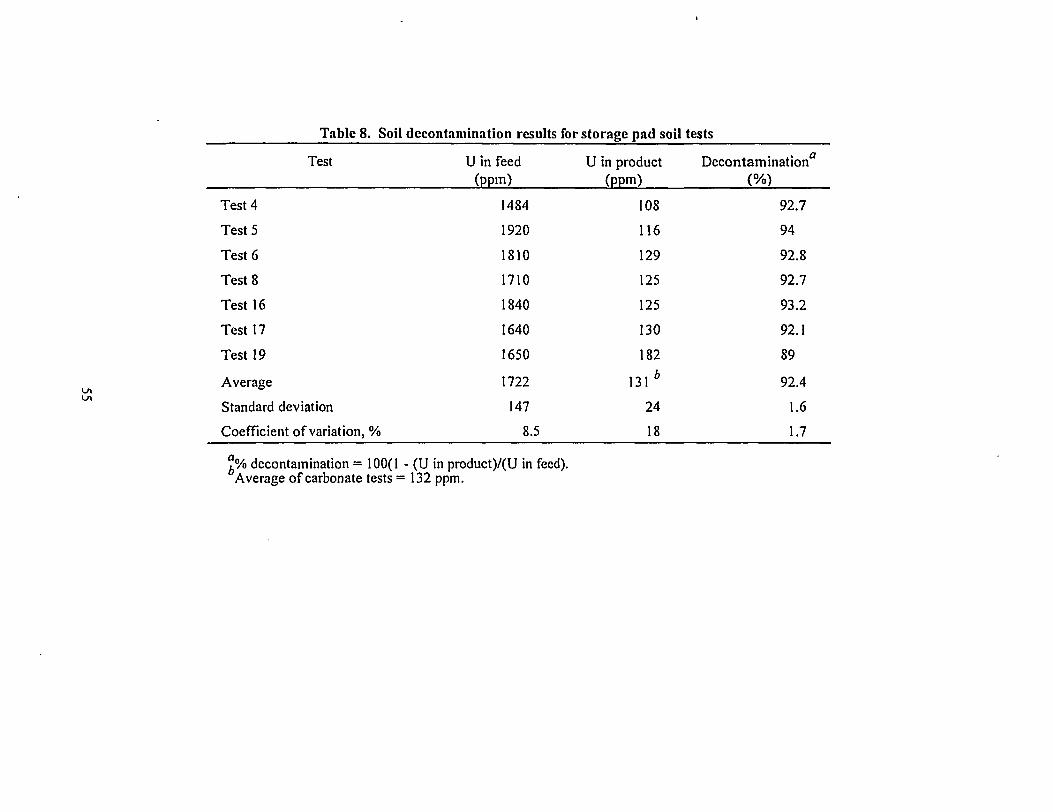
Table 8. Soil decontamination results for storage pad soil tests
Test U in feed U in product Decontamination (PP'n) (ppm) (%)
Test 4 1484
Test 5 1920
Test 6 1810
Test 8 1710
Test 16 1840
Test 17 1640
Test 19 1650
Average 1722
Standard deviation 147
Coefficient of variation, % 8.
108 92.7
116 94
129 92.8
125 92.7
125 93.2
130 92.1
182 89
131 * 92.4
24 1.6
18 1.7
,% decontamination = 100(1 - (U in product)/(U in feed). Average of carbonate tests = 132 ppm.
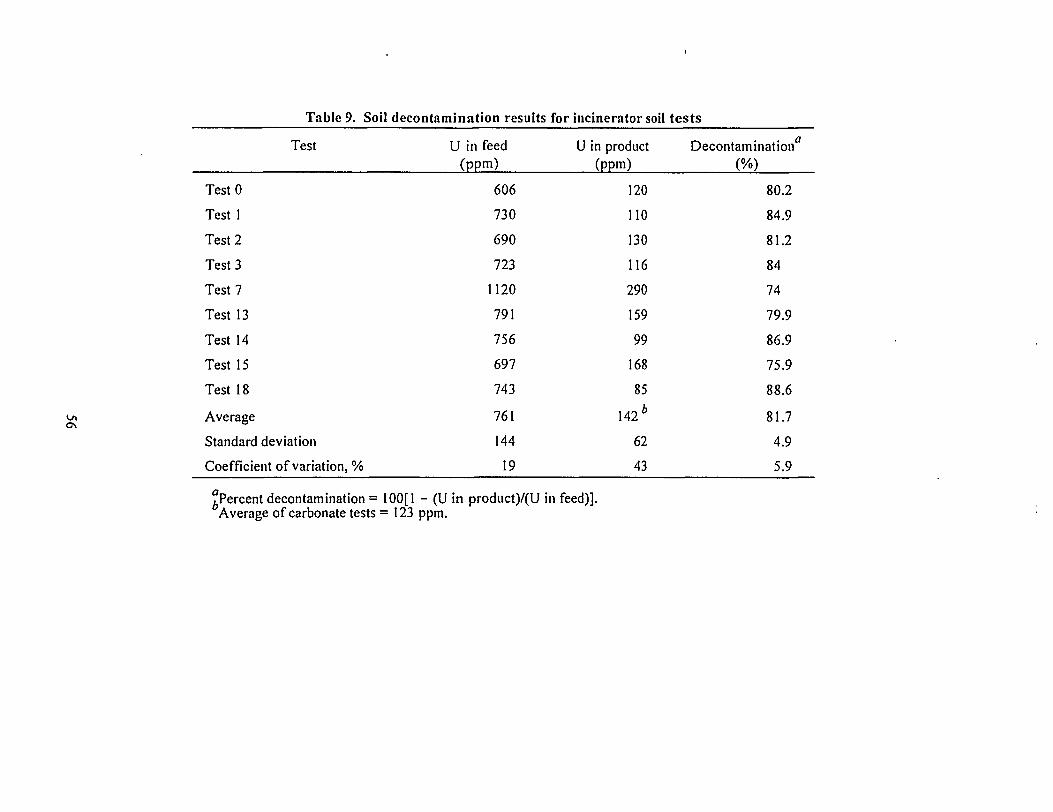
Table 9. Soil decontamination results for incinerator soil tests
Test U in feed U in product Decontamination (ppm) (ppm) (%)
TestO 606 120 80.2
Test 1 730 110 84.9
Test 2 690 130 81.2
Test 3 723 116 84
Test 7 1120 290 74
Test 13 791 159 79.9
Test 14 756 99 86.9
Test 15 697 168 75.9
Test 18 743 85 88.6
Average 761 142* 81.7
Standard deviation 144 62 4.9 Coefficient of variation, % 19 43 5.9
a. Percent decontamination = 100[1 - (U in product)/(U in feed)]. Average of carbonate tests = 123 ppm.
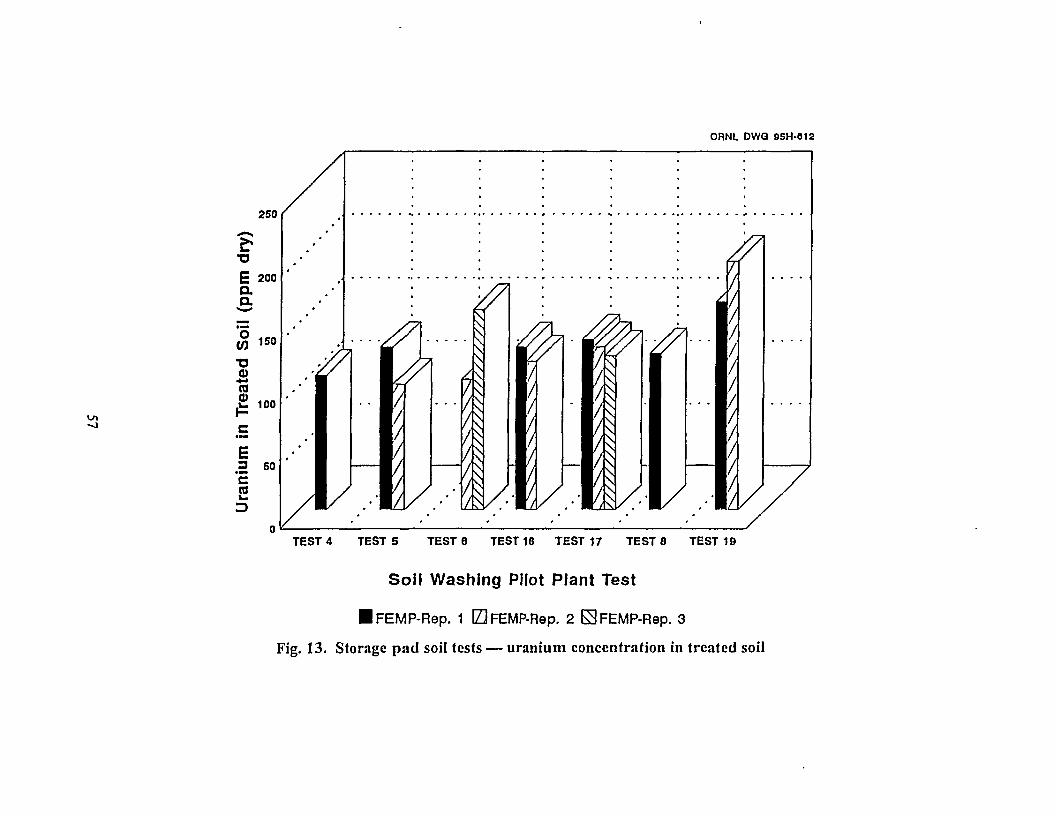
ORNL DWQ 05H-012
-̂ 1
TEST 4 TEST 5 TESTS TESTIS TEST 17 TEST 8 TEST 19
Soil Washing Pilot Plant Test
• FEMP-Rep. 1 ElFEMP-Rep. 2 0FEMP-Rep. 3
Fig. 13. Storage pad soil tests — uranium concentration in treated soil
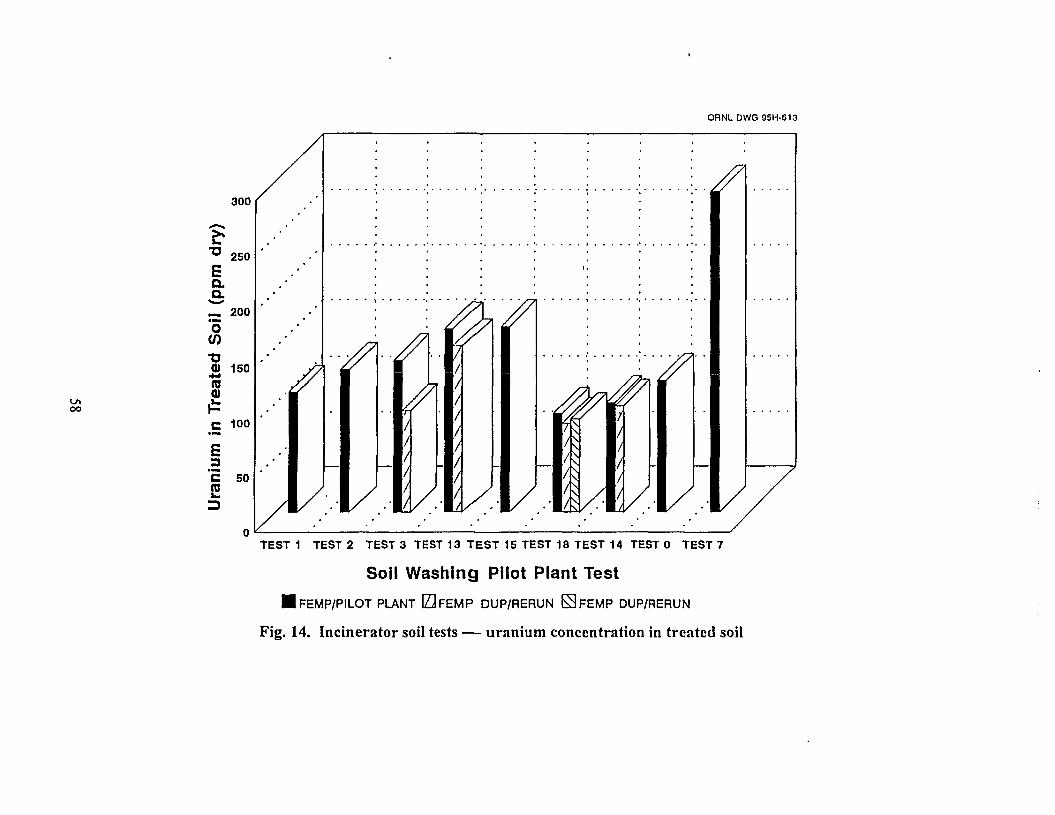
ORNL DWG 95H-613
oo
300
250 E a. a. «̂**
— M 200
o 0) T3 0) 150
+ J (Q (1) .»-J-C 100
E 3 C 50 n
A-A A
A
A
TEST 1 TEST 2 TEST 3 TEST 13 TEST 15 TEST 18 TEST 14 TEST 0 TEST 7
Soil Washing Pilot Plant Test • FEMP/PILOT PUNT 0FEMP DUP/RERUN 0FEMP DUP/RERUN
Fig. 14. Incinerator soil tests — uranium concentration in treated soil
the preliminary decontamination target of 52 ppm uranium, based on a the t-test comparison of the
target level with the replicate test results (including Test 19) at a 95% confidence level. The power
of the t-test was 0.88, indicating a high probability that the difference was true.
Statistical analysis showed no significant relationship between percent decontamination and the
uranium feed concentration for the storage pad soil. The average percent decontamination was 92%.
Based on a paired t-test comparison, the percent decontamination values in Table 8 were
significantly higher than those determined in the kinetic analysis [calculated as measured uranium
concentration in the filtrate phase divided by the uranium concentration in the filtrate assuming
100% decontamination (Sect. 6)]. This is consistent with the speculation that low decontamination
values in the kinetics analysis may have resulted from uranium adsorption on filtration paper.
8.4.2 Incinerator Soil
For the incinerator soil, Table 9 and Fig. 14 indicate that the type of leaching agent had a
significant effect on the treated soil uranium concentration. Except for Test 7, in which citric acid
was the leachant, all the treated soil uranium concentrations lay within two standard deviations from
the average. The average for the carbonate tests was 123 ppm, as compared with an average of
142 ppm for all tests. Again using the paired t-test to compare with the results of the replicate tests
(Tests 2,3, and 15), the treated soil uranium concentration from the citric acid test was significantly
higher than those from the carbonate tests. However, as discussed above, a confounding factor is
the high concentration of uranium in the feed soil in Test 7. Because of this, no conclusion is made
about the effect of type of leaching agent on uranium decontamination.
The t-test did not detect any significant effect of attrition scrubbing (Tests 0, 1, 13, & 14) or
reactor temperature (Test 18). As discussed previously, soil samples were taken in Test 0 at attrition
scrubbing times of 0, 15, 30,45, and 60 min. Bench-scale tests with these samples confirmed the
absence of a beneficial effect of attrition scrubbing on treated soil uranium concentration.14
Consequently, pooling the results of Tests 0, 1,2,3, 13,14, and 15 is valid since attrition scrubbing
had no effect. A subsequent paired t-test using the pooled results did show that increased reactor
temperature significantly lowered the treated soil uranium concentration. The power of the t-test
59
was 0.96, indicating a high probability that the difference was true. The effect of reactor
temperature is consistent with results of ORNL bench-scale leaching studies. As discussed above,
the kinetic data also indicated a significant effect of temperature on leaching.
As was found for the storage pad soil, the t-test at a 95% confidence level showed that the
treated incinerator soils from the replicate tests had significantly higher concentrations of uranium
than the preliminary decontamination target of 52 ppm. The power of the t-test was essentially equal
to 1, indicating a very high probability that the difference was true.
Statistical analysis showed no significant relationship between percent decontamination and the
uranium feed concentration . The average percent decontamination was 83%. Based on a paired
t-test comparison, the percent decontamination values in Table 9 were significantly higher than those
calculated in the kinetic analysis. Again, this is consistent with the idea that low decontamination
values in the kinetics analysis resulted from slurry filtration problems, namely, uranium adsorption
on the paper filter.
60
9. RESULTS OF TESTS CARRIED OUT AT "OPTIMUM" CONDITIONS
9.1 BASIS FOR EXPERIMENTAL CONDITIONS
As discussed in the Phase II test plan, the final tests of Phase II were to be carried out at
"optimum" conditions. These conditions were to be based on the results of the Phase II tests listed
in Table 1, as well as previous and concurrent bench-scale tests at ORNL. Also, the feed soils were
to be incinerator and storage pad soils, each of which had been prepared by blending in a concrete
mixer, as described in Sect. 3.3, and a soil that contained grass and roots. In collecting the soils that
were ultimately blended, the procedure involved removing several inches of the topsoil layer before
collecting the actual soil samples. In collecting the latter soil from the Plant 1 Pad area, the topsoil
layer, which contained grass and roots, was included as part of the soil sample.
Based on the results presented in Sect. 8 and on ORNL bench-scale results, the conditions for
the final Phase II soil leaching tests were chosen as described in the following:
• Attrition scrubbing was eliminated as a process step. Fernald test unit and bench-scale tests showed no beneficial effect of attrition scrubbing on uranium removal efficiency. In fact, the ORNL bench-scale tests on the samples produced in the Fernald test unit attrition scrubber showed a detrimental effect on efficiency. A possible cause of this was the increase in surface area due to the generation of small soil particles. The additional surface area could provide more adsorption sites for solubilized uranium species, thereby decreasing the experimental leaching efficiency (which was determined by analysis of the solubilized uranium in the leaching solution).
By eliminating attrition scrubbing, the centrifuge was used to process only treated soil. As discussed in Sect. 8, the centrifuge was used to process both feed soils and treated soils in the previous tests. Consequently, contamination of the treated soil by residual feed soil in the centrifuge was a potential problem. This was not the case in the final tests.
I n each test, the soil underwent three 1-hr leaching reactions followed by two rinsing steps. The soil slurry was centrifuged after each leaching reaction, and fresh Iixiviant was added when another leaching reaction followed. When a rinsing step followed, the centrifuged solids were repulped with process water with no addition of chemicals. In bench-scale tests at ORNL, soil samples were subjected to five successive leaching steps, with fresh Iixiviant used in each step. The results indicated that a certain amount of uranium was leached from the soil in each leaching step, the amount leached decreasing with each step.
Potassium permanganate was used as an oxidant in the leaching reaction. ORNL bench-scale tests showed this to be beneficial in leaching uranium from incinerator area soil.
• • The leaching reactor was to be operated at 40°C. From the results discussed in Sect. 8 and from ORNL bench-scale tests, increased temperature has a beneficial effect on leaching rate and uranium leaching efficiency for incinerator area soil.
61
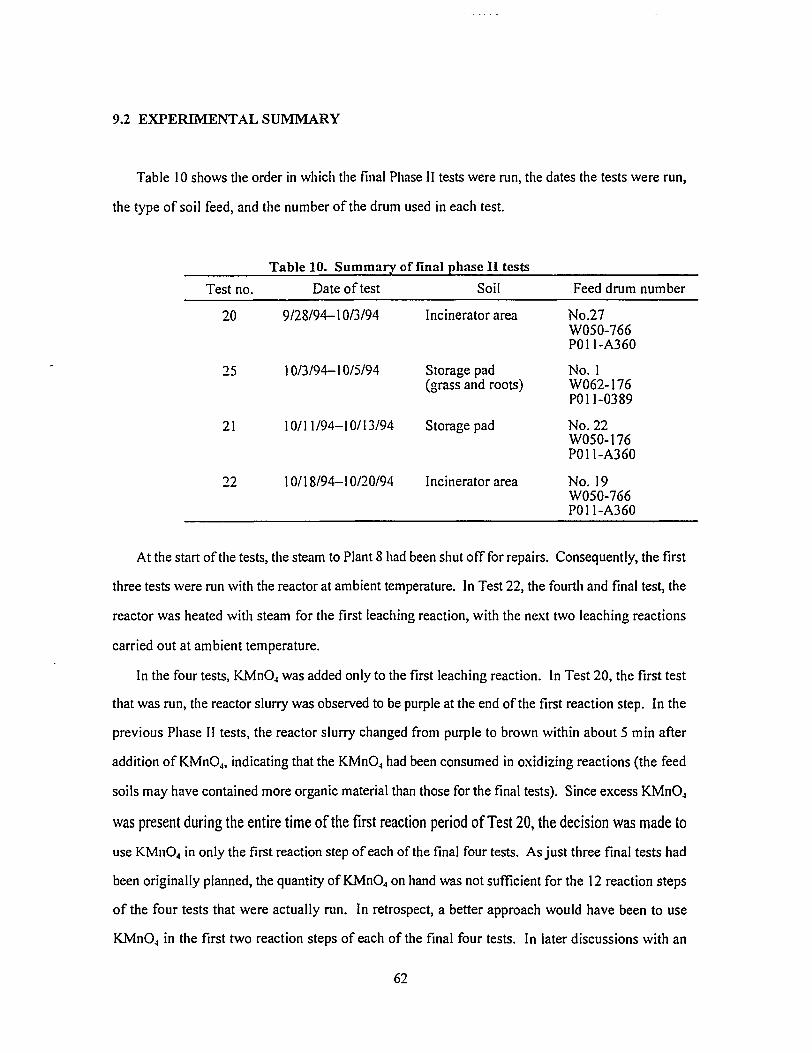
9.2 EXPERIMENTAL SUMMARY
Table 10 shows the order in which the final Phase II tests were run, the dates the tests were run,
the type of soil feed, and the number of the drum used in each test.
Table 10. Summary of final phase II tests Test no. Date of test Soil Feed drum number
20 9/28/94-10/3/94 Incinerator area No.27 W050-766 P011 -A360
25 10/3/94-10/5/94 Storage pad No. 1 (grass and roots) W062-176
P011-0389
21 10/11/94-10/13/94 Storage pad No. 22 W050-I76 P011-A360
22 10/18/94-10/20/94 Incinerator area No. 19 W050-766 P011-A360
At the start of the tests, the steam to Plant 8 had been shut off for repairs. Consequently, the first
three tests were run with the reactor at ambient temperature. In Test 22, the fourth and final test, the
reactor was heated with steam for the first leaching reaction, with the next two leaching reactions
carried out at ambient temperature.
In the four tests, KMn04 was added only to the first leaching reaction. In Test 20, the first test
that was run, the reactor slurry was observed to be purple at the end of the first reaction step. In the
previous Phase II tests, the reactor slurry changed from purple to brown within about 5 min after
addition of KMn04, indicating that the KMn04 had been consumed in oxidizing reactions (the feed
soils may have contained more organic material than those for the final tests). Since excess KMn0 4
was present during the entire time of the first reaction period of Test 20, the decision was made to
use KMn0 4 in only the first reaction step of each of the final four tests. As just three final tests had
been originally planned, the quantity of KMn0 4 on hand was not sufficient for the 12 reaction steps
of the four tests that were actually run. In retrospect, a better approach would have been to use
KMn0 4 in the first two reaction steps of each of the final four tests. In later discussions with an
62
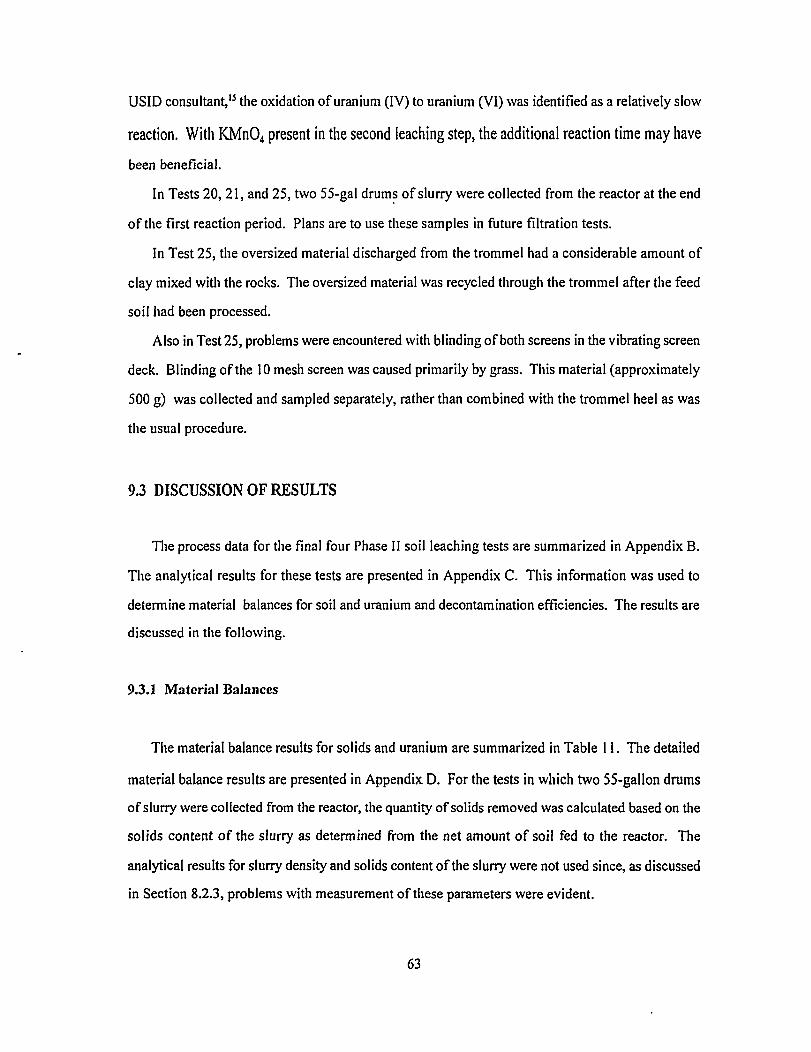
USID consultant,15 the oxidation of uranium (IV) to uranium (VI) was identified as a relatively slow
reaction. With KMn04 present in the second leaching step, the additional reaction time may have
been beneficial.
In Tests 20,21, and 25, two 55-gal drums of slurry were collected from the reactor at the end
of the first reaction period. Plans are to use these samples in future filtration tests.
In Test 25, the oversized material discharged from the trommel had a considerable amount of
clay mixed with the rocks. The oversized material was recycled through the trommel after the feed
soil had been processed.
Also in Test 25, problems were encountered with blinding of both screens in the vibrating screen
deck. Blinding of the 10 mesh screen was caused primarily by grass. This material (approximately
500 g) was collected and sampled separately, rather than combined with the trommel heel as was
the usual procedure.
9.3 DISCUSSION OF RESULTS
The process data for the final four Phase II soil leaching tests are summarized in Appendix B.
The analytical results for these tests are presented in Appendix C. This information was used to
determine material balances for soil and uranium and decontamination efficiencies. The results are
discussed in the following.
9.3.1 Material Balances
The material balance results for solids and uranium are summarized in Table 11. The detailed
material balance results are presented in Appendix D. For the tests in which two 55-gallon drums
of slurry were collected from the reactor, the quantity of solids removed was calculated based on the
solids content of the slurry as determined from the net amount of soil fed to the reactor. The
analytical results for slurry density and solids content of the slurry were not used since, as discussed
in Section 8.2.3, problems with measurement of these parameters were evident.
63
Table 11. Solids and uranium material balances for final Phase II tests Quantity of soil or uranium (lb)
Test 20 Test 21 Test 22 Test 25
Feed soil 340.4 293.2 332 282.5
Product soil 205.2 165.6 255.8 144.2
Soil in other streams 138.1 123.4 62.8 124.5
Percent soil recovery 100.9 98.6 96 95.1
Uranium in feed 0.1900 0.1507 0.1855 0.2495
Uranium in product 0.0179 0.0083 0.0171 0.0164
Uranium in other streams 0.1671 0.1250 0.1445 0.4205
Percent uranium recovery 97.4 88.5 87.1 175
The material balances for soil for these four runs were very good, the average soil recovery
being 97.7%. The fraction of the feed soil recovered in the product soil in Tests 20, 21, and 25 was
relatively low because of the 55-gal drum samples of reactor slurry that were taken. The product
soil accounted for an average of 56% of the soil that was recovered, as compared with 77% for
Test 22.
The uranium recoveries for Tests 20, 21, and 22 were acceptable. In Test 25, however, the
uranium recovery was almost 200%. This is considerably greater than would be expected due to
experimental variances. The high recovery could be caused by errors in the data. If this were the
case, the measured uranium concentrations in the feed soil and in the centrate would be the prime
suspects (since these represent the major inlet and outlet uranium streams). However, the variance
of the uranium concentrations of the three samples of the feed soil that were taken was acceptable
(the coefficient of variation being equal to 9%). Also, the uranium concentrations of the centrates
agreed well with those of the filtrates from the reactor slurry samples (recall that the centrates were
produced from centrifuging the reactor slurries). Thus, the high uranium recovery in Test 25 does
not appear to be attributed to errors in the data.
64
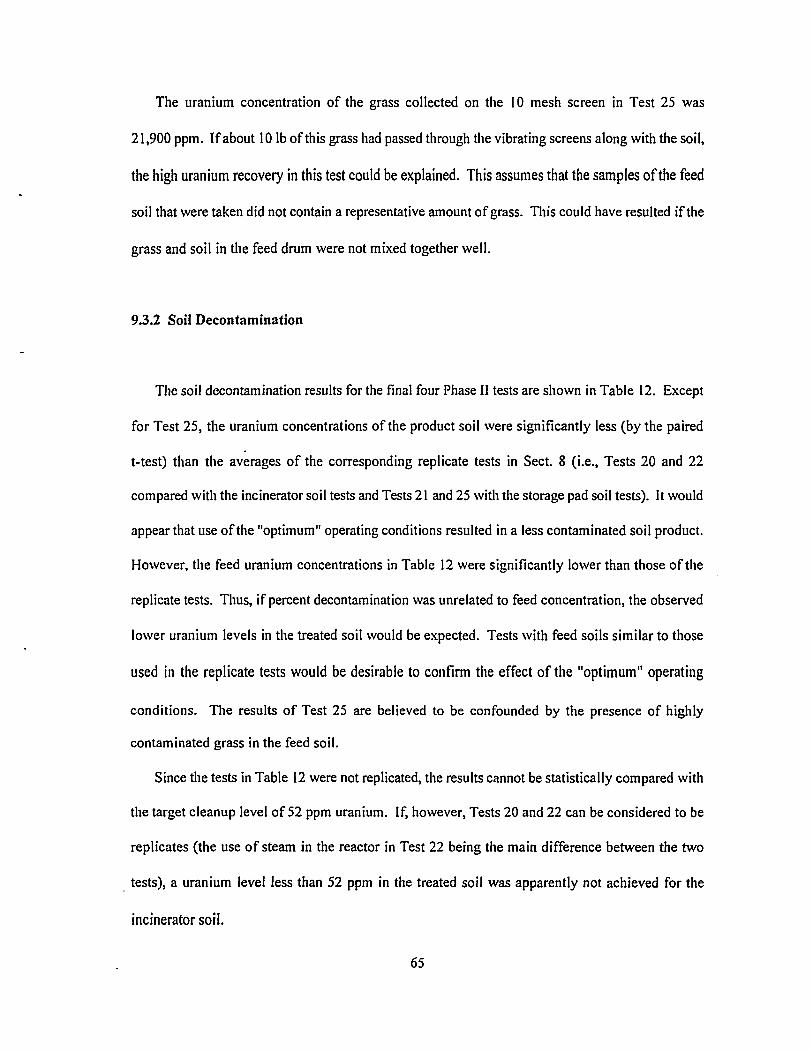
The uranium concentration of the grass collected on the 10 mesh screen in Test 25 was
21,900 ppm. If about 10 lb of this grass had passed through the vibrating screens along with the soil,
the high uranium recovery in this test could be explained. This assumes that the samples of the feed
soil that were taken did not contain a representative amount of grass. This could have resulted if the
grass and soil in the feed drum were not mixed together well.
9.3.2 Soil Decontamination
The soil decontamination results for the final four Phase II tests are shown in Table 12. Except
for Test 25, the uranium concentrations of the product soil were significantly less (by the paired
t-test) than the averages of the corresponding replicate tests in Sect. 8 (i.e., Tests 20 and 22
compared with the incinerator soil tests and Tests 21 and 25 with the storage pad soil tests). It would
appear that use of the "optimum" operating conditions resulted in a less contaminated soil product.
However, the feed uranium concentrations in Table 12 were significantly lower than those of the
replicate tests. Thus, if percent decontamination was unrelated to feed concentration, the observed
lower uranium levels in the treated soil would be expected. Tests with feed soils similar to those
used in the replicate tests would be desirable to confirm the effect of the "optimum" operating
conditions. The results of Test 25 are believed to be confounded by the presence of highly
contaminated grass in the feed soil.
Since the tests in Table 12 were not replicated, the results cannot be statistically compared with
the target cleanup level of 52 ppm uranium. If, however, Tests 20 and 22 can be considered to be
replicates (the use of steam in the reactor in Test 22 being the main difference between the two
tests), a uranium level less than 52 ppm in the treated soil was apparently not achieved for the
incinerator soil.
65
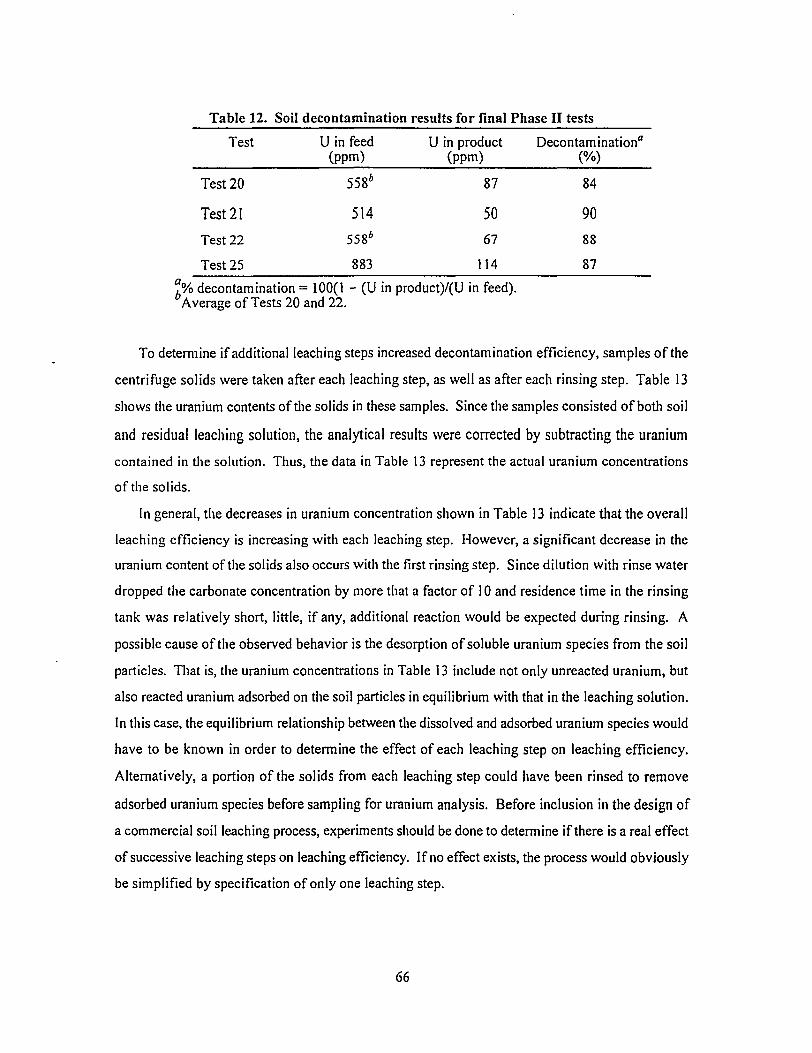
Table 12. Soil decontamination results for final Phase II tests Test U in feed U in product Decontamination0
(ppm) (ppm) (%)
Test 20 558* 87 84
Test 21 514 50 90
Test 22 558* 67 88
Test 25 883 1J4 87 ?% decontamination = 100(1 - (U in product)/(U in feed). Average of Tests 20 and 22.
To determine if additional leaching steps increased decontamination efficiency, samples of the
centrifuge solids were taken after each leaching step, as well as after each rinsing step. Table 13
shows the uranium contents of the solids in these samples. Since the samples consisted of both soil
and residual leaching solution, the analytical results were corrected by subtracting the uranium
contained in the solution. Thus, the data in Table 13 represent the actual uranium concentrations
of the solids.
In general, the decreases in uranium concentration shown in Table 13 indicate that the overall
leaching efficiency is increasing with each leaching step. However, a significant decrease in the
uranium content of the solids also occurs with the first rinsing step. Since dilution with rinse water
dropped the carbonate concentration by more that a factor of 10 and residence time in the rinsing
tank was relatively short, little, if any, additional reaction would be expected during rinsing. A
possible cause of the observed behavior is the desorption of soluble uranium species from the soil
particles. That is, the uranium concentrations in Table 13 include not only unreacted uranium, but
also reacted uranium adsorbed on the soil particles in equilibrium with that in the leaching solution.
In this case, the equilibrium relationship between the dissolved and adsorbed uranium species would
have to be known in order to determine the effect of each leaching step on leaching efficiency.
Alternatively, a portion of the solids from each leaching step could have been rinsed to remove
adsorbed uranium species before sampling for uranium analysis. Before inclusion in the design of
a commercial soil leaching process, experiments should be done to determine if there is a real effect
of successive leaching steps on leaching efficiency. If no effect exists, the process would obviously
be simplified by specification of only one leaching step.
66
Table 13. Uranium concentration in soil from leaching and rinsing steps
Uranium concentration in solids (ppm dry)
Process step Test 20 Test 21 Test 22 Test 25
1st leaching no sample 98 122 331 2nd leaching 137 69 111 143 3rd leaching 119 74 75 148 1st rinse 89 55 69 114 2nd rinse 87 50 67 114
9.3.3 Decontamination of Trommel Oversize
In die Phase II tests discussed in Sect. 8, me trommel oversized material, which consisted of clay
and small rocks, typically contained significant amounts of uranium. The uranium likely was
associated with the clay. To determine if this oversized material could be decontaminated, plans
were to study the recycle of the material through the trommel during the final four Phase II tests.
Of these tests, only Test 25 produced trommel oversize material with an appreciable clay fraction.
After the feed soil had been processed through the trommel in this test, the oversize material was
recycled. The resultant uranium content was 77 ppm, indicating removal of the clay did accomplish
decontamination. Unfortunately, this cannot be confirmed because the oversize material was not
sampled before being recycled. If desired, a short test could be run on the trommel using as feed the
oversize material that was archived from previous runs.
67
10. CONCLUSIONS
The conclusions from the USID Phase II Fernald test unit studies are as follow:
No significant effects of attrition scrubbing were observed.
Increased reaction temperature significantly increased uranium decontamination for the incinerator area soil. No effect was observed for the storage pad soil.
The rates of uranium leaching with carbonate and with citric acid are reasonably fast; within 30-60 min, the uranium removal is 90% or more of that reached at the end of the 120-min reaction period.
Citric acid was apparently not as effective as sodium carbonate/sodium bicarbonate for leaching the incinerator area soil. However, the comparison was confounded by a significantly higher uranium concentration in the feed soil that was used in the citric acid test. Thus, no conclusion is made concerning the effect of leaching agent in the incinerator soil tests. For the storage pad soil, there was no significant difference between the two leaching agents.
The preliminary decontamination target level of 52 ppm uranium was not achieved with either the incinerator area or the storage pad soil.
In the replicated tests in the experimental design, the average uranium levels in the treated soil that were achieved with carbonate as leachant were 132 and 123 ppm for the storage pad soil and the incinerator area soil, respectively.
In the final tests run under "optimum" operating conditions, uranium levels less than 100 ppm were attained. However, because of the lower uranium concentrations in the feed soils, no conclusion can be drawn about an effect of operating conditions.
The average percent uranium decontamination was 92% for the storage pad soil and 83% for the incinerator area soil.
68
11. RECOMMENDATIONS
Based on the results from the USID Phase II Fernald test unit studies, recommendations for the
development, design, and operation of a soil leaching process for uranium decontamination are as
follow:
• Perform bench-scale studies to establish whether or not successive leaching steps improve overall leaching efficiency.
• Exclude attrition scrubbing from the soil leaching process, as this unit operation has no beneficial effect on leaching efficiency.
• Specify a residence time of at least 1 hr in the design of a soil leaching process.
• Operate the leaching reactor(s) at 40°C.
Although the preliminary decontamination target level of 52 ppm uranium was not achieved in
the pilot plant tests, a significant portion of uranium was removed from the soils. The uranium
remaining in the soil likely exists in a more refractory form. Because of the lower uranium
concentrations and the apparent decreased mobility of the uranium, the soil leaching process may
well produce a treated soil capable of meeting levels developed from risk-based analyses.
69
12. REFERENCES
1. Uranium Solids Integrated Demonstration: Phase II Test Plan, Fernald CRU5/USID Soil Decontamination Pilot Plant (Carbonate/Citrate Leaching), ORNL/TM-12673 October 1, 1993, ORNL/TM-12673, prepared for the U.S. Department of Energy, Office of Technology Development, Fernald Site Office, by the Oak Ridge National Laboratory, Oak Ridge, Tennessee (in preparation).
2. Treatability Study Work Plan for Operable Unit 5 Soil Washing, Fernald Environmental Management Project, Fernald, Ohio, Remedial Investigation and Feasibility Study, March 1992, U.S. Department of Energy, Fernald Office.
3. C. W. Francis, A. J. Mattus, L. L. Farr, M. P. Elless, and S. Y. Lee, Selective Leaching of Uranium Contaminated Soils: Progress Report 1, ORNL/TM-12177, February 1993.
4. C. W. Francis, A. J. Mattus, M. P. Elless, and M. E. Timpson, "Carbonate- and Citrate-Based Selective Leaching of Uranium from Uranium-Contaminated Soils," Part 1 of Removal of Uranium from Uranium-Contaminated Soils, Phase 1: Bench-Scale Testing, ORNL-6762, 1993.
5. S. Y. Lee, and J. D. Marsh, Jr., Characterization of Uranium Contaminated Soil from DOE Fernald Environmental Management Project Site: Results of Phase 1 Characterization, ORNL/TM-11980, 1992.
6. R. C. Merritt, The Extractive Metallurgy of Uranium, Colorado School of Mines Research Institute of Mines, Library of Congress Catalog Card No. 71-157076, 1971.
7. J. H. Wilson, personal communication with M. J. Geyer, FERMCO, MS-81-3,25 Merchant St., Executive Center 3, Springdale, Ohio 45246.
8. R. E. Walpole and R. H. Myers, Probability and Statistics for Engineers and Scientists, 2 ed., Macmiltan Publishing Co., Inc., New York, 1978, p. 100.
9. J. H. Wilson, personal communication with Jeff Bock, Quality Division, Martin Marietta Energy Systems, P.O. Box 2003, Oak Ridge, Tennessee 37831-7383, April 1994.
10. J. H. Wilson, personal communication with M. R. Ally, Chemical Technology Division, Martin Marietta Energy Systems, P.O. Box 2008, Oak Ridge, Tennessee 37831-6044, April 1994.
11. J. H. Wilson, personal communication with C. W. Francis, Environmental Sciences Division, Martin Marietta Energy Systems, P.O. Box 2008, Oak Ridge, Tennessee 37831-6317, July 1994.
12. C. Lipson and N. J. Sheth, Statistical Design and Analysis of Engineering Experiments, McGraw-Hill Book Company, New York, 1993, p. 91.
13. J. H. Wilson, personal communication with C. W. Francis, Environmental Sciences Division, Martin Marietta Energy Systems, P.O. Box 2008, Oak Ridge, Tennessee, 37831-6317, September 1994.
14. J. H. Wilson, personal communication with Wayne Henderson, Brown & Root U.S.A., Inc., P.O. Box 3, Houston, Texas, 77001-0003, Dec. 1, 1994.
70

APPENDIX A
PROCESS FLOW SHEETS

APPENDIX A
PROCESS FLOW SHEETS
The process flow sheets for all of the Phase II tests are included in Appendix A. These flow
sheets, which are presented in the order that the tests were run, illustrate the process configuration
of each test. Also shown on the flow sheets are the sample points for each test. The process sample
points are described in Table A-l. Samples were taken at these specified locations during each test.
Sample points 12 through 18 were for rinsate samples taken when cleaning equipment after each
test. Sample points 19 through 28 were for any samples that, although not specified in the sampling
plan, could be included in any test. Sample point 29 was for a duplicate sample to be analyzed
onsite, and sample points 101 through 118 were for duplicates for off-site analyses.
73

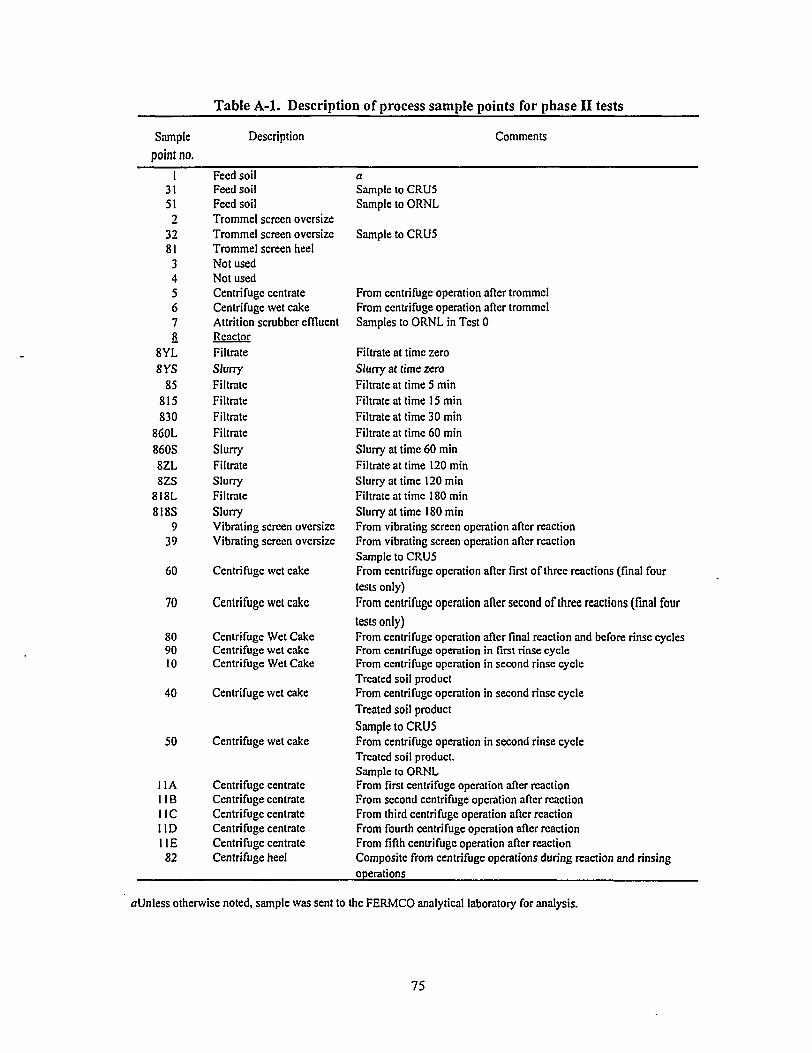
Table A-1. Description of process sample points for phase II tests
Sample point no.
Description Comments
1 31 51 2
32 81 3 4 5 6 7 8
8YL 8YS
85 815 830
860L 860S 8ZL 8ZS
8I8L 818S
9 39
60
70
80 90 10
40
50
Feed soil Feed soil Feed soil Trommel screen oversize Trommel screen oversize Trommel screen heel Not used Not used Centrifuge ccntrate Centrifuge wet cake Attrition scrubber effluent Reactor Filtrate Slurry Filtrate Filtrate Filtrate Filtrate Slurry Filtrate Slurry Filtrate Slurry Vibrating screen oversize Vibrating screen oversize
Centrifuge wet cake
Centrifuge wet cake
Centrifuge Wet Cake Centrifuge wet cake Centrifuge Wet Cake
Centrifuge wet cake
Centrifuge wet cake
I1A Centrifuge ccntratc I IB Centrifuge centrate 11C Centrifuge centrate UD Centrifuge centrate HE Centrifuge centrate 82 Centrifuge heel
Sample to CRU5 Sample to ORNL
Sample to CRU5
From centrifuge operation after trommel From centrifuge operation after trommel Samples to ORNL in Test 0
Filtrate at time zero Slurry at time zero Filtrate at time 5 min Filtrate at time 15 min Filtrate at time 30 min Filtrate at time 60 min Slurry at time 60 min Filtrate at time 120 min Slurry at time 120 min Filtrate at time 180 min Slurry at time 180 min From vibrating screen operation after reaction From vibrating screen operation after reaction Sample to CRU5 From centrifuge operation after first of three reactions (final four tests only) From centrifuge operation after second of three reactions (final four tests only) From centrifuge operation after final reaction and before rinse cycles From centrifuge operation in first rinse cycle From centrifuge operation in second rinse cycle Treated soil product From centrifuge operation in second rinse cycle Treated soil product Sample to CRU5 From centrifuge operation in second rinse cycle Treated soil product. Sample to ORNL From first centrifuge operation after reaction From second centrifuge operation after reaction From third centrifuge operation after reaction From fourth centrifuge operation after reaction From fifth centrifuge operation after reaction Composite from centrifuge operations during reaction and rinsing operations ^ ^ _
oUnless otherwise noted, sample was sent to the FERMCO analytical laboratory for analysis.
75
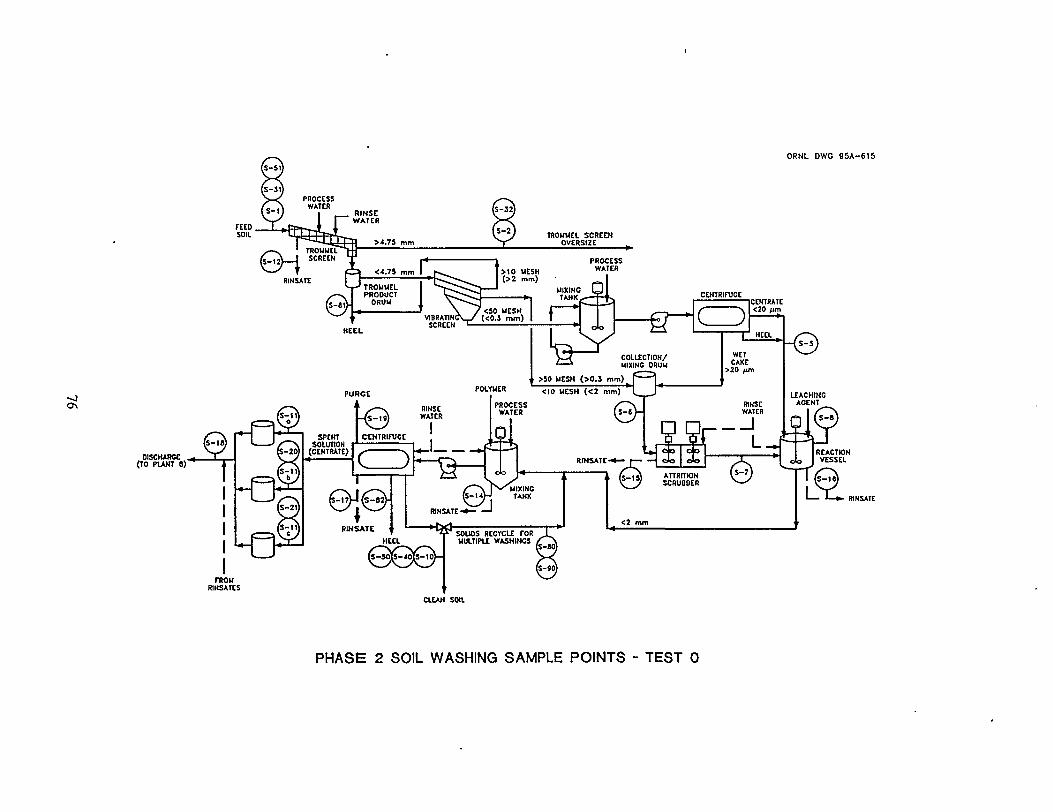
ORNL DWC 9 5 A - 6 1 5
0\
FROM RWSATCS
CtfAW SOIL
PHASE 2 SOIL WASHING SAMPLE POINTS - TEST 0
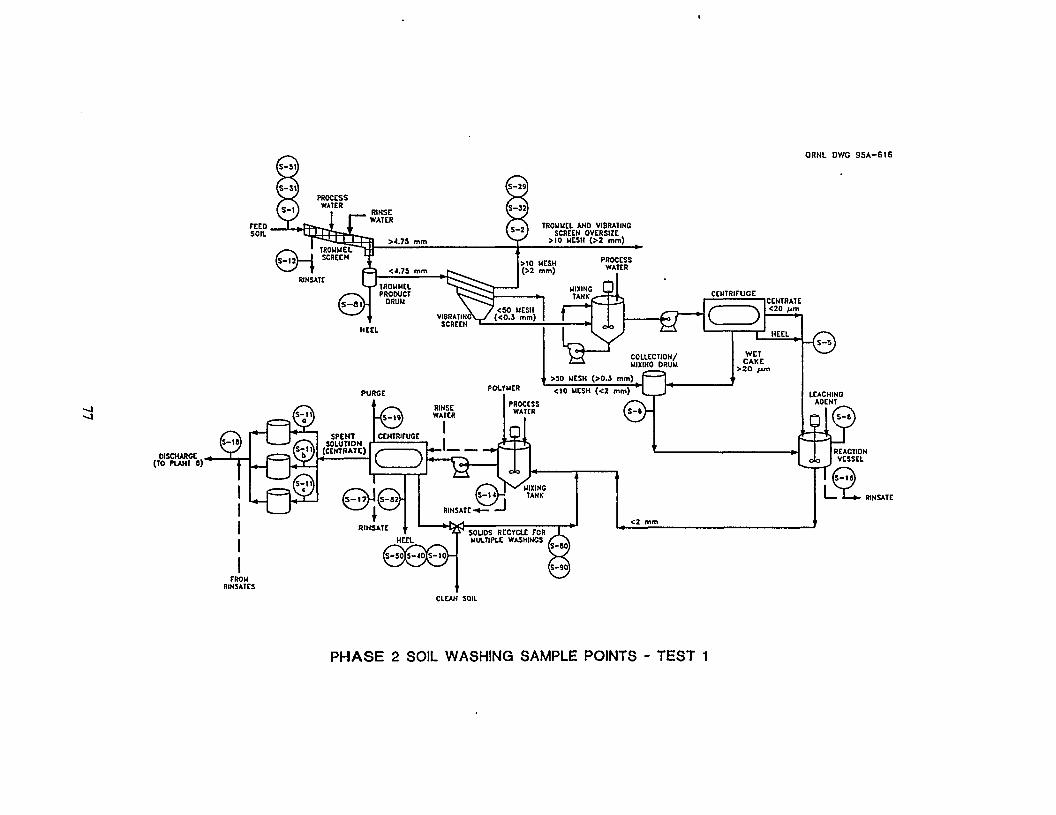
ORNL DWG 9 S A - 6 1 6
- J • - J
fROU HINSATCS
PHASE 2 SOIL WASHING SAMPLE POINTS - TEST 1
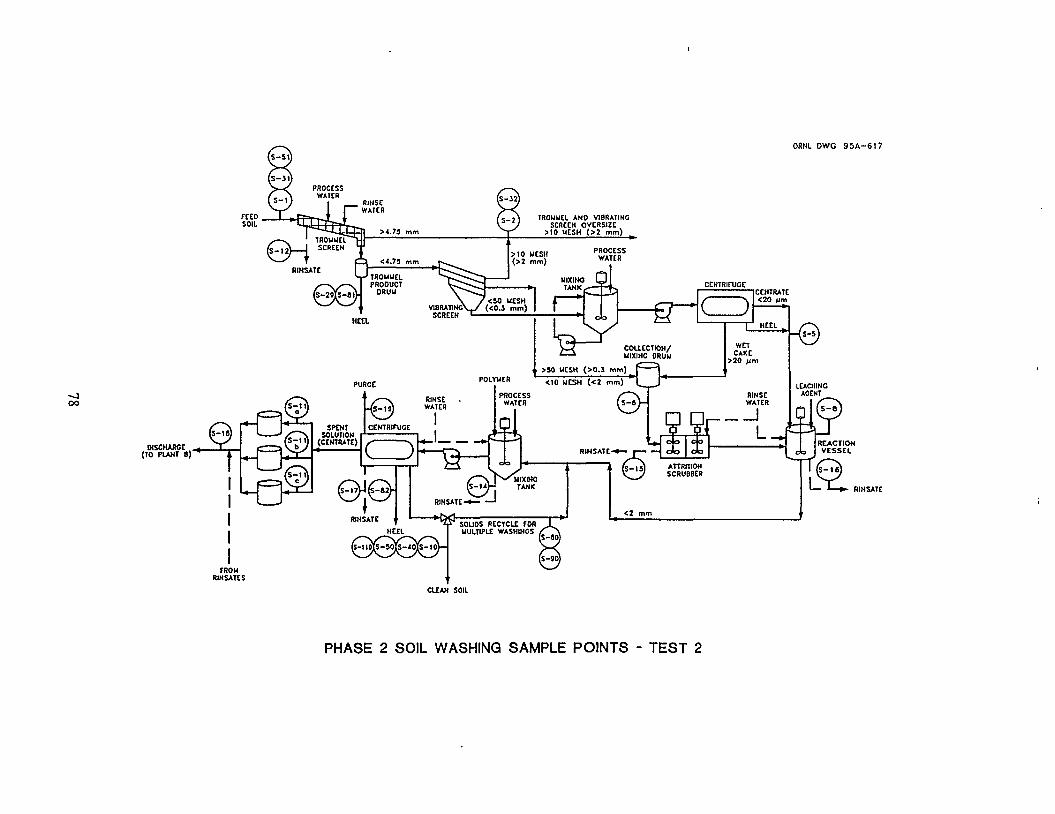
ORNL DWG 9 5 A - 6 1 7
- J OO
RINSATC
TROM RINSATES
CLEAN SOIL
PHASE 2 SOIL WASHING SAMPLE POINTS - TEST 2
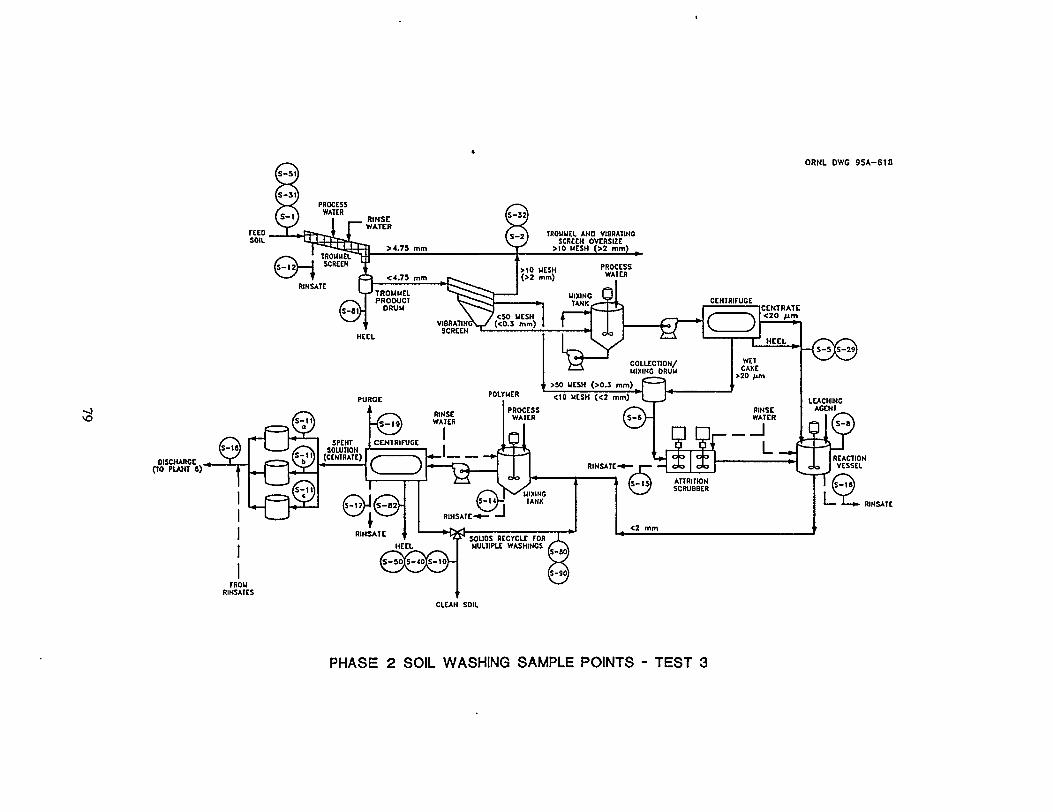
ORNL DWG 95A-618
CENTRATE <20 /xm
~@©
roou RINSATCS
PHASE 2 SOIL WASHING SAMPLE POINTS - TEST 3
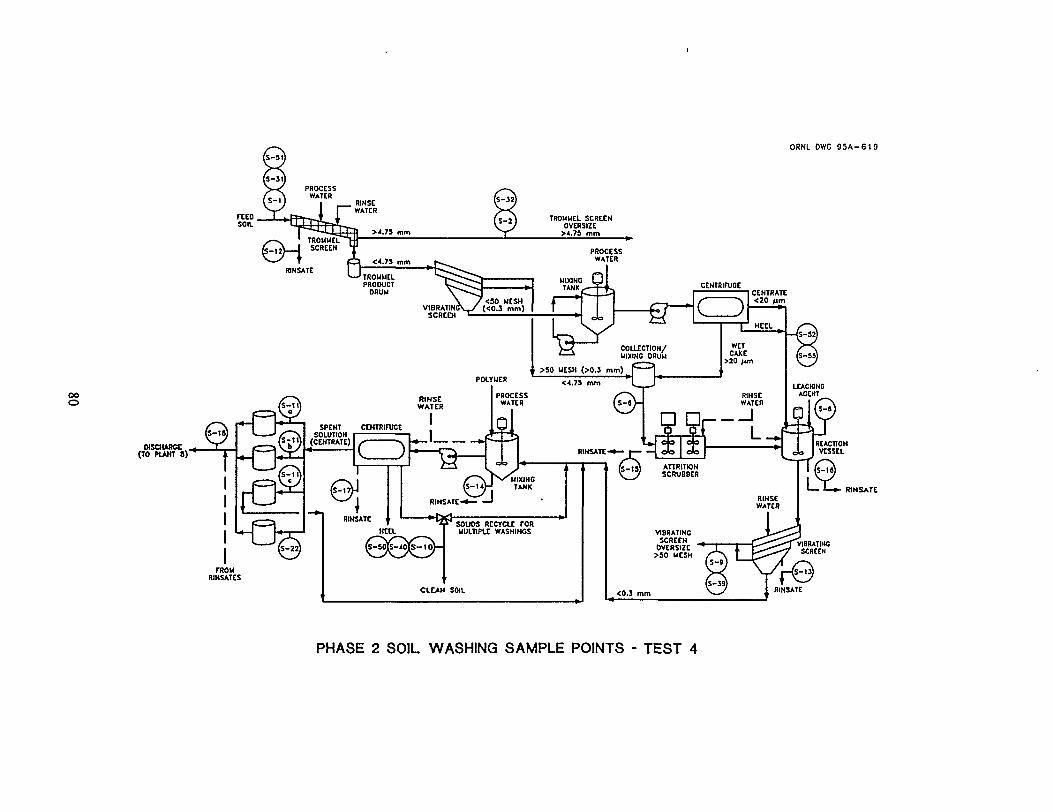
ORNL OWG 9 5 A - 6 1 9
OO O
DISCHARGE ^ (TO WJUn 8 )
FROM RINSATES
VIBRATING SCREEN
PHASE 2 SOIL WASHING SAMPLE POINTS - TEST 4
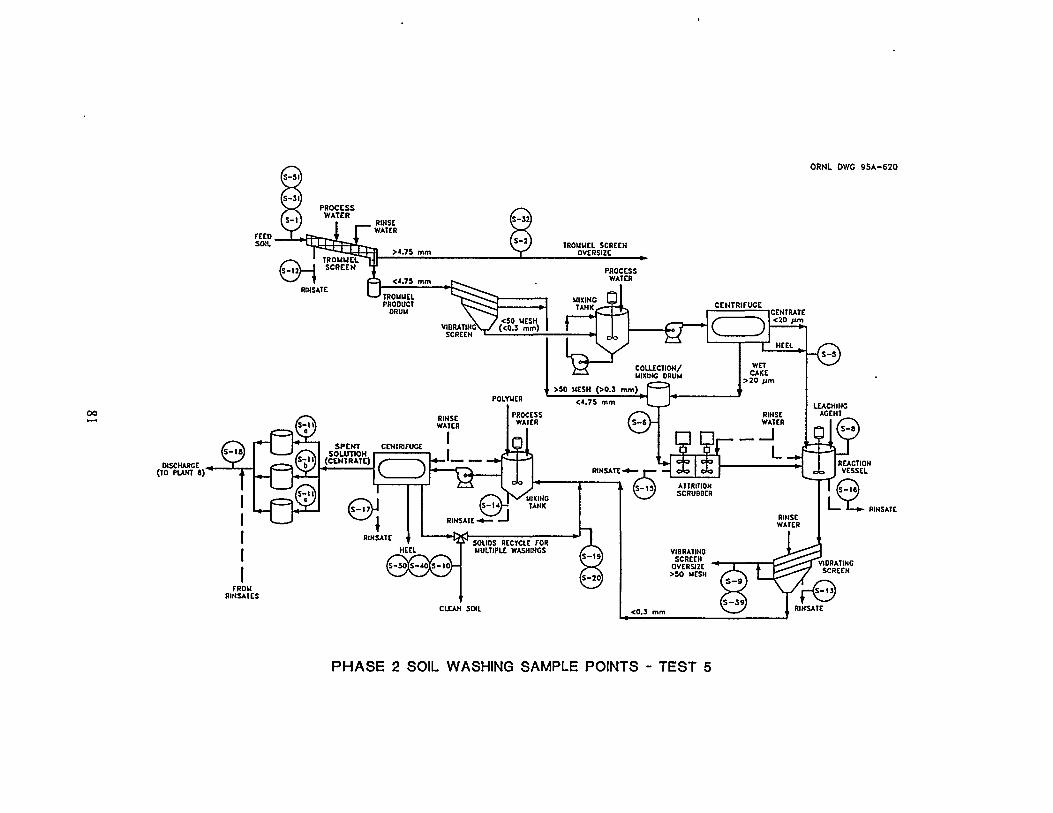
ORNL DWG 95A-S20
PHASE 2 SOIL WASHING SAMPLE POINTS - TEST 5
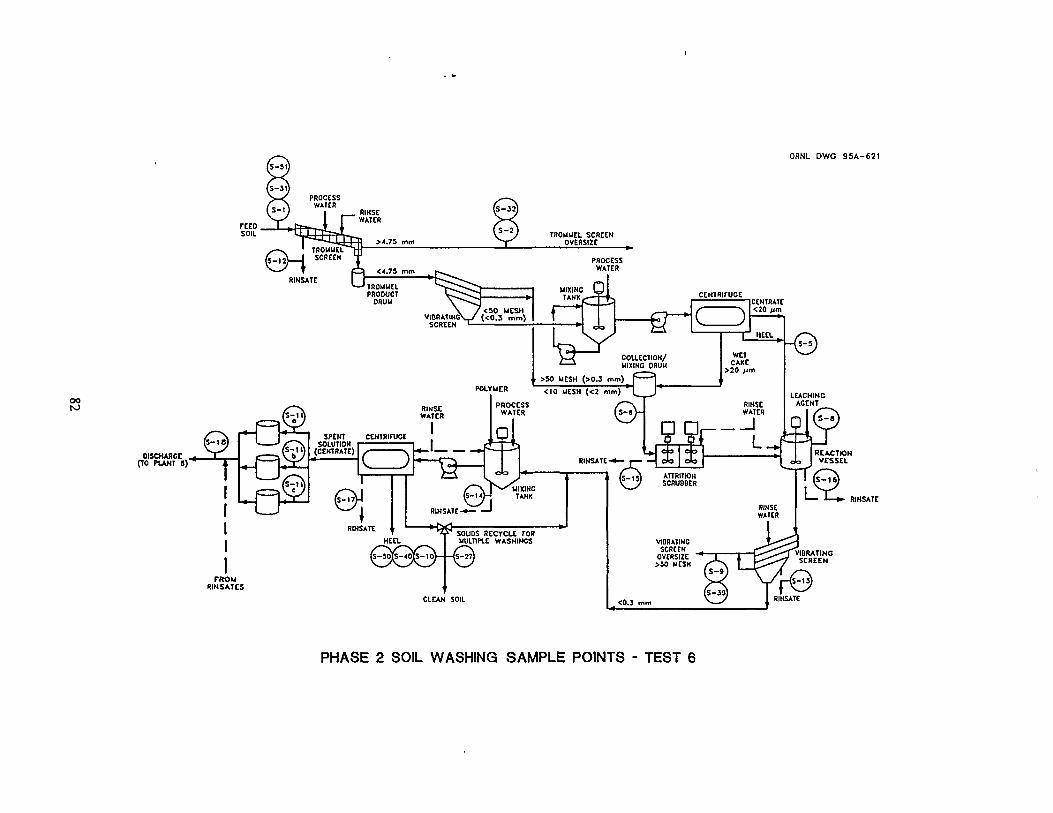
ORNL DWG 95A-621
TROU RINSATES
PHASE 2 SOIL WASHING SAMPLE POINTS - TEST 6

ORNL DWG 9 5 A - 6 2 2
I — >—*• WNSATE
NtOU RINSATCS
CLEAN S W l
PHASE 2 SOIL WASHING SAMPLE POINTS - TEST 7
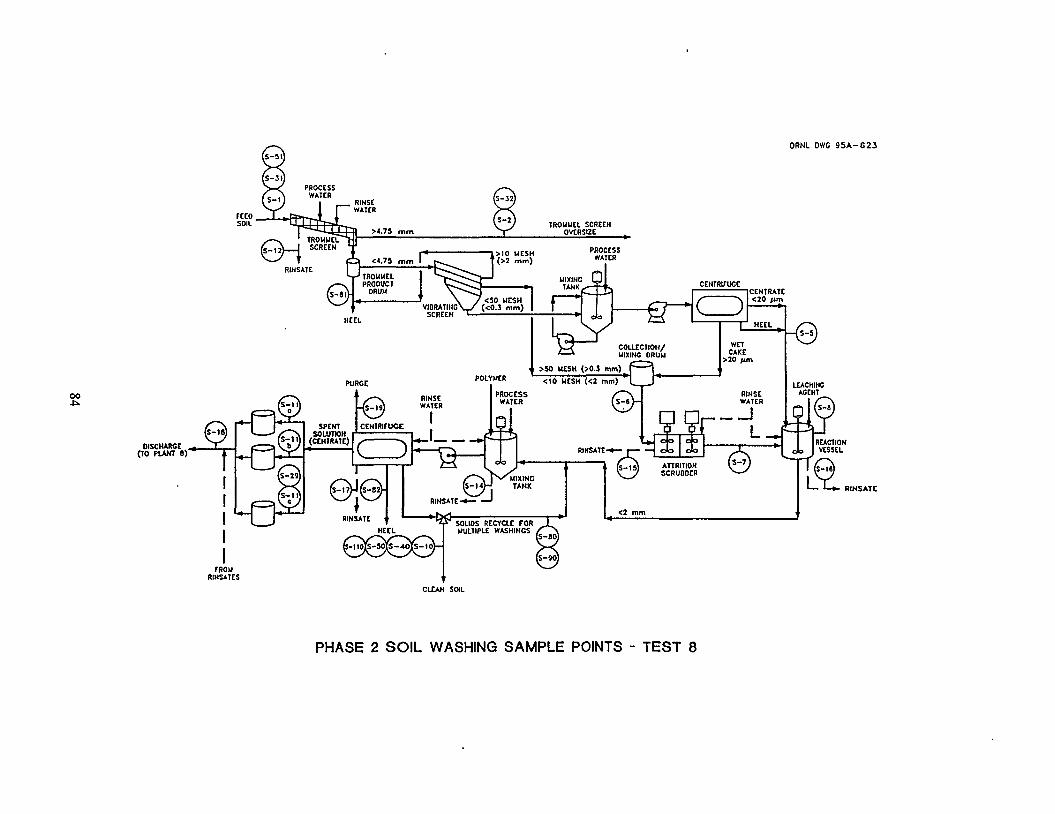
ORNL DWG 95A-623
00 4*.
FCCO SOIL
(TO PUNT 8 ) ^ r
FROU RINSATCS
PHASE 2 SOIL WASHING SAMPLE POINTS - TEST 8
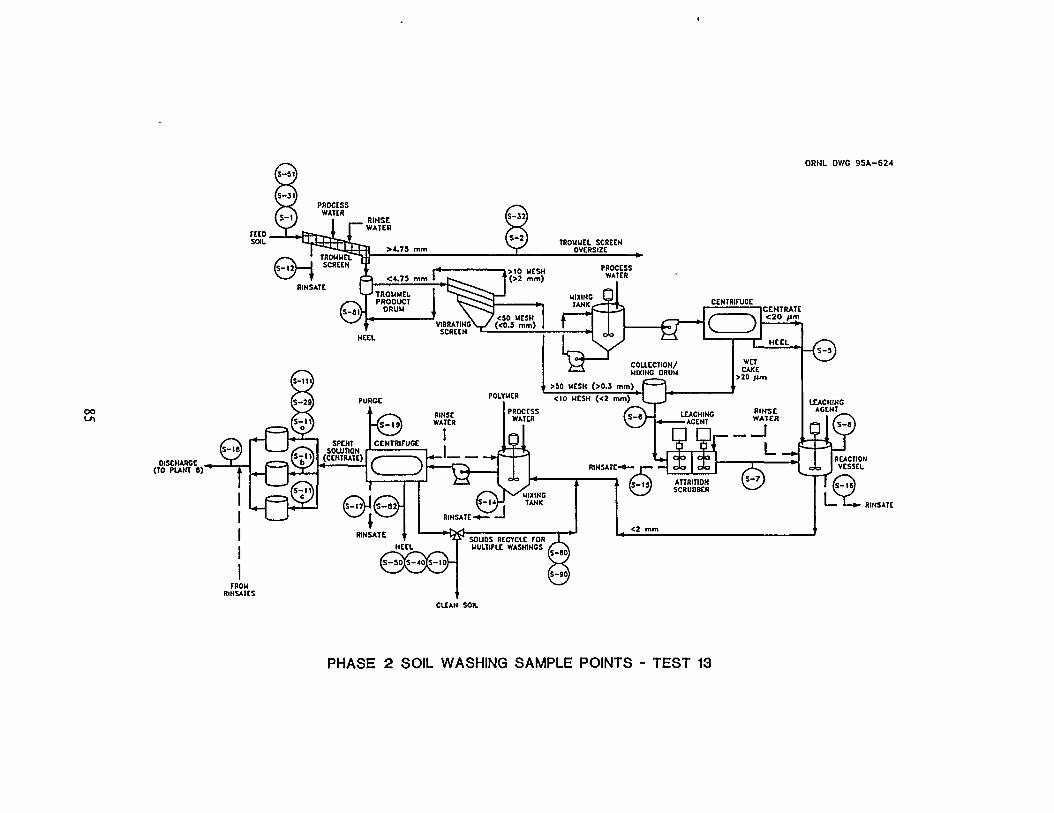
ORNL DWG 95A-624
CENTRATE <20 /im
RINSAICS
PHASE 2 SOIL WASHING SAMPLE POINTS - TEST 13
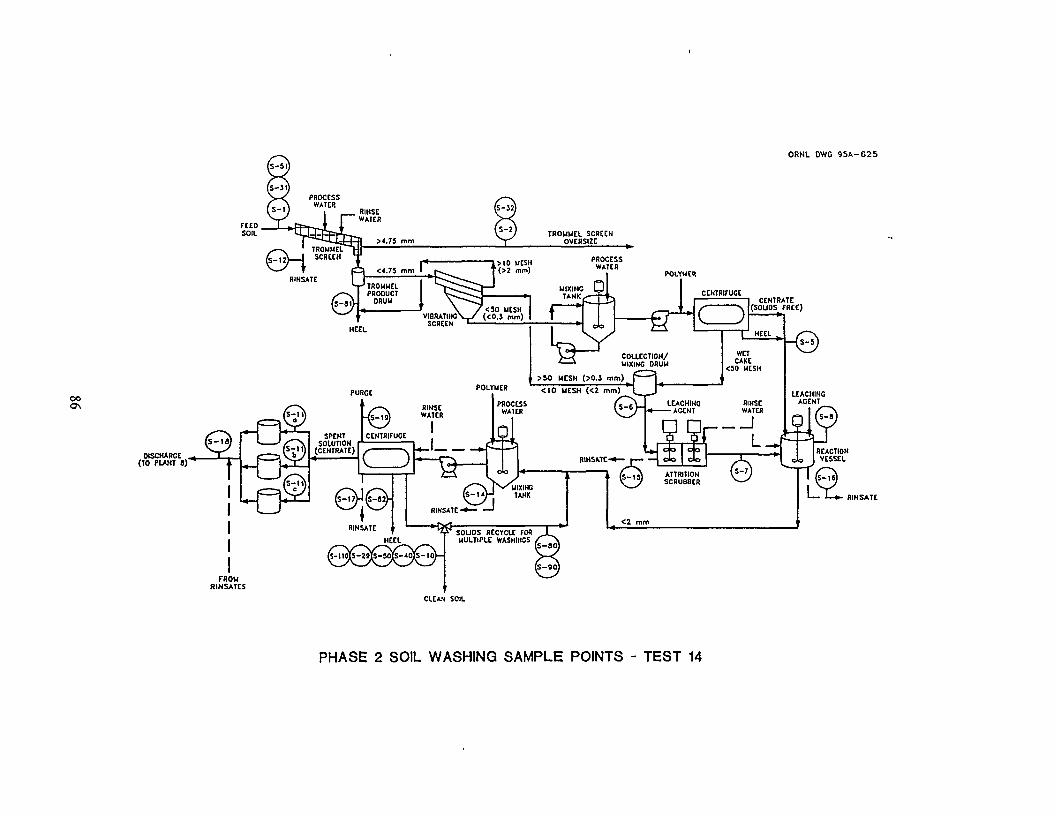
FEED SOIL
RINSE WATER
ORNL DWC 9 5 A - 6 2 5
>4.75 mm TROMMEL SCREEN
OVERSIZE
PROCESS WATER
„ , <S0 MESH VIBRATINCV, / ( < 0 . J mm)
SCREEN ^
MIXING •
f — rig CENTRATE (SOUDS FREE)
(S-t7^[S-82;
RINSATE
HEEL
03030-
l — l _ * - RINSATE
FROM RINSATES
PHASE 2 SOIL WASHING SAMPLE POINTS - TEST 14
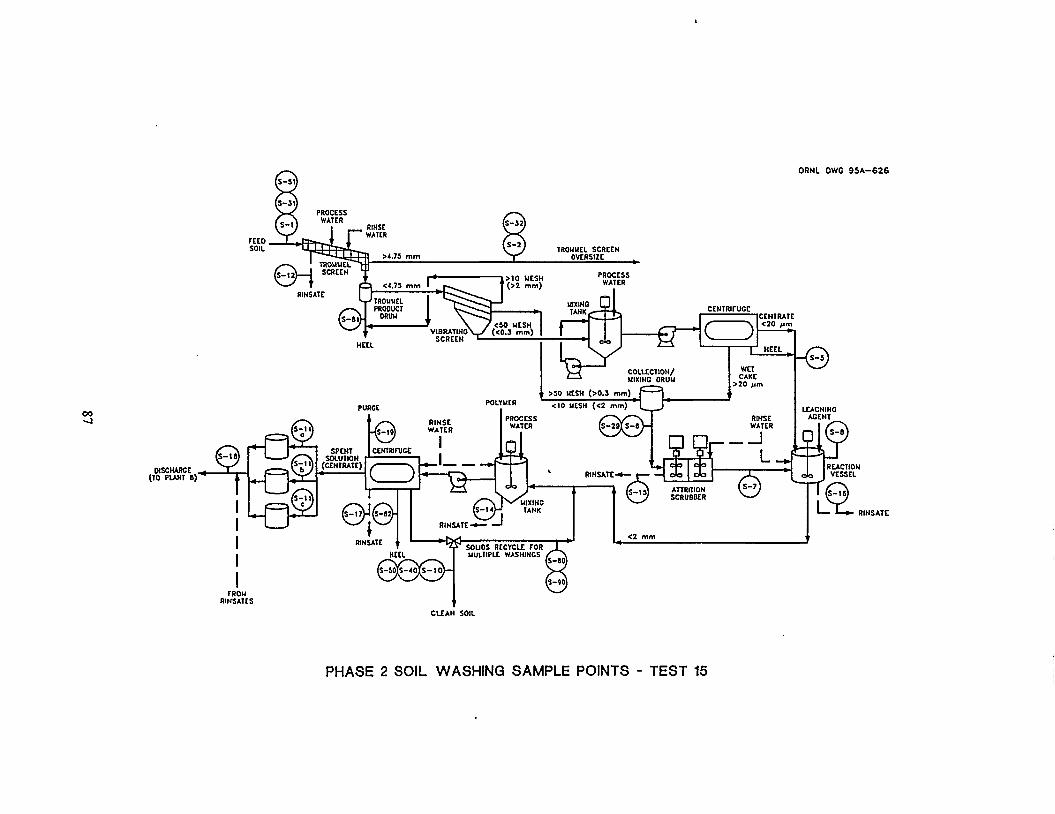
00 - J
ORNL OWC 9 5 A - 6 2 6
TROUUEL SCREEN OVERSIZE
HEEL
. . <50 MESH V IBRATIMO\_y (<0 .3 m m )
SCREEN ^
UIXING TANK r̂
PROCESS WATER
WV • f in CD > _ < COLLECTION/ ' — * MIXING DRUM
• > S 0 MESH ( > 0 . J mm]
DISCHARGE (TO PUNT "
iM3 < I 0 MESH ( < 2 mm]
CENTRATE < 2 0 ftm
HEEL
WET CAKE
>20 /im
RINSE WATER
L£8r ^ RtNSATt-*— p— H cJo | do | Jk.
1 (£_Js\ ATTRITION (S-O ^ 7 SCRUBBER ^ - " /
HEEL
©SO-TROM
RINSATES
PHASE 2 SOIL WASHING SAMPLE POINTS - TEST 15
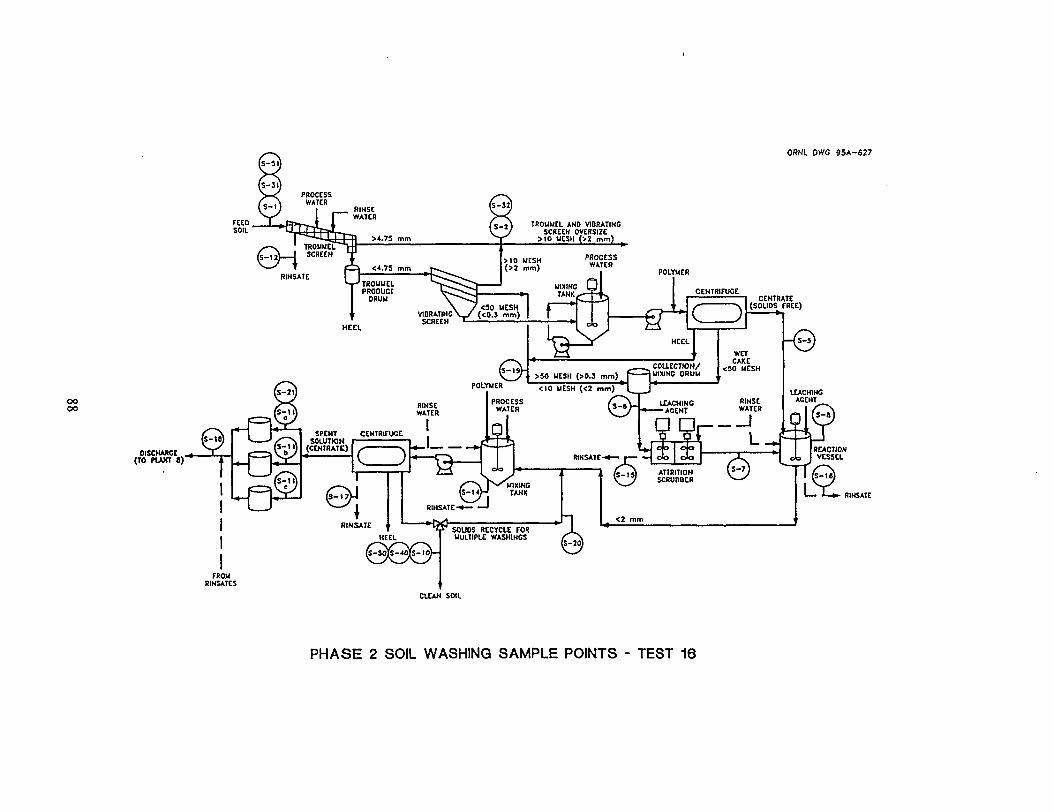
ORNL DWG 9 5 A - 6 2 7
TROUUtl AND VIBRATING SCREEN OVERSIZE
> IO UESH (>2 m m )
CENTRATE (SOLIDS FREE)
FROM RINSATES
PHASE 2 SOIL WASHING SAMPLE POINTS - TEST 16
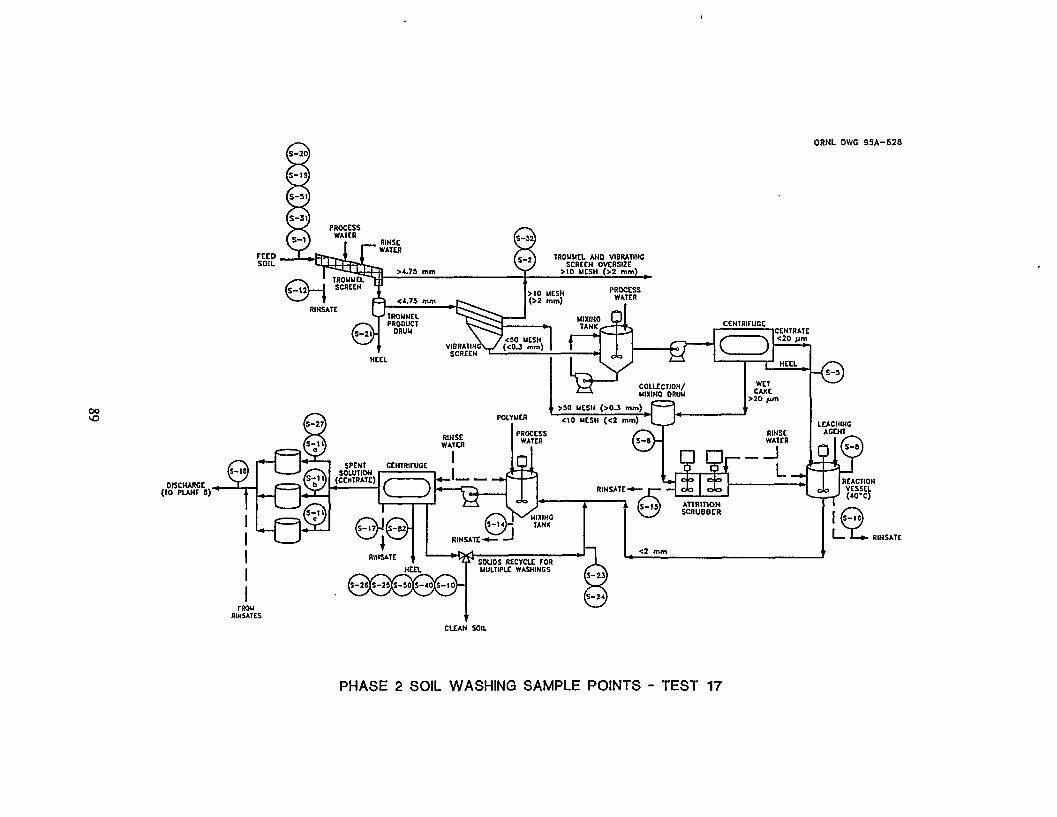
ORNL DWG 9 5 A - 6 2 8
TROUUEt AND VIBRATINC SCREEN OVERSIZE
> I 0 UCSH ( > 2 mm)
CENTRA1E <20 fim
RINSATE
TROU RINSAICS
CLEAN SOIL
PHASE 2 SOIL WASHING SAMPLE POINTS - TEST 17
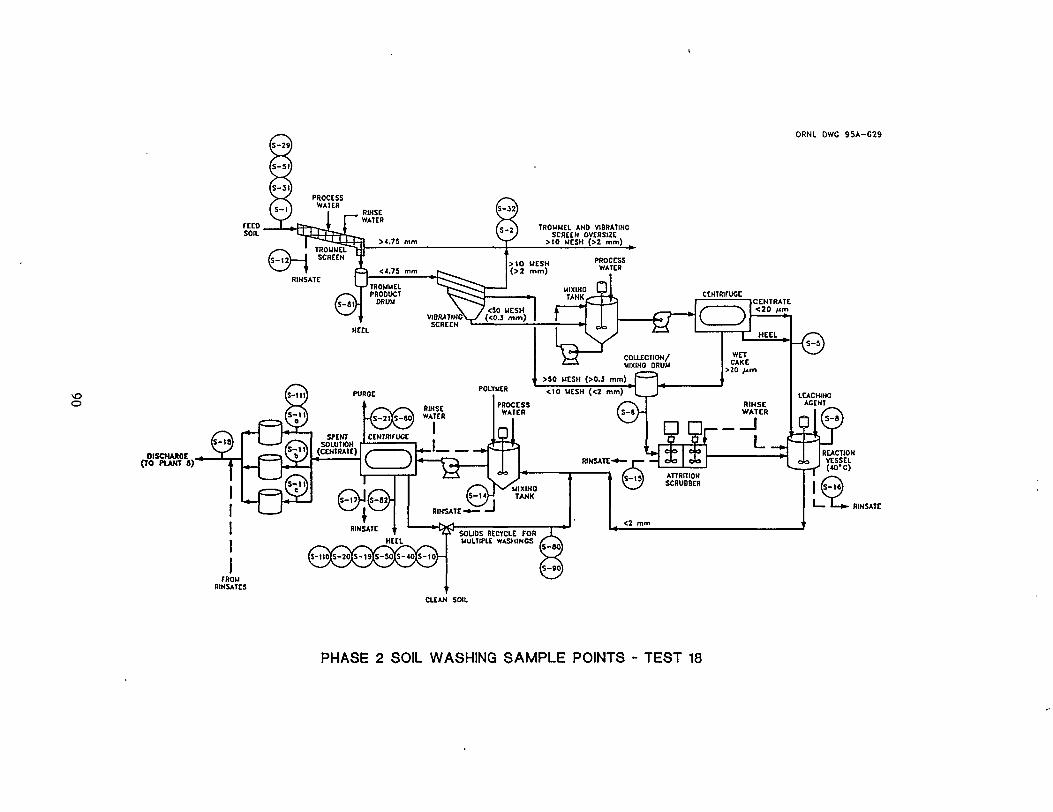
o
ORNL DWG 9 5 A - 6 2 9
TROMMEL ANB V1BRATINC SCREEN OVERSIZC
> I 0 MESH (>Z mm)
PROCESS WATER
„ , <50 MESH VIBRATING\_ / (<0.J m m )
SCREEN T
MIXING U I TANK,
RINSATE
PHASE 2 SOIL WASHING SAMPLE POINTS - TEST 18
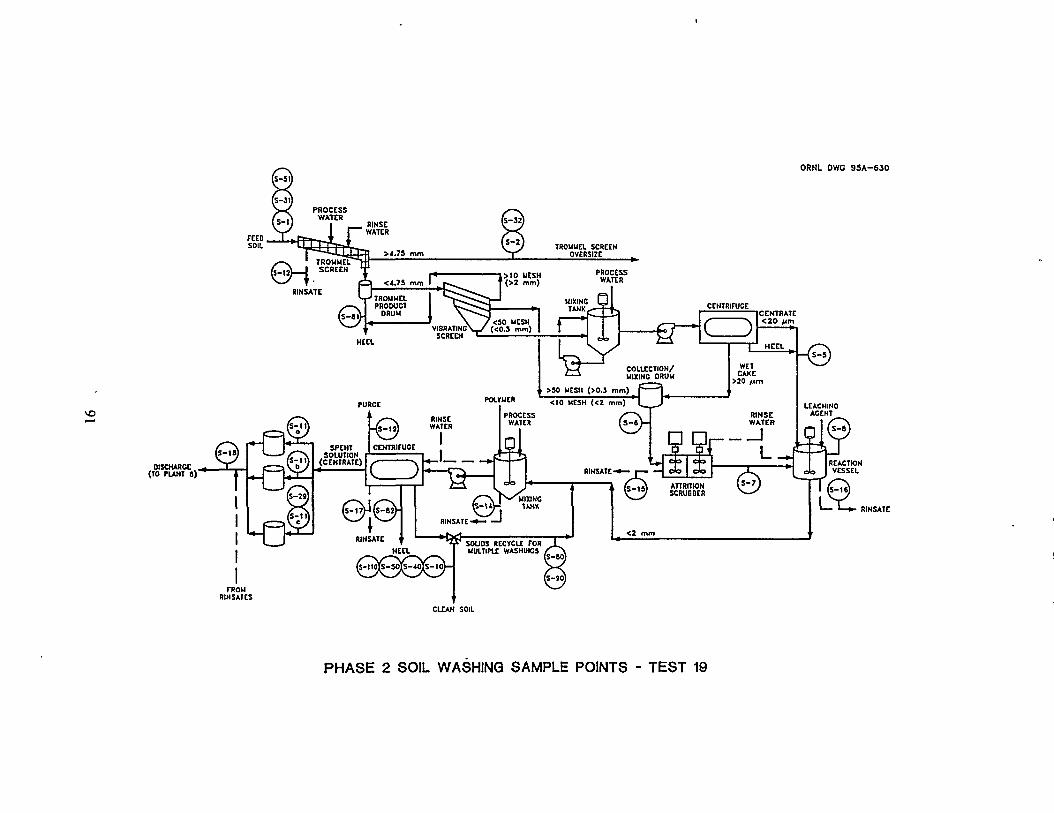
vo
RINSE WATER
ORNL DWG 9 5 A - 6 3 0
TROUMEl SCREEN OVERSIZE
PROCESS WATER
„ . < 5 0 MESH VI8RATING\_ / ( < 0 . J m m )
SCREEN ^
MIXING Q TANK, CENTRIFUGE
f iHCD CENTBATE <20 /jm
' • • — v R |NSE ^_,j) WATER
CEHTRIFUOE
©JO" RINSATE ' '
PHASE 2 SOIL WASHING SAMPLE POINTS - TEST 19
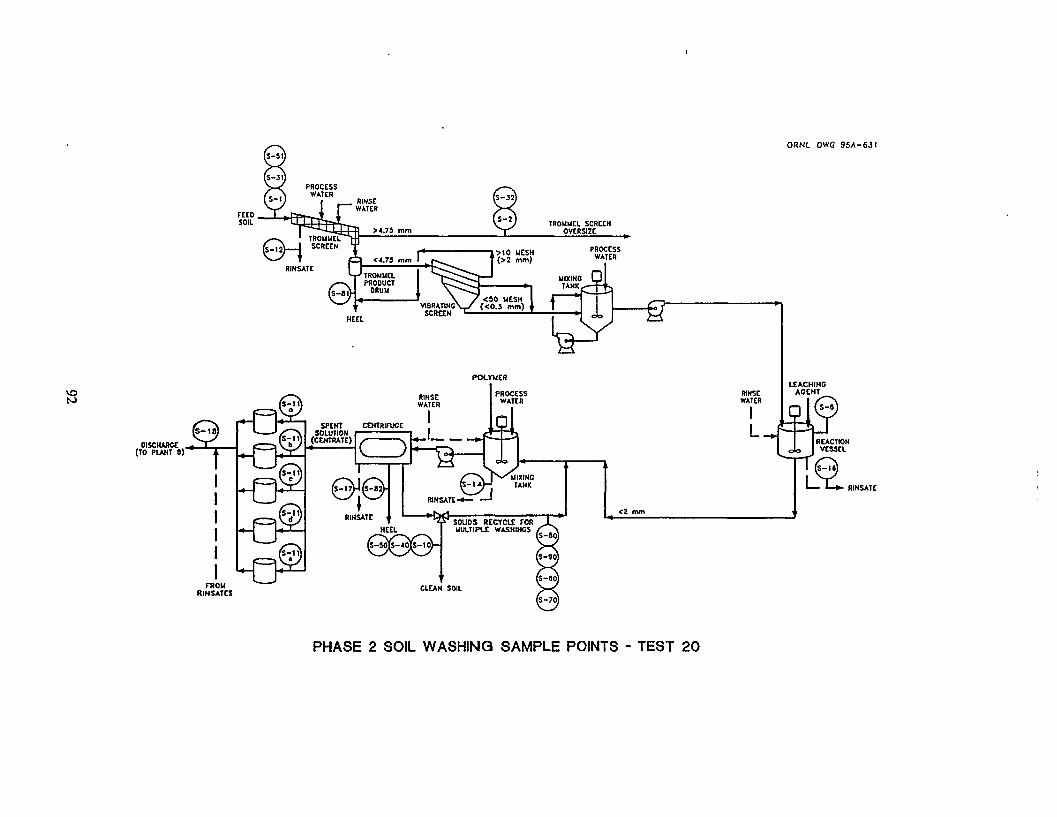
ORNL DWG
' - .„ RIHSATE
r^ PROCCSS
WATER
si RINSATE &J
V^! uixmc TANK
HEEL
(S-50P-«0lS-t0>
FROM RINSATES
SOUOS RECYCLE TOR MULTIPLE WASHINGS
RINSE WATER
PHASE 2 SOIL WASHING SAMPLE POINTS - TEST 20

ORNL DWG
« = . & "
^
©|0j RINSATt
RINSATE
"•fed
ft-ljH TANK
HEEL
TROU RIHSAICS
SOUDS RECYCU FOR UULTIPIC WASHINGS
RINSE WATER
CLEAH SOIL
PHASE 2 SOIL WASHING SAMPLE POINTS - TEST 21
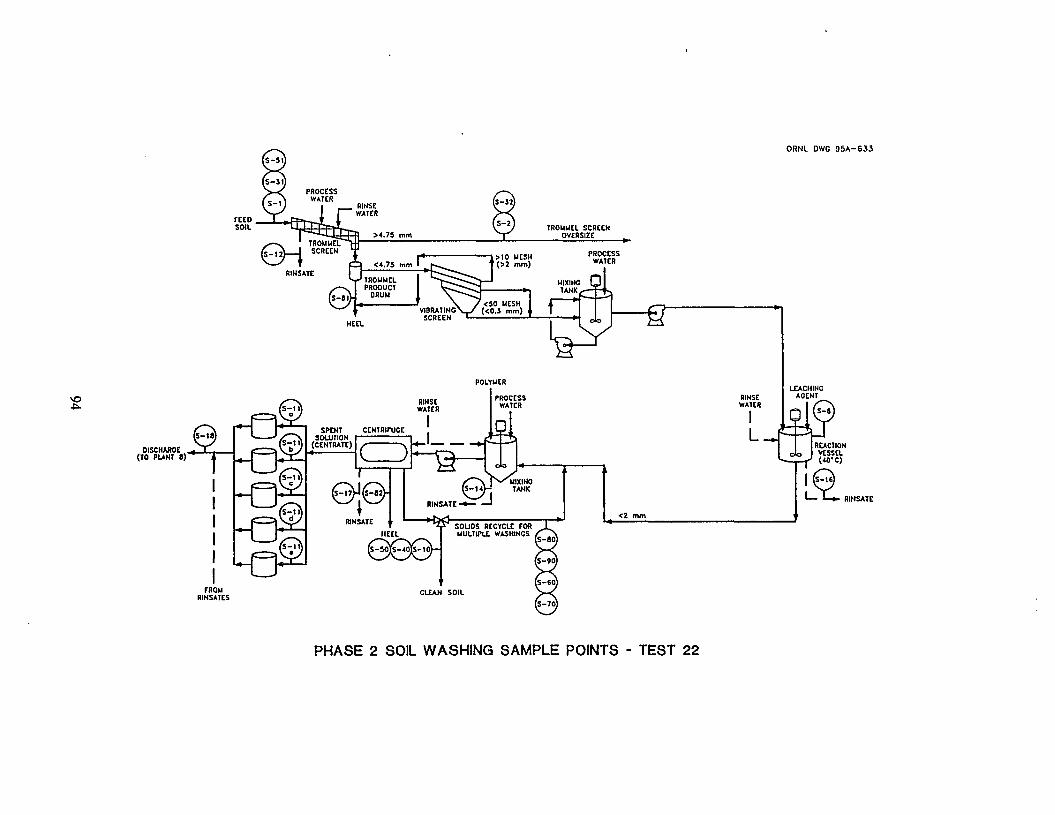
ORNL OWG 9 S A - 6 3 3
POLYUER
MIXING TANK
RINSATC
HEEL
©GO-SOUOS RECYCLE FOR MULTIPLE WASHINGS
RINSE WATER
L-J
RINSATE
PHASE 2 SOIL WASHING SAMPLE POINTS - TEST 22
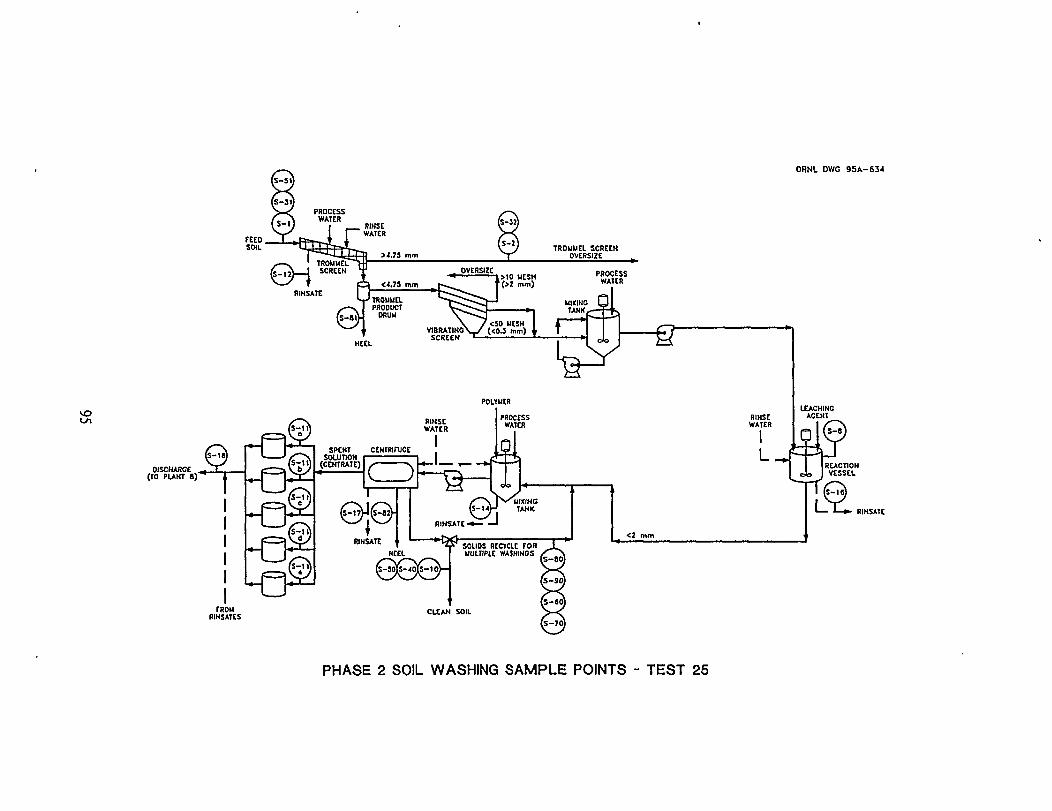
ORNL DWG 95A-634
POLYMER
DISCHARGE ^ _ (TO PLANT f %
^C." 1 PJNSATE
r-a RIHSATt
MOCESS WMES
9i fa-lA-J TAHK
KEEt
@Q0-fBOU
RIN SATES
SOUOS RECYCLE TOR MUITIPIE WASHINOS
<2 mm
RINSE WATER
L-J
PHASE 2 SOIL WASHING SAMPLE POINTS - TEST 25

APPENDIX B
PROCESS FLOW SHEETS

APPENDIX B
PROCESS DATA
Appendix B summarizes the process data taken during the Phase II tests. Data sheets for each
test are presented that tabulate the weights and volumes of feed and product streams, as well as
intermediate streams and samples. The data sheets are arranged in the order in which the tests were
run.
99
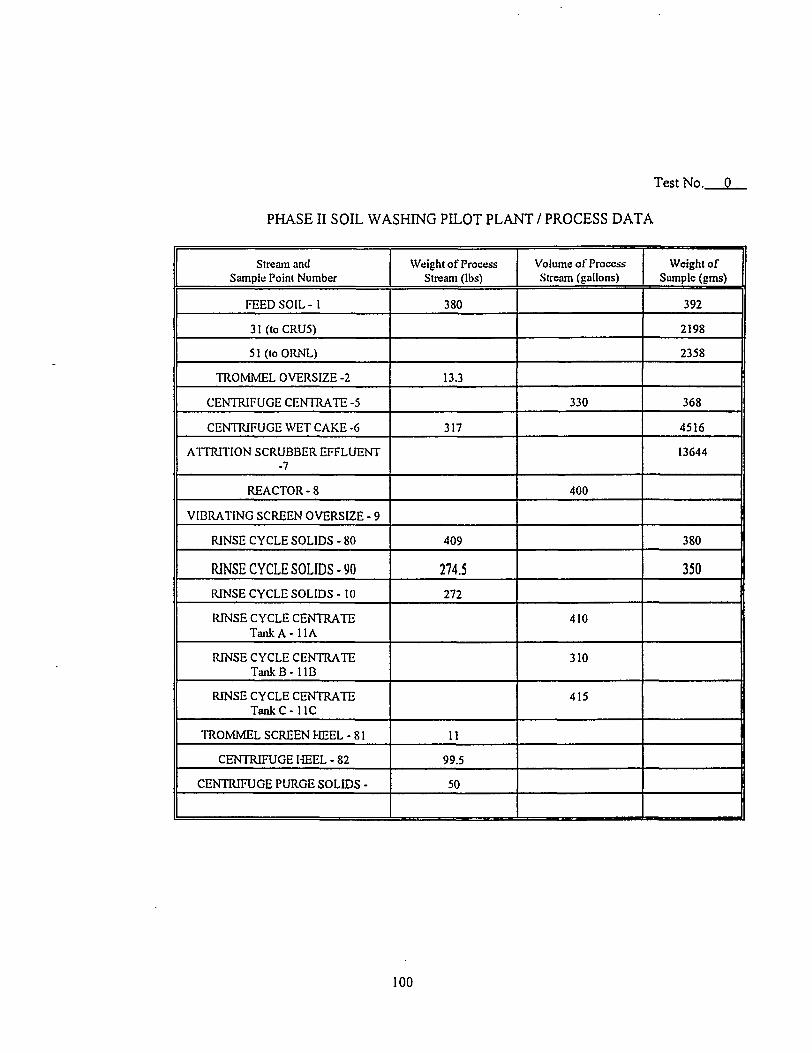
Test No. Q_
PHASE II SOIL WASHING PILOT PLANT / PROCESS DATA
Stream and Sample Point Number
Weight of Process Stream (lbs)
Volume of Process Stream (gallons)
Weight of Sample (gms)
FEED SOIL - 1 380 392
31(toCRU5) 2198
51(toORNL) 2358
TROMMEL OVERSIZE -2 13.3
CENTRIFUGE CENTRATE -5 330 368
CENTRIFUGE WET CAKE -6 317 4516
ATTRITION SCRUBBER EFFLUENT -7
13644
REACTOR-8 400
VIBRATING SCREEN OVERSIZE - 9
RINSE CYCLE SOLIDS - 80 409 380
RINSE CYCLE SOLIDS -90 274.5 350 RINSE CYCLE SOLIDS -10 272
RINSE CYCLE CENTRATE Tank A - 11A
410
RINSE CYCLE CENTRATE T a n k B - l l B
310
RINSE CYCLE CENTRATE T a n k C - U C
415
TROMMEL SCREEN HEEL - 81 11
CENTRIFUGE HEEL - 82 99.5
CENTRIFUGE PURGE SOLIDS - 50
100
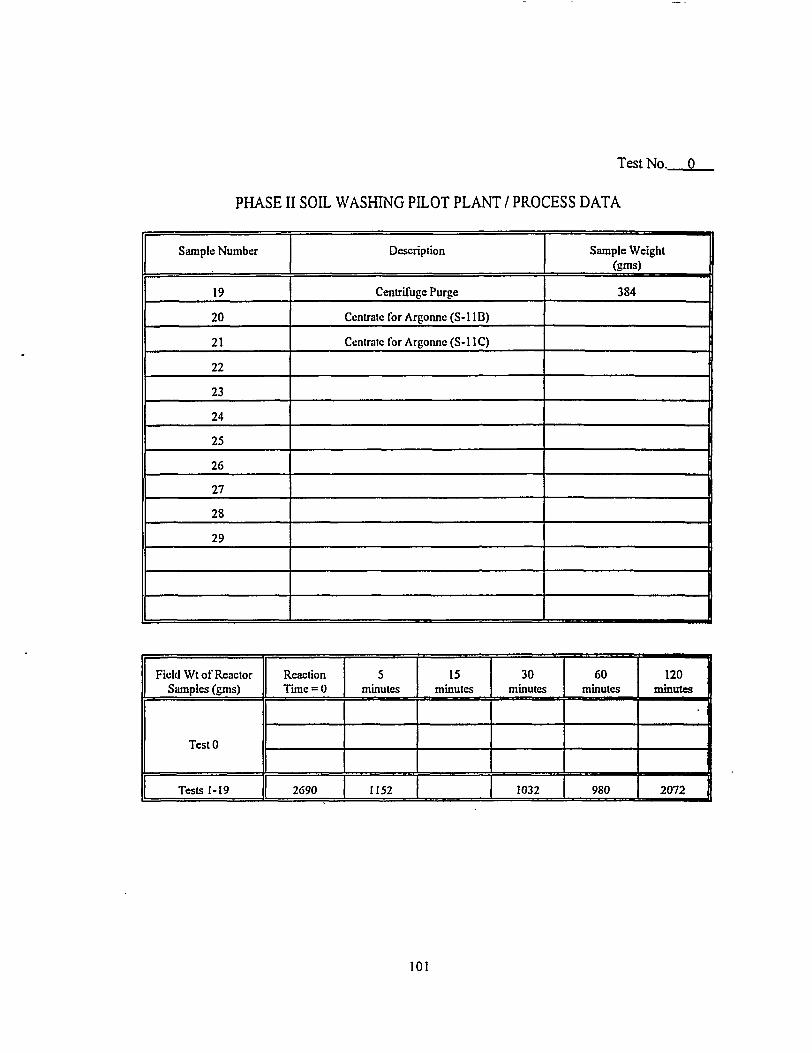
Test No. a PHASE II SOIL WASHING PILOT PLANT / PROCESS DATA
Sample Number Description Sample Weight (gms)
19 Centrifuge Purge 384
20 Centrate for Argonne (S-l IB)
21 Centrate for Argonne (S-l 1C)
22
23
24
25
26
27 I 28 I 29 |
1 I 1
Field Wt of Reactor Samples (gms)
Reaction Time = 0
5 minutes
15 mmutes
30 minutes
60 minutes
120 mmutes
TestO TestO TestO
Tests 1-19 2690 1152 1032 980 2072
101
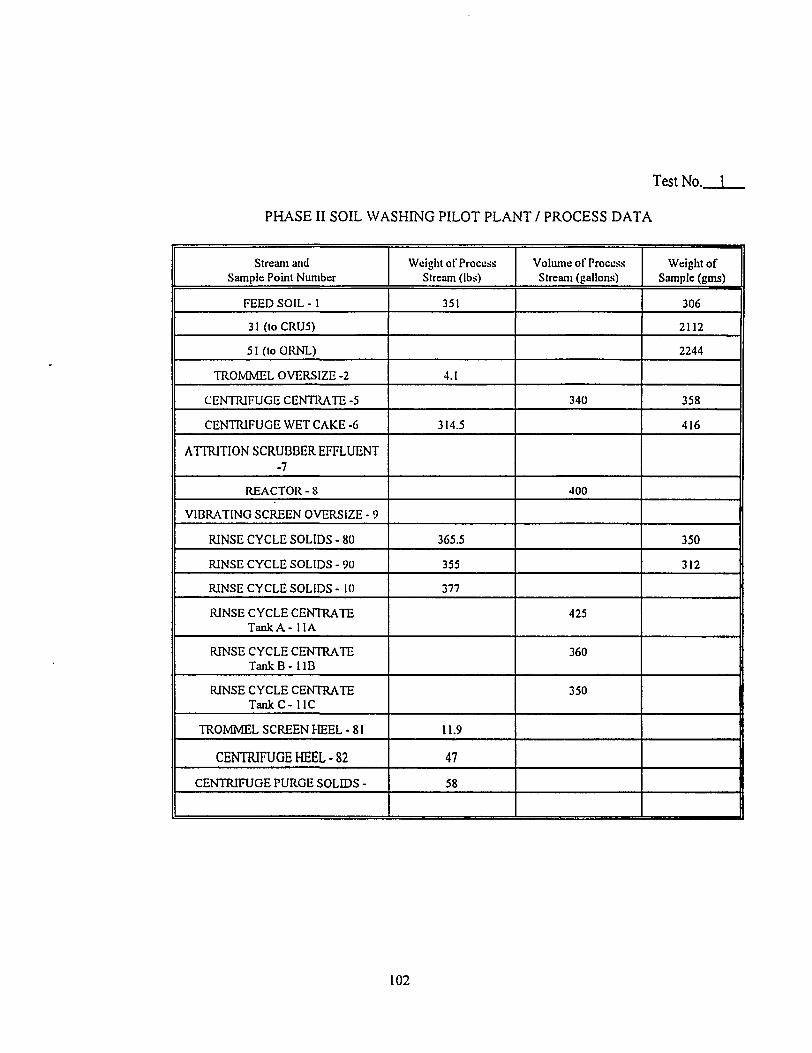
Test No. 1
PHASE II SOIL WASHING PILOT PLANT / PROCESS DATA
Stream and Sample Point Number
Weight of Process Stream (lbs)
Volume of Process Stream (gallons)
Weight of Sample (gms)
FEED SOIL - 1 351 306
31 (toCRU5) 2112
5I(toORNL) 2244
TROMMEL OVERSIZE -2 4.1
CENTRIFUGE CENTRATE -5 340 358
CENTRIFUGE WET CAKE -6 314.5 416
ATTRITION SCRUBBER EFFLUENT -7
REACTOR - 8 400
VIBRATING SCREEN OVERSIZE - 9
RINSE CYCLE SOLIDS-80 365.5 350
RINSE CYCLE SOLIDS - 90 355 312
RINSE CYCLE SOLIDS - 10 377
RINSE CYCLE CENTRATE TankA-llA
425
RINSE CYCLE CENTRATE TankB-llB
360
RINSE CYCLE CENTRATE Tank C-11C
350
TROMMEL SCREEN PEEL • 81 11.9
CENTRIFUGE HEEL-82 47
CENTRIFUGE PURGE SOLIDS - 58
102
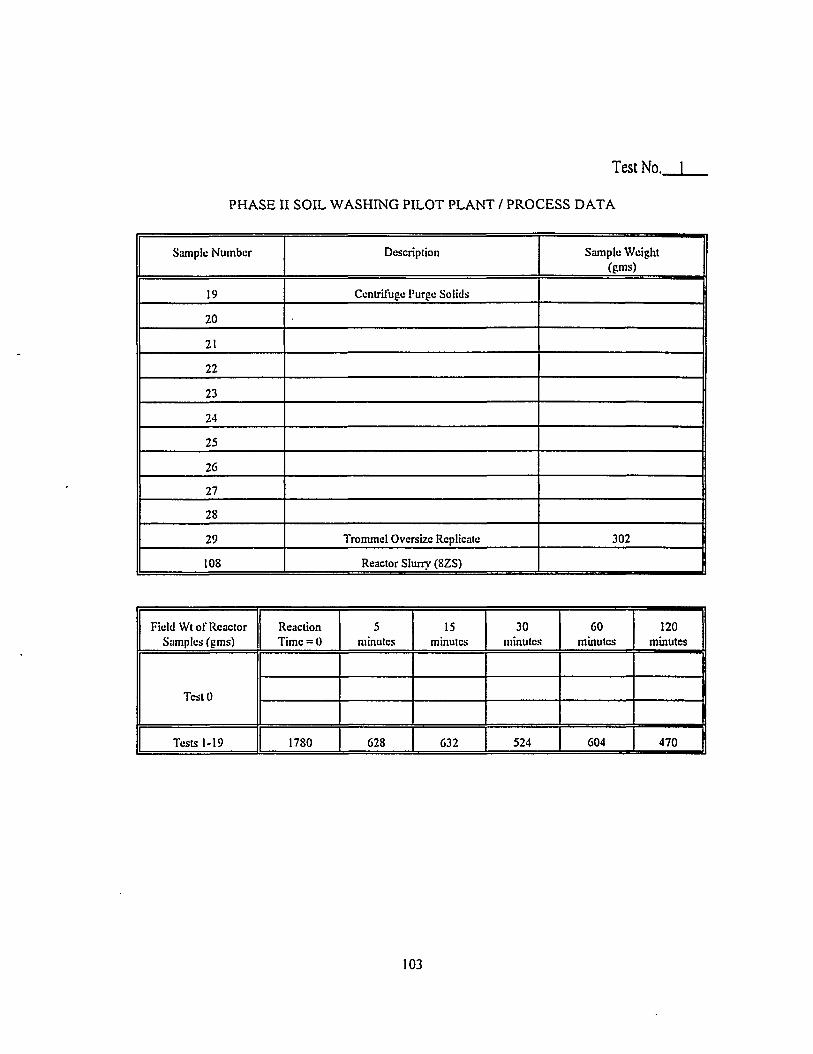
Test No. 1
PHASE II SOIL WASHING PILOT PLANT / PROCESS DATA
Sample Number Description Sample Weight (gms)
19 Centrifuge Purge Solids
20
21
22
23
24
25
26
27
28
29 Tronunel Oversize Replicate 302
108 Reactor Slurry (8ZS)
Field Wt of Reactor Samples (gms)
Reaction Time = 0
5 minutes
15 minutes
30 minutes
60 minutes
120 minutes
TestO TestO TestO
Tests 1-19 1780 628 632 524 604 470 |
103
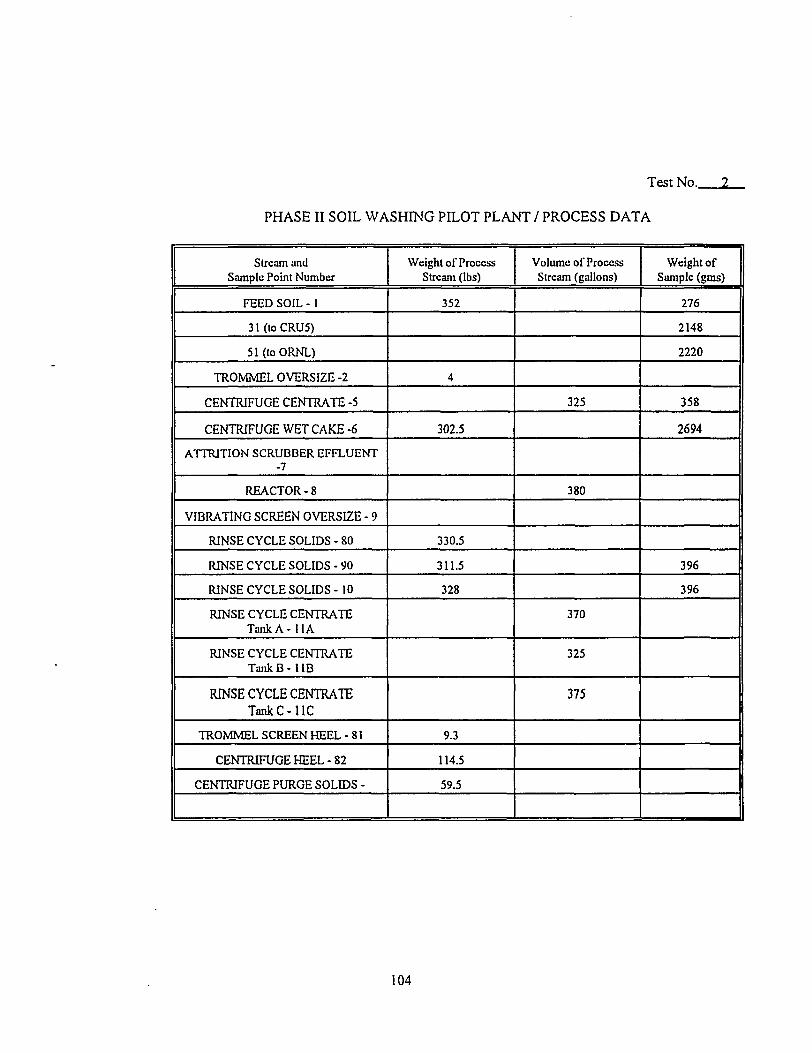
Test No.. 1 PHASE II SOIL WASHING PILOT PLANT / PROCESS DATA
Stream und Sample Point Number
Weight of Process Stream (lbs)
Volume of Process Stream (gallons)
Weight of Sample (gms)
FEED SOIL - 1 352 276
31(toCRU5) 2148
51(toORNL) 2220
TROMMEL OVERSIZE -2 4
CENTRIFUGE CENTRATE -5 325 358
CENTRIFUGE WET CAKE -6 302.5 2694
ATTRITION SCRUBBER EFFLUENT -7
REACTOR - 8 380
VIBRATING SCREEN OVERSIZE - 9
RINSE CYCLE SOLIDS - 80 330.5
RINSE CYCLE SOLIDS - 90 311.5 396
RINSE CYCLE SOLIDS - 10 328 396
RINSE CYCLE CENTRATE Tank A - 1IA
370
RINSE CYCLE CENTRATE Tank B - 1 IB
325
RINSE CYCLE CENTRATE TankC-llC
375
TROMMEL SCREEN HEEL - 81 9.3
CENTRIFUGE HEEL - 82 114.5
CENTRIFUGE PURGE SOLIDS - 59.5
104
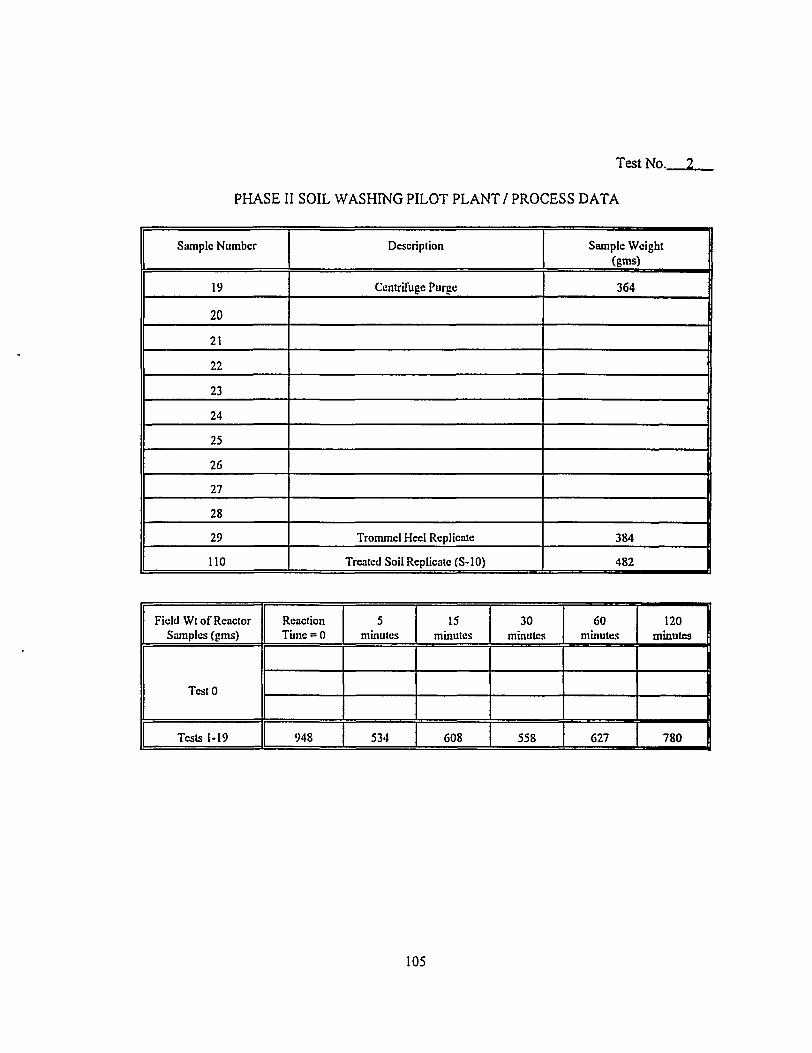
Test No. 2
PHASE II SOIL WASHING PILOT PLANT / PROCESS DATA
Sample Number Description Sample Weight (gms)
19 Centrifuge Purge 364
20
21
22
23
24
25
26
27
28 1 29 Trommel Heel Replicate 384 1 110 Treated Soil Replicate (S-10) 482 |
Field Wt of Reactor Samples (gms)
Reaction Time = 0
5 minutes
15 minutes
30 minutes
60 minutes
120 1 minutes |
TestO
I TestO I TestO
|
Tests 1-19 948 534 608 558 627 780 (J
105
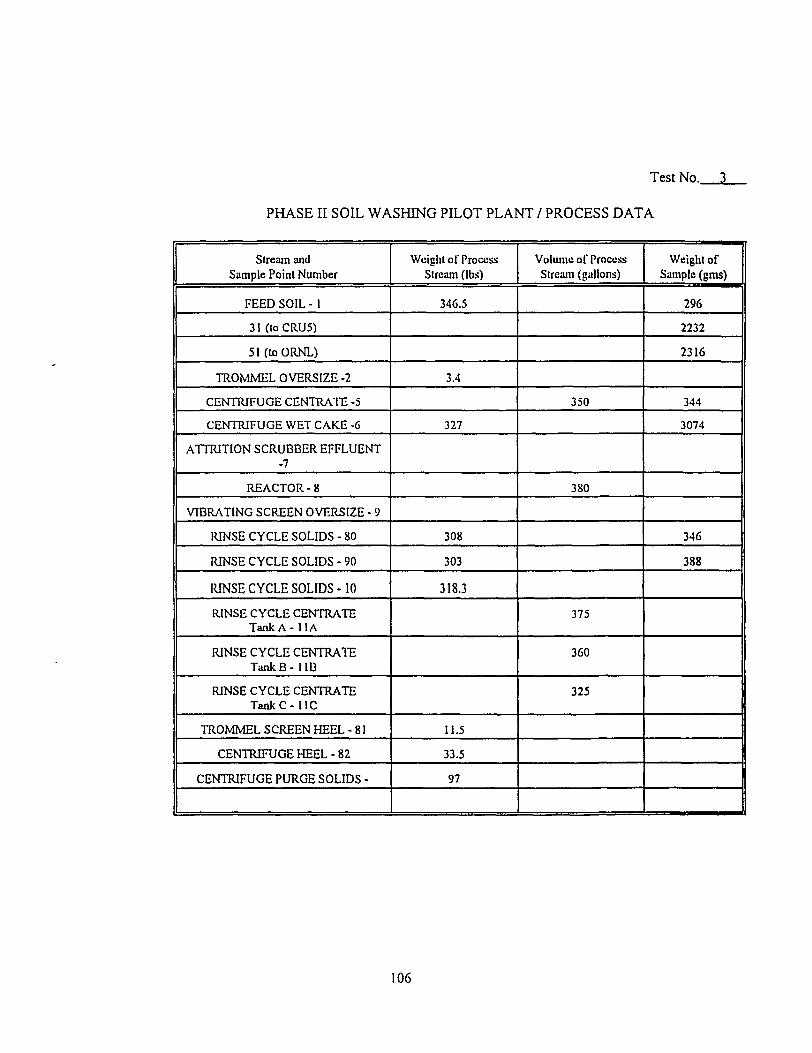
Test No. 1
PHASE II SOIL WASHING PILOT PLANT / PROCESS DATA
Stream and Sample Point Number
Weight of Process Stream (lbs)
Volume of Process Stream (gallons)
Weight of Sample (gms)
FEED SOIL - 1 346.5 296
31 (toCRU5) 2232
51(toORNL) 2316
TROMMEL OVERSIZE -2 3.4
CENTRIFUGE CENTRATE -5 350 344
CENTRIFUGE WET CAKE -6 327 3074
ATTRITION SCRUBBER EFFLUENT -7
REACTOR-8 380
VIBRATING SCREEN OVERSIZE - 9
RINSE CYCLE SOLIDS - 80 308 346
RINSE CYCLE SOLIDS - 90 303 388
RINSE CYCLE SOLIDS -10 318.3
RINSE CYCLE CENTRATE T a n k A - l l A
375
RINSE CYCLE CENTRATE T a n k B - l l B
360
RINSE CYCLE CENTRATE Tank C- 11C
325
TROMMEL SCREEN HEEL - 81 11.5
CENTRIFUGE HEEL - 82 33.5
CENTRIFUGE PURGE SOLIDS - 97
106
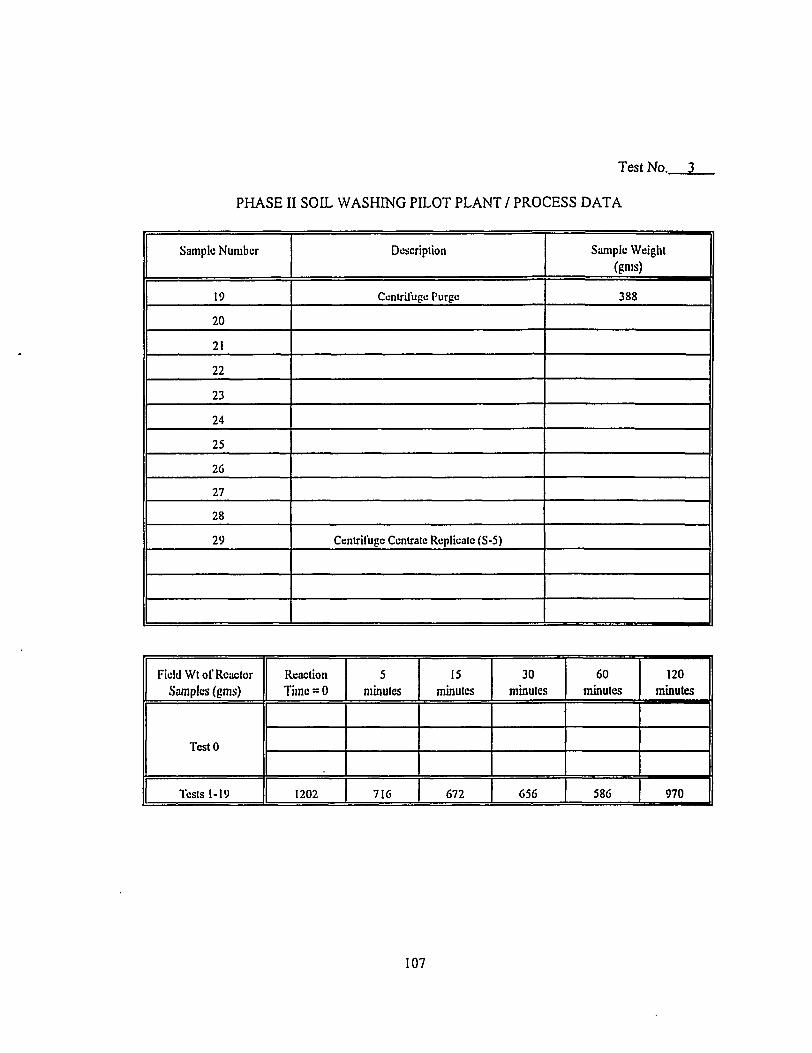
Test No. 1
PHASE II SOIL WASHING PILOT PLANT / PROCESS DATA
Sample Number Description Sample Weight (gms)
19 Centrifuge Purge 388
20
21
22
23
24
25
26
27
28
29 Centrifuge Centratc Replicate (S-5)
Field Wt of Rcaclor Samples (gms)
Reaction Time = 0
5 minutes
15 minutes
30 minutes
60 minutes
120 minutes
TestO TestO TestO
Tests 1-19 1202 716 672 656 586 970
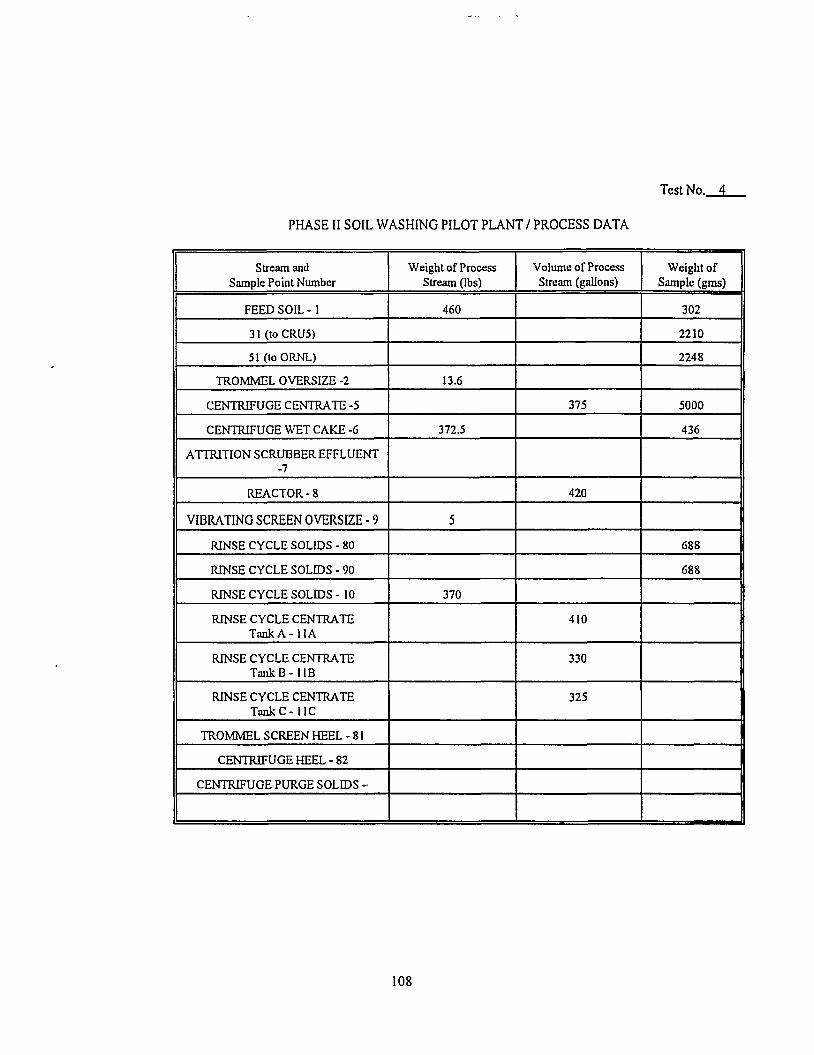
Test No. 4
PHASE II SOIL WASHING PILOT PLANT/ PROCESS DATA
Stream and Sample Point Number
Weight of Process Stream (lbs)
Volume of Process Stream (gallons)
Weight of Sample (gms)
FEED SOIL -1 460 302
31(toCRU5) 2210
51(toORNL) 2248
TROMMEL OVERSIZE -2 13.6
CENTRIFUGE CENTRATE -5 375 5000
CENTRIFUGE WET CAKE -6 372.5 436
ATTRITION SCRUBBER EFFLUENT -7
REACTOR-8 420
VIBRATING SCREEN OVERSIZE - 9 5
RINSE CYCLE SOLIDS - 80 688
RINSE CYCLE SOLIDS - 90 688
RINSE CYCLE SOLIDS - 10 370
RINSE CYCLE CENTRATE Tank A -11A
410
RINSE CYCLE CENTRATE T a n k B - l l B
330
RINSE CYCLE CENTRATE Tank C-11C
325
TROMMEL SCREEN HEEL - 81
CENTRIFUGE HEEL - 82
CENTRIFUGE PURGE SOLIDS -
108
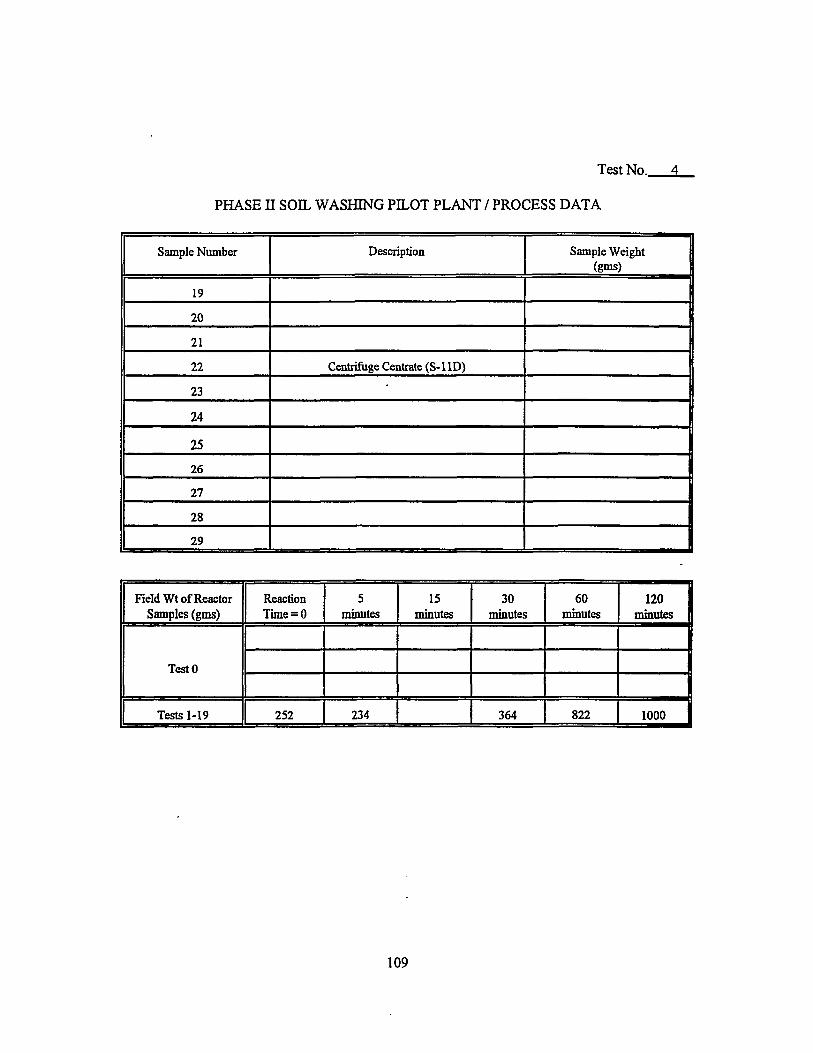
Test No. 4
PHASE II SOIL WASHING PILOT PLANT / PROCESS DATA
Sample Number Description Sample Weight (gms)
19
20
21
22 Centrifuge Centrate (S-llD)
23
24
25 26
27
28
29
Field Wt of Reactor Samples (gms)
Reaction Time = 0
5 minutes
15 minutes
30 minutes
60 minutes
120 1 minutes ||
TestO
1 TestO 1 TestO I
Tests 1-19 252 234 364 822 1000 1
109
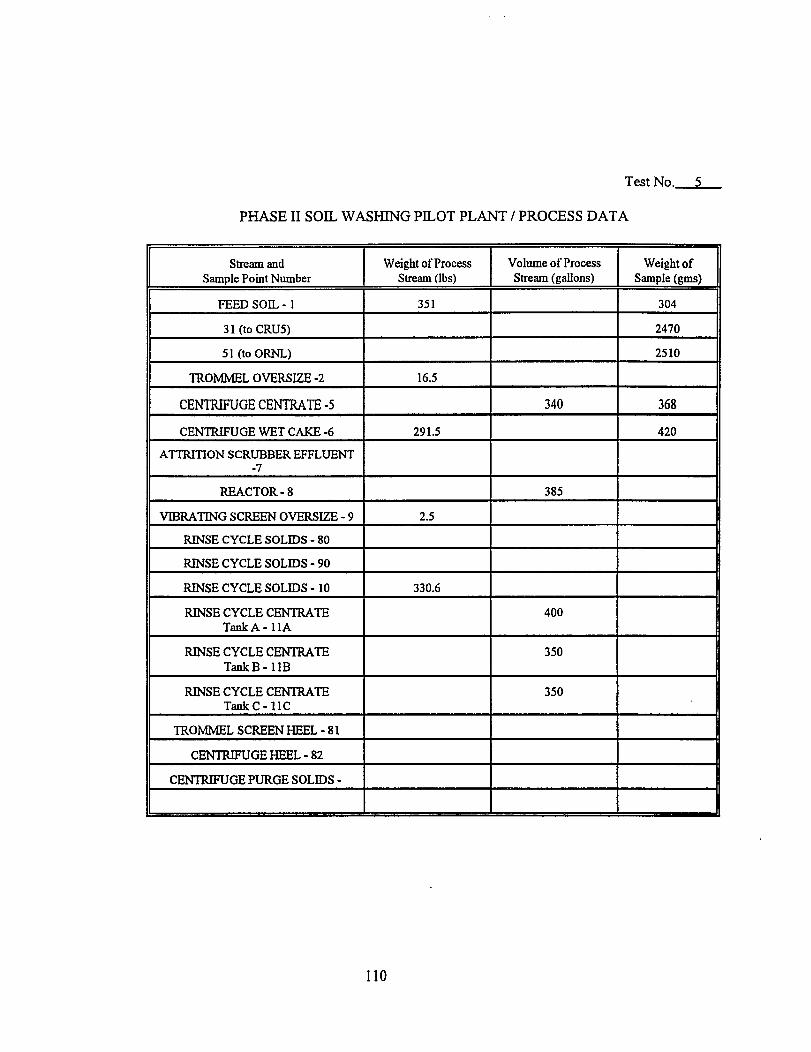
Test No. 5
PHASE II SOIL WASHING PILOT PLANT / PROCESS DATA
Stream and Sample Point Number
Weight of Process Stream (lbs)
Volume of Process Stream (gallons)
Weight of Sample (gms)
FEED SOIL - 1 351 304
31(toCRU5) 2470
51(toORNL) 2510
TROMMEL OVERSIZE -2 16.5
CENTRIFUGE CENTRATE -5 340 368
CENTRIFUGE WET CAKE -6 291.5 420
ATTRITION SCRUBBER EFFLUENT -7
REACTOR-8 385
VIBRATING SCREEN OVERSIZE - 9 2.5
RINSE CYCLE SOLIDS - 80
RINSE CYCLE SOLIDS - 90
RINSE CYCLE SOLIDS -10 330.6
RINSE CYCLE CENTRATE TankA-llA
400
RINSE CYCLE CENTRATE TankB-llB
350
RINSE CYCLE CENTRATE Tank C-11C
350
TROMMEL SCREEN HEEL - 81
CENTRIFUGE HEEL - 82
CENTRIFUGE PURGE SOLIDS -
110
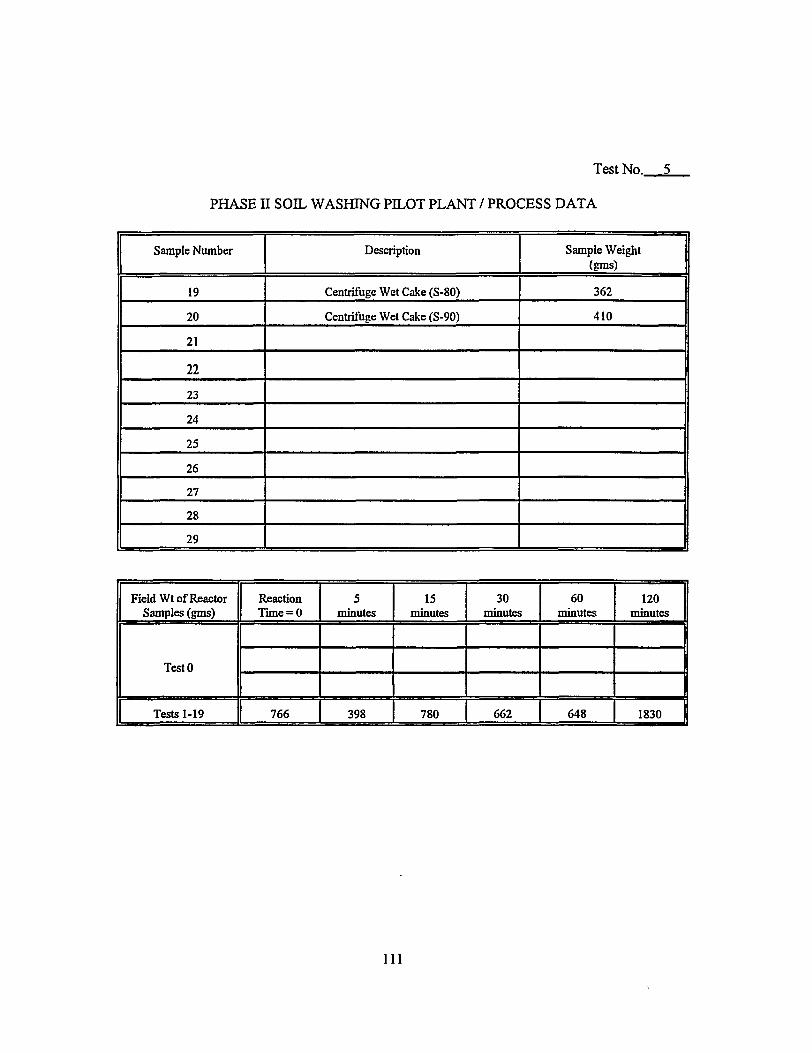
Test No. 5
PHASE II SOIL WASHING PILOT PLANT / PROCESS DATA
Sample Number Description Sample Weight (gms)
19 Centrifuge Wet Cake (S-80) 362
20 Centrifuge Wet Cake (S-90) 410
21
22
23
24
25
26
27
28
29
Field Wt of Reactor Samples (gms)
Reaction Time = 0
5 minutes
15 minutes
30 minutes
60 minutes
120 minutes
TestO TestO TestO
Tests 1-19 766 398 780 662 648 1830 J
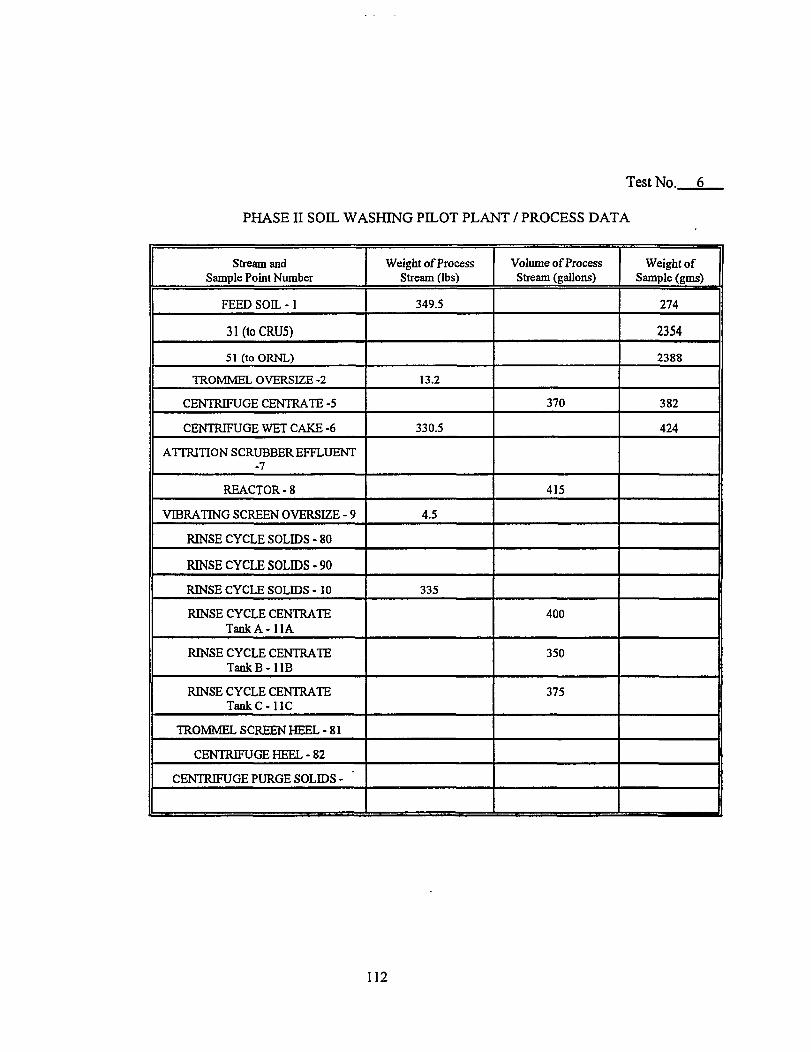
Test No. 6
PHASE II SOIL WASHING PILOT PLANT / PROCESS DATA
Stream and Sample Point Number
Weight of Process Stream (lbs)
Volume of Process Stream (gallons)
Weight of Sample (gins)
FEED SOIL - 1 349.5 274
31(toCRU5) 2354
51 (to ORNL) 2388
TROMMEL OVERSIZE -2 13.2
CENTRIFUGE CENTRATE -5 370 382
CENTRIFUGE WET CAKE -6 330.5 424
ATTRITION SCRUBBER EFFLUENT -7
REACTOR-8 415
VIBRATING SCREEN OVERSIZE - 9 4.5
RINSE CYCLE SOLIDS - 80
RINSE CYCLE SOLIDS - 90
RINSE CYCLE SOLIDS - 10 335
RINSE CYCLE CENTRATE TankA-llA
400
RINSE CYCLE CENTRATE TankB-llB
350
RINSE CYCLE CENTRATE Tank C-11C
375
TROMMEL SCREEN HEEL - 81
CENTRIFUGE HEEL - 82
CENTRIFUGE PURGE SOLIDS -
112
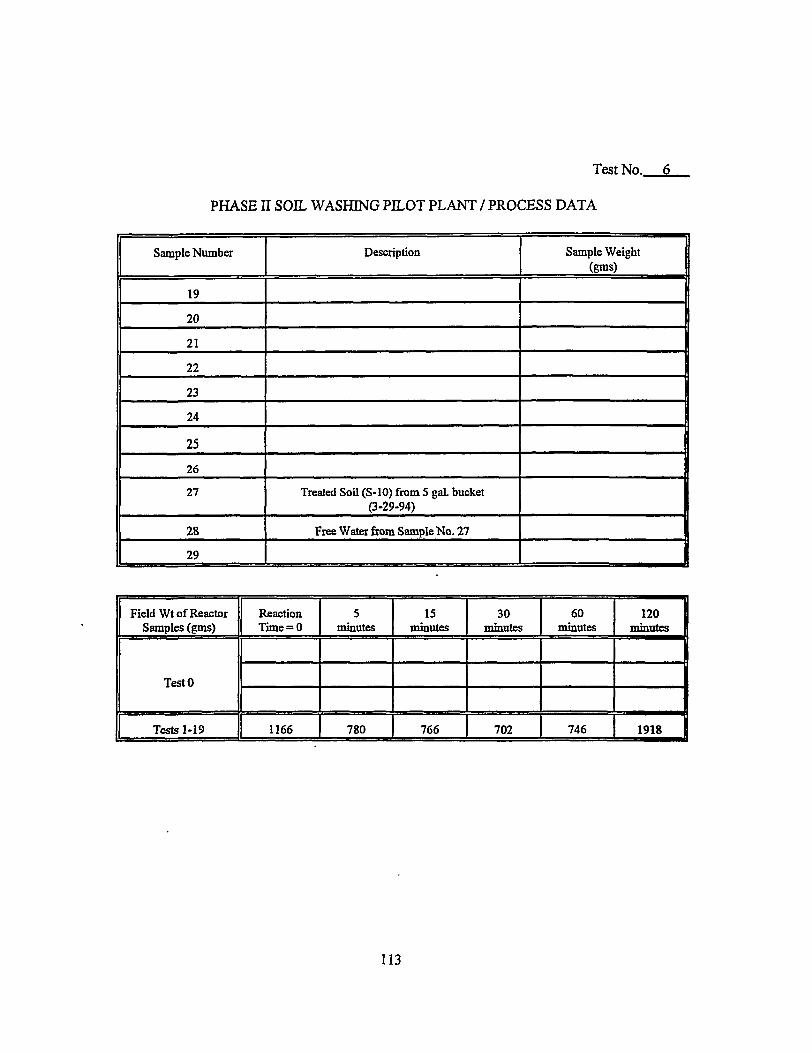
Test No. 6
PHASE II SOIL WASHING PILOT PLANT / PROCESS DATA
Sample Number Description Sample Weight (gms)
19
20
21
22
23
24
25 26 I 27 Treated Soil (S-10) from 5 gaL bucket
(3-29-94)
28 Free Water from Sample No. 27 1 29 1
Field Wt of Reactor Samples (gms)
Reaction Time = 0
5 minutes
15 minutes
30 minutes
60 minutes
120 1 minutes fl
TestO
1
TestO I TestO
1 Tests 1-19
! • • - " • =
1166 780 766 702 746 1918 8
113
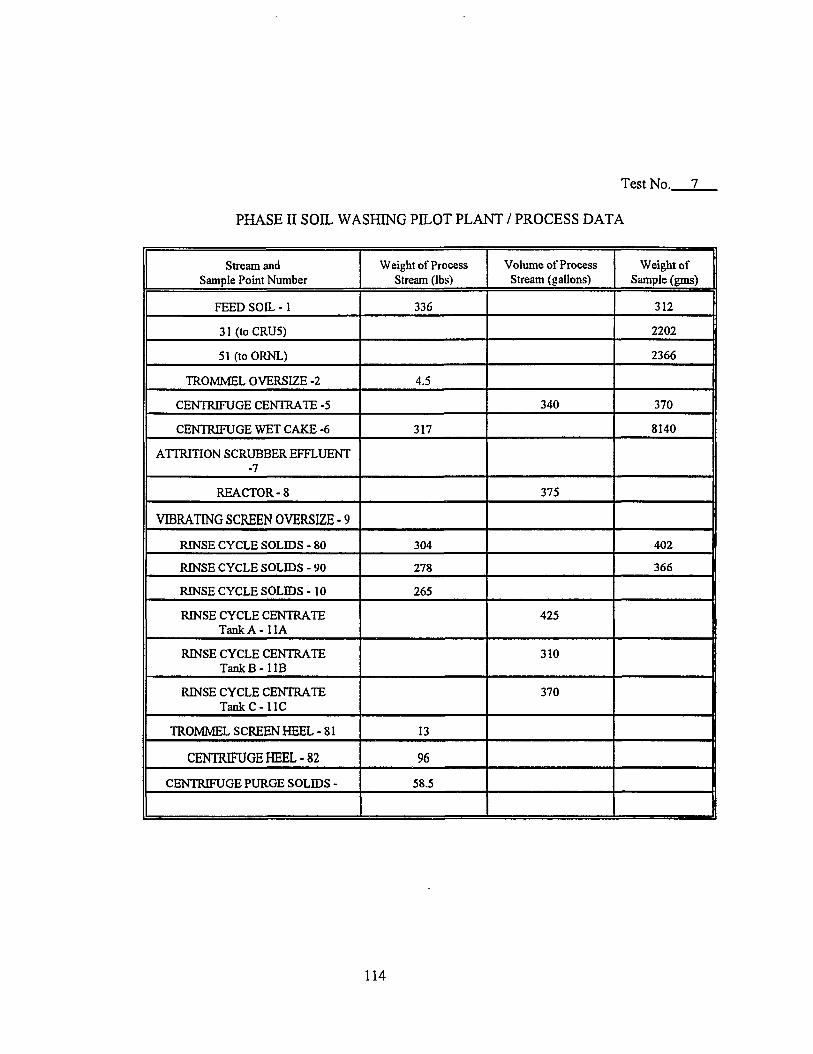
Test No. 7
PHASE II SOIL WASHING PILOT PLANT / PROCESS DATA
Stream and Sample Point Number
Weight of Process Stream (lbs)
Volume of Process Stream (gallons)
Weight of Sample (gms)
FEED SOIL - 1 336 312
31(toCRU5) 2202
51(toORNL) 2366
TROMMEL OVERSIZE -2 4.5
CENTRIFUGE CENTRATE -5 340 370
CENTRIFUGE WET CAKE -6 317 8140
ATTRITION SCRUBBER EFFLUENT -7
REACTOR-8 375
VIBRATING SCREEN OVERSIZE - 9
RINSE CYCLE SOLIDS - 80 304 402 1
RINSE CYCLE SOLIDS - 90 278 366 |
RINSE CYCLE SOLIDS - 10 265
RINSE CYCLE CENTRATE TankA-llA
425
RINSE CYCLE CENTRATE TankB-llB
310
RINSE CYCLE CENTRATE TankC-llC
370
TROMMEL SCREEN HEEL - 81 13
CENTRIFUGE HEEL-82 96 CENTRIFUGE PURGE SOLIDS - 58.5
114
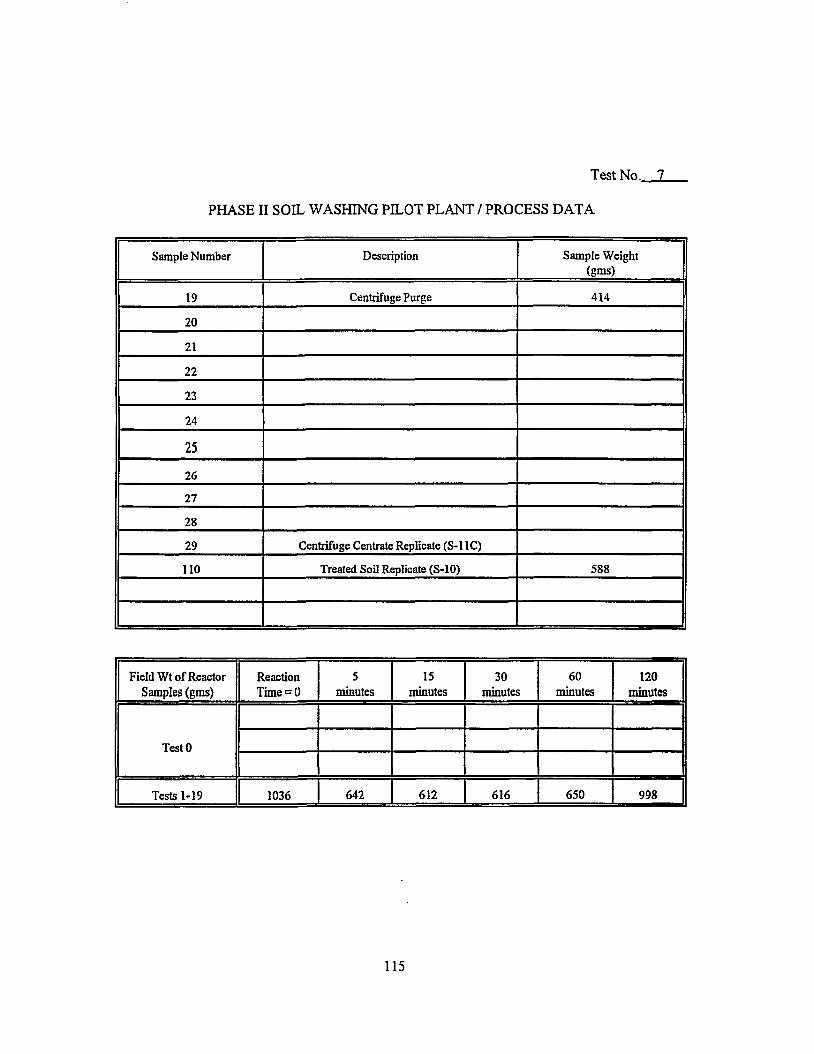
Test No. 7
PHASE II SOIL WASHING PILOT PLANT / PROCESS DATA
Sample Number Description Sample Weight (gms)
19 Centrifuge Purge 414
20
21
22
23
24
25 26
27
28
29 Centrifuge Centrate Replicate (S-11C)
110 Treated Soil Replicate (S-10) 388
Field Wt of Reactor Samples (gms)
Reaction Time = 0
5 minutes
15 minutes
30 minutes
60 minutes
120 minutes
TestO TestO TestO
Tests 1-19 1036 642 612 616 650 998
115
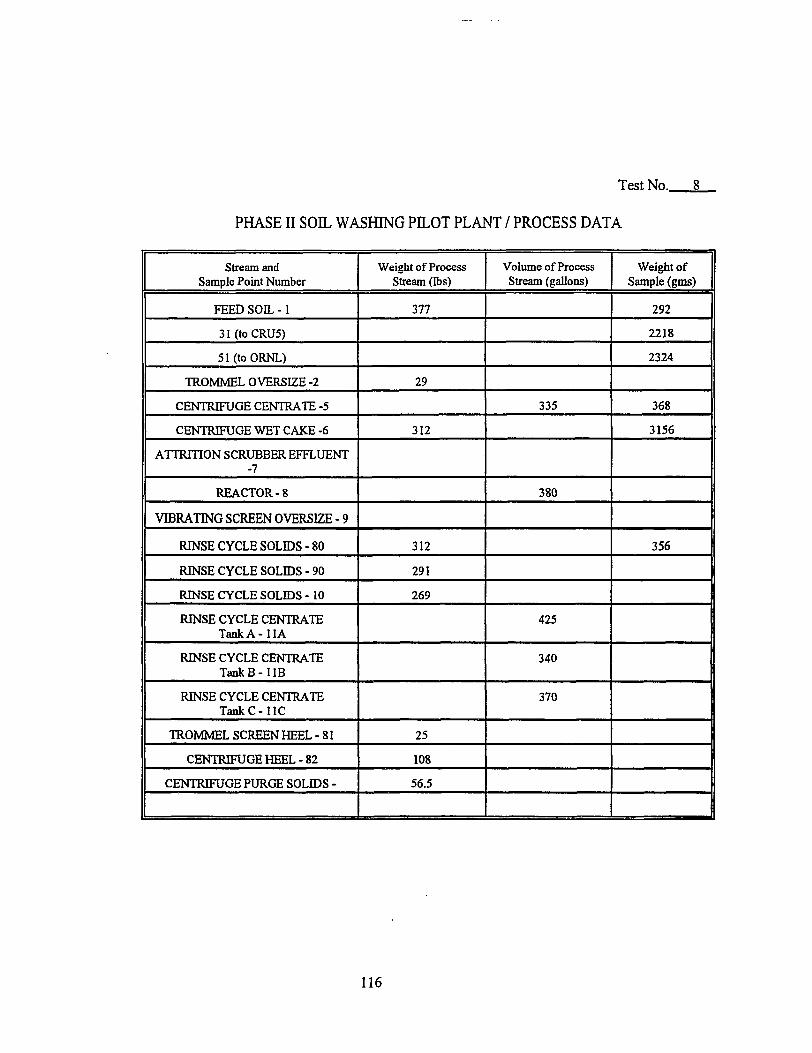
Test No. 8
PHASE II SOIL WASHING PILOT PLANT / PROCESS DATA
Stream and Sample Point Number
Weight of Process Stream (lbs)
Volume of Process Stream (gallons)
Weight of Sample (gms)
FEED SOIL -1 377 292
31(toCRU5) 2218
51 (to ORNL) 2324
TROMMEL OVERSIZE -2 29
CENTRIFUGE CENTRATE -5 335 368
CENTRIFUGE WET CAKE -6 312 3156
ATTRITION SCRUBBER EFFLUENT -7
REACTOR-8 380
VIBRATING SCREEN OVERSIZE - 9
RINSE CYCLE SOLIDS - 80 312 356
RINSE CYCLE SOLIDS - 90 291
RINSE CYCLE SOLIDS - 10 269
RINSE CYCLE CENTRATE TankA-llA
425
RINSE CYCLE CENTRATE TankB-llB
340
RINSE CYCLE CENTRATE TankC-llC
370
TROMMEL SCREEN HEEL - 81 25
CENTRIFUGE HEEL - 82 108
CENTRIFUGE PURGE SOLIDS - 56.5
116
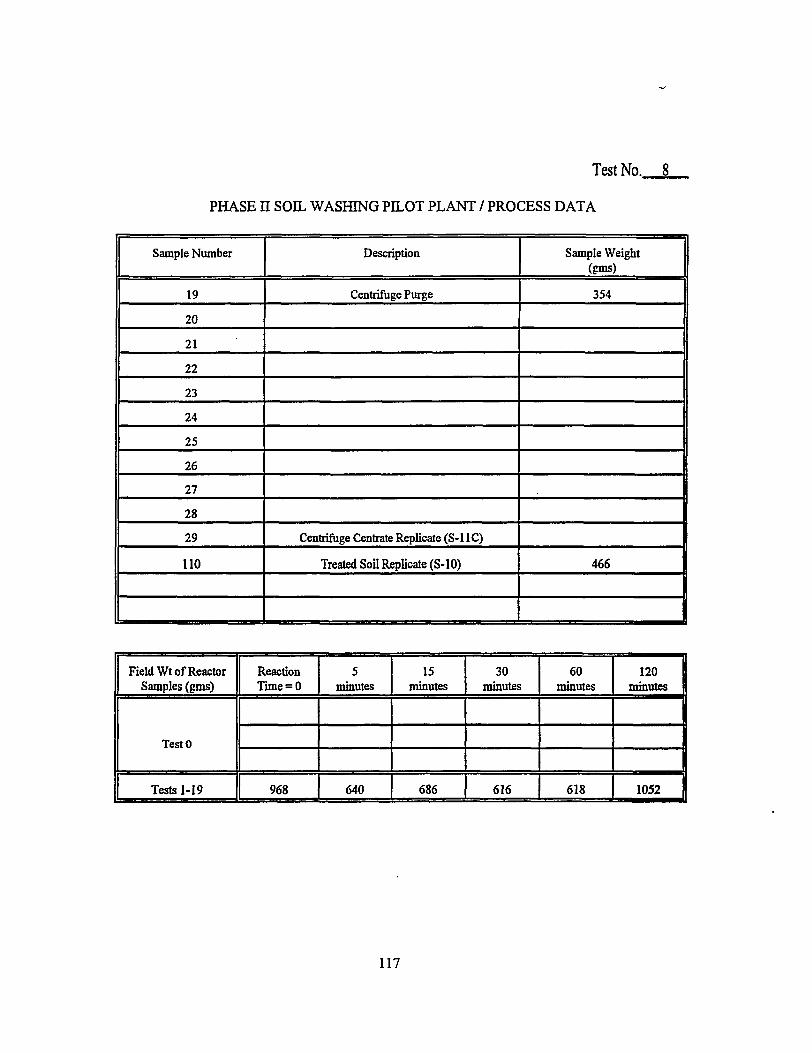
Test No. 8
PHASE II SOIL WASHING PILOT PLANT / PROCESS DATA
Sample Number Description Sample Weight (gms)
19 Centrifuge Purge 354
20
21
22
23
24
25
26
27 |
28 I 29 Centrifuge Centrate Replicate (S-11C) I 110 Treated Soil Replicate (S-10) 466 1
I I
Field Wt of Reactor Samples (gms)
Reaction Time = 0
5 minutes
15 minutes
30 minutes
60 minutes
120 minutes [
TestO TestO TestO
Tests 1-19 968 640 686 616 618 1052 1
117
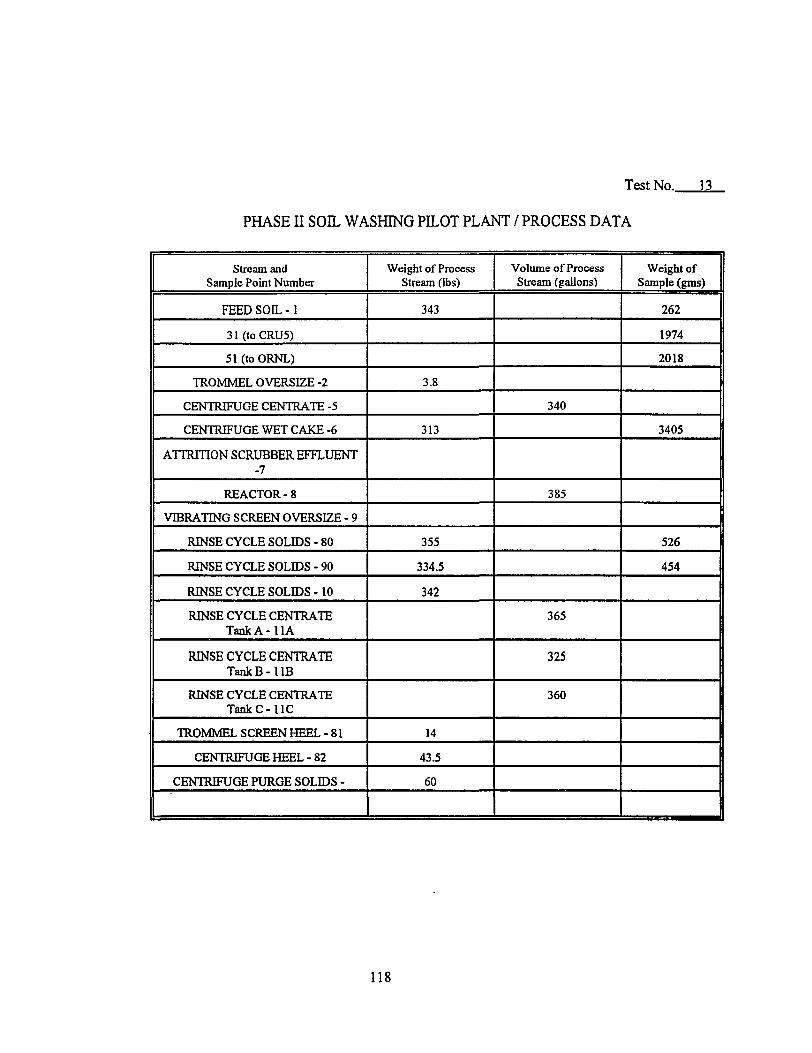
Test No. 13
PHASE II SOIL WASHING PILOT PLANT / PROCESS DATA
Stream and Sample Point Number
Weight of Process Stream (lbs)
Volume of Process Stream (gallons)
Weight of Sample (gms)
FEED SOIL -1 343 262
31 (toCRU5) 1974
51(toORNL) 2018
TROMMEL OVERSIZE -2 3.8
CENTRIFUGE CENTRATE -5 340
CENTRIFUGE WET CAKE -6 313 3405
ATTRITION SCRUBBER EFFLUENT -7
REACTOR-8 385
VIBRATING SCREEN OVERSIZE - 9
RINSE CYCLE SOLIDS - 80 355 526
RINSE CYCLE SOLIDS - 90 334.5 454
RINSE CYCLE SOLIDS -10 342
RINSE CYCLE CENTRATE TankA- l lA
365
RINSE CYCLE CENTRATE TankB- l lB
325
RINSE CYCLE CENTRATE Tank C-11C
360
TROMMEL SCREEN HEEL - 81 14
CENTRIFUGE HEEL - 82 43.5
CENTRIFUGE PURGE SOLIDS - 60
118
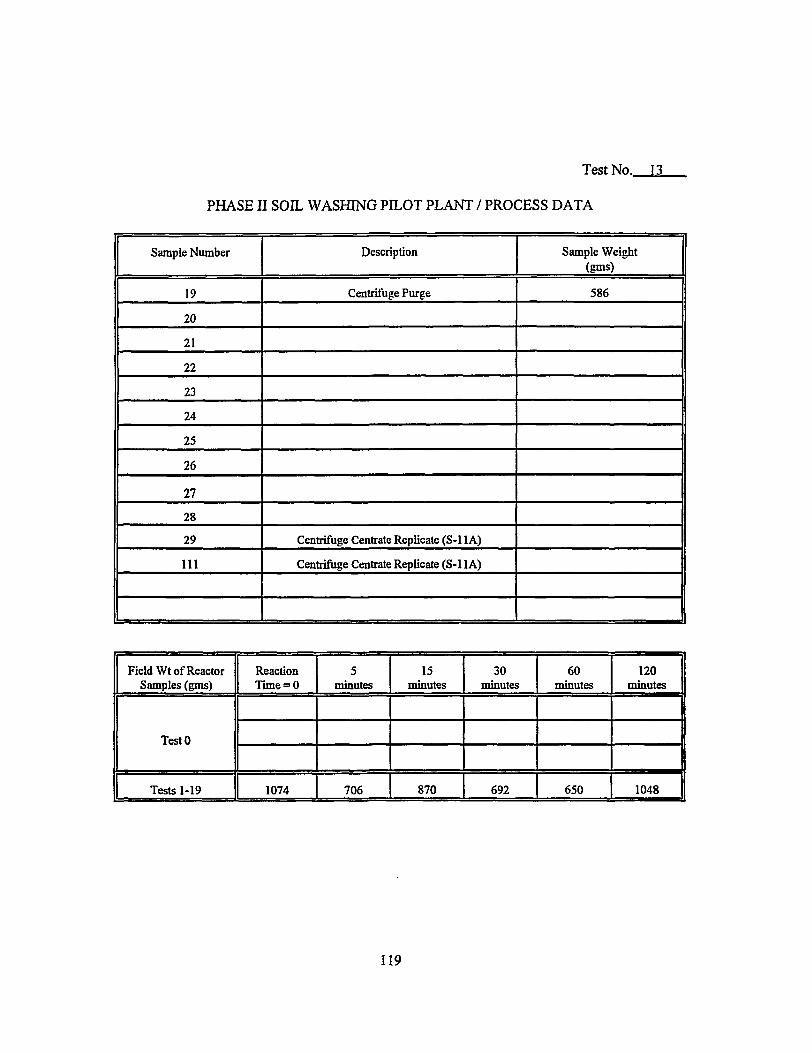
Test No. H
PHASE II SOIL WASHING PILOT PLANT / PROCESS DATA
Sample Number Description Sample Weight (gms)
19 Centrifuge Purge 586
20
21
22
23
24
25
26
27
28
29 Centrifuge Centrate Replicate (S-11 A)
111 Centrifuge Centrate Replicate (S-11 A)
Field Wt of Reactor Samples (gms)
Reaction Time = 0
5 minutes
15 minutes
30 minutes
60 minutes
120 minutes
TestO TestO TestO
Tests 1-19 1074 706 870 692 650 1048 1
119
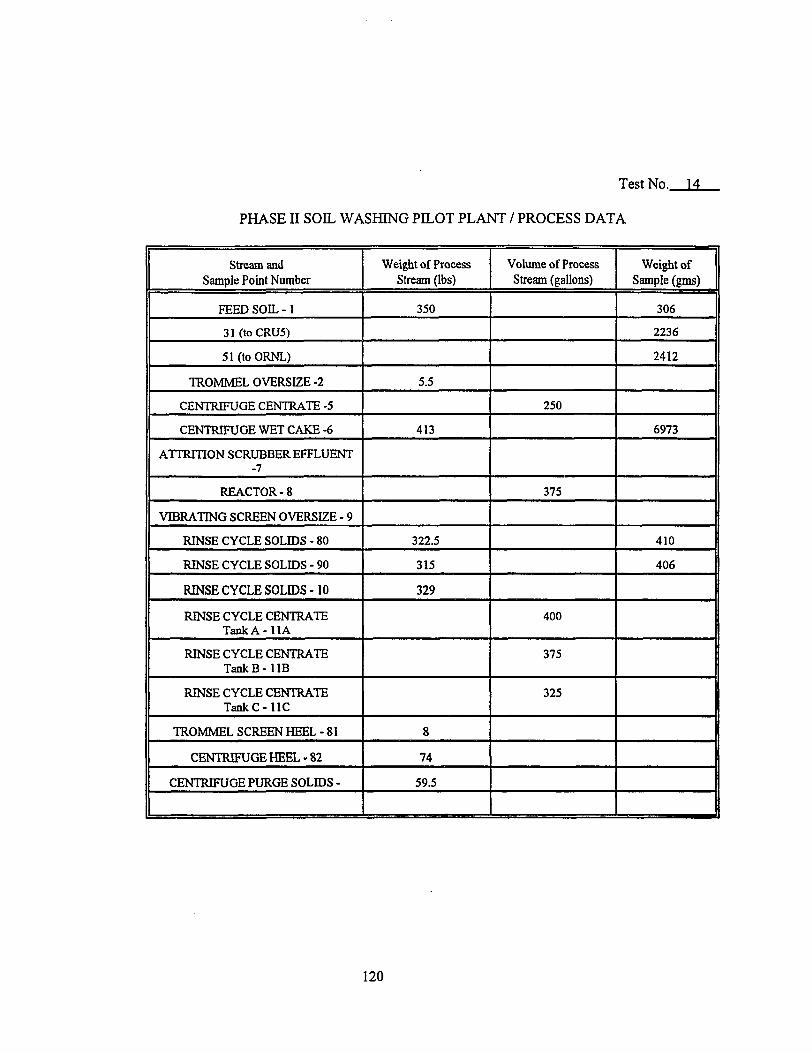
Test No. M
PHASE II SOIL WASHING PILOT PLANT / PROCESS DATA
Stream and Sample Point Number
Weight of Process Stream (lbs)
Volume of Process Stream (gallons)
Weight of Sample (gms)
FEED SOIL -1 350 306
31(toCRU5) 2236
51 (toORNL) 2412
TROMMEL OVERSIZE -2 5.5
CENTRIFUGE CENTRATE -5 250
CENTRIFUGE WET CAKE -6 413 6973
ATTRITION SCRUBBER EFFLUENT -7
REACTOR-8 375
VIBRATING SCREEN OVERSIZE - 9
RINSE CYCLE SOLIDS - 80 322.5 410
RINSE CYCLE SOLIDS - 90 315 406
RINSE CYCLE SOLIDS-10 329
RINSE CYCLE CENTRATE TankA-llA
400
RINSE CYCLE CENTRATE TankB-llB
375
RINSE CYCLE CENTRATE Tank C-11C
325
TROMMEL SCREEN HEEL - 81 8
CENTRIFUGE HEEL - 82 74
CENTRIFUGE PURGE SOLIDS - 59.5
120
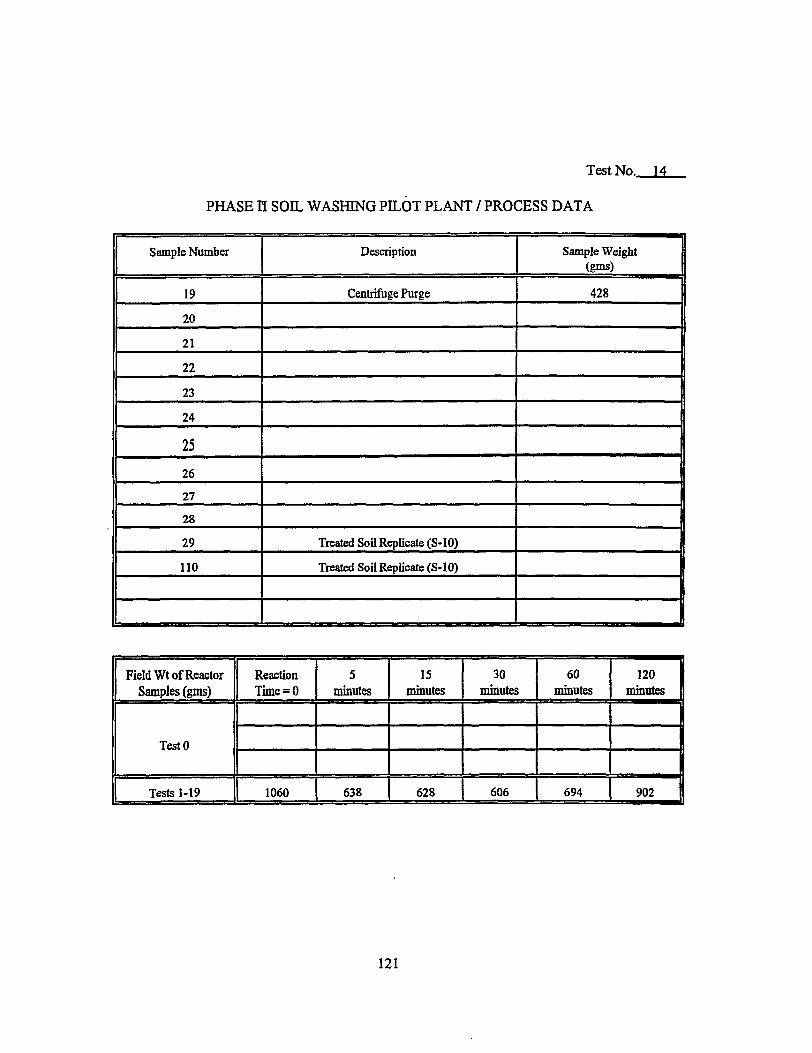
Test No. \±
PHASE H SOIL WASHING PILOT PLANT / PROCESS DATA
Sample Number Description Sample Weight (gms)
19 Centrifuge Purge 428
20
21
22
23
24
25 26
27 1 28 |
29 Treated Soil Replicate (S-10) I 110 Treated Soil Replicate (S-10) |
I 1
Field Wt of Reactor Samples (gms)
Reaction Time = 0
5 minutes
15 minutes
30 minutes
60 minutes
120 minutes f
TestO TestO TestO
Tests 1-19 1060 638 628 606 694 902
121
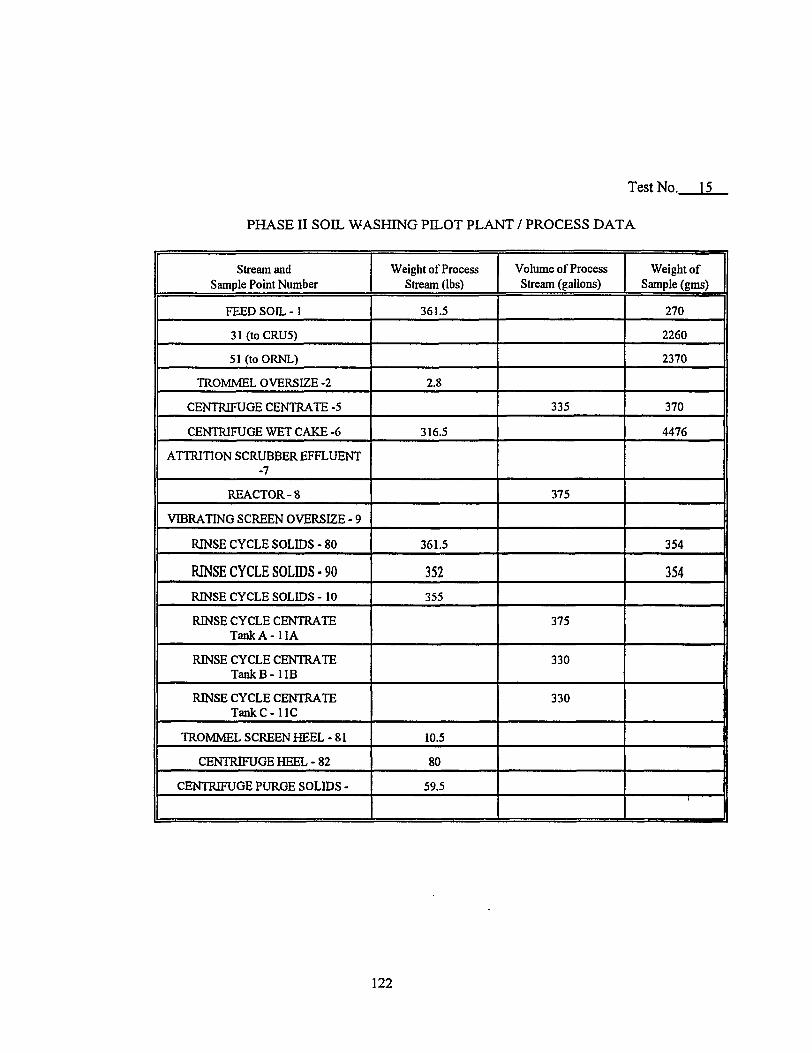
Test No. 11
PHASE II SOIL WASHING PILOT PLANT / PROCESS DATA
Stream and Sample Point Number
Weight of Process Stream (lbs)
Volume of Process Stream (gallons)
Weight of Sample (gms)
FEED SOIL -1 361.5 270
31(toCRU5) 2260
51 (to ORNL) 2370
TROMMEL OVERSIZE -2 2.8
CENTRIFUGE CENTRATE -5 335 370
CENTRIFUGE WET CAKE -6 316.5 4476
ATTRITION SCRUBBER EFFLUENT -7
REACTOR-8 375
VIBRATING SCREEN OVERSIZE - 9
RINSE CYCLE SOLIDS - 80 361.5 354
RINSE CYCLE SOLIDS- 90 352 354 RINSE CYCLE SOLIDS - 10 355
RINSE CYCLE CENTRATE TankA-llA
375
RINSE CYCLE CENTRATE TankB-llB
330
RINSE CYCLE CENTRATE Tank C-11C
330
TROMMEL SCREEN HEEL - 81 10.5
CENTRIFUGE HEEL - 82 80
CENTRIFUGE PURGE SOLIDS - 59.5
122
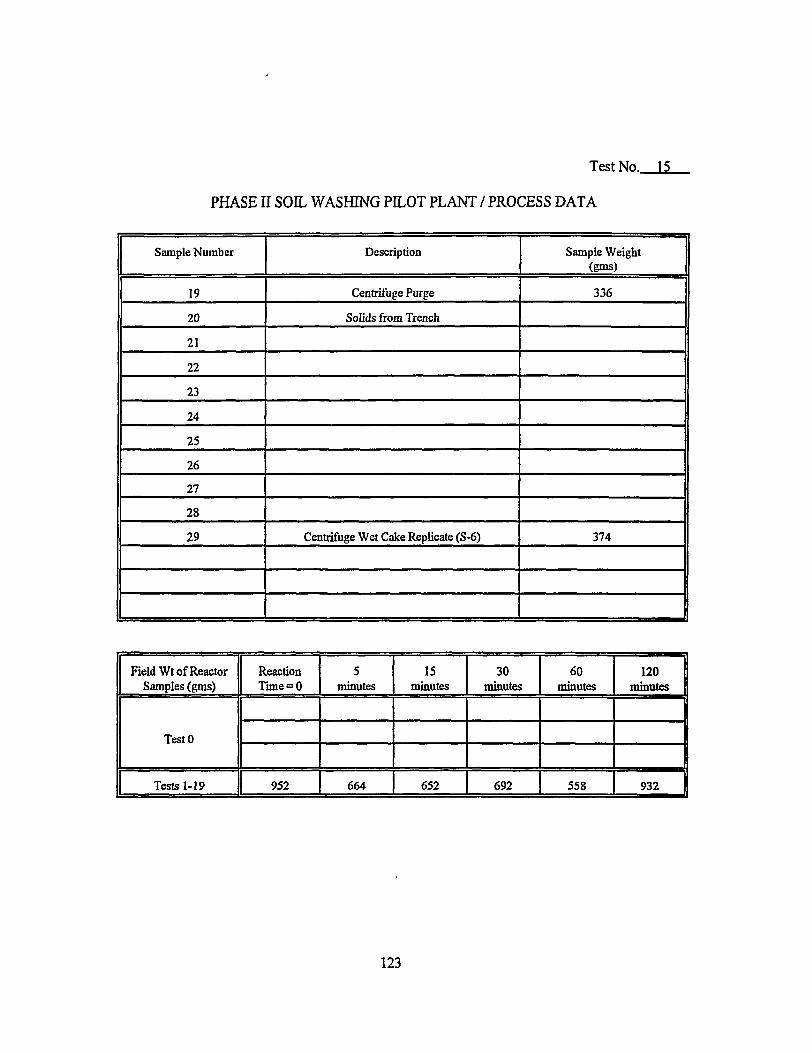
Test No. 11
PHASE II SOIL WASHING PILOT PLANT / PROCESS DATA
Sample Number Description 1 —••• a = j a
Sample Weight (gms)
19 Centrifuge Purge 336
20 Solids from Trench
21
22
23
24
25
26
27
28
29 Centrifuge Wet Cake Replicate (S-6) 374
Field Wt of Reactor Samples (gms)
Reaction Time = 0
5 minutes
15 minutes
30 minutes
60 minutes
120 minutes
TestO
I TestO TestO
Tests 1-19 952 664 652 692 558 932 J
123
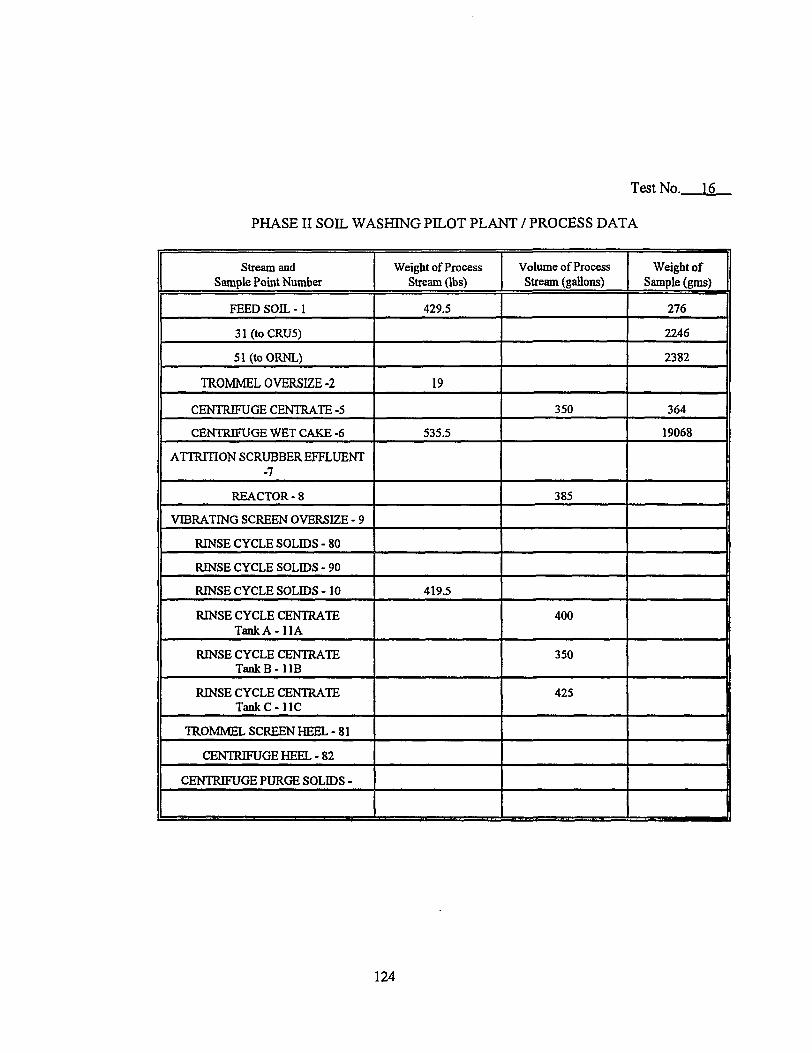
Test No.. 1£
PHASEII SOIL WASHING PILOT PLANT / PROCESS DATA
Stream and Sample Point Number
Weight of Process Stream (lbs)
Volume of Process Stream (gallons)
Weight of Sample (gms)
FEED SOIL -1 429.5 276
31(toCRU5) 2246
51 (to ORNL) 2382
TROMMEL OVERSIZE-2 19
CENTRIFUGE CENTRATE -5 350 364
CENTRIFUGE WET CAKE -6 535.5 19068
ATTRITION SCRUBBER EFFLUENT -7
REACTOR-8 385
VIBRATING SCREEN OVERSIZE - 9
RINSE CYCLE SOLIDS - 80
RINSE CYCLE SOLIDS - 90
RINSE CYCLE SOLIDS - 10 419.5
RINSE CYCLE CENTRATE TankA-llA
400
RINSE CYCLE CENTRATE TankB-llB
350
RINSE CYCLE CENTRATE Tank C-11C
425
TROMMEL SCREEN HEEL - 81
CENTRIFUGE HEEL - 82
CENTRIFUGE PURGE SOLIDS - l
124
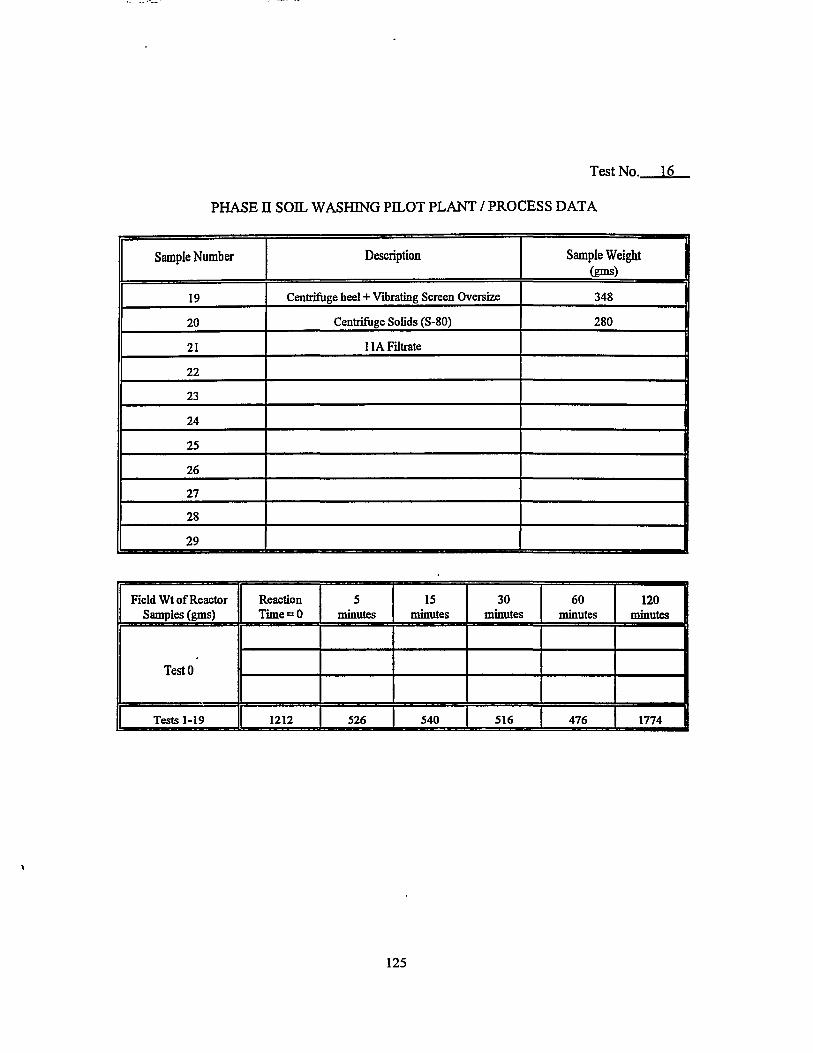
Test No. 16
PHASE H SOIL WASHING PILOT PLANT / PROCESS DATA
Sample Number Description Sample Weight (gms) |
19 Centrifuge heel + Vibrating Screen Oversize 348
20 Centrifuge Solids (S-80) 280 1
21 11A Filtrate
22
23
24
25
26
27
28
29
Field Wt of Reactor Samples (gms)
Reaction Time = 0
5 minutes
15 minutes
30 minutes
60 minutes
120 I minutes |
TestO TestO TestO
Tests 1-19 1212 526 540 516 476 1774 |
125
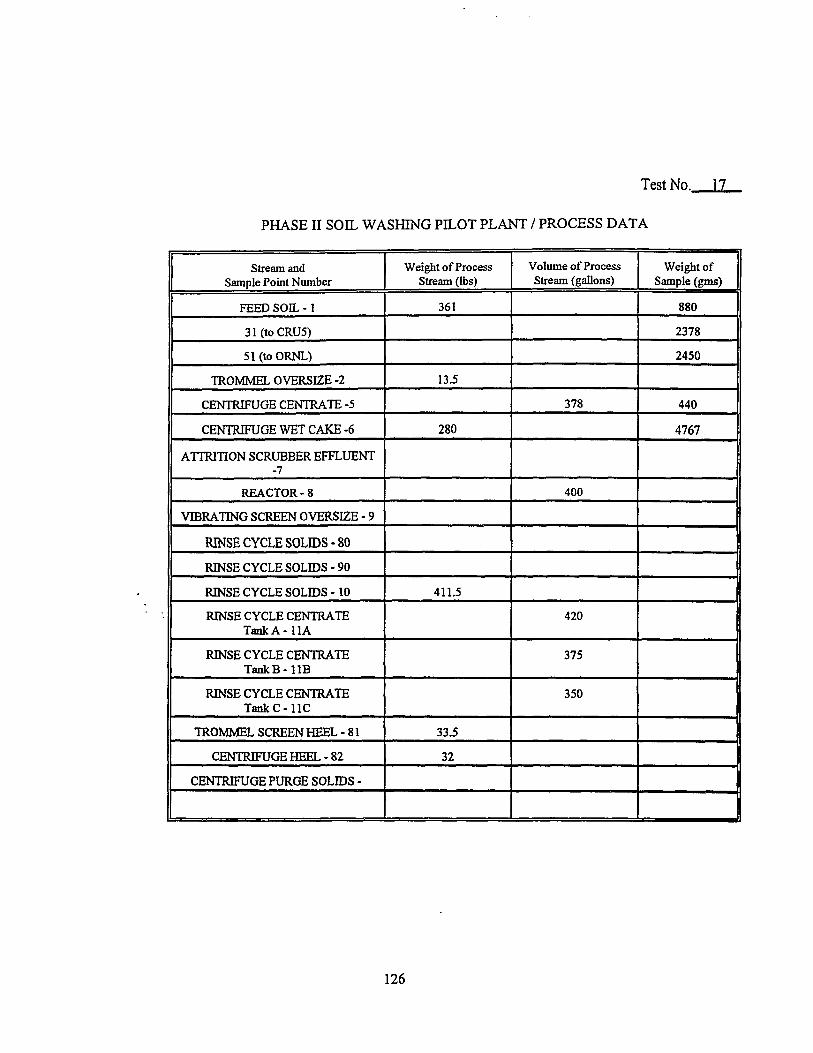
Test No. 17
PHASE II SOIL WASHING PILOT PLANT / PROCESS DATA
Stream and Sample Point Number
Weight of Process Stream (lbs)
Volume of Process Stream (gallons)
Weight of Sample (gms)
FEED SOIL - 1 361 880
31(toCRU5) 2378
51(toORNL) 2450
TROMMEL OVERSIZE -2 13.5
CENTRIFUGE CENTRATE -5 378 440
CENTRIFUGE WET CAKE -6 280 4767
ATTRITION SCRUBBER EFFLUENT -7
REACTOR-8 400
VIBRATING SCREEN OVERSIZE - 9
RINSE CYCLE SOLIDS-80
RINSE CYCLE SOLIDS - 90
RINSE CYCLE SOLIDS - 10 411.5
RINSE CYCLE CENTRATE TankA-llA
420
RINSE CYCLE CENTRATE TankB-llB
375
RINSE CYCLE CENTRATE Tank C-11C
350
TROMMEL SCREEN HEEL - 81 33.5
CENTRIFUGE HEEL - 82 32
CENTRIFUGE PURGE SOLIDS -
126
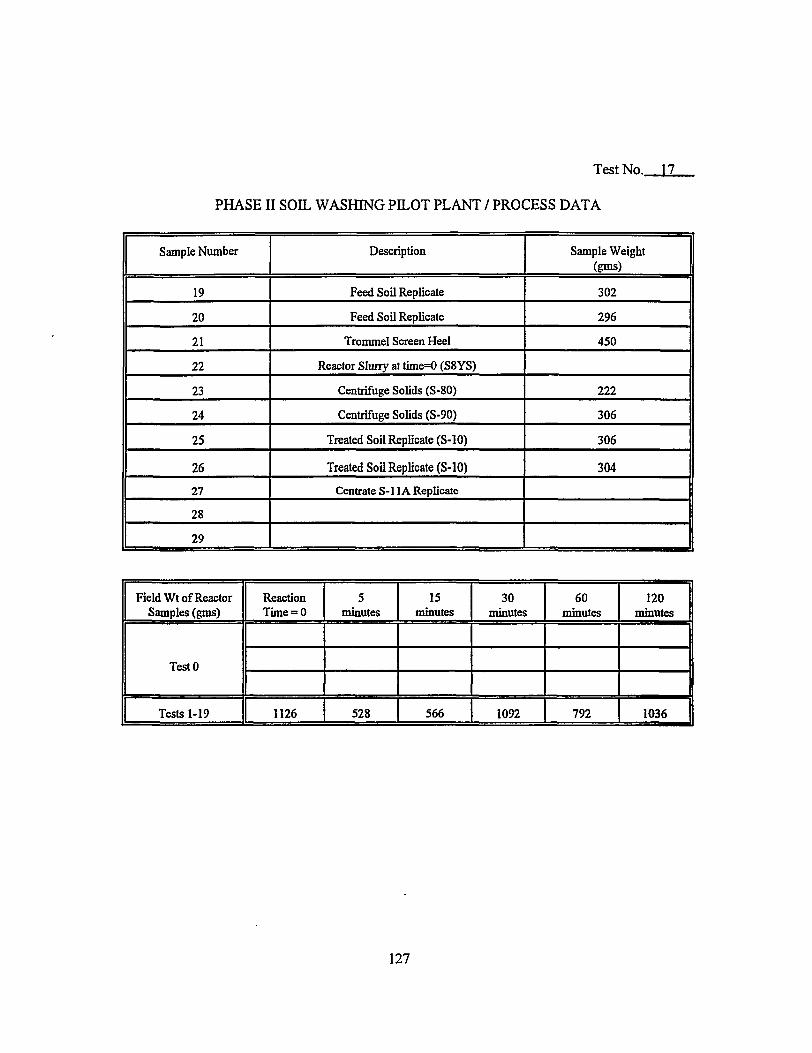
Test No.. 11
PHASE II SOIL WASHING PILOT PLANT / PROCESS DATA
Sample Number Description Sample Weight (gms)
19 Feed Soil Replicate 302
20 Feed Soil Replicate 296
21 Trommel Screen Heel 450
22 Reactor Slurry at time=0 (S8YS)
23 Centrifuge Solids (S-80) 222
24 Centrifuge Solids (S-90) 306
25 Treated Soil Replicate (S-10) 306
26 Treated Soil Replicate (S-10) 304
27 Centrate S-l 1A Replicate
28
29
Field Wt of Reactor Samples (gms)
Reaction Time = 0
5 minutes
15 minutes
30 minutes
60 minutes
120 minutes
TestO TestO TestO
Tests 1-19 1126 528 566 1092 792 1036 f
127
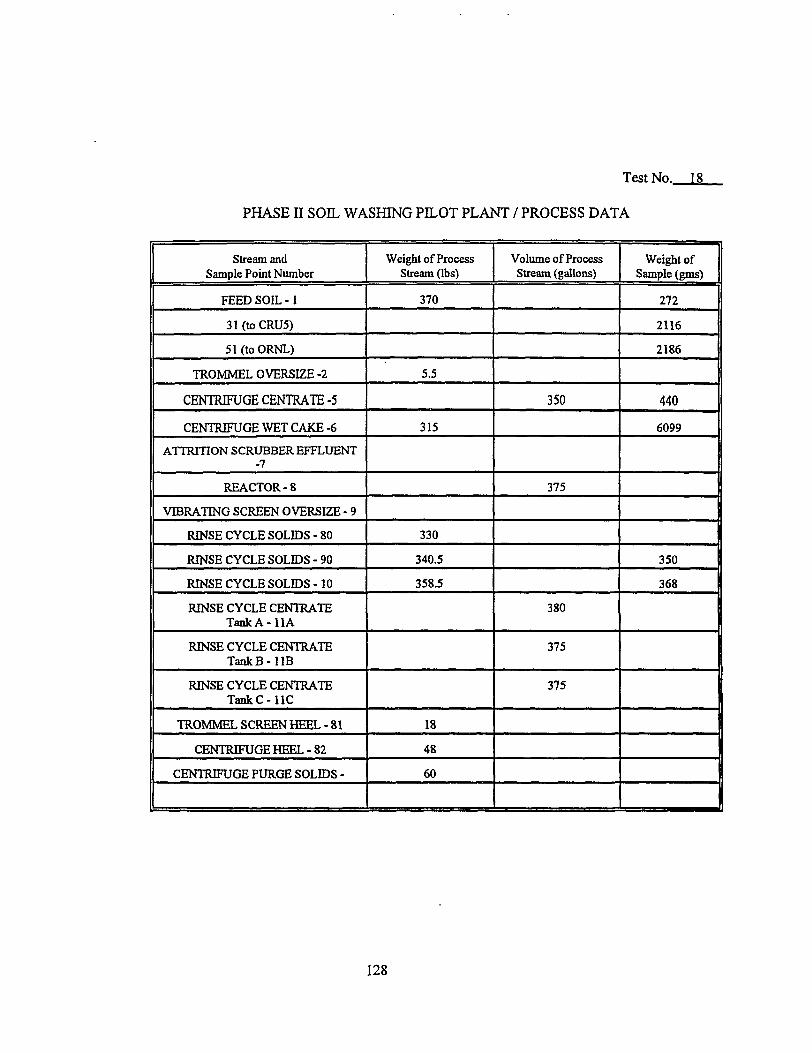
Test No. 18
PHASE II SOIL WASHING PILOT PLANT / PROCESS DATA
Stream and Sample Point Number
Weight of Process Stream (lbs)
Volume of Process Stream (gallons)
Weight of Sample (gms)
FEED SOIL -1 370 272
31(toCRU5) 2116
51(toORNL) 2186
TROMMEL OVERSIZE -2 5.5
CENTRIFUGE CENTRATE -5 350 440
CENTRIFUGE WET CAKE -6 315 6099
ATTRITION SCRUBBER EFFLUENT -7
REACTOR-8 375
VIBRATING SCREEN OVERSIZE - 9
RINSE CYCLE SOLIDS - 80 330
RINSE CYCLE SOLIDS - 90 340.5 350
RINSE CYCLE SOLIDS - 10 358.5 368 |
RINSE CYCLE CENTRATE T a n k A - l l A
380
RINSE CYCLE CENTRATE TankB- l lB
375
RINSE CYCLE CENTRATE Tank C-11C
375
TROMMEL SCREEN HEEL - 81 18
CENTRIFUGE HEEL - 82 48
CENTRIFUGE PURGE SOLIDS - 60
128
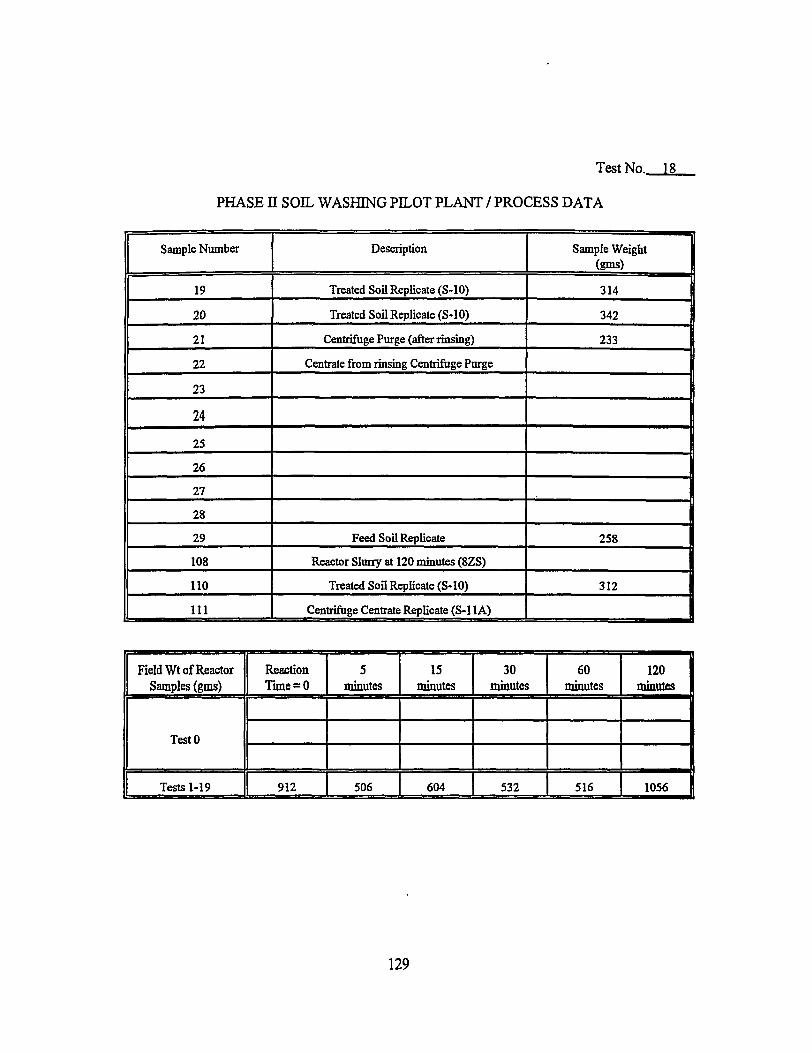
Test No. ]8_
PHASE H SOIL WASHING PILOT PLANT / PROCESS DATA
Sample Number Description Sample Weight (gms) |
19 Treated Soil Replicate (S-10) 314
20 Treated Soil Replicate (S-10) 342 1
21 Centrifuge Purge (after rinsing) 233 i
22 Centrate from rinsing Centrifuge Purge
23
24 25
26
27
28
29 Feed Soil Replicate 258 1
108 Reactor Slurry at 120 minutes (8ZS)
110 Treated Soil Replicate (S-10) 312 1
111 Centrifuge Centrate Replicate (S-l 1A)
Field Wt of Reactor Samples (gms)
TestO
Tests 1-19
Reaction Time = 0
912
5 minutes
506
15 minutes
604
30 minutes
532
60 minutes
516
120 minutes
1056
129
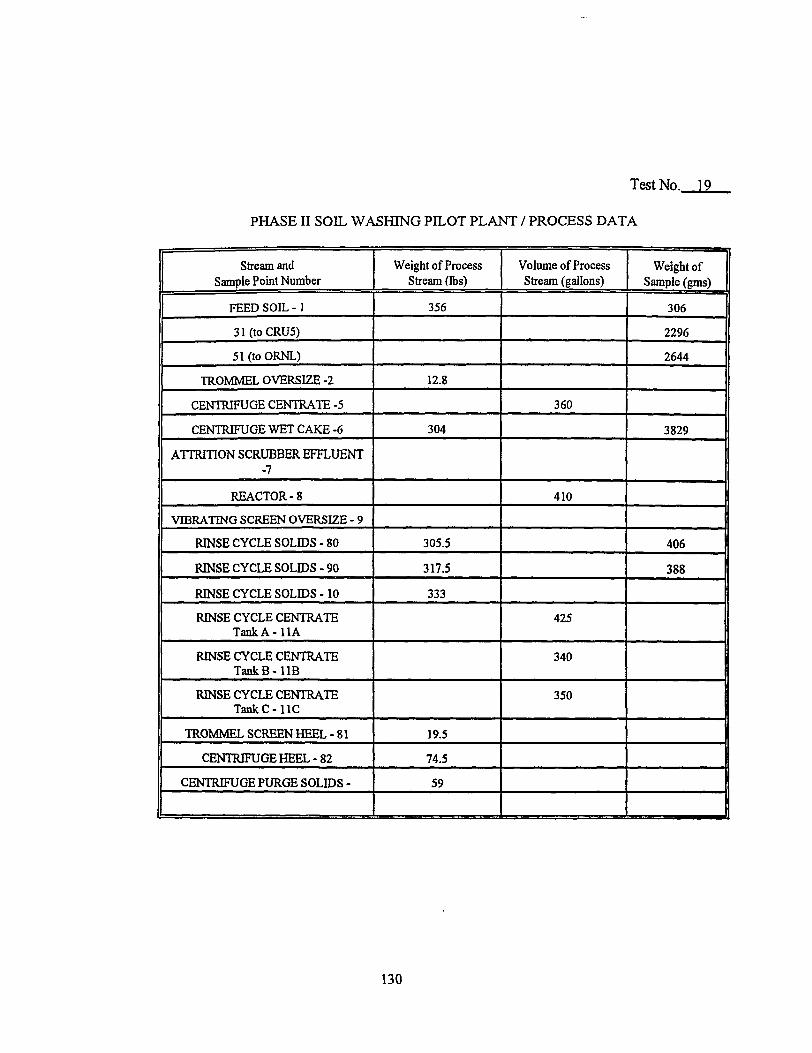
Test No. 19
PHASE II SOIL WASHING PILOT PLANT / PROCESS DATA
Stream and Sample Point Number
Weight of Process Stream (lbs)
Volume of Process Stream (gallons)
— = ^ ^ ^ n c Weight of
Sample (gms)
FEED SOIL - 1 356 306
31(toCRU5) 2296
51(toORNL) 2644
TROMMEL OVERSIZE -2 12.8
CENTRIFUGE CENTRATE -5 360
CENTRIFUGE WET CAKE -6 304 3829
ATTRITION SCRUBBER EFFLUENT -7
REACTOR-8 410
VIBRATING SCREEN OVERSIZE - 9
RINSE CYCLE SOLIDS - 80 305.5 406
RINSE CYCLE SOLIDS - 90 317.5 388
RINSE CYCLE SOLIDS -10 333
RINSE CYCLE CENTRATE TankA-llA
425
RINSE CYCLE CENTRATE TankB-llB
340
RINSE CYCLE CENTRATE Tank C-11C
350
TROMMEL SCREEN HEEL - 81 19.5 |
CENTRIFUGE HEEL - 82 74.5 1 CENTRIFUGE PURGE SOLIDS - 59 I 1
130
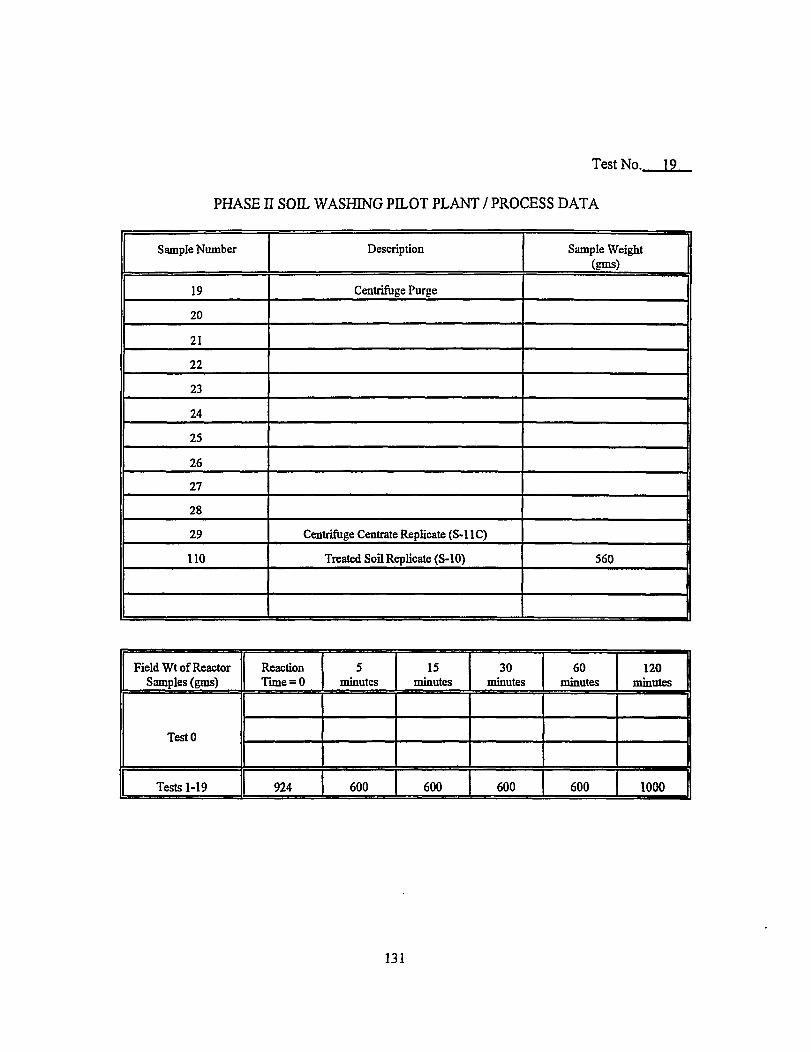
Test No. 19
PHASE II SOIL WASHING PILOT PLANT / PROCESS DATA
Sample Number Description Sample Weight (gms)
19 Centrifuge Purge
20
21
22
23
24
25
26
27
28
29 Centrifuge Centrate Replicate (S-11C)
110 Treated Soil Replicate (S-10) 560 |
1 Field Wt of Reactor
Samples (gms) Reaction Time = 0
5 minutes
15 minutes
30 minutes
60 minutes
120 [ minutes f
TestO TestO TestO 1 Tests 1-19 924 600 600 600 600 1000
131
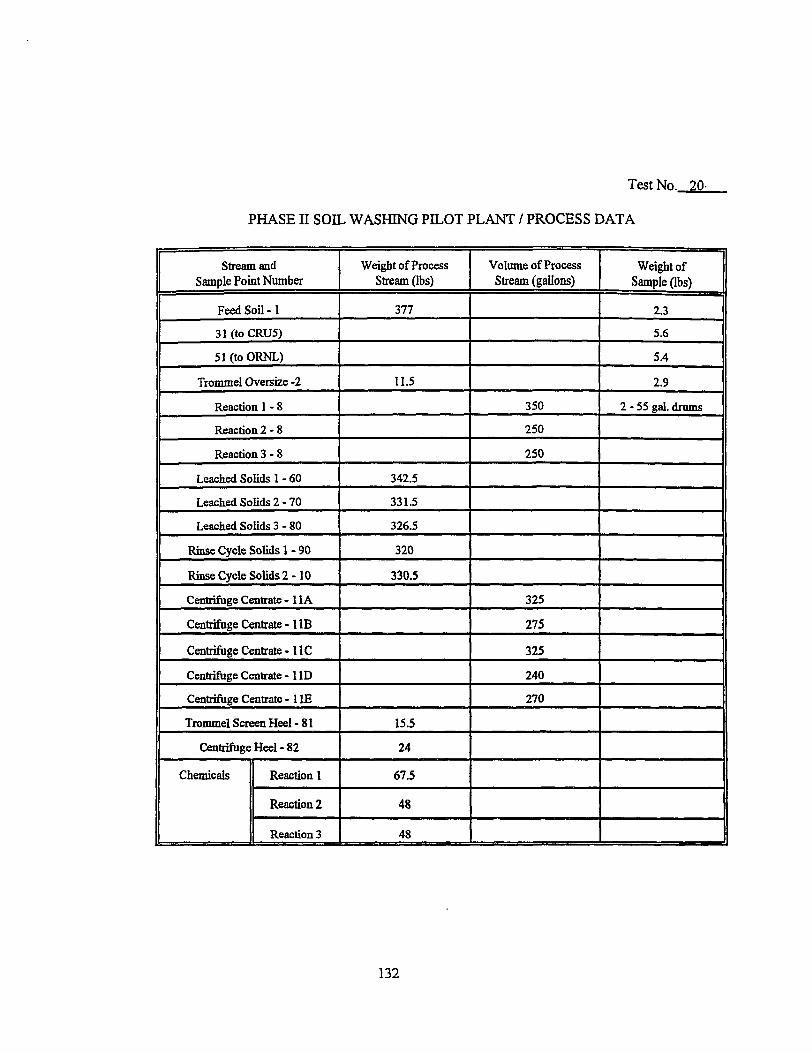
Test No. 20-
PHASE II SOIL WASHING PILOT PLANT / PROCESS DATA
Stream and Sample Point Number
Weight of Pro cess Stream (lbs)
Volume of Process Stream (gallons)
Weight of Sample (lbs)
Feed Soil -1 377 2.3
31(toCRU5) 5.6
51(toORNL) 5.4
Trommel Oversize -2 11.5 2.9
Reaction 1-8 350 2-55 gal. drums
Reaction 2 -8 250
Reaction 3-8 250
Leached Solids 1-60 342.5
Leached Solids 2-70 331.5
Leached Solids 3-80 326.5
Rinse Cycle Solids 1 - 90 320
Rinse Cycle Solids 2 -10 330.5
Centrifuge Centrate - 11A 325
Centrifuge Centrate - 11B 275
Centrifuge Centrate -11C 325
Centrifuge Centrate - 1 ID 240
Centrifuge Centrate -HE 270
Trommel Screen Heel - 81 15.5
Centrifuge Heel-82 24
Chemicals Reaction 1 67.5 Chemicals
Reaction 2 48
Chemicals
Reaction 3 48
132
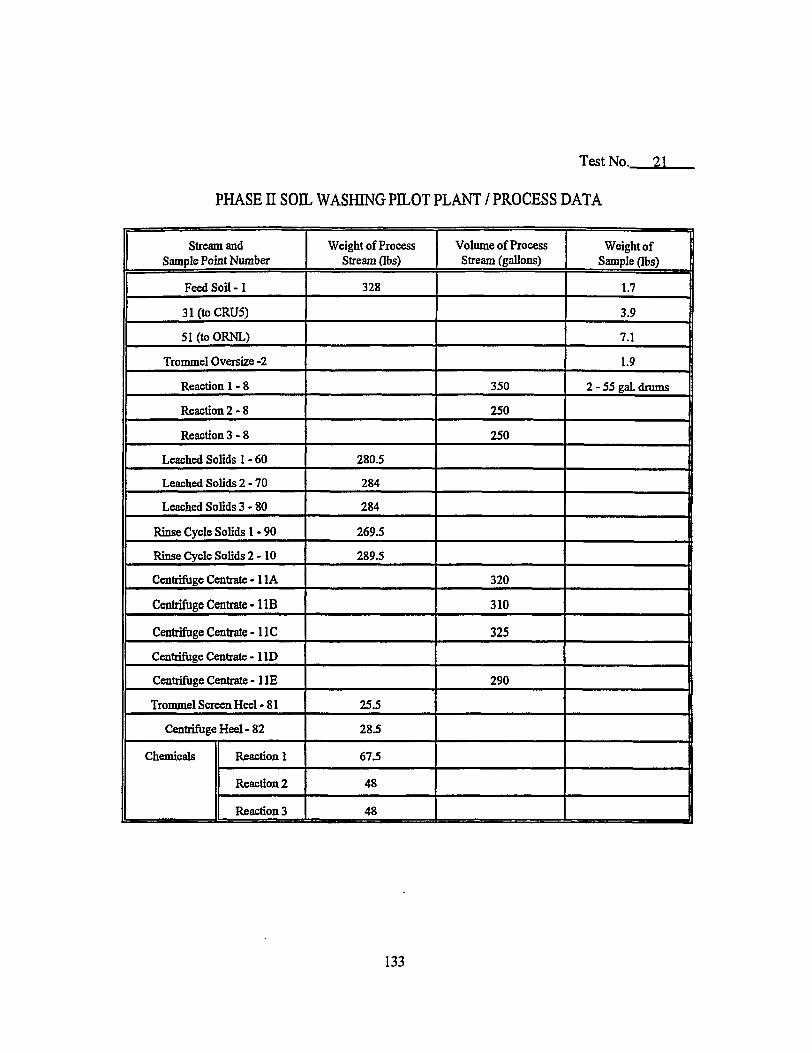
Test No. 21
PHASE II SOIL WASHING PILOT PLANT / PROCESS DATA
Stream and Sample Point Number
Weight of Pro cess Stream (lbs)
Volume of Process Stream (gallons)
Weight of Sample (lbs)
Feed Soil -1 328 1.7
31 (to CRU5) 3.9
51 (to ORNL) 7.1
Trommel Oversize -2 1.9
Reaction 1-8 350 2-55 gal. drums
Reaction2-8 250
Reaction 3 - 8 250
Leached Solids 1 - 60 280.5
Leached Solids 2 - 7 0 284
Leached Solids 3 - 8 0 284 I Rinse Cycle Solids 1-90 269.5 I Rinse Cycle Solids 2 - 1 0 289.5 |
Centrifuge Centrate -11A 320 |
Centrifuge Centrate -1 IB 310 I Centrifuge Centrate - 11C 325
Centrifuge Centrate - 1 ID |
Centrifuge Centrate - HE 290 |
Trommel Screen Heel - 81 25.5 |
Centrifuge Heel-82 28.5
Chemicals Reaction 1 67.5 Chemicals
Reaction 2 48
Chemicals
Reaction 3 48 1
133
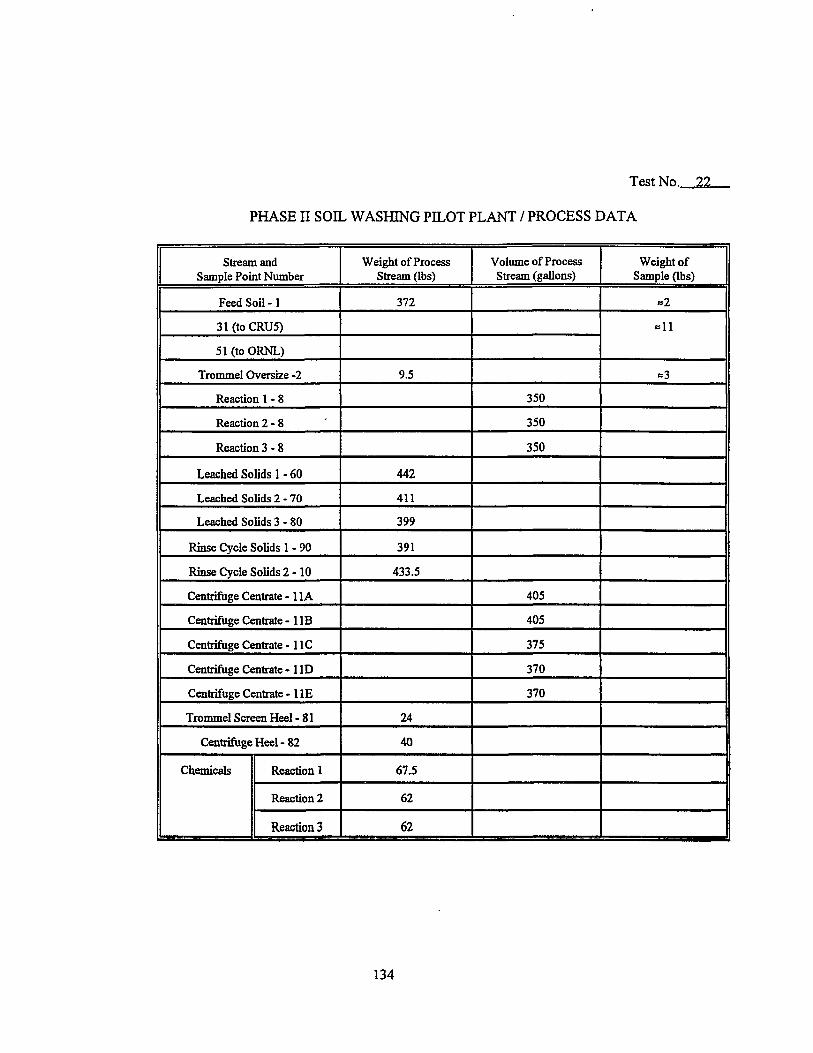
Test No. 21
PHASE II SOIL WASHING PILOT PLANT / PROCESS DATA
Stream and Sample Point Number
Weight of Process Stream (lbs)
Volume of Process Stream (gallons)
Weight of Sample (lbs)
Feed Soil - 1 372 «=2
31(toCRU5) «11
51 (to ORNL)
«11
Trommel Oversize -2 9.5 «3
Reaction 1-8 350
Reaction 2 - 8 350
Reaction 3 - 8 350
Leached Solids 1 - 60 442
Leached Solids 2 - 70 411
Leached Solids 3 - 80 399
Rinse Cycle Solids 1 - 90 391
Rinse Cycle Solids 2 - 1 0 433.5
Centrifuge Centrate - 11A 405
Centrifuge Centrate - 118 405
Centrifuge Centrate -11C 375
Centrifuge Centrate - 1 ID 370
Centrifuge Centrate - H E 370
Trommel Screen Heel -81 24
Centrifuge Heel-82 40
Chemicals Reaction 1 67.5 Chemicals
Reaction 2 62
Chemicals
Reaction 3 62
134
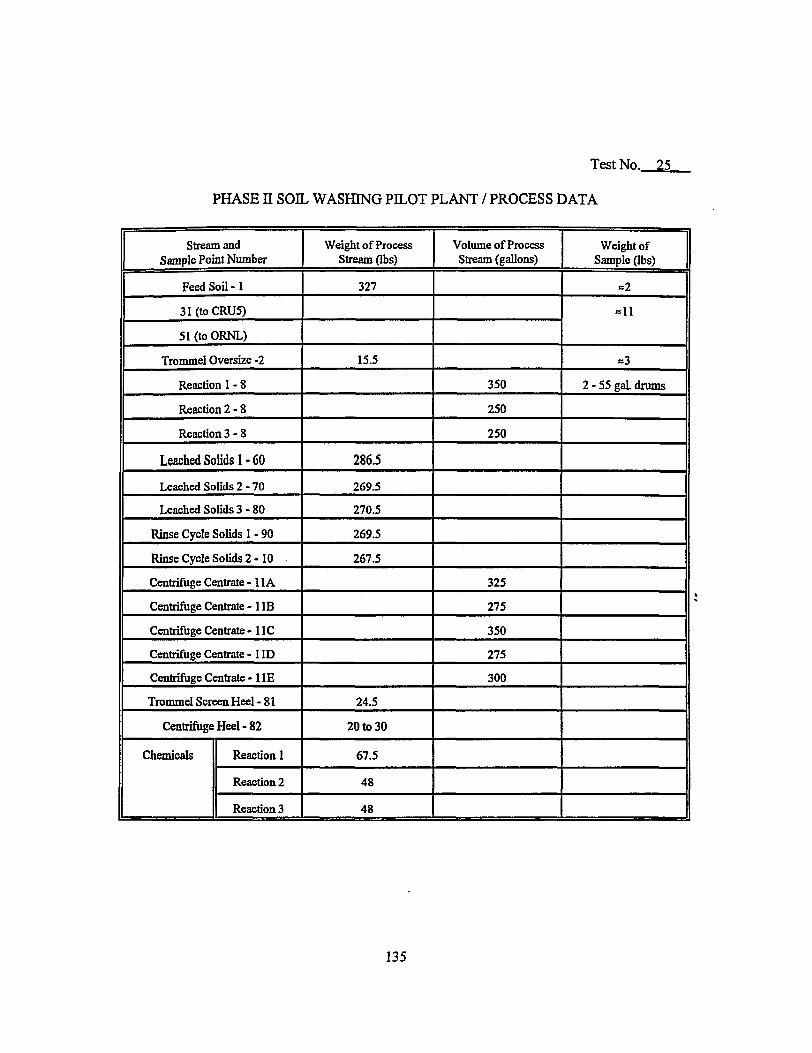
Test No. 25
PHASE n SOIL WASHING PILOT PLANT / PROCESS DATA
Stream and Sample Point Number
Weight of Process Stream (lbs)
Volume of Process Stream (gallons)
Weight of Sample (lbs)
Feed Soil - 1 327 =2
31(toCRU5) = 11
51(toORNL)
= 11
Trommel Oversize -2 15.5 =3
Reaction 1-8 350 2-55 gaL drums
Reaction 2-8 250
Reaction 3-8 250
Leached Solids 1 - 60 286.5
Leached Solids 2-70 269.5
Leached Solids 3 - 80 270.5
Rinse Cycle Solids 1 - 90 269.5
Rinse Cycle Solids 2-10 267.5
Centrifuge Centrate - 11A 325
Centrifuge Centrate -1 IB 275
Centrifuge Centrate - 11C 350
Centrifuge Centrate - 1 ID 275
Centrifuge Centrate - 1 IE 300
Trommel Screen Heel - 81 24.5
Centrifuge Heel-82 20 to 30
Chemicals Reaction 1 67.5 Chemicals
Reaction 2 48
Chemicals
Reaction 3 48
135

APPENDIX C
ANALYTICAL RESULTS

APPENDIX C
ANALYTICAL RESULTS
All of the analytical results from the Phase II tests are included in Appendix C. For each result,
the test number and the sample number are shown as part of the User Sample Identification Number.
For example, T4S830 refers to the reactor filtrate sample taken at a reaction time of 30 min in Test 4
(refer to Appendix A for a description of the sample points).
139
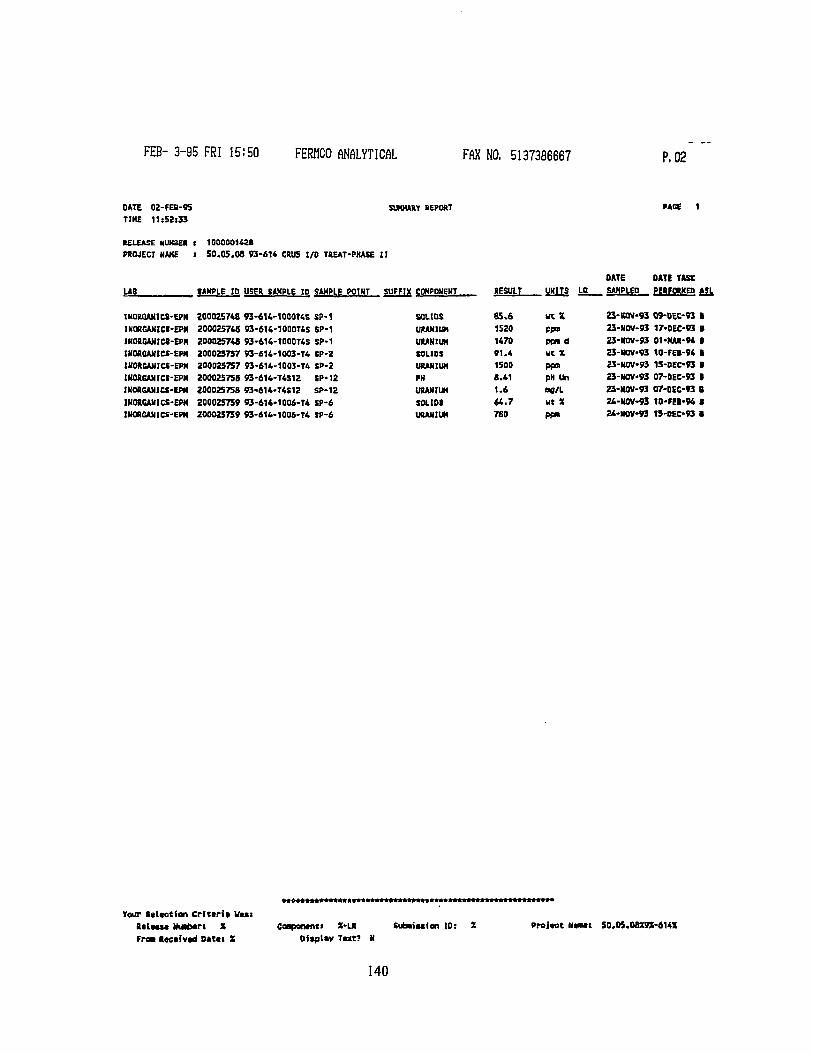
FEB- 3-95 FRI 15:50 FERHCO ANALYTICAL FAX NO. 5137386667 P. 02
DATE TIM
02-FEB-9S 11:52:33
SUMMARY REPORT PAGE 1
RELEASE HUM8ER t 1000001628 PROJECT NAME : 50.05.08 93-61* CRUS I/D TREAT-PHASE II
LAB SAMPLE ID USER SAMPLE ID SAMPLE POIHT SUFFIX COMPONENT
INOR6AHIC8-EPH 200025748 93-614-1000T4S SP-1 INORGANICS-EPM 2000257(6 93-614-1000T4S SP-1 1N0RGANICS-EPN 200025748 93-614-1000T4S SP-1 IMORGAMies-EPN 200025757 93-614-1003-T4 SP-2 IKORGANICS-EPM 200025757 93-614-1003-T4 SP-2 IHORGAHICS-EPM 200025758 93-614-T4512 SP-12 INORGANICS-EPM 200025758 93-614-T4S12 SP-12 WORCANICS-EPM 200025759 93-614-1006-T4 SP-6 INORGANICS-EPM 200025759 93-614-1006-T4 SP-6
SOLIDS URANIUM URANIUM SOLIDS URANIUM PH URANIUM SOLUS URANIUM
OATE OATl TASK
RESULT UNITS LO I , SAMPLED PERFORMED ASL
85 .6 OT X 23-KOV-93 09-DEC-93 • 1520 ppo 23-NOV-93 17-0EC-93 B 1470 ppra d 23-NOV-93 01-KAR-94 1 91.4 ut X 23-HOV-93 10-FEB-94 t 1500 PP« 23-N0V-93 1S-DEC-93 • 8.41 pH Un 23-NOV-93 O7-0EC-93 1 1.6 n«/L 23-N0V-93 07-OEC-n B 64 .7 ut X 24-HOV-93 10-FEB-94 I 780 PP" 24-N0V93 15-0EC-93 B
Tour t d t c t l e n Criteri* U u i I I I H U Nurtxri X rrcm lectivad D»t«i X
Ceapontntt X-Lfl Display T«xt?
Subaiwtcn 10: Pro j tc t Utmti 50.O5.O8X9X-614X
140
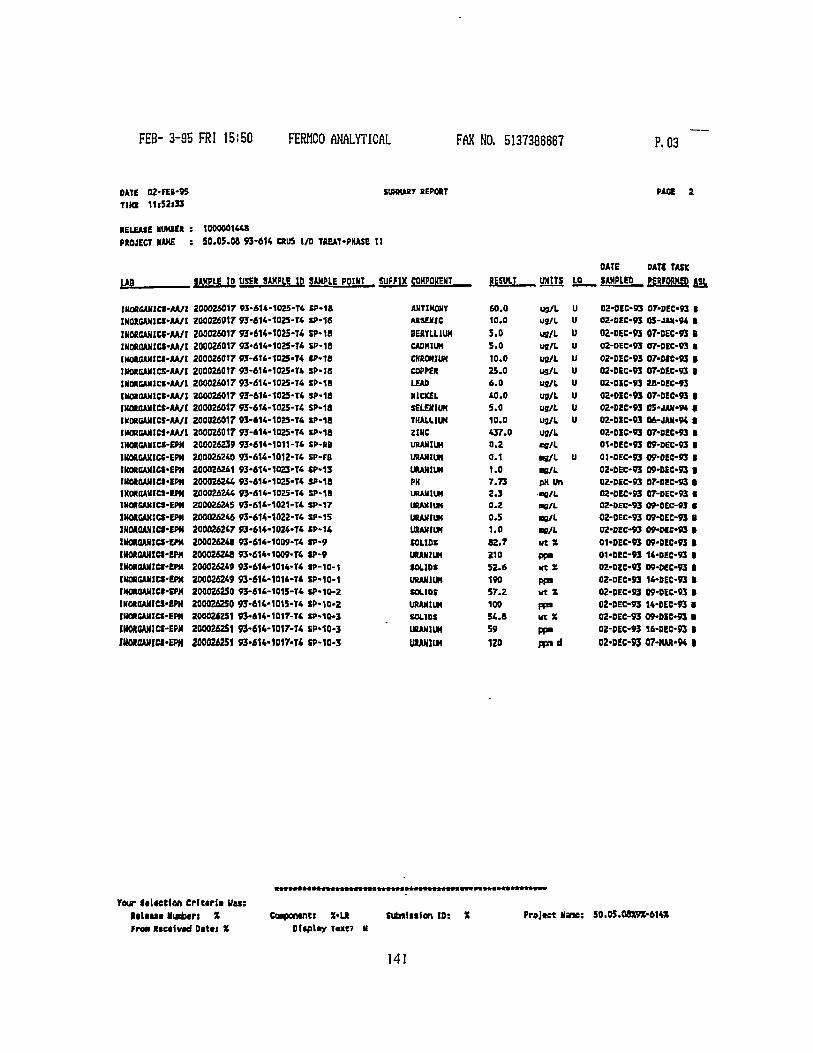
FEB- 3-95 FRI 15:50 FERHCO ANALYTICAL FAX NO. 5137386667 P. 03
DATE 02-FEB-95 SUKMART REPORT PACE 2 TIM 11|52|33
RELEASE NUMBER : 100000144B PROJECT NAME : 50.05.08 93-614 CRUS 1/0 TREAT-PHASE II
OATE DATE TASK LAB SAMPLE ID USER SAMPLE ID SAMPLE POINT SUFFIX COHPCHENT RESULT .
60.0
UJUJ1 U9/L
LO SAMPLED PERFORMED A.SJ,
ll«JRCANlCt-AA/I 200024017 93-614-1025-T4 SP-18 ANTIMONY
RESULT .
60.0
UJUJ1 U9/L U 02-0EC-93 07-DEC-93 I
IK0XSAM1CS-AA/I 200026017 93-614-1025-T4 SP-18 ARSENIC 10.0 ug/L U 02-DEC-93 05-JAN-94 1 IMMGAH1CS-AA/I Z00026017 93-614-1025-T4 SP-18 BERYLLIUM 5.0 US/L U 02-DEC-93 07-DEC-93 B IMOROAHICS-AA/I 200026017 93-614-1025-T4 JP-1B CADMIUM 5.0 ua/L U 02-DEC-93 07-DEC-93 • INOROAMICS-AA/I 200024017 93-614-102S-T4 IP-18 CHROMIUM 10.0 ua/L U 02-DEC-93 07-DK-93 • IJXKGAMICS-AA/I 200026017 93-614-1025-T4 SP-18 COPPER 25.0 ua/L U 02-DEC-93 07-DEC-93 B lNOAGAMCS-AA/l 200026017 93-614-1023-T4 SP-1B LEAD 6.0 us/L U 02-0EC-93 28-0EC-93 IHORGANICS-AA/I 200026017 93-614-1023-T4 SP-18 NICKEL 40.0 U9/L u 02-DEC-93 07-DEC-93 • INORCANtCS-AA/I 200026017 93-6H-102S-T4 SP-18 SELENIUM 5.0 ua/L u 02-0EC-93 05-JAN-P4 1 IKORGAMICS-AA/I 200026017 93-614-102S-T4 SP-1B THALLIUM 10.0 US/L u 02-DIC-B3 06-JAN-94 8 IWRGANICS-AA/1 200026017 93-614-1025-T4 SP-1B ZINC 437.0 ug/L 02-DEC-93 07-DEC-93 B IHORGANICS-EPN 200026239 93-614-1011-T4 SP-RB URANIUM 0.2 ag/L 01-DEC-93 09-DEC-93 8 IKORGANICS-EPH 200026240 93-614-1012-T4 SP-FB URANIUM 0.1 H3/L u 01-DEC-93 09-DEC-93 8 IKORCANICS-EPH 200026241 93-614-1023-T4 SP-13 URANIUM 1.0 •B/L 02-DEC-93 09-DEC-93 8 INORGAHICI-EPH 200026244 93-614-1025-T4 5P-18 PH 7.73 pH Un 02-DEC-B3 07-0EC-93 8 INOROANICS-IPM 200026244 93-614-1025-T4 SP-1B URANIUM 2.3 •g/L 02-DEC-93 07-0EC-93 8 IH0RGANIC3-EPH 200026245 93-614-1021-T4 SP-17 URANIUM 0.2 ne/L 02-OEC-93 09-0EC-93 I IHORGANICS-EPN 200026246 93-614-1022-T4 SP-1S URANIUM 0.5 no/L 02-DEC-93 09-BEC-93 8 INORQAN1CI-EPH 200026247 93-614-1024-T4 SP-14 URANIUM 1.0 ag/L 02-DEC-93 09-M C-93 8 IHORDANieS-EPH 200026241 93-614-1009-T4 SP-9 SOLIDS 82.7 wt X 01-DEC-93 09-DEC-93 8 IMOftGAHICS-EPM 200026248 93-614-1009-T4 tP-9 URANIUM 210 PP" 01-DEC-93 14-DEC-93 8 IKOAOAMICS-EPM 200026249 93-614-1014-T4 tP-10-1 SOLIDS 52.6 Kt Z 02-0EC-93 09-DEC-93 8 IKORGANICS-EPH 200026249 93-614-10K-T4 SP-10-1 URANIUM 190 PP" 02-DEC-93 14-DEC-93 8 INOMANICI-EPM 200026250 93-614-1015-T4 SP-10-2 SOUOS 57.2 ut X 02-DEC-93 09-DEC-93 8 IHOROANICS-EPH 200026250 93-614-1015-T4 SP-10-2 URANIUM 100 PP" 02-DEC-93 14-DEC-93 8 IUORSANICS-EPH 20002(251 93-614-1017-T4 SP-10-3 SOLIDS 54.8 ut X 02-DEC-93 09-DIC-93 8 IKORGAM1CS-EPM 200026251 93-614-1017-T4 SP-10-3 URANIUM 59 PP" 02-DEC-93 16-DEC-93 8 INOMANICI-EPM 200026251 93-614-1017-T4 SP-10-3 URANIUM 120 ppid 02-DEC-W 07-MAR-94 1
Your fsltetton Crlurii Was: Rsltua Umbtri X from Ricalvad D»Ui X
COMpOMntt X-LR Display Text?
Submission ID: Project Nane: 50.05.08X9X-614X
141
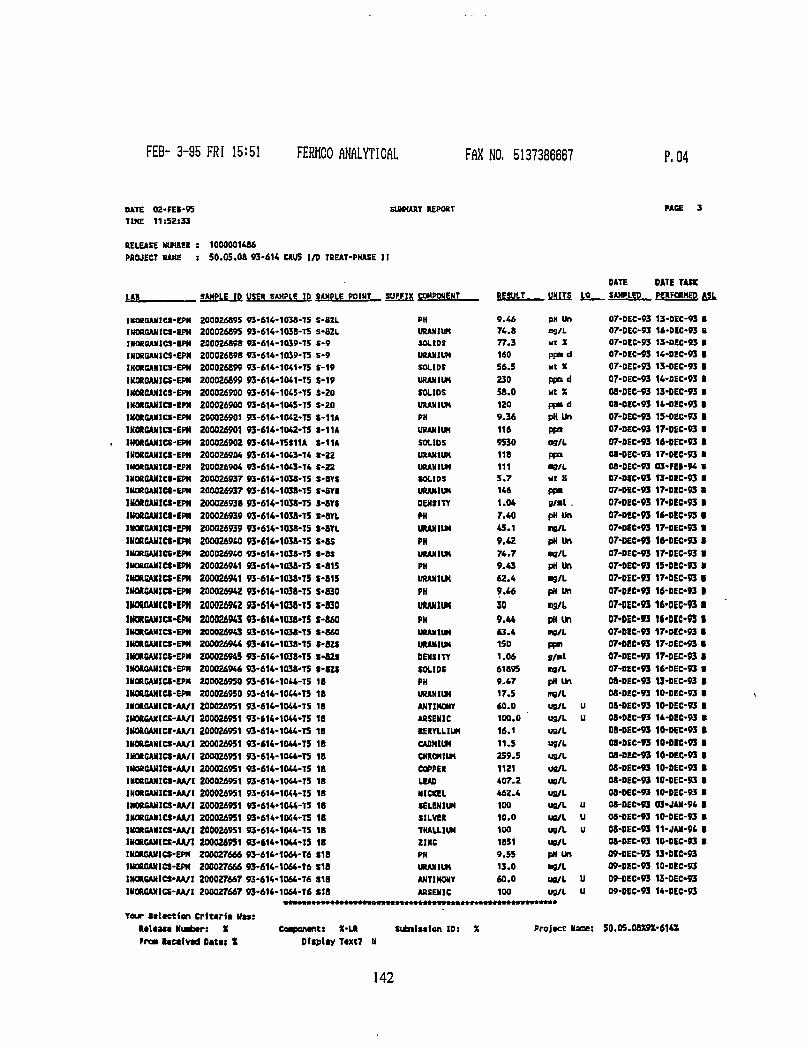
FEB- 3-95 FRI 15:51 FERHCO ANALYTICAL FAX NO. 5137386667 P. 04
OATE TIKE
02-FEI-9S 11:52:33
SUMMARY REPORT
RELEASE NUMBER : 1000001486 PROJECT NAME : 5 0 . 0 5 . 0 8 93-614 CRU5 I/O TREAT-PHASE II
DATE OATE TASK LAB SAMPLE 10 USER SAMPLE ID SAMPLE POINT SUFFIX COMPONENT RESULT UNITS 10
9.46 pH Un
SAMPLED PERFORMED ASL
IHOROANICI-EPH 200026895 93-614-1038-75 S-8ZL PH
RESULT UNITS 10
9.46 pH Un 07-0EC-93 13-DEC-93 B IHORGANICS-EPH 200026895 93-614-1038-TS S-8ZL URANIUM 74.8 n9/L 07-DEC-9I 16-DEC-93 B INORBANICS-IPM 200026898 93-6U-1039-T5 S-9 SOLIDS 77.3 wt X 07-OEC-93 13-DEC-93 I INORGANICS-EPN 200026898 93-614-1039-T5 S-9 URANIUM 160 ppn d 07-DEC-93 14-DEC-93 B INORGANICS-EPM 200026899 93-614-1041-TS S-19 SOLIDS 56.5 wt X 07-DEC-93 13-0EC-93 B IHORGAHICS-EPM 200026899 93-614-1041-T5 S-19 URANIUM 230 ppn d 07-DEC-93 14-0EC-93 B 1NOROAMICS-EPM 200026900 93-614-1045-T5 S-20 SOLIDS 58.0 Mt X 08-DEC-93 13-0EC-93 B INORGAHICS-eP* 200026900 93-614-104S-T5 S-20 URANIUM 120 ppod 08-0EC-93 14-DEC-93 B INORCAN1CS-EPH 200026901 93-614-1042-T5 S-11A PH 9.36 pH Un 07-DEC-93 15-OEC-93 B INGRGAHICS-EPH 200026901 93-614-1042-T5 f-IIA URANIUM 116 PPO 07-DEC-93 17-DEC-93 B WOAGAHICS-EPM 200026902 93-614-T5S11A S-11A SOLIOS 9530 09/L 07-DEC-93 16-0EC-93 B IHORGAHICS-EPH 200026904 93-614-1043-T4 S-22 URANIUM 118 PP» 08-0EC-93 17-0EC-93 B IMOROAMICS-EPM 200026904 93-614-1043-T4 S-22 URANIUM 111 •g/L 08-DEC-93 03-FEB-94 • INORGAMICt-EPM 200026937 93-614-1038-T5 S-8YC SOLIDS 5.7 wt X 07-010-93 13-DEC-93 B INORGANICS-EPM 200026937 93-614-1038-T5 S-SYS URANIUM 146 PP« 07-0EC-93 17-DIC-93 B HHKOAHICS-EPM 200026938 93-614-1038-TS S-8YS OEHSITY 1.04 B/al . 07-DEC-93 17-0K-93 B IHOBCANlCS-EPN 200026939 93-614-10SB-TS S-BYL PH 7.40 pH Un 07-DEC-93 16-DIC-93 • INORGAHICI-EPM 200026939 93-614-1038-15 S-BYL URANIUM 45.1 ro/L 07-DEC-93 17-DEC-93 B lNORSAHICS-If* 200026940 93-614-10M-T5 S-8S PH 9.42 pH Un 07-DEC-93 16-DEC-93 B INORQAHICS-EPM 200026940 93-614-1038-TS S-8S URANIUM 74.7 IKI/L 07-DEC-93 17-DEC-93 B IMORCAHICS-EPH 200026941 93-614-1038-TS S-815 PM 9.43 pH un 07-DEC-93 15-DEC-93 B IHORGANICS-EPH 200026941 93-614-1038-T5 S-815 URANIUM 62.4 •S/L 07-DEC-93 17-DEC-93 I IHOmSAHICt-EPM 200026942 93-614-1038-T5 S-830 PK 9.46 pH un 07-0EC-93 16-DEC-93 B HUROAMtCI'lFK 200026942 93-614-1038-TJ 1-830 URANIUM 30 BS/t 07-0EC-93 16-DEC-93 1 IMOKSANICS-EPM 200026MJ 93-6U-1038-T5 S-860 PH 9.44 pH Un 07-0EC-93 lt-DIC-93 1 INORCANICS-EPM 2000Z6943 93-614-1038-TS S-860 URANIUM 63.4 no/L 07-BIC-93 17-MC-93 B IKOROAHICS-EPM 200026944 93-614-103S-T5 S-BZS URANIUM 150 pen 07-DEC-93 17-DEC-93 B IMORCAKICS-EPM 200026945 93-614-1038-T5 S-BZS DENSITY 1.06 S/Bl 07-0EC-93 17-0EC-93 1 MORGANICS-EPM 200026946 93-614-1038-T5 S-BZS SOLIDS 61895 D9/L 07-DEC-93 16-DEC-93 B IN0R6AMICS-EM 200026950 93-614-1044-T5 IB PK 9.47 pH Un 08-OEC-93 U-DEC-93 B INOOGAHICS-EPN 200026950 93-614-1044-T5 18 URANIUM 17.5 mo/L 08-0EC-93 1Q-DEC-93 B INOROAIIICt-AA/I 200026951 93-614-1044-T5 18 ANTIMONY 60.0 US/L U 08-BEC-93 10-DEC-93 B IUOROUIICS-AA/I 200026951 93-614-1044-T5 18 ARSENIC 100.0 ug/L U 08-DEC-93 14-DEC-93 B INOROAN1CI-AA/I 200026951 93-614-1044-TS 18 BERYLLIUM 16.1 us/L 08-DEC-93 10-DEC-93 B IKORSANICS-AA/I 200026951 93-614-1044-T5 18 CADMIUM 11.5 U9/L 0S-DEC-93 10-DIC-93 B INORGANICS-AA/i 200026951 93-614-1044-TS IB CHROMIUM 259.5 ug/L OS-DEC-93 10-DEC-93 B INORCAHICt-AA/I 200026951 93-614-1044-T5 18 COPPER 1121 US/l 08-CEC-93 10-DEC-93 B IRORGANICS-AA/I 200026951 93-614-1044-T5 18 LEAD 407.2 us/L 08-DEC-93 10-0EC-93 B INORSANICS-AA/I 200026951 93-614-1044-T5 IB NICKEL 462.4 us/L 08-DEC-93 10-0EC-93 B INORGAJUCS-AA/I 200026951 93-614-1044-T5 18 SELENIUM 100 ug/L U 08-DEC-93 03-JAN-94 B WORGAR1CS-AA/I 200026951 93-614-1044-TS 18 SILVER 10.0 us/L U 08-0EC-93 10-DEC-93 B IKORBANICS-AA/I 200026951 93-614-1044-T5 18 THALLIUM 100 ugA. U 08-DEC-93 11-JAN-94 B IHORGANtCS-AA/I 200026951 93-614-1044-T5 18 ZIKC 1851 US/L 08-DEC-93 10-DEC-93 B IKORGANICS-EPN 200027666 93-614-1064-T6 S18 PH 9.55 PN Un 09-CEC-93 13-DIC-93 1UORBAHIC3-EPN 200027666 93-614-1064-T6 S18 URANIUM 13.0 •B/L 09-OEC-93 10-DEC-93 lNORGAMlCS-AA/I 200027667 93-614-1064-T6 S18 ANTIMONY 60.0 UO/L U 09-0EC-93 13-DEC-93 INORGAHlCS-JU/1 200027667 93-614-1064-T6 S18 ARSENIC 100 ug/L u 09-DEC-93 14-DEC-93
IIIIIMWIIHIM* Tour salactfen Criteria Was:
Rtliua Nuabar: X Coapanant: %-LR Subniaaicn ID: 1 Projtcc Name: S0.05.08X9X-614X Fro* Raealvad Ditti X Display T«xt? U
142
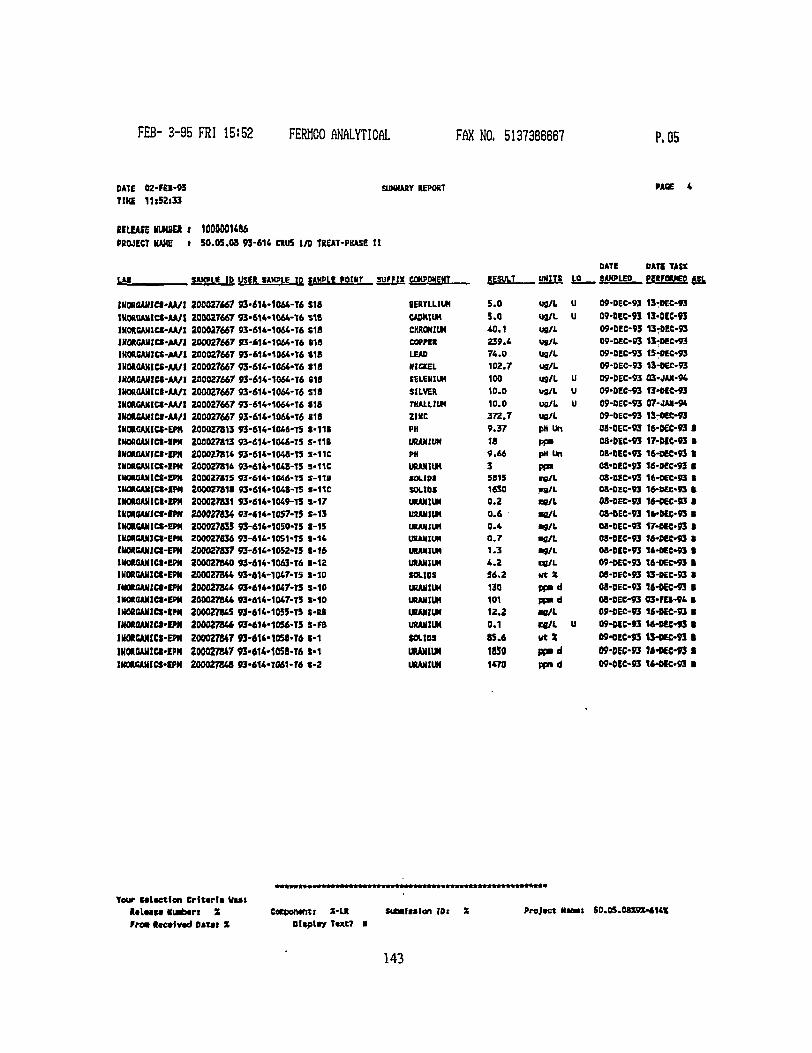
FEB- 3-95 FRI 15:52 FERHCO ANALYTICAL FAX NO. 5137386667 P. 05
DATE TIKE
02-FES-95 11«52»33
SUHHARY REPORT PAGE 4
RELEASE NlMSEJt ! 1000001*86 PROJECT MAKE i 5 0 . 0 5 . 0 8 9 3 - 6 1 6 CMS I/O TREAT-PHASE t l
SAXPl* ID USER (AMPLE IP SAMPLE POINT SUFflX COMPONENT
IKORfiAUICf'AA/I INORGAMlCS-AA/l IKORGAUlCt-AA/I IHORSANICS-AA/I IHORCANICS-AA/l IHORGANICS-AA/I INMSANICS-M/I IHOROAMICS-AA/I INORGAMICS-AA/I IHORSANICS-JU/I 1M0RCAMICS-EPH W0RCANIC8-IPM INORaANICt-EPH INORfiAHICS-EPM INORGANICt-EPH INORGANICS-IP* HOROANICS-EPH tKOROANICS-fPH IHORCAMICS-EPM IKORGANICS-EPH (UORSANICS-EPM INORGANICS-EPM INORGAUICS-EPH INORSANICt-IPH IMOtOAMiet-EPH INORGANICS-IP* IMOMUNICt'IHI IHORCMHCS-EFM IHOROAUICI-EFM
iwnauites-tPM
200027467 93-200027667 93-200027667 93' 200027667 93' 200027667 93-200027667 93-200027667 93' 200027667 93' 200027667 93-200027667 93-200027813 93-200027813 93-200027814 93-200027814 93-200027815 93-200027811 93' 200027831 93-200027834 93-200027635 93-200027836 93-200027837 93-200027840 93-200027844 93-200027864 93-200027844 93-200027865 93-200027866 93-200027647 93-200027847 93-200027868 93-
614-1066-T6 •614-1064-T6 •614-1064-T6 •M6-1064-T6 •614-1064-T6 416-1064-T6 614-1064-T6 •614-1064-T6 614-1064-T6 •614-1064-T6 614-1066-T5 614-1046-13 •614-1048-T5 •614-1048-T5 614-1046-TS '614-1048-T5 '614-1049-T5 '814-1057-75 614-1050-T5 614-10S1-TS 814-1052-15 614-1063-T6 614-1047-T5 614-1047-TS 614-1047-TS 614-10H-T5 614-1056-TJ 614-1058-T6 614-1058-T6 614-1061-T6
S18 S18 S18 818 S18 (18 S18 S18 (18 (18 (-111 S-111 S-11C s-nc S-11B S-11C S-17 8-13 1-15 8-14 (-16 8-12 S-10 S-10 S-10 s-efl S-FB » -1 S-1 *-2
DATE DAT! TASK COMPONENT RESULT
5.0
UNITS L9 .
ug/L U
SAMPLED PERFORMED Att,
SERTLLIUH
RESULT
5.0
UNITS L9 .
ug/L U 09-DEC-93 13-DEC-93 CADMIUH 5.0 ug/L u 09-0EC-93 13-DK-9J CHROMIUM 40.1 ug/L 09-DEC-93 13-DEC-93 COPPER 239.6 US/L 09-DEC-93 1J-DEC-93 LEAD 74.0 ug/L O9-0EC-93 15-DEC-93 NtOCEL 102.7 U9/L 09-0EC-93 13-OEC-93 SELENIUM 100 U9/L U 09-DEC-93 (B-JAN-94 SILVER 10.0 U9/L U 09-DEC-93 13-0EC-93 THALLIUM 10.0 ug/L u 09-OEC-93 07-4AN-94 21NC 372.7 ug/L 09-DEC-93 1S-DK-93 PH 9.37 pH Un 08-0EC-93 16-DEC-93 • URANIUN 18 PP" 08-DEC-93 17-DIC-93 B PH 9.66 pH Un 08-DEC-93 16-D8C-93 • UUWIUH 3 PP" 08-0EC-93 16-0EC-93 • SOLIDS 5815 ne/L OS-DEC-93 16-DEC-93 8 SOLIDS 1630 •s/L 08-DEC-93 16-OEC-n 8 URANIUM 0.2 BQ/L OS-OEC-93 16-0EC-93 1 URANIUH 0.6 •O/L 08-CEC-93 16-DEC-93 • URANIUM 0.4 •g/i 08-DEC-93 17-CK-93 8 URANIUM 0.7 •g/L O3-0EC-93 16-MC-93 8 URANIUM 1.3 •g/L 08-DEC-93 U-DCC-93 I URANIUM 4.2 «S/L 09-OEC-93 16-OEC-93 • (OLIOS S6.2 Mt X 08-DEC-93 U-DEC-93 8 URANIUM 130 ppad OS-DEC-93 16-0EC-93 8 URANIUM 101 ppnd 08-SEC-93 03-FE8-96 8 URANIUN 12.2 •W/L 09-OEC-93 16-BEC-93 8 URANIIM 0.1 Ifl/L U 09-MC-93 16-BU-93 • SOLIDS 8S.6 wtX 09-OEC-93 13-MX-93 • URANIUH 1850 pp»d 09-DEC-93 M-KC-93 I URANIUN 1470 ppnd 09-0EC-93 164EC-93 8
Tour Mtaetion Cri tarU Vast Rt lMM Nujb«ri X from Rec»fv*d oatai X
Cecponwit: X-LR Display Ttxt?
subafssfon IDt Projtct Nioti S0.05.08X9X-614X
143
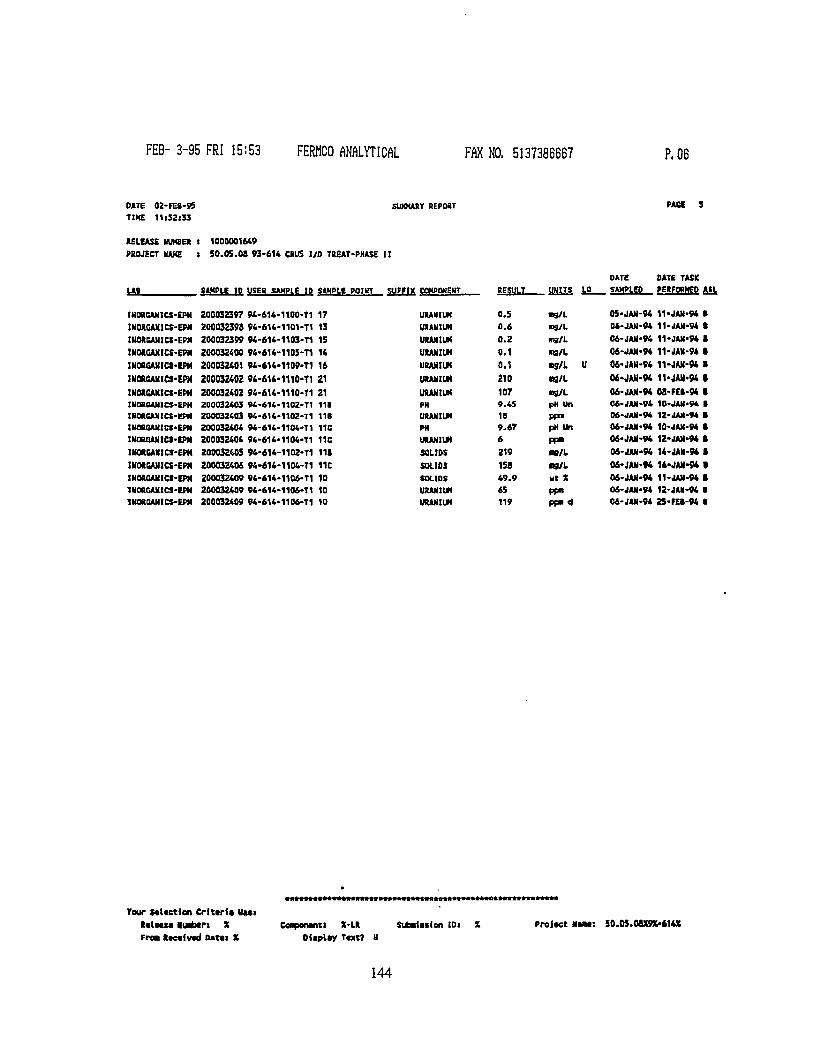
FEB- 3-95 FRI 15:53 FERHCO ANALYTICAL FAX NO. 5137386667 P. 06
DATE TIKE
0Z-FE8-95 11:52:33
SUMMARY REPORT PASI
RELEASE NUMBER I 1000001649 PROJECT HAKE t SO.OS.OS 93-614 CRUS I/O TREAT-PHASE II
t4L SAMPLE ID USEB SAMPLE ID SAMPLE POINT SUFFIX COHPOHENT..
IHORCANICS-EPH INORGANICS-EM tUORCANICS-EPM IHOXGANICS-EPM INORGANICt-EPM 1K0ROAHICS-EPM INOXGAXICS-EPM IHOBCANICS-EPM IKOS.CANICS-EPM 1KOBGANICS-EPM IKORQAMICt-EPM INOR6ANICS-EPH INORSANICS-EPM INORQANICt-EPM 1KORGAMICS-IPM 1N0RGANICS-EPH
200032397 200032398 200032399 200032400 200032(01 200032402 200032402 200032403 200032403 200032404 200032404 200032405 200032406 200032409 200032409 200032409
94-614-94-614-94-614-94-614-94-614-94-614-94-614-94-614-94-614-94-614-94-614* 94-614-94-614-94-614-94-614-94-614-
1100-T1 17 1101-T1 13 1103-T1 15 1105-T1 14 1109-T1 16 1110-T1 21 1110-T1 21 110Z-T1 111 1102-n tie 1104-T1 11C 1104-T1 11C 1102-T1 11» 1104-T1 11C 1106-T1 10 1106-T1 10 1106-T1 10
URANIUM URANIUM URANIUM URANIUM URANIUM URANIUM URANIUM PH URANIUM PH URANIUM SOLIDS SOLIDS SOLIDS URANIUM URANIUM
DATE DATE TASK RESULT UMITS LO SAMPLED PERFORMED AIL
0.5 mg/L 05-JAN-94 11-JAN-94 B 0.6 n9/L 04-JAN-94 11-JAN-94 I 0.2 tng/L 06-JAN-94 ll-JAN'94 I 0.1 ng/L 06-JAN-94 11-JAH-94 • 0.1 •3/L U 06-JAH-94 11-JAN-94 I 210 «9/L 04-JAN-94 11-JAN-94 1 107 eg/L 06-JAN-94 Oa-FEI-94 • 9.45 pH Un 06-MN-94 10-JAU-94 • IB PP» 06-JAN-94 12-JAN-M • 9.67 pH Un 06-JAN-94 10-JAN-94 • 6 PP" 06-JAN-94 12-JAN-94 I 219 •0/L 06-JAN-94 14-JAK-94 • 15a •9/1 06-JAN-94 14-JAN-94 • 49.9 yt X 06-JAN-94 11-JJUI-94 • 65 ppa 06-JAN-94 12-JAN-94 • 119 pp" d 06-JAN-94 2S-FEI-94 I
Tour Solution CrittrU Uui Releiu Nuabart X Fred Stcaivad Oatai X
Ceapentnti X-LR Diiplay T«xt7
Subaiasien ID: Project Naaa: 50.05.0aX9X-t14X
144
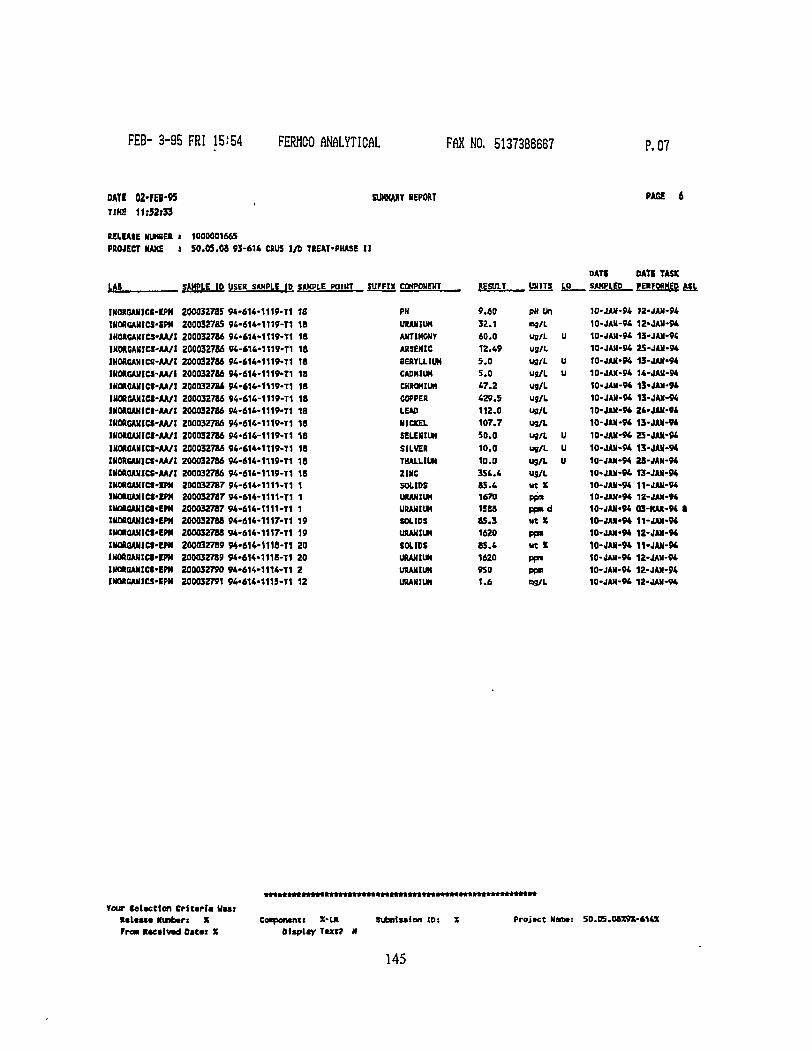
FEB- 3-95 FRI 15:54 FERHCO ANALYTICAL FAX NO. 5137386667 P. 07
OATS 02-FEB-9S TIME 1J:52i33
SUMMARY REPORT PACE 6
RELEASE NUMBER l PROJECT NAME 1
1000001665 50.0S.08 93-614 CAUS I/D TREAT-PHASE II
i*L. SAMPLE ID USER SAMPLE ID SAMPLE POIHT SUFFIX COMPONENT
IHOROAMICI-EPH INORCAHICS-EPM INOROAHICS-AA/I IM0R5AUICI-AA/I INORGANJCS-AA/I 1N0RGAHICS-AVI INOROAMICt-M/I IHORSANICt-AA/l IKOROAMICI-AA/I IKOKGAHICS-AA/I INORGAMICt-AVI INORGAHICS-AA/I INORCAHICt-AA/t INORQAHICS-AA/I IKOROAMICt-EPM INORGANICS-EPM IHORCAHICt-EPM HtOROAMICI-EPM IMOROAHICS-EPM IMOROANICR-EF* IHOftOAHICS-EPH INOROAMICS-EPH INORGANICS-EPM
200032735 94-200032785 94-200032786 91' 200032786 94-200032788 94' 200032786 94' 200032786 94' 200032786 94' 200032786 94-200032786 94' 200032786 94' 200032786 94' 200032786 94-200032786 94-200032787 94' 200032787 94' 200032787 94-200032788 94-200032788 94-200032789 94' 200032789 94-200032790 94-200032791 94-
614-1119-614-1119 614-1119' 614-1119' 414-1119' 614-1119' 614-1119' 614-1119' 614-1119. 614-1119' 614-1119. 614-1119' 614-1119-614-1119-614-1111-614-1111-614-1111-614-1117-614-1117-614-1118-614-1118-614-1114-614-1115-
TI 18 •T1 IB •T1 18 •TI 18 •T1 18 T1 18 Tl 18 •T1 18 •TI 18 •T1 18 •TI 18 •TI 18 'TI 18 •TI 18 •TI 1 •TI 1 •T1 1 •TI 19 •TI 19 TI 20 TI 20 TI 2 TI 12
DATS DATE TASK COMPONENT RESULT
9.60
UNITS LQ
PH Un
SAMPLEO PERFORMED ASl
PH
RESULT
9.60
UNITS LQ
PH Un 10-JAN-94 12-JAN-94 URANIUM 32.1 mg/L 10-JAN-94 12-JAN-94 ANTIMONY 60.0 ug/L U 10-JAN-94 13-JAN-94 ARSENIC 12.49 ug/L 10-JAN-94 25-JAN-94 BERYLLIUM 5.0 U3/X U 10-JAN-94 13-JAN-94 CADMIUM 5.0 Uj/L U 10-JAN-94 14-JAN-94 CHROMIUM 47.2 ug/l 10-JAN-94 13-JAN-94 COPPER 429.5 ug/L 10-JAN-94 13-JAN-94 LEAD 112.0 ug/L 10-JRN-94 24-JAN-94 NICKEL 107.7 ug/L 10-JAN-94 13-JAN-94 SELENIUM 50.0 ug/L U 10-JAN-94 25-JAN-94 SILVER 10.0 UB/L U 10-JAN-94 13-JAN-94 THALLIUM 10.0 ug/L U 10-JAN-94 2B-JAN-94 ZINC 354.4 ug/L 10-JAN-94 T3-JAN-94 SOLIDS 85.4 Mt X 10-4AN-94 11-JAN-M URANIUM 1670 PP» 10-JMI-94 12-JAM-9* URANIUM 1588 pp*d 10-JAN-94 (B-HAR-94 • SOLIDS 85.3 Mt X 10-JAN-94 11-JAN-M URANIUM 1620 PP» 10-JJUC94 12-JU-94 SOLIDS BS.4 ut X 10-JAN-94 11-JAN-94 URANIUM 1620 PF™ 10-JAN-94 12-JAN-94 URANIUM 950 PP» 10-JAN-94 12-JAN-94 URANIUM 1.6 ng/L 10-JAN-94 12-JJUI-9*
Your Selection Criur ia Was: R*l«u« Ninbart X Froa Rtecivad Oitax X
Co«pon«nt: X-LR Dltpl iy Text?
Subntssion to: Project Nan*: 50.05.08X9X-614X
145
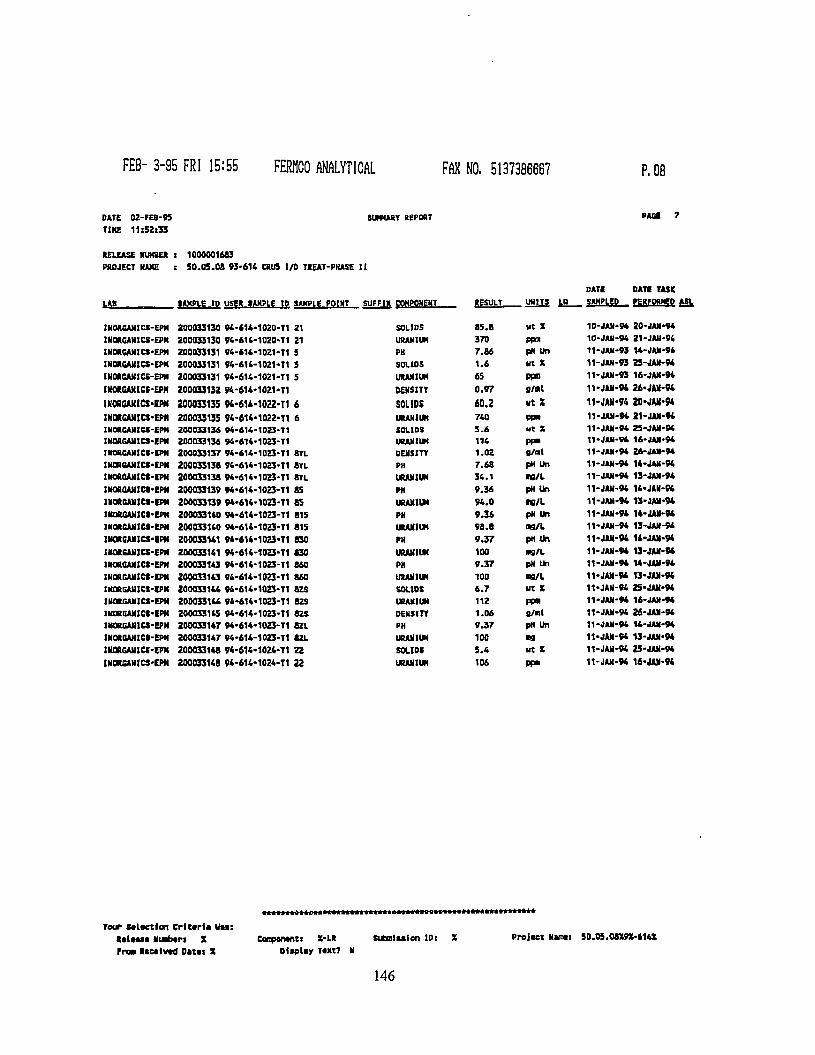
FEB- 3-95 FRI 15:55 FERHCO ANALYTICAL FAX NO. 5137386667 P. 08
DATE TIKE
02-FEB-95 11:52>33
SUMMARY REPORT PAGt
RELEASE NUMBER PROJECT MAKE
1000001683 50.05.08 93-614 CMS I/O TREAT-PHASE I I
k£B_ SAMPLE-IP USE* SAMPLE IP SAMPLE POINT SUFFIX COMPONENT.
IN0K6AMICS-EPM INORGANICS-EPM IKORSANICS-EPM INORGANICS-EPM INORGANICS-EPN IMORCANICt-EPH UORCAMICS>EPM IH(KGANICS-EPM 1NORCANICS-EPM INOR6AJ1ICS-EPM MORGANICS-EPM 1K0R6AHICS-EPM lKKGANlCt-EPH IHORGANICt-CPM INORGANICS-IPM 1K0R6ANICI-EPM IHORCAllieS-EPM INORBJUIICS-IPM HOtCAHlCS-EPN IHORGANiet-EPM INOflGANICt-IPM WORSAHICS-EPM IHORGAMICS-EPM IKORGAHICS-IPM INORCAH1C1-EPM INOROANICS-EPM IHORCAKICS-Em IK0R6ANICS-EPM
200033130 200033130 200033131 200033131 200033131 200033132 200033135 200033135 200033136 200033136 200033137 200033138 200033138 200033139 200033139 200033140 200033140 200033141 200033141 200033143 200033143 200033144 200033144 200033145 200033147 200033147 200033148 2000331(8
94-614' 94-614' 94-614' 94-614 94-614 94-614' 94-614' 94-614 94-614 94-614' 94-614' 94-614' 94-614' 94-614 94-614 94-614' 94-614 94-614 94-614 94-614 94-614' 94-614' 94-614' 94-614 94-614' 94-614-94-614' 94-614'
•1020-T1 21 •1020-T1 21 •10Z1-T1 S •1021-T1 •1021-T1 •1021-T1 •1022-T1 •1022-T1 •10Z3-T1 •1023-T1 •102S-T1 8TL •10Z3-T1 8YL •1023-T1 STL •1023-T1 85 •1023-T1 SS "1023-T1 815 •1023-T1 815 •1023-T1 830 •1023-T1 830 •1023-T1 860 •1023-T1 860 •1023-T1 8ZS •1023-T1 8ZS •10Z3-T1 SZS •1023-T1 8ZL •1023-11 BZL •1024-T1 22 •1024-T1 22
SOLIDS USAHIUN PH SOLIDS URANIUM DENSITY SOLIDS URANIUM SOLIDS URANIUM OENSITY PH URANIUM PH URANIUM PH URANIUM PH URANIUM PH URANIUM SOLIDS URANIUM DENSITY PH URANIUM SOLIDS URANIUM
DAT! DAT! TASK RESULT_ _ UH1TS LO SAMPLED PERFORMED ASL
85.8 ut X 10-JAX-94 20-JAN-94 370 ppra 10-JAN-94 21-JAH-94 7.86 pH Un 11-JAN-93 U-JAN-94 1.6 UT X 11-JAN-93 25-JAH-94 65 ppo 11-JAN-93 16-JAH-94 0.97 g/al 11-JAH-94 26-JAX-04 60.2 wt X 11-JAN-94 20-JAH'W 740 PP» 11-JAN-94 21-JAX-94 5.6 Ht X 11-JAN-94 25-JAN-94 114 PP" 11-JAU-94 16-JAN-94 1.02 S/nl 11-JAN-94 26-JAN-94 7.68 pH Un 11-JAN-94 14-JAH-94 34.1 BO/L 11-JAN-94 13-JAX-94 9.36 pH Un 11-JAM-94 14-JAN-94 94.0 W/L 11-JAM-94 13-JAN-94 9.36 pH Un 11-JAN-94 14-JAN-94 98.8 D9/1 1WAN-94 13-JAN-94 9.37 pH Un 11-JAH-94 14-JAN-94 100 •9/1 11-JAN-94 13-JAN-94 9.37 pH Un 11-JAN-94 U-JAN-94 100 •fl/L 11-JAN-94 13-JAN-94 6.7 ut X 11-JAH-94 2S-JAH-94 112 PP» 11-JAN-94 16-JAN-94 1.06 S/Bt 11-JAN-94 26-JAN-94 9.37 pH Un 11-JAN-94 U-JAN-94 100 B3 11-JAN-94 13-JAN-94 5.4 ut X 11-JAH-94 25-JAH-94 106 PP» 11-JAN-94 16-JAN-94
rour select ion C r i t e r i a Was: Relaasa Niafceri X Proa Rieatvad Oatat X
Cotpenantt X-LR Diaplay TaxT7
subaisaion ID : Project Harnat 50.05.08X9X-614X
146
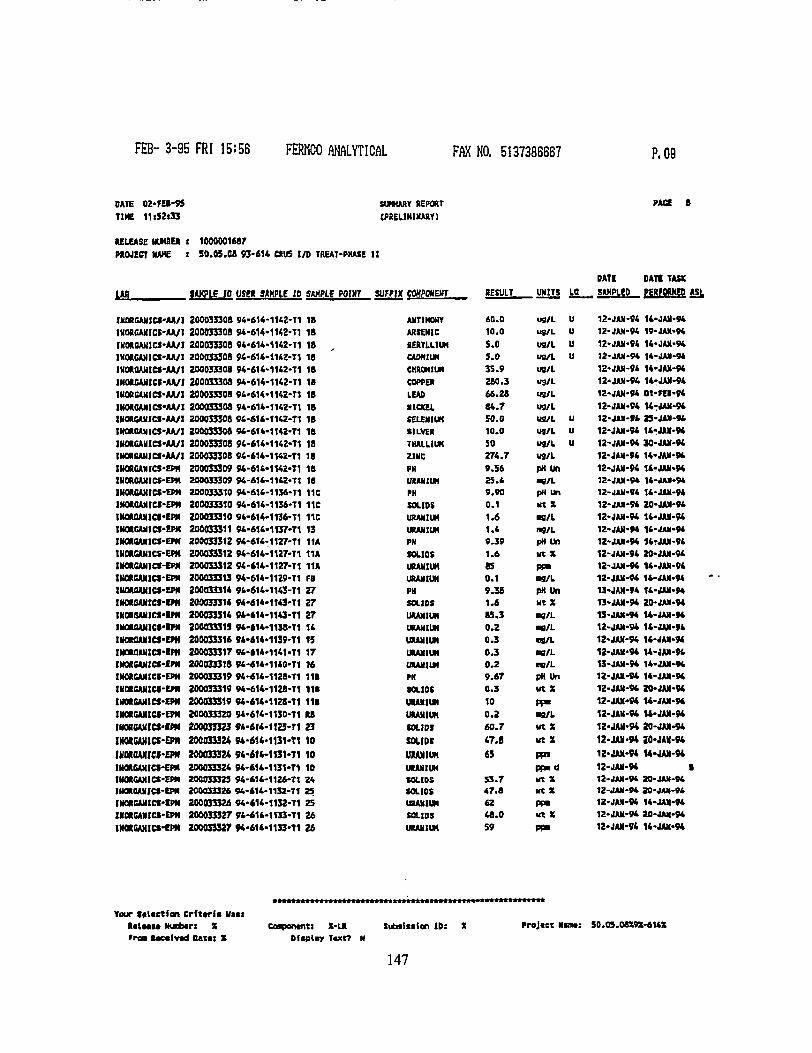
FEB- 3-95 FRI 15:56 FERHCO ANALYTICAL FAX NO. 5137386667 P. 09
DATE TIME
02-fEI-95 11i52l33
SUMMARY REPORT (PRELIMINARY)
PAGE
RELEASE NUMBER 1 1000001687 PROJECT NAME i S0.0S.08 93-614 CXU5 t/D TREAT-PXASE II
Lit. t/WPLE tO USER SAMPLE ID SAMPLE POINT SUFFIX COMPONENT
IKORGAMICt-M/I INORGAHICt-AVI INORQAHICS-AA/I 1H0AGAHICS-AA/I INOROAHICR-AA/I JNORCANt»-AA/l IKORCAM1CS-AA/I IKOROANICS-AA/I IHORCANICS-AA/I IHOROANICS-AA/I IHORSAMICS-AA/I IHORCAMlCS-AA/l IHOROANICS-EPM tHORSANICS-EPH IHORSAHICS-EPM IKOROAHICS-EPH lKOROMIICf-EPK INORGANICS-EM INORSAIIICS-EPN INORSAHICS-EPH IHORGMICS-EM lHORCAMICI-Em IWOAONICS-EPM IKOUIANtCS-EPM INORSAUICt'IPH IHOUUUICt'tPM IMOtaANtCS-EPH IMORflAHICS-IPH INORSANlCt-IPtt IMORGANICI-EPK iHOROMitw-era INORGANICS-EM HWROUtCS-Em tHORSANICt'fPN IHORSANICS-EPM
INOROMICI-EPN IHORUMICR-EPN IHORGAMICS-EPH IHORGAHtCS-EPM IHORCAHICt-IPH WOASAMCl-EPK lNORBAMlCS-EPH
200033308 94' 2000333QB 94> 200033308 94' 200033308 9«' 200033308 94' 200033308 94 200033308 94 200033308 94 200033308 94-200033308 94' 200033308 94' 200033308 94' 200033309 94' 200033309 94 200033310 94' 200033310 94' 200033310 94' 200033311 94' 200033312 94' 200033312 94' 200033312 94' 200033313 94' 200033314 94' 2000333H 9*' 200033314 94' 200033315 94' 200033316 94-200033317 94' 200033318 94-200033319 94-200033319 94< 200033319 94-200033320 94' 200033323 94-200033324 94-200033324 94-200033324 94-200033323 94-200033326 94-200033326 94-200033327 94-200033327 94-
•614-1142-T1 18 •614-1142-T1 18 •614-1142-T1 18 -614-114Z-T1 18 •614-1142-T1 18 •614-1142-T1 IB •614-1142-T1 18 -614-1142-T1 18 •M4-1142-T1 IB •614-1142-T1 18 -614-1142-T1 18 •614-1142-T1 18 •614-1142-T1 18 -614-WZ-T1 18 •614-1136-T1 11C •614-1136-T1 11C •614«1136-T1 11C •614-1137-T1 13 •614-1127-T1 11A •614-1127-T1 11A •614-1127-T1 11A •614-1129-T1 FB •614-1143-T1 27 •6H-1143-TI 27 •614-1143-T1 27 •614-1138-T1 14 •614-1139-T1 13 •4U-1141-T1 17 6H-1H0-T1 16 614-1128-T1 111 •614-1128-T1 118 614-112B-T1 111 '614-1130-T1 RB 614-112I-T1 23 6U-1131-T1 10 6H-1H1-T1 10 614-1131-T1 10 614-11Z6-T1 24 614-1132-T1 25 614-11S2-T1 25 414-1133-T1 26 •6H-1133-T1 26
DAT! DATE TASK COMPONENT RESULT UNITS LO SAMPLED PERFORMED ASL
ANTINOMY 60.0 ug/L U 12-JAH-94 U-JAN-94 ARSENIC 10.0 ug/L U 12-JAN-94 19-JAN-94 BERYLLIUM S.O U9/L U 12-JAN-94 14-JAN-94 CADMIUM S.O UB/L U 12-JAN-94 14-JAN-94 CHROMIUM 35.9 ug/L 12-JAH-94 U-JAN-94 COPPER 280.3 ug/L 12-JAN-94 14-JAN-94 LEAD 66.28 ug/L 12-JAN-94 01-FEI-94 NICKEL 84.7 ug/L 12-JAH-94 U-JAN-94 SELENIUM 50.0 ua/L u 12-JUU-94 25-JAN-S4 SILVER 10.0 ug/L u 12-JAN-94 14-JAN-94 THALLIUM 50 ug/l U 12-JAN-94 30-JAN-94 ZINC 274.7 ug/L 12-JAN-94 14-JAN-94 PH 9.56 PH un 12-JAH-94 14-JAN-94 URANIUM 25.4 •e/L 12-JAH-94 U-MN-94 PN 9.90 pN un 12-JAN-94 14-JAN-94 SOLIDS 0.1 ut X 12-JAN-94 20-JAN-94 URANIUM 1.6 •g/L 12-JAN-94 U-JAN-94 URANIUM 1.4 ng/L 12-JAN-94 14-JAN-94 PH 0.39 pH Un 12-JAN-94 14-JAN-94 SOLIDS 1.6 in X 12-JAN-94 20-JAN-94 URANIUM 85 ppa 12-JAN-94 14-JAN-94 URANIUM 0.1 •g/L 12-JAN-94 U-JAN-94 PH 9.38 PH Un 13-JAN-94 14-JAN-94 SOLIDS 1.6 ut X 13-JAN-94 20-JAN-94 URANIUM 85.3 •8/L 13-JAN-94 U-JAR-M URANIUM 0.2 •9/L 12-JAN-94 14-JAN-94 URANIUM 0.3 og/L 12-MN-94 14-JAN-94 URANIUM 0.3 •g/L 12-JAN-94 U-JAN-94 URANIUM 0.2 ne/L 13-JAN-94 U-JAN-94 PH 9.67 pH Un 12-JAN-94 14-JAN-9* SOLIDS 0.3 ut X 12-JAN-94 20-JAN-94 URANIUM 10 PT» 12-JAN-94 U-JAR-94 URANIUM 0.2 •9/L 12-JAN-94 U-JAN-94 SOLIDS 60.7 ut X 12-JAN-94 20-JAN-94 SOLIDS 47.8 ut X 12-JAN-94 20-JIN-94 URANIUM 63 W 12-JAH-W U-JAN-94 URANIUM ppjid 12-JAN-94 B SOLIDS 53.7 ut X 12-JM-94 20-JA1I-K SOLIDS 47.8 ut X 12-MM-94 20-JAX-W URANIUM 62 PPB 12-JAN-94 14-JAN-94 SOLIDS 48.0 ut X 12-JAN-94 20-JAK-94 URANIUM 59 PP» 12-JAN-94 14-JAN-94
Your fcUetfon Crlttrl* Uti i I I I M H mxbtn % trtm Racalvad Oat«i X
coapontnti X-LR Display T«xt7
Sutaixsion ID: Projtct Nnwi 50.03.08X9X-614X
147
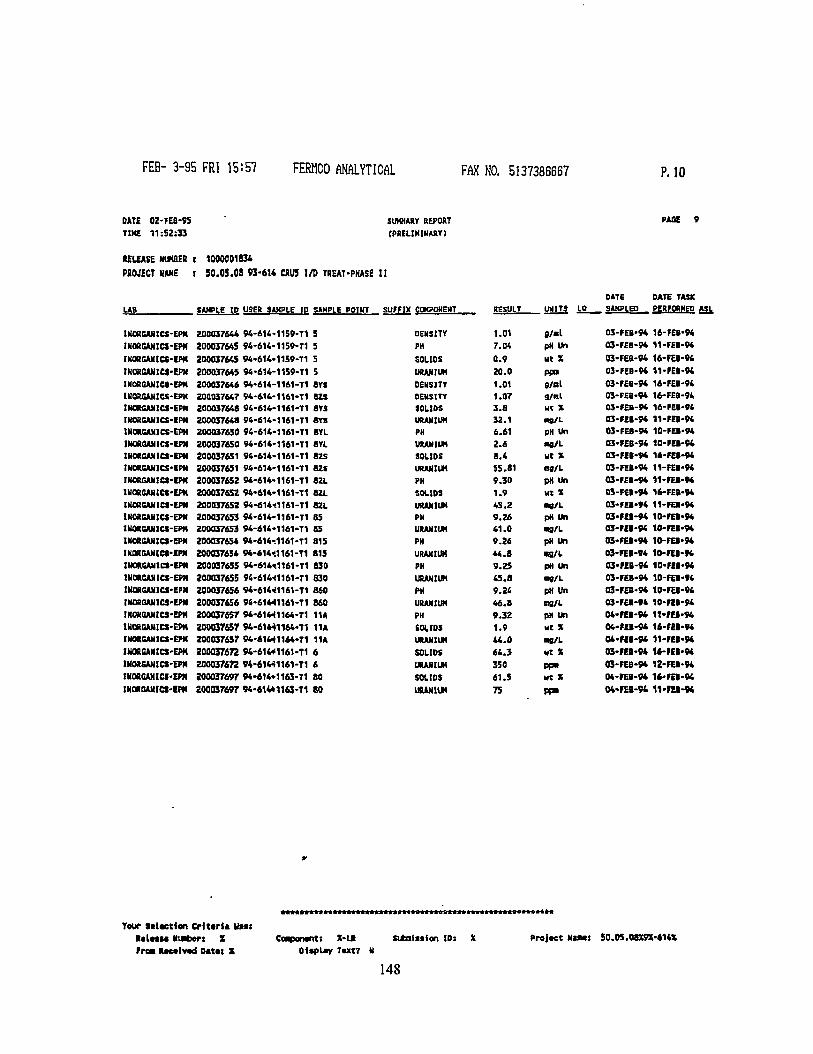
FEB- 3-95 FRI 15:57 FERHCO ANALYTICAL FAX NO. 5137386667 P. 10
DATE TIKE
0Z-FE8-95 11:52:33
SUMMARY REPORT (PRELIMINARY)
PAGE
RELEASE NUMBER I 1000001834 PROJECT NAME t 50.05.03 93-61* CRU5 I/D TREAT-PHASE II
LAB SAMPLE tO USER SAMPLE IP SAMPLE POIHT SUFFIX COMPONENT
IMORGANICS-EPM INORGAMICS-EPM INORSANICS-EPH IKORGANICI-EPM INORCAWIC1-EPM INORSANICS-EPM UORQAN1CS-EPM IXORBANICS-IPM INORGANICS-EM INOSGAHICS-EPM IHORGANICS-EPM IKORGAUICS-IPM IKORGANttt-tPM WORGAHtCS-IPM IMORSAUICS-EPM INORGAMICS-EPM 1HORSAN1CS-EPH INOSGAMICS-EPM IKORGANICS-EPM WORSAMICS-tPM lUOtGAHIM-EPM IKORGAXICS-EPN INOROANICS-EPM INOKOAMICS-EPM IUORGAHICS-EM IMOKCANICS-EPM INORGANICS-EPK IHOX6AN1CS-EPH IKOSGANICI-Era INOfOANICS-IPM
2000376a 200037645 200037645 200037M5 200037646 2000376*7 200037648 200037648 200037650 200037650 200037651 200037651 200037652 200037652 200037652 200037653 200037653 200037654 200037654 200037655 200037655 200037656 200037656 200037657 200037657 200037657 200037672 200037672 200037697 200037697
94-614-1159 94-614-1159' 94-614-1159 94-614-1159 94-614-1161 94-614-1161' 94-614-1161 94-614-1161 94-614-1161 94-614-1161 94-614-1161 94-614-1161 94-614-1161 94-614-1161 94-61411161 94-614-1161 94-614-1161' 94-614-1161 94-6144.1161-94-614^1161 94-61441161 94-61441161 94-61441161 94-61441164-94-61441164' 94-61441164' 94-61441161' 94-61441161' 94-614»1163' 94-614*1163'
•T1 5 •T1 5 -T1 5 •T1 5 -T1 8T1 •T1 6Z3 •TI ars -T1 SYS •TI BYL -TI 8YL -T1 8ZS -TI azs -TI 8ZL -TI ezL -T1 8ZL •TI 85 •TI 85 •TI 815 •TI 815 -TI 830 •TI 630 -T1 860 -T1 860 •TI 11A •T1 11A •TI 11A •T1 6 •TI 6 •TI 80 •T1 80
DENSITY PH SOLIOS URANIUM DENSITY DENSITY SOLIOS URANIUM PH URANIUM SOLIDS URANIUM PH SOLIDS URANIUM PH URANIUM PH URANIUM PH URANIUM PH URANIUM PH SOLIDS URANIUM SOLIDS URANIUM SOLIDS URANIUM
DATE DATE TASK RESULT UNITS LO SAMPLED PERrORMED
1.01 B/«l 03-FEB-94 16-FEB-94 7.04 pH Un 03-FEB-94 11-FEB-94 0.9 Ut X 03-FEB-94 16-FEI-94 20.0 PP* 03-FEB-94 1WEI-94 1.01 9/Bl 03-FEB-94 16-FEB-94 1.07 g/«il 03-FEB-94 16-FEB-94 3.8 ut X 03-FEB-94 16-FEB-94 32.1 ng/L 03-UB-94 11-FEI-94 6.61 pH Un 03-FE8-94 10-FEB-94 2.6 ag/L 03-FEB-94 10-FU-94 8.4 ut X 03-FEI-94 16-FEB-94 55.81 Wfl/L 03-FEB-94 11-FEB-94 9.30 pH Un 03-FEB-94 11-FEB-94 1.9 ut X 03-FEI-94 16-FEB-94 45.2 «8/L 03-FU-94 11-FEB-94 9.26 pH Un 03-FEI-94 10-FEB-94 41.0 •9/L 03-FEB-94 10-FEI-94 9.26 pH un 03-FE8-94 10-FEB-94 44.8 •9/L 03-FEB-94 10-FEB-94 9.2S pH Un 03-FEB-94 10-FU-94 45.8 •9/L 03-FEB-94 10-FEB-94 9.24 pH Un 03-FEB-94 10-FEI-94 46.8 ng/L 03-FEI-94 10-FK-94 9.32 pN Un 04-FEI-94 11-KB-94 1.9 ut X 04-KI-94 16-FEI-94 44.0 •9/L 04-FIB-94 11-FEI-94 64.3 ut X 03-KB-94 16-FEB-94 3S0 PP" 03-FEB-94 12-FEB-94 61.5 ut X 04-FEB-94 16-FEI-94 75 PP* 04-FEB-94 1WEI-94
Teur ttlactlon Criteria Utt: t t l M M Miabert X Frc« tacaivad Data: X
Coaponcntx X-Ut Ofsplay Taxt7
» r t * M > m a B H M t i m l m * n i t » t * l a
sutnisilon ID: Project Hums 50.05.08X9X-614X
148
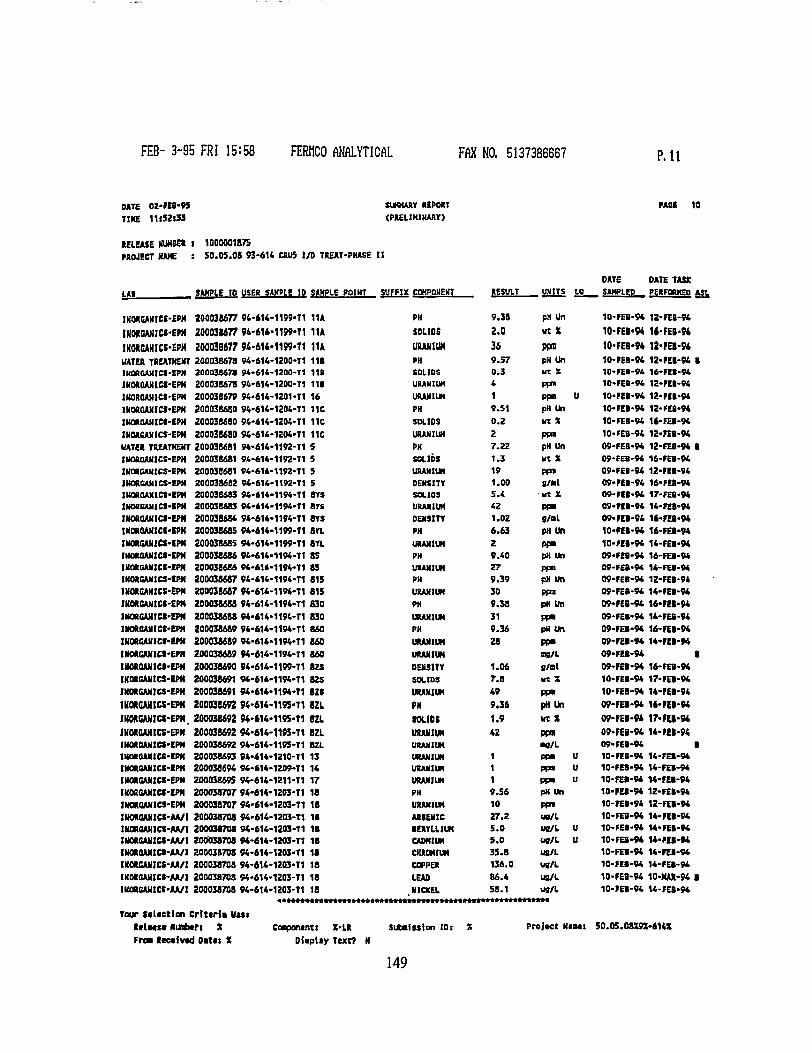
FEB- 3-95 FRI 15:58 FERHCO ANALYTICAL FAX NO. 5137386667 P. 11
DATE TIKE
OZ-FEB-95 11s52l33
SUOttRY REPORT <PRELIMIHART>
PASB 10
RELEASE NUHBEt ! 1000001875 PROJECT NAME : 50.05.08 93-614 CRU5 1/D TREAT-PHASE II
DATE DATE TASK LAI ,_., SAMPLE 10 USER SAMPLE ID SAMPLE POINT SUFFIX COMPONENT RESULT
9.38
UNITS LO
pH Un
SAMPLED PERFORMED ASL
IHORCAHICS-EPM 200038677 94-614-1199-T1 11A PK
RESULT
9.38
UNITS LO
pH Un 10-FEB-94 12-FEB-94 INORCMHCS-EPM 200031677 94-6H-1199-T1 11A SOLIDS 2.0 wt X 10-FEI-94 U-FEB-tt IHORCAMICS-EPH 200033677 04-6H-1199-T1 11A URANIUM 36 ppra 10-FEB-94 12-FEB-94 UATER TREATMENT 200038678 94-614-120011 11B PH 9.57 pH Un 10-PEB-94 12-FEB-94 8 lUOaCANICI-EPM 200038678 94-614-1200-T1 118 SOLIDS 0.3 ut x 10-FEB-94 16-FE8-94 lHORCANICt-EPM 200038678 94-614-1200-T1 118 URANIUM 4 PF" 10-FEB-94 12-FEB-94 INOROANICt-EPM 20003B679 94-614-1201-T1 16 URANIUM 1 PP» U 10-FEB-94 12-FIB-94 INORGAMICS-EPM 200038680 94-614-1204-T1 11C PH 9.51 pH Un 10-FES-94 12-FEB-94 IKOROAHICB-EPH 200038680 94-614-1204-T1 11C SOLIDS 0.2 ut X 10-FEB-94 16-FEB-94 INORCANICS-EPM 200038680 94-6K-1204-T1 11C URANIUM 2 ppn 10-FEB-94 12-FEB-94 UATCR TREATMENT 200038681 94-614-1192-T1 5 PH 7.22 pH Un 09-FEB-94 12-FEB-94 8 IHORGAMt«-EPH 200038681 94-614-1192-T1 5 SOLIDS 1.3 ut X 09-FEB-94 16-FEB-94 IN0R6ANICS-EPH 200038681 94-6H-1192-T1 5 URANIUM 19 PP« 09-FEB-94 12-FEB-94 IMOREAMICS-EPM 200038682 94-614-1192-T1 5 DENSITY 1.00 g/al 09-FEB-94 16-FE8-94 IKOROANICf-EPM 200038683 94-6U-1194-T1 SYS SOLIDS 5.4 wt X 09-FEB-94 17-FEB-94 INORCAMICS-IPM 200038683 94-6U-1194-T1 8YS URANIUM 42 PP" 09-FEB-94 14-FEB-94 IHOROANICS-EPM 20003S684 94-614-1194-T1 8YS DENSITY 1.02 g/al 09-FEB-94 16-FEB-94 IKOROANtCt-IPH 200038685 94-614-1199-T1 8 a PH 6.63 pH Un 10-K8-94 16-FE8-94 IMORSAHICS-IPM 200038685 94-614-1199-T1 8YL URANIUM 2 PP» 10-FE8-94 U-FEB-94 IMORaAHICI-EPM 200038686 94-614-1194-T1 85 PH 9.40 pH un 09-FEB-94 16-FEB-94 IHOROANICt-EPH 200038686 94-6U-1194-T1 85 URANIUM 27 PP«n 09-FEB-94 14-FEB-94 IHORSANICS-EPM 200038687 94-614-1194-T1 815 PH 9.39 pH un Q9-FEB-94 12-FEB-94 INORGAMICS-EPM 200038687 94-614-1194-T1 815 URANIUM 30 pptx 09-FEB-94 14-FEI-94 IKORSANICS-EPM 200038688 94-614-1194-T1 830 PH 9.38 pH un 09-FEB-94 16-FEB-94 1N0R6AMIU-EPM 200038688 94-614-1194-T1 830 URANIUM 31 PP" 09-FE8-94 14-FEB-94 UtOftOANICt-EPH 200038689 9A-614-1194-T1 860 PH 9.36 pH un 09-FEB-94 16-FEB-94 IKORCANICS-SPM 200038689 94-614-1194-T1 860 URANIUM 28 PP» 09-FEB-94 U-FEB-94 IMORGAHICS-EPH 200038689 94-614-1194-T1 860 URANIUM ng/L 09-FEB-94 | lUOROAHICI-EPM 200038690 94-614-1199-T1 8ZS DENSITY 1.06 s/at 09-FEB-94 16-FEB-94 INORGANICS-IPM 200038691 94-614-1194-T1 8ZS SOLIDS 7.8 ut X 10-FEB-94 17-FEB-94 INORGAMICS-EPM 200038691 94-614-1194-T1 828 URANIUM 49 PP" 10-FEB-94 14-FES-94 1K0RGANICS-EPM 200038692 94-614-1195-T1 8ZL PH 9.36 pH Un 09-FEB-94 li-FEI-94 INORCANICS-EPM. 200038692 94-814-119S-T1 821 SOLIDS 1.9 Ut X 09-FEB-94 17-FEB-94 IKORGAHICS-EPM 200038692 94-614-119S-T1 8ZL URANIUM 42 PP" 09-FEB-94 U-FE1-94 1NOROANICS-EPM 200038692 94-614-1195-T1 8ZL URANIUM •g/L 09-FEB-94 8 lUOROANICt-EPM 200038693 94-614-1210-T1 13 URANIUM 1 PP" U 10-FEB-94 14-FE8-94 IHOROAHICS-RPK 200038694 94-614-1209-T1 14 URANIUM 1 ppa U 10-FEB-94 14-FE8-94 INORCANICS-EPH 200038695 94-614-1211-T1 17 URANIUM 1 PP» " 10-FEB-9* U-FEB-94 INORGANICt-EPH 200038707 94-614-1203-T1 18 PH 9.56 pH Un 10-FEB-94 12-FEB-94 IHORGAMICS-EPM 200038707 94-614-1203-T1 18 URANIUM 10 PF» 10-FEB-94 12-FEB-94 IIMRSAHICI-AA/I 200038708 94-614-1203-T1 18 ARSENIC 27.2 ug/L 10-FE8-94 14-FE8-94 IKOROAHICS-AA/I 200031708 94-6U-1203-T1 18 BERYLLIUM 5.0 Ufl/L U 10-FE8-94 U-FEB-94 luORGAHICS-AA/t 200038708 M-614-1203-T1 18 CADMIUM 5.0 UB/L U 10-FEI-M U-FEB-94 IHOROANICt-AA/I 200038708 94-614-1203-T1 IS CHROMIUM 35.8 us/L 10-FEB-94 U-FEI-94 INOUANICS-AA/I 200038708 94-614-1203-T1 18 COPPER 136.0 ug/L 10-FEB-94 U-FEB-94 IN0ROAHIC1-AA/I 200038708 94-614-1203-T1 18 LEAD 86.4 ug/L 10-FEB-94 10-MM-94 I INORGAUICt-AA/I 200038708 94-614-1203-T1 18 NICKEL 58.1 ug/L 10-FEB-94 U-FEB-94
M*MMtt*********M» **>**••»•»»•••*•***»•••«*«»*•******•*• Tour Salietion Crltaria I U I I
R * I M M Nintwri X Ccaponint: X-LR Subafulon ID: X ProjtCt MUM! 50.05.08X9X-614X From Received Oittt X DUpliy Text? N
149
FEB- 3 -95 FRI 15:59 FERHCO ANALYTICAL FAX NO. 5137386667 P. 12
DATE T1MC
02-FEB-9S 11:52)33
SUMMARY REPORT (PRELIMINARY)
P A S 11
RELEASE NUMBER : 1000001875 PROJECT NAME : 50.0S.08 93-616 CRU5 I/D TREAT-PHASE II
ua_ SAMPLE IP USER SAMPLE 10 SAMPLE POINT SUFFIX COMPONENT
IUORCAMICS-M/I INOROAMICS-AA/I INORBANICS-AA/t IUORBAHICS-AA/I IN0RGAX1C1-EPM INOROANICS-EPH IN0R6ANICS-EPM IHORGANICS-EPM INOXSAHICS-EFN INOROAMCS-EPH INORSAHICS-EPH IKORGANICS-EPM
IKORSAUICI-EPH INORGAMICS-EPtt IKORCANICS-EPM 1K0RGAMICS-EPN IKORGAMCS-EPM
tHORGAHICS-EPM ITAS-fTL ITAS-STL
200038708 200038708 200038708 200038708 200038709 200038709 200038710 200038710 200038711 200038711 200038712 200038712 200038713 200038713 200038716 200038714 200038715 200038715 200038716 200038716
94-616-94-614-94-614-94-614 94-614-94-614-94-614-94-614-94-614-94-614-94-614-94-614-94-6U 94-614 94-614-94-614-94-614-94-614 94-616-94-616
•1203-T1 18 •1203-T1 18 •1Z03-T1 18 •1203-T1 18 •1196-T1 19 •1196-T1 19 •1197-T1 80 •1197-T1 80 •1198-T1 90 •1198-T1 90 •1202-T1 10 •1202-T1 10 •1206-T1 82 •1206-T1 82 •1193-T1 6 •1193-T1 6 •1208-T1 21 •1208-T1 21 •1195-T1 108 •1195-T1 108
SELENIUM SILVER THALLIUM ZINC SOLIDS URANIUM SOLIOS URANIUM SOLIDS URANIUM SOLIOS URANIUM SOLIDS URANIUM SOLIDS URANIUM SOLIDS URANIUM TOTAL SUS. URANIUM
RE5ULT UNITS LP
SOLI
5 11.8 10.0 209.7 59.5 230 sa.o 140 55.7 150 54.4 110 51.5 170 64.9 640 47.8 130 1.0 24200
Ug/L U UB/L Ug/L U ug/L ut X ppm d ut X ppa d wt X ppad ut X ppnd ut X ppn d ut X ppad ut X ppad wg/L ug/L
DATE , SAMPLED
OATE TASK PERFORMED ASL
10-FM-94 10-KI-94 10-FU-94 10-FEB-94 09-FEB-94 09-FEB-94 09-FEB-96 09-FEI-94 10-FEI-96 10-KI-94 10-Ftt-M 10-F6B-9* 10-FEB-94 10-FM-9* 09-FEB-94 09-FEB-W 10-FER-94 10-KI-94 09-FU-94 09-FCI-96
17-FE8-94 14-FII-94 25-FII-94 I 14-FEB-94 16-FEB-9* 18-MAR-94 16-FEI-96 OS-HU-94 16-FII-94 Oa-KAR-W 16-FEI-94 OI-KAR-94 16-KI-94 17-FEI-96 16-FER-94 OS-MAI-94 16-FU-94 12-FEI-94 14-MM-94 I 21-MAR-94 •
Your Salaetlon Crftirl* Vast R t l t u a Ninber: X Fro* tccaivtd Data: X
Ccaponanti X-LR Dtaplay Taxt?
Subaiaaion ID: X
150
Project Nam: S0.05.08X9X-6UX

FEB- 3-95 FRI 15:59 FERHCO ANALYTICAL FAX HO. 5137386667 P. 13
DATE 02-FEI-95 . SUMMARY REPORT TIKE 11:52:33 (PRELIMINARY)
RELEASE KUHBEt : 1000001940 PROJECT NAME : 50.05.08 93-614 CRIB I/O TREAT-PHASE II
LAI SAMPLE ID USER SAMPLE ID SAMPLE P01MT SUFFJX COMPONENT
IHORQANICS-EPN 200039907 94-614-1246-T3 19 SOLIDS IKORGAX1CS-EPH 200039907 94-614-1246-T3 19 URAMIUH INORGAHICJ-EPM 200039908 94-614-1249-T3 80 SOLIDS tlUXWlU-tPM 200039908 94-614-1249-T3 80 URANIUM INOROAHICI-EW 200039909 94-614-1247-T3 90 SOLIDS INOBfiAN]CS*IPM 200039909 94-614-1247-T3 90 URANIUM IMOtQANICI-EPH 200039910 94-614-1254-T3 10 SOLIDS IKORGAMICS-EPM 200039910 94-6K-1234-T3 10 URAMIUH INOROANICWPM 200039910 94-614-12S4-T3 10 URANIUM IMORCAHICS'IPM 200039911 94-614-1257-T3 82 SOLIDS IHOAGAHICS-IPM 200039911 94-614-1257-T3 82 URANIUM INORGANICS-EM 200039912 94-614-1264-T2 10 SOLIDS 1NORCAHICS-EPH 200039912 94-614-1264-T2 10 URANIUM IK0R0AM1C8-EPM 200039913 94-614-12M-T2 82 SOLIDS 1HOROANICS-EPM 200039913 94-614-1268-T2 82 URAMIUH IHORQAMICt-EPM 200039914 94-614-1272-T9 1 SOLIDS IKOAGANICS-EPM 200039914 94'614«1272-T9 1 URANIUM IKORQAUIC8-IPM 200039915 94-614-1273-T9 2 SOLIDS IMORaAHICt-EPM 200039915 94-CK-1273-T9 2 URANIUM INORCANICS-IPN 200039916 94-414-1274-T9 3 SOLIDS INMOAMICt-EPM 200039916 94-614-1274-T9 3 URANIUM UOKAHICS-EPH 200039917 94-614-1273-T9 4 SOLIDS IKORSAJHCI-EP* 200039917 94-614-1275-T9 4 URANIUM iKORUNtcs-em 200039918 94-614-1276-T9 5 SOLIDS IHORSAHICt-IPN 200039911 94-614-1276-T9 5 URANIUM 1KOAQAHICI-EW 200039919 94-614-1277-T9 i SOLIOS IMOROAHICS-EPM 200039919 94-614-1277-T9 6 URANIUM IHORGANICS-EPM 200039920 94-614-127B-T9 7 SOLIDS tUORGANICC-EMI 200039920 94-614-1278-T9 7 URANIUM IMORGAMICS-EPM 200039921 94-6H.1279-T9 8 SOLIOS IWKGAJHCI-EPM 200039921 94-614-1279-T9 8 URANIUM IMORSAHICS'IPN 200039922 94-614-12M-T9 9 SOLIDS IMOROANICS-EPM 200039922 94-614-12S0-T9 9 URANIUM INORGANICS-IP* 200039923 94-e1«-12ai-T9 10 SOLIDS IHORCAVICl-EPM 20003993 94-614-12B1-T9 10 URANIUM 1HM6AMICS-EPN 200039924 94-614-1282-T9 11 SOLIDS IMORUMICS-EPM 200039924 W-414-12S2-T9 11 URANIUM IMORSAHICS-EPH 200039925 94-6U-1283«T9 12 SOLIDS IKOROAMCI-EP* 200039925 94-6H-1283-T9 12 URANIUM IKMOANIU'EPH 200039926 94-614-1250-T3 11A SOLIDS IMOROAHICS'IPM 200039926 94-614-1250-T3 11A URANIUM IHORGAMICS-EPM 200039927 94-614-1248-T3 118 SOLIDS IKOHOAHICS-EI* 200039927 94-6U-1248.T3 11B URANIUM INOMAMICS-EFM 200039928 94-614-1252-T3 RB URANIUM IHORCANICS-EPM 200039929 94-6U-1253-T3 FB URANIUM INOROANICS-EPM 200039931 94-614-1258-T3 11C SOLIDS IKOMAMICS-EPM 200039931 94-614-1258-T3 11C URANIUM
PAGE 12
RESULT UNITS 10
56.5 zso 55.9 134 54.2 150 50.2 138 94 45.6 250 48.5 130 40.5 234 99.7 86 99.6 43 99.6 9.6 55.1 110 55.1 130 S2.7 127 55.4 161 53.4 172 99.9 162 100 140 100 133 53.4 140 1.7 37.5 0.3 4 0.1 0.1 0.2 1
wt X ppad Ht X ppad Ht % pped wr X ppn d ppad ut X PP» <* ut X Ppad ut X .Ppad ut X ppad ut x ppad ut X ppn d ut X ppa d in % ppad ut X ppad ut X ppad Ut X PP"* ut X ppad Ht X ppn d Ht X ppad ut X ppad ut X PP» Ut X
PPJ> •3/L U ag/L u Ut X PP"
DATE SAMPLED
DATE TASK EERF3SD.4SV
16-FEI-94 16-FEB-94 16-FEB-94 16-FEH-94 16<FEI-94 16*KI-94 16-FEI-94 16-FEI-94 16-FM-S+ 1&-FEB-94 1&-FES-94 17-FEB-94 17-FE8-94 17-FE8-9* 17-FEB-94 15-FE1-94 15-FEI-94 16-FEB-9* 16-FEB-94 H-HI-94 16-FEI-94 16-FII-94 16-FEB-94 16-FEB-94 16-FE1-94 16-FES-94 16-FEB-94 16-FER-94 14-FEB-94 16-FEB-94 16-FE8-94 17-FEB-S* 17-FES-94 17-FEB-94 17-FEI-94 17-FE1-94 17-FE8-94 17-FEB-94 17-FEB-94 16-FEB-94 16-FEB-94 16-FEB-94 16-FU-94 16-FEB-94 16-FEB-S4 16-FEB-94 16-FEB-94
22-FU-94 8 26-FEI-94 • 22-FEH-94 8 27-FEI-94 I 22-FU-94 I 2S-KI-94 I 22-FU-94 • 27-FES-94 I 13-API-94 I 22-FEJ-94 8 27-FEB-94 8 22-FEI-94 8 26-FII-94 8 22-FEV94 • 08-NAR-94 I 22-FEB-94 8 27-FEJ-94 8 22-FEB-94 • 26-FEI-94 8 22*FtB*94 • 01-MAR-94 • 22-FES-94 • 26.FE8-94 8 2Z-FEB-94 8 26-FEB-94 • 22-FE1-94 • 01-MAR-94 8 2Z-FEB-94 I 27-FE1-94 8 22*RB-94 B 27-FEI-94 8 22-FE8-94 8 01-MAR-94 8 Z2-FEB-94 • 26-FE8-94 8 22-FU-94 I
25<ra-94 • 22-FEI-94 8 26-FU-V4 8 22*ra-94 • 02-HU-94 I 22-FE1-M • 0MM.-94 8 Ot-MAR-94 8 01-KAft-M 8 Z2-FEB-94 8 01-MAR-94 8
m BJMf^BFwwWaTV 181811
Tour Saltetlon Crfttrla WMI h l n M Nunbar: X Coapontnt: X-LR Froa Racatvtd oatt: X Display T«xt?
««•««»«««»««»»»«»»««»««««««»««««»««««""•««'»
Sufca)i»ion 10: Project Nana: 50.O5.08X9X-614X
151
FEB- 3-95 FRI 16:01 FERHCO ANALYTICAL FAX NO. 5137386667 P. 14
DATE 02-FE1-95 SUMMARY REPORT PACE 13 TIKE 11i5Z:33 (PRELIMINARY)
RELEASE UJKSE* : 1000001940 PROJECT KANE : 50.05.09 93-61* CRUS I/O TREAT-PHASE II
OATE DATE TASK LAB SAMPLE ID USER SAMPLE ID SAMPLE P0INT_ SUFFIX COMPONENT RESULT
1
UNITS
Pja U
SAMPLED PERFORMED AIL
(NOSCAHICI-EPN 200039932 94-6H-1259-T3 16 URANIUM
RESULT
1
UNITS
Pja U 17-FEB-W 2WEJ-94 B INOflCANICMPtl 200039933 94-6U«1260-TJ 17 URANIUM 1 ppo U 17-FM-94 Z5-FII-94 • INORGANICS-EPN 20003993* 94-614-1261-T3 13 URANIUM 1 pea U 17-FEB-94 2S-FEI-94 1 IWQRGAHICS-EPK 200039935 94-614-1262-T3 14 URANIUM 1 ppm u 17-FEB-94 2S-FEB-94 • IKOREANICS-fPM 200039934 94-614-1243-12 13 URANIUM 1 ppn u 16-FER-94 25-FIt-94 • 1N0RCANICS-EPM 200039937 94-614-1Z64-TZ 10 URANIUM 74 PP™ 17-FEI-94 28-FEB-94 B IHORGANICS-EPM 200039949 94-614-1269-T2 11C PH 8.10 PH Un 17-FEB-94 01-MAR-94 B MORGAN ICS-EPM 200039949 94-614-1Z69-TZ 11C SOLIDS 0.1 ut X 17-FEB-94 22-FEB-94 B MORQANICS-EPM 200039949 94-614-1249-T2 11C URANIUM 1 KM 17-FEB-94 OVMAR-94 B INORGANICS-EPM 200039950 94-614-1270-TZ 14 URANIUM 1 Pf« u 17-FES-94 25-KB-94 B IKORSAMICS-EFM 200039951 94-614-1271-T2 17 URANIUM 1 P Pa u 17-FEB-94 03-HU-94 B INORCANICS-EPM 200039952 94-614-1251-T3 IB PH 7.45 PH Un 16-FEB-94 Z7-FEB-94 B IKORGAXICS-EPM 200039952 94-61A-1251-T3 18 URANIUM 3 PP» 16-FEB-94 23-FEI-94 B INOROANICS-AA/I 200040001 94-614-1251-T3 IB ANTIMONY 60.0 ug/L u 16-FEB-94 24-FU-94 B IHORCANICS-AA/I 200040001 94-614-1251-T3 16 ARSENIC 10.0 ug/L u 16-KB-94 01-MAR-94 B UORGANICS-AA/I 200040001 94-614-12S1-T3 18 BERYLLIUM 5.0 U9/L u 16-FEB-94 24-FEI-94 B INORGANICS-JUL/1 200040001 94-614-1ZS1-T3 16 CADMIUM 5.0 ug/L u 16-FEB-94 24-FEI-94 B IHORCANICt-AA/I 2000(0001 94-614-1251-T3 18 CHROMIUM 14.6 US/L 16-FEB-94 24-FEB-94 B lNOROANICI-AA/l 200040001 94-614-1251-T3 18 COPPER 7S.6 U8/L 16-FEB-94 Z4-FEB-94 B INORGANICI-AA/I 200040001 94-614-12S1-T3 IB LEAD 54.0 ug/L 16-FEB-94 09-MAR-94 • 1U0RGANICS-AA/1 200040001 94-614-1251-T3 18 NICKEL 40.0 US/L u 16-FEB-W 2S-FEB*94 1 IKOtEAJilCI-AA/I 200040001 94-6K-1251-T3 18 SELENIUM 50.0 ug/L u 16-FEI-94 03-NAR-M • IMOAGANICS-AA/I 200040001 94-614-1251-T3 18 SILVER 11.5 ug/L 16-FEB-94 24-FU-94 B INORGANICS-AA/I 200040001 94-614-1251-T3 18 THALLIUM 40.0 ug/L u 16-FER-94 12-HAR-94 B 1N0RGAXICI-AA/I 200040001 94-614-I251-T3 18 ZINC 20.0 ug/L u 16-FEB-94 24-FER-94 B ITAS-STL 200042033 94-614-1247-T2 110 TOTAL SUS. SOLI 47.88 ng/L 17-FEB-94 B ITAS-STL 200042033 94-614-1267-T2 110 N URANIUM 17.7 ug/g 17-FEB-94 23-MAR-94 B MASS SPECTROSCO 200076060 94-614-1272 T9 1 URANIUM 234 4.0E+01 pci/g 15-FEB-94 04-AUQ-94 B MASS SPICTROSCO 200076060 94*614-1272 T9 1 URANIUM 235 1.3E»00 pCi/fl 15-FER-94 04-AUQ-94 B MASS SPECTROSCO 200076060 94-614-1272 T9 1 URANIUM 236 1.2E-01 pCi/g 15-FEB-V4 D4-AUG-94 B MASS SPECTROSCO 200076060 94-614-1272 T9 1 URANIUM 23B 2.9E«01 pci/g 15-FEB-M 04-AUS-94 B MASS tPECTROSeO 200076061 94-614-1273 T9 2 URANIUM 234 1.2E+01 pci/g 16-FEB-94 07-AUS-94 B MASS SPECTROJCO 200076061 94-614-1273 T9 2 URANIUM 235 6.6E-01 pct/s 16-FEB-94 07-AUC-94 8 MASS SPECTMSCO 200076061 94-614-1275 T9 2 URANIUM 236 2.8E-02 PCI/S u 16-FEB-94 07-AUQ-94 B MASS SPECTROSCO 200076061 94-614-1273 T9 2 URANIUM 238 1.4E+01 pCi/l 16-FEB-94 07-AU0-94 B MASS JPECTSOSCO 200076062 94-614-1274 T9 3 URANIUM 234 pci/g 16-FEB-94 B MASS tPECTROSCO 200076062 94-614-1274 T9 3 URANIUM 235 pci/g 16-FEB-94 B MASS SPiCTR0*CO 200076062 94-614-1274 T9 3 URANIUM 236 pH/g 16-FES-04 • MASS SPECTROSCO 20007(062 94-614-1274 T9 3 URANIUM 238 PCi/g 16-FEB-94 B NASI (PECTROSCO 200076063 94-614-1275 T9 4 URANIUM 234 3.5E*01 pct/g 16-FEB-94 OS-AUS-94 B MASS SPECTROSCO 200076063 94-614-1275 T9 4 URANIUM 235 1.5E+O0 pci/g 16-FE1-94 05-AUC-94 B MASS CPICTROSCO 200074063 94-614-1275 T9 4 URANIUM 236 6.2I-01 pci/g 16-FEB-94 05-AUG-94 B MASS SPECTROSCO 200078063 94-614-1275 T9 4 URANIUM 238 3.71*01 pCI/S 16-FEI-94 05-AUQ-M B MASS SPtCTROSCO 200076064 94-614-1276 T9 S URANIUM 234 3.6E+01 PCI/I 16-FEI-94 04-AUS-94 B M S I SMCTMICO 200076064 94-614-1276 T9 5 URANIUM 235 1.EE+00 pct/g 16-FM-94 04-AUC-94 I MASS SPECTROSCO 200076064 94-614-1276 T9 5 URANIUM 236 5.4E-01 pc>/g 16-FEB-94 04-AUS-94 B MASS SPECTROSCO 200076064 94-614-1276 T9 5 URANIUM 238 4.3E+01 PCi/g 16-FEB-94 04-AUG-94 B
«..p»».•»«..»««««.»«» £AAtAftftftftftt ft ft BlAftftftftftftAA ft ftftftftftftftftftftftftft."
Tour Selection criteria Uss> Release Nuebers Z Component: X-LR submission 10: X Projtet N I M : 50.05-08X9X-6HX rroa Received Dttti X Dlepley Text? N
152
FEB- 3-95 FRI 16:02 FERHCO ANALYTICAL FAX NO. 5137386667 P. 15
DATE TIME
02-JEB-95 11152:33
SUMMARY REPORT (PRELIMINARY)
PAGE 14
RELEASE NUMBER I 1000001940 PROJECT WAKE X 50.05.08 93-61* «U5 I/O TREAT-PHASE II
SAMPLE ID USEP SAHPIE ID SAMPLE POIHT SUFFIX COMPONENT
HAS* fPECTROSCO KASI IPECTROSCO MASS IPECTROSCO MASS (PECTROSCO MASS tPECTROSCO KASS tPECTROSCO KASS tPECTROSCO KASS SPECTROSCO MASS SPECTROSCO MAM IPECTROSCO HASI IPIGTROSCO KASS SPECTROSCO MASS SPECTROSCO KASS SPECTROSCO MASS SPECTROSCO KASS SPECTROSCO NAM IPECTROSCO KAII IPECTROSCO MASS SPECTROSCO MASS SPECTROSCO KASS SPECTROSCO KASS SPECTROSCO MASS IPECTROSCO KASI tPECTROSCO MAS! IPECTROSCO KASS SPICTAOSCO KASS SPECTROSCO KASI SPECTROSCO
200076065 200076065 200076065 200076065 200076066 200076066 200076066 200076066 200076067 200076067 200076067 200076067 200076068 200076068 200076068 200076068 200076069 200076069 200076069 200076069 200076070 200076070 200076070 200076070 200076071 200076071 200076071 200076071
94-616-1277 T9 6 94-614-1277 T9 6 94-614-1277 T9 6 94-614-1277 T9 6 94-614-1278 T9 7 94-614-1276 T9 7 94-614-1278 T9 7 94-614-1278 T9 7 94-614-1279 T9 8 94-614-1279 T9 8 94-614-1279 T9 8 94-614-1279 T9 8 94-614-1280 T9 9 94-614-1280 T9 9 94-614-1280 T9 9 94-614-1280 T9 9 94-614-1281 19 10 94-614-1281 T9 10 94-614-1281 T9 10 94-614-1281 T9 10 94-614-1282 T9 11 94-614-1282 T9 11 94-614-1282 T9 11 94-614-1282 T9 11 200076071 12 200076071 12 200076071 12 200076071 12
OATC DATI TASK COMPONENT RESULT
4.4E*01
UNITS LO
PM/B
SAMPLED PER FORKED Ast,
URAUIUH 234
RESULT
4.4E*01
UNITS LO
PM/B 16-FEB-94 08-A1M-94 • URANIUM 235 1.8E+00 PCi/9 16-FEI-94 08-AUG-94 • URANIUM 236 6.7E-01 pci/s 16-FEI-94 08-AUG-94 • URANIUM 238 4.2E*01 PCI/9 16-FEI-94 08-AUB-94 I URANIUM 234 4.2E+01 PCI/8 16-FE8-94 26-OCT-94 • URANIUM 235 2.2E+00 pCl/g 16-FEB-94 26-OCT-94 I URANIUM 236 6.9E-01 PCI/8 16-FEB-94 26-0CT-94 1 URANIUM 238 5.4E*01 pCf/s 16-FEB-94 26-0CT-94 B URANIUM 234 5.6E+01 PCI/S 16-FEB-94 07-AIK-94 1 URANIUM 235 2.6E*00 P«/8 16-FEB-94 07-AUO-94 I URANIUM 236 5.7E-01 pCi/g 16-FEB-94 07-AUG-94 • URANIUM 238 5.7E+01 PCI/8 16-FEB-94 07-AU0-94 I URANIUM 234 5.6E+01 pci/s 17-FEB-94 05-AUG-94 • URANIUM 235 2.5E*00 pCi/s 17-FEB-94 05-AUG-94 • URANIUM 236 5.51-01 pCi/O 17-FU-S4 05-AUS-M • URANIUM 238 5.4C*01 PCi/g 17-FEB-94 05-AUG-94 B URANIUM 234 8.7E*00 pct/g U 17-FU-94 05-AUa-94 • URANIUM 235 2.1E*00 PCJ/9 17-FEB-94 05-AUQ-94 1 URANIUM 236 9.1E-0Z PCi/g U 17-FEB-94 OS-AUO-94 • URANIUM 238 4.7E*01 pCi/8 17-FE8-94 05-AUS-94 B URANIUM 234 9,0£»01 PCf/B 17-FEB-94 19-OGT-94 • URANIUM 235 1.9E*00 pCi/fl 17-FEB-94 19-OCT-94 1 URANIUM 236 1.1E*00 PCI/8 17-FEI-M 19-0CT-94 B URANIUM 238 4.4E+01 PCI/B 17-FEI-94 19-0CT-94 I URANIUM 234 6.2E+01 PCJ/9 17-FEI-94 04-AUQ-94 • URANIUM 235 2.2E*00 pci/a 17-FEB-94 04-A1U-94 • URANIUM 236 5.9E-01 PCI/9 17-FEB-94 04-AUQ-C4 B URANIUM 238 4.7E+01 PCI/8 17-FEB-94 H-AlK-94 1
Your Itltetlen Crlttrii V u i Rclui* NUBbtri X Frai itccivad Ost*i X
Ca*pentnt: X-lR Otcplay Ttxt? N
Subilssion ID: X
153
Projtct HWMI 50.05.08X9X-614X

FEB- 3-95 FRI 16:43 FERHCO ANALYTICAL FAX NO. 5137386667 P. 01
B»TE 02-FEB-95 TIME H : S 2 t 3 3
SUHHART REPORT (PRELIM HAim
PAGE 15
RELEASE NUM8ER t 1000002055 PROJECT NAME I 50.05.08 93-614 CRUS I/O TREAT-PHASE II
• DATE DATE TASK w SAMPLE ID USER SAMPLE ID SAMPLE POINT SUFFIX COMPONENT RESULT UNITS 10 SAMPLED PERFORMED ASL
INORCAHICS-EPM 200042890 94-614-1331-T1 5 PH 7.30 pH un 28-FEI-94 16-NM-94 I INORGANICS-EPM 200042890 94-614-1331-T1 5 SOLIDS 1.5 wt X 28-FEB-9* 09-MAR-94 I INORGANICS-EPM 200042890 94-614-1331-T1 5 URANIUM 24 PP" 28-FEB-94 16-HU-94 • IKORSANICS-EPH 200042891 94-614-1331-T1 S DENSITY 1.00 fl/Kl 2B-FEI-94 13-HAX-94 1 INORGANICS-EPM 200042892 94-614-1332-T1 SYS SOLIDS 5.8 wt X 2B-FII-94 09-KAR-94 8 INORGANICS-EM 200042892 94-614-133Z-T1 SYS URANIUM 39 PP* 2S-FEI-94 1S-HAI-94 1 INORGANICS-EPM 200042893 94-614-1332-T1 8YL PH 8.35 pH un 2B-FES-9* 12-HAR-94 I INORGANICS-EM 200042893 94-614-1332-T1 STL URANIUM 19 ppm 28-FEI-94 13-MAR-94 • INORGANICS-EM 200042894 94-614-1333-T1 IS URANIUM 0.4 PP» 28-FII-94 13-MAR-9* • INORGANICS-EM 200042895 94-614-1349-T1 Ft URANIUM 0.1 •9/L U 01-HAR-94 13-MAR-94 • INORQWICS-EM 200042894 94-614-1336-T1 11A PH 9.19 pH Un 28-FIB-94 16-MAR-94 t IHORSANICS-EPM 200042896 94-614-1336-T1 11A SOLIOS 1.8 ut X 2B-NS-94 09-MI-94 8 INORGANICS-EM 200042896 94-614-1336-T1 11A URANIUM 37 PP" 28-FEI-94 16-MAR-94 I IKORCAKICS-EPM 200042897 94-614-1340-T1 111 PH 9.25 pH un 28-FEB-94 16-KU-94 • INORGANICS-EM 200042897 94-614-1340-T1 111 SOLIDS 0.3 ut X 28-FEB-94 09-MAR-94 • INORGANICS-EM 200042897 94-614-1340-T1 111 URANIUM 4 PP" 28-FEB-94 16-KU-94 I INORGANICS-EM 200042898 94-614-1332-T1 82L PH 9.20 pH Un 28-FEI-94 16-MAA-94 I IHOtOANICS-EPK 200042698 94-614-1332-T1 8ZL SOLIDS 1.6 wt X 28-FEI-9* 09-KU-94 1 INORGANICS-EM 200042898 94-614-1532-T1 8ZL URANIUM 34 ppn 28-FEB-94 16-HAI-94 • IKOROAHICS-EM 200042899 94-614-1341-T1 11L PH 8.67 pH Un 01-HU-94 16-HAR-94 • MOROAHICl-EPM 200042899 94-614-1341-T1 11L . SOLIOS 0.2 Ht X 01-KAR-94 09-MM-94 B IHORGANICS-EPN 200042899 94-614-1341-T1 11L URANIUM 2 PP" 01-MAR-94 16-MAR-9* B INORGANICS-EM 200042900 94-614-1372-T1 11A PH 9.24 pH Un 03-KAR-94 16-MAR-94 • INORGANICS-EM 200042900 94-614-1372-T1 11A SOLIDS 1.8 wt X 03-KAI-94 09-MAR-9* B IIIOtOAKtCS-IPH 200042900 94-614-1372-11 11A URANIUM 38 PP" 03-KAX-94 16-HAR-K • INORGANICS-EM 200042901 94-614-1375-T1 111 PH 9.18 pH un 03-MAR-94 16-HAR-94 B INORGANICS-EPM Z00042901 94-614-1375-T1 111 SOLIDS 0.3 wt X 03-MAR-94 09-KAR-94 B INORGANICS-EM 200042901 94-614-1375-T1 111 URANIUM 4 PP™ 03-MAR-94 16-MAR-94 B INORGANICS-EPM 200042902 94-614-1378-T1 11C PH 9,05 pH Un 03-KAR-94 16-KAI-94 B INORGANICS-EM 200042902 94-614-137I-T1 11C SOLIOS 0.1 ut X 03-MAB.-94 09-MAI-94 B INORGANICS-EM 200042902 94-614-1378-T1 11C URANIUM 1 PP" U 03-MAR-94 16-MAR-9* B INORGANICS-EM 200042903 94-614-1332-T1 8TS DENSITY 1.03 S/"l 28-FEB-94 13-MAR-94 B IKOfiOANICS-EM 200042904 94-6U-1332-T1 SZS DENSITY 1.04 S/»l 28-FEB-94 T3-KAR-94 B W0RGAN1CS-EPM 2000*2905 94-614-1363-T1 8TS DENSITY 1.0Z g/al 02-HAR-94 13-MAR-94 8 INOICANICI-EPM 200042906 94-614-1369-T1 82S DENSITY 1.06 9/»l 02-HM-94 15-HAS-9* 1 IHORGAIIICS-EPM 20OO42907 94-614-1HM1 8ZS SOLIOS 7.6 wtX M-FEB-9* 09-NJU-94 • IKORGANICS-EPN 200042907 94-614-1332-T1 SZS URANIUM 5 PP» 28-FEB-9* 17-MAR-94 B INORGANICS-EM 200042909 94-614- 1369-T1 BZS SOLIDS 7.8 wt X 02-MAR-94 09-MAR-94 B INORGAXICS-EPH 200042909 94-614-1369-T1 SZS URANIUM 47 PP» 02-MW-94 22-MAI-94 B INORGANICS-EM 200042910 94-614-1361-T1 J SOLIDS 0.6 wt X 02-MAR-94 09-NAI-94 B INOROAHICB-EM 200042910 94-614-1361-T1 5 URANIUM 2 PP" 02-HAR-94 Z6-HAR-94 B INORGANICS-EM 2000*2911 94-614-1363-T1 8YS SOLIDS 5.5 wt X 02-MAR-94 09-NAR-94 • INORGANICS-EM 200042911 94-614-1363-T1 8YS UUNIUH 46 Ppn 02-MAR-94 07-APR-94 B INORGANICS-EM 200042912 94-614-1332-T1 85 PH 9.31 pH Un 28-rEB-94 14-MAR-94 R INORGANICS-EPM 200042912 94-614-1332-T1 8$ URANIUM 27.7 PP" Z8-FEB-94 13-MM-94 B INORGANICS-EM 200042913 94-614-1332-T1 815 PH 9.30 pH Un 2B-FEB-94 14-MAR-94 B INORGANICS-EM 200042913 94-614-1332-T1 815 URANIUM 28.9 PP" 28-FEB-94 13-KAR-9* B
M»M*MMMr****»m •o«»a»»*****>**o<ai»i m i t t t n a M M m Tour Selection CrlttMa Uast
•aluce Nuafeer: X Ceopenants X-LR Sitaistien 10: X Projtct Nana: 50.0S.08X9X-614X ftem Racaivtd Data: X O U p U y Taxt? U
154
FEB- 3-95 FRI 16:44 FERHCO ANALYTICAL FAX NO. 5137386667 P. 02
DATE TIME
02-KB-9S 11152:33
SUMMARY REPORT (PRELIMINARY)
PACE 1 6
RELEASE NUMBER I 1 0 0 0 0 0 2 0 5 5 PROJECT NAME t S 0 . 0 S . 0 5 9 3 - 6 1 4 CRU5 l / D TREAT-PHASE I I
LiJ. SAMPLE ID USER IAHPLE ID SAMPLE POINT SUPHK COMPONENT .
IHORCANICS-EPM IHORGANICS-EPM IMORGAHICS-EPH 1N0RGAHIC1-EPM INOROAHICS-EM IKORQAHICS-EPH IHORCAH1CS-EPH INORCAHICS-EPH IHORCANICS-EPM INOROAMICS-EPM lKORGAHIGI-CPM IKOROANtCS-tPM INORGAHICS-IPH INORGAHICS-EPM IHORCANICS-EPM IHORGAMICS-EPN IWORGANICS-EPM IHORCANICl-EM INORGAHICS-EPM IHOROANICS-EPH INOftCAMICS-EPM INORCANICS-EW lUORSAHICt-EPM INOROAMICS-CPM INORSAHICS-IPM INOROANICt-tPM IMORSAMICS-EPH INOCOAUICI-Cm INOROANICS-tPH INORSANICS-IPH lUORGANlCS-tPM INOROANICt-EPH IHORQANICS-IPM
i N O R O A N i e s - c m IHORSAHICS-IPH IHORGANICt-EPM INORCAMICJ-IPM INOROAlliet-EPH IHOROANIU-IPH IMORQAHlCt-IPM 1HORGANICS-EPM 1HOROAMIU-IPN INORCAUICS-m IkORCANIM-IN IKORGANICS-EPM IHORGAHICS-EPM INORQAHICt-EPH
2000(2914 200042914 200042915 200042915 2000(2916 200M29W 200042917 200042917 2000(2918 200042918 2000(2919 2000(2919 2000*2920 200042920 200042921 2000(2921 200042922 200042923 200042924 200042925 200042926 200042927 200042928 200042929 200042930 200042931 200042932 200042933 200042937 200042937 200042938 200042938 200042939 200042939 200042939 200042940 200042940 200042941 200042941 200042942 2000(2942 200042942 200042943 200042943 20OIM2944 200042944 200042945
94-414 94-614 94-614 94-614 94-614 94-414 94-614 94-614' 94-614 94-614 94-614 94-614' 94-614' 94-614' 94-614' 94-614' 94-614' 94-614-94-614-94-614-94-614-94-614-94-614-94-614-94-614-94-414-94-614-94-614' 94-614-94-614-94-614-94-614-94-614-94-614-94-614-94-614-94-614-94-614-94-614-94-614-94-614-94-614-94-614' 94-614-94-614-94-614-94-614-
•1332-T1 830 •1332-T1 830 •1332-T1 860 -1332-T1 860 •1364-T1 8TL •1364-T1 8YL •136S-T1 83 •1365-T1 85 •1366-T1 815 -1366-T1 81S •1367-T1 830 •1367-T1 830 •136B-T1 860 -136B-T1 860 •1370-T1 821 •1370-T1 BZl -1343-T1 14 •1347-T1 17 -134B-T1 16 •13S6-T1 12 •1357-T1 13 •1362-T1 15 •1376-T1 16 •1382-T1 14 •1383-T1 17 -1350-T1 RB •13B4-T1 H •1385-T1 RB '1330-T1 6 •1330-T1 6 •1335-T1 19 •1335-T1 19 •1337-T1 29 •1337-T1 29 •1337-T1 29 •1339-T1 90 •T339-T1 90 •1334-T1 80 •1334-T1 80 •1344-T1 10 •1344-T1 10 1J44-T1 10 •13S1-T1 1 •1351-Tt 1 1352-T1 2 1352-T1 2 1355-T1 81
Your ( a t a c t i o n C r l t a r f a Vaa: Ralaaaa Kunbars X Frea Raeatvsd Oatat X
Conponantx X-LR D i s p l a y Taxt?
PH URANIUM PH URANIUM
PH URANIUM PH URANIUM PH URANIUM PH URANIUM PH URANIUM PH URANIUM URANIUM URANIUM URANIUM URANIUM URANIUM URANIUM URANIUM URANIUM URANIUM URANIUM URANIUM URANIUM SOLIDS URANIUM
SOLIDS URANIUM PH SOLIDS URANIUM SOLIDS URANIUM SOLIDS URANIUM SOLIDS URANIUM URANIUM
SOLIDS
URANIUM
SOLIDS URANIUM SOLIDS
SUtnUfion IDl X
DATE DATE TASK
EOtiLT UHtTS LQ SAMPLED PERfORHEO ASL
9.30 pH Un 28-FEB-94 14-MAR-94 B a . 9 ppO 28-KB-94 13-KAR-94 • 9.28 pH Un 28-FE8-94 14-MAR-94 B 32 ppra 28-FEI-94 13-XAR-94 1
7.59 pH un 02-KAR-94 K-HAR-94 1
19 PP» 0 2 - H U - t t 13 -M I -94 1
9.36 pH un 02-KAR-94 14-MAR-B4 B 32 ppn 02-NAR-94 13-MU-94 B 9.36 pH Un 02-KAR-94 16-KU-94 B 32 PP» 02-MAR-94 13-KAI-94 B 9.35 PH Un 02-MAR-94 14-KU-94 B 35 PP* 02-HAR-94 13-HU-94 B 9.34 pH un OZ-MAR-94 14-HAR-94 B 36 PP" 02-HAR-94 13-KU-94 B 9.32 pH Un 02-MAR-94 U-MAR-94 B 37 PP» 02-MAR-94 13-MAR-94 1 1 ppa U 01-MAR-94 13-MAR-94 B 1 ppa U 01-HAR-94 U-XAX-94 B 1 PP» U 01-KAR-94 14-KAR-94 B 1 PpB U 02-MAR-94 14-HU-94 • 1 ppa U 02-KAR-94 14-MAR-94 1 1 ppn U 02-KAR-94 14-HAR-94 B 1 ppa U 03-MAR-94 14-MU-94 B 1 ppn U 03-KAR-94 tt-KAA-94 B 1 ppn U 03-MAR-94 U-MAR-94 B 0.1 ng/L U 01-KAR-94 14-HU-94 B 0 .1 • 9 / L U 03-MAR-94 15-KAR-94 B 0.1 • s /L u 03-KAR-94 1S-MR-94 B 64.6 wt X 28-FES-94 09-KAR-94 B 590 p p a d 28-FES-94 15-KU-94 B 54.5 ut X 28-FEB-94 09-HM-94 B 250 p p a d 28-FE1-94 15-WR-94 B 9.18 pH Un 28-FEB-M 16-NAR-94 B 1.8 ut X 2B-FEB-94 09-KAR-K B 37 PP> 28-rEB-04 K-HAR-94 B 54 .6 u t X ZS-FEI-W 09-KU-94 B 180 p p a d 2 8 - K I - 9 4 15-HM-94 B 54 .7 Ht X 2S-FIB-94 09-MAR-94 B 230 p p n d 28-FEB-94 1S-KM-94 B 52 .0 u t X 01-NAR-94 09HUR-94 B 169 p p a d 01-MAR-94 16-HAR-94 B 151 p p a d 01-KAR-94 26-KAV-94 1 81.4 wt X 02-KAR-94 09-HM-94 B 8 (0 p p a d 02-HAR-94 15-KU-94 B
68.0 UCX 02-KU-94 09-KU-94 • 150 ppa d 02-MAR-94 18-MAR-94 B 78.3 Ht X 02-HM-94 09-MM-94 B
Project Nana: 50.05.08X9X-614X
155
FEB- 3-95 FRI 16:46 FERHCO ANALYTICAL FAX NO. 5137386667 P. 03
DATE TIKE
02-FEI-95 11:52:33
SUMMARY REPORT (PRELIMINARY)
PACE 17
RELEASE KW8ER 1 1000002055 PROJECT NAME J 50.05.0* 93-614 CRU5 I/O TREAT-PHASE II
UL. SAMPLE ID USER SAMPLE IP SAMPLE POINT SUFFIX COMPONENT RESULT UNITS Lj}_ DATE .SAMPl£P_
DAT! TASK PERFORMED AIL
INORGAHICS-IPM IRORCANiet-EPM INOAGAHICI-IPM INORQAHICS-IPN
lUORGAHieS'EPH IN0RGAN1CS-EPM IKORCANICS-EPM IHSRGANICS-EPH INORSANICS-EPM INORGAHICS-EPN' INCKGANICS-EPM 1N0RGAHICS-EPH IKORGAMICS-IPH IN0R.0AN1CS-EPM INOROANICS-EPM INORGANICS-AA/t lKORCAHICS-AA/i JRORGAMICS-AA/l 1N0RGRNICS-AA/I INOXQAMICS-AA/1 IlfORCANICS-AA/l INORGAMICS-AA/t INORSAHICS-AA/l IKORGAMICS-AA/I 1N0R6ANICS-AA/I INORCAHICS-AA/1 INORHUJlCS-AA/t INOROANICS-EPH INORCANICS-EPM IHOUAMICf-AA/I INOROANICS-AA/I IN0R8AN1CS-AA/1 INORCANICt-AA/l IHORCAMICS-AA/I INORGANICS-AA/t INOXOAHICS-AA/I IltORSANIM-AA/1 IN0R6ANICS-A4/t INORSAXICS-AA/l INOABANlCS-AA/l IKORGAHlCJ-AA/l IHORGAMICS-AA/I INORCAWCS-EPM lUORSANICS-EPM
200042945 200042946 200042946 200042947 200OU947 200042948 200042948 200042949 200042949 2000(2950 2000(2950 200042951 2000(2951 2000(2952 2000(2952 200042953 2000(2953 2000(2953 2000(2953 2000(2953 200042953 200042953 200042953 2000(2953 2000(2953 2000(2953 2000429S3 200042954 200042954 200042955 200042955 200042955 200042955 20004295S 200042955 2000(2955 200042955 200042955 200042955 200042955 200042955 200042955 200042957 200042957
94-614' 94-614 94-614 94-614' 94-614' 94-614 94-614-94-614 94-614 94-614' 94-614 94-614' 94-614' 94-614 9 4 - 6 U 94-614 94-614' 94-614' 94-614' 94-614-94-614 94-614-94-614-94-614-94-614' 94-614-94-614-94-614-94-614 94-614' 94-614-94-614-94-614-94-614-94-614-94-614-94-614-94-614-94-614-94-614-94-614-94-614-94-614-94-614-
•135S-T1 81 •1358-T1 82 -135B-T1 62 •1360-T1 6 •1360-T1 6 •1371-T1 80 •1371-T1 80 •1373-T1 19 •1373-T1 19 •1374-T1 90 •1374-T1 90 •1379-T1 10 •1379-T1 10 •1386-T1 29 •1386-T1 29 •1342-T1 18 •1342-T1 18 '1342-T1 18 •1342-T1 18 •1342-T1 18 •1J42-T1 18 •1342-T1 18 •1342-T1 18 •1342-T1 18 •1342-T1 18 -1342-T1 18 •1342-T1 18 •1342-T1 16 •1342-T1 18 •1377-T1 18 •1377-T1 18 1377-T1 18
•1377-T1 18 •1377-T1 18 •1377-T1 18 •1377-T1 •1377-T1 •1377-T1 •1377-T1 •1377-T1 18 •1377-T1 18 1377-T1 11 •1377-T1 18 1377-T1 18
18 18 18 IB
URANIUM SOLIDS URANIUM SOLIDS
US AM UN
SOLIDS URANIUM SOLIDS URANIUM SOLIDS URANIUM SOLIDS URANIUM SOLIDS URANIUM ANTIMONY ARSENIC •ERYLLIUH
CADMIUM CHROMIUM COPPER LEAD NICKEL SELENIUM SILVER THAU I UN 2INC PH URANIUM ANTIMONY ARSENIC 9ERYLLIUM CADMIUM CHROMIUM COPPER LEAD LEAD NICKEL SELENIUM SILVER THALLIUM ZINC PH URANIUM
740 41 .7 190 54.1
780 S9.6 393 59.8 230 56.4 140 S0.8 100 49.8 97 60.0 11.6 5.0 5.0 29.0 96.8 89 .7 40.4 5.0 14.6 100 156.2 9.36 13 60.0 10.0 5.0 5.0 38.2 139.2
72.4 41.9 5.0 20.0 100.0 156.9 9.43 15
P P " d ut X ppnd Mt X
ppnd ut x pp" d ut X p p a d ut X ppo d ut X ppo d ut X pprad ug/L U ua/L ug/L U ua/L u UB/L uj/L ug/L ug/L ug/L U ug/L ug/L U ug/L pH Un PP» ug/L ug/L ug/L ua/L ug/L ug/L ug/L ug/L ug/L ua/L u ug/L ug/L U-ug/L pH Un PP*
U u U u
OZ-MAR-94 02-MAR-94 02-MAA-94 02-KAR-94 02-KAR-94 0 3 - M A R - N 03-MM-94 03-MAR-94 03-KAR-94 03-MAR-94 03-HAR-94 03-MAR-94 03-HAR-94 03-HAR-94 03-MAR-94 01-MAR-94 01-MAR-94 01-MAR-94 OI-MAR-94 01-MAR-94 01-HAR-94 OI-MAR-94 OI-MAR-94 01-KAR-94 OI-MAR-94 OI-MAR-94 01-KAR-94 01-MAR-94 OI-MAR-94 03-HAR-94 03-KAR-M 03-KAR-94 03-MAR-94 03-MAR-94 03-MAR-94 03-MAR-94 03-HM-94 03-MAR-94 03-MAR-94 03-KAR-94 03-MAR-94 03-MAR-94 03-MAR-94 03-RAR-94
16-KAR-94 • 09-MAR-94 I 16-MAR-94 • 09-HU-94 • 15-KM-94 • 09-MAR-94 I 16-MAR-94 I 09-KAR-94 • 26-MAR-94 I 09-MAR-94 • 16-MAR-94 • 09-MAR-94 I 14-KAR-94 I 09-MAR-94 I 14-NAI-94 • 09-MM-94 B 16-MAR-94 I 09-MAR-94 • 09-HM-M • 09-MAR-94 B 10-KAA-94 8 12-MAR-94 B 0 9 - K A R - M B 29-IUR-94 B 09-MAR-94 B 19-API-94 B 15-MAR-94 B 09-MAR-K B 09-MAR-94 B 09-MAR-94 B W - N M - K B 09-MAR-94 B 09-MAR-94 R 09-MAR-94 B 10-MAR-94 B
B 12-MAR-94 B 09-MM-94 B 29-MAR-94 B 09-MAR-94 | 20-APR-94 B 15-MAR-94 B 09-KAR-94 B 0a-KAR-94 B
Tour ftlactlon criteria Was: Balaam Nirbtri X Frea ttcatvtd Data: X
Caaponanti X-LR Display Text?
«***o*»*«*******a**o***
Subafeslen ID: Project Nil 50.05.08X9X-614X
156
FEB- 3-95 FRI 16:47 FERMCO ANALYTICAL FAX NO. 5137386667 P. 04
DAT! 02-fEI-95 SUMMARY REPORT PACJ 18
TIKE 11:52:33 (PRELIMINARY)
RELEASE KUHBER > 1000002116 PROJECT NAME : 50.0S.08 93-616 CflUS I/O TREAT-PHASE I I
DATE DATE TASK
<•«» SAMPLE 10 USER SAMPLE 10 SAMPLE POINT SUFFIX COHPONEKT RESULT UNITS 10 SAMPLED PERFORMED ASL
lHOAGAHICI-IPM 200044720 94-614-1390-T0 2 SOLIDS 94.3 wt Z 07-MAR-94 16-MAR-94 1
INOROAHICS-EPH 200044720 94-614-1390-T0 2 URANIUM 32 ppn d 07-MAR-94 23-MAR-94 B
IN0R6ANICS-EPK 200044720 94-614-1390-T0 2 URANIUM 31 p p a d 07-MAR-94 1B-APR-94 •
INORGANICS-EPN 200044721 94-614-1388-T1 62 SOLIDS 44.9 wt X 07-HAR-94 16-MAX-94 B
IKMSMIICS-EPK 200044721 94-614-138S-T1 82 URANIUM 169 p p n d 07-MAR-94 12-APR-94 I INORSANICS-EPM 200044722 94-614-1389-TO 1 SOLIDS 80 .7 wt X 07-MAR-94 16-MAR-94 B
INOAQANICS-EPM 200044722 94-614-13S9-T0 1 URAHIUH 525 p p a d 07-MAR-94 13-AM-94 • II10RGANICS-EPM 200044722 94-614-1389-TO 1 URANIUM 679 ppad 07-HAR-94 15-APR-94 I
IHORGAHICS-EPH 200044723 94-614-1396-T0 81 SOLIDS 76.7 wt X 07-KAR-94 16-KU-94 8 INOXOANICS-EPtt 200044723 94-614-1396-T0 81 URANIUM 1140 p p a d 07-HAR-94 12-AM-94 8 IHOROAN1CS-EPM 200044724 94-614-1397-T0 6 SOLIDS 65.1 wt X 07-MAR-94 16-KU-94 •
IKORSANJCS-EPM 200044724 94-614-1397-T0 6 URANIUM 535 PP" d 07-HAR-94 12-AM-94 B INORCANICS-EPM 200044725 94-614- 1344-TO 80 SOLIDS 45 .2 wt X 09-MAR-94 16-KU-94 B IKORSANICS-EPH 200044725 94-614-1344-70 80 URANIUM 120 ppra d 09-MAR-94 23-HAR-94 • IMOROAMICS-EPH 200044726 94-614-1346-T0 19 SOLIOS 48.3 wt X 09-MAR-94 16-HU-94 B ttfOROUHCS-EPM 200044726 94-614-1346-TO 19 URANIUM 215 P p a d 09-MAR-94 12-APR-94 B IHORflAHIGI-EPM 200044727 94-614-1393-T0 12 UXANIUH 1 PPa U 07-MAR-94 23-MAR-94 B lUOHOUtlCt-IPH 200044728 94-614-1340-T0 5 PH 7.31 pH Un 08-MAR-94 22-KAR-94 • lHOAQAUIU-IPN 200044728 94-614-1340-TO 5 SOLIDS 1.1 wt X 08-KAR-94 16-HAR-94 B mauumcs-CH 200044728 94-614-1340-T0 5 URANIUM 26 PP» 08-MAR-96 24-MAI-94 B IKOROANICS-EPH 200044729 94-614-1340-T0 S DENSITY 1.02 S/ml 03-MAR-94 05-AM-94 8
IHORGAM1CS-EPM 200044730 94-614-1341-TO 8ATL m 7.45 pH Un OS-KAR-94 17-KAR-94 • INORGANICS-EPM 20004(730 94-614-1341-TO BAYl URANIUM 2.5 PPa 08-HAR-94 Z4-HAR-94 B maiaAHiM'EPH 200044731 96-614-1342-T0 RB URANIUM 0 .1 tiJ/L U 08-MAR-94 25-KAR-94 B INORGAHICI-IPH 200044712 94-614-139S-T0 13 URANIUM 0.2 Ppn 07-MAR-94 Z5-KAR-94 B IttOROAHICS-EPH 200044733 94-614-1399-T0 15 URANIUM 0.3 PP" 08-MAR-94 24-KAI-94 I INORBANICS-IPM 200044734 94-614-1341-T0 BAYS SOLIOS 4 . 1 wt X 08-MAR-94 16-MAR-94 B lKORCANICS-EPH 200044734 94-614-1341-TO SAYS URANIUM 50 ppn 08-HAR-94 24-KAR-94 I IWMGAMICS-EPH 200044735 94-614-1341-TO 8BYS SOLIDS 3 .1 wt X 08-HAR-94 16-KU-94 B IHOAOAHICS-EPM 200044735 94-614-1341-TO 88YS URANIUM 50 PP" 08-MAR-94 24-HAX-94 B
WMWlCi-m 20004(7)6 94-614-1341-TO 8CYS SOLIDS 1.2 w t X 03-HAR-94 16-HM-94 B
imumci-m 200044736 94-614-1341-TO 8CYS URANIUM 65 PPR 08-MU-94 24-RU-94 1
IHOASAHItt-EPH 200044737 94-614-1S45-T0 11A PH 9.26 pH Un 09-KAR-94 22-KU-94 • 1NOAGAHICB-EPM 20004*737 94-614-1345-TO 1 U SOLIDS 1.9 wt X 09-MAR-94 16-MAR-94 B IHOROAHICt-EPH 200044737 94-614- 1345-TO 11A URANIUM 36 ppm 09-HAK-94 24-M4R-94 • IKORUUdet-EFH 200044738 94-614-1341-TO SAYS OEMSITY 1.02 9/mX Ca-KNt-94 05-AM-94 B INORCAHICS-EPH 200044739 94-614-1341-TO 8SY5 DENSITY 1.Q3 tt/ml Oa-NAR-94 OS-APA-94 B INORGANICS-EPM 200044740 94-614-1341-TO 8CYS DENSITY 1.03 9 /a l 08-KAR-94 03-APB-94 B IKORGAHICt-EPH 200044741 94-614-1J41-T0 88YL PH 7.07 pH Un 08-KAR-94 17-HM-94 8
IHORQAUICS-IPM 200044741 94-614-1341-TO 8BYL URANIUM 3 PP" 08-NAR-94 2S-MAR-94 B
IHOROANICI-EPM 200044742 94-614-1341-TO 8CYL PH 7.10 pH un 08-MAR-94 17-KAR-94 8 MOREAHICS-CPM 200044742 94-6U-1341-T0 *CYL URANIUH 3 ppn 08-MAR-94 23-KU-94 8 IHORCAMlCS-ePH 200044743 94-614-1341-TO 8E5 PH 9.29 pH Un 08-MAR-94 17-KU-94 B JNOBOAHICB-EMt 200044743 94-614-1341-TO 8E5 URANIUM 30 PP» 08-MAR-96 25-RAR-94 B lHOACAHlCS-EPM 200044744 94-614-1341-TO 8F5 PH 9.28 PH Un 08-MAR-94 17-MAR-94 B HHJRBANICS-fPM 200044744 94-614-1341-TO 875 URANIUM 29 PP" 08-MAR-94 23-MAR-94 R
INORGANICS-EM 200044745 94-614-1341-TO 8E30 PH 9.26 pH Un OS-MAR-94 17-MAR-94 B I I I I I I I I I M U I H I H M #A • * ) • > • ptsi • • • • • • •< • • *>
rour s t t t e t f o n C r i t e r i a V u i R a l U S * Kuobars X . Ceopancnt: X-LR Sifcnicsion ID: X Projtet Mane: 50.05.0EX7X-614X
from Raealvad Datai X Display T u t ? u
157
FEB- 3 -95 FRI 16:49 FERHCO ANALYTICAL FAX NO. 5137386667 P. 05
DATE TIME
02-FEB-95 11:52:33
RELEASE NUMBER PROJECT NAME
SUMMARY REPORT (PRELIMINARY)
P A * 19
t 1000002U6 : 50.05.08 93-614 CRUS I/D TREAT-PHASE II
IAB
IN08CAHICS-EPN INMSANICS-EFW IMOKSAMICS-EPM 1N0RGANIC1-EPM INOXOANICS-EPH INORCANICS-EPN INORGANICS-EM* INORGANICS-EPN
SAMPLE 10 USER SAMPLE 10 SAMPLE POINT
2000(4745 94-614-1341-TO 8E30 20004*746 94-414-1341-TO 8HO 200044746 94-614-1341-70 8F30 2000*4747 94-614-1341-T0 8E60 200044747 94-614-1341-TO BE60 200044748 94-614-1341-TO 8P60 2000U748 94-614-1341-TO 8F60 200044749 94-614-1342-T0 FB
DATE DATI TASK SUFFIX COMPONENT RESULT
34
UNITS LO SAMPLED PERFORMED ASL
URANIUM
RESULT
34
UNITS LO
OS-KAR-94 23-HAR-94 • PH 9.26 pH Un 08-HAR-94 17-MAA-94 B URANIUM 35 PP» 08-MAR-94 25-HAR-94 I PH 9.26 pH Un Oa-HAR-94 17-HAI-94 8 URANIUM 34 ppn 08-KAR-94 23-HAR-94 • PH 9.25 pH Un 08-MAI-94 17-HAR-94 8 URANIUM 36 PP" 08-MAR-94 23-MAA-94 8 URANIUM 0.1 W / L U 08-MAR-94 25-MAI-94 8
Tour Salactlen c r t t t r i a Vast M l a a u Nuabari X Fro* Mcalvad Datai X
CeopoMnti X-LR OUplsy Ttxt?
Sltaitliion IOJ X
158
Project Nam: 50.05.0SXM-4UX
FEB- 3-95 FRI 16:49 FERMCO ANALYTICAL FAX NO. 5137386667 P. 06
DATE TIKE
02-FEB-95 11:32i33
SUMMARY REPORT (PRELIMINARY)
PACE 20
RELEASE NUMKR I PROJECT HAKE I
1000002252 50.05.08 93-614 CRUS I/O TREAT-PHASE 12
LAB SAMPLE 10 USER SAHPH ID SAMPLE POINT SUFFIX COMPONENT
MORCAHICS-EPM IKORQANICI-EPH IHORGAMICS-EPM IKORCAHICS-EPM lUORCAMICS-EPH INOROAHICS-EPtt INOEGANICS-EPM INOROANICS-EPH IMORGAMICS-EPM INORGAHICS-EPH lUORQANICt-EPH IMOROAUICS-EPM INORCANICS-EPM 1N0R0AHICS-EPM IMOROAHICS-EPM INOROANICS-EPH INORGANICS-EM IMORCAMICS-EPM IMORCANICS-EPN lUOROAMICI-EPK IN0R0AN1CS-EPM IUORGAHICS-EPH IMOACANICS-CFM IIKXQAHICS-EPM IMORGAMCS-EPM IKORSAHICS-EPM IN0R6ANICS-EP* IMORGANICS-EPN. IUORGAHICS-EPH INORCANICS-EPM IHORGAXICS-EPM IHORGAHICI-EPN IHORGANICS-EM IHORSAHieS-EPH IWOROAHlCt-EPM. INORGANICS-EM UOROANICS-EPtt IHORSAMICS-EPM INOftCAHICS-EPH lNOKGAMCI-EPK INORGAHICS-EPM INORGANICS-U*
200048499 20OO48SO0 2O0OW500 200048501 200048502 200048502 200048503 200041504 20004B505 200048506 200048507 200046507 200048508 200048508 200048508 200048509 200048510 200048510 200048511 200048511 200048512 200048512 2000*8513 200048513 200048514 200048513 200.048515 200048515 200048521 200048521 200048522 200048522 200048522 200048523 200048523 200048524 200048524 200048525 200048525 200048525 200048526 200048526
94-614-94-614-94-614' 94-614-94-614-94-614-94-614-94-614-94-614-94-614-94-614-94-614-94-614-94-614-94-614-94-614-94-614-94-614-94-614-94-614-94-614-94-614-04-614 94-614-94-614-94-614-94-614-94-614-94-614-94-614-94-614-94-614-94-614-94-614-94-614-94-614-94-614-94-614-94-614-94-614 94-614-94-614
•1437 T1 15 1438 T1 SYS 1438 T1 8YI 1438 T1 8YS
-1438 T1 8YL •1438 T1 BYL -1453 Tt F l -1456 T1 14 •1457 T1 16 •1458 T1 17 •1438 T1 BZS 1438 T1 8Zt
•1438 T1 8ZL •1438 T1 SZL •1438 T1 8ZL •1438 T1 8Z I •1438 T1 85 •1438 T1 85 •1438 T1 815 •1431 T1 815 •1438 T1 830 •1438 T1 830 •1438 T1 860 •1438 T1 860 •1454 T1 RE •1439 T1 11A •1439 T1 11A •1439 T1 11A •1441 T1 19 •1441 T1 19 •1442 T6 27 •1442 T6 27 •1442 T6 27 •1444 T8 82 •1444 TO 82 1446 T1 90
•1446 T1 90 •1448 T1 10 1448 T1 10
•1448 T1 10 •1459 T1 82 •1459 T l 62
URAHIUH SOLIOt
URAHIUH.
DENSITY PH URANIUM URANIUM URANIUM URANIUM URANIUM SOLIDS URANIUM PH SOLIDS URANIUM DENSITY PH URANIUM PH URANIUM
PH URANIUM PH URANIUM URANIUM PH SOLIDS URANIUM SOLIDS URANIUM SOLIDS URANIUM URANIUM SOLIDS URANIUM SOLIDS URANIUM SOLIDS URANIUM URANIUM SOLIDS URANIUM
OATE DATS TASK RESULT UNITS LQ SAMPLED PERFORMED ASL
1 ppa U 29-MAR-94 06-AM-94 I 4.3 Wt X 29-MAR-94 06-AM-94 8 102 PP™ 29-NAR-U Oi-API-94 8 1.04 g/Bl 29-HAR-94 05-APR-94 8 7.10 pH un 29-MAR-94 06-APR-94 8 30 PC" 29-MAR-94 06-APR-94 8 0.1 •O/l U 30-HU-94 04-APR-94 I 1 ppa " 30-KAR-9& 06-APR-94 B 1 ppa U 30-KAR-94 06-AP8-94 I 1 ppa U 30-HM-94 06-AM-94 8 7.3 ut X 29-MAR-94 06-AM-94 I 103 PP» 29-HAR-94 06-RPR-94 B 9.41 pH Un 29-KAR-94 06-APR-94 • 1.8 ut X 29-MAR-94 06-AM-94 • 87 PP» 29-KAR-94 06-APR-94 B 1.0S 8/»l 29-MAR-94 05-AM-94 I 9.41 pH Un 29-MAX-94 06-AFR-94 • 69 PP" 29-KAR-94 06-AP8-94 8 9.41 pH Ml 29-KAR-94 06-AM-94 8 76 Ppa 29-KU-94 W-APR-94 S 9.40 pM Un 29-KM-94 06-APR-94 B 78 PP» 29-MAR-94 07-AM-94 8 9.40 pH un 29-KAR-94 06-APR-94 8 82 PP" 29-MAR-94 06-AM-94 6 0.1 ne/L u 30-MAR-94 04-AM-94 B 9.40 pM Un 29-HAR-94 06-AM-94 8 2.0 ut X 29-NAR-94 06-AM-94 8 84 PP» 29-KAR-M 07-APA-94 • 56.2 ut X 29-KAR-94 07-AM-94 8 296 PP» 29-MAR-94 C8-API-94 1 38.1 ut X 29-KAR-M 07-AK-94 B 129 PP" 29-KAR-94 13-APR-94 B 525 ppad 29-KAR-94 13-APR-94 B 38.8 ut X 29-HAR-94 07-AM-94 B 277 PP" 29-KAR-94 08-AM-94 B 52.6 ut X 29-KAR-94 07-APR-94 B 184 ppad 29-MAR-94 08-AM-94 B 47.4 ut X 30-KAR-94 07-AM-94 8 166 PP"d 3Q-KAR-94 08-APR-94 8 198 ppad 30-KAR-94 26-MAT-94 B 45.6 ut X 31-RAR-94 07-AM-94 B 267 ppad 31-HAJt'M 08-APR-94 I
Your t i t tct len Crittrta U I I : R t l i i M mnbari X Fron Rtctlwd Data: X '
Coopontnt: X-LR Display TaxtT
Subllssion ID:
159
Project Nanat 50.05.08X9X-614X
FEB- 3-95 FRI 16:50 FERMCO ANALYTICAL FAX NO. 5137386667 P. 07
DATE 02-FEB-95 SUWIARY REPORT PME 21 TIKE 11:52:33 (PRELIMINARY)
UlEASE K*8E» S 1 0 0 0 0 0 Z 3 « PROJECT HAKE : 5 0 . 0 5 . 0 8 93-614 CMS I/D TREAT-PHASE II
DATE DATE TASK
• • • M U S I I in u c » « I V D I P in t u r n * DMUT tiirm COHPONPHT RESULT UMTS LQ SAMPLED PCKFQPJgp ASL
160

3-95 FRI 16:53 FERHCO ANALYTICAL FAX NO. 5137386667
02-FEB-95 11iS2i33
SUXHART REPORT (PRELIMINARY]
RELEASE NUMBER : 1000002342 PROJECT NAME : 50.05.08 93-614 CMS I/O TREAT-PHASE II
LA|_ SAMPLE ID USER SAMPLE ID SAMPLE POINT
ITAS-«TL 200051431 94-614-1420-T8 110 ITAS-tTL Z000S1431 94-614-U20-T8 110 ITAS-STL 200051432 94-614-1451-T1 110 ITAS-JTL 2000S1432 94-614-1451-T1 110 1TAS-ITL 200051433 94-614-1387-T1 110 ITAS-tTL 200051433 94-614-1387-T1 110 ITAS-STL 200051434 94-614-133B-T1 111 ITAS-STL 200051434 94-614-1338-T1 111
P. 01
PAGS 22
OATE OATE TASK SUFFIX COMPONENT RESULT
NR
UNITS LC
Ht X
_ SAMPLED PERFORMED ASl
SOLIDS
RESULT
NR
UNITS LC
Ht X 17-MAR-94 0 URANIUM 67.8 us/g 17-MAR-94 22-APR-94 0 SOLIOS NR « X 30-NAR-94 D URANIUM 328 ug/B 30-MAR-94 22-APR-94 D SOLIDS NR ut X 03-KAR-M 0 URANIUM 110 "S/0 03-KAA-94 22-APR-94 0 TOTAL SUS. SOLI 115 ng/L 28-FEI-94 19-APR-9* C URANIUM 37400 ug/L 28-FEB-94 21-AM-94 6
your (tlwtion Crltarta Was: Ralaaaa Nutban X Pre* Raealvad Data: X
Carponanti X-LR Display Text?
••ft**4*»***#**«******«***»
Submission ID: X Project Nam: 50.0S.08X9X-614X
161
FEB- 3-95 FRI 16:54 FERHCO ANALYTICAL FAX NO. 5137386667 P.02
DATE 0Z-FE8-95 SUHHARY REPORT TIKE 11:52:33 (PRELIMINARY)
RELEASE MMBER : 1000002365 PROJECT MAKE : 50.05.08 03-614 CRUS I/O TREAT-PHASE II
DATE LAB SAWie ID USER SAMPLE 10 SAMPLE POINT SUFFIX COMPONENT RESULT UNITS iO
YES/N
SAMPLED
HANFORD 200052295 19940415-295 T 1 SHIPPED
RESULT UNITS iO
YES/N 13-APR-94 HARFORD 200052296 19940415-296 T 17 SHIPPED YES/M 13-APR-94 KANFORO 200052297 199*0*15-297 T 4 SHIPPED YES/H 13-APR-94 HARFORD 200052293 19940415-298 T 16 SHIPPED YES/U 13-APR-04
PAGE 23
DATE TASK
Tour Salactlon CMtaria Was: RilMM Nuabtri X Coopontntt X-LR Sutariaaion ID: X Projtet Uarae: 50.05.08X9X-M4X Froa Racaivad Datat X Dlaplay Taxr? N
162
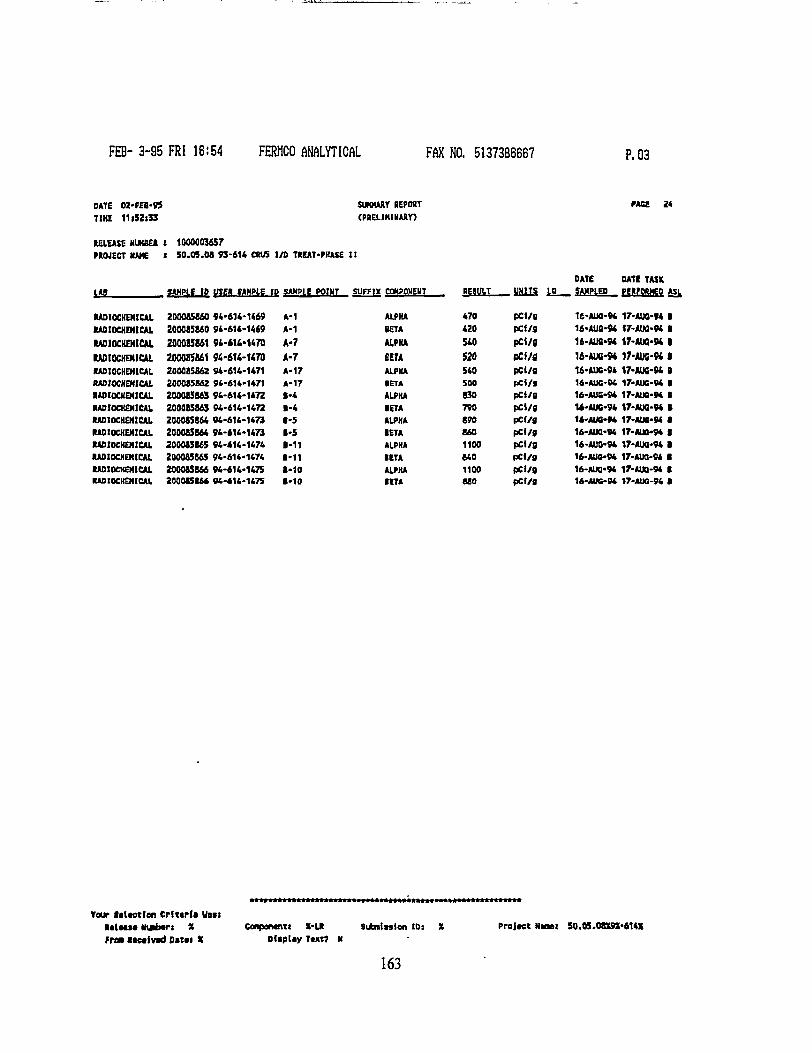
FEB- 3-95 FRI 16:54 FERHCO ANALYTICAL FAX NO. 5137386667 P. 03
DATE 02-FEB-95 SUMMARY REPORT PACE 24 TIHI 11iSZ>33 (PRELIMINARY)
RELEASE UUHSa t 1000003657 PROJECT NAME I 50.05.08 93-614 CRUS 1/D TREAT-PHASE II
DATE DATE TASK i*» SAMPLE IP USER (AMPLE I IP SAMPLE POINT SUFFIX COMPONENT RESULT UNITS LQ
470 pCI/g
SAMPLED PERFORMED ASL,
RADIOCHEMICAL 200065860 94-614-1*69 A-1 ALPHA
RESULT UNITS LQ
470 pCI/g 16-AU0-94 17-AU0-94 I RADIOCHEMICAL 200085860 94-614-1469 A-1 BETA 420 PCJ/9 16-AU6-94 17-AIM-94 1 RADIOCHEMICAL 200085861 94-414-1470 A-7 ALPHA 540 PCJ/9 16-AUfi-M 17-AUG-94 1 RADIOCHEMICAL 200085861 94-614-1470 A-7 SETA 520 pCi/fl 16-AUC-M 17-AUS-M 1 RADIOCHEMICAL 200085862 94-614-1471 A-17 ALPHA 540 pCi/g 16-AUG-94 17-AUS-94 B RADIOCHEMICAL 200085B6Z 94-614-1471 A-17 1ETA 500 pct/s 16-AUG-94 17-AUC-94 • RADIOCHEMICAL 200085863 94-614-1472 1-4 ALPHA 830 P«/9 16-AUS-94 17-AU0-94 I RADIOCHEMICAL 200085863 94-614-1472 B-4 IETA 790 pc«/g 14-AO0-S4 17-AUC-94 B RADIOCHEMICAL 200085864 94-614-1473 ••5 ALPHA 870 p"/a 16-AUQ-M 17-A08-W • RADIOCHEMICAL 200085864 94-614-1473 1-5 IETA 860 pct/o 16-AUQ-94 17-AUQ-94 • RADIOCHEMICAL 200085865 94-614-1474 B-11 ALPHA 1100 pci/g 16-AU0-94 17-AUG-94 • RADIOCHEMICAL 200085665 94-614-1474 •-11 •ETA 640 pC«/8 16-AUB-94 17-AUQ-94 I RADIOCHEMICAL 200085866 94-614-1475 1-10 ALPHA 1100 pci/g 16-AU0-94 17-AU0-94 1 RADIOCHEMICAL 2000SSS66 94-414-1475 1-10 •ETA 880 pCI/9 16-AUC-M 17-AU6-94 t
Your (•ttetlon CMt t rU Uai: I I I H M Miafatrt X from Atetivad D i t i i X
Cenponcntt X-LR Dltplay Tut?
Subnttsion ID> Prajtet Naast 50.03.O8X9X-614X
163
FEB- 3-95 FRI 16:55 FERMCO ANALYTICAL FAX NO. 5137386667 P.04
BATE 02-FEI-95 SUMMARY REPORT 'ACE 23 TIKE 11:52:33 (PREIIHIHARYJ
RELEASE KUK8H t 1000003891 PROJECT NAME : 50.OS.OS 93-614 CRUS 1/D TREAT-PHASE II
DAT! DATE TASK LAB SAMPLE ID VISgR SAMPLE ID SAMPLE POtUT SUfMX COHPOMEWT RESULT UHITS ip. SAMPLED PERFOBMEB ASl
RADIOCHEMCM. 200093511 94-614-1*76 A-9 ALPHA 320 pC»/s OB-AUG-94 09-SEP-94 I RADIOCHEHICAL 200093511 94-614-1476 A-9 BETA 260 pcl/g 0S-AUQ-94 W-SEP-W I
Tour Mlcetlon Crlttrfa Vast M I m i Niacw: X Coopontnti X-Ut subolssion IDt X Project Nmti S0.0S.08X9X-614X Proa lacatvad Date X Display TaxW N
164
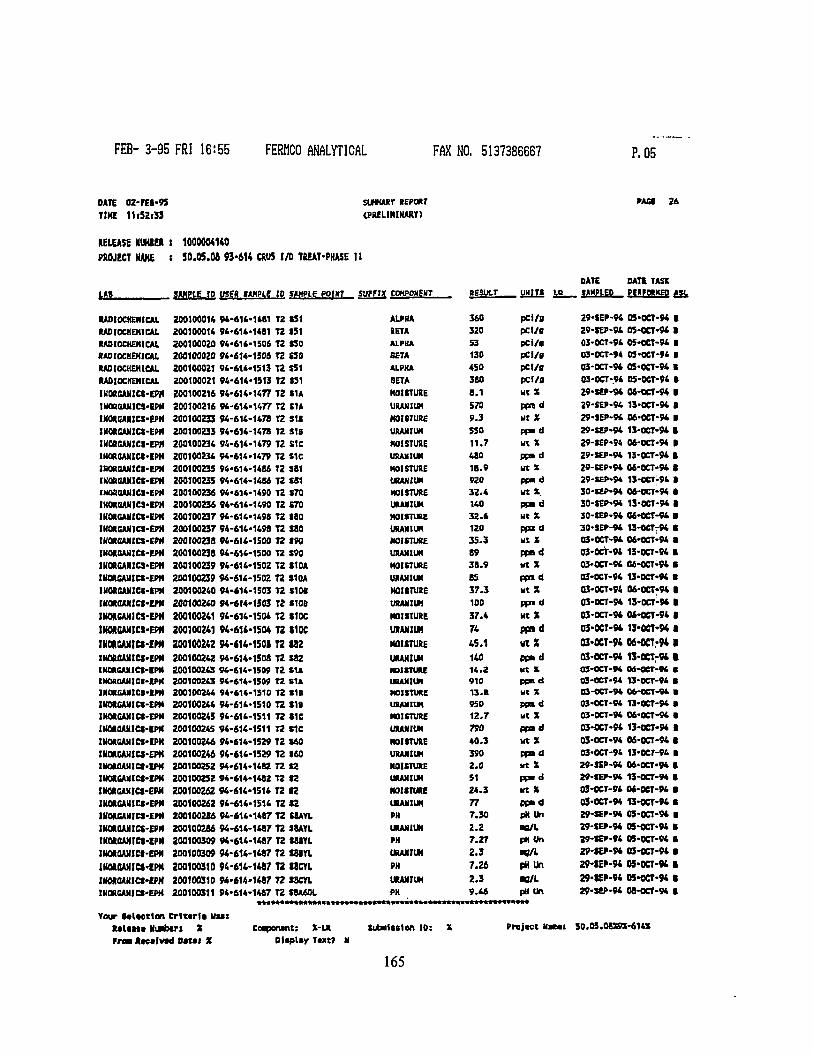
FEB- 3-95 FRI 16:55 FERMCO ANALYTICAL FAX NO. 5137386667 p. 05
OATE 02-re«>9S SUHKART REPORT PAGE 26 TIKE 11«52t3J tPAELIHINARY)
RELEASE MUHin : 1000004140 PROJECT HAKE s 90.05.08 93-614 CRUS I/O TREAT-PHASE II
OATE DATS TASK LAB. SAHPtt_to yseq SAHPIE to SAMPLE POIHT supfijt COWOHENT . RESULT UHITS I Q SAMPLED PIRPORMEO A M .
RADIOCHEMICAL 200100014 94-614-1481 T2 SSI ALPHA 360 PCI/B 29-SEP-94 05-OCT-94 • RADIOCHEMICAL 2001000U 94-614-1481 T2 151 BETA 320 pcl/g 29-SEP-94 C5-0CT-94 1 RAOIOCKEHtCAL 200100020 94-614-1506 TZ SSO ALPHA 53 pci/t 03-OCT-94 05-OCT-94 B RAOfOCHEHICAL 200100020 94-614-1S06 T2 SSO BETA 130 pCi/s 03-OCT-94 05-OCT-94 • RADIOCHEMICAL 200100021 94-614.1513 T2 SS1 ALPHA 450 pCi/fl 03-0CT-94 05-0CT-94 B RADIOCHEMICAL 200100021 94-614-1513 TZ SSI BETA 380 pCi/B 03-0CT-.94 05-OCT-94 B IHMGAHICS-EPH 200100216 94-614-1477 T2 S1A MOISTURE 8.1 Ut X 29-SEP-94 06-OCT-94 • IMOaaAUICS.EPM 200100216 94-614-1477 T2 S H URANIUM 570 Ppm d 29-SEP-94 13-0CT-94 B IKORGAHICS-EPH 200100233 94-614-1478 TZ SIS MOISTURE 9.3 wt X 29-SEP-94 06-0CT-94 • IMOBGANICS-EPM 200100233 94-614-1478 T2 SIB URAHIUM 550 ppad 29-SEP-94 13-0CT-94 B lMORGAHICI-EPH 200100234 94-614-1479 T2 S1C MOISTURE 11.7 Ut X 29-SEP-94 06-OCT-94 B 1HORQAKICI-IPH 200100234 94-614.1479 T2 S1c URANIUM 480 PP» d 29-SEP-94 13-0CT-94 B IHORQAMICS-EPM 20010023S 94-614-1486 T2 S81 MOISTURE 18.9 ut X 29-SEP-94 06-0CT-94 8 IKQRGAKICC-EPH 200100235 94-614-1466 T2 SSI URANIUM 920 ppad 29-SEP-94 13-0CT-94 B IUORQAHICS-EPN 200100236 94-614-1490 T2 S70 HOISTURE 3Z.4 ut X. 30-SEP-94 06-OCT-94 6 IKOROANICS-EPH 200100236 94-614-1490 T2 S70 URANIUM 140 pod 30-SEP-94 13-0CT-94 B IHORGAHICS-EPH 200100237 94-614-1498 TZ SSO MOISTURE 32.6 ut X 30-SEP-94 06-OCT-94 • IK08.CAH1CS-EPM 200100237 94-614-1498 T2 SSO URANIUM 120 ppad 30-SEP-94 13-0CT-94 • INORCAHICS-EPM 200100238 94-614-1500 T2 190 MOISTURE 35.3 ut X 03-0CT-94 06-OCT-94 • IMOAOAHICS-EPM 200100238 94-614-1500 T2 S90 URANIUM 89 ppn d 03-0CT-94 13-0CT-94 B 1HORGAHICS-EPM 200100239 94-614-1502 TZ S10A HOISTURE 38.9 wt X 03-0CT-94 06-OCT-94 B IKORSAUICS-EPM 200100239 94-614-1502 T2 S10A URANIUM 85 ppid 03-KT-94 13-OCT-94 • IUORGAHICS-EPM 200100240 94.614-1503 T2 S10S HOISTURE 37.3 Ht X 03-OCT-94 06-OCT-94 I IKOROAKICf-EPPl 200100240 94-614-1503 T2 S10B URANIUM 100 ppnd 03-OCT-94 13-OCT-94 I IHORGAHICS-EPH 200100241 94-614-1504 T2 S10C MOISTURE 37.4 Ht X 03-0CT-94 04-0CT-94 B IHOftGAHlCI-EP* 200100241 W-614-1504 T2 HOC URANIUM 74 ppad 03-0CT-94 13-0CT-94 • IKOKGANIC9-EM4 2001002(2 94-614-1501 T2 S82 MOISTURE 45.1 HtX 03-KT-94 06-OCT-W • IHORQAMICS'EPM 200100242 94-614-1508 T2 S82 URANIUM 140 ppad OJ-OCT-94 1S-0CT-94 I IKORGAHICt-IPM 200100243 94-614-1509 T2 S U MOISTURE 14.2 ut X (B-OCT-94 06-OCT-94 • INORGAMICS-EPM 200100243 94-614-1509 T2 S U URANIUM 910 PfKd 03-OCT-94 13-0CT-94 B MOROAHICS-IPM 200100244 94-614-1310 TZ 11B MOISTURE 13.8 ut X 03-OCT-94 06-OCT-94 • IKORCAMICS-EPM 200100244 94-614-1510 T2 SIS URANIUM 950 ppad 03-OCT-94 13-OCT-94 • IHORGAHICS-EPM 200100245 94-614-1511 TZ SIC MOISTURE 1Z.7 ut X 03-0CT-94 06-0CT-94 B lUOROAHies-EPH 200100245 94-614-1511 T2 SIC URANIUM 790 ppad 03-OCT-94 13-OCT-94 B IHORCAHICS-IPM 200100246 94-614-1529 TZ S60 MOISTURE 40.3 ut X 03-OCT-94 06-OCT-94 B lUXGAHICS-EPH 200100246 94-614-1529 TZ 860 URANIUM 390 ppad 03-OCT-94 13-0CT-94 B IHOROAHICS-IPM 200100252 94-614-1482 T2 S2 MOISTURE 2.0 ut X 29-SEP-94 06-0CT-94 B IMORGAHICS-EPM 200100252 94-614-1482 TZ S2 URANIUM 51 ppad 29-SEP-94 13-OCT-94 B IHORGAHICS-EPH ZO0100262 94-614-1514 T2 S2 MOISTURE 24.3 ut X 03-0CT-94 Ot-0eT-94 B IKORGAHICS-EPP] 200100262 94-614-1514 TZ 82 URAHIUN 77 pptd 03-OCT-94 13-CCT-94 B INOACAHICS-EPM 200100286 94-614-1487 TZ S8AYL PH 7.30 pHUn Z9-SEP-94 05-0CT-94 B IUORGAIIICC-EPM 200100266 94-614-1487 T2 SBAYL URANIUM 2.2 •0/L 29-SEP-94 OS-OCT-94 B IHMOAHlCt-lPM 200100309 94-614-1487 TZ SSIYL PH 7.27 pHUn 29-SEP-94 05-0CT-94 B lUORaAHICI-EPP) 200100309 94-614-1487 T2 SSIYL URANIUM 2.3 •9/1 29-SEP-94 03-OCT-94 B IMOROAMICI'tPM 200100310 94-614-1487 T2 SICYl PH 7.26 pHUn 29-SEP-94 05-0CT-8* I IMORSAHICt'tPM 200100310 94-614-1487 T2 SSCYL URANIUM 2.3 •O/L 29-SEP-94 05-OCT-94 B IMORGANICS-EPK 200100311 94-614-1487 T2 S8A60L PH 9.46 pH un 29-S8P-94 08-OCT-94 B
IS&9JJ9iBYtvB)S¥BiBl(BBlB)tlBkftt?SrtlB)tf
Your Salaetlon Criteria Uu i Ra ima NUMbtrt X Ceapontnt: X-U Subnttaien 10: X Projact Uamti S0.05.08X9X-614X from Aacafvad Datai X Display Ttxt? N
165
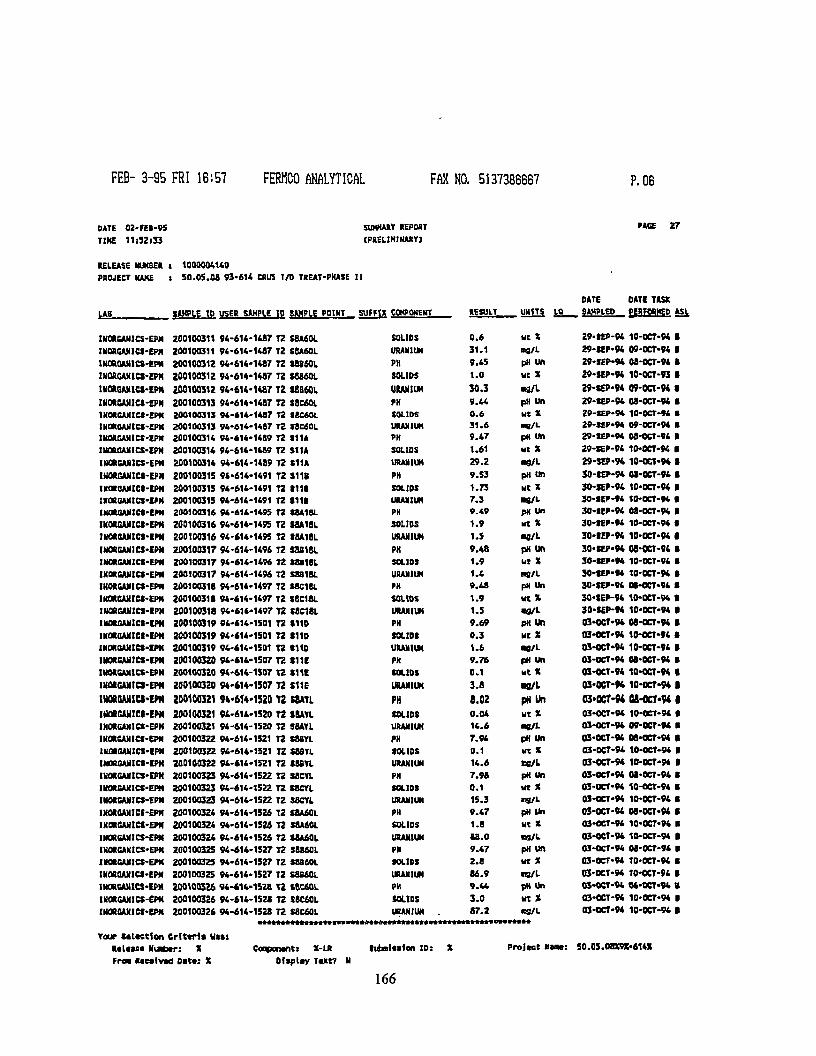
FEB- 3-95 FRI 16:57 FERHCO ANALYTICAL FAX NO. 5137386667 P. 06
DATE TIKE
02-FEI-95 11:S2i33
SUMMARY REPORT (PRELIMINARY)
FACE 27
RELEASE NUMBER 1 1000004140 PROJECT KANE I 50.0S.08 93-614 CRUS I/O TREAT-PHASE II
DATE OAT! TASK
LAB
IKORCANICS-EPM
SAMPLE ID USER SAHPLE ID SAMPLE PQIUT SUFFIX COMPONENT RESULT UNITS LQ SAMPLED PERFORMED ASL LAB
IKORCANICS-EPM 200100311 94-614-1487 T2 SBA40L SOLIOS 0.6 ut X 29-SEP-04 10-OCT-94 •
INORGANICI-EPtt 200100311 94-614-1487 T2 S8A60L URANIUM 31 .1 ag/L 29-SEP-94 09-0CT-94 •
1K0RGAHICS-EPM 200100312 94-614-1487 T2 S8S60L PH 9.45 pH un 29-1EP-94 08-OCT-94 (
IK0R6ANICS-EPM 200100312 94-614-1487 T2 S4860L SOLIOS 1.0 ut X 29-S8P-94 10-OCT-93 •
1N0XGMIICI-EPM 200100312 94-614-1487 T2 SSB60L URANIUM 30.3 •SA 29-SEP-94 09-0CT-94 • U0R6JUUCS-EP". 200100313 94-614-1487 T2 S8C60L PH 9.44 pH Un 29-SEP-94 08-0CT-94 •
1X0RCAHICS-EPM 200100313 94-614-1487 T2 SSC60L SOLIDS 0.6 u t X 29-SEP-94 10-OCT-ft • INORGAHICS-EPM 200100313 96-614-1487 T2 S8C60L URANIUM 31.6 «aA 29-SEP-94 W-OCT-94 • 1K0RGAH1CS-EPN 200100314 94-614-1489 T2 SUA PH 9.47 pH un 29-SEP-94 08-OCT-94 8
IMORGANICS-EPH 200100314 94-614-1489 T2 SUA SOLIOS 1.61 ut X 29-SEP-94 10-OCT-94 I
tWOtOUilCS-EPN 200100314 94-614-1489 T2 S11A URANIUM 29.2 • 9 / L 29.SEp.94 10-OCT-94 •
IKORGAXIU-EPM 200100315 94-614-1491 T2 SUB PH 9.53 pH Un 30-SEP-94 0I-0CT-94 I
UtOROANtCt-EPM 200100315 94-614-1491 T2 1111 SOLIOS 1.73 ut X 30-SEP-94 10-OCT-94 I INORSANICS-IPM 200100315 94-614-1491 T2 S i l l URANIUM 7.3 • 9 / 1 - 30-SEP-94 10-OCT-94 • INOROANICS-EPtt 200100316 94-614-1495 T2 (8A1SL PH 9.49 DM Un 30-SEP-94 C8-OCT-94 t IKOtGANlCS-EPN 200100316 94-614-1495 T2 S8A18L SOLIDS 1.9 ut X 30-SEP-94 10-OET-94 • 1HOR0AHICS-IPM 200100316 94-614-1495 T2 IBA18L URANIUM 1.5 • 8 / L 30-IEP-94 10-OCT-W •
IN0RGAN1CS-CPM 200100317 94-614-1496 T2 S8818L PH 9.48 pH tin 30-SEP-94 08-OCT-94 • INORGMIICI-EPM 200100317 94-614-1496 T2 S8B18L SOLIOS 1.9 ut X 30-SEF-V4 10-0CT-94 • INORGAVICS-EPN 200100317 94-614-1496 T2 S8818L URANIUM 1.4 ng/L 30-SEP-94 10-0CT-94 • INORCANICS-EPM 200100318 94-614-1497 T2 S8C18L PH 9.48 pH Un 30-SEP-94 OS-OCT-94 •
IKORGAHICS-EPH 200100311 94-414-1497 T2 S8C18L SOLIOS 1.9 ut X 30 -KP-94 10-OCT-W • IH0RGAM1C1-IPM 200100318 94-614-1497 T2 S8C18L URANIUM 1.5 ag/L 30-IEP-94 10-OCT-94 • IN0R0AN1CI-IPM 200100319 94-414-1501 T2 S11D PH 9.69 pHUn 03-0CT-94 08-OCT-94 • INORGANICI-IPM 200100319 94-414-1501 T2 1110 SOLIDS 0.3 ut X 03-OCT-94 10-OCT-94 • 1N0R0AHICS-EPH 200100319 94-414-1501 T2 S11D URANIUM 1.6 • O A 01-CCT-94 10-0CT-94 • INOROAHieS-EPN 200100320 94-616-1507 T2 SHE PH 9.76 pH Un 03-OCT-94 M-OCT-94 • IHORBUICS-EPM 200100320 94-614-1507 T2 SUE SOLIDS 0.1 u t X 03-OCT-94 10-OCT-94 • lUOtQAHICS-EPN 200100320 94-614-1507 T2 SUE URANIUM 3.8 •S/L 03-OCT-K 10-OCT-94 I IHORGAMIU'EPN 200100321 94-614-1520 72 S8ATL PH 8.02 pHUn 03-0CT-94 M-OCT-M 1 IUORCAHICI -EPM 200100321 94-614-1520 T2 SSAYL SOLIDS 0.04 ut X 03-OCT-94 10-0CT-94 * INORBANICS-EPM 200100321 94-614-1520 T2 SBAYL URANIUM 14.6 •B/L 03-OCT-94 09-0CT-94 •
INORSANICS-EPN 200100322 94-614-1521 T2 SSBYL PH 7.94 pH Un 03-0CT-94 M-OCT-94 • INORSAMICS-IPM 200100322 94-614-1521 TZ S8BYL SOLIDS 0.1 ut X 03-0CT-94 10-OCT-94 • INORCAHICt-lPH 200100322 94-614-1521 T2 SBBYl URANIUM 14.6 a g / l 03-0CT-94 10-0CT-94 1 HORGANICS-EPH 200100323 94-614-1522 TZ S8CYL PH 7.98 pH Un 03-OCT-94 M-DCT-94 ( IWXSAHICS-EPM 200100323 94-614-1522 T2 S8CYL SOLIOS 0 .1 ut X 03-OCT-94 10-OCT-94 • IKOIGANICS-EPN 200100323 94-614-1522 T2 3SCYL URANIUM 15.3 ng/L 03-OCT-94 10-0CT-94 •
lMOROAMIU-EPM 200100324 94-614-1526 T2 SBA60L PH 9.47 pH Un 03-OCT-94 08-OCT-94 • UORGANICS-EPM 200100324 94-614-1526 T2 S8A60L SOLIDS 1.8 ut X 03-OCT-94 10-OCT-94 •
INOREANICS-EPM 200100324 94-614-1526 TZ S8A60L URANIUM 18.0 ng/L 03-0CT-94 10-0CT-94 •
KORCANICS-EPM 200100325 94-614-1527 T2 SB860L PH 9.47 pH On 03-OCT-94 08-0CT-94 • UraROANICS-EPH 200100325 94-614-1527 T2 S8B60L SOLIDS 2 .8 ut X 03-0CT-94 10-0CT-94 •
IHOROAHICI-EPM 200100325 94-614-1527 T2 S8B60I URANIUM 86.9 ng/L 03-OCT-94 10-0CT-94 »
INORCAHICS-EPM 200100326 94-614-1528 T2 S8C60L PH 9.44 pH Un Q3-0CT-94 06-0CT-94 a
INORGANICS-EPH 200100326 94-614-1521 T2 S8C60L SOLIDS 3 .0 Ut X 03-0CT-94 10-OCT-94 I
IKOR&AMieS-EPX 200100326 94-614-1528 T2 S8C60L URANIUM 87.2 • 9 / L 03-OCT-94 10-OCT-94 I « « t « M « « « t a « « « — i « « « « f <«»«««»»«««»«««» ft MAC flat AAA A t AAAAAAAAA
Your tattction C r l t t r l a Wit t R t l t w i h a t e r : X Coaporwnt: X-LR SliratMlon 10: X Project Nana: 50.05.08X9X-614X
Fraa Raealvad Data: X Display T«xt7 N
166
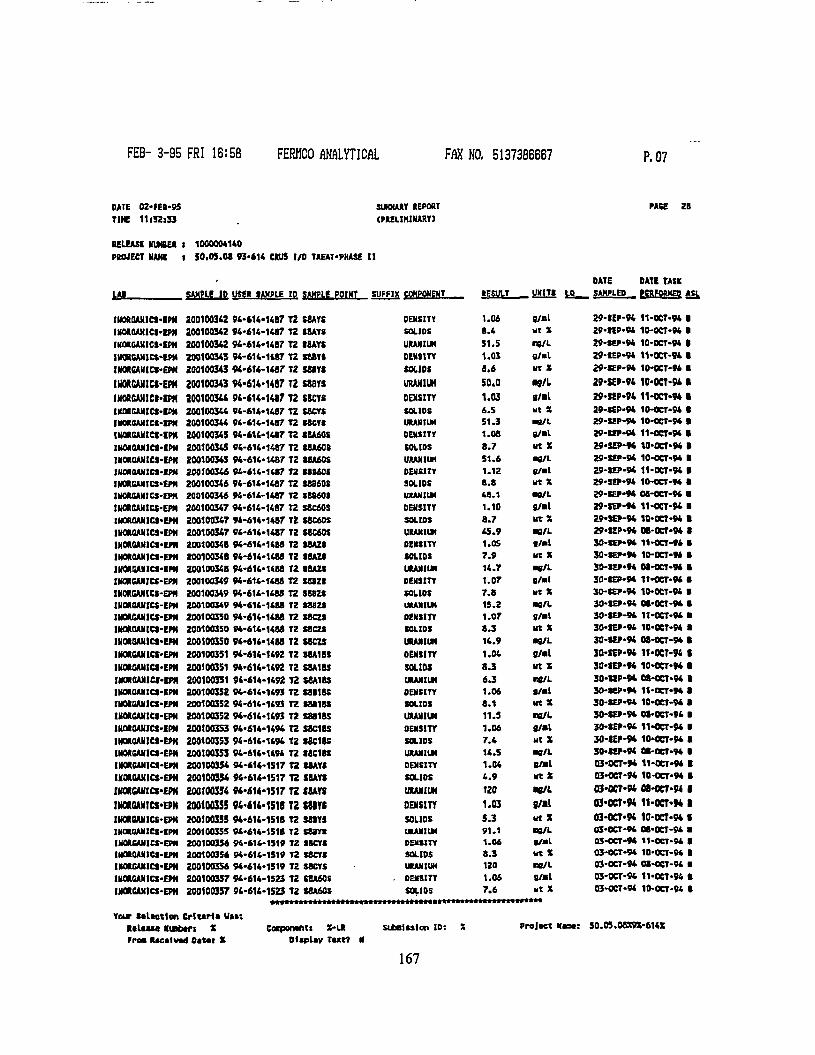
FEB- 3-95 FRI 16:58 FERHCO ANALYTICAL FAX NO, 5137386667 P. 07
DATE OZ-EEB-95 SUMMARY REPORT PASE 28 TIHE 11|52:33 (PRELIKINARY)
RELEASE NUMBER 1 100000*140 PROJECT NAME 1 50.0S.OS 93-414 CRUS I/O TREAT-PHASE I I
. DATE DATI TASK
IA» . SAMPLE ID USE* SAMPLE ID SAMPLE POINT SUFFIX COHPONENY RESULT UNITS LO
1.06 9/Bl
SAMPLED PERFORMED ASl
tUORBAUlGS-IPH 2001003(2 94-614*1487 T2 SSAYS OERSITT
RESULT UNITS LO
1.06 9/Bl 29-IEP-94 11-OCT-94 8 IXORQAHICt'EPM 200100342 94-414-1487 T2 IBAYS SOLIDS 8.4 wt X 29*SIP*94 10-OCT-94 •
INOAGAUICS-IPM 200100342 94-614*1487 T2 IBAYS URANIUM 51.5 mg/L 29-SEP-94 10-OCT-W •
IMORGANICS-EPH 200100343 94-614-1487 T2 S88YI DENSITY 1.03 g / a l 29-SEP*94 11-0CT-94 •
INOKSANICS>EPM 200100343 94-614-1487 T2 S8BYS SOLIDS 8.6 ut X 29-SEP-94 10-OCT-94 •
IHORG/UUCS-EPM 200100343 «4*614*1487 T2 SS8TJ URANIUM 50.0 • 9 / 1 29*SE»-94 10-OCT-W 1
IHOBQAHiei-EPM 200100344 94-414-1487 T2 SECTS OENSITY 1.03 g /a l 29-SfP*94 11-OCT*94 1
1NOAGANICS-EPM 200100344 94-614-1487 T2 S8CYS SOLIDS 6.5 ut X 29-SEP*94 10-0CT-94 • IMORGAMICt-EPM 200100344 94-414-1487 T2 S8CYS URANIUM 51.3 •S /L 29-SEP-94 10-OCT-94 • INORGANICf-IPM 200100345 94-614-1487 T2 8BA60S DENSITY 1.08 g /a l 29-8ZP-94 11-OCT*94 I
IKORGAXlCt-EPM 200100345 94-614-1487 TZ 88A60S SOLIDS 8.7 ut X 29-UP-V4 10-OCT-94 •
HORQAHICS-EMf 200100345 94-614-1487 T2 MAMS URANIUM 51.6 ae/L 29-REP-94 10-OCT-94 •
INOKUN1C3-IPM 200100346 94-614-1487 T2 SSB40S DENSITY 1.12 S/a l 29-SEP-94 11-OCT-94 • IHORGAN1CS-EPH 200100346 94-614-1487 TZ S8860S SOLIDS a.s ut X 29-SEP-94 10-OCT-94 •
INOROANICS-EPM 200100346 94-614-1487 T2 38860S URANIUM 48 .1 as/L Z9-SEP-9* 09-0CT-94 1
IIKXGAHICS-EPN 200100347 94-614-1487 T2 S8C60S DENSITY 1.10 g /a l 29-SEP-94 11-0CT-94 I
IHORaAHlCS-EPH 200100347 94-614-1487 T2 S8C60S SOLIOS 8 . 7 UT X 29-SEP-94 10-0CT-94 •
IHOROMUCS-EPM 200100347 94-614-1487 T2 S«C60S URANIUM 45.9 ag/L Z9-SIP-94 08-0CT-94 •
INORGANICS-EM 200100348 94-614-1488 T2 S8AZS DENSITY 1.05 ! / • ! 30-SEP*94 11-OCT-9* •
INOAOANICJ-EPM 200100346 94-614-1488 TZ S8AZS SOLIDS 7.9 ut X 30-RCP-94 10-OCT-W •
'MORGANICS-EPM 20010034B 94-614*1488 TZ SBAZS URANIUM 14.7 ao/L 30-SEP-94 Oa-OCT-94 a
IKORGRNICS-EPM 200100349 94-614-1488 T2 S8SZI OENSITY 1.07 a/at 30-SEP-94 T1-OCT-94 C
IHORCANICS-EPH 200100349 94-614-1488 TZ S86ZS SOLIDS 7.8 u t X 30-SEP-94 10-0CT-94 •
INORGAHICS-EPM 200100349 94-614-1488 T2 S8SZS URANIUM 15.Z a g / l 30-SEP-94 08-0CT-94 a
IM0R6ANICS-ERH 200100350 94-614-1488 TZ S8CZS OENSITY 1.07 9 / a l 30-SEP-94 11-0CT-94 •
IHOROAHICtt-EIW 200100350 94-614-1488 TZ S8CZS SOLIDS 8.3 Ut X 30-SEP-94 10*0CT*94 1
INORGAHICt-EPM 200100350 94-614-1488 T2 S8CZS URANIUM 14.9 • 0 /L 30-SEP-94 08-OCT-94 •
INORGAHICS-EPM 200100351 94-614-1492 TZ S8A1BS DENSITY 1.04 g /a l 30-IEP-94 11*001*94 1
INOAGAMICS-EP". 200100351 94-614-1492 T2 SSA18S SOLIOS 8.3 Ut X SO-SEP-94 10*OCT*94 • MORGANlCf-IPN 200100351 94-614-1492 T2 S8A18S URANIUM 6.3 ng/L 30 *UP-94 C8-OCT-94 I
UIOROAMICs-EPH 200100352 94-414-1493 TZ U I 1 8 S OENSITY 1.06 S/a l 30-SCP-94 11-OCT-94 > IHOISANICS-EPM 200100352 94-614-1493 TZ S8B18S SOLIDS 8 .1 ut X 30-SEP*94 10-OCT-94 •
IHORGAMICI-EPM 200100352 94*614-1493 T2 S8B1BS URANIUM 11.3 ng/L 30-SEP-94 O8-0CT-94 •
IHOROAUICt-IPM 200100353 94-614*1494 TZ S8C18S OENSITY 1.06 g / a l 30*8EP-94 11-0CT-94 •
IHOROANICt-EPH 200100353 94-614*1494 T2 8SC18S SOLIOS 7.4 ut X 30 -UP-94 10-OCT-B4 •
IHORGANICS-EP* 200100353 94-614*1494 TZ S8C1BS URANIUM 14.5 ag/L 30-SCP-94 Og-OCT-9* • INORGANICS-HP* 200100354 94-614-1517 TZ MAYS DENSITY 1.04 g /a l Q3-OCT-94 11-0CT-9* •
INORGAKICS-EPH 200100354 94-614-1517 T2 S8AYS SOLIOS 4 . 9 ut X 03-OCT-94 10-OCT-94 •
imSUHCI'tPH 200100354 94*614*1517 TZ MATS URANIUM 120 • a / l 03*OCT*W 08-OCT-W I
IMCGAMICS-ErM 200100355 94-614-1518 T2 SOTS OENSITY 1.03 g/a l Q3*0CT*94 11-0CT-94 1
IHOXOAUICS-EPH 200100335 94-614-1518 T2 S81YJ SOLIDS 5.3 ut X 0 3 * 0 0 9 4 10-OCT-94 (
iwxaAMies-sPM 20010035S 94-614-1518 T2 S88YS URANIUM 91.1 B9/L 03-OCT-K 08-0CT-94 •
IMORGAMICS-EPH 200100356 94-614-1519 TZ SBCYS OENSITT 1.04 g /a l QS-OCT-94 11-0CT-94 •
IHOHAKICl-EPH 200100356 94*614-1519 T2 S8CYS SOLIDS 8.3 ut X 03-OCT-9* 10-OCT-94 I
INORQANtCf-EPH 200100356 94*614-1519 TZ S8CYS URANIUM 120 ne/L 03-OCT-94 U*OCT-94 •
IKORGANICS-EPM 200100357 94-614*1523 T2 S8A60S . DENSITY 1.06 g /a l 03-0CT-94 11-OCT-94 •
INORGANICS-EM 200100357 94-614-1523 T2 S8A&0S SOLIDS 7.6 ut X 03-0CT-94 10-OCT-94 1
Tour se lect ion C r l t a M a U«»: l i l u w a t a b t r i X conponanti Z-LR st^aission ID: X Project Marc: 50.05.08X9X-614X
Proa Raealvad Oatai X Display Taxt? N
167
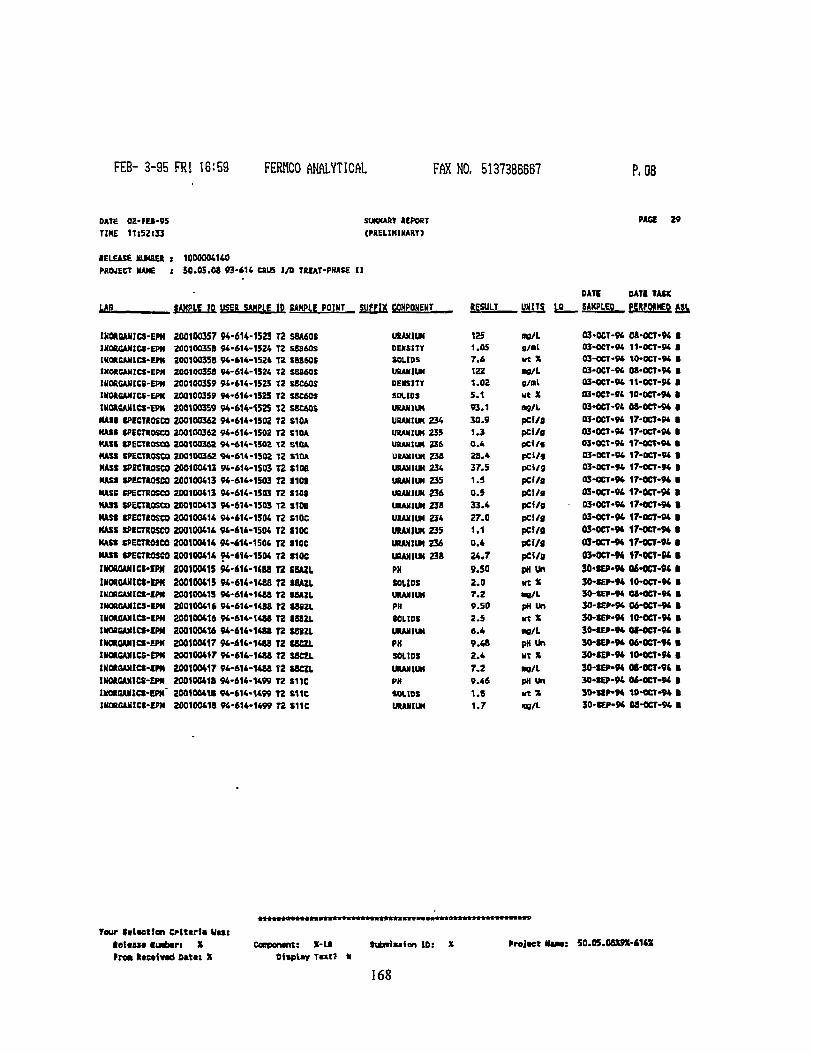
FEB- 3-95 FRI 16:59 FERHCO ANALYTICAL FAX NO. 5137386667 P. 08
DATE TIME
02-FEI-95 11:52:33
SUMMARY REPORT {PRELIMINARY}
PACE 29
RELEASE NUMBER > 1000004140 PROJECT NAME : 5 0 . 0 5 . 0 8 93 -414 CSUS I/O TREAT-PHASE II
DATI DATI TASK l/fl. tAKPLE ID USER SAKPL8 ID SAMPLE POIMT _ SUFFIX COMPONENT RESULT
125
UNITS 10
D9/L
SMIPLEO pMFMMEO A5L
INORBJUHCJ-EPM 200100357 94-614-1523 T2 SBA60S URANIUM
RESULT
125
UNITS 10
D9/L 03-0CT-94 C8-OCT-M • INORGAN1CS-EPN 2001O035B 94-614-1524 T2 SS860S DENSITY 1.05 g/al 03-0CT-94 11-OCT-94 I (KORGANICS-EFH 200100358 94-614-1524 T2 SSB60S SOLIDS 7.6 wt X 03-OCT-94 tO-OCT-94 • INORGAMICS-EPM 200100358 94-614-1524 T2 SBS60S URANIUM 122 na/L 03-OCT-94 08-0CT-94 • IHORGANICS-EPM 200100359 94-614-1525 T2 SSC60S DENSITY 1.02 g/al 03-OCT-94 11-0CT-94 8 INORSANICS-EPN 200100359 94-614-1525 T2 S8C60S SOLIDS 5.1 ut X 03-OCT-94 10-CCT-94 8 IH0R6AHie*-EPN 200100359 94-614-152$ T2 S8C60S URANIUM 93.1 ag/L 03-OCT-94 08-OCT-94 8 M M IPECTROSCO 200100362 94-614-1502 T2 S10A URANIUM 234 30.9 pC«/fl 03-OCT-94 17-0CT-94 8 MAIS SPECTROSCO 200100362 94-614-1502 T2 S10A URANIUM 235 1.3 pci/g 03-OCT-94 17-0CT-94 8 KAII SPECTROSCO 200100362 94-614-1502 T2 S10A URANIUM 236 0.4 pcl/s 03-OCT-94 17-0CT-94 • HAS* SPECTROSCO 200100362 94-614-1502 T2 S10A URANIUM 238 28.4 pci/S 03-0CT-94 17-OCT-94 8 KASt SPECTROSCO 200100411 94-614-1503 T2 S10B URANIUM 234 37.5 pC«/9 03-0CT-94 17-0CT-94 8 MASS SPECTROSCO 200100413 94-614-15(3 TZ 1101 URANIUM 235 1.9 pC«/9 03-OCT-94 17-0CT-94 8 MASS SPECTROSCO 200100413 94-614-1503 T2 S108 URANIUM 236 0.5 pCi/s 03-0CT-94 17-0CT-M 8 KA31 SPECTROSCO 200100413 94-614-1503 T2 S10B URANIUM 238 33.4 pcf/s 03'OCT-M 17-00-94 8 HAM SPECTROSCO 200100414 94-614-1504 T2 S10C URANIUM 234 27.0 BCl/fl 03-CCT-94 17-0CT-94 • MASS SPECTROSCO 200100414 94-614-1504 T2 S10C URANIUM 235 1.1 pCVO 03-OCT-94 17-0CT-94 • MASS SPECTROSCO 200100414 94-414-1504 T2 S10C URANIUM 236 0.4 pci/g 03-CCT-94 17-OCT-94 8 MASS SPECTROSCO 200100414 94-614-1504 T2 HOC URANIUM 238 24.7 pCi/B 03-OCT-9* 17-0CT-94 • INOROAHICI-IPM 200100415 94-616-1(88 T2 SBAZL PH 9.50 pN un 30-SEP-94 06-CCT-94 I UORGANtCS-tPM 200100415 94-614-1488 T2 SSAZL SOLIDS 2.0 MtX 30-SEP-94 10-OCT-94 • IHORSAM1CS-IPM 200100415 94-614-1488 T2 SBAZL URANIUM 7.2 •8/1- 30-SEP-94 08-0CT-94 • 1HOSCAMICS-IPH 200100416 94-614-1488 T2 S8BZL PH 9.50 pH Un 30-SEP-94 0&-0CT-94 8 INOROANICS-IPH 200100416 94-614-1488 T2 S88ZL SOLIDS 2.5 Ht X 30-SEP-94 10-OCT-94 8 IN0B6AN1CS-IPM 200100416 94-614-1488 T2 SBBZL URANIUM 6.4 •V/l 30-SEP-9* 08-OCT-94 8 IK0R0AN1CS-EPH 200100417 94-616-1488 T2 SSCZL PH 9.48 pH Un 30-SEP-94 06-0CT-94 • 1HORGMICS-EPM 200100417 94-614-1488 T2 SSCZL SOLIDS 2.4 ut X 30-SEP-94 10-0CT-94 8 IXORQAMCS-EPM 200100417 94-614-1488 T2 SSCZL URANIUM 7.2 •0/1 30-SEP-94 08-0CT-94 8 INORCAMICS-EPM 200100418 94-614-1499 T2 S11C PH 9.46 pM Un 30-SEP-94 O6-0CT-94 8 HMR0AMC8-EPH' 200100418 94-614-1499 T2 S11C SOLIDS 1.8 ut X 3D-SIP-V4 10-OCT-94 8 IKORGAHICt-EPN 200100418 94-614-1499 T2 S11C URANIUM 1.7 me/L 30-SEP-94 08-OCT-94 I
Your falcetlen Olttrta Uut Retcast Ruabar: X Fro* Rtcatvad 0«tti X
Coopomnt: X-LR Oisplay T«xc?
Staniufon ID: X
168
ProJMt N A M : 50.05.08X9X-614S

FEB- 3-95 FRI 17:00 FERHCO ANALYTICAL FAX NO. 5137386667 P. 09
DATE TIME
02-FE8-95 11:52:33
SUMURY REPORT (PRELIMINARY)
PAGE 30
RELEASE NUMBEJt I 1000004169 PfiOJECT KAMI i 5 0 . 0 5 . 0 8 9 3 - 6 U CRU5 1/0 TREAT-PHASE I t
DATE DATS TASK LAI , SAMPLE ID USER SAMPLE ID SAMPLE POINT SUFFIX COMPONENT RESULT
47
UNITS
PCI/S
12 SAMPLED PERFORMED ASL
RADIOCHEMICAL 200100890 94-614-15A3-T2 S50 ALPHA
RESULT
47
UNITS
PCI/S 05-OCT-94 07-0CT-94 I RADIOCHEMICAL 200100890 94-614-1545-T2 SSO BETA 360 pCI/B 05-0CT-94 07-OCT-94 I IH0R6ANICS-EPM 200101024 94-614-1530-T2 S81 MOISTURE 12.1 Ut X O4-0CT-94 11-OCT-94 • IHORGAHICS-EPN 200101024 94-614-1530-T2 S81 URANIUM 154 ppnd 04-CCT-94 14-0CT-94 • INORGAHICS-EP* 200101029 94-614-1534-T2 $70 MOISTURE 39.9 ut X 04-OCT-94 11-OCT-94 1 IHMGAHICt-EPM 200101025 94-614-1534-T2 S70 URANIUM 163 ppn d 04-0CT-94 14-0CT-94 • IKORSANICS-EPM 200101026 W-614-1S37-T2 SSO MOISTURE 39.4 Ht X M-OCT-94 11-OCT-94 > IUORCAMICS-EPN 200101026 94-614-1537-T2 S80 URANIUM 150 ppad 04-0CT-94 15-OCT-94 8 INORGAHICS-EPM 200101027 94-614-1539-T2 S90 MOISTURE 43.5 ut X 05-0CT-94 11-0CT-94 • INORGANICS-EPM 200101027 94-614-1339-T2 S90 URANIUM 114 ppo d OS-OCT-94 H-OCT-94 • INOMANICS-EPM 200101028 94-614-1541-12 S10A MOISTURE 46.5 ut X 05-0CT-94 11-OCT-94 • INORCAHICC-EPN 200101028 94-614-1S41-T2 S10A URANIUM 180 ppad 05-OCT-94 14-0CT-94 • MAM RPECTROSCO 200101029 94-614-1S41-T2 S10A MOISTURE 45.56 Mt X 05-OCT-94 17-0CT-94 1 MASS SPICTROSeO 200101029 94-614-1541-TZ S10A URANIUM 234 6.6E+01 pCi/g 05-OCT-94 15-SEC-94 S MASS SPECTROSCO 200101029 94-614-1541-TZ tlOA URANIUM 23S 2.6E*D0 pCi/s OS-OCT-94 15-DEC-94 • MASS SPICTItOSCO 200101029 94-614-1541-T2 S10A URANIUM 236 8.5E-01 pCi/B 0S-0CT-94 15-DEC-94 B MASS tPECTROSCO 200101029 94-614-1541-T2 S10A URANIUM 238 6.0E+01 pCf/8 05-OCT-9* 15-DEC-94 • IKORQAHICS-EPM 200101030 94-614-1542-T2 S10S MOISTURE 46.1 ut X 05-OCT-94 11-OCT-94 8 INORGANICS-CM 200101030 94-614-1342-T2 S10S URANIUM 114 pp>d 05-OCT-94 14-OCT-94 8 MAS* SPECTROSCO 200101031 94-414-1542-T2 SI OB MOISTURE ut X OS-OCT-94 12-OCT-94 8 MASS SPECTAOSCO 200101031 94-614-1S42-T2 S10B URANIUM 234 pcl/g 05-OCT-9* 23-NOV-K » MASS SPECTROSCO 200101031 94-614-1542-T2 S108 URANIUM 235 pCi/8 OS-OCT-94 23-K0V-94 • MASS SPECTROSeO 200101031 94-A14-1542-T2 S10B URAHIUM 236 PCi/B 05-OCT-94 Z3-NOV-94 8 MASS SPECTROSCO 200101031 94-614-1542-T2 S10B URANIUM 238 PCI/S 05-0CT-9* 23-HOV-94 • IHOROAHICS-EPH 200101032 94-614-1543-T2 S10C MOISTURE 45.8 Mt X 05-OCT-94 11-OCT-94 8 IKOR6AMICS-EFN 200101032 94-614-1543-T2 S10C URANIUM 113 ppmd OS-OCT-94 M-OCT-9* • MASS SPECTROSCO 200101033 94-614-1543-T2 S10C MOISTURE ut X 05-OCT-94 12-OCT-94 I KAII JPECTItOScO 200101033 94-61.4-1543-T2 S10C UMNIUH 234 PCI/9 M-OCT-94 23-NOV-K B Mil tPECTROSCO 200101093 9V614-15W-T2 S10C URANIUM 235 P«/l 05-0CT-94 23-H0V-94 • MAIS SPECTXOSCO 200101033 94-4H-1S43-T2 S10C URANIUM 236 pc</g 05-0094 a-IWV-94 • MASS SPSCTSOSCO 200101033 94-614-1543-T2 S10C URANIUM 238 pci/e OS-OCT-94 23-N0V-94 • lUGftGAMlCS-EFH 200101034 94-614-1532-T2 S19 MOISTURE 78.6 ut X 04-OCT-94 11-OCT-9* • IHORGAHICI-EPH 200101034 94-614-1332-T2 S19 URANIUM 21900 ppad 04-OCT-94 15-OCT-94 • IH0R5AMIC1-EPB 200101035 94-614-1531-T2 SUA PH 9.4B pN Un M-OCT-94 OB-OCT-94 • IMORCAMICS-EPM 200101035 94-614-1531-T2 S U A SOLIDS 1.52 ut X 04-OCT-94 10-OCT-94 8 MMCAHICS-EPH 200101035 94-414-1531-T2 S 1 U URANIUM 81.0 •9/L 04-0CT-94 11-OCT-94 B IHOROAMICS-EPH 200101036 94-614-1S3J-T2 SBAZS PH 9.52 pH Un 04-CCT-94 12-OCT-94 8 IHOROAHICS-EPH 200101036 94-614-1SJ3-T2 S8AZS SOLIDS 7.5 ut X 04-0CT-9* 10-OCT-94 I HKMOANICI-CPM 200101036 94-614-1533-T2 SBAZS URAHIUM 35.1 •DO/L 04-OCT-94 10-0CT-94 • IHOROAUICS-EPM 200101037 94-614-1533-T2 SBSZS PH 9.50 pHUn M-OCT-94 12-0CT-94 B INORGAHICS-EPM 200101037 94-614-15J3-T2 SBBZS SOLIDS 7.5 ut X O4-0CT-94 10-CCT-94 8 IHORGANICS-EPH 200101037 94-614-15J3-.T2 S8BZS URANIUM 48.2 •fl/L 04-OCT-94 11-OCT-94 8 IHOROANICS-EPM 200101038 94-614-1533-T2 S8CZS PH 9.52 PH Un 04-0CT-9* 12-0CT-94 8 IMORGANICS-EPM 200101038 94-614-1533-T2 S8CZS SOLIDS 7.0 ut X 04-0CT-94 10-0CT-9* • IHOAOAMCS-IPK 200101038 94-414-15J3-T2 S8CZS URANIUM . 48.7 •S/L 04-OCT-94 11-0CT-94 8 IKM6ANICS-EPH 200101039 94-614-15J3-T2 S6AZL PH 9.52 PH Un 04-OCT-94 12-0CT-94 • JKOSCAKICS-EPM 200101039 94-614-1533-T2 SSAZL SOLIDS 1.9 HtX 04-OCT-94 10-OCT-94 I
>*a««a««»««ni*«ti«««t«««»>m«**t«*«««»«t«n««««»»««m«»« Your ttlactlon Criteria Uast
Ralaasa Kurbar: X Coopenents X-l*. Sutaiaaion ID: X Projaet Naaa: 50.05.08X9X-414X FroM Racatved Data: X Display Taxn N
169
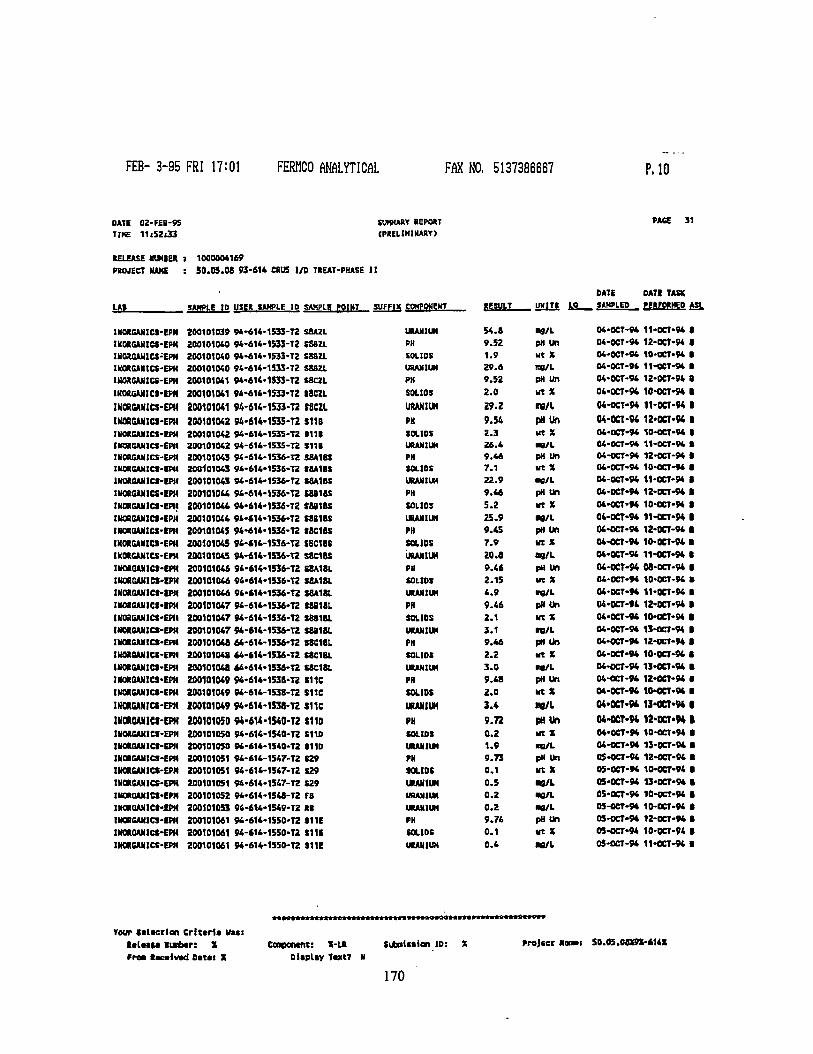
FEB- 3-95 FRI 17:01 FERHCO ANALYTICAL FAX NO. 5137386667 P. 10
OATE 02-FES-95 SUMMARY REPORT PACE 31 TINE 11:52:33 (PRELIMINARY)
RELEASE NUMIER > 1000004169 PROJECT MAKE : S0.05.0S 93-614 C8U5 I/O TREAT-PHASE II
BATE OATI TASK LAf SAMPLE 10 USER SAMPLE ID SAMPLE POINT SUFFIX COMPONENT RESULT UNITt JO SAMPLED . tf*TWZ° * ^
1HORGAN1CS-EPH 200101039 94-614-1533-T2 S8A2L URANIUM 54.8 •9/t 04-0CT-94 11-OCT-94 8 IKOROANICS-EPH 200101040 94-614-1S33-T2 SSBZL PH 9.52 PH Un 04-0CT-94 12-OCT-94 8 IHOJtGAMIU-EPH 200101040 94-614- 1533-T2 SS32L SOLIDS 1.9 wt X 04-0CT-94 10-OCT-94 8 INOACANICS-EPM 200101040 94-614-1S33-T2 SSBZL URANIUM 29.6 ns/L 04-0CT-94 11-0CT-94 8 IHOXCAN1CS-EPH 200101041 94-614-1S33-T2 S8C2L PH 9.52 PH Un 04-0CT-94 12-0CT-94 8 IHOROAHICS-EPfl 200101041 94-614-1S33-T2 SSCZL SOLIDS 2.0 Ht X 04-OCT-94 10-OCT-94 • INORGAMICS-EPH 200101041 94-6K-1533-T2 J8CZI URANIUM 29.2 me/l M-OCT-94 11-0CT-94 8 IUORGUIU-EPH 200101042 M-614-1535-T2 SUB PH 9.54 pMUn 04-OCT-W 12-0CT-94 8 mogoAXict-EPH 200101042 94-614-153S-T2 till SOLIDS 2.3 wt X 04-OCT-94 10-OCT-94 8 IKORSANICS-EPH 200101042 94-614-1535-T2 S11B URANIUM 26.4 •8/L 04-OCT-94 11-0CT-94 8 IKORSANICS-EPH 200101043 94-614-1536-T2 SSA18S PH 9.46 pH Un 04-OCT-94 12-OCT-94 8 IKORGAHICS-8PU 200101043 94-614-1536-T2 SBA18S SOLIDS 7.1 Ht X 04-OCT-94 10-OCT-94 8 lNORGAMlCS-EPM 200101043 94-614-1S36-T2 S8A18S URANIUM 22.9 •9/L 04-OCT-94 11-0CT-94 8 1NORGAHICS-IPH 200101044 94-614-1536-T2 CBB18S PH 9.46 pH Un 04-0CT-94 12-DCT-94 8 IKORGAHieS-EPH 200101044 94-614-1536-T2 SSB18S SOLIDS 5.2 Ut X 04-OCT-94 10-OCT-94 8 IHOBGAHICS-IPM 200101044 94-614-1536-T2 S8B18S URANIUM 25.9 •9/L 04-0094 11-OCT-94 8 INORaAHlCS-EPN 200101043 94-614-1536-T2 S8C1&S PH 9.45 pH Un 04-OCT-94 12-0CT-94 • iMORGMics-em 200101045 94-614-1536-T2 S8C1SC SOLIDS 7.9 lit X 04-0CT-94 10-0CT-94 8 INOXGAMICS-EPH 200101045 94-614-1536-T2 S8C18S URANIUM Z0.8 ag/L 04-0CT-94 11-OCT-94 8 IHOtQANICS-Em 200101046 94-614-1536-T2 S8A18L PH 9.46 pH Un 04-OCT-94 08-OCT-94 8 IKORGAH1GS-IPH 200101046 94-614-1536-T2 S8A18L SOLIDS 2.15 Ht X 04-OCT-94 10-OCT-94 8 IHORGANICS-EPH 200101046 94-614-1536-TZ S8A18L URANIUM 4.9 na/L 04-OCT-94 11-0CT-94 8 INORGANICS-IPM 200101047 94-614-1536-T2 SSB18L PH 9.46 pH Un 04-0CT-94 1Z-0CT-94 8 INORGANICS-EM 200101047 94-614-1S36-T2 S8S1BL SOLIDS 2.1 Ht X 04-0CT-9* IO-OCT-94 • IHOROANICS-EPM 200101047 94-614-1536-T2 SSB18L URANIUM 3.1 ng/L 04-0CT-94 13-CCT-94 8 IKORGUICS-EPH 200101048 64-614-1536-T2 S8C181 PH 9.46 pH Un 04-OCT-94 12-0CT-94 8 IKORBAHICC-EFH 200101048 64-614-1536-T2 S8C1BL SOLIDS 2.2 Ht X 04-OCT-94 10-OCT-94 8 INORCAMICS-EPH 200101048 64-614-153A-T2 S8C18L URANIUM 3.0 •8/1 04-OCT-94 13-OCT-94 8 INOROAUICS-EPH 200101049 94-614-153B-T2 S11C PH 9.48 pH Un 04-OCT-K 12-0CT-94 8 IK0R6AH1CS-EPU 200101049 94-614-1538-T2 S11C SOLIDS 2.0 Ht X 04-0CT-94 10-CCT-94 I IHORUNICS-EPH 200101049 94-6H-1538-T2 I11C URANIUM 3.4 •8/t 04-0CT-9* 13-0CT-94 0 IKORCANICS-EPH 200101050 94-6U-1S40-T2 S11D PK 9.72 pHUn 04-OCT-W 12-OCT-94 • INORCAHICS-EPM 200101050 94-614-1540-T2 S11D SOLIDS 0.2 ut X 04-0CT-94 10-OCT-94 8 IIIOROANICS-EPH 200101030 94-614-1540-T2 S11D URANIUM 1.9 wan. 04-OCT-94 13-0CT-94 8 1KORBANICS-EPN 200101051 94-614-1547-T2 829 PH 9.73 pM Un 0S-0CT-94 12-OCT-94 8 IHOXSANICS-EPJI 200101051 94-614-1547-T2 S29 SOLIDS 0.1 Ht X 05-0CT-94 10-OCT-94 8 IHOKGAXICS-EM 200101051 94-614-1547-T2 S29 URANIUM 0.5 •8/L 05-0CT-94 13-0CT-94 8 IKOROAHICS-EPfl 200101052 94-614-1S48-T2 F8 URANIUM 0.2 •o/t 05-OCT-94 10-OCT-94 8 IKOIOANiei-IPH 200101053 94-614-1549-T2 88 URANIUM 0.2 •e/L 05-OCT-94 1Q-OCT-94 8 INGRBANICS-EPH 200101061 94-614-1S50-T2 811E PH 9.74 pH Un 05-OCT-94 12-0CT-94 8 INOROANICS-EPH 200101061 94-6U-1550-T2 8111 SOLIDS 0.1 Ht X 05-OCT-94 10-OCT-94 8 INOKCANICS-EPH 200101061 94-614-1550-T2 S U E URANIUM 0.4 •B/L 05-OCT-94 11-0CT-94 8
Your ((taction Crittrla Wi«: t t l M M Kuabar: X Ccnpontnt: X-LR Subtiitaion ID: X Project Naaat 50.05.08X9X-614X Proa lacalvad Data: X Diaplay Taxt? N
170
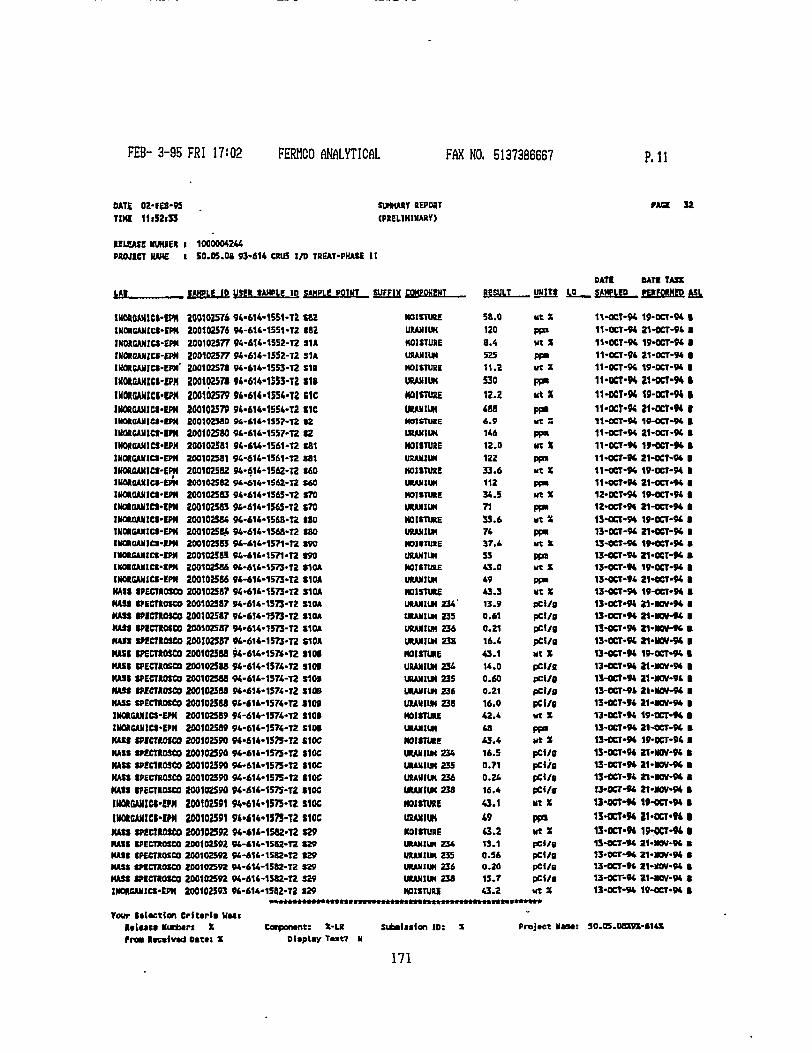
FEB- 3 -95 FRI 17:02 FERHCO ANALYTICAL FAX NO. 5137386667 P. 11
DATE Tim
02-FEB-95 11)52i55
SUMMARY REPORT (PRELIMINARY)
PAGE 32
U L U S E KUNRER PROJECT KAHE
1000004244 50.05.08 93-614 CRUS I/D TREAT-PHASE II
i*L SAMPLE 10 USER tAHPLE IP SAMPLE POINT SUFFIX COKPOHENT BESUIT ,52111 iS_ OATI OATl TASK SAMPLED PERFORMED RSI
IMORQAHICI-EPH INORGAHICS-EPM IK0R6AHICS-EPH IMORGANICC-EPM IHORCAJIICS-EPM' IKOftQAHICI-EPH .MORflANKI-CPM IKOftGANlCI-EPM 1M0RGANICS-IPK IKORCAMICS-IPH INORGAH1CS-EPM INORGANICS-EPH IHORSANICS-EPH lUORGAHICf-ETH INORGAHICS-EPH IMOROAUIGS-EPN IHOROANICS-EPH IHORSAMCS-EPH IKOROANICS-EPN IDORRANICS-EPH iKORaAxics-fnt IMORGAMiet-EPM NASI SPECTROSCO KASS SPECTROSCO KASS SPECTROSCO HAS* SPECTKOSCO MASS SWCTROSCO FUSS SPECTROSCO MASS SPECTROSCO KASS SPECTROSCO HAS* SPECTROSCO KASS SPECTROSCO INORGAItlCS-EPH IHORGAUICI-EFN
KASS spiercoseo KASS SPCGTROSCO KASS SPECTROSCO HASS SPECTRQSCO KASS SPECTROSCO IHORQANIGI-EM IHORGAJUM-IWI HASS SPECUOSCO HASS sPEcntoseo KASS SPECTROSCO KASS SPf CTROSCO HASS SPICTROSCO IMORCAHICS-EPM
200102576 200102574 200102577 200102577 200102578 200102578 200102579 200102579 200102580 200102580 200102581 200102581 200102582 200102582 2001025S3 200102583 200102584 200102584 200102S85 200102585 200102586 200102586 200102587 200102587 200102587 200102587 200102587 200102588 200102588 200102588 200102588 200102588 200102589 200102589 200102590 200102590 200102590 200102590 200102590 200102591 200102591 200102592 200102592 200102592 200102592 200102592 200102593
94-614-94-614' 94-614 94-614 94-614' 94-614' 96-614' 94-614' 94-614' 94-614' 94-614' 94-614-94-614' 94-614-94-614-94-614-94-614-94-614-94-614-94-616-96-616-94-614-94-614-94-614-94-614-94-614-94-614-94-614-94-614-94-614-94-614-96-616-94-614-94-614-94-614-94-614-94-614-94-614-94-616-94-614-94*614-96-616-96-616-94-616-94-614-94-614-94-616-
15S1-T2 $82 1551-T2 S82 1552-T2 S1A
-1552-T2 S1A -1553-T2 S1B •1553-T2 SIB •1554-T2 SIC •1554-T2 t i e -1557-T2 S2 •1557-T2 82 •1561-T2 S81 •1561-T2 S81 -1562-T2 S60 •1562-T2 SAO •1S65-T2 S70 •156S-T2 S70 -1S68-T2 S80 1568-T2 S80 •1571-T2 S90 '1571-T2 S90 •1S73-T2 810A 1573-T2 S10A 1573-T2 S10A 1573-T2 S10» 1373-T2 S10A 1573-T2 S10A 1573-TZ S10A 1574-T2 8101 1574-T2 SIM 1574-T2 S10S 1574-T2 S10B 1574-T2 810S 1574-T2 S101 1S74-T2 S10B 1575-T2 S10C 1575-T2 S10C 1575-T2 S10C 1575-T2 S10C 1575-T2 S10C 1575-T2 S10C 157J-T2 S10C 1582-T2 $29 1582-T2 829 1582-T2 829 1582-T2 S29 1582-T2 S29 1SB2-T2 S29
Your Silaetion Cr i t t r l i V M I Rt lMt* Rurfcar: X Proa Rtcvlvad oatti X
Conpontnt: X-LR Ditplay Taxt?
NOISTURE URANIUH
MOISTURE URANIUM HOISTUKI
URAH1UH
MOISTURE
URANIUH MOISTURE URANIUM MOISTURE URANIUM MOISTURE URANIUH MOISTURE URANIUM MOISTURE URANIUM MOISTURE URANIUM MOISTURE URANIUM MOISTURE URANIUH 234 ' URANIUM 235 URANIUM 236 URANIUM 238 MOISTURE URANIUH 236 URANIUM 235 URANIUM 236 URANIUM 238 MOISTURE URANIUM MOISTURE URANIUH 234 URANIUM 235 URANIUM 236 URANIUM 238
MOISTURE UKANIUM
KOISTURE URANIUM 234 URANIUH 235 URANIUH 236 URANIUM 238 MOISTURE
Sufaaluion 10:
58.0 120 8.4 525 11.2 530 12.2 468 6.9 166 12.0 122 33.6 112 34.5 71 35.6 74 37.4 55 43.0 49 43.3 13.9 0.61 0.21 16.4 43.1 14.0 0.60 0.21 16.0 42.4 48 43.4 16.5 0.71 0.26 16.4 43.1 49 63.2 13.1 0.56 0.20 1S.7 43.2
Ht X PP» ut X Pt» lit X PP* u t X
PP* Ht 5
PP» Ht X pptl u t X PF» u t X PF« ut X PF* ut X
ut X PP" ut X pC«/9 pCI/8 pci/g pCi/g ut X pCl/a P« /0 pCi/fl pCi/9 ut X PF» Ut X pCI/0 P « / S pCI/R pci/a Ht X
PP» ut X PCI/9 P«/g pCi/o pCi/i ut X
11-OCT-94 11-OCT-94 11-0CT-94 11-OCT-94 11-0CT-94 11-0CT-94 11-OCI-94 11-OCT-K 11-OCT-94 11-OCT-94 11-OCT-94 11-0CT-94 11-0CT-94 11-OCT-94 12-DCT-94 12-0CT-94 13-CCT-94 13-0CT-94 13-0CT-94 13-0CT-94 13-0CT-94 W-OCT-94 13-0CT-94 13-OCT-94 13-OCT-9* 13-0CT-9* 13-0CT-94 13-OCT-94 13-OCT-94 13-OCT-94 13-0CT-94 13-0CT-94 13-0CT-94 13-0CT-94 13-CCT-94 13-CCT-94 13-OCT-94 13-CCT-94 I3-0CT-94 13-OCT-94 1J-OCT«94 13-OCT-94 13-OCT-94 13-0CT-94 13-0CT-94 13-OCT-94 13-OCT-94
19-0CT-94 t 21-OCT-94 8 19-0CT-94 8 21-OCT-94 8 19-0CT-94 8 21-OCT-94 • 19-0CT-94 • 21-OCT-9* • 1P-OCT-94 8 21-OCT-94 6 19-OCT-94R 21-OCT-94 8 19-OCT-94 8 21-0CT-94 8 19-0CT-94 8 21-OCT-94 8 19-0CT-94B 21-0CT-94 8 19-OCT-9* • 21-CCT-94 • 19-0CT-94 8 21-OCT-94 • 19-OCT-94 8 21-HOV-94 8 21-MV-96B 21-N0V-94 8 21-N0W-94 8 19-0CT-94 8 21-MOV-94 8 21-NOV-96 8 21-NOV-94 B 21-B0V-94 8 19-CCT-94 8 31-CCT-94 B 19-0CT-96 B 21-N0V-94 8 21-N0V-94 • 21-N0V-94 B 21-NOV-94 8 19-CCT-94 • 21-OCT-94 I 19-CCT-94B 21-N0V-96 B 21-HOV-94 B 21-NOV-94 B 21-B0V-94 8 19-OCT-94 8
Projaet N«w: 30.05.08X9X-614X
171
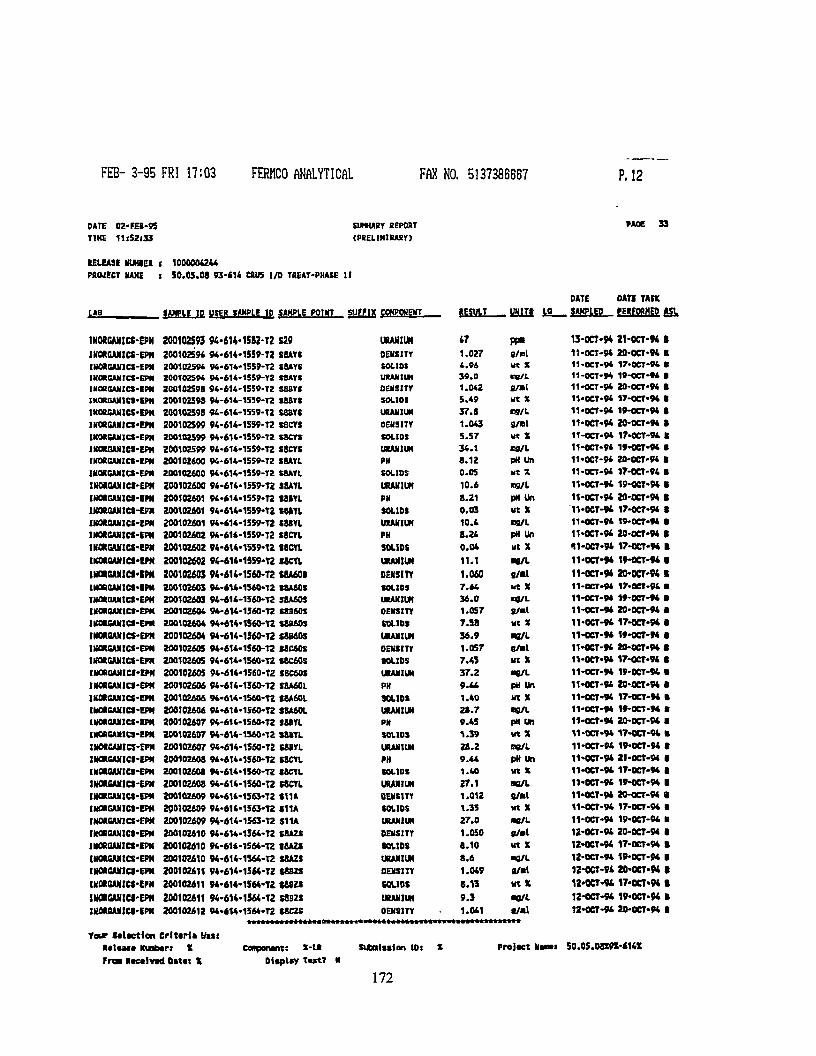
FEB- 3-95 FRI 17:03 FERHCO ANALYTICAL FAX NO. 5137386667 P. 12
DATE 02-EES-95 SUMMARY REPORT PAOE 33 TIKE 11s52l33 (PRELIMINARY)
RELEASE MUKSEA i 1000004244 PROJECT NAME i 50 .05 .03 93-414 CRU5 I/O TREAT-PHASE I I
DATE DAT! TASK iiS SAMPLE ID. USER SAMPLE IP SAMPLE POIMT - S W 1 X CCKPOHEHT RESULT W I T S LQ SAHP|,ED e^E9PHff i l k
INORGMICS-EPM 200102593 W - 6 H - 1 5 8 M 2 S29 URANIUM 47 PP» 13-OCT«94 21-OCT-K JNOftGANICS-EPH 200102594 94-614-1559-T2 SBAYS DENSITY 1.027 g/nl 11-OCT-94 20-0CT-S4 IHORCAHICS-EPM 20010259* 94-614-1S59-T2 SBATS SOLIDS 4.96 wt X 11-OCT-9* 17.0CT-94 INOROAMTCS-EPM 200102S94 M-614-1S59-T2 (SAYS URANIUM 39.0 ng/L 11-OCT-94 19-OCT-94 INORGANICS-IPM 200102598 94-614-1S59-T2 S8BTI DENSITY 1.042 B/»l 11-OCT-94 20-OCT-94 IKOROAMICS-IPM 200102598 94-614-1539-T2 SSBYS SOLIOS 5.49 ut X 11-0CT-O4 17-OCT-94 1NORCAUICS-EPM 200102598 S4-614-15S9-T2 S8SYS URANIUM 37.8 ng/L 11-OCT-94 19-OCT-94 INORSAmCS-EM 200102S99 94-614-1559-T2 S8CYS DENSITY 1.043 9/Bl 11-OCT-M 20-OCT-94 INORSMICS-EPN 200102599 94-614-1559-T2 SSCYS SOLIDS 5.57 Wt X 11-OCT-94 17-OCT-94 IHORGANICI-EPH 200102599 94-614-1559-T2 SSCTS URANIUM 34.1 ra/L 11-OCT-94 19-0CT-94 IHOROAMICt'IPH 200102600 94-614-1SS9-T2 SSAYL PH 8.12 pH un 11-OCT-94 20-OCT-94 INORGANICS-EPM 200102600 94-614-1559-T2 S8AYL SOLIDS 0.05 Wt X 11-OCT-94 17-OCT-94 1HORSAMICS-EPH 200102600 94-614*1559-T2 S8ATL URANIUM 10.6 ng/L 11-0CT-94 19-OCT-94 IMORGAHICS-IPM 200102401 94-614-15S9-T2 881YL PN 8.21 pH Un 11-OCT-94 20-OCT-94 IKORGANIO-CPH 200102601 94-614-1559-T2 SHYl SOLIOS 0.03 ut X 11-OCT-94 17-OCT-94 INORQANICS-EPN 200102601 94-414-1559-T2 (8BYL URAHIUH 10.4 ng/L 11-OCT-94 19-OCT-94 IMOftCANICf-EPN 200102602 94-614.1559-T2 SSCYL PH 8.24 pH Un 11-OCT-94 20-OCT-94 mOROANICI-CPM 200102602 94-614-1559-T2 IBCYL SOLIDS 0.04 ut X 11-OCT-94 17-OCT-9* IKOROAJIICS'IPM 200102602 94-614-1559-T2 SSCYL URANIUM 11.1 •S/L 11-OCT-f* lf-OCT-94 IMOROAIIlCS'lPM 200102603 94-6K-1560-T2 S8A60I DENSITY 1.060 8/>l 11-0CT-9* 2D-0CT-94 IHOROAHICS-IPM 200102603 94-614-1560-T2 S8A60S SOLID) 7.44 Ht X 11-OCT-W 17.QCT-94 tMOROANlCS-EPM 200102603 94-414-1560-T2 SBA60S URANIUM 36.0 ng/L 11-OCT-94 19-0CT-94 IKOROAXICS-EPM 200102604 94-614-1560-T2 S8B60S DENSITY 1.057 8/«l 11-0CT-94 20-OCT-94 IU0R6ANtCS-EM 200102604 94-614-1J60-T2 C8R60S SOLIDS 7.S8 wt X 11-CCT-94 17-OCT-94 INORSANICS-EPH 200102604 94-6H-1560-T2 S8B60S URANIUM 36.9 •B/L 11-OCT-H tt-OCT-94 INORCANICS-EPN 200102605 94-614-1S60-T2 S8C60S OEHSITY 1.057 a/ml 11-OCT-t* 20-0CT-94 INORCAHICS-EPM 200102605 94-614-1560-T2 S8C60S SOLIDS 7.43 ut X 11-0CT-94 17-0CT-94 IUORGAN1CS-EPM 200102605 94-614-1560-T2 S8C60S URANIUM 37.2 •g/L 11-OCT-94 19-OCY-94 INORCANICS-EPM 200102606 94-614-1560-T2 SBA60L PH 9.44 pH Un 11-OCT-94 20-OCT-94 INORCJUHCS-EPK 200102606 94-614-1560-T2 SBA60L SOLIDS 1.40 ut X 11-OCT-94 17-OCT-94 IHORfiAHICS-EPM 200102606 94-614-1560-T2 S8A60L URANIUM 2S.7 BB/L 1VOCT-94 19-0CT-94 iwatoAJiies-iPN 200102607 94-6H-1560-T2 SB8YL PN 9.45 PH Un 11-OCT-94 20-OCT-94 INOR6AN1CS-EPM 200102607 94-614-1360-T2 SSSYL SOLIDS 1.39 wt X 11-0CT-94 17«0CT-«4 INORGANICS-EPM 200102607 94«614-1560-T2 S88YL URANIUM 28.2 ng/L 11-0CT-94 19-CCT-94 INORGANICI-EPN 200102608 94-614-1560-T2 SSCYL PH 9.44 pHUn 11-OCT-94 21-0CT-94 INOROANICI-EPN 200102608 94-614-1560-T2 SftCYL SOLIDS 1.40 wt x 11-0CT-04 17-OCT-94 INORSAHICS-EPX 200102608 94-614-1560-T2 SSCYL URANIUM 27.1 •e/L 11-0CT-94 19-OCT-94 INORGANICS-EPM 200102609 94-6H-1563-T2 SUA DENSITY 1.012 S/ml 11-0CT-94 20-OCT-94 INORGANICS-EPH 200102609 94-614-1563-T2 S11A SOLIOS 1.35 wt X 11-OCT-94 17-OCT-94 IMORSANICS-EPM 200102609 94-614-1563-T2 S11A URANIUM 27.0 •S/L 11-OCT-94 19'0CT-94 IRORGAHICS-EPM 200102610 94-614-1S64-T2 SBA2S DEHSITT 1.050 s/nl 12-0CT-94 20-0CT-94 lNORGANICS-IPM 200102610 94-614-1564-T2 IBAZS SOLIDS 8.10 wt X 12-OCT-94 17-OCT-94 ItttRSMICS-EPM 200102610 94-614-1364-T2 S8A2S URANIUM 8.6 •8/L 12-OCT-94 19-0CT-94 INORSANICI-E1W 200102611 94-614-1564-T2 S882S DENSITY 1.049 S/Bl 12-OCT-M 20-OCT-94 INORSANICS-EPJI 200102611 94-614-1564-T2 SA82S SOLIDS 8.13 w* 12-0CT-94, 17-0CT«94 IHORGUilCI-EPK 200102611 94-614-1564-T2 SSS2S URANIUH 9.3 •B/L 12-OCT-94 19-0CT-94 IKOROAMIU'EPH 200102612 94-414-1564-T2 S8C2S OENSITY 1.041 •/•I 12-OCT-94 20-OCT-94
Your Salwtien Crlttrlk Utni R < I « M « KuriMrt X eenpciwjnt: X-tR SubaUsIon IDt * ProJoet Hmmi 50.05.O8t9X-«UX Trm Rtcclvad DaUi X 0i«pl»y T«tT M
172
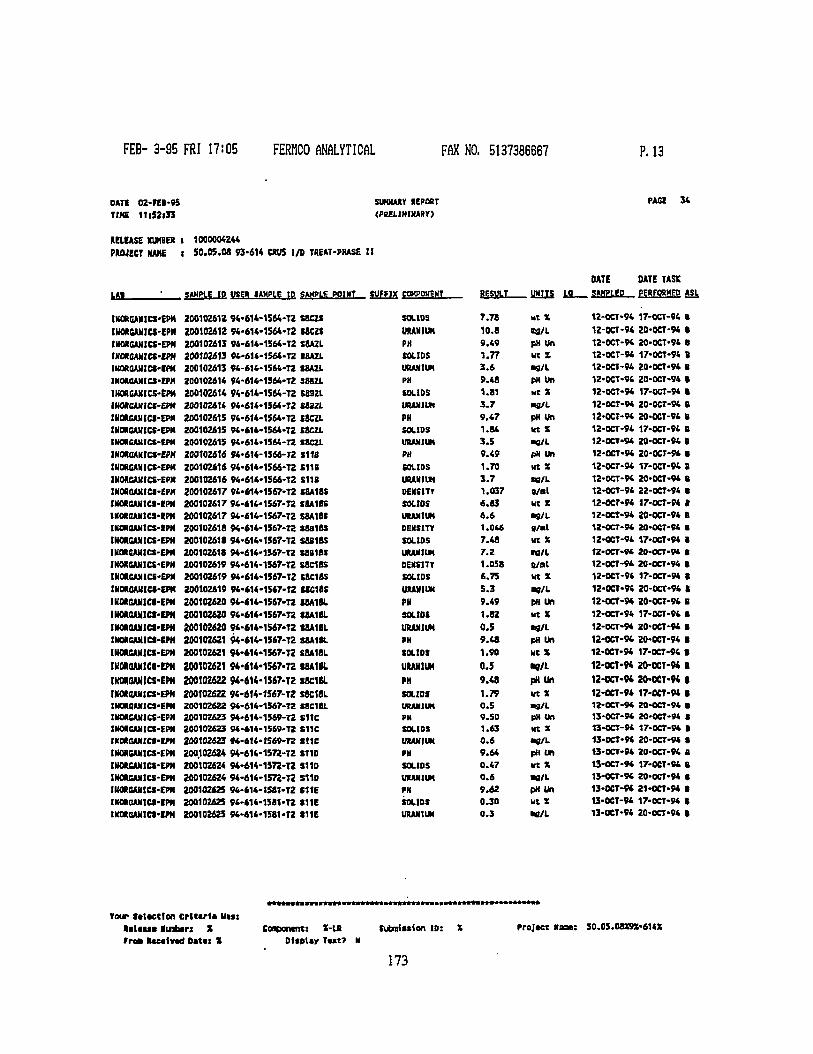
FEB- 3-95 FRI 17:05 FERHCO ANALYTICAL FAX NO. 5137386667 P. 13
DATE TIKE
OZ-PEB-tf 11lS2lJ3
SUKHARY REPORT (PRELIMINARY)
RELEASE NUMBER l 1000004244 PROJECT HAKE t 50.05.08 93-614 CRUS I/O TREAT-PHASE II
PACE 34
1AJ_ SAMPLE IP USER RAMPLE IP SAMPLE POtMT SUFFIX COKPOHEMT
IKORGANICS-EPM INORGAHICI-EPN IKORGAHICS-EPH INORCAMICS-IPH IKORQAUICS-IPM INOROANICS-EPM IHORGAHICS-EPH INORCANICS-EPM IKORCAHICI-EPII IHORCAMICS-EPM IHORCAMICS-CPM INOROAIircS-EPH IHORGANICS-EPM IHOR6AMICS-EPJI 1HOROAMICI-EPM 1MORGAMICS-EPM UOROAMICS-EPK IKOR0AN1CS-EPM IKOXGAHICS-EPH INOREAHICS-EPN INORSANICS-EPM IHORGAMICE-EPN INOR0AHICS-EPM 1M0RBAHICS-EPM IIMRQAHICS-EPM IHOROAMICt'EPM IMORGAMICS-EPM INOR0AH1CS-EPH INORGAMICI-tTH IKORQAHICS'EM WOROANICS-EPM IHOROANICS-EPM IKORGAMICS-EPM IHORGAMICt-EPH IKORflANrCt-IPM INORCAMICS-EPM IHOACAMICS-EPM IHORGAHICS-EPH lUORaAHICS-EPK IKORGANICS-EPM IMOAaAHICI-IPH
20010Z61Z 94-614-200102612 94-614' 20O10Z613 94-614' 200102613 94-614' 200102613 W-6U 200102614 94-614' 200102614 94-614 200102614 94-614' 200102615 94-614' 200102615 94-614' 200102615 94-614' 200102616 94-614-200102616 94-614' 200102616 94-614' 200102617 94-614' 200102617 94-614-200102617 M-614 200102618 94-614' 200102618 94-614' 200102618 94-614' 200102619 94-614' 200102619 94-614' 200102619 94-614' 200102620 94-616' 200102620 94-614' 200102620 94-614' 200102621 94-614' 200102621 94-614' 200102621 94-614' 200102622 94-614' 200102622 94-614-200102622 94-616-200102623 94-614' 200102623 94-614-200102623 94-614-200.102624 94-614-200102624 94-614-200102624 94-614-200102625 94-614-2OQ102625 94-614-200102625 94-614-
•1564-T2 •1564-T2 •1564-T2 •1564-T2 •1564-T2 -1564-T2 •1S64-T2 •1564-T2 •1564-T2 -1564-T2 -1S64-T2 •1566-T2 -1566-T2 •1566-T2 -1567-T2 •1S67-T2 •1S67-T2 •1567-TZ •1567-T2 •1567-T2 •1567-T2 •1S67-T2 •1567-TZ •1567-T2 •1567-T2 •1567-T2 •1367-T2 •1567-T2 •1567-T2 •1S67-T2 1567-T2
•1567-T2 •1569-T2 -1569-T2 •1S69-T2 •1572-T2 1572-T2
•1S72-T2 1581-TZ
•1581-TZ 1581-T2
saczs tsczs S8A2L 88AZL S8A2L J8BZL SBB2L taazt. ESCZL S8CZL SSCZL 1MB SUB SUB S8A18S S8A1SS S8A18J S6816S SS81BS taaiM S8C18S SBC18S ftcisc MA18L t u i e i M A U I S8A18L S8A18L I8A1IL I8C1K. S8CI8L S8C18L sue sue sue S110 S11D S11D SUE SUE SUE
SOLIDS URANIUM PH SOLIDS URANIUM PH SOLIDS URANIUM PH SOLIDS URANIUM PH SOLIDS URANIUM DENSITY SOLIDS URANIUM DENSITY SOLIDS URANIUM DENSITY SOLIDS URANIUM PH SOLIDS URANIUM PH SOLIDS URANIUM PH SOLIDS URANIUM PH SOLIDS URANIUM PH SOLIDS URANIUM PK SOLIDS URANIUM
DATE DATE TASK RESULT WITS 14 SAMPLED PERFORMED ASl
7.78 wt X 12-OCT-94 17-OCT-94 B 10.8 Bfl/L 12-0CT-94 20-OCT-94 1 9.49 PH Un 12-0CT-94 20-OCT-94 B 1.77 ut X 12-0CT-94 17-0CT-94 ( 3.6 «g/L 12-0CT-94 20-0CT-94 t 9.48 pH Un 12-0CT-94 20-OCT-94 I 1.81 Ht X 12-0CT-94 17-OCT-94 B 3.7 •a/L 12-OCT-94 ZO-OCT-94 B 9.47 pH Un 12-0CT-94 20-OCT-94 B 1.84 wt X 12-0CT-94 17-0CT-94 B 3.5 •8/L 12-OCT-W ZO-OCT-94 8 9.49 P* un 12-OCT-94 20-0CT-94 B 1.70 Ht X 12-0CT-94 17-0CT-94 8 3.7 •e/L 12-0CT-94 20-0CT-94 B 1.037 o/al 12-0CT-94 ZZ-OCT-94 B 6.83 ut X 12-OCT-94 17-OCT-94 1 6.6 •9/L 12-0CT-94 20-OCT-94 B 1.046 8/al 12-0CT-94 20-OCT-94 B 7.48 Wt X 12-OCT-94 17-0CT-94 8 7.2 «QYL 1Z-0CT-94 ZO-OCT-94 B 1.05B s/at 12-0CT-94 20-0CT-94 B 6.75 wt X 12-OCT-94 17-CCT-94 B S.3 •8/1 12-0CT-94 20-OCT-94 t 9.49 pa Un 12-OCT-94 20-OCT-94 B 1.82 ut X 12-OCT-94 17-0CT-94 B 0.5 •9/L 12-0CT-94 20-OCT-W B 9.48 pH Un 12-0CT-94 20-0CT-94 8 1.90 ut X 12-OCT-94 17-0CT-94 B 0.5 •8/L 12-OCT-9* 20-0CT-94 B 9.48 pHUn 12-0CT-94 20-0CT-94 I 1.79 wt X 12-OCT-94 17-0CT-94 8 0.5 •9/L 1Z-0CT-94 ZO-OCT-94 B 9.50 PH Un 13-0CT-94 ZO-OCT-94 B 1.63 ut X 13-0CT-94 17-0CT-94 B 0.6 •9/L 13-OCT-94 20-OCT-94 B 9.64 pH un 13-OCT-94 20-OCT-94 B 0.47 ut X 13-OCT-94 17-0CT-94 B 0.6 •9/L 13-0CT-94 ZO-OCT-94 B 9.62 pH Un 13-OCT-94 21-0CT-94 S 0.30 ut X 13-0CT-94 17-0CT-94 B 0.3 •fl/L 13-OCT-94 20-OCT-94 8
Your Satacclon crltarla U n : Ralaisa lunbtrt X Fraa Raealvad Datat X
Conponcnt: X-LR Ditplay Taxt?
Subniiasion ID: Projaet Naae: 30.05.08X9X-614X
173
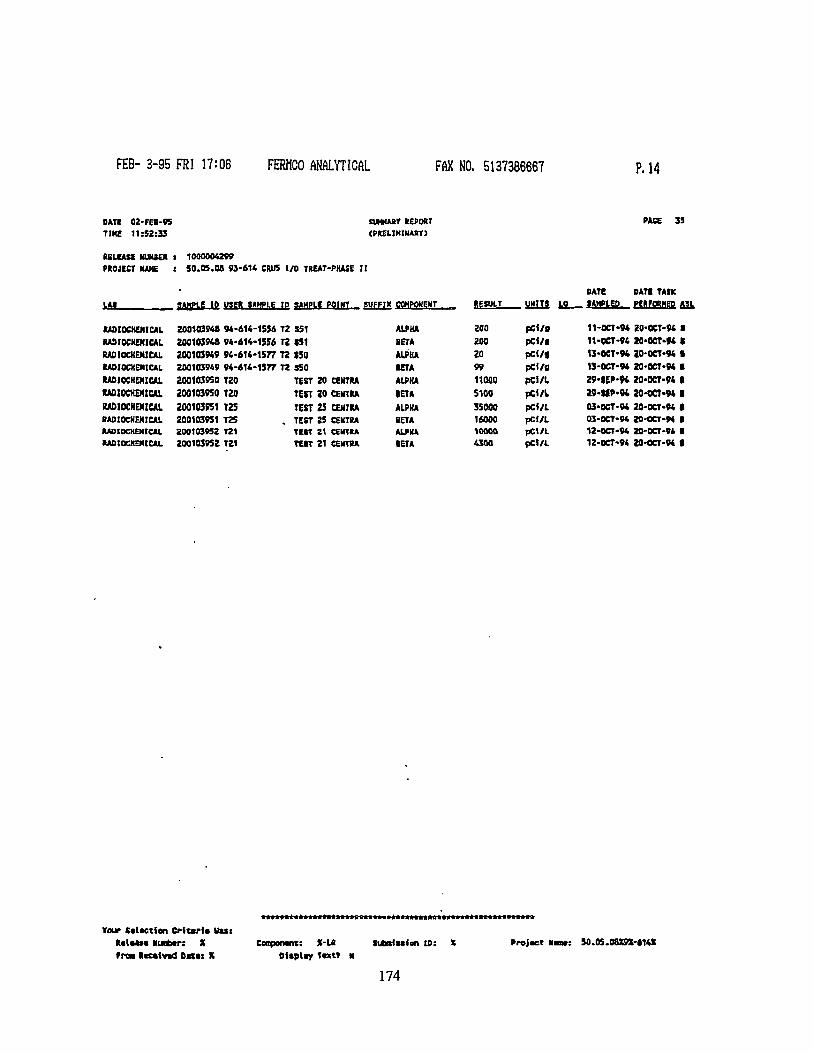
FEB- 3-95 FRI 17:06 FERHCO ANALYTICAL FAX NO. 5137366667 P. 14
DAT! TIKE
02-FEB-95 11:52:33
XUHKARr REPORT (PRELIMINARY}
PACE 35
RELEASE NUMBER J 1000004299 PROJECT NAME : 5 0 . 0 5 . 0 8 9 3 - 6 1 4 CRIB I/O TREAT-PHASE II
' BATE DATE TASK lAt SAMPLE ID USER SAMPLE, 10 SAMPLE POINT SUFFIX COMPONENT . RESULT
ZOO
_ UNITS
pCi/9
iS. SAMPLED PERFORMED A3L
RADIOCHEMICAL 200103948 94-614-1556 T2 S51 ALPHA
RESULT
ZOO
_ UNITS
pCi/9 11-0CT-94 20-0CT-94 I RADIOCHEMICAL 200103948 94-614-1556 T2 S51 BETA 200 pCi/f 11-0CT-94 M-OCT-94 I RADIOCHEMICAL 200103949 94-614-1577 T2 $50 ALPHA 20 pC</» 13-0CT-94 20-OCT-94 • RADIOCHEMICAL 200103949 94-614-1377 T2 S50 RITA 99 pct/g 13-0CT-94 20-0CT-94 • RADIOCHEMICAL 200103950 T20 TEST 20 CENTRA ALPHA 11000 pcl/L 29-SEP-94 20-0CT-94 1 RADIOCHEMICAL 200103950 T20 TEST 20 CENTRA •ETA 5100 pCWL 29-ttP-M 20-OCT-W 1 RADIOCHEMICAL 200103951 T2S TEST 35 CENTRA ALPHA 35000 pCi/L 03-OCT-94 20-CCT-M • RADIOCHEMICAL 200103951 T25 . TEST 25 CENTRA SETA 16000 pCl/L 03-OCT-94 20-OCT-W 1 RADIOCHEMICAL 200103952 T21 Tt«T 21 CENTRA ALPHA 10000 pCl/L 12-CCT-94 20-CCT-94 • RADIOCHEMICAL 200103952 T21 T U T 21 CENTRA IETA 4300 pCl/L 12-0CT-94 20-CCT-W •
Tour S i l t e t i en CrStarU Wasi Ralwst Murter: X Proa Rceatvtd Oatci X
Conpootnt: 3*~LR OUpliy T « M
Subnlufon 10:
174
Projact Ni 50.0S.08X9X-614X
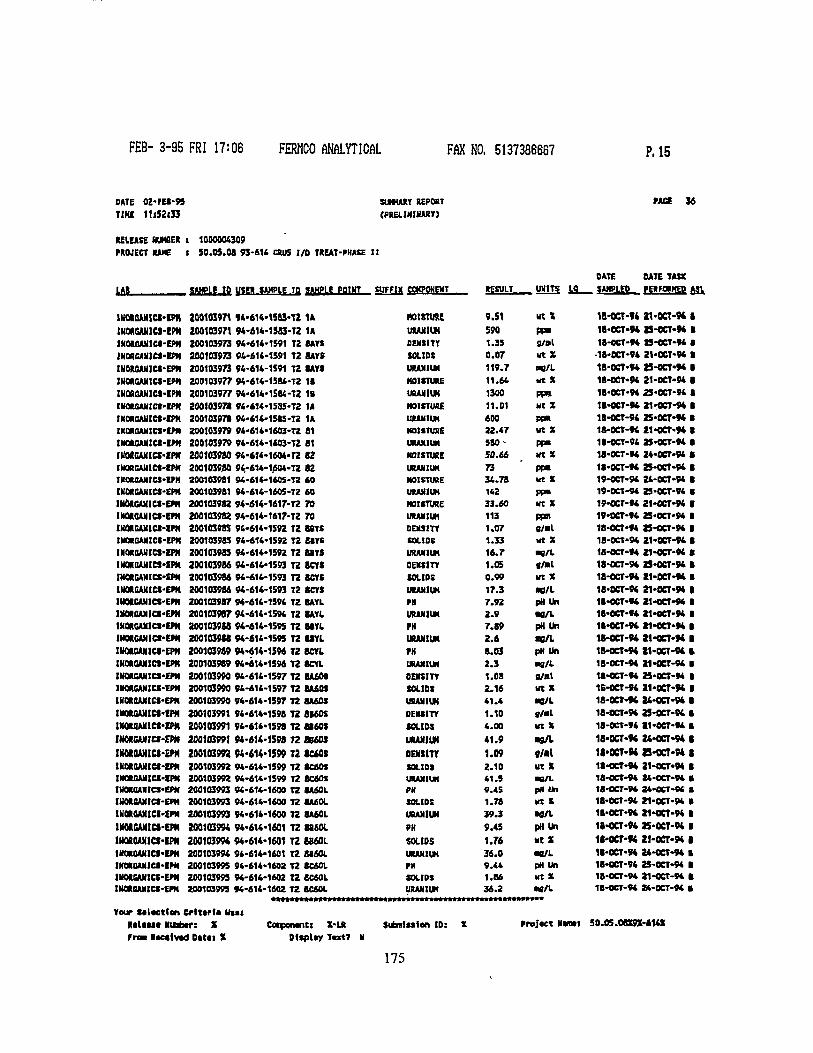
FEB- 3-95 FRI 17:06 FERHCO ANALYTICAL FAX NO. 5137386667 P. 15
DATE 02-FEB-95 SUHHART REPORT PACT 36 TIM 11*52(33 (PRELIMINARY)
RELEASE NUMBER i 1000004309 PROJECT RANE I 50.05.08 93-614 CRU5 I/O TREAT-PHASE II
DATE DATE TASK U B SAHPLt 10 USER IAHPLE ID SAHPLt POINT SUFFIX COKPONENT RESULT WITS LQ SAMPLED PERFORMED ASL
1NORQAHICMPN. 200103971 l**614*15«*T2 1A MOISTURE 9.S1 ut X 1B-OCT-94 21-0CT-94 I IKOttGAUiet-CW 200103971 94*614-13aS-T2 1A URANIUM 590 PP" 18-0094 23-CCT-94 8 1MOROAMICI-EPH 200103973 94-614-1591 T2 SAYS OENSITT 1.35 g/al 18-OCT-94 25-OCT-94 • INORCAHICS-BK 200103973 94-614-1591 T2 BAYS SOLIDS 0.07 ut X •18-0CT-94 21-0CT-94 I INOR6AM1CS-EPK 200103973 94-614-1591 T2 IAYS URANIUM 119.7 •S/L 18-0CT-94 2S-0O94 I INORGANICS-EPH 200103977 94-614-1584-T2 11 MOISTURE 11.64 ut X 18-OCT-94 21-OCT-94 I IH06GAHICJ-IPH 200103977 94-614-1SB4-T2 1B URANIUM 1300 PP". 18-0CT-94 2S-0CT-94 * IKOtOAKICI-EMt 20010397* 94-614-1585-T2 1« MOISTURE 11.01 ut X 18-OCT-9* 21-0CT-94 > INOROAUICt-IPH 20010397* P4-614-15S5-T2 1A URANIUM 600 PP« 18-OCT-94 25-OCT-94 B IKOROANICS-IM 200103979 94*614*1603*T2 81 MOISTURE 22.47 Ut X 18-0CT-K 21*0CT*94 * IHORGANICI-EPH 200103979 94-614-1603-T2 81 URANIUM 580- PP» 18-OCT-94 25-OCT-94 • IKORQAKICt-IPK 200103980 94-614*1604-T2 82 MOISTURE 50.66 Ut X 18-0CT-94 24-0CT-9* B IM0RCAH1CS*EPH 200103980 94*614-1604*T2 82 URANIUM 73 ppa 1S-0CT-94 25-OCT-94 • IHOUANtCS-IPM 200103981 94-614-160S-T2 60 MOISTURE 34.78 ut X 19-OCT-9* 24-0CT-94 B INORGANICS-EPM 2001039B1 94-614-1605-T2 60 URANIUM 142 ppa 19-0CT-9* 25-0CT-94 B INORGAXICS-EPH 200103982 94-614-1617-T2 70 MOISTURE 33.60 ut X 19-OCT-94 21-0CT-P4 • IKOROAKICS-EPM 200103982 94-614-1617-T2 70 URANIUM 113 ppn 19-0CT-94 25-0CT-94 S IKORSAHICI-IPH 200103983 94-614-1592 T2 88YS DENSITY 1.07 B/al 18-0CT-94 2S-0CT-94 B IMORGAHICS-EPH 200103985 94-614-1592 T2 BITS SOLIDS 1.33 Mt X 18-OCT*94 21-CCT-94 B IROROAMICJ-IPH 200103985 94-614*1592 T2 BBYS URANIUM 16.7 •9/L 18-OCT-94 21-OCT-94 B IMORGAHICJ-IPM 200103986 94-614-1593 TZ SCYS DENSITY 1.05 S/al 18-OCT-9* 2S-0CT-94 B WORGANICS-EPH 200103986 94-614-1593 T2 8CYC SOLIDS 0.99 ut X 18-0CT-94 21-0CT-94 B INORGANICS-EM 200103986 94-614-1593 T2 8CY* URANIUM 17.3 •S/L 18-OCT-94 21*0CT*94 8 IHQRGRHICS-EPH 200I039B7 94-614-1594 T2 8AYL PN 7.92 pH Un 1I-0CT-94 21-OCT-94 • IKORSANICI-EPH 200103967 94-614-1594 T2 SAYl URANIUM 2.9 •S/L 1B-0CT-94 I1-OCT-9* • INORSAHICS'EPH 200103988 94-614-1595 T2 M Y L PH 7.89 pHUn 1B-CCT-9* 21*0CT*94 B IMORGANICS-EPM 200103988 94-614-1595 T2 U Y L URANIUM 2.6 BO/L 1B-0CT-94 21-oa*94 I IMORQAHICS-EPH 200103989 94*614-1596 T2 8CYL PH 8.03 pH Un 18-OCT-94 21-0CT-94 t IHOtOANICt-EPM 200103989 94-614*1596 T2 8CYL URANIUM 2.3 •9/L 18-OCT-94 21*CCT-94 B INORSAHICS-EIK 200103990 94-614*1597 T2 BA6M OENSITT 1.08 B/al 1B-OCT-94 25-OCT-94 I 1H0R6ANICS-EPM 200103990 94-614-1597 T2 BA60S SOLIDS 2.16 ut X 16-0CT-94 21-0CT-94 I INOROANICI-EPN 200103990 94-614-1597 T2 8A60S URANIUM 41.4 •S/L 18-0CT-94 24-OCT-94 • 1M0RGANICI-IPM 200103991 94*614*1598 T2 8I60S OENSITT 1.10 g/al 18-OCT-94 2S-0CT-94 B IHORQ/UtlCS-IPM 200103991 94*614*1598 T2 8*60* SOLIDS 4.00 ut X 1B-0CT-94 11-OCT-K B INORSWICt-ePN 200103991 94-614-1598 T2 0B6OS URANIUM 41.9 •9/1 18-0CT-94 24*CCT«94 1 IKORQAHICI-EPH 200103992 94*614*1599 T2 icMs DENSITY 1.09 «/al 1I-0CT*»4 25-OCT-94 1 IHOROAHICS-EPM 200103992 94*614*1599 T2 8C60S SOLIDS 2.10 ut X 18-OCT-94 21-OCT-94 8 1N0RQANICI-IPN 200103992 94-614-1599 T2 8C60S URAMIUH 41.5 •S/L 18-0CT-94 I4-OCT-94 B IHOAGANICS-EPM 200103993 94-414-1600 T2 IA60L PH 9.45 pH Un I8-OCT-9* 24-OCT-W • IHORSAHICS-EPH 200103993 94-614-1600 T2 SA60L SOLIDS 1.78 Ut X 18-0CT-94 21-0CT-9* B INORGANICI-EPM 200103993 94*614*1600 T2 8A60L URANIUM 39.3 •S/L 1B-0CT-94 21*OCT*94 B lMOAHUlCI-EPM 200103994 94*614*1601 T2 8860L PH 9.45 pHUn 18-OCT-94 2S-0CT-94 ( IHOBQANICS-IPN 200103994 94*614*1601 T2 8860L SOLIDS 1.76 Mt X 1**OCT-f4 21-OCT-94 8 IHOROAHICf-EPM 200103994 94-614*1601 T2 8I60L URANIUM 36.0 •9/L 18-OCT-94 24-CCT-9* 8 IKOROANICl-IPM 200103995 94-614*1602 T2 8C60L PH 9.44 pH un 18-OCT-94 25-0CT-94 S INORSANICS-EPH 200103995 94-614-1602 T2 8C60L SOLIDS 1.86 Ht X 18-OCT-94 21-OCT-9* B IKORSANICS-EPH 20010399S 94-614-1602 T2 BC60L URANIUM 36.2 •S/L T8-0CT-94 24-0CT-9* B
Your Sclactfcn Crlttrl* ui-t RSlMM KUobtr: X Cacpontnti X -U Submission ID: X Projiet N-mt 50.OS.OSX9X-616X Proa Rie«iv*d 0*t«i X Display Y«xtT M
175
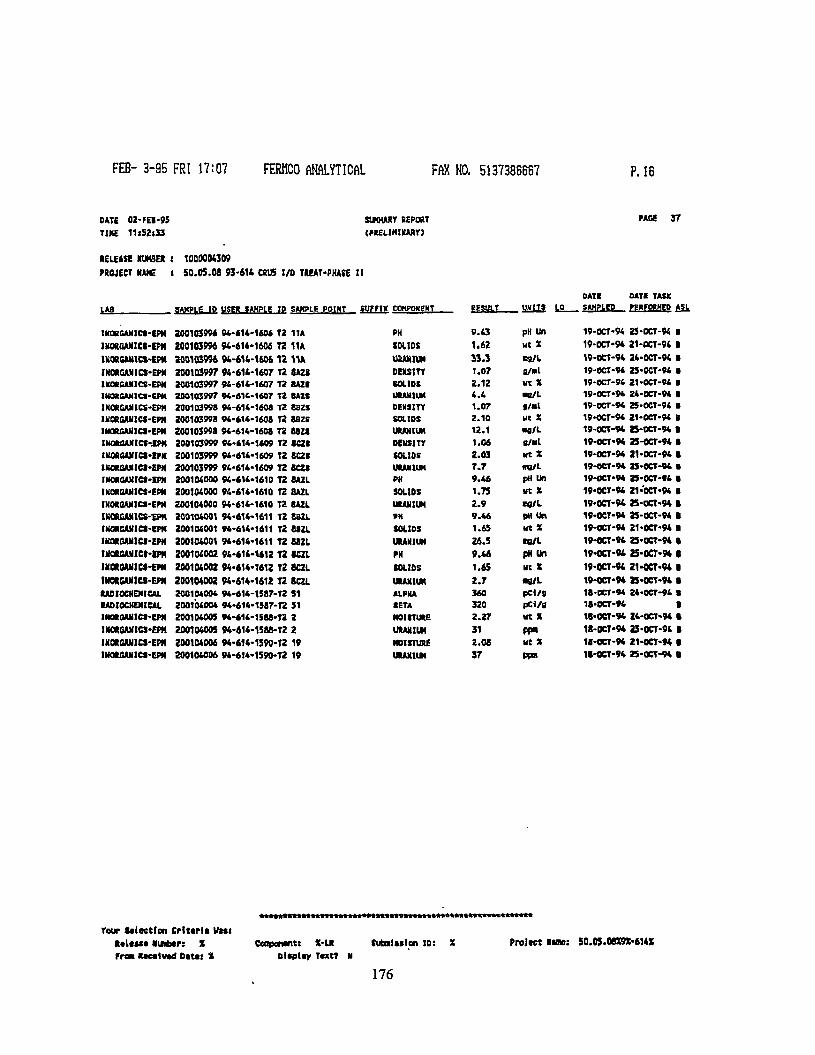
FEB- 3-95 FRI 17:07 FERHCO ANALYTICAL FAX NO. 5137386667 P. 16
DATE TIKE
02-FE8-95 11I52I33
SUMMARY REPORT (PRELIMINARY)
PABE 3 7
RELEASE HUKSER < 1000004309 PROJECT NAME t 5 0 . 0 5 . 0 3 9 3 - 6 1 4 CRUS I/O TREAT-PHASE It
DATS DATA TASK LAB SAMPLE ID USER SAMPLE ID SAMPLE POINT SUFFIX COKPOXBMT RESULT
9.43
UMfTS LQ
pH Un
SAMPLED PENFORHEO ASl
IKOBSANlCR-fM 200103996 94-614-1606 T2 11A PH
RESULT
9.43
UMfTS LQ
pH Un 19-0CT-94 23-0CT-94 I
IHORGANICI-EPM 200103996 94-614-1606 T2 11A SOLIDS 1.62 ut X 19-0CT-94 21-CCI-94 1
IKORSANICS-EPM 200103996 94-614-1606 12 11A URANIUM 33 .3 Rg/L 19-0CT-94 24-0CT-94 •
INORGANICS-EPtI 200103997 94-614-1607 T2 8A2S DENSITY 1.07 a/nil 19-CCT-94 2S-0CT-94 •
H U M A N I C S - E M 200103997 94-614-1607 T2 SAZC SOLIDS 2.12 Ht X 19-CCT-94 21-0CT-94 • IKOKOAMICS-CPK Z001Q3997 94-414-1607 T2 BAZt UUK1UM 4.4 •S/L 19-0CT-94 24-0CT-94 •
INORGAMICS-EPH 200103998 94-614-1608 TZ 88ZS DENSITY 1.07 I / a l 19-0CT-94 Z5-0CT-94 •
INOROAJIICS-EPM 200103998 94-614-1608 T2 88ZS SOLIDS 2.10 Wt X 19-OCT-94 21-0CT-94 B
IHORCAHtCS-EMI 200103998 94-614-1608 T2 8SZS URANIUM 12.1 •S /L 19-OCT-94 25-OCT-94 •
IKORtUNICf-JPH 200103999 94-614-1609 T2 8CZS OENSITY 1.06 g /a l 19-OCT-94 2S-0CT-94 I
IKORCAXICS-EPM 200103999 94-614-1609 T2 8CZS SOLIDS 2.03 Ht X 19-0CT-94 21-0CT-94 8 IWXtEAXICI-EPM 200103999 94-614-1609 TZ SCZS URANIUM 7 . 7 WB/L 19-OCT-94 25-0CT-94 •
HKXGAHICt-IPM 200104000 94-616-1610 T2 6AZL PH 9.46 pH Un 19-OCT-9* 25-0CT-94 I
INORQAMICS'EPH 200104000 94-614-1610 T2 8AZL SOLIDS 1.75 « X 19-0CT-94 21-0CT-94 • IHOAQ7UIICS-EPM 200104000 94-614-1610 T2 SAZL URANIUM 2 .9 eg/L 19-0CT-94 2S-OCT-9* 8 INORGAHICS-EPN 200104001 94-614-1611 T2 882L PH 9.46 pH Un 19-0CT-94 25-0CT-94 8 tuaiauiies-epN 200104001 94-614-1611 T2 88ZL SOLIDS 1.65 wt X 19-0CT-94 21-0CT-94 I IIUXSAMtCI-EPM 200104001 94-614-1611 T2 8221 URANIUM 26.3 BO/L 19-0CT-94 25-OCT-94 8 lUOSOAMiet-tPH 200104002 94-614-1612 T2 8CZL PH 9.46 pH Un 19-CCT-94 25-OCT-94 8 INOROAUIU-EPM 200104002 94-614-1612 T2 BCZL SOLIDS 1.65 Mt X 19-CCT-94 21-OCT-94 8 IH0R6AN!es-EPN 200104002 94-614-1612 T2 SOL URANIUM 2 .7 • 9 / L 19-OCT-94 25-0CT-94 8 RADIOCHEMICAL 200104004 94-614-1S87-T2 51 ALPHA 360 p c i / a 18-0CT-94 Z4-0CT-94 8 RADIOCHEMICAL 200104004 94-614-15B7-T2 51 •ETA 320 pc i / a 18-0CT-94 8 HMROAMCt-EPM 200104005 94-414-15S8-T2 2 MOISTURE 2.27 wt X 18-0CT-94 24-OCT-94 8 INOROAIilCS-EPN 200104005 94-614-1588-T2 2 URANIUM 31 PP» 18-0CT-94 25-0CT-94 8 UOftGANICS-EPH 200104006 94-614-1590-T2 19 MOISTURE 2.08 wt X 1B-OCT-94 21-OCT-94 8 INOROAMies-EPM 200104006 94-614-1590-T2 19 URANIUM 37 PFn 1B-CCT-94 25-0CT-94 8
Tour Saleetton CrlMrU Wtsx Rtltu* Nunbtr: X Froa ucalvtd Dati: X
Ceaponmt: X-IR Dicplay Text?
SubalMlon ID:
176
Project R*ae: 50.05.08X9X-614X
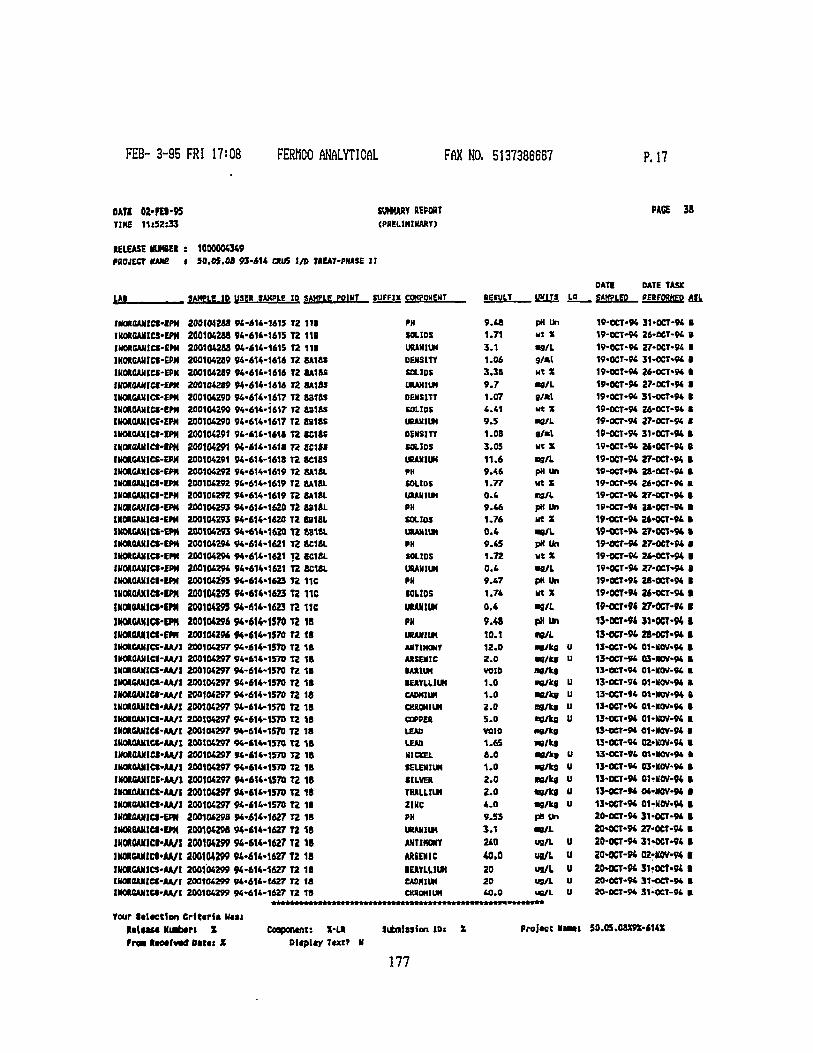
FEB- 3 - 9 5 FRI 17:08 FERHCO ANALYTICAL FAX NO. 5137386667 P. 17
DATI TIKE
02-rci-w 11:52:33
SUMMARY REPORT (PRELIMINARY
PACE 3B
RELEASE WMER : 1000004349 PROJECT NAME I 5 0 . 0 5 . 0 8 9 3 - 6 1 4 OUJS I/D TREAT-PHASE II
DATE DATE TASK
LAf.,.,. SAMPLE 10 USER SAMPLE ID SAMPLE POINT SUFFIX COMPONENT RESULT
9.48
WITS
pH Un
LO SAMPLED PERFORMED AJL
INMOAHICS-IPM 200104288 94-6H-1615 T2 111 PH
RESULT
9.48
WITS
pH Un
LO
19-0CT-94 31-0CT-94 B
IUOROAIIICS-EPH 200104288 94-614-1615 T2 118 SOLIDS 1.71 Mt X 19-OCT-94 26-OCT-94 B
INORGAUICS'EPM 200104288 94-614-1615 T2 111 UMHIUK 3 .1 • 9 / L 19-0CT-94 27-KT-94 1 IR0AGANIC8-EPM 200104289 94-614-1616 T2 8A1SS DENSITY 1.06 9 / * l 19-0CT-94 31-0CT-94 8 INOAGANICS-EPM 200104289 94-614-1616 T2 8A18S SOLIDS 3.38 Mt X 19-OCT-94 26-OCT*94 B ftfOROANICf-EPM 200104289 94-614-1616 72 8A183 URANIUM 9 .7 • 0 / L 19-0CT-94 27-OCT-94 8 MORGAUICS-EPM 200104290 94-614-1617 T2 8318S DENSITY 1.07 9 / « l 19-0CT*94 31-OCT-94 B INOROAMICS-EPN 200104290 94-614-1617 T2 83185 SOLIDS 4.41 Mt X 19-OCT-94 26-0CT-94 B IHOAGAHIC8-EPM 200104290 94-614-1617 T2 8B18S URANIUM 9.5 • f l /L 19-0CT-94 27-0CT-94 f IHOtCIAMiei-EPH 200104291 94-614-1618 T2 SC16S OENSITT 1.08 • / • I 19-0CT-94 31-0CT-94 B
(NORGAHttt'lPH 200104291 94-614-1618 T2 8C188 SOLIDS 3.05 Ht X 19-OCT-94 26-0CT-94 B IHORCAHieS-EPM 200104291 94-614-1618 T2 8C18S URANIUM 11.6 ng/L 19-0CT-94 27-OCT-M B INOftUXICC-EPN 200104292 94-614-1619 T2 8A18L PH 9.46 pH Un 19-OCT-94 28-OCT-M B 1NOAOAUICI-EPM 200104292 94-614-1619 T2 8A18L SOLIDS 1.77 Mt X 19-OCT-94 Z6-0CT-V4 • INORGAHICS-EPM 20010(292 94-614-1619 T2 8A18L URANIUM 0.4 n s / l 19-0CT-94 27-OCT-94 B IHOR6AMICS-EPH 200104293 94-614-1620 T2 6818L PH 9.46 pH Un 19-OCT-W 2B-0CT-94 • INOESAUICS-EPM 200104293 94-614-1620 TZ 8B18L SOLIDS 1.76 ut X 19-0CT-94 26-0CT-94 B IKOACAHICS-EPM 200104293 94-614-1620 T2 8S18L URANIUM 0 .4 • 9 / L 19-CCT-94 27-0CT-94 B MORsAXICC-EPH 200104294 94-614-1621 T2 8C18L PH 9.45 pH Un 19-0CT-9* 27-0CT-94 S IHOREAKICS-EPII 200104294 94-614-1621 T2 8C18L SOLIDS 1.72 Nt X 19-CCT-94 26-OCT-94 B IV0A8AMICS-EPM 200104294 94*614*1621 T2 BC18L URANIUM 0.4 •g /L 19-0CT-94 27-OCT-M B IHOROAMICS-EPM 200104295 94-614*1623 TZ 11C PH 9.47 OH Un 19-QCT-94 28-OCT-94 B IHOtOANICt'IPN 200104295 94-614*1623 T2 11C SOLIDS 1.74 ut X 19-0CT-94 26-OCT-94 B IKOROAHlCS'EPM 200104295 94-616-1623 T2 11c URAMIUH 0.4 •fl/L 19-OCT*94 27-0CT-94 I
IHWCANICS'EPN 200104296 94-614-1570 T2 18 PH 9.48 pH Un 13-0CT-94 31-0CT-94 1 IHORBAMICS-EPII 200104Z96 94*614*1570 T2 18 URAMIUH 10.1 IW/L 13-0CT-94 28-0CT-94 8 IMORGANICE-AA/I 200104297 94-614-1570 T2 18 ANTIMONY 12.0 •g /kg u 13*0CT-94 01-H0V-94 B lKOKOAHICS-M/l 200104297 94*614*1570 TZ IS ARSENIC Z.O •e/fca u 13-CCT-94 03-MOV-94 B INOB.GAHICS-AA/I 200104297 94-614-1570 TZ IB IARIUN VOID •g /kg 13-0CT-94 01-N0V-94 • IHMCANICS-U/I 200104297 94*614-1570 T2 18 BERYLLIUM 1.0 «B/kg u 13-OCT-96 Ol-NOV-94 • fNOkOAMICS-AA/I 200104297 94-614*1570 72 18 CADMIUM 1.0 •B/kg u 13-OCT-94 01-XOV-94 6 IKOROAUICS-AA/I 200104297 94-614-1570 T2 IB CHROMIUM 2 .0 88/kg U 13-0CT-94 01-N0V-94 B IK0AGAMICS-«A/1 200104297 94-614-1570 T2 18 COPPER 5 .0 eg/kg u 13-0CT-94 01-KOV-94 B IKORSANICS-AA/I 200104297 94*614*1570 T2 18 LEAD VOID ng/kg 13-OCT-94 01-N0V-94 B lUORQAHICS-AA/I 200104297 94*614*1570 T2 1B LEAD 1.65 •B/kg 13-OCT-94 02-K0V-94 B 1H0RSAXICS-AVI 200104297 94*614*1570 T2 IB KIOXL 8.0 •e /kg u 13-0CT-94 01*N0V*94 B HtOROANICt-AA/I 200104297 94-614-1570 T2 IB SELEMIUN 1.0 •B/kg u 13-OCT-94 03-X0V-94 B INORCANIH-AVI 200104297 94-614-1570 T2 18 SILVER 2.0 ng/kg u 13-OCT-94 01-H0V-94 B tHOtOAMICt-AA/l 200104297 94-614-1570 T2 18 THALLIUM 2 .0 «s/kg u 13-0CT-94 04-NOV-94 B IKOROANICS-AA/I 200104297 94-614-1570 T2 11 2IKC 4 . 0 • 9 / k g u 13-0CT-94 01-N0V-94 B INOtSANICI-EPM 20O10429S 94*614-1627 T2 18 PH 9.53 pH Un 20-0CT-94 31-0CT-94 B
IHORSAUICt-IPH 200104298 94*614*1627 T2 18 URANIUM 3 . 1 • g / L 20-OCT-94 27-0CT-94 B
IMMOAKICI-AA/I 200104299 94-614-1627 T2 18 ANTIMONY 240 US/L u 20-OCT-94 31-0CT-94 B
IKORCAMICt'AA/I 200104299 94-614-1627 T2 18 ARSENIC 40.0 ua/L u 20*OCT-M 02*K0V*94 •
INOftCANICS-AA/1 200104299 94-614-1627 T2 18 BERYLLIUM 20 US/L u 20-OCT-94 31-0CT*94 8 IHOROAHCS-M/I 200104299 94*614* 1627 T2 18 CADMIUM 20 US/L u 20-0CT-94 31-OCT-94 B MOEEAHICB-AA/I 200104299 94-614-1627 T2 18 CHROMIUM 40.0 ug/L u 20-0CT-94 31-0CT-94 B
Tour StUctlon Critiri* U-ti
u
RtlMM Niatxri X Ceapantnt: X-LR Submission io< J Proitct Naati 50.05.08X9X-614X
frm KtMtvtd D im X ol«pl«y Text? N
177
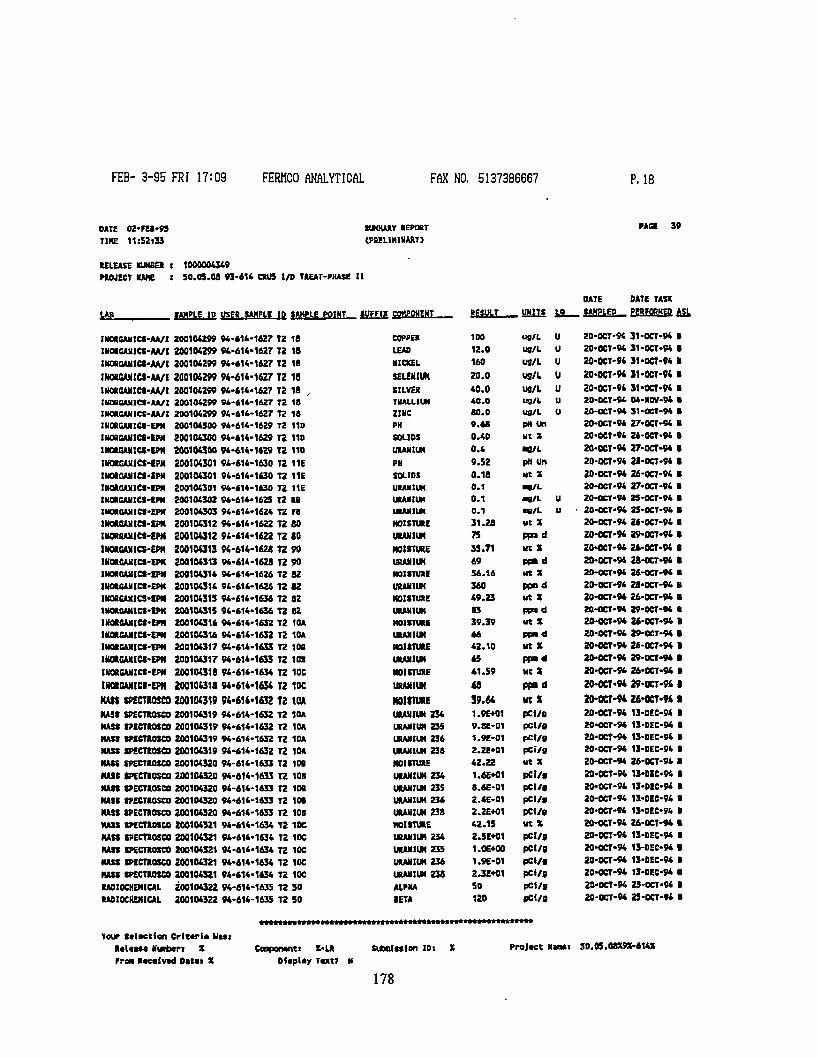
FEB- 3-95 FRI 17:09 FERMCO ANALYTICAL FAX NO. 5137386667 P. 18
DATE 02-FEI-95 SUKHARY REPORT PACE 39
TIKE 11:52>33 (PSELIHIMART}
RELEASE NUMBER I 1000004349 PROJECT KAHE t 50.05.08 93-614 CMS 1/0 TREAT-PHASE 11
DATE DATE TASK
U B SAMPLE ID USER JAMPtI ID SAMPLE POINT $UfFI)< COMPONENT RESULT . _ UNITS
100 ug/L
I S SAMPLED _ pgREOEHED A5L
INORSANICS-AA/I 200104299 94-614-1627 TZ IB COPPER
RESULT . _ UNITS
100 ug/L U 20-OCT-94 31-OCT-94 t
INORGAHIGS-AA/I 20010(299 94-614-1627 T2 18 LEAD 12.0 u j / L U 20-OCT-94 31-0CT-94 •
IKOROAHSCS-AA/I 200104299 94-614-1627 T2 18 NICKEL 160 US/L U 20-0CT-94 31-OCT-94 1
JHORCANIU-M/ I 20010(299 94-614-1627 T2 18 SELENIUM 20 .0 US/L U 20-OCT-94 31-0CT-94 8
INORSAHieS-AA/I 200104299 94-614-1627 T2 18 , SILVER 40 .0 U9/L U 20-0CT-94 31-0CT-94 I
MOREANICS-AA/l 200104299 94-614-1627 T2 18 THALLIUM 40 .0 ug/L U 20-0CT-94 04-N0V-94 •
IIMRCAHICS-AA/I 200104299 94-614-1627 T2 18 ZINC 80 .0 us/L U 20-OCT-94 31-OCT-94 •
INORGANlCt-EPM 200104300 94-614-1629 T2 110 PH 9 .68 pH Un 20-0CT-94 27-0CT-94 R
INORGAHICS-EPM 200104300 94-614-1629 T2 11D SOLIOS 0.40 uc X 20-OCT-94 24-0CT-9* 8
HUROANICS-EPH 200104300 94-614-1629 T2 110 URANIUM 0 .6 • f l /L 20-OCT-94 27-OCT-94 8
IKORGAlilCS-EPM 200104301 94-614-1630 T2 11E PH 9.52 pH un 20-OCT-94 U-OCT-94 8
INOSGANICS-EPM 200104301 94-614-1630 T2 11E SOLIOS 0.18 ut X 20-OCT-94 26-OCT-94 I
IHORGANICS-EPM 200104301 94-614-1630 T2 116 URANIUM 0.1 ng/L 20-OCT-94 27-0CT-94 •
1NORCANICS-EPM 200104302 94-614-1625 T2 R8 URANIUM 0.1 •B/L U 20-OCT-94 2S-0CT-94 •
IHOROAN1CS-EPM 200104303 94-614-1624 TZ n URANIUM 0.1 • g / L U - 20-OCT'94 25-0CT-94 •
IMOROANICS-EPM 200104312 94-614-1622 T2 80 MOISTURE 31.28 Ut X 20-0CT-94 26-OCT-94 R
INORBAHICS-EPM 200104312 94-614-1622 T2 80 URANIUM 75 p p n d ZO-OCT-94 29-0CT-94 8
INOKCANICS-EPN 200104313 94-614-1628 T2 90 MOISTURE 35.71 ut X 20-OCT-04 26-0CT-94 8
IMOR8AHICI-EPH 200104313 94-614-1628 T2 90 URANIUM 69 p p a d 20-OCT-94 28-OCT-94 8
MOROAHICS-EPN 200104314 94-614-1626 T2 82 MOISTURE 56.16 ut X 20-OCT-94 26-OCT-94 •
IHORGAH1CS-EPM 200104314 94-614-1626 TZ 82 URANIUM 360 p p n d 20-0CT-94 28-0CT-94 B
IN0R6AH1CS-EPM 200104315 94-614-1636 TZ 82 MOISTURE 49.23 ut X 20-OCT-94 26-0CT-94 •
INOROANlCf-EPM 200104315 94-614-1636 T2 82 URANIUM 83 P P « d ZO-OCT-94 29-OCT-94 •
IHORaANICS-EPH 200104316 94-614-1632 T2 10A MOISTURI 39.39 ut X 20-OCT-94 26-OCT-94 8
INORGANICS-ERR 200104316 94-614-1632 T2 IDA URANIUM 66 p p a d 20-OCT-94 29-OCT-94 8
IHOROUIICS-EPM 200104317 94-614-1633 T2 10B MOISTURE 42.10 ut X 20-0CT-94 26-0CT-94 8
IKOROANICS-EPM 200104317 94-614-1633 T2 10B URANIUM 65 p p a d 20-0CT-94 29-OCT-94 I
IKORBAMlCt-CPM 200104318 94-614-1634 TZ IOC MOISTURE 41.59 ut X 20-OCT-94 26-OCT-94 8
IHOtGANIU-EPM 200104318 94-614-1634 T2 IOC URANIUM 68 ppad 20-OCT-94 29-0CT-94 I
HAW P£CTI0SC0 200104319 94-6HM632 T2 10* MOISTURE 39.64 HtX 20-0CT-94 26-0CT-94 • MASS tPECTROSCO 200104319 94-614-1632 T2 10A URANIUM 234 1.9E+01 pCi/fl 20-0CT-94 13-0EC-94 8
MASS SPECTROSCO 200104319 94-614-1632 T2 10A URANIUM Z35 9.8C-01 pc l /g 20-OCT-94 13-DEC-94 S
HAM tMCTROSCO 200104319 94-614-1632 TZ 10A URANIUM 236 1.98-01 p M / o 20-OCT-94 13-DEC-94 8
MASS XPECTROSCO 200104319 94-614-1632 T2 IDA URANIUM 238 2.28*01 pC»'/9 20-OCT-94 13-DEC-94 8
MASS SPECTROSCO 200104320 94-614-1633 T2 108 MOISTURE 42 .22 ut X 20-OCT-94 26-0CT-94 •
MASS SPECTEOSCO 200104320 94-614-1633 T2 108 URANIUM 234 1.66*01 p C ( / t 20-OCT-94 13-0EC-94 8
MASS tPECTROSCO 200104320 94-614-1633 T2 100 URANIUM 235 8.6E-01 PCI/R ZO-OCT-94 13-DEC-94 8
KAII tPECTROSCO 200104320 94-614-1633 T2 1 M URANIUM 236 2.6E-01 pCI/g 20-0CT-94 13-0IC-94 8
MASS tPECTROSCO 200104320 94-614-1633 T2 108 URANIUM 238 2.2E+01 PC1/8 20-OCT-94 13-0EC-94 t
MASS tPECTROICO 200104321 94-614-1634 T2 IOC MOISTURE 42.15 u t X 20-0CT-94 26-0CT-94 8
HAtt SPECTROSGO 200104321 94-614-1634 T2 IOC URANIUM 234 2.5E+01 PC1/S 20-OCT-94 13-DEC-94 8
HASt SPECTROSCO 200104321 94-614-1634 T2 IOC URANIUM 235 1.06*00 pci/g 20-CCT-94 13-DEC-94 •
MASS tPECTROSCO 200104321 94-614-1634 T2 IOC URANIUM 236 1.96-01 PCI/g 20-OCT-94 13-DEC-94 8
KAtt tPECTROteO 200104321 94-614-1634 T2 IOC URANIUM 238 2.31*01 pci/e ZO-OCT-94 13-0EC-94 8
RAOIOCHENICAL 200104322 94-614-1635 T2 50 ALPHA 50 pCI /9 ZO-OCT-94 25-OCT-94 8
RADIOCHEMICAL 200104322 94-614-1635 T2 50 SETA 120 pc</g 20-CCT-94 2S-0CT-94 8
Tour ftlactfcn Crltarla Uu i I I I I H I Nuiswri X from Rtcalvtd Oatat X
Caaponanti X-LR Display Taxt?
SUbntufon ID:
178
Project Naaat S0.05.08X9X-614X
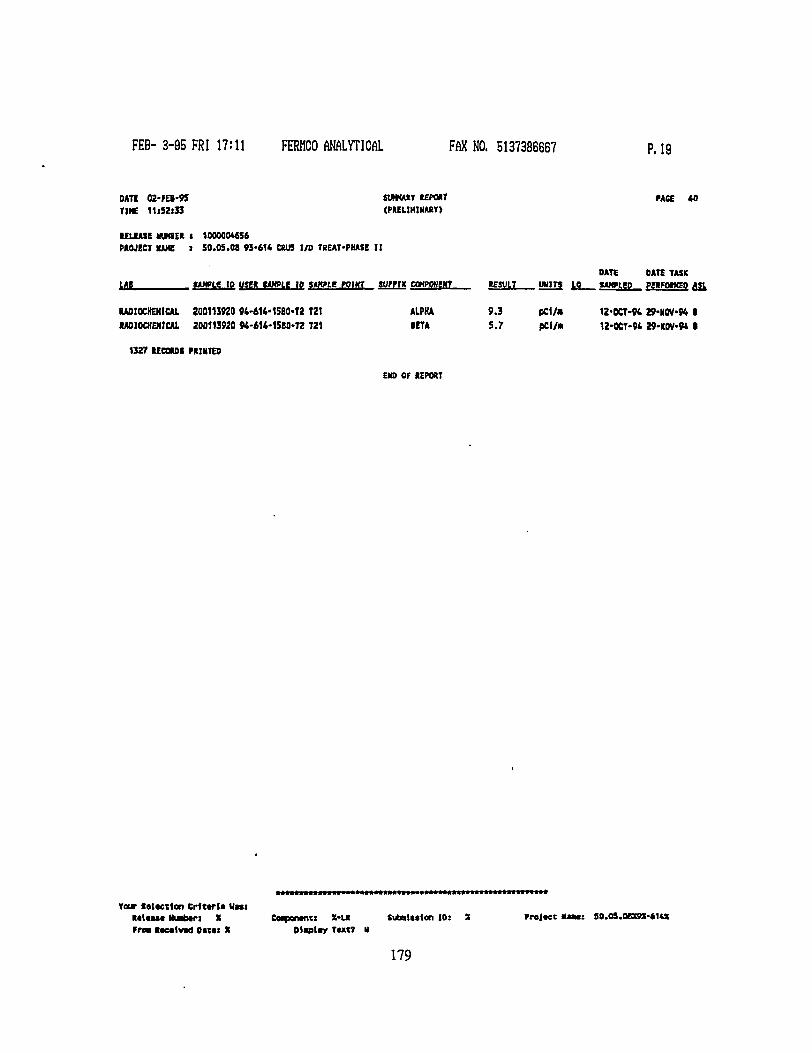
FEB-3-95 FRI 17:11 FERHCO ANALYTICAL FAX NO. 5137386667 P. 19
DATE 02-FEB-95 StWUtr REPORT PACE 40 TIHE 11I5ZISJ (PRELIMINARY)
RELEASE MUMER I 1000004656 PROJECT NAME i 50.05.08 93-61* CRU5 I/D TREAT-PHASE II
DATE DATE TASK U S WHPLg IP V«R WKPLE IP MHPtC POIOT SOPPIK COMPWEICT REJVLT UHTS. M SAMPtgp pgEFOtWEO Aft
RADIOCHEMICAL 200113920 94-61i-1580«t2 T21 ALPHA 9.3 pCt/a 1Z-0CT-94 29-ROV-W I
RADIOCHEMICAL 200113920 W-4H-15M-T2 T21 IITA 5.7 pCf/M 12-OCT-94 29-K0V-W I
1327 RECORDS PRINTED
EKD OF REPORT
Tour teltetlon Crfttrla U*s: R « I M M Miabtri t C«pontntt V IR Subalttion ID: X Projtct I U M I 50.0S.08X9X-M4X Fro* Meclvad O i w X Olaplmr Text? H
179

APPENDIX D
DETADLED MATERIAL BALANCES

APPENDIX D
DETAILED MATERIAL BALANCES
The detailed material balance results are shown in Appendix D. These detailed balances list the
amounts of solids and uranium in each stream. Tables D-l through D-8 apply to Tests 0 through 19.
Material balances for the final four Phase II tests are presented in Tables D-9 and D-10. The reactor
and the centrifuge material balances for solids are shown in Table D-l for the storage pad soil and
in Table D-2 for the incinerator area soil. The overall material balances for solids are shown in
Table D-3 for the storage pad soil and in Table D-4 for the incinerator area soil. The reactor and the
centrifuge material balances for uranium are shown in Table D-5 for the storage pad soil and in
Table D-6 for the incinerator area soil. The overall material balances for uranium are shown in
Table D-7 for the storage pad soil and in Table D-8 for the incinerator area soil. The soil and
uranium overall material balances for the final four tests are given in Tables D-9 and D-10,
respectively.
183
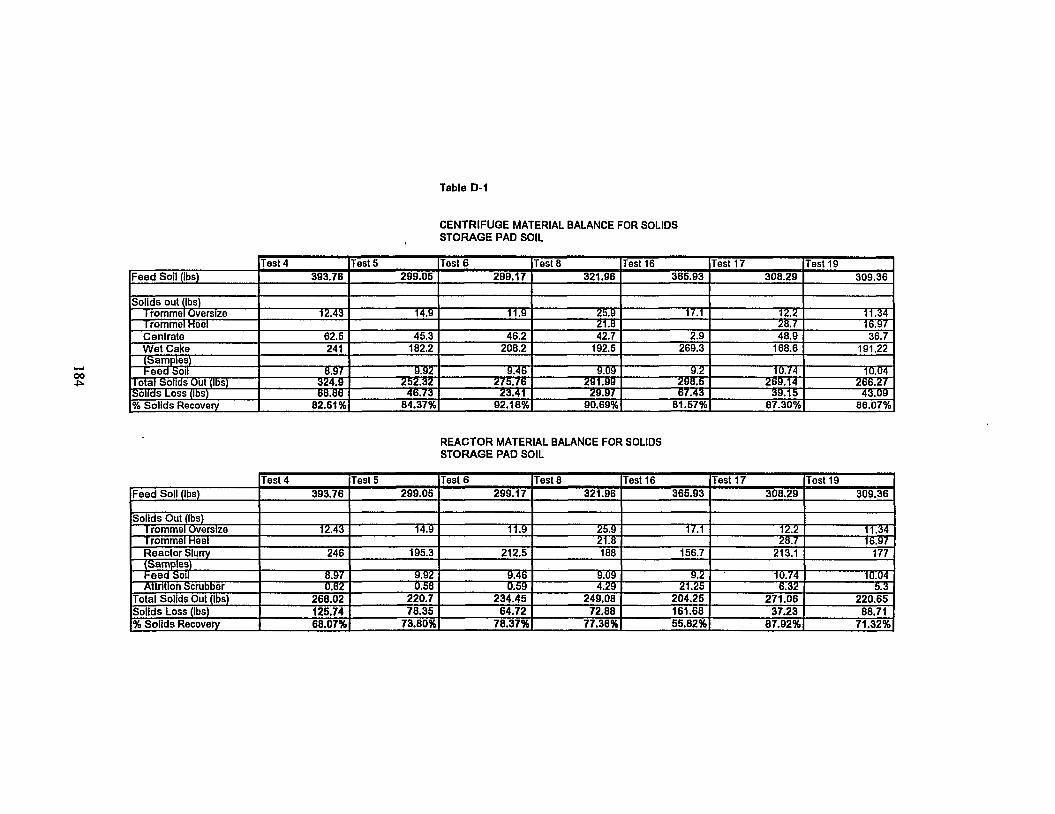
Table D-1
CENTRIFUGE MATERIAL BAUNCE FOR SOLIDS STORAGE PAD SOIL
Test 4 Test 5 Test 6 Test 8 Test 16 Test 17 Test 19 Feed Soil (lbs) 393.76 299.05 299.17 321.96 365.93 308.29 309.36
Solids out (lbs) Trommel Oversize 12.43 14.9 11.9 25.9 17.1 12.2 11.34 Trommel Heel 21.8 28.7 16.97 Centrate 62.5 45.3 46.2 42.7 2.9 48.9 36.7 Wet Cake 241 182.2 208.2 192.5 269.3 168.6 191.22 (Samples) Feed Soil 8.97 9.92 9.46 9.09 9.2 10.74 10.04
Total Solids Out (lbs) 324.9 2S2.32 275.76 291.99 298.5 269.14 266.27 Solids Loss (lbs) 68.66 4G.73 23.41 29.97 67.43 39.15 43.09 % Solids Recovery 82.51% 84.37% 92.18% 90.69% 81.57% 87.30% 86.07%
REACTOR MATERIAL BAUNCE FOR SOLIDS STORAGE PAD SOIL
Test 4 Test 5 Test 6 Test 8 Test 16 Test 17 Test 19 Feed Soil (lbs) 393.76 299.05 299.17 321.96 365.93 308.29 309.36
Solids Out (lbs) Trommel Oversize 12.43 14.9 11.9 25.9 17.1 12.2 11.34 Trommel Heel 21.8 28.7 16.97 Reactor Slurry 246 195.3 212.5 188 156.7 213.1 177 (Samples) Feed Soil 8.97 9.92 9.46 9.09 9.2 10.74 10.04 Attrition Scrubber 0.62 0.58 0.59 4.29 21.25 6.32 5.3
Total Solids Out (lbs) 268.02 220.7 234.45 249.08 204.25 271.06 220.65 Solids Loss (lbs) 125.74 7B.35 64.72 72.88 161.68 37.23 88.71 % Solids Recovery 68.07% 73.80% 78.37% 77.36% 55.82% 87.92% 71.32%
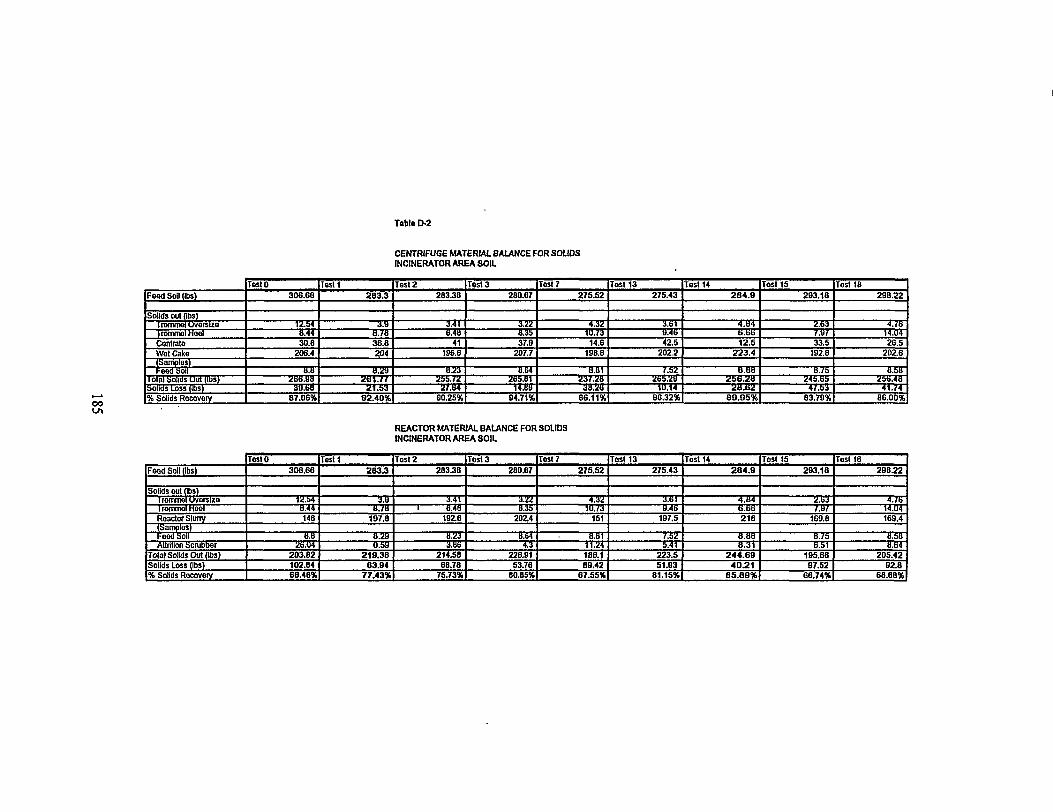
Table D-2
CENTRIFUGE MATERIAL BALANCE FOR SOLIDS INCINERATOR AREA SOIL
TestO Testl Test 2 Tests Test 7 Test 13 Test 14 Test 15 Test 18 Feed Soil (lbs) 306.66 283.3 283.36 280.67 275.52 275.43 284.9 293.18 298.22
Solids out (lbs) trommel oversize 12.54 3.9 3.41 3.22 4.32 3.61 4.H4 2.63 4.75 IrommolHoel U.44 B.7B B.4B B.35 10.73 S.46 b.bU 7.07 14.04 Cenlrale 30.8 36.8 41 37.9 14.6 42.5 12.5 33.5 26.5 Wot Cake 206.4 204 196.6 207.7 198.8 202.2 223.4 192.8 202.6 (Samples) heed Soil B.B 8.29 a:/i B.B4 ti.BI 7.52 U.OB B./b B.5S
lolal Solids Out (lbs) at>6.UB a«i.77 2bb.72 2BB.B1 237.26 265.2U 25B.2U 245.BS 25B.4B Solids Loss (lbs) au.tH 21. S3 2/.B4 14.BB 38.28 1U.14 2U.ti2 47.53 41.74 % Solids Rocovory 87.06% 02.40% 90.25% 94.71% 86.11% 96.32% 89.05% 83.79% 86.00%
REACTOR MATERIAL BALANCE FOR SOLIDS INCINERATOR AREA SOIL
TestO Testl Test 2 Tests Test 7 Test 13 Test 14 Test 15 Test 18 Food Soil (lbs) 306.66 283.3 283.36 280.67 275.52 275.43 284.0 293.18 298.22
Solids out (lbs) trommel oversize 12.54 3.0 3.41 3.22 4.32 3.61 4.84 2.63 4.76 IrommolHeel B.44 8.78 1 8.4B B.3i> 10.73 y.4i> (5.66 7.H7 14.U4 Reactor Slurry 148 197.8 192.6 202.4 151 197.5 216 169.8 169.4 Samples) rood sou B.B 8.2!) u.yj B.M 8.81 /.52 U.8B B.75 B.5B Attrition Scrubber 28.04 0.59 3.BB 4.3 11.24 5.41 U.31 6.51 B.64
Total Solids Out (lbs) 203.82 219.36 214.58 226.91 186.1 223.5 244.69 195.66 205.42 Solids Loss (lbs) 102.84 63.94 88.78 53.76 89.42 51.93 4 0 2 1 97.52 92.8 % Solids Recovery 66.46% 77.43% 75.73% 80.85% 67.55% 81.15% 85.69% 66.74% 68.88%
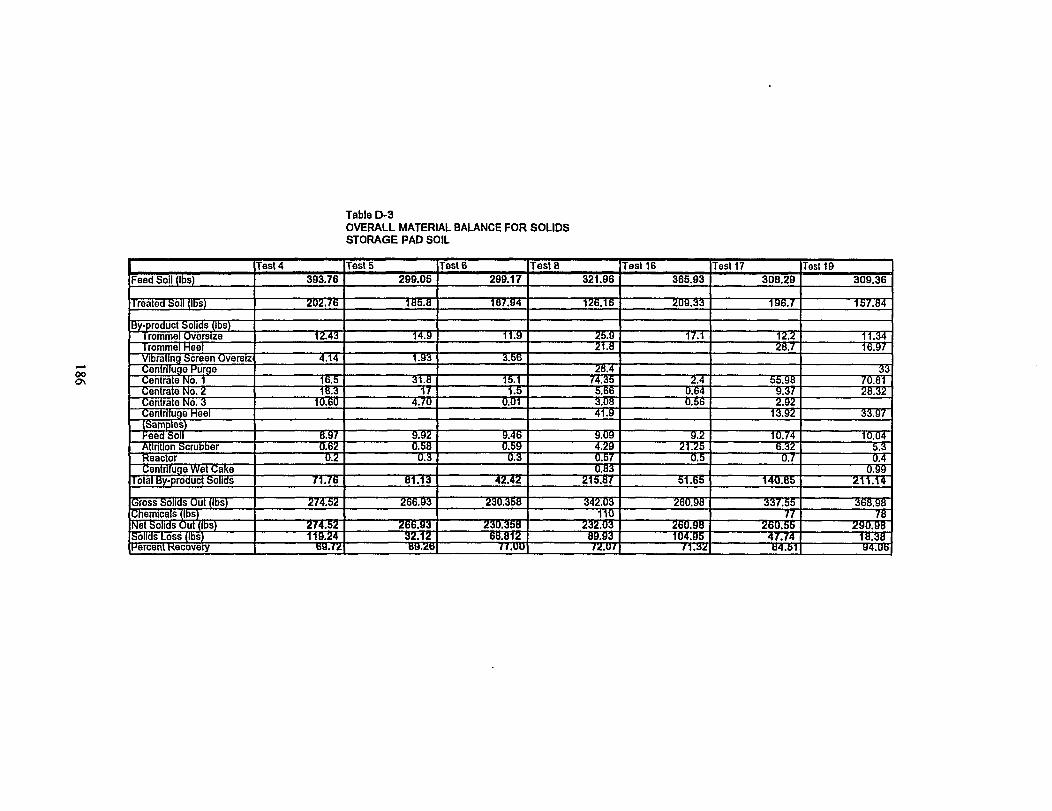
Table D-3 OVERALL MATERIAL BALANCE FOR SOLIDS STORAGE PAD SOIL
Test 4 Test 5 Test 6 Tests Test 16 Test 17 Test 19 Feed Soil (lbs) 393.76 299.05 299.17 321.96 365.93 308.29 309.36
Treated Soil (lbs) 202.76 185.8 187.94 126.16 209.33 196.7 157.84
By-product Solids (lbs) Trommel Oversize 12.43 14.9 11.9 25.9 17.1 12.2 11.34 IrommelHeel 21.8 28.7 16.97 Vibrating Screen Oversiz 4.14 1.93 3.56 Centriluge Purge 28.4 33 Centrate No. 1 16.S 31.8 15.1 74.35 2.4 55.98 70.81 Centrate No. 2 18.5 17 1.5 5.56 0.64 9.37 28.32 Centrate No. 3 10.60 4.70 0.01 3.08 0.56 2.92 Centrifuge Heel 41.9 13.92 33.97 (Samples) Feed Soil 8.97 9.92 9.46 9.09 9.2 10.74 10.04 Attrition Scrubber 0.62 0.58 0.59 4.29 21.25 6.32 5.3 Reactor 0.2 0.3 0.3 0.57 0.5 0.7 0.4 Centrifuge Wet Cake 0.83 0.99
Total By-product Solids 7176 81.13 42.42 215.87 51.65 140.85 211.14
Gross Solids Out (lbs) 274.52 266.93 230.358 342.03 260.98 337.55 368.98 Chemicals (lbs) 110 77 78 Net Solids Out (lbs) 274.52 266.93 230.358 232.03 260.98 260.55 290.98 Solids Loss (lbs) 119.24 32.12 68.812 89.93 104.95 47.74 18.38 Hercertt Kecovery 6U./2 BU./& 77.0U /2.U7 n. 32 04.51 U4.UB
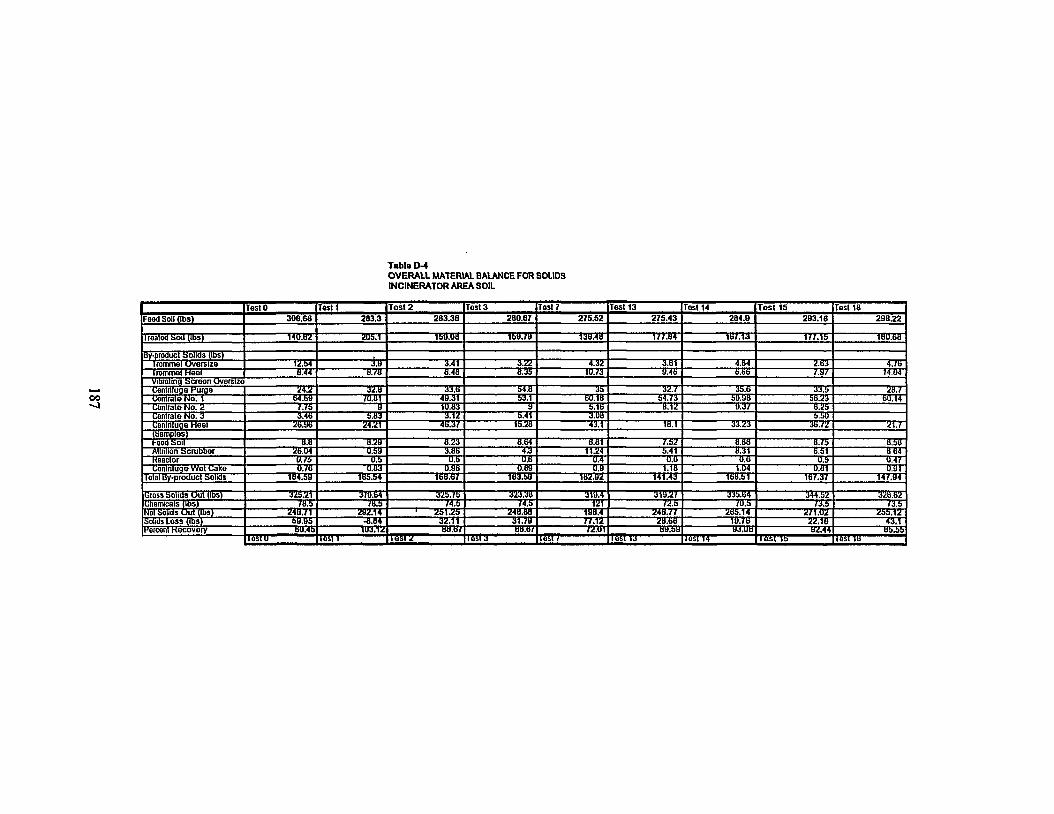
Table D-4 OVERALL MATERIAL BALANCE FOR SOLIDS INCINERATOR AREA SOIL
TestO Testl Test 2 Test 3 Test 7 Test 13 Test 14 Test 15 Test 18 Food Soil (lbs) 306.68 283.3 283.38 280.67 27S.S2 275.43 2B4.9 2B3.1S 2S8.22
Iroalod Soil fibs) 140.82 ZUS.1 isu.oa 1S9.7B 13B.4B 177.B4 1B7.13 177.15 1UU.6B
By-product Solids (lbs) trommel Oversize 12.b4 19 3.41 3.22 4.32 3.B1 4.U4 2.63 4.76 Irommoi Hool B.44 B.70 B.4B 8.35 10.73 S.4B 8.66 7.97 14.04 Vibrating Screen uvorslze (Jentnluge Purge 24.2 32.8 33.B S4.B 35 32.7 3b.6 33.5 2B.7 contralo No. 1 64.89 70.01 49.31 53.1 B0.1S 54.73 b9.9B 56.23 60.14 connate No. 2 ;./b g 10.83 9 b.lU 8.12 9.3/ 8.25 Uentrate No. 3 3.4B 5.B3 3.12 b.41 3.UB 5.50 (Jonlnluge Heel 26.98 24.21 46.37 15.2B 43.1 18.1 33.23 38.72 21.7 (Samples) Hood soil B.8 B.2t) 0.23 B.64 a.ai 7.52 e.ea 8.75 B.5B Altnllon Scrubber 26.04 0.59 3.00 4.3 11.24 5.41 8.31 6.51 8 64 Koactor U74 0.5 O.b U.b U.4 0.6 0.6 o.b 0.47 fjonlnluge Wet Cake 0.76 0.B3 0.98 0.69 U.9 1.1B 1.04 0.81 0.91
lolal by-product Solids 1B4.SU 1BS.54 1GB.G7 1B3.5B 1B2.92 141.43 16B.b1 187.37 147.94
JJross solids' (Jut (lbs) 325.21 370.64 325.75 323.38 319.4 319.27 33b.64 344.52 328.62 Chomreals (lbs) 7B.5 78.5 74.5 74.5 121 72.5 /0.S 73.5 73.5 Nol Solids Out (lbs) 248.71 yoa.i* 1 25125 24B.BB 19B.4 24B.77 265.14 271.02 255.12 Solids Loss (lbs) iB.US -8.84 32.11 31.79 77.12 2B.66 19,/b1 22.1B 43.1 HOICOM Kecovery BU.40 1U3.12 BH.tj/ UB.U/ /2.U1 HU.bU U3.Ub 92.44 Ub.bb
14511 liil'2 I4sl3 lesl 14 lest lb lesl K
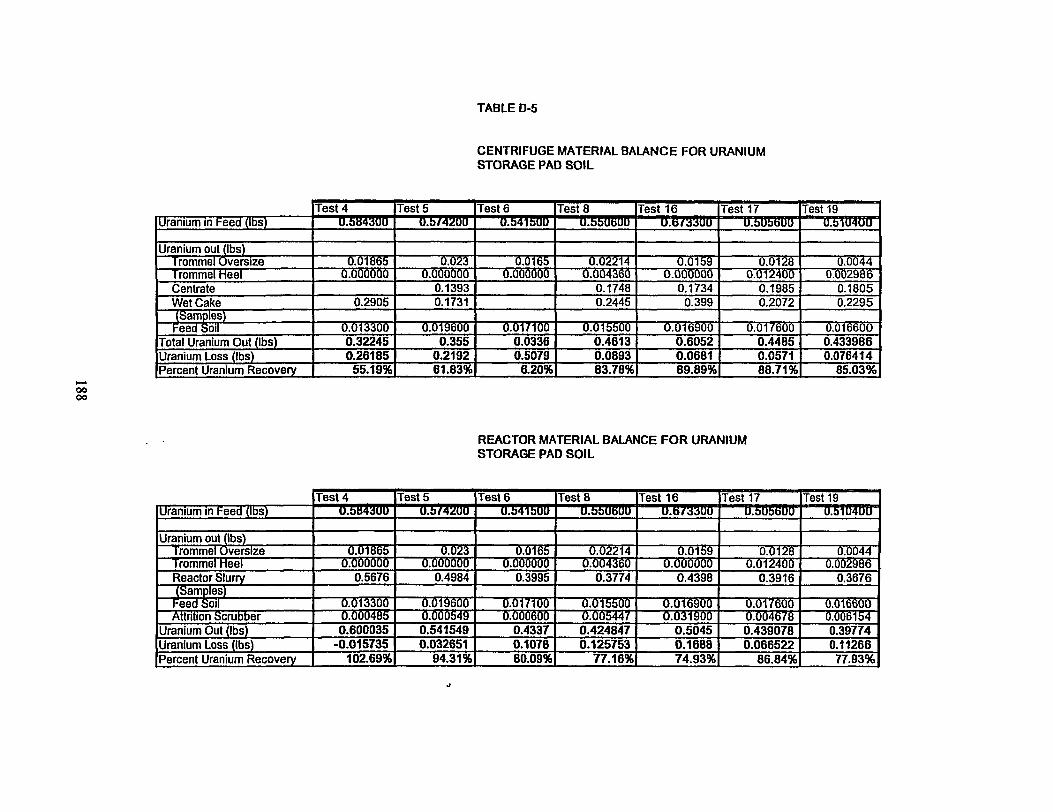
TABLE D-5
CENTRIFUGE MATERIAL BALANCE FOR URANIUM STORAGE PAD SOIL
Test 4 Test 5 Test 6 Test 8 Test 16 Test 17 Test 19 Uranium in Feed (lbs) U.bBMSUU U.b/4UUU U.&41&UU U.bbUBUU U.B/SSUu O.bUbBUU 0.510400
Uranium out (lbs) Trommel Oversize 6.01665 0.023 0.0165 0.02214 0.0150 0.0128 0.0044 Trommel Heel 0.000000 0.000600 0.000000 0.004360 0.000000 0.012400 0.002986 Centrate 0.1393 0.1748 0.1734 0.1985 0.1805 Wet Cake 0.2905 0.1731 0.2445 0.399 0.2072 0.2295 (Samples) Feed Soil 0.013300 0.010600 0.017100 0.015500 0.016000 0.017600 0.016600
Total Uranium Out (lbs) 0.32245 0.355 0.0336 0.4613 0.6052 0.4485 0.433986 Uranium Loss (lbs) 0.26185 0.2192 0.5079 0.0893 0.0681 0.0571 0.076414 Percent Uranium Recovery 55.19% 61.83% 6.20% 83.78% 89.89% 88.71% 85.03%
REACTOR MATERIAL BALANCE FOR URANIUM STORAGE PAD SOIL
Test 4 Test 5 Test 6 Test 8 Test 16 Test 17 Test 19 Uranium in Feed (lbs) U.&H43UU O.bMZUO U.M1&UU U.&&U6UU u.B/aauu U.bUbBUU U.b1(14UU
Uranium out (lbs) Trommel Oversize 0.01665 0.023 0.0165 0.02214 0.0150 0.0128 0.0044 Trommel Heel 0.000000 0.000000 0.000000 0.004360 0.000000 0.012400 0.002986 Reactor Slurry 0.5676 0.4984 0.3995 0.3774 0.4398 0.3916 0.3676
Samples) Feed Soil 0.013300 0.010600 0.017100 0.015500 6.016060 0.017600 0.016600 Attrition Scrubber 0.000465 0.000540 0.006600 0.005447 0.031900 0.004676 0.006154
Uranium Out (lbs) 0.600035 0.541549 0.4337 0.424847 0.5045 0.439078 0.39774 Uranium Loss (lbs) -0.015735 0.032651 0.1078 0.125753 0.1688 0.066522 0.11266 Percent Uranium Recovery 102.69% 94.31% 80.09% 77.16% 74.93% 86.84% 77.93%
J
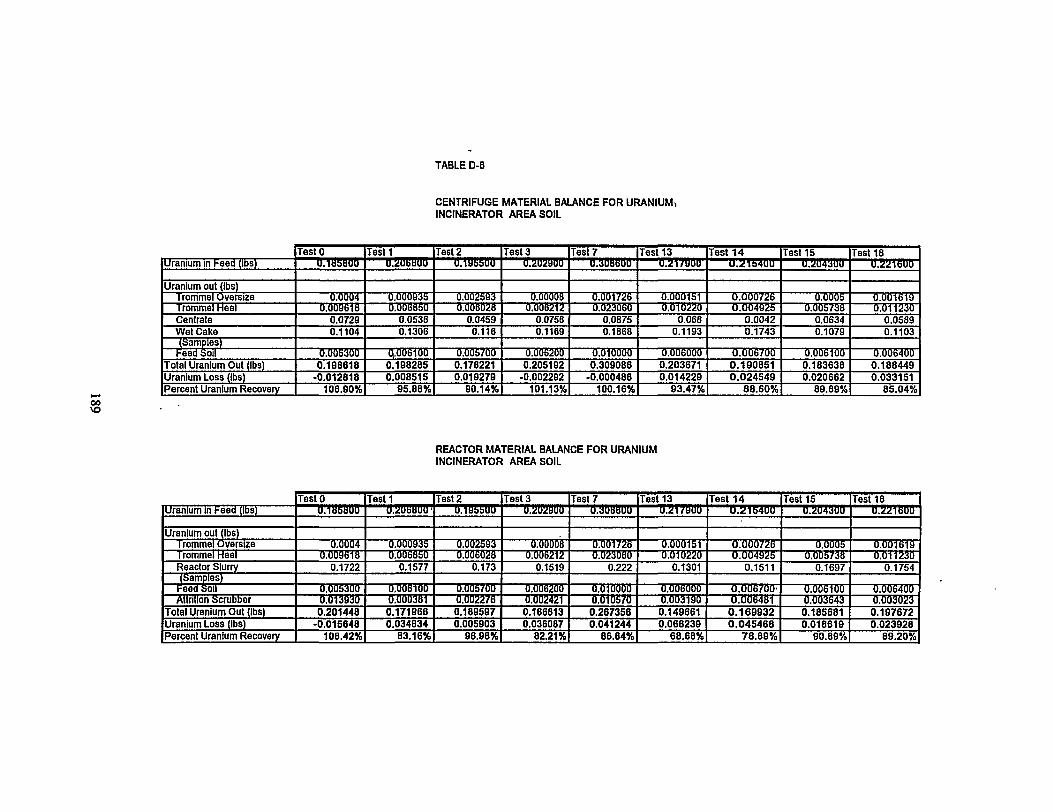
TABLE D-6
oo
CENTRIFUGE MATERIAL BALANCE FOR URANIUM, INCINERATOR AREA SOIL
TestO TesM Test 2 Test 3 Test 7 Test 13 Test 14 Test 15 Test 18 Uranium in Feed (lbs) 0.1051)00 u.uuuyuu U.1US5UU U.2U2UUU u.uuyuuu (UU/UUU u.yiwuu U.2U43UU — 0 . 2 2 1 S D 0 -
Uranium out lbs) 1 rorrimel C iversize 0.0004 0.000935 0.002593 0.00008 0.001726 0.000151 O.O00726 0.0005 0.001619 IrommelHeel 0.009618 0.006350 0.006028 0.006212 0.023060 0.010220 0.004925 0.005736 0.011230 Cenlrate 0.0729 0.0538 0.0459 0.0758 0.0875 0.068 0.0042 0.0634 0.0589 Wei Cake 0.1104 0.1306 0.116 0.1169 0.1868 0.1193 0.1743 0.1079 0.1103 (Samples) Feed Soil 0.005300 Q.006100 0.005700 0.006200 0.010000 0.006000 0.006700 0.006100 0.006400
Total Uranium Out (lbs) 0.198618 0.19828S 0.176221 0.205192 0.309086 0.203671 O.190851 0.183638 0.188449 Uranium Loss (lbs) -0.012818 0.008515 0.019279 -0.002292 -0.000486 0.014229 0.024549 0.020662 0.033151 Percent Uranium Recovery 106.90% 95.88% 90.14% 101.13% 100.16% 93.47% 88.60% 89.89% 85.04%
REACTOR MATERIAL BAUNCE FOR URANIUM INCINERATOR AREA SOIL
TestO Testl Test 2 Test 3 Test 7 Test 13 Test 14 Test 15 Test 18 Uranium in Feed (lbs) 0.1U5UUU u.yuuuuu > U.UJbbUU u.yuymju U.MUU(J(JU u.yi/yuu U.Z1b4UU U.yiMUUU uMUHtJUO
Uranium out jibs) I rommel Oversize 0.0004 0.000935 0.002593 0.00008 0.001726 0.000151 0.000726 0.0005 0.001619 Trommel Heel 0.009618 0.006850 0.006028 0.006212 0.023060 0.010220 0.004925 0.005738 0.011230 Reactor Slurry 0.1722 0.1577 0.173 0.1519 0.222 0.1301 0.1511 0.1697 0.1754 (Samples)
Feed Soil 0.005300 0.006100 0.005700 0.006200 0.010000 0.006000 0.006700- 0.006100 0.006400 Attrition Scrubber 0.013930 0.000381 0.002276 0.002421 0.010570 0.003190 O.O06481 0.003643 0.003023
Total Uranium Out (lbs) 0.201448 0.171966 0.189597 0.166813 0.267356 0.149661 0.169932 0.185681 0.197672 Uranium Loss (lbs) -0.015648 0.034834 0.005903 0.036087 0.041244 0.068239 0.045468 0.018619 0.023928 Percent Uranium Recovery 108.42% 83.16% 96.98% 82.21% 86.64% 68.68% 78.89% 90.89% 89.20%
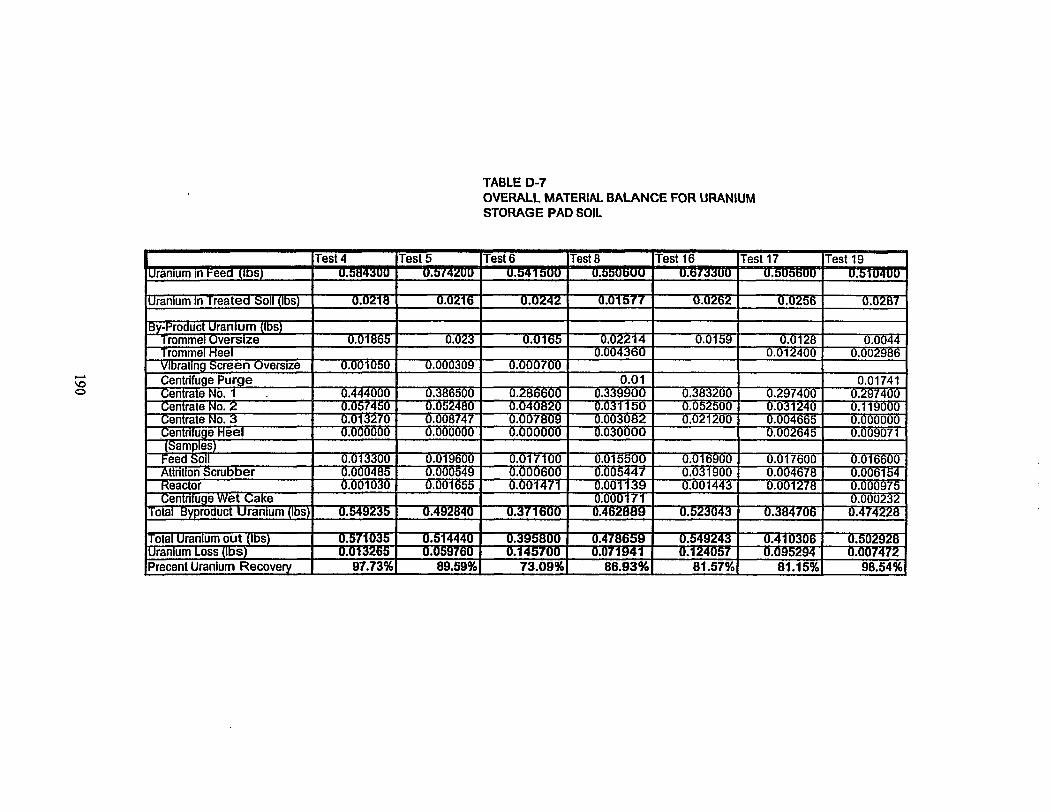
TABLE D-7 OVERALL MATERIAL BALANCE FOR URANIUM STORAGE PAD SOIL
Test 4 Test 5 Test 6 Test 8 Test 16 Test 17 Test 19 uranium in heed (IDS) u.5U4yuu li.UU'M U.5415oU u.iJSuBuu o.ti/yuuu U.bU&bUU
Test 19
Uranium in Treated Soil (lbs) 0.021 S 0.0216 0.0242 0.01577 0.0262 0.0256 0.0287
By-Product Uranium (lbs) Trommel Oversize 0.01865 0.023 0.0165 0.02214 0.0159 0.0128 0.0044 Trommel Heel 0.004360 0.012400 0.0O2986 Vibrating Screen Oversize 0.001050 0.000309 0.000700 Centrifuge Purge 0.01 0.01741 Centrate No. 1 0.444000 0.366500 0.286600 0.339966 0.383200 0.297400 0.297400 Centrate No. 2 0.057450 0.052400 0.040820 0.0311S6 0.0525O0 0.031240 0.119000 Centrate No. 3 0.013270 0.008747 0.007809 0.003082 0.021200 0.004665 0.000000 Centrifuge Heel 0.000000 0.000000 0.000000 0.030066 0.002645 0.009071
Samples) Feed Soil 0.013300 0.019600 0.017100 0.015500 0.016900 0.017600 0.016600 Attrition Scrubber 0.000405 0.000549 0.000600 0.005447 0.031900 0.004678 0.006154 Reactor 0.001030 0.001665 0.001471 0.001139 0.001443 0.001278 0.000975 Centrifuge Wet Cake 0.000171 0.000232
Total Byproduct Uranium (lbs) 0.549235 0.492640 0.371600 0.462669 0.523043 0.384706 0.474228
Total Uranium out (lbs) 0.571035 0.514440 0.395600 0.478659 0.549243 0.410306 0.502928 Uranium Loss (lbs) 0.013265 0.059760 0.145700 0.071941 0.124057 0.095294 0.007472 Precent Uranium Recovery 97.73% 89.59% 73.09% 86.93% 81.57% 81.15% 98.54%
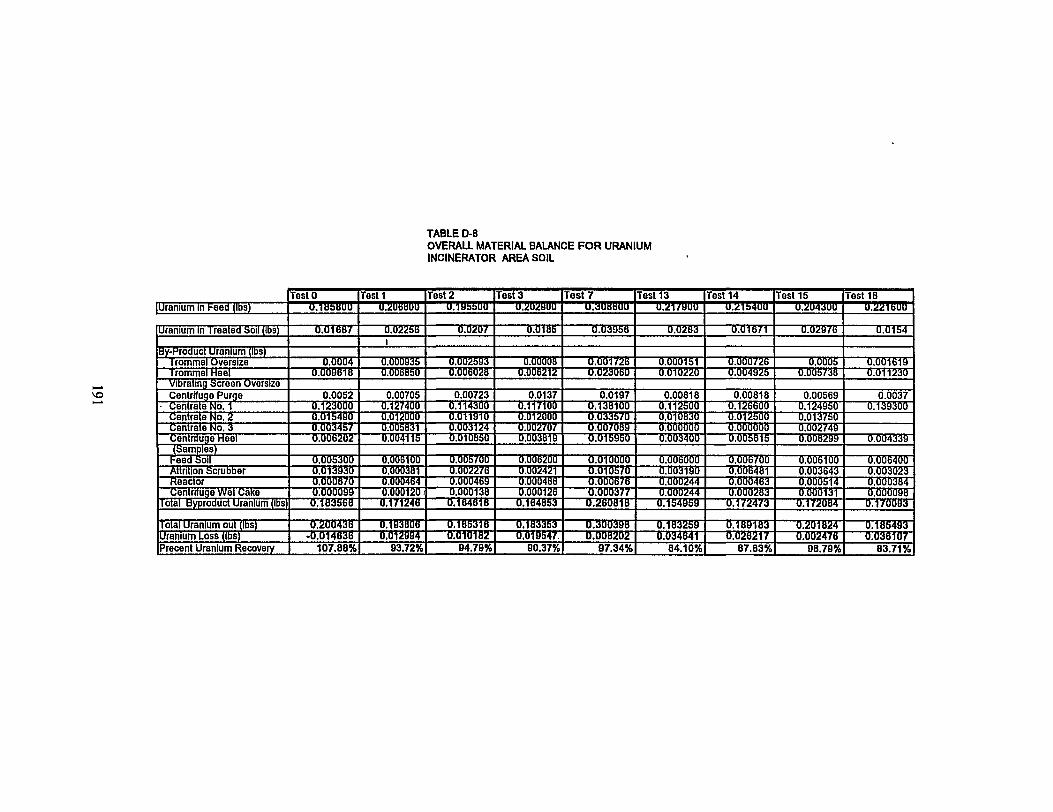
TABLE D-8 OVERALL MATERIAL BAUNCE FOR URANIUM INCINERATOR AREA SOIL
TestO Testl Test 2 Test 3 Test 7 Test 13 Test 14 Test 15 Test18 Uranium In Feed (lbs) U.1USUUU U.yUBHUU 1 U.1E955UU U.202DUU U.3UMSUU U.SU/UUU U.SMMUU U.UMSJUU U.2216UU
Uranium in Treated Soil (lbs) 0.01537 0.02256 0.0207 0.0185 0.03958 0.0263 0.01671 0.02976 0.0154 i
By-Product Uranium (lbs) Trommel oversize 0.0004 0.000935 0.002593 0.00008 0.001726 0.000151 0.000726 0.0005 0.001619 Trommel Heel 0.008618 0.005650 0.006028 0.006212 0.023060 0.010220 0.004925 0.005738 0.011230 Vibrating Screen Oversize Centrifuge Purge 0.0052 0.00705 0.00723 0.0137 0.0197 0.00818 0.00818 0.00569 0.0037
• Centrate No. 1 0.123000 0.127400 0.114300 0.117100 O.138100 0.112500 0.126600 0.124950 0.139300 Centrate No. 2 0.015450 0.012000 0.011910 0.012000 0.033570 0.010830 0.012500 0.013750 Centrate No. 3 0.003457 0.005S31 0.003124 0.002707 0.007089 0.000000 0.000000 0.002749 Centrifuge Heel 0.006202 0.004115 0.010850 0.003819 0.015950 0.003400 0.005615 0.008299 0.004339 (Samples)
Feed Soil 0.005300 0.006100 0.005700 0.006200 O.O10000 0.006000 0.006700 0.006100 0.006400 Attrition Scrubber 0.013930 0.000361 0.002276 0.002421 0.010570 0.003190 0.006481 0.003643 0.003023 Reactor O.000S7O 0.000464 0.000469 0.000488 0.000676 0.000244 0.000463 0.000514 0.000384 Centrifuge wet cake 0.000099 0.0001201 0.000138 0.000126 O.000377 0.000244 0.000283 0.000131 0.000098
Total Byproduct Uranium (lbs) 0.183565 0.171246 " 0.164618 0.164853 0.260818 0.154959 0.172473 0.172064 0.170093
Total Uranium out (lbs) 0.200436 0.103606 0.185318 0.183353 0.300398 0.183259 0.189183 0.201824 0.165493 Uranium Loss (lbs) •0.014636 0.012994 •" 0.010182 0.019547. O.O0B202 0.034641 0.026217 0.002476 0.036107 Precent Uranium Recovery 107.88% 93.72% 94.79% 90.37% 97.34% 84.10% 87.83% 98.79% 83.71%
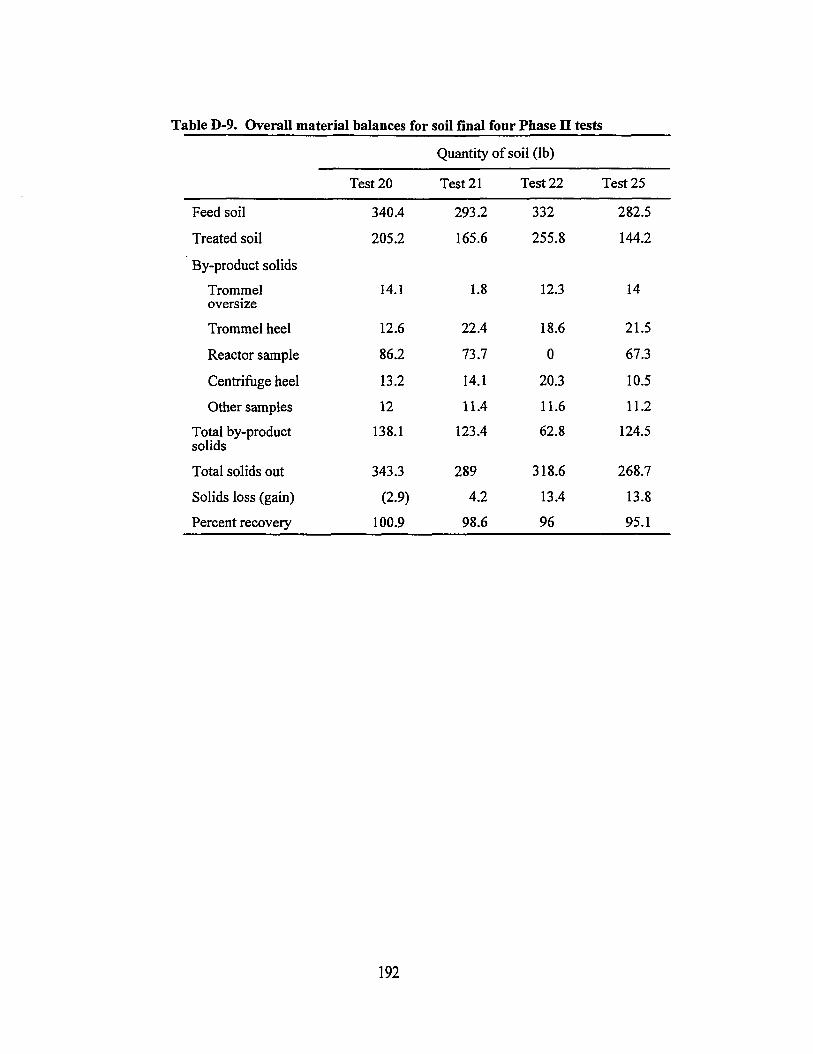
Table D-9. Overall material balances
Test 20
Feed soil 340.4
Treated soil 205.2
By-product solids
Trommel 14.1 oversize
Trommel heel 12.6
Reactor sample 86.2 Centrifuge heel 13.2
Other samples 12
Total by-product 138.1 solids
Total solids out 343.3
Solids loss (gain) (2.9)
Percent recovery 100.9
soil final four Phase II tests
Quantity of soil (lb)
Test 21 Test 22 Test 25
293.2 332 282.5
165.6 255.8 144.2
1.8 12.3 14
22.4 18.6 21.5
73.7 0 67.3
14.1 20.3 10.5
11.4 11.6 11.2
123.4 62.8 124.5
289 318.6 268.7
4.2 13.4 13.8
98.6 96 95.1
192
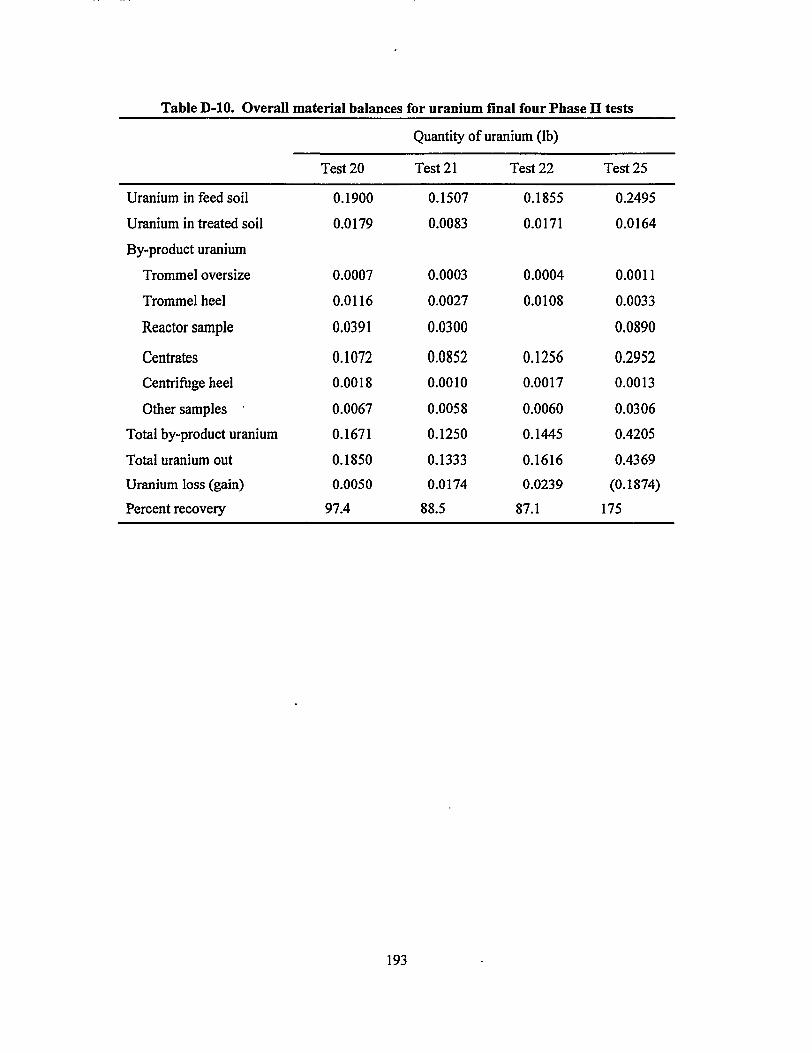
Table D-10. Overall material balances for uranium final four Phase II tests
Test 20
Uranium in feed soil 0.1900 Uranium in treated soil 0.0179 By-product uranium
Trommel oversize 0.0007 Trommel heel 0.0116
Reactor sample 0.0391
Centrates 0.1072 Centrifuge heel 0.0018
Other samples • 0.0067 Total by-product uranium 0.1671 Total uranium out 0.1850 Uranium loss (gain) 0.0050 Percent recovery 97.4
Quantity of uranium (lb)
Test 21 Test 22 Test 25
0.1507 0.1855 0.2495 0.0083 0.0171 0.0164
0.0003 0.0004 0.0011 0.0027 0.0108 0.0033 0.0300 0.0890
0.0852 0.1256 0.2952 0.0010 0.0017 0.0013 0.0058 0.0060 0.0306 0.1250 0.1445 0.4205 0.1333 0.1616 0.4369 0.0174 0.0239 (0.1874)
193

ORNL/TM-12960
INTERNAL DISTRIBUTION
1. M.R.Ally 15. L. E. McNeese 2. A. Q. Armstrong 16. L. L. Oakes 3. H.L.Boston 17. J. G. Pruett 4. A.G.Croff 18. S. M. Robinson 5. N. H. Cutshall 19. D. S. Shiner 6. D. M.Douthat 20. B. P. Spalding 7. M.P.Elless 21. S. H. Stow 8. B. D.Faison 22. J. S. Watson 9. D.D.Gates 23-25. J. H. Wilson
10. J. R. Hightower 26. Central Research Library 11. A. J. Kuhaida, Jr. 27. ORNL Laboratory Records Department 12. S.Y.Lee 28. ORNL Laboratory Records-RC 13. A. P. Malinauskas 29. ORNL Patent Section 14. A.J.Mattus 30. ORNL Y-12 Technology Library
EXTERNAL DISTRIBUTION
31. Y. Acar, Electrokinetics Inc., Louisiana Business and Tec Center, South Stadium Drive, Suite 102, Baton Rouge, LA 70803-6100
32. R. Bahorich, Scientific Ecology Group, 1501 Ardmore Blvd., Forest Hills, PA 15221 33. J. Barthel, Rust Remedial Services, 1597 Cole Blvd., Bldg. 15, Suite 350, Golden, CO
80401 34. V. Ceci, BDM Federal, Bellemeade 1,20251 Century Blvd., Germantown, MD 20874 35. W. A. Bliss, Reynolds Electrical Eng. Co. Inc., P. O. Box 98521, MS-428, Las Vegas, NV
89193-8521 36. J. R. Brainard, LANL-INC-4, MS-C36, Los Alamos National Laboratory, Los Alamos, NM
87545 37. E. T. Bramlitt, Defense Nuclear Agency, Field Command, FCDNA/FCEH,
1680 Texas St. S. E. Kirtland AFB, NM 87117-5669 38. D. Brettschneider, FERMCO, P.O. Box 398704, Cincinnati, OH 45239-8704 39. M. Bricka, USAE WES, 3909 Halls Ferry Rd., WESEE-R, Vicksburgh, MS 39180 40. K. Brierly, British Nuclear Fuels pic, R220 Risley, Warrington, Cheshire, United Kingdom,
WA3 6AS 41. E. C. Buck, Argonne National Laboratory, Chemical Technology Division, 9700 South
Cass Avenue, Argonne, IL 60439 42. J. L. Burnett, ER-142, G-339/GTN, Office of Basic Energy Sciences, U. S. Department of
Energy, 19901 Germantown Road, Germantown, MD 20545 43. J. Caldwell, Jacobs Engineering Group, 251 S. Lake Avenune, Pasadena, CA 91101 44. D. J. Chaiko, Argonne National Laboratory, Chemical Technology Division, 9700 South
Cass Aye., Bldg. 205, Argonne, IL 60439-4837
195
45. P. Colomobo, Brookhaven National Laboratory, Bldg. 703-50 Rutherford, Upton, NY 11973
46. R. H. Condit, Lawrence Livermore National Laboratory, P.O. Box 808, Livermore, CA 94550
47. J. Corone, Ames Laboratory, 329 Wilhelm Hall, Iowa State University, Ames, IA 50011 48. C. Cox, USEPA National Air & Radiation, Environmental Laboratory, 1504 Avenue A,
Montgomery, AL 3 6115-2601 49. J. C. Cunnane, Chemical Technology Division, Argonne National Laboratory, 9700 South
Cass Avenue, Argonne, IL 60439 50. A. Dietrich, Scientific Ecology Group, 1501 Ardmore Blvd., Forest Hills, PA 15221 51. D. Dougherty, Halliburton NUS, 10200 Bellaire, Haouston, Texas 77072-5299 52. L. Dworjahyn, Westinghouse SRL, Savannah River Site/Bldg. 779-2A, Aiken, SC 29808 53. M. Eagle, U.S. EPA, 401 M Street SW, RSD-6603J, Washington, DC 20460 53. S. Fauver, DOE-HQ, EM-424, Trevion II Bldg., Washington, DC 20585-0002 55. D. Foust, General Electric Co., Corporate R&D, P. 0 . Box 8, Bldg. K-l, RM 5A24,
Schenectady, NY 12301 56. A. J. Francis, PI Brookhaven National Laboratory, 1 South Technology St., Bldg 318,
Upton, NY 11973 57. M. Fuhrmann, Brookhaven National Laboratory, Bldg. 83 0, Upton, NY 11973 58. D. M. Gerrick, FERMCO, P. O. Box 398704, MS 52-5, Cincinnati, OH 45239-8704 59. M. J. Geyer, FERMCO, P. O. Box 398704, MS 81-3, Cincinnati, OH 45239-8704 60. M. Ghosh, Dept of Civil and Environmental Engineering, University of Tennessee, 219B
Berkins Hall, Knoxville, TN 37996-2010 61. D. Gombert, Westinghouse Idaho Nuclear Co., Site Remediation, P. O. Box 4000,
Idaho Falls, ID 83402-4000 62. R. A. Graves, ISOTRON Corporation, 13152 Chef, New Orleans, LA 70124 63. B. Gupta, Manager, Waste Management Prgrms, National Renewable Energy Laboratory,
1617 Cole Boulevard, Golden, CO 80401 64. K. Hain, U. S. Department of Energy, EM-55, RM-422, Trevion II Blvd., Washington, DC
20585-0002 65. G. F. Hall, Lockheed Env Systems & Tech, 900 Grier Dr., Suite B, Las Vegas, NV 89119 66. A. Hanson, New Mexico State University, Dept. Of Civil Engineering, Engineering
Complex II, Box 3CE, Los Cruces, NM 88003 67. J. Hart, U. S. Department of Energy, FUSRAP, MS-EW93, P. O. Box 2001, Oak Ridge,
TN 37831-8723 68. B. Hass, Ames Laboratory, 329 Wilhelm Hall, Iowa State University, Ames, IA 50011 69. S. Hay & Associates, S. Cohen & Associates, Inc., 14181-85 Parkway, Montgomery, AL
36016 70. J. E. Helt, Chemical Technology Division, Argonne National Laboratory, 9700 South Cass
Avenue, Argonne, IL 60439 71. D. Herman, FERMCO, P.O. Box 398704, Cincinnati, OH 45239-8704 72. P. Hopper, Scientific Ecology Group, Inc., P. O. Box 2570, 1560 Bear Creek Rd.,
Oak Ridge, TN 37831 73. C. S. Hultman, BNFL Inc., 5655 South Yosemite, Suite 100, Englewood, CO 80111 74. R. Jacobson, Desert Research Institute, P.O. Box 19040, Las Vegas, NV 89132-0040 75. G. Y. Jordy, Director, Office of Program Analysis,, Office of Energy Research, ER-30,
G-226, U.S. Department of Energy, Washington, DC 20545
196
76. D. L. Keairns, Westinghouse Science and Technology Center, 1310 Beulah Road, Pittsburgh, PA 15235-5098
77. P. C. Keegan, Scientific Ecology Group, 1501 Ardmore Blvd., Pittsburgh, PA 15221 78. D. Kelsh, Science Applications Intl. Corp., 555 Quince Orchard Rd., Suite 500,
Gaithersburg, MD 20878 79. T. R. Krause, Chemical Technology Division, Argonne National Laboratory,
9700 South Cass Avenue, Argonne, IL 60439 80. M. A. Kristich, FERMCO, P. O. Box 398704, MS 52-5, Cincinnati, Ohio 45239-8704 81. E. J. Lahoda, Westinghouse Electric Science & Tech. Center, 1310 Beulah Rd.,
Pittsburgh, PA 15235-5098 82. E. R. Landa, U.S. Geological Survey, Water Resources Division, 431 National Center,
MS-4432,RestonVA 22092 83. E. R. Lindgren, Sandia National Laboratories, P. O. Box 5800, Albuquerque, NM
87185-5800 84. H. L. Lomasney, ISOTRON Corporation, 13152 Chef Hwy, New Orleans, LA 70129 85. J. L. Malhotra, DOE/Morgantown Energy Technical Center, P. O. Box 880,
Collins Ferry Rd., Morgantown, WV 26507-0880 86. M. Malone, U. S. Department of Energy, EM-551, Trevion II Blvd., Washington, DC
20585-0002 87. G. Maraman, Argonne National Laboratory, P. O. Box 6974, Oak Ridge, TN 37831 88. C. Mason, Los Alamos National Laboratory, P. O. Box 1663, MSJ-534, Los Alamos, NM
87545 89. J. Mather, DOE-HQ, EM542, Trevion II Bldg., Washington, 20585-0002 90. E. Milicic, Westinghouse Remediation Services ATLANTA, 675 Park North Blvd.,
Building F, Suite 100, Clarkston, GA 30021-1962 91. F. L. Miller, Jr., Desert Research Institute, P. O. Box 19040, Las Vegas, NV 89132-0040 92. L. A. Moschuk, AECL Technologies, 9210 Corporate Blvd., Suite 410,
Rockville, Maryland 20850 93. K. Mory 1, EG&G Rocky Flats, P.O. Box 464, Golden, CO 8042-0464 94. P. R. Mulik, Westinghouse Science and Technology Center, 1310 Beulah Road,
Pittsburgh, PA 15235-5098 95. T. M. Murarik, AWC-Lockheed, P.O. Box 96118, Las Vegas, NV 89193
96-98. K. R. Nuhfer, FERMCO, P. O. Box 398704, MS 82-1, Cincinnati, OH 45239-8704 99. A. Patrinos, Director, Environmental Sciences Division, Office of Health and
Environmental Research, ER-74, U.S. Department of Energy, Washington, DC 20585 100. M. Peterson, PNL, Battelle Pacific NW Laboratory, P.O. Box 999, MS-INP-41,
Battelle Blvd, Richland, WA 99352 101. P. J. Pettit, FERMCO, P.O. Box 398704, Cincinnati, OH 45239-8704 102. A. D. Pflug, Argonne National Laboratory, 9700 S. Cass Ave., CID-900, Argonne, IL
60439-4832 103. K. L. Pylka, FERMCO, P.O. Box 398704, MS 81-3, Cincinnati, OH 45239-8704 104. L. Rogers, EG&G, Energy Measurements, Inc., P.O. Box 1912, MS-RSL-11,
316 East Atlas Circle, Las Vegas, NV 89030 105. R. R. Ryan, EG&G Rocky Flats, P. O. Box 4013, T 130-A, LATO, Golden, CO
80401-0013 106. M. Salisbury, FERMCO, P.O. Box 398704, Cincinnati, OH 45239-8704
197
107. D. Sanning, U.S. Environmental Protection Agency, 26 W. Martin Luther King Drive, RM-218, Cincinnati, OH 45219
108. J. Schwing, FERMCO, P. O. Box 398704, MS 81-2, Cincinnati, OH 45239-8704 109. B. Seay, U. S. Department Of Energy, P. O. Box 2001, Oak Ridge, TN 37831-8723 110. R. Jeff Seme, Geochemistry Section, Geosciences Department, Battlelle Pacific
Northwest Lab, P.O. Box 999, Richland, WA 990352 ' 111. W. E. Sisk, U. S. Army Environmental Center, ENAEC-TS-D, Bldg. E4460,
Aberdeen Proving Grounds, MD 21010-5401 112. M. Skriba, Fluor Daniel Environmental Services, Inc, 3333 Michelson Drive, Irvine, CA
92730 113. S. C. Slate, Pacific Northwest Laboratory, MSIN KI-19, Office of Environmental
Technology, P.O. Box 999, Richland, WA 99352 114. R. F. Smiecinski, U. S. DOE/NV, 2765 S. Highland, Las Vegas, NV 89193-8518 115. R. Stead, FERMCO, P. O. Box 398704, MS 81-2, Cincinnati, OH 45239-8704 116. J. Steel, Waste Env. Remediation Prgrms, Savannah River Site, Bldg. 773-A, A208,
Aiken, SC 29802 117. G. Subbaraman Rockendyne Division, Rockwell Internaltioal/ETEC, Energy Technology
Eng., Center, P. O. Box 7930, Canoga Park, CA 91309-7930 118. J. R. Suitlas, Brown & Root Environmental, Foster Plaza 7, 661 Anderson Drive,
Pittsburgh, PA 15220 119. N. Swift, Bradtec - US, 1010 Huntcliff Trail, Suite 1350, Atlanta, GA 30350 120. C. L. Tellez, Lockeed, Manager, Projects, 900 Grier Drive, Suite B, Las Vegas, NV 89119 121. V. Tidwell, Sandia National Laboratory, Department 6115, 1515 Eubank Blvd. S. E.,
Albuquerque, NM 87185 122. R. Warner, DOE-Fernald, MS-45, P.O. Box 398704, Cincinnati, Ohio 45239-8704 123. L. Worl, Los Alamos National Laboratory, Nuclear Materials Technology Div., NMT-3,
MS-E511, Los Alamos, NM 87545 124. P. J. Yerace, U. S. Department of Energy, FERMCO, P. O. Box 398704, MS-45,
Cincinnati, Ohio 45239-8704 125. D. A. York, Los Alamos National Lab, MEE-4, MS G787, P.O. Box 1663,
Los Alamos, NM 87545 127. Office of Scientific and Technical Information, P.O. Box 62, Oak Ridge, TN 37831
198