Technogenic soils of Poland
358
TECHNOGENIC SOILS OF POLAND
Transcript of Technogenic soils of Poland

TECHNOGENIC SOILS
OF POLAND


TECHNOGENIC SOILS
OF POLANDEDITED BY
PRZEMYSŁAW CHARZYŃSKIPIOTR HULISZ
RENATA BEDNAREK
POLISH SOCIETY OF SOIL SCIENCETORUŃ 2013

Editors: Przemysław Charzyński, Nicolaus Copernicus University, Toruń Piotr Hulisz, Nicolaus Copernicus University, Toruń Renata Bednarek, Nicolaus Copernicus University, Toruń
Reviewers: Jaroslava Sobocká, Director of Soil Science and Conservation Research Institute; Bratislava, Slovakia Zbigniew Zagórski, President of Polish Society of Soil Science; Warsaw University of Life Sciences
Language editing: Ewa Kaźmierczak
Cover design: Marcin Świtoniak
Photographs on the cover: Przemysław Charzyński
© Copyright by Polish Society of Soil Science, Toruń 2013
Unless otherwise stated, figures and photographs included in the book were created by the authors.
ISBN 978-83-934096-1-7
Publisher: Polish Society of Soil Science, Toruń 2013
Graphics design: Beata Króliczak-Zajko White Plum 87-100 Toruń, ul. Szosa Bydgoska 50 tel. +48 56 651 97 87
Press: Machina Druku tel. +48 56 651 97 87 www.machinadruku.pl
Wydano na zlecenie Urzędu Marszałkowskiego Województwa Kujawsko-Pomorskiego w Toruniu. Published at the request of the Marshal’s O¨ce of the Kuyavian-Pomeranian Province in Toruń.
Materiały dofinansowane ze środków Wojewódzkiego Funduszu Ochrony Środowiska i Gospodarki Wodnej w Toruniu. Printing supported by the Regional Fund for Environmental Protection and Water Management in Toruń.

FOREWORD 7
LIST OF SYMBOLS WITH EXPLANATIONS 8
CONTRIBUTORS 9
I PART I URBAN AREAS 15
Chapter 1 17 SOILS WITHIN TORUŃ URBAN AREA
Przemysław Charzyński, Renata Bednarek, Piotr Hulisz, Anna Zawadzka
Chapter 2 31 URBAN SOILS IN ZIELONA GÓRA
Andrzej Greinert, Róża Fruzińska, Jakub Kostecki
Chapter 3 55 LAWN SOILS IN TORUŃ AND BYDGOSZCZ
Przemysław Charzyński, Renata Bednarek, Szymon Różański, Łukasz Mendyk, Bartosz Morawski
Chapter 4 81 SOILS FORMING ON THE BUILDINGS IN TORUŃ
Przemysław Charzyński, Piotr Hulisz
Chapter 5 95 NECROSOLS OF CEMETERIES IN MASURIAN LAKELAND
Leszek Majgier, Oimahmad Rahmonov
Chapter 6 111 ‘PALEOTECHNOSOLS’ OF ANCIENT SETTLEMENTS
IN GRODNO AND KAŁDUS Maciej Markiewicz, Renata Bednarek, Michał Jankowski, Marcin Świtoniak
I PART II INDUSTRIAL AREAS 123
Chapter 7 125 SOILS AFFECTED BY SODA INDUSTRY IN INOWROCŁAW
Piotr Hulisz, Agnieszka Piernik
Chapter 8 141 SOILS AND VEGETATION UNDER THE IMPACT OF CEMENT INDUSTRY
IN THE VICINITY OF BIELAWY Halina Dąbkowska-Naskręt, Hanna Jaworska, Piotr Malczyk
Chapter 9 157 SOILS CONTAMINATED BY BRINE SPILLS IN SĘDOWO
Piotr Hulisz, Paweł Sowiński, Anna Felińczak-Drabik
CONTENTS

I PART III TRAFFIC AREAS 171
Chapter 10 173 EKRANOSOLS OF TORUŃ AIRFIELD
Przemysław Charzyński, Renata Bednarek, Łukasz Mendyk, Marcin Świtoniak, Aleksandra Pokojska-Burdziej, Andrzej Nowak
Chapter 11 191 SOILS OF TRAFFIC AREAS IN SZCZECIN
Marcin Kubus, Ryszard Malinowski, Edward Meller, Katarzyna Malinowska, Marcel Raček
Chapter 12 207 SOILS OF TRAFFIC AREAS IN WARSAW
Wojciech Kwasowski
I PART IV MINING AREAS 231
Chapter 13 233 POST-MINING SOILS IN ŁĘKNICA REGION
Andrzej Greinert, Michał Drab, Jakub Kostecki, Róża Fruzińska
Chapter 14 255 SOILS OF EXTERNAL DUMPING GROUND OF THE BEŁCHATÓW
OPEN-CAST LIGNITE MINE Marcin Świtoniak, Piotr Hulisz, Szymon Różański, Izabela Kałucka
Chapter 15 275 TECHNOGENIC SOILS DEVELOPED FROM MINE WASTES CONTAINING
IRON SULPHIDES IN SOUTHERN POLAND Łukasz Uzarowicz, Stefan Skiba
Chapter 16 301 SOILS OF URBAN FORESTS AND PARKS OF THE UPPER SILESIA REGION
Tadeusz Magiera, Marzena Rachwał, Adam Łukasik
I PART V MILITARY AREAS 321
Chapter 17 323 SOILS OF BARE LANDS IN THE TORUŃ MILITARY AREA
Michał Jankowski, Piotr Sewerniak
Chapter 18 345 SOILS CONSTRUCTED ON THE 19th CENTURY FORTIFICATIONS IN TORUŃ
Michał Jankowski, Renata Bednarek, Magdalena Jaworska
CONTENTS

7 TECHNOGENIC SOILS OF POLAND
In recent years, urban soils have been extensively researched. The growing interest in the related issues contributes to better understanding of the soil cover diversity in the cities, identification of changes and threats resulting from urbanization and industria-lisation.
This book presents the state of the art of knowledge about diverse technogenic soils in Poland. It includes many examples of urban soil studies conducted in miscella-neous Polish scientific centres. The presented issues concern not only morphology and properties of technogenic soils, but also their genesis, functioning in the environment, classification and reclamation.
For the purpose of accurate terminology, this book distinguishes between intentio-nal human activity in agricultural areas, aiming at increasing the soil productivity, which leads to the development of Anthrosols, and in most cases, unintentional human acti-vity related to life, industrial production or transport. The latter results in profound transformations of the soil cover in urban areas and formation of di³erent technoge-nic soils. This term was used to describe soils of urban areas because not all of them meet the criteria defined by WRB for Technosols. The process of their development was defined as technogenesis, and all human activities related to construction, industry, transportation, mining and military, a³ecting (both intentionally and unintentionally) the formation of technogenic soils, were defined as technopressure.
The editors hope that this monograph will provide new information on technogenic soils and will contribute to improvement of classification of this group of soils, and will further influence the growth of urban soil science.
Przemysław CharzyńskiPiotr Hulisz
Renata Bednarek
FOREWORD

TECHNOGENIC SOILS OF POLAND 8
Alo – acid oxalate extractable aluminiumBS – base saturationCEC – cation exchange capacityEA – exchangeable acidityEC1:5 – electrical conductivity of a 1:5 soil-water extract ECe – electrical conductivity of the soil saturation extractFed – dithionite extractable ironFeo – acid oxalate extractable ironFet – total iron HA – hydrolytic acidityĸ – magnetic susceptibility LoI – loss on ignitionn.d. – not determinedNt – total nitrogenOC – organic carbonPca – phosphorus soluble in 1% citric acid solutionPt – total phosphorusSAR – sodium adsorption ratioSD – standard deviationTEB – total exchangeable bases
Descriptions of all the studied soils were made according to the procedures outlined by FAO:
• FAO. 2006. Guidelines for Soil Description. Food and Agriculture Organization of the United Nations, Rome.
Soil colour was determined using the Munsell Soil Color Chart:
• Munsell Soil Color Chart. 2000. GretagMacbeth. New Windsor, NY.
LIST OF SYMBOLS WITH EXPLANATIONS

9 TECHNOGENIC SOILS OF POLAND
RENATA BEDNAREKDEPARTMENT OF SOIL SCIENCE AND LANDSCAPE MANAGEMENT FACULTY OF EARTH SCIENCES NICOLAUS COPERNICUS UNIVERSITY, TORUŃ [email protected]
PRZEMYSŁAW CHARZYŃSKI DEPARTMENT OF SOIL SCIENCE AND LANDSCAPE MANAGEMENT FACULTY OF EARTH SCIENCES NICOLAUS COPERNICUS UNIVERSITY, TORUŃ [email protected]
HALINA DĄBKOWSKA-NASKRĘTDEPARTMENT OF SOIL SCIENCE AND SOIL PROTECTION FACULTY OF AGRICULTURE AND BIOTECHNOLOGY UNIVERSITY OF TECHNOLOGY AND LIFE SCIENCES, BYDGOSZCZ [email protected]
MICHAŁ DRABDEPARTMENT OF LAND PROTECTION AND RECLAMATION INSTITUTE OF ENVIRONMENTAL ENGINEERING FACULTY OF CIVIL AND ENVIRONMENTAL ENGINEERING UNIVERSITY OF ZIELONA GÓRA [email protected]
RÓŻA FRUZIŃSKADEPARTMENT OF LAND PROTECTION AND RECLAMATION INSTITUTE OF ENVIRONMENTAL ENGINEERING FACULTY OF CIVIL AND ENVIRONMENTAL ENGINEERING UNIVERSITY OF ZIELONA GÓRA [email protected]
ANNA FELIŃCZAK-DRABIKINOWROCLAW SALT MINES „SOLINO” S.A. INOWROCŁAW [email protected]
ANDRZEJ GREINERTDEPARTMENT OF LAND PROTECTION AND RECLAMATION INSTITUTE OF ENVIRONMENTAL ENGINEERING FACULTY OF CIVIL AND ENVIRONMENTAL ENGINEERING UNIVERSITY OF ZIELONA GÓRA [email protected]
CONTRIBUTORS

TECHNOGENIC SOILS OF POLAND 10
PIOTR HULISZDEPARTMENT OF SOIL SCIENCE AND LANDSCAPE MANAGEMENT FACULTY OF EARTH SCIENCES NICOLAUS COPERNICUS UNIVERSITY, TORUŃ [email protected]
MICHAŁ JANKOWSKIDEPARTMENT OF SOIL SCIENCE AND LANDSCAPE MANAGEMENT FACULTY OF EARTH SCIENCES NICOLAUS COPERNICUS UNIVERSITY, TORUŃ [email protected]
HANNA JAWORSKADEPARTMENT OF SOIL SCIENCE AND SOIL PROTECTION FACULTY OF AGRICULTURE AND BIOTECHNOLOGY UNIVERSITY OF TECHNOLOGY AND LIFE SCIENCES, BYDGOSZCZ [email protected]
MAGDALENA JAWORSKADEPARTMENT OF SOIL SCIENCE AND LANDSCAPE MANAGEMENT FACULTY OF EARTH SCIENCES NICOLAUS COPERNICUS UNIVERSITY, TORUŃ
IZABELA KAŁUCKADEPARTMENT OF ALGOLOGY AND MYCOLOGY FACULTY OF BIOLOGY AND ENVIRONMENTAL PROTECTION UNIVERSITY OF ŁÓDŹ [email protected]
JAKUB KOSTECKIDEPARTMENT OF LAND PROTECTION AND RECLAMATION FACULTY OF CIVIL AND ENVIRONMENTAL ENGINEERING UNIVERSITY OF ZIELONA GÓRA [email protected]
MARCIN KUBUSDEPARTMENT OF DENDROLOGY AND LANDSCAPE ARCHITECTURE WEST POMERANIAN UNIVERSITY OF TECHNOLOGY, SZCZECIN [email protected]
WOJCIECH KWASOWSKIDEPARTMENT OF SOIL ENVIRONMENT SCIENCES FACULTY OF AGRICULTURE AND BIOLOGY WARSAW UNIVERSITY OF LIFE SCIENCES, WARSAW [email protected]

11 TECHNOGENIC SOILS OF POLAND
ADAM ŁUKASIKDEPARTMENT OF POST-INDUSTRIAL AREAS RECLAMATION INSTITUTE OF ENVIRONMENTAL ENGINEERING THE POLISH ACADEMY OF SCIENCES, ZABRZE [email protected]
LESZEK MAJGIERDEPARTMENT OF PHYSICAL GEOGRAPHY FACULTY OF EARTH SCIENCES UNIVERSITY OF SILESIA, KATOWICE [email protected]
PIOTR MALCZYKDEPARTMENT OF SOIL SCIENCE AND SOIL PROTECTION FACULTY OF AGRICULTURE AND BIOTECHNOLOGY UNIVERSITY OF TECHNOLOGY AND LIFE SCIENCES, BYDGOSZCZ [email protected]
KATARZYNA MALINOWSKADEPARTMENT OF PLANT PHYSIOLOGY FACULTY OF ENVIRONMENTAL MANAGEMENT AND AGRICULTURE WEST POMERANIAN UNIVERSITY OF TECHNOLOGY, SZCZECIN [email protected]
RYSZARD MALINOWSKIDEPARTMENT OF PEDOLOGY FACULTY OF ENVIRONMENTAL MANAGEMENT AND AGRICULTURE WEST POMERANIAN UNIVERSITY OF TECHNOLOGY, SZCZECIN [email protected]
TADEUSZ MAGIERADEPARTMENT OF POST-INDUSTRIAL AREAS RECLAMATION INSTITUTE OF ENVIRONMENTAL ENGINEERING THE POLISH ACADEMY OF SCIENCES, ZABRZE [email protected]
MACIEJ MARKIEWICZ DEPARTMENT OF SOIL SCIENCE AND LANDSCAPE MANAGEMENT FACULTY OF EARTH SCIENCES NICOLAUS COPERNICUS UNIVERSITY, TORUŃ [email protected]
ŁUKASZ MENDYK DEPARTMENT OF SOIL SCIENCE AND LANDSCAPE MANAGEMENT FACULTY OF EARTH SCIENCES NICOLAUS COPERNICUS UNIVERSITY, TORUŃ [email protected]
TECHNOGENIC SOILS OF POLAND 12
EDWARD MELLERDEPARTMENT OF PEDOLOGY FACULTY OF ENVIRONMENTAL MANAGEMENT AND AGRICULTURE WEST POMERANIAN UNIVERSITY OF TECHNOLOGY, SZCZECIN [email protected]
BARTOSZ MORAWSKI DEPARTMENT OF SOIL SCIENCE AND LANDSCAPE MANAGEMENT FACULTY OF EARTH SCIENCES NICOLAUS COPERNICUS UNIVERSITY, TORUŃ
ANDRZEJ NOWAK DEPARTMENT OF SOIL SCIENCE AND LANDSCAPE MANAGEMENT FACULTY OF EARTH SCIENCES NICOLAUS COPERNICUS UNIVERSITY, TORUŃ
AGNIESZKA PIERNIKDEPARTMENT OF GEOBOTANY AND LANDSCAPE PLANNING FACULTY OF BIOLOGY AND ENVIRONMENT PROTECTION NICOLAUS COPERNICUS UNIVERSITY, TORUŃ [email protected]
ALEKSANDRA POKOJSKA-BURDZIEJDEPARTMENT OF MICROBIOLOGY FACULTY OF BIOLOGY AND ENVIRONMENT PROTECTION NICOLAUS COPERNICUS UNIVERSITY, TORUŃ
MARCEL RAČEKDEPARTMENT OF PLANTING DESIGN AND MAINTENANCE FACULTY OF HORTICULTURE AND LANDSCAPE ENGINEERING SLOVAK UNIVERSITY OF AGRICULTURE IN NITRA, SLOVAKIA [email protected]
MARZENA RACHWAŁDEPARTMENT OF POST-INDUSTRIAL AREAS RECLAMATION INSTITUTE OF ENVIRONMENTAL ENGINEERING OF THE POLISH ACADEMY OF SCIENCES, ZABRZE [email protected]
OIMAHMAD RAHMONOVDEPARTMENT OF PHYSICAL GEOGRAPHY FACULTY OF EARTH SCIENCES UNIVERSITY OF SILESIA, KATOWICE [email protected]

13 TECHNOGENIC SOILS OF POLAND
SZYMON RÓŻAŃSKIDEPARTMENT OF SOIL SCIENCE AND SOIL PROTECTION FACULTY OF AGRICULTURE AND BIOTECHNOLOGY UNIVERSITY OF TECHNOLOGY AND LIFE SCIENCES, BYDGOSZCZ [email protected]
PIOTR SEWERNIAK DEPARTMENT OF SOIL SCIENCE AND LANDSCAPE MANAGEMENT FACULTY OF EARTH SCIENCES NICOLAUS COPERNICUS UNIVERSITY, TORUŃ [email protected]
STEFAN SKIBADEPARTMENT OF PEDOLOGY AND SOIL GEOGRAPHY INSTITUTE OF GEOGRAPHY AND SPATIAL MANAGEMENT JAGIELLONIAN UNIVERSITY, CRACOW [email protected]
PAWEŁ SOWIŃSKI DEPARTMENT OF SOIL SCIENCE AND SOIL PROTECTION FACULTY OF ENVIRONMENTAL MANAGEMENT AND AGRICULTURE UNIVERSITY OF WARMIA AND MAZURY, OLSZTYN [email protected]
MARCIN ŚWITONIAK DEPARTMENT OF SOIL SCIENCE AND LANDSCAPE MANAGEMENT FACULTY OF EARTH SCIENCES NICOLAUS COPERNICUS UNIVERSITY, TORUŃ [email protected]
ŁUKASZ UZAROWICZDEPARTMENT OF SOIL ENVIRONMENT SCIENCES FACULTY OF AGRICULTURE AND BIOLOGY WARSAW UNIVERSITY OF LIFE SCIENCES, WARSAW [email protected]
ANNA ZAWADZKA DEPARTMENT OF SOIL SCIENCE AND LANDSCAPE MANAGEMENT FACULTY OF EARTH SCIENCES NICOLAUS COPERNICUS UNIVERSITY, TORUŃ

URBAN AREAS
PART I


1
17 TECHNOGENIC SOILS OF POLAND
SOILS WITHIN TORUŃ URBAN AREA
PRZEMYSŁAW CHARZYŃSKI RENATA BEDNAREK PIOTR HULISZ ANNA ZAWADZKA
Introduction
In the countryside and areas free of urbanization processes or destructive industrial forces, natural soil dominate; they are resistant to anthropogenic and technogenic impact. In urban areas, there are only remnants of natural soils, while soils radically transformed by di�erent human activities dominate together with ‘new soils’, where development of particular horizons and layers is not reflected in natural conditions of the system. Sealing of soils, transformations of naturally developed soils and formation of soils from anthro-pogenic deposits are the main types of soil formations in urban areas (Blume 1989). Soils of urban areas are quite di�erent complexes deserving individual consideration.
The problem of anthropogenic soil transformations is a subject of growing interest among researchers. It is di�cult, however, to get detailed soil maps of only urban eco-systems (Stroganova, Prokofieva 2000).
This chapter characterizes the urban soil cover in Toruń. The identified soil units were described with special reference to soils formed and transformed as a result of anthropogenic and technogenic activity.
Study area
The city of Toruń (18º36’ E and 53º01’ N) covers an area of 116 km2. It is located in the Toruń Basin (part of the Vistula ice marginal streamway) in North Poland (Fig. 1). The Toruń Basin is 20 km wide in the vicinity of the city and cover an area of 11 535 km2.
Toruń is situated on the flat river terraces – the most important element of the relief – with small groups of dunes. Such a location does not hinder the development of the city. Of the original eleven terraces distinguished, only X, IX, VIII, VII and VI survived to our times. Their origin probably dates back to 17.0 and 14–13.5 ka BP. All the terraces,

TECHNOGENIC SOILS OF POLAND 18
P. CHARZYŃSKI, R. BEDNAREK, P. HULISZ, A. ZAWADZKA
except the floodplain, are built of sand and gravel deposits, underlain by Pleistocene boulder clay or Tertiary clay. The main problem in the spatial development of the city was the edge of terraces VIII and IX in places adja-cent to terrace IV. However, during the expansion of the city and road con-struction, the edge has been substan-tially softened. Similarly, the dunes have been significantly transformed or destroyed by the construction of military, industrial or sports facilities, as well as by exploitation of dune sands (Niewiarowski, Weckwerth 2006). The largest areas in Toruń are represented by flat lands, which have developed as a result of filling of primary or secondary depressions and levelling of natural convex forms (e.g. dunes). This type of terrace transformation is evidenced by embankments. According to Fedorowicz (1993), the thickness of downtown embankments is around 2.5 to 4.0 m, or even more than 7–8 m in places of medieval moats. Outside the City Centre, the embankment thickness is relatively smaller and ranges within 1.0–2.5 m.
The average annual air temperature for the period of 1951–2000 is 7.9oC and the average total precipitation for the same period is 522.5 mm (Wójcik 2006).
The largest plant formation in the area of Toruń are forests, covering about 23% of the total urban area. The total forest area is about 27 km2 and forest parks – 1.5 km2 (Kozłowski 1998). Meadows cover 7% of the urban area and arable lands – about 18%.
The history of Toruń as an urban centre began on 18 December 1233 when the city rights were granted. Since then, the city has grown very rapidly. In the 13th century, it was already surrounded by city walls. In 1233, the area of the city was 20 ha and in 1264 − as much as ca. 40 ha (Fedorowicz 1993). The specific location of this city and particular role of the Vistula River as a haul road contributed to the fact that in the 14th century, Toruń was already an important trade centre of the then Polish country. It was one of the largest cities in medieval Poland (Klimek, Rymaszewski 1994).
The development of Toruń was interrupted in the 17th century by the war with Sweden. Nevertheless, the city regained its former splendour. In the late 18th century and 19th century, however, the political situation led to a complete functional transformation of Toruń – in the spatial and economic structure (Fig. 2). The extension of fortifications determined the transformation of the city into a powerful fortress. Elimination of the suburbs and a ban on house building near the fortress zone caused that for a long time there were no connections between the medieval centre and suburbs developing in the
Fig. 1. Location of Toruń

19 TECHNOGENIC SOILS OF POLAND
SOILS WITHIN TORUŃ URBAN AREA
distance. This situation resulted in a trade slump and restriction on the spatial develop-ment of the city. Introduction of new architecture was possible only after the removal of certain fortification elements in 1918 (Gregorkiewicz 1983). The period of World War II did not bring any damage to the city, but after the liberation of Poland and seizure of power by the communists, Toruń has lost its role as a provincial capital in favour of the neighbouring city of Bydgoszcz.
Fig. 3. Contemporary skyline of Toruń Old Town
The next stage of Toruń development started after 1960, when decisions about the construction of two large industrial plants were taken (‘Elana’ chemical fibre plant and ‘Merinotex’ yarn spinning mill). This caused a massive influx of people from the neighbourhood that resulted in the rapid development of urban infrastructure. Since 1989, Toruń, like other cities in Poland, has undergone profound social and economic transformations.
Fig. 2. Skyline of 17–18th century Toruń, a copper engraving by Christian Daniel Pietsch

TECHNOGENIC SOILS OF POLAND 20
Nowadays, the city is a co-capital of the Kuyavian-Pomeranian Province and a regional centre of investment, science and tourism. In 1997, the medieval part of Toruń was designated as a UNESCO World Heritage Site (Fig. 3). As of January 1st 2013, the population of the city was 198 383 people (source: Toruń City Council Census).
Anthropogenic transformation of the landscape and soils in Toruń
The genesis and characteristics of urban soils depend on the history of a given city. The origin of surface feature transformation in the area of Toruń goes back to the 13th century with the highest intensity in the 19th and 20th centuries. The human activity generates the development of negative and positive land forms, which contribute to specific anthropogenic relief within the city range (Podgórski 1996). Destructive morphological ac-tivity of man occurred, among others, during construction of channels and drainage ditches, levelling of surfaces, formation of pits and workings after exploitation of building material etc. Extensive destruction of e.g. dunes has been observed, which until the 13th century occurred in large numbers on all the terraces, excluding the inundation ones.
The impact of human activity led to a gradual transformation of aeolian forms and to a total elimination of small dunes. Construction of roads and streets resulted in the transformation of terraces. Furthermore, also many linear embankments developed. The thickness of surface embankments within the administrative boundaries of the city varies, depending on their age. In the medieval area of the city and in the Podgórz district, there are 2.5–4.0 m thick embankments. On the outskirts of the Old Town, their thickness increases to about 7 m. The embankments with a thickness of 1.0–2.5 m occur within the boundaries of the 19th century city (Fedorowicz 1993).
Soil units
Figure 4 presents a map with the current state of knowledge about the soil cover trans-formation of technogenic and anthropogenic origin in the Toruń urban area. Its first ver-sion was prepared for the SUITMA 2 conference in Nancy (Bednarek et al. 2003). A modi-fied version of the map was published in the monograph of Toruń (Bednarek, Jankowski 2006). The soils were mapped using units distinguished as hybrids of three urban soil classifications: by Stroganova et al. (1998), Konecka-Betley et al. (1984) and Burghardt (2000). The legend of this map consists of 8 soil units: undisturbed and weakly trans-formed soils, urbisols, industrisols, garden soils, soils of parks and lawns, necrosols, ekranosols and constructosols. They are described below.
P. CHARZYŃSKI, R. BEDNAREK, P. HULISZ, A. ZAWADZKA

21 TECHNOGENIC SOILS OF POLAND
Undisturbed and weakly transformed soilsThis unit includes urban forest and agricultural soils located within the administrative boundaries of Toruń (Fig. 4).
Urban forest soils cover about 23% of the city area. They also belong to anthropo-genically transformed soils, but changes in their morphology and properties are often relatively small. Therefore, these soils can be locally classified as natural.
Fig. 4. The map of soils within Toruń urban area (Bednarek et. al 2003; Bednarek, Jankowski 2006; modified). Explanations: 1 – undisturbed and weakly transformed soils, 2 – urbisols, 3 – industrisols, 4 – garden soils, 5 – soils of parks and lawns, 6 – necrosols, 7 – ekranosols, 8 – constructosols, 9 – rubbish dump, 10 – admini-strative boundaries of Toruń, 11 – surface waters
Urban forests, occurring mostly in suburbs, show spatial and ecological continuity with forest complexes situated outside the city. Their soils developed from river terrace and dune sands (Fig. 5), covered mainly with pine stands (Pinus sylvestris). These sandy acid soils (Podzols, Arenosols) are characterised by low resistance to pollution. The highest degree of soil transformation is observed in the vicinity of industrial plants in the western part of Toruń.
SOILS WITHIN TORUŃ URBAN AREA

TECHNOGENIC SOILS OF POLAND 22
The urban agricultural soils (mainly Fluvisols – Fig. 6) are used as meadows, pastures and arable lands. They cover ca. 25% of the city area, but this value constantly decreases. Like all other soil units found in urban ecosystems, urban agricultural soils are much more a�ected by pollution compared to soils of non-urbanized areas. Interwoven into the urban infrastructure, they are a�ected by large amounts of greenhouse gases and toxins emitted by factories, as well as by domestic and commercial wastewater (particularly on the northern outskirts of Toruń).
UrbisolsThese soils are characterised by large quantities of artefacts in their profile, like e.g. bricks, and high horizontal and vertical variability (Fig. 7). Urbisols cover the largest area within the municipal boundaries. They include compact urban built-up areas of right-bank as
Fig. 5. Urban forest soil (Brunic Arenosol) Fig. 6. Urban agricultural soil (Haplic Fluvisol)
P. CHARZYŃSKI, R. BEDNAREK, P. HULISZ, A. ZAWADZKA

23 TECHNOGENIC SOILS OF POLAND
well as left-bank Toruń. The built-up areas were treated comprehensively on the map (Fig. 4), however they include also separate soil units occurring under the town squares, hous-ing estate and street lawns. The latter are not included on the map. As mentioned above, spatial development of the city proceeded with varying intensity over the centuries. That is why urbisols formed in the urban built-up area are characterised by varying degrees of morphological transformation. The soils occurring in the Old Town and downtown were formed on a well-developed cultural layer with the urbic horizon of large thickness and high content of artefacts. Most of such soils meet the criteria of WRB Technosols. The areas of relatively new housing estates are covered with incompletely developed urbisols. The soils are often only partially technogenically transformed with still visible deeper soil horizons, which until recently were mostly natural, or agriculturally transformed. Such urbisols do not qualify as Technosols.
Fig. 7. Urbisol (Szosa Chełmińska st.) Fig. 8. Industrisol (at the former chemical plant ‘Polchem’)
SOILS WITHIN TORUŃ URBAN AREA

TECHNOGENIC SOILS OF POLAND 24
Industrisols These soils occur in places of working industrial plants and in their close proximity (Fig. 8). Their typical feature is contamination with various substances – gaseous, liquid or solid. Toruń industry is concentrated in three parts of the city − western, north eastern and southern (Fig. 4). The studies of soil contamination with heavy metals and sulphur in the protection zone of the largest and most environmentally harmful industrial plants re-vealed an elevated content of sulphur around the ‘Elana’ chemical fibre factory. Within a distance of 2.6 km from the CHP plant ‘Energotor’, soils were strongly contaminated with cadmium, and – to a lesser extent – with zinc and sulphur (Burak 2001). However, the soil acidification caused by emission of sulphur compounds was not detected (Pokojska et al. 1999).
Garden soilsAllotment gardens in Toruń cover ca. 349 ha (3% of the total city area) and constitute significant greenery resources of the city (Fig. 4). The largest complex occurs in left-bank Toruń, in the Rudak quarter on the floodplain. The oldest, still existing allotment garden is located just outside the Old Town area. It was founded in 1928 and named after General Sikorski. It covers an area of 3.5 ha.
Garden soils in Toruń due to horticultural operations developed thick and dark humus horizons (Fig. 9), which usually meet criteria of mollic but not very often hortic, due to too low phosphorus content (Hudańska 2013).
The primary soils in particular garden complexes were di�erent (Fluvisols, Brunic Arenosols and Mollic Gleysols). However, organic deposits of di�erent origin and thickness were applied by garden owners. The degree of soil transformation in particular complexes depends also on the type and the level of contamination. Due to the development of the city infrastructure, gardens located in the past on the outskirts are now close to industrial areas and main tra�c routes. Monitoring results for the period of 1994–1996 in 13 allotment garden complexes pointed to zinc and lead pollution. Extreme contamination with these elements was found in gardens located near the highway from Toruń to the north part of Poland (Jankowski 1995).
Soils of parks and lawnsSometimes the soil cover in large green urban areas cannot be classified as ‘artificial’ soils, but instead as technogenically transformed ones (Fig. 10). Parks and housing estate lawns are included in the so-called ‘arranged green’. The arranged green area in Toruń is about 226 ha, including 31 ha of historical garden installations. The soils of parks and grass plots cover 1.95% of the city area. Lawn soils are described in Chapter 3.
P. CHARZYŃSKI, R. BEDNAREK, P. HULISZ, A. ZAWADZKA

25 TECHNOGENIC SOILS OF POLAND
NecrosolsThere are 15 old, no longer used cemeteries and former graveyard grounds in the city of Toruń and 11 contemporary cemeteries, still in use. The Central Communal Cemetery is the largest one, located in the northern part of the city. It was founded in 1975 and covers an area of 59 ha. The soils occurring in the cemetery area are called necrosols (Fig. 11). Accord-ing to Stroganova et al. (1998), the depth of technogenic transformations within these soil profiles exceeds 2 m. Other features of graveyard soils include the absence of natural horizons, the presence of urban layers with abrupt transitions and the occurrence of arte-facts (e.g. fragments of bricks, glass, nails). This was also observed in soils of Toruń cem-eteries (Charzyński et al. 2011b). The research was carried out in the above-mentioned Central Communal Cemetery and in the two oldest cemeteries − St. George cemetery
Fig. 9. Garden soil (Szczanieckiego st.) Fig. 10. Lawn soil (Lubicka st.)
SOILS WITHIN TORUŃ URBAN AREA

TECHNOGENIC SOILS OF POLAND 26
existing since 1811 and St. Jacob the Apostle Parish cemetery established in 1817. In the Polish burial tradition, graves are usually covered with large horizontal tombstones, therefore sealing is another feature to be recognized in necrosols.
EkranosolsIn contemporary cities, large areas are sealed by road and pavement coverings. In densely populated agglomerations, sealed soils cover most of their area. In Moscow, sealed soils cover 90–95% of the downtown districts, 80% in industrial districts and 60% in residential areas.
The largest homogeneous area of ekranosols in the city is located under the runway and taxiways of Toruń Aerodrome. These soils were described in Chapter 10. Furthermore, ekranosols also occur under all asphalted or cemented streets, sidewalks and alleys in
Fig. 11. Necrosol (Central Communal Cemetery) Fig. 12. Ekranosol (Gałczyńskiego st.)
P. CHARZYŃSKI, R. BEDNAREK, P. HULISZ, A. ZAWADZKA

27 TECHNOGENIC SOILS OF POLAND
the city parks (Fig. 12). Ekranosols in Toruń are characterised by alkaline reaction, high calcium carbonate content, low organic carbon and total nitrogen content. Some profiles contain layers with a high content of phosphorus, which is related to the previous land use (Charzyński et al. 2011a).
ConstructosolsConstructosols in Toruń are mainly represented by soils developed on forts or some medi-eval walls (Fig. 13). According to the definition by Stroganova et al. (1998) and taking into account the genesis of forts, these are artificial soil products built of several di�erent layers of mineral material brought by man, which are enriched with mould material on the surface. The former Toruń Fortress included 15 forts built in the 19th century. Their con-struction was of brick with ceiling thickness above 1 m, covered with earthy (soil) deposits. The thus developed soils constituted a fort construction unit and also a substrate for plant cover, which was a significant structural part of the defence (see Chapter 18).
Fig. 13. Constructosol on walls of Dybowski Castle
Soils of eight older sport grounds can also be considered as another version of constructosols. In these areas, a thin humus horizon built of the transported material occurs over the autochthonous mineral material, which represents di�erent parts of the natural soil profile. This humus horizon is artificially deposited to create optimal conditions for sward development. Soils of similar genesis can occur on newly formed housing-estate and street lawns. However, they are usually additionally contaminated with combustion gases, particularly near busy streets.
SOILS WITHIN TORUŃ URBAN AREA

TECHNOGENIC SOILS OF POLAND 28
Summary
As evidenced by the results of long-term and multifaceted studies of soils within the Toruń urban area, the anthropogenic and technogenic factors significantly a�ected the primary soil cover. The present state of urban soils is a result of over 750 years of spatial development and an e�ect of human economic activity. Before the intensive urbaniza-tion process had started, Brunic Arenosols dominated in the described area. Nonetheless, the natural soils (undisturbed and weakly transformed), polluted to a varying degree, are still recognized within the municipal boundaries. Nowadays, about 75% of the city area consists of technogenic soils − human-transformed or man-made.
References
1. Bednarek R., Jankowski M. 2006. Soils. [In:] L. Andrzejewski, P. Weckwerth, S. Burak (Eds.). Toruń and its surroundings – environmental monograph. Wyd. UMK. Toruń: 153–176 (in Polish with English Summary).
2. Bednarek R., Charzyński P., Zawadzka A. 2003. Soils within Toruń Urban area. SUITMA 2003 abstracts book, Nancy: 229–230.
3. Blume H.-P., 1989. Classification of soils in urban agglomerations. Catena 16: 269–275.
4. Burak Sz. 2001. Assessment of the environment in Toruń. WIOŚ, Toruń (in Polish).
5. Burghardt W. 2000. The German double track concept of classifying soils by their substrate and their anthropo-natural genesis: the adaptation to urban areas. First International Conference on Soils of Urban, Industrial, Tra�c and Mining Area, Proceedings, 1. Essen, Germany: 217–222.
6. Census of the City Council of Toruń 2013. http://www.Torun.pl/ pl/miasto/mieszkancy-dane.
7. Charzyński P., Bednarek R., Błaszkiewicz J. 2011a. Morphology and properties of Ekranic Tech-nosols in Toruń and Cluj-Napoca. Rocz. Glebozn. 62(2): 1–6 (in Polish with English abstract).
8. Charzyński P., Bednarek R., Świtoniak M., Żołnowska B. 2011b. Ekranic Technosols and Urbic Technosols of Toruń Necropolis. Geologija 53, 4: 179–185.
9. Fedorowicz L. 1993. Geographical environment anthropogenic transformations in the area of Toruń city. Stud. Soc. Sci. Toruń, Sec. C, 10, 3 (in Polish with English Summary).
10. Gregorkiewicz K. 1983. Toruń. Spatial development of the city. Toruńskie Towarzystwo Kultury, Toruń (in Polish).
11. Hudańska P. 2013. Garden soils in the city of Toruń. M.Sc. manuscript. Nicolaus Copernicus University, Toruń (in Polish with English abstract).
12. Jankowski J. 1995. Assessment of heavy metal content in soils of allotments in Toruń. WIOŚ, Toruń (in Polish).
13. Klimek S., Rymaszewski B. 1994. Toruń, architecture and history. VIA, Toruń (in Polish).
P. CHARZYŃSKI, R. BEDNAREK, P. HULISZ, A. ZAWADZKA

29 TECHNOGENIC SOILS OF POLAND
14. Konecka-Betley K., Janowska E., Luniewska-Broda J., Szpotański M. 1984. Preliminary classi-fication of soils in the Warsaw aglomeration. Rocz. Glebozn. 35(2): 151–163 (in Polish with English abstract).
15. Kozłowski T. 1998. Assessment of the situation in urban forests. [In:] Toruń municipal forests − the state of management and protection. Polski Klub Ekologiczny, Toruń: 21–35 (in Polish).
16. Niewiarowski W., Weckwerth P. 2006. Genesis and relief development. [In:] Toruń and its sur-roundings – environmental monograph. Wyd. UMK, Toruń: 65–98 (in Polish with English Summary).
17. Podgórski Z. 1996. Anthropogenic changes in relief of the Toruń Province. Stud. Soc. Sci. Toruń. C, 9, 5 (in Polish with English abstract).
18. Pokojska U., Kwiatkowska A., Szrejder B. 1999. E�ects of sulphur compounds deposition on rusty soils in the vicinity of Toruń inorganic industry works ‘Polchem’. Zesz. Nauk. ATR w Bydgoszczy 217 – Rolnictwo (43): 97–106 (in Polish with English abstract).
19. Stroganova M., Miagkova A., Prokofieva T., Skvortsova I. 1998. Soils of Moscow and urban environment. Moscow.
20. Stroganova M., Prokofieva T. 2000. Urban Soils – concept, definitions, classification. [In:] W. Burghardt, Ch. Dornauf (Eds.) First International Conference on Soils of Urban, Industrial, Tra�c and Mining Area, Proceedings, 1. Essen, Germany: 235–239.
21. Wójcik G. 2006. Climate. [In:] L. Andrzejewski, P. Weckwerth, S. Burak (Eds.). Toruń and its surroundings – environmental monograph. Wyd. UMK. Toruń: 99–128 (in Polish with English Summary).
SOILS WITHIN TORUŃ URBAN AREA


31 TECHNOGENIC SOILS OF POLAND
URBAN SOILS IN ZIELONA GÓRA
ANDRZEJ GREINERT RÓŻA FRUZIŃSKA JAKUB KOSTECKI
2Introduction
The urban sphere is a complex formation comprising both elements of the natural envi-ronment, preserved (usually in a rudimentary form) within the boundaries of a modern city, as well as of the technogenic environment, connected with di�erent types of human activity. With regard to soils, they have been thoroughly analysed for merely a quarter of a century.
According to Blume (1989), there are three basic soil formations in urban areas: soils sealed on the surface, transformed soils with natural development and soils formed from technogenic deposits. Soils with natural profiles are formed mainly as a result of di�erent behaviour of surface and groundwater. This is conditioned by spatial and vertical distribution of chemical compounds and soil-forming materials (Burghardt 1995). The character of urban areas is considerably di�erent from the above thesis. The role of water in the formation of urban soils is strongly limited by truncation of profiles, as well as formation of embankments and excavations, and consequently, changes in the distance between the surface layer and the groundwater table. Changes in the water flow are also caused by isolation of the land surface, the presence of ditches, canals and pipes as well as drainage. The interconnection between particular soil-forming factors is broken. As a result, urban and post-industrial soils merely reflect the history of their use (Pouyat et al. 2009), whereas their genesis is usually quite incomprehensible. This is enhanced by the young age of most urban soils – estimated as several dozen years at most. Most authors notice considerable di�erences between urban and natural soils in terms of characteristics, including the layout of their layers and levels, chemical composition and structure (Kabata-Pendias, Pendias 1992; Tiller 1992).
Specific soil-forming materials are an important aspect in the discussions of soil scien-tists on urban soils (Pickett, Cadenasso 2009). Their characteristics and properties largely a�ect the characteristics and properties of urban soils. Identification of the materials

TECHNOGENIC SOILS OF POLAND 32
A. GREINERT, R. FRUZIŃSKA, J. KOSTECKI
building the urban soils provides a large amount of information about their condition both in the short and long run. This applies to the chemical composition of soils, the behaviour of substances in the soil profile (transport, accumulation, sorption), and transfor-mations caused by di�erent types of weathering. Czarnowska (1995) described the main role of technogenic materials in earthwork soils, and distinguished detailed taxonomic categories: the silicate-rubble-waste subtype, the silicate-rubble-coal subtype, etc.
In terms of transformations of soils resulting from their use, usually the following categories are distinguished: areas used as gardens, parks, cemeteries, housing estates (detached houses and blocks of flats), and communication routes. Apparent di�erences between the types of buildings constitute an important aspect in the discussion about the influence of the land development type on the behaviour of urban soils. This is indicated by most urban-soil scientists (Burghardt 1996; Hiller, Meuser 1998; Kahle, Coburger 1996; Kretschmer et al. 1993), and also by the results obtained from the research on soils and land in the urban area of the city of Zielona Góra. There are papers indicating that the heterogeneity of urban soils is obvious, which results from the same technologies used for the development of particular areas (Shane 2005). However, most authors regard considerable di�erences between urban soils as a consequence of single actions in small areas. In this way, areas with a di�erent structure of the soil profile and soil properties are located close to one another. In general, greater variation between soils is described by environmental scientists (soil scientists) than by technical scientists (urban planners).
Study area and soil profile documentation
Zielona Góra is a medium-sized town inhabited by about 110 thousand residents and lo-cated in the western part of Poland (51°56’07”N, 15°30’13”E). The town’s history dates back to the beginning of the fourteenth century and is related mostly to agricultural and craft activities of the town’s inhabitants. Until the mid-nineteenth century, the small town was surrounded by cultivated fields, gardens and vineyards. Remnants of these activities are present in the residual and surrounding areas to this day. The evolution of the urban territory was limited to the historic centre until the end of the 19th century, after which the character and appearance of the town changed. Strong urbanization and indus-trialization processes occurred and remained the main mechanism of the area develop-ment by the end of the twentieth century. After the political transformation of Poland, Zielona Góra lost its industrial character and became a town with mainly tertiary economy. This involves significant di�erences both in terms of the scale and intensity of techno-genic impact on the environment.
From the geological and geomorphological perspective, Zielona Góra is located in the Middle-Odra-Land, on two geomorphological forms: the Zielona Góra Moraine Belt

33 TECHNOGENIC SOILS OF POLAND
URBAN SOILS IN ZIELONA GÓRA
(max. height 221 m a.s.l.) and the Chynów-Płoty Basin (about 80 m a.s.l.). The moraine belt has a latitudinal shape, and is situated between two main ice marginal valleys: Warsaw-Berlin and Głogow-Baruth (Podgajna 2010). Most of the geological materials building the topsoil of the Zielona Góra locality are medium and coarse sands of glacial and fluvial origin, gravels and in some areas, silts and clays within glacitectonically disturbed moraine structures (Gontaszewska, Kraiński 2007).
Weather conditions are typical of the transition area, influenced by the oceanic and con-tinental climate. During the period of 30 years, the following average values were recorded: monthly temperatures – 9.0oC, min. -22oC (I), max. +35.3oC (VII); annual precipitation – 572 mm (high annual varability – 505–757 mm from 2000 to 2011); the number of rainy days per year – 175.1; winds from the western sector above 50% of the wind rose; wind velocity – 3.2 m·s-1, max. 34 m·s-1; the number of cloudy days per year – 109; atmospheric pressure – 993.2 hPa, min. 978.9 hPa, max. 1006.1 hPa; snow cover – 50.7 days (Dancewicz 2010).
In the close surroundings of Zielona Góra, the presence of Podzols is a typical phenomenon. This is a clear result of pine monocultures as a dominant form of production forests, which has been observed from the nineteenth century. Forests replaced most of the arable lands and according to the current data, they cover 45.1% of the town and 57.0% of the municipality. Similar processes led to the formation of Brunic Arenosols. In smaller areas, Luvisols, Albeluvisols, Gleysols and Phaeozems were identified according to WRB classification (IUSS Working Group WRB 2007).
Several distinct changes in the use of urban and suburban areas, compared to forest or arable lands, have caused di�erent soil transformations. Changes are observed in the soil profile morphology, soil physics and chemistry. Most of them are related to typical urbanisation/building activities, or communication and industrialisation.
Technogenic and anthropogenic soils are present in the area of Zielona Góra as a result of multilateral human pressure (IUSS Working Group WRB 2007):
— Hortic Anthrosols— Technic Regosols— Mollic Technosols— Urbic Technosols— Ekranic TechnosolsThe research was carried out in the town and in the administrative commune of Zielona
Góra in areas of di�erent use. Particular locations were selected in areas illustrating particu-lar stages of human impact on the natural environment – 105 soil profiles at a depth of 150 cm (samples from each of the morphological layers or genetic horizons) + 32 bulk surface samples (an area of approximately 20 m2 each, samples from humus horizons). In total, 562 samples were analysed (Greinert 2003). Soils were classified according to WRB (IUSS Work-ing Group WRB 2007) and PSSS (Commission V on Genesis, Classification and Cartography of Soils PSSS 2011) classification. In addition, about 100 other soil profiles were morpho-logically described up to 2012, taking the opportunity of construction work in the town.

TECHNOGENIC SOILS OF POLAND 34
Three selected soil profiles from the Zielona Góra urban area presented in the tables represent di�erent spatial situations and use forms – profile 1 – young town sector, industrial character, created in the late 1960s, about 1 km from the town centre, about 300 m from the main pollutant in the town – a heat and power station (CHP); profile 2 – old town, a few meters from the town hall, with residues of medieval times about 150–200 cm below the present surface; profile 3 – place probably close to the initial location of the town, a productive vineyard till the end of World War II (with no known historical periods of other uses), nowadays the vineyard park, about 500 m from the Old Square (Fig. 1).
Fig. 1. Location of soil profiles in Zielona Góra
Sorption properties (hydrolytic acidity – HA and total exchangeable bases – TEB) were determined by the Kappen method, pH in H2O, 1M KCl and 0.01 M CaCl2 – by the potentiometric method; total Ca, K and Na content in aqua regia extract using flame photometry and the TOC content using a Shimadzu analyser. The content of heavy metals in the soil samples was determined by atomic absorption FAAS. Extracts in aqua regia (the mixture of concentrated acids HCl:HNO3 in the proportion of 3:1) were prepared according to ISO 11466 (1995), extracts in 0.1M HCl – the fraction potentially available to plants according to Baker and Amacher (1982). Extracts in 0.1M HCl were prepared and analysed both for the soils and anthropogenic materials. Electrical conductivity (EC) of soil-water extract 1:2 was determined by conductometric method.
All statistical analyses were conducted using Statistica for Windows 9.1a. The basic statistical figures were defined together with correlations between soil condition indi-ces at levels α=0.01 and 0.05.
A. GREINERT, R. FRUZIŃSKA, J. KOSTECKI

35 TECHNOGENIC SOILS OF POLAND
Profile 1
Location: Zjednoczenia St.,
Zielona Góra, Western Poland
Coordinates: 51°56’37”N
15°29’27”ESoil classification (WRB 2007): Paratechnic Regosol (Arenic)
A1 — 0–5 cm: humus horizon, loamy sand, dark greyish brown, granular structure, dry, few arte-facts (glass, plastic and waste organic matter; < 1%), unclear boundary.
A2 — 5–22 cm: humus horizon, loamy sand, dark grey, granular structure, dry, artefacts (pieces of brick, stones, glass, plastic and waste organic matter; 2%), clear boundary.
C — 22–48 cm: mortar-sand-gravel layer, light greenish grey, compacted, gravel and stones > 20%.
IIC — 48–122 cm: sand, light yellowish brown, com-pacted, dry, interbeddings of loamy sand, stones and gravel (2%), clear boundary.
IIIC — below 122 cm: sand, pale yellow to light grey, single grain structure, slightly moist, without arte-facts.
URBAN SOILS IN ZIELONA GÓRA
0 cm
50 cm
100 cm
150 cm
200 cm
250 cm

TECHNOGENIC SOILS OF POLAND 36
Table 1. Selected soil properties – profile 1
HORIZON A1 A2 C IIC IIIC
DEPTH [cm] 0–5 5–22 22–48 48–122 > 122
PARTICLE SIZE DISTRIBUTION [%]
>2 mm <1 2 22 2 0
2 mm–50 µm 81 83 94 96 97
50–2 µm 15 13 6 4 3
<2 µm 4 4 0 0 0
TEXTURE CLASS (USDA)
loamy sand
loamy sand sand sand sand
SOIL MATRIX COLOUR
dry
moist
2.5Y 4/1.5
2.5Y 3/1
2.5Y 4/1
2.5Y 3/1
5G 7/1
5G 5/1
2.5Y 6/3
2.5Y 4.5/4
2.5Y 7/2.5 2.5Y 5/12.5Y 5/3 2.5Y 4/1
BULK DENSITY [g·cm-3] 1.36 1.42 1.84 1.72 1.54
OC [%] 5.7 6.4 0.6 1.1 0.1
Nt [%] 0.30 0.29 0.02 0.06 0.02
C:N 19 22 40 20 6
pH in H2O 7.3 6.9 7.7 7.5 7.2
in 1M KCl 7.1 6.8 7.3 7.2 6.9
EC [mS·cm-1] 0.46 0.44 0.30 0.29 0.33
CEC [cmol·kg-1] 25.1 21.4 5.6 7.3 3.9
CaCO3 [%] 0.7 0.9 2.7 0.7 0.3
TOTAL CONTENT OF SELECTED MACROELEMENTS
P [mg·kg-1] 2800 2900 600 130 500
K [mg·kg-1] 10000 10000 5180 4450 6140
Ca [mg·kg-1] 11400 26500 40400 5710 2860
A. GREINERT, R. FRUZIŃSKA, J. KOSTECKI
37 TECHNOGENIC SOILS OF POLAND
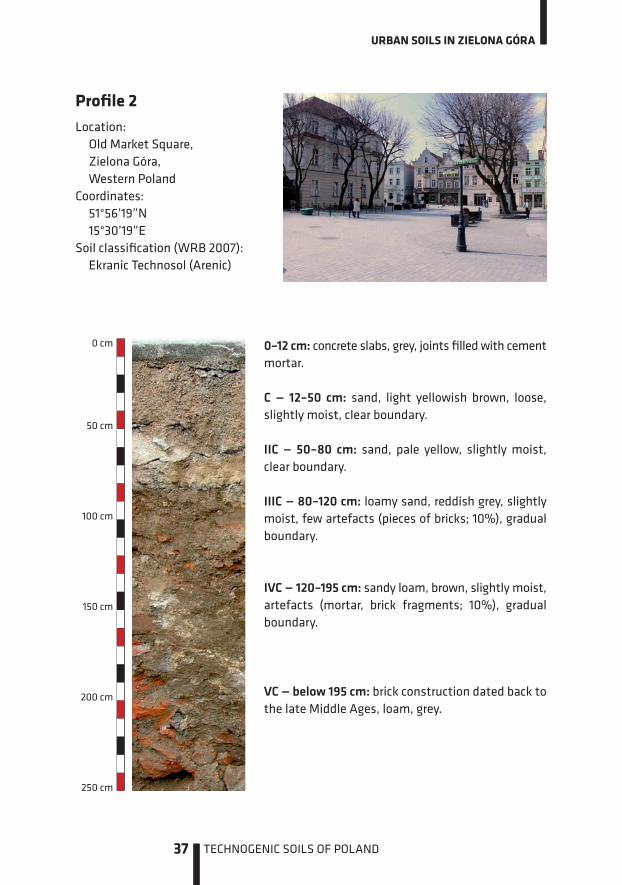
Profile 2
Location: Old Market Square,
Zielona Góra, Western Poland
Coordinates: 51°56’19”N
15°30’19”ESoil classification (WRB 2007): Ekranic Technosol (Arenic)
0–12 cm: concrete slabs, grey, joints filled with cement mortar.
C — 12–50 cm: sand, light yellowish brown, loose, slightly moist, clear boundary.
IIC — 50–80 cm: sand, pale yellow, slightly moist, clear boundary.
IIIC — 80–120 cm: loamy sand, reddish grey, slightly moist, few artefacts (pieces of bricks; 10%), gradual boundary.
IVC — 120–195 cm: sandy loam, brown, slightly moist, artefacts (mortar, brick fragments; 10%), gradual boundary.
VC — below 195 cm: brick construction dated back to the late Middle Ages, loam, grey.
URBAN SOILS IN ZIELONA GÓRA
0 cm
50 cm
100 cm
150 cm
200 cm
250 cm

TECHNOGENIC SOILS OF POLAND 38
Table 2. Selected soil properties – profile 2
HORIZON C IIC IIIC IVC VC
DEPTH [cm] 12–50 50–80 80–120 120–195 >195
PARTICLE SIZE DISTRIBUTION [%]
>2 mm 3 1 8 15 87
2 mm–50 µm 96 98 76 73 51
50–2 µm 4 2 22 17 36
<2 µm 0 0 2 10 13
TEXTURE CLASS (USDA) sand sand loamy
sandsandy loam loam
SOIL MATRIX COLOUR
dry
moist
2.5Y 6/3
2.5 4/3
2.5Y 7/32.5Y 8/12.5 5/4
5YR 5/2
5YR 4/1
7.5YR 5/2
7.5YR 3.5/2
7.5YR 5/1
7.5YR 4/1
BULK DENSITY [g·cm-3] 1.42 1.53 1.66 1.72 —
OC [%] 0.1 0.0 0.3 0.1 0.0
pHin H2O 7.5 7.1 7.2 7.1 6.9
in 1M KCl 7.1 6.8 6.9 6.8 6.7
EC [mS·cm-1] 0.25 0.25 0.24 0.21 0.24
CEC [cmol·kg-1] 5.7 2.6 12.4 15.4 18.1
CaCO3 [%] 2.1 0.6 1.3 4.2 0.9
TOTAL CONTENT OF SELECTED MACROELEMENTS
P [mg·kg-1] 600 200 1100 1500 900
K [mg·kg-1] 2460 2650 3780 4200 4290
Ca [mg·kg-1] 32000 5800 17100 42000 8900
A. GREINERT, R. FRUZIŃSKA, J. KOSTECKI

39 TECHNOGENIC SOILS OF POLAND
Profile 3
Location: Brick Hill; Vineyard Park,
Zielona Góra, Western Poland
Coordinates: 51°56’15”N
15°30’43”ESoil classification (WRB 2007): Hortic Anthrosol Arenic)
A1 — 0–5 cm: humus horizon, sand, dark grey, granular structure, slightly moist, very few artefacts (plastic, municipal wastes, glass; <1%), clear boundary.
A2 — 5–145 cm: humus horizon, sand, grey, granular structure, slightly moist, few artefacts (stones; <1%), sharp boundary.
C — below 145 cm: sand, pale yellow, single grain structure, dry/slightly moist.
URBAN SOILS IN ZIELONA GÓRA
0 cm
50 cm
100 cm
150 cm
200 cm
250 cm

TECHNOGENIC SOILS OF POLAND 40
Table 3. Selected soil properties – profile 3
HORIZON A1 A2 C
DEPTH [cm] 0–5 5–145 >145
PARTICLE SIZE DISTRIBUTION [%]
>2 mm 5 0 0
2 mm–50 µm 95 93 95
50–2 µm 5 7 5
<2 µm 0 0 0
TEXTURE CLASS (USDA) sand sand sand
SOIL MATRIX COLOUR
drymoist
5Y 4/15Y 2.5/1
5Y 5/15Y 3/1
2.5Y 8/32.5Y 6/3
BULK DENSITY [g·cm-3] 1.42 1.51 1.62
OC [%] 5.3 3.3 0.0
Nt [%] 0.38 0.21 —
C:N 14 16 —
pHin H2O 6.5 6.8 6.8
in 1M KCl 6.0 6.3 6.5
EC [mS·cm-1] 0.28 0.24 0.06
CEC [cmol·kg-1] 22.8 20.6 2.0
CaCO3 [%] 0.5 0.3 0.0
TOTAL CONTENT OF SELECTED MACROELEMENTS
P [mg·kg-1] 3200 2600 600
K [mg·kg-1] 10600 8550 4300
Ca [mg·kg-1] 26000 22000 2800
A. GREINERT, R. FRUZIŃSKA, J. KOSTECKI

41 TECHNOGENIC SOILS OF POLAND
Technogenic substrates of urban soils
Technogenic materials present in most urban soils produce lots of pollution, which results from the composition of substrates used for their production and the manufacturing technology (Hiller, Meuser 1998). The content close to general content and potential availability of selected heavy metals from technogenic materials obtained from surface soil layers were analysed in Zielona Góra and nearby settlements. The materials were cleaned of soil without removing traces of lime and cement binding material.
It was found that the analysed materials did not contain large quantities of heavy metals, and they were potentially movable and hence bioavailable (Table 4). This is an important aspect of the discussion about the environmental importance of brick debris in the soils of urban areas. As evidenced by the results of the calcium carbonate content in the analysed materials, there are characteristic changes in the pH of materials, which is an aftermath of not only the construction material properties, but also the amount and the type of binding material present in the brick debris.
Table 4. Reaction (pH values in H2O), electrical conductivity (EC) and 0.1M HCl extracted heavy metal content in selected technogenic materials deposited on the soil surface
Material pH in H2O
EC CaCO3 Fe Cd Pb Zn Cu Ni
[mS·cm-1] [%] [mg·kg-1]
neat plaster 11.0 0.63 2.22 88.0 0.18 2.8 25.9 3.7 6.0
aerated concrete 8.3 0.85 2.17 n.d. 0.17 1.7 2.4 1.0 5.0
roof tile 8.1 2.27 2.27 306 0.16 n.d. 33.6 8.3 2.0
clinker brick (factory chimney) 7.8 1.14 2.26 3750 0.15 n.d. 41.1 16.7 1.3
asbestos-cement roof plank 11.8 4.49 2.18 n.d. 0.18 4.6 3.2 5.7 4.3
slag I 8.7 1.30 2.25 4150 0.12 18.5 92.0 35.8 16.3
slag II 7.5 0.70 2.26 5410 0.13 21.5 125 56.7 17.8
slag III 9.9 0.80 2.26 4960 0.13 n.d. 11.7 8.0 8.0
Main characteristics of urban soils
Mechanical transformations of the soil profile are often found in the area of Zielona Góra and its immediate vicinity. In most cases, they are caused by: — vertical and horizontal mixing of soil horizons and layers;
URBAN SOILS IN ZIELONA GÓRA

TECHNOGENIC SOILS OF POLAND 42
— admixing of foreign materials to the soil, which are mainly municipal and building waste materials; they are often deposited in layers, which considerably changes the conditions for the transport of water and other components in the soil (Fig. 2–3);
— truncation of the soil profile, mainly by removing the humus horizon, in shallow soils only the bed-rock may remain, so basically no soil is left;
— sealing of the profile with solid materials (bituminous, concrete surfaces, cobble-stone or prefabricated cobbles on the cement bed) or loose (organic or mineral) ma-terials;
— compacting the soil layers with heavy construction machines.
Fig. 2–3. Accidental deposition of di�erent technogenic materials induces the formation of unusual soil layers and horizons
Mechanical transformations of soil profiles are often accompanied by considerable changes in physical properties. Excessive density of a large part of soil layers and levels is common (profiles 1–2). Surface layers are loose due to mechanical cultivation and ferti-lisation with organic matter, but layers situated deeper in soil profiles are often dense and tight (42.5% of the analysed soil profiles in Zielona Góra). This is a result of using heavy construction machines at di�erent stages of the development of urban areas. Loosening the topsoil layer facilitates the rooting of grasses and herbs, but is not su�cient for plants with a deeper root system. Di�erent forms of soil have di�erent water permeability, which means that migrating substances, including nutrients and pollutants, are either retained or infiltrated into deeper soil horizons. This generates problems in plant feeding
A. GREINERT, R. FRUZIŃSKA, J. KOSTECKI

43 TECHNOGENIC SOILS OF POLAND
and reduces the e�ciency of reaction to intoxication. A comparison between the compactness of deeper layers in Zielona Góra soil profiles and loosening of the surface layers results in a picture of random land development, focused on a short-term aesthetic e�ect (Fig. 4–5).
Fig. 4–5. Soil compactness of surface layers, 0–20 cm (from the left) and deeper layers (from the right) in soil profiles; Greinert (2003)
The sand fraction dominates in the particle-size composition of Zielona Góra soils. The average content of isolated fractions from all of the 105 investigated profiles should be presented as follows:
• skeleton 23.5%• particles < 2 mm 76.5%, incl.: – 2 mm – 50 µm 81.2% – 50–2 µm 17.8% – < 2 µm 1.0%The skeleton fraction was absent in only 6 profiles. The following texture classes
were identified: sand, silt loam, loamy sand, sandy loam (layers in 3 profiles) and loam (layers in 3 profiles). This situation is associated with the genesis of bedrock material and in some cases with the brought-in construction material. Park et al. (2010) observed changes in the particle size distribution correlated with the age of a town. Di�erent relationships have been observed in Zielona Góra. The time when a particular area was incorporated into the town cannot be explicitly related to the above characteristic.
The presence of considerable quantities of brick debris, slag and municipal wastes is a typical morphological feature of soils observed in urban areas, including Zielona Góra. With regard to the development of urban soils, a considerable amount of their additional components is their bedrock.
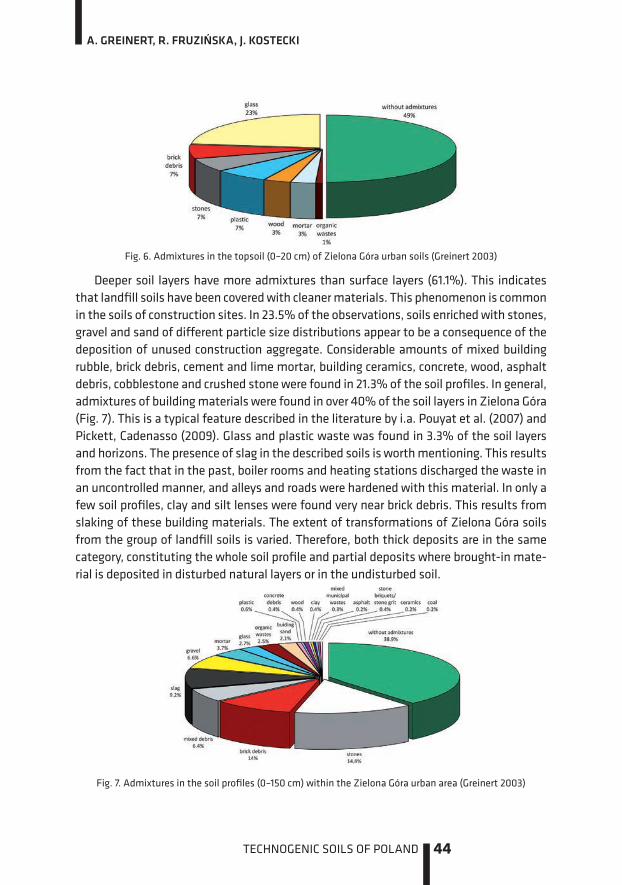
As evidenced by the analysis of additional components present in the topsoil (0–20 cm) in Zielona Góra, as many as 25% of the soils contain considerable amounts of glass as a result of insu�ciently pure municipal waste compost used as a fertilising substance, and uncontrolled deposition of glass. The latter is also the cause of the presence of brick, wood, plastic, lime and cement mortar debris, and undecomposed organic wastes (Fig. 6).
URBAN SOILS IN ZIELONA GÓRA
TECHNOGENIC SOILS OF POLAND 44
Fig. 6. Admixtures in the topsoil (0–20 cm) of Zielona Góra urban soils (Greinert 2003)
Deeper soil layers have more admixtures than surface layers (61.1%). This indicates that landfill soils have been covered with cleaner materials. This phenomenon is common in the soils of construction sites. In 23.5% of the observations, soils enriched with stones, gravel and sand of di�erent particle size distributions appear to be a consequence of the deposition of unused construction aggregate. Considerable amounts of mixed building rubble, brick debris, cement and lime mortar, building ceramics, concrete, wood, asphalt debris, cobblestone and crushed stone were found in 21.3% of the soil profiles. In general, admixtures of building materials were found in over 40% of the soil layers in Zielona Góra (Fig. 7). This is a typical feature described in the literature by i.a. Pouyat et al. (2007) and Pickett, Cadenasso (2009). Glass and plastic waste was found in 3.3% of the soil layers and horizons. The presence of slag in the described soils is worth mentioning. This results from the fact that in the past, boiler rooms and heating stations discharged the waste in an uncontrolled manner, and alleys and roads were hardened with this material. In only a few soil profiles, clay and silt lenses were found very near brick debris. This results from slaking of these building materials. The extent of transformations of Zielona Góra soils from the group of landfill soils is varied. Therefore, both thick deposits are in the same category, constituting the whole soil profile and partial deposits where brought-in mate-rial is deposited in disturbed natural layers or in the undisturbed soil.
Fig. 7. Admixtures in the soil profiles (0–150 cm) within the Zielona Góra urban area (Greinert 2003)
A. GREINERT, R. FRUZIŃSKA, J. KOSTECKI

45 TECHNOGENIC SOILS OF POLAND
Profiles of landfill soils are most often characterised by a sharp transition between artificially created layers (43.9%). For this reason, technogenic impact is usually easy to diagnose in the case of urban soils. Clear transition between horizons was found in 38.5% of the observed soil profiles, gradual transition in 16%, and unclear transition in 1.6%.
The functionality of urban soils is mostly conditioned by their sorption properties. In areas of garden allotments, this aspect is additionally connected with the problem of food production. The sorption capacity largely depends on the content of organic mat-ter and the mineral colloids. Admixtures of skeletal parts, such e.g. building material debris, reduce the cation exchange capacity (CEC), which has been confirmed by the research conducted by Hiller and Meuser (1998) on the soils of the Ruhr district. Kahle and Coburger (1996) drew attention to the e�ect of land use on the sorption capacity of soils. This is related to cultivation or lack thereof, and the depth of mechanical transfor-mation of natural soil. The highest values of CEC were found in the soil of areas with detached houses, which is related to technogenic enrichment of soils with silts, organic matter and clay materials. These techniques are used to achieve good growth of orna-mental plants, which require good habitat conditions. A higher capacity of surface lay-ers is typical for most urban soils, with the exception of truncated and mixed soils. In layers situated deeper in the soil profile, the sorption capacity often depends on the covered organic layers and layers of wastes consisting of porous materials (Table 5).
Table 5. Sorptive properties of selected soils within the Zielona Góra urban area (Greinert 2005)
Soil descriptionHA TEB CEC BS
[cmol·kg-1 ] [%]
initial soils 0.0–2.1 2.3–24.6 3.6–24.6 65–100
rigosols 0.5–0.9 3.6–20.7 4.1–21.6 76–96
treposols* 0.0–4.4 1.9–24.4 2.8–25.2 70–100
hortisols 0.5–1.7 1.6–20.7 2.1–21.4 76–96
landfill soils:
from bedrock materials without carbonates 0.1–3.3 1.1–24.1 1.6–25.5 32–99
from mixed materials with carbonates 0.2–1.6 2.0–24.7 2.3–26.3 78–99
from mixed materials without carbonates 0.1–11.9 1.4–17.5 1.9–21.8 41–100
from technogenic materials with carbonates 0.0–2.2 0.7–24.6 0.9–25.0 73–100
from brought-in materials without carbonates 0.0–7.2 1.6–24.1 2.4–30.9 63–100
ekranosols 0.1–0.7 2.2–17.0 2.4–17.3 82–99
proper ferruginous soils 1.7–5.1 0.0–5.4 1.9–8.9 0–61
proper podzol soils 0.5–3.3 0.7–1.6 1.1–4.9 32–56
* – according to DBG classification (1998), cited by Greinert (2003)
URBAN SOILS IN ZIELONA GÓRA

TECHNOGENIC SOILS OF POLAND 46
One of the most common di�erences between technogenic soils and soils of natural origin is their pH. This is a highly important property from the ecological perspective. The pH level depends on the type of species living in the soil or on the soil surface. During the research on soils in Zielona Góra, fluctuations in pH values were observed. The analysis of surface layers of the studied soils showed that merely 21.9% of the layers were characterised by neutral reaction and 9.4% – by alkaline reaction. In the case of deeper layers, often enriched with alkaline materials (construction site wastes), it was 24.4% and 50.7%, respectively (Table 6). Although alkalization of urban soils causes many problems related to introduction of plants which require acid soil, it has also a number of advantages, which has been confirmed by the research on soil degradation factors conducted by Siuta, Kucharska (1996). It increases the immunity of soils to acidification caused by ‘acid rain’ and the possibility of stabilising several pollutants (especially lead), which are, in this case, less movable in the soil and are not absorbed by plants.
Table 6. The typical pH values of selected soil groups within the Zielona Góra urban area (Greinert 2005)
Soil description pH in 0.01M CaCl2
initial soils 6.3–7.6(suburbs: 3.9–4.5)
rigosols 6.0–6.9
treposols* 4.7–7.5
hortisols 6.0–7.7
landfill soil: 3.9–7.3
from native materials without carbonates 3.9–7.4
from mixed materials with carbonates 6.4–7.8
from mixed materials without carbonates 5.2–7.3
from technogenic materials with carbonates 6.6–8.2
from technogenic materials without carbonates 5.4–7.3
ekranosols 6.9–7.4
proper ferruginous soils 3.5–4.2
proper podzol soils 4.1–4.9
* – acc. to DBG classification (1998), cited by Greinert (2003)
Large amounts of rock-salt (NaCl) and smaller quantities of other salts: CaCl2, MgCl2, Na2SO4, are used every winter to prevent slipperiness on the streets and pavements, or to remove ice from their surfaces. This causes an increase in the salinity level of the
A. GREINERT, R. FRUZIŃSKA, J. KOSTECKI

47 TECHNOGENIC SOILS OF POLAND
roadside soils. With sandy texture and precipitation exceeding evaporation, salts dis-solved in the water are not retained in the soil for a long time, and typical values of electrical conductivity range from 0.03 to 0.39 mS·cm-1 in the topsoil to 2.50 mS·cm-1 in the subsoil (Greinert 2003). According to the research conducted by Hiller and Meuser (1998), most technogenic materials in urban soils have EC below 1.0 mS·cm-1. The au-thors associated high EC values in soils containing debris with the introduction of gyp-sum. EC in industrial dusts ranged from 0.7 to 4.0 mS·cm-1, and in dusts from hard coal burning − from 0.9 to 6.0 mS·cm-1, and brown coal burning − from 2.4 to 3.1 mS·cm-1. Dusts from industrial waste burning had high EC values – from 10.5 to 20.2 mS·cm-1. It is necessary, however, to notice that soils in the vicinity of Zielona Góra have much lower EC values – within 0.10–0.15 mS·cm-1 (Greinert 2003). According to Jackson’s salinity scale (Jackson 1958), soils from the Zielona Góra urban area can be classify as non-saline. In such conditions, negative e�ects should not be observed, even for ornamental plants.
Urban soils are typically enriched with heavy metals. Soils in Zielona Góra do not usually contain high concentrations of elements included in this group. Most of them are present in the soil in the form of salts that can be relatively easily dissolved in water, which means quick migration into deeper layers when the soil is permeable. For this reason, topsoil is not contaminated, despite surface deposition of industrial and tra�c pollution. Moreover, the material deposited on the surface of soil profiles is seldom retained for a long time. Rebuilding of the internal structure of the town, both in terms of buildings and streets, results in the excavation of materials which used to remain deeper and introduction of new material from outside the town. This causes a variable distribution of heavy metals in the soils of Zielona Góra. Their content (in dry mass) is as follows: Cd – 0.2–2.7 mg·kg-1 (av. 0.4), Cu – 4.6–192 mg·kg-1 (av. 24.8), Ni – 1.2–46.8 mg·kg-1 (av. 11.1), Pb – 3–241 mg·kg-1 (av. 39.5) and Zn – 9–510 mg·kg-1 (av. 80) in a subtotal form. Higher contents of lead and zinc were found in surface samples, average values of which were 52 and 111 mg·kg-1, respectively. According to the Regulation of the Minister of the Environment (2002), the concentration of heavy metals was higher than the threshold limits defined for soils covering the urban areas only in a few samples – for Cu (threshold values for sandy soils and 0–30 cm layer: 150 mg·kg-1, below 30 cm: 100 mg·kg-1), for Zn (respectively: 300 mg·kg-1 for topsoil and 350 mg·kg-1 for subsoil) and for Pb (100 mg·kg-1 for topsoil and subsoil). The highest Pb and Zn values were recorded in the roadside areas. The very di�erent situation was connected with the Cu spatial distribution. The highest values were found in the former vineyard areas, where copper compounds were used for fungal disease control. The Bordeaux Mixture (a mixture of copper(II) sulphate (CuSO4) and slaked lime (Ca(OH)2) has been known in vineyards since 1882 as a fungicide to control infestations of downy mildew, powdery mildew and other fungi.
URBAN SOILS IN ZIELONA GÓRA

TECHNOGENIC SOILS OF POLAND 48
Functional and ecological problems
The main features that influence the assessment of urban soil conditions are as follows: the soil profile morphology, physical properties, salinity, pH, the content of heavy metals and other toxic substances. Each of these features is assessed individually depending on the land use type and indications of environmental risk. In most areas of Zielona Góra, the occurrence of conflicts related to soil profile structure defects and soil properties is not clearly visible. This usually results from the frequent replacement of the surface soil layer with artificial garden soil, implemented at the end of the investment process, which often covers the rock layers of technogenic origin – brick debris layers. They make it di�cult for trees and bushes to take roots. Such layers also disturb the circulation of water and min-erals. The fashion which has existed for a number of years and consisted in planting of acidophilic plants in urban areas, including coniferous trees and bushes, heathers (Callu-na sp. and Erica sp.), azaleas and rhododendron, has resulted in additional important changes in physical and chemical properties of surface levels. This causes the formation of two completely di�erent parts of soil, usually separated at a depth of 20–30 cm.
Lack of water is characteristic of urban areas, both in the soil and in the form of moisture in the atmosphere. Plants obtain water mainly through the roots from the soil. Water percolating quickly through the soil consisting of brick debris (into the soil below the rhizosphere) is unavailable to plants. This e�ect is additionally enhanced by construction of buildings and development of infrastructure. Another factor is the sealing of areas of modern cities and draining water from such soils through the rain drainage system (Sieghardt et al. 2005). As a result, almost 50% of the rainfall in the urban environment is biologically ine�ective water.
One of the basic problems related to chemical properties of urban soils in the area of Zielona Góra, which is divided by numerous streets and pavements, is the salinization of roadside soils. The salt used in winter for street maintenance prevents the absorption of su�cient amounts of water, which causes the withering of plants, leaf necrosis, premature shedding of leaves, and in extreme cases, the death of plants. However, the duration of salinization varies in urban areas. The worst situation is observed in median dividers, where the soil material is very dense. An increase in salinity is also a result of decomposition of building material and communal wastes deposited in the soil.
Soils in Zielona Góra do not usually contain large quantities of heavy metals. This is partly a result of their high water permeability, and partly low industrialisation. However, the analysis of soil properties in Zielona Góra shows high solubility, which indicates high bioavailability of heavy metals. This phenomenon is interesting in the context of high soil pH. At this point, it is also necessary to remember the disturbances in the structure and low sorption properties of the researched soils. Similar results were reported by Madrid et al. (2008) in the description of high availability and bioavailability of heavy metals in soil samples taken in Torino and Sevilla. Recently, the possible
A. GREINERT, R. FRUZIŃSKA, J. KOSTECKI

49 TECHNOGENIC SOILS OF POLAND
influence of organic fertilisation of soils in urban areas on the bioavailability of heavy metals has also been extensively described (Murray et al. 2011). This may particularly apply to organic matter with low pH used for cultivation of coniferous ornamental plants, but a similar influence of composites in gardens is also described. Murray et al. (2011) described an increase in the bioavailability of heavy metals after the use of compost in the sequence: Cd > Zn > Cu > Pb. Madrid et al. (2008) reported the availability of selected heavy metals in soils in the areas of Torino (T) and Sevilla (S) as follows: Cr 0.6±0.4 (T), 13.1±1.9(S), Cu 50.2±16.5 (T), 16.6±2.6 (S), Ni 7.6±3.1 (T), 2.4±0.5 (S), Pb 47.2±10.2, 18.6±2.7 (S), Zn 19.8±5.9 (T), 54.8±20.3 (S).
Potential availability of heavy metals (HM) was determined in surface layers of soil profiles in Zielona Góra, defined as the ratio HM-0.1M HCl/HM-aqua regia: 29.5% Cd, 37.2% Cu, 20.9% Ni, 61.8% Pb and 33.3% Zn. In deeper layers and levels, the ratio has the following values: 27.7% Cd, 39.2% Cu, 20.3% Ni, 51.6% Pb and 27.4% Zn. The following regularities in the content and solubility of heavy metals can be applied to all soils researched in Zielona Góra:
• content sequence: Zn > Pb > Cu > Ni > Cd;• solubility sequence in topsoil: Pb > Cu > Zn > Cd > Ni; • solubility sequence in subsoil: Pb > Cu > Cd > Zn > Ni.Indications of the so-called ‘hot points’ location are important deviations from the
trends described in the relevant literature, which is important in terms of urban soil monitoring. In the case of heavy metals, they are always searched for in the emission routes of industrial plants and roads with heavy tra�c. A di�erent situation has been observed in the case of roads with the heaviest tra�c in Zielona Góra. The concentra-tion of heavy metals in roadside soils is lower compared to other locations. This results from the short exposure time of soils located near the newly built roads. During the construction, part of the material constituting the soils under discussion was brought from clean areas outside the town. The primary soils were also deeply mixed, which caused the e�ect of heavy metals dilution in the soil mass.
However, hot points in the industrial and post-industrial areas of the town are dif-ferent in their character; they occur with high density, i.e. close to each other. Due to intensive urbanization of Zielona Góra in the second half of the 20th century, industrial areas previously located in the suburbs or outside the town were included in the urban area. As evidenced by the research performed in the areas of metallurgical and textile industry, power stations, as well as di�erent warehouses and transhipment facilities, there are large quantities of heavy metals and oil derivatives in their soils, down to a considerable depth (Fruzińska 2011, 2012; Greinert et al. 2012).
URBAN SOILS IN ZIELONA GÓRA

TECHNOGENIC SOILS OF POLAND 50
Classification and cartography of urban soils
Identification of soils and their description, for monitoring or other scientific and practical purposes, requires certain simplification. In this case, classification and mapping of soils in urban areas are the basic requirements of soil science. In the world reference literature, there are di�erent concepts of soil classification in urban areas. The main di�erences re-late to the inclusion of mechanically, highly transformed soils in Regosols, Anthrosols or Technosols (IUSS 2007). Soils in Poland are o�cially classified according to the Polish Soil Classification, the 5th edition (Commission V on Genesis, Classification and Cartography of Soils PSSS 2011), which divides the anthropogenic soils (Order 11) into four types and 11 subtypes, and all of them are represented in the urban area of Zielona Góra.
Systematics is not an easy issue in soil science, as there are di�erent criteria in di�erent periods of time for defining and assessing particular systematic units. This is closely related to a di�erent approach to soil and its functions, i.e. as one of the components of the ecosystem. Authors of the latest scientific articles often argue that sharp divisions in the classification of soils are incorrect. It should be possible to reflect transitional features of soil profiles and to include one particular soil into more than one unit (Odgers et al. 2011). The problem with classification of soils is even more complicated in the case of urban areas because of their internal complexity, a di�erent scale of transformations and the general complexity of di�erent factors: natural, technogenic, constructional and social (Pickett, Cadenasso 2009). In most cases, there are major di�erences in the structure of soils with anthropogenic, technogenic and natural genesis. Soils of anthropogenic origin have both pedogenetic horizons and lithogenic layers, or only lithogenic layers. For this reason, it is di�cult to adopt a general picture of pedogenetic soil horizons as one of the basics of modern soil classification. In the case of urban soils, modern soil classification must be based on the study of both soil horizons as layers, and technogenesis as pedogenesis (Da-Gang et al. 2008).
Based on the criteria defined by Burghardt (1994), Greinert (2003) classified the soils in the area of Zielona Góra (Fig. 8). This classification includes di�erent forms of anthropogenic and technogenic impact, as well as the genesis and further development of particular soils. Thus, it meets the criteria of the genetic soil classification. According to the principles of the world soil science, this is the primary condition of good classification (Hiller, Meuser 1998; Blume, Runge 1978; Meuser 1996).
This classification was used in the following years as a basis for discussion on the diversity of urban soils. Consequently, the new unit of Edifisols was proposed (Charzyński et al. 2011b) and the new subunit of Carbonate Ekranosols in the type of Ekranosols (Charzyński et al. 2011a).
Soil mapping in urban areas involves specifications of criteria for determination of cat-egories for every piece of data plotted on a map (Blume et al. 1989). Valuable informa-tion, resulting from the contents of soil maps of urban areas, includes:
A. GREINERT, R. FRUZIŃSKA, J. KOSTECKI

51 TECHNOGENIC SOILS OF POLAND
— land use; — resistance of soils to di�erent forms of degradation; — risk of plant pollutions; — risk of groundwater pollution; — requirements for soil reclamation.In order to achieve the abovementioned objectives, the concept of urban soil car-
tography is based on two initial categories – soil systematics and land use. As a result of this approach, di�erent data are associated with basic soil characteristics and planners’ functional concepts. This solution also allows the compatibility between studies of urban soils and soil maps of non-urbanised areas in Poland.
Fig. 8. The concept of urban soil classification (Greinert 2003)
A number of maps of urban areas are large scale maps, which negatively a�ects their precision. The main problem is to find such an approach to soil research (the basis of soil cartography) as to avoid the excessive complexity of the spatial situation, on the one hand, and to present the true and full information to maps’ end-users, e.g. land-scape architects, on the other. In the context of these solutions, it is obvious that we are still at the early stage of work on urban soil maps.
URBAN SOILS IN ZIELONA GÓRA

TECHNOGENIC SOILS OF POLAND 52
Summary
Areas covered with landfill materials are systematically expanding in Zielona Góra, which is caused by quite intensive construction activities. At the same time, areas previously covered with soils with an unchanged or slightly changed profile, mainly in terms of prop-erties and morphological features of surface horizons, are shrinking. There is also a sys-tematic development of construction forms in the area surrounding the town, located within the administrative commune of Zielona Góra. The lands in this area are mostly devoid of soil cover as a consequence of deep mixing of autochthonous materials, the removal of surface layers and transport of materials in the process of investment area levelling.
The course of changes in the soil usually involves the removal of original, useless and barren ground, which is replaced by new material containing humus, brought from other locations (most often, material from topsoil from other construction sites). Special subsoil mixtures, made mainly of composites, peat and bark, are often brought to form a new soil surface layer. The next step is to introduce a barrier for unwanted plants – weeds, mainly by using a non-woven crop cover and bark litter, or by planting a lawn.
The whole area is watered and fertilised, which will lead to changes in the chemical properties of the soil. Unfortunately, in areas of intensive and fast urbanisation, wastes are still managed incorrectly, which results in the presence of brick debris and other waste materials in the soil.
References
1. Blume H.-P. 1989. Classification of soils in urban agglomerations. Catena 16: 269–275.
2. Blume H.-P., Burghardt W., Cordsen E., Finnern H., Fried G., Grenzius R., Kneib W.D., Kues J., Pluquet E., Schraps W.G., Siem H.-K. 1989. Empfehlungen des Arbeitkreises Stadtboden der DBG für die bodenkundliche Kartieranleitung urban, gewerblich und industriell überformter Flächen (Stadtboden). UBA Texte 18. Umweltbundesamt Berlin (in German).
3. Blume H.P., Runge M. 1978. Genese und Ökologie innerstädtischer Böden aus Bauschutt. Z. Pflanzenernähr. Bodenkd. 141: 727–740.
4. Burghardt W. 1994. Soils in urban and industrial environments. Z. Pflanzenernähr. Bodenk. 157: 250–214.
5. Burghardt W. 1995. Classification concept of substrates and soils from urban and industrial sites. [In:] W.J. van Den Brink, R. Bosmanandf. Arendt (Eds.). Contaminated Soil ‘95: 187–188.
6. Burghardt W., 1996. Urbaner Bodenschutz. Springer Verlag, Berlin-Heidelberg (in German).
7. Charzyński P., Bednarek R., Błaszkiewicz J. 2011a. Morphology and properties of Ekranic Techno-sols in Toruń and Cluj-Napoca. Rocz. Glebozn. 52(2): 48–53 (in Polish with English abstract).
A. GREINERT, R. FRUZIŃSKA, J. KOSTECKI

53 TECHNOGENIC SOILS OF POLAND
8. Charzyński P., Bednarek R., Chmurzyński M. 2011b. Properties of soils forming on the buildings in Toruń city. [In:] M. Jankowski (Ed.). Selected problems of genesis, systematics, management and soil protection in the Kuyavia and Pomerania region. PTSH, PTG, Toruń: 11–28.
9. Commission V on Genesis, Classification and Cartography of Soils PSSS. 2011. Polish Soil Classification (Systematyka Gleb Polski), 5th edition. Rocz. Glebozn. 62(3): 1–193 (in Polish with English abstract).
10. Czarnowska K. 1995. Soils and plants in the urban environment. Zesz. Probl. Post. Nauk Roln. 418 (1): 111–116 (in Polish with English abstract).
11. Da-Gang Y., Gan-Lin Z., Zi-Tong G. 2008. Numerical Approaches to Identification of Character-istic Soil layers in an urban environment. Pedosphere 18(3): 335–343.
12. Dancewicz A., 2010. Climate and weather. [In:] Stan środowiska w Zielonej Górze w latach 2005–2010. Biblioteka Monitoringu Środowiska, Zielona Góra: 13–24 (in Polish).
13. Fruzińska R. 2011. Accumulation of iron in the soil-plant system in a metal industry area. Civ. Environ. Eng. Rep. 7: 59–68.
14. Fruzińska R., 2012. Aluminium, manganese and iron in the soils of metal industry area. [In:] J. Skowronek (Ed.) Innowacyjne rozwiązania rewitalizacji terenów zdegradowanych 2011. Katowice: Instytut Ekologii Terenów Uprzemysłowionych: 167–175.
15. Gontaszewska A., Kraiński A. 2007. Geology of the northern part of the Zielona Gora Moraine (near the Przylep village). Zesz. Nauk. UZ Ser. Inż. Środ., Zielona Góra 134(14): 51–60 (in Polish with English Summary).
16. Greinert A. 2003. Studies of soils in the Zielona Góra urban area. Oficyna Wydawnicza Uni-wersytetu Zielonogórskiego, Zielona Góra (in Polish).
17. Greinert A. 2005. Chapter 9. Urban soils and grounds. [In:] Stan środowiska w Zielonej Górze w 2004 roku. Biblioteka Monitoringu Środowiska. WIOŚ w Zielonej Górze, UM w Zielonej Górze, Zielona Góra: 105–116 (in Polish).
18. Greinert A., Kostecki J., Fruzińska R., Bednarz K. 2012. Mobility and phytoavailability of lead in urban soils. Proceedings of ECOpole 6(1): 105–111.
19. Hiller D.A., Meuser H. 1998. Urbane Böden. Springer Verlag (in German).
20. ISO 11466. 1995. Soil quality – Extraction of trace elements soluble in aqua regia using open hot plate digestion technique.
21. IUSS Working Group WRB. 2007. World References Base for Soil Resources 2006. Update 2007, World Soil Resources Reports, 103, FAO, Rome.
22. Jackson M.L. 1958. Soil chemical analysis. Constable Ltd., London.
23. Kabata-Pendias A., Pendias H. 1992. Trace elements in soils and plants. 2nd Ed. CRC Press Inc. Boca Raton, Florida.
24. Kahle P., Coburger E. 1996. Eigenschaften von Boden unterschiedlicher Nutzung im Stadt-gebiet von Rostock. Z. Pflanzenemahr. Bodenk. 159: 637–642 (in German).
25. Kretschmer H., Kahle P., Belau L., Coburger E. 1993. Kennzeichnung von Teerdeposolen in Stadtgebiet von Rostock. Mitteilungen der DBG 72: 981–984 (in German).
URBAN SOILS IN ZIELONA GÓRA

TECHNOGENIC SOILS OF POLAND 54
26. Madrid F., Biasioli M., Ajmone-Marsan F. 2008. Availability and bioaccessibility of metals in fine particles of some urban soils. Arch. Environ. Contam. Toxicol. 55: 21–32.
27. Meuser H. 1996. Schadsto�potential technogener Substrate in Böden urban-industrieller Verdichtungsräume. Z. Pflanzenernahr. Bodenk. 159: 621–628 (in German).
28. Murray H., Pinchin T.A., Macfie S.M. 2011. Compost application a�ects metal uptake in plants grown in urban garden soils and potential human health risk. J. Soil Sediment. 11: 815–829.
29. Odgers N.P., McBratney A.B., Minasny B. 2011. Bottom-up digital soil mapping. I. Soil layer classes. Geoderma 163: 38–44.
30. Park S.J., Cheng Z., Yang H., Morris E.E., Sutherland M., McSpadden Gardener B.B., Parwinder S. Grewal, 2010. Di�erences in soil chemical properties with distance to roads and age of development in urban areas. Urban Ecosyst. 13: 483–497.
31. Pickett S.T.A., Cadenasso M.L. 2009. Altered resources, disturbance, and heterogeneity: A framework for comparing urban and non-urban soils. Urban Ecosyst. 12: 23–44.
32. Podgajna U. 2010. Characteristics and trends of the city development. [in:] Stan środowiska w Zielonej Górze w latach 2005–2010. Biblioteka Monitoringu Środowiska, Zielona Góra: 7–12 (in Polish).
33. Pouyat R.V., Yesilonis I.D., Golubiewski N.E. 2009. A comparison of soil organic carbon stocks between residential turf grass and native soil. Urban Ecosyst. 12: 45–62.
34. Pouyat R.V., Yesilonis I.D., Russell-Anelli J., Neerchal N.K. 2007. Soil chemical and physical proper-ties that di�erentiate urban land-use and cover types. Soil Sci. Soc. Am. J. 71: 1010–1019.
35. Regulation of the Minister of the Environment dated September 9, 2002 on soil and land quality standards. (Dz. U. 02. 165. 1359, October 4, 2002).
36. Shane D.G., 2005. Recombinant urbanism: conceptual modelling in architecture, urban design, and city theory. John Wiley & Sons, Hoboken.
37. Sieghardt M., Mursch-Radlgruber E., Paoletti E., Couenberg E., Dimitrakopoulus A., Rego F., Hatzistathis A., Randrup T.B. 2005. Chapter 11. The abiotic urban environment: impact of urban growing conditions on urban vegetation [In:] C.C. Konijnendijk, K. Nilsson, T.B. Randrup, J. Schipperijn (Eds.) Urban forests and trees. Springer, Berlin-Heidelberg, Part III: 281–323.
38. Siuta J., Kucharska A. 1996. Multifactorial environmental degradation. Biblioteka Monitoringu Środowiska. PIOŚ, IOŚ, Warsaw (in Polish).
39. Tiller K.G. 1992. Urban soil contamination in Australia. Aust. J. Soil Res. 30: 937–957.
A. GREINERT, R. FRUZIŃSKA, J. KOSTECKI

55 TECHNOGENIC SOILS OF POLAND
Introduction
Green areas are an integral component of urban landscape. Green spaces within cities and towns are created in areas deliberately excluded from construction in order to plant vegetation and create urban greenery units, or they are put aside for housing or industrial development in a distant future. Their location, dimensions and shape are included in the spatial development plans for the urban areas. According to Polish legislation, urban green areas such as parks, lawns and allotments play a recreational, health and aesthetic role. Green areas could be divided into the following groups:
— small and medium, up to 2 ha: backyard lawns, lawns of residential districts consisting of large blocks of flats, children’s playgrounds, green squares and flowerbeds, roadside greenbelts and isolated plantings (especially trees);
— large, over 2 ha: parks, sports and recreation areas, cemeteries, arable lands, allot-ments, hospitals, monastery gardens and the like, educational gardens (zoological, botanical, arboretums) and communal forests.
Vegetation areas placed within the city boundaries play a very important role in functioning of urban ecosystems. Greinert (2000) distinguishes the following functions (among others): recreational, climatic (regeneration of the atmosphere), reserves of genes, separation of areas with di�erent functions (residential, services, industrial, tra�c and others), aesthetics (flowerbeds, ornamental lawns, hedges), educational resources for the natural sciences.
Lawns of di�erent size are the most common type of greenery in Toruń and Bydgoszcz, and other Polish cities and towns.
LAWN SOILS OF TORUŃ AND BYDGOSZCZ
PRZEMYSŁAW CHARZYŃSKI RENATA BEDNAREK SZYMON RÓŻAŃSKI ŁUKASZ MENDYK BARTOSZ MORAWSKI
3

TECHNOGENIC SOILS OF POLAND 56
Study area and soil profile documentation
Toruń is situated on flat river terraces, which are the most important element of the relief, together with small groups of dunes. During the expansion of the city, the dunes have been significantly transformed or destroyed by constructions (Niewiarowski, Weckwerth 2006). The largest areas in Toruń are represented by flat lands, which have developed as a result of filling of primary or secondary depressions and flattening of natural convex forms (e.g. dunes). According to Fedorowicz (1993), the thickness of downtown embankments ranges from 2.5 to 4.0 m, or even up to 7–8 m in places of medieval moats. Outside the City Centre, the embankment thickness is relatively smaller and ranges from 1.0 to 2.5 m.
Bydgoszcz is located in the north-western part of the Toruń Basin and in the mouth section of the Brda River Valley. In the north, the city is surrounded by till plains devel-oped during the Weichselian glaciation (Kondracki 2000; Kozłowska, Kozłowski 1990). The central part of the city lies on the river terraces numbered by Galon (1961) from V to VIII. The surface of these terraces is covered by sediments of various grain sizes and ages, like Pliocene clays and silts, Pleistocene tills, sands and gravels (Kozłowska, Kozłowski 1990).
This chapter presents characteristics of eight soil profiles, representative of the lawn soil in Toruń and Bydgoszcz. The location of the study sites was presented in Figure 1. Pedons from Toruń were situated on the right bank of the Vistula River, near the city center. Three pedons from Bydgoszcz came from both banks of the Brda River, also in the city center, and one from the Bydgoszcz Canal Park, 3 km west. Analysis of soil samples collected from horizons and layers was performed according to international standards (van Reeuwijk 2006). In addition, the following parameters were determined:
— total phosphorus (Pt) by Bleck’s method, modified by Gebhardt (1982),— the content of heavy metals dissolved in 2M HNO3 (Fe, Mn, Zn, Pb, Cd, Cu, Cr, Ni,
Co) by atomic absorbance spectroscopy (AAS) after Desaules et al. 2001, the total content of Hg in solid phase on an AMA analyzer, and magnetic susceptibility (ĸ) determined at the Institute of Environmental Engineering of the Polish Academy of Sciences in Zabrze,
— fractional composition of humus by the method of Kononova and Belchikova (Kononova 1966).
Description of morphology of each profile can be found on next pages. Results of the analyses were presented in Tables 1–10. The studied soils were classified according to World Reference Base for Soil Resources (IUSS Working Group WRB 2007).
P. CHARZYŃSKI, R. BEDNAREK, S. RÓŻAŃSKI, Ł. MENDYK, B. MORAWSKI

57 TECHNOGENIC SOILS OF POLAND
LAWN SOILS OF TORUŃ AND BYDGOSZCZ
Fig.
1. L
ocat
ion
of s
oil p
rofi
les
in B
ydgo
szcz
and
Tor
uń U
rban
Are
as

TECHNOGENIC SOILS OF POLAND 58
P. CHARZYŃSKI, R. BEDNAREK, S. RÓŻAŃSKI, Ł. MENDYK, B. MORAWSKI
Profile 1
Location: Teatralny Sq.,
Toruń, Northern Poland
Coordinates: 53°00.522’ N
18°35.920’ ESoil classification (WRB 2007): Umbric Regosol
A1 — 0–30 cm: loamy sand, very dark greyish brown, granular structure, moist, artefacts (pieces of bricks; 1%), clear boundary.
A2 — 30–90 cm: loamy sand, dark olive grey, granular structure, moist, few artefacts (pieces of bricks, stones, bones; 3%), clear boundary.
Bu1 — 90–120 cm: loamy sand, olive brown, granular structure, slightly moist, interbeddings of loam and sand, few artefacts (pieces of bricks, charcoals; 5%), gradual boundary.
Bu2 — 120–155 cm: loam, light olive brown, blocky subangular structure, slightly moist, interbed-dings of loam, common artefacts (pieces of bricks; 15%), abrupt boundary.
Ab — 155–185 cm: loamy sand, dark greyish brown, granular structure, moist, very few arte-facts (charcoals; <1%) gradual boundary.
Bw — 185–240 cm: sand, yellowish brown, single grain structure, moist, soft iron concretions, arte-facts (charcoals; <1%), gradual boundary.
C — below 240 cm: sand, light grey, single grain structure, moist.
0 cm
50 cm
100 cm
150 cm
200 cm
250 cm

59 TECHNOGENIC SOILS OF POLAND
LAWN SOILS OF TORUŃ AND BYDGOSZCZ
Table 1. Selected soil properties – profile 1
HORIZON A1 A2 Bu1 Bu2 Ab Bw C
DEPTH [cm] 0–30 30–90 90–120 120–155 155–185 185–240 < 240
PARTICLE SIZE DISTRIBUTION [%]
>2 mm 7 9 10 23 4 1 <1
2 mm–50 µm 86 87 84 49 86 94 99
50–2 µm 10 7 11 36 12 2 1
<2 µm 4 6 5 15 2 4 0
TEXTURE CLASS (USDA)
loamysand
loamysand
loamysand loam loamy
sand sand sand
SOIL MATRIX COLOUR
drymoist
2.5Y 3/22.5Y 2/1
5Y 3/25Y 2/2
2.5Y 4/32.5Y 3/3
2.5Y 5/42.5Y 4/4
10YR 4/210YR 2/2
10YR 5/610YR 4/6
2.5Y 7/12.5Y 5/3
BULK DENSITY [g·cm-3] 1.40 1.48 1.46 1.57 1.47 1.62 1.71
OC [%] 1.22 0.58 0.49 0.24 0.91 0.04 0.04
Nt [%] 0.100 0.045 0.039 0.029 0.064 0.005 0.004
C:N 12 13 13 8 14 — —
pHin H2O 7.7 7.9 8.4 8.2 8,0 8.3 8.2
in 1M KCl 7.3 7.6 7.7 7.2 7.5 7.6 6.9
CaCO3 [%] 1.6 2.2 3.7 1,0 0.6 0.2 0.1
Pt [mg·kg-1] 1440 1540 1185 437 1250 159 80

TECHNOGENIC SOILS OF POLAND 60
Profile 2
Localition: Rapacki Sq.,
Toruń, Northern Poland
Coordinates: 53°00.661’ N
18°36.007’ ESoil classification (WRB 2007): Umbric Regosol (Humic)
A1 – 0–15 cm: humus horizon, sandy loam, dark greyish brown, granular structure, moist, clear boundary.
A2 – 15–25 cm: humus horizon, sandy loam, very dark grey, massive structure, moist, clear boundary.
Bu1 – 25–55 cm: loamy sand, very dark greyish brown, granular structure, slightly moist, inter-beddings of loam, few artefacts (pieces of bricks and tiles, charcoals; 5%), gradual boundary.
Bu2 – 55–105 cm: sand, very dark greyish brown, week granular structure, slightly moist, inter-beddings of dark loamy and light sandy material, very few artefacts (pieces of bricks; <1%), gradual boundary.
Ab – 105–110 cm: sand, very few iron concretions, gradual boundary.
Ab/Bb – 110–120 cm: sand, few iron concretions.
P. CHARZYŃSKI, R. BEDNAREK, S. RÓŻAŃSKI, Ł. MENDYK, B. MORAWSKI
0 cm
50 cm
100 cm

61 TECHNOGENIC SOILS OF POLAND
Table 2. Selected soil properties – profile 2
HORIZON A1 A2 Bu1 Bu2
DEPTH [cm] 0–15 15–25 25–55 55–110
PARTICLE SIZE DISTRIBUTION [%]
>2 mm 2 10 12 10
2 mm–50 µm 71 48 85 92
50–2µm 24 46 12 6
<2 µm 5 6 3 2
TEXTURE CLASS (USDA)
sandy loam
sandy loam
loamy sand sand
SOIL MATRIX COLOUR
drymoist
2.5Y 4/22.5Y 3/2
10YR 3/110YR 2/1
2.5Y 3/25Y 2/2
2.5Y 3/25Y 2/2
BULK DENSITY [g·cm-3] 1.52 1.21 1.47 1.56
OC [%] 1.44 3.23 0.25 0.82
Nt [%] 0.130 0.331 0.024 0.068
C:N 11 10 10 12
pHin H2O 7.7 8.0 8.5 8.1
in 1M KCl 7.3 7.6 8.2 7.7
CaCO3 [%] 1.0 0.4 3.2 3.4
Pt [mg·kg-1] 580 1550 636 1070
LAWN SOILS OF TORUŃ AND BYDGOSZCZ

TECHNOGENIC SOILS OF POLAND 62
Profile 3
Location: ‘Dream Valley’ City Park,
Toruń, Northern Poland
Coordinates: 53°00.522’ N
18°35.920’ ESoil classification (WRB 2007): Mollic Regosol (Humic)
A – 0–30 cm: loamy sand, very dark greyish brown, granular structure, moist, gradual boundary.
Bu1 – 30–50 cm: sand, olive brown, single grain structure, slightly moist, very homogeneous sandy material, common soft concretions of iron, gradual boundary.
Bu2 – 50–65 cm: loamy sand, dark brown, massive structure, slightly moist, mottling, clear boundary.
Bu3 – 65–85 cm: sandy loam, olive brown, blocky angular structure, slightly moist, few artefacts (pieces of cobblestone; 2%), gradual boundary.
C – below 85 cm: sand, light brownish grey, week granular structure, slightly moist, interbeddings of loam.
P. CHARZYŃSKI, R. BEDNAREK, S. RÓŻAŃSKI, Ł. MENDYK, B. MORAWSKI
0 cm
50 cm
100 cm

63 TECHNOGENIC SOILS OF POLAND
Table 3. Selected soil properties – profile 3
HORIZON A Bu1 Bu2 Bu3 C
DEPTH [cm] 0–30 30–50 50–65 65–85 < 85
PARTICLE SIZE DISTRIBUTION [%]
>2 mm 9 15 6 10 1
2 mm–50 µm 80 91 85 64 95
50–2 µm 15 7 11 25 2
<2 µm 5 2 4 11 3
TEXTURE CLASS (USDA)
loamy sand sand loamy
sandsandy loam sand
SOIL MATRIX COLOUR
drymoist
2.5Y 3/22.5Y 3/2
2.5Y 4/32.5Y 3/3
10YR 3/310YR 2/2
2.5Y 4/32.5 Y 3/3
2.5Y 6/22.5Y 4/3
BULK DENSITY [g·cm-3] 1.60 1.73 1.63 1.80 1.70
OC [%] 1.33 0.17 0.54 0.29 0.05
Nt [%] 0.101 0.017 0.049 0.018 0.003
C:N 13 10 11 16 —
pH in H2Oin 1M KCl
7.9 8.1 8.1 8.5 8.9
7.4 7.6 7.6 7.8 8.6
CaCO3 [%] 1.1 0.4 1.1 4.9 3.9
Pt [mg·kg-1] 980 972 1450 727 311
LAWN SOILS OF TORUŃ AND BYDGOSZCZ

TECHNOGENIC SOILS OF POLAND 64
Profile 4
Location: Bema St.,
Toruń, Northern Poland
Coordinates: 53°01.145’ N
18°35.690’ ESoil classification (WRB 2007): Haplic Regosol (Arenic)
A – 0–12 cm: sand, very dark greyish brown, granular structure, moist, clear boundary.
Bu – 12–50 cm: sand, greyish brown, blocky sub-angular structure, slightly moist, few artefacts (pieces of bricks, tiles, wire, flakes of dried paint, charcoals; 2%), interbeddings of loam, few roots, clear boundary.
Ab1 – 50–55 cm: sand, dark greyish brown, granular structure, slightly moist, very few arte-facts (pieces of bricks, glass, charcoals; 3%), gradual boundary.
Ab2 – 55–63 cm: sandy loam, light olive brown, granular structure, slightly moist, abrupt boundary.
C – below 63 cm: sand, pale yellow, single grain structure, slightly moist.
P. CHARZYŃSKI, R. BEDNAREK, S. RÓŻAŃSKI, Ł. MENDYK, B. MORAWSKI
0 cm
50 cm
100 cm
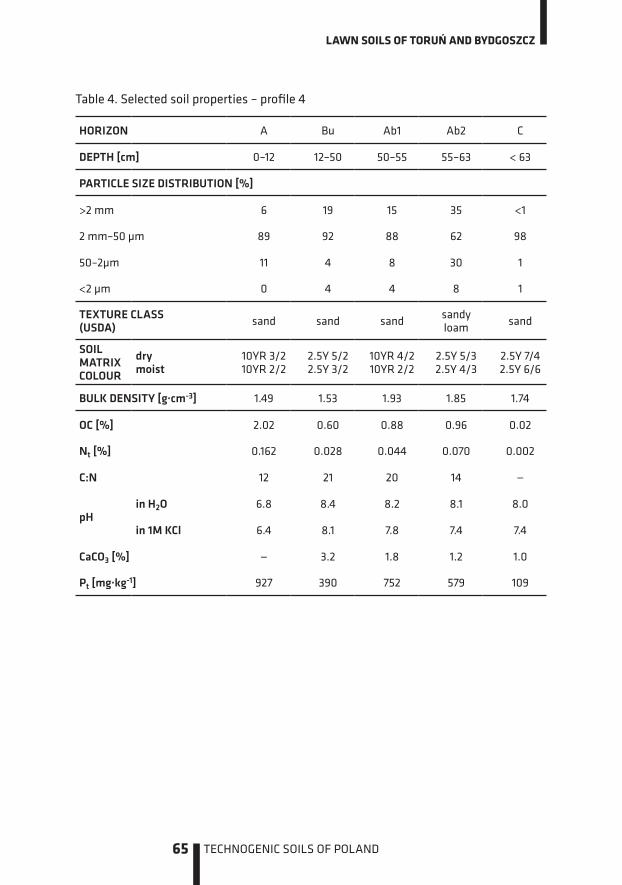
65 TECHNOGENIC SOILS OF POLAND
Table 4. Selected soil properties – profile 4
HORIZON A Bu Ab1 Ab2 C
DEPTH [cm] 0–12 12–50 50–55 55–63 < 63
PARTICLE SIZE DISTRIBUTION [%]
>2 mm 6 19 15 35 <1
2 mm–50 µm 89 92 88 62 98
50–2µm 11 4 8 30 1
<2 µm 0 4 4 8 1
TEXTURE CLASS (USDA) sand sand sand sandy
loam sand
SOIL MATRIX COLOUR
drymoist
10YR 3/210YR 2/2
2.5Y 5/22.5Y 3/2
10YR 4/210YR 2/2
2.5Y 5/32.5Y 4/3
2.5Y 7/42.5Y 6/6
BULK DENSITY [g·cm-3] 1.49 1.53 1.93 1.85 1.74
OC [%] 2.02 0.60 0.88 0.96 0.02
Nt [%] 0.162 0.028 0.044 0.070 0.002
C:N 12 21 20 14 —
pHin H2O 6.8 8.4 8.2 8.1 8.0
in 1M KCl 6.4 8.1 7.8 7.4 7.4
CaCO3 [%] — 3.2 1.8 1.2 1.0
Pt [mg·kg-1] 927 390 752 579 109
LAWN SOILS OF TORUŃ AND BYDGOSZCZ

TECHNOGENIC SOILS OF POLAND 66
Profile 5
Location: ‘Bydgoszcz Canal’ City Park,
Bydgoszcz, Northern Poland
Coordinates: N 53°07’16.3’’
E 17°57’47.9’’ Soil classification (WRB 2007): Mollic Regosol (Technic)
Au – 0–6 cm: sandy loam, dark grey, granular structure, moist, clear boundary.
Bu1 – 6–24 cm: sandy loam, dark grey, blocky subangular structure, moist, numerous arte-facts (pieces of bricks, concrete, glass, garbage), gradual boundary.
Bu2 – 24–51 cm: sandy loam, dark grey, blocky subangular structure, moist, few artefacts (bricks, concrete, glass), numerous snail shells, gradual boundary.
Bu3 – 51–80 cm: loamy sand, grey, blocky sub-angular structure, moist, few artefacts and shells, clear boundary.
Bw – 80–98 cm: sand, brownish yellow, single grain structure, moist, homogeneous sandy ma-terial, no artefacts and shells, di�use boundary.
C – 98–126 cm: sand, very pale brown, single grain structure, moist, homogeneous sandy material, no artefacts and shells, gradual boundary.
Cg – 126–150 cm: sand, light grey, single grain structure, very wet, homogeneous sandy material.
P. CHARZYŃSKI, R. BEDNAREK, S. RÓŻAŃSKI, Ł. MENDYK, B. MORAWSKI
0 cm
50 cm
100 cm
150 cm

67 TECHNOGENIC SOILS OF POLAND
Table 5. Selected soil properties – profile 5
HORIZON Au Bu1 Bu2 Bu3 Bw C Cg
DEPTH [cm] 0–6 6–24 24–51 51–80 80–98 98–126 126–150
PARTICLE SIZE DISTRIBUTION [%]
>2 mm 6 25 11 7 1 6 9
2 mm–50 µm 56 62 59 76 88 89 94
50–2 µm 41 34 38 23 11 10 6
<2 µm 3 4 3 1 1 1 0
TEXTURE CLASS (USDA) sandy loam sandy
loamsandy loam
loam sand sand sand sand
SOIL MATRIX COLOUR
drymoist
10YR 4/110YR 2.5/1
10YR 4/110YR 3/1
10YR 4/110YR 3/1
10YR 5/110YR 4/1
10YR 6/810YR 4/6
10YR 7/410YR 5/6
10YR 7/210YR 6/1
OC [%] 3.75 2.15 3.60 1.10 0.19 0.03 0.01
Nt [%] 0.310 0.110 0.262 0.098 0.007 0.005 0.004
C:N 12 20 14 11 27 — —
pHin H2O 7.2 7.8 7.6 7.4 7.3 7.4 7.7
in 1M KCl 7.1 7.5 7.5 7.3 7.2 7.3 7.5
CaCO3 [%] 5.6 4.3 7.5 1.1 0.3 0.3 0.3
LAWN SOILS OF TORUŃ AND BYDGOSZCZ

TECHNOGENIC SOILS OF POLAND 68
Profile 6
Location: Bernardyńska St.,
Bydgoszcz, Northern Poland
Coordinates: N 53°07’15.2’’
E 18°00’24.4’’Soil classification (WRB 2007): Haplic Regosol (Technic)
Au – 0–35 cm: sandy loam, very dark grey, granular structure, slightly moist, numerous (>10%) artefacts (pieces of bricks, concrete, glass), clear boundary.
Bu1 – 35–60 cm: sand, light yellowish brown, single grain structure, slightly moist, few artefacts (pieces of bricks, glass, garbage), homogeneous sandy material, abrupt boundary.
Bu2 – 60–97 cm: sandy loam, greyish brown, blocky subangular structure, slightly moist, numerous artefacts (pieces of bricks, concrete, glass) and roots, di�use boundary.
Bu3 – 97–150 cm: sandy loam, greyish brown, blocky subangular structure, slightly moist, a lot of artefacts (pieces of bricks, concrete, glass) and roots.
P. CHARZYŃSKI, R. BEDNAREK, S. RÓŻAŃSKI, Ł. MENDYK, B. MORAWSKI
0 cm
50 cm
100 cm
150 cm

69 TECHNOGENIC SOILS OF POLAND
Table 6. Selected soil properties – profile 6
HORIZON Au Bu1 Bu2 Bu3
DEPTH [cm] 0–35 35–60 60–97 97–150
PARTICLE SIZE DISTRIBUTION [%]
>2 mm 5 4 21 18
2 mm–50 µm 68 96 65 66
50–2µm 30 4 32 31
<2 µm 2 0 3 3
TEXTURE CLASS (USDA) sandy loam sand sandy
loamsandy loam
SOIL MATRIX COLOUR
drymoist
10YR 3/110YR 2/1
10YR 6/410YR 4/4
10YR 5/210YR 3/1
10YR 5/210YR 3/1
OC [%] 2.51 0.01 1.01 1.07
Nt [%] 0.167 0.001 0.066 0.064
C:N 15 10 15 17
pHin H2O 7.8 8.0 7.9 8.0
in 1M KCl 6.9 7.8 7.6 7.7
CaCO3 [%] 1.1 0.7 3.0 1.5
LAWN SOILS OF TORUŃ AND BYDGOSZCZ
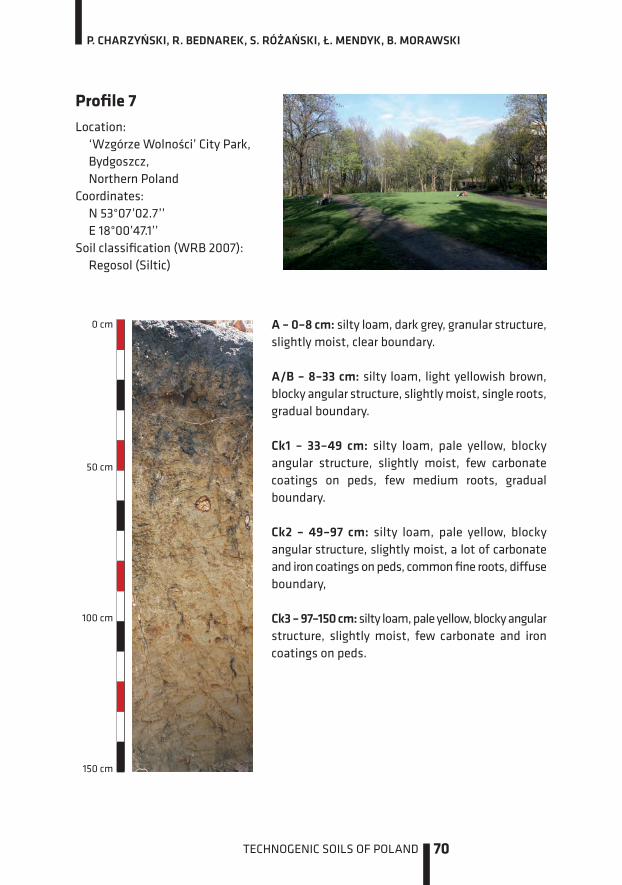
TECHNOGENIC SOILS OF POLAND 70
Profile 7
Location: ‘Wzgórze Wolności’ City Park,
Bydgoszcz, Northern Poland
Coordinates: N 53°07’02.7’’
E 18°00’47.1’’Soil classification (WRB 2007): Regosol (Siltic)
A – 0–8 cm: silty loam, dark grey, granular structure, slightly moist, clear boundary.
A/B – 8–33 cm: silty loam, light yellowish brown, blocky angular structure, slightly moist, single roots, gradual boundary.
Ck1 – 33–49 cm: silty loam, pale yellow, blocky angular structure, slightly moist, few carbonate coatings on peds, few medium roots, gradual boundary.
Ck2 – 49–97 cm: silty loam, pale yellow, blocky angular structure, slightly moist, a lot of carbonate and iron coatings on peds, common fine roots, di�use boundary,
Ck3 – 97–150 cm: silty loam, pale yellow, blocky angular structure, slightly moist, few carbonate and iron coatings on peds.
P. CHARZYŃSKI, R. BEDNAREK, S. RÓŻAŃSKI, Ł. MENDYK, B. MORAWSKI
0 cm
50 cm
100 cm
150 cm
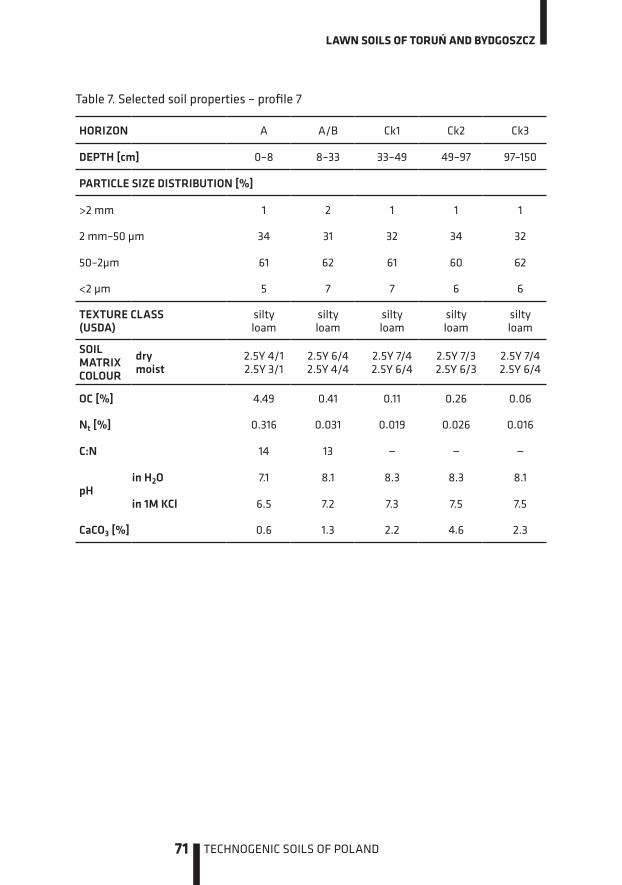
71 TECHNOGENIC SOILS OF POLAND
Table 7. Selected soil properties – profile 7
HORIZON A A/B Ck1 Ck2 Ck3
DEPTH [cm] 0–8 8–33 33–49 49–97 97–150
PARTICLE SIZE DISTRIBUTION [%]
>2 mm 1 2 1 1 1
2 mm–50 µm 34 31 32 34 32
50–2µm 61 62 61 60 62
<2 µm 5 7 7 6 6
TEXTURE CLASS (USDA)
silty loam
silty loam
silty loam
silty loam
silty loam
SOIL MATRIX COLOUR
drymoist
2.5Y 4/12.5Y 3/1
2.5Y 6/42.5Y 4/4
2.5Y 7/42.5Y 6/4
2.5Y 7/32.5Y 6/3
2.5Y 7/42.5Y 6/4
OC [%] 4.49 0.41 0.11 0.26 0.06
Nt [%] 0.316 0.031 0.019 0.026 0.016
C:N 14 13 — — —
pHin H2O 7.1 8.1 8.3 8.3 8.1
in 1M KCl 6.5 7.2 7.3 7.5 7.5
CaCO3 [%] 0.6 1.3 2.2 4.6 2.3
LAWN SOILS OF TORUŃ AND BYDGOSZCZ
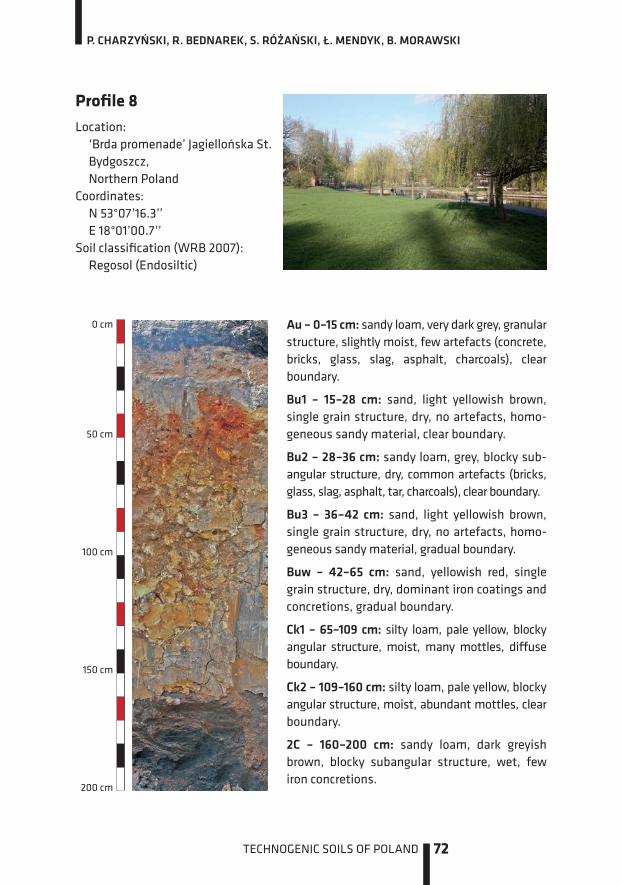
TECHNOGENIC SOILS OF POLAND 72
Profile 8
Location: ‘Brda promenade’ Jagiellońska St.
Bydgoszcz, Northern Poland
Coordinates: N 53°07’16.3’’
E 18°01’00.7’’Soil classification (WRB 2007): Regosol (Endosiltic)
Au – 0–15 cm: sandy loam, very dark grey, granular structure, slightly moist, few artefacts (concrete, bricks, glass, slag, asphalt, charcoals), clear boundary.
Bu1 – 15–28 cm: sand, light yellowish brown, single grain structure, dry, no artefacts, homo-geneous sandy material, clear boundary.
Bu2 – 28–36 cm: sandy loam, grey, blocky sub-angular structure, dry, common artefacts (bricks, glass, slag, asphalt, tar, charcoals), clear boundary.
Bu3 – 36–42 cm: sand, light yellowish brown, single grain structure, dry, no artefacts, homo-geneous sandy material, gradual boundary.
Buw – 42–65 cm: sand, yellowish red, single grain structure, dry, dominant iron coatings and concretions, gradual boundary.
Ck1 – 65–109 cm: silty loam, pale yellow, blocky angular structure, moist, many mottles, di�use boundary.
Ck2 – 109–160 cm: silty loam, pale yellow, blocky angular structure, moist, abundant mottles, clear boundary.
2C – 160–200 cm: sandy loam, dark greyish brown, blocky subangular structure, wet, few iron concretions.
P. CHARZYŃSKI, R. BEDNAREK, S. RÓŻAŃSKI, Ł. MENDYK, B. MORAWSKI
0 cm
50 cm
100 cm
150 cm
200 cm

73 TECHNOGENIC SOILS OF POLAND
Table 8. Selected soil properties – profile 8
HORIZON Au Bu1 Bu2 Bu3 Buw Ck1 Ck2 2C
DEPTH [cm] 0–15 15–28 28–36 36–42 42–65 65–109 109–160 160–200
PARTICLE SIZE DISTRIBUTION [%]
>2 mm 14 22 21 9 13 0 0 0
2 mm–50 µm 60 90 71 87 88 15 11 55
50–2µm 37 9 26 11 11 70 69 42
<2 µm 3 1 3 2 1 15 20 3
TEXTURE CLASS(USDA)
sandy loam sand sandy
loam sand sand silt loam
silt loam
sandy loam
SOIL MATRIX COLOUR
drymoist
2.5Y 3/12.5Y 2.5/1
2.5Y 6/42.5Y 4/4
2.5Y 5/12.5Y 3/1
2.5Y 6/42.5Y 5/3
5YR 4/65YR 3/4
2.5Y 7/42.5Y 6/3
2.5Y 7/42.5Y 6/3
2.5Y 4/22.5Y 3/1
OC [%] 11.1 0.01 2.44 0.06 0.16 0.24 0.04 1.73
Nt [%] 0.763 n.d. 0.083 0.006 0.024 0.067 0.064 0.206
C:N 15 — 29 10 — — — —
pHin H2O 8.0 8.9 8.0 8.2 8.0 7.6 7.7 7.4
in 1M KCl 7.4 8.5 7.4 7.9 7.7 7.1 7.1 7.1
CaCO3 [%] 4.5 4.2 0.7 0.3 0.4 2.8 0.9 1.8
LAWN SOILS OF TORUŃ AND BYDGOSZCZ

TECHNOGENIC SOILS OF POLAND 74
General properties of the studied soils
All of the tested soils from Toruń had a texture of sand or loamy sand. This is related to Toruń location on sandy terraces of the Vistula River. Loamy or sandy loamy horizons were also present: in topsoil (profile 2) or deeper (from 50 to 150 cm, other profiles) – Tables 1–4. The investigated soils from Bydgoszcz were much more diversified in texture. Profiles 5 and 6 had a texture of sandy loams and sands, profile 7 was silt loam in the entire profile, and profile 8 was the most varied with texture − from sands to silt loam (Tables 5–8). It was the result of lithogenesis and technogenic impact on the Bydgoszcz environment.
According to Munsell Soil Color Charts (2000), the hue of genetic horizons and layers in profiles ranged from 2.5 to 10.5 YR, with 2.5Y as the most common one. This value occurred in 24 samples. Large di�erences in colour between levels were associated with their large variety and diversity of the material, often even within a single layer (Tables 1–8).
The range of bulk density in tested soils was from 1.21 to 1.93 g·cm-3. The relatively high density of subsurface layers can be associated with preparations of the lawn soil (compaction to reduce permeability). Large variability in physical properties is an e�ect of heterogeneous morphology of the urban soils.
The soil reaction was closely related to the content of organic matter. Values of pH were between 6.8 and 8.9 (in H2O) and between 6.4 and 8.6 (in 1M KCl). There was no clear vertical pH trend in the examined profiles.
The CaCO3 content in the individual profiles was varied and ranged from 0.1% to 7.5%. No significant relations between the pH values measured in 1M KCl and carbonate content were found.
The highest organic carbon (OC) content was in the surface horizons. The content of OC in non-A horizons varied. The increase in OC content was observed at certain depths in all profiles. It was connected with the presence of material from older surface hori-zons. The content of total nitrogen (Nt) corresponded with the organic carbon distribu-tion in individual profiles. Values of the carbon to nitrogen ratio were up to 29; in most cases − from 10 to 14. The narrow range of the C:N ratio is an e�ect of lawn treatments and fertilization. This allows to maintain high biological e�ciency of these soils.
The total phosphorus (Pt) content was di�erent in each analyzed soil. The highest value was observed in profile 1 (80–1550 kg·mg-1). This pit was located in the direct neighbourhood of the remains of a medieval church and in the area of an old cemetery.
The percentage ratio of humic and fulvic acids in humus horizons of the examined Toruń soils was similar in most of the analyzed samples, and was close to 1:1, with a slight predominance of fulvic acids. Di�erent values were found only in samples from profile 1, the fractional composition of which was dominated by humic acids. A signifi-cant di�erence was found in Ab horizon due to a high level of organic matter decompo-sition in this buried horizon (decomposed fulvic acids) – Fig. 2.
P. CHARZYŃSKI, R. BEDNAREK, S. RÓŻAŃSKI, Ł. MENDYK, B. MORAWSKI

75 TECHNOGENIC SOILS OF POLAND
A – Profile 1 Ab – Profile 1
A1 – Profile 2 A2 – Profile 2
A – Profile 3 A – Profile 4
Fig. 2. Percentage of humic and fulvic acids in humus horizons of the examined soils in Toruń
Comparison of the results with similar studies in Germany showed a few di�erences between German and soils investigated in our study. The bulk density of soil in Stutt-gart was almost twice as high in the surface horizons, and in the lower horizons − much lower than in Toruń. The results of total nitrogen analysis also showed some di�er-ences. The Nt values were higher in the German city of Stuttgart (Lorenz, Kandel 2005) than in Toruń and Bydgoszcz. Carbon and nitrogen content was also higher in the Ger-man city of Kiel, however, the ratio of carbon to nitrogen was at a similar level (Beyer et al. 1994). These di�erences may result from di�erent methods of lawn cultivation. The increased density may be connected with the use of tractors for mowing and the
LAWN SOILS OF TORUŃ AND BYDGOSZCZ

TECHNOGENIC SOILS OF POLAND 76
increased nitrogen content − with the use of higher amounts of fertilizers. Hong Kong urban soils had similar properties as soils in Toruń, especially in the case of pH and the content of OC and Nt (Jim 1998).
Heavy metals and magnetic susceptibility
In most cases, the content of heavy metals (soluble in 2M HNO3) did not exceed the Polish standards defined in the Regulation of the Minister of the Environment (2002). As shown in tables 9 and 10, the content of zinc and the content of cadmium slightly exceeded the limit values only in profiles 5 and 8, respectively. Local Zn contamination of soils in By-dgoszcz is confirmed in long-term research conducted in the most green areas of the city. The content of this element ranged from 20 to 896 mg·kg-1 (Malczyk et al. 1996; Dąbkowska-Naskręt, Różański 2002, 2006, 2009). Among the analysed metals, only Mn, Zn, Pb and Cu were significantly positively correlated (at p<0.05) with magnetic susceptibility (ĸ) – Table 9.
A similar content of heavy metals in urban soils of Gorzów and Zielona Góra (Western Poland) was reported by Greinert (2000, 2003). The origin of these pollutants may be associated with artefacts that often occur in urban soils (pipes, cables, foundations, paints and their components). In the soils of Bydgoszcz, the vicinity of contamination sources, such as heat and power plants and heavy tra�c, also influence the content of heavy metals (Dąbkowska-Naskręt, Różański 2007, 2009). Also other parameters of the Zielona Góra soils had characteristics similar to the soils of Toruń and Bydgoszcz (bulk density, pH in H2O, OC content).
The soils investigated by Sobocká in Bratislava (Sobocká et al. 2004) showed some discrepancies in the content of heavy metals compared to soils in Toruń. The content of cobalt, copper, manganese and nickel was higher in Toruń soils, in contrast to the content of cadmium, chromium and lead, which was higher in Bratislava. However, these di�erences were not very large. When comparing the studied soils to those from Stockholm, the con-tent of heavy metals was higher in the latter (Linde et. al. 2007). The mean content of Pb, Cu, Ni, Cr and Zn in lawn soils of Toruń was lower than in soils of Nanjing (Lu et al. 2003) and Beijing (Chen et al. 2005). In the case of Pb, it was over 4 times less than in Beijing and 10 times less than in Nanjing. The mean content of Zn was over 2 times higher in Beijing and over 5 times higher in Nanjing. Both Bejing’s and Nanjing’s soils have a similar mean content of Cu, which was over 6 times higher compared to Toruń. The analyzed lawn soils compared to similar soils in the cities of Tuscany (Bretzel, Calderisi 2006), Uppsala (Ljung et. al. 2006), New Castle (Rimmer 2006) and Xuzhou (Xue-Song, Yong 2006) are less con-taminated with heavy metals. This may be related to relatively low industrialization of Toruń, the main function of which are services, especially educational ones.
P. CHARZYŃSKI, R. BEDNAREK, S. RÓŻAŃSKI, Ł. MENDYK, B. MORAWSKI

77 TECHNOGENIC SOILS OF POLAND
Table 9. Total content of selected heavy metals (HM) and magnetic susceptibility (ĸ) in the examined profiles from Toruń, and Pearson correlation coe�cient (ĸ:HM)
Depth [cm]
ĸ[10–8 m3·kg-1]
Fe Mn Zn Pb Cd Cu Cr Ni Co
HM [mg·kg-1]
Profile 1
0–30 41 3450 212 39 62 0.33 34.0 2.0 4.5 2.3
30–120 50 3330 227 23 66 0.23 52.0 1.5 4.3 3.0
Profile 2
0–15 17 3250 151 22 10 0.16 7.9 2.7 4.4 2.4
15–25 44 7470 271 109 30 1.02 60.0 5.0 23.0 9.2
Profile 3
0–25 42 7830 1047 29 18 0.28 7.0 1.7 6.5 4.7
25–45 10 9070 833 8.8 6.1 0.15 2.3 2.0 4.1 3.7
Profile 4
0–12 27 5100 215 48 20 0.28 8.5 1.9 2.8 1.8
12–50 57 2073 980 69 19 0.20 8.4 1.4 3.3 1.8
MEAN 5197 492 43 29 0.33 22.5 2.28 6.6 3.6
SD 2597 388 32 23 0.29 22.9 1.17 6.7 2.5
ĸ:HM -0.44 0.15 0.52 0.55 0.28 0.50 -0.08 0.20 0.12
In comparison to Toruń soils, only the content of Zn and Ni was significantly higher in Bydgoszcz soils – 4 and 2 times, respectively. Nevertheless, due to alkaline reaction of the analysed soils, most of the heavy metals are represented by immobile forms (Hanna et al. 2009; Martinez, Motto 2000), which was confirmed in the recent research by Dąbkowska-Naskręt and Różański (2009) on Zn and Pb in Bydgoszcz soils. This situa-tion, in contrast to Toruń, may result from the presence of such industry as heat and power plants, chemical plants as well as heavier road and rail tra�c compared to Toruń. It is especially visible in the case of mercury content, i.e. 1.40 mg·kg-1 , a typical value for Bydgoszcz (Dąbkowska-Naskręt, Różański 2007; Różański, Dąbkowska-Naskręt 2011).
LAWN SOILS OF TORUŃ AND BYDGOSZCZ

TECHNOGENIC SOILS OF POLAND 78
Table 10. Total content of selected heavy metals in the examined profiles from Bydgoszcz
Depth [cm]Fe Mn Zn Pb Cd Cu Ni Hg
[mg·kg-1]
Profile 5
0–6 2750 288 423 69.6 0.30 37.9 19.1 0.18
6–24 2745 425 436 56.2 0.05 47.1 19.2 0.16
Profile 6
0–35 3969 141 182 58.6 0.35 46.0 12.7 1.40
35–60 1333 296 8.0 2.2 1.31 3.3 2.9 0.02
Profile 7
0–8 2912 249 97 29.6 1.35 23.3 24.2 0.13
8–33 2391 254 38 2.5 0.94 15.9 20.1 0.07
Profile 8
0–15 3561 239 72 34.7 4.77 25.2 14.0 0.29
15–28 1528 271 7.0 0.2 2.18 22.7 0.8 0.02
MEAN 2649 270 158 31.7 1.41 27.7 14.1 0.28
SD 904 79 177 28 1.53 15.1 8.4 0.46
Summary
Except for profile 7, the analysed soils exhibited all the characteristics of urbanosols which were specified by Gerasimova et al. (2003). All these soil profiles were characterized by the presence of horizons (layers), the origins of which can be linked to human activity. These were often heterogeneous, disturbed layers with numerous artefacts, such as fragments of bricks, concrete, asphalt, glass and bones, metal elements. Transitions between levels were often sharp, which proved their artificial origin. Generally, the ma-terial in adjacent layers was characterized by di�erent physical and chemical proper-ties, colour, etc., which can also be related to their technogenic origin. Lawn soils have some common features but also some di�erences. They are basically determined by the history and the type of land use of the area where a given lawn is located. As com-pared to other cities, in most cases, the content of heavy metals was relatively low, and close to natural values. The increased concentration of metals was recorded only in a few profiles, and in several others, the content was at the contamination level.
This study was partly financed by Polish Ministry of Science and Higher Education (grant No. N N306 463738).
P. CHARZYŃSKI, R. BEDNAREK, S. RÓŻAŃSKI, Ł. MENDYK, B. MORAWSKI

79 TECHNOGENIC SOILS OF POLAND
References:
1. Beyer L., Blume H. P., Elsner D. C., Willnow A. 1994. Soil organic matter composition and micro-bial activity in urban soil. Sci. Total. Environ. 168 (195). Elsevier: 267–278.
2. Bretzel F., Calderisi M. 2006. Metal contamination in urban soil of coastal Tuscany (Italy). Environ. Monit. Assess. 118: 319–355.
3. Chen T., Zheng Y., Lei M., Huang Z., Wu H., Chen H., Fan K., Yu K., Wu X., Tian Q. 2005. Assessment of heavy metal pollution in surface soils of urban parks in Beijing, China. Chemosphere 60: 542–551.
4. Dąbkowska-Naskręt H., Różański S. 2002. Accumulation of heavy metals and physico-chemical properties of urbanozems from Bydgoszcz agglomeration. Chemia i Inżynieria Ekologiczna 9: 1313–1318.
5. Dąbkowska-Naskręt H., Różański S. 2006. Distribution of heavy metals in urban soils from park area of Bydgoszcz, Poland. Mengen und Spurenelemente 23: 343–348.
6. Dąbkowska-Naskręt H., Różański S. 2007. Mercury content in garden soils of urban agglomera-tion. Global NEST Journal 9: 237–241.
7. Dąbkowska-Naskręt H., Różański S. 2009. Forms of Pb and Zn in urbanozems of Bydgoszcz agglomeration. Ochrona Środowiska i Zasobów Naturalnych 41: 478–485 (in Polish with Eng-lish Summary).
8. Fedorowicz J. 1993. Geographical environment anthropogenic transformations in the area of Toruń city. Stud. Soc. Sci. Torun, Sec. C, 10, 3 (in Polish with English Summary).
9. Galon R. 1961. Morphology of the Noteć-Warta (or Toruń-Eberswalde) ice marginal stream-way. Pr. Geogr. Inst. Geogr. PAN 29.
10. Gebhardt H. 1982. Phosphatkartierung und bodenkundliche Geländeuntersuchungen zur Ein-grenzung historischer Siedlungs – und Wirtschaftsflächen der Geestinsel Flögeln, Kreis Cux-haven. Probleme der Küstenforschung im Südlichen Nordseegebiet, Band 14: 1–10.
11. Gerasimova M. I., Stroganova M. N., Mozarowa M. W., Prokofieva T. W. 2003. Anthropogenic soils (Genesis, geography, recultivation), Moscow (in Russian).
12. Greinert A. 2000. Conservation and recultivation of urban areas. Wyd. Politechniki Zielo-nogórskiej, Zielona Góra (in Polish).
13. Greinert A. 2003. Studies on soils of Zielona Góra urban area. Oficyna Wydawnicza Uniwer-sytetu Zielonogórskiego, Zielona Góra (in Polish).
14. Hanna K., Lassabatere L., Bechet B. 2009. Zinc and lead transfer in a contaminated roadside soil: Experimental study and modeling. J. Hazard. Mater. 161: 1499–1505.
15. IUSS Working Group WRB. 2007. World References Base for Soil Resources 2006. Update 2007, World Soil Resources Reports, 103, FAO, Rome.
16. Kondracki J. 2000. Regional geography of Poland. Wyd. Nauk. PWN, Warsaw (in Polish).
17. Kononova M. 1966. Soil Organic Matter. 2nd Ed. New York, Pergammon Press.
18. Kozłowska M., Kozłowski I. 1990. Detailed geological map of Poland (Szczegółowa mapa geologiczna Polski). Arkusz Bydgoszcz Wschód 319, PIG, Warsaw.
LAWN SOILS OF TORUŃ AND BYDGOSZCZ

TECHNOGENIC SOILS OF POLAND 80
19. Linde M., Öborn I., Gustafsson J.P. 2007. E�ects of changed soil conditions on the mobility of trace metals in moderately contaminated urban soil. Water Air Soil Poll. 183: 69–83.
20. Ljung K., Otabbonge E., Selinus O. 2006. Natural and anthropogenic metal inputs to soils in urban Uppsala, Sweden. Environ. Geochem. Health. 28: 353–364.
21. Lorenz K., Kandele E. 2005. Biochemical characterization of Urban soil profiles from Stutt-gart, Germany. Soil Biol. and Biochem. 37: 1373–1385.
22. Lu Y., Gong Z., Zhang G., Burghardt W. 2003. Concentrations and chemical speciations of Cu, Zn, Pb and Cr of urban soils in Nanjing, China. Geoderma 115: 101–111.
23. Malczyk P., Kędzia W., Nowak M. 1996. Heavy metals in soils of the Bydgoszcz city. Rocz. Glebozn. 47: 195–202 (in Polish with English abstract).
24. Martínez, C.E., Motto, H.L. 2000. Solubility of lead, zinc, and copper added to mineral soils. Environ. Pollut. 107: 153–158.
25. Munsell Soil Color Charts. 2000. GretagMacbeth. New Windsor, NY.
26. Niewiarowski W., Weckwerth P. 2006. Genesis and relief development. [In:] Toruń and its sur-roundings – environmental monograph. Wyd. UMK, Toruń: 65–98 (in Polish with English Summary).
27. Rimmer D. L. 2006. Metal contamination of urban soil in the vicinity of a municipal waste incinerator: One source among many. Sci. Total Environ. 356: 207–216.
28. Regulation of the Minister of the Environment dated September 9, 2002 on soil and land quality standards (Journal of Laws No. 165, item 1359, October 4, 2002).
29. Różański S., Dąbkowska-Naskręt H. 2011. Spatial and profile distribution of mercury in urba-nozems of Bydgoszcz city. Ochrona Środowiska i Zasobów Naturalnych 49: 193–201 (in Polish with English Summary).
30. Sobocká J., Jaduda M., Poltarska K. 2004. Urban soils of the city Bratislava and their environ-ment. [In:] J. Sobocká (Ed.) Soil Anthropization VIII. Bratislava, Slovakia, September 28–30, 2004: 53–61.
31. van Reeuwijk L.P. 2006. Procedures for soil analysis. 7th Edition. Technical Report 9, ISRIC – World Soil Information, Wageningen, Netherlands.
32. Xue-Song W., Yong Q. 2006. Some characteristics of the distribution of heavy metals in urban topsoil of Xuzhou, China. Environ. Geochem. Health. 29: 11–19.
P. CHARZYŃSKI, R. BEDNAREK, S. RÓŻAŃSKI, Ł. MENDYK, B. MORAWSKI

81 TECHNOGENIC SOILS OF POLAND
Introduction
Human activity in urbanized areas involves permanent changes in various components of the environment. Land preparation for building development usually leads to removal of the natural vegetation and soil cover. Covering the soil surface (soil sealing) contributes to inhibition of the soil-forming processes. A construction site becomes a new land and, as in the natural environment, is a�ected by external, climatic or biological factors (Woodell 1979; Duchoslav 2002; Lisci et al. 2003) – Fig. 1. Consequently, weathering of bricks, con-crete and similar materials takes place. The development of crevices and cracking filled with residual deposits allows the succession of vegetation and initiation of the initial soil-forming process. Obviously, the presence of plants is followed by some adverse ef-fects, including further destruction of the surface of brick and stone walls (biological weathering), e.g. through secretion of organic acids a�ecting the decomposition of car-bonates, and mechanical delamination of materials as a result of the root growth (Jasieńko et al. 2011).
In favourable environmental conditions, particularly in humid climate, such processes may result in relatively fast soil cover development on buildings (unless prevented by man). Invasion of ruderal and woody vegetation may result in the total concealment of a construction.
Properties of soils forming on buildings are also largely determined by the inflow of matter from outside, e.g. as a result of transport by wind and water, birds and other animals living there. In this respect, gutters and recesses of roofs provide specific con-ditions conducive to accumulation of the allochthonous matter. According to Achkasov et al. (2006), the sedimentation rate of wind-transported material in transportation areas can vary significantly. In Moscow, it ranges from 0.1 to 3 g·m2 per day. It should be expected that accumulation of deposits on buildings occurs at a reduced rate.
SOILS FORMING ON BUILDINGS IN TORUŃ
PRZEMYSŁAW CHARZYŃSKI PIOTR HULISZ
4

TECHNOGENIC SOILS OF POLAND 82
Fig. 1. Block diagram presenting the building’s fate in relation to human and environmental intervention (Lisci et al. 2003, modified)
Although soils of urbanized areas become increasingly popular among professionals from di�erent fields, so far the described soils have not attracted much attention of researchers. This study is a continuation of pioneer research undertaken in Poland by Charzyński et al. (2011). The results of the research conducted in Toruń were used in the description of soils forming on buildings. Furthermore, particular attention was paid to issues related to genesis and classification of these soils.
The study area and soil site documentation
This chapter presents the results of the research on soils developed on buildings in the city of Toruń (5 sites) – Fig. 2. Some of the data presented (site 1 and 4) come from the study by Charzyński et al. (2011).
P. CHARZYŃSKI, P. HULISZ

83 TECHNOGENIC SOILS OF POLAND
The first three study sites were located in the Old Town (founded in 1233) with an area of 34 ha. Site 1 was located in Podmurna street on a Gothic city wall from the first half of the 13th century. The two other sites were located within a group of buildings from the end of the 19th century (Ciasna street): on a roof (site 2) and in a gutter (site 3).
Fig. 2. Location of the study sites
Site 4 was located on a wall surrounding the ruins of a former slaughterhouse (Tormięs, Lubicka street) in the district of Jakubskie Przedmieście. Construction of the slaughterhouse began in 1883–84 and it operated until 1999. Apart from the residen-tial-industrial buildings mostly from the 20th century, several wattle and daub buildings with the so-called timber framing have been preserved in the district since the 19th century.
The last sample (site 5) was collected from a gutter in the complex of garages built in the 1970s in Bema street, within the district of Chełmińskie Przedmieście. This dis-trict is mostly covered with multi-family housing development, which includes new, modern buildings, but also old buildings from the communist People's Republic of Po-land, the interwar period, and even the 19th century buildings with a timber framing.
The analysis of soil material collected from buildings was performed according to international standards (van Reeuwijk 2006). The content of lead, zinc, copper and cad-mium was determined by atomic adsorption spectroscopy after mineralization of sam-ples in the mixture of acids HF and HClO3. Organic samples were previously predigested in H2O2 to destroy organic matter. The phosphorus content (Pca) was determined in 1% citric acid solution (van Reeuwijk 2006).
SOILS FORMING ON BUILDINGS IN TORUŃ

TECHNOGENIC SOILS OF POLAND 84
P. CHARZYŃSKI, P. HULISZ
Site 1
Location: Podmurna St., medieval city wall,
at a height of 3 m, Toruń, Northern Poland
Coordinates: 53° 00’ 42.64’’ N
18° 36’ 19.47’’ EVegetation: Achillea millefolium L.,
Taraxacum o�cinale F.H. Wigg, Poaceae sp.
Soil classification (WRB 2007): Linic Technosol
(Paracalcaric, Paraarenic)
AuCu – 0–3 cm: soil material accumu-lated in gaps and cracks between bricks, loamy sand, light grey, fresh, clear boundary, high content of carbonates, artefacts (pieces of bricks, mortar; 20%).

85 TECHNOGENIC SOILS OF POLAND
Site 2
Location: Ciasna St., roof of the 19th c
outbuilding, at a height of 4.5 m, Toruń, Northern Poland
Coordinates: 53° 00’ 32.65’’N
18° 36’ 29.43’’ EVegetation: Galinsoga parviflora Cav.,
Stellaria media (L.) Vill.Soil classification (WRB 2007): Linic Technosol
AuCu – 0–5 cm: soil material accumu-lated on the roof surface covered with roofing felt, sand, artefacts (bird feath-ers, pieces of mortar; 30%).
SOILS FORMING ON BUILDINGS IN TORUŃ

TECHNOGENIC SOILS OF POLAND 86
Site 3
Location: Ciasna St., gutter of the 19th c
outbuilding, at a height of 4.5 m, Toruń, Northern Poland
Coordinates: 53° 00’ 32.78’’N
18° 36’ 29.87 EVegetation: Galinsoga parviflora Cav.,
Epilobium adnatum Griseb. Soil classification (WRB 2007): Protofolic Linic Technosol
Ou – 0–5 cm: organic soil material accu-mulated in a galvanized steel gutter, very few artefacts (bird feathers, pieces of mortar; 2%).
P. CHARZYŃSKI, P. HULISZ

87 TECHNOGENIC SOILS OF POLAND
Site 4
Location: Lubicka St., top of the wall constructed
in the 19th c surrounding the meat processing factory Tormięs, at a height of 3 m, Toruń, Northern Poland
Coordinates: 53° 01’ 01.75’’ N
18° 38’ 11.13’’ EVegetation: Taraxacum o�cinale F.H. Wigg,
Plantago media L., Achillea pannonica Scheele
Soil classification (WRB 2007): Linic Technosol (Paraarenic)
Au – 0–3 cm: humus horizon, loamy sand, very dark brown, sharp boundary, arte-facts (pieces of bricks, mortar; 30%).Cu – 3–9 cm: parent material, sand, very pale brown, weathered mortar, high con-tent of carbonates.
SOILS FORMING ON BUILDINGS IN TORUŃ

TECHNOGENIC SOILS OF POLAND 88
Site 5
Location: Bema St., gutter of garages
constructed in the 1970s, at a height of 3 m, Toruń, Northern Poland
Coordinates: 53° 01’ 12.52’’ N 18° 35’ 46.86’’ EVegetation: Acer negundo L.Soil classification (WRB 2007): Protofolic Linic Technosol
Ou – 0–6 cm: organic soil material accu-mulated in a gutter lined with roofing felt, very few artefacts (pieces of mortar; 3%).
P. CHARZYŃSKI, P. HULISZ

89 TECHNOGENIC SOILS OF POLAND
Table 1. Selected soil properties
SITE No. 1 2 3 4 5
BUILDING TYPE wall roof gutter wall gutter
HORIZON AuCu AuCu Ou Au Cu Ou
DEPTH [cm] 0–3 0–5 0–3 0–3 3–9 0–6
PARTICLE SIZE DISTRIBUTION [%]
>2 mm 18 13 — 11 3 —
2 mm–50 µm 86 99 — 87 94 —
50–2 µm 11 1 — 12 2 —
<2 µm 3 0 — 1 4 —
TEXTURE CLASS (USDA)
loamy sand sand — loamy
sand sand —
SOIL MATRIX COLOUR
drymoist
10YR 7/110YR 6/1
——
——
7.5YR 2.5/27.5YR 2.5/1
10YR 8/310YR 8/1
——
OC [%] 3.95 3.87 15.8 6.99 1.00 27.0
Nt [%] 0.292 0.400 0.949 0.347 0.071 1.72
C:N 14 10 17 20 14 16
pHin H2O 7.9 7.1 6.9 7.5 8.2 6.4
in 1M KCl 7.6 7.0 6.6 7.2 7.7 6.0
CaCO3 [%] 5.1 2.1 1.3 1.1 3.7 trace
Pca [mg·kg-1] 245 3920 1050 240 163 1090
Properties of soils forming on buildings
The analysed soils are very shallow, which can be attributed to their specific origin, devel-oped from both mineral (site 1, 2 and 4) and organic sediments (site 3 and 5). The maxi-mum thickness of the soil material was 9 cm. The mineral material was dominated by sands and loamy sands (Table 1), which resulted from the nature of substratum. In most cases, it was masonry mortar containing considerable amounts of sand. The content of fractions finer than sand at sites 1 and 4 (wall) may have resulted from aeolian transpor-tation or alluviation of particles washed down by rainwater from higher parts of the build-ing. A high content of skeleton parts in some soils (i.e. fragments of bricks and slightly weathered mortar) is also worth noting.
SOILS FORMING ON BUILDINGS IN TORUŃ

TECHNOGENIC SOILS OF POLAND 90
The content of organic carbon significantly varied in the studied soils (Table 1). The lowest content of OC was recorded at site 4 (wall, Cu horizon – 1.0%), and the highest content – at site 5 (gutter, Ou horizon) in the soil developed from the organic material (27.0%). The total content of nitrogen (Nt) closely correlated with the OC content and ranged from 0.071 to 1.72%. The C:N ratio in most of the studied soils was narrow and did not exceed the value of 20, which could indicate a regular inflow of fresh organic matter.
The pH values in the studied soils measured in mineral horizons (site 1, 2 and 4) were high and ranged from 7.1 to 8.2 in H2O and from 7.0 to 7.7 in KCl (Table 1). Neutral and alkaline reaction of the samples was probably caused by the presence of binder – a parent substance of masonry mortar. Soils occurring on roofs (site 3 and 5) were characterised by slightly lower pH values (6.4–6.9 in H2O and 6.0–6.6 in KCl), which can be attributed to a high content of organic matter.
The content of CaCO3 in the analysed soils varied and ranged from trace amounts in the gutter (site 5) to 5.1% on the wall (site 1). The content of carbonates was a�ected mainly by a binder contained in the masonry mortar. Whereas accumulation of CaCO3 on the roofs of buildings occurred in places with many cavities facilitating the accumulation of construction debris from damaged facades of buildings, weathering in situ. The soil material present in gutters was characterised by the lowest carbon content. The reason for this was probably much smaller deposition of mortar and the presence of large amounts of organic matter washed o� the roof or derived from the decomposition of lit-terfall (leaves, flowers, small twigs) carried by the wind from trees growing nearby.
The content of phosphorus soluble in 1% citric acid (Pca) ranged from 163 mg·kg-1
(site 4) to 3920 mg·kg-1 (site 2) – Table 1. Determination of the geochemical background is not possible for the analysed soils because of the allochthonous material of unknown origin. The activity of animals should also be accounted for (Crowther 1997). Bird drop-pings, which are a significant source of phosphorus, can accumulate in gutters and on the roofs of buildings. This was evidenced by the presence of artefacts of avian origin (feathers) in some soils.
The content of heavy metals in the studied soils should be attributed mainly to the input of construction materials, such as plates or wires and the impact of pollutants from the atmosphere instead of the natural environmental conditions in the study area of Toruń. High pH values resulting in immobilization of some metals is an additional factor responsible for their accumulation (Brümmer, Herms 1983). The lead content in the analysed soils ranged from less than 16 mg·kg-1 to 214 mg·kg-1 (Table 2). The distance between the study sites and the main tra�c routes may be the di�erentiating factor. Despite the downward trend in recent years, the concentration of this element in the air was relatively high, which is confirmed by the environmental monitoring data (Hilde-brandt et al. 2010). And probably therefore, a relatively high content of Pb (131 mg·kg-1) was recorded at site 4 located at a busy two-lane street connecting the city centre with the largest Toruń outskirts. The copper content ranged from 11 to 110 mg·kg-1. The elevated
P. CHARZYŃSKI, P. HULISZ

91 TECHNOGENIC SOILS OF POLAND
values may suggest that this pollutant originates mainly from corrosion of copper wiring or roof elements in the vicinity of the research sites. The zinc content in the analysed samples was the highest among all the identified heavy metals and ranged from 72 to 654 mg·kg-1. The main source of Zn is the widespread use of zinc carbonate coated steel, i.e. galvanized steel, especially in gutter construction. As in the case of zinc, the highest content of cadmium was found in soils occurring in gutters (sites 4 and 5), i.e. 30 and 41 mg·kg-1, respectively.
Table 2. Content of some heavy metals soluble in a mixture of acids HF and HClO3
Site No. 1 2 3 4 5
Building Type wall roof gutter wall gutter
Horizon AuCu AuCu Ou Au Cu Ou
Depth [cm] 0–3 0–5 0–5 0–3 3–9 0–6
Pb
[mg·kg-1]
<16 42 214 131 <16 96
Cu 26 11 30 110 14 41
Zn 211 136 654 402 72 448
Cd <5 <5 17 <5 <5 18
Summary
Several attempts have been undertaken to define urban soils. According to Blume (1989), urban soil is a sealed natural soil with properties modified as a result of covering the soil surface with anthropogenic material and soil developing on anthropogenic material and occurring in urban agglomerations. Also Hollis described urban soils as any unconsoli-dated organic or mineral material on the Earth's surface with conditions suitable for the plant growth (EÑand, Pouyat 1997). A slightly broader definition was provided by Burghardt (1994; 1996), who defined urban soil as a soil occurring in an urban ecosystem (Urbic Technosol) with elements resulting from human activity, including truncated hori-zons, deposition of natural and technogenic material, churning, intrusions of liquids and gases into the soil. Soils described in the present chapter fall into the aforementioned definitions. Their formation would have been impossible without a human factor, i.e. ar-chitectural objects providing a platform for their development and inflow of allochtho-nous soil material, both of technogenic (weathering mortar) and natural origin (parts of plants, bird droppings).
So far, other researchers have not been interested in these soils, except for Burghardt (1996) who, however, outlined only one of the possible scenarios for the development of
SOILS FORMING ON BUILDINGS IN TORUŃ

TECHNOGENIC SOILS OF POLAND 92
soils on buildings, i.e. the development of aerosols as a result of aeolian accumulation of the material produced by vehicular tra�c. The spontaneous development of the studied soils on the technogenic substratum was, however, not accounted for, e.g. mor-tar with mineral and organic matter brought by wind, rainwater or animals.
Soils develop on buildings in a very specific way – spontaneously, without inten-tional human activity, but the soil parent material is highly technogenic. Properties of these soils are primarily dependent on the characteristics of construction materials, as well as environmental conditions under which the soil substratum is deposited and transformed by living organisms. Therefore, in a sense, the soils may be defined as semi-natural or semitechnogenic, and their genesis − as natural (Charzyński et al. 2011). Furthermore, the analysed soils can also be considered as a technogenic analogue of natural initial soils.
Soils forming on buildings are usually ephemeral, which is associated with specific character of objects on which they developed. Some buildings, i.e. ruins of no historical value, might be demolished within a short time as they are a blot on city centres. Gut-ters with soils may break o� under the load of deposited material or they may be cleaned. Buildings of historical importance (site 1), still used by man, are periodically cleaned of all the soil and vegetation. The presence of geomembrane in the floor, in-stead of the roof (Ekranosols), is an important distinguishing feature of the analysed soils. In this case, a shielding layer does not reduce the impact of the external environ-ment on the soil development, but blocks the contact with natural or technogenic soils occurring on the Earth's surface.
The main factor determining the physical and chemical characteristics of the ana-lysed soils is their location sensu stricto, i.e. roof, gutter, wall, etc.
Based on the performed analysis of soils developing on buildings, we propose a new taxonomic unit called Edifisols (Latin aedificium = building), which should be intro-duced to urban soil taxonomy.
It is also recommended to provide a possibility of precise classification of the de-scribed soils in the international classification of WRB, because they develop world-wide in places where man creates housing estates and carries out business activity. In the currently valid edition of WRB (IUSS Working Group WRB 2007), Edifisols may be classified as Linic Technosols, although this unit was created rather for soils intention-ally placed on the top of buildings, the so-called "green roofs".
The above classification does not specify the nature of soils, i.e. their spontaneous development without intentional human activity, so the next edition of WRB should include the additional qualifier Edific.
The definition of this qualifier should account for the lack of contact with substratum (the presence of geomembrane), due to location on the buildings, and spontaneous development as a result of weathering of technogenic material in situ, and also the supply of mineral and organic matter carried by wind, rainwater or animals.
P. CHARZYŃSKI, P. HULISZ

93 TECHNOGENIC SOILS OF POLAND
References
1. Achkasov A.I., Basharkevich I.L., Varava K.V., Samayev S.B. 2006. Snow cover pollution by icing-reducing reagents. Prospect. Contr. Geolog. Environ. 9–10: 132–137 (in Russian).
2. Blume H.-P. 1989. Classification of soils in urban agglomerations. Catena 16: 269–275.
3. Brümmer G., Herms U. 1983. Influence of soil reaction and organic matter on the solubility of heavy metals in soils. [In:] B. Ulrich, J. Pankrath (Eds.) E²ects of accumulation of air pol-lutants in forest ecosystems. D. Reidel Publishing Company, Dordrecht: 233–243.
4. Burghardt W. 1994. Soils in urban and industrial environments. Z. Pflanzenernahr. Bodenk. 157: 205–214.
5. Burghardt W. 1996. Boden und Böden in der Stadt. Substrate der Bodenbildung urban, gewerblich und industriell überformter Flächen. [In:] Urbaner Bodenschutz. Springer Verlag: 7–44.
6. Charzyński P., Bednarek R., Chmurzyński M. 2011. Properties of soils forming on the buildings in Toruń city. [In:] M. Jankowski (Ed.). Selected problems of genesis, systematics, manage-ment and soil protection in region of Kuyavia and Pomerania. PTSH, PTG, Toruń: 11–28 (in Polish).
7. Crowther J. 1997. Soil Phosphate Surveys: Critical Approaches to Sampling, Analysis and Interpretation. Archaeol. Prospect. 4: 93–102.
8. Duchoslav M. 2002. Flora and vegetation of stony walls in East Bohemia (Czech Republic). Preslia 74: 1–25.
9. EÑand W., Pouyat R. 1997. The genesis, classification, and mapping of soils in urban areas, Urban Ecosys. 1: 217–228.
10. Hildebrandt K., Jankowski J., Solarczyk A., Wojtczak H. 2000. The report of the monitoring study carried out in 2009 in the city of Toruń. Inspekcja Ochrony Środowiska, WIOŚ, Toruń (in Polish).
11. IUSS Working Group WRB. 2007. World References Base for Soil Resources 2006. Update 2007, World Soil Resources Reports, 103, FAO, Rome.
12. Jasieńko J., Mierzejewska O., Hamrol K., Misztal W. 2011. Fixing the wall crests in historic building structures to be exhibited as permanent ruin. Conservation News 30: 117–132.
13. Lisci M., Monte M., Pacini E. 2003. Lichens and higher plants on stone: A review. Int. Biodete-rioration Biodegrad. 51: 1–17.
14. van Reeuwijk L.P. 2006. Procedures for soil analysis. 7th Edition. Technical Report 9, ISRIC – World Soil Information, Wageningen, Netherlands.
15. Woodell S. 1979. The flora of walls and pavings. [In:] I. C. Laurie (Ed.). Nature in cities. John Wiley & Sons, Chichester: 135–157.
SOILS FORMING ON BUILDINGS IN TORUŃ


95 TECHNOGENIC SOILS OF POLAND
Introduction
The soil development in the surface layer of the earth's crust is a result of soil-forming factors, such as parent material, climate, organisms (vegetation and fauna), relief and time. The advent of man on Earth and the development of civilisation added another important factor in soil formation − human activity (Jenny 1941; Dokuchaev 1949; Mulins 1991). The latter factor has led to the transformation of soils, especially in the areas of intensive settlement (Baran, Turski 1996) and deforestation of natural ecological systems (Vitousek et al. 1997). Such places may include cemeteries, where specific land use has degraded the natural soil cover.
Earlier soil science studies have led to the identification of a new type of soil formed in cemeteries as Necrosol. This is a specific type of soil that is exposed to unequal pro-portions of mechanical and chemical changes in the soil profile, as well as to natural soil-forming processes. Physical changes lead to the formation of specific horizons not found in soils devoid of technogenic influence (Stroganova et al. 1998; Stroganova, Prokofieva 2000; Gerasimova et al. 2003). Human activity contributes to changes in physical and chemical properties of cemetery soils.
The issue of Necrosols did not appear in the scientific literature until the second half of the 20th century. The precursors in this field were Czechoslovak researchers Smolik (1957) and Svec and Hlina (1978). Necrosols were described in detail by the Slovak researcher Sobocká (1999; 2003; 2004). The first classification was delivered by Burghardt (1994).
In Poland, cemetery soil properties have been described by Charzyński et al. (2011), as well as by Majgier and Rahmonov (2012).
NECROSOLS OF CEMETERIES IN MASURIAN LAKELAND
LESZEK MAJGIER OIMAHMAD RAHMONOV
5

TECHNOGENIC SOILS OF POLAND 96
Study area and soil profiles documentation
The investigation was conducted in the abandoned evangelical cemeteries in the villages of Rudówka Mała and Wejdyki. They are located in the Ryn commune in the Great Masu-rian Lake District, in the central part of the Masurian Lakeland (Fig. 1). Moraine deposits from the Weichselian Glaciation are the parent material for soil development in this re-gion. They consist mostly of boulder clay, sand and gravel with a substantial contribution of limestone fragments of di�erent sizes (Kondracki 2002).
The investigated cemeteries were founded in the 19th century by people of German and Masurian origin. They have not been used since the end of World War II (Płotek 2011) and are devastated and overgrown as a result of natural succession (Majgier, Rah-monov 2010; 2012; Rahmonov et al. 2010).
The cemeteries were surveyed by taking four soil profiles: two in Rudówka Mała (pro-files 1 and 2) and two in Wejdyki (profiles 3 and 4). The profiles were divided into two groups: burial Necrosols (profiles 1 and 3) and undisturbed cemetery soils (profiles 2 and 4).
Fig. 1. Location of investigated cemeteries
L. MAJGIER, O. RAHMONOV

97 TECHNOGENIC SOILS OF POLAND
Profile 1
Location: Cemetery Rudówka Mała
Ryn commune Northern Poland
Coordinates: 53°55.550’ N
21°37.443’ ESoil classification (WRB 2007): Urbic Technosol
A – 0–30 cm: loose sand, dark greyish brown, fresh, penetrated by thin roots of plants, abrupt boundary.Bu1 – 30–70 cm: large contribution of material originated from A horizon, loose sand, yellowish brown, fresh, occasionally penetrated by thin roots of plants, a few artefacts (pieces of con-crete, pieces of bricks; 5%), gradual boundary.Bu2 – 70–100 cm: slight contribution of mate-rial originated from A horizon (gravel), loose sand, yellowish brown, fresh, penetrated by large roots of plants, gradual boundary.Bu3 – 100–125 cm: large contribution of material originated from Bu2 layer, loose sand, yellowish brown, fresh, penetrated by thin roots of plants, a few artefacts (pieces of concrete, pieces of bricks, stones; 15%), gradual boundary.Bu4 – 125–148 cm: artificial enrichment with anthropogenic organic matter, loamy sand, yellowish brown, fresh, roots of plants absent, iron concretions, a lot of artefacts (bones, co�n remains, clothing pieces, gravel, stones; <30%), abrupt boundary.C – below 148 cm: loose sand, pale yellow, fresh, occasionally penetrated by thin roots of plants.
NECROSOLS OF CEMETERIES IN MASURIAN LAKELAND
0 cm
50 cm
100 cm
150 cm

TECHNOGENIC SOILS OF POLAND 98
L. MAJGIER, O. RAHMONOV
Table 1. Selected soil properties – profile 1
HORIZON A Bu1 Bu2 Bu3 Bu4 C
DEPTH [cm] 0–30 30–70 70–100 100–125 125–148 <148
PARTICLE SIZE DISTRIBUTION [%]
>2 mm 3 8 40 19 42 <1
2 mm–50 µm 93 97 95 94 90 99
50–2 µm 7 3 3 3 7 1
<2 µm 0 0 2 3 3 0
TEXTURE CLASS (USDA)
loose sand
loose sand
loose sand
loose sand
loamy sand
loose sand
SOIL MATRIX COLOUR
drymoist
10YR 4/210YR 2/2
10YR 5/410YR 3/6
10YR 5/410YR 3/6
10YR 5/410YR 3/3
10YR 5/410YR 3/4
2.5Y 7/32.5Y 5/3
OC [%] 3.36 0.41 1.15 0.43 0.61 0.07
Nt[%] 0.170 0.017 0.121 0.017 0.026 0.007
C:N 20 24 9 25 23 10
pHin H2O 7.2 8.2 8.1 8.4 8,2 8.6
in 1M KCl 6.5 7.6 7.5 7.9 7.6 8.1
CaCO3 [%] 1.0 1.5 2.0 1.9 1.2 5.1
Pt [mg·kg-1] 1560 249 2010 239 259 184

99 TECHNOGENIC SOILS OF POLAND
NECROSOLS OF CEMETERIES IN MASURIAN LAKELAND
Profile 2
Location: Cemetery Rudówka Mała,
Ryn commune, Northern Poland
Coordinates: 53°55.550’ N
21°37.434’ ESoil classification (WRB 2007): Brunic Arenosol
A – 0–31 cm: loose sand, very dark grey, fresh, penetrated by many thin roots of plants, a few artefacts (pieces of concrete, pieces of bricks; >5%), abrupt boundary.
Bwo1 – 31–100 cm: loose sand, dark yellowish brown, fresh, penetrated by many thin roots of plants, iron con-cretions, gradual boundary.
Bwo2 – 100–155 cm: loose sand, brown, fresh, penetrated by many thick roots of plants, gradual boundary.
C – below 155 cm: loose sand, light yellowish, fresh, occasionally pene-trated by thin roots of plants.
0 cm
50 cm
100 cm
150 cm

TECHNOGENIC SOILS OF POLAND 100
Table 2. Selected soil properties – profile 2
HORIZON A Bwo1 Bwo2 C
DEPTH [cm] 0–30 30–100 100–155 < 155
PARTICLE SIZE DISTRIBUTION [%]
>2 mm 6 7 9 4
2 mm–50 µm 94 95 95 97
50–2 µm 6 5 5 3
<2 µm 0 0 0 0
TEXTURE CLASS (USDA)
loose sand
loose sand
loose sand
loose sand
SOIL MATRIX COLOUR
drymoist
10YR 3/110YR 2/1
10YR 4/410YR 3/4
10YR 4/310YR 3/2
2.5Y 6/32.5Y 4/3
OC [%] 3.66 0.39 1.07 0.05
Nt [%] 0.257 0.007 0.034 0.005
C:N 14 56 31 11
pHin H2O 7.4 8.0 8.0 8.4
in 1M KCl 6.8 7.3 7.4 8.0
CaCO3 [%] 0.3 0.9 1.9 5.4
Pt [mg·kg-1] 323 246 468 446
L. MAJGIER, O. RAHMONOV

101 TECHNOGENIC SOILS OF POLAND
Profile 3
Location: Ryn commune,
Northern PolandCoordinates: 53°55.140’ N
21°30.080’ ESoil classification (WRB 2007): Ekranic Technosol
TombstoneA – 0–10 cm: loose sand, dark greyish brown, fresh, penetrated by many thin roots of plants, abrupt boundary.
Bu1 – 10–60 cm: large contribution of material originated from A horizon, loose sand, brown, fresh, penetrated by many thin roots of plants, a few arte-facts (pieces of concrete; <10%), gradual boundary.
Bu2 – 60–110 cm: small contribution of material originated from A horizon and large contribution of material originated from Bu1 layer, loose sand, brown, fresh, penetrated by many thin roots of plants, a few artefacts (pieces of concrete, stones; 10%), abrupt boundary.
Bu3 – 110–140 cm: artificial enrichment with anthro-pogenic organic matter, loose sand, brown, fresh, penetrated by many thin roots of plants, a lot of artefacts (bones, co�n remains, pieces of con-crete, gravel; <30%), gradual boundary.
Bu3C – 140–160 cm: transitional horizon mixed with Bu3 layer, loose sand, yellowish brown, fresh, penetrated by many thin roots of plants, a few artefacts (bones; 15%), gradual boundary.
C – below 160 cm: loose sand, light yellowish brown, fresh, no roots.
NECROSOLS OF CEMETERIES IN MASURIAN LAKELAND
0 cm
50 cm
100 cm
150 cm

TECHNOGENIC SOILS OF POLAND 102
Table 3. Selected soil properties – profile 3
HORIZON A Bu1 Bu2 Bu3 Bu3C C
DEPTH [cm] 0–10 10–60 60–110 110–140 140–160 < 160
PARTICLE SIZE DISTRIBUTION [%]
>2 mm 9 17 18 37 25 12
2 mm–50 µm 94 94 93 95 96 93
50–2 µm 6 6 7 5 4 6
<2 µm 0 0 0 0 0 1
TEXTURE CLASS (USDA)
loose sand
loose sand
loose sand
loose sand
loose sand
loose sand
SOIL MATRIX COLOUR
drymoist
10YR 4/210YR 2/2
10YR 5/310YR 3/3
10YR 5/310YR 3/3
10YR 4/310YR 3/3
10YR 5/410YR 3/6
2.5Y 6/32.5Y 4/3
OC [%] 0.21 0.41 1.11 2.51 0.17 1.07
Nt [%] 0.006 0.034 0.027 0.064 0.024 0.020
C:N 36 12 41 39 7 53
pHin H2O 7.1 7.5 7.6 7.4 7.8 8.1
in 1M KCl 6.4 7.0 7.0 6.7 7.3 8.0
CaCO3 [%] 0.6 0.5 0.4 0.8 0.6 6.0
Pt [mg·kg-1] 240 290 308 680 660 291
L. MAJGIER, O. RAHMONOV

103 TECHNOGENIC SOILS OF POLAND
Profile 4
Location: Cemetery Wejdyki,
Ryn commune, Northern Poland
Coordinates: 53°55.141’ N
21°30.100’ E
Soil classification (WRB 2007): Brunic Arenosol
A – 0–10 cm: loose sand, very dark greyish brown, fresh, penetrated by many thin roots of plants, a few artefacts (pieces of concrete; 5%), gradual boundary.
ABo – 10–30 cm: loose sand, brown, fresh, calcium carbonate concretions, penetrated by many thin roots of plants, gradual boundary.
Bwo1 – 30–80 cm: loose sand, light yellowish brown, fresh, penetrated by many thin roots of plants, iron concretions, gradual boundary.
Bwo2 – 80–100 cm: loamy sand, pale brown, fresh, penetrated by many thin roots of plants, gradual boundary.
NECROSOLS OF CEMETERIES IN MASURIAN LAKELAND
0 cm
50 cm
100 cm

TECHNOGENIC SOILS OF POLAND 104
Table 4. Selected soil properties – profile 4
HORIZON A ABo Bwo1 Bwo2 C C2
DEPTH [cm] 0–10 10–30 30–80 80–100 100–120 < 120
PARTICLE SIZE DISTRIBUTION [%]
>2 mm 7 9 5 8 0 3
2 mm–50 µm 95 94 94 86 99 95
50–2 µm 5 6 6 12 1 5
<2 µm 0 0 0 2 0 0
TEXTURE CLASS (USDA)
loose sand
loose sand
loose sand
loamy sand
loose sand
loose sand
SOIL MATRIX COLOUR
drymoist
10YR 3/210YR 2/1
10YR 4/310YR 2/2
10YR 6/410YR 4/4
10YR 6/310YR 4/3
10YR 5/410YR 4/4
2.5Y 6/32.5Y 4/3
OC [%] 3.04 0.47 0.09 0.06 0.06 0.04
Nt [%] 0.146 0.046 0.008 0.006 0.010 0.006
C:N 21 10 12 10 — —
pHin H2O 6.9 7.7 8.1 7.8 7.5 8.5
in 1M KCl 6.3 7.4 7.6 6.8 6.8 6.8
CaCO3 [%] 0.01 0.01 0.01 0.01 0.01 0.05
Pt [mg·kg-1] 572 267 152 111 188 144
Influence of the burial process and cemeteries use on soil properties
Cemetery soils were divided in accordance with their character into burial Necrosols (with the direct influence of the burial on the profile) and undisturbed cemetery soils (soil in the cemetery area, not exposed to direct influence of the burial, but exposed to indirect im-pact of cemetery use). Morphological descriptions were made for all investigated profiles, and samples were taken from genetic horizons and layers for laboratory analysis. Soil samples were submitted to standard physical and chemical analyses (van Reeuwijk 2006).
L. MAJGIER, O. RAHMONOV

105 TECHNOGENIC SOILS OF POLAND
In the past, the soils in abandoned cemeteries were exposed to strong techno- and anthropogenic pressure, related to the nature of these sites and the consequent type of land use. As a result, they have special properties compared to soils that remain outside the influence of cemeteries. The research results also showed significant di�erences between soils located in individual cemeteries.
As evidenced by the research, one of the most important morphological features of burial Necrosols was the distortion of the natural sequence of genetic horizons and their replacement with the mixed human-disturbed layers (Bu). A larger number of technogenic layers was mainly connected with the contribution of material of the overlying layers and horizons (especially gravel), the presence of man-made artefacts coming from the cemetery infrastructure (concrete, brick, glass, plastic) and the presence of plant material that has entered deeper into the soil profile.
In the case of profiles 1 and 3, the technogenic layers artificially enriched with organic matter (Bu3 and Bu4) were associated with the process of grave digging, deposition of a co�n and backfilling. In this way, there was a secondary supply of technogenic mate-rial to the soil profile, which exerted further impact on the soil chemistry. The depth of this layer was determined by the nature of the burial. In the studied burial Necrosols, the depth of the technogenic layer enriched with ex situ organic matter ranged from 110 cm to 150 cm. The distinguishing feature of this layer was its peculiar brown colour, result-ing from the decomposition of co�n wood. This is characteristic of burial Necrosols.
The investigated burial Necrosols were distinguished by a large contribution of skeletal particles (>2 mm) − mainly artefacts, which Sobocká (2004) considers to be typical of Necrosols. This is especially important for the technogenic layers, which in some cases of the analysed profiles contained over 30% of the skeletal particles (gravel and man-made artefacts).
All the examined soil profiles were characterised by neutral to alkaline reaction. This is due to a high content of carbonates in the parent material, and thus the presence of these compounds in other horizons and layers. In addition, a significant contribution of artefacts in Necrosols, especially elements of the cemetery infrastructure (concrete de-bris), a�ects the soil alkalisation due to their chemical composition. The increase in pH of Necrosol layers and horizons was noted (Tables 1–4). The reaction of mechanically untransformed soils (undisturbed cemetery soils) was indirectly a�ected by a cemetery through a secondary supply of carbonates.
As evidenced by the research, the organic carbon (OC) content both in burial Necro-sols and undisturbed cemetery soils varied. The highest OC content was recorded in humus horizons of burial and undisturbed Necrosols (from 0.21% to 3.66%) and the technogenic layers enriched with organic matter from ex situ (Bu4, Bu3) of the burial Necrosols (from 0.61 % to 2.51 %). A similar situation was observed for the total nitro-gen (Nt) content (Tables 1–4).
NECROSOLS OF CEMETERIES IN MASURIAN LAKELAND

TECHNOGENIC SOILS OF POLAND 106
Phosphorus is a crucial geochemical indicator in pedological studies of anthropo-genic and technogenic soils (Go�er 1980; Gebhardt 1982; Andrzejewski, Socha 1998; Bednarek 2007, 2008; Bednarek, Markiewicz 2007; Markiewicz 2011). Its higher content in the soil may reflect the anthropogenization of the environment (Brzeziński et al. 1983; Bednarek et al. 2004; Chudecka 2009). The usefulness of the phosphorus method in the research on cemetery soils has been ascertained by other authors (Sobocká 2004; Charzyński et al. 2011; Żychowski 2011; Majgier, Rahmonov 2012), as well as by the pre-sent study.
The total phosphorus content (Pt) in the studied soils was determined by Bleck method, modified by Gebhardt (1982). The highest accumulation of Pt was found in the A horizons and layers enriched with organic matter from ex situ (profile 1 – Bu4 and profile 3 – Bu3) of the burial Necrosols (259–2 010 mg·kg-1), and in the humus horizons of both burial Necrosols and undisturbed soils (240–1 560 mg·kg-1).
For comparative purposes, based on the soil outside the cemeteries, the background value of phosphorus was determined for the cemeteries in the Ryn commune. The standard phosphorus content in the area was up to 300 mg·kg-1. This value is close to the average geochemical background for north-east Poland, i.e. 250 mg P·kg-1 (Geo-chemical Atlas of Poland 1995).
High levels of phosphorus accumulation in the humus horizons of all soils from the investigated cemeteries are associated with organic fertilisers used for soil fertilization in the areas where ornamental plants are grown. Similar values were found for other soil used for garden vegetation growing (Chudecka 2009). However, a high concentration of phosphorus in the technogenic layers (especially in the layers artificially enriched with organic matter) is closely linked with burials. It should be noted that the recorded con-tents of Pt were lower than the results obtained at archaeological sites (Bednarek et al. 2004; Bednarek, Markiewicz 2007; Bednarek 2008) and in mass graves (Żychowski 2011).
Summary
Due to di�erent degrees of soil transformation within the cemeteries, it is suggested that the soils developed due to mechanical transformation, leading to disturbances in natural genetic horizons, should be classified as burial Necrosols. Other undisturbed cemetery soils have not been transformed mechanically, but they are indirectly a�ected by burials, especially in surface horizons.
Burial Necrosols develop due to mechanical transformation leading to disturbances in natural genetic horizons and the formation of intermingled technogenic layers with the presence of anthropogenic layers artificially enriched with organic matter. These layers have a specific brown colour, derived from decaying co�n wood and a high con-tent of extraneous material in the form of artefacts (for example bones, co�n remains).
L. MAJGIER, O. RAHMONOV

107 TECHNOGENIC SOILS OF POLAND
Undisturbed cemetery soils do not have technogenic layers, instead they preserve their natural genetic horizons. The major changes in their morphology are observed in the surface horizons, which contain technogenic material (fragments of concrete, brick and glass) from the cemetery infrastructure (especially tombstones).
Chemical changes in burial Necrosols apply to the entire soil profile and include the following parameters: increased content of organic carbon (OC) and total nitrogen (Nt), a high content of total phosphorus (Pt) and higher pH value, all in relation to untrans-formed soil outside the cemeteries. Similar changes of chemical properties in undis-turbed cemetery soils are recorded only in the surface horizons.
Based on our research and the research by Charzyński et al. (2011), we believe that the qualifier Necric should be added to the list of qualifiers for Technosols RSG in the World Reference Base for Soil Resources (IUSS Working Group WRB 2007). This will improve the characterization of burial Necrosols. Furthermore, a su�x for technogenic subsoil layer artificially enriched with organic matter should be also added (characteris-tic of burial Necrosols) in FAO Guidelines for Soil Description (2006).
References
1. Andrzejewski M., Socha T. 1998. Phosphorus and its usefulness in the archaeological study. [In:] W. Śmigielski (Ed.). Life sciences and aerial photography in archaeology 9: 57–63 (in Polish).
2. Baran S., Turski R. 1996. Degradation, protection and remediation of soils. Lublin (in Polish).
3. Bednarek R. 2007. Significance of pedology studies in environmental archaeology. [In:] M. Makohonienko, D. Makowiecki, Z. Kurnatowska (Eds.). Environment-Human-Civilization 1, Bogucki Wyd. Nauk., Poznań: 71–91 (in Polish).
4. Bednarek R. 2008. The use of paleopedological and soil science methods in archaeological research. [In:] W. Chudziak (Ed.). The human and the natural environment in the Middle Ages, in the light of interdisciplinary research. Wyd. Naukowe UMK, Toruń: 63–106 (in Polish).
5. Bednarek R., Markiewicz M. 2007. The phosphorus content in the soil, as an indicator of early human activity in the early medieval fortified settlements in Pokrzydowo and Gronowo (Chełmińsko-Dobrzyńskie Lakeland). [In:] E. Smolska, P. Szwarczewski (Eds.). Record of hu-man activity in the natural environment, 3. Wyd. SWPR, Warsaw (in Polish).
6. Bednarek R., Jankowski M, Kwiatkowska A., Markiewicz M., Świtoniak M. 2004. The diversity of phosphorus in soils within the complex in Kałdus settlement and its surroundings. [In:] W. Chudziak (Ed.) Natural and archaeological studies. Seria: Mons Sancti Laurentii, 2. Wyd. UMK: 199–208 (in Polish).
7. Brzeziński W., Dulinicz M., Kobyliński Z. 1983. The phosphorus content in the soil as an indi-cator of ancient human activity, Kwart. Hist. Kult. Mater. 31: 277–297 (in Polish).
8. Burghardt W. 1994. Soil in urban and industrial environments. Zeitschrift Planzenernahr. Bodenkunde 157: 205–214.
NECROSOLS OF CEMETERIES IN MASURIAN LAKELAND

TECHNOGENIC SOILS OF POLAND 108
9. Charzyński P., Bednarek R., Świtoniak M., Żołnowska B. 2011. Ekranic Technosols and Urbic Technosols of Toruń Necropolis. Geologija 53, 4(76): 179–185.
10. Chudecka J. 2009. Characteristics of soil substrate in a anthropogenic layer of the oldest part of Szczecin. Wydawnictwo Uczelniane Zachodniopomorskiego Uniwersytetu Technologicznego, Szczecin (in Polish).
11. Dokuchaev V.V. 1949. Lectures on soil science. Izbr. Sochet., T. 3. Moscow (in Russian).
12. Guidelines for Soil Description. 2006. 4th Edition, FAO, Rome, Italy.
13. Gebhardt H. 1982. Phosphatkartierung und bodenkundliche Geländeunter-suchungen zur Ein-grenzung historischer Siedlungs- und Wirtschaftsflächen der Geestinsel Flögeln, Kreis Cux-haven – Verlag August des Hildesheim.
14. Geochemical Atlas of Poland. 1995. J. Lis, A. Pasieczna (Eds.). 1: 2 500 000, Państwowy Instytut Geologiczny, Warsaw.
15. Gerasimova M. I., Stroganova M. N., Mozharova M. W., Prokofieva T. W. 2003. Anthropogenic soils (Genesis, geography, recultivation). Moscow (in Russian).
16. Go�er Z. 1980. Archaeological chemistry. A sourcebook on the applications of chemistry to archaeology. New York: 334–338.
17. IUSS Working Group WRB. 2007. World References Base for Soil Resources 2006. Update 2007, World Soil Resources Reports, 103, FAO, Rome.
18. Jenny H. 1941. Factors of soil formation. McGraw – Hill Book Co., New York.
19. Kondracki J. 2002. Regional geography of Poland. Wyd. Nauk. PWN, Warsaw (in Polish).
20. Majgier L., Rahmonov O. 2010. The need to protect cultural landscape for example aban-doned cemeteries in Ryn commune (GML). Kształtowanie środowiska geograficznego na ob-szarach uprzemysłowionych i zurbanizowanych. Wydział Biologii i Ochrony Środowiska, Wydział Nauk o Ziemi, Katowice-Sosnowiec 41:41–51 (in Polish with English abstract).
21. Majgier L., Rahmonov O. 2012. Selected chemical properties of Necrosols from the abandoned cemeteries Słabowo and Szymonka (Great Mazurian Lakes District), Bull. Geogr. – Phys. Geogr. Ser. 5: 43–56.
22. Markiewicz M. 2011. Phosphorus in the study of the former settlement. [In:] M. Drewnik, A. Kacprzak, W. Szymański (Eds.). History and developments of geography of soils in Poland. Wyd. IGiGP UJ, Cracow: 78–79 (in Polish).
23. Mulins C.E. 1991. Physical properties of soil in urban areas. [In:] P. Bulloc, P.J. Gregory (Eds.) Soil in the Urban Environment, Blackwell, Oxford: 88–118.
24. Płotek M. 2011. Di�cult beginnings. Mazury District in 1945–1946. Wyd. Retman, Dąbrówno (in Polish).
25. Rahmonov O., Jędrzejko K., Majgier L. 2010. The secondary succession in the area of aban-doned cemeteries in northern Poland. [In:] M. Barančoková, J. Krajčí, J. Kollár, I. Belčáková (Eds.) Landscape ecology – methods, applications and interdisciplinary approach. Institute of Landscape Ecology, Slovak Academy of Sciences, Bratislava: 647–657.
26. Smolik F. 1957. Pedology. Praha (in Slovak).
L. MAJGIER, O. RAHMONOV

109 TECHNOGENIC SOILS OF POLAND
27. Sobocká J. 1999. The current state of knowledge and evaluation of anthropogenic soils in Slovakia. Rostl. Vyroba 45(5): 237–244 (in Slovak).
28. Sobocká J. 2003. Urban Soils vs. Anthropogenic Soils, their Characteristics and Functions. Phytopedon 2: 76–80.
29. Sobocká J. 2004. Necrosol as a new anthropogenic soil type. [In:] Soil Anthropization VII, Bratislava, Slovakia: 107–112.
30. Stroganova M., Myagova A., Prokofieva T., Skvortsova I. 1998. Soil of Moscow and urban en-vironment. Moscow.
31. Stroganova M., Prokofieva T. 2000. Urban soils – concept, definitions, classification. [In:] A First International Conference on Soils of Urban Industrial, Tra�c and Mining Area. Proceedings 1: 235–239.
32. Svec F., Hlina J. 1978. Hygiene of urban communities. Praha (in Slovak).
33. van Reeuwijk L.P. 2006. Procedures for soil analysis. 7th Edition. Technical Report 9, ISRIC – World Soil Information, Wageningen, Netherlands.
34. Vitousek P.M., Mooney H.A., Lubchenco J., Melillo J.M. 1997. Human domination on earth’s ecosystems. Science 277: 494–499.
35. Żychowski J. 2011. The impact of cemeteries in Kraków on the natural environment – selected aspects. Geogr. Polon. 84: 5–23.
NECROSOLS OF CEMETERIES IN MASURIAN LAKELAND


111 TECHNOGENIC SOILS OF POLAND
Introduction
The archaeological sites in the form of remnants of ancient settlements are common parts of landscapes. They constitute valuable sources of information on the ancient human settlements. In the past, the Chełmno Land, due to the specificity of the natu-ral environment, created uniquely favourable conditions for the development of human communities. The surface landform facilitating the protection against enemies, access to water, relatively fertile soils and abundance of wild animals living in the nearby forests, have become factors contributing to origination of settlements. The initial groups of people arrived here shortly after the withdrawal of the glacier, during the Alleröd inter-stadial, about 11 800–10 900 years ago. But those people led mainly a nomadic life, without creating sustainable human settlements. The first farmers arrived in the catch-ment areas of the Vistula, Oder, Elbe, Rhine and Danube as late as in the second half of the 5th century BC, starting with the early Stone Age – Neolithic (6 150–3 650 BP). It is believed that the breakthrough in the socio-economic development took place at that time. The transition from the hunter-gatherer economy to farming and breeding re-sulted in the slow process of transition to a settled way of life and a significant increase in the population density (Strzałko, Ostoja-Zagórski 1995). This was also the time when the anthropogenic soils started to develop.
The specific anthropogenic soils are traditionally present within the areas of ancient human settlements. Their structure and properties result from both natural processes of soil formation and intensive human activities due to the presence of human com-munities in relatively small areas, limited to settlements and adjacent areas. These soils are characterised by a modification of certain morphological features and chemical, physicochemical and physical properties that distinguish them from similar soils in the neighbourhood, but are not transformed by former human activities. They are distin-guished by the presence of sharp boundaries between di�erent soil units and between
‘PALEOTECHNOSOLS’ OF ANCIENT SETTLEMENTS IN GRODNO AND KAŁDUS
MACIEJ MARKIEWICZ RENATA BEDNAREK MICHAŁ JANKOWSKI MARCIN ŚWITONIAK
6

TECHNOGENIC SOILS OF POLAND 112
individual components of soils (Bednarek, Markiewicz 2006). They often lack intermediate zones, called pedoecotones, which are very characteristic of the natural soils (Bednarek, Prusinkiewicz 1980).
The soils transformed by man in the past can be called ‘Paleotechnosols’ due to their similarity in their origin to contemporary forming Technosols, defined as soils which are severely influenced by various human activities, but not only by cultivation (IUSS Working Group WRB 2007). The ‘Paleotechnosols’ contain large amounts of artefacts (e.g. frag-ments of clay or flint pottery, tools made of various materials, often burned, etc.). The feature that distinguishes these soils from the other Technosols is the time of origin, as-sociated with the former settlement (hundreds to thousands of years ago).
Study area and soil profile documentation
This paper shows characteristic of two selected soil profiles representative of the archae-ological sites from the Chełmno Land – the Lusatian archaeological site in Grodno and the Early-Medieval site in Kałdus. The location of the study sites were presented in Figure 1. All pedons were situated on the right bank of the Vistula River. The analysis of soil samples collected from horizons and layers was performed according to international standards (van Reeuwijk 2006). In addition, the total phosphorus content (Pt) was determined by Bleck’s method, modified by Gebhardt (1982).
Description of morphology in each profile can be found on next pages. Results of the analysis were presented in Tables 1–2.
The soil samples for the spatial di�erentiation map of phosphorus content in the early medieval cultural horizon of sub-town settlements in Kałdus (Fig. 2) were col-lected from the boreholes carried out at intervals of 30 m.
The Archaeological site of GrodnoThis site is located in the Chełmno Lake District (Fig. 1). It includes an oval lake peninsula, with an area of about 1.5 ha and a diameter of about 90–100 m, located in the bottom of the Chełmno subglacial channel at Lake Grodno (Tomczak 1967). The central, flat part of the peninsula lies at an altitude of about 90 m above sea level and about 5 m above the lake surface. The results of underwater excavations (Szulta 1998) show that in the ar-chaeological past, this area was a lake island connected with the mainland by a wooden bridge. Currently, in the western part of the peninsula (the site of the old bridge), there is a narrowing field with a length of about 100 m.
The central part of the Grodno peninsula is used for agricultural purposes – alfalfa growing. The edges are covered with clusters of deciduous trees and shrubs forming a sub-assembly of a typical subcontinental broadleaved forest Tilio-Carpinetum typicum.
On the lake island, there was a fortified settlement dated back to the Lusatian culture and later a medieval open village from the turn of the 10th and 11th century (Bagniewski 1977;
M. MARKIEWICZ, R. BEDNAREK, M. JANKOWSKI, M. ŚWITONIAK

113 TECHNOGENIC SOILS OF POLAND
Gackowski 1997, 1998; Szulta 1998). The Lusatian settlement was surrounded from almost all sides with a single-row palisade made of ‘ripped’ oak wood and an earth embankment, and connected with the mainland by a wooden bridge with a length of about 70–80 m. Based on the oak wood dendrochronological measurements, it is known that the building materials were young, 41–89-year old oak trees Quercus sp. Therefore, the relative age of the settlement was esti-mated at 60–70 ± 20 years. It is believed that three generations of people lived there and used the land. Using the radio-carbon method, the absolute chronology was determined (Gackowski, Krąpiec 2000). It was found that the wood building material was gathered from the neighbouring areas within short intervals, probably in the 8th century BC, while the Grodno fortified settlement existed in the later part of the Hallstatt period (Ha C: ca. 750–620 BC), and probably was used even at the beginning of Ha D (620–450 BC).
The Archaeological site of KałdusThe Early-Medieval settlement in Kałdus consists of a hill fort located on Mt St. Lawrence (in Polish Góra Świętego Wawrzyńca) and functionally is connected with the immediate vicinity. This area includes a flat moraine plateau with an altitude of 75–80 m above sea level, the slope and the bottom of the Vistula River valley – a total area of about 1.5 km2. The site is adjacent to the slope of the Vistula River valley, about 50 m above the valley bottom. In the immediate vicinity of its slope, Lake Starogrodzkie is located, which is a remnant of old river beds of the Vistula (Kola 1994).
The archaeological site of Kałdus is considered by many historians as the historical town of Chełmno and the largest, in this part of the western Slav lands, socio-economic and political centre of supra-local importance. It occupies an area of about 15 ha on the high edge of the Vistula River valley, directly at Mt St. Lawrence, which is a remnant of the Lusatian town. In the second half of the 10th century, that place was seized by Piast people during the conquest of Pomerelia (Gdańsk Pomerania). This place witnessed a creation of a political and church power centre sedes regni principalis. At the beginning of the 10th century, the construction of the town fortifications and the brick Christian church was started. The favourable location at the crossroad of trade and communication routes determined a superior, supra-local significance of the centre. The crisis of the centre was associated with the pagan reaction from the 1030s, when the construction of the basilica was abandoned.
‘PALEOTECHNOSOLS’ OF ANCIENT SETTLEMENTS IN GRODNO AND KAŁDUS
Fig. 1. Location of study area

TECHNOGENIC SOILS OF POLAND 114
M. MARKIEWICZ, R. BEDNAREK, M. JANKOWSKI, M. ŚWITONIAK
Profile 1
Location: the Lusatian archaeological site
in Grodno, peninsula on Lake Grodzieńskie, Northern Poland
Coordinates: 53˚9’31.67’ N
18˚42’14.97’ESoil classification (WRB 2007): Hortic Anthrosol
A – 0–35 cm: human disturbed, loamy sand, very dark grey, weak granular structure, slightly moist, clear boundary.
Bu1 – 35–130 cm: human disturbed, loamy sand, brown, weak granular structure, slightly moist, single charcoals, clear boundary.
Bu2 – 130–170 cm: human disturbed, loamy sand, dark greyish brown, weak granular structure, slightly moist, numerous charcoals, clear boundary.
Bu3 – 170–250 cm: human disturbed, loamy sand, grey, weak granular structure, slightly moist, clear boundary.
Bu4 – 250–275 cm: human disturbed, sand, dark grey, weak granular structure, slightly moist, numerous charcoals, clear boundary.
Bu5 – 275–320 cm: human disturbed, sand, dark grey, weak granular structure, moist, clear boundary.
Ob – below 320 cm: weakly decomposed peat, very dark grey, fibrous structure, very moist, many artefacts (animal bones, pieces of clay vessels, numerous charcoals).
0 cm
100 cm
200 cm
300 cm
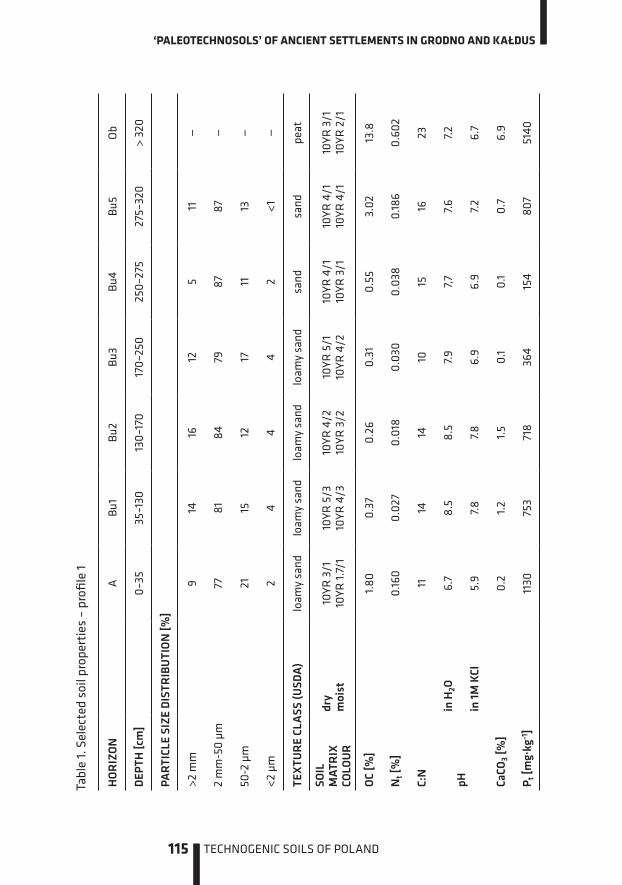
115 TECHNOGENIC SOILS OF POLAND
‘PALEOTECHNOSOLS’ OF ANCIENT SETTLEMENTS IN GRODNO AND KAŁDUS
Tabl
e 1.
Sel
ecte
d so
il pr
oper
ties
– p
rofi
le 1
HO
RIZ
ON
AB
u1B
u2B
u3B
u4B
u5O
b
DEP
TH [c
m]
0–35
35–1
3013
0–17
017
0–25
025
0–27
527
5–32
0>
320
PAR
TICL
E SI
ZE
DIS
TRIB
UTI
ON
[%]
>2 m
m9
1416
125
11—
2 m
m-5
0 µm
7781
8479
8787
—
50-2
µm
2115
1217
1113
—
<2 µ
m2
44
42
<1—
TEX
TUR
E CL
ASS
(USD
A)
loam
y sa
ndlo
amy
sand
loam
y sa
ndlo
amy
sand
sand
sand
peat
SOIL
M
ATR
IX
COLO
UR
dry
moi
st10
YR 3
/110
YR 1
.7/1
10YR
5/3
10YR
4/3
10YR
4/2
10YR
3/2
10
YR 5
/110
YR 4
/210
YR 4
/110
YR 3
/110
YR 4
/110
YR 4
/110
YR 3
/110
YR 2
/1
OC
[%]
1.80
0.37
0.26
0.31
0.55
3.02
13.8
Nt [
%]
0.16
00.
027
0.01
80.
030
0.03
80.
186
0.60
2
C:N
1114
1410
1516
23
pHin
H2O
6.7
8.5
8.5
7.9
7,7
7.6
7.2
in 1
M K
Cl5.
97.
87.
86.
96.
97.
26.
7
CaCO
3 [%
]0.
21.
21.
50.
10.
10.
76.
9
Pt [
mg·
kg-1
]11
3075
371
836
415
480
751
40

TECHNOGENIC SOILS OF POLAND 116
Profile 2
Location: the Early-Medieval
archaeological site in Kałdus, Northern Poland
Coordinates: 53°19’39.34’ N
18°22’54.16’ ESoil classification (WRB 2007): Technic Arenosol
Bu1 – 0–42 cm: human disturbed, loamy sand, dark greyish brown, weak granular structure, slightly moist, clear boundary.Bu2 – 42–61 cm: human disturbed, sand, brown, weak granular structure, numerous stones, slightly moist, single charcoals, clear boundary.Bu3 – 61–90 cm: human disturbed, loamy sand, dark greyish brown, weak granular struc-ture, slightly moist, numerous charcoals, clear boundary. Bu4 – 90–93 cm: human disturbed, sand, dark grey, weak granular structure, numerous charcoals, slightly moist, clear boundary.Bu5 – 93–105 cm: human disturbed, sand, greyish brown, weak granular structure, slightly moist, clear boundary.Bu6 – 105–115 cm: human disturbed, sand, brown, weak granular structure, moist, clear boundary.Ab – 115–135 cm: sand, greyish brown, weak granular structure, moist.Cg – below 135 cm: sand, very pale brown, weak granular structure, moist.
M. MARKIEWICZ, R. BEDNAREK, M. JANKOWSKI, M. ŚWITONIAK
0 cm
50 cm
100 cm

117 TECHNOGENIC SOILS OF POLAND
Tabl
e 2.
Sel
ecte
d so
il pr
oper
ties
– p
rofi
le 2
HO
RIZ
ON
Bu1
Bu2
Bu3
Bu4
Bu5
Bu6
Ab
Cg
DEP
TH [c
m]
0–42
42–6
161
–90
90–9
393
–105
105–
115
115–
135
>135
PAR
TICL
E SI
ZE
DIS
TRIB
UTI
ON
[%]
>2 m
m0
01
00
00
0
2 m
m–5
0 µm
7496
7892
9493
9197
50–2
µm
213
198
53
61
<2 µ
m5
13
01
43
2
TEX
TUR
E CL
ASS
(USD
A)
loam
y sa
ndsa
nd
loam
y sa
ndsa
nd
sand
sa
nd
sand
sa
nd
SOIL
M
ATR
IX
COLO
UR
dry
moi
st10
YR 4
/2.5
10YR
2/2
.510
YR 5
/3.5
10YR
3/3
.510
YR 4
/210
YR 2
/1.5
10
YR 4
/1.5
10YR
2/1
10YR
5/2
10YR
3/1
.510
YR 5
/3.5
10YR
3/3
.510
YR 5
/2.5
10YR
2.5
/310
YR 7
/310
YR 4
.5/3
OC
[%]
0.46
0.09
0.61
0.74
0.31
0.14
0.37
0.04
Nt [
%]
0.04
60.
008
0.05
80.
047
0.02
20.
012
0.03
10.
003
C:N
1011
1116
1412
1213
pHin
H2O
8.5
8.2
8.4
8.4
8.3
8.2
8.0
8.0
in 1
M K
Cl7.
77.
67.
77.
87.
87.
57.4
7.2
CaCO
3 [%
]tr
ace
trac
etr
ace
trac
etr
ace
trac
etr
ace
trac
e
Pt [
mg·
kg-1
]10
5031
583
763
932
044
910
7023
5
‘PALEOTECHNOSOLS’ OF ANCIENT SETTLEMENTS IN GRODNO AND KAŁDUS

TECHNOGENIC SOILS OF POLAND 118
Soil properties
All of the analysed soils had a texture of sand or loamy sand. This is related to location on the sandy parent material (aeolian or outwash plain sands). The aeolian sandy loamy horizons were found mainly in the topsoil (profile 1 and 2) or deeper (from 61 to 90 cm in profile 2) – Tables 1 and 2. The deepest horizon of profile 1 consisted of weakly decom-posed peat – the previous land surface in the surrounding of Lake Grodno.
According to Munsell Soil Color Charts (2000), all the genetic horizons and layers in profiles had a hue of 10.5 YR. Di�erences in the colour between horizons were associated with their large variety and diversity of the material and the content of organic matter (Tables 1 and 2).
The soil reaction was closely related to the content of CaCO3. Values of pH were be-tween 6.7 and 8.5 (in H2O) and between 5.9 and 7.8 (in 1M KCl). There was no clear vertical pH pattern in the examined profiles. The CaCO3 content in the individual profiles was varied and ranged from trace amounts to 6.9%.
The highest content of organic carbon (OC) was recorded in Ob horizon (peat) in profile 1. In A and Bu horizons, the content of OC was varied. No increase in OC content was observed at a certain depth of profiles. This was connected with the presence of material from older surface horizons. The content of total nitrogen (Nt) corresponded with the organic carbon distribution in individual profiles. Values of the carbon-to-ni-trogen ratio ranged from 10 to 23 (peat); in the majority of cases – from 10 to 13.
The total phosphorus (Pt) content was di�erent in each of the analysed soils. The highest value was measured in peat in profile 1 (5 140 mg·kg-1). Many remnants of old human activity (i.e. phosphorus-rich bones) were found in this horizon. As a rule, high phosphorus content is characteristic of horizons with higher content of organic matter.
Spatial di�erentiation of phosphorus content in the Early-Medieval cultural layer in Kałdus
This section discusses an attempt at applying the analysis of soil phosphorus content in order to assess the e�ect and the intensity of the Early-Medieval settlement within the Kałdus settlement complex (Fig. 2). Long-term human impact on the soil has been reflected in the increased content of this element. The main sources of phosphorus are human and animal faeces, food remains, bones, ashes, and other remains of human daily activity. The specific phosphorus properties, including its presence in each living cell, low dissolubility and almost total immobility (Brady, Weil 1996), determine unusual applica-bility of the phosphorus method in archaeology (Cook, Heizer 1965; Scudder et al. 1996).
M. MARKIEWICZ, R. BEDNAREK, M. JANKOWSKI, M. ŚWITONIAK

119 TECHNOGENIC SOILS OF POLAND
Fig. 2. Map of the spatial differntiation in the total phosphorus (Pt) content in the Early-Medieval cultural layer within the sub-stronghold settlement in Kałdus
‘PALEOTECHNOSOLS’ OF ANCIENT SETTLEMENTS IN GRODNO AND KAŁDUS

TECHNOGENIC SOILS OF POLAND 120
The total phosphorus content exceeded 500 mg·kg-1 almost throughout the study area. This value was assumed as the geochemical background based on the analysis of soils not transformed by the early-medieval human activity, which occurred in the near-est proximity of the archaeological site.
Analysis of the map presenting spatial di�erntiation in total phosphorus content in the medieval cultural layer within the sub-stronghold settlement enabled us to outline the southern and south-eastern limits of the settlement range (Fig. 2). The isoline 500 mg·kg-1 was assumed as the limit value of the total phosphorus content. The occur-rence of several oval zones of the increased (>2 000 mg·kg-1, a maximum of 6 500 mg·kg-1) phosphorus content seems to be related to locations of cottages and associated stor-age or waste pits of any kind, workshops, or places of farm animals gathering.
Summary
The analysed soils, in this chapter called ‘Paleotechnosols’, exhibited all the characteris-tics of Technosols (IUSS Working Group WRB 2007), but they were buried below 100 cm. All the analysed soil profiles (Hortic Anthrosol and Technic Arenosol) were characterised by the presence of horizons (or cultural layers) whose origins can be linked to ancient hu-man activity. Their characteristics often included heterogeneous disturbed layers with many artefacts, such as stones or gravels, fragments of bones, concrete, bronze or other metal tools, charcoals, pieces of clay vessels etc. The transitions between levels were of-ten sharp, which proved their artificial origin. Also an increased content of organic matter and total phosphorus, as compared to background, is their characteristic property. Unfor-tunately, the use of Thapto-specifier indicating the presence of buried layers is not possi-ble, because buried soil lies at a depth of more than 100 cm. It seems appropriate to intro-duce a new, paleopedological specifier to a next edition of WRB classification.
References:
1. Bagniewski Z. 1977. Documentation of the archaeological investigations carried out in the Chełmża vicinity. Materiały Muzeum Archeologicznego w Toruniu (in Polish).
2. Bednarek R., Markiewicz M. 2006. Reconstruction of the boundaries of ancient cultures on the basis of soil properties. [In:] J. Plit (Ed.). Boundaries in cultural landscapes. Prace Komisji Krajobrazu Kulturowego PTG, 5. Sosnowiec: 128–138 (in Polish).
3. Bednarek R., Prusinkiewicz Z. 1980. Geography of soils. Wyd. Nauk. PWN. Warsaw (in Polish).
4. Brady N.C., Weil R.R. 1996. The nature and properties of soils. Prentice-Hall International, Inc. New Jersey.
5. Cook S.F., Heizer R.F. 1965. Studies on the chemical analysis of archaeological sites. Vol. 2. University of California, Publication in Anthropology.
M. MARKIEWICZ, R. BEDNAREK, M. JANKOWSKI, M. ŚWITONIAK

121 TECHNOGENIC SOILS OF POLAND
6. Gackowski J. 1997. Report on the archaeological investigations carried out at an archaeological site in Grodno in 1997. Materiały Wojewódzkiego Konserwatora Zabytków w Toruniu (in Polish).
7. Gackowski J. 1998. Report on the archaeological investigations carried out at an archaeological site in Grodno in 1998. Materiały Wojewódzkiego Konserwatora Zabytków w Toruniu (in Polish).
8. Gackowski J., Krąpiec M. 2000. The implementation report of the NCU grant. Materiały Wojewódzkiego Konserwatora Zabytków w Toruniu (in Polish).
9. Gebhardt H. 1982. Phosphatkartierung und bodenkundliche Geländeuntersuchungen zur Ein-grenzung historischer Siedlungs- und Wirtschaftsflächen der Geestinsel Flögeln, Kreis Cux-haven. Probleme der Küstenforschung im südlichen Nordseegebiet, Band 14.
10. IUSS Working Group WRB. 2007. World References Base for Soil Resources 2006. Update 2007, World Soil Resources Reports, 103, FAO, Rome.
11. Kola A. 1994. Kałdus, Chełmno parish [In:] R. Boguwolski, J. Bojarski, W. Chudziak, J. Chudzia-kowa, K. Grążawski, M. Grupa, A. Kola, P. Molewski, D. Poliński, V. Stawska, W. Tokarski (Eds.). Early-Medieval strongholds of Chełmno Land. Wyd. UMK. Toruń: 85–93 (in Polish).
12. Munsell Soil Color Charts. 2000. GretagMacbeth. New Windsor, NY.
13. Scudder S.J., Foss J.E., Collins M.E. 1996. Soil science and archaeology. Adv. Agron. 57: 1–76.
14. Strzałko J., Ostoja-Zagórski J. 1995. Ecology of the human population. Human environment in prehistory. Wyd. Nauk. UAM (in Polish).
15. Szulta W. 1998. Report on the underwater archaeological investigations carried out at the forti-fied settlement of the Lusatian culture in Grodno, Chełmża parish in 1998. Materiały Wojewódz-kiego Konserwatora Zabytków w Toruniu (in Polish).
16. Tomczak A. 1967. Notes on the geomorphological map in the scale of 1:50 000. Sheet N-34-98 C Toruń. Dokumentacja Geomorfologiczna (in Polish).
17. van Reeuwijk L.P. 2006. Procedures for soil analysis. 7th Edition. Technical Report 9, ISRIC – World Soil Information, Wageningen, Netherlands.
‘PALEOTECHNOSOLS’ OF ANCIENT SETTLEMENTS IN GRODNO AND KAŁDUS


INDUSTRIAL AREAS
PART II


125 TECHNOGENIC SOILS OF POLAND
7 SOILS AFFECTED BY SODA INDUSTRY IN INOWROCŁAW
PIOTR HULISZ AGNIESZKA PIERNIK
Introduction
The development of the soda industry in Inowrocław (north-central Poland) is associated with the occurrence of the salt rock deposits. The soda plant was built south of the city centre in 1882 (Mątwy quarter). In the past, the activity of this factory had significant influence on the transformations of the local environment (Cieśla et. al 1981; Pokojska et. al 1998; Hulisz 2003). The post-production wastes are disposed outside the factory in ponds called ‘white seas’ (Fig. 1). The waste consisted of sediment containing mainly: CaCO3, CaSO4, Ca(OH)2, Fe(OH)3, silicates, aluminosilicates and supernatant liquid (so-lution of KCl, NaCl, NH4OH, Na2SO4, NaOH, MgCl2, CaCl2), which were generated during the manufacture of soda ash using the “Solvay process” (Abramski, Sobolewski 1977).
The long-term storage of strongly saline, semi-fluid waste products in the waste ponds, situated directly on permeable grounds without proper sealing of the bottom, caused strong groundwater pollution. As a result, very fertile soils (Mollic Gleysols) were degraded in the area of over 100 hectares.
Because of the technological process modernization, the waste ponds with an area of approximately 135 ha are currently not used. The solid wastes form a substrate for the production of fertilizers, while the liquid wastes, decanted and appropriately dilut-ed, are transported by a pipeline to the Vistula River. Some ponds have been reclaimed and a few of them have been turned into municipal landfills. Despite these undertakings, the salinity of waters and soils still remains relatively constant.
This chapter describes the technogenic soil transformations caused by the e¤ects of soda industry wastes from Inowrocław-Mątwy. In addition, particular attention is paid to ecological e¤ects of the soil salinity.

TECHNOGENIC SOILS OF POLAND 126
P. HULISZ, A. PIERNIK
Study area and soil profile documentation
The presented soil data come from the study by Hulisz et al. (2010) and Hulisz, Piernik (2011). The research was conducted in the Noteć River valley, within the area adjacent from the north and west to the waste ponds of Soda Polska Ciech S.A. (soda plant) (Fig. 1). In the eastern part of the study area (profiles 1 and 2), the soils (Mollic Gleysols, in Poland called black earths) were used in the past as an arable land, but later they have been turned into a wasteland. Profile 3 was located in the small depression occupied by salt meadow.
The soil material was analysed according to standard methods. Electrical conductivity (ECe) and the main ion content (Cl-, Na+, K+, Ca2+ and Mg2+) were determined in the saturated soil-paste extract (van Reeuwijk 2006). The sodium adsorption ratio (SAR) was calculated by the following equation using concentrations of cations Na+, Ca2+ and Mg2+ (in mmolc·dm-3):
SAR = Na+
√1—2 (Ca2++Mg2+)
The studied soils were classified according to criteria of the World Reference Base for Soil Resources (IUSS Working Group WRB 2007).
Fig. 1. Location of the study area (source: Google Earth 2013)

127 TECHNOGENIC SOILS OF POLAND
SOILS AFFECTED BY SODA INDUSTRY IN INOWROCŁAW
Profile 1
Location: Inowrocław-Mątwy,
Noteć River valley, north-central Poland, about 100 m north of the waste ponds, degraded arable land
Coordinates: 52˚45’35.67” N
18˚14’51.43” E
Groundwater level: 100 cm
Soil classification (WRB 2007): Hypersalic Mollic Technosol (Sodic, Calcaric)
Anz – 0–50 cm: loamy sand, very dark grey, granular structure, slightly moist, common fine and very fine roots, accumulation of soluble salts and exchangeable sodium, clear boundary.
AC – 50–70 cm: sand, dark greyish brown, weak granular structure, slightly moist, accumulation of soluble salts and exchangeable sodium, gradual boundary.
Cnzg – below 70 cm: sand, very pale brown, single grain structure, moist, accumulation of soluble salts and exchangeable sodium, gleyic colour pattern (40% yellow mottles – 2.5Y 7/8).
0 cm
50 cm
100 cm

TECHNOGENIC SOILS OF POLAND 128
Profile 2
Location: Inowrocław-Mątwy,
Noteć River valley, north-central Poland, about 100 m north of the waste ponds, degraded arable land
Coordinates: 52˚45’35.64” N
18˚14’32.16” E
Groundwater level: 100 cm
Soil classification (WRB 2007): Hypersalic Mollic Technosol (Sodic)
Anz – 0–45 cm: sandy loam, dark grey, granular structure, slightly moist, few fine and very fine roots, accumulation of soluble salts and ex-changeable sodium, clear boundary.
AC – 45–65 cm: sandy loam, dark greyish brown, weak granular structure, slightly moist, accumulation of soluble salts and exchangeable sodium, gradual boundary.
Cnzg – below 65 cm: sandy loam, yellow, massive structure, slightly moist to moist, accumulation of soluble salts and exchangeable sodium, gleyic colour pattern (50% olive yellow mottles – 2.5Y 6/8).
P. HULISZ, A. PIERNIK
0 cm
50 cm
100 cm
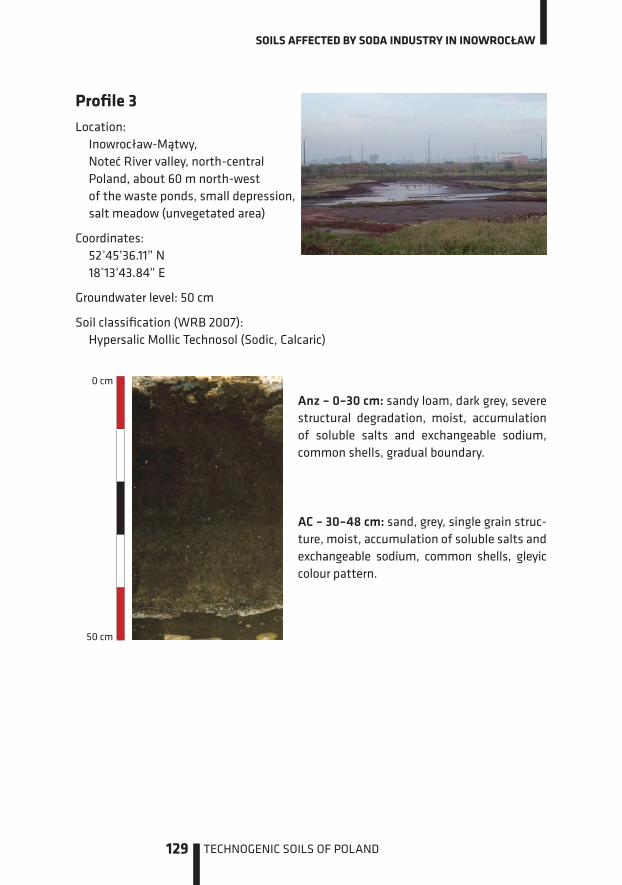
129 TECHNOGENIC SOILS OF POLAND
Profile 3
Location: Inowrocław-Mątwy,
Noteć River valley, north-central Poland, about 60 m north-west of the waste ponds, small depression, salt meadow (unvegetated area)
Coordinates: 52˚45’36.11” N
18˚13’43.84” E
Groundwater level: 50 cm
Soil classification (WRB 2007): Hypersalic Mollic Technosol (Sodic, Calcaric)
Anz – 0–30 cm: sandy loam, dark grey, severe structural degradation, moist, accumulation of soluble salts and exchangeable sodium, common shells, gradual boundary.
AC – 30–48 cm: sand, grey, single grain struc-ture, moist, accumulation of soluble salts and exchangeable sodium, common shells, gleyic colour pattern.
SOILS AFFECTED BY SODA INDUSTRY IN INOWROCŁAW
0 cm
50 cm

TECHNOGENIC SOILS OF POLAND 130
Table 1. Selected soil properties – profiles 1–3
PROFILE 1 2 3
HORIZON Anz AC Cnzg Anz AC Cnzg Anz AC
DEPTH [cm] 0–50 50–70 <70 0–45 45–65 <65 0–30 30–48
GRAIN SIZE DISTRIBUTION [%]
>2 mm 1 1 0 1 1 0 4 2
2 mm–50 µm 80 87 81 76 69 72 67 88
50–2 µm 17 10 7 17 17 17 30 8
<2 µm 3 3 2 7 14 11 3 4
TEXTURE CLASS (USDA)
loamy sand sand sand sandy
loamsandy loam
sandy loam
sandy loam sand
SOIL MATRIX COLOUR
dry
moist
10YR 3/1
10YR 2/1
10YR 4/2
10YR 2/2
10YR 7/4
10YR 5/4
10YR 4/1
10YR 3/1
10YR 4/2
10YR 2/2
10YR 7/6
10YR 5/6
10YR 4/1
10YR 3/1
10YR 6/1
10YR 5/1
OC [%] 0.97 0.33 — 0.82 0.23 — 5.48 0.23
Nt [%] 0.09 0.03 — 0.07 0.03 — 0.50 0.02
C:N 11 10 — 11 8 — 10 —
pHin H2O 7.7 7.5 7.5 7.5 7.5 7.8 7.3 7.8
in 1M KCl 7.7 7.4 7.0 7.5 7.5 7.6 7.3 7.8
CaCO3 [%] 2.1 0.0 0.0 0.6 0.2 1.2 21.9 6.2
General soil properties and salinity state
The soil parent material was alluvial sediments with texture of sand and sandy loam with gleyic properties (Table 1). The organic carbon (OC) content in topsoil varied from 0.82% to 5.64%. A relatively large thickness (50 cm) and the colour of A horizons in profiles 1 and 2 were characteristic of typical Kuyavian black earths, described i.a. by Cieśla (1961). The high content of CaCO3 (23.6%) in profile 3 was most probably caused by the presence of shells.
The salinity was a factor that significantly modified the soil reaction and caused the increase in the saturation of the sorption complex with alkaline cations. Therefore, the range of pH values was very narrow (7.3–7.8 in H2O and 7.0–7.8 in KCl) − Table 1.
The construction of the waste ponds in Inowrocław-Mątwy contributed to the groundwater table rise as well as some disturbances in the water flows. The studied
P. HULISZ, A. PIERNIK

131 TECHNOGENIC SOILS OF POLAND
soils occurred in low landscape positions with shallow groundwater (depth 0.5–1 m). Some areas were also periodically flooded during high water levels in drainage ditches (profile 3). The water salinity was extremely high. As reported by Hulisz and Piernik (2011), the electrical conductivity of these waters can be as high as 102 dS·m-1, while the concen-tration of chlorides, sodium and calcium − 60.3, 17.0 and 18.5 g·dm-3, respectively.
In Polish climatic conditions, due to percolative type of the water regime, the typical salt accumulation does not take place as it is the case of the arid and semi-arid climates. Therefore, the salinity level of the analysed soils was closely linked to the groundwater level. According to some authors, the greatest intensity of the salinization process by capillary rise and evapotranspiration occurs when groundwater is present in a certain zone called the critical depth, where fluctuations of the groundwater level are relatively small (Kovda 1973; Rhoades et al. 1999). In general, the critical depth of the water table ranges between 1.5 and 3.0 m depending on the soil properties (mainly the texture), the root zone of crops, salt content in groundwater (Abrol et al. 1988).
Table 2 presents the salinity characteristics of the studied soils. The ECe values ranged from 43 to 99 dS·m-1 and indicated strong chemical degradation. The highest content of chlorides (555 mmolc·dm-1), sodium (548 mmolc·dm-1) and calcium (524 mmolc·dm-1) was found in profile 3 where groundwater was at 0.5 m depth (nearest to the soil surface).
The threshold of the sodium adsorption ratio (SAR = 13), adopted as one of the criteria for distinguishing the sodium soils (Richards 1954), was exceeded in all soils. Values of the SAR index varied from 26 to 35 (Table 2). They showed no clear correlation with the ECe values due to the e¤ect of not only NaCl, but also CaCl2 – the main components of the post-soda wastes. The excess of sodium also contributed to peptization of soil colloids, which resulted in the destruction of the topsoil structure (Fig. 2).
Table 2. Properties of the soil saturation extract
Profile HorizonDepth[cm]
EC[dS·m-1]
Cl- Na+ K+ Ca2+ Mg2+
SAR[mmolc·dm-3]
1 Az 0–50 63 357 352 7.3 262 32 29
AC 50–70 65 366 361 7.5 256 26 30
Cg >70 76 423 417 9.3 294 20 32
2 Az 0–45 52 339 335 1.0 185 109 28
ACz 45–65 43 271 267 1.1 133 76 26
Cg >65 57 368 363 1.5 231 77 29
3 Akz 0–30 97 555 548 3.5 524 1.6 34
ACgz 30–48 99 555 548 15 479 6.6 35
SOILS AFFECTED BY SODA INDUSTRY IN INOWROCŁAW

TECHNOGENIC SOILS OF POLAND 132
Spatial variability of soil salinity at the microscale
The soil salinity is usually considered as both time- and space-dynamic factor (Armstrong et al. 1996; Shi et al. 2005). The salt accumulation in soils is a consequence of di¤erent complex processes of salt redistribution that depends on natural or anthropogenic (techno-genic) conditions. In the arid and semi-arid regions, the salinity is closely linked to low-lands or depressions. The restricted drainage caused by topography, resulted in a high groundwater table, usually contributes to salinization (Richards 1954; Salama et al. 1999).
Strongly contaminated surface and groundwater in the vicinity of the waste ponds in Inowrocław-Mątwy does not only contribute to a high salinity level of the studied soils, but is also the main factor for micro-relief formation within the salt meadow (pro-file 3), located in a small depression (Fig. 2).
Fig. 2. Changes in the microrelief due to destruction of the soil structure and water stagnation
As shown by the studies conducted by Rokicka (2009), the variability of soil salinity at the microscale did not only result from the saline water supply, but was also favoured by the microrelief and some soil properties (organic matter content and texture – expressed as saturation percentage). Despite the very small area of the study plots (10x10 m), the large spatial variability of ECe values and Cl- concentrations was noted in 0–25 cm layer.
Figure 3 presents sample maps of variability in the microrelief and selected soil properties (salt meadow). The variation coe¹cient for ECe was as high as 162% (range 31–107 dS·m-1; mean 63 dS·m-1). The highest level of soil salinity was found at the lowest points (in mi-cro-depressions). The lowest values of ECe were recorded at a location higher by about 20 cm, which could be related to the limited capillary rise of saline groundwater.
P. HULISZ, A. PIERNIK

133 TECHNOGENIC SOILS OF POLAND
The occurrence of such diverse soil conditions within very small areas was undoubt-edly ecologically important. The most important factors for plant species distribution included the salinity level and elevation. The latter was mainly responsible for mosaic structure of vegetation.
Fig. 3. Contour maps of microrelief and soil properties drawn by the kriging method (the salt meadow in Inowrocław-Mątwy; Rokicka 2009, modified)
SOILS AFFECTED BY SODA INDUSTRY IN INOWROCŁAW
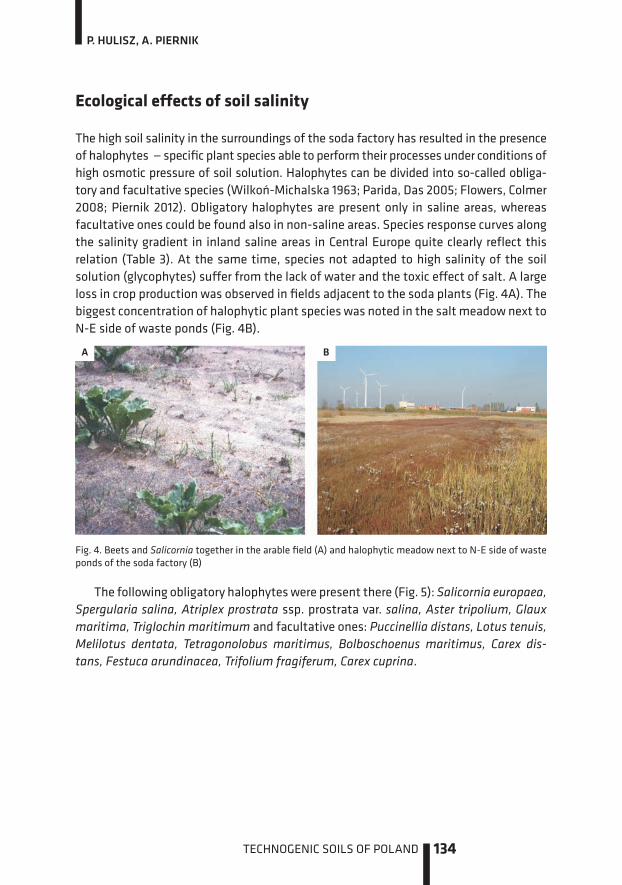
TECHNOGENIC SOILS OF POLAND 134
Ecological e�ects of soil salinity
The high soil salinity in the surroundings of the soda factory has resulted in the presence of halophytes — specific plant species able to perform their processes under conditions of high osmotic pressure of soil solution. Halophytes can be divided into so-called obliga-tory and facultative species (Wilkoń-Michalska 1963; Parida, Das 2005; Flowers, Colmer 2008; Piernik 2012). Obligatory halophytes are present only in saline areas, whereas facultative ones could be found also in non-saline areas. Species response curves along the salinity gradient in inland saline areas in Central Europe quite clearly reflect this relation (Table 3). At the same time, species not adapted to high salinity of the soil solution (glycophytes) su¤er from the lack of water and the toxic e¤ect of salt. A large loss in crop production was observed in fields adjacent to the soda plants (Fig. 4A). The biggest concentration of halophytic plant species was noted in the salt meadow next to N-E side of waste ponds (Fig. 4B).
Fig. 4. Beets and Salicornia together in the arable field (A) and halophytic meadow next to N-E side of waste ponds of the soda factory (B)
The following obligatory halophytes were present there (Fig. 5): Salicornia europaea, Spergularia salina, Atriplex prostrata ssp. prostrata var. salina, Aster tripolium, Glaux maritima, Triglochin maritimum and facultative ones: Puccinellia distans, Lotus tenuis, Melilotus dentata, Tetragonolobus maritimus, Bolboschoenus maritimus, Carex dis-tans, Festuca arundinacea, Trifolium fragiferum, Carex cuprina.
P. HULISZ, A. PIERNIK
BA

135 TECHNOGENIC SOILS OF POLAND
Tabl
e 3.
Res
pons
e cu
rves
of
spec
ies
wit
h a
freq
uenc
y >
5% o
n sa
lt m
arsh
es a
long
the
soi
l sal
init
y gr
adie
nt (E
C e).
Den
otat
ions
: M
–occ
urre
nce
opti
mum
(EC e
in d
S·m
-1) o
btai
ned
in t
he G
LM m
odel
, WA
– o
ccur
renc
e op
tim
um c
alcu
late
d as
a w
eigh
ted
aver
age
of
salin
ity
and
spec
ies
cove
r-ab
unda
nce
(ECe
in d
S·m
-1).
Not
sta
tist
ical
ly s
igni
fica
nt m
odel
s fo
r: A
trip
lex
pros
trat
a ss
p. p
rost
rata
va
r. sa
lina,
Che
nopo
dium
gla
ucum
, Gla
ux m
arit
ima,
Lot
us t
enui
s, P
hrag
mit
es a
ustr
alis
, Puc
cine
llia
dist
ans,
Spe
rgul
aria
sal
ina,
Tr
iglo
chin
mar
itim
um (P
iern
ik 2
012)
Spec
ies
endi
ng t
heir
rang
es
(fac
ulta
tive
)Sp
ecie
s w
ith
an o
ptim
um
(fac
ulta
tive
)Sp
ecie
s th
at re
alis
e th
eir
enti
re ra
nge
(obl
igat
ory)
Spec
ies
wit
h tw
o op
tim
a
(wit
h tw
o ec
otyp
es)
pW
AM
pW
AM
pp
Bolb
osch
oenu
s m
arit
imus
<0.0
5A
chill
ea m
illef
oliu
m10
.710
.6<0
.001
Ast
er t
ripol
ium
29.3
n.o
<10-6
Agr
osti
s st
olon
ifera
<10-6
Care
x cu
prin
a<1
0-6El
eoch
aris
uni
glum
is5.
13.
7<1
0-6Ju
ncus
ger
ardi
27.0
33.1
<10-6
Plan
tago
inte
rmed
ia<1
0-6
Care
x di
stan
s<1
0-6El
ymus
repe
ns12
.512
.6<0
.001
Mel
ilotu
s de
ntat
a14
.717
.2<0
.01
Sonc
hus
oler
aceu
s<0
.05
Cirs
ium
arv
ense
<10-6
Fest
uca
rubr
a9.
27.
3<1
0-6Sa
licor
nia
euro
paea
38.1
n.o
<10-6
Poa
angu
stif
olia
<0.0
1
Dau
cus
caro
ta<0
.01
Leon
todo
n
auat
umna
lis6.
76.
6<1
0-6Sp
ergu
laria
m
edia
29.1
43.4
<10-6
Des
cham
psia
cae
spit
osa
<0.0
01Po
tent
illa
anse
rina
7.0
5.1
<10-6
Suae
da m
arit
ima
31.4
36.6
<10-6
Fest
uca
arun
dina
cea
<10-6
Poa
subc
aeru
lea
5.3
4.3
<10-6
Junc
us c
ompr
essu
s<1
0-6Sc
hoen
ople
ctus
ta
bern
aem
onta
ni7.1
7.6
<10-6
Mar
tica
ria m
arit
ima
ssp.
in
odor
a<0
.05
Tara
xacu
m p
alus
tre
7.6
7.5
<0.0
01
Poly
gonu
m a
vicu
lare
<0.0
01Tr
ifoliu
m fr
agife
rum
5.7
5.4
<10-6
Sonc
hus
arve
nsis
<10-6
Tara
xacu
m o
ci
nale
<10-6
Trif
oliu
m re
pens
<10-6
SOILS AFFECTED BY SODA INDUSTRY IN INOWROCŁAW

TECHNOGENIC SOILS OF POLAND 136
Fig. 5. Main halophytic plant species in Inowrocław-Mątwy
P. HULISZ, A. PIERNIK

137 TECHNOGENIC SOILS OF POLAND
In general, vegetation reflected the soil salinity level (Piernik et al. 1996; Piernik 2006; Piernik 2012). In the part of the meadow dominated by grasses such as Festuca rubra, Elymus repens and Agrostis stolonifera and accompanied by halophytes such as Lotus tenuis, Tetragonolobus maritimus, Triglochin maritimum, Aster tripolium and others, salinity expressed as ECe reached ca. 17 dS·m-1. The most saline places were occupied by Salicornia europaea where salinity reached ca. 60 dS·m-1.
The results of the research performed in the Kuyavian region in central Poland dem-onstrate that halophytic plant species and their communities can be used as indicators of soil salinity (Piernik 2003, Table 4).
Table 4. Halophytes as indicators of soil salinity (according to Piernik 2003)
Species as indicators:
> 2 dS·m-1 Triglochin maritimum
> 4 dS·m-1 Salicornia europaea, Glaux maritima Soil salinity scale according to Jackson (1958):
0–2 dS·m-1 – non saline
2–4 dS·m-1 – very slightly saline
4–8 dS·m-1 – slightly saline
8–16 dS·m-1 – strongly saline
> 16 dS·m-1 – very strongly saline
Communities as indicators:
> 2 dS·m-1 Glaux maritima-Potentilla anserina-Agrostis stolonifera comm.
> 8 dS·m-1 Puccinellia distans-Salicornia europaea-Sper-gularia salina comm.
> 12 dS·m-1 Triglochin maritimum comm.
> 20 dS·m-1 Salicornia europaea comm. Aster tripolium comm.
Soil salinity over 2 dS·m-1 could be indicated by the presence of Triglochin mariti-mum, over 4 dS·m-1 by Glaux maritima and Salicornia europaea. However, plant com-munities were better salinity indicators than single species. In this way, the extremely saline soils i.e. with salinity over 20 dS·m-1 could be indicated by the presence of the Salicornia europaea community and the Aster tripolium community, strongly saline soils (salinity over 8 dS·m-1) by the Triglochin maritimum community and the Puccinellia distans-Salicornia europaea-Spergularia salina community, whereas the Glaux mariti-ma-Potentilla anserina-Agrostis stolonifera community could indicate slightly saline soils with salinity over 2 dS·m-1. Therefore, halophilous vegetation can be a useful tool for monitoring the impact of salt and soda industry on the surroundings.
SOILS AFFECTED BY SODA INDUSTRY IN INOWROCŁAW

TECHNOGENIC SOILS OF POLAND 138
Summary
The results of soil and botanical research carried out for decades in areas contaminated with post-soda wastes of Inowrocław-Mątwy indicate a very high and relatively stable salinity level of waters and soils. As evidenced by botanical observations, despite the exclusion of waste ponds from the production process, the area of salt-a¤ected soils is still growing. This is proved by the described new stands of halophytes (including Salicornia europaea) outside the study area (Strzelecka et al. 2011). Two likely reasons for this situa-tion include a huge amount of accumulated wastes and environmentally adverse location of the soda plant in the Noteć River valley. However, considering the location of waste ponds near the salt dome, intensively exploited in the past (Budryk 1933; Szczerbowski et al. 2003), a simultaneous e¤ect of the natural salinity source cannot be excluded either.
The second edition of the World Reference Base for Soil Resources (IUSS Working Group WRB 2007) has undergone a major revision. The new unit of Technosols was in-troduced, which comprises soils of urban and industrial areas. One of the criteria for this reference soil group (RSG) is the presence of large amounts of artefacts. Obviously, the artefacts include also the fluid wastes of the soda industry. Therefore, the soils degraded by the technogenically induced salinization process in Inowrocław-Mątwy can be classified as Mollic Technosols (Calcaric). The list of qualifiers for this group does not include formative elements, expressing the soil salinity and sodicity features, but as evidenced by the described soil properties, such qualifiers have to be used. There-fore, it seems appropriate to add these qualifiers to the list for Technosols in the next WRB edition (Hulisz et al. 2010).
References
1. Abramski K., Sobolewski J. 1977. Environment protection against waste of soda production collected in waste ponds. Gosp. Wodna 4: 107–110 (in Polish).
2. Abrol I.P., Yadav J.S.P., Massoud F.I. 1988. Salt-a¤ected soils and their management. FAO Soils Bulletin 39, Rome.
3. Armstrong A.S.B., Rycroft D.W., Tanton T.W. 1996. Seasonal movement of salts in naturally structured saline-sodic clay soils. Agric. Water Manage. 32: 15–27.
4. Budryk W. 1933. Landslides of the city of Inowrocław. Przegl. Górn. Hutn. 8, AG, Kraków: 431–444 (in Polish).
5. Cieśla W. 1961. Chemical properties of the Kuyavian black earths on the background of the geographical environment. Prace Kom. Nauk Roln. i Kom. Nauk Leśn. PTPN 7 (4).
6. Cieśla W., Dąbkowska-Naskręt H., Siuda W. 1981. Soil salinity state in the vicinity of the Inowrocław soda plant in Mątwy. Rocz. Glebozn. 32 (2): 103–113 (in Polish with English abstract).
7. Flowers T. J., Colmer T. D. 2008. Salinity tolerance in halophytes. New Phytol. 179: 945–963.
P. HULISZ, A. PIERNIK

139 TECHNOGENIC SOILS OF POLAND
8. Hulisz P. 2003. Soil salinity in the vicinity of Inowrocław (Poland) due to the e¤ect of soda industry. Abstracts. SUITMA 2003, Nancy: 159–160.
9. Hulisz P., Charzyński P., Giani L. 2010. Application of the WRB classification to salt-a¤ected soils in Poland and Germany. Polish J. Soil Sci. 43(1): 81–92.
10. Hulisz P., Piernik A. 2011. E¤ect of soda industrial waste on vegetation and soils in Inowrocław-Mątwy. [In:] M. Jankowski (Ed.). Selected problems of genesis, systematics, management and soil protection in the Kuyavia and Pomerania region, PTSH Wrocław, PTG Warsaw: 97–116 (in Polish).
11. IUSS Working Group WRB. 2007. World References Base for Soil Resources 2006. Update 2007, World Soil Resources Reports, 103, FAO, Rome.
12. Jackson M. L. 1958. Soil chemical analysis. Constable Ldt., London.
13. Kovda V.A. (Ed.) 1973. Irrigation, drainage and salinity. An international source book. London, Hutchinson, FAO, UNESCO.
14. Parida A. K., Das A. B. 2005. Salt tolerance and salinity e¤ects on plants: a review. Ecotoxicol. Environ. Saf. 60: 324–349.
15. Piernik A. 2003. Inland halophilous vegetation as indicator of soil salinity. Basic Appl. Ecol. 4: 525–536.
16. Piernik A. 2006. Growth of three meadow species along a salinity gradient in an inland saline habitat: transplant experiment. Pol. J. Ecol. 54: 117–126.
17. Piernik A. 2012. Ecological pattern of inland salt marsh vegetation. Nicolaus Copernicus Uni-versity Press, Toruń.
18. Piernik A., Każmierczak E., Rutkowski L. 1996. Di¤erentiation of vegetation in a saline grass-land in the vicinity of Inowrocław Soda Plants at Mątwy. Acta Soc. Bot. Pol. 65: 349–356.
19. Pokojska U., Bednarek R., Hulisz P. 1998 Taxonomy problems of salt-a¤ected soils with reference to the area influenced by „SODA-MĄTWY S.A.” Zesz. Probl. Post. Nauk Roln. 460: 513–521 (in Polish with English abstract).
20. Rhoades J.D., Chanduvi F., Lesch S. 1999. Soil salinity assessment. Methods and interpreta-tion of electrical conductivity measurement. FAO Irrigation and Drainage Paper 57, Rome.
21. Richards L.A. (Ed.) 1954. Diagnosis and improvement of saline and alkali soils. Agriculture Handbook 60, USDA, Washington.
22. Rokicka A. 2009. E�ect of moisture, salinity and microrelief gradients on the pattern of halo-phytic vegetation in Inowrocław-Mątwy. M.Sc. manuscript. Nicolaus Copernicus University, Toruń (in Polish with English abstract).
23. Salama R.B., Otto C.J., Fitzpatrick R.W. 1990. Contributions of groundwater conditions to soil and water salinization. Hydrogeol. J. 7: 46–64.
24. Shi Z., Li Y., Wang R., Makeschine F. 2005. Assessment of temporal and spatial variability of soil salinity in a coastal saline field. Environ. Geol. 48: 171–178.
25. Strzelecka J., Dąbrowski M., Hulisz P., Piernik A. 2011. Changes in soil properties and plant bio-mass under the influence of soda waste ponds in Inowrocław, Poland. Ecol. Quest. 14: 69–71.
SOILS AFFECTED BY SODA INDUSTRY IN INOWROCŁAW

TECHNOGENIC SOILS OF POLAND 140
26. Szczerbowski Z., Pilecki Z., Kłosiński J., Koster M. 2003. Seismic assessment of rock mass in the salt dome in Inowrocław. Warsztaty „Zagrożenia naturalne górnictwa”, IGSMiE PAN, Kraków: 517–528 (in Polish).
27. van Reeuwijk L.P. 2006. Procedures for soil analysis. 7th Edition. Technical Report 9, ISRIC – World Soil Information, Wageningen, Netherlands.
28. Wilkoń-Michalska J. 1963. Halophytes of Kuyavia. Stud. Soc. Sci. Tor. sec. D, Botanica 7 (in Polish with English abstract).
P. HULISZ, A. PIERNIK

141 TECHNOGENIC SOILS OF POLAND
8 SOILS AND VEGETATION UNDER THE IMPACT OF CEMENT INDUSTRY IN THE VICINITY OF BIELAWY
HALINA DĄBKOWSKA-NASKRĘT HANNA JAWORSKA PIOTR MALCZYK
Introduction
The regions of Kuyavia and Pomerania (Kujawy and Pomorze in Polish) are characterised by the predominance of arable lands – 57% of their total area. Their natural conditions are extremely favourable for agricultural development.
Local industry located in the region a¤ects the quality of the environment, including soils. One of the major hazardous activities is cement and lime production in Bielawy (Jaworska 1990). The Lafarge-Cement plant, established upon the conversion of the ‘Kujawy’ Cement and Lime Works, is located within the Kuyavian tectonic dyke, composed of Jurassic limestone (Kondracki 2002). The main raw material used in the production of clinker is limestone exposed to thermal processing. In 2003, the production technology was changed from wet to dry, which consequently has reduced the emission of pollution almost tenfold. The prevalent pollutants emitted into the atmosphere are particulate dust, CO2, nitrogen oxides NOx, sulphur oxides (SOx) and carbon monoxide (CO).
These pollutants are emitted during operations such as grinding, kiln operation, clinker cooling and mixing, power generation, transportation and bagging (Scheider et al. 2011). Each of them is a source of gaseous emission and particulate matter contamination.
The composition of the emitted particulate matter is determined by the type of material in the burning process. Heavy metals introduced into the processing line via raw materials and fuels, may enter the combustion gases and are emitted into the air.
Dust pollution a¤ects the atmosphere, vegetation and soils. The dust is generally toxic and hazardous and can pose a serious health threat to humans. The natural environment is also a¤ected by dust emissions: soils in the surroundings of the plant are characterised by alkaline reaction and contain elevated levels of lead and zinc (Dąbkowska-Naskręt et al. 1997).
The raw materials used for the production of cement clinker are limestone from local sources and clay. Generally, raw materials used in the cement production do not contain harmful substances. However, changes in the technological regime and application of

TECHNOGENIC SOILS OF POLAND 142
wastes instead of mineral substances, as well as waste-derived fuels in place of fossil fuels, although economically valid, can be environmentally risky. Although the cement sector is following the best available technology, the production of clinker (Poland be-come the seventh country in Europe in terms of cement production) is a serious problem for the natural environment.
Cement production is a highly energy-consuming industry. The total energy con-sumption by cement production is about 100 KWh·t-1 of cement, including grinding as the biggest energy consumer in the whole manufacturing process.
The use of alternative fuels and raw materials for cement clinker production is highly important for the cement manufacturer and for the utilization of wastes of di¤erent origin. As alternative fuels, mainly tires, sewage sludge, waste oils, municipal solid wastes and animal residues are used. In cement clinker production, also plastics, foils, rubber and textiles containing di¤erent impurities are used instead of coal. Although the use of alternative fuels for the production of Portland cement clinker can substitute the natural, fossil fuels, it can a¤ect the increase of toxic emissions to the environ-ment, like heavy metals and others. On the other hand, such changes in the technology of clinker production help to solve the problem with wastes of di¤erent origin by utilizing them either as fuels or raw materials.
Exploitation of limestone in quarries in Wapienno, Piechcin and Bielawy at the turn of the 19th and 20th century for the local construction work was the beginning of the ce-ment and lime industry. Production of clinker in the ‘Kujawy’ plant started in 1972. After 25 years, the privatization of cement industry led to a change of ownership and the name of the plant to Lafarge S.A. The dust emission from the cement plant was very high, i.e. 8 000 tons per hectare per year in 1987. In 1995, the emission from the plant significantly decreased as a consequence of modernization and renovation of techno-logical lines. However, the long term impact of high-level emission has brought serious changes in the soil surrounding the cement plant in Bielawy, as well as negative conse-quences in the conditions of vegetation.
The environmental impact of the Lafarge cement plant on the ecosystem (plants and soils) was assessed by a long-term study of soils, natural vegetation and the quality of crops in the surrounding area (Cieśla et al. 1994; Dąbkowska-Naskręt et al. 2011).
Study area and soil profile documentation
The study was undertaken in 1987 and carried out within the 5 km radius from the source of emission – the Lafarge S.A. cement plant (north-central Poland). A total of 335 soil samples were collected from the surface (0–20 cm) and 60 soil profiles were analysed (the study documentation 1987–2010 – the material of the Department of Soil Science and Soil Protection, University of Technology and Life Sciences in Bydgoszcz).
H. DĄBKOWSKA-NASKRĘT, H. JAWORSKA, P. MALCZYK

143 TECHNOGENIC SOILS OF POLAND
In 1995, 1997, 1998, 2000, 2002, 2008, 2009, 2010, 2011 the study was continued and changes in soil pH, the content of organic carbon and the total content as well as avail-able fractions of metals (Zn, Cu, Cr, Ni, Cd and Pb) were analysed. The detailed analysis was carried out on soils sampled at 6 sites to monitor periodical changes in the selected parameters. The sites were located at di¤erent distances from the Lafarge cement-plant: Sadłogoszcz 500 m, Piechcin 3 000 m, Krotoszyn 4 000 m, Wolice I 5 000 m, Wolice II 6 500 m, Mamlicz 10 000 m (Fig. 1).
The chemical composition of cement dust emitted into the atmosphere and en-trapped in electrofilters were also analysed (SiO2, Fe2O3, Al2O3, CaO, MgO, K2O, Na2O, P2O5, Cd, Zn, Ni, Pb, Cr, Cu).
The selected properties of soils (0–20 cm and 20–40 cm layers) were determined by the following standard methods:
— hydrolytic acidity (HA) by the Kappen method,— CaCO3 content by the Scheibler method,— pH in H2O and 1M KCl by the potentiometric method,— particle-size distribution by the hydrometric method,— organic carbon (OC) content by Alten’s method,— exchangeable bases (Ca2+, Mg2+, K+ and Na+) determined by extraction with
1M NH4Cl after removal of water soluble ions on the PU-9100X spectrometer us-ing atomic absorption and atomic emission techniques.
Cation exchange capacity (CEC) of soils was calculated as a sum of hydrolytic acidity (HA) and total exchangeable bases (Ca2+, Mg2+, K+, Na+) – TEB.
The following available forms of macro- and microelements were determined:— P2O5 and K2O content by Egner-Riehm method,— Mg content by Schachtschabel method,— Fe, Mn, Zn and Cu content – after the extraction of soil samples in DTPA according
to Lindsay and Norvell (1978) on the atomic absorption spectrometer PU 9100X. Details on laboratory methods were described by Dąbkowska-Naskręt and Dymińska (1996).
SOILS AND VEGETATION UNDER THE IMPACT OF CEMENT INDUSTRY...

TECHNOGENIC SOILS OF POLAND 144
Fig. 1. Location of the study sites (source: Google 2013)
H. DĄBKOWSKA-NASKRĘT, H. JAWORSKA, P. MALCZYK

145 TECHNOGENIC SOILS OF POLAND
Profile 1
Location: Sadłogoszcz,
the region of Kuyavia, north-central Poland
Coordinates: 52°49.776’ N
18°2.394’ E
Soil classification (WRB 2007): Haplic Luvisol
Ap – 0–28 cm: loamy sand, brown, granular structure, consistence 0.15 kN·m-2, accumulation of CaCO3, abrupt boundary.
AE – 28–36 cm: loamy sand, light brown, granular structure, consistence 0.41 kN·m-2, clear boundary.
E – 36–52 cm: loamy sand, very pale brown, granular structure, consistence 0.32 kN·m-2, gradual boundary.
Bt – 52–94 cm: sandy loam, strong brown, angular structure, consistence 0.27 kN·m-2, gradual boundary.
Ck – below 94 cm: sandy loam, light brown, angular structure, consistence 0.19 kN·m-2.
SOILS AND VEGETATION UNDER THE IMPACT OF CEMENT INDUSTRY...
0 cm
50 cm
100 cm
150 cm

TECHNOGENIC SOILS OF POLAND 146
Table 1. Selected soil properties (2011) – profile 1
HORIZON Ap AE E Bt Ck
DEPTH [cm] 0–28 28–36 36–52 52–94 >94
PARTICLE SIZE DISTRIBUTION [%]
>2 mm — — — — —
2 mm–50 µm 81 84 76 52 55
50–2 µm 16 14 20 41 37
<2 µm 3 2 4 7 8
TEXTURE CLASS (USDA)
loamy sand
loamy sand
loamy sand
sandy loam
sandy loam
SOIL MATRIX COLOUR
dry
moist
7.5YR 5/2
7.5YR 4/2
7.5YR 6/3
7.5YR 4/4
10YR 8/3
10YR 7/3
7.5YR 5/6
7.5YR 4/4
7.5YR 6/4
7.5YR 5/4
ACTUAL MOISTURE [% by weight] 11.8 8.2 8.1 11.0 12.3
BULK DENSITY [g·cm-3] 1.19 1.56 1.64 1.73 1.74
OC [%] 0.69 0.08 0.04 0.02 0.03
pHin H2O 8.4 8.5 8.6 8.2 8.4
in 1M KCl 7.7 7.9 7.9 7.2 7.6
CaCO3 [%] 9.9 1.7 0 0 1.4
Changes in soil properties
The soils in the vicinity of cement plant developed from sandy and loamy materials (Table 1). The texture qualified them as soils with low bu¤er properties and as such, they are susceptible to pollution. These soils are under the impact of alkaline dust, rich in CaO – Table 2.
Properties of the soils near the cement plant (sites A and B) have markedly changed, including their reaction − they become alkaline. Some of them were also enriched in CaCO3 (max up to 9.2%). According to Cieśla et al. (1994), the non-contaminated soils in this region are rather acid or neutral (pH 5.5–6.7).
H. DĄBKOWSKA-NASKRĘT, H. JAWORSKA, P. MALCZYK

147 TECHNOGENIC SOILS OF POLAND
Table 2. Chemical composition of cement-lime dust from the cement plant in Bielawy
ComponentFrom electrofilters Except electrofilters
[%]
CaO 49.3 42.0
SiO2 12.9 13.2
K2O 7.59 6.67
MgO 1.37 1.23
Na2O 0.39 0.54
Al2O3 6.42 7.26
Fe2O3 3.71 4.26
MnO 0.03 0.03
P2O5 0.11 0.12
[mg·kg-1]
Cd 32.0 44.0
Cr 37.0 34.0
Cu 39.0 60.0
Ni 31.0 31.0
Pb 937 772
Zn 281 531
The pH values of the studied soils varied depending on the sampling location and the year, which can be related to changes in the cement production technology, emis-sion of alkaline dust and weather conditions (Table 3).
In general, pH (in H2O) values ranged from 6.2 to 8.6, with geometric mean of 6.5–8.2, in the soil samples taken from sites located in the immediate vicinity of the plant (A, B and C). These pH values are much higher than the values in soils not a¤ected by cement dust (sites D, E, F – Table 3) and they result from alkaline dust deposition.
The alkaline e¤ect was not restricted to the topsoil (Tables 1 and 3). For example, the alkaline reaction was unchanged in the surface and subsurface soil samples in Sadłogoszcz (site B). It should be emphasized that the parent material of soils around the cement plant in Bielawy does not include CaCO3 and thus this component is of tech-nogenic origin and may come from alkaline emissions.
SOILS AND VEGETATION UNDER THE IMPACT OF CEMENT INDUSTRY...

TECHNOGENIC SOILS OF POLAND 148
Table 3. Reaction, CaCO3, organic carbon (OC) and clay fraction content in the studied soils (1995–2011)
SiteDepth [cm]
pH*CaCO3
OC [%]
Clay fractionH2O KCl
PiechcinA 0–20
7.2–7.6 6.9–7.40–1 0.80–1.38 4.0
7.4 7.2
20–407.3–7.6 6.9–7.5
0–1 1.05–1.40 5.07.5 7.2
SadłogoszczB 0–20
7.9–8.6 7.6–8.61.3–9.2 0.54–0.77 4.0
8.23 7.9
20–408.0–8.5 7.5–8.5
1.3–6.0 0.60–0.75 8.08.2 7.9
KrotoszynC 0–20
6.5–6.7 6.1–6.30 0.62–1.18 7.0
6.5 6.2
20–406.2–6.8 5.7–6.5
0 0.92–1.24 8.06.5 6.1
Wolice ID 0–20
5.6–6.2 4.4–6.10 0.72–1.01 1.0
5.9 5.3
20–405.4–6.3 4.5–5.8
0 0.84–1.03 4.06.0 5.4
Wolice IIE 0–20
5.6–6.2 5.1–5.60 0.79–1.00 7.0
5.9 5.4
20–405.3–6.6 4.6–6.0
0 0.82–0.95 7.05.8 5.1
MamliczF 0–20
5.9–6.4 4.7–6.20 0.62–0.70 2.0
6.2 5.6
20–405.8–7.1 4.9–6.6
0 0.61–0.75 6.06.4 5.8
*Min – Max
Geom. mean
Emission of alkaline particles has changed the composition of the soil exchangeable complex. The analysis of the soil sorptive properties performed in 2011 showed the elevated content of Ca2+ (12.5 cmol·kg-1) in the topsoil (site A; Table 4). The base saturation reached 100% and basically di¤ered from the so-called model soil that should contain 65% of Ca2+, 10% of Mg2+, 5% of K+ and up to 20% of H+ ions (Jaworska et al. 2008).
H. DĄBKOWSKA-NASKRĘT, H. JAWORSKA, P. MALCZYK

149 TECHNOGENIC SOILS OF POLAND
Table 4. Soil sorptive properties – site A, Sadłogoszcz (2011)
Horizon Depth[cm]
HA Ca2+ Mg2+ K+ Na+ TEB CEC
[cmol·kg-1]
Ap 0–28 0 12.5 0.43 0.77 0.15 13.9 13.9
AE 28–36 0 6.03 0.32 0.41 0.14 6.89 6.89
E 36–52 0 3.21 0.27 0.36 0.09 3.92 3.92
Bt 52–94 0 11.0 0.97 1.55 0.17 13.7 13.7
Ck <94 0 12.6 0.65 0.34 0.16 13.8 13.8
The negative e¤ect of cement dust in soils may be connected with high concentra-tions of heavy metals present in high concentrations in cement particles (Table 2).
The metals of primary concern, which may reduce the plant yield or the quality of crops in this region are lead, cadmium and zinc. According to the available data on soils at the study sites, the total content of metals was as follows: Pb 7–42 mg·kg-1, Zn 12–66 mg·kg-1, Cd 0.2–0.6 mg·kg-1, Cu 2–9 mg·kg-1, Cr 12–16 mg·kg-1 and Ni 5–8 mg·kg-1 (Dąbkowska-Naskręt et al. 2006). These values were comparable with the total content of each metal in non-contaminated soils. The content of lead was usually higher in the surface than in subsurface horizons. The naturally occurring concentration of lead in soils free of technogenic disturbance in this region is 18 mg·kg-1 (Kabata-Pendias 2001). Further-more, in spite of waste application in clinker manufacturing, no elevated mercury con-tent was recorded in the soils (Jaworska et al. 2009). Although less pronounced, the concentration of zinc was higher in soils more a¤ected by cement emission (site A and B) compared to others, and the Zn content is higher than the natural geochemical back-ground value for these soils (Dąbkowska-Naskręt, Długosz 2000).
The reaction is the most important factor which can induce the mobility of nutrients and heavy metals in soil. Relatively high pH changed the content of available fractions of zinc and copper in soils a¤ected by clinker. Such a process leads to a deficit of these metals in plants (Dąbkowska-Naskręt et al. 2002).
Condition of natural vegetation
The e¤ect of dust emitted by the cement industry on vegetation has been reported in the literature. Usually injuries of leaves, chlorotic needles, cell destruction and reduced growth were observed (Mandre 2002).
Cement dust a¤ects the ecosystems, causing the imbalance in soil nutrients. In order monitor the natural vegetation under the impact of the cement factory in Bielawy, the pine forest near the Lafarge S.A. plant was investigated. In addition to forest soils
SOILS AND VEGETATION UNDER THE IMPACT OF CEMENT INDUSTRY...

TECHNOGENIC SOILS OF POLAND 150
(Podzols and Luvisols), plant material sampled from Scots pines (Pinus sylvestris L.) was analysed. The analysis of morphological and physical characteristic of 70–80-year-old Scots pine trees, stems and leaves showed serious deviations in comparison with a rela-tively healthy forest in an unpolluted area (Jaworska et al. 2010).
Forest ecosystems easily respond to direct and indirect technogenic e¤ects chang-ing their structure. Pine needles of di¤erent ages were collected for the analysis. Hard incrustation with cement was observed on the entire exposed surfaces of pine trees including needles, branches and bark.
Table 5. Morphology of pine needles (Jaworska et al. 2010)
Site Age of needles Surface area [mm2] Width [mm] Length [mm]
P1 I* 256 1.43 82.9
II 250 1.45 80.1
III 209 1.48 74.0
P2 I 169 1.20 63.4
II 172 1.58 52.0
III 158 1.34 59.1
*I, II, III, one year, two years and three years old, respectively
In wet conditions, adhesive properties of alkaline dust favour the formation of a kind of incrustation on the surface of plants.
As evidenced by the detailed biometric analysis of needles with the software DIGISHAPE, older needles, due to a longer exposure to cement, are shorter and narrower than the younger ones. The negative e¤ects of emission were more pronounced in individual trees growing close to the source of dust emission (site P2) compared to less a¤ected site P1 (Table 5). The impact of dust on the vegetation could be physical through depo-sition of particles on the surfaces of leaves, with adverse e¤ect on the plant growth and changes in the stomata opening and closing mechanism, as well as chemical through the nutrient absorption from the soil and modifications of the nutrient availability by plants. Many authors have reported deviations in plant metabolism and physiology (Mandre et al. 1999). Cement dust may release calcium hydroxide, which may cause denaturation of proteins in leaves (Hemlata 1991).
Other authors (Brandt, Rhoads 1972) reported a significant reduction in the lateral growth of trees in the cement dust-a¤ected area compared to a control site. Foliar chlorosis, leaf scorch, general decline in the growth and a smaller average number of cones on a single tree (Zerrougi, Sbaa 2008) were also observed.
Cement dust pollution of soils may also cause a significant reduction in the amount of soil microbial biomass, particularly in a fungal population. Such a phenomenon and an increase in the lignin content in needles observed under alkaline dust pollution (Mandre 2002) may disrupt the humification processes in the forest a¤ected by alkaline emission.
H. DĄBKOWSKA-NASKRĘT, H. JAWORSKA, P. MALCZYK

151 TECHNOGENIC SOILS OF POLAND
Cultivated soils and crops
Soils in the neighbourhood of the Lafarge S.A. cement plant are used for cultivation of crops like maize (Zea maize). The aim of the study undertaken in 2012 was to establish how and to what extent alkaline emissions a¤ect the cultivated land and crops. The observation of plant cover on the corn field in Krotoszyn Sp. z o.o. revealed symptoms of nutrient deficiency in cultivated plants in the form of red-purple spots on leaves and stems as well as dead, dry ends of leaves in a large number of individual plants in spite of proper soil management and fertilization (Fig. 2).
Fig. 2. Symptoms of phosphorus deficit on maize
The measured hydrolytic acidity of agriculturally used soils, with maize as the main crop, was very low, close to 0 cmol·kg-1 (Table 4). Calcium was the dominant ion among the exchangeable bases in the studied soils (up to 100%). The CaCO3 content is another consequence of the alkaline emission. The amounts of carbonates were in the range of 0–9.2% in the studied soils under the impact of the Lafarge S.A. cement plant.
The cement manufacturing process generates also changes in the total content and the availability of metals. The detailed study of soil properties showed that the content of plant-available phosphorus, potassium and magnesium was not su¹cient for culti-vated plants. The P content was particularly low (Table 6). This macronutrient is very important for photosynthesis and is necessary for the formation of seeds.
SOILS AND VEGETATION UNDER THE IMPACT OF CEMENT INDUSTRY...
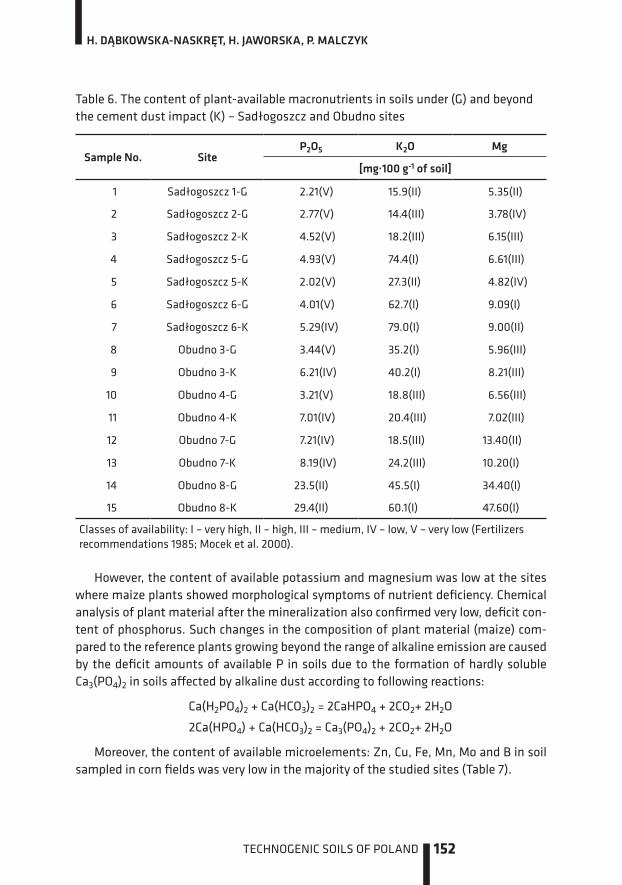
TECHNOGENIC SOILS OF POLAND 152
Table 6. The content of plant-available macronutrients in soils under (G) and beyond the cement dust impact (K) – Sadłogoszcz and Obudno sites
Sample No. SiteP2O5 K2O Mg
[mg·100 g-1 of soil]
1 Sadłogoszcz 1-G 2.21(V) 15.9(II) 5.35(II)
2 Sadłogoszcz 2-G 2.77(V) 14.4(III) 3.78(IV)
3 Sadłogoszcz 2-K 4.52(V) 18.2(III) 6.15(III)
4 Sadłogoszcz 5-G 4.93(V) 74.4(I) 6.61(III)
5 Sadłogoszcz 5-K 2.02(V) 27.3(II) 4.82(IV)
6 Sadłogoszcz 6-G 4.01(V) 62.7(I) 9.09(I)
7 Sadłogoszcz 6-K 5.29(IV) 79.0(I) 9.00(II)
8 Obudno 3-G 3.44(V) 35.2(I) 5.96(III)
9 Obudno 3-K 6.21(IV) 40.2(I) 8.21(III)
10 Obudno 4-G 3.21(V) 18.8(III) 6.56(III)
11 Obudno 4-K 7.01(IV) 20.4(III) 7.02(III)
12 Obudno 7-G 7.21(IV) 18.5(III) 13.40(II)
13 Obudno 7-K 8.19(IV) 24.2(III) 10.20(I)
14 Obudno 8-G 23.5(II) 45.5(I) 34.40(I)
15 Obudno 8-K 29.4(II) 60.1(I) 47.60(I)
Classes of availability: I – very high, II – high, III – medium, IV – low, V – very low (Fertilizers recommendations 1985; Mocek et al. 2000).
However, the content of available potassium and magnesium was low at the sites where maize plants showed morphological symptoms of nutrient deficiency. Chemical analysis of plant material after the mineralization also confirmed very low, deficit con-tent of phosphorus. Such changes in the composition of plant material (maize) com-pared to the reference plants growing beyond the range of alkaline emission are caused by the deficit amounts of available P in soils due to the formation of hardly soluble Ca3(PO4)2 in soils a¤ected by alkaline dust according to following reactions:
Ca(H2PO4)2 + Ca(HCO3)2 = 2CaHPO4 + 2CO2+ 2H2O
2Ca(HPO4) + Ca(HCO3)2 = Ca3(PO4)2 + 2CO2+ 2H2O
Moreover, the content of available microelements: Zn, Cu, Fe, Mn, Mo and B in soil sampled in corn fields was very low in the majority of the studied sites (Table 7).
H. DĄBKOWSKA-NASKRĘT, H. JAWORSKA, P. MALCZYK

153 TECHNOGENIC SOILS OF POLAND
Table 7. The content of available microelements in soils a¤ected by cement dust (G) and beyond the alkaline emission (K) – Sadłogoszcz and Obudno sites
Sample No. SiteZn* Cu Fe Mn Mo B
[mg·kg-1]
1 Sadłogoszcz 1-G
45.8(I)
3.23(II)
2450(II)
300(II)
0.012(III)
1.35(III)
2 Sadłogoszcz 2-G
28.4(I)
1.94(III)
1956(II)
299(II)
0.008(III)
1.34(III)
3 Sadłogoszcz 2-K
49.9(I)
3.15(II)
2788(II)
321(II)
0.018(III)
1.87(III)
4 Sadłogoszcz 5-G
12.7(II)
3.75(III)
2776(II)
488(II)
0.007(III)
1.42(III)
5 Sadłogoszcz 5-K
15.3(II)
3.74(III)
2546(II)
574(II)
0.005(III)
0.95(III)
6 Sadłogoszcz 6-G
22.5(I)
4.35(II)
2662(II)
534(II)
0.012(III)
1.22(III)
7 Sadłogoszcz 6-K
25.3(I)
3.88(II)
2847(II)
602(II)
0.017(III)
1.43(III)
8 Obudno 3-G
9.47(III)
2.26(III)
1709(II)
271(II)
0.009(III)
1.02(III)
9 Obudno 3-K
15.3(II)
1.26(III)
1801(II)
290(II)
0.009(III)
1.25(III)
10 Obudno4-G
6.86(III)
2.72(III)
1437(II)
209(II)
0.015(III)
1.03(III)
11 Obudno 4-K
8.18(III)
2.05(III)
1600(II)
215(II)
0.014(III)
1.25(III)
12 Obudno 7-G
15.7(II)
3.73(III)
1589(II)
219(II)
0.032(II)
2.05(III)
13 Obudno 7-K
14.9(II)
5.27(II)
1687(II)
311(II)
0.028(III)
2.02(III)
14 Obudno 8-G
45.7 (I)
8.12(I)
1619(II)
437(I)
0.044(II)
3.02(II)
15 Obudno8-K
50.3(I)
9.15(I)
1741(II)
504(I)
0.048(II)
3.18(II)
*Microelements extracted with 1M HClClasses of availability: I – high, II – medium, III – low (Fertilizers recommendations 1985; Mocek et al. 2000).
SOILS AND VEGETATION UNDER THE IMPACT OF CEMENT INDUSTRY...

TECHNOGENIC SOILS OF POLAND 154
Summary
The major conclusion drawn from over 25 years of the research on the influence of the cement-lime industry on the quality of the natural environment, soils and plant cover in the vicinity of the Lafarge cement plant was that cement dust acts as a liming sub-stance, raising pH of naturally slightly acidic soils (Luvisols) up to pH 8.6. Due to alka-line emissions, soils are also enriched with calcium, magnesium and potassium in forms available to plants – exchangeable ones.
The application of wastes of di¤erent origin and composition as a fuel in cement manufacturing causes an increase in the content of metals such as lead and zinc in soils in the vicinity of the cement plant. The concentrations of plant-available DTPA-extract-able Pb in the studied soils were low due to high alkalinity caused by the cement dust. Based on metal extractability with DTPA, it was also concluded that plant-available zinc and copper concentrations in the soils a¤ected by cement particles were below the recommended limits due to their alkalization.
Natural vegetation was a¤ected by cement dust in a similar way as soils. Hard ce-ment incrustation was observed on exposed surfaces of pine trees. The negative e¤ect was also observed in the morphology of pine needles and consequently – the growth reduction in trees.
Also changes in the quality of plants in arable fields under the influence of cement emission were observed. Furthermore, reduction in the height of plants and changes in the morphology of leaves were observed in the corn fields. Purple-red spots and dry leaves were present due to the deficit of phosphorus in available forms in soil. Thus, soil alkalization causes the deficit of phosphorus in the soils surrounding the cement plant in Bielawy.
Taking into consideration changes in the technology of cement production and long term emission of solid particles to the environment, it is necessary to control the soil parameters and the quality of forest and crop vegetation under the impact of cement manufacturing in the Lafarge S.A. plant in Bielawy.
References
1. Brandt C.J., Rhoads R.W. 1972. E¤ects of limestone dust accumulation on composition of a for-est community. Environ. Pollut. 3: 217–225.
2. Cieśla W., Zalewski W., Jaworska H. 1994. Acidity and related properties in arable soils in the midst of KCW ‘Kujawy’ Lime and Cement Plant. Zesz. Probl. Post. Nauk Roln. 413: 75–81.
3. Dąbkowska-Naskręt H, Dymińska M. 1996. Contents and forms of microelements in soils ad-jacent to Cement Lime Kujawy. Zesz. Probl. Post. Nauk Roln. 434,2: 855–860 (in Polish with English abstract).
H. DĄBKOWSKA-NASKRĘT, H. JAWORSKA, P. MALCZYK

155 TECHNOGENIC SOILS OF POLAND
4. Dąbkowska-Naskręt H., Jaworska H., Długosz J. 1997. The influence of emitted cement dust on properties of soils. Fertilization for Sustainable Plant Production and Soil Fertility, Pro-ceedings 3: 8–13.
5. Dąbkowska-Naskręt H., Długosz J. 2000. Elimination of baseline concentration of zinc in soils of Kujawy region, Poland. Mengen Spuren Element 20: 16–21.
6. Dąbkowska-Naskręt H., Jaworska H., Długosz J. 2002. The influence of pH changes on the mobility of copper and zinc in Luvisols in the vicinity of Lafarge-Cement Poland S.A. plant. (in Polish). Zesz. Probl. Post. Nauk Roln. 482: 11–119 (in Polish with English abstract).
7. Dąbkowska-Naskręt H., Jaworska H., Długosz J. 2006. E¤ect of cement dust on lead content in soils in the vicinity of the Lafarge-Cement Poland S.A. Plant Ecol. Chem. And Eng. A. 13/12: 1353–1359.
8. Dąbkowska-Naskręt H., Jaworska H., Malczyk P. 2011. Changes in soil environment under the impact of cement-lime industry in 1991–2011 in Barcin. [In:] M. Jankowski (Ed.). Selected prob-lems of genesis, systematics, management and soil protection in the region of Kuyavia and Pomerania: 175–193 (in Polish).
9. Fertilizers recommendations. 1985. Thu. I. Limiting numbers to valuation contents of macro- and micronutrients in the soils. Ed. IUNG Puławy, Ser. P (20): 14–34.
10. Hemlata C. 1991. E¤ect of cement dust on growth performance of Trigonellafoenum graecum, and the reversal of its inhibitory e¤ect by di¤erent substance and growth rehalators. Acta Ecol. 13(2): 103–108.
11. Jaworska H. 1990. Preliminary study on the e¤ect of dust emitted by Cement-Lime Plant ‘Kujawy’ on soils and forest pine trees. Biuletyn Inf. ‘Człowiek przeciwko sobie’ cz. I, XVII, 5–17 (in Polish).
12. Jaworska H., Kobierski M., Dąbkowska-Naskręt H. 2008. Cation exchange capacity and ex-changeable bases in Luvisols with di¤erent texture. Rocz. Glebozn. 59(1): 84–89 (in Polish with English abstract).
13. Jaworska H., Dąbkowska-Naskręt H., Różański Sz. 2009. Total content of mercury in arable soils in the vicinity of Lafarge-Cement Poland S.A. Plant (Kujawy Bielawy). Ecol. Chem. And Eng. A. 16, 10: 1299–1305.
14. Jaworska H., Dąbkowska-Naskręt H., Sawilska K. 2010. The influence of cement dust on se-lected properties of soils and the morphology of pine needles from the forest stands in the surroundings of ‘Lafarge’ – cement plant in Bielawy. Ecol. Chem. And Eng. A. 4(1): 14–145.
15. Kabata-Pendias A. 2001. Biogeochemistry of trace elements. Wyd. Nauk. PWN, Warszawa (in Polish).
16. Kondracki 2002. Regional geography of Poland. Wyd. Nauk. PWN: 164–166 (in Polish).
17. Lindsay W.L., Norvell W.A. 1978. Development of DTPA soil test for zinc, iron, manganese and copper. Soil Sci. Soc. Am. J. 42: 421–428.
18. Mandre M. 2002. Relationships between lignin and nutrients in Picea albies L. under alkaline air pollution. Water Air Soil Poll. 133: 361–377.
19. Mandre M., Kloseiko J., Ots K., Tunlmets L. 1999. Changes in phytomass and nutrient partitioning in young conifers in extreme alkaline growth conditions. Environ. Pollut. 105: 209–220.
SOILS AND VEGETATION UNDER THE IMPACT OF CEMENT INDUSTRY...

TECHNOGENIC SOILS OF POLAND 156
20. Mocek A., Drzymała S., Maszner P. 2000. Genesis, analysis and classification of soils. AR Poznań: 265–270 (in Polish).
21. Scheider M., Romer M., Tschudin M., Bolio H. 2011. Sustainable cement production – present and future. Cement Concrete Res. 4: 642–650.
22. Zerougi Z., Sbaa M., Quiidi M., Elkhamouz M., Bengamra S., Zerrougi A. 2008. Assessment of cement’s dust impact on the soil using principal component analysis and GIS. Int. J. Environ. Sci. Technol. 5(1): 125–134.
H. DĄBKOWSKA-NASKRĘT, H. JAWORSKA, P. MALCZYK

157 TECHNOGENIC SOILS OF POLAND
SOILS CONTAMINATED BY INDUSTRIAL BRINE SPILLS IN SĘDOWO
PIOTR HULISZ PAWEŁ SOWIŃSKI ANNA FELIŃCZAK-DRABIK
9Introduction
Brine is an important substrate for the chemical industry in the Kuyavian-Pomeranian Province (north-central Poland). This raw material is extracted in two salt mines – Góra and Przyjma near Mogilno using a borehole mining system and transported over long distances through pipelines with a total length of ca. 140 km. The most important prob-lem related to operation of the pipelines are frequent failures, mainly due to electrolytic corrosion of the pipes, which are followed by uncontrolled brine spills with a concentration of about 312 g NaCl·dm-3 into the soils and groundwater. It can even lead to complete degradation of soils and crops. Such soils lose their natural structure and permeability, which results in the brine stagnation on the land surface. Furthermore, heavy precipita-tion washes out the salt from the soil, which as a solution is likely to migrate to e.g. shal-low groundwater. During a drought, however, severe crusting of soils impedes the agricul-tural practices (Rytelewski et al. 1993; Gonet, Herman 1995; Hulisz et al. 2001).
In this chapter, the case study method was used to assess the salinity of agricul-tural soils contaminated by industrial brine spills in Sędowo (near Mogilno). Bases on the obtained results, also the proposals for soil reclamation were presented. The re-search object is an example of spot, but very strong technogenic transformations of the natural environment.
Study area and methods
Failure of the brine pipeline, which belongs to Inowrocław Salt Mines (Inowrocławskie Kopalnie Soli SOLINO S.A.) took place in October 2007. The brine spill from the protec-tion well no. 25 (52°43’18.67’’ N; 17°57’51.45’’ E) occurred in the village of Sędowo near Mogilno (Fig. 1.). In July 2008; there was also another failure which did not result in the

TECHNOGENIC SOILS OF POLAND 158
brine leak out of the well. The contamination covered the field of barley on Luvisols. These soils were characterised by coarse-over-fine vertical texture contrasts (loamy sands overlying loam or silty loam).
Fig. 1. Location of the study area (source: Google Earth 2013)
The study was conducted in 2011 using the method of transects, which were located in the immediate vicinity of the protection well and the pipeline, and at some distance from them. Soil samples for analysis were collected from boreholes prepared at three di¤erent depths: 0–20 cm, 60–80 cm, and 130–150 cm (sites 1–19), which allowed to determine the extent of the soil salinity (Fig. 2).
The majority of boreholes were made in the area where agricultural cultivation was discontinued due to the pipeline failure (wasteland). The outermost sites of the soil transects were located on the cultivated field (sites 8, 14 and 17). For comparison pur-poses, the reference samples were also collected (sites 18 and 19) and located outside the zone of brine influence. In addition, the actual moisture of soils (0–20 cm) was measured under field conditions by Time-Domain Reflectometry (TDR), the vegetation cover was identified and the surface of wasteland around the well was mapped.
P. HULISZ, P. SOWIŃSKI, A. FELIŃCZAK-DRABIK
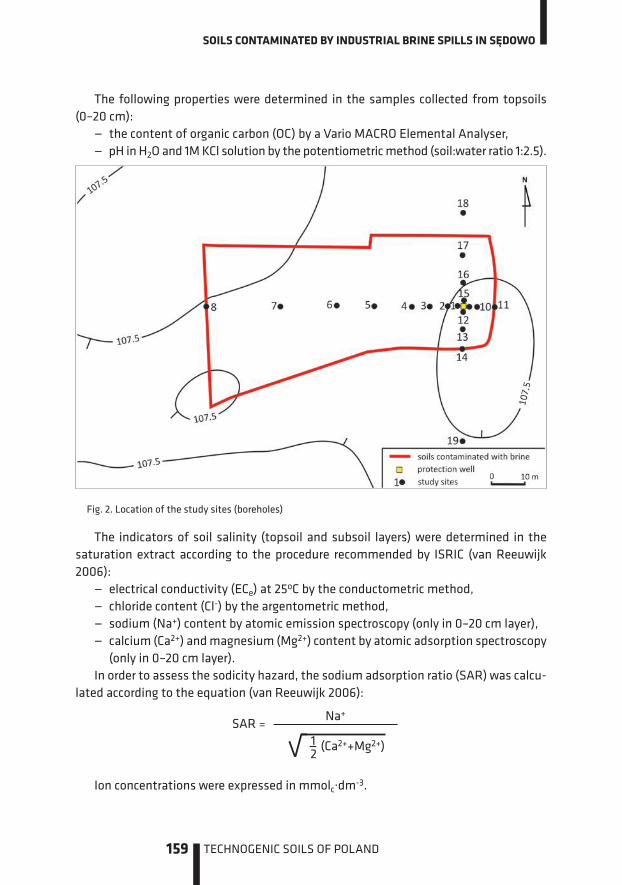
159 TECHNOGENIC SOILS OF POLAND
SOILS CONTAMINATED BY INDUSTRIAL BRINE SPILLS IN SĘDOWO
The following properties were determined in the samples collected from topsoils (0–20 cm):
— the content of organic carbon (OC) by a Vario MACRO Elemental Analyser,— pH in H2O and 1M KCl solution by the potentiometric method (soil:water ratio 1:2.5).
Fig. 2. Location of the study sites (boreholes)
The indicators of soil salinity (topsoil and subsoil layers) were determined in the saturation extract according to the procedure recommended by ISRIC (van Reeuwijk 2006):
— electrical conductivity (ECe) at 25oC by the conductometric method,— chloride content (Cl-) by the argentometric method,— sodium (Na+) content by atomic emission spectroscopy (only in 0–20 cm layer), — calcium (Ca2+) and magnesium (Mg2+) content by atomic adsorption spectroscopy
(only in 0–20 cm layer).In order to assess the sodicity hazard, the sodium adsorption ratio (SAR) was calcu-
lated according to the equation (van Reeuwijk 2006):
SAR =Na+
√ 1—2 (Ca2++Mg2+)
Ion concentrations were expressed in mmolc·dm-3.

TECHNOGENIC SOILS OF POLAND 160
Influence of brine contamination on soil properties
Based on the field observations, it was found that during the pipeline failure, the brine mostly spilled over the western and southern parts of the study area according to the land slope (Fig. 2). For the analysed soils, the adverse changes in the soil structure was found only within a very narrow zone, up to 10 m westwards from the well (sites 1–3). This area represents a shallow depression, where brine certainly stagnated for a long time (Fig. 3).
Fig. 3. Changes in the soil structure caused by brine spill
The organic carbon (OC) content in the soils within the limits of the wasteland ranged from 0.81% (site 3) to 1.37% (site 7) – Table 1. The content of organic matter in soils under cultivation of barley ranged from 0.73% to 1.28%. Compared to soils perma-nently used for agriculture, the surface horizons of soils contaminated with brine were not depleted of organic matter.
The actual moisture of the topsoil ranged from 4.5% (site 7) to 22.1% (site 13) – Table 1. The lowest values were characteristic of soils occurring westwards from the protection well and those under the cultivation of barley.
P. HULISZ, P. SOWIŃSKI, A. FELIŃCZAK-DRABIK

161 TECHNOGENIC SOILS OF POLAND
Table 1. Selected properties of the topsoil (0–20 cm)
Site No.
Actual moisture [% v/v]
pH OC [%]in H2O in KCl
1 14.8 7.3 6.9 1.06
2 20.3 6.9 5.2 0.93
3 10.2 6.7 4.8 0.86
4 9.0 7.2 5.9 0.94
5 4.7 6.7 5.5 1.04
6 5.9 6.7 5.0 1.19
7 4.5 6.3 4.8 1.37
8 14.6 7.5 7.0 1.28
9 5.0 6.9 5.4 1.07
10 6.8 6.8 5.7 1.08
11 15.0 6.4 5.6 0.81
12 17.3 7.3 6.1 0.81
13 22.1 7.1 5.8 1.04
14 12.5 8.1* 7.6* 1.06
15 8.6 7.2 6.5 1.20
16 13.5 7.2 6.2 0.95
17 8.9 7.5 6.9 0.94
Reference samples
18 6.1 7.0 6.3 0.85
19 8.5 6.7 6.0 0.73
*CaCO3 content 1.3%
The soils contaminated with industrial brine following the failure of pipelines are likely to have alkaline reaction (Rytelewski et al. 1988). The increase in pH values above 10 may be caused by some reactions with exchangeable sodium and hydrolysis of salts, such as Na2CO3 and NaHCO3. This is particularly evident for soils rich in calcium carbonate. The pH values (in H2O) for samples collected from topsoil (0–20 cm), which mostly did not contain carbonates, ranged from 6.3 to 7.5. In many cases, they did not deviate from the values obtained for the reference samples (7.0 and 6.7, respectively) – Table 1. The alkaline reaction (pH 8.1) was recorded only for one sample (site 14). It was probably caused by the presence of CaCO3.
The pH values measured in H2O for non-saline soils characterised by low content of calcium carbonate (also non-limed) are usually about one to one and a half units higher than those measured in KCl. Such a relationship was observed for 10 out of 17 analysed
SOILS CONTAMINATED BY INDUSTRIAL BRINE SPILLS IN SĘDOWO

TECHNOGENIC SOILS OF POLAND 162
samples, as well as for the reference sites. In the soils containing neutral salts, such as NaCl, the reaction is usually neutral or weakly alkaline, while pH values in H2O and KCl are generally very similar (Hulisz 2007). Therefore, four years after the failure, the impact of brine on the topsoil pH can be considered as very small.
According to the salinity scale proposed by Jackson (1958) and given the ECe determi-nations for all horizons (Tables 2 and 3), the examined soils can be classified as follows:
— sites 6, 7, 8, 14 and 17 – non-saline soils (0–2 dS·m-1), — sites 5, 9, 10, 11,12 and 13 – slightly saline soils (2–4 dS·m-1), — sites 1 and 15 – moderately saline soils (4–8 dS·m-1), — sites 2, 3, 4 and 16 – strongly saline soils (8–16 dS·m-1).It should be noted, however, that right after the failure, the level of soil salinity can
be extremely high. As evidenced by the research of Hulisz et al. (2001), the ECe values in the soils contaminated with brine are likely to reach even 194 dS·m-1.
The results showed that four years after the failure, the humus horizons of the analysed soils (0–20 cm) were significantly desalinated (Table 2). The ECe values ranged from 0.64 to 5.34 dS·m-1. The highest electrical conductivity was recorded at the sites located in the closest proximity to the well (1, 9, 12, 15). The ECe values significantly decreased with the distance from the well. At the outermost sites of the transects (7, 8, 11, 14, 17), they were only two or three times higher than the ECe values recorded for the reference samples (0.35 and 0.42 dS·m-1, respectively).
By analysing the ECe values in all the layers (0–20, 60–80 and 130–150 cm), it should be pointed out that for as many as eight sampling sites (2–6, 10, 11, 16), the salinity of deeper soil horizons was significantly higher compared to the surface horizons (up to a maximum of 17.9 dS·m-1). This probably resulted from the loamy or silty loamy texture of soil horizons laying deeper and top-down washing out by rainwater (Table 3).
Due to the pipeline failure, the high salinity level was mainly associated with the presence of chloride and sodium ions in the soil. Chlorine compounds are readily soil-soluble. The chloride anion (Cl-) is basically not exchangeably adsorbed. For this reason, it is rapidly washed out from the surface soil horizons deep into the soil profile and absorbed by plants. Very high chloride content was recorded in three samples (site 1 – 1820 mg·dm-3, site 12 – 1090 mg·dm-3 and site 15 – 1920 mg·dm-3) collected from the topsoil around the protection well (Table 3). However, as in the case of ECe, the maxi-mum chloride content occurred in deeper soil horizons (up to 6890 mg·dm-3 – site 2). For comparison, the Cl- content in reference samples (sites 18 and 19) was 29.1 and 34.0 mg·dm-3, respectively.
P. HULISZ, P. SOWIŃSKI, A. FELIŃCZAK-DRABIK

163 TECHNOGENIC SOILS OF POLAND
Table 2. Properties of the soil saturation extract (topsoil; layer 0–20 cm)
Site No. ECe[dS·m-1]
Cl- Na+ Ca+ Mg2+
SAR[mg·dm-3]
1 5.34 1820 1490 4.88 4.11 120
2 0.69 315 n.d. n.d. n.d. —
3 1.12 800 301 0.97 1.39 46
4 1.21 437 356 12.7 4.47 22
5 0.90 218 177 13.6 5.24 10
6 0.82 243 187 3.18 2.42 19
7 0.48 48.5 93.9 6.34 3.20 8
8 0.50 38.8 17.8 58.1 7.25 1
9 1.39 437 301 8.84 4.39 21
10 0.60 72.8 35.9 38.1 8.77 2
11 1.02 82.5 28.9 37.9 8.86 1
12 3.04 1090 814 13.0 3.52 52
13 2.04 728 555 6.70 4.69 40
14 0.86 48.5 28.1 96.9 14.3 1
15 7.24 1920 1810 189 25.9 33
16 2.56 703 448 28.7 5.47 20
17 0.67 38.8 9.3 87.9 9.66 <1
Reference samples
18 0.35 29.1 5.56 37.8 6.84 <1
19 0.42 34.0 7.50 40.6 8.87 <1
The soils contaminated with brine (NaCl) concentrate the exchangeable sodium in the sorption complex, while Ca2+ and Mg2+ ions are displaced therefrom. It is an adverse phenomenon from the agricultural point of view (Rengasamy, Olsson 1991). The salinity of the analysed soils was qualitatively assessed using the sodium adsorption ratio (SAR). This indicator was originally used to estimate the relative content of sodium in irrigation waters, the impact of which may contribute to the formation of sodium soils (as a result of exchangeable adsorption of cations). Therefore, it describes the so-called sodium risk. The SAR threshold for sodium soils is 15, if pH exceeds 8.5 (Richards 1954). In the analysed soils, SAR values ranged from 1 to 120 (Table 2). In the reference sites, however, they were lower than 1. The value of this indicator showed a clear relationship with ECe due to the dominant contribution of NaCl in the soil salinity. Accordingly, the mentioned threshold value (SAR > 15) was exceeded at 8 sites in the closest proximity to the well.
SOILS CONTAMINATED BY INDUSTRIAL BRINE SPILLS IN SĘDOWO

TECHNOGENIC SOILS OF POLAND 164
Table 3. Properties of the soil saturation extract (subsoil; layers 60–80 and 130–150 cm)
SiteNo.
60–80 cm 130–150 cm
ECe [dS·m-1] Cl- [mg·dm-3] ECe [dS·m-1] Cl- [mg·dm-3]
2 12.5 4850 17.9 6890
3 15.3 5890 16.2 6350
4 1.11 582 10.1 3710
5 1.75 631 3.07 1240
6 1.30 340 0.34 29.1
8 0.23 24.3 n.d. n.d.
10 3.43 1330 3.65 1360
11 0.90 53.4 3.92 1410
13 0.88 53.4 0.32 29.1
14 0.29 24.3 0.28 29.1
16 2.31 606 11.6 3930
17 0.33 29.1 0.44 34.0
Reference samples
18 0.47 38.8 0.41 34.0
19 0.26 24.3 0.14 9.70
Spatial variability in the salinity of the analysed soils
The mapping of the study area enabled calculation of the wasteland area located around the protection well. It amounted to 0.95 ha. According to the classification by Jackson (1958), the study area was dominated by non-saline and slightly saline soils. They covered 71.6% and 18.9% of the wasteland, respectively. The area of moderately and strongly saline soils was 9.5% of the total area, which certainly indicated a fairly limited range of the pollution impact as a consequence of the brine pipeline failure. The spatial distribution of zones with di¤erent soil salinity levels is presented in Figure 4.
P. HULISZ, P. SOWIŃSKI, A. FELIŃCZAK-DRABIK
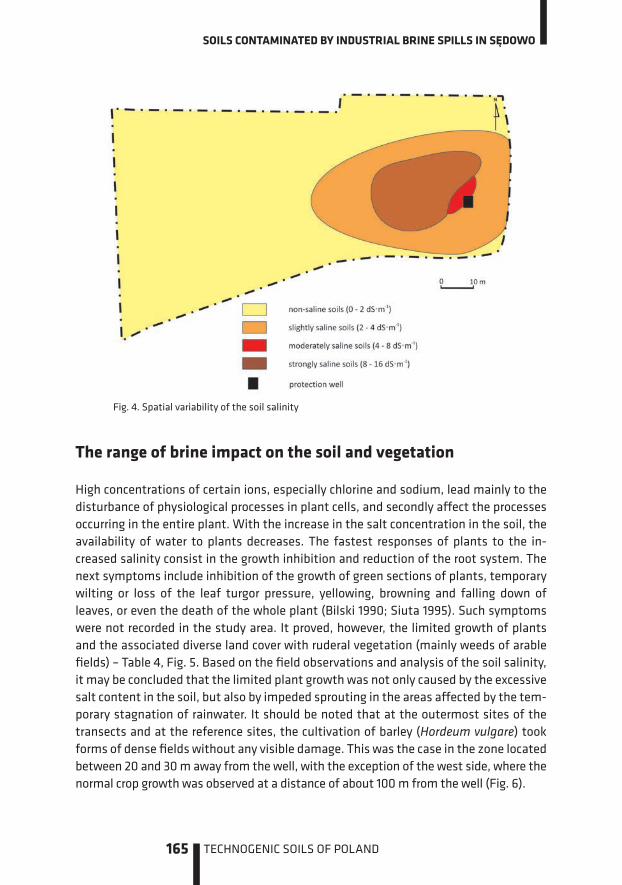
165 TECHNOGENIC SOILS OF POLAND
Fig. 4. Spatial variability of the soil salinity
The range of brine impact on the soil and vegetation
High concentrations of certain ions, especially chlorine and sodium, lead mainly to the disturbance of physiological processes in plant cells, and secondly a¤ect the processes occurring in the entire plant. With the increase in the salt concentration in the soil, the availability of water to plants decreases. The fastest responses of plants to the in-creased salinity consist in the growth inhibition and reduction of the root system. The next symptoms include inhibition of the growth of green sections of plants, temporary wilting or loss of the leaf turgor pressure, yellowing, browning and falling down of leaves, or even the death of the whole plant (Bilski 1990; Siuta 1995). Such symptoms were not recorded in the study area. It proved, however, the limited growth of plants and the associated diverse land cover with ruderal vegetation (mainly weeds of arable fields) – Table 4, Fig. 5. Based on the field observations and analysis of the soil salinity, it may be concluded that the limited plant growth was not only caused by the excessive salt content in the soil, but also by impeded sprouting in the areas a¤ected by the tem-porary stagnation of rainwater. It should be noted that at the outermost sites of the transects and at the reference sites, the cultivation of barley (Hordeum vulgare) took forms of dense fields without any visible damage. This was the case in the zone located between 20 and 30 m away from the well, with the exception of the west side, where the normal crop growth was observed at a distance of about 100 m from the well (Fig. 6).
SOILS CONTAMINATED BY INDUSTRIAL BRINE SPILLS IN SĘDOWO

TECHNOGENIC SOILS OF POLAND 166
Fig. 5. Unvegetated area west of the protection well
Fig. 6. Barley crop at a distance of about 20 m west of the protection well
P. HULISZ, P. SOWIŃSKI, A. FELIŃCZAK-DRABIK

167 TECHNOGENIC SOILS OF POLAND
Table 4. Characteristics of the vegetation cover in the study area
Site No. Cover [%] Main species Land-use type
1
no plants
Polygonum aviculare, Multicaria inodora wasteland
2
3
4 30
5 75
6 85
7 85
8 100 Hordeum vulgare arable land
9 no plants
wasteland10 55 Polygonum aviculare, Multicaria inodora, Alopecurus geniculatus11 65
12 10 Polygonum aviculare, Alopecurus geniculatus, Apera spica-venti
wasteland13 15
14 100 Hordeum vulgare arable land
15 80 Polygonum aviculare, Alopecurus geniculatus wasteland
16 15
17 100 Hordeum vulgare arable land
Reference sites
18 100Hordeum vulgare arable land
19 100
Reclamation of brine-impacted soils
Among the chemical methods commonly applied for reclamation of sodium soils, the most frequent are gypsum and phosphogypsum methods (Abrol et al. 1988; Rytelewski et al. 1992). Following the application of these substances, the soils show a decrease in alkalisation and a significant displacement of the sodium ion from the sorption com-plex by calcium. The reclamation treatments, however, do not eliminate the wrong ratio of calcium to magnesium. Considering the properties of the humus horizons in the ana-lysed soils (slightly alkaline reaction and significant desalination of the horizons four years after the failure), the application of this method does not seem right.
SOILS CONTAMINATED BY INDUSTRIAL BRINE SPILLS IN SĘDOWO
TECHNOGENIC SOILS OF POLAND 168
In the Polish climatic conditions (predominance of precipitation over evaporation throughout the year), the soils under the influence of brine should fairly quickly and naturally desalinate by washing out of harmful substances from the soil profile. Unfor-tunately, in the case of the analysed soils, the clay soil horizons constitute a barrier for penetration of pollutants. Moreover, much of the area a¤ected by brine is in a shallow depression, where rainwater periodically stagnates. Therefore, it appears that in this case, the natural process of soil desalination is basically impossible.
During the failure, the brine spilled mainly along the pipeline. Therefore, the con-struction of the latter and soil morphological disturbances may further impede the salt penetration into deeper horizons. In such situation, one of the possible solutions would consist of a complete soil replacement to a depth of the pipeline (1.5 m) and the soil cover restoration. This would be, however, a very cost-intensive investment. Such a so-lution should be seriously considered in the face of the ongoing electrolytic corrosion of the pipeline and the risk of further failures. In order to restore the soil cover to pre-failure condition, it would be necessary to perform the following work:
– removal of the soil material of varying degrees of salinity to a depth of 1.5 m,– replenishment of the mineral material with a thickness of 1.25 m and specific
quality parameters,– replenishment of the humus layer with a thickness of about 0.25 m and specific
quality parameters,– performance of agrotechnical operations.Another solution would be to create an ecological site with shrubs and trees resistant
to salinity, such as Betula pendula, Ailanthus altissima, Gleditsia triacanthos, Quercus robur, Quercus rubra, Robinia pseudoacacia and Sophora japonica (Leh 1971). In the initial phase of such project, it is necessary to level the land (removal of minor local depressions) to prevent the surface water stagnation.
In addition to landscape values, such activity would be highly beneficial in terms of agrocenoses. Narrow patches of vegetation at the edges or within the crops are critical to the preservation of local fauna and flora. They are also shelters and migration routes between permanent animal habitats. They can be, for example, habitats for insects of the ground beetle family and birds that feed on crop pests (Dąbrowski, Wysocki 2009). It should be noted that the formation of ecological sites is one of the most important guidelines of the Thematic Strategy for Soil Protection (Commission of the European Communities 2006).
Summary
The influence of industrial brine on the soils four years after the pipeline failure in Sędowo is still evident, but in a limited zone representing only 28.4% of the entire investigated wasteland, i.e. 0.27 ha.
P. HULISZ, P. SOWIŃSKI, A. FELIŃCZAK-DRABIK
169 TECHNOGENIC SOILS OF POLAND
The results showed that the topsoil (0–20 cm) was significantly naturally desali-nated. The highest electrical conductivity was measured at the sites located in the closest proximity to the well (ECe >2 dS·m-1). The ECe values distinctively decreased with the distance from the well. In the subsurface horizons, the salinity level was higher (ECe values up to 17.9 dS·m-1) and had a similar spatial variability.
Based on the field observations and analysis of the soil properties, it may be con-cluded that the limited plant growth was caused not only by the excessive salt content in the soil, but also by impeded sprouting in the small depressions a¤ected by temporary rainwater stagnation. At the outermost sites of the soil transects and at the reference sites, the cultivation of barley took forms of dense fields without any visible damage.
Due to adverse environmental conditions, mainly poorly permeable subsoil horizons and periodic stagnation of water in small depressions, there are two options of land reclamation/development. The first consists in the total replacement of the ground to a depth of the pipeline and the restoration of soil cover. The second one is related to the transformation of the study area into an ecological site. It should be noted, however, that the reclamation of soils degraded due to brine spills cannot substitute for an e¤ective action preventing a failure recurrence. In the Kuyavian-Pomeranian Province, a total re-placement of pipes is required with those resistant to corrosion (for example plastic ones).
References
1. Abrol I.P., Yadav J.S.P., Massoud F.I. 1988. Salt-a�ected soils and their management. FAO Soils Bulletin 39, Rome.
2. Bilski J. 1990. Acidification and salinity of the substrate as stress factors for plants. Rocz. Nauk Rol. ser. D, 222. PAN, Warsaw (in Polish).
3. Dąbrowski Z. T., Wysocki C. 2009. Needs for interdisciplinary approach in the validation of importance of designated ecological areas and ecological infrastructures for pro-ecological plant protection. Prog. Plant Prot. 49 (3): 973–981 (in Polish with English abstract).
4. Gonet S., Hermann J. 1995. Salinity hazard of the black earths in the Kuyavian region. Zesz. Probl. Postępów. Nauk Rol. 418: 207–217 (in English with Polish abstract).
5. Hulisz P. 2007. Some aspects of the studies on salt-a�ected soils in Poland. SOP, Toruń (in Polish).
6. Hulisz P., Pokojska U., Posadzy W. 2001. E¤ects of damage of Góra-Mątwy brine pipeline and methods of counteracting soil degradation. Inż. Ekol. 5: 63–69 (in Polish with English abstract).
7. Jackson M. L. 1958. Soil chemical analysis. Constable Ltd., London.
8. Leh O.H.; 1971. Schäden an Strassebaumen durch Ausftausalze. Gesunde Pflanzen 23: 217–220 (in German).
9. Rengasamy P., Olsson K.A. 1991. Sodicity and soil structure. Aust. J. Soil Res. 29: 935–952.
SOILS CONTAMINATED BY INDUSTRIAL BRINE SPILLS IN SĘDOWO

TECHNOGENIC SOILS OF POLAND 170
10. Richards L. A. (Ed.) 1954. Diagnosis and improvement of saline and alkali soils. Agriculture Handbook 60, USDA, Washington.
11. Rytelewski J., Kasińska D., Poradziński M., Przedwojski J., Wróbel R. 1988. Chemistry of soils occurring along the brine pipelines in the area of Inowrocław. Acta Acad. Agri. Tech. Olst. 45: 35–41 (in Polish with English abstract).
12. Rytelewski J., Przedwojski J., Niklewska A. 1992. Programme of remediation of salt-a¤ected soils in Kuyavian region. Biul. Nauk. ART Olsztyn 1: 139–144 (in Polish with English abstract).
13. Rytelewski J., Przedwojski J., Niklewska A. 1993. Causes of salt-a¤ected soils formation in the Kuyavian region. Acta Acad. Agric. Tech. Olst. 56: 111–120 (in Polish with English abstract).
14. Siuta J. 1995. Soil – diagnosis of state and the risk. IOŚ, Warsaw (in Polish).
15. Commission of the European Communities (CEC). 2006. Thematic Strategy for Soil Protec-tion – COM (2006)/231. http://ec.europa.eu/environment/soil/pdf/com_2006_0231_en.pdf
16. van Reeuwijk L.P. 2006. Procedures for soil analysis. 7th Edition. Technical Report 9, ISRIC – World Soil Information, Wageningen, Netherlands.
P. HULISZ, P. SOWIŃSKI, A. FELIŃCZAK-DRABIK
PART IIITRAFFIC AREAS


173 TECHNOGENIC SOILS OF POLAND
10 EKRANOSOLS OF TORUŃ AIRFIELD
PRZEMYSŁAW CHARZYŃSKI RENATA BEDNAREK ŁUKASZ MENDYK MARCIN ŚWITONIAK ALEKSANDRA POKOJSKA-BURDZIEJ ANDRZEJ NOWAK
Introduction
According to the Thematic Strategy for Soil Protection (2006) defined by the Commission of the European Communities, the major threats leading to soil degradation include: erosion, decline in organic matter, local and di�use contamination, compaction, decline in biodiversity, salinisation, floods, landslides and sealing. Further in the document: ‘In order to achieve a more rational use of soil, Member States will be required to take appropriate measures to limit soil sealing by rehabilitating brownfield sites and to mitigate its e�ects by using construction techniques that allow maintaining as many soil functions as possible’.
When studying the ecological situation in the cities, extensive covering of the earth's surface should be taken into account, as this causes the soil degradation. The examples include aerial photographs of Moscow, which revealed that covered soils rep-resent 90 – 95% of the total area in the city centre, 80% in industrial districts, and 60% in residential districts (Stroganova et al. 1998).
According to Stroganova et al. (1998), the soil surface can be covered (isolated from the impact of the atmosphere) by:
— buildings,— permeable road surfaces (pavement, gravel),— impermeable road surfaces (asphalt, concrete). The problem of soil covering has been extensively studied by the team of researchers
from the Lomonosov State University of Moscow who analysed technogenic and anthro-pogenic soils of the city (Stroganova et al. 1998; Prokofieva, Gubankov 2000; Stroganova, Prokofieva 2000, 2001, 2003; Gerasimova et al. 2003). Soils covered with asphalt were called Ekranosols. The name comes from French: écran – screen and from Russian: zemla – soil, earth. The systematics of urban surface deposits developed by the afore-mentioned research team defines Ekranosols as one of the urban soil types under the

TECHNOGENIC SOILS OF POLAND 174
P. CHARZYŃSKI, R. BEDNAREK, Ł. MENDYK, M. ŚWITONIAK, A. POKOJSKA-BURDZIEJ, A. NOWAK
road foundation, asphalt, concrete and others. Burghardt (2001) classifies the covered soils from the group of lithosols as ekranolits and defines them as young urban soils where diagnostic horizons have not developed yet.
In the latest edition of WRB classification (IUSS Working Group WRB 2006), sealed soils were included in the new Reference Soil Group − Technosols. They are identified on the lower level of classification, with the qualifier Ekranic (ek). This qualifier is applied when technic hard rock starts within 5 cm of the soil surface, covering at least 95% of the horizontal extent of the pedon.
The authors of this chapter previously undertook the research on the covered soils in the city of Toruń and Romanian Cluj-Napoca (Charzyński et al. 2011).
The study area and soil profile documentation
Soil pits were located in the Toruń airfield (Fig. 1), which is situated on terrace IV of the Vistula River with an altitude of 50–52 m a.s.l. The terrace is built of sands with gravel interbeddings of 7–10 m thickness mostly (Niewiarowski, Weckwerth 2006). The Toruń airfield located in the western part of the city, covers an area of 297 ha, and includes a homogeneous land of Ekranic Technosols with an area of over 15 ha. It consists of two runways with the length of 1.270 m and the width of 60 m, arranged in the shape of the letter ‘T’.
A balloon and airship (dirigible) airport, as well as the airfield were built in Toruń already in the first decade of the 20th century by the then German authorities. When Pomerania was regained by the Republic of Poland (18 January, 1920), Toruń military facilities were planted with vegetation by the Polish army. Soon after that, the Aviation Observers O¨cers School was opened (including the Aeronautical O¨cers' School). Since 1924, the airfield hosted Air Force Regiment 4. In 1935, sport aviation enthusiasts set up a local flying club, which was the first association of this kind in the Pomeranian Province and was called the Pomeranian Flying Club (in Polish: Aeroklub Pomorski). During World War II, the German Luftwa�e was stationed in the Toruń airfield, and at that time the aforementioned runways were built (Słowiński 1983). At present, the Po-meranian Flying Club operates in the airfield.

175 TECHNOGENIC SOILS OF POLAND
EKRANOSOLS OF TORUŃ AIRFIELD
Fig. 1. Location of soil profiles within Toruń urban areas.
Three soil pits were made in the airfield area: — profile 1 – the reference, Arenosol (Parathaptobrunic), 2 m from the edge of the
concrete apron, — profile 2 – Ekranic Technosol, soil covered with concrete, 1 m from the edge of the
concrete apron, — profile 3 – Ekranic Technosol, soil covered with concrete, 3 m from the edge of the
concrete apron (Fig. 2). Samples with undisturbed and disturbed structure were collected for laboratory
analysis from profiles 1 and 2, from all identified horizons. Analyses of soil samples col-lected from horizons and layers were performed according to international standards (van Reeuwijk 2006). The following additional analyses were performed in samples col-lected from selected horizons:
— total phosphorus (Pt) by Bleck’s method, modified by Gebhardt (1982),— the content of heavy metals dissolved in 2M HNO3 (Fe, Mn, Zn, Pb, Cd, Cu, Cr, Ni, Co)
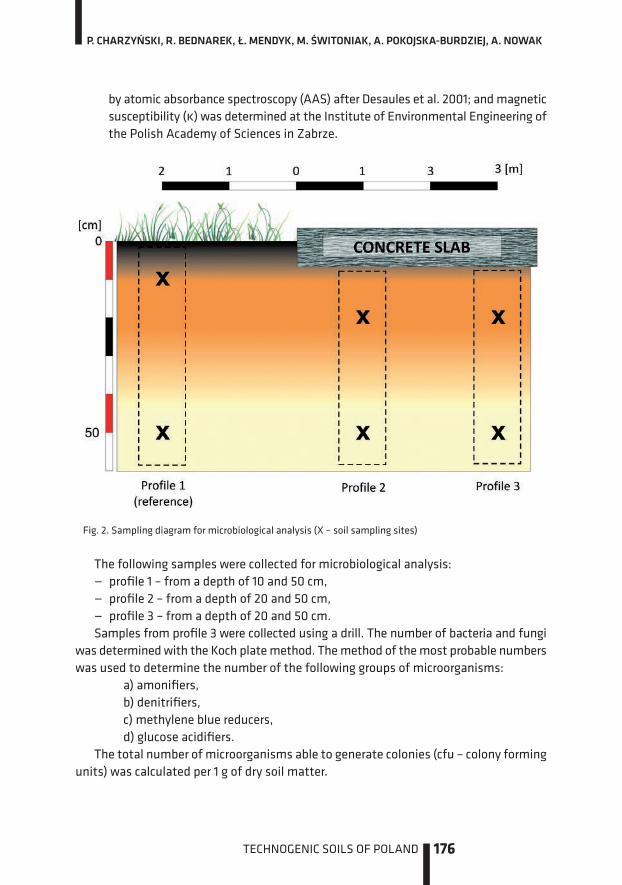
TECHNOGENIC SOILS OF POLAND 176
by atomic absorbance spectroscopy (AAS) after Desaules et al. 2001; and magnetic susceptibility (k) was determined at the Institute of Environmental Engineering of the Polish Academy of Sciences in Zabrze.
Fig. 2. Sampling diagram for microbiological analysis (X – soil sampling sites)
The following samples were collected for microbiological analysis:— profile 1 – from a depth of 10 and 50 cm,— profile 2 – from a depth of 20 and 50 cm,— profile 3 – from a depth of 20 and 50 cm. Samples from profile 3 were collected using a drill. The number of bacteria and fungi
was determined with the Koch plate method. The method of the most probable numbers was used to determine the number of the following groups of microorganisms:
a) amonifiers, b) denitrifiers, c) methylene blue reducers, d) glucose acidifiers.The total number of microorganisms able to generate colonies (cfu – colony forming
units) was calculated per 1 g of dry soil matter.
P. CHARZYŃSKI, R. BEDNAREK, Ł. MENDYK, M. ŚWITONIAK, A. POKOJSKA-BURDZIEJ, A. NOWAK

177 TECHNOGENIC SOILS OF POLAND
Profile 1
Location: Toruń Airfield,
Toruń, Northern Poland
Coordinates: 53˚02’14” N
18˚32’27” E
Soil classification (WRB 2007): Arenosol (Parathaptobrunic)
Ap – 0–18 cm: human-disturbed, sand, dark greyish brown, weak granular structure, slightly moist, clear boundary.B/Cp – 18–55 cm: human-disturbed, sand, very pale brown, single grain structure, slightly moist, clear boundary.A/Bp – 55–74 cm: human-disturbed, sand, pale brown, weak granular/single grain structure, slightly moist, clear boundary, A/Cp – 74–94 cm: human-disturbed, sand, pale brown, weak granular/single grain structure, slightly moist, insertion of organic matter en-riched material, clear boundary.Ab – 94–103 cm: sand, greyish brown, single grain structure, slightly moist, clear boundary.Bwb – 104–130 cm: sand, light yellowish brown, single grain structure, slightly moist, gradual boundary.C – below 130 cm: sand, very pale brown, single grain structure, slightly moist.
EKRANOSOLS OF TORUŃ AIRFIELD
0 cm
50 cm
100 cm

TECHNOGENIC SOILS OF POLAND 178
Table 1. Selected soil properties – profile 1
HORIZON Ap B/Cp A/Bp A/Cp Ab Bwb C
DEPTH [cm] 0–18 18–55 55–74 74–94 94–103 104–130 <130
PARTICLE SIZE DISTRIBUTION [%]
>2 mm 1 <1 <1 <1 2 2 <1
2 mm–50 µm 97 97 98 99 97 98 98
50–2 µm 3 3 2 1 2 2 2
<2 µm 0 0 0 0 1 0 0
TEXTURE CLASS (USDA) sand sand sand sand sand sand sand
SOIL MATRIX COLOUR
drymoist
10YR 4/210YR 3/1
10YR 7/310YR 5/4
10YR 6/310YR 4/3
10YR 6/310YR 4/3
10YR 5/210YR 4/2
10YR 6/410YR 4/4
10YR 7/410YR 5/4
BULK DENSITY [g·cm-3] 1.68 1.69 1.62 1.69 1.68 1.74 1.69
ACTUAL MOISTURE by volume [%] 11.8 2.2 8.6 3.0 3.5 5.0 4.9
OC [%] 0.86 — 0.24 — — 0.09 —
Nt [%] 0.055 — 0.009 — — 0.007 —
C:N 16 — 25 — — 12 —
pHin H2O 7.5 7.6 7.5 7.5 7.6 7.5 6.1
in 1M KCl 6.5 6.8 6.5 6.8 6.5 6.5 5.1
CaCO3 [%] 0.1 0.0 0.1 0.1 0.0 0.0 0.0
Pt [mg·kg-1] 110 65 135 90 163 93 100
P. CHARZYŃSKI, R. BEDNAREK, Ł. MENDYK, M. ŚWITONIAK, A. POKOJSKA-BURDZIEJ, A. NOWAK

179 TECHNOGENIC SOILS OF POLAND
Profile 2
Location: Toruń Airfield,
Toruń,Northern Poland
Coordinates: 53˚02’14” N
18˚32’27” E
Soil classification (WRB 2007): Ekranic Technosol
(Arenic, Parathaptobrunic)
Concrete slab – 0–15 cm.
Ap1 – 15–20 cm: sand, pale brown, weak granular structure, slightly moist, clear boundary.
B/Cp – 20–60 cm: sand, very pale brown, weak granular structure, slightly moist, clear boundary.
Ap2 – 60–63 cm: sand, very dark grey, weak granular structure, slightly moist, clear boundary.
C – 63–95 cm: sand, pale brown, single grain struc-ture, slightly moist, clear boundary.
Ab – 95–102 cm: sand, light brownish grey, single grain structure, slightly moist, clear boundary.
Bwb – 102–120 cm: sand, light yellowish brown, single grain structure, slightly moist, clear boundary.
C – below 120 cm: sand, very pale brown, single grain structure, slightly moist.
EKRANOSOLS OF TORUŃ AIRFIELD
0 cm
50 cm
100 cm
150 cm

TECHNOGENIC SOILS OF POLAND 180
Table 2. Selected soil properties – profile 2
HORIZON Ap1 B/C Ap2 C Ab Bwb C
DEPTH [cm] 15–20 20–60 60–63 63–95 95–102 102–120 <120
PARTICLE SIZE DISTRIBUTION [%]
>2 mm <1 <1 <1 <1 2 5 1
2 mm–50 µm 98 96 95 98 98 99 98
50–2 µm 2 4 4 2 2 1 2
<2 µm 0 0 1 0 0 0 0
TEXTURE CLASS (USDA) sand sand sand sand sand sand sand
SOIL MATRIX COLOUR
dry
moist
10YR 6/3
10YR 4/2
10YR 7/3
10YR 5/4
10YR 3/1
10YR 2/1
10YR 6/3
10YR 5/3
10YR 6/2
10YR 4/2
10YR 6/4
10YR 4/4
10YR 7/4
10YR 5/4
BULK DENSITY [g·cm-3] 1.56 1.46 — 1.63 1.71 1.66 1.79
ACTUAL MOISTURE by volume [%] 3.6 3.8 — 3.6 5.3 5.1 4.5
OC [%] 0.13 0.14 2.39 — 0.13 0.11 —
Nt [%] 0.006 0.007 0.138 — 0.008 0.010 —
C:N 23 20 17 — 16 11 —
pHin H2O 8.8 5.3 7.4 6.2 4.7 4.9 5.4
in 1M KCl 8.0 5.0 6.7 5.1 4.7 4.9 5.0
CaCO3 [%] 0.2 0.0 0.2 0.0 0.0 0.0 0.0
Pt [mg·kg-1] 139 139 118 93 91 162 104
General soil properties
Morphology and physical propertiesMorphology, as well as physical and chemical properties of the analysed airfield soils were significantly changed compared to natural soils in the vicinity. Also the research conducted in Pushchino revealed that not only Ekranosols, but also adjacent soils are characterised by modified morphology and compaction (Reshotkin 2003).
P. CHARZYŃSKI, R. BEDNAREK, Ł. MENDYK, M. ŚWITONIAK, A. POKOJSKA-BURDZIEJ, A. NOWAK

181 TECHNOGENIC SOILS OF POLAND
Distorted, unnatural configuration of horizons (buried A horizons mixed with Brunic B horizons) as well as sharp, irregular boundaries between horizons were a consequence of previous levelling treatments, which were carried out during the construction of the concrete apron. Originally, dune forms occurred in this area, which is typical of natural terrace areas of the Toruń Basin. In both presented profiles, the primary area was located much deeper, ca 95 cm (Ab horizon). Based on the arrangement of horizons in the buried soils, it seems likely that Brunic Arenosols occurred here before levelling. This is also confirmed by the abundant occurrence of such soils in the forests surrounding the airfield (Bednarek, Jankowski 2006).
Particle size distribution in the studied soils was very similar to that of the natural soils occurring in the terraces of the Toruń Basin. It was mostly sandy material of fluvial origin, deposited during the formation of Pleistocene terraces and remodelled by the aeolian process in later periods. The content of the silt and clay fraction was negligible. There were not significant di�erences in the particle size distribution between the reference soil and the soil under the concrete. In both profiles, the soil skeleton occurred mostly in the buried soil – below the depth of 95 cm. It consists of coarser mineral material – gravel. The lack of skeleton in overlying horizons and their highly monofractional charac-ter may prove that the deposited material came from dune forms previously occurring in the airfield. Similar relations were proved by studies of other covered soils in Toruń and Cluj-Napoca (Charzyński et al. 2011).
The highest moisture content was recorded in the Ap horizon in profile 1, which is related to retention properties of the humus. The moisture content irregularly decreased below this horizon, which reflected mixing of the soil material with a varying humus con-tent. In the covered soil (profile 2), a layer situated directly beneath the concrete was over-desiccated, which is typical of Ekranic Technosols (Stroganova et al. 1998). On the other hand, the moisture content of lower horizons was similar to values recorded in pro-file 1 (the reference). This was a consequence of impeded rainwater infiltration by imperme-able road surfaces. Craul (1992) proved that a high percentage of sealed lands alters the balance between infiltration and evaporation. Already after two or three days after covering the ground, the soil moisture drops to permanent wilting moisture.
The humus horizon in the studied Ekranic Technosols was destroyed and replaced by concrete slabs of the runway. Because soil sealing reduces the growth of plants, this horizon is not able to develop again. The lack or initial stages of humus horizons in Ekranosols was also reported by Greinert (2003).
Reaction and carbonatesSoils occurring within the airfield were poor in CaCO3 (0.1–0.2%) and less abundant in this component compared to other technogenic soils in Toruń (Charzyński et al. 2011). This is probably related to the airfield location in the area with no previous building development (no artefacts found in the profiles, e.g. fragments of brick or mortar).
EKRANOSOLS OF TORUŃ AIRFIELD

TECHNOGENIC SOILS OF POLAND 182
The analysed soils were characterised by increased pH values compared to natural soils in the Toruń Basin (Bednarek, Jankowski 2006). Values of pH in the material above the buried Brunic Arenosol (Profile 2) ranged from 8.8 to 5.3 (in H2O) and from 8.0 to 5.1 (in KCl); whereas reaction of the buried soil was acid.
According to Greinert (2003), strongly alkaline reaction of layers directly beneath the technic hard rock (pH 8.8–9.6) and a small content of calcium cations may be related to low bu�er capacity of road construction materials (washed sand). This phenomenon can be accounted for high values of pH in the reference soil from the airfield (profile 1 – 7.5), which was located in the vicinity of concrete slabs cleared of snow with the use of i.a. salt.
Organic matter properties and total phosphorus contentThe content of organic carbon (OC) highly varied in the analysed soils – from 0.09 to 2.39%. The highest values occurred in the humus horizon of profile 1 (0.86%) and in the humus horizon Ap2 of profile 2 (2.39%). The total content of nitrogen (Nt) has a similar pattern – from 0.006% in the horizon directly beneath the concrete in profile 2 to 0.138% in the humus horizon Ap2 of the same profile. The studied technogenic soils had a wide ratio of organic carbon to total nitrogen (18–25). The C:N ratio in the upper layers of Ekranic Technosols is wider in the covered soil (23) compared to reference soil (16). This could indicate a generally lower biological activity in the covered soils.
The total phosphorus content (Pt) in the studied soils of the airfield ranged from 65 to 163 mg·kg-1. Small amounts of Pt corresponded to geochemical background values of sandy soils occurring on terrace IV of the Vistula River (Geochemical Atlas of Poland 1995). This indicated the absence of anthropogenic/technogenic enrichment with this element in the area. As in the case of calcium carbonate content, the total phosphorus content in the studied soils was much lower compared to Ekranosols in the centre of Toruń, where it ranged from 46 to even 2 599 mg·kg-1 (Charzyński et al. 2011).
Heavy metal content and magnetic susceptibilitySamples from horizons Ap and A/Bp of unsealed soil and samples from horizons Ap1, B/C and Ap2 from soil under the runway (Table 3) were analysed in terms of heavy metal (HM) content and magnetic susceptibility (ĸ).
The content of heavy metals was several times lower in the covered soil from the airfield compared to reference soil next to the runway. This could be attributed to the protective e�ect of impermeable road surfaces, reducing the impact of industrial and tra¨c emission.
P. CHARZYŃSKI, R. BEDNAREK, Ł. MENDYK, M. ŚWITONIAK, A. POKOJSKA-BURDZIEJ, A. NOWAK

183 TECHNOGENIC SOILS OF POLAND
Table 3. Content of heavy metals soluble in 2M HNO3 (HM), magnetic susceptibility (ĸ) in the examined profiles and Pearson’s correlation coe¨cient (ĸ:HM)
Depth [cm]
ĸ [10-8 m3·kg-1]
Fe Mn Zn Pb Cd Cu Cr Ni Co
HM [mg·kg-1]
Profile 1
0–18 5.6 862 63.2 5.3 4.7 <0.01 1.4 0.4 0.6 0.4
55–74 3.3 725 56.8 0.9 2.5 <0.01 0.3 <0.1 0.8 <0.1
Profile 2
15–20 2.7 714 36.2 1.0 2.5 <0.01 0.1 0.3 0.6 0.3
20–60 2.1 720 15.3 0.9 1.2 <0.01 0.2 <0.1 0.9 <0.1
60–63 5.1 1248 13.0 2.1 4.7 <0.01 3.7 0.6 1.7 <0.1
MEAN 853 36.9 2.04 3.12 <0.01 1.14 0.43 0.92 0.35
SD 228 23.1 1.89 1.54 <0.01 1.52 0.15 0.49 0.07
ĸ:HM 0.98 0.88 0.94 1.00 0.98 0.87 0.96 0.20 0.98
According to Kocher and Wessolek (2003), soils in the direct vicinity of the road surface are characterised by strong sorption of certain metals (Cd, Cu, Ni, Zn). Their content decreases with a distance from a roadway. Also Nehls et al. (2008) observed that the material filling the gaps between pavement slabs is characterised by a high content of heavy metals, particularly lead. Contrary to loamy material, sandy soil material does not absorb lead, which may explain a small content of this element in sandy soils near the roads (Bouvet et al. 2003). According to Imperato et al. (2003), exhaust gases are the source of Pb, Zn and Cu content in soils, whereas Tijhuis et al. (2000) reported from Norway that car tyres carry large amounts of road dust in winter, which contains an elevated amount of Cd, Cr, Cu, Pb and Zn. The main cause of the increased Pb content was leaded petrol, currently not in use. Abrasion of tyres is partly responsible for the content of Zn and Cd in the soil, because di�erent parts of the braking system, e.g. braking blocks, contain Cu and Zn. Other sources of heavy metals include i.a. industrial emissions and garbage.
As evidenced by the presented research, the content of heavy metals in the soil of the Toruń airfield was low compared to the background represented by reference unsealed soils adjacent to profiles of Ekranosols. This was associated with a small tra¨c of vehicles limited to aircraft taxiing and rare passages of cars. Therefore, the above-mentioned sources of pollution had no significant e�ect on the soil properties.
EKRANOSOLS OF TORUŃ AIRFIELD
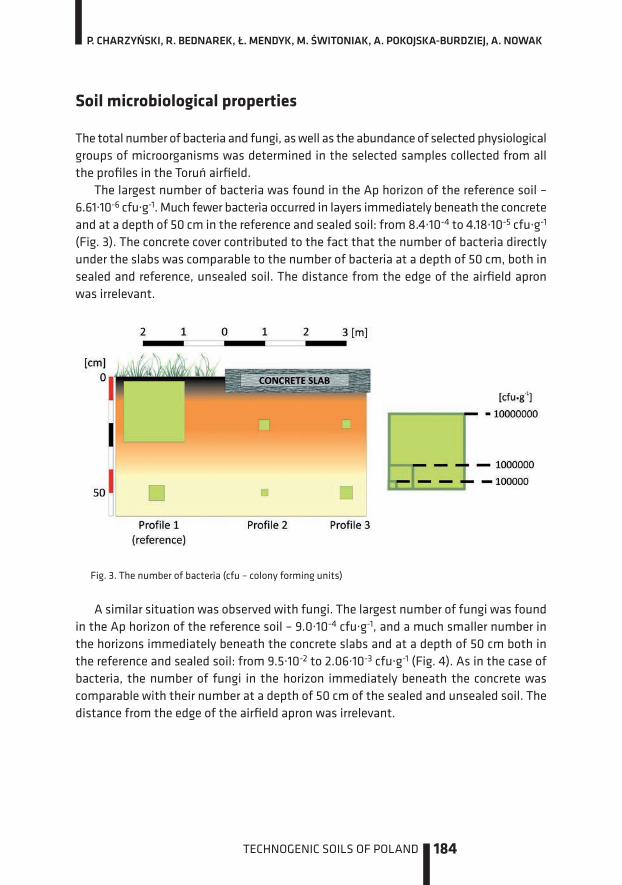
TECHNOGENIC SOILS OF POLAND 184
Soil microbiological properties
The total number of bacteria and fungi, as well as the abundance of selected physiological groups of microorganisms was determined in the selected samples collected from all the profiles in the Toruń airfield.
The largest number of bacteria was found in the Ap horizon of the reference soil – 6.61·10-6 cfu·g-1. Much fewer bacteria occurred in layers immediately beneath the concrete and at a depth of 50 cm in the reference and sealed soil: from 8.4·10-4 to 4.18·10-5 cfu·g-1 (Fig. 3). The concrete cover contributed to the fact that the number of bacteria directly under the slabs was comparable to the number of bacteria at a depth of 50 cm, both in sealed and reference, unsealed soil. The distance from the edge of the airfield apron was irrelevant.
Fig. 3. The number of bacteria (cfu – colony forming units)
A similar situation was observed with fungi. The largest number of fungi was found in the Ap horizon of the reference soil – 9.0·10-4 cfu·g-1, and a much smaller number in the horizons immediately beneath the concrete slabs and at a depth of 50 cm both in the reference and sealed soil: from 9.5·10-2 to 2.06·10-3 cfu·g-1 (Fig. 4). As in the case of bacteria, the number of fungi in the horizon immediately beneath the concrete was comparable with their number at a depth of 50 cm of the sealed and unsealed soil. The distance from the edge of the airfield apron was irrelevant.
P. CHARZYŃSKI, R. BEDNAREK, Ł. MENDYK, M. ŚWITONIAK, A. POKOJSKA-BURDZIEJ, A. NOWAK

185 TECHNOGENIC SOILS OF POLAND
Fig. 4. The number of fungi (cfu – colony forming units)
The comparison between the reference and sealed soil revealed only an increase in the number of amonifiers in Ekranic Technosol situated within a distance of 1 m from the edge of the airfield apron (profile 2). Their number was similar in profile 3, situated 3 m from the edge of the apron, and in the reference soil. The number of denitrifiers was reduced in the profiles under the concrete. The number of bacteria reducing methylene blue was similar in profile 1 (the reference) and profile 2 (under the concrete). Whereas in profile 3 under the concrete at a depth of 20 cm, their number was two times lower compared to the reference soil at a depth of 10 cm. In the horizon situated at a depth of 50 cm of the sealed soil in profile 3, the number of these bacteria was two times higher compared to profile 1. The number of glucose acidifying bacteria significantly decreased in horizons at a depth of 20 cm in profiles 2 and 3 compared to horizon Ap of the reference soil. As in the case of methylene-blue reducing bacteria, this increase may be explained by a higher content of organic matter in the buried humus horizon (Table 4).
The studied Ekranosols contain a reduced number of microorganisms in the topsoil, which contributed to anaerobic conditions and a low content of organic matter. ‘New microbiological conditions prevailing under the covered surface determine the develop-ment of anaerobic microorganisms and the reduction processes. Furthermore, lower and more stable temperatures in Ekranosols are conducive to the development of spe-cific psychrotrophic microorganisms’ (Bednarek, Jankowski 2006).
Also Wessolek (2008) emphasizes that soil sealing destroys the habitat of soil fau-na and flora by disturbing the circulation of matter and energy in the soil.
EKRANOSOLS OF TORUŃ AIRFIELD

TECHNOGENIC SOILS OF POLAND 186
Table 4. The number of microorganisms with specific physiological properties per 1 g dry weight
Depth [cm] amonifiers denitrifiers methylene
blue reducersglucose
acidifiers
Profile 1 (reference)
10 15 900 47 800 122 200 122 200
50 4 600 20 600 46 400 4 600
Profile 2 (1 m of the concrete slab edge)
20 258 000 150 154 800 3 100
50 770 46 000 25 500 4 600
Profile 3 (3 m of the concrete slab edge)
20 20 400 1 500 45 900 11 700
50 4 700 2 600 113 800 25 900
The British researchers were comparing di�erent urban soils: from under the trees surrounded by pavement slabs, near busy streets, as well as in allotment gardens and urban parks, and they proved that the former had the lowest microbial activity (Bullock, Gregory 1991).
According to Machulla et al. (2003), the surface soil layers (0–5 cm), which are rich in organic matter and relatively well aerated, are characterised by the highest biomass and microbial activity. As evidenced by Quantin et al. (2003), who studied soils in New Caledonia, the availability of organic matter is the main parameter controlling the ac-tivity of bacteria in the soil. The biological activity is reduced in sealed soils with no or fragmentary humus horizons. Lower and more stable temperature under the asphalt favours the development of specific microorganisms while reducing the growth of mi-croorganisms decomposing the organic debris (Stroganova et al. 1998).
Summary
One of the distinguishing features of urban soils is no exchange of components between the environmental elements as a result of compact cover (Burghardt 1996). Road and other covered surfaces modify the ecosystem structure and indirectly a�ect the uncovered urban soils, which are open for exchange processes (Stroganova, Prokofieva 2001).
Although Ekranosols are not capable of fulfilling several biocenological functions, there is still a poor exchange of gases between the atmosphere and the microorganisms. Roots of plants may penetrate through artificial surface, which leads to its destruction, while grass and shrubs may grow in crevices (Stroganova et al. 1998). It is assumed that
P. CHARZYŃSKI, R. BEDNAREK, Ł. MENDYK, M. ŚWITONIAK, A. POKOJSKA-BURDZIEJ, A. NOWAK

187 TECHNOGENIC SOILS OF POLAND
areas of Ekranic Technosols, abandoned as a result of physical and biological weathering (plants taking root in crevices and cracking), are again exposed after a certain time. Ac-cording to Stroganova et al. (1998), soil fauna may transform the soil structure even under the cover. Whereas Burghardt et al. (2003) and Nelhs et. al. (2006) believe that substances in the soil under pavement slabs accumulate in gaps between the slabs. A similar phenomenon is observed in the Toruń airfield where grass covered gaps be-tween slabs and cracking. The above-mentioned processes are inhibited and their ef-fects are mitigated by regular removal of vegetation growing on the airfield apron and sealing up of new crevices. It can be assumed that carbon enriching the material within crevices of the Toruń airfield slabs is of natural origin, and admixtures from combustion gases (Nehls et al. 2006) are negligible.
According to Stroganova et al. (1998), the artificial surface directly and indirectly af-fects the components of urban ecosystems, and therefore, road surfacing technology should be improved. They should be more water and air permeable. On the other hand, soil sealing should be reduced. Compared to unsealed soils, Ekranosols exert much lesser impact on the functioning of ecosystems in urban areas. They are not involved in a number of soil-forming processes. The sealed soils, however, can be treated the same way as the nearby, unsealed soils since they are also a component of urban soil cover. They should be reclaimed for green areas (Stroganova et al. 2003). Other authors, i.a. Prokofieva and Gubankov (2000), observed that Ekranosols may be useful after removal of a sealing cover. According to Burghardt et al. (2003), they should be regarded as soils, not grounds, even though they do not serve a productive function and they are not in-volved in the processes of soil-environment exchange. Due to the lack of fresh organic matter supply, the circulation of chemical elements is very limited in Ekranic Techno-sols (Tobiasova 2004).
The sealed soils are an essential component of a city. They should be researched and charted, because their characteristics a�ect the ecological situation in a city (Stroganova, Prokofieva 2000). Ekranosols are also important because they store information about the history of the urban ecosystem. Their boundaries are sharp and easy to identify. Profiles of Ekranosols have both natural and technogenic horizons. One could say that they are in hibernation and they are ready to be exposed and restored to their original functions.
Sealed soils di�er to a large extent from not covered soils in terms of morphology and several physical, chemical and microbiological properties. Ekranic Technosols of the Toruń airfield were characterised by a destroyed upper part of the soil profile as a result of land levelling. They had higher bulk density in the horizon immediately below the concrete or asphalt as a consequence of compaction during the construction and/or compaction caused by vibrations resulting from taxiing down the runway. Isolation of the soil from the rainwater caused desiccation of the upper layer of the sealed soil com-pared to surface horizons of the reference soil without a technic hard rock. They were
EKRANOSOLS OF TORUŃ AIRFIELD
TECHNOGENIC SOILS OF POLAND 188
also characterised by elevated pH values in the layer directly below the concrete, e.g. due to leaching of carbonates from the concrete slab or their penetration through cracking caused by salt used for snow removal. Other characteristics included a small content of heavy metals compared to adjacent unsealed soil, which resulted from a protective ef-fect of the artificial surface (pavement).
A wide range of the C:N ratio in the soil beneath the concrete may prove its low bio-logical activity. Microbiological analysis has repeatedly revealed a reduced number of microorganisms in the upper layer of the covered soil. The abundance of bacteria and fungi colonies under the concrete slabs was much smaller compared to the surface ho-rizon of unsealed soil. This was caused by anaerobic conditions and destruction of the humus horizon.
This study was financed by Polish Ministry of Science and Higher Education (grant No. N N306 463738).
References:
1. Bednarek R., Jankowski M. 2006. Soils. [In:] L. Andrzejewski, P. Weckwerth, S. Burak (Eds.). Toruń and its surroundings – Environmental Monograph. Wyd. UMK, Toruń: 153–176 (in Polish with English Summary).
2. Bouvet M., Francois D., Schwartz Ch. 2003. Road soil retention of heavy metals leached from Municipal Solid Waste Incinerator bottom ash used in road construction. SUITMA 2003 Ab-stracts. Nancy, France: 121–123.
3. Bullock P., Gregory P. 1991. Soils in the Urban Environment. Blackwell Scientific Publications, Oxford: 148.
4. Burghardt W. 1996. Urbaner Bodenschut. Springer Verlag, Berlin.
5. Burghardt W. 2001. Soils of Low Age as Specific Features of Urban Ecosystem. [In:] J. Sobocká (Ed.) Soil Anthropization VI. Bratislava, Slovakia: 11–18.
6. Burghardt W., Hagedorn A., Komossa M., Wenikajtys M. 2003. Characteristics and Types of Street Soils. SUITMA 2003 Abstracts. Nancy, France: 55–57.
7. Charzyński P., Bednarek R., Błaszkiewicz J. 2011. Morphology and properties of Ekranic Tech-nosols in Toruń and Cluj-Napoca. Rocz. Glebozn. 62(2): 1–6 (in Polish with English Summary).
8. Commission of the European Communities (CEC). 2006. Thematic Strategy for Soil Protection – COM (2006)/231. http://ec.europa.eu/environment/soil/pdf/com_2006_0231_en.pdf.
9. Craul P. G. 1992. Urban Soils in Landscape Design. Wiley, New York.
10. Desaules A., Hämmann M., Weisskopf M. 2001. Commentary on the Ordinance of 1st July 1998 relating to impacts on the soil (OIS). Swiss Agency for the Environment, Forest and Land-scape, Berne.
P. CHARZYŃSKI, R. BEDNAREK, Ł. MENDYK, M. ŚWITONIAK, A. POKOJSKA-BURDZIEJ, A. NOWAK

189 TECHNOGENIC SOILS OF POLAND
11. Gebhardt H. 1982. Phosphatkartierung und bodenkundliche Gelände untersuchungen zur Eingren-zung historischer Siedlungs – und Wirtschaftsflächen der Geestinsel Flögeln, Kreis Cuxhaven. Probleme der Küstenforschung im Südlichen Nordseegebiet, Band 14: 1–10.
12. Geochemical Atlas of Poland. 1995. J. Lis, A. Pasieczna (Eds.). 1: 2 500000, Państwowy Insty-tut Geologiczny, Warsaw.
13. Gerasimova M. I., Stroganova M. N., Możarova K. W., Prokofieva T. W. 2003. Anthropogenic soils (genesis, geography, recultivation). Moscow (in Russian).
14. Greinert A. 2003. Studies on soils of Zielona Góra urban area. Oficyna Wydawnicza Uniwer-sytetu Zielonogórskiego, Zielona Góra (in Polish).
15. Imperato M., Adamo P., Naimo D., Arienzo M., Stanzione D., Violante P. 2003. Spatial Distribu-tion of Heavy Metals in Urban Soils of Napoli. SUITMA 2003 Abstracts, Nancy. France: 101–103.
16. IUSS Working Group WRB. 2007. World References Base for Soil Resources 2006. Update 2007, World Soil Resources Reports, 103, FAO, Rome.
17. Kocher B., Wessolek G. 2003. Road Runo� Changes Sorption Characteristics of Sandy Road-side Soils. SUITMA 2003 Abstracts, Nancy. France: 97–99.
18. Machulla G., Franzke F., Besch-Frotscher W., Felinks B. 2003. How di�erent are the microbial properties of anthropogenic soils from those in undisturbed soils. SUITMA 2003 Abstracts. Nancy, France: 67–69.
19. Nehls T., Józefaciuk G., Sokołowska Z., Hajnos M., Wessolek G. 2006. Pore-system character-istics of pavement seam materials of urban sites. J. Plant Nutr. Soil Sci. 169: 16–24.
20. Nehls T., Józefaciuk G., Sokołowska Z., Hajnos M., Wessolek G. 2008. Filter properties of seam material from paved urban soils. Hydrol. Earth Syst. Sc. 12: 691–702.
21. Niewiarowski W., Weckwerth P. 2006. Genesis and relief development. [In:] L. Andrzejewski, P. Weckwerth, S. Burak (Eds.). Toruń and its surroundings – Environmental monograph. Wyd. UMK, Toruń: 65–98 (in Polish with English Summary).
22. Prokofieva T., Gubankov A. 2000. Sealed Soils in Urban Cover. [In]: W. Burghardt, Ch. Dornauf (Eds.) First International Conference on Soils of Urban, Industrial, Tra¢c and Mining areas, Proceedings, 1. Essen, Germany: 270.
23. Quantin C., Becquer T., Rouiller J., Berthelin J. 2003. Impact of Bacterial Activity on Metal Mobilisation and Redistribution in a New Caledonia Soils. SUITMA 2003 Abstracts. Nancy, France: 73–75.
24. Reshotkin O. 2003. Properties of Soils in Urban Areas (Exemplified by the Soils of Pushchino). SUITMA 2003 Abstracts. Nancy, France: 191–195.
25. Słowiński K. 1983. Toruń airfield 1920–1945. WKiŁ, Warsaw (in Polish).
26. Stroganova M., Myagkova A., Prokofieva T., Skvortsova I. 1998. Soils of Moscow and urban environment. Moscow.
27. Stroganova M., Prokofieva T. 2000. Urban Soils – concept, definitions, classification. [In]: W. Burghardt, Ch. Dornauf (Eds.) First International Conference on Soils of Urban, Industrial, Tra¢c and Mining Area, Proceedings, 1. Essen, Germany: 235–239.
EKRANOSOLS OF TORUŃ AIRFIELD

TECHNOGENIC SOILS OF POLAND 190
28. Stroganova M., Prokofieva T. 2001. Urban Soils – a Particular Specific Group of Anthrosols [In:] J. Sobocká (Ed.) Soil Anthropization VI. Bratislava, Slovakia: 23– 28.
29. Stroganova M., Prokofieva T. 2003. Soil Survey and Ecological Status Estimation of Urban Areas. SUITMA 2003 Abstracts. Nancy, France: 233–235.
30. Tijhuis L., Brattli B., Sether O. M. 2000. A Geochemical survey of topsoil in the city of Oslo. Norway, Environ. Geochem. Health 24: 67–94.
31. Tobiasova M. 2004. Specific Problems of Urban Soils Research in the area of Prešov. [In:] J. Sobocká (Ed.) Soil Anthropization VIII. Bratislava, Slovakia: 123.
32. van Reeuwijk. L.P. 2006. Procedures for soil analysis. 7th Edition. Technical Report 9, ISRIC – World Soil Information, Wageningen, Netherlands.
33. Wessolek G. 2008. Sealing of Soils. [In:] J. M. Marzlu�, E. Shulenberger, W. Endlicher, M. Alberti, G. Bradley, C. Ryan, U. Simon, C. Zumbrunnen (Eds.). Urban Ecology. An International Perspec-tive on the Interaction Between Humans and Nature. Springer, Berlin: 161–179.
P. CHARZYŃSKI, R. BEDNAREK, Ł. MENDYK, M. ŚWITONIAK, A. POKOJSKA-BURDZIEJ, A. NOWAK

191 TECHNOGENIC SOILS OF POLAND
SOILS OF TRAFFIC AREAS IN SZCZECIN
MARCIN KUBUS RYSZARD MALINOWSKI EDWARD MELLER KATARZYNA MALINOWSKA MARCEL RAČEK
11Introduction
The deteriorating conditions of trees growing in green areas, especially along the main roads have been observed for many years in several cities of Poland, including Szczecin (Kubus 2006). Deformation and degradation of soil habitats in urbanized areas are the main factors that threaten and limit the cultivation of trees. The worst soil-water conditions for trees are found along the streets. As reported by some authors (Szczepanow-ska 2001; Łukaszkiewicz 2008), the following soil factors threaten the growth and de-velopment of trees by reducing their vitality and life span (listed according to their harmfulness):
— excessive soil compaction (hardened, impermeable surfaces),— too small soil porosity for roots,— soil salinity (derived from motor tra¨c),— water stress (drought, heat islands, reduction of the subsoil water level).This chapter characterises the technogenic soils of tra¨c areas in Szczecin. Special
attention was given to the introduction of technogenic structural soils in these areas as a new way of reclamation.
General characteristics of technogenic soils in Szczecin
A few zones with di�erent intensity of technopressure are found in urban agglomera-tions. The oldest, usually central parts of the cities are mechanically and chemically transformed to the largest extent. Younger, modern districts, new housing estates, greeneries and allotment gardens are transformed in a lesser degree. However, strongly transformed areas can be found within each zone, e.g. within gas stations, main roads, scrap metal dumps and industrial plants.

TECHNOGENIC SOILS OF POLAND 192
Industrial-urban environments are characterised by significant air pollution with dust and gases (Niedźwiecki et al. 2000a, b; 2004; Piasecki et al. 1995; Wojcieszczuk, Niedźwiecki 2003). Dust fall and gases are deposited on trees and soil surface, enriching them with chemical elements, including heavy metals.
Fig. 1. Study sites of technogenic soils in Szczecin (based on the literature data)
Niedźwiecki et al. (2000a, b) examined the content of some heavy metals in soil and dust fallout in di�erent urban zones of Szczecin. They found that heavy dust contamination with cadmium occurred mainly within the limits of gas stations, on average: Cd – 3.97, Pb – 272, Zn – 1135, Cu − 161, Ni – 30.3 mg·kg-1; in repair shops of the grain elevator (Elewa-tor EWA Sp. z o.o.) (site 1 – Fig. 1): Cd – 31.0, Pb – 763, Zn – 3709, Cu – 864, Ni – 352 mg·kg-1 and on machines working on the communal waste dump in Sierakowo (site 2 – Fig. 1): Cd – 7.15, Pb – 1029, Zn – 3389, Cu – 214, Ni – 38.4 mg·kg-1. Along the main roads, however,
M. KUBUS, R. MALINOWSKI, E. MELLER, K. MALINOWSKA, M. RAČEK

193 TECHNOGENIC SOILS OF POLAND
cadmium concentration in the street dust was on average: Cd – 2.25, Pb – 366, Zn – 598, Cu –194, Ni – 33.0 mg·kg-1 and in the children’s playgrounds: Cd – 0.98, Pb – 214, Zn – 486, Cu – 50.2, Ni – 18.5 mg·kg-1. On the other hand, the authors recorded high concentration of cadmium in the indoor dust: Cd – 5.74, Pb – 285, Zn – 2124, Cu – 267, Ni – 37.9 mg·kg-1.
The origin of Szczecin dates back to Roman times and its great development took place in the 10th century. The results obtained by Chudecka (2009) showed that the depth of technogenic sediments in the oldest part of the city reaches 6.2 m and they are textur-ally diverse. There are also rubble embankments with a thickness ranging from 1 to 6 m, which significantly a�ected the soil development. The common occurrence of rubble lay-ers is connected with the defensive character of Szczecin. Restriction of the housing area by defensive walls was connected with the density of buildings and construction of new buildings in place of old ones, destroyed by fire and warfare. According to the aforemen-tioned author, rubble layers are usually continuous, especially in low-lying areas which were buried and levelled in the past, e.g.: pre-walls with a moat system or the oldest harbour area on the Odra River. However, a significantly lower depth of 2.3 m below the ground surface was found in the area allocated for buildings in the mid-eighteenth century.
Chudecka (2009) is also of the opinion that enrichment with organic matter, phos-phorus, nitrogen, calcium and sodium, and heavy metals: lead (max 716 mg·kg-1), zinc (max 826 mg·kg-1), copper (max 225 mg·kg-1) and cadmium (max 2.9 mg·kg-1) is a char-acteristic feature of technogenic soils of the oldest part of Szczecin. The other heavy metals, such as manganese, nickel, chromium and mercury, were recorded in larger amounts in the topsoil, while in the subsoil, they did not exceed the geochemical back-ground values. However, greater accumulation of heavy metals throughout the entire thickness of these soils was observed in the oldest part of the city (pre-wall, harbour and fishing settlement) compared to the city area built in the 18th century (Fort Wilhelm and Leopold). The presence of technogenic layers contaminated with Zn to a depth of 4 m, with Pb, Cu − 6 m and with Cd − 1.3 m below the present soil surface can indicate that they have been accumulated from the beginning of the urban settlement.
Many researchers of technogenic soils in Szczecin drew attention to zonation and tra¨c overload in the city (sites 3, 4 and 5 – Fig. 1). Niedźwiecki et al. (2009) studied soils in the north-western part of Szczecin, both in the areas with heavy tra¨c (Bo-haterów Warszawy avenue – site 6; Mieszka I street – site 7, Sprzymierzonych square – site 8, Odrodzenia square – site 9 and Giedroycia roundabout – site 10) and at a distance of over 100 m from the roadway (Chopina street – site 11, Braniborska street – site 12, Słowackiego street – site 13) – Fig. 1. It was found that these soils were highly trans-formed by admixture of technogenic substrates and some organic materials. They were characterised by alkaline reaction, low content of CaCO3, varying content of available potassium and magnesium, and usually high to very high content of available phosphorus.
In accordance with the instruction prepared by the Institute of Soil Science and Plant Cultivation (Kabata-Pendias et al. 1993), most of the studied soils met the criteria
SOILS OF TRAFFIC AREAS IN SZCZECIN

TECHNOGENIC SOILS OF POLAND 194
of the 1st and the 2nd degree of heavy metal pollution (1st − increased heavy metal con-tent; 2nd − slightly polluted). Moreover, moderate or high pollution (the 3rd and 4th de-gree) was recorded in the surface soil layers at Giedroycia roundabout (Zn, Cu), at Mieszka I street (Zn, Pb), Bohaterów Warszawy avenue (Zn, Cu, Pb) and at a depth of 100–150 cm at Słowackiego street (Zn). Accumulation of these metals at the above-mentioned study sites followed the spot pattern and the maximum values reached 1 804 mg·kg-1 for Zn, 248 mg·kg-1 for Pb and 527 mg·kg-1 for Cu.
According to Malinowska (2012), the tra¨c volume significantly a�ects the degree of soil contamination. The research was conducted in zones with varying volume of tra¨c, including residential areas (Struga street − site 14, Wyzwolenia street – site 15, Derdowskiego street – site 16, Krzywoustego street – site 17 and Mieszka I street – site 18, Andrzejewskiego street – site 19, Jasna street – site 20, Legnicka street – site 21, Kaliny street – site 22, Ofiar Oświęcimia street − site 23, Orzeszkowej street – site 24 and Kasprowicza Park – site 25) – Fig. 1. Technogenic initial soils developed from loamy sands or sandy loam with a humus layer of artificial origin. The soils were characterised by a slightly wider C:N ratio (on average 16) compared to housing estate soils (on aver-age 14). The reaction was slightly acid in the topsoil and alkaline in the parent material. The humus horizons of soils in the tra¨c areas contained on average 52.6 mg·kg-1 of P, 65.5 mg·kg-1 of K, 42.8 mg·kg-1 of Mg. The parent material was poorer in these ele-ments: 31.3, 39.7 and 29.3 mg·kg-1, respectively. The heavy metal contamination in sur-face soil layers varied (Cu – 20.6; Zn – 102; Pb – 73.0; Cd – 0.26; Ni – 19.8; Co – 2.97 mg·kg-1 in tra¨c areas and Cu – 12.0; Zn – 64.7; Pb – 21.3; Cd – 0.10; Ni – 19.0; Co – 3.72 mg·kg-1 in areas of housing estates of limited motor tra¨c). The content of the above heavy metals in the parent material was usually significantly lower than in the topsoil and typical of uncontaminated soils.
The similar studies were also conducted by Wojcieszczuk et al. (2006) along Solsk-iego street (site 26), Krzywoustego street (site 26) and Piastów avenue (site 27) – Fig. 1. The highest values were recorded in the topsoil of Krzywoustego street (heavy tra¨c): Zn – 212; Pb – 18.5; Ni – 2.62; Cu – 15.0; Co – 1.16 and Cd – 1.12 mg·kg-1.
Niedźwiecki et al. (2000b) studied properties of soils occurring in Szczecin parks (sites 25–30). They found that soils in parks developed mainly from loamy sands and loams. Their reaction ranged from neutral to alkaline depending on the admixture of limestone rubble. Technogenic soils in the Kasprowicz Park, Kownas Park and Żeromski Park were not contaminated with heavy metals whose concentration decreased with depth. The elevated content of Cd, Pb and Zn was recorded (2.51, 111 and 263 mg·kg-1, respectively) only in the surface soil layers near the road in the Kasprowicz Park.
M. KUBUS, R. MALINOWSKI, E. MELLER, K. MALINOWSKA, M. RAČEK

195 TECHNOGENIC SOILS OF POLAND
Structural soils as a medium for trees in tra�c areas
The roots of trees require soils of granular structure (macropores) for proper growth and optimal performance of their nutritional functions (Fig. 2). Such soils are characterised by low mechanical resistance, high content of oxygen and low content of carbon dioxide and, of course, abundant water. Soil with proper granular structure should contain about 50% of porous space. However, porous space should be characterised by a proper content of macro- and mesopores that a�ect water and air circulation (Arnold 1989). In compacted urban soils, the content of solid elements is much higher and a�ects a de-crease in the volume of free spaces in soil.
Unfavourable factors, especially excessive soil compaction and the lack of space for the root growth a�ect the deformation of the tree’s root system. Sometimes roots grow in the direction of oxygen (aerotropism) and if their growth is strong, they damage the infrastructure, i.e. pavements, foundations, elements of small architecture and transmission networks.
Apart from soil factors, also other factors of urban environment synergistically af-fect trees along the streets (i.e. unfavourable microclimate and air pollution). These factors intensify the unfavourable influence.
Fig. 2. Graphical representation of the compaction e�ect on soil (Coder 2000, modified)
The research on the improvement of conditions of the tree root system growth was conducted in many countries, in places where open green zones are functionally impossible and most of the area is covered by pavements, e.g. along narrow roads, in parking lots, on the squares and promenades. Many technologies have been used, e.g. anti-compression
SOILS OF TRAFFIC AREAS IN SZCZECIN
TECHNOGENIC SOILS OF POLAND 196
media, paths for roots, soil cells improving the air-water soil properties and preventing the excessive soil compaction around trees. The research conducted in the USA, Den-mark and Finland confirmed that mixtures of stones, soil and hydrogel are suitable for the root system growth and also they prevent surface settling.
In countries of Western Europe and in the United States of America, the improved mixtures of soil and stones (so-called structural soils) have been used in urban planting for over 40 years. They improve growth conditions of trees cultivated next to pave-ments (Szczepanowska 2001, Bassuk et al. 2003, Garczarczyk 2008).
Structural soils (media) are the most technologically advanced solution used to im-prove the soil conditions of trees growing in the cities (Bassuk et al. 1998). Determina-tion of appropriate proportions of mixtures is the most important task during their preparation, because the excess of soil a�ects settling of the medium, while excess of stones results in improper water capacity of a mixture.
First anti-compression soils were used in the 1970s in Amsterdam (Amsterdam Tree Soil – ATS). It was a mixture of coarse sand, organic substrate and stones. Composition of a mixture called CU-Structural Soil elaborated by scientists from Cornell University in Ithaca, USA, contains 3 components mixed in the following proportion by weight: crushed stone (granite, limestone with granulation of 13–25 mm) – 100, clay loam – 20, hydrogel – 0.03. The content of organic matter should range from 2 to 5%. Hydrogel added in a small amount acts as an adhesive, which binds the stones and soil during mixing and applying (Bassuk et al. 2003). The key aggregate is a frame of highly porous substrate; pores and voids are filled with partly uncompacted soil. Such substrate is resistant to the pressure of pedestrians and vehicles (Kosmala 2008). The substrate CU-Structural Soil was used for the first time in 1994 and proved useful, which was evi-denced by the growth and development of cultivated plants (Grabosky et al. 2005).
Bassuk et al. (1998) were of the opinion that the optimal structural soil consists of a mixture of 12.5–25.0 mm crushed stone with sharp edges, clay loam of the following gravimetric composition: 20–40% clay, 10–40% loam and 20–50% sand and hydrogel in the amount of 30 g for every 100 kg of stone and 20 kg of soil. According to Grabosky, Bassuk (1995) and Grabosky et al. (2005), the best results were obtained when crushed stones of diameter ranging from 15 to 35 mm were mixed with loam or loamy sand. The weight ratio of stones to soil ranged from 4:1 to 6:1.
Using technogenic structural soils in Szczecin
Kubus et al. (2009) and Malinowski et al. (2010) tested chemical and physical properties of two stony-soil mixtures from the company Tegra with commercial names: Hydralit ZN and Hydralit ZU. The mixture Hydralit ZN is recommended for the use on non-hardened surfaces next to a tree trunk, and the mixture Hydrolit ZU is recommended as a base of hardened surfaces.
M. KUBUS, R. MALINOWSKI, E. MELLER, K. MALINOWSKA, M. RAČEK

197 TECHNOGENIC SOILS OF POLAND
Fig. 3. Hydralit ZN mixture Fig. 4. Hydralit ZN – gravel fraction
Fig. 5. Hydralit ZU mixture Fig. 6. Hydralit ZU – gravel fraction
Hydralit ZN is a mixture of material containing 72% of the gravel fraction and 28% of the soil material with loamy sand texture (Malinowski et al. 2012) – Fig. 3 and 4. Coarse fragments of the mixture consists mainly of crushed bricks and stones, quartz and glazed remaining slag (according to the producer − lava) whose main function is stabilization (limitation of excessive concentration and regulation of water-air proportions).
Hydralit ZU consists in 81% of the slag fraction and the soil material of loamy sand texture (Fig. 5 and 6). The root activator Radolix is also added to these mixtures. Both mixtures are characterised by a small amount of organic matter (from 2.02% − Hydralit ZU to 4.53% − Hydralit ZN), alkaline reaction, the abundance of magnesium and potas-sium readily available to plants and average or small amount of phosphorus (Kubus et al. 2009). Specified concentrations of heavy metals, both water-soluble and total forms, are natural and safe for cultivated plants (Regulation of the Minister of the En-vironment 2002; Kabata-Pendias et al. 1993; Kabata-Pendias, Pendias 1999; PIOŚ, IUNG 1990). This proves that, in terms of chemical composition, both mixtures can be used without limitation in cultivation of trees and shrubs in urban areas. Figures 7–10 show some places in Szczecin where structural soils have been successfully used for tree planting.
SOILS OF TRAFFIC AREAS IN SZCZECIN

TECHNOGENIC SOILS OF POLAND 198
Advantages of using technogenic structural soils
Advantages of stony-soil mixtures are as follows:— improvement of habitat conditions of trees,— regular growth of roots a�ecting the maintenance of tree statics,— possibility of the root growth in a direction that avoids collision with underground
infrastructure,— possibility of introducing trees in sidewalks or narrow street zones.
Fig. 8. Filling with Hydralit structural soil (Szczecin city, source: www.tegra-polska.pl)
Fig. 10. Pots with trees filled with structural soil (Wojska Polskiego street)
Fig. 7. Site preparation for the lawn (Szczecin city, source: www.tegra-polska.pl)
Fig. 9. Pots with trees filled with structural soil (Szczecin, Księcia Bogusława street)
M. KUBUS, R. MALINOWSKI, E. MELLER, K. MALINOWSKA, M. RAČEK

199 TECHNOGENIC SOILS OF POLAND
In addition, it was proved that the mixtures are as resistant to pressure as a tradi-tional stony base and the growth of roots in such mixtures is four times stronger (Gra-bosky et al. 2005). A significant part of stony fraction does not a�ect freezing of the root system (Grabosky et al. 1999; Grabosky et al. 2005).
The mixtures are recommended as a base of pavements, bicycle paths and wooded car parks. The layer should be at least 60 cm thick, optimally 90 cm thick (Grabosky et al. 1999; Grabosky et al. 2005).
According to Bassuk, Lindsey (1991) and Bassuk, Trowbridge (2004), about 0.3 m3 of the prepared soil should be used per 1 m2 of the crown projection area of a mature tree. The authors are of the opinion that small trees with a maximum height of 9 m need less soil and large trees with a height of over 15 m need more soil.
Special mixtures with di�erent physical properties were developed (by Tegra company) for di�erent places of their use – on non-hardened surfaces next to a tree trunk (Hydralit ZN) or as a base of hardened surfaces (Hydralit ZU), e.g. of cobblestones or flagstone pavements (Hydralit 2009, brochure).
Species of trees recommended for planting in stony-soil mixtures are as follows (Kosmala 2008): field maple (Acer campestre), Norway maple (A. platanoides), syca-more maple (A. pseudoplatanus), European hornbeam (Carpinus betulus), common hackberry (Celtis occidentalis), Turkish hazel (Corylus colurna), European ash (Fraxinus excelsior), green ash (Fraxinus pensylvanica), maidenhair tree (Ginkgo biloba), thornless honeylocust (Gleditsia triacanthos var. inermis), London plane ‘Acerifolia’ (Platanus his-panica ‘Acerifolia’), Callery pear (Pyrus calleryana), English oak (Quercus robur), black locust (Robinia pseudoacacia), Swedish whitebeam (Sorbus intermedia), little-leaf linden (Tilia cordata), Caucasian lime (Tilia ‘Euchlora’).
Stony-soil mixture was used for the first time in Poland in 2007 in Poznań in Podgórna street. Trees of Callery pear ‘Chanticleer’ were planted in the mixture of granite grit, hydrogel of greater resistance to salts and loamy sand. Fertile soil was used only in the surroundings of the root system of planted trees (Garczarczyk 2008). It was found that pears planted in the described mixture grow as well as those growing in the open space.
Borowski et al. (2005) are of the opinion that in the extreme conditions, the total me-dium replacement should be used. The medium is replaced with technogenic structural soils used in di�erent variants depending on the road construction (Fig. 11–13). In the cases when the total medium replacement is not necessary, it is possible to improve the soil structure by adding soil-loosening media and hydrogels. Soil-loosening media are modified natural, granulated and calcined products. Those are mixtures of natural sedimentary rocks and silica gel. Their practical activity consists in reducing the salinity (ionic exchanger), protection of plants from excessive fertilization (water solution bu�er), drainage and regulation of air-water proportions in the soil.
SOILS OF TRAFFIC AREAS IN SZCZECIN

TECHNOGENIC SOILS OF POLAND 200
Fig. 11. Technogenic structural soil used for construction of pavements with impermeable (A) and permeable (B) surface, e. g. brick pavers – after Borowski et al. (2005, modified). Explanations: 1 – structural soil to 60 cm; 2 – drainage; 3 – mulch; 4 – curb and road surface; 5A – impermeable pavement surface and appropriate size of a tree well − min. diameter 150 cm; 5B – permeable pavement surface, small elements separated by permeable joints on the permeable base, a smaller tree well, diameter − 100 cm
Fig. 12. Application of technogenic structural soil for construction of tree wells and pavements – a tree well with a high edge from the road side [A], a tree well with a high edge connected with site furnishings [B] after Borowski et al. (2005, modified). Explanations: 1 – structural soil; 2 – soil; 3 – drainage; 4 – mulch; 5 – curb and road surface ; 6 – edge of a tree well ca 40 cm below the ground; 7A – edge of a tree well with a perforated wall from the road side allowing for water run-o� towards a tree; 7B – edge of a tree well − ca 40 cm above the ground connected with site furnishings e. g. bench; 8 – edge of a tree well allowing for water run-o� from a pavement
M. KUBUS, R. MALINOWSKI, E. MELLER, K. MALINOWSKA, M. RAČEK

201 TECHNOGENIC SOILS OF POLAND
Fig. 13. Application of technogenic structural soil under pavement parts – vertical section [A] aerial view [B] after Borowski et al. (2005, modified). Explanations: 1 – structural soil; 2 – soil ; 3 – drainage; 4a – part of permeable pavement on structural soil; 4b – part of impermeable pavement; 5 – mulch or plant cover; 6 – grass; 7 – pavement curb; 8 – curb and road surface
Activities connected with the use of technogenic structural soils
Other solutions possible to implement together with the use of technogenic structural soils, which significantly improve the conditions of the tree root growth, include:
a) reduction of the destructive soil salinity impact through: reduced proportions of soil to sand and gravel in the mixture used for roadway deicing;
b) enlargement of space for the growth of tree roots by adding bowls and creation of green zones with the optimal width of 2.5–3.0 m Kosmala (2001);
c) grouping of the underground infrastructure construction in the canals isolated from the soil environment, which ensure their safety and also minimizes the risk of colli-sion with trees’ roots. These solutions should be implemented while designing new streets and modernizing the existing ones (Malczyk 2005; Borowski et al. 2005);
d) the use of surfaces that are permeable to air and water, e.g. perforated or open-work slabs, special cobblestones. Lawns formed on crushed stones and gravels (max 55 cm thick) are characterised by larger spaces for the growth of tree roots (Bassuk, Hilman 2003);
e) water supply, which is the main growth and survival factor for trees growing in the cities. Irrigation is necessary in the case of new plant cultivation and in periods of long-lasting drought, also in the case of older trees. The methods of irrigation include: surface irrigation in pots (bowls), injection directly into the tree root system. New
SOILS OF TRAFFIC AREAS IN SZCZECIN

TECHNOGENIC SOILS OF POLAND 202
technologies are recommended – establishment of an irrigation system (it can be also an aeration system) or application of hydrogels that accumulate water – su-per absorbents. Absorptive capacity of hydrogels is several hundred times higher than their mass and about 95% of the absorbed water is available for plants. The cycle of water absorption can be repeated thousands of times for at least five years. After that time, the preparation is degraded and its elements are safe for the environment;
f) air supply to the space within the root system. The applied methods of aeration include a single air injection to the soil by a specialist procedure requiring knowledge and experience, and construction of a system of perforated pipes used mostly in the plantations of trees but also for older trees. Construction of the aeration system should be preceded with the identification of the tree root system structure, be-cause proper arrangement of drainage pipes a�ects e�ectiveness of the system activity. The installation should be regularly cleaned, including desludging.
Summary
The urban and urban-industrial environment in the Szczecin agglomeration is characterised by strong technogenic transformation. The influence of human activities on urban soils is observed e.g. in the form of a stratum built of materials of foreign geological origin, the presence of artefacts, industrial and municipal waste, higher content of organic sub-stance, and higher concentration of macro- and microelements (Niedźwiecki et al. 2000a, b; Kollender-Szych et al. 2008). The influence of road tra¨c on heavy metal contamination in urban soils was discussed in many studies. The results presented in this chapter showed the elevated content of Pb, Zn ad Cu in the soils of tra¨c areas in the city of Szczecin. It was also emphasized that high accumulation of heavy metals in soils follows the spot pattern and occurs sporadically.
The deteriorating conditions of trees growing in green areas, especially along the main roads have been observed for many years in many cities of Poland, including Szczecin (Kubus 2006). One of the reclamation methods used for urban and urban-industrial soils consists in the introduction of technogenic structural soils (mixtures of stones and soils). This is an advanced and favourable method of improving the soil conditions, espe-cially along the tra¨c areas. Our studies showed that a hydralit mixture consisting of the gravel fraction and soil fine material used in proper proportions and with admixture of other elements, e.g. hydrogels, imitates the granular soil structure and optimizes the air-water proportions favourable for trees roots. The composition of mixtures can be modified depending on the place where they are used for structural soils (non-hardened surfaces next to trees trunks, the base of hardened surfaces). Structural soils should be introduced in urban green areas of Poland, especially during planting of new trees and modernization of roads.
M. KUBUS, R. MALINOWSKI, E. MELLER, K. MALINOWSKA, M. RAČEK

203 TECHNOGENIC SOILS OF POLAND
References
1. Arnold H.F. 1989. Planning trees on urban sites. Architecture New Jersey 89(3).
2. Bassuk N., Lindsey P. 1991. Specifying soil volumes to meet the water needs of mature urban street trees and trees in containers. J. Arboric. 17(6): 141–149.
3. Bassuk N., Trowbridge P. 2004. Trees in urban landscape: site assessment, design and installation. John Wiley & Sons, Inc., Hoboken, New Jersey.
4. Bassuk N.L., Curtis D.F., Marracana B.Z., Neal B. 2003. Recommended urban trees: site assess-ment and tree selection for stress tolerance. Urban Horticulture Institute.
5. Bassuk N.L., Grabosky J., Trowbridge P. 1998. Structural soil: An innovate medium under pavement that improves street trees vigor. American Society of Landscape Architects, Annual Meeting Pro-ceeding: 183–185.
6. Bassuk N.L., Hillman A. 2003. Creating the urban forest: the bare root method. Cornell Univer-sity, Ithaca, New York.
7. Borowski J., Latocha P., Zaraś-Januszkiewicz E., Swoczyna T. 2005. Main threats and methods of improving of urban trees growth conditions. Study made for Environment Protection Of-fice of Department of City of Warsaw (manuscript).
8. Chudecka J. 2009. Characteristics of soil substrate in the anthropogenic layer of the oldest part of Szczecin. West Pomeranian University of Technology in Szczecin, Szczecin (in Polish with English summary).
9. Coder K.D. 2000. Soil compaction and trees: causes, symptoms and e©ects. University of Georgia, USA, http://www.extension.iastate.edu/forestry/ publications/for00-003.pdf (2013.04.03).
10. Garczarczyk M. 2008. Application of stony-soil mixture for planting roadside trees. Present and historic green areas in the cities. [In:] A. Greinert, M.E. Drozdek (Eds.). From the promenade to the highway – communication with nature. ZKTZ, IZiIR, PWSZ, Sulechów-Kalsk: 232–238 (in Polish).
11. Grabosky J., Bassuk N. 1995. A new urban tree soil to safety increase rooting volumes under sidewalks. J. Arbor. 21(4): 187–201.
12. Grabosky J., Bassuk N., Trowbridge P. 1999. Structural soils. A new medium to allow urban trees to grow in pavement. Washington, ASLA.
13. Grabosky J., Bassuk N., Trowbridge P. 2005. Using CU-structural soil in the Urban Environment. Ithaca, Cornell University.
14. IUNG. 1990. Fertilization recommendations. Part I. Threshold limit values for assessment of macro and microelements contents in the soils. Puławy (in Polish).
15. Kabata-Pendias A., Motowicka-Terelak T., Piotrowska M., Terelak H., Witek T. 1993. Evaluation of the soil and vegetation pollution with heavy metals and sulphur. Framewok directives for agriculture 53. IUNG, Puławy (in Polish).
16. Kabata-Pendias A., Pendias H. 1999. Biogeochemistry of trace elements. Wyd. Nauk. PWN, Warsaw (in Polish).
SOILS OF TRAFFIC AREAS IN SZCZECIN

TECHNOGENIC SOILS OF POLAND 204
17. Kollender-Szych A., Niedźwiecki E., Malinowski R. 2008. Urban soils – selected issues for stu-dents of Environment Protection. University of Agriculture in Szczecin (in Polish).
18. Kosmala M. 2001. Trees’ root systems. Facts and myths. Main problems of trees cultivation in the streets. Green areas of Warsaw, problems and hopes. Conference abstracts. Warsaw-Powsin, Botanical Garden PAN (in Polish)
19. Kosmala M. 2008. Saving the trees − the latest technologies improving the growth conditions of streetside trees in the cities. [In:] E. Oleksiejuk and A. Jankowska (Eds.) Urban greenery, the natural wealth of the city (abstracts). Toruń 9–11 October 2008: 163–171 (in Polish).
20. Kubus M. 2006. Implementation of treatments for trees growing in the green areas in Szczecin. Trees and shrubs recommended for urban planting in the conditions of Szczecin (manuscript). Study made for Environment Protection O¨ce of Department of City of Warsaw (in Polish).
21. Kubus M., Wojcieszczuk T., Malinowski R., Meller E. 2009. Evaluation of properties of structural soil Hydralit produced by Tegra and its application for trees cultivation in urban areas. [In:] S. Stankowski, K. Pacewicz (Eds.). The brownfields and reclaimed areas and the possibility of their development. Polish Society of Ecological Engineering, Szczecin Branch: 101–110 (in Polish).
22. Łukaszkiewicz J. 2008. Influence of selected urban environment conditions on the growth and development of trees. [In:] E. Oleksiejuk and A. Jankowska (Eds.) Urban greenery, the natural wealth of the city (abstracts). Toruń 9–11 October 2008: 117–128 (in Polish).
23. Malczyk T. 2005. Directives on green designing in urbanized areas. Publishing House of Public Vocational High School in Nysa, script 6 (in Polish).
24. Malinowska K. 2012. Influence of urban factors on selected physiological parameters of some trees in Szczecin. West Pomeranian University of Technology in Szczecin, Szczecin (in Polish with English abstract).
25. Malinowski R., Kubus M., Meller E., Wojcieszczuk M. 2010. Characteristics of physical proper-ties of stony-soil mixture Hydralit used for trees cultivation in urban areas. [In:] S. Stankows-ki, K. Pacewicz (Eds.) Natural use of by-products of carbon and biomass combustion and of carbon with biomass co-combustion. Polish Society of Ecological Engineering, Szczecin Branch: 37–40 (in Polish).
26. Malinowski R., Kubus M., Meller E., Wojcieszczuk M. 2012. Physical parameters of structural soils recommended for trees and shrubs cultivation in urban and degraded areas. Folia Pomer. Univ. Technol. Stetin., Agric., Aliment., Pisc., Zootech. 295(22): 29–34 (in Polish with English abstract).
27. Niedźwiecki E., Protasowicki M., Wojcieszczuk T. 2000a. Content of some heavy metals in soil and dust fallout within Szczecin urban area. [In:] W. Burghardt, Ch. Dornauf (Eds.) First Inter-national Conference on Soils of Urban, Industrial, Tra¢c and Mining areas, Proceedings, 1. Essen, Germany: 75–79.
28. Niedźwiecki E., Protasowicki M., Kujawa D., Niedźwiecka D. 2000b. Contents of cadmium and lead in the waste dust in the area of Szczecin agglomeration. [In]: Cadmium in the envi-ronment – ecological and methodical problems. Zesz. Nauk. Komitetu „Człowiek i Środowisko” PAN 26: 201–207.
M. KUBUS, R. MALINOWSKI, E. MELLER, K. MALINOWSKA, M. RAČEK
205 TECHNOGENIC SOILS OF POLAND
29. Niedźwiecki E., Meller E., Malinowski R., Sammel A., Kruczyńska J. 2004. Dandelion (Taraxa-cum o¢cinale) as a bioindicator of heavy metals pollution of urban soils in Szczecin. Folia Univ. Agric. Stettin. Agricultura 242/99: 103–108 (in Polish with English abstract).
30. Niedźwiecki E., Protasowicki M., Wojcieszczuk T., Sammel A., Dembińska K., Jaruta G. 2009. Morphological features and chemical composition of soils in the northern-western part of Szczecin. Zesz. Probl. Post. Nauk Rol. 542: 797–808 (in Polish with English abstract).
31. Piasecki J., Maciejewska M., Cyran A. 1995. The content of zinc, manganese, copper and lead in soil and meadow vegetation in the city of Szczecin. Zesz. Nauk. AR Szczecin 167, Roln. 60: 81–88 (in Polish with English abstract).
32. PIOŚ, IUNG, 1995. Basics of the evaluation of chemical soil pollution – heavy metals, sulphur and WWA. Library of Environment Monitoring, Warsaw (in Polish).
33. Regulation of the Minister of the Environment dated September 9, 2002 on soil and land quality standards (Journal of Laws No. 165, item 1359, October 4, 2002).
34. Szczepanowska H.B. 2001. Trees in the city. Hortpress Publication House, Warsaw (in Polish).
35. Wojcieszczuk T., Niedźwiecki E. 2003. The content of selected microelements in the leaves of trees and in the streetside soils of Szczecin. Zesz. Probl. Post. Nauk Roln. 492: 411–417 (in Polish with English abstract).
36. Wojcieszczuk T., Niedźwiecki E., Wojcieszczuk M., Sammel A., Zacharewicz A. 2006. Influ-ence of dust contamination on the content of selected chemical components in the leaves of trees and in the urban soils of Szczecin. Zesz. Probl. Post. Nauk Roln. 515: 431–437 (in Polish with English abstract).
SOILS OF TRAFFIC AREAS IN SZCZECIN


207 TECHNOGENIC SOILS OF POLAND
SOILS OF TRAFFIC AREAS IN WARSAW
WOJCIECH KWASOWSKI12Introduction
One of the e�ects of intensive development in urbanized areas is the transformation of soil properties. Apart from diverse changes in the physical properties of soil, human activity contributes to the exceeded concentration of various substances in the soil.
Motor transport is a significant factor polluting the urban environment. Its negative e�ects include the emission of exhaust gases, asbestos, cadmium, zinc (wear and tear of breaks, clutches and tires), charcoal from the abrasion of tires, as well as asphalt particles. The hazard posed by motor transport is observed mainly in areas located in the immediate vicinity of motorways, speedways and roads with heavy tra¨c. Air pol-lution is particularly dangerous in cities where a large number of vehicles occurs in a small area and where frequent restrictions of tra¨c speed: crossroads, pedestrian crossings and numerous tra¨c jams cause high emission of exhaust gases and exces-sive wear of the car wheel and steering system.
All toxic particles are deposited from the atmosphere on the surrounding soils, causing significant changes in their chemical properties. The most common modifica-tion (hazardous to the environment) is the accumulation of some trace elements in the soil, mainly cadmium, zinc and lead, and in smaller amounts also nickel and copper.
This chapter presents selected chemical properties of chemically modified urban soils (technogenic soils) based on studies of soils located in the direct vicinity of the most busy routes out of Warsaw.
Study area and soil profile documentation
Four study sites have been selected for studies in the area of Warsaw City (Fig. 1). The soil profiles were located at a distance of c. 5 m from the busy communication routes. Site 1 was situated on the right-hand bank of Warsaw within the northern margin of the

TECHNOGENIC SOILS OF POLAND 208
Mazovian Landscape Park at Bronisława Czecha Street, which is the main route out of Warsaw in the direction of Terespol and Lublin. The mean 24-hour traffic load is c. 61 000 vehicles. Site 2 was located at the margin of a former arable field (at present fallow land) at Krakowska Avenue (beside the Warsaw Frederic Chopin Airport), in the direct vicinity of the route from Warsaw to Cracow and Wrocław. The mean 24-hour tra¨c load of this route is c. 74 000 vehicles. Site 3 was located near the route towards Poznań at Połczyńska Street. The mean 24-hour tra¨c load is c. 50 000 vehicles. The last site (4) was situated in the northern margin of the Młociński Forest at Pułkowa Street, which is the main route towards Gdańsk. The mean 24-hour tra¨c load is c. 60 000 vehicles.
All the study sites have been located on former arable or forest areas so the mor-phology of the studied soils was altered by human activity. It should be emphasized that these soils were devoid of any artefacts that would influence their chemical prop-erties. The soil material was analysed according to international standards (van Reeu-wijk 2006) – Tables 1–4. The total heavy metal content (in mg·kg-1 dry mass) was deter-mined by microwave digestion with aqua regia and analysed by graphite furnace AAS (atomic adsorption spectroscopy). Other specialized methods are explained further in this chapter.
Fig. 1. Location of the study area (source: http://mapa.zumi.pl/warszawa)
W. KWASOWSKI

209 TECHNOGENIC SOILS OF POLAND
Profile 1
Location: Bronisława Czecha Street,
Warsaw
Coordinates: 52°13.339’ N
21°09.415’ E
Soil classification (WRB 2007): Umbrisol (Brunic, Arenic)
Oi – 8–7 cm: weak decomposed organic material (coniferous needles, cones, pieces of pine bark, pine twigs).Oe – 7–2 cm: moderately decomposed organic material (brown remains of plants, small roots).Oa – 2–0 cm: highly decomposed organic material, dark brown, small roots.
AE – 0–32 cm: sand, light brownish grey, single grain structure, numerous roots, slightly moist, clear boundary.
Bsw – 32–40 cm: sand, yellowish brown, single grain structure, slightly moist, very few roots, gradual boundary.
Bw – 40–70 cm: sand, light yellowish brown, single grain structure, slightly moist, unclear boundary.
C – below 70 cm: sand, light grey, single grain structure, slightly moist.
SOILS OF TRAFFIC AREAS IN WARSAW
0 cm
50 cm
100 cm

TECHNOGENIC SOILS OF POLAND 210
Table 1. Selected soil properties – profile 1
HORIZON Oi Oe Oa AE Bsw Bw C
DEPTH [cm] 8–7 7–2 2–0 0–32 32–40 40–70 >70
GRAIN SIZE DISTRIBUTION [%]
>2 mm — — — 2 0 1 2
2 mm–50 µm — — — 91 91 88 90
50–2 µm — — — 7 7 11 9
<2 µm — — — 2 2 1 1
TEXTURE CLASS (USDA) — — — sand sand sand sand
SOIL MATRIX COLOUR
drymoist
——
——
——
10YR 6/210YR 4/2
10YR 5/410YR 3/2
10YR 6/410YR 5/6
10YR 7/210YR 7/4
OC [%] 51.2 50.3 29.8 0.90 0.71 0.21 —
pHin H2O 4.4 3.7 3.6 4.0 4.4 4.9 4.9
in 1M KCl 3.7 3.0 2.9 3.4 3.9 4.3 4.3
CEC [cmolc·kg-1] 62.5 60.2 49.7 9.84 3.24 2.44 3.37
BS [%] 26 14 12 5 6 9 10
Fet [%] — — — 0.242 0.337 0.309 0.265
Fed [%] — — — 0.167 0.261 0.163 0.064
Feo [%] — — — 0.091 0.123 0.129 0.009
Alo [%] — — — 0.069 0.221 0.039 0.070
TOTAL CONTENT OF HEAVY METALS [mg·kg-1]
Cd 1.21 1.12 1.24 0.88 0.67 0.32 0.21
Pb 79.4 72.0 72.3 58.3 21.3 11.3 9.52
Zn 134 128 130 105 67.6 49.0 36.8
Cu 24.1 20.3 20.4 14.9 11.2 6.87 4.12
W. KWASOWSKI

211 TECHNOGENIC SOILS OF POLAND
Profile 2
Location: Krakowska Avenue, Warsaw
Coordinates: 52°10.532’ N
20°57.001’ E
Soil classification (WRB 2007): Stagnic Luvisol (Arenic)
Ap – 0–24 cm: sand, brown, single grain structure, slightly moist, few roots, unclear boundary.
Et – 24–35 cm: sand, light yellowish brown, single grain structure, slightly moist, few roots, unclear boundary.
EB – 35–52 cm: sand, dark yellowish brown, single grain structure, slightly moist, few roots, unclear boundary.
2Btg – 52–71 cm: loamy sand, dark greyish brown, subangular structure, moist, clear boundary.
2C – below 71 cm: loamy sand, pale brown, sub-angular structure, slightly moist.
SOILS OF TRAFFIC AREAS IN WARSAW
0 cm
50 cm
100 cm

TECHNOGENIC SOILS OF POLAND 212
Table 2. Selected soil properties – profile 2
HORIZON Ap Et EB 2Btg 2C
DEPTH [cm] 0–24 24–35 35–52 52–71 >71
GRAIN SIZE DISTRIBUTION [%]
>2 mm 1 1 1 1 2
2 mm–50 µm 83 83 79 73 76
50–2 µm 14 14 16 16 14
<2 µm 3 3 5 11 10
TEXTURE CLASS (USDA) sand sand sand loamy sand loamy sand
SOIL MATRIX COLOUR
drymoist
10YR 5/310YR 4/3
10YR 6/410YR 4/6
10YR 4/610YR 3/6
2.5Y 5/22.5Y 4/2
10YR 7/310YR 6/3
OC [%] 1.12 0.52 0.23 — —
pHin H2O 7.2 7.4 7.1 7.0 6.9
in 1M KCl 6.6 6.8 6.6 6.5 6.6
CEC [cmolc·kg-1] 8.85 3.45 4.67 6.23 6.81
BS [%] 50 52 58 52 59
TOTAL CONTENT OF HEAVY METALS [mg·kg-1]
Cd 1.41 1.22 0.70 0.41 0.40
Pb 122 119 61.2 49.2 34.4
Zn 152 125 48.8 39.1 36.8
Cu 27.2 22.2 17.2 13.5 11.2
W. KWASOWSKI

213 TECHNOGENIC SOILS OF POLAND
Profile 3
Location: Połczyńska Street, Warsaw
Coordinates: 52°13.002’ N
20°53.092’ E
Soil classification (WRB 2007): Phaeozem (Arenic)
Ap – 0–19 cm: loamy sand, dark grey, granular structure, many small roots, slightly moist, un-clear boundary.
A2 – 19–55 cm: loamy sand, very dark grey, sub-angular structure, slightly moist, very few roots, gradual boundary.
Cr – below 55 cm: loamy sand, light grey, angular blocky structure, strong reduction.
SOILS OF TRAFFIC AREAS IN WARSAW
0 cm
50 cm
100 cm

TECHNOGENIC SOILS OF POLAND 214
Table 3. Selected soil properties – profile 3
HORIZON Ap A2 Cr
DEPTH [cm] 0–19 19–55 >55
GRAIN SIZE DISTRIBUTION [%]
>2 mm 0 1 2
2 mm–50 µm 77 75 78
50–2 µm 19 20 19
<2 µm 4 5 3
TEXTURE CLASS (USDA) loamy sand loamy sand loamy sand
SOIL MATRIX COLOUR
dry
moist
10YR 4/1
10YR 2/1
10YR 3/1
10YR 2/1
5Y 7/1
5Y 5/1
OC [%] 1.76 1.97 —
pHin H2O 7.2 7.4 7.2
in 1M KCl 6.6 6.9 6.7
CEC [cmolc·kg-1] 11.8 8.21 6.79
BS [%] 90 93 91
TOTAL CONTENT OF HEAVY METALS [mg·kg-1]
Cd 1.71 0.82 0.43
Pb 102 62.4 29.8
Zn 167 79.8 38.9
Cu 27.4 19.5 11.2
W. KWASOWSKI

215 TECHNOGENIC SOILS OF POLAND
Profile 4
Location: Pułkowa Street, Warsaw
Coordinates: 52°19.051’ N
20°54.588’ E
Soil classification (WRB 2007): Brunic Arenosol
A – 0–34 cm: loamy sand, light brownish grey, granular structure, many roots, slightly moist, clear boundary.
Bw – 34–69 cm: loamy sand, brownish yellow, subangular structure, slightly moist, very few roots, gradual boundary.
BwC – 69–82 cm: loamy sand, very pale brown, subangular structure, slightly moist, unclear boundary.
2C – below 82 cm: sand, very pale brown, single grain structure, slightly moist.
SOILS OF TRAFFIC AREAS IN WARSAW
0 cm
50 cm
100 cm

TECHNOGENIC SOILS OF POLAND 216
Table 4. Selected soil properties – profile 4
HORIZON A Bw BwC 2C
DEPTH [cm] 0–34 34–69 69–82 >82
GRAIN SIZE DISTRIBUTION [%]
>2 mm 4 2 2 2
2 mm–50 µm 82 77 76 87
50–2 µm 14 17 18 12
<2 µm 4 6 6 1
TEXTURE CLASS (USDA) loamy sand loamy sand loamy sand sand
SOIL MATRIX COLOUR
dry
moist
10YR 6/2
10YR 4/2
10YR 6/6
10YR 4/6
10YR 7/4
10YR 5/4
10YR 8/3
10YR 7/3
OC [%] 0.96 0.42 — —
pHin H2O 7.0 7.4 7.0 7.1
in 1M KCl 6.6 6.9 6.7 6.6
CEC [cmolc·kg-1] 11.0 7.23 6.35 2.87
BS [%] 70 75 79 68
TOTAL CONTENT OF HEAVY METALS [mg·kg-1]
Cd 1.44 1.57 0.51 0.21
Pb 126 66.2 28.3 22.2
Zn 150 101 41.2 30.0
Cu 20.3 22.4 11.2 10.5
Properties of the analysed soils
The analysed soil represented two variants: forest soils – profiles 1 and 4 located at the margins of the Mazovian Landscape Park and Młociny Forest, as well as post-arable soils – profiles 2 and 3. The main soil parent materials were sand or loamy sand. The content of silt and clay fractions is particularly low in profile 1. In the other profiles, the content of these fractions was higher, particularly of silt, i.e. 12–20%.
The organic carbon (OC) content varied. The lowest values were recorded in profile 1 (0.90%), and the highest – in profile 3 (1.76%).
W. KWASOWSKI

217 TECHNOGENIC SOILS OF POLAND
The soil pH values ranged from 3.6 to 7.4 in H2O and from 2.9 to 6.9 in 1M KCl. How-ever, the soil material from profiles 2, 3 and 4 had neutral reaction, typical of urban soils, whereas profile 1 represented a strongly acidic soil. It is typical of soils developed from sands under coniferous forests.
The soil represented by profile 1 was characterised by distinct migration of the ana-lysed iron fractions (Fet, Fed, Feo), as well as amorphous aluminium (Alo), typical of the initial stage of the podzolization process.
The sorption capacity of the studied soils was characterised by two elements: the clay fraction content and the humus content in the surface and subsurface horizons. The low-est cation exchange capacity (CEC) was in profile 1 and ranged from 2.44 to 9.84 cmolc·kg-1 in the mineral horizons, at the base saturation (BS) not exceeding 10%. The sorption properties of other soils were di�erent. Although the value of CEC was only slightly higher (2.87–11.8 cmolc·kg-1), the base saturation was much higher, from 50 even up to 93%.
Heavy metal content and analysis of particular fractions in its total content
The urban soils selected for the study preserved the original arrangement of genetic horizons and properties typical of Umbrisols, Luvisols, Phaeozems and Arenosols (IUSS Working Group IUSS 2007). However, their location in the direct vicinity of communication routes resulted in the modification of their chemical properties by the accumulation of heavy metals introduced to the soils with deposition of tra¨c pollution from the atmosphere.
In all the studied soils, the heavy metal content decreased with depth of a soil profile. Many authors (Kozanecka et al. 2002; 2006; Kwasowski et al. 2006) link this observa-tion with slow migration of trace elements down the soil profile at simultaneous accumu-lation of the most mobile forms of metals by plants and their subsequent (biological) transport to the surface.
The total content of lead in the analysed soils varied within 9.52–127 mg·kg-1. The highest concentrations were recorded in the topsoil and in the subsurface soil horizons (58.3–127 mg·kg-1). These values significantly exceed the content of lead occurring in non-contaminated soils (Kwasowski et al. 2000; Lu et al. 2003). Analysis of the lead concentration in profile 1 distinctly points to the accumulation of this metal in organic horizon, which reached up to 79.4 mg·kg-1. Similar results (51–67 mg·kg-1) were obtained by Czępińska-Kamińska and Janowska (1999) during the analysis of the metal content in the topsoil of forest soils located near the routes with heavy tra¨c. Accumulation of lead in the mineral topsoil of the analysed soils conforms with the results obtained by other authors (Dębska-Kalinowska et al. 1999; Czarnowska et al. 2002; Kwasowski, Markiewicz 2007). According to Kozanecka et al. (2000), who analysed the lead content
SOILS OF TRAFFIC AREAS IN WARSAW

TECHNOGENIC SOILS OF POLAND 218
in soils surrounding the petrol stations in Warsaw, heavy tra¨c is the cause of high lead content in the mineral topsoil (48–270 mg·kg-1). In the deepest soil horizons of the ana-lysed soils, the lead content was several times lower than in the topsoil and varied within 9.52–34.4 mg·kg-1. The results were typical of non-contaminated soils and only slightly exceeded the geochemical background values (Czarnowska 1996; Kwasowski et al. 2000).
The distribution of zinc in the analysed soils had a similar pattern as that of lead. The highest content was recorded in the mineral topsoil and ranged within 105–167 mg·kg-1. The obtained values are conformable with the results obtained by other au-thors (Gee et al. 2000; Lee et al. 1997). During the analysis of the zinc content in the soil collected near the A31 motorway in France, Viard et al. (2004) recorded a significantly higher concentration of this metal in the direct vicinity of the route – above 300 mg·kg-1, while the zinc content significantly decreased with the distance from the route margin. According to Lee et al. (1997), wear of car tires is the main reason of such high zinc ac-cumulation, as their rubber contains 0.8% of this metal. The content of zinc in all the analysed profiles decreased with profile depth to reach values close to natural in the soil parent material (30.0–38.9 mg·kg-1).
Cadmium is one of the most mobile and very toxic metals in the environment. Its content in the topsoil on non-polluted soils in Poland is within the range of 0.3–0.4 mg·kg-1 and decreases to c. 0.2–0.3 mg·kg-1 in deeper horizons (Kabata-Pendias, Pendias 1999; Kwasowski et al. 2000; Kirkham 2006). The cadmium content in the parent rock horizons of the analysed soils is at a natural level and varies within 0.21–0.43 mg·kg-1. A di�erent situation was observed in the topsoil and subsurface horizons, where cadmium accumula-tion was several times higher compared to non-polluted soils and reaches 0.67–1.57 mg·kg-1 in the subsurface horizons and 0.88–1.71 mg·kg-1 in the topsoil. Similarly high values of cadmium content in urban soils have been recorded by many authors (Czarnowska et al. 2002; Właśniewski, Hajduk 2012). In the immediate vicinity of the A71 motorway in France, Lee et al. (1997) recorded a significantly higher concentration of this element – on average 2.72 mg·kg-1.
The concentration of copper was highly variable in the analysed soils: in the mineral topsoil it ranged within 14.9–27.4 mg·kg-1, and in the C horizons − within 4.12–11.2 mg·kg-1. These results only slightly di�er from the values recorded in non-polluted soils. Other authors reported similar values of copper concentrations in the topsoil near the communication routes : 20.1 mg·kg-1 (Dębska et al. 1999), 27.3 mg·kg-1 (Czarnowska et al. 2002), 15 mg·kg-1 (Klimowicz, Melke 2000). Some reports point to high accumulation of copper in soils of urbanized areas and near communication routes (Lu et al. 2003).
The total content of metals in soils does not always correctly indicate the degree of their contamination caused by urbanization of the studied areas. This is linked with the diverse content of trace elements in various types of soils, which is caused by many natu-ral factors, such as e.g. composition of the parent material or the organic matter content.
W. KWASOWSKI

219 TECHNOGENIC SOILS OF POLAND
According to various authors (Chłopecka 1993; Tack, Verloo 1995; Gee et al. 2000; Lu et al. 2003), a better assessment of soil contamination may be obtained by the analysis of the contribution of particular metal fractions (MF) distinguished by sequential extraction. The contribution of selected metal fractions in the studied soils was determined by se-quential extraction after Tessier et al. (1979) with the modification of Salbu et al. (1998). This allowed to distinguish fractions defined as: F1 – water-soluble forms, F2 – exchange-able forms, F3 – specifically absorbed and bound to carbonates, F4 – reducible – bound to iron and manganese oxides, F5 – complexed by organic compounds, and F6 – residual. The obtained results are presented in Tables 5–8. Several authors (Gworek et al. 2004; Kabała, Singh 2006; Kalembasa, Pakuła 2006) assess the content of mobile forms of metals, thus those directly introduced to the soil due to human actions, based on the mobility factor (MF). The MF is calculated as the percentage contribution of the sum of fractions F1 + F2 + F3 in the total content. The factor provides information on the mobil-ity and bioavailability of metals in soils and indirectly – on the degree of pollution.
Table 5. Fractions of heavy metals in profile 1
HorizonF1 F2 F3 F4 F5 F6
[mg·kg-1]
Zn
AE 1.02 0.80 20.8 40.2 12.6 30.2
Bsw 0.59 0.42 8.96 17.0 7.82 34.8
Bw 0.55 0.62 4.91 7.89 4.69 31.9
C 0.47 0.58 2.91 4.55 2.69 26.9
Pb
AE 0.62 4.91 6.99 25.5 2.44 20.8
Bsw 0.11 0.93 2.80 7.22 1.82 11.2
Bw 0.12 0.62 0.78 2.39 1.15 7.36
C 0.09 0.10 0.78 1.59 0.99 6.81
Cd
AE 0.01 0.17 0.15 0.16 0.09 0.39
Bsw —* 0.08 0.06 0.10 0.06 0.47
Bw —* 0.01 0.02 0.06 0.03 0.23
C —* —* 0.02 0.04 0.03 0.15
Cu
AE 0.39 0.15 1.61 1.81 1.92 9.33
Bsw 0.16 0.17 1.01 1.12 1.25 7.51
Bw 0.03 0.10 0.21 0.62 1.02 4.83
C 0.05 0.06 0.10 0.37 0.41 3.12
* — below detection limit
SOILS OF TRAFFIC AREAS IN WARSAW

TECHNOGENIC SOILS OF POLAND 220
Table 6. Fractions of heavy metals in profile 2
HorizonF1 F2 F3 F4 F5 F6
[mg·kg-1]
Zn
Ap 3.08 4.62 33.5 61.0 6.11 47.2
Et 2.85 4.11 23.8 31.5 13.9 52.5
EB 0.54 1.12 5.84 10.5 7.39 25.1
2Btg 0.40 0.46 2.77 3.94 5.98 26.2
2C 0.36 0.43 2.98 3.47 5.22 24.3
Pb
Ap 2.44 6.12 15.9 52.3 4.87 40.1
Et 2.97 5.32 14.3 46.3 4.76 45.1
EB 0.62 1.23 6.75 12.3 8.61 31.8
2Btg 0.26 1.25 1.49 10.3 4.93 31.9
2C 0.19 0.36 1.56 6.92 2.43 23.1
Cd
Ap 0.02 0.27 0.21 0.25 0.10 0.56
Et 0.01 0.19 0.18 0.22 0.11 0.50
EB 0.01 0.02 0.05 0.11 0.07 0.46
2Btg —* 0.01 0.03 0.05 0.03 0.28
2C —* 0.01 0.03 0.06 0.02 0.28
Cu
Ap 0.88 1.12 2.61 4.84 5.20 12.7
Et 0.30 0.46 2.59 3.84 3.91 11.6
EB 0.18 0.20 0.89 1.71 2.26 12.2
2Btg 0.11 0.25 0.59 1.29 1.52 10.1
2C 0.08 0.11 0.58 0.76 1.16 8.65
* — below detection limit
W. KWASOWSKI

221 TECHNOGENIC SOILS OF POLAND
Table 7. Fractions of heavy metals in profile 3
HorizonF1 F2 F3 F4 F5 F6
[mg·kg-1]
Zn
Ap 3.59 7.23 32.5 64.0 12.7 50.8
A2 0.92 2.68 15.0 23.9 5.11 35.3
Cr 0.40 0.81 2.91 5.48 3.82 25.7
Pb
Ap 4.66 4.91 17.2 36.9 6.72 36.0
A2 0.81 1.32 6.49 17.3 5.61 34.7
Cr 0.31 0.42 1.79 4.20 2.41 22.2
Cd
Ap 0.06 0.30 0.28 0.36 0.20 0.60
A2 0.03 0.09 0.11 0.17 0.06 0.40
Cr —* 0.02 0.02 0.06 0.03 0.36
Cu
Ap 0.39 0.15 1.61 1.81 1.92 9.33
A2 0.16 0.17 1.01 1.12 1.25 7.51
Cr 0.03 0.10 0.21 0.62 1.02 4.83
* — below detection limit
Table 8. Fractions of heavy metals in profile 4
HorizonF1 F2 F3 F4 F5 F6
[mg·kg-1]
Zn
A 3.59 4.91 30.6 62.4 4.92 47.1
Bw 1.85 3.49 21.9 28.8 8.42 41.2
BwC 0.52 1.01 3.72 5.89 6.98 24.0
2C 0.31 0.87 2.21 2.44 3.96 20.1
Pb
A 3.91 6.54 18.2 48.6 8.14 43.0
Bw 1.49 2.91 8.58 26.7 4.41 25.9
BwC 0.29 0.90 2.53 3.99 2.02 18.6
2C 0.22 0.24 2.35 3.40 1.58 14.4
Cd
A 0.03 0.26 0.23 0.25 0.13 0.56
Bw 0.04 0.28 0.22 0.24 0.15 0.61
BwC —* 0.04 0.05 0.11 0.05 0.35
2C —* 0.01 0.03 0.04 0.03 0.15
Cu
A 0.36 0.79 1.79 2.58 2.87 13.3
Bw 0.24 0.29 1.51 2.78 2.96 15.3
BwC 0.08 0.11 0.55 1.38 1.46 8.54
2C 0.05 0.20 0.75 1.15 1.27 7.62
* — below detection limit
SOILS OF TRAFFIC AREAS IN WARSAW

TECHNOGENIC SOILS OF POLAND 222
The highest amount of lead in the topsoil of all analysed soils was accumulated in frac-tion F4 (forms bound to iron and manganese oxides) and ranged from 36.9 to 52.3 mg·kg-1, which accounted for 36–43% of the total Pb content (Fig. 2 and 3). In the remaining genetic horizons (with the exception of horizon Et in profile 2 – Fig.3), the highest content of lead was linked with residual fraction F6. The contribution of this fraction in the total content was within 39–71%.
Fig. 2. Percentage contribution of lead fractions in profile 1
The ratios of particular lead fractions in the topsoil indicate the significant influence of tra¨c on the analysed soils. This is confirmed by the high value of MF within 20–23%. Similar results were obtained by Kwasowski and Oktaba (2011) in their analysis of topsoil near the Warsaw–Poznań speedway, where the mobility factor was 22%. The series of percentage contribution of particular lead fractions in the topsoil of the analysed profiles were as follows (average values):
— in profiles 1 and 2: F4(42)>F6(34)>F3(13)>F2(6)>F5(4)>F1(1);— in profiles 3 and 4: F4(37)>F6(35)>F3(13)>F5(6)>F2(5)>F1(4).The MF value clearly decreases with the profile depth to reach 6–12% in the C horizons.
These are typical values for non-polluted soils (Lu et al. 2003; Kwasowski et al. 2010; Kwasowski, Oktaba 2011).
W. KWASOWSKI

223 TECHNOGENIC SOILS OF POLAND
Fig. 3. Percentage contribution of lead fractions in profile 2
Similarly, the series of percentage contribution of lead fractions in the deepest ho-rizons of the soil profile were typical for soils with the natural content of this metal and were as follows (average values):
— in profiles 1, 2 and 3: F6(69)>F4(17)>F5(8)>F3(4)>F2(1)=F1(1);— in profile 4: F6(66)>F4(15)>F3(10)>F5(7)>F2(1)>F1(1).Analysis of the contribution of zinc fractions in the studied soils shows that the
topsoil of all profiles contains the highest amounts of zinc bound to iron and manga-nese oxides (F4) – Fig. 4 and 5. Its percentage contribution in the total content was within the range of 35–41%. The residual fraction (F6) dominated in the remaining ho-rizons and its contribution was within the range of 40–71%. The series of percentage contribution of particular zinc fractions in the topsoil of the analysed profiles was only slightly di�erent (average values):
— profiles 1 and 2: F4(42)>F6(34)>F3(13)>F2(6)>F5(4)>F1(1);— profiles 3 and 4: F4(37)>F6(35)>F3(14)>F5(6)>F2(5)>F1(3).
Fig. 4. Percentage contribution of zinc fractions in profile 2
SOILS OF TRAFFIC AREAS IN WARSAW
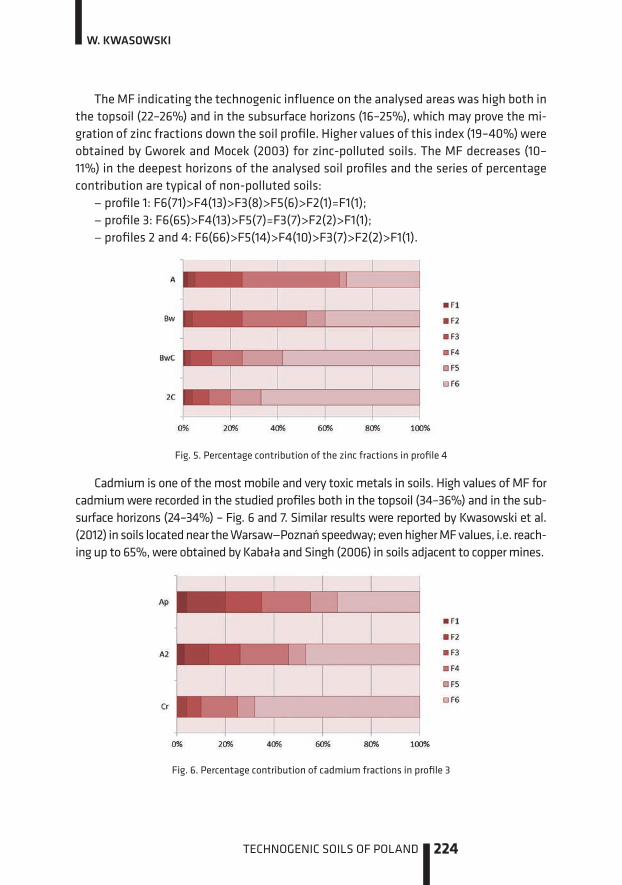
TECHNOGENIC SOILS OF POLAND 224
The MF indicating the technogenic influence on the analysed areas was high both in the topsoil (22–26%) and in the subsurface horizons (16–25%), which may prove the mi-gration of zinc fractions down the soil profile. Higher values of this index (19–40%) were obtained by Gworek and Mocek (2003) for zinc-polluted soils. The MF decreases (10–11%) in the deepest horizons of the analysed soil profiles and the series of percentage contribution are typical of non-polluted soils:
— profile 1: F6(71)>F4(13)>F3(8)>F5(6)>F2(1)=F1(1);— profile 3: F6(65)>F4(13)>F5(7)=F3(7)>F2(2)>F1(1);— profiles 2 and 4: F6(66)>F5(14)>F4(10)>F3(7)>F2(2)>F1(1).
Fig. 5. Percentage contribution of the zinc fractions in profile 4
Cadmium is one of the most mobile and very toxic metals in soils. High values of MF for cadmium were recorded in the studied profiles both in the topsoil (34–36%) and in the sub-surface horizons (24–34%) – Fig. 6 and 7. Similar results were reported by Kwasowski et al. (2012) in soils located near the Warsaw—Poznań speedway; even higher MF values, i.e. reach-ing up to 65%, were obtained by Kabała and Singh (2006) in soils adjacent to copper mines.
Fig. 6. Percentage contribution of cadmium fractions in profile 3
W. KWASOWSKI

225 TECHNOGENIC SOILS OF POLAND
As evidenced by the analysis of the distribution of cadmium fractions in the studied soils, their contribution significantly varied with the depth of the soil profile. Although all horizons of the analysed soils contained the highest amount of cadmium linked with the residual fraction, its content in the topsoil was within the range of 34–42% and al-most doubled in the parent material horizons (68–72%). Similar high variability of the content with depth was observed for exchangeable cadmium (F2) and cadmium bound to carbonates (F3), from trace amounts to 19% for F2 and from 6 to 15% for F3.
Fig. 7. Percentage contribution of cadmium fractions in profile 4
The series of percentage contribution of particular zinc fractions in the topsoil and parent rock horizons of the analysed soils were as follows (average values):
— topsoil of profiles 1, 2 and 4: F6(40)>F2(18)>F4(17)>F3(15)>F5(8)>F1(2);— topsoil of profile 3: F6(34)>F4(20)>F2(16)>F3(15)>F5(11)>F1(4);— the parent rock horizon of profiles 1 and 2: F6(71)>F4(15)>F3(8)>F5(5)>F2(1)>F1(0)— the parent rock horizon of profiles 3 and 4:F6(69)>F4(14)>F5(8)>F3(6)>F2(3)>F1(0)The last analysed metal was copper. The total content of this microelement within
the range of 4.12–27.4 mg·kg-1 only slightly exceeded its content in non-polluted soils. This was reflected in the contributions of particular fractions in the total content as well as in the MF values. In all analysed soils, the dominance of copper was associated with the residual fraction (61–76%) – Fig. 8; the water-soluble fraction had the lowest contribution − from trace amounts to 2%. The contribution of the remaining copper fractions did not vary significantly, only the copper fraction bound to carbonates (F3) varied in a slightly wider range from on average 9% in the topsoil to 4% in the parent material. The MF had low values within the range of 5–12% regardless of the soil profile depth. Such contribution of particular copper fractions, typical for non-polluted soils, was confirmed by other reports (Gworek et al. 2006; Wójcikowska-Kapusta, Niemczuk 2009; Kwasowski et al. 2010). The series of percentage contribution of particular copper fractions in the topsoil and C horizons were as follows (average values):
— topsoil of profiles 1, 2, 3 and 4: F6(64)>F5(13)>F4(11)>F3(8)>F2(3)>F1(1);— C horizons of profiles 1, 2, 3 and 4: F6(71)>F5(11)>F4(9)>F3(6)>F2(2)>F1(1)
SOILS OF TRAFFIC AREAS IN WARSAW

TECHNOGENIC SOILS OF POLAND 226
Fig. 8. Percentage contribution of copper fractions in profile 4
Summary
The analysed soils from urban agglomerations were characterized by a natural arrange-ment of the genetic horizons. They did not contain artefacts or any other features alter-ing their profile (mixing of horizons or additional humus horizons). The only e�ect of human activity was the significant accumulation of some heavy metals (Pb, Cd, Zn) in the topsoil and subsurface horizons of the analysed soils. The content of these metals was usually several times higher compared to the natural concentration in soils. As evidenced by the assessment of soil contamination with the studied trace elements based on the Regulation of the Minister of the Environment (2002) on the soil and land quality standards, the content of any of the analysed metals did not exceed the limit values defined in the Regulation. It should be noted, however, that the aforementioned document does not specify the degree of soil contamination, but only indicates the limit values beyond which the land reclamation is necessary.
The soil analysis clearly indicates that the accumulation of lead, cadmium and zinc results from the deposition of pollutants from the atmosphere and communication routes. Tra¨c pollutants (exhaust gases, wear and tear of the car wheel and steering system, abrasion of tires and asphalt particles) have the highest contribution in the pollution.
The technogenic origin of the metals in the topsoil was confirmed by their high total content as well as the significant contribution of their mobile fractions.
Accumulation of copper was not observed in any of the studied soil profiles. Both the total content and the contribution of the mobile fractions was low and typical of non-polluted soils. It should be noted, however, that some scientists point to copper as one of the important pollutants of soils located near the communication routes (Koza-necka et al. 2000; Gee et al. 2000; Czarnowska et al. 2002; Lu et al. 2003).
W. KWASOWSKI

227 TECHNOGENIC SOILS OF POLAND
Description of the analysed soils in compliance with the World Reference Base for Soil Resources (IUSS Working Group WRB 2007) does not provide any grounds for their classification as Technosols or Anthrosols. It would be recommended, however, to use one of the Toxic qualifiers for their description, for example Ecotoxic, but the avail-able qualifiers are very inaccurate and therefore a precise assessment of the described soils is di¨cult.
The analysed soils belong to a wide range of urban soils. According to the new sys-tematics of Polish soils (Commission V on Genesis, Classification and Cartography of Soils PSSS 2011), they should be classified as chemically transformed urban soils.
References
1. Chłopecka A. 1993. Forms of trace metals from inorganic sources in soils and amounts found in spring barley. Water Air Soil Pollut. 69: 127–134.
2. Commission V on Genesis, Classification and Cartography of Soils PSSS. 2011. Polish Soil Classification (Systematyka Gleb Polski), 5th edition. Rocz. Glebozn. 62(3): 1–193 (in Polish with English abstract).
3. Czarnowska K. 1996. Total content of heavy metals in parent rocks as reference background levels of soils. Rocz. Glebozn. 47: 43–50 (in Polish with English summary).
4. Czarnowska K., Chlibiuk M., Kozanecka T. 2002. Trace elements in arable soils near roads around Warsaw. Rocz. Glebozn. 53 (3/4): 67–74 (in Polish with English summary).
5. Czępińska-Kamińska D., Janowska E. 1999. The impact of speedways on surface horizons in forest soil. Sylwan 4: 45–55 (in Polish with English summary).
6. Dębska-Kalinowska Z., Lewicka E., Kwasowski W. 1999. Heavy metal content in soil and meadow plant growing at various distances from motorway. Environ. Prot. Nat. Resour. 18: 357–363 (in Polish with English summary).
7. Gee Y., Murray P., Hendershot W.H. 2000. Trace metal speciation and bioavailability in urban soils. Environ. Pollut. 107: 137–144.
8. Gworek B., Kwapisz J., Jeske K. 2004. Usability of sequential extraction methods for assess-ment of e�ectiveness of phytoremediation of soil contaminated with copper and lead. Rocz. Glebozn. 55 (1): 135–143.
9. Gworek B., Mocek A. 2003. Comparison of sequential extraction methods with reference to zinc fractions in contaminated soils. Pol. J. Environ. Stud. 12(1): 41–48.
10. Gworek B., Mocek A., Kondzielski I. 2006 Speciation of copper in industrially polluted soils – a comparison of two sequential extraction methods. Pol. J. Environ. Stud. 15(2a): 295–303.
11. IUSS Working Group WRB. 2007. World References Base for Soil Resources 2006. Update 2007, World Soil Resources Reports, 103, FAO, Rome.
12. Kabała C., Singh B.R. 2006. Distribution and forms of cadmium in soils neat a copper smelter. Pol. J. Environ. Stud. 15(2a): 90–97.
SOILS OF TRAFFIC AREAS IN WARSAW

TECHNOGENIC SOILS OF POLAND 228
13. Kabata-Pendias A., Pendias H. 1999. Biogeochemistry of Trace Elements. Wtd. Nauk. PWN, Warsaw (in Polish).
14. Kalembasa D., Pakuła K. 2006. Fractions of zinc and copper in the forest Luvisols of South Podlasie Lowland. Pol. J. Environ. Stud. 15(2a): 98–103.
15. Kirkham M.B. 2006. Cadmium in plants on polluted soils: e�ects of soil factors, hyperaccu-mulation, and amendments. Geoderma 137: 19–32.
16. Klimowicz Z., Melke J. 2000. The content of heavy metals in soils in the vicinity of tra¨c roads using chosen stretches of road as examples. Rocz. Glebozn. 51 (3/4): 37–46 (in Polish with English abstract).
17. Kozanecka T., Czarnowska K., Kwasowski W. 2000. Accumulation of heavy metals in the soils near petrol stations in Warsaw. Rocz. Glebozn. 51 (1/2): 73–78 (in Polish with English summary).
18. Kozanecka T., Czarnowska K., Brogowski Z., Kwasowski W. 2006. Content of microelements in selected herbs from natural meadows. Pol. J. Environ. Stud. 15(2A): 385–389.
19. Kozanecka T., Chojnicki J., Kwasowski W. 2002. Content of heavy metals in plant from pollu-tion-free regions. Pol. J. Environ. Stud. 11(4): 395–399.
20. Kwasowski W., Chojnicki J., Kozanecka T. 2012. Determination of cadmium content in selected vegetative organs of patatoes (Solanum tuberosum) growing in the vicinity of Warsaw-Poznań speedway. Progress in Environmental Science, Technology and Management: Volume 2 – Heavy metals in the environment. Maralte B.V. Leiden, The Netherlands: 187–192.
21. Kwasowski W., Chojnicki J., Okołowicz M., Kozanecka T. 2000. Heavy metals content in standard soil plots of Puszcza Biała forest. Rocz. Glebozn. 51 (3/4): 85–95 (in Polish with English summary).
22. Kwasowski W., Chojnicki J., Falfus K. 2010. Fractions and mobility of zinc, copper, lead in the intensively cultivated luvisols of the Błonie-Sochaczew plain. Rocz. Glebozn. 61 (3): 75–86.
23. Kwasowski W., Oktaba L. 2011. Evaluation of zinc and lead content in selected organs of wheat growing in vicinity of the main road Warsaw-Poznań. Environ. Prot. Nat. Resour. 48: 498–507 (in Polish with English summary).
24. Kwasowski W., Markiewicz M. 2007. Content of heavy metals in soils nearby the accumulatory factory in Piastów. Zesz. Probl. Post. Nauk Roln. 520: 531–537 (in Polish with English abstract).
25. Kwasowski W., Michalak D., Kozanecka T. 2006. Bioaccumulation of microelements in selected plants of the undergrowth in Kampinos National Park. Pol. J. Environ. Stud. 15 (2A): 398–402.
26. Lee P.K., Touray J.C., Baillif P., Ildefonse J.P. 1997. Heavy metal contamination of settling particles in a retention pond along the A-71 motorway in Sologne, France. Sci. Total Environ. 201: 1–15.
27. Lu Y., Gong Z., Zhang G., Burghardt W. 2003. Concentrations and chemical speciations of Cu, Zn, Pb and Cr of urban soils in Nanjing, China. Geoderma 115: 101–111.
28. Regulation of the Minister of the Environment dated September 9, 2002 on soil and land quality standards (Journal of Laws No. 165, item 1359, October 4, 2002).
29. Salbu B., Krekling T., Oughton D.H. 1998. Characterization of radioactive particles in environ-ment. Analyst 123: 843–849.
30. Tack F.M., Verloo M.G.1995. Chemical speciation and fractionation in soil and sediment heavy metal analysis: a review. Int. J. Environ. Anal. Chem. 59: 225–238.
W. KWASOWSKI

229 TECHNOGENIC SOILS OF POLAND
31. Tessier A., Cambell P.G.C., Bisson M. 1979: Sequential extraction procedure for the speciacion of particular trace metals. Anal. Chem. 51: 844–850.
32. van Reeuwijk L.P. 2006. Procedures for soil analysis. 7th Edition. Technical Report 9, ISRIC – World Soil Information, Wageningen, Netherlands.
33. Viard B., Pihan F., Promeyrat S., Pihan J.C. 2004. Integrated assessment of heavy metal (Pb, Zn, Cd) highway pollution: bioaccumulation in soil, Graminaceae and land snails. Chemosphere 55: 1349–1359.
34. Właśniewski S., Hajduk E. 2012. The accumulation of cadmium in soils and selected vegeta-bles cultivated in the allotment gardens of Rzeszów. Rocz. Glebozn. 63 (1): 55–60 (in Polish with English summary).
35. Wójcikowska-Kapusta A., Niemczuk B. 2009. Copper speciation in di�erent-type soil pro-files. J. Elem. 14(4): 815–824.
SOILS OF TRAFFIC AREAS IN WARSAW


MINING AREAS
PART IV


233 TECHNOGENIC SOILS OF POLAND
13 POST-MINING SOILS IN ŁĘKNICA REGION
ANDRZEJ GREINERT MICHAŁ DRAB JAKUB KOSTECKI RÓŻA FRUZIŃSKA
Introduction
The contemporary world is characterised by a dynamic spatial increase in anthropo-genically transformed lands (Greinert 1988; Greinert et al. 2009; Hüttl 1998). One of the many forms of soils transformation is multifactorial post-mining land degradation being a result of opencast extraction of lignite. In several places around the world, power generation from lignite is a very important element of energy security. The problem limiting the lignite exploitation is the necessity to transform large areas. Their reclama-tion is always di�cult and costly because of the unfavourable composition of the overlay material. Lignite in operating areas is covered by very diverse overburden materials, which during the extraction of the former are deposited in heaps. The type of overburden material substantially alters the usage characteristics of a post-mining site. Against this background, areas covered with sandy soil with a high content of pyrite are particu-larly disadvantageous (Greinert 1988; Greinert et al. 2009; Krzaklewski et al. 1997). Iron sulphides are typical components of overburden grounds but they occur in di�erent amounts. In di�erent locations, the content of pyrite in lignite has been reported as ranging from traces to several per cent (Koukouzas et al. 2010; Thakur et al. 2010). Zim-mer et al. (2005) reported the content of pyrite at 59.9 mol·m-3 in heap sediments of post-mining East German areas (geologically the same formation as in the region of Łęknica). It is a high value compared to other deposits, even in Germany – the heap sediment content of pyrite in the Rhineland Lignite Mine Area was estimated at 17.7 mol·m-3 (Wisotzky, Obermann 2001). Pyrite accumulated in the surface layers of the post-mining soil is oxidized, which results in the formation of iron sulphate forms (Stumm, Morgan 1996):

TECHNOGENIC SOILS OF POLAND 234
A. GREINERT, M. DRAB, J. KOSTECKI, R. FRUZIŃSKA
2FeS2 + 7O2 + 2H2O � 2Fe2+ + 4SO42- + 4H+ chemical reaction
Thiobacillus ferrooxidans4Fe2+ + O2 + 4H+ � 4Fe3+ +2H2O microbiological reaction
Fe3+ + 12H2O � 4Fe(OH)3 + 12H+ chemical reactionAcidithiobacillus
FeS2 + 14Fe3+ + 8H2O � 15Fe2+ + 2SO42- + 16H+ microbiological reaction
Hüttl (1998) pointed out the adverse consequences of the pyrite-rich land proper-ties, including a drastic reduction in pH and salinity increase, as well as heavy metal mobility. Uhlmann et al. (2000) reported a major problem for ground and surface waters connected with a high content of soluble Fe and Mn compounds in the ground material, especially in the conditions of intense erosive phenomena. According to Mohan and Chander (2006), the problem of acidification induced by pyrite oxidation is important for most of the abandoned American mines, resulting in pollution with heavy metals of more than 23 000 km of rivers and streams. A high concentration of Fe2+ ions in the soil solution suppresses the plant uptake of other, mostly divalent ions: Ca, Co, Cu, Mg, Mn, Ni, Zn (Hooda 2010; Kabata-Pendias, Pendias 2001). High Fe concentrations are known to cause P deficiency. Symptoms of K deficiency could also be associated with Fe toxic content (Kabata-Pendias, Pendias 2001).
Study area and soil profile documentation
The research area is located in Poland in the southern part of the Lubuskie Province, in the village of Nowe Czaple, near the town of Łęknica (Muskau Embankment, within the western part of Saxony-Lusatian Lowlands acc. to Kondracki 1988) in the area of the former lignite mine ‘Przyjaźń Narodów’ (‘Friendship of Nations’) – Fig. 1.
Muskau Embankment, also called the Muskau Arch, is a morphological horseshoe-shaped elevation open towards the north. It is a result of glacier activity moving down the Pre-Neisse valley and the ice-sheet of the Saalian glaciation. The Muskau Arch is a piled-up moraine belt, raised to 153 m a.s.l. The glacier moving from the north lifted and folded the Tertiary and early Pleistocene sediments. This activity resulted in uplifting of coal beds originally deposited at great depths amongst various raw materials, including coal, quartz sands and ceramic clays up to the surface, which facilitated its excavation. Deposits of lignite on the Polish side of the Muskau Arch form the ‘Babina’ deposit. These are narrow forms, sometimes stretching for several kilometres. The ‘Babina’ lig-nite bed is built of several groups of lignite, but due to the thickness of layers, only a few of them are of economic importance: ‘Łużycki I’ (called the ‘Henry’ deck – the upper Miocene) and ‘Łużycki II’ (called ‘Ścinawski’ deck – the middle Miocene) (Wróbel 1985).
The research objects were located on the external waste dump of the mine. Its tech-nical reclamation was carried in 1976–1980.

235 TECHNOGENIC SOILS OF POLAND
POST-MINING SOILS IN ŁĘKNICA REGION
Because of the insu�cient reclamation results (loss of trees, even above 50% in some areas; extreme complex malnutrition symptoms), the decision was made in 1986 to improve the site on the basis of a field experiment. Two experimental objects have been established and marked as: ‘A’ (51°33’45” N, 14°46’25” E) – with 6 year-old Scotch Pine, and ‘B’ (51°33’50” N, 14°46’48” E) – with 2-year-old Scotch Pine (Fig. 1).
Fig. 1. The research objects in the post-mining area in Łęknica locality
Di�erent fertilization combinations were used at the plots (A1 to A10 and B1 to B10):
1 – control, without fertilization (0)2 – magnesium lime 8 Mg·ha-1 (0 + Ca)3 – N – 100, P2O5 – 70 kg·ha-1 (NP)4 – N – 100, K2O – 160 kg·ha-1 (NK)5 – N – 100, P2O5 – 70, K2O – 160 kg·ha-1 (NPK)6 – N – 200, P2O5 – 140, K2O – 320 kg·ha-1 (2NPK)7 – magnesium lime 8 Mg·ha-1, N – 100, P2O5 – 70 kg·ha-1 (NP + Ca)8 – magnesium lime 8 Mg·ha-1, N – 100, K2O – 160 kg·ha-1 (NK + Ca)9 – magnesium lime 8 Mg·ha-1, N – 100, P2O5 – 70, K2O – 160 kg·ha-1 (NPK + Ca)
10 – magnesium lime 8 Mg·ha-1, N – 200, P2O5 – 140, K2O – 320 kg·ha-1 (2NPK + Ca).
Lime was used once in November 1986. Nitrogen (ammonia nitrate), phosphorus (simple dusty superphosphate) and potassium (potash salt 50%) were used as fertiliz-ers in di�erent experimental combinations, and were applied in the first three months of 1986. Each of the plots had a size of 35x8 m (280 m2). The growth and overall state of plants, as well as changes in the soil profiles were closely monitored.

TECHNOGENIC SOILS OF POLAND 236
To reconstruct the initial situation, i.e. after evaluation of land levelling, neutraliza-tion of the surface layers and phosphoric fertilization, soil samples were collected in 1985 (before the experiment) using Kopecky cylinders as to represent the disturbed and undisturbed structure. In 2010, samples were collected from soil profiles located at each plot of both experimental objects as representative for plots and soil horizons (layers).
Soil samples were air dried (35oC) and then passed through a 2-mm sieve. Particle size distribution was determined using the hydrometric and sieve methods. The pH was measured in H2O and 1M KCl (soil:water ratio 1:2.5) with a WTW SenTix 41 glass elec-trode. Bulk density was determined by weight in Kopecky cylinders. Hydrolytic acidity (HA) and total exchangeable base content (TEB) were determined using the Kappen method. Cation exchange capacity (CEC) and base saturation (BS) were mathematically calculated: CEC = HA + TEB; BS = (TEB /CEC)·100% (Mocek et al. 2006). Total content of elements in soil samples was determined by the atom absorption spectrometry meth-od (AAS FL) after combustion in a mu·e furnace at a temperature of 550°C and dilu-tion when hot in a mixture of concentrated acids HCl:HNO3 in the proportion of 3:1 – aqua regia (ISO 11466, 1995). The content of potentially available elements was determined with the atom absorption spectrometry (AAS FL) after extraction of air-dried soil samples in 0.1 mol·dm-3 HCl (Page et al. 1982). Fiszman et al. (1984) described this form as the most closely related to the amount of metals bound by amorphous oxides and carbonates, organic matter and resistant crystalline Fe hydroxides. Identifi-cation of this form using the spectrometry method (AAS FL) indicates the possibility of elements transport in the soil-water-plant system in fertilized areas. The content of available phosphorus and potassium was determined by the Egner-Riehm method (Riehm 1958).
The content of total organic carbon (OC) was estimated using a NDIR Shimadzu TOC-VCSN analyser with a SSM 5000A adapter. Total nitrogen (Nt) content was analysed ap-plying the standard Kjeldahl method and a Gerhardt-Vapodest VAP 30 analyser.
The results were statistically analysed by calculating the descriptive statistics (min-imum, maximum, arithmetic mean, standard deviation) applying the procedures and linear correlation according to Rudnicki (1991) and Drab (2007), using Statsoft Statistica 10.
A. GREINERT, M. DRAB, J. KOSTECKI, R. FRUZIŃSKA

237 TECHNOGENIC SOILS OF POLAND
Profile 1
Location: Post-mining area,
Nowe Czaple near Łęknica, Western Poland
Coordinates: 51°33’45” N
14°46’25” E
Soil classification (WRB 2007): Spolic Technosol (Thionic)
C1 – 0–30 cm: overburden material, loamy sand, light grey, compacted, slightly moist, pieces of lignite; 5%), increased pH due to liming, gradual boundary.
C2 – 30–50 cm: overburden material, loamy sand, light brownish grey, compacted, slightly moist, pieces of lignite (5%), influence of liming, gradual boundary.
C3 – 50–80 cm: overburden material, loamy sand, light yellowish brown, compacted, slightly moist, pieces of lignite (5%), strong acid material, gradual boundary.
C4 – 80–200 cm: overburden material, sand, light brownish grey, compacted, slightly moist, strong acid material.
POST-MINING SOILS IN ŁĘKNICA REGION
0 cm
50 cm
100 cm
150 cm

TECHNOGENIC SOILS OF POLAND 238
Table 1. Selected soil properties – profile 1
HORIZON C1 C2 C3 C4
DEPTH [cm] 0–30 30–50 50–80 80–200
PARTICLE SIZE DISTRIBUTION [%]
>2 mm 10 11 11 < 1
2 mm–50 µm 83 79 84 93
50–2 µm 11 15 10 6
<2 µm 6 6 6 1
TEXTURE CLASS (USDA) loamy sand loamy sand loamy sand sand
SOIL MATRIX COLOUR
drymoist
2.5Y 7/12.5Y 5.5/3
2.5Y 6/22.5Y 5/4
2.5Y 6/32.5Y 4/4
2.5Y 6/22.5Y 5/4
BULK DENSITY [g·cm-3] 1.27 1.24 1.38 1.40
OC [%] 3.45 3.43 3.56 0.17
Nt [%] 0.06 0.06 0.04 n.d.
C:N 58 57 89 –
pHin H2O 6.7 5.2 3.9 3.5
in 1M KCl 5.8 4.7 3.4 3.2
HA [cmol·kg-1] 6.9 6.9 10.3 3.7
TEB [cmol·kg-1] 4.9 3.5 1.2 0.2
CEC [cmol·kg-1] 11.8 10.4 11.5 3.9
BS [%] 42 34 10 5
TOTAL CONTENT OF SELECTED MACROELEMENTS
P [mg·kg-1] 60 65 60 30
K [mg·kg-1] 1224 1312 1312 1100
CONTENT OF PLANT-AVAILABLE MACROELEMENTS
P [mg·kg-1] 24.4 10.0 18.0 17.5
K [mg·kg-1] 17.8 13.0 13.0 13.0
METALS EXTRACTED WITH 0.5M HCl
Mg [mg·kg-1] 126 33 6 2
Fe [mg·kg-1] 32 18 48 44
Zn [mg·kg-1] 18 6 8 6
A. GREINERT, M. DRAB, J. KOSTECKI, R. FRUZIŃSKA

239 TECHNOGENIC SOILS OF POLAND
Profile 2
Location: Post-mining area,
Nowe Czaple near Łęknica, Western Poland
Coordinates: 51°33’45” N
14°46’25” E
Soil classification (WRB 2007): Spolic Technosol (Thionic)
Oi – 3–0 cm: forest litter, slightly decomposed.
(A) – 0–3 cm: initial humus horizon, loamy sand, dark grey, unclear boundary.
C1g – 3–22 cm: overburden material, loamy sand, light greenish grey, loose, slightly moist, gradual boundary.
C2 – 22–145 cm: overburden material, loamy sand, reddish grey, normally consolidated, slightly moist, lignite additives, gradual boundary.
C3 – 145–200 cm: overburden material, loamy sand, grey, normally consolidated, slightly moist, abundant lignite additives.
POST-MINING SOILS IN ŁĘKNICA REGION
0 cm
50 cm
100 cm
150 cm

TECHNOGENIC SOILS OF POLAND 240
Table 2. Selected soil properties – profile 2
HORIZON Oi (A) C1g C2 C3
DEPTH [cm] 3–0 0–3 3–22 22–145 145–200
PARTICLE SIZE DISTRIBUTION [%]
>2 mm – – – – –
2 mm–50 µm – 85 86 86 86
50–2 µm – 10 9 8 9
<2 µm – 5 5 6 5
TEXTURE CLASS (USDA) – loamy sand loamy sand loamy sand loamy sand
SOIL MATRIX COLOUR
drymoist
––
5YR 4/15YR 2.5/2
5G 7/15G 6/1
5YR 5/25YR 3/1
2.5Y 5/12.5Y 4/2
BULK DENSITY [g·cm-3] 1.17 – 1.38 1.38 1.40
OC [%] 24.9 2.53 1.28 3.90 1.90
Nt [%] 1.06 0.137 0.073 0.067 0.075
C:N 23 18 17 58 25
pHin H2O 4.8 4.8 3.5 3.4 3.4
in 1M KCl 4.0 4.2 3.1 3.0 3.0
HA [cmol·kg-1] 22.0 9.6 10.0 13.6 13.6
TEB [cmol·kg-1] 9.6 4.4 1.6 1.6 2.2
CEC [cmol·kg-1] 31.6 14.0 11.6 15.2 15.8
BS [%] 30 31 14 11 14
TOTAL CONTENT OF SELECTED MACROELEMENTS
P [mg·kg-1] 444 108 22 28 18
K [mg·kg-1] 1440 1160 1250 940 970
CONTENT OF PLANT-AVAILABLE MACROELEMENTS
P [mg·kg-1] 65 14 16 3 2
K [mg·kg-1] 152 22 16 15 11
METALS EXTRACTED WITH 0.5M HCl
Mg [mg·kg-1] 549 330 337 177 177
Fe [mg·kg-1] 1204 744 456 1820 798
Zn [mg·kg-1] 92 90 2 3 4
A. GREINERT, M. DRAB, J. KOSTECKI, R. FRUZIŃSKA

241 TECHNOGENIC SOILS OF POLAND
Properties of post-mining soils
The land consists mainly of Miocene sands with an admixture of brown coal, pyrite, marcasite, and small amounts of mica (Skawina 1971; Wróbel 1985). The overburden material is characterised by an uneven distribution of components. The texture class of the studied samples was sand to sandy loam, with a varied quantity of silt and clay fractions. In terms of physical properties, also the gravel content di�erentiation deter-mined in the mass of soil is important. Bulk density of the collected mineral soil sam-ples varied from 1.25 to 1.40 g·cm-3 (Tables 1 and 2) and air capacity from 0.7 to 25.7%. Water volume of less than 30% by weight was found in the dump mass (the range from 20.0 to 32.8% by weight). Because of the biological oxidation of pyrite, the soils were being constantly acidified. The pH values frequently dropped below 4.0. The content of soil organic matter varied from 0.17 to 24.9%. Sandy texture and relatively low abun-dance of organic matter (mainly in the form of brown coal crumbs) resulted in the weak sorption properties of the soil parent material (C horizons). Special attention should be paid to relatively high hydrolytic acidity (3.7–13.6 cmol·kg-1) and low base saturation (5.1–41.9%). Some soil properties were changed after liming, however, this was ob-served only in layers of max. 20–30 cm below the soil surface (Profile 1, Table 1). Profile 1 was typical for the post-mining sites out of the described reclamation objects.
After 30 years of soil formation (profile 2), the following horizons were observed: organic (Oi; 3–0 cm), humus (A; 0–3 cm) and parent material with gleyic properties (C1g; 3–22 cm) covering the morphologically and chemically modified C2 horizon (22–145 cm), beneath which the C3 horizon was found, unchanged with respect to the input ground (Profile 2). The presence of the C1g horizon directly below the thin humus horizon was a characteristic feature. It was a typical consequence of the use of heavy machines during the reclama-tion work (Table 2).
After 30 years from the beginning of reclamation, these soils should still be classi-fied as Technosols (IUSS Working Group WRB 2007). However, according to Polish Soil Classification (Commission V on Genesis, Classification and Cartography of Soils PSSS 2011), they can be described as initial industriogenic soils (AIin) within the order of an-thropogenic soils.
Reclamation of post-mining grounds in Łęknica locality
The brown coal mine ‘Przyjaźń Narodów’ was located in an area of 479 ha. By 1966, the mine had technically reclaimed about 30 ha in the post-mining areas from the years of 1940–1944. In 1968, a conceptual project was prepared for reclamation of 434 ha post-mining area of. Two main directions of land development were adopted:
— forests in areas of external and internal dumps, within the boundaries of excava-tions and in auxiliary lands adjacent to the excavations;
POST-MINING SOILS IN ŁĘKNICA REGION

TECHNOGENIC SOILS OF POLAND 242
— water in the recesses of final excavations, in areas of former deposits mined by opencast extraction.
The reclamation was carried out in 1976–80. The basic reclamation phase comprised: formation of dumps (slopes were formed 1:4 and ditches were dug 1:3), levelling of the surface and neutralisation of toxic acid formations (50 Mg·ha-1 (30+20) of waste magne-sium lime from the steelworks ‘Miasteczko Śląskie’, fertilised with a dose of 5 Mg·kg-1 of ground phosphate rock). In order to eliminate the results of mining activities, earth piles were to be relocated from the boundaries to excavations, up to the level which made bio-logical regeneration possible. Detailed reclamation consisted in the enrichment of land reclaimed with basic fertilising components and the introduction of plants – one or two year old trees, i.e. common pines only or common pines and aspens, and in certain areas − common pines, red oaks, European white birches and black alders. The a�orestation took place in highly diverse areas, including those with toxic properties – pH of 3–4. Neutral-isers and enriching mineral fertilisers were not used in all the areas. As a result of strong water erosion, trees on the slopes were seriously damaged. Those growing at the bottom of the excavations were covered with sand coming from the slopes (Fig. 2).
Fig. 2. New plants are being covered by materials coming down from the slopes as a result of erosion (1985)
In 1985–1987, new reclamation technology was developed and applied as a field experi-ment, which was partly based on the reclamation model of the Polish Academy of Sciences. It involves strong stimulation of primary soil forming processes by agricultural engineering and large doses of NPK. A detailed description of the work is included in the section ‘Study area and soil profile documentation’.
A. GREINERT, M. DRAB, J. KOSTECKI, R. FRUZIŃSKA

243 TECHNOGENIC SOILS OF POLAND
Early e�ects of reclamation works
Unlike compact formations – clays and silts, in the reclamation of which physical and water properties play a key role, clay sands of the dumping ground in Łęknica are less of a problem in this case. In the in situ observations, the hydrophobicity of the material in a dry, rainless period should be accounted for, which results in more severe surface wa-ter erosion in the initial stage of rainfall. Krzaklewski et al. (1997) also observed this problem. The bulk density of the soil forming material at the dumping grounds is about 0.1–0.2 g·cm-3 lower than in the cultivated land of similar texture (Dobrzański, Zawadz-ki 1993). The water capacity corresponds to an average value for sandy soils. A rela-tively low surface capacity of the formation under research should be accounted for, which results from both the lack of structure in the dump material and levelling of the soil with heavy machines used during reclamation.
At the beginning of the experiment, e�ects of additional liming and application of the fertilisers were observed. The pH values in the surface layer significantly increased (from 3–4 to about 7) together with the base saturation (BS) (from about 2 to over 80% in the first three years and 50% in the following years). Based on the assessment meth-od presented by Dobrzański, Zawadzki (1993), pH values were very low in three fields (A-5, A-6b and B-10b), the reaction was acid in nine fields (A-2, A-3, A-4, A-6a, A-7, B-4, B-8, B-9, B-10a), slightly acid in other nine fields (A-1, A-8, A-9, A-10a, B-1, B-3, B-5, B-6a, B-7) and neutral in three fields (A-10b, B-2, B-6b). In none of the experimental plots the pH values were too low to prevent the growth of pines, which was corrobo-rated by other authors (Baule, Fricker 1971).
The initial abundance of the studied dumping areas was very low. Because of the reclamation fertilisation, it was possible to increase the amount of phosphorus availa-ble to plants, applying the Egner-Riehm method. Nonetheless, even with additional NPK fertilisation, the assessed amount of this form of phosphorus was low in object ‘A’ in five combinations, and in object ‘B’ in eight experimental plots. The analysis of the distribution of these forms of phosphorus in the soil profiles showed that the largest quantity of this element had been accumulated in 5 cm, and partially also at a depth of 5–10 cm. The content of dissolved iron indicates an uneven distribution, both on the surface (between particular fields of the experimental objects) and in the soil profiles. This reflects the di�erences in the post mining dumps, and also their di�erent proper-ties modifying the solubility of Fe (pH, potential, redox). A similar analysis can be per-formed in the case of zinc, the content of which in the surface layers of the dumping grounds also increased after neutralisation and additional liming.
POST-MINING SOILS IN ŁĘKNICA REGION

TECHNOGENIC SOILS OF POLAND 244
Fig. 3. Herbaceous plants dominated over pine cuttings in the first phase of the experiment (1986)
In fields No. 3 to 10, fertilised with nitrogen, herbaceous plants appeared between the rows of trees. In the first years, herbaceous plants literally competed with the com-mon pine trees (Fig. 3), and this induced the accumulation of organic matter in the surface of the land being reclaimed. The plants rooted in the 0–10(15) cm layer improved the structure of the soil surface and protected it against erosion. In the first three years, the growth of pine treetops was 40.2–46.2 cm in the plot fertilised with NPK compared to 34.4 cm in the control plots (A-1, B-1) and 24.8 cm in the control plot with liming (A-2, B-2). The di�erences in the growth intensity started to disappear four years after the beginning of the experiment, which is typical of young, densely planted trees.
Long-term e�ects of reclamation work
Thirty years after the completion of basic reclamation, and in the 25th year of the experi-ment (2010), the post-mining area was considerably changed. The pines planted densely during the biological reclamation started to play a dominant role in the development of soil. Nevertheless, there are still di�erences between particular experimental fields, and the e�ect of the initial high mineral fertilization is still apparent. The average annual growth in the whole period of the experiment for both experimental objects in the control plots was 53 cm per year for older trees (object ‘A’), 51 cm per year for younger trees (object ‘B’), and up to 65 cm per year in the NPK fertilised plot. The highest growth was found in the plot where 100 kg N, 70 kg P2O5 and 160 kg K2O·ha-1 was applied.
A. GREINERT, M. DRAB, J. KOSTECKI, R. FRUZIŃSKA

245 TECHNOGENIC SOILS OF POLAND
The trees in the study area were of the same height until the cutting conducted in 2009–2011, which was followed by the occurrence of low trees and bushes (Fig. 4). The composition of the groundcover considerably changed after the canopy of trees had shaded the ground. At the planting stage, it consisted of di�erent species of grass and herbs, which could be referred to as ruderal plants, and in 2010–2012, plants character-istic of coniferous forests started to dominate. The common moss (Entodon Schreberi (Wildt.) MNKM) dominated, covering from 20 to 50% of the ground surface. Also com-mon heather (Calluna vulgaris L.), self-sown common pines (Pinus sylvestris L.), aspens (Populus tremula L.) and black locusts (Robinia pseudoacacia L.) occurred. Plants abun-dant at the beginning of the pine growth were represented by scarce bushgrass (Calamagrostis epigeios (L.) Roth) and browntop (Agrostis vulgaris With.).
As evidenced by pH measurements performed in 2010 at each experimental plot, the soil reaction remained acid. The organic horizon developed in the top part of the profiles was characterised by acid and strong acid reaction, typical of coniferous forest groundcover. Thirty years after deacidification to pH-H2O of ca. 7 (performed in 1980), pH-H2O values of the organic matter, situated now beneath the groundcover, ranged from 4.4 to 6.0. The pH values of bedrock layers ranged within 3.3–4.0. Based on the analysis of the dump material performed in 2010, it can be concluded that changes in pH occurring after liming applied during the reclamation and preparation of the experi-mental fields were not permanent under the described development.
The sorption complex of the humus horizons was characterised by secondary acidity, which is indicated by a decrease in the content of basic cations by 10–30% (from about 50% in 1986 to 20–40% in 2010).
Fig. 4. Trees in experimental field A-5 in 2013 after clearing (2013)
POST-MINING SOILS IN ŁĘKNICA REGION

TECHNOGENIC SOILS OF POLAND 246
Accumulation of soil organic carbon is one of the most important processes during the soil formation. Total organic carbon content in the described post-mining Techno-sols was a�ected by fertilizer combinations. In the litter layer of the limed plots NPK + Ca and 2NPK + Ca, the total organic carbon content was lower than in NPK and 2NPK (11.5 vs. 12.8% and 10.7 vs. 12.1%, respectively). Plots with NPK fertilization had higher values of TOC compared to most fertilized plots, e.g. the average TOC in unlimed plots NPK and 2NPK – 12.4% vs. the average TOC for other unlimed plots 1–9.8%. There were no significant di�erences in TOC between two mineral top layers. Using the formula of Shrestha and Lal (2011), the accumulation of organic carbon in the forest litter and in the layer directly beneath the litter has been calculated separately for the limed and unlimed plots. Limed plots accumulated 2.29 kg C·m-2 in the litter layer and 0.68 kg C·m-2 in the mineral horizon beneath. For the unlimed plots, the accumulation of C amounted to 3.43 kg·m-2 in the litter layer and 0.68 kg·m-2 in the mineral horizon beneath. The intensity of organic matter accumulation on the reclaimed land depended on the age of woods. On the reclaimed land surrounding Bärenbrück, the new litter accumulation in the area with 19-year-old pine trees was estimated at 1.7–2.1 kg C·m-2, and on the sur-face with 37-year old pine trees − at 4.1 kg C·m-2 (Fettweis et al. 2005). The authors re-ported 7.1 kg C·m-2 deposition in the natural environment under the 95–year old pine trees. Higher accumulation of coniferous litter was observed in the plots with complete NPK fertilization and doubled NPK fertilization compared to other fertilizer combina-tions and the control. Paul et al. (2002) and Johnson (1992) indicated that NPK applica-tion to forest areas increases the C accumulation in soil by increasing the growth and litter production both above and below ground (Gilewska et al. 2001; Paul et al. 2002; Pietrzykowski, Krzaklewski 2007). In the Reclamation Model of the Polish Academy of Sciences (PAS), N-fertilizing is considered the most important factor. According to Lal (2005), many forest ecosystems are nitrogen limited and an increase in N supply can enhance the C accumulation in soils. One of the main e�ects of the reclamation pro-cesses is a systematic increase in the pedogenic carbon content in the soil in the form of humus (Shrestha, Lal 2006). Soil rehabilitation brings changes related to soil structure, as well as its physicochemical and biological properties. Consequently, a soil profile develops that is typical of certain soil-forming factors (van Breemen, Buurman 1998). Carbon accumulation in the topsoil is subsequent to the advantage of humification over mineralization processes, which is characterised by periodical fluctuations caused by transformation of the soilless ground into soil carbon storage (Smith et al. 2009).
As expected, the highest content of total nitrogen (0.34–1.23%) was found in the topsoil (0–3 cm). Samples taken from deeper levels had a high content of TN (0.02–0.15%). Whereas, the content of TN in the dump material increased compared to the initial content, as a result of the experiment. The C:N ratio in parent rock (C) was much higher (2–33:1) compared to topsoil (even higher than 50:1). Apart from the C:N ratio, the dynamics of changes in nitrogen and phosphorus in the decomposing plant matter is
A. GREINERT, M. DRAB, J. KOSTECKI, R. FRUZIŃSKA

247 TECHNOGENIC SOILS OF POLAND
described by the C:P ratio (Gonet et al. 2007). According to Fotyma et al. (1987), Dziadowiec (1990), Jurcowa (1990) and Takeda (1998), the ratio of carbon to phosphorus of about 200–300:1 is most conducive to the mineralisation process. The range of the C:P ratio in the soils under study was very wide and much varied. It was dependant on the depth from which the samples were taken, fertilisation variants and the location of the ex-perimental plots. The widest range of the C:P ratio was found in the samples taken from the surface layers. The maximum value for object ‘A’ – 1270 was found in profile A-4, in the 0–3 cm layer, the minimum – 72 in profile A-1 in the 8–15 cm layer. The maximum value for object ‘B’ was 1400, found in profile B-0, in the 0–2 cm layer, the minimum − 5 in profile B-5, in the 25–50 cm layer. In general the content of phosphorus in the soils under study was low. A similar conclusion should be applied to the content of magnesium. The content of elements in the soil profiles reflected a typical conse-quence of land being covered with forest, where elements are biologically accumulated, and then deposited on the soil surface in the groundcover which slowly decomposes. A relatively low rate of this phenomenon was also corroborated by Šourkova et al. (2005). Rock layers, deposited at a small depth beneath the land surface, have remained relatively unchanged since the beginning of the reclamation.
Reclamation as a soil-forming process
The phenomena occurring in the soils of post-mining sites are very important in terms of possible reclamation of a land after lignite exploitation. Post-mining areas signifi-cantly increased both in Europe and on other continents, which largely results from the nature of extraction. Many of the former coal mining sites have unfavourable properties of soil, inhibiting the biological colonisation and occurrence of soil-forming processes (Greinert et al. 2009). The identification of phenomena occurring in the thus formed land may contribute to the establishment of e�ective remediation technologies, which still remains an unsolved problem. The presence of pyrite and marcasites (FeS2) in the reclaimed post-mining ground is extensively described as one of the most important problems. Many authors confirm that pyrite pats (nodules) can persist in mine soils for decades due to their resistance to weathering (Schaaf, Hüttl 2006; Horbaczewski 2010). The observations of physicochemical properties of the described soils support this the-sis. It should be emphasized that even large lime doses (50 Mg·ha-1 + 8 Mg·ha-1 in plots A,B-7-10), applied as an element of reclamation treatments, were not su�cient for a satisfactory long-term e�ect. In fact, the pH value of post-mining grounds rapidly de-creases and is said to be as quick as 5 to 10 years after the liming process. Thirty years after the reclamation, pH values are similar to the values at the initial point.
At typical sites, pine forests cover poor sandy soils, mainly Podzols. The podzolization process is initiated and sustained by coniferous trees. It appears that 30 years after
POST-MINING SOILS IN ŁĘKNICA REGION

TECHNOGENIC SOILS OF POLAND 248
intensive reclamation treatments is a su�cient time for significant changes in the soil profile morphology. The most important changes in O and A horizons were induced by living organisms. Also the e�ect of mechanical work on the post-mining ground is re-flected in the heterogeneous C horizon. Obviously, at present only the beginning of the soil forming process can be determined. The observed direction of the soil development indicates the possibility of the future podzolization process. The mineral horizon below the initial humus horizon should not be referred to as the eluvial horizon (E) despite its lighter colour. According to Stützer (1998), who described a similar situation, it is not always possible to distinguish the eluvial horizon in the soil under a 30-year-old pine plantation. The author described the presence of the 5–6 cm E horizon in the area under the 40-year old Pinus contorta Dougl. ex Loud. plantation and the 8–10 cm E horizon under 80–100-year old Pinus sitchensis (Bongard) Carrière 1855. In the areas of 80–100-year-old plantations, the author did not observe the presence of illuvial horizon (B), di�erent to bedrock (C). The research of Certini et al. (1998) resulted in the much more far-reaching conclusions. They described a 50-year-old black pine plantation as too young to develop a clearly isolated eluvial horizon in the soil profile composed of loam. According to the aforementioned authors, bright layers found at the bottom of the humus horizon, i.e. 6–8 cm below the surface, were insu�cient to distinguish the eluvial horizon. Targulian and Krasilnikov (2007) described the pedogenic processes as a characteristic chain. Based on their study, the formation of a litter layer takes ten to one hundred years, in-cluding some fast processes (i.e. gleization), and hundreds of years are needed for the advanced organic matter humification. Finally, certain characteristic soil-forming pro-cesses determined by water (i.e. podzolization) take even thousands of years.
Functional problems associated with post-mining soils
The areas presented in the study were covered with pine forest before lignite exploita-tion. At present, forest reclamation is implemented in post mining areas, which is a characteristic procedure in this type of areas in western Poland. A�orestation is recom-mended as an e�cient reclamation method in terms of high biomass production, deep and intensive infiltration and biological activity of soil (Filcheva et al. 2000).
The problem with land reclamation consists in a pine monoculture defined as a tar-get type of forest. This choice seemed natural because of the low use value of the hab-itat. Nevertheless, it should be expected that the plant cover will dominate soil-forming processes, which will lead to podzolization of the soils. This type of soil development should not be preferred in terms of industrial land reclamation. Even in the case of sandy soils, it should be attempted to slow down the podzolization processes by plant-ing di�erent species of trees, including the European white birch, red oak, black alder, aspen and deciduous bushes.
A. GREINERT, M. DRAB, J. KOSTECKI, R. FRUZIŃSKA

249 TECHNOGENIC SOILS OF POLAND
The material constituting the substratum for trees is very liable to erosion and de-flation. The edge surfaces of excavations are particularly exposed to erosion, including the development of deep ravines (Fig. 5). Wind erosion (eolian) occurs simultaneously with water erosion, which results in the formation of dunes. On steep slopes, mass movements occur in the form of landslides.
Nitrogen-rich fertilisation applied after the initial neutralisation of toxic acid soil is the correct anti-erosion measure, because quick development of a dense plant cover is the only possible way to stop the erosion. This was corroborated by the experiment described above (Fig. 4 – no soil erosion symptoms vs. Fig. 5 – outside the experimental area).
According to the contemporary theories, the erosion phenomena could turn the soil back to a nearly initial stage of its development, especially at the early stages of soil formation (Targulian, Krasilnikov 2007). This is particularly evident in the post-mining area under study, where lands prone to strong soil erosion have been virtually un-changed since the dumps were created (Profile 1).
Fig. 5. E�ects of strong water erosion on the surface of a post-mining dump outside the experimental area (2013)
POST-MINING SOILS IN ŁĘKNICA REGION

TECHNOGENIC SOILS OF POLAND 250
Fig. 6. Mushroom-shape forms – a view typical of wind erosion – a dump outside the experimental area (2010)
Summary
Covering the ground with plants is the main mechanism that triggers o� and maintains the soil-forming processes in the post-mining areas with no soil cover. In this case, the establishment of plants is of the same importance as the initiation of soil-forming pro-cesses in the natural environment. In the case of technogenically changed areas, the problem consists in timing of their development. Natural processes form soils during thousands of years or more, whereas the target development of post-industrial areas in Poland (including post-mining areas) has to be completed in 5 years after ceasing their industrial use (Law on the protection of agricultural and forest areas – The Journal of Laws of the Republic of Poland, 2004 No. 121, item 1266, as of 1 January, 2012; article 20, passage 4).
In the case of opencast brown coal mining, the key problem is the quality of the overlay material deposited in the dumps. In the area around Łęknica, there are large quantities of pyrite and marcasite in the overlay. This induces the e�ect of strong acid-ity in the soil up to the phytotoxic level. Intensive liming with the use of large doses of lime is necessary in this type of soil. However, it causes a whole series of negative side e�ects in the form of phosphorus retrogression, or blocks the absorption of cations by plants. Consequently, the growth of plants and the deposition of residual organic mat-ter are smaller. This phenomenon is highly unfavourable to the initiation of soil-form-ing processes, for which the accumulation of organic matter is essential.
Intensive reclamation activities can considerably contribute to faster soil formation in the technogenic landscape. However, spectacular results should not be expected within the time specified by the law, or even in a much longer time. In the situation described
A. GREINERT, M. DRAB, J. KOSTECKI, R. FRUZIŃSKA
251 TECHNOGENIC SOILS OF POLAND
in this chapter, the 30 year-old post-mining area undergoing intensive reclamation is covered with technosols at a very early stage of their development. The direction of further evolution of the soils described is strongly determined by the selected type of land development. The growth of pine forest in the researched post-mining area will probably result in gradual soil podzolization until the formation of typical podzols.
References
1. Baule H., Fricker C. 1975. Fertilization of forest trees. PWRiL Warsaw (in Polish).
2. Certini G., Ugolini F.C., Corti G., Agnelli A., 1998. Early stages of podzolization under Corsican pine (Pinus nigra Arn. ssp. laricio). Geoderma 83: 103–125.
3. Commission V on Genesis, Classification and Cartography of Soils PSSS. 2011. Polish Soil Classification (Systematyka Gleb Polski), 5th edition. Rocz. Glebozn. 62(3): 1–193 (in Polish with English abstract).
4. Dobrzański B., Zawadzki S. (Eds.) 1993. Soil Science. PWRiL, Warsaw (in Polish).
5. Drab M., 2007. Selected problems of mathematical statistics and experimentation in environ-mental engineering. Ofic. Wydawn. UZ, Zielona Góra (in Polish).
6. Dziadowiec H., 1990. Litter decomposition in selected forest ecosystems (mineralization, release of nutrients, humification). Rozprawy. Uniwersytet Mikołaja Kopernika, Toruń (in Polish).
7. Fettweis U., Bens O., Huttl R.F., 2005. Accumulation and properties of soil organic carbon at re-claimed sites in the Lusatian lignite mining district a�orested with Pinus sp. Geoderma 129: 81–91.
8. Filcheva E., Noustorova M., Gentcheva-Kostadinova SV., Haigh M.J., 2000. Organic accumula-tion and microbial action in surface coal-mine spoils, Pernik, Bulgaria. Ecol. Eng. 15: 1–15.
9. Fiszman M., Pfei�er W.C., Drude De Lacerda L., 1984. Comparison of methods used for ex-traction and geochemical distribution of heavy metals in bottom sediments from Sepetiba Bay, R. J. (Brazil). Environ Technol. 5: 567–575.
10. Fotyma M., Mercik S., Faber A. 1987. Chemical basis of soil fertility and fertilization. PWRiL, Warsaw (in Polish).
11. Gilewska M., Bender J., Drzymala S. 2001. Organic matter formation in pot mining soils in central Poland. [In:] D.E. Stott, R.H. Mohtar, and G.C. Steinhardt (Eds.). Sustaining the Global Farm – Selected papers from the 10th International Soil Conservation Organization Meeting, May 24–29, 1999, West Lafayette, IN. International Soil Conservation Organization in coopera-tion with the USDA and Purdue University, West Lafayette, IN: 623–626.
12. Gonet S.S., Dębska B., Zaujec A., Banach-Szott M., Szombathowa N. 2007. E�ect of tree spe-cies, soil and climatic conditions on the properties of forest soil humus. [In:] S.S. Gonet., M. Markiewicz (Eds.). Rola materii organicznej w środowisku. PTSH Wrocław (in Polish).
13. Greinert H., 1988. Properties of soils resulting from the restoration of the lignite post-mining area in the Łęknica locality. Zeszyty Nauk. WSInż. w Zielonej Górze, Zielona Góra 84: 93–104 (in Polish with English Summary).
POST-MINING SOILS IN ŁĘKNICA REGION

TECHNOGENIC SOILS OF POLAND 252
14. Greinert H., Drab M., Greinert A., 2009. Studies of the forest restoration e�ectiveness on the phytotoxic acid Miocene sand dumps in the former lignite mine in Łęknica. Oficyna Wyd. Uni-wersytetu Zielonogórskiego, Zielona Góra (in Polish).
15. Hooda P.S. (Ed.) 2010. Trace elements in soil. A John Wiley and Sons, Ltd., Publication.
16. Horbaczewski J.K. 2010. Weathering of pyrite in mine soils at Gibbons Creek Lignite Mine, Texas. Reclamation matters, American Society of Mining and Reclamation: 7–9.
17. Hüttl R.F. 1998. Ecology of post strip-mining landscapes in Lusatia, Germany. Environmental Science and Policy 1: 129–135.
18. ISO 11466. 1995. Soil quality – Extraction of trace elements soluble in aqua regia using open hot plate digestion technique.
19. IUSS Working Group WRB. 2007. World References Base for Soil Resources 2006. Update 2007, World Soil Resources Reports, 103, FAO, Rome.
20. Johnson D.W. 1992. E�ects of forest management on soil carbon storage. Water Air Soil Pollut. 64: 83–120.
21. The Journal of Laws of the Republic of Poland, 2004, No. 121, item 1266, as of 1 January, 2012; article 20, passage 4.
22. Jurcowa O. 1990. Korenove, a pozberove zvysky rastiln ako sucast bilansie podnej organickej hmoty. Humusowe latky – aktivni slozka systemu puda – rostlina. Praha: 36–41.
23. Kabata-Pendias, A. Pendias H. 2001. Trace elements in soils and plants. CRC Press LLC.
24. Kondracki J. 1988. Physical Geography of Poland, PWN, Warsaw (in Polish).
25. Koukouzas N., Ward C.R., Li Z. 2010. Mineralogy of lignites and associated strata in the Ma-vropigi field of the Ptolemais Basin, northern Greece. Int. J. Coal Geol. 81: 182–190.
26. Krzaklewski W., Kowalik S., Wójcik J. 1997. Reclamation of toxic acid grounds in the lignite mining. Monography. AGH Cracow (in Polish).
27. Lal R., 2005. Forest soils and carbon sequestration. Forest Ecol. Manage. 220: 242–258.
28. Mocek A., Drzymała S., Maszner P. 2006. Genesis, analysis and classification of soils. Wyd. AR w Poznaniu (in Polish).
29. Mohan D., Chander S. 2006. Single, binary, and multicomponent sorption of iron and manga-nese on lignite. J. Colloid Interface Sci. 299: 76–87.
30. Paul K.I., Polglase P.J., Nyakuengama J.G., Khanna P.K. 2002. Change in soil carbon following a�orestation. Forest Ecol. Manag. 168: 241–257.
31. Page A.L., Miller R.H., Keeney D.R. (Eds.) 1982. Methods of Soil Analysis. Part 2. Chemical and Microbiological Methods. American Society of Agronomy/Soil Science Society of America, Madison, WI.
32. Pietrzykowski M., Krzaklewski W. 2007. An assessment of energy e�ciency in reclamation to forest. Ecol. Eng. 30: 341–348.
33. Riehm H. 1958. Die ammoniumlaktatessigsaure-Method zur bestimmung der leichtloslichen phosphorsaure in karbonathaltigen boden. Agrochimica 3: 49–65.
34. Rudnicki F. 1991. Agricultural experimentation. AT-R Bydgoszcz 1991 (in Polish).
A. GREINERT, M. DRAB, J. KOSTECKI, R. FRUZIŃSKA

253 TECHNOGENIC SOILS OF POLAND
35. Schaaf W., Hüttl R.F. 2006. Direct and indirect e�ects of soil pollution by lignite mining. Water Air Soil Pollut. 6: 353–364.
36. Shrestha R.K., Lal R. 2006. Ecosystem carbon budgeting and soil carbon sequestration in reclaimed mine soil. Environ. Int. 32: 781–796.
37. Shrestha R.K., Lal R. 2011. Changes in physical and chemical properties of soil after surface mining and reclamation. Geoderma 161: 168–176.
38. Skawina T. 1971. The scope of application and interpretation of geological surveys for the re-mediation purposes. Ochr. Teren. Górn. 16 (in Polish).
39. Smith P., Falloon P., Kutsch W.L. 2009. The role of soils in the Kyoto Protocol [In:] Soil Carbon Dynamics. An Integrated Methodology. Cambridge University Press, NY, USA, 245–256.
40. Stumm W., Morgan J.J. 1996. Aquatic chemistry. Wiley Interscience, New York.
41. Stützer A. 1998. Early stages of podzolisation in young aeolian sediments, western Jutland. Catena 32: 115–129.
42. Šourková M., Frouz J., Fettweis U., Bens O., Hüttl R.F., Šantručková H. 2005. Development and properties of microbial biomass succession in reclaimed post mining sites near Sokolov (Czech Republic) and near Cottbus (Germany). Geoderma 129: 73–80.
43. Takeda H. 1998. Decomposition processes of litter along a latitudinal gradient [In:] K. Sassa (Ed.) Environmental forest science, Kluwer Academic Press, Dordrecht: 197–206.
44. Targulian V.O., Krasilnikov P.V. 2007. Soil system and pedogenic processes: self-organization, time scales, and environmental significance. Catena 71: 373–381.
45. Thakur O.P., Singh A., Singh B.D. 2010. Petrographic characterization of Khadsaliya lignites, Bhavnagar District, Gujarat. J. Geol. Soc. Ind. 76: 40–46.
46. Uhlmann W., Grünewald U., Gröschke A., Lessmann D., Hemm M., Gockel G., Seidl K. 2000. Hydrogeochemische Entwicklung von Tagebauseen während der Flutung. Prognose und Beo-bachtung im Lausitzer Revier. Aktuelle Reihe 4(1): 78–79.
47. van Breemen N., Buurman P. 1998. Biological processes in soils. [In:] Soil formation. Kluwer Academic Publishers, Dordrecht, The Netherlands: 81–114.
48. Wisotzky F., Obermann P. 2001. Acid mine groundwater in lignite overburden dumps and its prevention – the Rhineland lignite mining area (Germany). Ecol. Eng. 17: 115–123.
49. Wróbel I. 1985. Geological conditions for the soil development in the Zielona Góra region. Prze-wodnik po trasie OKN „Podniesienie produkcyjności gleb lekkich”. Zielona Góra (in Polish).
50. Zimmer U., Wisotzky F., Obermann P. 2005. Abschätzung der Pyritoxidation in einem Braun-kohletagebau mithilfe numerischer Modellrechnungen. Grundwasser – Zeitschrift der Fach-sektion Hydrogeologie 2: 74–82.
POST-MINING SOILS IN ŁĘKNICA REGION


255 TECHNOGENIC SOILS OF POLAND
SOILS OF THE EXTERNAL DUMPING GROUND OF THE BEŁCHATÓW OPEN-CAST LIGNITE MINE
MARCIN ŚWITONIAK PIOTR HULISZ SZYMON RÓŻAŃSKI IZABELA KAŁUCKA
14
Introduction
Opencast mining causes major transformations in the natural environment through i.a. disturbance of geological structure, modification of land relief, changes in hydrographic conditions and destruction of the soil cover. Excavations and dumping grounds left after exploitation contribute to permanent changes in the landscape and require land recla-mation. The purpose of reclamation treatments is to restore the devastated lands – to the extent technically feasible and economically reasonable – back to the state of eco-nomic use through formation of soils within the range of lands in question (Skawina 1958, 1963). In Poland, the most frequent land-use methods applied for soilless deposits within the post-mining dumping grounds is forest, agricultural or recreational-park rec-lamation. The reclamation work usually consists of three phases: preparatory, technical and biological (Polish Norm PN-G-7800:2002). The e�cient action involving i.a. recon-struction of soil cover (technical phase) and introduction of pioneer and target vegeta-tion (biological phase) may lead to stimulation of soil-forming processes and rapid for-mation of well-functioning ecosystems (Bender 1995). Consequently, after sometime, the soil may be formed with characteristics similar to natural ones. In this context, the impact of a plant community on the rate and direction of pedogenesis appears to be of major importance (Skawina 1958; Nietrzeba-Marcinonis 2007).
In the ‘Bełchatów’ lignite mine (in Polish: Kopalnia Węgla Brunatnego ‘Bełchatów’, further referred to as KWB), the land reclamation was carried out within the zone of external overburden dumping ground, aimed mostly at a pine-dominated forest. The research on the e�ect of pine tree stands on the soil cover of overburden dumping grounds proved that organic carbon resources are largely associated with the technogenic soil development (Świtoniak et al. 2011). This chapter presents soil characteristics on the external dumping ground of KWB Bełchatów in terms of implemented reclamation.

TECHNOGENIC SOILS OF POLAND 256
The study area and soil profile documentation
The external overburden dumping ground of KWB Bełchatów was created in 1977–1994 as a result of non-selective dumping of 1.3 billion m3 of overburden removed from the first open pit in the eastern part of the lignite deposit. Mainly Pleistocene deposits were used for its construction, including fluvioglacial sands, silt deposits, varved (strat-ified) clay, boulder clay and Neogene deposits represented mostly by sandy and gravel deposits (Pająk et al. 2004). The base of the dumping ground has an area of 1 500 ha, the relative height is 180–195 m and the hilltop has an area of 500 ha. In some places, oxidation of pyrite (FeS2), which is a characteristic mineral of Tertiary deposits, could cause acidification of soil substratum. Materials with such properties require neutrali-zation (Kowalik et al. 1999). Biological reclamation was implemented after the dumping ground had been formed. For example, herbaceous and woody vegetation was intro-duced (the former included mostly grasses and Fabaceae species) and mineral fertiliza-tion was carried out within the northern slope of the site (Pająk, Krzaklewski 2006). The thus prepared sites were handed over to the Regional Directorate of State Forests in Łódź for a�orestation. The Scots pine (Pinus sylvestris) was used as the main forest-forming species. The oldest pine plantations had been established already in 1987, six years before the dumping ground was completely created.
The research was conducted in 2005. A total of 8 soil pits were made (Fig. 1) and they represented soils in the final stage of the biological reclamation phase (Świtoniak et al. 2011). The analysed soils were covered with pine forest stands of di�erent age, i.e.: profile 1 – 5 years, profile 2 – 8 years, profiles 3 and 4 – 10 years, profile 5 – 14 years, profiles 6 and 7 – 16 years and profile 8 – 19 years.
Samples for laboratory analysis were collected from all genetic horizons of the studied soils. The following parameters were determined in the collected soil material: particle size distribution by hydrometric method combined with the sieve method, actual moisture and bulk density by oven-drying, organic carbon (OC) by the method of Tiurin (mineral samples) and Alten (organic samples), nitrogen (Nt) by Kjeldahl's method, soil pH in H2O, 1M KCl and after treatment with 30% solution of H2O2 by the potentiometric method, electrical conductivity in the 1:5 soil:water extract (EC1:5) and the content of CaCO3 by Scheibler’s method. Furthermore, the content of selected heavy metals (Cd, Cu, Cr, Ni, Pb) was determined by atomic adsorption spectrometry (AAS), and Hg − by the AMA method.
M. ŚWITONIAK, P. HULISZ, S. RÓŻAŃSKI, I. KAŁUCKA

257 TECHNOGENIC SOILS OF POLAND
Fig. 1. Location of soil profiles within the external dumping ground
SOILS OF THE EXTERNAL DUMPING GROUND OF THE BEŁCHATÓW OPEN-CAST LIGNITE MINE

TECHNOGENIC SOILS OF POLAND 258
Profile 1
Location: Bełchatów open-cast lignite mine,
external dumping ground, forest section no. 314, 5-year-old pine stand, Central Poland
Coordinates: 51°13’27” N, 19°24’37” E
Soil classification (WRB 2007): Spolic Technosol (Arenic)
Au – 0–10 cm: human-transported material, sand, greyish brown, single grain structure, dry, common roots, gradual boundary.
Cu – below 10 cm: human-transported material, sand, light brownish grey, single grain structure, few roots, slightly moist.
Profile 2
Location: Bełchatów open-cast lignite mine, external
dumping ground, forest section no. 313, 8-year-old pine stand, Central Poland
Coordinates: 51°13’42” N, 19°23’48” E
Soil classification (WRB 2007): Spolic Technosol (Arenic)
Au – 0-13 cm: human-transported material, loamy sand, dark greyish brown, weak granular structure, slightly moist, common roots, charcoal, abrupt boundary.
Cu – below 13 cm: human-transported material, sand, yellow, single grain structure, slightly moist, few roots.
M. ŚWITONIAK, P. HULISZ, S. RÓŻAŃSKI, I. KAŁUCKA
0 cm
40 cm
0 cm
40 cm

259 TECHNOGENIC SOILS OF POLAND
Table 1. Selected soil properties – profiles 1 and 2
PROFILE 1 2
HORIZON Au Cu Au Cu
DEPTH [cm] 0–10 >10 0–13 >13
PARTICLE SIZE DISTRIBUTION [%]
>2 mm 1 <1 1 <1
2 mm–50 µm 89 94 80 97
50–2 µm 8 4 13 2
<2 µm 3 2 7 1
TEXTURE CLASS (USDA) sand sand loamy sand sand
SOIL MATRIX COLOUR
drymoist
2.5Y 5/22.5Y 3/2
2.5Y 6/22.5Y 4/2
2.5Y 4/22.5Y 3/2
2.5Y 7/62.5Y 5/6
BULK DENSITY [g·cm-3] 1.52 — 1.65 1.63
OC [%] 0.78 0.16 0.59 0.01
Nt [%] 0.055 0.007 0.047 0.002
C:N 14 — 13 —
pH
in H2O 8.2 8.8 8.3 9.1
in 1M KCl 7.8 8.3 7.8 8.7
in H2O2 5.5 6.1 6.0 6.6
CaCO3 [%] 0.8 1.2 1.7 1.0
EC1:5 [µS·cm-1] 136 122 132 92.0
SOILS OF THE EXTERNAL DUMPING GROUND OF THE BEŁCHATÓW OPEN-CAST LIGNITE MINE

TECHNOGENIC SOILS OF POLAND 260
Profile 3
Location: Bełchatów open-cast lignite mine,
external dumping ground, forest section no. 300, 10-year-old pine stand, Central Poland
Coordinates: 51°12’51” N, 19°26’20” E
Soil classification (WRB 2007): Spolic Technosol (Arenic)
Cu – below 0 cm: human-transported material, sand, greyish brown, single grain structure, dry, charcoal, few roots.
Profile 4
Location: Bełchatów open-cast lignite mine,
external dumping ground, forest section no. 300, 10-year-old pine stand, Central Poland
Coordinates: 51°12’48” N, 19°26’28” E
Soil classification (WRB 2007): Spolic Technosol (Arenic)
Oi – (0.5)–0 cm: slightly decomposed pine needles.Au – 0–7 cm: human-transported material, sandy clay loam, greyish brown, granular structure, slightly moist, few charcoals, few roots, abrupt boundary.Cu – below 7 cm: human-transported material, sand, light yellowish brown, single grain structure, slightly moist, very few roots.
M. ŚWITONIAK, P. HULISZ, S. RÓŻAŃSKI, I. KAŁUCKA
0 cm
20 cm
0 cm
40 cm

261 TECHNOGENIC SOILS OF POLAND
Table 2. Selected soil properties – profiles 3 and 4
PROFILE 3 4
HORIZON Cu Oi Au Cu
DEPTH [cm] >0 (0.5)–0 0–7 >7
PARTICLE SIZE DISTRIBUTION [%]
>2 mm <1 — 1 1
2 mm–50 µm 93 — 62 92
50–2 µm 5 — 15 5
<2 µm 2 — 23 3
TEXTURE CLASS (USDA) sand — sandy clay
loam sand
SOIL MATRIX COLOUR
drymoist
2.5Y 5/22.5Y 3/2
——
2.5Y 5/22.5Y 3.5/2
2.5Y 6/32.5Y 4/3
BULK DENSITY [g·cm-3] 1.57 0.054 1.56 1.66
OC [%] 0.11 59.0 0.87 0.08
Nt [%] 0.004 0.634 0.031 0.007
C:N 28 80 28 –
pH
in H2O 8.8 4.5 4.2 4.5
in 1M KCl 8.3 4.0 3.2 3.6
in H2O2 6.2 — 1.6 2.2
CaCO3 [%] 1.7 — — —
EC1:5 [µS·cm-1] 108 — 63.3 86.0
SOILS OF THE EXTERNAL DUMPING GROUND OF THE BEŁCHATÓW OPEN-CAST LIGNITE MINE
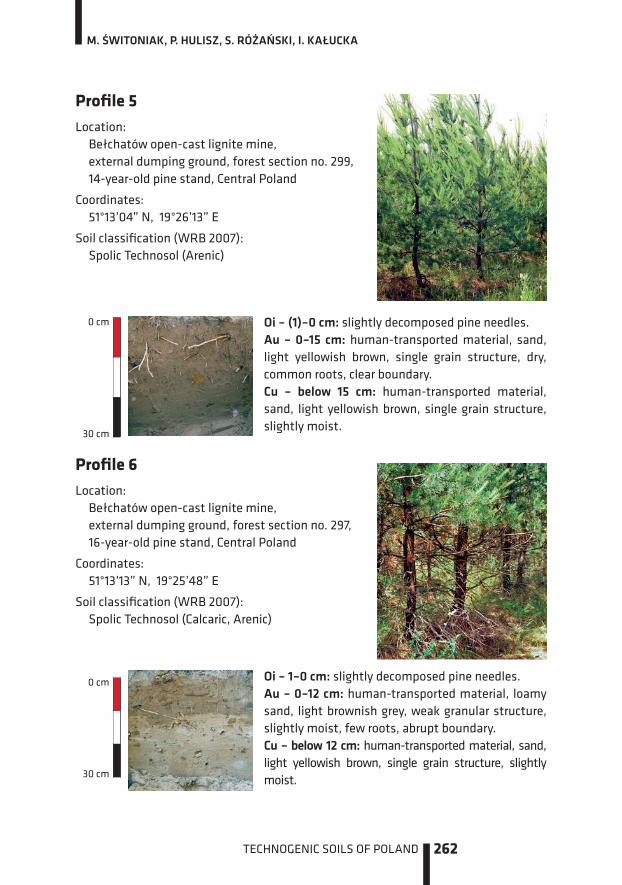
TECHNOGENIC SOILS OF POLAND 262
Profile 5
Location: Bełchatów open-cast lignite mine,
external dumping ground, forest section no. 299, 14-year-old pine stand, Central Poland
Coordinates: 51°13’04” N, 19°26’13” E
Soil classification (WRB 2007): Spolic Technosol (Arenic)
Oi – (1)–0 cm: slightly decomposed pine needles.Au – 0–15 cm: human-transported material, sand, light yellowish brown, single grain structure, dry, common roots, clear boundary.Cu – below 15 cm: human-transported material, sand, light yellowish brown, single grain structure, slightly moist.
Profile 6
Location: Bełchatów open-cast lignite mine,
external dumping ground, forest section no. 297, 16-year-old pine stand, Central Poland
Coordinates: 51°13’13” N, 19°25’48” E
Soil classification (WRB 2007): Spolic Technosol (Calcaric, Arenic)
Oi – 1–0 cm: slightly decomposed pine needles.Au – 0–12 cm: human-transported material, loamy sand, light brownish grey, weak granular structure, slightly moist, few roots, abrupt boundary.Cu – below 12 cm: human-transported material, sand, light yellowish brown, single grain structure, slightly moist.
M. ŚWITONIAK, P. HULISZ, S. RÓŻAŃSKI, I. KAŁUCKA
0 cm
30 cm
0 cm
30 cm

263 TECHNOGENIC SOILS OF POLAND
Table 3. Selected soil properties – profiles 5 and 6
PROFILE 5 6
HORIZON Oi Au Cu Oi Au Cu
DEPTH [cm] (1)–0 0–15 >15 1–0 0–12 >12
PARTICLE SIZE DISTRIBUTION [%]
>2 mm — 6 7 — 3 6
2 mm–50 µm — 88 87 — 87 89
50–2 µm — 8 8 — 4 5
<2 µm — 4 5 — 9 6
TEXTURE CLASS (USDA) — sand sand — loamy sand sand
SOIL MATRIX COLOUR
dry
moist
—
—
2.5Y 5.5/3
2.5Y 4/3
2.5Y 6/3
2.5Y 4/4
—
—
2.5Y 5.5/2
2.5Y 4/2
2.5Y 6/3
2.5Y 5/3
BULK DENSITY [g·cm-3] 0.063 1.65 — 0.103 1.57 1.58
OC [%] 50.4 0.32 0.15 54.8 0.32 0.05
Nt [%] 1.06 0.017 0.006 0.898 0.014 0.004
C:N 61 23 – 64 22 –
pH
in H2O 4.7 8.5 8.6 4.8 8.5 8.7
in 1M KCl 4.2 8.1 8.2 4.3 7.8 8.0
in H2O2 — 7.4 7.9 — 6.6 6.8
CaCO3 [%] — 3.5 0.6 — 3.5 7.2
EC1:5 [µS·cm-1] — 147 145 — 138 106
SOILS OF THE EXTERNAL DUMPING GROUND OF THE BEŁCHATÓW OPEN-CAST LIGNITE MINE

TECHNOGENIC SOILS OF POLAND 264
Profile 7
Location: Bełchatów open-cast lignite mine, external
dumping ground, forest section no. 297, 16-year-old pine stand, Central Poland
Coordinates: 51°13’15” N, 19°26’02” E
Soil classification (WRB 2007): Spolic Technosol (Calcaric)
Oi – 0.5–0 cm: slightly decomposed pine needles.
Au – 0–10 cm: human-transported material, clay loam, light brownish grey, subangular structure, slightly moist, few roots, clear boundary.
Cu – below 10 cm: human-transported material, loam, light yellowish brown, subangular struc-ture, slightly moist, common roots.
M. ŚWITONIAK, P. HULISZ, S. RÓŻAŃSKI, I. KAŁUCKA
0 cm
40 cm

265 TECHNOGENIC SOILS OF POLAND
Table 4. Selected soil properties – profile 7
HORIZON Oi Au Cu
DEPTH [cm] 0.5–0 0–10 >10
PARTICLE SIZE DISTRIBUTION [%]
>2 mm — <1 <1
2 mm–50 µm — 33 50
50–2 µm — 38 37
<2 µm — 29 13
TEXTURE CLASS (USDA) — clay loam loam
SOIL MATRIX COLOUR
drymoist
——
2.5Y 6/22.5Y 4.5/2
2.5Y 6/32.5Y 4/3
BULK DENSITY [g·cm–3] — 1.35 1.66
OC [%] 54.7 0.68 0.51
Nt [%] 0.849 0.031 0.018
C:N 64 22 —
pH
in H2O 5.3 8.2 8.0
in 1M KCl 5.0 7.4 7.5
in H2O2 — 7.1 7.2
CaCO3 [%] — 3.5 7.2
EC1:5 [µS·cm-1] — 242 272
SOILS OF THE EXTERNAL DUMPING GROUND OF THE BEŁCHATÓW OPEN-CAST LIGNITE MINE

TECHNOGENIC SOILS OF POLAND 266
Profile 8
Location: Bełchatów open-cast lignite mine, external
dumping ground, forest section no. 313, 19-year-old pine stand, Central Poland
Coordinates: 51°13’31” N, 19°23’54” E
Soil classification (WRB 2007): Spolic Technosol (Calcaric)
Oi – 1–0 cm: slightly decomposed pine needles.
Au – 0–17 cm: human-transported material, loamy sand, light olive brown, weak granular structure, slightly moist, common roots, abrupt boundary.
Cu1 – 17–33 cm: human-transported material, sandy loam, light yellowish brown, subangular structure, slightly moist, abrupt boundary marked with roots.
Cu2 – 33–45 cm: human-transported material, sand, light brownish grey, single grain structure, slightly moist, clear boundary.
Cu3 – below 45 cm: human-transported material, sand, pale yellow, single grain structure, slightly moist.
M. ŚWITONIAK, P. HULISZ, S. RÓŻAŃSKI, I. KAŁUCKA
0 cm
40 cm

267 TECHNOGENIC SOILS OF POLAND
Table 5. Selected soil properties – profile 8
HORIZON Oi Au Cu1 Cu2 Cu3
DEPTH [cm] 1–0 0–17 17–33 33–45 >45
PARTICLE SIZE DISTRIBUTION [%]
>2 mm — 2 1 <1 <1
2 mm–50 µm — 82 76 88 91
50–2 µm — 10 12 7 5
<2 µm — 8 12 5 4
TEXTURE CLASS (USDA) — loamy sand
sandy loam sand sand
SOIL MATRIX COLOUR
drymoist
——
2.5Y 5/32.5Y 3/3
2.5Y 6/32.5Y 4/3
2.5Y 6/22.5Y 5/3
2.5Y 7/32.5Y 6/3
BULK DENSITY [g·cm-3] 0.13 1.51 1.84 — —
OC [%] 52.1 0.82 0.24 0.16 0.02
Nt [%] 0.974 0.055 0.018 0.012 0.004
C:N 53 15 — — —
pH
in H2O 5.3 8.0 8.5 8.1 8.8
in 1M KCl 4.7 7.6 7.9 7.3 7.9
in H2O2 — 5.6 6.7 4.3 5.5
CaCO3 [%] — 1.3 3.2 — —
EC1:5 [µS·cm-1] — 206 199 74.9 78.1
SOILS OF THE EXTERNAL DUMPING GROUND OF THE BEŁCHATÓW OPEN-CAST LIGNITE MINE

TECHNOGENIC SOILS OF POLAND 268
Soil properties
Soil morphology and textureThe sequence of genetic horizons in the analysed soils was rather simple. Humus hori-zons (Au) with a sharp lower boundary were represented by upper mineral parts of the soil, and their thickness ranged from a few to several centimetres. The substratum (Cu) with no characteristics related to pedogenesis was situated directly beneath the humus horizons. Continous organic horizons (Oi) were found only at sites covered with older pine woods (profiles 4–8). These horizons had little thickness and were built mainly of poorly decomposed pine litter.
The reclaimed post-mining lands of the KWB Bełchatów dumping ground were dis-tinguished by the presence of Tertiary deposits in the substratum (Tables 1–5) − their particle size distribution ranged from sand to sandy clay loam. The soil at site 7 was the exception − built entirely of the material with the texture of clay loam and loam. The studied soils (profiles 2, 4, 7 and 8) were distinguished by much higher content of silt and clay size fractions in the surface horizons compared to deeper horizons. It is not possible that within ten years there has been such a significant transformation of par-ticle size distribution in the topsoils as a result of weathering or natural soil-forming processes. Whereas vertical variability of the particle size distribution in the analysed profiles is connected with one of the initial reclamation phases, which aims at recon-struction of soils using technical methods (Skawina et al. 1969). These treatments in-volve i.a. intentional deposition of material with favourable physical properties on the surface of reclaimed lands. In the analysed cases, highly permeable, clay-poor sands were covered with more fine-grained material, which was to improve the water-air properties of the reclaimed lands.
Basic soil propertiesThe results of physicochemical analysis of soils are presented in Tables 1–5. Reaction of the mineral material in the studied soils was mostly alkaline. The range of pH values was 8.0–9.1 in H2O and 7.3–8.7 in KCl. In most cases, this was caused by the presence of CaCO3 in the soil, the content of which ranged from 0.6 to 7.2%, except for profile 4 where hori-zons were characterised by strong acidification (pH in H2O 4.2–4.5 and pH in KCl 3.2–3.6).
Because of the anticipated large content of pyrite (FeS2) in the material from exca-vation (Jagodziński, Kałucka 2008), soil samples were treated with 30% solution of H2O2. This method is commonly applied in the assessment of potentially acid sulphate soils where a sudden drop in pH values has been observed as a result of oxidation of sulphides and formation of H2SO4 (IUSS Working Group WRB 2007). The lowest pH values after oxidation with 30% H2O2 were recorded in profile 4 (1.6 and 2.2). According to WRB, this met the criteria of sulphidic soil material (pH in H2O2 < 2.5). It can be there-fore assumed that under field conditions with the actual moisture content, the soil
M. ŚWITONIAK, P. HULISZ, S. RÓŻAŃSKI, I. KAŁUCKA

269 TECHNOGENIC SOILS OF POLAND
could have alkaline reaction, similar to other analysed soils. Acidification of samples could, however, happened in the laboratory during drying, where sulphides in the mate-rial of relatively low bu�er capacity were oxidized. It is also possible, however, that the observed acid reaction of horizons in profile 3 results from initial characteristics of the soil substratum rich in FeS2. Other soils (profiles 1–3, 5–7), despite the presence of car-bonates, were characterised by relatively large di�erences (above two units) between pH (in H2O) results obtained in air-dried samples and after treatment with 30% H2O2 solution. Bu�er properties of carbonates may be responsible for the fact that pH (in H2O2) values were higher than 2.5 and the horizons did not meet the aforementioned diagnostic criterion. All these facts indicate the presence of pyrite in the studied soils.
Electrical conductivity of soil solution (1:5 extract) ranged from 74.9 to 147 µS·cm-1 in sandy horizons, and from 86.0 to 272 µS·cm-1 in loamy horizons. The obtained results prove a very low salinity level and they were similar to natural EC1:5 values recorded in sandy and loamy soils in the environs of Toruń, which are 40.0–130 µS·cm-1 and 140–300 µS·cm-1, respectively (Bednarek et al. 2001).
There were two types of horizons containing the organic matter in the studied soils of the external dumping ground. Organic remains from the litterfall of pine tree stands accumulated on the soil surface within all the studied sites. In the case of 5 and 8-year-old forest stands, and 10-year-old forest with low growth dynamics (profiles 3), plant litter (usually pine needles) did not form compact and continuous organic horizons. They occurred only as small lenticular accumulations of raw humus in ground depressions and therefore they were not included in further analysis. Organic horizons in the form of compact and continuous subhorizons built mainly of slightly decomposed organic mate-rial (Oi) developed under 10-year-old forest stands with high growth rates (profile 4) and at all sites with older pine monocultures. Organic horizons of the studied soils are char-acterised by small thickness and lesser decomposition of hardly humified plant remains. The content of organic carbon in Oi horizons varies within a narrow range between 50.4 and 54.8%, which is typical of this type of subhorizons built almost exclusively of or-ganic raw humus with a small admixture of mineral fractions (Plichta 1981). The studied soils are relatively homogeneous in respect of the total nitrogen content in Oi horizons (0.849–1.060%). Only profile 4 di�ers from other soils and from results obtained by oth-er authors (Plichta 1981; Pająk, Krzaklewski 2006) in a relatively small content of this element (0.634%). This also a�ects the C:N ratio, which is extremely high (80) in this profile. Mineral humus horizons (Au) represented the second type of genetic horizons; they contained large amounts of organic matter and were present in almost all analysed pedons (apart from profile 3). They were located directly on the soil surface or beneath the organic litter horizons. Humus horizons were characterised by relatively large di�erences in their thickness (from 7 to 17 cm), the content of organic carbon (0.32–0.87%) and total nitrogen (0.014–0.055%). These values are more than two times higher compared to soils of dumping grounds studied by Pająk and Krzaklewski (2006).
SOILS OF THE EXTERNAL DUMPING GROUND OF THE BEŁCHATÓW OPEN-CAST LIGNITE MINE

TECHNOGENIC SOILS OF POLAND 270
The research of Świtoniak et al. (2011) revealed that the total resources of organic carbon in the soils of the KWB Bełchatów external dumping ground result not only from the decomposition of plant remains coming from pine tree stands growing on this ground, but also from selective enrichment with technogenic material enriched with organic matter. This fact is evidenced by previously described specific morphological characteristics of humus horizons (Au) in these soils.
Heavy metal contentThe content of chromium (35.9–92.1 mg·kg-1), zinc (40.7–67.7 mg·kg-1), copper (6.12–14.5 mg·kg-1), nickel (0.14–17.9 mg·kg-1) and lead (12.1–73.7 mg·kg-1) were relatively low in the studied soils (Fig. 2 ). Generally, the values were similar to those occurring natu-rally in soils of Poland (Kabata-Pendias et al. 1993). Other elements, such as cadmium
M. ŚWITONIAK, P. HULISZ, S. RÓŻAŃSKI, I. KAŁUCKA
Fig. 2. Heavy metal content in selected soil profiles

271 TECHNOGENIC SOILS OF POLAND
and mercury, were present in trace concentrations. None of the analysed metal concen-trations exceeded the allowable standards for soils (group B – i.a. arable lands, forest lands, wastelands; the depth of 0.0–0.3 m u.s.l.) defined in the Regulation of the Min-ister of the Environment (2002). Many studies have shown that the analysed ele-ments can be sorbed i.a. by organic matter (Cr, Pb, Zn), clay minerals (Pb), which re-duces their solubility, and at the same time reduce their availability for plants (Kabata-Pendias, Pendias 1999). Furthermore, the mobility of most heavy metals in the alkaline environment is negligible (Brümmer, Herms 1983). This was clearly reflected in the profile distribution of Cr, Cu, Pb and Zn concentrations. The highest concentration of these metals occurred in the surface horizons (both mineral and organic) and prob-ably resulted from the industrial impact of atmospheric contamination. This was fol-lowed by a decrease in Cr, Cu, Pb and Zn concentrations with depth. Profile 4 was the exception, where the highest accumulation of the studied chemical elements occurred in the subsurface level Cu (Fig. 2). In connection with acid reaction of this soil, this may indicate migration of metals into deeper horizons. However, given the great diversity of the material used for soil cover restoration in the study area, it is di�cult to clarify this fact.
Impact of the pine stand on soil diagnostic properties
Pine is generally thought to be a species of small edaphic requirements. It grows both on poor sandy habitats, oligotrophic raised peat bogs and rich habitats of mixed forests (Białobok et al. 1993). It is one of the species responsible for podzolization of soils. This process contributes to i.a. reduction in pH values of surface horizons and significant losses of exchangeable bases and important nutrients (Pokojska 1986). Given the reac-tion of organic horizons in the studied soils (profiles 4–8), it can be concluded that the litterfall was less acid compared to typical reaction under pine woods (Brożek, Zwydak 2003), i.e. values of pH (in H2O) ranged from 4.5 to 5.3, and pH (in KCl) – from 4.0 to 5.0 (Tables 1–5). For comparison, pH values in 100 organic soil horizons under pine tree stands of southern-western Poland were 3.8±0.3 in H2O and 3.0±0.3 in KCl (Sewerniak et al. 2009). This can be explained by habitat abundance in nutrients and less intensive withdrawal of basic elements from the litterfall by pine (Lemke 1980, Prusinkiewicz et al. 1986). Relations between the reaction of humus horizons and the age of forest stands did not indicate the acidifying e�ect of pine. Favourable bu�er properties (mainly the presence of carbonates) probably also contributed to this condition. Bleached quartz grains, which indicate formation of the albic depletion horizon charac-teristic of the podzolization process, were not found in any of the analysed cases. There are two likely causes of the lack of morphological characteristics of this process. The period of vegetation impact, which induces podzolization, is too short within the study sites. Morphological and chemical characteristics of albic and spodic horizons in natural
SOILS OF THE EXTERNAL DUMPING GROUND OF THE BEŁCHATÓW OPEN-CAST LIGNITE MINE

TECHNOGENIC SOILS OF POLAND 272
soils begin to appear after a few dozen (Jankowski, Bednarek 2000; Rahmonov 2007) or even several hundred years (Ugolini 1968; Singleton, Lavkulish 1987). This period may be even longer in soils of the KWB ‘Bełchatów” external dumping ground because of the slow rate resulting from alkaline reaction of surface mineral deposits.
Summary
The conducted research indicate that the technical phase of the land reclamation had a major e�ect on changes in the properties of surface deposits of the KWB ‘Bełchatów’ external dumping ground.
Soil properties of the dumping ground have been modified to a small extent by soil-forming processes since the biological phase of reclamation was started 20 years ago. The main e�ect of transformations resulting from pine planting is the accumulation of organic horizons. Even after twenty years since pine planting, these horizons are still in the initial phase of development.
No characteristics associated with the podzolization process (typical of natural au-togenic habitats remaining under the impact of pine tree stands) were observed at any of the studied sites. The absence of any symptoms of this process is connected with a short development time of the analysed soils and alkaline reaction of the surface de-posits. The presence of carbonate bu�er is likely to have an inhibitory e�ect on the podzolization process at a later stage of the soil development.
Given the origin of the substratum and characteristics of the studied soils based on the WRB classification (IUSS Working Group WRB 2007), the soils were classified as Spolic Technosols. In addition, it was possible to identify the following su�x qualifiers: Arenic (1–6) and Calcaric (6–8).
References:
1. Bednarek R., Pokojska U., Plichta W., Kwiatkowska A., Józefkowicz-Kotlarz J., Jankowski M., Hulisz P., Amroziewicz M., Magiera L. 2001. Reference soil profiles as a basis for soil monitoring and proper management of production space in Toruń Province. Raport końcowy z realizacji projektu badawczego KBN Nr 6PO4G 011/14, manuscript (in Polish).
2. Bender J. 1995. Reclamation of post-mining areas in Poland. Zesz. Probl. Post. Nauk Roln. 418: 75–86 (in Polish with English abstract).
3. Białobok S., Boratyński A. , Bugała W. (Eds.) 1993. Biology of Scots pine. Wyd. Sorus. Poznań–Kórnik (in Polish).
4. Brożek S., Zwydak M. 2003. Atlas of Polish forest soils. CILP. Warszawa (in Polish with Eng-lish summary).
M. ŚWITONIAK, P. HULISZ, S. RÓŻAŃSKI, I. KAŁUCKA

273 TECHNOGENIC SOILS OF POLAND
5. Brummer G., Herms U. 1983. Influence of soil reaction and organic matter on the solubility of heavy metals in soils. [In:] Ulrich B., Pankrath J. (Eds.) E�ects of accumulation of air pollutants in forest ecosystems. D. Reidel Publishing Company, Dordrecht: 233–243.
6. IUSS Working Group WRB. 2007. World References Base for Soil Resources 2006. Update 2007. World Soil Resources Reports, 103, FAO, Rome.
7. Jankowski M., Bednarek R. 2000. Quantitative and qualitative changes of properties as basis for distinguishing development stages of soils formed from dunes sand. Pol. J. Soil Sci. 33: 61–69.
8. Jagodziński M., Kałucka I. 2008. Age-related changes in leaf area index of young Scots pine stands. Dendrobiology 59: 57–65.
9. Kabata-Pendias A., Motowicka-Terelak., Piotrowska M., Terelak H., Witek T. 1993. Assessment of the contamination degree of soils and plants with heavy metals and sulphur. Ramowe wytyczne dla rolnictwa. IUNG, Puławy (in Polish).
10. Kabata-Pendias A., Pendias H. 1999. Biogeochemistry of trace elements. Wyd. Nauk. PWN, Warszawa (in Polish).
11. Kowalik S., Krzaklewski W., Wójcik J. 1999. E�ectiveness of neutralisation of toxically acidic soils on the outer dumping ground of the ‘Bełchatów’ brown coal mine. Inż. Środow. 4, 2: 395–410 (in Polish with English abstract).
12. Lemke J. 1980. Some features of the assimilatory organs of Scots pine in aspect of forest site fertility. Prace – PTPN, Wydz. Nauk Roln. i Leśn. 50: 51–55 (in Polish).
13. Nietrzeba-Marcinonis J. 2007. The e�ect of the forestry reclamation approach in post-mining areas on selected properties of initial (incipient) soils based on the example of the overburden dumping ground in the Turów coal mine. Manuscript of PhD dissertation (in Polish with English abstract).
14. Pająk M., Forgiel M., Krzaklewski W. 2004. Growth of trees used in reforestation of a northern slope of the external spoil bank of the ‘Bełchatów’ Brown Coal Mine. EJPAU 7(2). www.ejpau.media.pl/series/volume7/issue2/forestry
15. Pająk M., Krzaklewski W. 2006. Selected chemical properties of initial soils on the outside spoil-bank of the ‘Bełchatów’ Mine. Rocz. Glebozn. 57 (1/2): 158–163 (in Polish with English abstract).
16. Plichta W. 1981. Problems of the origin, properties and classification of the mor humus. Wydawnictwo UMK, Toruń (in Polish with English summary).
17. Pokojska U. 1986. Role of humus in formation of the reaction, the bu�er properties and the cation exchange capacity of forest soils. Rocz. Glebozn. 37, 2–3: 249–263 (in Polish with English abstract).
18. Polish Norm PN-G-07800:2002. Open pit mining. Reclamation. General design guidelines. Polski Komitet Normalizacyjny. February 2002 (in Polish).
19. Prusinkiewicz Z., Konys L., Mąkosa K. 1986. Multivariate statistical analysis of the elemen-tary composition of Scots pine needles as a method of ecological evaluation of forest sites. Rocz. Glebozn. 37 (4): 159–185 (in Polish with English abstract).
20. Rahmonov O. 2007. Relations between vegetation and soil in initial phase of succession in sandy area. Wyd. Uniwersytetu Śląskiego, Katowice (in Polish with English summary).
SOILS OF THE EXTERNAL DUMPING GROUND OF THE BEŁCHATÓW OPEN-CAST LIGNITE MINE

TECHNOGENIC SOILS OF POLAND 274
21. Regulation of the Minister of the Environment dated September 9, 2002 on soil and land quality standards (Journal of Laws No. 165, item 1359, October 4, 2002).
22. Singleton G.A., Lavkulich L.M. 1987. Soil chronosequence on beach sands. Vancouver Island. British Columbia. Can. J. Soil Sci. 67: 795–810.
23. Sewerniak P., Gonet S.S., Piernik A., 2009. Relations between features of forest floor vegetation and surface soil horizons properties in Scots pine (Pinus sylvestris L.) stands in southwest Poland. Pol. J. Soil Sci. 42(2): 193–202.
24. Skawina T. 1958. Soil forming processes on coal mining dumps. Rocz. Glebozn. Suppl. 7: 149–161 (in Polish with English abstract).
25. Skawina T. 1963. Reclamation of brown coal post mining areas. Węgiel Brunatny 3: 151–156 (in Polish).
26. Skawina T., Bojarski Z., Kamieniecki F., Zubikowska-Skawinowa L. 1969. Methods of the recla-mation of brown coal post mining areas. Komisja ds. Gospodarczo-Leśnych i Rekultywacyjnych przy Ministrze Leśnictwa i Przemysłu Drzewnego, 3, 13 (in Polish).
27. Świtoniak M., Hulisz P., Kałucka I., Różański S. 2011. Role of Scots pine monocultures on a the formation of organic carbon resources in soils on an external dumping ground of the Bełchatów open-cast lignite mine. Rocz. Glebozn. 62 (2): 395–405 (in Polish with English abstract).
28. Ugolini F.C. 1968. Soil development and alder invasion in a recently deglaciated area of Glacier Bay, Alaska. [In:] J.M. Trappe, J.F. Franklin, R.F. Tarrant, G.M. Hansen (Eds.) Biology of Alder. Oregon: 115–140.
M. ŚWITONIAK, P. HULISZ, S. RÓŻAŃSKI, I. KAŁUCKA

275 TECHNOGENIC SOILS OF POLAND
TECHNOGENIC SOILS DEVELOPED FROM MINE WASTES CONTAINING IRON SULPHIDES IN SOUTHERN POLAND
ŁUKASZ UZAROWICZ STEFAN SKIBA
15
Introduction
Technogenic soils (Technosols) defined as soils strongly influenced by human (IUSS Working Group WRB 2007), develop, among others, from diverse mine wastes. They form, for example, on surfaces of landfills consisting of iron sulphide-bearing materials. The development of such Technosols begins immediately after deposition of wastes on land surface and subsequently continues, in particular, on the surfaces of landfills, which were reclaimed or were covered by plants due to natural succession.
In Poland, Technosols containing iron sulphides occur, for example, on mine dumps of hard coal mines in the area of Upper Silesian Coal Basin, Lublin Coal Basin, and Wałbrzych Coal Basin (e.g. Skawina 1959; Strzyszcz 1978, 1988; Uzarowicz, Skiba 2011), as well as on mine spoils of lignite mines, e.g. in the area of Bełchatów and Bogatynia (e.g. Krzaklewski 1990). Such Technosols also occur in the area of abandoned sulphide mines in Wieściszowice, Western Sudety Mts. (Uzarowicz et al. 2008, 2011; Uzarowicz, Skiba 2011), and Rudki, Holy Cross Mts. (Skawina et al. 1974; Uzarowicz 2011, 2013; Uzarowicz, Maciejewska 2012; Warda 2007), as well as locally in other sites.
Sulphide-bearing mine wastes deposited on land surface undergo weathering and soil-forming processes, which change original properties of wastes (e.g. Barnhisel, Mas-sey 1969; Dixon et al. 1982; Kostenko, Opanasenko 2005; Struthers 1964; Uzarowicz, Skiba 2011). It is because these wastes contain sulphides which are unstable on land surface. In the weathering environment, sulphides react with oxygen and water with a participation of microorganisms. As a result, metals are released and sulphuric acid is produced, causing strong acidity, unless neutralising agents (e.g. carbonates) are present in wastes. Weathering of mine wastes, coming from coal and sulphide mines exploiting polymetallic ores, may enrich soils and groundwater in heavy metals and radioactive elements (e.g. Barnhisel, Massey 1969; Dang et al. 2002; Johnson 2003; Uzarowicz 2011).

TECHNOGENIC SOILS OF POLAND 276
Taking into account that trace elements are more mobile in acidic soils (Kabata-Pendias 2010), the release of metals from mine wastes may cause a pollution of soils and waters on a local scale.
Distinct mineral transformations were recognised in the superficial parts of sul-phide-bearing mine waste landfills. A weathering of sulphides leads to the formation of sulphate minerals (gypsum and jarosite mainly) (e.g. Dixon et al. 1982; Uzarowicz, Skiba 2011; Uzarowicz 2013). Furthermore, strong acidity caused by weathering of sulphides leads to transformations of inherited phyllosilicates (e.g. mica and chlorite) into secondary swelling clay minerals, (smectite and vermiculite) and dissolution of less resistant clay minerals (e.g. Barnhisel, Rotromel 1974; Bzowski, Strzyszcz 1993; Dixon et al. 1982; Uzarowicz, Skiba 2011; Uzarowicz et al. 2011).
In this chapter, the results of the studies aiming in determination of an e�ect of iron sulphide weathering on properties and functioning of Technosols developed from mine wastes containing iron sulphides, are presented.
Study areas and soil profile documentation
The study covered soil samples taken from Technosol profiles (Tables 1–5) de-veloped from mine wastes containing iron sulphides. The study areas were located at three abandoned industrial sites in Po-land (Fig. 1): (1) the ‘Siersza’ hard coal mine in Trzebinia town (the Silesian Upland), (2) the ‘Staszic’ pyrite mine in Rudki village (the Holy Cross Mts.), and (3) the pyrite mine in Wieściszowice village (the Rudawy Janowickie Mts. within the Western Su-dety Mts.).
Soil profiles were located on superficial parts of mine spoils. Basic soil properties were determined according to standard analytical methods (van Reeuwijk 2006). Contents of trace elements were determined with the use of inductively coupled plasma-mass spectrometry (ICP-MS) in the Activation Laboratories Ltd. ACTLABS, Canada. Soil units were described and classified according to the World Reference Base for Soil Resources (IUSS Working Group WRB 2007).
All of the soils studied were classified according to the WRB as diverse variants of Spolic Technosols, because of the presence of artefacts (i.e. industrial wastes) occurring in the uppermost 100 cm layer of the soils. According to Polish Soil Classification, the soils
Ł. UZAROWICZ, S. SKIBA
Fig. 1. Location of the study sites
277 TECHNOGENIC SOILS OF POLAND
investigated can be assigned to initial industriogenic soils (AIin) within anthropogenic soils order (Commission V on Genesis, Classification and Cartography of Soils PSSS 2011).
Technosols investigated varied in age. Mining exploitation in the ‘Siersza’ hard coal mine ceased in 1999. Therefore, soils developed on the surface of the dump were at least several years old. They were not reclaimed before completion of the investigation (2009 year). Land in the area of the ‘Staszic’ pyrite mine was reclaimed after the cessa-tion of mining in the 1970s. The soils developed there were at least 40 years old. Mining exploitation and waste deposition in the Wieściszowice region continued between 1785 and 1925. Therefore, the soils on the dumps may be 100–200 years old. The dumps have not been reclaimed, and the soils developed there due to spontaneous plant succession.
Soil parent materials
Properties of the soils developed from mine spoils are strictly dependent on the min-eral composition of soil parent materials and their subsequent transformation in the weathering environment. Mineral composition of parent materials of soil investigated, varied between the study areas and soil profiles studied. The mineral composition seems to be the basic information, which should be known when studying the functioning of soils developed from sulphide-bearing materials (Uzarowicz, Skiba 2011; Uzarowicz 2013).
One of the most desirable mineral compounds in soils containing iron sulphides are carbonates, which are able to neutralise acidity caused by weathering of sulphides. All soil profiles studied (apart from profile 2) are devoid of carbonates.
Profile 1 from Trzebinia town was developed from a mixture of sulphide- and coal-bearing upper Carboniferous rocks (tonsteins, mudstones, sandstones). Major minerals inherited from parent material were: quartz, feldspars, kaolinite, micas and iron sul-phides (pyrite and marcasite).
TECHNOGENIC SOILS DEVELOPED FROM MINE WASTES CONTAINING IRON SULPHIDES...

TECHNOGENIC SOILS OF POLAND 278
Profile 1
Localization: Trzebinia town, Silesian Upland,
surface of the mine dump with no plant cover
Coordinates: 50°11’38.1” N
19°26’30.2” E
Soil classification (WRB): Spolic Technosol (Toxic, Humic)
1C – 0–40 cm: very dark grey fine material con-taining ground hard coal, slightly moist, firm consistence, blocky structure, none roots, abrupt boundary.
2C – 40–76 cm: grey loamy material, slightly moist, friable consistence, blocky structure, none roots, clear boundary.
3C – 76–98 cm: dark grey fine loamy material containing ground hard coal, slightly moist, firm consistence, poorly developed structure, none roots, clear boundary.
4C – 98–105 cm: light yellowish brown sandy loam, slightly moist, firm consistence, poorly de-veloped structure, none roots.
Ł. UZAROWICZ, S. SKIBA
0 cm
50 cm
100 cm

279 TECHNOGENIC SOILS OF POLAND
Table 1. Selected soil properties – profile 1
HORIZON 1C 2C 3C 4C
DEPTH [cm] 0–40 40–76 76–98 98–105
PARTICLE SIZE DISTRIBUTION [%]
>2 mm — 33 23 30
2 mm–50 µm — 50 44 76
50–2 µm — 35 36 14
<2 µm — 15 20 10
TEXTURE CLASS (USDA) — loam loam sandy
loam
SOIL MATRIX COLOUR
drymoist
N 3/0N 1.5/0
10YR 5/110YR 3/1
10YR 4/110YR 2/1
2.5Y 6/410YR 4/4
OC [%] — 7.4 14.8 1.6
pHin H2O 2.4 3.4 3.1 2.4
in 1M KCl 2.4 3.3 3.0 2.3
HA [cmolc·kg-1] 31.4 12.5 17.9 14.1
EA [cmolc·kg-1]
H(H+) + H(Al3+) 2.3 1.0 1.1 1.4
H(H+) 2.1 0.9 1.1 1.2
H(Al3+) 0.2 0.1 0 0.2
CONTENT OF SELECTED TRACE ELEMENTS [mg·kg-1]
Zn 94 145 280 39
Cd 0.9 < 0.5 1.6 < 0.5
Cu 45 53 41 23
Pb 57 74 65 27
As 17 6 < 5 < 5
Tl 1.3 0.3 < 0.1 0.8
Sb 3.0 7.7 3.8 0.5
Ni 23 29 26 10
Th 13.3 10.5 11.2 6.3
U 4.7 4.2 4.6 1.5
TECHNOGENIC SOILS DEVELOPED FROM MINE WASTES CONTAINING IRON SULPHIDES...

TECHNOGENIC SOILS OF POLAND 280
Profile 2
Localization: Rudki village, Holy Cross Mts.
former flotation tanks covered with a meadow
Coordinates: 50°53’49.0” N
21°05’58.3” E
Soil classification (WRB): Spolic Technosol (Calcaric, Toxic)
Oi – 0–1 cm: weakly decomposed grass litter.
A – 1–3 cm: brown loamy humus material, slightly moist, friable consistence, blocky structure, very few roots, clear boundary.
1C – 3–30 cm: brownish yellow clay containing grey clayey mottles, slightly moist, very firm consistence, blocky structure, very few roots, abrupt boundary.
2C – 30–95 cm: brown sandy loamy material, slightly stratified, slightly moist, very firm con-sistence, weakly developed structure (some-times platy), none roots.
Ł. UZAROWICZ, S. SKIBA
0 cm
50 cm
90 cm

281 TECHNOGENIC SOILS OF POLAND
Table 2. Selected soil properties – profile 2
HORIZON Oi A 1C 2C
DEPTH [cm] 0–1 1–3 3–30 30–95
PARTICLE SIZE DISTRIBUTION [%]
>2 mm — 20 28 0
2 mm–50 µm — 45 40 59
50–2 µm — 33 20 37
<2 µm — 22 40 4
TEXTURE CLASS (USDA) — loam clay sandy
loam
SOIL MATRIX COLOUR
drymoist
——
7.5YR 5/37.5YR 3/3
10YR 6/67.5YR 5/4
7.5YR 5/47.5YR 3/3
OC [%] — 5.2 0.9 —
pH in H2O — 7.3 7.2 7.4
in 1M KCl — 6.9 6.7 7.4
HA [cmolc·kg-1] — 1.2 1.1 0.5
EA [cmolc·kg-1] H(H+) + H(Al3+) — 0 0 0
H(H+) — 0 0 0
H(Al3+) — 0 0 0
CaCO3 [%] — 3.0 2.4 60.3
CONTENT OF SELECTED TRACE ELEMENTS [mg·kg-1]
Zn — 192 146 133
Cd — 1.4 1.2 1.1
Cu — 64 55 23
Pb — 1170 1490 229
As — 26 41 < 5
Tl — 0.5 7.3 1.6
Sb — 0.5 2.9 < 0.5
Ni — 50 47 26
Th — 8.8 15.9 0.8
U — 16.6 23.2 6.4
TECHNOGENIC SOILS DEVELOPED FROM MINE WASTES CONTAINING IRON SULPHIDES...

TECHNOGENIC SOILS OF POLAND 282
Profile 3
Localization: Rudki village, Holy Cross Mts.
former ‘Serwis’ mine waste dump covered with a meadow
Coordinates: 50°53’35.8” N
21°04’49.8” E
Soil classification (WRB): Spolic Technosol (Toxic)
Oi – 0–2 cm: weakly decomposed grass, leaf, and moss litter.
A – 2–7 cm: greyish yellowish brown sandy loamy humus material, wet, very friable consistence, weakly developed structure, few roots, clear boundary.
1C – 7–14 cm: very pale brown loam, wet, very friable consistence, blocky structure, very few roots, gradual boundary.
2C – 14–30 cm: light yellowish brown loam, wet, very friable consistence, blocky structure, very few roots, gradual boundary.
3C – 30–60 cm: pale brown sandy clay loam, wet, very friable consistence, blocky structure, none roots, gradual boundary.
4C – 60–75 cm: pale brown sandy loam, wet, very friable consistence, blocky structure, none roots, big (dozen of cm) rock fragments consisting of iron sulphides.
Ł. UZAROWICZ, S. SKIBA
0 cm
20 cm
40 cm
60 cm
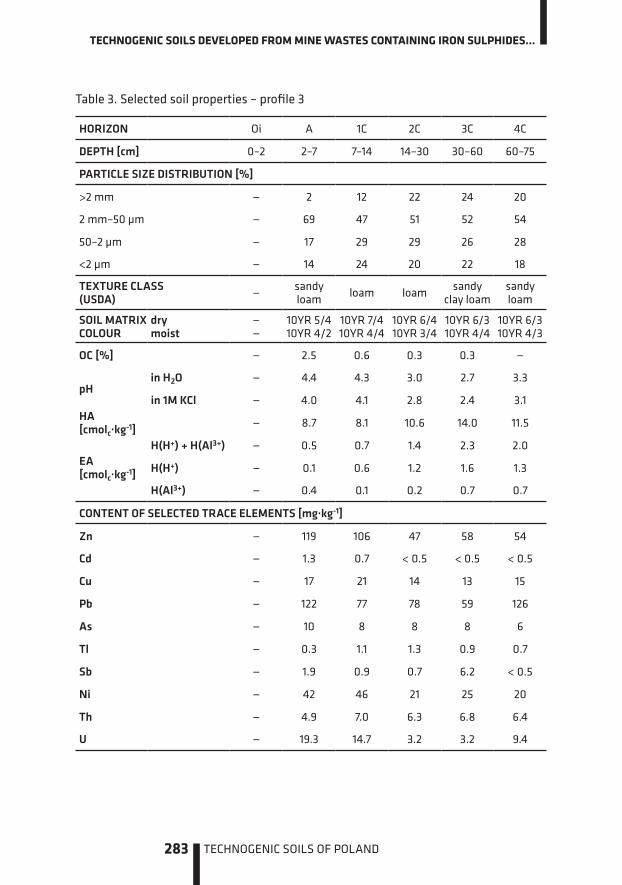
283 TECHNOGENIC SOILS OF POLAND
Table 3. Selected soil properties – profile 3
HORIZON Oi A 1C 2C 3C 4C
DEPTH [cm] 0–2 2–7 7–14 14–30 30–60 60–75
PARTICLE SIZE DISTRIBUTION [%]
>2 mm — 2 12 22 24 20
2 mm–50 µm — 69 47 51 52 54
50–2 µm — 17 29 29 26 28
<2 µm — 14 24 20 22 18
TEXTURE CLASS (USDA) — sandy
loam loam loam sandy clay loam
sandy loam
SOIL MATRIX COLOUR
drymoist
——
10YR 5/410YR 4/2
10YR 7/410YR 4/4
10YR 6/410YR 3/4
10YR 6/310YR 4/4
10YR 6/310YR 4/3
OC [%] — 2.5 0.6 0.3 0.3 —
pHin H2O — 4.4 4.3 3.0 2.7 3.3
in 1M KCl — 4.0 4.1 2.8 2.4 3.1HA [cmolc·kg-1] — 8.7 8.1 10.6 14.0 11.5
EA [cmolc·kg-1]
H(H+) + H(Al3+) — 0.5 0.7 1.4 2.3 2.0
H(H+) — 0.1 0.6 1.2 1.6 1.3
H(Al3+) — 0.4 0.1 0.2 0.7 0.7
CONTENT OF SELECTED TRACE ELEMENTS [mg·kg-1]
Zn — 119 106 47 58 54
Cd — 1.3 0.7 < 0.5 < 0.5 < 0.5
Cu — 17 21 14 13 15
Pb — 122 77 78 59 126
As — 10 8 8 8 6
Tl — 0.3 1.1 1.3 0.9 0.7
Sb — 1.9 0.9 0.7 6.2 < 0.5
Ni — 42 46 21 25 20
Th — 4.9 7.0 6.3 6.8 6.4
U — 19.3 14.7 3.2 3.2 9.4
TECHNOGENIC SOILS DEVELOPED FROM MINE WASTES CONTAINING IRON SULPHIDES...

TECHNOGENIC SOILS OF POLAND 284
Profile 4
Localization: Wieściszowice village
Western Sudety Mts. stony mine dump covered with a spruce and beech forest
Coordinates: 50°49’43.6” N
15°58’23.2” E
Soil classification (WRB): Spolic Technosol (Skeletic)
Oi – 0–1 cm: weakly decomposed leaf and needle litter.
Oe – 1–4 cm: partly decomposed organic matter.
A1 – 4–9 cm: dark greyish brown sandy loamy humus material, moist, very friable consistence, blocky structure, few roots, clear boundary.
A2 – 9–10 cm: dark brown sandy loamy humus material, moist, very friable consistence, blocky structure, few roots, clear boundary.
C – 10–45 cm: yellow sandy loamy material con-taining 70–80% of rock fragments, slightly moist, firm consistence, weakly developed struc-ture, few roots.
Ł. UZAROWICZ, S. SKIBA
0 cm
20 cm
40 cm

285 TECHNOGENIC SOILS OF POLAND
Table 4. Selected soil properties – profile 4
HORIZON Oi Oe A1 A2 C
DEPTH [cm] 0–1 1–4 4–9 9–10 10–45
PARTICLE SIZE DISTRIBUTION [%]
>2 mm — — 57 51 70
2 mm–50 µm — — 74 71 75
50–2 µm — — 15 19 17
<2 µm — — 11 10 8
TEXTURE CLASS (USDA) — — sandy
loamsandy loam
sandy loam
SOIL MATRIX COLOUR
drymoist
——
——
10YR 4/210YR 2/2
10YR 5/310YR 2/3
10YR 7/610YR 6/6
OC [%] — — 9.9 4.9 0.7
pH in H2O 4.8 4.0 3.9 4.0 3.9
in 1M KCl 4.3 3.4 3.3 3.4 3.5
HA [cmolc·kg-1] — — 22.0 12.1 6.0
EA [cmolc·kg-1] H(H+) + H(Al3+) — — 0.7 0.6 0.5
H(H+) — — 0.2 0.1 0.1
H(Al3+) — — 0.5 0.5 0.4
CONTENT OF SELECTED TRACE ELEMENTS [mg·kg-1]
Zn — — 129 109 73
Cd — — < 0.5 < 0.5 < 0.5
Cu — — 81 101 22
Pb — — 109 70 36
As — — 38 98 32
Tl — — 0.3 0.3 0.5
Sb — — 5.6 9.7 1.7
Ni — — 20 24 10
Th — — 2.1 2.4 1.7
U — — 1.4 1.7 2.1
TECHNOGENIC SOILS DEVELOPED FROM MINE WASTES CONTAINING IRON SULPHIDES...

TECHNOGENIC SOILS OF POLAND 286
Profile 5
Localization: Wieściszowice village
Western Sudety Mts. fine earth mine dump covered with sparse birch and pine forest
Coordinates: 50°49’50.1” N
15°58’21.4” E
Soil classification (WRB): Spolic Technosol
Oi – 0–1 cm: weakly decomposed organic matter.A – 1–4 cm: pale brown sandy loamy humus ma-terial, slightly moist, very friable consistence, weak structure, few roots, clear boundary.AC – 4–15 cm: yellow sandy loamy material, slightly moist, friable consistence, weak structure, few roots, clear boundary.1C – 15–30 cm: yellow silt loamy material with light grey and olive yellow mottles, slightly moist, fri-able consistence, weak structure, few roots, clear boundary.2C – 30–35 cm: yellow loamy sand material, slightly moist, very friable consistence, single grain structureless material, few roots, clear boundary.3C – 35–86 cm: yellow silt loamy material with light grey and olive yellow mottles, slightly moist, firm consistence, weak structure, very few roots, clear boundary.4C – 86–112 cm: spotty loamy sand material with olive yellow and light grey mottles, slightly moist, very friable consistence, single grain structureless material, very few roots.
Ł. UZAROWICZ, S. SKIBA
0 cm
50 cm
100 cm

287 TECHNOGENIC SOILS OF POLAND
Table 5. Selected soil properties – profile 5
HORIZON Oi A AC 1C 2C 3C 4C
DEPTH [cm] 0–1 1–4 4–15 15–30 30–35 35–86 86–112
PARTICLE SIZE DISTRIBUTION [%]
>2 mm — 3 0 0 1 0 0
2 mm–50 µm — 75 65 11 86 11 87
50–2 µm — 18 28 68 9 70 8
<2 µm — 7 7 21 5 19 5
TEXTURE CLASS (USDA) — sandy loam
sandy loam
silty loam
loamy sand
silty loam
loamy sand
SOIL MATRIX COLOUR
dry — 10YR 6/3
10YR 7/6
2.5Y 8/6
10YR 7/8
2.5Y 8/6 and
2.5Y 8/1
2.5Y 7/6
moist — 10YR 4/2
10YR 5/6
2.5Y 6/8
10YR 5/6
2.5Y 6/6 and
2.5Y 7/2
2.5Y 6/6
OC [%] — 2.6 1.0 0.5 0.9 0.5 0.9
pHin H2O — 4.2 4.2 4.3 4.4 4.3 4.3
in 1M KCl — 3.5 3.6 3.6 3.9 3.6 4.1
HA [cmolc·kg-1] — 4.7 3.6 3.7 2.0 3.3 1.6
EA [cmolc·kg-1]
H(H+) + H(Al3+) — 0.3 0.3 0.3 0.1 0.2 0
H(H+) — 0.1 0 0 0 0 0
H(Al3+) — 0.2 0.3 0.3 0.1 0.2 0
CONTENT OF SELECTED TRACE ELEMENTS [mg·kg-1]
Zn — 89 86 115 95 84 62
Cd — < 0.5 < 0.5 < 0.5 < 0.5 < 0.5 < 0.5
Cu — 89 72 36 70 66 61
Pb — 23 10 16 11 13 5
As — 17 16 19 26 27 11
Tl — 1.0 0.4 0.5 0.2 0.5 0.3
Sb — 2.4 2.2 1.3 2.4 2.0 2.1
Ni — 15 14 12 10 13 8
Th — 1.3 1.2 0.9 0.5 1.1 0.6
U — 0.8 0.8 1.0 0.6 1.2 0.6
TECHNOGENIC SOILS DEVELOPED FROM MINE WASTES CONTAINING IRON SULPHIDES...

TECHNOGENIC SOILS OF POLAND 288
Profile 2 from Rudki village was a bipartite profile. The subsoil (2C horizon) com-prised the post-flotation sludge originated due to grinding of dolomitic sulphide ore. Major minerals inherited from parent material in the subsoil were: dolomite, iron sul-phides (marcasite and pyrite), calcite, quartz, and micas. The topsoil (A and 1C horizon) was built of loamy and clay material deposited on the sludge during reclamation works in the 1970s. Major minerals inherited from parent material in the topsoil were: quartz, micas, kaolinite, goethite, hematite, feldspars, iron sulphides (marcasite and pyrite), and dolomite.
Profile 3 from Rudki village was developed from loamy material containing rocks fragments consisting of iron sulphides. Major minerals inherited from parent material were: quartz, feldspars, micas, kaolinite, and iron sulphides (marcasite and pyrite).
Profiles 4 and 5 from Wieściszowice village were evolved from metamorphic pyrite-bearing schists exploited during the operation of the mine. The former profile was built of crushed rocks, whereas the latter developed from fine earth material originated as an e�ect of grinding of pyrite-bearing schists. Major minerals inherited from parent mate-rial in both soils were: quartz, Mg,Fe-chlorite, micas (muscovite and paragonite), feld-spars, and low amounts of pyrite.
Soil morphology and basic soil properties
The soils investigated were weakly developed Technosols. The soil substrate was built of sulphide-bearing mine wastes, which formed noticeable layers (1C, 2C etc.) in the soil profiles. Typical feature of the soils investigated was a lack of well-developed genetic horizons.
The development of O and A horizons containing soil organic matter depended on the age of soil and the type of vegetation. These horizons did not occur in very young soil from Trzebinia (Profile 1) because of the lack of plant cover. Dark grey layers (1C and 3C horizon) in that soil contained crumbled hard coal deposited on the dump. In the topsoil of soils from Rudki (Profile 2 and 3), O and A horizons occurred, which maximum thicknesses reached 7 cm. The best developed O and A horizons were present in soils from Wieściszowice (profile 4 and 5).
The accumulation of soil organic matter is the main soil-forming process taking place in the soils studied. The thickness of O and A horizon can be a good indicator of the degree of the advancement of soil-forming processes. This indicator is sometimes used for esti-mation of the influence of the applied reclaiming methods on the development of techno-genic soils on mine spoils (e.g. Thomas, Jansen 1985; Wójcik, Krzaklewski 2007).
Variable amounts of organic matter occurred in the soils studied (Tables 1–5). Con-tents of organic matter are higher in the topsoils (A horizons) of majority of soils studied and they tend to decrease downwards within soil profiles. The exception is Profile 1
Ł. UZAROWICZ, S. SKIBA

289 TECHNOGENIC SOILS OF POLAND
containing high amounts of organic matter coming from crumbled hard coal. The amounts of hard coal are the highest in black layers, i.e. 1C and 3C horizons (Table 1). Profile 2 and 3 from Rudki contain 5.2% and 2.5% of organic carbon in A horizons, respec-tively. Profile 4 from Wieściszowice contained the highest amounts of typical soil organic matter (9.9%), as it was located in well-developed forest (Table 4). Profile 5 from Wieściszowice contain up to 2.6% of organic matter in A horizon (Table 5).
Apart from the accumulation of soil organic matter, no significant traces of other soil-forming processes were found in the soils investigated (Uzarowicz, Skiba 2011). Any of the brown coloured horizons did not fulfil the requirements typical of cambic horizon according to the WRB classification syst em (IUSS Working Group WRB 2007). Light grey (2.5Y 7/2) mottles occurring in Profile 5 from Wieściszowice are evidences of oxido-reduction (gleyic) processes. Stratification and changes in the texture between horizons within soil profiles investigated (well evidenced in Profile 1, 2, and 5) were not the e�ect of natural soil-forming processes, but originated due to random deposition of post-mining wastes.
The most typical feature of Technosols developed from iron sulphide-bearing mine wastes was their strong acidity, unless neutralising agents (e.g. carbonates) are present. Profiles 1, 3, 4, and 5 are strongly acidic because are devoid of carbonates (Table 1 and 3–5). In young technogenic soils from Trzebinia and Rudki (Profile 1 and 3), the pH (in H2O) values dropped below 3 in certain soil layers (Table 1 and 3). Such strong acidity is related to the presence of great amounts of iron sulphides, which constantly release sulphuric acid until they are totally weathered. Several centimetre large rock fragments composed of sulphides were often found during field work in the profiles from Trzebinia and Rudki. Moreover, high amounts of sulphide form of sulphur was a typical feature of these soils (Uzarowicz 2011). This indicates that great potential for acidification occur. On the other hand, low quantities of sulphide form of sulphur were found in soils from Wieściszowice (Profile 4 and 5). Therefore, these soils were less acidic (pH in H2O between 3.9 and 4.8). Weaker acidity in soils from Wieściszowice can be also caused by the occur-rence of certain amounts of base-forming cations (e.g. Mg and Ca) in soil solution. These cation can originate in soil solution due to weathering of Mg- and Ca-bearing minerals (e.g. chlorite and Ca feldspars) present in parent materials.
Profile 2 from Rudki had nearly neutral reaction (pH in H2O from 7.2 to 7.4, Table 2) in spite of vast amounts of sulphides (Uzarowicz 2011; Uzarowicz, Skiba 2011). A high pH value in that case was caused by the high content of carbonates (mainly dolomite) reaching 60.3% in 2C horizon (Table 2). Carbonates were primary minerals in the post-flotation sludge (2C horizon), which originated due to grinding a dolomitic sulphide ore. Calcium-bearing neutralising agents (e.g. calcium oxide) were also added to the soil (A and 1C horizons) during reclamation works in the 1970s.
Another indicators of degree of acidification are values of hydrolytic (residual) and exchangeable acidity (Tables 1 and 3–5). The highest values of hydrolytic acidity (up to
TECHNOGENIC SOILS DEVELOPED FROM MINE WASTES CONTAINING IRON SULPHIDES...

TECHNOGENIC SOILS OF POLAND 290
31.4 cmolc·kg-1) were obtained in soils from Trzebinia (Profile 1) and Rudki (Profile 3). These values were much lower in soils from Wieściszowice (Profile 4 and 5), excluding A horizons of the former profile, where high hydrolytic acidity (22.0 cmolc·kg-1) was most likely related to high amounts of humic acids. Hydrolytic acidity in near neutral Profile 2, where carbonates are present, is very low (Table 2).
Analysis of the exchangeable acidity permitted to trace the changes of proportion of exchangeable H and Al along with the increasing age of soils. It was found that ex-changeable H predominated among acid-forming cations in younger soils from Trzebin-ia and Rudki (Tables 1 and 3), whereas Al was a major exchangeable acid-forming cation in old Technosols from Wieściszowice. It seems that H originated as an e�ect of sul-phide oxidation is the main acid-forming cation in the first stage of sulphide weather-ing. Strong acidification caused by H leads to dissolution of less resistant aluminosili-cates and release of Al to soils. Therefore, exchangeable Al tends to predominate in soils where degree of sulphide weathering is more advanced.
Mineral transformations in soils
Mineral transformations are one of the most important aspects of the functioning of technogenic soils developed from mine wastes containing iron sulphides (e.g. Barnhisel, Massey 1969; Dixon et al. 1982; Grube et al. 1982; Uzarowicz, Skiba 2011). Iron sulphides (pyrite and marcasite) are not resistant to weathering, as they are not in the equilibrium with the soil environment where oxygen is available. Therefore, their transformations are rapid and have a great impact on soil properties causing strong acidification similar to that recognised in acid sulphate soils (e.g. Fanning et al. 2002). Moreover, acidity of soils leads to transformations of other minerals unstable in acidic soils (e.g. phyllosili-cates and carbonates).
Transformations of iron sulphidesIron sulphides in the soils studied were subject to both physical and chemical weather-ing (Uzarowicz 2013). However, the latter type of weathering expressed by the oxidation of iron sulphides resulting in (1) total decay (dissolution) of sulphides and (2) in situ gradual development of pseudomorphs, plays more important role in mineral alteration than the former, expressed by the physical disintegration of iron sulphide crystals. Iron and sulphuric acid is produced as an e�ect of iron sulphide oxidation according to the following simplified reaction (van Breemen 1982):
4FeS2 + 15O2 + 14H2O � 4Fe(OH)3 + 16H+ + 8SO42-
The degree of the advancement of iron sulphide chemical weathering in the se-quence of soils studied increased along with the increasing age of soils (Uzarowicz, Skiba 2011; Uzarowicz 2013), as evidenced by optical microscope observations and scanning
Ł. UZAROWICZ, S. SKIBA

291 TECHNOGENIC SOILS OF POLAND
electron microscope-energy dispersive spectroscopy (SEM-EDS) studies (Fig. 2A and 2B). Sulphides present in relatively young Technosols from Trzebinia and Rudki were poorly weathered. Weathering a�ected mostly surfaces of sulphide crystals and cracks in grains (Fig. 2A). The progress of sulphide weathering in old Technosols from Wieściszowice, related to the long duration of the process, was remarkably more ad-vanced than in young soils. Majority of sulphide crystals observed in these soils were almost totally weathered (Fig. 2B).
Iron released to soils during iron sulphide transformations crystallised as iron oxides and/or oxyhydroxides. Porous Fe oxides predominated in young soils from Rudki, whereas massive forms of iron oxides were found to privilege in old soils from Wieściszowice (Uzarowicz, Skiba 2011; Uzarowicz 2013) (Fig. 2B). This suggests that well crystallised iron oxides become more abundant with the increasing degree of ad-vancement of the weathering (soil-forming) processes in the sequence of soils studied. This finding was supported by both SEM-EDS studies, and selective extractions of Fe, which shown that higher Fed/Feo ratio was typical of old Technosols than young ones (Uzarowicz, Skiba 2011).
Sulphate ions, which were products of sulphide weathering, crystallized as sulphate minerals represented mainly by gypsum and jarosite group minerals (Uzarowicz, Skiba 2011; Uzarowicz 2013). Subhedral prismatic crystals of gypsum and euhedral cubic-shaped jarosite crystallised in soils from Trzebinia. Euhedral (or subhedral) prismatic crystals of gypsum were observed in the near neutral Profile 2 from Rudki, whereas subhedral platy crystals of gypsum were found in the strongly acidic Profile 3 (Fig. 2C and 2D). Jarosite in a form of euhedral cubic crystals was detected in the acidic Profile 3 from Rudki. Crystals of sulphate minerals were rarely found in Technosols from Wieściszowice (Fig. 2E). These minerals were represented by subhedral, prismatic crys-tals of gypsum (Uzarowicz, Skiba 2011; Uzarowicz et al. 2008), as well as subhedral and anhedral pseudocubic crystals of jarosite (Fig. 2F). The development of sulphate par-ageneses depended on soil pH. Jarosite was exclusively found in strongly acidic soils (this mineral was not detected e.g. in the former post-flotation sludge comprising 2C horizon of Profile 2), whereas gypsum crystallised both in acidic and neutral soils.
TECHNOGENIC SOILS DEVELOPED FROM MINE WASTES CONTAINING IRON SULPHIDES...

TECHNOGENIC SOILS OF POLAND 292
Fig. 2. SEM images of iron sulphides and e�ects of their weathering in the Technosols studied. A – BSE image of poorly weathered iron sulphides (1) from Profile 2 from Rudki, 2C horizon. B – BSE image of almost totally weathered iron sulphides (1) surrounded by secondary iron oxides (2), Profile 4 from Wieściszowice, A2 hori-zon. C – SE image of subhedral prismatic crystals of gypsum (Gy), nearly neutral Profile 2 from Rudki, 2C horizon. D – SE image of subhedral platy crystals of gypsum (Gy), Profile 3 from Rudki, 4C horizon. E – SE image of euhedral cubic crystals of jarosite (J), Profile 3 from Rudki, 4C horizon. F – SE image of anhe-dral and subhedral pseudocubic crystals of jarosite (J), Profile 5 from Wieściszowice, 3C horizon.
Ł. UZAROWICZ, S. SKIBA

293 TECHNOGENIC SOILS OF POLAND
Phyllosilicate transformations and pedogenic clays formationThe soils studied are characterised by a great diversity of phyllosilicates occurring in clay fraction (<2 µm) depending on mineral composition of soil parent material (Uzaro-wicz, Skiba 2011) (Table 6). These minerals can be divided into two groups: (1) minerals inherited from parent material and (2) secondary phases originated as an e�ect of weathering (soil-forming) processes mainly represented by swelling clay minerals.
Kaolinite and illite were predominant minerals in clay fraction of Profile 1 from Trzebinia (Table 6). These minerals were most likely inherited phases. Moreover, certain mixed-layer phases containing swelling interlayers (e.g. smectite-illite and/or vermicu-lite-illite) were found. They are probably pedogenic phase.
Illite and kaolinite were the main inherited clay minerals in both soils from Rudki (Profile 2 and 3). The major di�erence between these profiles is the concentration of swelling clays (smectite, vermiculite, and mixed-layer clays containing swelling inter-layers), which are most likely pedogenic minerals. Swelling clay minerals are absent in near neutral (pH around 7) Profile 2, whereas great amounts of these minerals were identified in acidic Profile 3. Moreover, vermiculite accompanied by hydroxy-interlay-ered minerals, smectite and certain mixed-layer clays were found in less acidic topsoil (A and 1C horizon, pH around 4.3) of Profile 3, whereas vermiculite was absent in strong-ly acidic subsoil (2C, 3C, and 4C horizon, pH <3), where smectite and certain mixed-layer clays occurred exclusively. This led to conclusion that the formation of smectite and vermiculite in the acidic range of pH seems to be dependent on the degree of acid-ification. Similar finding was documented in clay fraction of saprolites taken from the bottom of ponds characterised by diverse pH of waters occurring in the area of the abandoned pyrite mine in Wieściszowice (Uzarowicz et al. 2012).
Table 6. Minerals identified in the clay fraction (<2 µm) of the soils studied
Minerals in clay fraction
Study site
Trzebinia Rudki Wieściszowice
Primary / inherited phyllosilicates
K-mica, kaolinite K-mica, kaolinite K-mica, Na-mica, chlorite
Secondary / pedogenic clay minerals
Mixed-layer minerals containing swelling
interlayers
Smectite, vermiculite, hydroxy-interlayered minerals, mixed-layer minerals containing swelling interlayers
Smectite, mixed-layer minerals containing swelling interlayers,
kaolinite, vermiculite?
Clay fraction of technogenic soils from Wieściszowice (Profile 4 and 5) was predomi-nated by inherited minerals: trioctahedral Mg, Fe-chlorite, as well as dioctahedral K-mica (illite) and Na-mica (brammalite). Apart from the above mentioned minerals, also
TECHNOGENIC SOILS DEVELOPED FROM MINE WASTES CONTAINING IRON SULPHIDES...

TECHNOGENIC SOILS OF POLAND 294
smectite and/or mixed-layer clays containing swelling interlayers, which most likely were secondary minerals, occurred. Moreover, kaolinite was found to be concentrated in relatively well developed humus horizon of Profile 4. This indicates that A horizon may be a suitable environment for kaolinite to be formed by crystallisation from soil solu-tion rich in Al and Si (Uzarowicz et al. 2011).
Trace elements in soils
The technogenic soils investigated contained elevated amounts of trace elements (Tables 1–5). It is a typical feature of not only Technosols itself, but mine wastes, from which these soils are developed. This involves in particular those mine wastes located in the vicinity of coal and sulphide mines exploiting polymetallic ores (e.g. Barnhisel, Massey 1969; Dang et al. 2002; Johnson 2003; Lu et al. 2005).
Although previous investigations (Uzarowicz 2013) shown, that iron sulphides in the soils studied are not the major carrier of trace elements, elevated amounts of these elements in bulk soil samples (Uzarowicz 2011) indicate that other metal-bearing host minerals, not identified in detail, occur in Technosols studied. The recognition of the mineral paragenesis occurring in mine wastes with the application of a combination of analytical techniques (e.g. diverse microscopic methods), permits the determination of the course and the degree of the advancement of mineral weathering. Therefore, it al-lows to assess the potential risk related to the release of toxic elements into the envi-ronment (Jamieson 2011 and references therein).
The results obtained show that amounts of trace metals di�er each other between specific soil horizon (layer), which is related to di�erent properties of layers (e.g. mineral composition). Technosols developed from mine wastes coming from the abandoned ‘Siersza’ hard coal mine in Trzebinia (represented by Profile 1) contained relatively high amounts of Zn, Cd, and Sb in certain layers (Table 1). Moreover, these soils have elevat-ed amounts of radioactive elements, particularly Th. Radioactive elements are common constituents of coals. Content of Th in coals from the Upper Silesian Coal Basin in Po-land (the mine in Trzebinia was a part of this basin) ranges from <0.1 to 33.5 mg·kg-1, and U – from 0.1 to 8.5 mg·kg-1 (Bojakowska et al. 2008; Olkuski, Stala-Szlugaj 2009).
Profile 2 developed on former flotation tanks in the vicinity of the abandoned pyrite mine in Rudki contained very high amounts of Pb, as well as high amounts of Zn, Cd, As, and Tl (Table 2). Profile 3 from Rudki had high quantities of Pb, Cd, Tl, and Sb in certain soil layers (Table 3). Both profiles from Rudki contained very high amounts of radioactive elements, in particular U. The occurrence of radioactive elements in soils from Rudki is related to the occurrence of polymetallic uranium mineralization in sulfide ores (Szecówka 1987), and subsequent deposition of contaminated materials on the land surface.
Ł. UZAROWICZ, S. SKIBA

295 TECHNOGENIC SOILS OF POLAND
Profile 4 and 5 developed on mine dumps of the abandoned pyrite mine in Wieściszowice contained relatively high amounts Cu, As, and Sb (Table 4 and 5). Contrary to soils from Trzebinia and Rudki, Technosols from Wieściszowice do not contain Cd (its quantities are lower than 0.5 mg·kg-1). Amounts of radioactive elements in the latter soils are low as well.
Comparison of the results obtained with the Polish ordinance regulating accessible amounts of pollutants (including trace elements) in soils (Regulation of the Minister of the Environment 2002) revealed that contents of As were higher than accessible amounts (60 mg·kg-1) in Profile 4, and contents of Pb exceeded accessible amounts (600 mg·kg-1) in Profile 2 (Uzarowicz, Maciejewska 2012), taking into account that the soils studied are located in industrial areas and they belong to the ‘C’ group in the ordi-nance mentioned.
Management of soils
Technosols developed from sulphide-bearing mine wastes should be managed in rea-sonable way taking under consideration their properties, which can vary between each mine waste landfill. The management of mine spoils investigated should consider, first of all, strong acidity and possible chemical contamination e.g. related to the occurrence of trace elements.
Before the management of mine spoils, the technogenic soils containing iron sul-phides should be reclaimed to restore an ecological balance in the industrial area as soon as possible. First of all, unless neutralising agents are present in soils, they should be treated with Ca- and/or Mg-containing compounds (e.g. lime or carbonates) to neu-tralise strong acidity. It is a common procedure used in acidified soils (e.g. Karczewska 2008). Unlike soils devoid of sulphides, neutralisation of sulphide-bearing Technosols should take under consideration not only present degree of acidification (expresses as pH or hydrolytic acidity), but also potential acidification that will be arising during pro-gressive weathering of sulphide grains of sulphide-bearing rock fragments in soil. The pH changes that occur in soils containing sulphide minerals, can be predicted using a test of susceptibility of sulphides to oxidation (e.g. Strzyszcz 1988). The dose of neu-tralising agent can be adjust to the potential acidity that will occur in soil in the future. This dose can be also assessed on the basis of amounts of sulphide form of sulphur in soil determined using a proper analytical method. The dose of neutralising agent (e.g. CaO or CaCO3) should not be calculated applying a procedure commonly used in agricul-tural chemistry based on a value of measured hydrolytic acidity (e.g. Strzyszcz 1988). The dose calculated in this manner will be underestimated in the case of sulphide-bearing soils.
Trace element contamination of soils seems to be among more serious environmental problems concerning the management of sulphide-bearing Technosols than the soil
TECHNOGENIC SOILS DEVELOPED FROM MINE WASTES CONTAINING IRON SULPHIDES...

TECHNOGENIC SOILS OF POLAND 296
acidification itself. First of all, there are no ideal method to make trace elements occurring in soils less harmful for the environment and human. These elements can be, for exam-ple, blocked in soils (e.g. be neutralisation of acidity), which is relatively easy and inex-pensive to do (e.g. Karczewska 2008). Thus, trace elements can be less available for plants. However, a blocked trace metals are still present in soil and they can, in fact, pose a problem unresolved. On the other hand, the contaminated mine wastes can be totally removed and transported to another place, which could be an expensive work. Moreover, a problem what to do with a removed wastes can arise. In the end, trace met-als can be removed using phytoremediation techniques, which is not ideal solution as well. The most serious problem can arise when radioactive elements occur in Techno-sols. Radioactive elements in soils studied may cause toxicological hazard, as these elements might be taken by plants in excessive amounts. They may also pose a prob-lem caused by radiation released during the radioactive decay of elements.
Summary
Technosols developed from mine wastes containing iron sulphides, despite their tech-nogenic origin, undergo natural soil-forming and weathering processes. One of the most important aspects of natural functioning of the soils studied are rapid mineral transformations of sulphide-bearing parent materials.
First of all, weathering of iron sulphides influences the chemical properties of soils enormously by strong acidification, unless neutralising agents are present. Hydrogen is the most active acid-forming cation in the first stage of iron sulphide weathering, whereas aluminium tends to be more and more active along with the increasing age of soils. Furthermore, mineral transformations of iron sulphides leads to the formation of secondary sulphates (mainly gypsum and jarosite) and iron oxides, which influence e.g. soil colour. Moreover, strong acidification causes alteration of other groups of minerals. The most pronounced are phyllosilicate transformation into swelling pedogenic clays (smectite and vermiculite), which formation is dependent on degree of soil acidifica-tion. Smectite is the major clay mineral originating in the most acidic soils (pH<3). In less acidic soils (pH 4–5), vermiculite, hydroxy-interlayered minerals, along with smec-tite form, whereas swelling clay minerals are minor constituent of clay fraction in near-ly neutral soils (pH around 7).
The soils investigated contained high amounts of trace metals, including radioac-tive elements. Therefore the sulphide-bearing mine waste landfills, and soils contain-ing sulphides should be always carefully managed. It is strongly suggested to gather as many information as possible before the management of mine spoils to determine the properties of Technosols. Among others, the degree of acidification, mineral composi-tion of soils, and degree of contamination should be determined. Taking into account
Ł. UZAROWICZ, S. SKIBA
297 TECHNOGENIC SOILS OF POLAND
a possible strong contamination of soils, certain kinds of management (e.g. agricul-tural use or building) of mine wastes landfills containing sulphides should be avoided, and sometimes forbidden.
References
1. Barnhisel R.I., Massey H.F. 1969. Chemical, mineralogical and physical properties of Eastern Kentucky acid-forming coal spoil materials. Soil Sci. 108: 367–372.
2. Barnhisel R.I., Rotromel A.L. 1974. Weathering of clay minerals by simulated acid coal spoil-bank solutions. Soil Sci. 118: 22–27.
3. Bojakowska I., Lech D., Wołkowicz S. 2008. Uranium and thorium in hard and brown coals from Polish deposits. Gospod. Surowcami Min. 24(2/2): 53–65 (in Polish with English abstract).
4. Bzowski Z., Strzyszcz Z. 1993. Changes of mineral composition of carboniferous claystones located on hard-coal heaps caused by the weathering processes. [In:] Proceedings of the 4th
International Symposium on the Reclamation, Treatment and Utilization of Coal Mining Wastes, Cracow, Poland: 95–99.
5. Commission V on Genesis, Classification and Cartography of Soils PSSS. 2011. Polish Soil Classification (Systematyka Gleb Polski), 5th edition. Rocz. Glebozn. 62(3): 1–193 (in Polish with English abstract).
6. Dang Z., Liu C., Haigh M.J. 2002. Mobility of heavy metals associated with the natural weath-ering of coal mine spoils. Environ. Pollut. 118: 419–426.
7. Dixon J.B., Hosser L.R., Senkayi A.L., Egashira K. 1982. Mineralogical properties of lignite over-burden as they relate to mine spoil reclamation. [In:] J. A. Kittrick, D.S. Fanning, L.R. Hossner (Eds.). Acid Sulfate Weathering. SSSA Special Publication no. 10, Madison, Wisconsin: 169–191.
8. Fanning D.S., Rabenhorst M.C., Burch S.N., Islam K.R., Tangren S.A. 2002. Sulfides and Sul-fates. [In:] J.B. Dixon and D.G. Schulze (Eds.). Soil Mineralogy with Environmental Applica-tions. SSSA, Madison: 229–260.
9. Grube W.E. JR., Smith R.M., Ammons J.T. 1982. Mineralogical alterations that a�ect pedogenesis in minesoils from bituminous coal overburdens. [In:] J.A. Kittrick, D.S. Fanning and L.R. Hossner (Eds.). Acid Sulfate Weathering. SSSA Special Publication, 10, Madison, Wisconsin: 209–223.
10. IUSS Working Group WRB. 2007. World References Base for Soil Resources 2006. Update 2007, World Soil Resources Reports, 103, FAO, Rome.
11. Jamieson H.E. 2011. Geochemistry and mineralogy of solid mine waste: essential knowledge for predicting environmental impact. Elements 7: 381–386.
12. Johnson D.B. 2003. Chemical and microbiological characteristics of mineral spoils and drain-age waters at abandoned coal and metal mines. Water Air Soil Pollut. 3: 47–66.
13. Kabata-Pendias A. 2010. Trace Elements in Soils and Plants. Fourth Edition. CRC Press.
14. Karczewska A. 2008. Soil conservation and reclamation of degraded areas. WUP, Wrocław (in Polish).
TECHNOGENIC SOILS DEVELOPED FROM MINE WASTES CONTAINING IRON SULPHIDES...

TECHNOGENIC SOILS OF POLAND 298
15. Kostenko I.V., Opanasenko N.E. 2005. Soil formation on sulfide mine dumps in the Western Donets Basin upon their overgrowing. Pochvovedenie 11: 1357–1365 (in Russian with English abstract).
16. Krzaklewski W. 1990. The analysis of reclamation activity in post-mining areas in main indus-trial branches in Poland. SGGW–AR, Warsaw (in Polish).
17. Lu L., Wang R., Chen F., Xue J., Zhang P., Lu J. 2005. Element mobility during pyrite weathering: implications for acid and heavy metal pollution at mining-impacted sites. Environ. Geol. 49: 82–89.
18. Olkuski T., Stala-Szlugaj K. 2009. The occurrence of radioactive elements in hard coal from the Upper Silesian Coal Basin. Gospod. Surowcami Min. 25(1): 5–17 (in Polish with English abstract).
19. Regulation of the Minister of the Environment dated September 9, 2002 on soil and land quality standards (Journal of Laws No. 165, item 1359, October 4, 2002).
20. Skawina T. 1959. The processes of soil deterioration in mining and industrial regions. Rocz. Glebozn. 7: 131–148 (in Polish with English abstract).
21. Skawina T., Trafas M., Gołda T. 1974. Recultivation of after-mine areas of the pyrite mine ‘Siarkopol’ in Rudki near Kielce. Zesz. Nauk. AGH, 466, Sozol. Sozotech. 4: 9–21 (in Polish with English abstract).
22. Struthers P.H. 1964. Chemical weathering of strip-mine spoils. Ohio J. Sci. 64: 125–131.
23. Strzyszcz Z. 1978. Changes in the chemistry of carboniferous formations from the aspect of biological recultivation and utilization of central waste dumps. Prace i Studia PAN 19: p. 118 (in Polish with English abstract).
24. Strzyszcz Z. 1988. Natural basis of dump reclamation in underground hard coal mining. Zeszyty Naukowe AGH, 1222, Sozologia i Sozotechnika 26: 159–173 (in Polish with English abstract).
25. Szecówka M. 1987. Uranium mineralization in Rudki by Słupia Nowa (Holy-Cross Mts.). Prace Geologiczne PAN 133: p. 91 (in Polish with English abstract).
26. Thomas D., Jansen I. 1985. Soil development in coal mine spoils. J. Soil Water Conserv. 40: 439–442.
27. Uzarowicz Ł. 2011. Technogenic soils developed on mine spoils containing iron sulfides in select abandoned industrial sites: Environmental hazards and reclamation possibilities. Pol. J. Environ. Stud. 20: 771–782.
28. Uzarowicz Ł. 2013. Microscopic and microchemical study of iron sulphide weathering in a chronosequence of technogenic and natural soils. Geoderma 197–198: 137–150.
29. Uzarowicz Ł., Maciejewska A. 2012. Assessment of properties of technogenic soils Technosols containing iron sulfides. Rocz. Glebozn. 63(3): 37–42 (in Polish with English abstract).
30. Uzarowicz Ł., Skiba S. 2011. Technogenic soils developed on mine spoils containing iron sulphides: Mineral transformations as an indicator of pedogenesis. Geoderma 163: 95–108.
31. Uzarowicz Ł., Skiba S., Skiba M., Michalik M. 2008. Mineral transformations in soils on spoil heaps of an abandoned pyrite mine in Wieściszowice (Rudawy Janowickie Mts., Lower Silesia). Pol. J. Soil Sci. 41(2): 183–193.
Ł. UZAROWICZ, S. SKIBA
299 TECHNOGENIC SOILS OF POLAND
32. Uzarowicz Ł., Skiba S., Skiba M., Šegvić B. 2011. Clay-mineral formation in soils developed in the weathering zone of pyrite-bearing schists: A case study from the abandoned pyrite mine in Wieściszowice, Lower Silesia, Poland. Clays Clay Miner. 59: 581–594.
33. Uzarowicz Ł., Šegvić B., Michalik M., Bylina P. 2012. The e�ect of hydrochemical conditions and pH of the environment on phyllosilicate transformations in the weathering zone of py-rite-bearing schists in Wieściszowice (SW Poland) http://claymin.geoscienceworld.org/con-tent/47/4/401.abstract – fn-1. Clay Minerals 47: 401–417.
34. van Breemen N. 1982. Genesis, morphology, and classification of acid sulfate soils in coastal plains. [in:] J.A. Kittrick, D.S. Fanning, L.R. Hossner (Eds.). Acid Sulfate Weathering. SSSA Special Publication no. 10, Madison, Wisconsin: 95–108.
35. van Reeuwijk L.P. (Ed.) 2002. Procedures for soil analysis. Technical Paper 9, ISRIC, Wageningen.
36. Warda A. 2007. Assessment of reclamation e�ects in ‘Staszic’ mine in Rudki near Kielce. Geomatics and Environmental Engineering 1: 181–196 (in Polish).
37. Wójcik J., Krzaklewski W. 2007. Accumulation of organic matter in the initial soils on the ex-ternal waste heap of the ‘Adamów’ Lignite Mine. Rocz. Glebozn. 58: 151–159 (in Polish, with English abstract).
TECHNOGENIC SOILS DEVELOPED FROM MINE WASTES CONTAINING IRON SULPHIDES...


301 TECHNOGENIC SOILS OF POLAND
SOILS OF URBAN FORESTS AND PARKS OF THE UPPER SILESIA REGION
TADEUSZ MAGIERA MARZENA RACHWAŁ ADAM ŁUKASIK
16Introduction
The basic research tools currently applied in soil pollution assessment are still chemical methods. Development of these methods in recent years significantly improved the accuracy of chemical analyses and the range of determination of particular elements, nevertheless increased the cost of these analyses. As a result, the research needs in the area of environmental state assessment have increased and cheaper methods involving the use of so-called ‘indicators of environmental pollution’, that can partially replace the direct chemical analyses in the initial assessment of environmental state, espe-cially in urban and post-industrial areas, where a high spatial variability of chemical pollutants does not allow a precise determination of the range of geochemical anoma-lies have been searched.
According to the European Environment Agency (EEA), an indicator of the environ-ment is a parameter that provides information about the current environmental situa-tion and time-spatial trends of the changes therein (Smeets, Weterings 1999). These criteria are performed by both biomarkers (called bioindicators) and easily measurable geophysical parameters recording the occurrence of the potential environmental haz-ard as well as its spatial range and changes over time. In accordance with the multi-stage principle of contaminated land management (EEA Report 2003), the first step should be preliminary land recognition, confirming or excluding the possibility of the presence of contaminants, and determining the possible extent of territorial range of the occurrence of contamination (anomalies). For this purpose, quick and inexpensive methods should be applied, mainly based on the field measurements.
The above mentioned criteria are met by soil magnetometry. It is a method based on the assumption, that magnetic iron oxides are component of many industrial and ur-ban dusts. The presence of ferrimagnetic iron oxides in topsoil can be easily detected using a simple and fast geophysical methods, based on the measurement of magnetic

TECHNOGENIC SOILS OF POLAND 302
T. MAGIERA, M. RACHWAŁ, A. ŁUKASIK
susceptibility (ĸ). Iron oxides produced during high temperature technological process-es of di�erent branches of industry are generally called technogenic magnetic particles (TMP). They contain lots of defects in the crystal lattice, where iron is substituted by other metals, and their extensive surface area allows the adsorption of many heavy metals. As a result, in many areas of long-term deposition of industrial, urban or tra�c-related dusts, geochemical anomalies are also accompanied by magnetic anomalies.
Stuczyński proposed the stepwise scheme to identify areas where the exceedance of allowable values of soil pollution occurred (Stuczyński et al. 2004). Thus, soil mag-netometry could be introduced as one of the methods of preliminary studies, intended at the beginning of the second stage of the procedure, before the determination of heavy metal content with chemical methods. It will allow the demonstration of the presence (or absence) of TMP and associated heavy metals, their spatial range and, in the case of ascertaining the existence of magnetic-geochemical anomaly, precisely indication of sampling sites, and thus reduction of their number, cutting the cost of chemical analyses, which usually comprises the major part of the monitoring costs.
Taking into account the suggestions included in the methodological guide for the administration, precise determination (percentage) of the surface where there is a risk of exceedance of threshold limit values (TLV) of heavy metal content is of crucial impor-tance for the number of soil samples necessary for sampling to perform chemical analy-ses. For example, if a potentially contaminated area accounts for 20% of the tested surface, 9 samples are recommended, and in the case of 5% of the surface, or a lack of such data, the number of samples increases to 24.
The degree of the impact of air pollution on soils depends on many factors, mainly on the amount of emitted pollutants, their spreading and the distance from the emis-sion source, as well as the form of land use (arable soils, meadows and pastures, forest habitats) (Magiera et al. 2006; Magiera, Zawadzki 2007). The above mentioned guide-lines primarily refer to agricultural soils. Research on the application of magnetometry in forest areas being under the influence of industrial emissions showed, that the growth in magnetic susceptibility was particularly high in the southern Poland (Strzyszcz et al. 1996; Strzyszcz, Magiera 1998). In the parks and forest areas of the Upper Silesian Industrial Region (USIR), the part of primary deposition of industrial and urban dusts settles on the leaves and needles forming tree crowns, and is a source of secondary emissions, which at a certain speed of wind get back to ground-level air layer and set-tles on the soil, additionally raising the value of magnetic susceptibility of the surface soil layer in wooded areas in relation to uncovered areas.
The above mentioned results suggest, that also in the area of urban forests and parks, being in the range of strong technopression, the connection of field geophysical (magnetic) techniques with a limited number of chemical analyses will enable the e�-cient identification of chemical hazards associated with industrial dust accumulation in the soil. The studies included selected larger forest areas located in the cities of the

303 TECHNOGENIC SOILS OF POLAND
SOILS OF URBAN FORESTS AND PARKS OF THE UPPER SILESIA REGION
USIR, making up the fragments of the Forest Protective Belt of the USIR, as well as much smaller parks located in the central parts of the cities of the USIR. On these objects the preliminary surface survey was performed, based on the measurements of soil magnetic susceptibility in a dense measurement network dependent on field condi-tions in the area of the particular forest or park, and specific chemical analyses of heavy metal content in the places of local magnetic anomalies (maximum and minimum) in order to determine the suitability of the soil magnetometry for the assessment of the level of soil contamination with heavy metals in such areas.
Study area
The first type of objects, where the research was conducted, were relatively large park and forest complexes, situated in the area of the cities of the central part of the USIR, included in the Forest Protective Belt of the USIR (Fig. 1):
The Makoszowy Wood in Zabrze – an area of approximately 450 hectares, located in the southern part of Zabrze, between Zabrze and Sośnica (Gliwice district), from the south directly adjacent to the ‘Sośnica-Makoszowy’ Mine and the former coking plant, being the area of Sunday walks and rest of the inhabitants of Zabrze and Sośnica. This park is impacted by emissions from the ‘Sośnica-Makoszowy’ and ‘Bielszowice’ mines, and local emission from nearby housing developments of the southern districts of Zabrze and Gliwice.
The Edmund Osmańczyk Park located in an area of Bytom, between the districts: Stroszek, Miechowice, Stolarzowice, Sucha Góra, and Helenka, the district of Zabrze – an area of approximately 2200 hectares, is a combination of urban park and natural forest complexes. Recreational function of this area has increased after the location in Sucha Góra (the district of Bytom), in the quarries after former exploitation of dolomite, sports and recreation complex called the Sport Valley. This area is situated in the range of the influence of the former ‘Orzeł Biały’ zinc and lead works in Piekary Śląskie, and the still active ‘Miasteczko Śląskie’ zinc works.

TECHNOGENIC SOILS OF POLAND 304
Figure 1. Location of research objects: 1 – The Makoszowy Wood; 2 – The Edmund Osmańczyk Park; 3 – The Panewnik-Kochłowice Forests; 4 – The Silesian Park; 5 – The Fallen Heroes Park in Zabrze; 6 – The City Park in Tarnowskie Góry; 7 – The Tadeusz Kościuszko Park in Katowice; 8 – The City Park ‘Green’ in Dąbrowa Górnicza
The Panewnik-Kochłowice Forests, located in the area of three cities: Ruda Śląska, Chorzów and Katowice – cover an area of approximately 1 200 hectares, extending be-tween Kochłowice (the district of Ruda Śląska) in the west, Panewniki (the district of Katowice) in the south, and Załęska Hałda (the district of Katowice) in the east. From the north the border of the area constitutes the A4 motorway. The tested area directly adjoins the terrains of the ‘Śląsk’ Mine from the north, and the terrains of the ‘Wujek’ Mine from the east. Approximately 2 km to the west the ‘Halemba’ Mine and Power Plant are located, and to the south – a sewage treatment plant. In the area of the com-plex the following centers are located: the Sports and Recreation Center of the ‘Nowy Wirek’ Hard Coal Mine, the Sunday Holiday Center of the ‘Śląsk’ Hard Coal Mine, and the ‘Radoszowy’ Sunday Leisure Center.
T. MAGIERA, M. RACHWAŁ, A. ŁUKASIK

305 TECHNOGENIC SOILS OF POLAND
The Silesian Park covers an area of over 600 hectares and was established in 1951 on wastelands and post-mining dumps located at the interface of three Silesian cities (Chorzów, Katowice and Siemianowice Śląskie). During the construction of the park about 3.5 mln m3 of soil and ground was moved, and 0.5 mln m3 of soil and peat was brought. It is now a place for recreation for the people of the entire Province of Silesia. The main sources of emissions in this region are the following iron foundries: the ‘Kościuszko’ Foundry in Chorzów, the ‘Siemianowice’ Foundry, as well as zinc and lead works in Wełnowiec (the district of Katowice).
The second type of areas where the research was conducted, were typical urban parks located in the central parts of the cities of the USIR, with the surface area ranging from about a dozen to dozens of hectares with diversified degree and character of hu-man-induced transformations:
The Fallen Heroes Park in Zabrze, located in the center of the city, whose total area is 13.45 hectares. Over its eastern part, in a north-southerly direction, the car overpass runs, built in October 2002. In the area of the park, in addition to the visible elements of the infrastructure (overpass, playgrounds, concreted ground), there are heating, elec-tricity, sewerage and telecommunication supply networks running underground.
The City Park in Tarnowskie Góry is located in the southern part of the city and covers an area of 21.5 hectares. In the area of the park the traces of old mining activity of Zn-Pb ores are observed quite frequently. In many places there are so-called ‘warpia’, which are small mounds up to 5 m in height, made of waste material derived from mining processes. Due to the architecture, the park can be divided into two parts: the developed central and eastern (gazebos, walking paths, annual removal of the foliage deposition, individual shrubs on the lawns), and the undeveloped western, where the presence of old fallen trees was noted, as well as denser undergrowth, and the presence of litter on the soil surface.
The Tadeusz Kościuszko Park in Katowice, with an area of 72 hectares, is located in the center of the city. On the northern border of the park the A4 motorway runs, and from the west and the east the park is surrounded by communication roads: the Mikołowska street (a part of the S 81) and the Tadeusz Kościuszko street – one of the main arteries of the city connecting the center with the southern districts. The land-scape of the park is formed by a radial, broad avenues intersecting both open areas and compact parts of tree stands with abundant undergrowth and ground cover.
The City Park ‘Green’ in Dąbrowa Górnicza covers an area of 67 hectares and is lo-cated on the northern outskirts of the town. In its immediate vicinity (1.5 km) the ‘Łagisza’ Power Plant is situated. The eastern part of the park is developed (avenues, benches, squares, gazebos, landscape glades), but the western part has typical forest character with single-storied stand and dense undergrowth. Besides, there is the ‘Green Wilderness’ ecological site in the area of the park, in its south-eastern part.
SOILS OF URBAN FORESTS AND PARKS OF THE UPPER SILESIA REGION
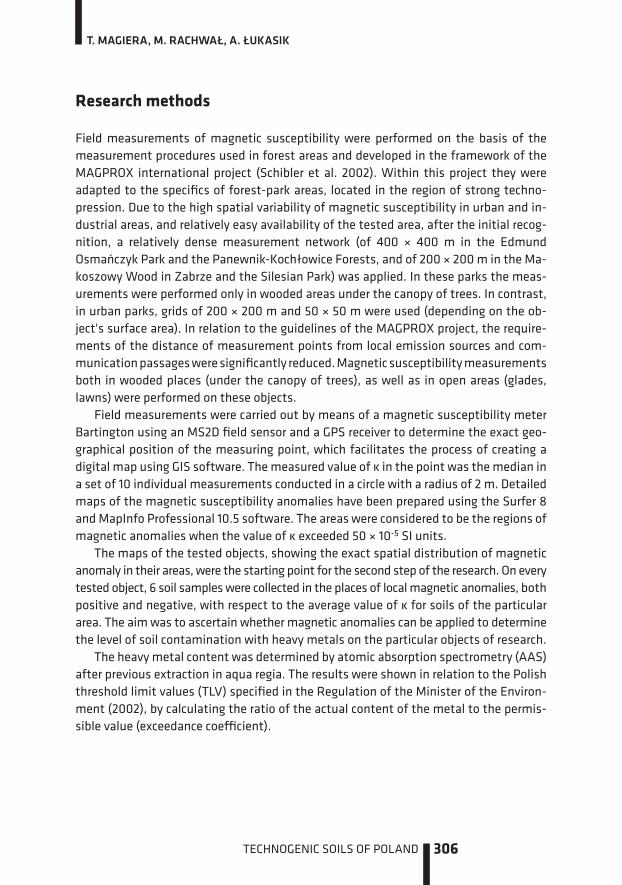
TECHNOGENIC SOILS OF POLAND 306
Research methods
Field measurements of magnetic susceptibility were performed on the basis of the measurement procedures used in forest areas and developed in the framework of the MAGPROX international project (Schibler et al. 2002). Within this project they were adapted to the specifics of forest-park areas, located in the region of strong techno-pression. Due to the high spatial variability of magnetic susceptibility in urban and in-dustrial areas, and relatively easy availability of the tested area, after the initial recog-nition, a relatively dense measurement network (of 400 × 400 m in the Edmund Osmańczyk Park and the Panewnik-Kochłowice Forests, and of 200 × 200 m in the Ma-koszowy Wood in Zabrze and the Silesian Park) was applied. In these parks the meas-urements were performed only in wooded areas under the canopy of trees. In contrast, in urban parks, grids of 200 × 200 m and 50 × 50 m were used (depending on the ob-ject's surface area). In relation to the guidelines of the MAGPROX project, the require-ments of the distance of measurement points from local emission sources and com-munication passages were significantly reduced. Magnetic susceptibility measurements both in wooded places (under the canopy of trees), as well as in open areas (glades, lawns) were performed on these objects.
Field measurements were carried out by means of a magnetic susceptibility meter Bartington using an MS2D field sensor and a GPS receiver to determine the exact geo-graphical position of the measuring point, which facilitates the process of creating a digital map using GIS software. The measured value of ĸ in the point was the median in a set of 10 individual measurements conducted in a circle with a radius of 2 m. Detailed maps of the magnetic susceptibility anomalies have been prepared using the Surfer 8 and MapInfo Professional 10.5 software. The areas were considered to be the regions of magnetic anomalies when the value of ĸ exceeded 50 × 10-5 SI units.
The maps of the tested objects, showing the exact spatial distribution of magnetic anomaly in their areas, were the starting point for the second step of the research. On every tested object, 6 soil samples were collected in the places of local magnetic anomalies, both positive and negative, with respect to the average value of ĸ for soils of the particular area. The aim was to ascertain whether magnetic anomalies can be applied to determine the level of soil contamination with heavy metals on the particular objects of research.
The heavy metal content was determined by atomic absorption spectrometry (AAS) after previous extraction in aqua regia. The results were shown in relation to the Polish threshold limit values (TLV) specified in the Regulation of the Minister of the Environ-ment (2002), by calculating the ratio of the actual content of the metal to the permis-sible value (exceedance coe�cient).
T. MAGIERA, M. RACHWAŁ, A. ŁUKASIK

307 TECHNOGENIC SOILS OF POLAND
Assessment of soil pollution using joint magnetic and geochemical methods
In the area of the Makoszowy Wood in Zabrze, the measurements of ĸ values were per-formed at 75 measuring points. They ranged from 11.8 to 129.0 × 10⁻⁵ SI units (Fig. 2).
Table 1. The ratio between the content of selected heavy metals and corresponding threshold limit values (Regulation of the Minister of Environment 2002) for selected soil samples in large forest objects – exceedance coe�cients
Point number Zn Pb Cd Cu Cr Ni
Makoszowy Wood in Zabrze
3 0.8 5.1 3.7 0.8 0.2 0.111 0.4 1.4 1.8 0.3 0.1 0.1
14 0.7 1.3 5.9 0.4 0.1 0.1
19 1.6 3.4 5.2 0.4 0.1 0.1
31 0.5 2.5 2.1 0.3 0.1 0.166 0.6 2.7 1.8 0.3 0.1 0.1
Edmund Osmańczyk Park in Bytom
6 0.9 12.1 5.2 0.5 0.1 0.128 3.0 10.3 12.9 0.5 0.2 0.2
39 4.3 4.0 10.4 0.5 0.1 0.1
44 2.7 5.4 9.6 0.3 0.1 0.1
64 1.1 9.2 4.8 0.5 0.1 0.195 0.9 10.0 6.1 0.7 0.2 0.1
Panewnik-Kochłowice Forests in Katowice/Ruda Śl.
4 1.4 15.9 6.3 1.4 0.2 0.222 0.6 1.3 1.7 0.2 0.1 0.1
29 2.2 2.4 7.3 0.4 0.1 0.1
39 1.6 4.4 5.9 0.5 0.1 0.1
52 2.0 7.4 7.8 0.6 0.2 0.253 2.1 11.4 5.4 1.0 0.2 0.2
Silesian Park in Chorzów
26 5.4 4.2 16.8 0.5 0.1 0.118 2.2 1.9 7.4 0.3 0.1 0.1
53 7.5 7.8 20.5 0.7 0.1 0.1
73 5.7 5.6 14.1 0.5 0.1 0.1
102 3.0 2.8 7.3 0.3 0.1 0.1111 3.4 3.7 9.5 0.4 0.1 0.1
SOILS OF URBAN FORESTS AND PARKS OF THE UPPER SILESIA REGION

TECHNOGENIC SOILS OF POLAND 308
Fig. 2. Distribution of soil magnetic susceptibility (ĸ) measured in situ in the Makoszowy Wood in Zabrze
Fig. 3. Distribution of soil magnetic susceptibility (ĸ) measured in situ in the Edmund Osmańczyk Park in Bytom
The highest positive magnetic anomaly is located in the northern part of the park, on the border with a housing estate, where the presence of a number of illegal (‘wild’) rubbish dumps was revealed. In the distance of several meters from that place a play-ground was located.
T. MAGIERA, M. RACHWAŁ, A. ŁUKASIK

309 TECHNOGENIC SOILS OF POLAND
Wide variations in magnetic susceptibility values can result from either the type of tree stand (deciduous, coniferous), its age, physicochemical properties of the soil, as well as the location of the measuring point in relation to the main source of emissions. In the case of the discussed park, considerable impact have the emitters of pollutants mentioned earlier: the former ‘Makoszowy’ Coking Plant, waste dumps of Makoszowy-Sośnica Mine, as well as the local emission, which source are domestic furnaces of the city of Zabrze and Sośnica – the district of Gliwice city.
Different values of magnetic susceptibility are accompanied by diverse content of heavy metals in the soils of the tested area. In the case of lead and cadmium, in all examined measuring points, the content exceeded the permissible values (Table 1). In the case of zinc, the excess was noted only at one point, in the area of anomalies in the eastern part of the investigated park. The content of other metals is highly variable. The content of Pb is exceeded approximately 2–3 times, and Cd even more than five times (2 samples). The content of Cu, Cr and Ni are within the TLV. The situation when lead prevails over zinc often takes place in soils nearby coking plant (Tokarska, Zajusz-Zubek 1996, Górka et al. 2001) and perhaps in this region it is a result of the activity of the former ‘Makoszowy’ Coking Plant.
High correlation coe�cient between the content of lead and the ĸ value accounts for technogenic sources of lead present in the soil of the Makoszowy Wood. Significant correlations between the ĸ value and the content of Cu and Cr were also observed, which can also evidence their technogenic origin, although the content of these ele-ments is lower than the permissible limit values (Table 3).
The Edmund Osmańczyk Park is located in the administrative area of Bytom and Tarnowskie Góry, and is a�ected by dust pollution, mainly coming from industrial plants located in the city of Bytom, as well as neighboring cities: Ruda Śląska and Chorzów inter alia.
The soils of the park are characterized by similar ĸ values as in the case of the Mako-szowy Wood. They ranged from 19.8 to 135.6 × 10⁻⁵ SI units. Its values are high in the southern part of the park, in the area of Bytom districts – Bobrek and Miechowice, and nearby Zabrze Rokitnica (Fig. 3). The reasons should be searched in the emissions com-ing from the major emitters of this region: steelwork and coking plant in Bobrek, the ‘Jadwiga’ Coking Plant, the ‘Miechowice’ Power Plant, as well as heat and power station in Zabrze Rokitnica. The central and northern part of the tested object, particularly the north-western part of it, can be regarded as an area of low degree of soil hazard by in-dustrial and urban deposition, because the magnetic susceptibility of these soils is low and does not exceed the value of 50 × 10-5 SI units. Based on previous studies, the mentioned value was considered as ‘alarming’ value. In the areas, where this value is higher, detailed geochemical analyses are absolutely necessary to perform (Strzyszcz, Magiera 2003; Strzyszcz 2004).
SOILS OF URBAN FORESTS AND PARKS OF THE UPPER SILESIA REGION

TECHNOGENIC SOILS OF POLAND 310
Fig. 4. Distribution of soil magnetic susceptibility (ĸ) measured in situ in the Panewnik-Kochłowice Forests
Fig. 5. Distribution of soil magnetic susceptibility (ĸ) measured in situ in the Silesian Park in Chorzów
In the case of the Edmund Osmańczyk Park, heavy metal content is very high in the entire area. In comparison to the other tested objects, in the soils of the park the highest content of metals such as Zn, Pb and Cd, as well as their highest fluctuations were observed
T. MAGIERA, M. RACHWAŁ, A. ŁUKASIK

311 TECHNOGENIC SOILS OF POLAND
(Table 1). The TLV are significantly exceeded for Pb and Cd, but in the case of Zn only in three tested points. The correlation coe�cients between the ĸ value and the content of metals (except for Zn) are negative here, or insignificant.
The reason is elevated geochemical background in this area, due to the natural content of Pb, Zn and Cd in geological background, which in the tested area comprises of the Triassic ore-bearing dolomites. These rocks since the Middle Ages were the subject of silver and lead exploitation, as well as zinc at a later time, in the area of Bytom-Tarnowskie Góry.
The Panewnik-Kochłowice Forests extend southernmost out of the tested park-forest complexes. The values of ĸ in this area range from 14.2 to 116.9 × 10⁻⁵ SI units. Compared to the Makoszowy Wood, there is more number of the local magnetic anomalies. In the area of the tested complex higher magnetic susceptibility values were found in the north-eastern part of the area (Kochłowice, Chorzów) compared to the southern part (Fig. 4). This area is likely to receive pollutants from the ‘Halemba’ Power Plant, and the following steelworks: ‘Pokój’ in Ruda Ślaska, ‘Batory’ in Chorzów, ‘Zgoda’ in Świętochłowice, as well as from the local emissions from cities and settlements sur-rounding the forests.
The threshold limit values of Pb and Cd were exceeded at all tested points. Likewise, the level of Zn was exceeded at all points except one (point no. 22), where the value of ĸ also belongs to the lowest. At some points even the content of Cu approached the TLV. As with the case of soils in the park in Zabrze, the correlation coe�cients between the magnetic susceptibility and the content of individual heavy metals (Pb, Cu, Cr, Ni) are high.
The Silesian Park is located in the central part of the USIR, which, taking into account the directions of prevailing winds (W and SW) and the local emission sources (the ‘Kościuszko’ Steelworks in Chorzów, the ‘Jedność’ Steelworks in Siemianowice Śląskie, the zinc and lead works in Katowice-Wełnowiec), as well as the proximity to the centers of such cities, as Katowice, Chorzów, Siemianowice Śląskie, with predominant local emission from urban sources should be reflected in the magnetic susceptibility values and heavy metal content. This thesis is confirmed by the results of the research. This park area, due to the development and frequent agrotechnical treatments, di�ers from the other objects. The vegetation is not always typically forest, various species of orna-mental trees and shrubs are often met, and a large area is covered by lawns and lanes, which give this place the character of a park, much more than in the case of previous three objects.
Magnetic susceptibility measured in the field was very diverse and ranged from 41.3 to 310.5 × 10⁻⁵ SI units, but two thirds of the tested surface showed the values above 100 × 10-5 SI units, which suggests a high probability of the occurrence of geochemical anomaly of technogenic origin. High values were found in almost entire area of the park, especially in its western part (the ‘Kościuszko’ Steelworks, the ‘Jedność’ Steel-works), as well as in the south-eastern part, bordering the area of Katowice (Fig. 5).
SOILS OF URBAN FORESTS AND PARKS OF THE UPPER SILESIA REGION
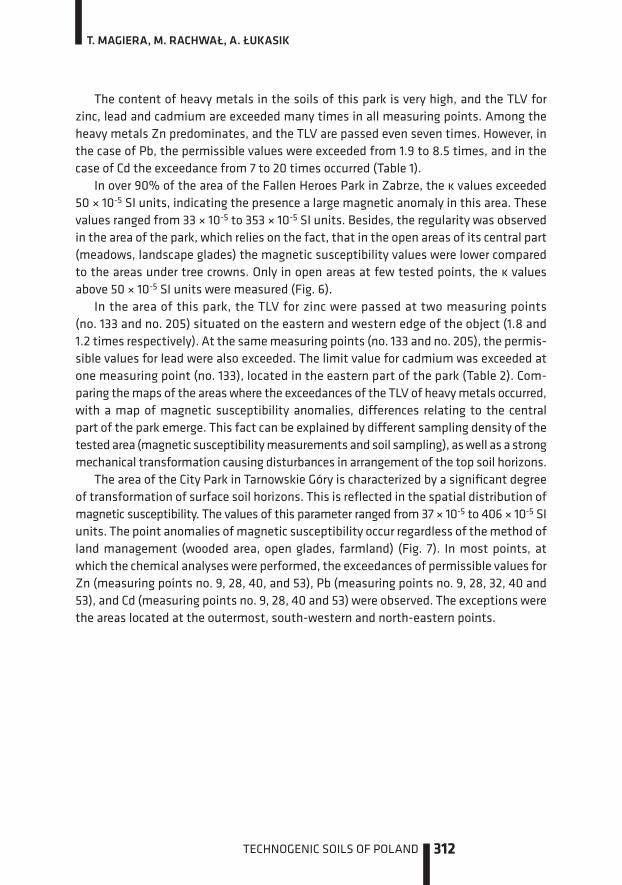
TECHNOGENIC SOILS OF POLAND 312
The content of heavy metals in the soils of this park is very high, and the TLV for zinc, lead and cadmium are exceeded many times in all measuring points. Among the heavy metals Zn predominates, and the TLV are passed even seven times. However, in the case of Pb, the permissible values were exceeded from 1.9 to 8.5 times, and in the case of Cd the exceedance from 7 to 20 times occurred (Table 1).
In over 90% of the area of the Fallen Heroes Park in Zabrze, the ĸ values exceeded 50 × 10-5 SI units, indicating the presence a large magnetic anomaly in this area. These values ranged from 33 × 10-5 to 353 × 10-5 SI units. Besides, the regularity was observed in the area of the park, which relies on the fact, that in the open areas of its central part (meadows, landscape glades) the magnetic susceptibility values were lower compared to the areas under tree crowns. Only in open areas at few tested points, the ĸ values above 50 × 10-5 SI units were measured (Fig. 6).
In the area of this park, the TLV for zinc were passed at two measuring points (no. 133 and no. 205) situated on the eastern and western edge of the object (1.8 and 1.2 times respectively). At the same measuring points (no. 133 and no. 205), the permis-sible values for lead were also exceeded. The limit value for cadmium was exceeded at one measuring point (no. 133), located in the eastern part of the park (Table 2). Com-paring the maps of the areas where the exceedances of the TLV of heavy metals occurred, with a map of magnetic susceptibility anomalies, di�erences relating to the central part of the park emerge. This fact can be explained by di�erent sampling density of the tested area (magnetic susceptibility measurements and soil sampling), as well as a strong mechanical transformation causing disturbances in arrangement of the top soil horizons.
The area of the City Park in Tarnowskie Góry is characterized by a significant degree of transformation of surface soil horizons. This is reflected in the spatial distribution of magnetic susceptibility. The values of this parameter ranged from 37 × 10-5 to 406 × 10-5 SI units. The point anomalies of magnetic susceptibility occur regardless of the method of land management (wooded area, open glades, farmland) (Fig. 7). In most points, at which the chemical analyses were performed, the exceedances of permissible values for Zn (measuring points no. 9, 28, 40, and 53), Pb (measuring points no. 9, 28, 32, 40 and 53), and Cd (measuring points no. 9, 28, 40 and 53) were observed. The exceptions were the areas located at the outermost, south-western and north-eastern points.
T. MAGIERA, M. RACHWAŁ, A. ŁUKASIK

313 TECHNOGENIC SOILS OF POLAND
Table 2. The ratio between the content of selected heavy metals and corresponding permissible values (Regulation of the Minister of Environment 2002) for selected soil samples in urban parks – exceedance coe�cients
Point number Zn Pb Cd Cu Cr Ni
Fallen Heroes Park in Zabrze
123 1.4 0.5 0.9 0.3 0.1 0.3124 2.4 1.0 1.3 0.3 0.1 0.1133 5.5 3.6 4.6 1.2 0.3 0.5145 1.8 1.0 1.1 0.4 0.1 0.1194 2.6 1.5 1.8 0.6 0.2 0.3205 3.8 2.5 2.1 0.8 0.2 0.2
City Park in Tarnowskie Góry
9 13.9 18.6 12.9 1.2 0.2 0.528 23.5 48.8 9.0 2.2 0.4 0.832 1.6 3.5 1.4 0.4 0.1 0.237 0.8 0.9 0.7 0.2 0.0 0.140 29.5 42.2 23.8 1.3 0.5 1.053 18.8 47.2 10.3 0.5 0.2 0.7
Tadeusz Kościuszko Park in Katowice
107 4.6 2.0 1.6 0.9 0.3 0.6129 8.2 10.0 7.1 1.5 0.3 0.6135 5.5 9.0 8.6 1.6 0.3 0.5140 4.4 4.1 4.2 0.8 0.2 0.3143 2.9 5.4 3.8 0.8 0.1 0.2145 4.6 3.9 4.4 0.9 0.2 0.3
City Park ‘Green’ in Dąbrowa Górnicza
403 14.1 22.4 18.6 2.1 0.4 0.6409 15.7 8.8 18.1 1.2 0.2 0.4412 3.2 2.4 4.0 0.4 0.1 0.2417 10.4 10.4 14.4 1.6 0.2 0.4434 3.5 3.0 3.5 0.4 0.1 0.2444 5.4 4.0 5.8 0.8 0.2 0.4
Regarding the content of Zn, Pb, Cd in the upper horizons of soils of the tested park, the reason for the presence of these elements should be considered. Apart from techno-genic sources (dust depositions and artefacts), the major cause of the increased content of heavy metals is the geological background (the Triassic ore-bearing dolomites). This example is confirmed by the results of the analysis from the point no. 40, where low magnetic susceptibility values correspond to high concentrations of heavy metals. The park was established in the areas of the old (medieval) mining of silver and lead ores, as evidenced by the morphology of land with the remains of numerous ‘warpias’.
SOILS OF URBAN FORESTS AND PARKS OF THE UPPER SILESIA REGION

TECHNOGENIC SOILS OF POLAND 314
Fig. 6. Distribution of soil magnetic susceptibility (ĸ) measured in situ in the Fallen Heroes Park in Zabrze
Fig. 7. Distribution of soil magnetic susceptibility (ĸ) measured in situ in the City Park in Tarnowskie Góry
In the area of the Tadeusz Kościuszko Park in Katowice a significant impact of tra�c pollution on the spatial distribution of magnetic susceptibility was observed. This park, from the north, east and west, is surrounded by roads with heavy tra�c. These roads are significant source of pollutants, which are caught by the trees growing in the outer parts of the park. In the central parts of the park lower values of magnetic susceptibility were measured, thus confirming the emission-absorbing role of trees in comparison with open areas, but it does not a�ect the designed areas of magnetic susceptibility anomalies which encompass the entire area of the park (Fig. 8).
The values of volume magnetic susceptibility throughout the park ranged from 45 × 10-5 to 339 × 10-5. The allowable contents of Zn were exceeded at the following points: 107,
T. MAGIERA, M. RACHWAŁ, A. ŁUKASIK

315 TECHNOGENIC SOILS OF POLAND
129, 135, 140, 145, and exceedances were in the order of 3 to 8 times. In the case of Pb, the exceedances occurred at the points no.: 129, 135, 140, 143, 145, and were in the order of 2–10 times, and in the case of Cd at the points no.: 129, 135, 140, 145, and were in the order of 1.5 to 8.5 times (Table 2). Both for Zn, Pb and Cd the maximum concentrations were recorded at the points of maximum values of the magnetic susceptibility, which indicates technogenic character of these metals.
Table 3. Pearson’s correlation coe�cients between magnetic susceptibility (ĸ) measured in situ and heavy metal content in particular research objects
Zn Pb Cd Cu Cr Ni
Makoszowy Wood in Zabrze
0.42 0.90 0 0.64 0.62 0.50
Edmund Osmańczyk Park in Bytom
0.85 -0.57 0.56 -0.22 -0.30 0.50
Panewnik-Kochłowice Forests in Katowice/Ruda Śl.
0.15 0.84 0.24 0.78 0.91 0.87
Silesian Park in Chorzów
0.38 0.52 0.28 0.51 0.26 0.88
Fallen Heroes Park in Zabrze
0.98 0.98 0.98 0.98 0.91 0.78
City Park in Tarnowskie Góry
0.44 0.64 0.25 0.30 0.17 0.46
Tadeusz Kościuszko Park in Katowice
0.57 0.82 0.84 0.69 0.17 -0.06
City Park ‘Green’ in Dąbrowa Górnicza
0.90 0.67 0.91 0.76 0.58 0.62
In the City Park ‘Green’ in Dąbrowa Górnicza, except for one measuring point, the anomaly of magnetic susceptibility was found, for which the maximum values were located in the central and south-western part (Fig. 9). The vital impact on the size of anomalies had species composition of the tree stand. Elevated values of magnetic susceptibility were measured in pine tree stands or clusters of coniferous trees (spruce, pine). The values of ĸ throughout the park ranged from 48 × 10-5 to 219 × 10-5 SI units. Besides, in this park, the highest correlation coe�cients between the magnetic susceptibility and the content of individual heavy metals in the upper soil horizons were found (Table 3).
SOILS OF URBAN FORESTS AND PARKS OF THE UPPER SILESIA REGION

TECHNOGENIC SOILS OF POLAND 316
A decisive impact on this fact had a low degree of conversion of surface soil horizons identified on the basis of analyses of collected soil cores, and one dominant source of TMP (the ‘Łagisza’ Power Plant).
Fig. 8. Distribution of soil magnetic susceptibility (ĸ) measured in situ in the Tadeusz Kościuszko Park in Katowice
Fig. 9. Distribution of soil magnetic susceptibility (ĸ) measured in situ in the City Park ‘Green’ in Dąbrowa Górnicza
T. MAGIERA, M. RACHWAŁ, A. ŁUKASIK
317 TECHNOGENIC SOILS OF POLAND
Maximum exceedances of the content of Zn in the upper soil horizons, in relation to the TLV, were noted at the points, where high magnetic susceptibility values were also measured (points no.: 403, 409, 417). A similar situation arose for the spatial distribu-tion of Pb and Cd. High agreement on the spatial distribution of heavy metals and TMP in this park, apart from mapping, is also reinforced by the correlation coe�cients between the two tested parameters, amounting to 0.90, 0.67, 0.91 for Zn, Pb and Cd respectively (Table 3).
Summary
The results obtained from the research indicate a considerable degree of contamination of surface soil horizons of the tested forests and urban parks, particularly with such heavy metals, as lead, zinc and cadmium. Significantly elevated (compared to the natu-ral content) concentration of TMP, occurring mostly in the form of ferrimagnetic iron oxides, which accompanies these chemical contaminants, makes it possible to asses size and spatial range of the distribution of these pollutants by the application of field magnetic measurements.
The important role in the process of distribution of pollutants in the tested areas plays the tree stand and its species composition. Besides, in the managed recreational part of the parks, care treatments are carried out involving, among others, the removal of the falling leaves in the autumn season, and mowing down meadows and lawns, which causes, that some contaminants are removed from the surface layer of the litter, so they accumulate in the soil to a lesser extent. As a result, in some park areas, located in the central part of the cities, where theoretically the number of local emission sourc-es is greater, the exceedances of metal contents are lower, than in the areas of urban forests, where human intervention is lesser.
In the second half of the 20th century, the size of industrial and urban dust deposi-tion in the tested areas of the USIR was much greater than today. Not until properly e�cient dust removal systems were applied and a number of obsolete industrial plants were closed, in the late eighties and early nineties, the amount of deposition was significantly reduced. In the particle size distribution of dusts emitted to the atmos-phere and deposited in the soil, coarse fractions dominated, and cultivation activities carried out in the parks, contributed to the reduction of certain amounts of pollutants retained by assimilation apparatus of plants (trees, grasses).
Nevertheless, a significant amount of pollutants penetrated into the soil with pre-cipitation, both in open areas and in wooded areas, as a result of under-crown precipita-tion and run-o� from the trunk, as so-called wet deposition. Advantageous factor, that contributed to the reduction of dust pollution migration into the deeper soil horizons, in the investigated forest and park areas, is soil particle size distribution and a large
SOILS OF URBAN FORESTS AND PARKS OF THE UPPER SILESIA REGION

TECHNOGENIC SOILS OF POLAND 318
amount of organic matter in the organic horizons (humus of mull type). In spite of the removal of the falling leaves in fragmentary areas of the studied parks, the accumulation of heavy metals and ferrimagnetic minerals in organo-mineral horizons (A) was observed.
The areas of local magnetic ‘hot spots’ designated on the basis of field measure-ments, indicate places posing a potential threat of secondary emissions of heavy metals from the soil surface. Locally, surface soil horizons devoid of vegetation and litter, can be a source of hazards to the environment and people in the area of city parks. Locally, in such places, under favourable conditions (dry, windy periods, a lack of vegetation), dusts (a mixture of mineral and organic soil fraction from A horizons), containing heavy metals, can be lifted into the atmosphere (secondary emissions). The application of e�cient electrofilters e�ectively reduced the level of emissions, decreasing simultaneously the contribution of coarse fractions, on behalf of fine fractions (of particle diameter <10 µm). The suspended dusts are characterized by di�erent aerodynamic parameters. Their presence in the atmosphere and the way of deposition are di�erent compared to the dusts of coarser fractions.
The investigated park and forest areas, being the places of recreation of the USIR in-habitants, are characterized by elevated, and even high values of magnetic susceptibility (the areas of theoretically ‘low or moderate risk’ where the value of ĸ < 50 × 10-5 SI units, contribute only a small proportion of the tested areas). Based on previous research (Strzyszcz, Magiera 2003; Strzyszcz, Rachwał 2010), depending on the value of ĸ, the fol-lowing degrees of soil hazard by industrial depositions were determined: ĸ < 30 × 10-5 SI units – small hazard, 30 < ĸ < 50 × 10-5 SI units – medium hazard, ĸ > 50 × 10-5 SI units – large hazard. In areas, where the value of ĸ is greater than 50 × 10-5 SI units, the con-tent of at least one of the three metals – Pb, Zn, Cd – exceeds the TLV, allowable by the regulations. Therefore, in the areas of high risk (ĸ > 50 × 10-5 SI units) more detailed geochemical studies should be carried out.
Soil magnetometry can support monitoring in the areas of environmental hazards, especially in the forests and city parks, where the accumulation of heavy metals carried by TMP coming from local emission sources (local industry, power plants and urban boilers, transport etc.) is significant and shows high areal fluctuation. This method is e�ective especially in the areas where anthropogenic/technogenic transformation of soil is relatively small and where industrial, urban and communication dust depositions are the major source of pollution.
In these areas, the correlation coe�cients between the ĸ values and the content of heavy metals are positive and relatively high. This method encounters large limitations in the areas with a significant degree of transformation of the substrate, i.e. in metal ore postmining areas – the Edmund Osmańczyk Park and the City Park in Tarnowskie Góry, that are the parks formed on the old dumps, and/or with a large amount of dis-placement of soils and grounds (Silesian Park), as well as in the vicinity of parks with lots of artefacts present in the soil.
T. MAGIERA, M. RACHWAŁ, A. ŁUKASIK

319 TECHNOGENIC SOILS OF POLAND
References
1. European Environment Agency 2003. Europe’s Environment: the third assessment. Environ-mental Assessment Report, No 10. Copenhagen.
2. Górka P., Kowalski S., Zajusz-Zubek E., Brózda A., Brzezina M. 2001. ‘Knurów’ cokery in Knurów as a source of heavy metal emissions. Karbo 6: 214–217 (in Polish).
3. Magiera T., Strzyszcz Z., Kapička A., Petrovský E. 2006. Discrimination of lithogenic and anthropo-genic influences on topsoil magnetic susceptibility in Central Europe. Geoderma 13:, 299–311.
4. Magiera T., Zawadzki J. 2007. Using of high-resolution topsoil magnetic screening for assess-ment of dust deposition: comparison of forest and arable soil datasets. Environ. Monit. Assess. 125: 19–28.
5. Regulation of the Minister of the Environment dated September 9, 2002 on soil and land quality standards (Journal of Laws No. 165, item 1359, October 4, 2002).
6. Schibler L., Boyko T., Ferdyn M., Gajda B., Holl S., Jordanova N. 2002. Topsoil magnetic suscep-tibility mapping: data reproducibility and compatibility, measurement strategy. Stud. Geophys. Geod. 46: 43–57.
7. Smeets E., Weterings R. 1999. Environmental indicators: Typology and overview. Technical Report No 25, European Environment Agency, Copenhagen.
8. Strzyszcz Z. 2004. Soil hazards of arable lands and forest sites by ferromagnetic emissions. Arch. Environ. Prot. 30 (4): 101–112 (in Polish).
9. Strzyszcz Z., Magiera T. 1998. Heavy metal contamination and magnetic susceptibility in soils of southern Poland. Phys. Chem. Earth, 23: 1127–1131.
10. Strzyszcz Z., Magiera T. 2003. Pollution assessment of forest soils on the basis of magnetic susceptibility on the example of Katowice Forest District. Prace Inst. Bad. Leśn. 961: 19–30 (in Polish).
11. Strzyszcz Z., Magiera T., Heller F. 1996. The influence of industrial immisions on the magnetic susceptibility of soils in Upper Silesia. Stud. Geophys. Geod. 40: 276–286.
12. Strzyszcz Z., Rachwał M. 2010. Application of magnetometry for monitoring and ecological assessment of soils of areas influenced by industrial emissions. Works & Studies, IPIŚ PAN, Zabrze, 78: 1–88 (in Polish).
13. Stuczyński T., Siebielec G., Maliszewska-Kordybach B., Smreczak B., Gawrysiak L. 2004. De-termination of areas with exceeded soil quality standards. Biblioteka Monitoringu Środowiska. Warsaw (in Polish).
14. Tokarska A., Zajusz-Zubek E. 1996. Analysis of soil contamination level in area of former ‘Concordia’ cokery in Zabrze. Karbo-Energochemia-Ekologia 4: 150–152 (in Polish).
SOILS OF URBAN FORESTS AND PARKS OF THE UPPER SILESIA REGION


MILITARY AREAS
PART V


323 TECHNOGENIC SOILS OF POLAND
17 SOILS OF BARE LANDS IN THE TORUŃ MILITARY AREA
MICHAŁ JANKOWSKI PIOTR SEWERNIAK
Introduction
Soils of military training areas are rarely investigated and papers presenting the impact of military activity on morphology and properties of soils are not common (Saison et al. 2000; Shelemina, Gagarina 2000). Previous studies concerning the environment of mili-tary areas are focused mainly on vegetation (Chojnacka et al. 2010; Gugnacka-Fiedor, Adamska 2010), general descriptions of the environment (Bukowska-Jania, Pulina 1997) or practical problems of forest management in lands abandoned by the army (Klawczyński 2010; Zubkowicz 2010; Borucka, Mikosz 2012).
The aim of this paper is to present the results of studies on the e�ects of direct military activity on the soils in the Toruń military training area and their natural regenera-tion following the process of vegetation succession. It is obvious that in places a�ected by direct military activity (e.g. explosions, heavy equipment transportation), morphology and properties of soils are exposed to major alterations; e�ects of such impact, how-ever, have not yet been investigated in detail. In such places, or in places where only protective vegetation cover is removed, intense water and wind erosion additionally occurs and leads to soil truncation or burial. Parent material or deeper soil horizons thus exposed constitute a substratum for a new line of plant succession and parallel forma-tion of a new soil generation. Some aspects of these processes have been presented in previous studies (Jankowski 2010; Jankowski, Bednarek 2000, 2002; Sewerniak et al. 2012).
Study area and soil profile documentation
The Toruń military area is located on the left bank of the Vistula river, south of Toruń (Fig. 1), in the Toruń Basin, which is one of the largest inland dune fields in Europe. The dunes and neighbouring glaciofluvial terraces are built of loose, extremely poor quartz sands.

TECHNOGENIC SOILS OF POLAND 324
M. JANKOWSKI, P. SEWERNIAK
The area was allocated for military purposes sometime in the first half of the 18th
century when the first artillery firing was exercised south of the city boundary (Wa-silewski 2004). Since then, the ground allocated for military exercises was regularly ex-panded and nowadays it covers a total of ca. 100 km2. Since the beginning of military exploitation, the area has been used for artillery practice, mostly shooting. This kind of activity dominates in the area, also at present.
Fig. 1. Location of the investigated area and study plots
Two functional zones can be distinguished in the Toruń military area, which are sig-nificantly di�erent from each other in terms of vegetation types and intensity of mili-tary activity. Since the 18th century, the central part of the area (ca. 50 km2) has been gradually deforested for military purposes. Due to the processes of secondary succes-sion, most of the ground is presently covered with a mosaic of heathlands and grass-lands with some admixture of Scots pine (Pinus sylvestris) and birch (Betula pendula). In the central zone of the military area, pine and/or birch form forest stands of natural origin, but they are not timber forests. In this zone, there are some areas of intensive military activity, which are characterised by major disturbances in the soil cover. Such real, active ‘bare lands’ are, however, rather rare and small.
The central part of the investigated artillery range is surrounded by an external belt that constitutes a bu�er zone protecting the military area. The zone has never been deforested for military purposes; it is mostly covered with pine timber forest and is free of direct military activity.
We investigated soils of 3 plots located in the areas with heavy former or current military activities. All of them were deforested in the past:

325 TECHNOGENIC SOILS OF POLAND
SOILS OF BARE LANDS IN THE TORUŃ MILITARY AREA
1. The plot located in the area allocated for detonation of explosives for at least 50 years (until now). The area is located in the very central part of the artillery range (Fig. 1). The bare land covers only about 0.06 km2 and is surrounded by vegetation developed in the course of natural succession (Fig. 2).
Fig. 2. Satellite images of the study plots
2. The plot located in the northern part of the artillery range (Fig. 1), in the area of about 0.6 km2 allocated for various military exercises for at least 50 years (until now), especially with the use of heavy military vehicles.
3. The plot located in the area allocated for di�erent military activities at least several decades ago. The area covers almost 1 km2 and is located in the north-eastern part of the artillery range (Fig. 1). At present, a new residential district is situated near the north-eastern boundary of the artillery range; the military activity in the plot has been ceased about 20 years ago. Consequently, at present, the main bare lands in the area are partly covered with vegetation in di�erent successional stages (Fig. 2).
Documentation of the investigated soil profiles is presented in the following sec-tions of the text. Main properties of the soils are presented in Tables 1–3. Standard methods of soil science were applied in the laboratory analysis (van Reeuwijk 2002).

TECHNOGENIC SOILS OF POLAND 326
Profile 1
Location: Plot 1, central part of the
Toruń military area, Forest section no. 315
Coordinates: 52°54’41’’ N
18°36’49’’ E
Soil classification (WRB 2007): Albic Arenosol (Areninovic)
A1 – 0–2 cm: sand, grey, single grain structure, dry, rhizomes of grasses, lamination, artefacts (charcoals, <1%), abrupt boundary.
A2 – 2–4 cm: sand, brown, single grain structure, dry, rhizomes of grasses, lamination, artefacts (charcoals, <1%), clear boundary.
A3 – 4–8 cm: sand, greyish brown, single grain structure, dry, rhizomes of grasses, artefacts (charcoals, <1%), abrupt boundary.
Ab – 8–14 cm: sand, dark grey, single grain structure, slightly moist, interbeddings of organic material, artefacts (iron pieces of detonated mate-rials, 5%; charcoals, <1%), clear, wavy boundary.
Eb – 14–17 cm: sand, grey, single grain structure, slightly moist, charcoals (<1%), clear boundary.
Bsb – 17–22 cm: sand, brown, single grain structure, slightly moist, charcoals (<1%), gradual boundary.
BC – 22–45 cm: sand, very pale brown, single grain structure, slightly moist, charcoals (<1%), gradual boundary.
C – below 45 cm: sand, very pale brown, single grain structure, slightly moist, charcoals (<1%).
M. JANKOWSKI, P. SEWERNIAK
0 cm
20 cm
40 cm
60 cm
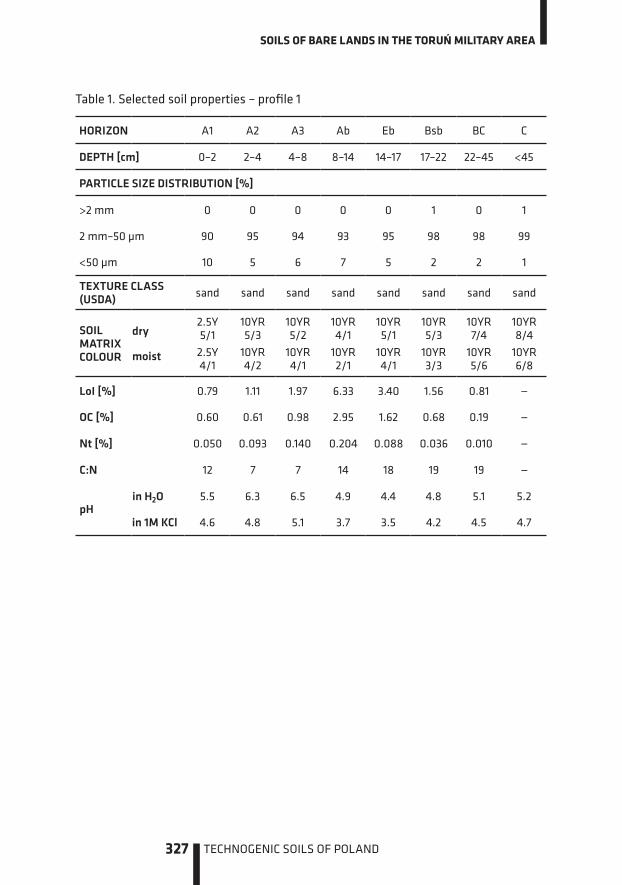
327 TECHNOGENIC SOILS OF POLAND
Table 1. Selected soil properties – profile 1
HORIZON A1 A2 A3 Ab Eb Bsb BC C
DEPTH [cm] 0–2 2–4 4–8 8–14 14–17 17–22 22–45 <45
PARTICLE SIZE DISTRIBUTION [%]
>2 mm 0 0 0 0 0 1 0 1
2 mm–50 µm 90 95 94 93 95 98 98 99
<50 µm 10 5 6 7 5 2 2 1
TEXTURE CLASS (USDA) sand sand sand sand sand sand sand sand
SOIL MATRIX COLOUR
dry
moist
2.5Y 5/1
2.5Y 4/1
10YR 5/3
10YR 4/2
10YR 5/2
10YR 4/1
10YR 4/1
10YR 2/1
10YR 5/1
10YR 4/1
10YR 5/3
10YR 3/3
10YR 7/4
10YR 5/6
10YR 8/4
10YR 6/8
LoI [%] 0.79 1.11 1.97 6.33 3.40 1.56 0.81 —
OC [%] 0.60 0.61 0.98 2.95 1.62 0.68 0.19 —
Nt [%] 0.050 0.093 0.140 0.204 0.088 0.036 0.010 —
C:N 12 7 7 14 18 19 19 —
pHin H2O 5.5 6.3 6.5 4.9 4.4 4.8 5.1 5.2
in 1M KCl 4.6 4.8 5.1 3.7 3.5 4.2 4.5 4.7
SOILS OF BARE LANDS IN THE TORUŃ MILITARY AREA

TECHNOGENIC SOILS OF POLAND 328
Profile 2
Location: Plot 2, northern part of the
Toruń military area, Forest section no. 18
Coordinates: 52°58’49’’ N
18°36’17’’ E
Soil classification (WRB 2007): Arenosol
Bp1 – 0–30 cm: sand, greyish brown, single grain structure, slightly moist, abrupt, smooth boundary.
Bp2 – 30–34(43) cm: sand, brown, single grain structure, slightly moist, clear, wavy boundary.
Bp3 – 34(43)–54(62) cm: sand, pale brown, single grain structure, slightly moist, clear, wavy boundary.
Bp4 – 54(62)–67(77) cm: sand, greyish brown, single grain structure, slightly moist, clear, wavy boundary.
Bp5 – 67(77)–100(110) cm: sand, pale brown, single grain structure, slightly moist, clear, wavy boundary.
C – below 100(110) cm: sand, very pale brown, sin-gle grain structure, slightly moist.
M. JANKOWSKI, P. SEWERNIAK
0 cm
20 cm
40 cm
60 cm
80 cm
100 cm

329 TECHNOGENIC SOILS OF POLAND
Table 2. Selected soil properties – profile 2
HORIZON Bp1 Bp2 Bp3 Bp4 Bp5 C
DEPTH [cm] 0–30 30–34(43)34(43)
–54(62)54(62) –67(77)
67(77) –100(110)
<100 (110)
PARTICLE SIZE DISTRIBUTION [%]
>2 mm 1 1 0 1 0 0
2 mm–50 µm 99 98 99 99 99 99
<50 µm 1 2 1 1 1 1
TEXTURE CLASS (USDA) sand sand sand sand sand sand
SOIL MATRIX COLOUR
drymoist
10YR 5/210YR 4/2
10YR 5/310YR 4/3
10YR 6/310YR 5/3
2.5Y 5/22.5Y 4/2
10YR 6/310YR 5/3
10YR 7/310YR 6/4
LoI [%] 0.56 0.35 0.25 0.29 — —
OC [%] 0.13 — — — — —
Nt [%] 0.006 — — — — —
C:N 22 — — — — —
pHin H2O 6.4 5.5 5.5 5.2 5.3 5.2
in 1M KCl 5.0 4.6 4.5 4.4 4.5 4.4
SOILS OF BARE LANDS IN THE TORUŃ MILITARY AREA

TECHNOGENIC SOILS OF POLAND 330
Profile 3
Location: Plot 3, north-eastern part
of the Toruń military area, Stawki district of Toruń
Coordinates: 52°59’05’’ N
18°39’07’’ E
Soil classification (WRB 2007): Protic Arenosol (Orthodystric)
(A) – 0–1 cm: sand, brown, single grain structure, dry, rhizomes of grasses and lichens, single fine charcoals (<1%), transitional boundary.
C – 1–110 cm: sand, light yellowish brown, single grain structure, dry, lamination of discontinuous initial humus horizons, single fine charcoals (<1%), clear boundary.
�2Bwb – 110–150 cm: sand, brownish yellow, sin-gle grain structure, dry, Palaeolithic artefacts (flints).
M. JANKOWSKI, P. SEWERNIAK
0 cm
20 cm
40 cm

331 TECHNOGENIC SOILS OF POLAND
Table 3. Selected soil properties – profile 3
HORIZON (A) C 2Bwb
DEPTH [cm] 0–1 1–110 110–150
PARTICLE SIZE DISTRIBUTION [%]
>2 mm 0 0 0
2 mm–50 µm 95 98 98
<50 µm 5 2 2
TEXTURE CLASS (USDA) sand sand sand
SOIL MATRIX COLOUR
drymoist
10YR 5/310YR 4/3
10YR 6/410YR 4/3
10YR 6/610YR 5/6
LoI [%] 0.55 0.37 0.43
OC [%] 0.24 — —
Nt [%] 0.02 — —
C:N 12 — —
pHin H2O 5.3 4.8 4.7
in 1M KCl 4.3 4.3 4.4
SOILS OF BARE LANDS IN THE TORUŃ MILITARY AREA

TECHNOGENIC SOILS OF POLAND 332
Profile 4
Location: Plot 3, north-eastern part
of the Toruń military area, Stawki district of Toruń
Coordinates: 52°58’56’’ N
18°38’59’’ E
Soil classification (WRB 2007): Haplic Arenosol (Orthodystric)
A – 0–4 cm: sand, dark greyish brown, single grain structure, dry, rhizomes of lichens and grasses, single fine charcoals (<1%), transitional boundary.
C – 4–70 cm: sand, brown, single grain structure, dry, lamination, single fine charcoals (<1%), clear boundary.
2Ab – 70–82 cm: sand, greyish brown, single grain structure, dry, lamination, single fine char-coals (<1%), clear boundary.
2Bwb – 82–110 cm: sand, yellowish brown, single grain structure, dry, Palaeolithic artefacts (flints).
M. JANKOWSKI, P. SEWERNIAK
0 cm
20 cm
40 cm
60 cm
80 cm

333 TECHNOGENIC SOILS OF POLAND
Table 4. Selected soil properties – profile 4
HORIZON A C
DEPTH [cm] 0–4 4–70
PARTICLE SIZE DISTRIBUTION [%]
>2 mm 0 0
2 mm–50 µm 97 98
<50 µm 3 2
TEXTURE CLASS (USDA) sand sand
SOIL MATRIX COLOUR
drymoist
10YR 4/210YR 3/2
10YR 5/310YR 4/3
LoI [%] 2.77 0.30
OC [%] 1.29 —
Nt [%] 0.09 —
C:N 15 —
pHin H2O 4.4 4.5
in 1M KCl 3.6 4.4
SOILS OF BARE LANDS IN THE TORUŃ MILITARY AREA
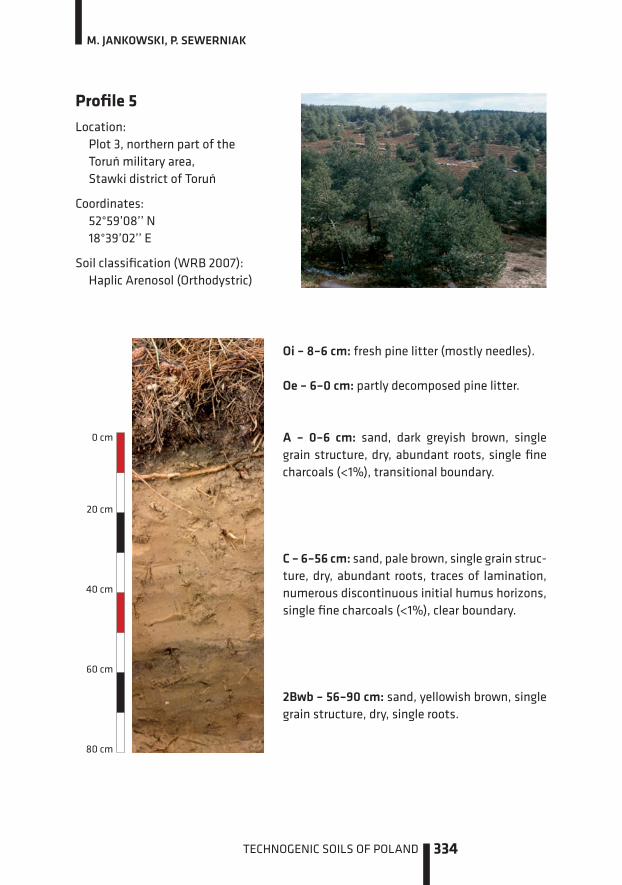
TECHNOGENIC SOILS OF POLAND 334
Profile 5
Location: Plot 3, northern part of the
Toruń military area, Stawki district of Toruń
Coordinates: 52°59’08’’ N
18°39’02’’ E
Soil classification (WRB 2007): Haplic Arenosol (Orthodystric)
Oi – 8–6 cm: fresh pine litter (mostly needles).
Oe – 6–0 cm: partly decomposed pine litter.
A – 0–6 cm: sand, dark greyish brown, single grain structure, dry, abundant roots, single fine charcoals (<1%), transitional boundary.
C – 6–56 cm: sand, pale brown, single grain struc-ture, dry, abundant roots, traces of lamination, numerous discontinuous initial humus horizons, single fine charcoals (<1%), clear boundary.
2Bwb – 56–90 cm: sand, yellowish brown, single grain structure, dry, single roots.
M. JANKOWSKI, P. SEWERNIAK
0 cm
20 cm
40 cm
60 cm
80 cm

335 TECHNOGENIC SOILS OF POLAND
Table 5. Selected soil properties – profile 5
HORIZON Oi Oe A C
DEPTH [cm] 8–6 6–0 0–6 6–56
>2 mm — — 0 0
2 mm–50 µm — — 95 97
<50 µm — — 5 3
TEXTURE CLASS (USDA) — — sand sand
SOIL MATRIX COLOUR
drymoist
——
——
10YR 4/210YR 2/2
10YR 6/310YR 4/3
LoI [%] 83.9 38.5 3.52 0.48
OC [%] 46.7 20.5 2.27 —
Nt [%] 0.60 0.74 0.07 —
C:N 78 28 17 —
pHin H2O 4.2 4.5 4.6 4.5
in 1M KCl 3.7 3.7 3.6 4.2
SOILS OF BARE LANDS IN THE TORUŃ MILITARY AREA

TECHNOGENIC SOILS OF POLAND 336
Morphology and properties of soils located in active bare lands
Soils of the investigated active bare lands present two di�erent stages of primary soil profile destruction. The ground surface in plot 1 is characterised by the presence of ca. 1.5 m deep explosion holes, where primary soil is completely destroyed. However, due to the location of the investigated soil profile, i.e. several meters outside a hole, explo-sions had little impact on the soil destruction. Plot 1 is located on one of the many dunes in the Toruń military area where Podzols are dominant soils (Bednarek, Jankowski 2006). Deforestation of the area in plot 1 caused destruction of the organic horizon (remains of the horizon were found as interbeddings in the Ab horizon), thus the input of organic acids was ceased and the podzolization process was disturbed. Therefore, the investigated soil does not meet the criteria of Podzols and was classified as Albic Arenosol. Further e�ects of deforestation included initiation of the colluvial process responsible for the accumulation of the 8 cm thick colluvial layer (horizons A1, A2 and A3) overlying the in situ material of the primary topsoil.
Direct impact of explosions on the soil properties in plot 1 is related to iron pieces of detonated explosives present in the topsoil. The highest content of such artefacts (about 5%) was found in the Ab horizon, which proves that during the longest period of detonations, the horizon occurred as one surface. Since the intensive military detona-tions in the area of plot 1 have been continued until today, the colluvial layer covering the Ab horizon must have been formed quite recently. The initiation of the colluvial process in a gentle dune slope above the investigated soil profile could be caused by removal (for example by burning) of just one pine and by opening the ground surface for denudation. The abundance of colluvial cover is strictly related to microrelief in plot 1. A few meters from the analysed soil pit, where a small hummock on a gentle dune slope occurs, colluvial cover was not found. Pieces of exploded materials occur there only on the soil surface (Fig. 3), in the surface humus horizon.
The humus horizon in the soil surface of the hummock is significantly enriched with iron pieces. We analysed the percentage by weight of those artefacts in the 2 cm soil surface layer for the main textural classes. The results are presented in Table 6.
The reasons for the highest percentage of iron artefacts in the two largest textural classes (>2 mm and 2–1 mm) are as follows: (i) low content of these classes in the natu-ral, primary ‘body’ of the soil that is formed from the well-sorted aeolian material and (ii) high density of pieces. The density of pieces found in the analysed samples was 5.1 g·cm-3, i.e. about twice as much as in the natural, mineral parent material of sandy soils in the Toruń Basin, which oscillated between 2.62–2.64 g·cm-3 (Prusinkiewicz, Biały 1976). In the analysed surface samples, also some admixture of other technogenic non-ferrous material was found, however, this was not yet investigated in detail.
M. JANKOWSKI, P. SEWERNIAK

337 TECHNOGENIC SOILS OF POLAND
Fig. 3. Artefacts of detonated explosives on the soil surface in plot 1
Table 6. Percentage of iron artefacts from detonated explosives per textural class in the 2 cm topsoil layer in plot 1
Textural class >2 mm 2–1 mm 1–0.5 mm 0.5–0.25 mm 0.25–0.1 mm 0.1–0.05 mm <0.05 mm
Percentage of artefacts
[%]88.5 63.2 18.4 1.3 0.1 0.7 0.0
Compared to plot 1, direct impact of military activity on soil morphology is much more evident in plot 2 where the whole soil material is technogenically changed up to a depth of about 105 cm. The plot is situated on a river terrace where Brunic Arenosols are the dominant soils (Bednarek, Jankowski 2006), however, none of the primary soil hori-zons was observed in the analysed soil profile. For many decades, the ground of plot 2 has been dug and mixed by heavy, military vehicles, which is now clearly reflected in the soil profile. The relative height of ruts left by vehicles in plot 2 is up to 50 cm, while the average height is about 25 cm (Fig. 4). Mineral material that fallen into furrows was mixed and pushed in by vehicles, which is reflected in morphology of the investigated soil up to a depth of about 100 cm.
The soil in plot 2 was classified as Arenosol and none of the prefix or su³x qualifiers provided for Arenosols in WRB (IUSS Working Group WRB 2007) was suitable for the investigated soil. It would be reasonable to introduce a new qualifier for Arenosols and also for other WRB Reference Soil Groups in order to express technogenic mixing or
SOILS OF BARE LANDS IN THE TORUŃ MILITARY AREA
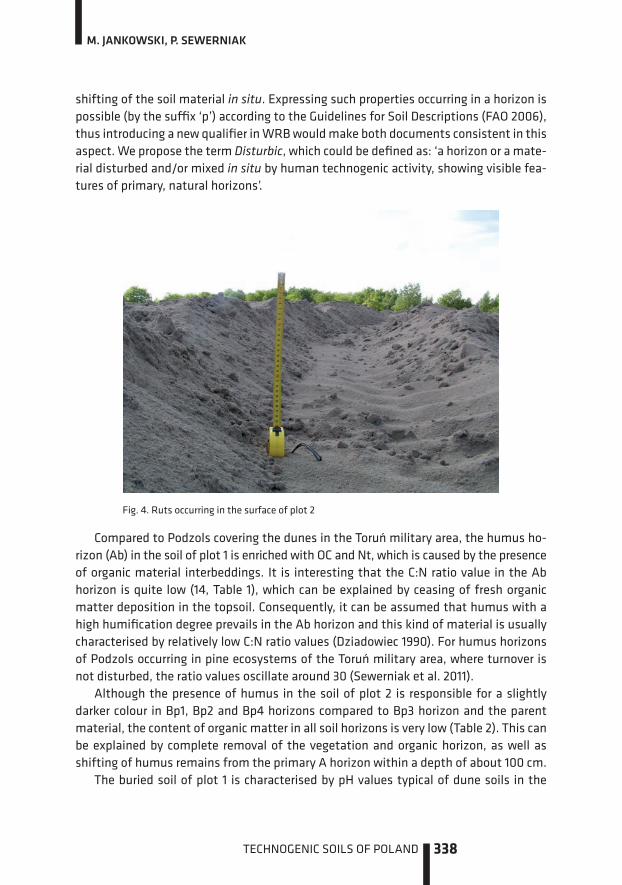
TECHNOGENIC SOILS OF POLAND 338
shifting of the soil material in situ. Expressing such properties occurring in a horizon is possible (by the su³x ‘p’) according to the Guidelines for Soil Descriptions (FAO 2006), thus introducing a new qualifier in WRB would make both documents consistent in this aspect. We propose the term Disturbic, which could be defined as: ‘a horizon or a mate-rial disturbed and/or mixed in situ by human technogenic activity, showing visible fea-tures of primary, natural horizons’.
Fig. 4. Ruts occurring in the surface of plot 2
Compared to Podzols covering the dunes in the Toruń military area, the humus ho-rizon (Ab) in the soil of plot 1 is enriched with OC and Nt, which is caused by the presence of organic material interbeddings. It is interesting that the C:N ratio value in the Ab horizon is quite low (14, Table 1), which can be explained by ceasing of fresh organic matter deposition in the topsoil. Consequently, it can be assumed that humus with a high humification degree prevails in the Ab horizon and this kind of material is usually characterised by relatively low C:N ratio values (Dziadowiec 1990). For humus horizons of Podzols occurring in pine ecosystems of the Toruń military area, where turnover is not disturbed, the ratio values oscillate around 30 (Sewerniak et al. 2011).
Although the presence of humus in the soil of plot 2 is responsible for a slightly darker colour in Bp1, Bp2 and Bp4 horizons compared to Bp3 horizon and the parent material, the content of organic matter in all soil horizons is very low (Table 2). This can be explained by complete removal of the vegetation and organic horizon, as well as shifting of humus remains from the primary A horizon within a depth of about 100 cm.
The buried soil of plot 1 is characterised by pH values typical of dune soils in the
M. JANKOWSKI, P. SEWERNIAK

339 TECHNOGENIC SOILS OF POLAND
military area, and this applies to both determined values corresponding to acidic reaction and values increasing with the depth of a soil profile. The main reason for relatively high pH values recorded both in the colluvial horizons (A1, A2 and A3) of plot 1 and the solum horizons of plot 2 is destruction of the organic horizon and vegetation, which prevented the inflow of organic acids into the topsoil.
Morphology and properties of soils regenerating along with plant succession
Although the process of vegetation development in the technogenic bare land of study plot 3 represents a secondary succession, its pattern is similar to primary succession typical of sandy areas in the subboreal zone (psammosera, acc. to Clements 1916). Pro-files 3, 4 and 5 represent three stages of plant succession and soil development:
1. The initial stage – only Algae and single Corynephorus canescens pioneer grasses occur, and the processes of wind-blown sand stabilization and soil-forming are initiated.
The soil occurring in such conditions (profile 3), with a horizon sequence: (A)-C, is the most initial soil and can be classified as Protic Arenosol (acc. to IUSS Working Group WRB 2007).
2. The younger intermediate stage – the surface is entirely covered with psammophilous vegetation (Spergulo-Corynephoretum plant association), lichens (Cladonia sp., Cetraria sp.) and mosses (Polytrichum piliferum, Pohlia nutans).
The soil under such vegetation (profile 4) has a shallow but clear humus horizon overlying the parent material A-C and thus can be classified as Haplic Arenosol.
3. The older intermediate stage – where single pine and birch trees occur in the al-ready stable vegetation cover. Gradual transition from open boreal vegetation to dense forest is observed under canopies of young trees where ground boreal spe-cies begin to form biogroups (Rahmonov, Oleś 2010).
In the soil of this stage (profile 5), an organic horizon overlies mineral soil typical of Haplic Arenosol: Oi-Oe-A-C.
The morphology of the studied profiles reflects the direction in the development of soils parallel to plant succession (Fig. 5). The first and the most important evidence of soil evolu-tion is the development of a humus horizon followed by an organic horizon. The presented data show that the humus horizon gradually becomes darker, which is expressed by Munsell values: from 5 to 4 dry and from 4 to 2 moist) and the increasing depth: from 1 to 6 cm. Two subhorizons representing di�erent stages of organic matter decomposition (Oi and Oe) can already be distinguished in the organic horizon documented in profile 5.
SOILS OF BARE LANDS IN THE TORUŃ MILITARY AREA

TECHNOGENIC SOILS OF POLAND 340
It is also worth mentioning that all three profiles in plot 3 are developed in quite fresh aeolian sandy sediments burying remnants of the primary soil cover (2A-2Bw ho-rizons). Clear lamination of the aeolian sand in the initial stage, disappears in the later stages due to biological activity, especially in the topsoil.
Fig. 5. The scheme of plant succession and soil development in plot 3, together with the further scenario of ecosystem evolution
The chemical data also express the soil development process. The organic carbon content in the humus horizon increases from 0.2% in Protic Arenosol to 1.3% in Haplic Arenosols, and then seems to stabilize at this level. However, in the later stage, the organic horizon becomes the main store of organic matter and contains 20–47% of OC. The total nitrogen content in the humus horizon also increases between profiles 3 and 4, from 0.02% to almost 0.09%, but in profile 5, it slightly decreases to ca. 0.07%. Val-ues of the C:N ratio increase from 12 in the (A) horizon of profile 3, through 15 in the A horizon of profile 4 to 17 in the A horizon of profile 5. The organic horizon of the latter profile is characterised by very high values: 28 in Oe and 78 in Oi.
Relatively strong acidification of the top mineral horizon can be observed due to humus accumulation. Values of pH measured in H2O decrease from 5.3 to 4.2 and pH values measured in 1M KCl − from 4.3 to 3.7. All changes in the soil properties indicate the mor type of humus development and they indicate podzolization as a likely direc-tion of the soil-forming process in the studied soils under pine forest vegetation (Jankowski, Bednarek 2000, 2002). The described scenario of soil evolution is similar
M. JANKOWSKI, P. SEWERNIAK

341 TECHNOGENIC SOILS OF POLAND
to results obtained by other authors regarding the early developmental stages of sandy soils in Europe (e.g. Reuter 1962; Bednarek 1979; Certini et al. 1998; Elgersma 1998; Rahmonov 1999; Stützer 1998).
Summary
The studied soils of the bare lands in the Toruń military area represent various aspects of soil destruction due to direct military activity, together with the technogenically initi-ated aeolian processes and the early stages of the soil cover regeneration. Although the physical destruction is a very quick process, the plant succession and the new soil gen-eration development are relatively slow processes, especially in poor sandy areas, where low fertility and water retention are factors limiting the encroachment of plants and their growth. In such places, the process of regeneration can be easily disturbed by recurrent occurrence of destruction factors. The state of plant succession and soil regeneration in the centre of plot 3 seems to have been stable for at least 25 years. The progress of succession has been observed only on the peripheries of this plot.
Acknowledgments
We are grateful to the commander of the Toruń military area, Captain Ireneusz Cackowski, for granting the permission to conduct this research in the closed army area. We thank Mr. Michał Dąbrowski for coordinating the laboratory analysis. In the field and laboratory, we were also supported by Mr. Piotr Wojciechowski.
References
1. Bednarek R. M. 1979. Soils of selected cli� sections of the Polish Baltic coast. Studia Soc. Sc. Torun. 10, 6, sec. D (in Polish).
2. Bednarek R., Jankowski M. 2006. Soils. [In:] L. Andrzejewski, P. Weckwerth, S. Burak (Eds.). Toruń and its Surroundings − Environmental Monograph. Wyd. UMK. Toruń: 153–176 (in Polish with English Summary).
3. Borucka A., Mikosz B. 2012. Bioremediation of Polish military training grounds following post-training reclamation and environmental management during ongoing military opera-tions. Forest Res. Pap. 73(2): 159–165 (in Polish with English Abstract).
4. Bukowska-Jania E., Pulina M. (Eds.). Studies of the environment of the Borne Sulinowo mili-tary area. Wyd. Nauk. PWN. Warsaw 1997 (in Polish).
SOILS OF BARE LANDS IN THE TORUŃ MILITARY AREA

TECHNOGENIC SOILS OF POLAND 342
5. Certini G., Ugolini F. C., Corti G., Agnelli A. 1998. Early stages of podzolization under Corsican pine (Pinus nigra Arn. ssp. laricio). Geoderma 83: 103–125.
6. Chojnacka J., Cyzman W., Nienartowicz A., Deptuła M. 2010. Variability of the structure and directions of the development of heaths and psammophilous grasslands within the artillery range near the city of Toruń. Ecol. Quest. 12: 87–125.
7. Clements F. E. 1916. Plant succession and the analysis of the development of vegetation. Pub-lication 242, Carnegie Institute of Washington, Washington, DC.
8. Dziadowiec H. 1990. Decomposition of litter in selected forest ecosystems (mineralization, nutrient release, humification). UMK, Toruń (in Polish with English Summary).
9. Elgersma A. M. 1998. Primary forest succesion on poor sandy soils as related to site factors. Biodiversity Conserv. 7: 193–206.
10. FAO. 2006. Guidelines for Soil Description. Food and Agriculture Organization of the United Nations, Rome.
11. Gugnacka-Fiedor W., Adamska E. 2010. The preservation state of the flora and vegetation of the artillery range near the city of Toruń. Ecol. Quest. 12: 75–86.
12. IUSS Working Group WRB. 2007. World References Base for Soil Resources 2006. Update 2007, World Soil Resources Reports, 103, FAO, Rome.
13. Jankowski M. Bednarek R. 2000. Quantitative and qualitative changes of properties as basis for distinguishing development stages of soils formed from dune sands. Pol. J. Soil Sci. 33(2): 61–69.
14. Jankowski M., Bednarek R. 2002. Secondary development stages of soils formed on inland dunes under pine woodlands. 17th WCSS, 14–21 Aug. 2002, Bangkok, Thailand, Transactions CD-rom.
15. Jankowski M. 2010. Some aspects of site conditions of heathlands in the Toruń basin. Ecol. Quest. 12: 145–151.
16. Klawczyński D. 2010. Does the army love forests? Forest management in active military areas. Las Pol. 2: 10–12 (in Polish).
17. Prusinkiewicz Z., Biały 1976. The soils of the selected forest reserves of the provinces of Bydgoszcz, Toruń and Włocławek. Stud. Soc. Sci. Tor. 8, 3, sectio C: 3–173.
18. Rahmonow O. 1999. Processes of vegetation overgrowing in the Błędów Desert (Southern Po-land). Uniwersytet Śląski, Sosnowiec (in Polish).
19. Rahmonov O., Oleś W. 2010. Vegetation succession over an area of a medieval ecological disaster. The case of the Błędów Desert, Poland. Erdkunde 64: 241–255.
20. Reuter G. 1962. Tendenzen der Bodenentwicklung im Küstenbezirk Mecklenburgs. Deutsche Aka-demie der Landwirtschaftswissenschaften zu Berlin. Wissenschaftliche Abhandlungen 49, Berlin.
21. Saison C., Schwartz C., Florentin L., Morel J.L. 2000. Soils in military areas devoted to the destruction of used explosives [In:] W. Burghardt, Ch. Dornauf (Eds.) First International Conference on Soils of Urban, Industrial, Tra�c and Mining areas, Proceedings, 1. Essen, Germany: 63–65.
22. Sewerniak P., Bednarek R., Szymańska A. 2011. Preliminary studies of the influence of dune-slope exposure on a pine forest ecosystem in the Toruń Basin. Forest Res. Pap. 72 (1): 37–46 (in Polish with English Abstract).
M. JANKOWSKI, P. SEWERNIAK

343 TECHNOGENIC SOILS OF POLAND
23. Sewerniak P., Jankowski M., Dąbrowski M. 2012. Diversity of soils and vegetation on inland dunes in the military area near Torun (northern Poland) [In:] Eurosoil 2012 abstracts, Bari: 1997.
24. Shelemina A., Gagarina E. 2000. Soil remediation on the ground military structures [In:] W. Burghardt, Ch. Dornauf (Eds.) First International Conference on Soils of Urban, Industrial, Tra�c and Mining areas, Proceedings, 1. Essen, Germany 805–809.
25. Stützer A. 1998. Early stages of podzolization in young aeolian sediments, western Jutland. Catena 32: 115–129.
26. van Reeuwijk L.P. 2006. Procedures for soil analysis. 7th Edition. Technical Report 9, ISRIC – World Soil Information, Wageningen, Netherlands.
27. Wasilewski S. 2004. Outline of the history of the Toruń artillery range. Wydawnictwo Centrum Szkolenia i Artylerii w Toruniu, Toruń (in Polish).
28. Zubkowicz R. 2010. Cleaning up after the army. Las Pol. 2: 13 (in Polish).
SOILS OF BARE LANDS IN THE TORUŃ MILITARY AREA


345 TECHNOGENIC SOILS OF POLAND
SOILS CONSTRUCTED ON THE 19th CENTURY FORTIFICATIONS IN TORUŃ
MICHAŁ JANKOWSKI, RENATA BEDNAREK, MAGDALENA JAWORSKA
18
Introduction
Fortifications have been important elements of most cities worldwide since the begin-ning of the human settlement history. Besides their military, defensive function, build-ings of fortifications strongly influenced the shape and structure of cities, stimulating or inhibiting their development. For the construction of castles, strongholds and forts, natural environment has been strongly modified and thus such objects become new, anthropogenic elements of the landscape. Among other elements of the environment, such as relief, water conditions and vegetation, the soil cover, as the land surface zone is the most exposed to anthropopressure and technopressure. During building of mili-tary objects, soils were altered, destroyed or used as a material for construction of vari-ous earthworks. New artificial soils have also been formed by man as construction ele-ments – to protect and hide fortification buildings in the landscape, and to play an essential role of natural soils – to constitute a substrate for vegetation that stabilise and hide fortifications. Such soils, due to their technogenic origin can be included in the group of technogenic soils.
The aim of this chapter is to characterise soils constructed on the roofs of fortifications built by Prussians in Toruń at the end of the 19th century, in terms of their morphology, basic properties, origin of the material used for the construction and also taxonomic position. Besides numerous historical and technical descriptions of forts, characteris-tics of vegetation of the former Toruń fortress area has been presented in details by Ceynowa-Giełdon and Nienartowicz (1994). General modifications of the geographical environment of Toruń, e.g. related to earthworks made for fortification purposes, have been described by Fedorowicz (1993). Soils on fortifications have not been investigated until now.

TECHNOGENIC SOILS OF POLAND 346
Study area and soil profile documentation
Since the moment of its foundation in 1233, Toruń functioned as a fortified town of great commercial, political and military importance (Fig. 1). Military constructions have been built, modernized and demolished through the centuries.
Fig. 1. The general shape of the former Toruń fortress complex and location of the study objects
Apart from gothic city walls, towers, gates and ruins of two castles, two rings of the 19th century brick-earth fortifications have preserved until today (Fig. 1, 2) evidencing the character of the fortress established by Prussians during the Partitions of Poland. Since the end of the 18th Century until the end of the First World War, the border be-tween the Prussian Partition and the Russian Partition was located about 10 km south-east of Toruń. Between 1815 and 1866, the inner ring of forts and garrison buildings (e.g. hospital and bakery) was built in the close vicinity of the medieval town (Biskup 1998a). Due to the progress in the martial arts, especially development of artillery and siege techniques in the middle of the 19th century, the outer ring of forts was raised after the Franco-Prussian War (1870–1871). During the years of 1877–1892, 15 modern artillery
M. JANKOWSKI, R. BEDNAREK, M. JAWORSKA

347 TECHNOGENIC SOILS OF POLAND
(main and medium) forts and about 80 smaller military objects (ammunition, artillery and infantry shelters, earth batteries) were built around the town on both sides of the Vistula River, at a distance of 3–4 km from the city centre and connected by the net of roads (Biskup et al. 1975; Biskup 1998b).
Fig. 2. Examples of brick-earth constructions of fort VI located in the outer ring of forts in Toruń: a. the main entrance, b. fortified moat
SOILS CONSTRUCTED ON THE 19th CENTURY FORTIFICATIONS IN TORUŃ

TECHNOGENIC SOILS OF POLAND 348
The studies were carried out on selected objects belonging to the outer ring of forts in Toruń (Fig. 2). Three representative profiles located on roofs of shelters have been selected for detailed analysis (van Reeuwijk 2006) and for presentation in this work.
The whole area of Toruń and its surroundings are situated on glaciofluvial and flu-vial terraces of the Toruń Basin formed during the Late Pleistocene and Holocene. The altitude of terraces in the city, ranges from the present-day floodplain (35 m a.s.l.) to the highest (X) outwash terrace (77 m a.s.l.). Although in general the surface of particu-lar terraces is flat, in many places, inland dunes of periglacial origin form slightly undu-lated landscape or single hillocks. Forts and other military objects in most cases are integrated with these landforms.
Table 1. Selected soil properties – profile 1
HORIZON Ap ACp 2Cp 3Cp1 3Cp2
DEPTH [cm] 0–27 27–37 37–51 51–73 73–93
PARTICLE SIZE DISTRIBUTION [%]
>2 mm 0 0 0 0 0
2 mm–50 µm 93 96 33 99 100
50–2 µm 7 4 32 1 0
<2 µm 0 0 35 0 0
TEXTURE CLASS (USDA) sand sand clay loam sand sand
SOIL MATRIX COLOUR
drymoist
2.5Y 3/12.5Y 2/1
10YR 4/210YR 2/1
10YR 5/210YR 3/2
10YR 6/410YR 5/4
10YR 5/410YR 4/4
LoI [%] 5.00 1.80 3.87 0.26 0.36
OC [%] 2.03 0.79 0.79 — —
Nt [%] 0.177 0.058 0.049 — —
C:N 11 14 — — —
pHin H2O 5.8 6.5 8.1 8.1 8.2
in 1M KCl 5.0 5.5 7.3 7.7 7.9
M. JANKOWSKI, R. BEDNAREK, M. JAWORSKA

349 TECHNOGENIC SOILS OF POLAND
Profile 1
Location: Fort VIII, shelter on the top
Bielańska st., Toruń
Coordinates: 53°01’24’ N
18°33’22’ E
Soil classification (WRB 2007): Linic Umbric Technosol
(Arenic, Greyic)
Ap – 0–27 cm: humus layer, sand, very dark grey, single grain structure, slightly moist, rhizomes of grasses, artefacts (pieces of bricks, charcoals, <1%), clear boundary.
ACp – 27–37 cm: mixed layer, sand, dark greyish brown, single grain structure, slightly moist, rhizomes of grasses, clear boundary.
2Cp – 37–51 cm: isolating layer, clay loam, greyish brown, fine angular structure, slightly moist, rhizomes of grasses, abrupt boundary.
3Cp1 – 51–73 cm: filtrating layer, sand, light yellowish brown, single grain structure, slightly moist, single rhizomes of bushes, clear boundary.
3Cp2 – 73–93 cm: draining layer, sand, yellowish brown, single grain structure, slightly moist, single rhizomes of bushes, clear boundary.
4 Ru – geomembrane – below 93 cm: concrete roof of the shelter.
SOILS CONSTRUCTED ON THE 19th CENTURY FORTIFICATIONS IN TORUŃ
0 cm
40 cm
40 cm
60 cm
80 cm

TECHNOGENIC SOILS OF POLAND 350
Profile 2
Location: Infantry shelter J-12, east of Fort VI
between Storczykowa and Polna st. Toruń
Coordinates: 53°02’23’ N
18°35’28’ E
Soil classification (WRB 2007): Linic Umbric Technosol
(Arenic, Greyic)
Ap1 – 0–4.5 cm: humus layer, loamy sand, dark brown, single grain structure, slightly moist, rhizomes of grasses, transitional boundary.
Ap2 – 4.5–16 cm: humus layer, sand, very dark grey, single grain structure, slightly moist, rhizomes of grasses, clear boundary, in places unclear.
2Cp – 16–22 cm: isolating layer, clay, yellowish brown, yellow and dark grey gleyic pattern, fine angular structure, slightly moist, rhizomes of grasses, in places interrupted by wedges of humus material, abrupt boundary.
3Cp – 22–59 cm: draining layer, sand, light yellow-ish brown, single grain structure, slightly moist, single rhizomes of bushes, single krotovinas, clear boundary.
4 Ru – geomembrane – below 59 cm: concrete roof of the shelter.
M. JANKOWSKI, R. BEDNAREK, M. JAWORSKA
0 cm
20 cm
40 cm

351 TECHNOGENIC SOILS OF POLAND
Table 2. Selected soil properties – profile 2
HORIZON Ap1 Ap2 2Cp 3Cp
DEPTH [cm] 0–4.5 4.5–16 16–22 22–59
PARTICLE SIZE DISTRIBUTION [%]
>2 mm 0 0 0 0
2 mm–50 µm 83 89 34 99
<50 µm 8 11 29 1
<2 µm 9 0 47 0
TEXTURE CLASS (USDA) loamy sand sand clay sand
SOIL MATRIX COLOUR
dry
moist
7.5YR 3/2
7.5YR 2.5/1
10YR 3/1
10YR 2/1
10YR 7/82.5Y 6/32.5Y 4/110YR 6/82.5Y 6/22.5Y 3/1
10YR 6/4
10YR 4/4
LoI [%] 9.57 8.75 4.03 0.37
OC [%] 4.36 3.38 0.55 —
Nt [%] 0.659 0.310 0.066 —
C:N 6 11 — —
pHin H2O 5.9 5.5 6.3 6.9
in 1M KCl 5.1 4.7 4.8 6.1
SOILS CONSTRUCTED ON THE 19th CENTURY FORTIFICATIONS IN TORUŃ

TECHNOGENIC SOILS OF POLAND 352
Profile 3
Location: Artillery shelter A-1,
southeast of the Fort II Winna st., Toruń
Coordinates: 53°01’13’ N
18°39’43’ E
Soil classification (WRB 2007): Linic Technosol (Arenic)
Ap1 – 0–13 cm: humus layer, sand, dark greyish brown, single grain structure, slightly moist, rhizomes of grasses, unclear boundary.
Ap2 – 13–26 cm: humus layer, sand, dark greyish brown, single grain structure, slightly moist, rhizomes of grasses, clear boundary.
2Cp – 26–34 cm: isolating layer, silty loam, yellowish brown with single rusty mottles, massive struc-ture, slightly moist, single rhizomes of grasses, clear boundary.
3Cp – 34–84 cm: draining layer, sand with single stones, pale brown, single grain structure, slightly moist, single rhizomes, clear boundary.
4 Ru – geomembrane – below 84 cm: concrete roof of the shelter.
M. JANKOWSKI, R. BEDNAREK, M. JAWORSKA
0 cm
20 cm
40 cm
60 cm

353 TECHNOGENIC SOILS OF POLAND
Table 3. Selected soil properties – profile 3
HORIZON Ap1 Ap2 2Cp 3Cp
DEPTH [cm] 0–13 13–26 26–34 34–84
PARTICLE SIZE DISTRIBUTION [%]
>2 mm 0 0 0 +
2 mm–50 µm 90 90 35 100
<50 µm 9 7 52 0
<2 µm 1 3 13 0
TEXTURE CLASS (USDA) sand sand silty loam sand
SOIL MATRIX COLOUR
drymoist
10YR 4/210YR 2/2
10YR 4/210YR 2/2
10YR 5/410YR 3/3
10YR 6/310YR 4/3
LoI [%] 2.73 1.21 2.96 0.33
OC [%] 1.37 0.53 0.88 —
Nt [%] 0.108 0.044 0.090 —
C:N 13 12 — —
pHin H2O 5.9 6.0 6.8 8.2
in 1M KCl 5.0 5.0 5.8 8.0
Morphology and properties of soils on fortifications
The soils covering fort buildings have been constructed according to the standard, deliberate scheme (Fig. 3). In all the studied profiles, they had a similar sequence of three layers: 1. humus layer (Ap) – covering the whole construction and formed into 16–37 cm
thick mantle. It is built from sandy material rich in well-decomposed organic mat-ter. This layer constitutes a substrate for vegetation stabilizing the whole con-struction and camouflaging the fortifications.
2. isolating layer (2Cp) – underlying the humus layer. It is built from weakly permeable material forming a shallow, 6–14 cm thick membrane. The role of this layer is to stop the infiltration of rainwater, however, it is also rich in mineral forms of nutrients. Thus, it also supports the growth of plants.
SOILS CONSTRUCTED ON THE 19th CENTURY FORTIFICATIONS IN TORUŃ

TECHNOGENIC SOILS OF POLAND 354
3. draining layer (3Cp) – underlying the isolating layer and deposited directly on the concrete, slightly inclined roof of the shelter. It has a thickness of 50 to 100 cm and it is built from permeable sandy material. Its role is to drain the redundant rainwater, which could penetrate through the soil and moisturise and damage the roof. Sand used for the construction acts also as a protective element, due to its high resistance to penetration by bullets and ability to absorb the explosions.
4. concrete roof of the fort (shelter; 4Ru) – limiting the soil depth.
Fig. 3. Scheme of soil construction on fortifications. 1 – humus layer, 2 – isolating layer, 3 – draining layer, 4 – concrete roof of the fort, 5 – vegetation cover
In this chapter, the layers have been marked with the su³x letter “p’. Although the materials building the soil layers have been neither ploughed nor disturbed, but rede-posited, according to definitions of FAO (2006), there is no other su³x closely corre-sponding to the presented case.
Each of the characteristic layers shows specific features related to the role they should play in the whole construction.
Humus and draining layers are built from loose permeable materials with sandy (loamy sand in Ap1 horizon of the profile 2) texture. Isolating layers are built from much finer materials. In profile 1, it is clay loam, in profile 2 – clay and in profile 3 – silty loam.
Humus layers contain from 1.4 to 4.4% of organic carbon (OC) and they are charac-terised by low values of the C:N ratio (6–13) and slightly acid reaction: pH 6.0 in H2O and 5.0 in KCl. Such properties are very advantageous compared to most of the sandy soils in the Toruń Basin, which are mainly excessively permeable, chemically poor and acid. Materials building the isolating layers and draining layers are depleted of significant amounts of organic matter. Their reaction varies from slightly acid to alkaline (pH 6.3–8.2 in H2O and 4.8–8.0 in KCl).
M. JANKOWSKI, R. BEDNAREK, M. JAWORSKA

355 TECHNOGENIC SOILS OF POLAND
Origin of soil materials used for the construction of soils on fortifications
Characteristics of morphological, textural and chemical properties of the materials used for the construction of soils on roofs of fortifications allowed to identify their pri-mary sources. Although these materials were transported and redeposited, they still show features typical of natural horizons of soils occurring in the vicinity of forts (Fig. 4; Bednarek, Jankowski 2006).
Fig. 4. Examples of natural soils occurring in the vicinity of the study objects, which could be sources of construction materials for soils on forts
Humic layers of profiles 1 and 2 with dark grey colour, relatively rich in organic matter and characterised by Greyic properties according to WRB definition (IUSS Working Group WRB 2007): the presence of uncoated mineral grains not complexed with humus, are similar to natural humus Ah horizons of mucky soils – Umbric Gleysols (Greyic, Arenic) occurring in depressions on the surface of terraces and in depressions between dunes. Due to the groundwater influence, such soils are the most fertile among soils of sandy terraces and dunes of the Toruń Basin.
Fine-grain materials used for the construction of the isolating layers in profiles 1 and 2 were derived from Tertiary (Mio-Pliocene) mottled clay deposits, underlying the Pleis-tocene glaciofluvial sands. Such sediments have a very characteristic colour pattern ap-pearing also in isolating layers. They are currently exploited in a mine located south of Toruń. Traces of their exploitation in the past can be found also in other areas of the city e.g. halfway between forts, where these profiles are located.
Draining layers in profiles 1 and 2 are deposited in the form of mixture of strata and lens of material derived from deeper horizons depleted of humus (E, Bw, Bs, C) in soils dominating on the terraces and dunes around Toruń (Brunic Arenosols, Podzols and Umbric Gleysols).
SOILS CONSTRUCTED ON THE 19th CENTURY FORTIFICATIONS IN TORUŃ

TECHNOGENIC SOILS OF POLAND 356
Materials of profile 3 have properties characteristic of the stratified silty-sandy allu-vial Holocene deposits building Fluvisols, which occur in the present-day floodplain of the Vistula River. These features include: sandy-silty texture, brown colour and quite high organic matter content, even in deeper layers. Such origin of the material in profile 3 seems to be confirmed by the fact that shelter A-1 where profile 1 is located is situated close to the Vistula River, exactly on the edge between high terrace IX and the floodplain.
Classification of soils on fortifications
By the criteria of the World Reference Base for Soil Resources (IUSS Working Group WRB 2007), the soils on the Prussian fortifications in Toruń can be classified as Linic Technosols due to the presence of a concrete geomembrane in their profile. Such clas-sification refers also to their technogenic origin, although materials used for their con-struction were derived from natural soil horizons and they do not contain artefacts. Properties of particular layers in profiles 1 and 2 can be additionally marked with the prefix Umbric and su³xes Arenic and Greyic. The soil in profile 3 can be classified as Linic Technosol (Arenic).
Apart from WRB, several names reflecting the character and origin of the soils under study can be adopted from classifications of urban and industrial soils proposed by dif-ferent authors for cities in di�erent countries.
In the classification proposed by Burghardt (1994), soils under study are most similar to Allosols (more than 80 cm deep, formed from the material of natural origin) included in Deposols, i.e. the subunit in Urbic Anthrosols.
Soils intentionally constructed by man, having a characteristic sequence of layers built from various materials of natural origin and covered with a layer enriched with organic matter, can be called Constructosols. This name is similar to the proposition given by Stroganova et al. (1998), who distinguished similar soils as a subunit of Urbo-technozems. The term Constructosols seems to reflect most accurately the character and origin of the studied soils. In general, it can also be used for soils intentionally constructed from typical technogenic materials (Séré et al. 2008).
Summary
Technogenic soils are mostly regarded as soils containing technogenic materials (various artefacts). Soils on the 19th century fortifications of Toruń presented in this work are built mainly from natural soil materials, but they are underlain by a concrete technogenic geomembrane of the fort (shelter) roof. The soils under study have been constructed intentionally, by a deliberate scheme, in order to take best advantage of natural properties
M. JANKOWSKI, R. BEDNAREK, M. JAWORSKA
357 TECHNOGENIC SOILS OF POLAND
of particular soil materials used for the formation of humus, isolating and draining layers. Such soils can be called Constructosols and according to WRB soil classification, they can be generally classified as Linic Technosols.
It is worth noting that the sequence of layers in the described technogenic soils is morphologically similar to natural soils occurring in the vicinity despite the fact that they are artificially constructed by man. The soil construction method seems to evi-dence the impressive knowledge of forts’ constructors about soils and their properties, even in times when the ideas of modern soil science only began to develop.
References:
1. Bednarek R., Jankowski M. 2006. Soils. [In:] L. Andrzejewski, P. Weckwerth, S. Burak (Eds.). Toruń and its Surroundings − Environmental Monograph. Wyd. UMK. Toruń: 153–176 (in Polish with English summary).
2. Biskup K. 1998a. The Toruń Fortress – the outer circumference 1814–1914. [In:] L. Narębski (Ed.). Fortyfikacja 5. Zebra, Warsaw – Cracow: 73–87 (in Polish).
3. Biskup K. 1998b. The Toruń Fort Fortress. 1873–1914. [In:] L. Narębski (Ed.). Fortyfikacja 5. Ze-bra, Warsaw – Cracow: 87–107 (in Polish).
4. Biskup K., Narębski L., Rutkowski W. 1975. The Toruń forts. Polskie Towarzystwo Turystyczno-Krajoznawcze. Toruń (in Polish).
5. Burghardt W. 1994. Soils in urban and industrial environments. Zeitschr. Pflanzenernähr. Bodenk. 157, 3: 205–214.
6. Ceynowa-Giełdon M., Nienartowicz A. 1994. Vegetation of the former Toruń fortress fortifica-tions. Guidebook. Scientific Society in Toruń. Popular-scientific works 62 (in Polish).
7. FAO 2006. Guidelines for Soil Description. Food and Agriculture Organization of the United Na-tions, Rome.
8. Fedorowicz J. 1993. Geographical environment anthropogenic transformations in the area of Toruń city. Stud. Soc. Sci. Toruń, Sec. C, 10, 3. (in Polish with English Summary).
9. IUSS Working Group WRB. 2007. World Reference Base for Soil Resources 2006, first update 2007. World Soil Resources Reports, 103, FAO, Rome.
10. Séré G., Schwartz C., Ouvrard S., Sauvage C., Renat J-C, Morel J.L. 2008. Soil construction: a step for ecological reclamation of derelict lands. J. Soil. Sedimen. 8 (2): 130–136.
11. Stroganova M., Myagkova A., Prokofieva T., Skvortsova I. 1998. Soils of Moscow and urban environment. Moscow.
12. van Reeuwijk L.P. 2006. Procedures for soil analysis. 7th Edition. Technical Report 9, ISRIC – World Soil Information, Wageningen, Netherlands.
SOILS CONSTRUCTED ON THE 19th CENTURY FORTIFICATIONS IN TORUŃ