Geochemical position of Pb, Zn and Cd in soils near the Olkusz mine/smelter, South Poland: effects...
20
Environ Monit Assess (2012) 184:2517–2536 DOI 10.1007/s10661-011-2135-2 Geochemical position of Pb, Zn and Cd in soils near the Olkusz mine/smelter, South Poland: effects of land use, type of contamination and distance from pollution source Vladislav Chrastný · Aleš Van ˇ ek · Leslaw Teper · Jerzy Cabala · Jan Procházka · Libor Pechar · Petr Drahota · Vít Penížek · Michael Komárek · Martin Novák Received: 1 September 2010 / Accepted: 25 May 2011 / Published online: 15 June 2011 © Springer Science+Business Media B.V. (outside the USA) 2011 Abstract The soils adjacent to an area of histori- cal mining, ore processing and smelting activities V. Chrastný (B ) · M. Novák Czech Geological Survey, Geologická 6, 152 00 Praha 5, Czech Republic e-mail: [email protected] V. Chrastný Faculty of Agriculture, University of South Bohemia, Studentská 13, 370 05 ˇ Ceské Bud ˇ ejovice, Czech Republic A. Van ˇ ek · V. Penížek Department of Soil Science and Soil Protection, Czech University of Life Sciences Prague, Kamýcká 129, 165 21 Praha 6, Czech Republic L. Teper · J. Cabala Faculty of Earth Sciences, University of Silesia, 60 B ˛ edzi ´ nska St, 41-200 Sosnowiec, Poland J. Procházka · L. Pechar Applied Ecology Laboratory, Faculty of Agriculture, University of South Bohemia, Studentská 13, 370 05 ˇ Ceské Bud ˇ ejovice, Czech Republic P. Drahota Institute of Geochemistry, Mineralogy and Mineral Resources, Charles University, Albertov 6, 128 43 Praha 2, Czech Republic M. Komárek Department of Agro-Environmental Chemistry and Plant Nutrition, Czech University of Life Sciences Prague, Kamýcká 129, 165 21 Praha 6, Czech Republic reflects the historical background and a mixing of recent contamination sources. The main an- thropogenic sources of metals can be connected with historical and recent mine wastes, direct at- mospheric deposition from mining and smelting processes and dust particles originating from open tailings ponds. Contaminated agriculture and for- est soil samples with mining and smelting related pollutants were collected at different distances from the source of emission in the Pb–Zn–Ag mining area near Olkusz, Upper Silesia to (a) compare the chemical speciation of metals in agri- culture and forest soils situated at the same dis- tance from the point source of pollution (paired sampling design), (b) to evaluate the relationship between the distance from the polluter and the retention of the metals in the soil, (c) to describe mineralogy transformation of anthropogenic soil particles in the soils, and (d) to assess the effect of deposited fly ash vs. dumped mining/smelting waste on the mobility and bioavailability of metals in the soil. Forest soils are much more affected with smelting processes than agriculture soils. However, agriculture soils suffer from the down- ward metal migration more than the forest soils. The maximum concentrations of Pb, Zn, and Cd were detected in a forest soil profile near the smelter and reached about 25 g kg −1 , 20 g kg −1 and 200 mg kg −1 for Pb, Zn and Cd, respectively. The metal pollutants from smelting processes are less stable under slightly alkaline soil pH then
-
Upload
independent -
Category
Documents
-
view
0 -
download
0
Transcript of Geochemical position of Pb, Zn and Cd in soils near the Olkusz mine/smelter, South Poland: effects...

Environ Monit Assess (2012) 184:2517–2536DOI 10.1007/s10661-011-2135-2
Geochemical position of Pb, Zn and Cd in soils nearthe Olkusz mine/smelter, South Poland: effects of land use,type of contamination and distance from pollution source
Vladislav Chrastný · Aleš Vanek · Leslaw Teper · Jerzy Cabala · Jan Procházka ·Libor Pechar · Petr Drahota · Vít Penížek · Michael Komárek · Martin Novák
Received: 1 September 2010 / Accepted: 25 May 2011 / Published online: 15 June 2011© Springer Science+Business Media B.V. (outside the USA) 2011
Abstract The soils adjacent to an area of histori-cal mining, ore processing and smelting activities
V. Chrastný (B) · M. NovákCzech Geological Survey, Geologická 6, 152 00Praha 5, Czech Republice-mail: [email protected]
V. ChrastnýFaculty of Agriculture, University of South Bohemia,Studentská 13, 370 05 Ceské Budejovice,Czech Republic
A. Vanek · V. PenížekDepartment of Soil Science and Soil Protection, CzechUniversity of Life Sciences Prague, Kamýcká 129,165 21 Praha 6, Czech Republic
L. Teper · J. CabalaFaculty of Earth Sciences, University of Silesia,60 Bedzinska St, 41-200 Sosnowiec, Poland
J. Procházka · L. PecharApplied Ecology Laboratory, Faculty of Agriculture,University of South Bohemia, Studentská 13, 370 05Ceské Budejovice, Czech Republic
P. DrahotaInstitute of Geochemistry, Mineralogy and MineralResources, Charles University, Albertov 6, 128 43Praha 2, Czech Republic
M. KomárekDepartment of Agro-Environmental Chemistry andPlant Nutrition, Czech University of Life SciencesPrague, Kamýcká 129, 165 21 Praha 6, Czech Republic
reflects the historical background and a mixingof recent contamination sources. The main an-thropogenic sources of metals can be connectedwith historical and recent mine wastes, direct at-mospheric deposition from mining and smeltingprocesses and dust particles originating from opentailings ponds. Contaminated agriculture and for-est soil samples with mining and smelting relatedpollutants were collected at different distancesfrom the source of emission in the Pb–Zn–Agmining area near Olkusz, Upper Silesia to (a)compare the chemical speciation of metals in agri-culture and forest soils situated at the same dis-tance from the point source of pollution (pairedsampling design), (b) to evaluate the relationshipbetween the distance from the polluter and theretention of the metals in the soil, (c) to describemineralogy transformation of anthropogenic soilparticles in the soils, and (d) to assess the effectof deposited fly ash vs. dumped mining/smeltingwaste on the mobility and bioavailability of metalsin the soil. Forest soils are much more affectedwith smelting processes than agriculture soils.However, agriculture soils suffer from the down-ward metal migration more than the forest soils.The maximum concentrations of Pb, Zn, and Cdwere detected in a forest soil profile near thesmelter and reached about 25 g kg−1, 20 g kg−1
and 200 mg kg−1 for Pb, Zn and Cd, respectively.The metal pollutants from smelting processes areless stable under slightly alkaline soil pH then

2518 Environ Monit Assess (2012) 184:2517–2536
acidic due to the metal carbonates precipitation.Metal mobility ranges in the studied forest soilsare as follows: Pb > Zn ≈ Cd for relatively circum-neutral soil pH (near the smelter), Cd > Zn > Pbfor acidic soils (further from the smelter). Underrelatively comparable pH conditions, the main soilproperties influencing metal migration are totalorganic carbon and cation exchange capacity. Themobilization of Pb, Zn and Cd in soils dependson the persistence of the metal-containing parti-cles in the atmosphere; the longer the time, themore abundant the stable forms. The dumpedmining/smelting waste is less risk of easily mo-bilizable metal forms, however, downward metalmigration especially due to the periodical leachingof the waste was observed.
Keywords Lead · Metals · Mining and smelting ·Pollution · Soils
Introduction
Ore mining and smelting in South Poland startedin the twelfth century, and intensified in the pe-riod of centrally planned economy (1950s–1980s;Cabala and Teper 2007). It caused large-scale en-vironmental pollution, negatively affecting life ex-pectancy and quality of life in local communities.
In the Olkusz ore district, Upper Silesia, the lastunderground mine is still active and one smelteris also in operation. The composition of the pol-lutants is inherited from primary Zn–Pb–Ag oremineralization related to Mississippi Valley-Type(MVT) low-temperature hydrothermal formationthat is mined and then used in smelting process.The ore consists chiefly of strata-bound galenaand sphalerite with associated Fe sulfides hostedin dolomites. Mineral components of the run-of-mine ore do not undergo significant chemicalalteration during processing (Cabala and Teper2007). The contamination of soils in the regioncomes from three sources. Some soils are di-rectly affected, or even sealed, by the dumpingof mining and smelting waste materials (Ullrichet al. 1999; Cabala and Teper 2007; Cabala et al.2009). The remobilization of dust particles fromthe surface of open tailing ponds supplies con-siderable amounts of potentially toxic elements
to adjacent ecosystems, while the deposition ofair-borne particles affects large areas around thepoint sources of pollution (Teper 2009). Due toa large surface area, tree canopies, and especiallythose of conifers, are effective scavengers of air-borne pollutants; both dissolved and particulate.As a result, forest soils receive elevated amountsof atmospheric pollutants, compared to nearbyclearings (Danek 2007).
The fate of mining and smelting related pol-lutants in the soils is also influenced by land usetype. The same input of pollutants will followdifferent dispersion pathways in forests and inagricultural land. Also, the mean residence timeand the rate of chemical transformations will varywith soil properties and ecosystem function.
The mobility and bioavailability of metals de-pend not only on the properties of the soils,but also on the structure and other physico-chemical characteristics of the contaminating ma-terial. A leaching test of air-pollution-controlresidues from a secondary lead smelter showedthat, after deposition of the residues, a mineralog-ical transformation takes place. The transforma-tion process depends on the pH of the leachingsolution (Ettler et al. 2005a).
Several studies on metal contamination of soilsin the Upper Silesia region (South Poland) orig-inating from mining and smelting have beenpublished (Cabala and Teper 2007; Teper 2009;Cabala et al. 2009). The MVT formation relatedore composition produces specific metal assem-blage found in wastes, with domination of Pb, Znand Cd. Here, we focus on the quantification ofvarious forms of the three potentially toxic metalsin the soils near the Olkusz mine and smelter.In all, we sampled vertical soil profiles in twomeadows and three forest stands. The samplingsites form an 8-km long transect downwind fromthe smelter, reaching a suburban, densely popu-lated area of the city of Olkusz. Our objectiveswere (a) to compare the chemical speciation ofmetals in meadow and forest soils situated at thesame distance from the point source of pollution(paired sampling design), (b) to evaluate the re-lationship between the distance from the polluterand retention of the metals in soil, (c) to describethe mineralogy of anthropogenic soil particles inthe soils, and (d) to assess the effect of deposited
Environ Monit Assess (2012) 184:2517–2536 2519
fly ash vs. dumped mining/smelting waste on themobility and bioavailability of metals in the soil.
Materials and methods
Soil sampling
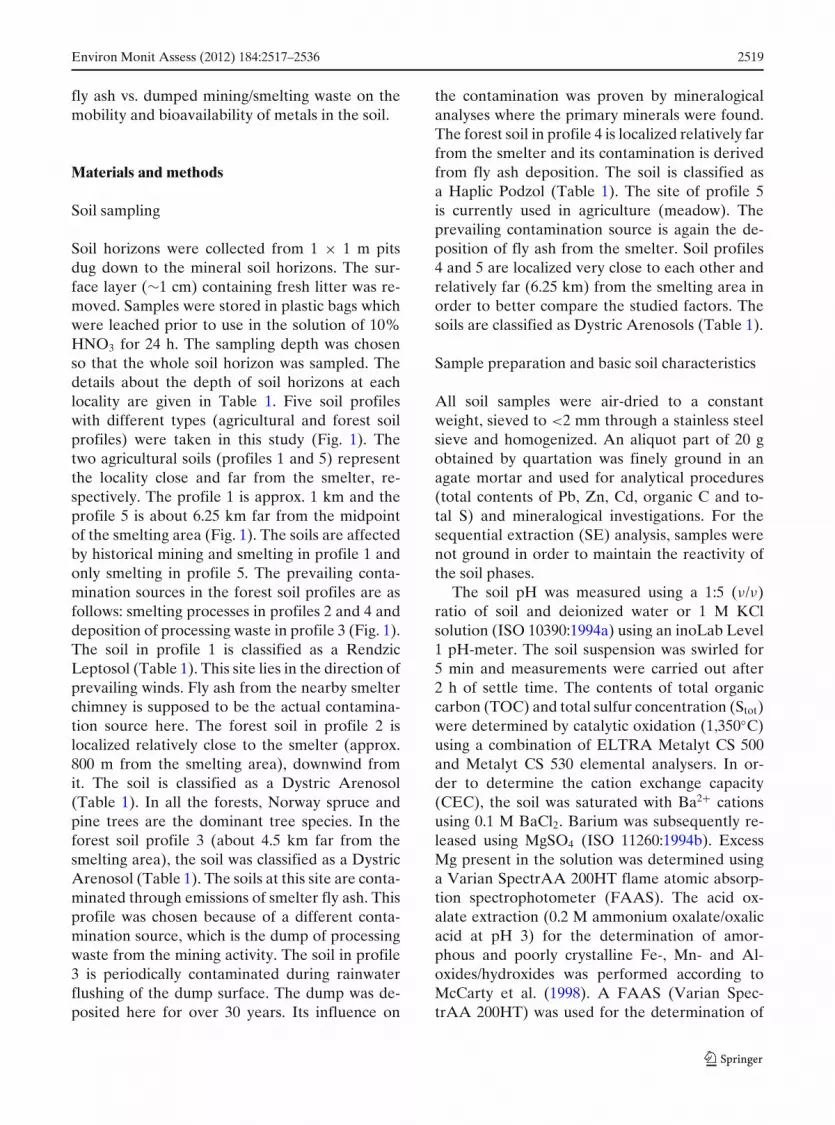
Soil horizons were collected from 1 × 1 m pitsdug down to the mineral soil horizons. The sur-face layer (∼1 cm) containing fresh litter was re-moved. Samples were stored in plastic bags whichwere leached prior to use in the solution of 10%HNO3 for 24 h. The sampling depth was chosenso that the whole soil horizon was sampled. Thedetails about the depth of soil horizons at eachlocality are given in Table 1. Five soil profileswith different types (agricultural and forest soilprofiles) were taken in this study (Fig. 1). Thetwo agricultural soils (profiles 1 and 5) representthe locality close and far from the smelter, re-spectively. The profile 1 is approx. 1 km and theprofile 5 is about 6.25 km far from the midpointof the smelting area (Fig. 1). The soils are affectedby historical mining and smelting in profile 1 andonly smelting in profile 5. The prevailing conta-mination sources in the forest soil profiles are asfollows: smelting processes in profiles 2 and 4 anddeposition of processing waste in profile 3 (Fig. 1).The soil in profile 1 is classified as a RendzicLeptosol (Table 1). This site lies in the direction ofprevailing winds. Fly ash from the nearby smelterchimney is supposed to be the actual contamina-tion source here. The forest soil in profile 2 islocalized relatively close to the smelter (approx.800 m from the smelting area), downwind fromit. The soil is classified as a Dystric Arenosol(Table 1). In all the forests, Norway spruce andpine trees are the dominant tree species. In theforest soil profile 3 (about 4.5 km far from thesmelting area), the soil was classified as a DystricArenosol (Table 1). The soils at this site are conta-minated through emissions of smelter fly ash. Thisprofile was chosen because of a different conta-mination source, which is the dump of processingwaste from the mining activity. The soil in profile3 is periodically contaminated during rainwaterflushing of the dump surface. The dump was de-posited here for over 30 years. Its influence on
the contamination was proven by mineralogicalanalyses where the primary minerals were found.The forest soil in profile 4 is localized relatively farfrom the smelter and its contamination is derivedfrom fly ash deposition. The soil is classified asa Haplic Podzol (Table 1). The site of profile 5is currently used in agriculture (meadow). Theprevailing contamination source is again the de-position of fly ash from the smelter. Soil profiles4 and 5 are localized very close to each other andrelatively far (6.25 km) from the smelting area inorder to better compare the studied factors. Thesoils are classified as Dystric Arenosols (Table 1).
Sample preparation and basic soil characteristics
All soil samples were air-dried to a constantweight, sieved to <2 mm through a stainless steelsieve and homogenized. An aliquot part of 20 gobtained by quartation was finely ground in anagate mortar and used for analytical procedures(total contents of Pb, Zn, Cd, organic C and to-tal S) and mineralogical investigations. For thesequential extraction (SE) analysis, samples werenot ground in order to maintain the reactivity ofthe soil phases.
The soil pH was measured using a 1:5 (ν/ν)ratio of soil and deionized water or 1 M KClsolution (ISO 10390:1994a) using an inoLab Level1 pH-meter. The soil suspension was swirled for5 min and measurements were carried out after2 h of settle time. The contents of total organiccarbon (TOC) and total sulfur concentration (Stot)were determined by catalytic oxidation (1,350◦C)using a combination of ELTRA Metalyt CS 500and Metalyt CS 530 elemental analysers. In or-der to determine the cation exchange capacity(CEC), the soil was saturated with Ba2+ cationsusing 0.1 M BaCl2. Barium was subsequently re-leased using MgSO4 (ISO 11260:1994b). ExcessMg present in the solution was determined usinga Varian SpectrAA 200HT flame atomic absorp-tion spectrophotometer (FAAS). The acid ox-alate extraction (0.2 M ammonium oxalate/oxalicacid at pH 3) for the determination of amor-phous and poorly crystalline Fe-, Mn- and Al-oxides/hydroxides was performed according toMcCarty et al. (1998). A FAAS (Varian Spec-trAA 200HT) was used for the determination of

2520 Environ Monit Assess (2012) 184:2517–2536
Tab
le1
Bas
icso
ilph
ysic
o-ch
emic
alch
arac
teri
stic
s
Pro
file
Nr.
/GP
ST
ype
ofSo
ilty
peH
oriz
onD
epth
Par
ticl
esi
zedi
stri
buti
onpH
CE
CT
CT
SF
eox
Mno
xA
lox
posi
tion
cont
amin
atio
ncm
Cla
y%
Silt
%Sa
nd%
KC
lH
2OC
mol
kg−1
%M
gkg
−1g
kg−1
gkg
−1g
kg−1
1/N
5017
.063
Smel
ting
/min
ing
Ren
dzic
Lep
toso
lA
h0–
256.
030
.563
.57.
17.
543
.22.
90.
061.
671.
221.
19E
1928
.386
(mea
dow
)C
r25
–60
15.9
39.9
44.2
7.7
8.0
40.7
4.8
<0.
010.
690.
750.
742
/N50
16.9
10Sm
elti
ng(f
ores
t)D
ystr
icA
reno
sol
O2–
0n.
d.n.
d.n.
d.6.
97.
038
.221
.43.
1111
.29
0.98
1.99
E19
29.1
09A
i0–
47.
119
.273
.77.
37.
627
.32.
30.
284.
820.
821.
37C
14–
103.
63.
992
.57.
17.
521
.50.
2<
0.01
0.19
0.17
0.34
C2
10–4
02.
85.
791
.57.
47.
725
.90.
6<
0.01
0.75
0.40
0.75
3/N
5017
.650
Pro
cess
ing
was
teD
ystr
icA
reno
sol
O2–
0n.
d.n.
d.n.
d.3.
94.
327
.144
.82.
165.
970.
040.
22E
1932
.290
(for
est)
M0–
123.
930
.965
.23.
43.
510
.20.
85.
824.
730.
000.
13A
p12
–25
2.3
0.5
97.2
3.5
3.5
16.5
0.3
0.12
0.32
0.00
0.08
C25
–60
1.3
1.2
97.5
3.6
3.6
15.3
0.1
0.03
0.44
0.00
0.02
4/N
5018
.887
Smel
ting
(for
est)
Hap
licP
odzo
lO
5–0
n.d.
n.d.
n.d.
3.7
4.3
30.3
34.0
0.31
3.86
0.09
4.20
E19
33.1
92A
e0–
23.
35.
191
.64.
14.
111
.72.
10.
020.
740.
030.
72E
p2–
163.
22.
894
.04.
04.
210
.50.
60.
020.
180.
000.
16C
16–6
04.
92.
193
.04.
85.
214
.80.
1<
0.01
0.10
0.02
0.38
5/N
5018
.824
Smel
ting
Dys
tric
Are
noso
lA
p0–
153.
32.
794
.05.
15.
214
.50.
60.
010.
510.
060.
65E
1933
.074
(mea
dow
)C
15–4
01.
30.
997
.85.
86.
110
.30.
2<
0.01
0.12
0.02
0.45
The
soils
wer
ecl
assi
fied
acco
rdin
gto
the
inte
rnat
iona
lst
anda
rdta
xono
mic
soil
clas
sifi
cati
onsy
stem
endo
rsed
byth
eIn
tern
atio
nal
Uni
onof
Soil
Scie
nces
(Wor
ldR
efer
ence
Bas
e19
98)

Environ Monit Assess (2012) 184:2517–2536 2521
Fig. 1 Location of the study area and the soil sampling sites
Fe, Mn and Al oxalate-extractable concentrations.The particle size distribution was determined bythe hydrometer method (Gee and Bauder 1986).
To determine bulk Pb, Zn, Cd concentrationsin the studied soils, an aliquot of 0.5 g of asoil sample (or bedrock) was digested in a mix-ture of concentrated hot acids HF /HClO4/HNO3
(Merck, Germany). During the analytical pro-cedure, deionized water (MILLI-Q Element,Millipore, France) and suprapure acids (Merck,Germany) were used. Quality control (QC) ofPb, Zn, Cd determination in the soil samples wasevaluated using the certified reference materialLight Sandy Soil 7001 (Analytika, Prague, CzechRepublic). The measured against the certified val-ues of the total metal concentration provides therecovery interval between 90–110%.
In order to obtain chemical fractionation formsof the studied metals (Pb, Zn, Cd) in soils, themodified BCR SE was used. The sequential ex-traction procedure is standardized technique in-volving to distinguish the operationally defined
metal fractions differ in the strength and the char-acter of metal bond to soils. The metals boundto soils are associated with the following SE frac-tions defined by specific extraction agents: theexchangeable or acid-extractable (acetic acidextraction), the reducible (hydroxylamine-hydro-chloride), the oxidisable (hydrogen peroxide) andthe residual defined as a total digest (HF/HClO4/HNO3). More details about the SE procedure aregiven in Quevauviller (2002). In order to deter-mine the easily mobilizable (“labile”) concentra-tion of Pb, Zn, Cd, a 0.05 M EDTA extraction wascarried out (Quevauviller 2002). Each BCR SE,0.05 M EDTA extraction and total sample diges-tions concentration were performed in three par-allel subsamples to obtained three independentmeasurements which were plotted into graphs aserror bars and were used in the statistic tests.
The determination of Pb, Zn and Cd in to-tal and SE samples was performed using aninductively coupled plasma mass spectrometer(ICP-MS, PQExCell, ThermoElemental, UK)
2522 Environ Monit Assess (2012) 184:2517–2536
under standard analytical conditions. The cal-ibration was carried out against an aqueousmulti-elemental standard solution (Merck VI,CertiPUR, Merck, Germany). The technique ofinternal standardization (10 ppb of In and Tbsolution) was used for corrections of incidental an-alytical signal drifts. The Pb isotopic compositionwas determined using ICP-MS. The standard–sample bracketing method was used to eliminateinstrumental mass bias with the NIST SRM 981(Common lead) used as a standard.
Mineralogical analyses
In order to obtain information about Pb miner-alogy and the mineralogical composition of thestudied soils, X-ray diffraction analyses (XRD)of bulk (or pre-concentrated) soil samples werecarried out using a PANalytical X‘Pert Prodiffractometer equipped with a diffracted beammonochromator and an X‘Celerator multichanneldetector. The analyses were performed under thefollowing conditions: Cu Kα radiation, 40 kV,30 mA, step scanning at 0.02◦/150 s in the range 3–80◦ 2θ . A qualitative analysis was performed withX‘Pert High-Score software 1.0d, equipped withthe JCPDS PDF-2 database (ICDD 2003).
Statistical analyses
The data obtained from total digestion and theSE were treated with an analysis of variancewith a consequent multiple range Duncan testbased on Student–Newman–Keuls method thatuses increasing alpha levels to calculate the crit-ical values in each step of the Newman–Keulsprocedure. The results were evaluated on the ba-sis of homogenous groups at a given significancelevel (p < 0.05). All the statistical tests presentedwere performed using the software StatSoft,STATISTICA 6.0 Software (2001).
Results
Basic physico-chemical soil characteristics
Basic physico-chemical characteristics of the stud-ied forest and agricultural (meadow) soils are
summarized in Table 1. The pH of the studied soilsin profiles 1 and 2 was circum-neutral in all hori-zons, while in profiles 3–5, the pH was acidic. Thelower pH values were detected in the upper soilhorizons with the only exceptions being profiles 3and 4. The upper soil horizons O were abundantwith organic C and total S (up to 44.8 wt.% Cand 3.11 wt.% S at profiles 3 and 2, respectively).The CEC varied from 10.3 to 43.2 cmol kg−1 andwas approximately two to three times higher inorganic horizons compared to mineral ones due toincreased soil organic matter contents (Table 1).The clay content was typically under the detectionlimit in forest floor humus (horizon O), while thedetectable values were obtained in agricultureswith the highest value up to 15.9 wt.% (profile 1,horizon C, Table 1).
The agriculture and forest soil profiles differfrom basic soil characteristics which can be re-sponsible for vertical downward metal migrationaccording to study by Sterckeman et al. (2000).The CEC values in agriculture soil profile 1 aremuch higher compared to profile 5, the pH of thesoil in profile 1 is neutral compared to slightlyacidic in profile 5 (7.1 compared to 5.2 in the uppersoil horizons, respectively). The clay/sand contentin profile 1 is higher compared to profile 5. Fromthe three forest soil profiles, the highest CECvalues were found in profile 2 follow by profile4. The lowest clay content was found in profile 3(Table 1).
Total concentrations of metals in agricultureand forest soil profiles
The total concentrations and fractionation of thestudied metals in agriculture (meadow) and for-est soils are presented in Figs. 2, 3, 4, 5, 6, 7,respectively. The agriculture soils localized nearthe smelter (profile 1) are rich in Pb, Cd andZn, compared to the site further from the smelter(profile 5). The total concentrations determinedat the site near the smelter exceed 1,000, 3,000and 20 mg kg−1 for Pb, Zn and Cd, respectively(Figs. 2, 3, 4). A significant decrease (according tothe Duncan test) in total metal concentration withthe distance from the contamination source wasfound for Zn and Cd in both upper organic soilhorizons A and mineral soil horizons C. No such

Environ Monit Assess (2012) 184:2517–2536 2523
Fig. 2 Totalconcentration, chemicalfractionation andEDTA-extractable Pb inagriculture soil profiles 1and 5. In all localities,each BCR SE fractionwas tested separatelyaccording to the Duncantest (p < 0.05); thedifferent typeface refersto each tested group. Theerror bars of the meanexpress the standarddeviation of threeindependent subsamples
P1
0
200
400
600
800
1000
1200
P5
0
20
40
60
80
100
Soil horizonCA
mg
Pb
kg-1
mg
Pb
kg-1
C
B B
A
B
A
A
A
c
b
aa
b b
a a
C
B
AA
A
A
A
B
exchangeablereducibleoxidisableresidualEDTATotal
difference in Pb concentrations between profiles1 and 5 was found in organic soil horizon A. Asignificant metal migration downwards to the min-eral soil horizons takes place in profile 5. Thesefindings can be accounted for the acidic char-
acter and much lower TOC and CEC values inprofile 5.
Generally, the concentrations of Pb, Zn andCd in the forest soil profiles further from thesmelter are much higher than those obtained in
Fig. 3 Totalconcentration, chemicalfractionation andEDTA-extractable Zn inagriculture soil profiles 1and 5. In all localities,each BCR SE fractionwas tested separatelyaccording to the Duncantest (p < 0.05); thedifferent typeface refersto each tested group. Theerror bars of the meanexpress the standarddeviation of threeindependent subsamples
P1
0
800
1600
2400
3200
4000
P5
0
30
60
90
120
150
180
Soil horizonCA
mg
Zn
kg-1
mg
Zn
kg-1
C
B
B
A
C
B
AA
a a
a
bc
b
aa
A A
A
C
C
B
B
A
exchangeablereducibleoxidisableresidualEDTATotal

2524 Environ Monit Assess (2012) 184:2517–2536
Fig. 4 Totalconcentration, chemicalfractionation andEDTA-extractable Cd inagriculture soil profiles 1and 5. In all localities,each BCR SE fractionwas tested separatelyaccording to the Duncantest (p < 0.05); thedifferent typeface refersto each tested group. Theerror bars of the meanexpress the standarddeviation of threeindependent subsamples
P1
0
5
10
15
20
25
exchangeablereducibleoxidisableresidualEDTATotal
P5
0.0
0.4
0.8
1.2
1.6
2.0
CA
A
B
B
C
A
A
B
C
ba
aa
c
a a
b
A
B
C
D
A
AB
B
C
mg
Cd
kg-1
mg
Cd
kg-1
Soil horizon
Fig. 5 Totalconcentration, chemicalfractionation andEDTA-extractable Pb inforest soil profiles 2–4. Inall localities, each BCRSE fraction was testedseparately according tothe Duncan test (p <
0.05); the differenttypeface refers to eachtested group. The errorbars of the mean expressthe standard deviation ofthree independentsubsamples
P2
0
300
600
900
1200
3000
4500
6000
7500
P3
0
200
400
600
8000
16000
24000
32000
P4
0
200
400
600
1500
1600
1700
1800
mg
Pb
kg-1
mg
Pb
kg-1
mg
Pb
kg-1
O M Ap C
O Ai C1 C2
O Ae Ep C
C
B
B
A A
AAA
A
AA
B
A A
A
AA
A
e
d
c
b
a a
aa
a
b
a
a
a a a
a a
a
E E
D
C
C
AB
AB
A
A
D
C
A
A
A
A
A
A
B
exchangeablereducibleoxidisableresidualEDTATotal

Environ Monit Assess (2012) 184:2517–2536 2525
Fig. 6 Totalconcentration, chemicalfractionation andEDTA-extractable Zn inforest soil profiles 2–4. Inall localities, each BCRSE fraction was testedseparately according tothe Duncan test (p <
0.05); the differenttypeface refers to eachtested group. The errorbars of the mean expressthe standard deviation ofthree independentsubsamples
P2
0
4000
8000
12000
20000
24000
28000
32000
P4
0
100
200
300
400
1100
1200
1300
1400
O Ai C1 C2
O Ae Ep C
mg
Zn
kg-1
mg
Zn
kg-1
C
BA
A
AA
A
A A
BBC d ba
a
aa
d ca
a
aa
D CB
AA A
E
D
B
B
P3
0
300
600
900
4000
8000
12000
O M Ap C
mg
Zn
kg-1
A
A A
A
A A
c
a a
b
A a a AA
C
A A
A
A
exchangeablereducibleoxidisableresidualEDTATotal
agriculture soils (Figs. 2, 3, 4 compared to Figs. 5,6, 7). The maximum Pb concentration was about25 g kg−1 in profile 3, where the contaminationfrom processing waste is supposed. The highesttotal Zn and Cd concentrations were found inprofile 2 in the upper organic soil horizon O,the site near the smelter (Figs. 5, 6, 7). The Znconcentration exceeds 20 g kg−1, and the concen-tration of Cd was detected as slightly over the200 mg kg−1 level. In all the profiles, a relativelyhigher amount of metals was detected in a soilhorizon below the highly contaminated horizonO and a high concentration of Pb was detectedeven in the mineral C1 and organomineral Ap soilhorizons in profiles 2 and 3, respectively (Figs. 5, 6,7). A statistically significant downward migrationof Pb was found in profile 4, where no significantdifference between upper O and deeper Ae soilhorizon was found (Fig. 2; Table 2). The TOC
content was comparable to other soil profiles, butCEC values were relatively lower compared toprofile 2 and the pH value of profile 4 is lower thanin profile 2 (6.9 compared to 3.7 in profiles 2 and4, respectively). The similar CEC values in profile3 can cause relatively higher downward migrationinto the deeper sedimentary horizon M, which isrepeatedly enriched with material from horizonO. In profiles 4 and 5, no significant Zn, Cd down-ward migration was found despite their chemicalbehavior under such soil properties (Figs. 2, 3, 4,5, 6, 7, Table 2).
Metal fractionation forms in agriculturalsoil profiles
The distribution of the operationally definedmetal forms (Quevauviller 2002) for Pb, Zn andCd in agriculture soils are summarized in Figs. 2,

2526 Environ Monit Assess (2012) 184:2517–2536
Fig. 7 Totalconcentration, chemicalfractionation andEDTA-extractable Cd inforest soil profiles 2–4. Inall localities, each BCRSE fraction was testedseparately according tothe Duncan test (p <
0.05); the differenttypeface refers to eachtested group. The errorbars of the mean expressthe standard deviation ofthree independentsubsamples
P2
0
50
100
150
200
250
P3
0
1
2
3
30
60
90
P4
0
2
4
6
8
16
18
20
O M Ap C
O Ai C1 C2
O Ae Ep C
B
C
A
A
A A
AA
A
E
D
C
B
dA
A A
AA
c
b
b a
aa
aa
ed
dc
bc
ab
ab
ababa
DC
B
AB
AB
AB
AA
A
F
E
D
C
B
AB
A
AA
mg
Cd
kg-1
mg
Cd
kg-1
mg
Cd
kg-1
exchangeablereducibleoxidisableresidualEDTATotal
3, 4. The concentration of acid-extractable Pb, Znand Cd related to total metal content is higher atthe site further from the smelter (Table 2). Thevertical Pb and Zn migration within the agricul-ture soil profile seems to be controlled by soilproperties, e.g. TOC, CEC, pH which are differentin profiles 1 and 5 (Table 1). On the other hand,despite the higher pH, TOC and CEC values inprofile 1, the vertical Cd downward migration ishigher compared to profile 5 (Table 2).
Reducible and oxidisable fractions of Pb aredominant in the soils from the more contami-nated area. At the site further from the smelter,Pb associated with the reducible fraction slightlyexceeds the oxidisable one in both A and C soilhorizons, and even highly exceeds the remaining
Pb fractions in the upper soil horizon A (Fig. 2).Pb distribution in the upper soil horizon A inprofile 5 cannot be explained on the basis of soilproperties (Fe, Mn and Al extractable content islower than those at profile 1, Table 1). Moreover,crystalline Fe oxides, goethite and hematite, weredetected by XRD in profile 2. On the other hand,only hematite is present in profile 5. A possibleexplanation could be a different mineralogicaltransformation of the fly ash after its depositioninto the soils, which is discussed further.
The Zn and Cd associated with the acid-extractable fraction in the mineral soil horizonin profile 1 are comparable to those in theorganomineral soil horizon in profile 5. In otherwords, the vertical downward migration of Zn and

Environ Monit Assess (2012) 184:2517–2536 2527
Table 2 The sum ofnon-residual metalfractions related to totalmetal concentration (inpercent) of the upper partof appropriate soilhorizon
Soil horizons Profile Horizon � fractions A, B and C related to totalnumber metal conc. in the upper soil horizon
Pb / % Zn / % Cd / %
Forest soils2 O 80 89 90
Ai 40 32 32C1 8.0 2.0 2.0C2 2.0 9.0 6.0
3 O 45 78 87M 53 274 290Ap 1.0 1.0 0.2C 0.02 0.3 0.3
4 O 89 82 95Ae 12 8.0 11Ep 5.0 6.0 3.9C 1.0 1.0 0.8
Meadow soils1 Ah 70 73 88
Cr 20 10 185 Ap 100 86 105
C 50 15 6.0
Cd within the more contaminated soil profile iscomparable to the spatial horizontal distributionof these metals (Figs. 3 and 4).
Metal fractionation forms in forest soil profiles
Lead, zinc and cadmium total concentrations andfractionations are summarized in Figs. 5, 6, 7.The different distribution of Pb fractionation wasfound in profiles 2–4. While the sum of non-residual fractions to total metal concentration isslightly higher in profile 4, in the above-lying soilhorizons there is still 40% of the sum of non-residual Pb in profile 2 and only 12% in profile4. The same situation was found for Zn and Cd(Table 2).
Some other differences in the distribution offractionation in forest soil profiles were found.In profiles 3 and 4, the non-residual Pb fractionsdominated the oxidisable and reducible (in almostin equal proportion) in profile 2, the oxidisabledominates, together with a significant decrease inthe reducible one. This fact cannot account forthe different physico-chemical properties in thesoil system (Table 1). The TOC content in profile2 is the lowest from the forest soil profiles. TheCEC value is only higher in profile 2 comparedwith 3 and 4, but in agriculture profile 1 under
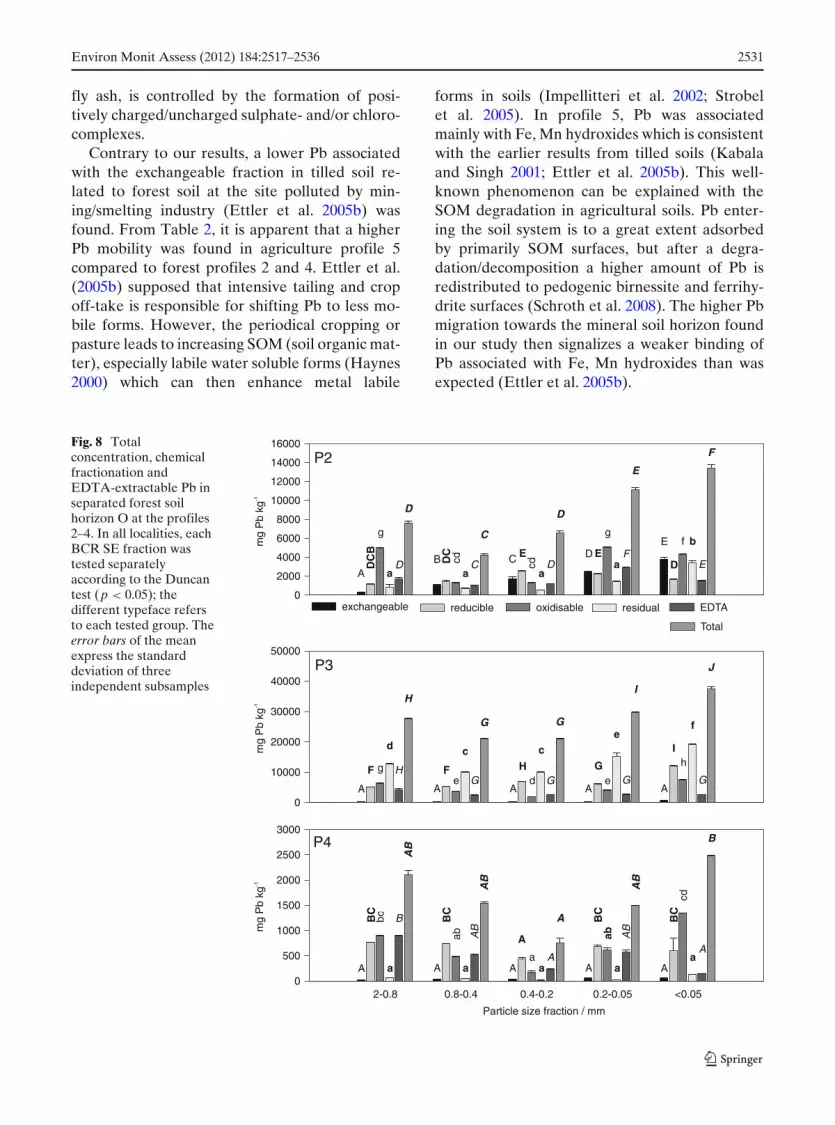
the highest CEC (Table 1) no such distribution isobserved. A different mineralogical and chemicalstructure of metal pollution depending on the dis-tance from the smelter is assumed in the forest soilprofiles. Similar finding was observed in earlierwork by Sanchez et al. (1999). For verifying sucha hypothesis, a particle separation of the organicsoil horizon O has been performed (Figs. 8, 9, 10).The finest particle size fractions are much closerto each other in the chemical structure in profiles2 and 4 (where the same contamination sourceis supposed) than the coarsest ones (Fig. 8). Therelatively coarse fraction that is the most abun-dant contains the reducible/oxidisable Pb ratioobserved in soil profile 2.
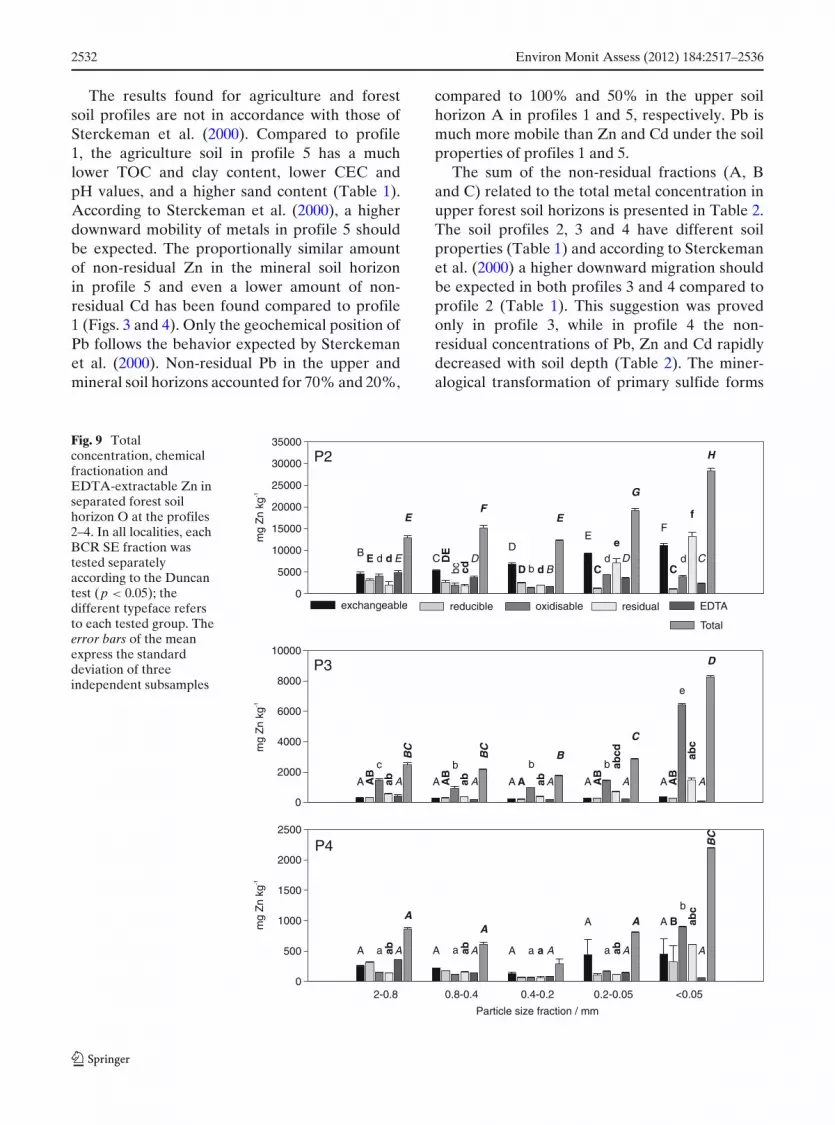
The distribution of Zn chemical fractions inprofiles 2 and 4 is comparable with the dominantacid-extractable fraction (about 38% and 32% ofthe total concentration in profiles 2 and 4, respec-tively). The proportionally lower amount of acid-extractable Zn in the upper soil horizon in profile4 (Table 2) has been detected regardless of thesoil properties (more acidic pH and higher TOCcontent, Table 1). In profile 2, the oxidisable Znfraction is dominant where the primary sulphidicZn form is supposed. In the finest particle sizefraction in profiles 2 and 4, the residual frac-tion became more abundant, together with acid-
2528 Environ Monit Assess (2012) 184:2517–2536
extractable fractions. In profile 2, a proportion-ally higher acid-extractable fraction was detectedcompared to profile 4 where the oxidisable frac-tion is dominant. If both dust materials are of thesame origin then the remobilization effect of Zndue to pH change in soils leads to enrichment ofthe oxidisable fraction.
The proportionally highest acid-extractable Cdconcentration was detected in profile 2 in theupper soil horizon and reaches about 44% fromthe total metal concentration and is in a goodagreement of earlier data related to similar con-tamination source (Sanchez et al. 1999). The acid-extractable fraction is the most abundant fractionin the upper soil horizon in profile 2, while Cdis associated mainly with the oxidisable fraction(Fig. 7). As in the case of Zn, the sulphidic formoriginated form processing waste contamination issupposed. The chemical structure of the dust par-ticles from the contamination source is differentin profile 2 compared to profile 4. The increasingamount of acid-extractable Cd concentration wasfound in the first two organic soil horizons Oand Ai in profile 2, while in profile 4 the oxi-disable fraction became more abundant (Fig. 7).The same pattern is reached in separated dustparticles from the upper soil horizons (Fig. 10).A very low amount of acid-extractable Cd wasdetected in profile 3. It is shown clearly that thepH of the soil does not directly remobilize primarycontamination material. On the other hand, thesmelting process produces apparently chemicallyand mineralogically less stable metal forms. Theconsequent transformation process of such mate-rial is probably controlled by a persistence in theatmosphere (the distance from the smelter) and/orby the pH of the target soil system.
Pb isotopic composition and tracingof pollution sources
The isotopic composition of Pb (206Pb/207Pb and208Pb/206Pb) is presented in a form of three-isotope graph (Fig. 11). The data are presentedfor EDTA extraction of the upper and mineralsoil horizons in forest soil profiles, the finestdust particle fraction and red mud sampled inprofile 3. The less variable data were obtainedfor total digestions because of the mixing of the
lithogenic and anthropogenic sources of pollution.A selective extraction of EDTA presents a rela-tively stronger tool to trace the Pb contaminationsources (Komárek et al. 2006).
The Pb isotopic compositions of the upper andmineral soil horizons differ in each soil profile.The highest differences were found in profile 2closer to the smelter (profile 4, Fig. 11). On theother hand, with the distance from the contamina-tion source the Pb isotopic composition seems tobe more uniform (Fig. 11).
The Pb isotopic composition of the dust parti-cles in profiles 2 and 4 correspond well to eachother, which is consistent with the assumption ofthe same source of contamination at these twosites. The processing waste as a prevailing conta-mination source was found in profile 3 where thePb isotopic composition of red mud is very closeto the finest dust particles sampled in the uppersoil horizon (Fig. 11).
Discussion
Mineralogical transformation of metal pollutionin the studied soils
The metal pollution, when entering the environ-ment, can be expected to mineralogically trans-form in the atmosphere, and consequently in thetarget soil system. Possible metal transformationin the atmosphere can be derived from the workby Vítková et al. (2009): fresh fly ash containsseveral Pb bearing and other concomitant phases,e.g., galena, caracolite (main Pb phase), PbSO3,anglesite, palmierite, phosgenite, laurionite, hy-drocerussite, KPb2Cl5, halite, etc. The differencesin mineralogical transformation were found be-tween fresh and pre-washed fly ash. In the caseof a relatively longer persistence of fly ash in theatmosphere, the transformation of fresh fly ashcan be accepted as a model. Moreover, higher SO2
presents in a higher amount in the atmosphere(Cabala et al. 2011) and can interact with the flyash particles. Under these conditions the possibletransformations mainly to caracolite and partiallyto anglesite are expected in the atmospehere.The following transformation process in the soilsystem is also controlled through the stability of

Environ Monit Assess (2012) 184:2517–2536 2529
metal-bearing phases under the pH conditions(Ettler et al. 2005a; Vítková et al. 2009). In profile1 (near the smelter) under a pH of about 8.0(Table 1) a complete dissolution of caracoliteshould take place and orthorhombic PbSO3, lau-rionite, cerussite or hydrocerussite are expectedas the predominant Pb phases. The much highermobility of Pb in profile 5 can be explained withthe caracolite stability and/or phosgenite forma-tion under a pH of about 5 (Vítková et al. 2009).Both mineral phases should be more soluble in thefirst step of BCR SE (Fig. 2).
In profiles 2 and 4, a different distribution ofmetal fractionations forms was found (Table 2,Figs. 5, 6, 7). The main primary metal phasescan lead to different transformation products. Inthe case of Pb, at circum-neutral pH of the soilin profile 2, a complete dissolution of caracoliteshould take place and the products of dissolutioncan be either transformed into secondary phases,e.g. cerussite or hydrocerussite (Table 3) fromwhich is better extracted during the first step ofBCR SE (Fig. 5). While at a lower pH value of thesoils in profile 4 (Table 1), an efficient transforma-tion of caracolite into anglesite probably occurs(Vítková et al. 2009). Anglesite formation sig-nificantly lowers the amount of acid-extractablePb in the first step of the BCR SE (Fig. 5). Itsstability during simple organic acid leaching wasdescribed by Ettler et al. (2009). According toXRD analysis in profile 2, dolomite carbonateswere found (Table 3). Therefore, co-precipitationof primary Pb phases with carbonates can be ex-pected. Moreover, the heterogeneous chemistrybetween PbSO4 and CaCO3 resulting in hydro-cerussite or cerussite can already take place in theatmosphere (Falgayrac et al. 2006). Lead and Zncarbonates were also proved as the main Pb, Znphases of dust particles from tailing ponds andaround mining and smelting area near the Olkusz(Cabala and Teper 2007; Teper 2009; Cabala et al.2009).
In profile 3, plumbojarosite and anglesite werefound as the predominant Pb phases. This is ingood agreement with the expected transformationprocess of the fly ash. Under such a low pH, thesulphidic form of Pb was partially transformedinto a sulphate which is geochemically more stable(Fig. 5). According to XRD analysis (Table 3),
smelting wastes contain mainly the primary Znminerals, e.g., sulfates and carbonates (Cabala andTeper 2007; Teper 2009; Cabala et al. 2009). Thesuperficial organic soil horizon O in profile 3 is re-peatedly eluted into the sedimentary soil horizonwhich can be easily enriched mainly with the finestdust particles or through the precipitation of dis-solved metals in the groundwater table fluctuationzone as described by Hürkamp et al. (2009). Asseen in Fig. 9, the above mentioned mechanism iseasily proven by chemical fractionation.
The vertical metal migration within studiedsoil profiles
Metal mobility in soils depends not only on thestructure of the contaminating material and itsphysico-chemical properties, but also on the prop-erties of the soils, however, some authors of ear-lier works (e.g., Sanchez et al. 1999) did not findany relationship between metal accumulation inthe surface layer and the soil chemical properties.The factors influencing the vertical distribution ofPb, Cd and Zn in smelter-affected soils are dis-cussed by Sterckeman et al. (2000). The relation-ship between the CEC values, sand/clay content,pH and metal mobility has been published in thefollowing manner: the higher the sand content andthe lower the CEC values, the higher the verticalmetal migration. Moreover, a positive relationshipbetween pH and Pb, Zn, Cd mobility has beenproved by Ullrich et al. (1999). The concentra-tions of Cd, Zn and Pb in acid-extractable fractionrose proportionally when soil pH decreased witha threshold pH value of 6 for Zn. The mobilityof Zn should be correlated with TOC because ofthe easy formation of organo-metallic complexes(Sterckeman et al. 2000). Ettler et al. (2009) foundthat Zn is less mobile when negatively chargedcomplexes with organic ligands are formed,e.g. Zn-citrate−. These complexes are efficientlyadsorbed on positively charged surfaces of Fehydroxides and organic matter under acidic con-ditions (Ettler et al. 2009). The stability of Cdcomplexes with organic matter is lower comparedto Zn, therefore the correlation between Cd andTOC is less significant. According to the resultsof Vítková et al. (2009), the vertical distributionof Pb and Cd, originating from the leaching of

2530 Environ Monit Assess (2012) 184:2517–2536
Table 3 Mineral components of studied soils (based on semi-quantitative XRD analysis)
Profile nr. Horizon Depth/cm Bed-rock derived minerals Metalliferous minerals
1 Ah 0–25 Quartz + + + + + Goethite + + ++K and Na feldspars ++ Sphalerite +Illite ++ Galena +Dolomite + Smithsonite ICalcite + Cerusite IAnkerite + Mn oxides ISmectites IKaolinite IChlorites I
Cr 25–60 Quartz + + + Goethite ++Calcite ++Illite +Montmorillonite +Ankerite IKaolinite I
2 O, Ai, C1 2–10 Quartz + + ++ Goethite ++Illite ++ Galena IMontmorillonite + Smithsonite ICalcite + Cerusite IDolomite I Mn oxides I
C2 10–40 Quartz + + + + + Goethite +Calcite + Galena IIllite + Cerusite IMontmorillonite IKaolinite I
3 O, M 2–12 Quartz. + + ++ Goethite ++Illite + Gypsum ++Kaolinite I Anglesite IDolomite I Galena IAnkerite I Sphalerite I
Hemimorphite IJarosite IPlumbojarosite IHexahydrites IMinrecordite IAnhydrite I
C 25–60 Quartz + + + + + Goethite IIllite IKaolinite ISmectites I
4 O, Ae, Ep 5–16 Quartz + + + + + Goethite IIllite IK and Na feldspars I
C 16–60 Quartz + + + + + Goethite IIllite ++
5 Ap 0–15 Quartz + + + + + Goethite IIllite IK and Na feldspars I
C 15–40 Quartz + + + + + Goethite IIllite ++
+ + + + + dominant component (>50%); + + ++ (20–50%); + + + (10–20%); ++ (5–10%); + (1–5%); I (identifabletraces)
Environ Monit Assess (2012) 184:2517–2536 2531
fly ash, is controlled by the formation of posi-tively charged/uncharged sulphate- and/or chloro-complexes.
Contrary to our results, a lower Pb associatedwith the exchangeable fraction in tilled soil re-lated to forest soil at the site polluted by min-ing/smelting industry (Ettler et al. 2005b) wasfound. From Table 2, it is apparent that a higherPb mobility was found in agriculture profile 5compared to forest profiles 2 and 4. Ettler et al.(2005b) supposed that intensive tailing and cropoff-take is responsible for shifting Pb to less mo-bile forms. However, the periodical cropping orpasture leads to increasing SOM (soil organic mat-ter), especially labile water soluble forms (Haynes2000) which can then enhance metal labile
forms in soils (Impellitteri et al. 2002; Strobelet al. 2005). In profile 5, Pb was associatedmainly with Fe, Mn hydroxides which is consistentwith the earlier results from tilled soils (Kabalaand Singh 2001; Ettler et al. 2005b). This well-known phenomenon can be explained with theSOM degradation in agricultural soils. Pb enter-ing the soil system is to a great extent adsorbedby primarily SOM surfaces, but after a degra-dation/decomposition a higher amount of Pb isredistributed to pedogenic birnessite and ferrihy-drite surfaces (Schroth et al. 2008). The higher Pbmigration towards the mineral soil horizon foundin our study then signalizes a weaker binding ofPb associated with Fe, Mn hydroxides than wasexpected (Ettler et al. 2005b).
Fig. 8 Totalconcentration, chemicalfractionation andEDTA-extractable Pb inseparated forest soilhorizon O at the profiles2–4. In all localities, eachBCR SE fraction wastested separatelyaccording to the Duncantest (p < 0.05); thedifferent typeface refersto each tested group. Theerror bars of the meanexpress the standarddeviation of threeindependent subsamples
P2
0
2000
4000
6000
8000
10000
12000
14000
16000
P3
0
10000
20000
30000
40000
50000
P4
0
500
1000
1500
2000
2500
3000
Particle size fraction / mm
2-0.8 0.8-0.4 0.4-0.2 0.2-0.05 <0.05
mg
Pb
kg-1
mg
Pb
kg-1
mg
Pb
kg-1
EDCB
A
A A A A A
A A A A A
I
H GFF
EEDD
C
DC
B
BC
BC
BC
A
BC
hg
ggf
e ed
cd
cd cd
bc
abab
a
fe
d c c
b
a a aa
a a a aa
GGH
G G
FED DC
A
B
AB
AB
A
J
IH
G G
F
E
D D
C
B
AB
AB
AB
A
exchangeable reducible oxidisable residual EDTA
Total
2532 Environ Monit Assess (2012) 184:2517–2536
The results found for agriculture and forestsoil profiles are not in accordance with those ofSterckeman et al. (2000). Compared to profile1, the agriculture soil in profile 5 has a muchlower TOC and clay content, lower CEC andpH values, and a higher sand content (Table 1).According to Sterckeman et al. (2000), a higherdownward mobility of metals in profile 5 shouldbe expected. The proportionally similar amountof non-residual Zn in the mineral soil horizonin profile 5 and even a lower amount of non-residual Cd has been found compared to profile1 (Figs. 3 and 4). Only the geochemical position ofPb follows the behavior expected by Sterckemanet al. (2000). Non-residual Pb in the upper andmineral soil horizons accounted for 70% and 20%,
compared to 100% and 50% in the upper soilhorizon A in profiles 1 and 5, respectively. Pb ismuch more mobile than Zn and Cd under the soilproperties of profiles 1 and 5.
The sum of the non-residual fractions (A, Band C) related to the total metal concentration inupper forest soil horizons is presented in Table 2.The soil profiles 2, 3 and 4 have different soilproperties (Table 1) and according to Sterckemanet al. (2000) a higher downward migration shouldbe expected in both profiles 3 and 4 compared toprofile 2 (Table 1). This suggestion was provedonly in profile 3, while in profile 4 the non-residual concentrations of Pb, Zn and Cd rapidlydecreased with soil depth (Table 2). The miner-alogical transformation of primary sulfide forms
Fig. 9 Totalconcentration, chemicalfractionation andEDTA-extractable Zn inseparated forest soilhorizon O at the profiles2–4. In all localities, eachBCR SE fraction wastested separatelyaccording to the Duncantest (p < 0.05); thedifferent typeface refersto each tested group. Theerror bars of the meanexpress the standarddeviation of threeindependent subsamples
P2
0
5000
10000
15000
20000
25000
30000
35000
P4
0
500
1000
1500
2000
2500
Particle size fraction / mm
2-0.8 0.8-0.4 0.4-0.2 0.2-0.05 <0.05
mg
Zn
kg-1
mg
Zn
kg-1
mg
Zn
kg-1
FE
DCB
A A A
A A
dd d
bc b
b
a a a a
E DE
D C C
B
f
e
dd
cd
aabab ab
abc
CDDEB
P3
0
2000
4000
6000
8000
10000
A A A A AAB
AB
A AB
AB
c b b b
eab
c
abcd
ab ab ab AAAAA
AAAAA
H
G
FE E
D
C
BC
BC
BC
B
AA
A
exchangeable reducible oxidisable residual EDTA
Total

Environ Monit Assess (2012) 184:2517–2536 2533
of Pb into plumbojarosite and anglesite (found byXRD) in profile 3 lead to relatively stable chem-ical forms which have a limited mobility (Fig. 5).In profile 2, under a slightly basic soil pH, a higherstability of metal carbonates forms should be ex-pected. A possible mechanism of vertical mobilitycannot necessarily be related to the redistributionof chemical forms. The microcrystalline structureof metals present as carbonates can be transportedinto the deeper soil horizons by water percolationin a passive way. The metal carbonates can alsopenetrate the deeper soil horizons by migrationon the basis of dissolved/co-precipitation equi-librium influenced by acid rains and basic soilenvironment. The transportation of relatively sta-ble metal pollution by water percolation is well
demonstrated in profile 3. The fractionation ofPb, Zn and Cd in sedimentary horizon M cor-responds well to the finest dust particle one ofthe above-lying horizon O (Figs. 5, 6, 7 comparedto Figs. 8, 9, 10). From the comparison of thefractionation forms of O horizon in profiles P2–P4 (Figs. 5, 6, 7) and the dust particles (Fig. 8, 9,10) some discrepancies between the profile 2 and4 are apparent. In profile 2 the difference betweenthe acid-extractable fraction of the coarse and thefinest particle fraction are higher compared thesame difference in profile 4. The longer persis-tence of the dust particles in the atmosphere canlead to better “homogenization” of the fractiona-tion forms. Moreover, the background level due tobetter homogenized resuspended material is more
Fig. 10 Totalconcentration, chemicalfractionation andEDTA-extractable Cd inseparated forest soilhorizon O at the profiles2–4. In all localities, eachBCR SE fraction wastested separatelyaccording to the Duncantest (p < 0.05); thedifferent typeface refersto each tested group. Theerror bars of the meanexpress the standarddeviation of threeindependent subsamples
P4
0
5
10
15
20
25
P3
0
10
20
30
40
50
60
70
P2
0
100
200
300
400
mg
Cd
kg-1
mg
Cd
kg-1
mg
Cd
kg-1
2-0.8 0.8-0.4 0.4-0.2 0.2-0.05 <0.05
GFE D C
BA AB
AB
AB
AB
AB
AB
AB
AB
D CB B
AB
AA
A
AAAAB
AB
AB
f
e
d
c c c
abc
bc
aab ab ab
ababab
g
ff
bc
d d
d c
b
b
aaaa
FED
CC
C
BC
AB
AAA
AA
A
A
I
HG
H
F
F
E
DE
CD
BC
AB
BC
AB
A
exchangeable reducible oxidisable residual EDTA
Total

2534 Environ Monit Assess (2012) 184:2517–2536
Fig. 11 Tracing of metalpollution in forest soilprofiles using 206Pb/207Pbisotope ratio determinedin EDTA extractions ofsoils, dust particle and redmud. The each point ispresent as a mean ± SD(n = 3) of the threeindependent subsamples
1.16 1.17 1.18 1.19 1.20 1.21 1.222.02
2.04
2.06
2.08
2.10
2.12
2.14
2.16
2.18
2.20
2.22
2.24
uppermineraldust
horizonsP4
upper
mineraldust
horizonsP3
red mud
upper
mineral
dust
horizonsP2
206 207Pb/ Pb
208
206
Pb/
Pb
“visible” with the distance from the source. Onthe other hand, lack of such differences detectedin profile 3 is the other evidence about the pre-vailing contamination source from the historicalmining and ore processing. The same situation canbe seen on Fig. 11. The isotopic composition ofEDTA-extractable Pb content (“labile” Pb form)is more homogenous with longer distance fromthe source (profile 4 compared to profile 2) whilein profile 3 no differences were found betweendust particles and primary contamination material(Fig. 11).
Conclusions
The severe smelting emissions intensively con-taminated mainly the upper soil horizons, whilethe deposition of processing waste resulted in acontamination of the deeper parts of soil profiles.Forest soils are much more affected than agricul-ture soils due to the “scavenging” of dust particleswith forest growth. However, metals bound toagriculture soils suffer from the downward migra-tion more than to the forest soils. Interestingly,Pb was found to be more mobile in both soiltypes than expected. The metal mobility ranges inthe studied forest soils are as follows: Pb > Zn≈ Cd for relatively circum-neutral soil pH (nearthe smelter), Cd > Zn > Pb for acidic soils with
prevailing primary contamination source from themining process and at the outlying site with pre-vailing contamination from the smelting processeswhich is in a good agreement with the findings bySanchez et al. (1999). The primary contaminationmaterial presents a risk for downward migrationof metals from the upper to the deeper soil hori-zons, especially due to the periodical leaching ofthe waste.
The mobilization of Pb, Zn and Cd in soilsdepends to a great extent on the mineralogicaltransformation of the primary materials and isdirectly controlled by the pH of the soil. Underrelatively comparable pH conditions, the mainsoil properties influencing metal migration areTOC and CEC. The vertical metal migration inthe soil profile cannot be fully discussed withonly the mere knowledge of soil properties andwithout data about the appropriate mineralogicaltransformation processes. The process of metaltransformation depends on the persistence of themetal-containing particles in the atmosphere; thelonger the time, the more abundant the stableforms. The consequent mineralogical transforma-tion processes are then more dependent on soilpH. In the case of a shorter persistence in theatmosphere, a higher amount of unstable phasescan be consequently transformed in soils into lessstable forms, which can possibly migrate down thesoil profile.

Environ Monit Assess (2012) 184:2517–2536 2535
When the potential mobility is operationallydefined, it does not matter whether the metal isactually weakly bound to the surface phase orwhether the chemical dissolution of carbonates,such as acetic acid, takes place. Based on theresults, it is shown that the metal pollutants fromsmelting processes are less stable under slightlyalkaline pH than acidic due to the possible carbon-ates formations. What this means for metal uptakeby plants should be further investigated.
Acknowledgements This project was funded by theCzech Science Foundation (GACR 526/09/P202), FinancialMechanism EEA/Norway, Brussels (Grant no. CZ0136)and The Ministry of Education of the Czech Republic(MSM 6007665806 and 6046070901).
References
Cabala, J., & Teper, L. (2007). Metalliferous constituentsof rhizosphere soils contaminated by Zn–Pb mining insouthern Poland. Water, Air and Soil Pollution, 178(1–4), 351–362.
Cabala, J., Krupa, P., & Misz-Kennan, M. (2009). Heavymetals in mycorrhizal rhizospheres contaminated byZn–Pb mining and smelting around Olkusz in South-ern Poland. Water, Air, and Soil Pollution, 199(1–4),139–149.
Cabala, J., Rahmonov, O., Jablonska, M., & Teper, E.(2011). Soil algal colonization and its ecological rolein an environment polluted by Past Zn–Pb mining andsmelting activity. Water, Air, and Soil Pollution, 215(1–4), 339–348.
Danek, M. (2007). The influence of industry on Scots pinestands in the south-eastern part of the Silesia-Krakowupland (Poland) on the basis of dendrochronologicalanalysis. Water, Air, and Soil Pollution, 185(1–4), 265–277.
Ettler, V., Mihaljevic, M., Šebek, O., & Strnad, L. (2005a).Leaching of APC residues form secondary Pb metal-lurgy using single extraction tests: the mineralogicaland the geochemical approach. Journal of HazardousMaterials, 121(1–3), 149–157.
Ettler, V., Vanek, A., Mihaljevic, M., & Bezdicka, P.(2005b). Contrasting lead speciation in forest andtilled soils heavily polluted by lead metallurgy.Chemosphere, 58(10), 1449–1459.
Ettler, V., Vrtišková, R., Mihaljevic, M., Šebek, O., Grygar,T., & Drahota, P. (2009). Cadmium, lead and zincleaching from the smelter fly ash in simple organicacids—Simulators of rhizospheric soil solutions. Jour-nal of Hazardous Materials, 170(2–3), 1264–1268.
Falgayrac, G., Sobanska, S., Laureyns J., & Brémard,C. (2006). Heterogenous chemistry between PbSO4and calcite microparticles using Raman microimaging.Spectrochimica Acta Part A, 64(5), 1095–1101.
Gee, G. W., & Bauder, J. W. (1986). Particle-size analy-sis. In A. Klute (Ed.), Methods of soil analysis, partI: Physical and mineralogical methods (pp. 383–411).Madison, WI: American Society of Agronomy—SoilScience Society of America.
Haynes, R. J. (2000). Labile organic matter as an indicatorof organic matter quality in arable and pastoral soilsin New Zealand. Soil Biology & Biochemistry, 32(2),211–219.
Hürkamp, K., Raab, T., & Jörg, V. (2009). Lead pollu-tion of foodplain soils in a historic mining area—age,distribution and binding forms. Water, Air, and SoilPollution, 201(1–4), 331–345.
ICDD (International Center for Diffraction Data) (2003).JCPDS PDF-2 Database. PA, U.S.A.: NewtownSquare.
Impellitteri, C. A., Lu, Y., Saxe, J. K., Allen, H. E., &Peijnenburg, W. J. G. M. (2002). Correlation of thepartitioning of dissolved organic matter fractions withthe desorption of Cd, Cu, Ni, Pb and Zn from 18 Dutchsoils. Environment International, 28(5), 401–410.
International Organization of Standardization, ISO 10390(1994a). Standard of soil quality—Determination ofpH.
International Organization of Standardization, ISO 11260(1994b). Standard of soil quality—Determination ofeffective cation exchange capacity and base saturationlevel using barium chloride solution.
ISSS-ISRIC-FAO (1998). World reference basis for soil re-sources. World Soil Resources Reports, 84, 92. Rome:FAO.
Kabala, C., & Singh, R. R. (2001). Fractionation and mo-bility of copper, lead, and zinc in soil profiles in thevicinity of a copper smelter. Journal of EnvironmentalQuality, 30(2), 485–492.
Komárek, M., Chrastný, V., Ettler, V., & Tlustos, P. (2006).Evaluation of extraction/digestion techniques used todetermine lead isotopic composition in forest soils.Analytical and Bioanalytical Chemistry, 385(6), 1109–1115.
McCarty, D. K., Moore, J. N., & Marcus, W. A. (1998).Mineralogy and trace element association in an acidmine drainage iron oxide precipitate; comparison ofselective extractions. Applied Geochemistry, 13(2),165–176.
Quevauviller, P. (2002). Operationally-defined extractionprocedures for soil and sediment analysis. Part 3: NewCRMs for trace-element extractable contents. Trendsin Analytical Chemistry, 21(11), 774–785.
Sanchez, A. G., Moyano, A., & Muñez, C. (1999). Formsof cadmium, lead, and zinc in polluted mining soils anduptake by plants (Soria province, Spain). Communica-tions in Soil Science and Plant Analysis, 30, 1385–1402.
Schroth, A. W., Bostic, B. C., Kaste, J. M., & Friedland,A. J. (2008). Lead sequestration and species redistrib-ution during soil organic matter decomposition. Envi-ronmental Science & Technology, 42(10), 3627–3633.
StatSoft, STATISTICA 6.0 Software (2001) Tulsa, OK,U.S.A.
Sterckeman, T., Douay, F., Proix, N., & Fourrier, H. (2000).Vertical distribution of Cd, Pb and Zn in soil near

2536 Environ Monit Assess (2012) 184:2517–2536
smelters in the North of France. Environmental Pol-lution, 107(3), 377–389.
Strobel, B. W., Borggaard O. K., Hansen, H. C. B.,Andersen, M. K., & Raulund-Rasmusen, K. (2005).Dissolved organic carbon and decreasing pH mobilizecadmium and copper in soil. European Journal of SoilScience, 56(2), 189–196.
Teper, E. (2009). Dust-particle migration around flotationtailings ponds: pine needles as passive samplers. Environ-mental Monitoring and Assessment, 154(1–4), 383–391.
Ullrich, S. M., Ramsey, H. M., & Helios-Rybicka, E.(1999). Total and exchangeable concentrations ofheavy metals in soils near Bytom, an area of Pb/Znmining and smelting in Upper Silesia, Poland. AppliedGeochemistry, 14(2), 187–196.
Vítková, M., Ettler, V., Šebek, O., Mihaljevic, M., Grygar,T., & Rohovec, J. (2009). The pH-dependent leasing ofinorganic contaminants from secondary lead smelterfly ash. Journal of Hazardous Materials, 167(1–3),427–433.