REGIONAL GEOCHEMICAL DISPERSION OF ELEMENTS IN ...
264
REGIONAL GEOCHEMICAL DISPERSION OF ELEMENTS IN THE REGOLITH OF THE GIRILAMBONE REGION, CENTRAL WEST NSW By KAMAL KHIDER A thesis submitted to the Australian National University in fulfilment of the requirements for the degree of Doctor of Philosophy 2007
-
Upload
khangminh22 -
Category
Documents
-
view
0 -
download
0
Transcript of REGIONAL GEOCHEMICAL DISPERSION OF ELEMENTS IN ...
REGIONAL GEOCHEMICAL DISPERSION OF ELEMENTS IN
THEREGOLITH OF THE
GIRILAMBONE REGION, CENTRAL WEST NSW
By
KAMAL KHIDER
A thesis submitted to the Australian National University in fulfilment
of the requirements for the degree of Doctor of Philosophy
2007
ABSTRACT
Geochemical exploration has provided a major contribution to the discovery of
mineral deposits in the Cobar-Girilambone region. The areas of bedrock exposure
have generally been well explored and further discoveries will significantly depend on
a better understanding of element dispersion, movement and accumulation within the
extensive areas of in situ and transported regolith cover.
This study evaluates the background levels of target and pathfinder elements in
various sampling media including groundwater, the top metre, transported and in situ
regolith; and the influences of secondary enrichment (calcrete, iron and manganese)
on the element association in the regolith of the Girilambone region. It also
demonstrated that the bedrock geology could be identified by geochemical signatures
preserved in in situe regolith. This improved knowledge of the regolith geochemistry
and parent bedrock will assist mineral exploration in the region.
Thresholds and anomalies for key target and pathfinder elements (As, Au, Co, Cr, Cu,
Mo, Ni, Pb, Sb, V, W, Zn) are estimated using Boxplot and MAD methods. The
highest threshold, which possibly indicates a local background, is indicated by the
Boxplot method, whereas the MAD method indicates a lower regional background for
elements. The thresholds of Au, Cu, Pb and Zn are higher in the in situ regolith facies.
Arsenic, Cr and V show higher backgrounds when associated with enrichments of
hematite and goethite in the Fe-enriched regolith zone. Four major element
associations are recognized by cluster analysis. These include elements associated
with Ca and Mg (carbonate group), with MnO (manganese oxide), with Fe20:, (iron
oxide) and with Ni and Cr (mafic group). Principal component analysis indicates
similar groups representing calcretization (Ca+Mg), adsorption (Fe-Mn oxides) and
bedrock influences.
A groundwater aquifer is present within the in situ regolith in phyllitic siltstone-
sandstone layers. Water levels mirror topography, indicating an unconfined aquifer
system, and groundwater is flowing to the northeast in the Hermidale area and in part
of the Byrock area. The groundwater in the region is mainly of chloride type, rich in
l
Na, Cl and SO4 compared to less common calcium-bicarbonate and bicarbonate-
chloride types. The correlation between Br/Cl and Na/Cl shows three processes affect
the groundwater composition: evaporation, water-rock interaction and water mixing.
Calculation of groundwater ages based on l6Cl/Cl indicates that the groundwater in
the Byrock area (418000-516000 years) is older than that in the Hermidale area
(241000-492000 years). Calculated saturation indices of ZnSiC^ malachite and
tenorite appear to show a vector towards sites of known mineralisation. The
correlation between the groundwater and regolith composition suggests at least two
sites (drill holes CBAC217 and CBAC219) of potential mineralisation in the Byrock
area.
Slightly weathered and deeply weathered saprolith can be discriminated using the
Chemical Index of Alteration (CIA) and major element trends (AI2O3- (Na20+CaO)-
K2O). These trends also indicate the chemical history of regolith profiles in the
Girilambone region. Four zones of weathering are recognised based on the CIA value
ranging from zone I (CIA>85), zone II (75>CIA> 85), zone III (55>CIA<75) and
zone IV (CIA<55).
Immobile element ratios Zr/Sc versus Th/Sc indicate the level of sediment recycling.
A significant increase of Zr/Sc (>10) with insignificant or no increase in Th/Sc (~1.0),
suggests significant recycling of much of the material through weathering processes.
ACC^/SiCF and TiCF/Zr ratios are used in association with the 1 5 Al20 3 -3 0 0 Ti0 2 -Zr
diagram to discriminate between sandstone, shale and mafic to felsic igneous
composition. Ti/Th and Ce/La ratios are used to discriminate between saprolith
materials that are derived from the Cobar Supergroup and Girilambone Group. Cobar
Supergroup data are clustered in limited ranges of Ti/Th (0.039 > Ti/Th > 0.03) and
Ce/La (2.2> Ce/La > 1.9) ratios, whereas those related to the Girilambone group are
characterised by a relatively small range of Ti/Th (0.03 > Ti/Th > 0.005) and Ce/La
(2.3 > Ce/La > 1.8).
Calcrete, Fe-Mn oxides or oxyhydroxides appear to be the major regolith components
that host Au and base metals (Cu, Zn, Pb) in transported and in situ regolith in the
Girilambone region. The association of Au with calcrete in the region appears to
reflect a chemical environment within both transported and in situ regolith that is
conducive to precipitation of both carbonate and mobilised gold, rather than a direct
control on gold fixation by calcrete. Sampling the upper part of the calcrete zone
within shallow transported and in situ regolith during air-core drilling, as part of the
strategy for gold exploration in this region, is recommended.
A Mn-enriched zone is variably distributed in the regolith of the Girilambone region
and is concentrated in the in situ regolith. The highest MnO contents are in the
southwest of the Hermidale area and generally decrease toward the east. A stratified
concentration of Mn above the present water table along the groundwater flow path
indicates previous water levels where the manganese oxides were precipitated due to
redox changes.
Enrichments of Au (> 0.009 ppm) and As (>40 ppm) match Fe2 Ü 3 increases related to
the abundance of ferruginous clasts in the Fe-enriched zone, and these indicate a
mechanical dispersion of remnant primary Au in ferruginous regolith.
An association of elevated Fe, Zn, Cu and Pb is correlated with the presence of
weathered mafic rocks in the region. Over most of the area there is no systematic
correlation of elevated Au, As, Zn, Cu and Pb with Fe2 Ü3 in either the transported or
in situ regolith (r2 < 0.006, 0.003, 0.04, < 0.16 respectively). These elements are
normally considered to be strongly adsorbed or incorporated into goethite and
hematite, particularly around mineralisation, but in this case the relationship is not
strongly expressed, probably because of the low levels of the trace elements in much
of the area and the different adsorption patterns of goethite and hematite.

Certificate of authorship
All results, interpretations and arguments presented in this thesis are my own, except where acknowledged.
Kamal Kinder

ACKNOWLEDGMENTS
This work was supported by the Australian Government’s Cooperative Research
Centre Program, within CRC LEME through a CRCLEME postgraduate award and
access to CRCLEME project funding.
Special thanks to my supervisors Ken McQueen and Bear McPhail who were always
there for me, advising and discussing outcomes, returning chapter drafts with
insightful comments “ How, W hy...and Refs. !!” with an optimistic “onward”. They
are the best supervisors that the “luckiest’ PhD student could ever have.
I could not mention supervisors without thanking Keith Scott (CSIRO, North Ryde)
for his periodic discussions and constructive suggestions and Professor Graham
Taylor (University of Canberra) for his judgment and discussion in the early stages of
the study.
The drilling for this study was carried out by the NSW Department of Primary
Industries, as part of a collaborative project with CRC LEME. Most of the regolith
samples were collected by CRC LEME and NSW DPI staff as part of the Girilambone
project.
Rainwater data for the study area were provided by Patrice de Caritat (Geoscience
Australia) whose support is gratefully acknowledged. Five groundwater samples
(Hermidale area) were collected by K. McQueen.
Thanks to Professor Keith Fifield (Department of Nuclear Physics, ANU) for his
assistance in analysing chlorine- 36 samples.
Thanks to the following people from the Department of Earth and Marine Sciences,
ANU; Judith Shelley for reading the initial drafts and for her invaluable linguistic
corrections, Maite Le Gleuher for her assistance in analysing the manganese oxides
and for her stimulating discussions, and Ulrike Troitzsch for her help in XRD
analysis.

I thank Rushdy Othman (University of NSW) and my co-workers from CRC LEME,
Roslyn Chan, Ian Roach and Tan Kok Piang for their various assistance and
discussions.
Thanks to John Spring and Aleksandra Plazinska (Bureau of Rural Sciences) for
providing valuable field and laboratory assistance.
Finally, thanks to my family particularly to my supportive wife Haifa, who I can’t
thank enough for her kindness, patience and help over the years, especially during the
protracted writing up of the thesis.

Table of Contents
Abstract i
Certificate of authorship iv
Acknowledgements v
1. Chapter one: Introduction 11.1 Preamble 1
1.2Aims and approaches of the study 3
1.3 Thesis outline 4
2. Chapter two: Regional and site characteristics 62.1 Location of study area 6
2.2 Climate, vegetation and landuse 7
2.3 Regolith landforms 8
2.4 Previous work on the geochemistry and regolith in the
Girilambone region 10
3. Chapter three: Regional geology and mineralisation 14
3.1 Regional setting of southeastern Australia 14
3.2 Regional tectonic history 17
3.3 Local stratigraphy and intrusions 21
3.3.1 Introduction 21
3.3.2 Girilambone Group 21
3.3.3 Ultramafic and related rocks 23
3.3.4 Silurian volcano- sedimentary sequence 24
3.3.5 Cobar Supergroup and related intrusives 24
3.4 Economic geology and known styles of mineralisation 25
3.4.1 Deposits related to the Girilambone Group 25
3.4.1.1 Girilambone 26
3.4.1.2 Tritton 26
3.4.2 Deposits related to the Cobar Supergroup 27
3.4.2.1 Canbelego-Mount Boppy 27
3.4.2.2 Cobar -type deposits 28
3.5 Mineral deposits in the study area 28

3.5.1 Deposits associated with the Girilambone Group 28
3.5.1.1 Budgery mine 30
3.5.1.2 Bylong 30
3.5.1.3 Calcite crystal rise, North Pole prospect and
Chert Ridge prospect 30
3.5.1.4 Mount Dijon - Bald Hills 32
3.5.2 Deposits related to Silurian granitoids 32
3.5.2.1 Beanbah prospect 32
3.5.3 Deposits in unnamed Silurian volcano-sedimentary sequences 32
3.5.4 Deposits in the Cobar Supergroup 34
3.5.4.1 Glengarry gossan and related deposits 35
4. Chapter four: Sampling methodology 36
5. Chapter five: Data analysis techniques 39
5.1 Introduction 39
5.2 Exploratory Data Analysis 40
5.3 Recognition of outliers by boxplot 41
5.4 Transformations 43
5.5 Transformation to avoid closure 43
5.6 Quality control of data 44
5.7 Detection limit 49
5.8 Cluster Analysis 50
5.8.1 Amalgamation or linkage rules 51
5.8.2 Distance measures 52
5.9 Principal Component Analysis 53
5.10 Summary and conclusions 53
6. Chapter six: Geochemical background, anomalies
and element associations 55
6.1 Definitions and methodology 55
6.1.1 Introduction 55
6.1.2 Definitions (background, threshold, and anomaly) 55

6.1.3 Techniques used to determine the background and anomaly 56
6.1.4 Evaluation of the statistical techniques 56
6.2 Regolith units and geochemical backgrounds, thresholds and anomalies 58
6.2.1 Introduction 58
6.2.2 Background and threshold values 60
6.2.2.1 Element thresholds for the top meter 60
6.2.2.2 Element thresholds for the transported regolith 61
6.2.2.3 Element thresholds for the in situ regolith 62
6.3 Geochemical anomalies 63
6.3.1 Anomalies in the top metre 63
6.3.1.1 Anomalies in the clay-silt- gravel facies 63
6.3.1.2 Anomalies in the regolith carbonate facies 64
6.3.2 Anomalies in transported regolith 64
6.3.2.1 Anomalies in the clay-silt-gravel facies 64
6.3.2.2 Anomalies in the regolith carbonate facies 71
6.3.2.3 Anomalies in the iron- rich facies 71
6.3.3 Anomalies in the in situ regolith 71
6.3.3.1 Clay-silt-gravel facies 71
6.3.3.2 Anomalies in the regolith carbonate facies 76
6.3.3.3 Anomalies of the iron-rich regolith facies 76
6.33.4 Anomalies in the manganese-rich facies 76
6.4 Element associations 80
6.5 Summary and conclusions 87
7. Chapter seven: Groundwater chemistry and hydrogeology 89
7.1 Introduction 89
7.2 Site descriptions 89
7.3 Hydrogeology 93
7.4 Electrical conductivity, pH/Eh and temperature 94
7.5 Alkalinity 97
7.6 Major ions geochemistry 99
7.7 Groundwater type and origin of dissolved ions 100
7.8 Chloride-36 105

7.9 Identification of aquifer minerals 107
7.9.1 Weathering of silicate minerals 109
7.9.2 Saturation indices 111
7.10 Implications for exploration 112
7.11 Summary and conclusions 117
8. Chapter eight: Weathering processes and provenance 118
8.1 Introduction 118
8.2 Geochemical approaches to evaluate sedimentary processes 119
8.2.1 Testing element immobility 120
8.2.2 Weathering and Chemical Index of Alteration (CIA) 121
8.2.3 Metasomatism 127
8.2.4 Sedimentary recycling 128
8.2.5 Sedimentary sorting 128
8.3 Bedrock, weathering profiles and sediment compositions 132
8.3.1 Weathering zones 132
8.3.2 Bedrock identification 134
8.4 Summary and conclusions 138
9. Chapter nine: Element dispersion in calcrete- manganese
- iron-dominant regolith 1409.1 Introduction 140
9.2 Element associations and dispersion in regolith carbonate zones 141
9.2.1 Introduction 141
9.2.2 Nature and regional distribution of regolith carbonate 141
9.2.3 Calcrete composition 145
9.2.4. Gold concentration in calcrete 154
9.2.4.1 Association of Au with calcrete in the in situ regolith 156
9.2.4.2 Association of Au with calcrete in the transported regolith 158
9.2.5 Minor and trace element characteristics of regolith
carbonate zones 160
9.2.5.1 Silver, arsenic, bismuth, antimony and tungsten 160
9.2.5.2 Barium and strontium 162
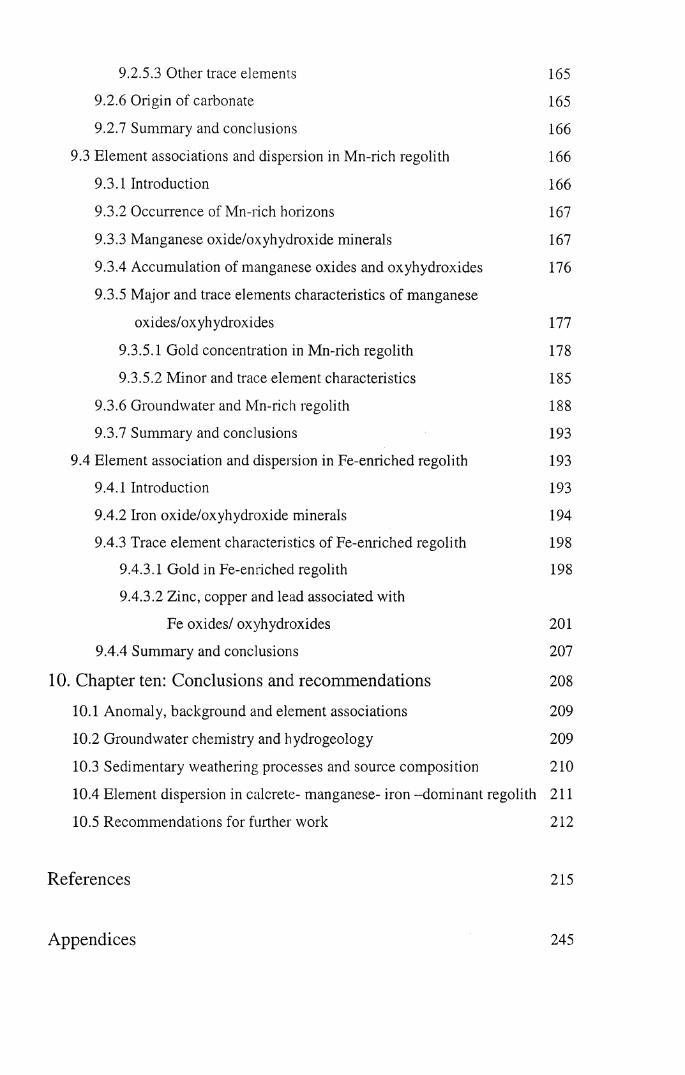
9.2.5.3 Other trace elements 165
9.2.6 Origin of carbonate 165
9.2.7 Summary and conclusions 166
9.3 Element associations and dispersion in Mn-rich regolith 166
9.3.1 Introduction 166
9.3.2 Occurrence of Mn-rich horizons 167
9.3.3 Manganese oxide/oxyhydroxide minerals 167
9.3.4 Accumulation of manganese oxides and oxyhydroxides 176
9.3.5 Major and trace elements characteristics of manganese
oxides/oxyhydroxides 177
9.3.5.1 Gold concentration in Mn-rich regolith 178
9.3.5.2 Minor and trace element characteristics 185
9.3.6 Groundwater and Mn-rich regolith 188
9.3.7 Summary and conclusions 193
9.4 Element association and dispersion in Fe-enriched regolith 193
9.4.1 Introduction 193
9.4.2 Iron oxide/oxyhydroxide minerals 194
9.4.3 Trace element characteristics of Fe-enriched regolith 198
9.4.3.1 Gold in Fe-enriched regolith 198
9.4.3.2 Zinc, copper and lead associated with
Fe oxides/ oxyhydroxides 201
9.4.4 Summary and conclusions 207
10. Chapter ten: Conclusions and recommendations 208
10.1 Anomaly, background and element associations 209
10.2 Groundwater chemistry and hydrogeology 209
10.3 Sedimentary weathering processes and source composition 210
10.4 Element dispersion in calcrete- manganese- iron -dominant regolith 211
10.5 Recommendations for further work 212
References 215
Appendices 245
LIST OF FIGURESFigure 2.1 Location map of study area in western NSW. 6
Figure 2.2 Monthly rainfalls in the Cobar area. 7
Figure 2.3 Basic regolith landforms on the Girilambone region. 9
Figure 3.1 Main structural entities in the basement of eastern Australia. 15
Figure 3.2 Provinces of the Lachlan Fold Belt. 16
Figure 3.3 Elements of the early Palaeozoic geology of the Lachlan Fold Belt. 17
Figure 3.4 Cambrian to Middle Devonian development of the Lachlan Fold Belt. 19
Figure 3.5 Interpretive geological map of study area. 22
Figure 3.6 Location map showing drill hole and mineralisation sites in the
Sussex area. 29
Figure 3.7 location map showing drill holes and mineralisation sites in the
Hermidale area. 31
Figure 3.8 Location map showing drill holes and mineralisation sites in the
Byrock area. 33
Figure 5.1 An example of boxplot application. 42
Figure 5.2 Plots showing results of replicate analysis. 48
Figure 5.3 Correlation between duplicate and original element. 49
Figure 6.1. Summary profiles of thickness of transported and in situ regolith
in the Byrock (A), Sussex (B) and Hermidale (C) areas. 59
Figure 6.2. Distribution pattern of Au anomalies. 64
Figure 6.3. Distribution pattern of Co anomalies. 65
Figure 6.4. Distribution pattern of Cr anomalies. 65
Figure 6.5. Distribution pattern of Cu anomalies. 66
Figure 6.6. Distribution pattern of Mo anomalies. 66
Figure 6.7. Distribution pattern of Ni anomalies. 67
Figure 6.8. Distribution pattern of Pb anomalies. 67
Figure 6.9. Distribution pattern of Sb anomalies. 68
Figure 6.10. Distribution pattern of V anomalies. 68
Figure 6.11. Distribution pattern of W anomalies. 69
Figure 6.12. Distribution pattern of Zn anomalies. 69
Figure 6.13. Anomalies in Cr and Mo for the regolith carbonate facies in the top
metre samples from drill holes CBAC191 and CBAC 92. 70

Figure 6.14. Anomalies in the regolith carbonate facies of the
transported regolith. 74
Figure 6.15. Anomalies in the Fe-rich facies of the transported regolith. 75
Figure 6.16. Anomalies in the in situ clay-silt- gravel facies. 77
Figure 6.17. Anomalies in the regolith carbonate facies of the in situ regolith 78
Figure 6.18. Anomalies in the Fe-rich facies of the in situ regolith. 79
Figure 6.19. Anomalies in the in situ Mn- rich facies. 81
Figure 6.20. Elements cluster dendrograms of the clay-silt-gravel facies of
the top metre regolith unit. 82
Figure 6.21. Elements cluster dendrograms of the in situ regolith unit 82
Figure 7.1. Geologic map of the Girilambone region showing some known
mineralisation sites, drill hole locations 90
Figure 7.2 Digital elevation model of the Byrock area. 91
Figure 7.3 Digital elevation model of the Flermidale area. 92
Figure 7.4 Magnetics imagery of the Byrock area. 92
Figure 7.5 Magnetics imagery of the Flermidale area. 93
Figure 7.6 Lithologic cross-section along the groundwater flow between and
CBAC217 and CBAC227. 94
Figure 7.7 Lithologic cross-section showing the water in the northern
part of the Flermidale area. 95
Figure 7.8 Lithologic cross-section showing the water table in the southern
part of Hermidale area. 95
Figure 7.9 General hydraulic contours (m) in the Byrock area. 96
Figure 7.10 General hydraulic contours (m) in the Hermidale area. 96
Figure 7.11 Eh-pH diagram. 98
Figure 7.12. Piper plots illustrating different types of groundwater. 101
Figure 7.13 Scatterplots of alkalinity vs (Na + K + Ca+Mg). 102
Figure 7.14 Scatterplots of (Ca2++Mg2+) vs (K+ +N+). 102
Figure 7.15 Scatterplot of Na+vs CF. 104
Figure 7.16 Scatterplot of Na/Br vs Cl/Br. 104
Figure 7.17 Scatterplot of CF vs S04 2\ 105
Figure 7.18 Scatterplot of Ca2+ vs S04 2\ 105
Figure 7.19 Cl /Cl versus chloride for the Byrock groundwater samples. 108

Figure 7.20 36C1 /Cl versus chloride for the Hermidale groundwater samples. 109
Figure 7.21 Hermidale and Byrock groundwater plotted on apportion
of the log (a K+/H+) versus log a Mg++/H+*2 diagram. 110
Figure 7.22 Calculated saturation indices of ZnSiOß (A), malachite (B),
and tenorite (C) in Hermidale groundwaters. 112
Figure 7.23 The Hermidale and Byrock groundwater compositions,
mineral stability fields. 114
Figure 7.24 The distribution pattern of Cu and Zn in the groundwater. 115
Figure 7.25 Distribution profiles of Cu and Zn in the regolith of the
Byrock drill holes CBAC217, CBAC219 and CBAC248. 115
Figure 7.26 Distribution patterns of EC, S 0 42-, CF, Cu and Zn in groundwater. 116
Figure 8.1 Scattergrams showing correlations between likely immobile elements. 122
Figure 8.2 Scattergrams showing immobility test correlations. 123
Figure 8.3. Scattergram showing correlation between AI2O3 and high CaO
of base of the hole saprolith samples. 124
Figure 8.4. Ternary plots of molecular proportions of AI2O3- (Na20+Ca0*)
-K2O with the Chemical Index of Alteration (CIA). 126
Figure 8.5 Plot of Th/Sc verse Zr/Sc for saprolith sample. 129
Figure 8.6 AHC^/SiC^ -100TiO2/Zr diagram for saprolith samples. 130
Figure 8.7 Ternary plot of 15Al203-300Ti02-Zr. 131
Figure 8.8 An idealized weathering profile developed on granitic bedrock. 133
Figure 8.9 A-CN-K diagram shows the weathering zones. 134
Figure 8.10 Scattergram of 30TiO2/Al2Ü3 and Ce. 136
Figure 8.11 Scattergram of SOTiCVAFC^ and La. 137
Figure 8.12 Ti/Th - Ce/La diagram of saprolith materials. 137
Figure 8.13 CIA - (Ce/La)N diagram of saprolith materials. 138
Figure 9.1 Classification of calcrete by hydrological setting. 143
Figure 9.2 Distribution of calcrete and associated soils in Australia. 144
Figure 9.3 Examples of calcrete from the Girilambone region. 146
Figure 9.4 Drill hole plots showing distribution of calcrete-bearing
zones in the transported regolith of the Byrock area. 147
Figure 9.5 Drill hole plots showing distribution of calcrete-bearing
zones in the transported regolith of the Hermidale area. 148
Figure 9.6 Drill hole plots showing distribution of calcrete-bearing
zones in the transported regolith of the Sussex area. 149
Figure 9.7 Drill hole plots showing distribution of calcrete-bearing zones
in the in situ regolith of the Byrock area. 150
Figure 9.8 Drill hole plots showing distribution of calcrete-bearing zones
in the in situ regolith of the Hermidale area. 151
Figure 9.9 Drill hole plots showing distribution of calcrete-bearing zones
in the in situ regolith of the Sussex area. 152
Figure 9.10 Triangular (MgO-CaO-AbC^) compositional diagram of
the transported and in-situ regolith. 153
Figure 9.11 Bivariate MgO-CaO diagram of the transported calcrete-bearing
Regolith. 153
Figure 9.12 Bivariate MgO-CaO diagram of the in situ calcrete-bearing. 154
Figure 9.13 Scattergrams of major components in the regolith carbonate zones. 155
Figure 9.14 Distributions of Au, Bi, CaO, MgO and total Fe2Ü3 (wt %)
within in situ regolith in drill hole CBAC2. 156
Figure 9.15 Distributions of Au, W, CaO, MgO and Fe203 (total)
in drill hole CBAC188. 157
Figure 9.16 Distributions of Au, CaO, MgO and Fe203 (total)
within in situ regolith in drill hole CBAC41. 158
Figure 9.17 Distributions of Au (ppm), CaO, MgO and total Fe203 (wt %)
within in situ regolith in drill hole CBAC204. 158
Figure 9.18 Distribution of Au (ppm), CaO, MgO and total Fe203 (wt %)
within transported regolith in drill holes CBAC78 and CBAC159. 159
Figure 9.19 Scattergrams showing correlation of detectable Ag with
major elements. 160
Figure 9.20 Distribution profile showing the relationships between FC203,
MnO, MgO, CaO (wt %), Ag, As, Au and Mo (ppm)
in drill holeCBAC188. 161
Figure 9.21 Arsenic distribution profiles and the relationships between As (ppm)
and MgO, CaO, Fe203, MnO (wt %), in drill holes CBAC13,
CBAC159 and CBAC184 . 163
Figure 9.22 Scattergrams showing correlations between Sr and Ba and other
elements in the regolith carbonates. 164

Figure 9.23 Showing distributions of Sr ppm, Ba ppm, S wt %, CaO wt %
and MgO wt % in drill hole CBAC213. 165
Figure 9.24 Drill hole plots showing distribution of Mn-enriched zones in
the in situ regolith. 168
Figure 9.25 SEM photomicrograph showing large flakes of mica
(muscovite) and microcrystalline Mn oxides (cryptomelane). 170
Figure 9.26 EDXA spectra showing the chemical compositions. 171
Figure 9.27 SEM photomicrograph showing a quartz crystal and
microcrystalline Mn oxides. 172
Figure 9.28 EDXA spectrum showing the chemical compositions. 172
Figure 9.29 SEM photomicrograph showing microcrystalline Mn oxides
clustered between clay crystals. 173
Figure 9.30 EDXA spectrum showing the chemical compositions. 173
Figure 9.31 SEM photomicrograph showing well-developed Mn(lithiophorite)
crystals forming sheaves in voids, mica crystals. 174
Figure 9.32 EDXA spectrum showing the chemical compositions. 175
Figure 8.33 EDXA spectrum showing the chemical compositions of
microcrystalline Mn oxides (pyrolusite). 175
Figure 9.34 Mineral sequences in the weathering of Mn-bearing silicates. 176
Figure 9.35 Distribution profile of Mn (wt %) and Mn-minerals in
drill holes CBAC176, CBAC177 and CBAC180. 178
Figure 9.36 Scattergrams of major elements in the Mn-dominant regolith. 179
Figure 9.37 Scattergrams of trace elements in the Mn-enriched regolith. 180
Figure 9.38 Distribution profiles in the Mn-dominant horizon of CBAC119. 182
Figure 9.39 Distribution profiles in the Mn-dominant horizon of CBAC191. 182
Figure 9.40 Distribution profiles in the Mn-dominant horizon of CBAC195. 183
Figure 9.41 Distribution profiles in the Mn-dominant horizon of CBAC198. 183
Figure 9.42 Distribution profiles in the Mn-dominant horizon of CBAC201. 184
Figure 9.43 Distribution profiles in the Mn-dominant horizon of CBAC211. 185
Figure 9.44 Scattergrams showing the correlation between Mn and Ba, Co, Cr,
Pb, Ni and Zn. 187
Figure 9.45 Distribution patterns in the Mn-dominant regolith of CBAC122,
CBAC177, CBAC198, and CBAC211. 188

Figure 9.46 A cross section showing the Mn-rich zone and watertable along
the flow path of the groundwater. 190
Figure 9.47 Distribution patterns in the Mn-rich regolith of CBAC 173. 191
Figure 9.48 Distribution patterns in the Mn-rich regolith of CBAC181. 191
Figure 9.49 Distribution patterns in the Mn-rich regolith of CB AC 185. 192
Figure 9.50 Distribution patterns in the Mn-rich regolith of CB AC 182. 192
Figure 9.51 Plan showing the location of drill holes with observed Fe-enriched
zones in the regolith from the Sussex area. 195
Figure 9.52 Plan showing the location of drill holes with observed Fe-enriched
zones in the regolith from the Hermidale area. 196
Figure 9.53 Plan showing the location of drill holes with observed Fe-enriched
zones in the regolith from the Byrock area. 197
Figure 9.54 Scattergrams of trace elements in the Fe-enriched regolith. 199
Figure 9.55 Distribution profiles in the Fe- dominant horizons of CBAC103. 200
Figure 9.56 Distribution profiles in the Fe- dominant horizons of CBAC204. 200
Figure 9.57 Distribution profiles in the Fe- dominant horizons of CBAC27. 202
Figure 9.58 Distribution profiles in the Fe- dominant horizons of CBAC246. 202
Figure 9.59 Distribution profiles in the Fe- dominant horizons of CBAC243. 203
Figure 9.60 Distribution profiles in the Fe- dominant horizons of CBAC200. 204
Figure 9.61 Distribution profiles in the Fe- dominant horizons of CBAC205. 205
Figure 9.62 Distribution profiles in the Fe- dominant horizons of CBAC218. 206
Figure 9.63 Distribution profiles in the Fe- dominant horizons of CBAC224. 206
LIST OF TABLES
Table 5.1. Standard deviation (s), mean (Y), coefficient of variation
(CV) and precision (P) of five replicate samples from
CBAC150, Hermidale area. 47
Table 5.2 Types of distance measures. 52
Table 6.1. Threshold values of elements estimated by Median+2MAD
and Boxplot methods for clay-silt-gravel, regolith carbonate,
Fe-rich and Mn-rich facies of the top metre, transported and
in situ regolith units in the Girilambone region. 62
Table 6.2 Anomalies of As, Au. Co, Cr, Cu, Ni, Pb, V, and Zn from
the transported clay-silt-gravel facies of the Sussex and
Hermidale areas. 72
Table 6.3 Anomalies of Co, Cr, Mo, Ni, Pb and V from the transported
clay-silt-gravel facies of the Byrock area. 73
Table 6.4 The rotated factor matrices with loading of elements on each
component of the principle component analysis. 84
Table 6.5 The rotated factor matrices with loading of elements on each
component of the principle component analysis. 85
Table 6.6 Elemental groups as are suggested by cluster analysis (CA)
and principal component analyses (PCA) from the top metre,
transported and in situ regolith facies. 86
Table 7.1 Sample depth, Electrical conductivity (EC), pH, Eh, temperature
and alkalinity of the groundwater samples from the Byrock and
Hermidale areas. 98
Table 7.2 j6Cl determinations for the Byrock and Hermidale groundwaters. 108
Table 9.1 Morphological classification of calcrete. 142
Table 9.2 Chemical compositions of the common Mn oxide minerals 170

1. CHAPTER ONE: INTRODUCTION
1.1 PREAMBLE
During the last decade there has been an increasing interest in the regolith and the
tectonic, climatic and surface processes that control it. Large areas of the Earth are
characterised by thick regolith cover. These areas are mainly located within the tropical
to sub-tropical zone (between latitudes 40° north and south). Most of Australia’s
surface is distinguished by low relief and this, together with its location in mid to low
latitude (11-43°), has affected the types of landform and the manner of landscape
development. As the search for buried ore deposits continues throughout Australia (e.g.,
Butt, 1998; Morris et al., 2003; Cameron et al., 2004; Tonuie et al., 2003) and the
world (e.g., Kauranne et al., 1992; Roy et al., 2004), the use of regolith geochemistry
will continue to play an important role in mineral exploration. The use of geochemistry
in mineral exploration has progressed from evaluating local targets using weathered
bedrock recovered by auger or aircore drilling to reconnaissance mode exploration,
where targets are defined over prospective stratigraphic and structural features (Cohen
et al., 1996). In Australia, exploration is focussed on regolith geochemistry as a tool,
particularly in areas of deep in situ and transported regolith cover (e.g., Butt et al.,
2005). Proper application of regolith multi element geochemistry as well as specific
sampling media in regolith-dominated terrains has led to the discovery of buried ore
deposits (Butt and Zeegers, 1989). The geochemical behaviour, dispersion and
accumulation of elements in the regolith results from interaction between parent rock
that may host mineralisation, weathering processes and groundwater that disperse and
/or accumulate target and pathfinder elements (e.g., Taylor and Eggleton, 2001).
The hydrogeochemistry of groundwater has been used in Australia as a tool to
understand the origins of dryland salinity (e.g. Cartwright et al., 2004) and to assist
mineral exploration under cover. For example a regional study of groundwater
chemistry has been conducted within the Carpentaria and Eromanga Basins, NW
Queensland, where the underlying basement rocks belong to the Georgetown and Mt
Isa inkers (Giblin 1996b; 2001). A detailed hydrogeochemical study was also
performed at the undisturbed Halfmile Lake and Restigouche Zn-Pb deposits in New
Brunswick (Leyboume et al., 2002). Both these studies showed a significant
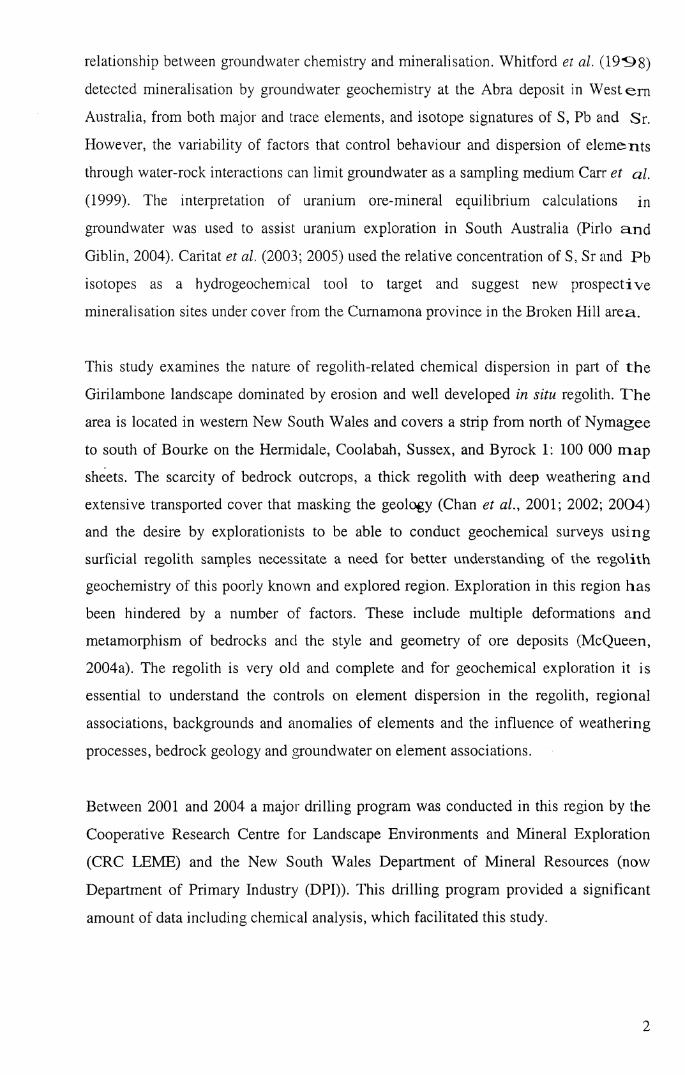
relationship between groundwater chemistry and mineralisation. Whitford et al. (19S)8)
detected mineralisation by groundwater geochemistry at the Abra deposit in Western
Australia, from both major and trace elements, and isotope signatures of S, Pb and Sr.
However, the variability of factors that control behaviour and dispersion of elements
through water-rock interactions can limit groundwater as a sampling medium Carr et al.
(1999). The interpretation of uranium ore-mineral equilibrium calculations in
groundwater was used to assist uranium exploration in South Australia (Pirlo an d
Giblin, 2004). Caritat et al. (2003; 2005) used the relative concentration of S, Sr and Pb
isotopes as a hydrogeochemical tool to target and suggest new prospective
mineralisation sites under cover from the Cumamona province in the Broken Hill area.
This study examines the nature of regolith-related chemical dispersion in part of the
Girilambone landscape dominated by erosion and well developed in situ regolith. The
area is located in western New South Wales and covers a strip from north of Nymagee
to south of Bourke on the Hermidale, Coolabah, Sussex, and Byrock 1: 100 000 map
sheets. The scarcity of bedrock outcrops, a thick regolith with deep weathering and
extensive transported cover that masking the geology (Chan et al., 2001; 2002; 2004)
and the desire by explorationists to be able to conduct geochemical surveys using
surficial regolith samples necessitate a need for better understanding of the regolith
geochemistry of this poorly known and explored region. Exploration in this region has
been hindered by a number of factors. These include multiple deformations and
metamorphism of bedrocks and the style and geometry of ore deposits (McQueen,
2004a). The regolith is very old and complete and for geochemical exploration it is
essential to understand the controls on element dispersion in the regolith, regional
associations, backgrounds and anomalies of elements and the influence of weathering
processes, bedrock geology and groundwater on element associations.
Between 2001 and 2004 a major drilling program was conducted in this region by the
Cooperative Research Centre for Landscape Environments and Mineral Exploration
(CRC LEME) and the New South Wales Department of Mineral Resources (now
Department of Primary Industry (DPI)). This drilling program provided a significant
amount of data including chemical analysis, which facilitated this study.
2

1.2 AIMS AND APPROACHES OF THE STUDY
This study investigates using regolith materials (top metre, transported and in situ) in
the Girilambone region, in addition to groundwater, as sampling media, to understand
element dispersion patterns and the formation of secondary geochemical haloes. The
outcomes may provide confidence in vectoring towards possible mineralisation in this
region. The research also aims to estimate background levels of target and pathfinder
elements in the regolith. The aims of the study can be summarised as follows:
• to develop improved geochemical exploration strategies through a better
understanding of multi-element geochemical associations, anomalies and
backgrounds;
• to identify processes of weathering, transportation and dispersion of elements in the
unmineralised and weakly mineralised regolith of the Hermidale- Sussex- Byrock
region;
• to understand the behaviour of potential target and pathfinder elements during
weathering processes, and particularly the controls on Au, Cu, Zn and Pb dispersion
and concentration in carbonate, iron and manganese-enriched regolith and variably
weathered background settings;
• to use groundwater chemistry to identify weathering water-rock interaction
processes, and target concealed mineralisation;
• to identify the parent materials of the regolith in the region; and
• to appraise the composite geochemical sampling media available in the region and
to make suggestions to assist mineral exploration in the region and elsewhere.
The approach taken has been to:
• examine the distribution pattem, local and regional background levels, and
thresholds for a range of target and pathfinder elements;
• identify geochemical associations and special lateral and vertical distribution
patterns of certain elements by using cluster analysis;
• examine and identify secondary minerals by visual and petrographic examination,
testing with hydrochloric acid, X-Ray Diffraction (XRD), Scanning Electron
Microscope (SEM) and Energy Dispersive X-ray Analysis (EDXA);
• analyse groundwater at selected sites by Inductively Coupled Plasma -Optical
Emission Spectrometry (ICP OES) and radioisotope chlorine-36 measurements; and
3

• recognise the geochemical signatures of bedrock samples from the base of d rill
holes by using immobile major and trace element ratios measured by X- R.ay
Fluorescence (XRF) spectroscopy analysis.
1.3 THESIS OUTLINE
The thesis is organised as follows:
• The current chapter is an introduction to the study outlining the aims an d
approaches;
• Chapter Two introduces the regional and site characteristics of the study area
including climate, vegetation, landuse, regolith landforms and previous work on the
geochemistry and regolith in the Girilambone region.
• Chapter Three summarises the geology and metallogeny of the region, and
describes previous geochemical investigations in the region;
• Chapter Four describes sampling methodology.
• Chapter Five describes the methods of data manipulation, quality control, basic and
multivariate statical techniques that were employed in the study.
• Chapter Six includes a detailed geochemical investigation, using cluster and
principal component analyses, to determine the characteristic geochemical
associations of the studied regolith units (top metre, transported, in situ) and to
identify background, and anomalous levels for elements in the region;
• Chapter Seven describes the types of groundwater samples, and the processes that
control the nature of the groundwaters, (e.g., evaporation and mixing), investigates
the rock-water interactions, and estimates the relative ages using 36C1
measurements;
• Chapter Eight presents a method for identifying the geochemical signatures of
underlying bedrock in partially weathered bottom of hole samples.
4

Chapter Nine includes a description of the weathering profiles, element associations
in the secondary calcrete-, iron- and manganese- enriched regolith zones; and
Chapter Ten presents the conclusions and recommendations of the study.
2. CHAPTER TWO: REGIONAL AND SITE CHARACTERISTICS
2.1 LOCATION OF STUDY AREA
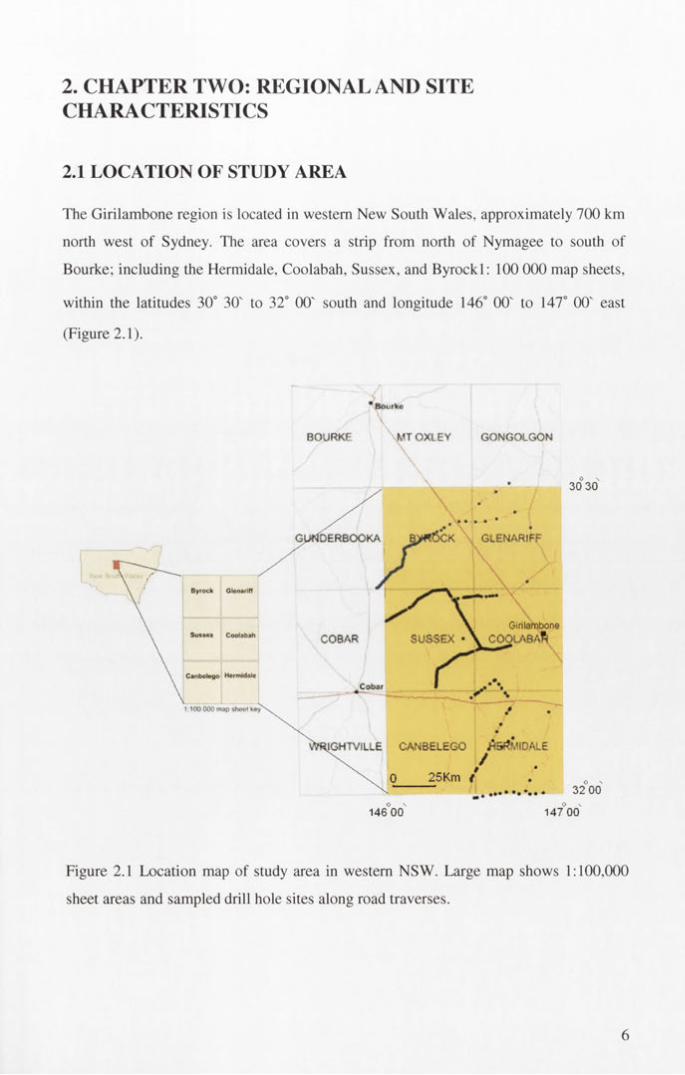
The Girilambone region is located in western New South Wales, approximately 700 km
north west of Sydney. The area covers a strip from north of Nymagee to south of
Bourke; including the Hermidale, Coolabah, Sussex, and Byrock 1: 100 000 map sheets,
within the latitudes 30° 30' to 32° 00' south and longitude 146° 00' to 147° 00' east
(Figure 2.1).
"Bomfcc
BOURKF MT OXLEY GONGOLGON
30 30
GLENARIFFGUNDERBOOKA
Byrock Gtenariff
\ GirilamboneS U S S E X - \ COOLABAÄCOBAR
Canbolego Hoimidale
1 100 000 map sheel key
JGHTVILLE CANBELEGO jtetfMIDALE
25Km (32 00
146 00 147 00
Figure 2.1 Location map of study area in western NSW. Large map shows 1:100,000
sheet areas and sampled drill hole sites along road traverses.
6

2.2 CLIMATE, VEGETATION AND LANDUSE
The study area has a sub-arid climate. Average monthly maximum temperatures rangeo o o o
from 13 C to 20 C in winter to between 28 C to 39 C in summer. Average monthly
minimum temperatures range from 2 C to 8 C in winter to 14 C to 24 C in summer.
The humidity is low. During the summer the average relative humidity is about 30 % in
the afternoon and about 50 % at 9 am. In winter it is about 45 % at 3 pm, whilst it is
about 75 % at 9 am. On average, rainfall tends to be uniformly distributed throughout
the year, with a median annual rainfall for Cobar of 390 mm (Australian Bureau of
Meteorology). Figure 2.2 shows the monthly rainfall in the Cobar area.
M o n t h l y r a i n f a l l d a t a Cobar
60
50
„__ ^ 40££
i o
oJ a n Feb Mar Apr May J u n Jul Aug S ep O ct Nov Dec
30
25
20
15
oH
1 o
5
O
B u r e a u o f M e t EOROl 06V
Av«. m o n t h l y ra in fa l l N u m b e r o f r a i n d a y s
Figure 2.2 Monthly rainfalls in the Cobar area, (from Australian Bureau of
Meteorology).
Livestock grazing is the main agricultural enterprise (Tate, 2003). Wheat is the
predominant crop further to the south of Cobar, but cropping is limited in the
Girilambone-Cobar region due to the low nutrient content of the soils and poor annual
rainfall (Cunningham et al., 1981). Mining is also a major industry within the region
where Au, Cu, Zn and Pb are mined (e.g., Stegman and Stegman, 1996).
7

The Girilambone region is host to many species of grasses, shrubs and trees, which can
be used as surrogates for identification of different regolith and landforms. Belah and
River Oak are noticed in large well-developed stands in or close to the drainage
channels, whereas White Cypress Pine are commonly found growing in coarse textured
red and brown earth (Munro, 2003), occasionally associated with streams, and shallow
soils well up the slopes of hills. Small communities of Black Cypress Pine are present
on hills and stony ridges, commonly associated with Kurrajong, Mugga Ironbark and
Green Mallee communities (Cunningham et al., 1981). Extensive areas of Mulga have
developed to form an almost impassable scrub.
2.3 REGOLITH LANDFORMS
The Girilambone region lies within the Cobar Pediplain. This Pediplain is largely
underlain by outcrop and subcrop of the Cambro-Ordovician Girilambone Group, the
Early to Middle Devonian Cobar Supergroup and the Middle to Late Devonian Mulga
Down Group (Glen, 1994). The pediplain is characterised by gently undulating hills
averaging 250 metres above sea level, with a few isolated peaks and ranges rising to
100 metres above this level (Leah, 1996). The Pediplain is bounded by sedimentary
sequences associated with the Neogene Murray Basin and the Quaternary Darling,
Bogan and Lachlan River system (Gilligan and Byrnes, 1995).
Most of the study area is covered by colluvial and alluvial sediments with small areas
of weathered bedrock rises (9-30 m relief). In the Hermidale (particularly in the
southwestern part) and Sussex areas there are some low hills (30-90 m relief), and in
the Byrock area more extensive highly weathered bedrock rises. A few small volcanic
plateaux of slightly weathered leucitite basalt occur in the Sussex and Byrock areas
(Chan et al., 2001; 2004; Glanville et a l, 2003). Colluvial sheetwash sediments on rises
dominate in the Sussex area, whereas colluvial sheetwash sediments on erosional plains
and depositional plains dominate in the Hermidale area (Chan et al., 2001; 2002; 2004).
Regolith landform units were used in the compilation of the Girilambone 1:100,000
regolith-landform map (Figure 2.3). In situ saprolite and saprock and transported
components are distinguished according to the degree of weathering of weatherable
8

fli Depositional and stagnant alluvial plains, channels, swamps and fans.
Erosional alluvial depressions.
Depositional colluvial plains.
Erosional colluvial plains and rises.
Aeolian landforms.
Highly weathered bedrock rises.
H Slightly weathered bedrock plains, rises, low hills and hills.Slightly weathered lava plateaus.
25 Km
32" 00
147 00146 00
Figure 2.3 Basic regolith landforms on the Girilambone region. Named sheets are
1:100,000 sheets (source CRC LEME and NSW DPI Girilambone-Cobar project).
9

minerals as well as clay mineral assemblages. Generally the transported regolit h
consists of clay and minor quartz silt-sand-gravel sediments, whereas the in s i t u
regolith consists of a variety of sandstone/siltstone to metasandstone/siltstone,
claystone to shale/phyllite (micaceous in places), and silty claystone/ phyllite (Chan e t
ai, 2001; 2002; 2004).
2.4 PREVIOUS WORK ON THE GEOCHEMISTRY AND REGOLITH IN THE GIRILAMBONE REGION
In the Girilambone region, the Cobar area has been a major focus for geological
investigation and modem mineral exploration, particularly for gold, since the m id-
1980s (Stegman and Stegman, 1996). Earlier, Andrews (1915) and Rayner (1961)
studied the stratigraphy, structure and tectonic history of the Cobar region and
described the Cobar copper and gold deposits with detailed investigation of th e
geology, ore deposits and operating mines. Other previous geological investigations in
the Byrock area (e.g., Hall, Ralph &Associates, 1969; Eastmet Minerals N.L., 1970)
concluded that the dominant outcrops in the area belong to the Girilambone Group
(Ordovician) and also noted that no economic mineralisation had been reported, except
an abandoned copper prospect to the north and a gold lode to the west. The regional
geology and mineralisation of the Cobar region and study area are discussed in Chapter
3.
Geochemical dispersion and associated depletion haloes in fresh rocks and regolith
sumounding orebodies have been investigated in numerous studies at selected
mineralised sites including at the Elura and CSA mines in the Cobar area. These studies
employed different analytical techniques and sample media (Cohen et al., 1996).
However, the present review only covers previous work concerned with using chemical
analysis of regolith and/or groundwater (as sampling medium) to target mineralisation
sites in the region.
The principles and mechanisms of geochemical dispersion, weathering, landscape
development, formation of regolith and anomalies have been discussed in different
geochemical exploration models (e.g. Butt, 1987; Butt and Zeegers, 1989; Taylor and
Butt 1998; Butt et al., 2000). Leah (1996) classified the weathering profiles in the
Cobar district into relict lateritic profiles preserved within deeply weathered Palaeozoic
10

bedrock terranes with partial oxidation ranging in depth between 80 and 100 metres
with ferruginous lag morphologies resting on the weathered bedrock and reworked
ferruginous regolith materials within overlying alluvium. Rutherford (2000) considered
oxidation (redox processes), which mainly affects the sulfide component and metal
species, and hydration of the silicate minerals as the main geochemical processes that
control the chemistry of the weathering profile in the Cobar area. Although these
processes are important in the formation of the weathered profile and movement of
metals, they are controlled by the paleoclimatic and recent climatic regimes (e.g.,
Campbell and Claridge, 1992).
Secondary dispersion of elements in the Cobar region has been interpreted as a result of
paleodrainage channel activity (Taylor et al., 1984), mechanical dispersion of ferricrete
from an earlier lateritic weathering profile (Dunlop et al., 1983) and weathering of the
sulfides. Studies have shown that Cu and Zn are preferentially concentrated in goethite
and that Pb is commonly concentrated in hematite (Scott, 2002). Different techniques
and sampling media were employed to understand factors controlling element
dispersion in the Cobar region (e.g., Alipour et al., 1995; 1996; 1997; Cohen, et al.,
1998; Pwa et al., 1999; Cairns et al., 2001; Khider, 2004; McQueen et al., 2004;
Whitbread and Moore, 2004; Khider and McQueen, 2006; McQueen, 2006).
Geochemical dispersion and resulting anomalies in residual and transported regolith
along the drainage system near the CSA mine displayed three element associations: Cu
- Zn - Mn ± Au ± Pb; the As-Sb ± Au; and the As- Sb-Pb ± Au (Shen et al., 1998).
These associations were recorded from deep saprolite, residual regolith and interbedded
gravels and silts of paleo-channel deposits respectively. Gold has irregular anomalies
correlated with near-surface carbonate accumulation (Hill et al. 1998; McQueen et al.
1999) and economic Au hosted in the oxidised zones (e.g., McKinnons regolith)
without significant base metals (Piang, 1996).
Pwa et al. (1999; 2002) showed that in the Cobar region Cu, Zn, Pb, Ni, As, Mo, Ag,
Sb, Ba, Bi and W are enriched around mineralisation, and K, Al, Ca, Ti, Ga, Rb, Sr, Zr,
Y, V, Na are generally depleted because of feldspar and mica weathering in regolith at
selected mineralised sites. Scott et al. (1991) related the secondary dispersion of Cu,
Zn, and some Au to the fluctuation of water table in the area. However, lack of
11

chemical analysis of the groundwater made it difficult to understand rock-water
interactions along the water table in this region.
Investigation of the behaviour of pathfinder elements in the intensely weathered C obar
terrain by McQueen and Munro (2003) revealed that at the new Cobar Au- Cu deposit
there is a progressive change in mineral hosts. Goethite, hematite and cryptomelane an d
alunite-jarosite minerals were identified as important hosts for Zn- Cu- As, Cu- Pb- S b
and Co-Cu- Ni element groups respectively. Secondary Fe and Mn oxides and
oxyhydroxides are major host phases for base metal cations within in situ regolith near
the Peak in the Cobar area (Cairns et al, 2001). These oxides were developed in a
dominantly erosional setting. No clear association was found between gold and any
particular secondary mineral. Pathfinder element associations in the Nyngan-Bourke-
Nymagee area include an “evaporitic” association of Ca-Mg ± Au, a redox association
of Mn-Co-Zn ± Ni - Cu ± Au related to redox boundary accumulations of Mn
oxides/oxyhdroxides, a goethite association of Fe-Cu-Zn and a hematite association o f
Fe-As-Pb ± Sb ± Bi (McQueen, 2004b). These groups of elements were proposed as
background associations but the study did not specify or link any of these associations
to transported or residual regolith units. Distribution of these elements through the
weathering profile around the New Cobar deposits was interpreted as due to the
interplay between chemical (hydromorphic) and mechanical dispersions (McQueen et
al., 2004). Elements such as Pb, As, Bi, Sb and W showed limited chemical dispersion
deeper in the profile but were mechanically dispersed in hematitic lag at the surface.
The association of Au with calcrete in the Girilambone region was studied by Khider
and McQueen (2006) and McQueen (2006) These studies have revealed that the
presence of carbonate is an indicator of a geochemical environment conducive to
precipitation of chemically mobilised gold rather than a direct control on gold fixation
by calcrete. The total carbonate content is probably not a significant control on the Au
concentration.
The hydrogeology of the Nymagee area was summarised by Menzies (1969) as being
controlled by three main rock type settings:
• Thin Quaternary deposits that are unlikely to contain usable water;
12

• Devonian rocks classified into the Amphitheatre and Mulga Downs Stages. T h e
Amphitheatre Stage is characterised by relatively porous and highly im pervious
rocks. Many of the latter are quartzites, which are full of joints and cracks th a t
make them capable of holding underground water. The Mulga Downs S ta g e
consists mainly of coarse sandy rocks, which are commonly silicified. Some o f
these rocks are porous sandstone and many of the quartzite beds are heavily
jointed and carry useful supplies of water; and
• Pre-Devonian rocks, which generally contain water with high quantities of salts.
The groundwater chemistry and hydrogeology of the Girilambone region w ere
investigated by Khider (2004) and Khider and McPhail (2005). These studies showed
that the aquifer is an unconfined system within the in situ regolith areas and consists o f
phyllitic siltstone - sandstone layers. The groundwater generally flows to the northeast
in the Hermidale area and in part of the Byrock area. The groundwater in the region is
mainly of chloride type, rich in Na, Cl and SO4 .The other calcium-bicarbonate and
bicarbonate - chloride types are not predominant and the main processes that affected
the groundwater composition are evaporation, water -rock and mixing.
13
3. CHAPTER THREE: REGIONAL GEOLOGY AND MINERALISATION
3.1 REGIONAL SETTING OF SOUTHEASTERN AUSTRALIA
The geological structure of the eastern third of Australia, which includes New South
Wales, is summarised by Scheibner (1999) as being composed of three main entities
(Figure 3.1):
1. the Palaeo-Proterozoic to Mesozoic Australian Craton to the west of the Tasman
Line, which is mostly concealed by platform basins. In places these basins have
been deformed into within-plate fold belts (e.g., Adelaide Fold Belt);
2. the Neoproterozoic to Mesozoic Tasman Fold Belt System or Orogenic Zone,
which represents an orogenic or active plate margin east of the Tasman Line;
and
3. the Late Carboniferous to Cainozoic platform cover of sedimentary and
intraplate igneous, dominantly volcanic, rocks.
Most of New South Wales lies in the Tasman Fold Belt System, which consists of five
fold belts. The important ones are the Kanmantoo, Lachlan and New England Fold
Belts, the last two being separated by the Sydney-Bowen Basin. Small parts of the
Thomson and Adelaide Fold Belts occur in the north and the west respectively (Figure
3.1; Scheibner, 1999).
The Girilambone region, the focus of this study, is located in the NW Lachlan Fold Belt
(LFB). The LFB has Cambrian to Carboniferous rock assemblages developed over 700
km across strike and subdivided into western, central and eastern subprovinces (Figure
3.2; Gray, 1997; Gray and Foster, 1997; 1998; Foster et cil., 1999; Fergusson, 2003;
Neef, 2004). The western and central subprovinces include structural evidence of east-
directed and west-directed thrusting, respectively (Gray et al, 2002).
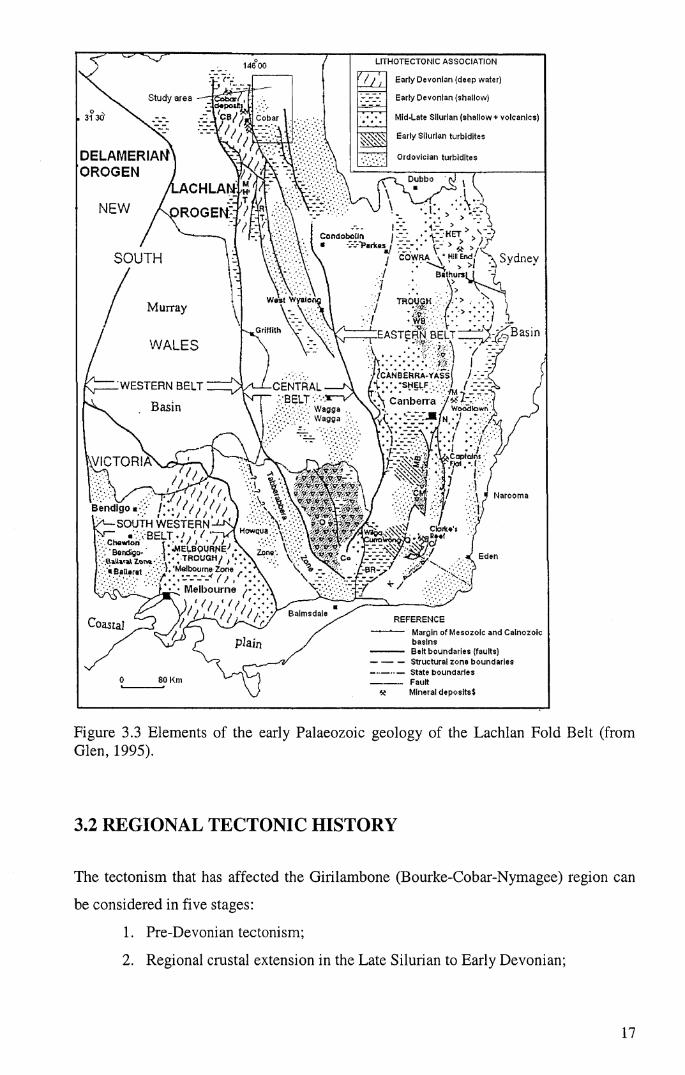
Glen (1992,1995) subdivided the LFB based on the distribution of constrained and
unconstrained sediment packages (lithotectonic associations) into the Western,
Southwestern, Central, and Eastern belts. Early Ordovician turbidites occur across the
Lachlan Fold Belt, but in the Late Ordovician, turbidites were restricted to the central
part of the Southwestern belt and the western part of the Western belt (Glen,
14

1992;Vandenberg and Stewart, 1992; Glen, 1995). The study area lies in Glen’s 1995* s
Central belt (Figure 3.3).
10 s -
TASM AN LINE
H O D G K IN S O N - B R O K E N R IVER F.B.
20 S -
A M A D E U S TR A N S V E R S E ZONE
30 S -
**'• CD ?
Study area
TASM AN LINE
40 S -400 Km
140 E 150 E
Figure 3.1 Main structural entities in the basement of eastern Australia (from Scheibner, 1999).
15

(C)HRZ / ,❖
V. s t / * BlueschistN blocks
o-d \ :
Figure 3.2 Provinces of the Lachlan Fold Belt (from Fergusson, 2003).
16
LITHOTECTONIC ASSOCIATION
Early Devonian (deep water)
Early Devonian (shallow)
Mid-Late Silurian (shallow + volcanics)
Early Silurian turbidites
Ordovician turbidites
REFERENCEMargin of Mesozoic and Cainozoic basinsBelt boundaries (faults)
----------- Structural zone boundaries------------State boundaries----------- Fault
« Mineral deposits$
Figure 3.3 Elements of the early Palaeozoic geology of the Lachlan Fold Belt (from Glen, 1995).
3.2 REGIONAL TECTONIC HISTORY
The tectonism that has affected the Girilambone (Bourke-Cobar-Nymagee) region can
be considered in five stages:
1. Pre-Devonian tectonism;
2. Regional crustal extension in the Late Silurian to Early Devonian;
17
3. Late Early Devonian transgressional tectonism;
4. Carboniferous tectonism; and
5. Neotectonism.
1. Pre-Devonian tectonism
The Lachlan Fold Belt in pre-Ordovician time was characterised by an oceanic setting
without any deformation in the belt itself, slowly filling in with thick deep-marine
turbidite sequences (Fergusson and Coney, 1992). The study area was in the ocean on
the continental side of the Molong Volcanic Arc (Byrnes, 1993) and the oldest rocks in
the Girilambone region were probably deposited from this time. To the west of this arc,
sedimentation of turbiditic basinal sediments (Wagga Marginal Basin) began in the
earliest Ordovician (Kilpatrick and Fleming, 1980). To the east was a fore-arc basin
(Monaro Slope and Basin; Figure 3.4A).
During the Late Ordovician to Early Silurian the Benambran Orogeny caused strong
deformation in the western and central parts of the Lachlan Fold Belt. The Molong
Volcanic Arc and its microcontinental basement collided with the fill of its back-arc
basin (Wagga Marginal Basin), causing strong deformation and large-scale imbrication
of the basinal sequences (Pogson, 1982).
The geochemical and isotopic signatures of rocks from this province indicate their
genesis in a subduction- related island-arc setting (Carr et al., 2003). The line of
collision is known as the Gilmore Suture (Figure 3.4 C). This structure is oriented
approximately north-south and its northern continuation is less well-defined (Scheibner,
1983,1999). It appears to connect with the faults in the Mineral Hill region (Pogson,
1991) and further north it terminates against the east-north-easterly trending Nandewar
Lineament (Byrnes, 1993). The deformation, thrust pile-up and consequent tectonic
thickening of the Wagga Marginal Basin fill in the high heat flow regime of the back-
arc basin (Pogson, 1982) resulted in high-temperature, low-pressure style
metamorphism leading to formation of anatectic granites. Some of these granites were
emplaced syntectonically, but most are post-tectonic. This orogenic activity formed the
Wagga-Omeo Metamorphic Belt (Figure 3.4B; Byrnes, 1993).
18

2. Regional crustal extension in the Late Silurian to Early Devonian
During the Silurian the Lachlan Fold Belt entered a tensional phase. Early Silurian
extension formed new troughs in the eastern half of the Lachlan Fold Belt, followed by
localised Late Silurian-Early Devonian deformation during the Bowning-Bindi
o o146 146
Bourke^y'BourkeStudy area /
BACK-ARC AREACobar
il oDARLIN^
•
g iSi\ / g I £ l
MONAROBASIN
Wagga
SLOPE /
l ,a TUMUT TROUGH
I I \
Thrusts
Dislocations,Incl. lineaments
Sutures
— . State boudaries
Figure 3.4 Cambrian to Middle Devonian development of the Lachlan Fold Belt (after
Byrnes, 1993).
Orogeny (Scheibner, 1999). However, west of the Gilmore Suture, extension facilitated
the emplacement, into the upper crust, of anatectic granitoid melts generated during the
Benambran tectonism (425-450 Ma). Further, brittle crust extensional tectonism west of
the Gilmore Suture in the earliest Devonian resulted in subsidence and the formation of
the composite Darling Basin in which the Cobar Supergroup was deposited (Figure
3.4C; Byrnes, 1993).
19

3. Late Early Devonian transgressional tectonism
The Middle Devonian Tabberabberan Orogeny terminated the pre-cratonic
development of the Lachlan Fold Belt. Radiometric dating (Glen et al, 1992) suggests
that deformation and metamorphism of the easternmost Darling Basin fill occurred a t
the close of the Early Devonian (395-400 Ma), as an early expression of the
Tabberabberan Orogeny, which affected the Lachlan region in a number of ways
(Powell, 1984). Former zones of extension probably suffered severe deformation from
this orogeny. It is also possible that former extensional faults became reverse faults and
developed into thrusts of thick-skin and thin-skin tectonic styles (Glen, 1988). This
deformation was followed by molassic overlap sedimentation, which in the Cobar-
Bourke area is represented by the Mulga Downs Group sedimentation in the Barka
Basin.
4. Carboniferous tectonism
Kanimblan tectonism in the Carboniferous (335-360 Ma) resulted in relatively mild
deformation of the Mulga Downs Group sediments in the Barka Basin and further
deformation of the underlying Cobar Supergroup. Deformation of these cover
sequences was probably controlled by reactivation of the normal and cross faults (Neef
and Bottrill, 2001), which were active during Early Devonian sedimentation. The faults
are probably reactivated basement faults (Glen, 1985, 1988). The Kanimblan Orogeny
resulted in the formation of large warps and open folds, such as the Gunderbooka
Syncline, without developing an axial plane cleavage.
The Kanimblan Orogeny further metamorphosed Lachlan Fold Belt rocks. Post-
kinematic granites intruded into the eastern part of the Lachlan Fold Belt. The existence
of some granitic intrusions of this age is considered possible in the Bourke-Cobar
region, but these intrusions are probably of small volumetric importance by comparison
with Siluro-Devonian plutons. Carboniferous low- temperature metamorphic effects
further east are best recognised from folded and thrust relicts of the Mulga Downs
Group in the Bourke area (Glen et al., 1996). A possible Carboniferous age cannot be
excluded for some of the least deformed felsic and andesite intrusives in the Bourke
and Cobar sheet areas.
20
5. Neotectonism
The Kanimblan Orogeny converted the LFB into a neocraton, and subsequent Late
Carboniferous-Holocene sedimentation has been of platformal character (Scheibner and
Basden, 1996) with some reactivation of the Palaeozoic structural framework during
Cainozoic time (Duk-Rodkin et al., 2003).
3.3 LOCAL STRATIGRAPHY AND INTRUSIONS
3.3.1 INTRODUCTION
The main Palaeozoic litho-tectonic units recognised in the study area are: The Older
Basement (Cambrian-Late Silurian); Cobar Supergroup (Late Silurian- late Early
Devonian); and the Mulga Downs Group (Early to Late Devonian).
The recognised rocks of the Older Basement in the study area are:
1. turbidites, chert and minor basic volcanics of the Girilambone Group;
2. intruded ultramafic and related rocks in the eastern part; and
3. a Silurian volcano- sedimentary sequence.
3.3.2 GIRILAMBONE GROUP
The Girilambone Group, as mapped on the Bourke, Cobar and Nymagee 1: 250,000
sheets (Byrnes, 1993; Suppel and Gilligan, 1993) crops out poorly to the east of Cobar
between Nymagee and Bourke (Figure 3.5). The Girilambone Group consists of
rhythmically bedded, poorly sorted, fine and coarse-grained quartzose sandstone with
subordinate quartzo-feldspathic sandstone, siltstone and chert, together with minor
intercalated basic volcanics and minor conglomerate, marl and serpentinite. This group
has undergone low- to medium- grade regional metamorphism, ranging from low
greenschist to low amphibolite facies (Gilligan and Byrnes, 1995).
The upper part of the Girilambone Group is characterised by a turbidite sequence
comprising medium to thickly bedded quartz-rich sandstone interbedded with siltstone,
slate, and minor chert beds occurring either as thin layers interbedded with slates or as
21

1 LegendI Dykes
I Matic-Ultramafic Intmsivos
Granitic Intrusive*
Early Devonian(Cot)« Supeigroup)
id ooar» graced kMmtt & and vacamaasics
Kopy)« GroupEarly Dev an tar Mt£or*i.»aroivy«a and anasor«
Siluro-Dovonianbnt/cat« trust packages o*'n> t coarse graved »tffmrts
Intrvisivo-rolatod body or homfelsod sodimcnt
I Harts Tank Beds (Silurian)I SaMsc»-s *itn imartI cry ca $■&<•:. * 3 * aw ,'0<rarici»v»
\ Siluro-OrdovicianI i « r n i f s
Mount Dijou Vo lea nicsFo m m , =raa'ao u u t aw awasoa-s. aauoxad sadanars
Girilambono Group (1)Saw*üMä e ».T OM-jr.f.nudatma. a * i , rar* ccr^c/ro-aiai aocanica aw imiaivaa.Girilambono Group (2)HgMy ca*ao acriss. m iaroslonaa and maw ntaat.-,a
Girilambono Group (3)-y r t ciwad iaoanecnww ma'c ddiai W ß EatVWeat fonatcr.
Girilambono Group (4)Sronoy aticaoua guana«
Magnetic structure or linear
(!) Aircore drill hole
V.tOO OOO map sheek key
Byrock Glenarift
Sussex Coolabah
Canbelego Herrn idale
VNew South Wales
Figure 3.5 Interpretive geological map of the study area showing drilling traverses (after Fleming et al., 2002).
22
mappable chert zones such as the Alandoon Chert and Whinfell Chert (Pogson, 1991).
The turbidites range from clay-rich shales to quartz-rich greywacke. Unmetamorphosecl
turbidites consist dominantly of clay minerals and quartz. Other minerals, notably
feldspar, are present in small amounts (Chappell, 1998). Chemical analysis of turbidites
of the Lachlan Fold Belt has shown that these are distinctively low in the elements o f
typical feldspar (i.e., Na, Ca and Sr; Wyborn and Chappell, 1986). The lower turbidite
sequence consists of well-bedded, thin to thick beds of meta-sandstone interbedded
with phyllite and schist. Metamorphosed limestone and calc-silicate rocks w ere
reported from Cobar (Rayner, 1969; Brunker, 1970; Feltone 1981) and Bourke (Byrnes,
1993) 1:250,000 sheets. The relationship of these lithological units to the Girilambone
Group is uncertain. It is thought that rather than being part of the Girilambone Group,
they represent another lithostratigraphic unit (of Silurian or Ordovician age and
possible volcanic 'arc’ affinity), which may have been imbricated with the turbidites
(Gilligan and Byrnes, 1995).
The Girilambone Group in the Hermidale, Coolabah and Sussex regions of the Cobar
1:250,000 sheet and the Bobadah-Nymagee 1:250,000 sheets is generally recognised as
undifferentiated thick and thin bedded, graded, parallel-laminated and ripple cross-
laminated, poorly sorted fine to coarse-grained, micaceous quartz sandstones
interbedded with quartzite, minor quartz feldspathic sandstone and thinly bedded chert,
quartz-sericite schist, quartz- muscovite- chlorite-biotite-albite-andalusite schist and
rare metabasic volcanics (Suppel and Gilligan, 1993). In the Byrock-Glenariff area of
the Bourke 1:250,000 sheet, the Girilambone Group is more recognisable as a group of
quartzose and quartz lithic sandstone, pelite and chert, minor intercalations of
polymictic conglomerate, carbonate-rich rocks, calc silicate homfels and marble, and
some magnetite-rich schist (Byrnes, 1993). A minor occurrence of Alandoon Chert has
also been recorded from the Hermidale area (Chan et ai, 2002).
3.3.3 ULTRAMAFIC AND RELATED ROCKS
Two main types of ultramafic rocks occur in the study area. The Honeybugle Complex
consists of hornblende pyroxenite, hornblendite, serpentinite, gabbro, syenodiorite,
quartz norite, monzogabbro and monzonite (Byrnes, 1993). This complex trends north-
westerly (Gilligan and Byrnes, 1995), and has been recorded from the southeastern
23

comer of the Hermidale sheet (Chan et al., 2002). Serpentinised ultramafic rocks a re
recorded at Miandetta on the east edge of the Hermidale sheet (Chan et al., 2002}.
These rocks are interpreted as the northern extension of the Alaskan type intrusive be lt
developed to the south (Elliott and Martin, 1991).
3.3.4 SILURIAN VOLCANO- SEDIMENTARY SEQUENCE
A Silurian volcano- sedimentary sequence consisting of felsic volcanics intercalated
with a sedimentary sequence forms a poorly known belt of rocks in the vicinity of Harts
Tank north of Nymagee (Gilligan and Byrnes, 1995). In the study area the Silurian
Harts Tank Beds were recorded at Rainbow Ridge, These beds comprise a complex
sequence of fine- grained sandstone, siltstone, phyllite, black graphitic shale, chert,
rhyodacitic volcaniclastics and minor related andesitic lavas and tuffs (Pan Australian
Mining Ltd, 1986; Chan et al., 2002). The widespread geochemical anomalies
associated with this sequence suggest a Silurian igneous association (Gilligan and
Byrnes, 1995).
3.3.5 COBAR SUPERGROUP AND RELATED INTRUSIVES
The Cobar Supergroup comprises a sedimentary and volcanic sequence deposited in the
Cobar region during the Early Devonian. Sedimentation varied from shallow water
shelf deposition of the Kopyje, Mouramba, Winduck and Walter Range shelves to
deeper water turbidite deposition represented by the Cobar Basin, Mount Hope, Rast
and Melrose Troughs (Glen, 1985). The only group that has been definitely recorded
from the study area is the Kopyje Group (Chan et al., 2002).
The Cobar Supergroup overlies older basement rocks with regional unconformity
/nonconformity or with a faulted relationship. Minor terrestrial sedimentation is
preserved at the base of the sequence in the marginal area of the Cobar Supergroup.
Volcanism was mainly submarine but with some subaerial accumulations on shelf areas
(Suppel and Gilligan, 1993). The Supergroup was deposited in a fault- controlled basin,
and troughs developed as a result of rifting at the beginning of the Early Devonian
24
(Glen, 1985, 1990). The known margins of the basin and troughs were north-nortk
westerly to northerly trending basement fractures (Suppel and Gilligan, 1993).
The major volcanic centres related to the Babinda and Majuba Volcanics contain thick
accumulations of felsic pyroclastics, consisting largely of ashflow and airfall tuffs with
rhyolite and dacite flows and minor tuffaceous siltstone. In the study area the Babinda
Volcanics, which form a series of hills, and the Florida Volcanics were recorded from
the southwest comer of the Hermidale sheet and east of Canbelego respectively (Chan
et al., 2002).
3.4 ECONOMIC GEOLOGY AND STYLES OF MINERALISATION
The central western region of New South Wales is one of the richest mineral provinces
in the Lachlan Fold Belt. Mining commenced in the Cobar area when copper was
discovered in 1870 in a waterhole at the site of the Great Cobar Copper Mine. Later, the
Cobar Mining Field became one of Australia’s main sources of copper. Gold mining in
the area started soon afterwards at the Great Cobar, the New Occidental, New Cobar,
Chesney, Mt Boppy, Mt Drysdale and Peak mines (Stegman and Stegman, 1996). The
major deposits occur near Cobar, around Girilambone, Nymagee and Canbelego.
Metallogenic maps with the mineral deposit sites have been compiled by Byrnes
(1993), Suppel and Gilligan (1993) and Gilligan and Byrnes (1995). The major
mineralisation styles of the region were summarised by Chan et al. (2001, 2002).
The mineral deposits in the Cobar-Girilambone region can be grouped according to
lithostratigraphic host units, unless they are related to granitoids, as follows:
1. Deposits related to the Girilambone Group.
2. Deposits related to the Cobar Supergroup.
3.4.1 DEPOSITS RELATED TO THE GIRILAMBONE GROUP
The Girilambone Group contains strongly deformed sequences with probable
juxtapositioning of different crustal blocks and sequences (Glen and Fleming, 2000).
Some of the rocks assigned to the Girilambone Group exhibit evidence of multiple
deformation. Minor puckering is common and in places chevron kinking is well
25
developed (Byrnes, 1993). The age of the Girilambone metasedimentary an d
metavolcanic rocks is thought to be Cambro- Ordovician, but some probable Late
Silurian- Early Devonian sedimentary units have probably been infaulted (Chan et al
2001). The main mineral deposits in the Girilambone terrain are predominantly o f
copper and gold.
3.4.1.1. GIRILAMBONE
The Girilambone copper deposit is the most significant (124,000 t Cu) deposit of this
type. It occurs 5 km west of Girilambone (Figure 3.6) and is hosted by chlorite-sericite
schists and the banded quartzite member of the Caro Schist Formation, the basal
formation of the Girilambone Group (Shields, 1996). Copper mineralisation at this site
occurs mainly as strongly folded layers and bands or lenses of sulfide in quartzite, and
as disseminated sulfides within chloritic schists. The occurrence of quartzite as the
dominant host rock and the layered style of sulfide mineralisation suggested to early
workers that the deposit represents a deformed, stratiform volcanogenic massive sulfide
deposit of possibly “Besshi” type. The dominant quartzite host rocks were possibly
exhalative chemical sediments (Shields, 1996; Chan et al., 2001). The main primary
sulfides are pyrite and chalcopyrite with secondary chalcocite developed in partly
oxidised ores. Malachite, azurite, cuprite and native copper occur in the main oxidised
zone, while rare phosphate minerals are reported from the upper section of the oxide
zone (Shields, 1996). Secondary processes, including economically significant
oxidation, supergene enrichment and leaching extend to 65, 45, and 30 metres below
the surface respectively (Gilligan and Byrnes, 1995). Alternative ore genesis models
suggest that the Girilambone deposit is a structurally controlled, epigenetic vein and
lode system (Chan et al., 2001).
3.4.1.2 TRITTON
The Tritton deposit is located 65 km NW of Nyngan and 20 km SW of the Girilambone
mine (Figure 3.6). It is a structurally controlled, sediment-hosted, copper deposit
discovered in 1995 (Tritton Resources Ltd, 2003). The deposit is hosted by a part of the
Girilambone Group, which consists of pelitic schists, mafic schists, greywackes and
quartzites. It does not crop out. The total resource is about 11 million tonnes of 2.8 wt
% copper at a lwt % cut-off (Nord Pacific Ltd, 1998). The deposit composes two
26
distinct en-echelon lenses of massive, mainly copper sulfide mineralisation, whicTi
plunge to the SE. Copper is primarily present as chalcopyrite. Gold occurs various with
hematite-impregnated schist, gossans, parent sulphides, copper ore and possibly quarts
veins (Fogarty 1996; Register of Australian Mining, 2003/2004).
Mineralisation occurs in three zones, upper, central and lower, which are continuous fo r
up to 450 m in strike length, up to 35 m wide and open at depth below 1000 m
(Fogarty, 1998). Mineralisation in the upper zone is hosted by a quartzite unit and
occurs approximately 180 m below the present land surface (Fogarty, 2001). Primary
mineralisation consists of massive pyrite and chalcopyrite, occurring as pipe-like
massive sulfide zones. The lower zone consists of massive and banded pyrite -
chalcopyrite lenses in chloride and semi-pelitic schist immediately overlying
carbonated mafic schist. Chlorite, epidote and carbonate alteration assemblages are also
common throughout the Tritton deposit, with siderite alteration in the hanging wall
closely associated with sulfide mineralisation (Berthelsen, 1998). Unlike the nearby
Girilambone deposits, little secondary mineralisation is developed within the weathered
profile of the Tritton copper deposits (Ackerman and Chivas, 2004).
3.4.2 DEPOSITS RELATED TO THE COBAR SUPERGROUP
3.4.2.1 CANBELEGO -MOUNT BOPPY
Gold mineralisation occurs near Canbelego (Figure 3.6) as free gold or associated with
chalcopyrite or iron-rich sphalerite. The host rocks are laminated quartz-mica schists,
phyllite, siliceous breccia, lithic sandstone, calcareous siltstone, and polymictic
conglomerate of the Early Devonian (Kopyje Group). The style of mineralisation is
quartz-vein stockworks in brecciated host rocks. Gilligan (1982) considered the
deposits to be of volcanic exhalative origin associated with local volcanism. The
primary ore minerals are sphalerite, galena and pyrite, whereas the main secondary
minerals are limonite and hematite.
The major Mt Boppy deposit (14.2 t of produced gold) is hosted by a conglomeratic
unit of the Baledmud Formation, near its unconformable boundary with the underlying
Girilambone group. The oxidation in the deposits extends to 91 metres and other
27
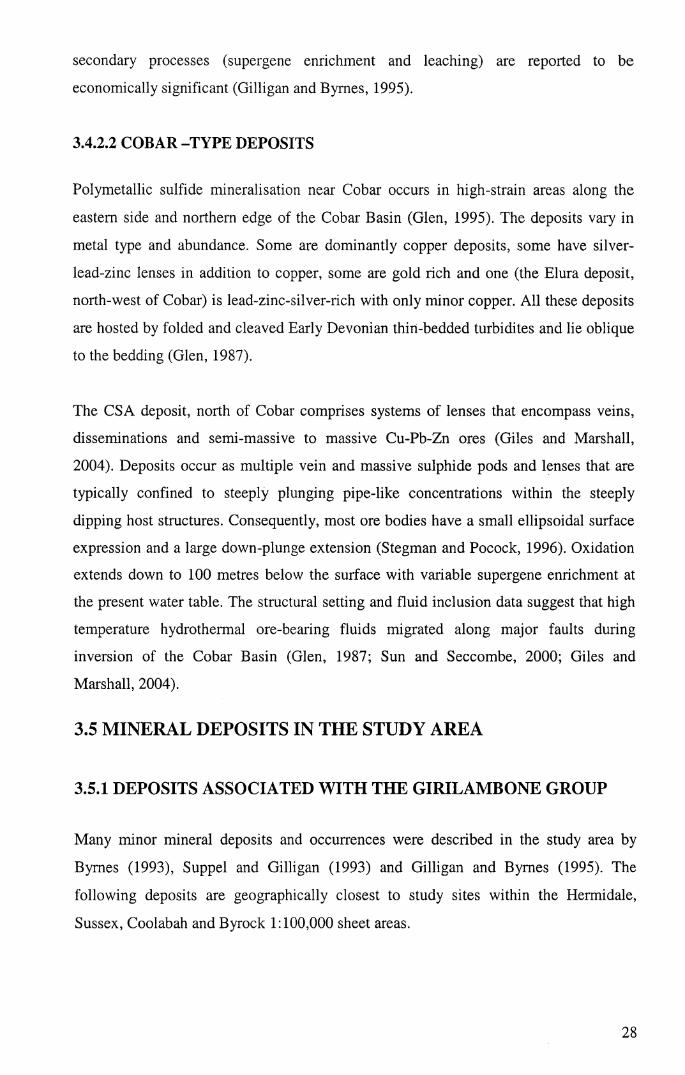
secondary processes (supergene enrichment and leaching) are reported to be
economically significant (Gilligan and Byrnes, 1995).
3.4.2.2 COBAR -TYPE DEPOSITS
Polymetallic sulfide mineralisation near Cobar occurs in high-strain areas along the
eastern side and northern edge of the Cobar Basin (Glen, 1995). The deposits vary in
metal type and abundance. Some are dominantly copper deposits, some have silver-
lead-zinc lenses in addition to copper, some are gold rich and one (the Elura deposit,
north-west of Cobar) is lead-zinc-silver-rich with only minor copper. All these deposits
are hosted by folded and cleaved Early Devonian thin-bedded turbidites and lie oblique
to the bedding (Glen, 1987).
The CSA deposit, north of Cobar comprises systems of lenses that encompass veins,
disseminations and semi-massive to massive Cu-Pb-Zn ores (Giles and Marshall,
2004). Deposits occur as multiple vein and massive sulphide pods and lenses that are
typically confined to steeply plunging pipe-like concentrations within the steeply
dipping host structures. Consequently, most ore bodies have a small ellipsoidal surface
expression and a large down-plunge extension (Stegman and Pocock, 1996). Oxidation
extends down to 100 metres below the surface with variable supergene enrichment at
the present water table. The structural setting and fluid inclusion data suggest that high
temperature hydrothermal ore-bearing fluids migrated along major faults during
inversion of the Cobar Basin (Glen, 1987; Sun and Seccombe, 2000; Giles and
Marshall, 2004).
3.5 MINERAL DEPOSITS IN THE STUDY AREA
3.5.1 DEPOSITS ASSOCIATED WITH THE GIRILAMBONE GROUP
Many minor mineral deposits and occurrences were described in the study area by
Byrnes (1993), Suppel and Gilligan (1993) and Gilligan and Byrnes (1995). The
following deposits are geographically closest to study sites within the Hermidale,
Sussex, Coolabah and Byrock T. 100,000 sheet areas.
28
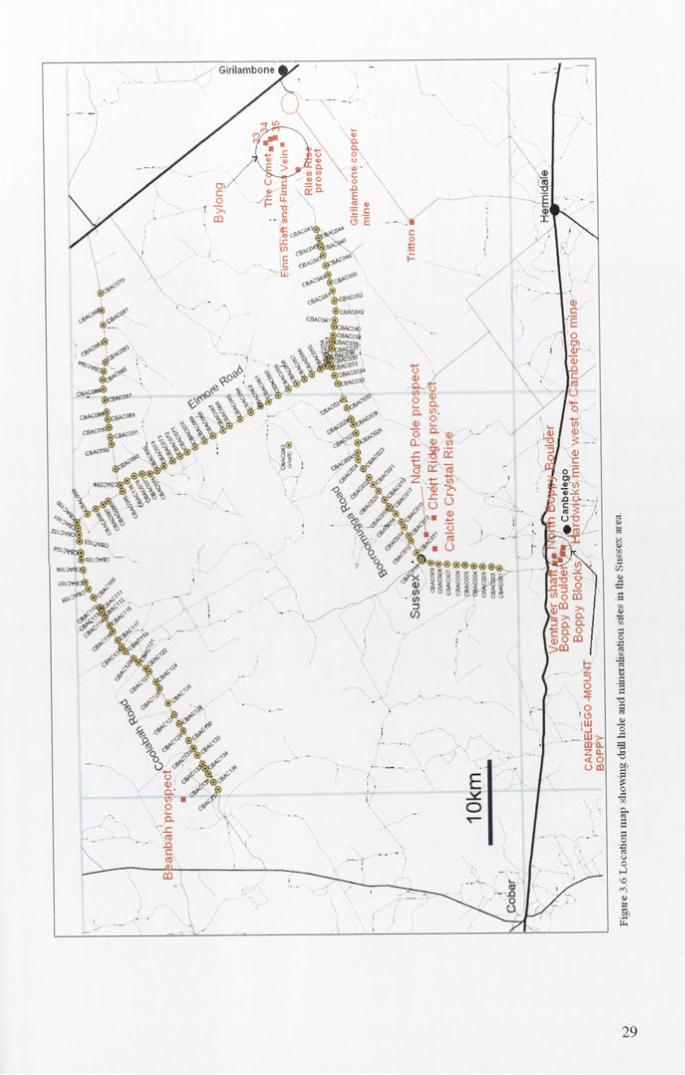
29

3.5.1.1 BUDGERY MINE
The Budgery deposit is located about 10 km to the northwest of Hermidale. It consists
of a pipe-like copper sulfide orebody that plunges south- southeast at 45°. It contains a
20 m vertical interval above the water table in which rich ores, both supergene
sulphides and oxide masses, were found (Gilligan and Byrnes, 1995). The deposit i s
associated with mafic rocks of the Girilambone Group. Drill hole CBAC151 is located
1.5 km northwest of the Budgery Mine (Figure 3.7).
3.5.1.2 BYLONG
Byrnes (1993) identified the Riles Rise prospect (Fe), the Comet (Au) and the F inn
Shaft and Finns Vein (Au) gold and ironstone deposits and three other unnamed
deposits numbered 33, 34 and 35 on the Cobar metallogenic map in the Bylong area
about 30-50 km W-NW of Girilambone. These small gold workings are mostly on iron-
stained quartz veins developed along fractures and schistosity. The veins vary from 2-5
cm to 15-25 cm wide (Gilligan and Byrnes, 1995). These deposits are hosted by schist
of the Girilambone Group. The closest drill hole to this area is CBAC 43, located about
25 km to the southwest (Figure 3.6).
3.5.1.3 CALCITE CRYSTAL RISE, NORTH POLE PROSPECT AND CHERT RIDGE PROSPECT
These prospects are located south of Booroomugga Road (close to drill holes CBAC8-
12) about 5 km southeast Sussex (Figure 3.6), and are considered to comprise a
stratigraphic trend, containing possible syngenetic mineralisation (Gilligan and Byrnes,
1995).
Calcite Crystal Rise (Pb) consists of two parallel gossanous quartz veins, which are
present in weakly-mineralised metasediment of the Girilambone Group. The best auger
hole values in this prospect showed 1700 ppm Pb, 390 ppm Zn and 350 ppm Cu
(Gilligan and Byrnes, 1995).
The North Pole prospect (Pb, Au) occupies a fault or shear zone with fractured chert,
quartz veining and iron staining. There is some minor gossanous development. Low
anomalous silver is widespread and occurs in both chert and ironstone. Maximum base
metal values recorded from the gossanous ironstone are 4000 ppm Cu, 6000 ppm Pb
and 2900 ppm Zn (Gilligan and Byrnes, 1995).
30
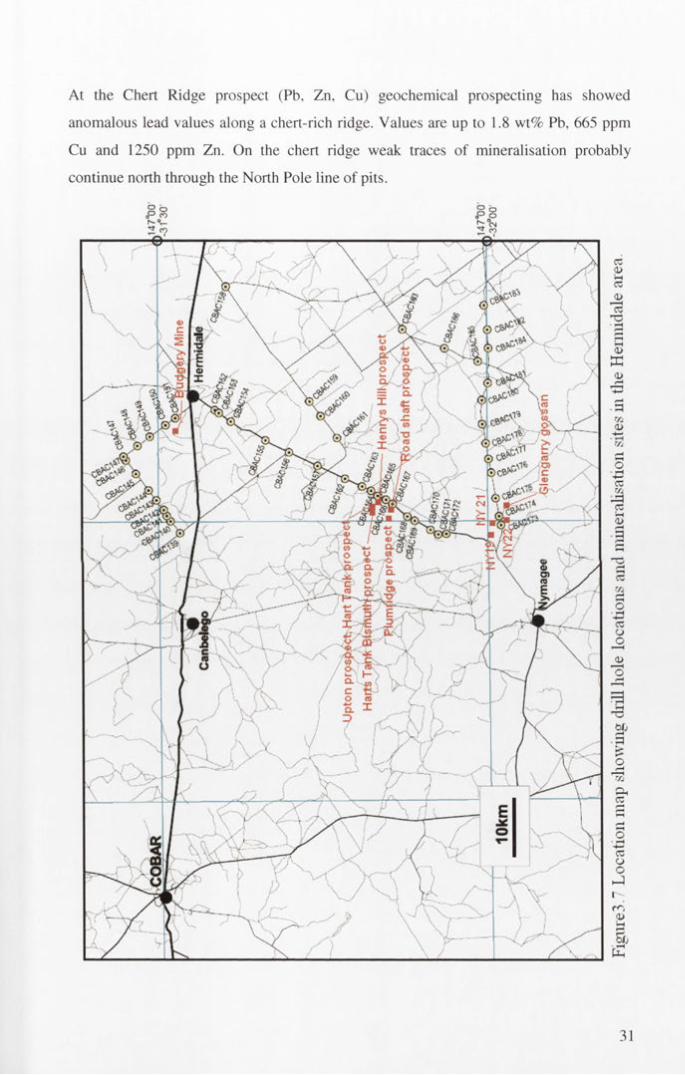
At the Chert Ridge prospect (Pb, Zn, Cu) geochemical prospecting has showed
anomalous lead values along a chert-rich ridge. Values are up to 1.8 wt% Pb, 665 ppm
Cu and 1250 ppm Zn. On the chert ridge weak traces of mineralisation probably
continue north through the North Pole line of pits.
31

3.5.1.4 MOUNT DIJOU - BALI) HILLS
Deposits in the Mt Dijou-Bald Hills area are associated with deformed mafic volcanic
rocks (including pillow lavas) and enclosing metasediments. Mineralisation appears to
be structurally controlled, occurring in fault breccias, quartz veins and lodes with
associated silicification and minor sulfides (Byrnes, 1993). Early descriptions of the
deposits (gold and silver) refer to mineralisation occurring in horizons or jasper-
ironstone lodes, probably reflecting near surface oxidised portions of the
mineralisation. Mafic units (dykes or interbedded volcanics) were recorded in nearby
aircore holes (McQueen, 2004a). Drill holes CBAC 199-202 are located close to the
Mount Dijou-Bald Hill area (Figure 3.8).
3.5.2 DEPOSITS RELATED TO SILURIAN GRANITOIDS
3.5.2.1 BEANBAH PROSPECT
The Beanbah prospect is an old working located northeast of Coronga Downs and
related to Silurian granitoids in the Beanbah area. It is hosted by silicified
metasediments of the Girilambone Group, which have been intruded by porphyritic
rocks and the Beanbah Granite. Quartz veining and silicification are common, with
anomalous values of Mo, Sn, W and locally Cu, Pb and As (De Ross, 1978). Maximum
rock chip values from the prospect are 0.35 wt% Cu, 1.28 wt% Pb, 10.2wt% As, 410
ppm Zn, 95 ppm Ag, 70 ppm Sn and 2500 ppm Mo (Gilligan and Byrnes, 1995). In the
present study CBAC 137 is the closest drill hole to this deposit (Figure 3.7).
3.5.3 DEPOSITS IN UNNAMED SILURIAN VOLCANO - SEDIMENTARY SEQUENCES
The following mineralisation sites are located to the northwest of Rainbow Ridge and
close to the studied drill holes CBAC 165, CBAC 166 and CBAC 167 in the Harts
Tank area:
Harts Tank Bismuth prospect Bi (Cu, W);
Upton prospect, Hart Tank prospect Zn, Pb, (Cu, W);
Bills Retirement, Au;
Henrys Hill prospect Cu (Zn);
32
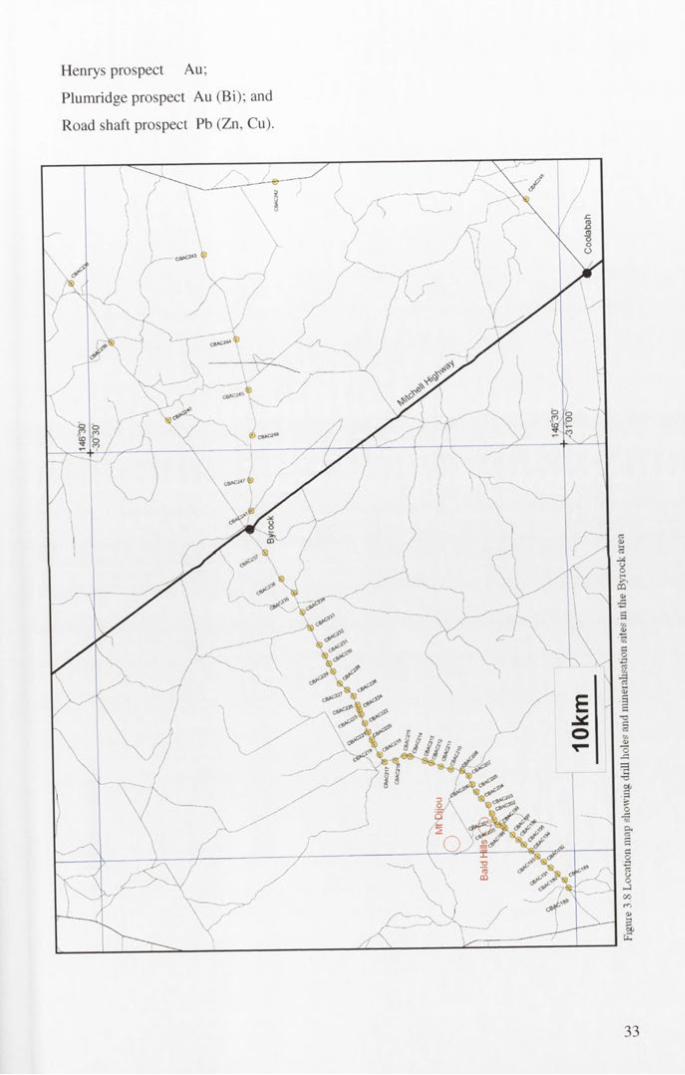
Henrys prospect Au;
Plumridge prospect Au (Bi); and
Road shaft prospect Pb (Zn, Cu).
33
3 S
Loc
atio
n m
ap s
how
ing
chill
ho

Gilligan and Byrnes (1995) recorded these deposits within unnamed Silurian volcano —-
sedimentary sequences. The Harts Tank area was originally prospected for gold an<d
Pan Australian Mining Ltd explored the area for base metals and gold in the late 1980s
(Pan Australian Mining Ltd, 1986). The geochemical anomalies are mainly associated
with ferruginous siliceous outcrops. The gold values are mostly below lg/t. Bismuth
was reported from a small fault zone passing through the Harts Tank Bismuth prospect
and north of the Upton prospect (Gilligan and Byrnes, 1995).
Mineralisation at Plumridge is hosted by intermediate volcanics and greenschist o f
Canbro-Ordovician age. The host rocks in the Road shaft prospect are greenschist felsic
volcanics, interbedded with Canbro-Ordovician sedimentary rocks. Rock samples
contain up to 325 ppm Cu and 2660 ppm Zn. Some ultra-silicified pyritic dolomite
contains up to 0.32 ppm Au, 6550 ppm Pb and 830 ppm As. Hydrothermal alteration is
predominant both at this prospect and Henrys Hill prospect (Gilligan and Byrnes,
1995).
A major concentration of gold and base metals occurs in and around Canbelego (Figure
3.6). The Mount Boppy mine was one of the major producers in the state early last
century. In addition, there are numerous smaller deposits that were prospected or mined
around this area. The following deposits are the closest to the study area:
The deposit occurrences in the Canbelego area are related to the basal part of the
Baledmund Formation or to the fault zone at or near the Girilambone Group basement-
Baledmund Formation cover contact. The Venturer shaft and Boppy Boulder deposits
occur as veins hosted by Early Devonian interbedded sedimentary rocks, greenschist,
and phyllite. Metaquartzite, greenschist and conglomerate host the North Boppy
Boulder and Boppy Blocks deposits. The Hardwicks deposits mainly occupy a fault or
3.5.4 DEPOSITS IN THE COBAR SUPERGROUP
Venturer shaft
Boppy Boulder
Au;
Au (Ag, Pb);
Fe (Mn, Au);
Fe, Mn (Au, Pb, Zn); and
Au, Mn (Ag, Zn, Co).
North Boppy Boulder
Boppy Blocks
Hardwicks mine west of Canbelego mine
34
shear zone and are hosted by conglomerate (Gilligan and Byrnes, 1995). In this study
CBAC 1 is the closest borehole to this site (Figure 3.6).
3.5.4.1 GLENGARRY GOSSAN AND RELATED DEPOSITS
The Glengarry Gossan and related deposits (coded as NY 19, NY21, and NY22 in
Nymagee Mineral data sheet; Suppel and Gilligan, 1993) are located in the
northwestern comer of the Bobadah and northeastern comer of the Nymagee (100 000)
sheets. The gold and /or silver deposits in this area are concentrated along veins in
felsic volcanic rocks, except NY 19, which occurs in siltstone of the Baledmund
Formation of the Kopyje Group. The following mineral deposits were described by
Suppel and Gilligan (1993) from this area:
NY19 Pb, Au (Cu, Ag);
NY 21 Au;
NY22 Au; and
Glengarry gossan Pb, Cu, Zn (Ag).
The primary and secondary minerals of these deposits are pyrite and iron or manganese
oxides, respectively. In this study drill holes CBAC 173, CBAC 174 and CBAC 175 are
close to these deposits (Figure 3.7).
35
4. CHAPTER FOUR: SAMPLING METHODOLOGY
A total of 247 drill holes (138 for Sussex-Coolabah, 49 for Hermidale, and 60 for the
Byrock sheets areas) were drilled in the study area using a small 6-wheel aircore rig
supplied by Geological Ore Search, Cobar. The drilling was conducted along roadside
traverses with holes generally spaced at 2-4 km. In some cases the spacing ranged from
1-8 km. Depth of drilling ranged from 6-82 m. Standard drill log sheets combining
requirements for both CRC LEME and NSW DPI were used. Chip tray samples were
collected for every metre for the first ten metres then 2 metres thereafter.
Approximately 4 kg samples were taken for geochemical analysis every 1 m for the
first 10 metres and then composite samples were collected every 1-3 metres until the
end of hole. The water table level was noted in the field at the time of drilling (Chan et
al, 2001; 2002, Fleming and Hicks, 2002). Samples were taken with a PVC sample
spear from bagged bulk samples collected by cyclone on the drill rig. Samples were
collected by the CRC LEME and NSW DPI sampling team.
Byrock and Hermidale samples were analysed for 28 elements (Ag, Al, As, Ba, Be, Bi,
Ca, Cd, Co, Cr, Cu, Fe, K, Mg, Mn, Mo, Na, Ni, P, Pb, S, Sb, Sr, Ti, V, W, Zn and Zr)
using Inductively Coupled Plasma Atomic Emission Spectrometry (ICP AES),
following a multi acid digest (HF- HNO3- HCO4 digestion, HC1 leach) using method
ME- ICP61 of ALS - Chemex Laboratories in Orange. Sussex samples were processed
by ANALABS of Cobar using ICP AES (method 1104) and ICP MS (method M104)
after multi acid digestion (Appendix 1). Although the analytical method used is not a
total analysis technique for some elements (Eaton at al., 1995), it gives a good first pass
indication of element abundances, particularly for most (but not all) elements of direct
interest as commodities or pathfinders (Chan et al, 2002). Each sample was also
analysed for Au by graphite furnace AAS analysis (method: AU-GF42 of ALS -
Chemex or F614 of ANALABS) following aqua regia digest and solvent extraction
(Appendix 1).
Four-kilogram samples were collected from the bottom 1 m interval of the 230 air core
holes. The depth of sampling varied from 3 m to 82 m, depending on the thickness of
the weathering profile and the depth of drill refusal. Samples were pulverised in a
36
tungsten carbide mill and analysed for major elements by X-ray fluorescence
spectrometry (XRF) and trace elements by inductively coupled plasma mass
spectrometry (ICP MS) at Geoscience Australia (Appendix 2).
Groundwater samples (1000 ml) were collected by stainless steel bailer (1 m length by
5 cm diameter, and 50 cm by 5 cm) from 14 drill holes (9 from the Byrock area, which
are CBAC217, CBAC218, CBAC219, CBAC227, CBAC231, CBAC235, CBAC242,
CBAC243 and CBAC248 and five drill holes CBAC150, CBAC154, CBAC158,
CBAC160 and CBAC173 from the Hermidale area). The water depth, electrical
conductivity (EC), pH, Eh and water temperature (T) were measured on site using
portable Orion™ electrodes and meters. All samples were collected after the third
bailing attempt to ensure that water representative of the groundwater in the hole was
being considered. Water samples were filtered with 0.45/am filters and separated into
500 ml for cation analyses (acidified with 2 ml concentrated HNO3) and 500 ml for
anion analyses (unacidified). Sample handling was earned out with talcum-free non-
sterile latex gloves. All sampling bottles were new and rinsed three times with the water
to be sampled prior to collection of the actual sample. Chemicals were added using
glass or disposable polyethylene pipettes. The alkalinity of the unacidified samples was
measured by titration in the laboratory and cation and anion concentrations were
measured by conventional methods using ICP OES at the Bureau of Rural Science
(BRS), for major (Na, K, Ca, Mg, Si, Cl, S04) and trace elements (Al, Ba, Cu, Fe, Mn,
Sr, Zn; Appendix 3). Seven water samples from drill holes CBAC150, CBAC158,
CBAC160, CBAC173, CBAC 217, CBAC227 and CBAC231 were analysed for 36C1 at
the Department of Nuclear Physics of the Australian National University.
Manganese-rich grains and Mn-coated dark coloured grains (>1 mm diameter) from
five Mn-dominant intervals in the drill holes CBAC 176 (37-39 m), CBAC 177 (8-9 m,
13-15 m), and CBAC 180 (6-7 m, 7-8 m) were examined using JEOL 6400 scanning
electron microscope (SEM) and energy dispersive X-ray (EDX) analysis system
operating at 15 KeV in Australian National University.
The mineralogy of 34 samples were examined by X-Ray Diffraction (XRD) to identify
carbonate, manganese oxides and iron oxides minerals and the semi-quantitative
determination of the mineral abundance was achieved using SiroQuant software at the
37

Department of Earth and Marine Sciences of the Australian National Universit y
(Appendix 4).
Standard, blanks, replicates and duplicates were used to ensure the accuracy a n d
precision as described in Chapter 5 (Appendix 5).
38

5. CHAPTER FIVE: DATA ANALYSIS TECHNIQUES
5.1 INTRODUCTION
Data analysis involves condensing large volumes of information into a form that is m ore
concise, but no less accurate, from which conclusions and /or decisions can be m ade
more easily and efficiently. Over the last century a large body of literature on th e
statistical treatment of geochemical data has been published and computer packages have
been developed, with some designed for the peculiarities of geochemical models an d
processes (e.g., Rollinson, 1993; Davis, 2002).
The patterns of geochemical data are generally complex because they are controlled by
different geological processes that influence the material from which the geochemical
samples are collected. Since Krumbein and Graybill (1965), statisticians have tried to
develop improved methods to analyse geological variables. The particular nature of these
variables, including the ubiquitous relationship between the location where a
measurement is made and the value of this measurement, has required the development
of appropriate statistical methods (Davis, 2002). Some non-statistical methods e.g.,
exploratory data analysis, element ratio, bivariate and triangle plots have also been used
to analyse geochemical variables (Rollinson, 1993).
In this study, different media, such as regolith (transported and residual) and groundwater
are sampled and the samples are analysed for their chemical and mineralogical contents
(e.g., by ICP AES & MS, XRF and XRD). The geochemical data are derived from
particular locations in space and time and are characterised by sample weight, sampling
densities, sample distributions and the analytical techniques applied.
This chapter includes techniques that are used to analyse the collected geochemical data
to:
• identify the distribution pattern and outliers ;
• avoid closure and investigate data transformation and quality control; and
• identify element associations using multivariate statistical methods (cluster analysis
(CA) and principal component analysis (PCA).
39

Data in this study, as generally in geochemical analysis (Helsel and Hirsch, 1992), a re
characterised by:
• a lower boundary of zero, no negative values are possible;
• presence of ‘outliers’, i.e. observations considerably higher or lower than many o f
the data;
• positive skewness and non-normal distribution; and
• censored data, reported only as below or above some threshold (e.g., detection
limit).
5.2 EXPLORATORY DATA ANALYSIS
Exploratory Data Analysis (EDA) is the manipulation, summarisation and display o f
data using simple arithmetic techniques to make them more comprehensible with the
intention of uncovering underlying structure in the data and detecting important
departures from this structure (Tukey, 1977; Kelly et al., 1992; Dale, 1995). EDA is an
approach philosophy for data analysis that employs a variety of techniques (mostly
graphical) to maximise insight into a data set, uncover underlying structure, extract
important variables, detect outliers and anomalies, test underlying assumptions, develop
conservative models, and determine optimal factor settings (e.g., Abonyi et al., 2004).
EDA is similar to classic statistical data analysis in that both start with a general
scientific problem and yield scientific conclusions. The difference is the sequence and
focus of the intermediate steps. For classic statistical analysis, the sequence is Problem
=> Data => Model => Analysis => Conclusions, whereas for EDA, the sequence is
Problem => Data => Analysis => Model => Conclusions (Dale, 1995;
NIST/SEMATCH, 2005). Accordingly for classical analysis, the data collection is
followed by the imposition of a model (e.g. normality, linearity, etc.) and the analysis,
estimation, and testing that follows are focused on the parameters of that model. For
EDA, the data collection is not followed by assuming a model but by analysis with a
goal of inferring what model would be appropriate (NIST/SEMATCH, 2005).
Most geochemical studies (Reimann and Filzmoser, 2000; Grunfeld, 2005) consider
using EDA as a first step in understanding the distribution of the measured variables
and a combination of different graphics of histogram, boxplot and a one dimensional
scattergram will give an excellent one-dimensional insight into the data.
40
In this study, data were analyzed using a mixture of both EDA and classic statistical
approaches (as well as other approaches e.g. multivariate analysis). Many graphical
techniques of EDA such as boxplots, scatter plots and ratio plots are proposed and used
to analyse the raw data to detect the outlier values (thresholds and anomalies), and to
discover the relationship between different major and trace elements in the regolith.
Classic statistics, such as mean, median and standard deviation are used in indicating
the quality (accuracy and precision) of the data and in estimating the background and
anomaly thresholds for the elements.
5,3 RECOGNITION OF OUTLIERS BY BOXPLOT
A boxplot consists of a rectangular box from first quartile (#0.25) to third quartile
(#0.75), with tick marks at the median (#0.5). The distance between the top and bottom
of the box is the interquartile range (IQR). The line in the middle of the box is the
sample median. If the median is not centred in the box, it is an indication of skewness.
The "whiskers" are lines extending above and below the box. They show the extent of
the rest of the sample set (unless there are outliers). The suspected outliers and extreme outliers are values that are more than 1.5 and 3.0 times the interquartile range away
from the top or bottom of the box respectively (Tukey, 1977). The plotted outlier points
may be the result of a data entry error, a poor measurement or an anomaly in the
measured data. The effectiveness of boxplots has been demonstrated in summarizing
the results of a field survey (Reese, 2005) and in processing the geochemical data of the
Cobar region (Cohen et al., 1996).
A single boxplot or multiple boxplots can be drawn together to compare multiple data
sets or to compare groups in a single data set. An example of a comparative application
of boxplot is given in Figure 5.1. Small boxes represent consistent values of elements,
whereas large boxes display a wide range of variation in element concentration.
Outliers are extreme high or low' measurements (outliers on the high side are more
common) that are sometimes referred to as “spurious” data because they are highly
divergent from the main population of data. Outliers may arise from matrix
interferences or errors in transcription, sampling technique, datacoding, analytical
methods and / or instrument calibration. Alternatively, what may appear to be outliers
41
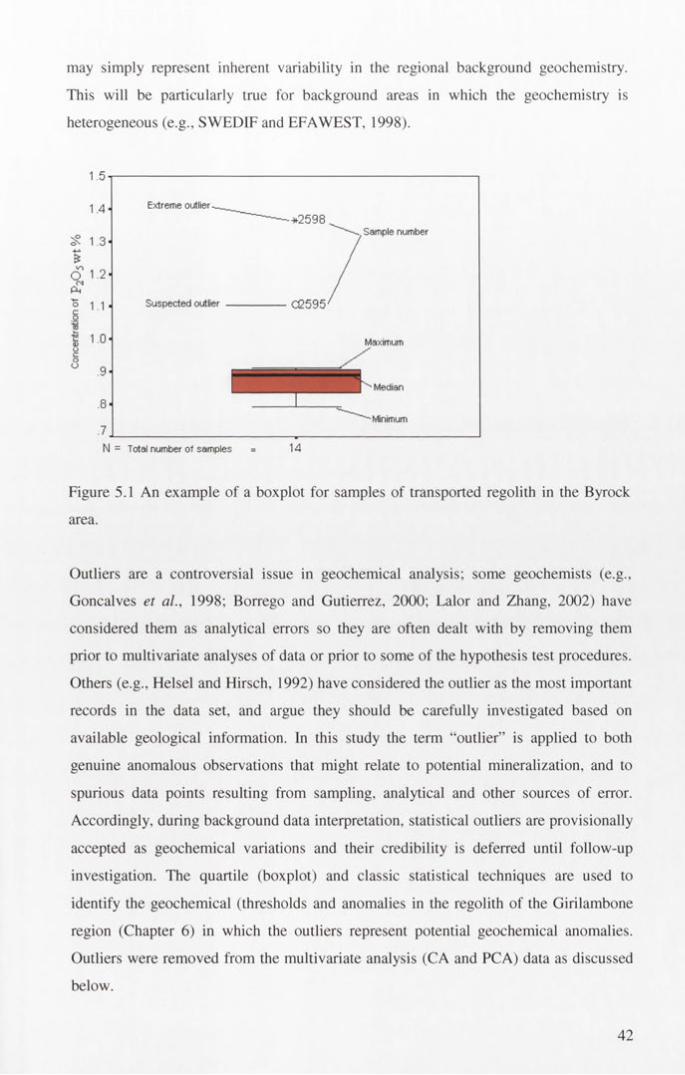
may simply represent inherent variability in the regional background geochemistry.
This w ill be particularly true for background areas in which the geochemistry is
heterogeneous (e.g., SWEDIF and EFAWEST, 1998).
1.5'
1.4 H
1.3 ■
1.2 ■
1.1 ■
1 .0 '
.9'
. 8 '
.7,N
Extreme outlier-
Suspected outlier
— -+2598
02595
Sample number
Maximum
Median
Minimum
Total number of samples
Figure 5.1 An example of a boxplot for samples of transported regolith in the Byrock
area.
Outliers are a controversial issue in geochemical analysis; some geochemists (e.g.,
Goncalves et al., 1998; Borrego and Gutierrez, 2000; Lalor and Zhang, 2002) have
considered them as analytical errors so they are often dealt with by removing them
prior to multivariate analyses of data or prior to some of the hypothesis test procedures.
Others (e.g., Helsel and Hirsch, 1992) have considered the outlier as the most important
records in the data set, and argue they should be carefully investigated based on
available geological information. In this study the term “ outlier” is applied to both
genuine anomalous observations that might relate to potential mineralization, and to
spurious data points resulting from sampling, analytical and other sources of error.
Accordingly, during background data interpretation, statistical outliers are provisionally
accepted as geochemical variations and their credibility is deferred until follow-up
investigation. The quartile (boxplot) and classic statistical techniques are used to
identify the geochemical (thresholds and anomalies in the regolith o f the Girilambone
region (Chapter 6) in which the outliers represent potential geochemical anomalies.
Outliers were removed from the multivariate analysis (CA and PCA) data as discussed
below.
42

5.4 TRANSFORMATIONS
Transformation is typically employed in geochemistry to de-skew data for use i n
modelling methods that assume normality of distribution. Employment o f
transformation is not merely an arbitrary choice, because serious problems can o ccu r
when procedures assuming symmetry, linearity or homoscedasticity (constant variance)
are used on data, which do not possess these required characteristics (Helsel a n d
Hirsch, 1992; Kotlyar et a l, 1998).
To normalise geochemical data, the most commonly used transformation is logarithmic,
because the lognormal distribution has long been recognised as a useful model in th e
evaluation of geological variables whose value distribution is often extremely skewed
(Rendu, 1988; Limpert et a l, 2001; Ohta et a l, 2004; 2005). However, a number o f
studies (e.g., Reimann and Filzmoser, 2000; Grunfeld, 2005) have shown that this has
not been a general rule of thumb when regional datasets are considered. Some
geochemical data rarely follow normal or even lognormal distributions (Reimann and
Filzmoser, 2000) and a practical problem remains that the lognormal model is often
only an approximation of the true distribution of geological data (Rendu, 1988).
The Girilambone geochemical data are not normally or log normally distributed. The
normal probability and detrended normal plots of the studied geochemical data
(element concentration) showed that the outliers make the distribution pattern of the
studied elements not normal (Appendix 8). Therefore, to avoid the “abnormal”
influences of these outliers on element association, and because some multivariate
analysis (i.e., PCA) are sensitive to outlier values (Davis, 2002) these outliers were
removed before multivariate statistical analysis. The data are also log-centred ratio
transformed to avoid the closure effect (as discussed below).
5.5 TRANSFORMATION TO AVOID CLOSURE
Geochemical data are typically reported as proportions (weight %, parts per million,
etc.). For a given observation, compositional proportions (i.e.; weight%) always sum to
a constant (100%). Closed data, by definition, are points of the simplex, which are a
43
part of n-dimensional real space. The elements of points on the simplex are vectors o f
real numbers that satisfy the constant sum constraint. Statistical measures, such a_s
measures of correlation and covariance can be misleading and can result in an incorrect
assessment of correlation or other measures of association (Davis, 2002). Aitchison
(1986) advocated the use of centred log-ratio transformations to overcome the effect o f
closure. The centred log-ratio transformation of an observation consists of taking the
logarithm of each variable after the variables have been divided by the geometric mean
calculated across all variables.
The log-centred ratio is useful because it maintains the concept of distance (i.e.;
Euclidean) between two compositions in the cluster analysis (Aitchison et al., 2000).
Also, closure can be avoided by utilising mass balance approaches based on fixing
volume, mass or concentration changes between samples of parent and daughter
lithologies. However, this is a restrictive approach and is impractical in the weathering
(regolith) environments where the equivalent fresh parent rock may be difficult to
obtain.
Another practical technique to remove closure effects is using element ratios (i.e.,
Mg/Ca, Al/Si, K/Al). This can be explained mathematically as follow:
Y ,/Y 2= (X,/X d )/(X2/Xd) .......................... (1)
Yi/Y2=Xi/X2 ............................. (2)
Where Yi and Y2 are the concentrations (weight % or mole %) of elements 1 and 2 in
the closed data, Xi and X2 are the pre closed amount of the elements 1 and 2
respectively, and Xd is the total sum of all element (1+ 2+3,....D)
In this study the effect of closure was largely avoided by using the log centred ratio.
This transformation is applied on the data of multivariate cluster analysis and principal
component analysis (Chapter 6), whereas ratios are predominantly used to identify the
parent materials (Chapter 8).
5.6 QUALITY CONTROL OF DATA
Exploration investment commonly hinges on the results and interpretation of
geochemical data. A measure of confidence of the data must be ensured, and this can be
44
obtained only from a reliable quality assurance/quality control (QA/QC) program,
which depends upon the quality of field sampling and laboratory analytical procedures.
An appropriate QA/QC program should minimize inconsistencies and uncertainties
within the data. Failure to monitor analytical quality may lead to incorrect estimation oT
thresholds and result in geochemical anomalies that are laboratory error and sampling
artefacts. The objectives of a QA/QC program are to:
• document the procedures and methods of sample collection, preparation and.
analysis;
• provide assurance as to reliability of analyses using replicate samples, cross-
laboratory checks;
• provide assurance as to the precision and accuracy from duplicate samples.
• provide assurance as to the accuracy from using recognized reference standards.
• provide reliable information regarding the interpretation of data with respect to the
behaviour of a mineral and its mineral component(s) during weathering.
Analytical quality control is essential in the initial stage of data analysis (Levinson,
1974). The principal indicators of data quality are their bias, precision and accuracy.
Bias is a consistent deviation of measured values from the true value, caused by
systematic errors in procedure that can be attributed to either the technique or the
laboratory’s use of the technique. Precision is the nearness with which measurements of
a given sample agree with each other. In other words it is a measure of the degree of
agreement among replicate analysis of a sample, usually expressed as the standard
deviation. Accuracy is a combination of bias and precision of an analytical procedure,
which reflects the closeness of a measured value to a true value (Clesceri et al., 1989).
Precision and accuracy are complex issues and are not the same for all elements and all
concentration levels (Nash et al., 2001).
Guides to analytical quality control (Plant et al., 1975; Fletcher, 1981) explain the
statistical basis of control and/or the precautions that must be observed. A
comprehensive account of the theory of error in geochemical data is given by Miesch
(1967). However, it does not give a detailed description of practical methods for
estimating the various forms of analytical error.
45

James (1970), Thompson and Howarth (1978) and Thompson (1983; 1992) described
the Statistical basis of analytical quality control, an approach to the estimation o f
analytical precision and the factors that need to be controlled in any analytical
procedure. These factors were classified to within-batch variations, between-batch
variations and overall accuracy. The within-batch variations are either random ,
uncontrolled variation that arises at every stage of analytical procedure, which can b e
quantified simply as within-batch precision, or are systematic changes within the batch.
They may become apparent as a change in accuracy, in the form of drift, a periodic
variation, or discontinuity. The between-batch variations represent changes in accuracy
between the batches or an additional source of variance, the between- batch precision.
The overall accuracy is the ability to have correct results of whole multi-batch analysis.
The purpose of a geochemical survey is to give a description of the geochemical
variation in sampling media within a region. Numerically this can be expressed in terms
of the natural “ geochemical variance” of the area. Geochemical information content is
diminished by the two processes of measurement: the act of taking a sample adds a
random error with “ sampling variance” and the act of chemical analysis adds another
random error with “ analytical variance” (Ramsey et al. 1992).
In this study, standards (9 tests by MB-6 standard and 9 tests STSD-2 standard of ALS
Chemex) and blanks were used to ensure the accuracy (Appendix 5). The analysis of
these standards showed that some elements (Be, P and Cd) significantly recorded
higher than the standard upper limits, whereas potassium, Fe and Ti values are lower
than the standard lower limit (Appendix 5). This possibly indicates analytical errors and
/or changes in the composition of the chemical standard.
Five replicates were used to investigate sub-sampling precision and analytical accuracy
and 65 duplicate (49 from Sussex-Coolabah, 6 from Hermidale and 10 from Byrock;
Appendix 5) samples have been used to estimate the precision of analysis in the three
batches of data. Replicates were used to calculate the standard error (standard deviation
(s) of the mean (y) and the probability or the confidence level of the data. Estimations
of uncertainty of the data are based on definition of the precision in geochemistry
(Thompson, 1983; Plouffe and Bond, 2003) as P = (2s/ y) * 100%, where the
coefficient of variation (CV), and the relative standard deviation are (s/ y) *100% and s/
46

y, respectively, and graphically by simply plotting the concentration of d ifferent
batches against each other (Table 5.1; Figure 5.2). Potassium, Bi, Sb and A u
concentrations show high variation and low precision, which are the result of the
analytical procedure (e.g., K & Sb, Chan et al., 2002) and/or variation in detecting lo w
concentrated trace elements (e.g., Au). Elements with low variation (<7%) such as A l,
Ba, Be, Co, Cr, Cu, Fe, Mg, Mn, Na, Ni, P, Pb, Sr, V, Zn and Zr (Table 5.1), indicate
high (> 93%) analytical precision. A significant similarity in sub- sample replicate
compositions indicates that these sub-samples are high-quality representatives of the
bulk composite sample.
Graphical correlation between the duplicates and original samples generally shows
significant correlation between the analysed elements (Figure 5.3), which indicates a
high analytical precision.
Table 5.1. Standard deviation (s), mean (y), coefficient of variation (CV) and precision
(P) of five replicate samples from CBAC150, Hermidale area. Silver, Mo, Cd, W, and S
are excluded from the data because they are below the detection limits. Bold numbers
(in Bi, Ca and Sb) represent half of detection limit.
S am ple A.u pp m M % A»sppm B a ppm B e pp m B i pp m C a % C o p p m Cr pp m C u ppm Fe % K %R1 0 004 11.16 12 824 4.3 4 0.01 2 96 33 5 3 7 2.21R2 0.004 11.46 11 833 4.7 1 0.01 2 104 36 5 49 1.11
R3 0.002 11.61 17 849 4.7 7 0.01 2 110 35 5.48 2.57
R4 0.002 10.13 13 760 4.7 6 0 .005 2 114 35 5 23 1.98
R5 0 0 0 2 9 7 8 14 716 4.8 6 0 .005 2 115 35 5 2 1 1.9
S 0.16 0.03 0.07 0.03 0.02 0.35 0.16 0.00 0.03 0.01 0.01 0.14
y 0.42 1.03 1.12 2.90 0.67 0.60 1.88 0.30 2.03 1.54 0.73 0.28
C V 39.12 3.24 6 4 2 1.08 2.81 57 88 8.77 0.00 1.60 0.90 1.48 50.21
p 78.25 6.48 12.83 2.16 5.62 115.76 17.54 0.00 3.20 1.80 2.96 100 4 1
S am ple M g % Mn ppm N a % Ni ppm P ppm Pb ppm Sb ppm Sr ppm T i% V ppm Zn ppm Zr ppmR1 0 5 2 67 0 0 9 24 574 32 6 41 0.13 124 84 93
R2 0.52 70 0 0 9 26 692 33 2.5 42 0.37 131 86 105
R3 0.53 70 0.09 26 667 32 2.5 44 0.34 130 86 106
R4 0.47 68 0 0 9 25 647 28 9 35 0.27 132 85 102
R5 0.45 65 0.09 25 645 26 2.5 34 0.31 131 84 103
S 0 0 3 0.01 0.00 0.01 0.03 0.04 0.26 0.05 0.18 0.01 0.01 0.02
y 3.70 1.83 2.95 1.40 2.81 1.48 0 .59 1.59 3.43 2.11 1 93 2.01
C V 0.86 0.74 0.00 1.03 1.08 3.03 4 5 .1 0 3.14 5.32 0.52 0 2 6 1.13p 1 71 1 4 9 0 0 0 2 0 7 2.17 6.07 90 19 6 2 9 10.64 1.03 0.53 2 2 6
47

■ R2R3
R5
Elements
ä 25
Elements
900
£ 600
Elements
Figure 5.2 Plots showing results of replicate analysis of major, minor and trace
elements for 5 replicates (sub-samples) from CBAC150 32-33m in the Hermidale area.
48

10000.000 -T
1000.000
100.000
10.000
1.000
♦ AI % - Fe % A Mn % x Mg % x Ca %• Na % + K % - P % - Ag <> As□ Ba □ Be o Cd x Co A Cr
0.100
0.010
0.0010.001 0.01 0.1 1 10 100 1000 10000
Original
Figure 5.3 Correlation between duplicate and original element concentrations in the
regolith of the Girilambone region shows a high correlation coefficient, r = 0.98. Data
are in ppm unless are nominated.
5.7 DETECTION LIMIT
The limit of detection is the lowest concentration, which can be measured by a specific
analytical method and is a function of the level of background noise relative to an
element signal (Norrish and Chappell, 1967). This value varies greatly from one
method to another and from one matrix (host rock material) to another (Levinson,
1974). The data less than the detection limit are known as left censored data (Last,
1988). Investigators apply various strategies to estimate values below the detection
limit (DL), including replacement of measurements below a DL with a single value, for
example DL, DL/2 or D1/V2 (Helsel, 1990; Homung and Reed, 1990). If the
distribution of measured data is log- normal, then the expected values of the missing
measurement are conditional on being less than the DL (Gleit, 1985).
In general, censoring means that observations at one or both extremes are not available
(Gleit, 1985). If censored data make up more than about 30%, the application of
parametric statistics may lead to unreliable results (Lubin et al., 2004). For less than
30%, a common and acceptable practice is for them to be converted to the value of half
49

of the detection limit (e.g. Ellis and Gilbert, 1980; Grunsky and Smee, 1999). This
method is widely used, but has no theoretical basis (Helsel, 1990). DL/2 was used as an
average value between the DL value and zero (Gleit, 1985). In this study, elements with
> 30% censored values are excluded from statistical analysis, whereas those with <30%d
are replaced by half of the detection limit.
5.8 CLUSTER ANALYSIS
The cluster analysis method divides a large number of objects into a smaller number o f
homogeneous groups on the basis of correlation structure (Hartigan, 1975). As an
explorative technique, cluster analysis provides a description of a reduction in the
dimension of the data. It classifies a set of observations into two or more mutually
exclusive unknown groups based on combinations of many variables. This analysis has
been used to group geological records (Hesp and Rigby, 1975; Guerzoni et al., 1996;
Goncalves, 1998; Maerz and Zhou, 1999; Bucker et al., 2000; Edwards et al., 2000;
Jerram and Cheadle, 2000; Zhou and Maerz, 2001), identify regional seismic events
(Young et al., 2001), group geochemical data (Roy, 1981; Goncalves and Ewert,
1998;Whiticar and Harris, 2000; Hwang et al., 2001; Lee et al., 2001; Zhang and Lalor,
2003; Reinders et al., 2003), and recognise the relationship of constituents and
geochemical associations (Baudo et al., 2000; Peruzzo and Busa, 2000; Popov, 2002)
and of background and contamination levels (Salman and Rukah, 1999; Hwang et al.,
2001) .
The purpose of cluster analysis is to assemble observations into relatively homogenous
groups or “clusters”, the members of which are at once alike and unlike members of
other groups. Clustering procedures can be classified into partitioning methods,
arbitrary origin methods, mutual similarity procedures and hierarchical clustering
(Davis, 2002). The hierarchical clustering techniques are most widely applied in the
earth sciences, probably because their development has been closely linked with
numerical categorisation of geological data.
Methods of hierarchical cluster analysis follow a prescribed set of steps as follows (e.g.,
Davis, 2002):
50

• collecting a data matrix whose columns stand for the objects (samples) to b e
cluster-analysed and whose rows are the attributes that describe the objects
(variables);
• optionally standardising the data matrix; and
• using the standardised data matrix to compute the values of resemblance
coefficients and measure the similarities among all pairs of variables and objects,
which results in a diagram called a tree, or dendrogram, that shows the hierarchy o f
similarities among all pairs of variables and objects.
5.8.1 AMALGAMATION OR LINKAGE RULES
At each step of the hierarchical process, the value of an objective function or clustering
criterion must be computed to determine which two groups are to be joined. The
objective function is usually based on a measure of proximity between groups. In other
words it is necessary to identify a linkage or amalgamation rule to determine when two
clusters are sufficiently similar to be linked together. The common linkage methods
(e.g., Sokal and Sneath, 1963; Johnson and Wichem, 1982; Davis, 2002) can be
summarised as follows:
• single linkage (nearest neighbor);
• complete linkage (furthest neighbor);
• unweighted pair-group method using arithmetic averages (UPGMA);
• weighted pair-group method using arithmetic averages (WPGMA);
• unweighted pair-group method using the centroid average (UPGMC);
• weighted pair-group method using the centroid average (WPGMC); and
• Ward’s method.
In this study, Ward’s method (Ward, 1963) is used to identify the linkage between
clusters. This method consists of using the analysis of variance approach to evaluate the
distance between clusters by minimizing the sum of squares of any two hypothetical
clusters that can be formed at each step. The advantages of this technique are i) any
coherent group will not split among different categories, ii) the methodology readily
allows consideration of all variables and iii) the boundaries between clusters fall, by
definition, in regions of multivariate space where there are few points. If this
51
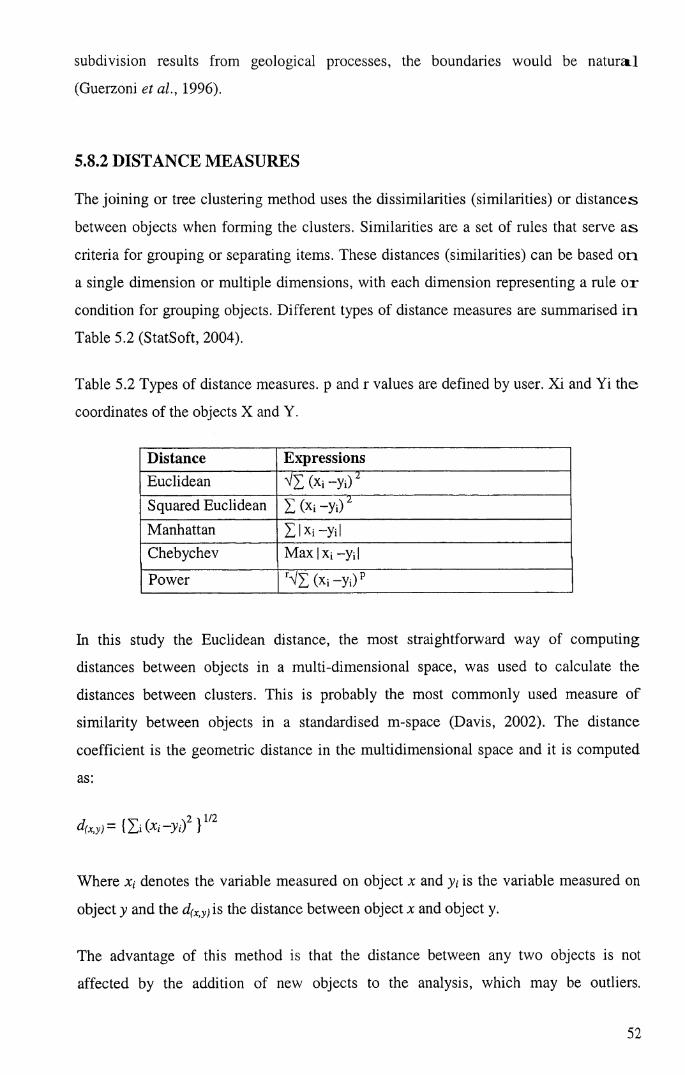
subdivision results from geological processes, the boundaries would be natura.]
(Guerzoni et al., 1996).
5.8.2 DISTANCE MEASURES
The joining or tree clustering method uses the dissimilarities (similarities) or distances
between objects when forming the clusters. Similarities are a set of rules that serve a s
criteria for grouping or separating items. These distances (similarities) can be based on
a single dimension or multiple dimensions, with each dimension representing a rule o r
condition for grouping objects. Different types of distance measures are summarised in
Table 5.2 (StatSoft, 2004).
Table 5.2 Types of distance measures, p and r values are defined by user. Xi and Yi the
coordinates of the objects X and Y.
Distance ExpressionsEuclidean VX (x,-y,VSquared Euclidean X (xi -yi)2Manhattan X 1 Xj -ydChebychev Max | X; -yd
Power WX (x,-y,)p
In this study the Euclidean distance, the most straightforward way of computing
distances between objects in a multi-dimensional space, was used to calculate the
distances between clusters. This is probably the most commonly used measure of
similarity between objects in a standardised m-space (Davis, 2002). The distance
coefficient is the geometric distance in the multidimensional space and it is computed
as:
d(X,y )= (XiCXi-yd2 }1/2
Where x,- denotes the variable measured on object x and y,- is the variable measured on
object y and the d(Xiy) is the distance between object x and object y.
The advantage of this method is that the distance between any two objects is not
affected by the addition of new objects to the analysis, which may be outliers.
52

However, the distances can be greatly affected by differences in scale among the
dimensions from which the distances are computed. Therefore the data must be
standardised by subtracting the column means and dividing by the column standard
deviation prior to computing distance measurements (Davis, 2002). This ensures that
each variable is weighted equally. Otherwise, the distance will be influenced most
strongly by the variable that has the greatest magnitude.
5.9 PRINCIPAL COMPONENT ANALYSIS
Principal component analysis (PCA) is a data reduction technique designed to reduce a
large number of variables to a small set of underlying components that summarise the
essential information contained in the variables. A number of steps comprise the PCA
procedure. These are computation of the correlation matrix (to determine the
appropriateness of the factor (component) analytical model, component extraction (to
determine the number of components that are necessary to represent the data and
rotation (to make the component structure more interpretable; Coakes and Steed, 2001).
PCA uses measures of association such as covariances or correlations to produce the
principal component (Cohen, 2001). However, selecting the association is important in
PCA because elemental association that is defined by covariance is possibly affected by
the scale of measurement values (ppm vs weight % data). This means elements with
large scale and large numerical values will dominate the variance-covariance matrix
from which PCA results are generated. The correlation matrix is not affected by scale
and is actually the standardised equivalent of the covariance matrix therefore all
elements are equally represented in the correlation matrix. In this study the correlation
matrix is used for all PCA association. The statistical background and the procedure of
PCA are summarised in Coakes and Steed (2001) and Davis (2002).
5.10 SUMMARY AND CONCLUSIONS
The most useful steps in data inspection and analysis are found to be:
• Displaying data using exploratory data analysis methods (Histogram, Boxplot) and
separating extreme or outlying values of elements as a subset of the data.
53
• Examining the normality of the data by plotting the data against the normal sco re
using the quartile-quartile diagram. This showed that the Girilambone regolith
geochemical data are neither normal nor lognormal. Therefore, to closely norm alise
these data, the outliers and data with >30% of their values below detection limit a re
excluded in CA and PCA.
• Determining the accuracy and precision of the data by graphical plotting an d
computing the coefficient of variation (CV) and the relative standard deviation. T h e
graphical method of determining precision is more reliable particularly for sm all
number of replicates.
• Applying multivariate cluster and principal component analyses to group the
geochemical variables.
54
6. CHAPTER SIX: GEOCHEMICAL BACKGROUND, ANOMALIES AND ELEMENT ASSOCIATIONS
6.1 DEFINITIONS AND METHODOLOGY
6.1.1 INTRODUCTION
One of the major objectives of this regional geochemical study is to establish the
normal or background variations of elements used in geochemical exploration in this
area of ancient and complex regolith cover. This chapter describes the concept and
definition of the term “background” and the approach used to estimate the geochemical
backgrounds and anomalies of elements in the top metre, transported and in situ units o f
regolith in the Girilambone region. The chapter also defines element associations based
on statistical calculation of the distance similarity coefficient between these elements
using cluster analysis. These element associations are further investigated by principal
component analysis.
6.1.2 DEFINITIONS (BACKGROUND, THRESHOLD, AND ANOMALY)
The geochemical background is the normal range of concentration for an element or
elements in an area excluding mineralised samples (Levinson, 1974). By definition, a
geochemical anomaly is a deviation from the norm and is a departure from the
geochemical patterns that are normal for a given area or geochemical landscape. To
differentiate between background and anomaly, the term threshold is introduced. The
threshold is the upper limit of normal background values (Levinson, 1974). Threshold
values, like background values, vary for each element in each rock type, and in each
area. Values higher than the threshold are considered anomalous and worthy of cautious
inspection. The problem with defining the background is identifying what is the normal
range or abundance. In other words what is the geochemical meaning of the words
“normal range” and how can it be recognised?
Several rules of thumb have been proposed to identify the background and anomalous
values. Hawkes and Webb (1962) suggested the best approximation for a single
population of values (one element from one type of rock) is to take the median value as
55

background, the mean plus twice the standard deviation as threshold and to consider
only the highest 2.5 percent as anomalous (or above the threshold). Boyle (1971 )
suggested samples that contain an amount of element twice the background, or more,
are generally considered anomalous.
6.1.3 TECHNIQUES USED TO DETERMINE THE BACKGROUND AND ANOMALY
Hawkes and Webb (1962) and Levinson (1974) suggest the following techniques for
estimating the background and anomaly values:
• In an area of known mineral occurrences, carrying out an orientation survey around
and away from the mineral occurrence(s) and plotting the data of element
concentration as a map, histograms and/or cumulative frequency plots, and
selecting a value that differentiates mineral occurrence-related data from the
remainder;
• In the common, often unavoidable absence of orientation information (in non/or
weakly mineralised sites with a thick weathering profile) and/or reliable data from
the literature, it is necessary to examine the data themselves for unusual behaviour
(Chen et al., 1998) and this leads to the concept of the statistical anomaly. Various
ways of identifying such anomalies are described below.
6.1.4 EVALUATION OF THE STATISTICAL TECHNIQUES
The widely used statistical techniques to estimate threshold values are briefly
summarised below.
1. METHOD OF MEAN PLUS TWO STANDARD DEVIATION (M+2S)
This method of selecting threshold values is still used, but is probably not appropriate
in many situations. It involves calculating the arithmetic mean (M) and standard
deviation (S) of the data set and applying the classification “anomalous” to values
exceeding M+2S. The use of the mean plus two standard deviations is not based on
some fundamental relationship to mineralisation (Chen et al., 1998). It is merely
equivalent, in a normal, unskewed distribution to the 97.5 percentile. Although it is
difficult to transform the geochemical data to a typical normal distribution, the use of
56

this parameter as a threshold is equivalent to selecting the uppermost 2.5 percent of an3 /
sample population. This method of deriving the 97.5 percentile was developed before
computers were widely available and summary statistics for large populations o-f
analytical values took a long time to process.
2. MEDIAN + 2 MEDIAN ABSOLUTE DEVIATION (MAD) METHOD
Starting geochemical data analysis with statistical tests based on assumptions o f
normality, independence and identical distribution may not be warranted, therefore
using the median + 2 Median Absolute Deviation (MAD) is an alternate more robust
analogy to M + 2S. In the median + 2MAD method the arithmetic mean is replaced by
the median and the standard deviation by the median absolute deviation (MAD),
defined as the median of the absolute deviations from the median of all data (Tukey,
1977). This method is strongly dependent on the lowest threshold value (median value)
(Levinson, 1974) without statistical assumptions. Also when a summary value is
desired that is not strongly influenced by a few extreme observations (outliers), the
median is preferable to the mean (Helsel and Hirsch, 1992). The mean value in
(mean+2S) is possibly pulled towards the outliers (becoming higher), whereas the
median is resistant to the effect of a change in value in the presence of outlying
observations. This method is useful when the data contains less than 10% outliers
(Reimann et al., 2005).
3. BOXPLOT METHOD
The boxplot method was explained in detail in Chapter 4. In this approach the
calculation of the threshold value is based on the quartile and interquartile range of the
data as 1.5 times the interquartile range (IQR=Q3-Q1) away from the top (upper hinge)
or bottom (lower hinge) of the box respectively. This boxplot method is the most
powerful as long as the outliers comprise less than 15% of the data set (Reimann et al.,
2005).
In this study the boxplot and median +2 MAD techniques are applied to calculate the
geochemical threshold of the different regolith (top metre, transported and in situ) units
because the preliminary inspection of the studied data showed that the outlier values are
less than 15%. The identified thresholds were plotted along the studied traverses to
57

show how the value of the threshold varies for a single element in different regolitTi
units of the study areas.
6.2 REGOLITH UNITS AND GEOCHEMICAL BACKGROUNDS, THRESHOLDS AND ANOMALIES
6.2.1 INTRODUCTION
In the study area the regolith can be conveniently divided in to three basic types:
• the top metre (largely comprising soil in most of the area);
• transported ; and
• in situ (residual).
The top metre samples from drilling have been used to understand the geochemical
signature of element associations and the nature and the pattern of element dispersion in
the surface and near-surface environments. Generally the material of the top metre has
a homogenous appearance. It consists of silty red-brown clay with pebbles, patches of
organic substances and regolith carbonate, that if present occurs in the second half
metre. The known soil horizons are uncertain and difficult to establish. The soil types in
the Girilambone area have been classified as solonised brown, solodic, red brown
earths and red calcareous and non-calcareous earths (e.g., Cohen et al., 1998). Soils
have been widely used as sampling media for geochemical exploration in the Cobar
area (Cohen et al., 1998; Cairns et al., 2001; Scott, 2002).
Transported regolith can be recognised from visual observation and Portable Infrared
Mineral Analysis (PIMA) spectra variations. Identification of clay minerals and the
kaolinite crystallinity index were used to define the unconformity between transported
regolith that contains kaolinite ± illite ± smectite and in situ regolith, which is
characterised by highly crystalline kaolinite associated with muscovite/ phengite ± illite
± smectite (Chan et al., 2002; 2004). The depth of transported regolith varies in the
study area. It extends to at least 66 m depth in the Byrock region, 35 m in the Sussex
region and 42 m in the Hermidale region (Figures 6.1 A-C).
Cyclic leaching of trace elements during weathering, aeolian contamination of fine
fractions and the thick transported regolith profile all have the potential to dilute
58

L o c a tio no o o < N T t c o c o o o j i o r ^ - a > ' « — c o i o h - o > T — c o m r ^ - o > ' r - c o t o h - o > c M ^ - < o c o0 0 0 > 0 > 0 > 0 > 0 > 0 0 0 0 0 ' r - T — *«— t — «t— C M C M C M C N C M C O C O C O C O C O T t ^ J - ^ ^T - T — X— C M C M C M C M O M C M C M C M C M C M C M C M C N C M C M C M C M C M C M C M C N C M C M C MO O O O O O O O O O O O O O O O O O O O O O O O O O O O O O< < < < < < < < < < < < < < < < < < < < < < < < < < < < < <c ü c o c ü c ü c o c n c ü c o c ü c ü c ü c ü o Q c o c ü c Q ü ü c o c o c o c o c ü c ü c o c ü G Q c D c o c n o QO O O O O O O O O O O O O O O O O O O O O O O O O O O O O O
C O C O
L o c a t i o nco o > c \i c o co c o c o c o CNJ r—^ co c o r— r— c o a > o>
c o co coCO CO CO
T— 0 > coCM CM CO
S" 30
o o o o o o o o o o o o o o o o o o o o
| i I T r a n s p n r t a d I I
LocationsCT>t— f O u O t ^ - C r > ’r - ^ l - C D o O O C N ^ | - C D C O O C \ | ^ l - C D c O O C M ^ C D (0 ^ ^ ^ ' t ^ m i f l i D U ,) ( £ l ( O t D ( D C D S N N N S c O c O C O C OÜ U Ü U O O O O U U U U O O O O O Ü O O U U O U< < < < < < < < ■ < < • < ■ < ■ < ■ < < ■ < < < ' < ' < < ■ < ' < ' <C Ü Ü Ü Ü Ü Ü Ü C Ü C Ü C Ü Ü Q C Q C Ü C Ü Ü Ü Ü Ü C Ü Ü Ü C Ü C Ü Ü Q Ü Q C Ü Ü Ü Ü Q C Ü Ü ÜO O O O U O O O O O O O O O O O O O O O O O O O
90 -1Figure 6.1 Summary profiles of thickness of transported and in situ regolith in the
Byrock (A), Sussex (B) and Hermidale (C) areas. D rill holes locations in the Sussex,
Hermidale and Byrock areas are shown in Figures (3.6-8).
59
geochemical anomalies. To detect these weaker anomalies it is important to understand
the behaviour of pathfinder elements during chemical weathering and soil formation.
Grouping these elements according to their occurrences and geochemical behaviours
(e.g., mobility of elements) can enhance detection of weaker anomalies and improve
inteipretation.
The regolith (top metre, transported and in situ) samples were also classified into
different regolith facies based on their main secondary enrichments produced during
weathering. These include a clay-silt-gravel facies (without any enrichment of CaO,
MgO, Fe203 or MnO), regolith carbonate facies (CaO and MgO are > 1% wt %), iron-
dominant facies (Fe2Ü3 total >8.5 wt %) and relatively manganese-dominant facies
(MnO >0.1 wt %). The concentration levels are arbitrarily chosen based on comparing
the chemical analysis with petrographic description of the samples (Appendix 7).
6.2.2 BACKGROUND AND THRESHOLD VALUES
Most of the area covered in this study is only weakly mineralised or totally
unmineralised. It thus provides an opportunity to establish typical background values
for elements of interest and threshold values for anomalies generated by regolith-
forming processes. Composite samples of the top metre, transported and in situ regolith
are used to recognise regional backgrounds, anomalies and local geochemical
associations of elements. Elements that have more than 30% of their values below the
detection limits (BDL) were excluded or treated separately.
The threshold values of the Au, As, Co, Cr, Cu, Mo, Ni, Pb, Sb, and Zn are summarised
in Table 6.1. These elements were selected because of their exploration importance as
“pathfinders” for ore deposits (e.g. Levinson, 1974). Generally the estimated threshold
values derived from the MAD method are less than those for the boxplot method (Table
6.1), which probably represent the minimum threshold values.
6.2.2.1 ELEMENT THRESHOLDS FOR THE TOP METRE
Background concentrations of elements in the surface and near-surface pedogenic
environments are primarily influenced by soil forming factors (Davies and Wixson,
1987). The apparent geochemical patterns and elemental composition of different soils
60
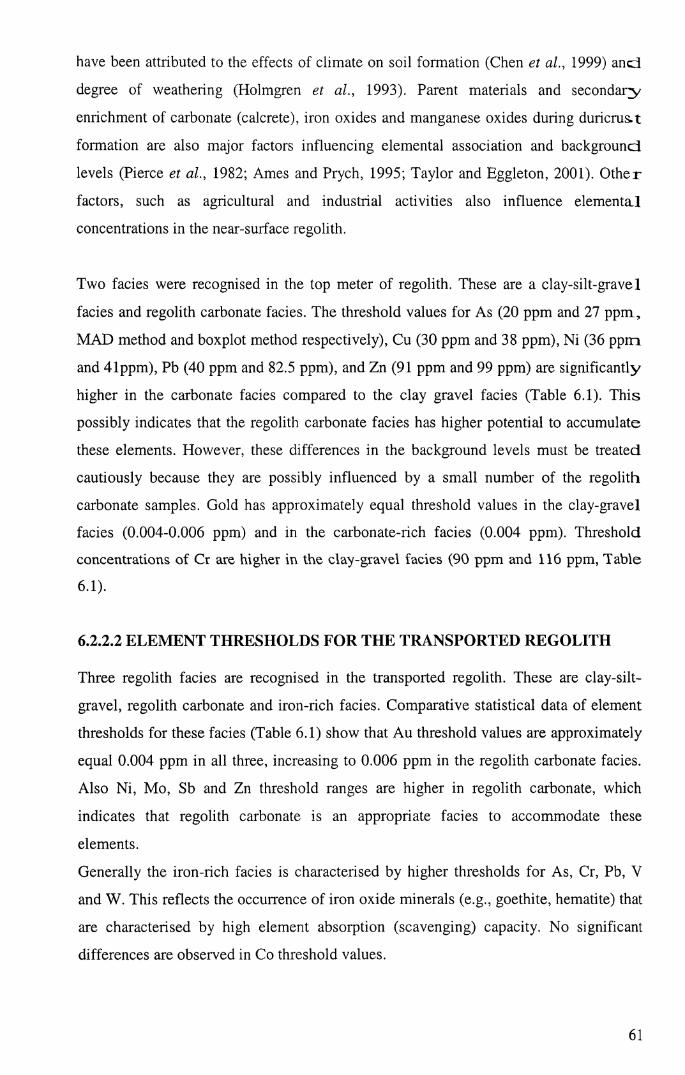
have been attributed to the effects of climate on soil formation (Chen et al., 1999) ancd
degree of weathering (Holmgren et al., 1993). Parent materials and secondary
enrichment of carbonate (calcrete), iron oxides and manganese oxides during duricru&t
formation are also major factors influencing elemental association and background
levels (Pierce et al., 1982; Ames and Prych, 1995; Taylor and Eggleton, 2001). Other
factors, such as agricultural and industrial activities also influence elementa.1
concentrations in the near-surface regolith.
Two facies were recognised in the top meter of regolith. These are a clay-silt-gravel
facies and regolith carbonate facies. The threshold values for As (20 ppm and 27 ppm,
MAD method and boxplot method respectively), Cu (30 ppm and 38 ppm), Ni (36 ppm
and 41 ppm), Pb (40 ppm and 82.5 ppm), and Zn (91 ppm and 99 ppm) are significantly
higher in the carbonate facies compared to the clay gravel facies (Table 6.1). This
possibly indicates that the regolith carbonate facies has higher potential to accumulate
these elements. However, these differences in the background levels must be treated
cautiously because they are possibly influenced by a small number of the regolith
carbonate samples. Gold has approximately equal threshold values in the clay-gravel
facies (0.004-0.006 ppm) and in the carbonate-rich facies (0.004 ppm). Threshold
concentrations of Cr are higher in the clay-gravel facies (90 ppm and 116 ppm, Table
6 . 1).
6.2.2.2 ELEMENT THRESHOLDS FOR THE TRANSPORTED REGOLITH
Three regolith facies are recognised in the transported regolith. These are clay-silt-
gravel, regolith carbonate and iron-rich facies. Comparative statistical data of element
thresholds for these facies (Table 6.1) show that Au threshold values are approximately
equal 0.004 ppm in all three, increasing to 0.006 ppm in the regolith carbonate facies.
Also Ni, Mo, Sb and Zn threshold ranges are higher in regolith carbonate, which
indicates that regolith carbonate is an appropriate facies to accommodate these
elements.
Generally the iron-rich facies is characterised by higher thresholds for As, Cr, Pb, V
and W. This reflects the occurrence of iron oxide minerals (e.g., goethite, hematite) that
are characterised by high element absorption (scavenging) capacity. No significant
differences are observed in Co threshold values.
61
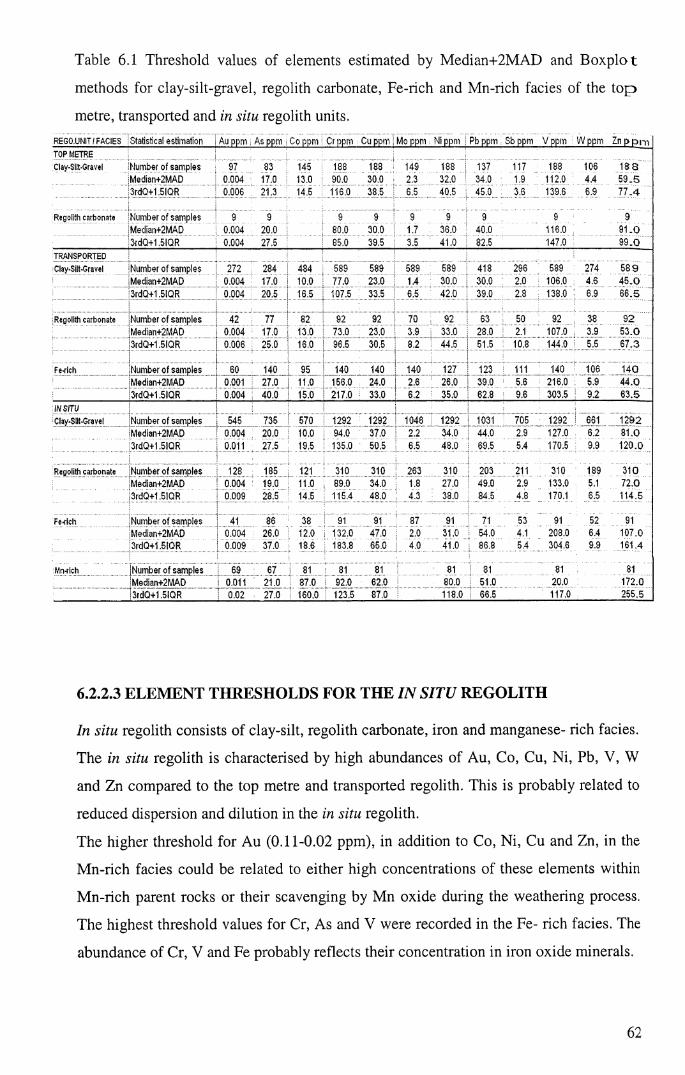
Table 6.1 Threshold values of elements estimated by Median+2MAD and Boxplot
methods for clay-silt-gravel, regolith carbonate, Fe-rich and Mn-rich facies of the top
metre, transported and in situ regolith units.R E G O .U N I T / F A C I E S S ta tis tica l e s tim a tio n A u p p m A s p p m C o p p m Cr p p m C u p p m Mo p p m Mi p p m P b p p m S b p p m V p p m W p p m Z n p p i m
T O P M E T R E
C la y - S i l t - G r a v e l N u m b e r o f s a m p le s 97 8 3 1 4 5 1 88 1 8 8 1 4 9 1 8 8 1 3 7 11 7 1 8 8 1 0 6 1 8 8
M edian+ 2M A D 0 .0 0 4 1 7 .0 1 3 .0 9 0 .0 3 0 .0 2 .3 3 2 .0 3 4 .0 1.9 1 1 2 .0 4 .4 5 9 . 5
3 rd Q + 1 .5 IQ R 0 .0 0 6 2 1 .3 1 4 .5 1 1 6 .0 3 8 .5 6 .5 4 0 .5 4 5 .0 3 .6 1 3 9 .6 6 .9 7 7 . 4
R e g o l i t h c a r b o n a t e N u m b e r o f s a m p le s 9 9 9 9 9 9 9 9 9
M edian+ 2M A D 0 .0 0 4 2 0 .0 8 0 .0 3 0 .0 1.7 3 6 .0 4 0 .0 1 1 6 .0 9 1 . 0
3 rd Q + 1 .5 IQ R 0 .0 0 4 2 7 .5 8 5 .0 3 9 .5 3 .5 4 1 .0 8 2 .5 1 4 7 .0 9 9 . 0
T R A N S P O R T E D
C la y - S i l t - G r a v e l N u m b e r o f s a m p le s 2 7 2 2 8 4 4 8 4 5 8 9 5 8 9 5 8 9 5 8 9 4 1 8 2 9 6 5 8 9 2 7 4 5 8 9
M edian+ 2M A D 0 .0 0 4 1 7 .0 1 0 .0 7 7 .0 2 3 .0 1.4 3 0 .0 3 0 .0 2 .0 1 0 6 .0 4 .6 4 5 . 0
3 rd Q + 1 .5 IQ R 0 .0 0 4 2 0 .5 1 6 .5 1 0 7 .5 3 3 .5 6 .5 4 2 .0 3 9 .0 2 .8 1 3 8 .0 6 .9 6 6 . 5
R e g o l i t h c a r b o n a t e N u m b e r o f s a m p le s 4 2 7 7 8 2 9 2 9 2 7 0 9 2 6 3 5 0 9 2 3 8 9 2
M edian+ 2M A D 0 .0 0 4 1 7 .0 1 3 .0 7 3 .0 2 3 .0 3 .9 3 3 .0 2 8 .0 2.1 1 0 7 .0 3 .9 5 3 . 0
3 rd Q + 1 .5 IQ R 0 .0 0 6 2 5 .0 1 6 .0 9 6 .5 3 0 .5 8 .2 4 4 .5 5 1 .5 10 .8 1 4 4 .0 5 .5 6 7 . 3
F e - r ic h N u m b e r o f s a m p le s 6 0 1 4 0 9 5 1 4 0 1 4 0 1 4 0 1 2 7 1 2 3 111 1 4 0 1 0 6 1 4 0
M edian+ 2M A D 0 .0 0 1 2 7 .0 1 1 .0 1 5 6 .0 2 4 .0 2 .6 2 6 .0 3 9 .0 5 .6 2 1 6 .0 5 .9 4 4 . 0
3 rd Q + 1 .5 IQ R 0 .0 0 4 4 0 .0 1 5 .0 2 1 7 .0 3 3 .0 6 .2 3 5 .0 6 2 .8 9 .6 3 0 3 .5 9 .2 6 3 . 5
I N S I T U
C la y - S i l t - G r a v e l N u m b e r o f s a m p le s 5 4 5 7 3 5 5 7 0 1 2 9 2 1 2 9 2 1 0 4 6 1 2 9 2 1031 7 0 5 1 2 9 2 6 61 1 2 9 2
M edian+ 2M A D 0 .0 0 4 2 0 .0 1 0 .0 9 4 .0 3 7 .0 2 .2 3 4 .0 4 4 .0 2 .9 1 2 7 .0 6 .2 8 1 . 0
3 rd Q + 1 .5 IQ R 0 .0 1 1 2 7 .5 1 9 .5 1 3 5 .0 5 0 .5 6 .5 4 8 .0 6 9 .5 5 .4 1 7 0 .5 9 .9 1 2 0 . 0
R e g o l i t h c a r b o n a t e N u m b e r o f s a m p le s 1 2 8 1 8 5 121 3 1 0 3 1 0 2 6 3 3 1 0 2 0 3 211 3 1 0 1 8 9 3 1 0
M edian+ 2M A D 0 .0 0 4 1 9 .0 1 1 .0 8 9 .0 3 4 .0 1.8 2 7 .0 4 9 .0 2 .9 1 3 3 .0 5.1 7 2 . 0
3 rd Q + 1 .5 IQ R 0 .0 0 9 2 8 .5 1 4 .5 1 1 5 .4 4 8 .0 4 .3 3 8 .0 8 4 .5 4 .8 170.1 6 .5 1 1 4 .5
F e - r i c h N u m b e r o f s a m p le s 41 8 6 38 91 91 8 7 91 71 5 3 91 5 2 91
M edian+ 2M A D 0 .0 0 4 2 6 .0 1 2 .0 1 3 2 .0 4 7 .0 2 .0 3 1 .0 5 4 .0 4.1 2 0 8 .0 6 .4 1 0 7 .0
3 r d 0 + 1 .5 I Q R 0 .0 0 9 3 7 .0 1 8 .6 1 8 3 .8 6 5 .0 4 .0 4 1 .0 8 6 .8 5 .4 3 0 4 .6 9 .9 1 6 1 .4
Mn-rich N u m b e r o f s a m p le s 6 9 6 7 81 81 81 81 81 81 81
M ed ian+ 2M A D 0 .0 1 1 2 1 .0 3 7 .0 9 2 .0 6 2 .0 8 0 .0 5 1 .0 2 0 .0 1 7 2 .0
3 rd Q + 1 .5 IQ R 0 .0 2 2 7 .0 1 6 0 .0 1 2 3 .5 8 7 .0 1 1 8 .0 6 6 .5 1 1 7 .0 2 5 5 .5
6.2.2.3 ELEMENT THRESHOLDS FOR THE IN SITU REGOLITH
In situ regolith consists of clay-silt, regolith carbonate, iron and manganese- rich facies.
The in situ regolith is characterised by high abundances of Au, Co, Cu, Ni, Pb, V, W
and Zn compared to the top metre and transported regolith. This is probably related to
reduced dispersion and dilution in the in situ regolith.
The higher threshold for Au (0.11-0.02 ppm), in addition to Co, Ni, Cu and Zn, in the
Mn-rich facies could be related to either high concentrations of these elements within
Mn-rich parent rocks or their scavenging by Mn oxide during the weathering process.
The highest threshold values for Cr, As and V were recorded in the Fe- rich facies. The
abundance of Cr, V and Fe probably reflects their concentration in iron oxide minerals.
62

6.3 GEOCHEMICAL ANOMALIES
Discriminating between ore-related and regional background anomalies is difficult and
often requires intensive, expensive and unrewarding fieldwork. However, a sufficient
amount of geological and geochemical information obtained through a major drilling
program will assist in following the anomalies in the third dimension (downhole) and
evaluating sampling media and the exploration approach. The threshold values obtained
from the MAD and boxpot methods were used to assess possible anomalous values o f
elements. Some observed values of the top metre samples are significantly greater than
the boxplot threshold values and therefore are considered as anomalies. These samples
are separated into sub-data sets for additional investigation down the regolith profile.
6.3.1 ANOMALIES IN THE TOP METRE
6.3.1.1 ANOMALIES IN THE CLAY-SILT-GRAVEL FACIES
The anomalous concentration range of elements in the top metre, clay-silt-gravel facies
samples are as follows: Au 0.007-0.027 ppm, Co 15-22 ppm, Cr 126-130 ppm, Cu 40-
232 ppm, Mo 7-12 ppm, Ni 42-73 ppm, Pb 48-160 ppm, Sb 3.9-11 ppm, V 143-151
ppm, W 7.1-10.4 ppm and Zn 71-128 ppm (Appendix 7). No anomalous values have
found for As. Elevated values (> boxplot threshold) of Au were detected from drill
holes CBAC6, 32, 112 and 239, Co from CBAC3, 10, 45, 177, 201 and 204, Cr from
CBAC 23, and 231, Mo from CBAC 15, 189, 193, 199, 200, 204, 209, 211, 223, 229,
231 and 232, Ni from CBAC 22-25, 166, 189 and 242, Pb from CBAC 6, 43, 60, 82,
85, 86, 88, 105, 115 and 188, Sb from CBAC 82, 139, 140, 149, 151, 152, 157, 159,
161, 162, 164, 172, and 177, V from CBAC 5 and 82, W from CBAC79, 85, 104, 106,
107 and 116 and Zn from CBAC1, 8, 10, 39, 68, 96, 104, 105, and 117. (Figures 6.2-
12, Appendix 7).
Gold anomalies are not associated with any other element except Cu (53 ppm) and Pb
(74 ppm) in drill hole CBAC6. Copper anomalies are accompanied by elevated Zn
values in drill holes CBAC1, 96, and 117. High Cu concentrations are associated with
elevated Mo in drill hole CBAC15 and elevated Sb in drill hole CBAC139. Elevated Zn
values were observed in drill holes CBAC104-106. A significant enrichment of Ni is
recorded from drill holes CBAC22-25 (Figure 6.7, Appendix 7).
63

6.3.1.2 ANOMALIES IN THE REGOLITH CARBONATE FACIES
The regolith carbonate facies in the top metre displays anomalies in two drill holes,
CBAC 191 and 192. Anomalies for Cr (95 ppm) and Mo (13 ppm) occur in CBAC192.
Elevated Mo (4 ppm) was detected in CBAC191 (Figure 6.13, Appendix 7).
6.3.2 ANOMALIES IN TRANSPORTED REGOLITH
6.3.2.1 ANOMALIES IN THE CLAY-SILT-GRAVEL FACIES
The clay-silt-gravel facies of the transported regolith shows Au anomalies (0.005-0.098
ppm) concentrated in the central and southern part of the region (Sussex-Hermidale
areas). These anomalies do not have associated As anomalies except in drill hole
CBAC64, where the elevated Au (0.005 ppm) is associated with elevated As (24 ppm)
and Co (25 ppm). Gold anomalies are associated with elevated Cr (115ppm) in drill
0.03 t
Au
O MAD
♦ ♦♦♦♦f l O C O ( N ( N ^ O ( r t O O ^ S ( O ^ N i t ) S O ) ö ) M O ) ( N ( D N O O ) ' - 0 ) r t ' - o n ( j ( j r ^ ( N O ' j ^ ( D N C O C O a O O r r c O 7 l / ) l / ) 0 ( D S C O O ) O O C ' J ^ f
£ £ £ < < < < < < < < < < 5 o u ü o Ü u u o o ü Ü o u u Ö o ' 'u u u u o u u ü u u ü u ü 2 j m m m m m m m m m m m m m m m m
Drill hole
o
6600000 mNt *CBAC231
CBAC223
0 C6AC209 # C8AC199
0 CBAC193Öwern n r , , .
^ B A C 1 1 fcB A C 9 T ceA C 8 6 C8AC79
6550000 mN*ca
. *CBAC68 ■
CBA.C6Ö
y » ®CBAC32 CBAC22
**CB
A c b a c io
K B A C 5 CBAC I
6500000 mN
Au ppm
£ 0.027 0 0.0135 • 0.0027
6450000 mN
# CJAC149*CBAC139 CBAC151
*CBAC152
0 157CBAC162
OCBAC184
*CBAC1T2
Figure 6.2 Distribution pattern of Au anomalies with MAD and boxplot (BOX)
threshold values (A) and a thematic map of anomalous Au in the top metre clay-silt-
gravel facies (B).
64

o Co ppm □ MAD A BOX
O 45
A0 0kO ------------0“2-........ ❖ ..........
0 <0 <X>O Oo <x>
177
0
204
o
........O..... -O........... ~
oO 0o o
O 00000000000000 0
r i / ) ( 0 < N M ^ ( N r t O 0 ) l f l S ( D l f ) S ^ N 0 ) 0 ) ( N 0 ) < N ( 0 N 0 ) 0) i - 0 ) ( n r - 0 ) (_) Q (_) *" (N (N CO IO S C000 c r < 0 0 » - r ( 7 ) i l k0U0<D<£)r^C007OOCNC0c0
ässMSlISSaiSiffijäilffliiHIiäDrill hole
o
6600000 mN
Qb
p . <8»C231 ''-6baC223
/ :BAC193BAC209
UC199
BAC188 G ** __ . -( S ’ CBAC11 P c B A C g fc & S e CBAC79
6550000 mN°ca
6500000 mN
Co ppm
O 22 o 11O 2.2
O 0XTBAC162Ct -b
kilometers
6450000 mN
®CBQa
Figure 6.3 Distribution pattern of Co anomalies with MAD and boxplot (BOX) threshold
values (A) and a thematic map of anomalous Co in the top metre clay-silt-gravel facies (B).
140
100
* - l f lC0CN<N^TCN<0O0>t f )h'<0iOl^l f l t ^0»0>(N0><N<0r^0>0>«-0>C0*-0> O O O T“ < N C N C 0 ’« T ( D r ^ 0 0 0 0 0 > O O f ' ^ c 0 T i O i / > < O < £ > r - 0 0 0 > O O < N < < ) ( 0
UiEo
LUEo
• E” BAC239 q
o o §o IAA S6600000 mN ^ ................. ".BAC.242..
AC 209^^Pba.C199 JKba.C193 BAC188
6550000 mN0AC129
/H b a c io
■ sacs " baci
BAC68BAC60• t • -
6500000 mN Cr ppm
f 130 0 65
9%BA.C152
.C149 2BAC151
• •tQCl57R öAC162 RbaC 164
®CBAC172
BAC177645Q000 mN
Figure 6.4 Distribution pattern of Cr anomalies with M AD and boxplot (BOX)
threshold values (A) and a thematic map of anomalous Cr in the top metre clay-silt-
gravel facies (B).
65

250 j—f 1
200 ■ I
a 150
rl/>«)(N(N'TfNMO0) S(OlßSlßS0)0)(N0)(N(DS0)ö)'-0)l')r0)( j Q O ' « - < N < N c O T T c o r - o o < » o ) o o t - ^ - c O T r i r > i r > < D ( £ > r ^ o o o ) 0 0 (Nroco
s g g s s s s s s s s s s | 5 | l i i i i | 5 i l i i l l s luuooououuü<juu®»gj5»8«ogs58»g8g8»«Drill hole
o
6600000 mN
*CBAC239
# *C B A C 23 1 CBAC223
*C B A C 2 .42
CBAC209 # CBAC199
0 C6AC193 CBAC188 - * * *
^ C0AC11 *CBAC98CBÄC86 CBAC79
6550000 mN * *obac68
*CBAC68
*CBAC32 CBA C6AC22
BAC10
6500000 mN Cu ppm
A 240 0 120
■UN
£C^AC149
iAC139 CBAC151
*C8AC152
CC157 # CBAC162
• CBAC164
*CBAC172
6450000 mN
Figure 6.5 Distribution pattern of Cu anomalies with MAD and boxplot (BOX)
threshold values (A) and a thematic map of anomalous Cu in the top metre clay-silt-
gravel facies (B).
r l ^ ( 0 ( N ( N ' T ( N ( 0 0 0 ) l f i S ( 0
nnmUiUTüiVüVfüVfüMliDrill hole
o o
6600000 mN
™ 6 A C 2 2 3
^^Ra*C199 ^ B K a C 1 93 ™ E lA C 1 8 S
^ cbaci i f qmq^ cbacs*eaten
6550000 mNC9AC129
Jk^AC22 fc B A C IO
*GBAC68
: *CBAC60
I • **C B A C 43CBAC32
A baciU0AC1
6500000 mN
Mo ppmA12
6450000 mN
^ C |A C 149W b a C139 C8AC151
CBAC152
C^157 CBAC182
• CBAC164
*CaAC172
*C 8AC 177
Figure 6.6 Distribution pattern of Mo anomalies with M AD and boxplot (BOX)
threshold values (A) and a thematic map of anomalous Mo in the top metre clay-silt-
gravel facies (B).
66
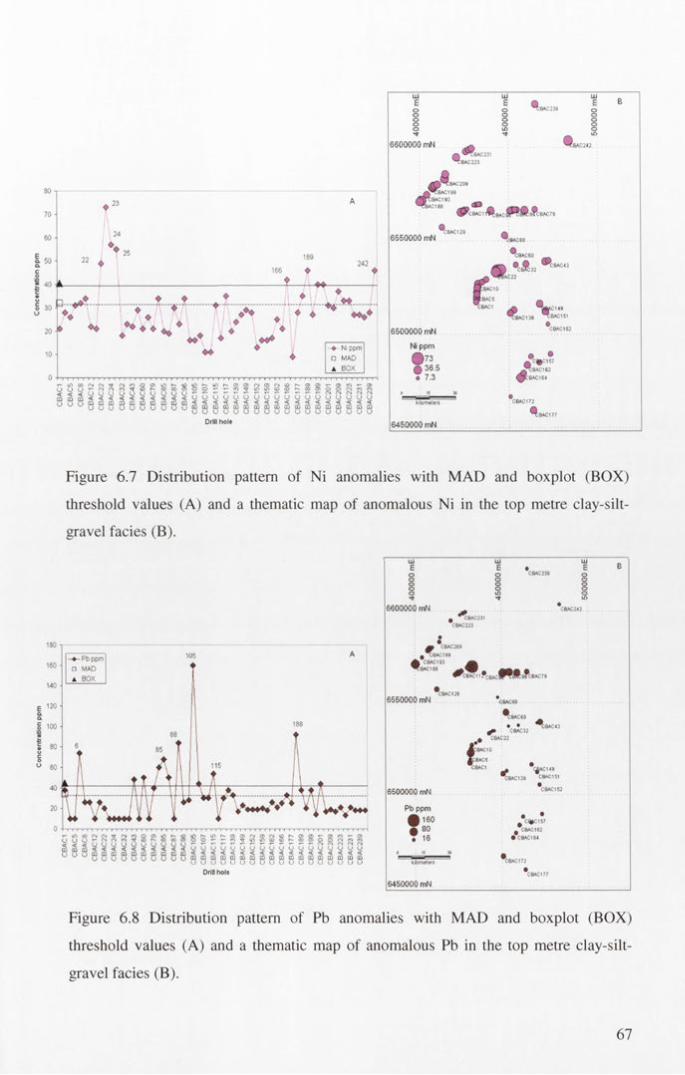
♦ Ni ppm
□ MAD
A BOX
Drill hole
EHiE Q E B
o o ” BAC239 0o o Oo _ S
6600000 mNr\ ^^BAC231 ™ BAC223
BAC 209 / - ^ B a C199 R baC193 CBAC188
® rC0ACl^0
6550000 mN !8AC68 ■
^ :bac60
*0832H b a c ig
K bA C5 " b a c i & Sy
“ BAC139
6500000 mN
Ni ppm 0 7 3 Q 36.5
C149BAC151
*CBAC152
^C^C157:6AC162
*CBAC172
)BAC1776450000 mN
Figure 6.7 Distribution pattern of Ni anomalies with MAD and boxplot (BOX)
threshold values (A) and a thematic map of anomalous Ni in the top metre clay-silt-
gravel facies (B).
■ *- Pb ppm □ MAD
A BOX
» - l O C O ( N ( N ^ O M ( * ) O C D l ß S < 0( J O Q y - C N C N f O ^ r ^ r ^ C O O p O )
Drill hole
6600000 mN
in in W Bo o CBAC239 Oo © Oo lD s
# BAC231 CBAC223
m CBAC209 CBAC199
6550000 mN
^CBAC11 cBAcfPftRsfci
®CBAC129
^ BAC22A b ac i o
A bacs
*C9AC68
BACSO• • 7BAC43
CBAC32
6500000 mN
Pb ppmA 160 0 80
» |^AC149CBA.C139 CBAC151
C * C 157 - C 6AC162
• CBAC164
' CBAC172
*CBAC177
6450000 mN
Figure 6.8 Distribution pattern of Pb anomalies with MAD and boxplot (BOX)
threshold values (A) and a thematic map of anomalous Pb in the top metre clay-silt-
gravel facies (B).
67
u LUE 0
LUB
o o CBAC239 O
o o o
o % s6600000 mN
_ ^?BAC231 CBAC223
sCBAC1
U&AC188
BAC209BAC199
<$F>• ^ c b a c i 1 ? CBAC
6550000 mN
. CBAC22
0AC1O
JCBAC5C0AC1
*08AC68
®C8AC60« • *C0AC43
C0AC32
flCE
6500000 mN
Sb ppm
@11 © 5.5o 1.1
j ) %^ B A C 139
U^K B A C 162SP?BAC164
,0149BAC151
^BAC1S2
§
^0ACI72^B A C 177
6450000 mN
Figure 6.9 Distribution pattern of Sb anomalies with MAD and boxplot (BOX)
threshold values (A) and a thematic map of anomalous Sb in the top metre clay-silt-
gravel facies (B).
Eo
UJE
o
LU• E” BAG239 o
o o O
o ID S6600000 mN
A ^ ^ A C 2 3 1™BAC223
............................... ^BAC.242. .
^ K baC209 j Ä ba C199
^ K baC193 ” bAC188
6550000 mN
: i o
*BAC1
6500000 mN
V ppmA 160 0 80
6AC6Ci
^ ^ C 1 4 9
^ K a.C139 ^0AC151 ^BAC152
■CBAC162CBAC164
6450000 mN
Figure 6.10 Distribution pattern of V anomalies with MAD and boxplot (BOX)
threshold values (A) and a thematic map of anomalous V in the top metre clay-silt-
gravel facies (B).
68

8 S 8 8 8 8 8 8 8 8 g g g g g g g g § g g g g g S g g §Drill hole
lii LLi LLiEo
Eo
A E” BAC239 0o o Oo m s
6600000 mNÄ ^ 0AC231
^HAC242
Ä^C&AC2Ö9 äWbAC199
K & A C 1 9 3 CBAC188
6550000 mN GBAG68
*CBAC60 -
• •CBAC32
CBAC10■DBA'ÄBAC5* B A C 1
rC0AC22
# VBAC139,0149BAC151
6500000 mN
W ppm
QuA 5.5 • 1.1
15
ÄBAC162
16450000 mN
Figure 6.11 Distribution pattern of W anomalies with MAD and boxplot (BOX)
threshold values (A) and a thematic map of anomalous W in the top metre clay-silt-
gravel facies (B).
ZnppmMADBOX
§ 6 0 . ^ . .................................oO o
„OO• Vo 0 *
V ° v °❖
£ « § 2 2 2 2 2 2 2 2 2 2 ^ ^ ^ ^ ^ ^ ^ ^ ^8 8U U U ( J u u H j C Ü C ü a j C Ü C Ü C Ü C D Q Q C D a j C D C D a j t n C D C D C Ü
0 0 0 0 0 0 0 0 0 0 0 0 0 0 0 0 0 0
Drill hole
l i iE E
Lii0 E
g o C&AC239 oo oo 2 S
6600000 mN< ?BAC231
. ®CSA.C242 :
A A.CBAC209 /^tBACl99
('fW'cBACI 93 Ä
^w’98 irc~®BACim>fc^
Q»
4LQ;BAC60
°cQ>2 ®cb
6500000 mN
Z n p p m
O130o f f
rO'‘ X0AC139
o °p p © C15T JtT8AC182
CJCBA.C164
9baci72BAC177
6450000 mN
Figure 6.12 Distribution pattern of Zn anomalies with MAD and boxplot (BOX)
threshold values (A) and a thematic map of anomalous Zn in the top metre clay-silt-
gravel facies (B).
69

L±J
* CBAC192 *CBAC191
6570000 mN ^ 4200
00 m
E
6560000 mN
tgCD
Io
100
90
80
70
60
50
4030
20
♦ Cr x Mo
10 - n - X
X
CBAC191 C BAC 192♦ Cr 95x Mo 4 13
Drill hole
Figure 6.13 Anomalies in Cr and Mo for the regolith carbonate facies in the top metre
samples from drill holes CBAC191 and CBAC 92.
hole CBAC29 and with elevated Cu (38 ppm) in drill hole CBAC 157. Copper
anomalies were also detected from the Sussex and Hermidale areas and range from 31
ppm to 257 ppm. Elevated Cu values are occur in drill holes CBAC1 (257 ppm ) and
CBAC153 (162 ppm ).
Anomalous Cu values are associated with elevated Zn in drill holes CBAC 68, 101,
117, 121 and 124, and with elevated Pb in drill holes CBAC93 and CBAC227. In
addition, anomalous Pb is associated with Cr and Ni anomalies in drill holes CBAC224,
225 and 237. Elevated Cr and Ni probably reflect the presence of weathered mafic
rocks and elevated Pb could reflect the greater abundance of iron oxides (i.e., hematite)
at these sites. Anomalous concentrations of Pb are widely spread over the study area
70
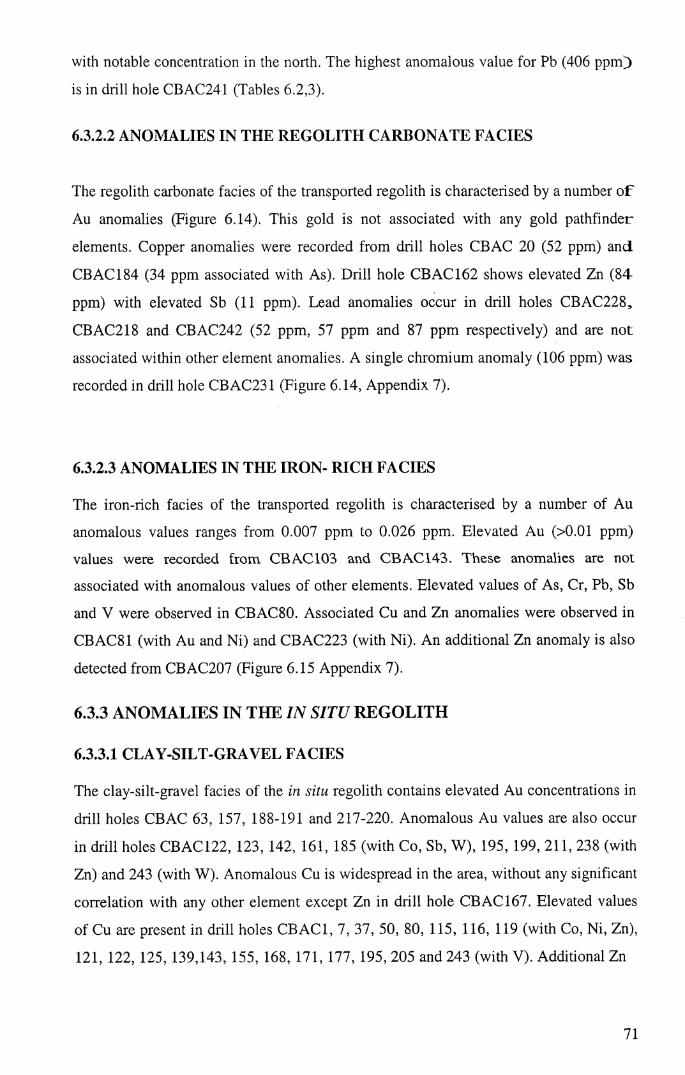
with notable concentration in the north. The highest anomalous value for Pb (406 ppm )
is in drill hole CBAC241 (Tables 6.2,3).
63.2.2 ANOMALIES IN THE REGOLITH CARBONATE FACIES
The regolith carbonate facies of the transported regolith is characterised by a number o f
Au anomalies (Figure 6.14). This gold is not associated with any gold pathfinder
elements. Copper anomalies were recorded from drill holes CBAC 20 (52 ppm) and
CBAC184 (34 ppm associated with As). Drill hole CBAC 162 shows elevated Zn (84-
ppm) with elevated Sb (11 ppm). Lead anomalies occur in drill holes CBAC228,
CBAC218 and CBAC242 (52 ppm, 57 ppm and 87 ppm respectively) and are not
associated within other element anomalies. A single chromium anomaly (106 ppm) was
recorded in drill hole CBAC231 (Figure 6.14, Appendix 7).
6.3.2.3 ANOMALIES IN THE IRON- RICH FACIES
The iron-rich facies of the transported regolith is characterised by a number of Au
anomalous values ranges from 0.007 ppm to 0.026 ppm. Elevated Au (>0.01 ppm)
values were recorded from CBAC 103 and CBAC 143. These anomalies are not
associated with anomalous values of other elements. Elevated values of As, Cr, Pb, Sb
and V were observed in CBAC80. Associated Cu and Zn anomalies were observed in
CBAC81 (with Au and Ni) and CBAC223 (with Ni). An additional Zn anomaly is also
detected from CBAC207 (Figure 6.15 Appendix 7).
6.3.3 ANOMALIES IN THE IN SITU REGOLITH
6.3.3.1 CLAY-SILT-GRAVEL FACIES
The clay-silt-gravel facies of the in situ regolith contains elevated Au concentrations in
drill holes CBAC 63, 157, 188-191 and 217-220. Anomalous Au values are also occur
in drill holes CBAC122, 123, 142, 161, 185 (with Co, Sb, W), 195, 199, 211, 238 (with
Zn) and 243 (with W). Anomalous Cu is widespread in the area, without any significant
correlation with any other element except Zn in drill hole CBAC 167. Elevated values
of Cu are present in drill holes CBAC1, 7, 37, 50, 80, 115, 116, 119 (with Co, Ni, Zn),
121, 122, 125, 139,143, 155, 168, 171, 177, 195, 205 and 243 (with V). Additional Zn
71
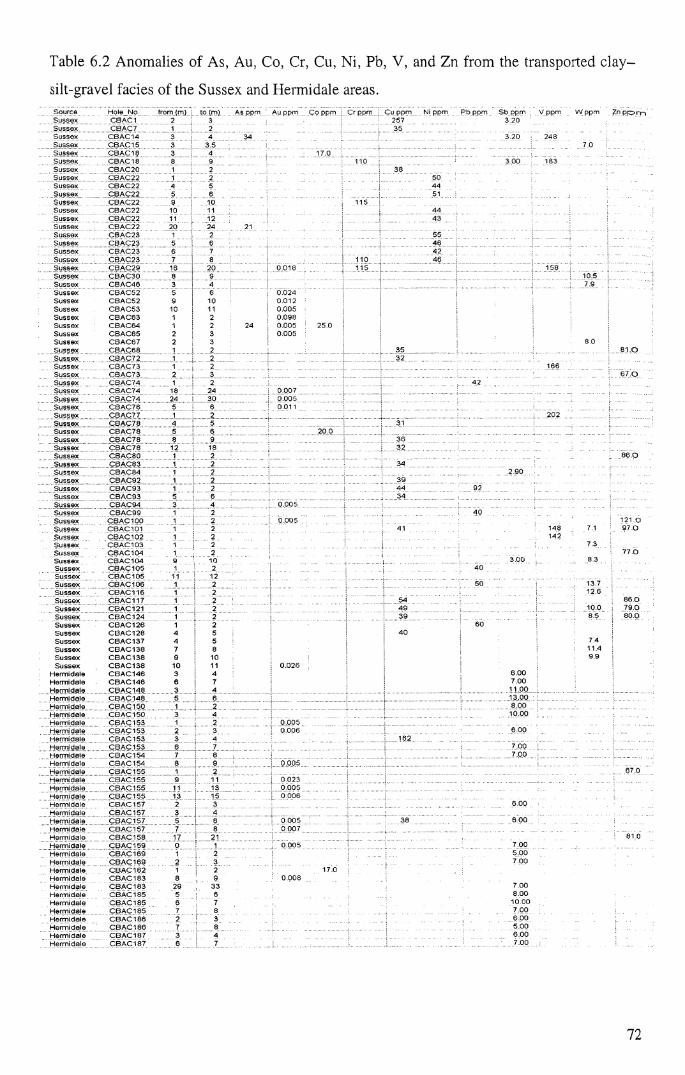
Table 6.2 Anomalies of As, Au, Co, Cr, Cu, Ni, Pb, V, and Zn from the transported clay-
silt-gravel facies of the Sussex and Hermidale areas.S o u rce H ole_N o from (m) to (m) As ppm Au ppm C o ppm C r ppm C u pp m Ni p p m P b ppm S b ppm V ppm W ppm Zn p p o n - ,S u sse x C BA C1 2 3 257 3 20S u sse x C B A C 7 1 2 35S u sse x C B A C 14 3 4 34 3 20 248S u sse x C B A C 15 3 3 5 7 0S u sse x C B A C 18 3 4 17 0S u s se x C B A C 18 8 9 110 3 0 0 183S u sse x C B A C 20 1 2 38S u sse x C B A C 22 1 2 50S u sse x C B A C 22 4 5 44S u sse x C B A C 22 5 6 51S u sse x C B A C 22 9 10 115S u sse x C B A C 22 10 11 i 44S u sse x C B A C 22 11 12 4 3S u sse x C B A C 22 20 24 21S u sse x C B A C 23 1 2 55S u sse x C B A C 23 5 6 4 6S u sse x C B A C 23 6 7 4 2S u sse x C B A C 23 7 8 110 46S u sse x C B A C 29 16 20 0 0 18 115 158S u sse x C B A C 30 8 9 10.5S u sse x C B A C 46 3 4 7 9S u sse x C B A C 52 5 6 0 .024S u sse x C B A C 52 9 10 0 .0 1 2S u sse x C B A C 53 10 11 0 .0 0 5S u sse x C B A C 63 1 2 0 0 9 8S u sse x C B A C 64 1 2 24 0 0 05 2 5 0S u sse x C B A C 65 2 3 0 0 05S u sse x C B A C 67 2 3 8 0S u sse x C B A C 68 1 2 3 5 81 OS u sse x C B A C 72 1 2 32S u sse x C B A C 73 1 2 166S u sse x C B A C 73 2 3 67 OS u sse x C B A C 74 1 2 42S u sse x C B A C 74 18 24 0 007S u sse x C B A C 74 24 30 0 0 0 5S u sse x C B A C 76 5 6 0 01 1S u sse x C B A C 77 1 2 2 02S u sse x C B A C 78 4 5 31S u sse x C B A C 7 8 5 6 2 0 0S u sse x C B A C 78 8 9 3 6S u sse x C B A C 7 8 12 18 32S u sse x C B A C 8 0 1 2 8 6 OS u sse x C B A C 83 1 2 34S u sse x C B A C 8 4 1 2 2 90S u sse x C B A C 92 1 2 3 9S u sse x C B A C 93 1 2 4 4 92S u sse x C B A C 93 5 6 34S u sse x C B A C 94 3 4 0 .0 0 5S u sse x C B A C 99 1 2 4 0S u sse x C B A C 1 0 0 1 2 0 0 0 5 121 OS u sse x C B AC 101 1 2 41 148 7.1 97 OS u sse x C B A C 1 0 2 1 2 142S u sse x C B A C 1 0 3 1 2 7 3S u sse x C B A C 1 0 4 1 2 77 OS u sse x C B A C 1 0 4 9 10 3 0 0 8 3S u s se x C B A C 1 0 5 1 2 4 0S u sse x C B A C 1 0 5 11 12S u s se x C B A C 1 0 6 1 2 50 13 7S u s se x C B A C 1 1 6 1 2 12 6S u s se x C B A C 1 1 7 1 2 54 86 0S u s se x C B A C 121 1 2 4 9 10 0 79 0S u s se x C B A C 1 2 4 1 2 3 9 8.5 8 0 0S u s se x C B A C 1 2 6 1 2 60S u s se x C B A C 1 2 8 4 5 4 0S u s se x C B A C 1 3 7 4 5 7 4S u s se x C B A C 1 3 8 7 8 11.4S u sse x C B A C 1 3 8 9 10 9 9S u s se x C B A C 1 3 8 10 1 1 0 0 2 6
H erm ida le C B A C 1 4 6 3 4 6 0 0H erm ida le C B A C 1 4 6 6 7 7 0 0H erm ida le C B A C 1 4 8 3 4 11 0 0H erm id a le C B A C 1 4 8 5 6 13 0 0H erm ida le C B A C 1 5 0 1 2 8 0 0H erm ida le C B A C 1 5 0 3 4 10 00H erm ida le C B A C 1 5 3 1 2 0 0 05H erm ida le C B A C 1 5 3 2 3 0 0 0 6 6 0 0H erm id a le C B A C 1 5 3 3 4 162H erm id a le C B A C 1 5 3 6 7 7.00H erm id a le C B A C 1 5 4 7 8 7 .0 0H erm id a le C B A C 1 5 4 8 9 0 0 05H erm id a le C B A C 1 5 5 1 2 67 0H erm id a le C B A C 1 5 5 9 1 1 0 0 23H erm id a le C B A C 1 5 5 11 13 0 0 0 5H e rm id a le C B A C 1 5 5 13 15 0 .0 0 6H erm id a le C B A C 1 5 7 2 3 6 0 0H e rm id a le C B A C 1 5 7 3 4H e rm id a le C B A C 1 5 7 5 6 0 0 0 5 38 6 0 0H e rm id a le C B A C 1 5 7 7 8 0 0 07H e rm id a le C B A C 1 5 8 17 21 81 0H e rm id a le C B A C 1 5 9 0 1 0 0 0 5 7 0 0H e rm id a le C B A C 1 6 9 1 2 5 0 0H e rm id a le C B A C 1 6 9 2 3 7 0 0H e rm id a le C B A C 1 8 2 1 2 17 0H e rm id a le C B A C 1 8 3 8 9 0 0 0 8H e rm id a le C B A C 1 8 3 29 3 3 7 0 0H e rm id a le C B A C 1 8 5 5 6 8 0 0H e rm id a le C B A C 1 8 5 6 7 10 00H e rm id a le C B A C 1 8 5 7 8 7 .0 0H e rm id a le C B A C 1 8 6 2 3 6 0 0H e rm id a le C B A C 1 8 6 7 8 5 0 0H e rm id a le C B AC 187 3 4 6 0 0H e rm id a le C B A C 1 8 7 6 7 7 00
72
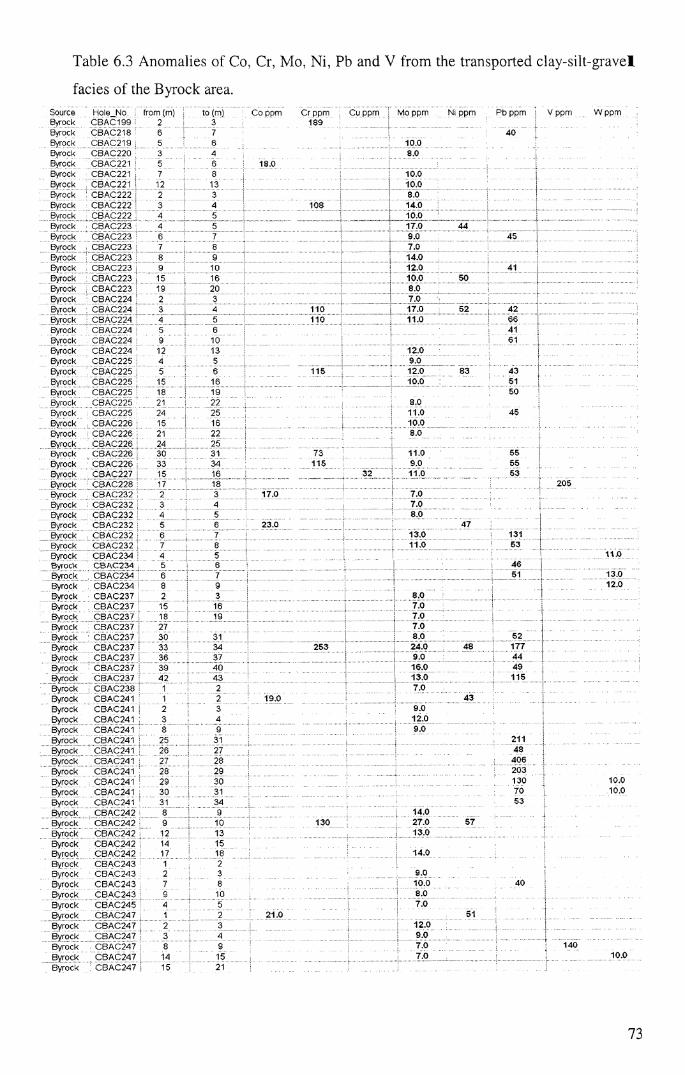
Table 6.3 Anomalies of Co, Cr, Mo, Ni, Pb and V from the transported clay-silt-gravel
facies of the Byrock area.Source Hole No from (m) to (m) Co ppm Cr ppm Cu ppm Mo ppm Ni ppm P b ppm V ppm W ppmByrock CBA C199 2 3 189Byrock CBA C218 6 7 40Byrock CBA C219 5 6 10.0Byrock CBA C220 3 4 8.0Byrock CBAC221 5 6 18.0Byrock CBAC221 7 8 10.0Byrock CBAC221 12 13 10.0Byrock CBA C222 2 3 8.0Byrock CBA C222 3 4 108 14.0Byrock CBAC222 4 5 10.0Byrock CBA C223 4 5 17.0 44Byrock CBA C223 6 7 9.0 45Byrock CBA C223 7 8 7.0Byrock CBA C223 8 9 14.0Byrock CBA C223 9 10 12.0 41Byrock CBA C223 15 16 10.0 50Byrock CBA C223 19 20 8.0Byrock CBAC224 2 3 7.0Byrock CBAC224 3 4 110 17.0 52 42Byrock CBAC224 4 5 110 11.0 66Byrock CBA C224 5 6 41Byrock CBA C224 9 10 61Byrock CBAC224 12 13 12.0Byrock CBA C225 4 5 9.0Byrock CBA C225 5 6 115 12.0 83 43Byrock CBA C225 15 16 10.0 51Byrock CBA C225 18 19 50Byrock CBA C225 21 22 8.0Byrock CBA C225 24 25 11.0 45Byrock CBA C226 15 16 10.0Byrock CBA C226 21 22 8.0Byrock CBA C226 24 25Byrock CBA C226 30 31 73 11.0 55Byrock CBA C226 33 34 115 9.0 55Byrock CBAC227 15 16 32 11.0 53By rock CBA C228 17 18 205Byrock CBA C232 2 3 17.0 7.0Byrock CBA C232 3 4 7.0Byrock CBA C232 4 5 8.0Byrock CBA C232 5 6 23.0 47Byrock CBA C232 6 7 13.0 131Byrock CBA C232 7 8 11.0 53Byrock CBA C234 4 5 11.0Byrock CBA C234 5 6 46Byrock CBA C234 6 7 51 13.0Byrock CBA C234 8 9 12.0Byrock CBA C237 2 3 8.0Byrock CBA C237 15 16 7.0Byrock CBA C237 18 19 7.0Byrock CBA C237 27 7.0Byrock CBA C237 30 31 8.0 52Byrock CBA C237 33 34 253 24.0 48 177Byrock CBA C237 36 37 9.0 44Byrock C BA C237 39 40 16.0 49Byrock C BA C237 42 43 13.0 115Byrock CBA C238 1 2 7.0Byrock CBAC241 1 2 19.0 43Byrock CBAC241 2 3 9.0Byrock CBA C241 3 4 12.0Byrock CBAC241 8 9 9.0Byrock CBAC241 25 31 211Byrock CBAC241 26 27 48Byrock CBAC241 27 28 406Byrock CBAC241 28 29 203Byrock CBAC241 29 30 130 10.0Byrock CBA C241 30 31 70 10.0Byrock CBA C241 31 34 53Byrock C B A C242 8 9 14.0Byrock C B A C 242 9 10 130 27.0 57Byrock C B A C 242 12 13 13.0Byrock C B A C 242 14 15Byrock C B A C 242 17 18 14.0Byrock C B A C 243 1 2Byrock C B A C 243 2 3 9.0Byrock C B A C 243 7 8 10.0 40Byrock C B A C 243 9 10 8.0Byrock C B A C 245 4 5 7.0Byrock CBA C247 1 2 21.0 51Byrock C B A C 247 2 3 12.0Byrock C B A C 247 3 4 9.0Byrock CBA C247 8 9 7.0 140Byrock C B A C 247 14 15 7.0 10.0Byrock CBA C247 15 21
73

6600000 mN
6400000. mN
# CBAC231
# #CBAC228 CBAC21 8
CBAC204
*CE
5# CB
# CE
*CBAC148
*CBAC152
CBAC160 *CBAC162 f * CBAC1 59
.............# CBAC181
*CBAC166
*CBAC185
CBAC184
1000 i
100
10 -
1 -
0.1
0.01
X e
▲
A +
O
♦ As ppm □ Au ppm A Co ppm A C r ppm x Cu ppm o Mo ppm• Ni ppm + Pb ppm — Sb ppm ■ Zn ppm
CBA
C20
CBA
C44
CBA
C45
CBA
C78
CBA
C14
8
CBA
C15
2
CBA
C15
9
CBA
C16
0
CBA
C16
1
CBA
C16
2
CBA
C16
6
CBA
C18
4
CBA
C18
5
CBA
C20
4
CBA
C20
4
CBA
C21
8
CBA
C22
8
CBA
C23
1
CBA
C24
2
From m 2 2 1 6 2 6 1 4 1 1 1 3 8 1 2 7 9 5 3
To m 3 3 2 7 3 7 2 5 2 2 2 4 9 2 3 8 10 6 4
Figure 6.14 Anomalies of As, Au, Co, Cr, Cu, Mo, Ni, Pb, Sb, V and Zn in the regolith
carbonate facies of the transported regolith.
74

6600000 m.N S g |'s Oy CBAC231
^*CBAC2; CBAC223
CBAC216*c baC21 7
*CE
CBAC206{ CBAC207
CBAC106 CBAC81* * C 8 A C
*CE
CBAC29 CBAC24 . •
• •# CBAC23
CBAC18
# CBAC53
CBAC32
1000
100
10 -
0 1 -
001
0.001
o ° o■
X
— — X X
+ ^ +
o o o o
+
° 0 0 0 0 0 ° ° o °
□
♦ As ppm □ Au ppm A Co ppm ACr ppm x Cu ppm o Mo ppm♦ Ni ppm + Pb ppm - Sb ppm O V ppm x W ppm ■ Zn ppm
OO OO CO CO
O (J O < < < CD CD m O O O
T O ) c s ( < ) o o r - n « ( D N ( o r t NN M < N < N r t i n i » o o « ) o o o n r t ^ oU U U U U U U U U r j r : ' " . rr rz jz pj < < < < < < < < < O Q O O O O O a 3 m c ü C D t r ) C ü O Q C ü [ n < < < < < < <o o o o o o o o o g g g g g g g
CO T'-- CO 0 0 O ) (J) CD ^— t — x— CN CO ^ T < O r — t — t — cO r - r - r - r - ^ - r - r - ( N ( N ( N ( N C N ( N ( N C O ^ ' ^ ' ,:T < N C N C N C N C N < N C N O M C N O N C N C N C N C N C N C N < N C No o o o o o o o o o o o o o o o o o < < < < < < < < < < < < < < < < < < C O C Ü Ü Q C Q C O O Q C O C Ü C O C Q Q Q C Q C O C Q Q Q C O C D C Q O O O O O O O O O O O O O O O O O O
from (m) 5 6 7 9 8 1 2 10 8 9 8 9 1 7 18 2 11 8 3 1 4 4 3 9 3 4 8 4 8 9 9 12 15 27 1 7 15 6to (m) 6 7 8 10 9 2 3 11 9 10 9 10 2 8 24 3 12 9 4 2 5 5 4 10 4 5 9 5 9 10 10 13 16 28 2 8 16 7
Figure 6.15 Anomalies of As, Au, Cr, Cu, Mo, Ni, Pb, Sb, V, W, and Zn in the Fe-rich
facies of the transported regolith.
75

anomalies also occur in drill holes CBAC104, 109, 120,142,144, 146, 175, 177,19 L
(with W), 198, 201 (with Ni), 218, 238 (with Au) and 243. Elevated Pb concentrations
(Pb> 150) occur in drill holes CBAC14, 16,44, 47, 60, 198, and 218 (with Au). The
highest Pb anomaly (Pb = 1010 ppm) was detected from drill hole CBAC198 (Figure
6.16, Appendix 7).
6.3.3.2 ANOMALIES IN THE REGOLITH CARBONATE FACIES
The regolith carbonate facies is characterised by elevated Au contents (> 0.01)
observed in drill holes CBAC41, CBAC64, CBAC188 and CBAC204. In CBAC41 and
CBAC64 elevated Au is associated with Sb anomalies, whereas in CBAC188 Au is
associated with elevated Pb and W values, and in CBAC204 Au is associated with Cr
and Mo anomalies. Anomalous Cu values range from 50 ppm to 283 ppm. Significant
Cu anomalies of 277 ppm and 283 ppm were observed in drill hole CBAC6 and
CBAC85 respectively, where elevated Cu is not associated with anomalies in any other
element. Anomalous Cu is associated with elevated Pb and As in drill hole CBAC2.
Major concentrations of Zn were observed in drill holes 69 (with Cu), 81, 121 (partly
with Co), 167 (with W), 169 (with Sb) and 198 (Figure 6.17, Appendix 7).
6.3.3.3 ANOMALIES OF THE IRON-RICH REGOLITH FACIES
Anomalies in the Fe-rich saprolite facies are summarised in Figure 6.18 and Appendix
7. Elevated Au is associated with As and Mo in drill hole CBAC204. Arsenic is also
accompanied by elevated Cr, Pb, Sb and V in drill hole CBAC237 and with elevated Cu
in drill hole CBAC243. Another elevated Cu value was observed in drill hole
CBAC246 (62-63 m) and is associated with high Ni and Zn contents. The anomalous
association between Cu, Ni, Cr and V was also observed in drill hole CBAC16.
Elevated Zn values are associated with elevated Ni in drill holes CBAC27 and
CBAC246, and with high Pb contents in dill holes CBAC104 and CBAC205 (with Sb).
Chromium anomalies occur in drill holes CBAC65 and CBAC 231 (with Mo, Sb, V).
6.3.3.4 ANOMALIES IN THE MANGANESE-RICH FACIES
In the Mn-rich facies of the in situ regolith (Figure 6.19, Appendix 7), Anomalous As
was observed in drill holes CBAC 174 and 167. In CBAC 174, As is associated with
elevated Zn. Elevated Au values range from 0.022 ppm to 0.077 ppm and occur in drill
holes CBAC 122 (3-5m) associated in the upper part with Co (287 ppm), Cu (129 ppm)
76

• CBAC238LU Lli • CBAC239 ^E E Eo o oo o • CBAC243 §o LO # • C BAC 245 S
6600000 mN CBAC233
*?£aC229♦6 baC217
^CBAC207j#CBAC198
CBAC247
yCBAC193 : BAC188
6550000 mN*CBAC133
do co rs r- CO 00 CO 9°O O O o
•CBAC104 g g g 8
5bAC1 18 • *C0AC!^r:BAC125 o
C92##*CBAC80
................ »CBAC66 . . .CBAC61
CBAC63 « ACBAC60
CBAC37,— * '0)0 o
CBAC16# * Ä ä C21 o o o
•►CBAC43CBAC44
cbacTo Ä 1 o o oCBAC147
CBAC145 # *_CBAC148 ♦CBAC149
»CBAC150 *CBAC151
CBAC1 43 * ♦• CBAC139
6500000 mN ♦ CBAC154
• CBAC155
GBAC157* ^ CBAC160
CBAC1B2* ♦ CBAC161 • CBAC164
• CBAC168
2$CBAC171 •CBAC186
CBAC175 CBAC180, *CBAC\C173 • CBAC184 CBAC183CBAC173
♦ As ppm □ Au ppm A Co ppm ACr ppm xCu ppm OMo ppm♦ Ni ppm + Pb ppm -S b ppm OV ppm x Wppm ■ Zn ppm
10000 !
1000 -
Ü 10 -
o^mr-TTnncDcoCNCNCNCOCO ^ -'T
r-cDinacN^Nar-CNNh-ror-^oocDT-nLOCDcn’-'TorooDC N C N C O ^ T T ' T ^ t / n D C D C D C D N b - r o C O C D C D a i C D C D O I O a a D O
T-r'-'q-^h-cob-mcDCNCD ( J Q ’— C N C D ^U O C D C ß C D O
Figure 6.16 Anomalies of As, Au, Co, Cr, Cu, Ni, Pb, Sb, V and Zn in the in situ clay-silt-
gravel facies. Data for this figure are in Appendix 7.
77

CBAC245 «CBAC244HI UJ u j : HI UJ
660000(£mN E E: E E8
g ; o ; o8
8 : 8 :o . o
8 :8 ° #CBAC214
i f )8 8
•CBAC211^ Ü B A C 2 0 7
JOTAC198 ' #CBAC193 •CBAC188
CB
AC
82 C
BA
C83
CB
AC
85 C
BA
C88
ACBAC118•CBAC 9 ^ •■ •#C 8A C 81
•CBAC124
•CBAC133 ♦C8AC696550000 mN
CBAC59 %CBAC58 CBAC55* £ § AC41 *CBAC44
CBAC40 C0AC38
C BAC13.tCBAC16- •CBAC 10 •CBAC6
*CBAC1 CBA0143- C B A C 142** CBAC141
•CBAC145
•CBAC150 •CBAC151
6500000 mN
•CBAC159
•CBAC162♦CBAC164
•CBAC167•CBAC169
CBAC175 «CBAC178 CBAC173* *
10000 -r
1000 -
o- oA + ^
T t ( O C O C O O < 0 < £ » C O C O C O O ^ - C OÜ o o< < < O U O O O O O OC A t t S < < < < < < < < 0 0 0 0 0 0 0 0 0 0 0 0 0 0 0 0 0 0 0 0 0 0 0 0 0^ w ^ \ r \ / \ r \ t s t \ / «w r s r f \ r f \ r f \ rC\ c%\ ( Y l r f t m n r t r t l i ’A f t ' i m r t l r r t f i r i f f l f t l n i ' i m r n r A fYl r . ' i r f \
O O O O O O O O O O O O O O O O O O O O O O O O O
♦ As□ Au ▲ Co A Cr x Cu o Mo « Ni + Pb _ Sb o VX w□ Zn
Figure 6.17 Anomalies of As, Au, Co, Cr, Cu, Mo, Ni, Pb, Sb, V, W and Zn in the regolith carbonate facies of the in situ regolith. Data for this figure are in Appendix 7.
78
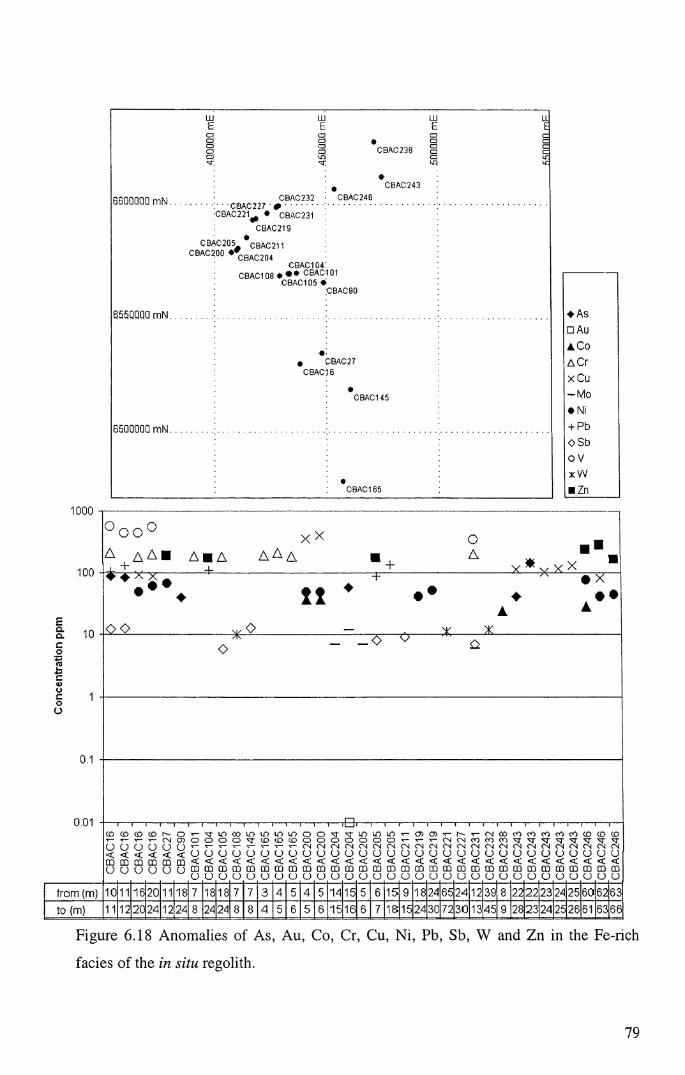
CBAC238 §
CBAC243CBAC246CBAC232
CBAC227 0 CBAC221^ ♦ CBAC231
CBAC219
66QQGQQ m N ...........
CBAC20: CBAC200 «
'5* CBAC211 * CBAC204
CBAC104:CBAC1 08 * • * CBAC1 01
CBAC105 •CBAC90
655QQQQ mN
CBAC27CBAC16
CBAC145
65G0G00 mN
CBAC165
1000 - I-----
t ^ - O T - ' T L n o o L n m i m m o o ' ^ r x r m i L n L nCNCT>0000^<D<0<00000000
from (m)
Figure 6.18 Anomalies of As, Au, Co, Cr, Cu, Ni, Pb, Sb, W and Zn in the Fe-rich
facies of the in situ regolith.
79

and Ni (190 ppm) anomalies; CBAC123 (1-2 m), CBAC191 (20-21 m), CBAC195 (31 -
32 m) and CBAC198 (15-17 m) associated in the upper part with Co (674 ppm), C u
(155 ppm), Ni (126 ppm) and Pb (212 ppm). Cobalt anomalies range from 182 ppm to
674 ppm. In addition to the previously mentioned anomalies of Co with Au, elevated
Co values of 254 ppm, 259 ppm and 415 ppm occur in drill holes CBAC 211,
CBAC191 and 177 (associated with Cu and Ni) respectively. A chromium anomaly
(155 ppm) is present in drill hole CBAC195 (27-33 m). Anomalies of Cu closely
correlated with elevated Ni occur in drill holes CBAC 122, 177 and 198 (as mentioned
above). A Ni anomaly (161 ppm) occurs in drill hole CBAC201 (27-33 m). Two
anomalous Pb values (78 ppm and 86 ppm) were observed in drill holes CBAC 118 (5-
6 m) and CBAC 119 (0-1 m) respectively. Other elevated Pb values were found in drill
hole CBAC198 (15-71 m). Zinc anomalies occur in drill holes CBAC167 associated
with elevated As, CBAC 174, CBAC 176 and CBAC 198 (Figure 6.19, Appendix 7).
6.4 ELEMENT ASSOCIATIONS
Cluster analysis (CA) was used to explore the relationships between As, Au, Ba, Co,
Cr, Cu, Mo, Ni, Pb, Sb, V and Zn in addition to major elements Ca, Fe, Mg and Mn.
Elements were excluded from the analysis when more than 30% of their records are
below detection limits (i.e., Au, As, Bi, Sb and W). Aluminium and K values were also
excluded because of potential errors for these elements in the analytical technique,
particularly at high concentration (Chan et al 2001). As explained in the data analysis
chapter, cluster analysis is an explorative technique that provides a reduction in the
dimensions of the data by classifying them into groups.
Dendrograms of the inter-elemental relationships in the top metre, transported and in
situ regolith facies are shown in Figures 6.20 and 6.21. Groups (Clusters) of elements at
selected Similarity Distance Levels (SDL=10) represent element associations at that
level. For more detailed investigations, such as element-to-element relationship, the
clustering needs to be decided on high similarity level (low SDL).
80

LUE
LUE
gj gg gCDcn o
50000.mN
65D000D.mN
10000 i
1000 -
I 100 -
1 -
•CBAC211
*CBAC201•CBAC198
CBAC119*CBAC118
CBAC123* CBAC122
•CBAC145
•CBAC167
CBAC174 »CBAC177• *
CBAC176
♦ AS ppm □ Au ppm A.Co ppm ACr ppm xCu ppm♦ Ni ppm + Pb ppm o V ppm ■ Zn ppm
+ + O O B * o 5 A A▲
+ A
0 1 -□ □ □ □
□ □□ □
CB CB CB CB CB CB CB CB CB CB CB CB CB CB CB CB CB CB CB CB CB CB CB CB CB CB CBAC AC AC AC AC AC AC AC AC AC AC AC AC AC AC AC AC AC AC AC AC AC AC AC AC AC AC118 119 119 122 122 123 145 167 167 174 174 174 176 177 177 177 191 191 195 195 198 198 198 198 201 211 211
from (m) 5 0 9 3 4 1 51 6 11 3 4 5 37 8 9 13 19 20 27 31 15 16 17 19 27 46 47to (m) 6 1 10 4 5 2 55 7 13 4 5 6 39 9 11 15 20 21 33 32 16 17 18 20 33 47 48
Figure 6.19 Anomalies of As, Au, Co, Cr, Cu, Ni, Pb and Zn in the in situ Mn- rich facies.
81

SDLElement
Figure 6.20 Elements cluster dendrograms of the clay-silt-gravel facies of the top metre regolith unit (A) and the transported regolith unit clay-silt-gravel facies (B), regolith carbonate facies (C) and (D) Fe-rich facies. SDL represents similarity distance level (see the text)
SDLZ i e i t t c i i t
SDLElem ent
HgBa
CuZnNi
HnCoCa
CrV
FeAs
PbAu
0 5 10 15 20 25
SDL=10
SDLE lem ent
0+------
reCu
18 =T|
Zn i i ------1Ni 12
CrV
610 J
Ho 7Pb 9
Kg 3
Hn 2Ba 5
SDL 0Elem ent Num +-------
CrNi
911 J
V 13Co 8Cu 10
Mn 2Pb 12As 5
Hg 3Ba 7Ca 4
Fe i
1 SDL=10
"1SDL^IO
Figure 6.21 Elements cluster dendrograms of the in situ regolith unit. (A) Clay-silt- gravel facies, (B) regolith carbonate facies, (C) Fe-rich facies and (D) Mn-rich facies. DSL represents similarity distance level (see the text).
82

Principal component analysis (PCA) is also applied to determine the main geological
components (processes) that control the suggested element associations. Significant
components were determined based on total variance explanations. The statistical
stages in calculating the total explained variance, component (factor) statistics table and
extracting the desired number of components using SPSS statistical software have been
described by Coakes and Steed (2001). The final rotated factor matrices [loadings o f
variables (elements) on components (processes)] for the regolith facies are displayed in
Tables 6.4 and 6.5. These variables have a loading of 0.3 or greater on at least one
component and they explain ^69% of total variance (except in clay-rich in situ regolith
= 61). Complex variables may have high loadings on more than one component.
The element associations of the regolith facies in the Girilambone region are
summarised in Table 6.6. In the top meter it was only possible to analyse the clay-silt-
gravel facies because of the small number of samples with regolith carbonate and Fe-
rich facies (< 10 samples). Utilizing cluster and principal component analyses to
determine element association shows that the pathfinder elements in the regolith
environment are mainly associated with Fe, Mn or Ca-Mg, in addition to a few single
element clusters or components. These associations are:
• Iron in the clay-silt-gravel facies of the top metre unit, and generally in all
transported regolith units, is mainly associated with Cr-V ± Ni ± As ± Cu ± Zn ± Pb
± Sb. Part of this association (Fe-V-Cr) probably reflects association of these
elements in iron oxide minerals (particularly hematite) and/or to lesser extent the
influence of intrusive mafic and ultramafic rocks.
• In the in situ regolith clay-gravel and regolith carbonate facies Fe is significantly
associated with Cu and Zn whereas in the Fe- and Mn- rich facies it associates with
As-Pb-Au and As, Zn, Ca, Ba, Mg and V respectively. PCA generally shows that Fe
enrichment is possibly controlling the dispersion of Cu+ Zn +V± Pb ± As in all in
situ facies. The significant associations of Cu and Zn with Fe and Mn are possibly
related to absorption of these metals by Fe and Mn oxide/oxyhydroxide minerals.
83

• Manganese is associated with Ca-Co ± Cu in the clay-gravel facies of the top m etre
and transported regolith, transported regolith carbonate facies and Mn-rich in s i tu
facies. This association reflects Mn oxide/oxyhydroxide minerals (e.g.,
lithiophorite, todorokite, bimessite) that can accommodate Co and Ca in th e ir
structures. Energy dispersive X-ray Analysis (EDXA) of Mn minerals explored this
Table 6.4 The rotated factor matrices with loading of elements on each component o f
the principal component analysis. Table A represents clay-silt-gravel faces of the top
metre. B, C and D represent clay-silt and gravel, Ca-Mg and Fe rich facies of the
transported regolith, respectively.
C om ponen t
1 2 3 4 5Cr .879
V .876
Fe .814 -.331Ca .789 -.315
Co .685 .363
Mn -.458 .685
Pb -.509 -.583
Zn .944
Cu .716 .506
Ni .622 -.348 .341
Mg .933
Ba -.495 .758
Mo .946
C o m p o n e n t
1 2 3 4 5Fe .898
V .772 .309
C r .769 .396
As .696 -.307
C u .578 .544 .326
C o .789
Z n .656 .558
Mn -.36 9 .593 .342
Mg .740
Ba .651
Mo -.571 .433
Au -.800
Ni .340 .720
Pb -.829
C a .717
A B
C om ponen t
1 2 3 4 5 6V .877
C r .859
Pb .793
A s .675
Fe .581 .657
Sb .634
Bi .324 .716
Cu -.707 .301
W .660 .326
Co -.426 -.540
Ni -.301 .817
Ca -.421 -.766
Mn .727
Mg -.332 .697 .397
Ba 641
Mo -.852
Zn .605 663
C o m ponen t
1 2 3 4 5Fe .822 .311
V .778
Cr .675 -.327
Cu .641 .577
As .602
Mg .923
Ca .820
Ni -.811
Co -.308 .827
Zn .801
Mn .637
Pb -.876
Ba .387 .671
Au .882
C D
84

Table 6.5 The rotated factor matrices with loading of elements on each component o f
the principal component analysis. Tables A, B, C and D represent clay-silt and gravel
facies, regolith carbonate facies, Fe- rich facies and Mn- rich facies of the in s i tu
regolith, respectively.
C om ponent
1 2 3V .85
Ba .69 .39
Cr .68 -
Mn -
Zn .85
Fe .84
Cu .73
Ni -
Mg .42 .67
Ca - .57
A
C om ponent
1 2 3 4 5V -.838Cr -.805Cu .658 .375 -.331Ni .654
Au -.896Zn .613 .661
Ba .637 -.544
Fe .784
Mg .421 -.704
As .670
Mn .898
Co .315 .694 .427
Pb -.780
Ca -.318 .700
C
C o m p o n e n t
1 2 3 4Fe .901
C u .8 7 5
Z n .8 7 0
Ni .5 0 6
V .9 0 4
C r .9 0 3
C a -.371 .7 3 2
P b -.3 2 8 -.6 8 6
M g -.5 0 4 .6 2 6
M o -.7 4 7
B a .7 3 6
M n .4 5 8 .5 2 2
B
C om ponen t
1 2 3 4 5Cr .892 -.321V .874 .330
Ni .778 -.322 .341
Ca -.608 -.335 .512
Cu .843
Mg -.817 .437
Mn -.403 .587 .445
Zn -.336 .866
Fe .730 .480
C o .556 -.593 .324
Pb -.772
Ba -.363 -.448 .614
As .362 -.765
Au -.345 -.746
D
85
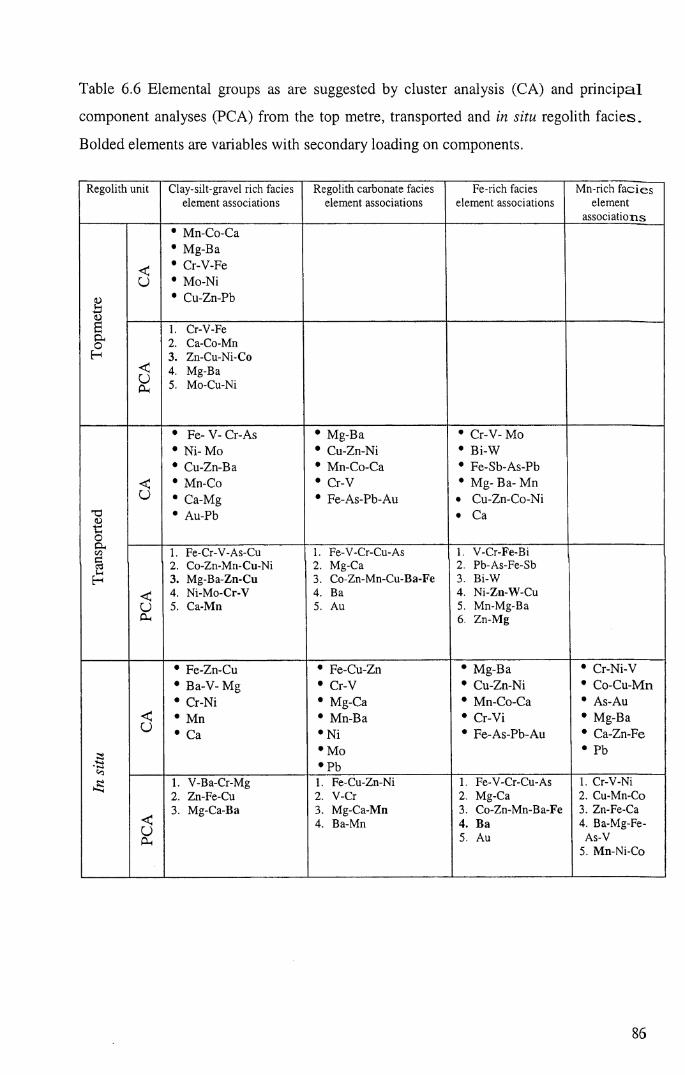
Table 6.6 Elemental groups as are suggested by cluster analysis (CA) and principal
component analyses (PCA) from the top metre, transported and in situ regolith facies.
Bolded elements are variables with secondary loading on components.
R ego lith u n it C lay -silt-g ravel rich facies R ego lith c a rb o n a te facies F e-rich facies M n-rich f a c i e se lem en t asso c ia tio n s elem en t a sso c ia tio n s e lem en t a sso c ia tio n s e lem en t
a s s o c ia t io n s
• M n -C o -C a
• M g -B a
< • C r -V -F e
Ü • M o -N i
• C u -Z n -P b
O)£ 1. C r-V -F eD-O 2. C a-C o-M n
H
PCA
3. Z n -C u -N i-C o4. M g-B a5. M o-C u-N i
• F e - V - C r - A s • M g -B a • C r - V - M o
• N i- M o • C u -Z n -N i • B i -W
• C u -Z n -B a • M n - C o - C a • F e - S b - A s - P b
< • M n -C o • C r -V • M g - B a - M nU • C a -M g • F e - A s - P b - A u • C u - Z n - C o - N i
• A u -P b • C a
oC -co 1. F e-C r-V -A s-C u 1. F e -V -C r-C u -A s 1. V -C r-F e -B ic03 2. C o -Z n -M n -C u -N i 2. M g-C a 2. P b -A s-F e -S b
H 3. M g -B a -Z n -C u 3. C o -Z n -M n -C u -B a -F e 3. B i-W
< 4. N i-M o -C r-V 4. Ba 4. N i-Zn-V V -C u
u 5. C a -M n 5. A u 5. M n -M g -B a6. Z n -M g
• F e -Z n -C u • F e - C u - Z n • M g - B a • C r -N i-V
• B a -V - M g • C r -V • C u -Z n -N i • C o - C u - M n
• C r -N i • M g -C a • M n - C o - C a • A s -A u
< • M n • M n - B a • C r - V i • M g -B au
• C a • N i • F e - A s - P b - A u • C a - Z n - F e
a
■'S
• M o • P b
• P b1. V -B a-C r-M g 1. F e -C u -Z n -N i 1. F e -V -C r-C u -A s 1. C r-V -N i2. Z n -F e -C u 2. V -C r 2. M g -C a 2. C u -M n -C o
PCA
3. M g -C a -B a 3. M g -C a -M n 3. C o -Z n -M n -B a -F e 3. Z n-F e-C a4. B a-M n 4. B a 4. B a-M g-F e-
5. A u A s-V5. M n -N i-C o
86

association between Mn and Co and to some extent Ca (Chapter 9). Manganese i s
associated with Ba in the Fe-rich facies of the transported and in situ regolith and in th e
in situ carbonate facies. This association represents the typical hollandite composition,
which is also observed in this study (Chapter 9).
• The magnesium-Ca association is predominantly observed in the regolith carbonate
facies. However, this association is not significantly correlated with any element,
which means that the Ca-Mg enrichment process has limited influence on
dispersion of the elements. A magnesium-Ba association is noticed in the in situ
facies and in the transported Fe-rich and regolith carbonate facies. This association
possibly reflects occurrences of Ba as barite or within Mg-clay minerals (see
Chapter 9).
• Gold and to some extent Pb and Mo are not associated with any of the Fe, Mn and
Ca-Mg enrichment facies, which generally indicates the independent behaviour.
Lead is associated with As, Sb and Fe particularly in the Fe-rich facies.
6.5 SUMMARY AND CONCLUSIONS
The regolith of the Girilambone region can be subdivided into the top metre (as a
general representative of soil), transported and in situ regolith based on visual field,
petrographic and chemical analysis. These units also can be further classified based on
clay-gravel, carbonate, iron and manganese enrichment, using the boundaries of Ca &
Mg > 1 %, Fe > 8.5 % and Mn > 0.1 %. These boundaries are based on comparison
between chemical composition and visual and petrographic examination. The clay
facies represents samples that do not include any Ca, Mg, Fe and Mn enrichment.
To understand the processes that affected element distribution, accumulation and
association, the thresholds and anomalies of the elements were calculated in each
regolith facies and only for element values above the detection limits. Element
thresholds can be calculated using two methods of estimation (MAD+2Median and
boxplot). Generally the boxplot estimation of the threshold is higher than that from the
MAD method. The results showed significant enrichment of Au, Cu, Zn and to some
extent Pb in a profile extending from drill hole CBAC119 to drill hole CBAC125 in the
87

northwest Sussex area. The regional background values of Au, Cu, Pb and Zn a re
higher in the in-situ facies, which possibly relates to parent material enrichment.
Arsenic, Cr and V showed higher background values within the Fe facies. This relates
to adsorption or incorporation by secondary Fe oxides (hematite and goethite).
Major and trace element contents determined in clay- carbonate- Fe- and Mn-rich facies
were subjected to cluster and principal component analyses. Cluster analysis generally
revealed four element associations, which are Ca and Mg (carbonate group) association,
MnO (manganese oxides) association, Fe2Ch (iron oxides) association and Ni and C r
(mafic group) association. Principal component analysis generally showed similar
groups, representing association with calcrete (Ca+Mg), adsorption (Fe-Mn oxides) and
bedrock influences.
Cluster analysis and principal component analysis were used to show the main factors
controlling the trace element associations. The association of base metals with Fe and
Mn is clear in the in situ facies. An association of mafic group element (i.e., Cr, V) with
Fe is common in the top metre clay and transported facies. No significant association
between regolith carbonates facies and Au was observed.
88
7. CHAPTER SEVEN: GROUNDWATER CHEMISTRY AND HYDROGEOLOGY
7.1 INTRODUCTION
Groundwater is a potentially useful sampling medium for successful mineral
exploration (e.g., Gray, 1991; Giblin and Dickson, 1992; Gray, 2001; Jeong, 2001;
Giblin and Rutherford, 2003; Cameron et al., 2004; Caritat and Kirste, 2004; Phipps et
al., 2004; Pirlo and Giblin, 2004; Cameron and Leyboume, 2005). It is also one of the
agents important in weathering processes and the geochemical evolution of the regolith,
given its reactive nature and ability to transport elements and dissolved gases (Giblin
and Rutherford, 2003). An aim of the study was to investigate potential geochemical
signatures in groundwater from background and weakly mineralised sites. This would
also assist in understanding the geochemical controls on groundwater compositions.
This chapter examines the hydrogeology of the area, the likely hydrogeochemical
processes, water types and water-rock interaction, using observations of the
groundwater major and trace element compositions. It also includes interpretation of
36C1/C1 isotope ratios and calculated mineral saturation indices of potential aquifer
minerals in the area.
7.2 SITE DESCRIPTIONS
Groundwater samples were collected from drill holes CBAC217, CBAC218,
CBAC219, CBAC227, CBAC231, CBAC235, CBAC242, CBAC243 and CBAC248 in
the Byrock area and CBAC150, CBAC154, CBAC158, CBAC160 and CBAC173 from
the Hermidale area (Figure 7.1).
A digital elevation model and the present drainage pattern in the Byrock area show a
northwest trending ridge separating the Byrock catchment from the Bogan River
(Figure 7.2). In the Byrock area the Bogan River and Mulga Creek are flowing north
whereas Tindarey Creek is flowing north-northeast (Figure 7.2).
89
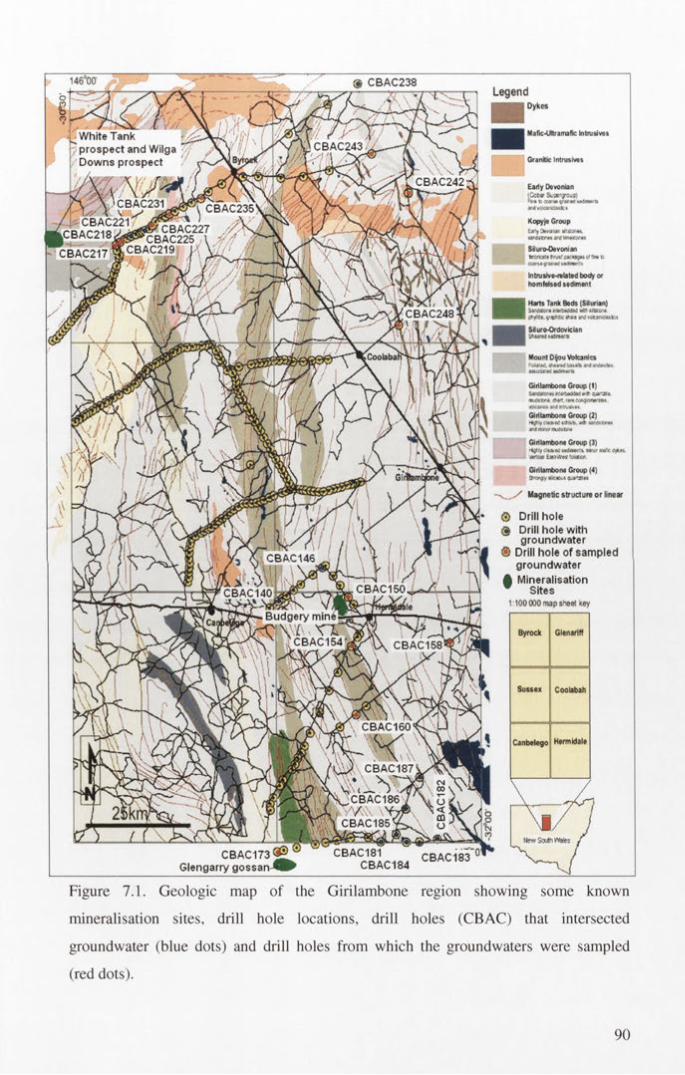
Legend
Early Devonian(Coca' Suor—H n # t ) (30*TM* V — andrtuaradASfcs
__ -rjrgroup)to (to*rw v***c Mdvmr *
Kopyjo Grouphaty Dfrvorar «: iiorte w ^ i t m a rc tw>«ror«s
Sil uro-Oe vornanIrene*!« Trj%:s* tag*t c* fn* to rc4M#ijffcr*0 AMlnwr'i
Intnjsive-rtlated body or homfotead sedimont
Harts Tank Bods (Silurian)S*<3ttC<’* a-WUMnl *AP ftflBCr« oty**. pvMic Jtee <r<c vott«r castes
Siluro-OrdovkianStMdM sawner s
Mount Oijou Votaanics#**r*C U « lk an«! »KSavA.«
aaaoOMM MflnMfS
Girilambono Group (1)Sanctforvi n:c*TjdiMeo w<r ojarata. flMMtora fr«rT. »an» c<yv*e*n#faiM «totcanta ar d r*.r-.*«*v
Girilambono Group (2)HgNy «r «restoreand arcrmjds torn«
Girilambono Group (3)r i j f »y C1&&4C sedan* *.s i r r e im rt cyfcfti
■ vbogo EasHVe«'CHOcn
Girilambono Group (4)Bwgfy a*:*«.; auar»«*
Magnetic structure or linear
0 Drillhole 0 Drill hole with
groundwater ® Drill hole of sampled
1 groundwater \ " A Mineralisation
- U w Sites * 1:100000 map sneet key
Byrock Glenarlff
Sussex Coolabah
Canbelego Herrn idale
Glengarry gossan‘:181 CBAC183CBAC184
Figure 7.1. Geologic map of the Girilambone region showing some known
mineralisation sites, drill hole locations, drill holes (CBAC) that intersected
groundwater (blue dots) and drill holes from which the groundwaters were sampled
(red dots).
90
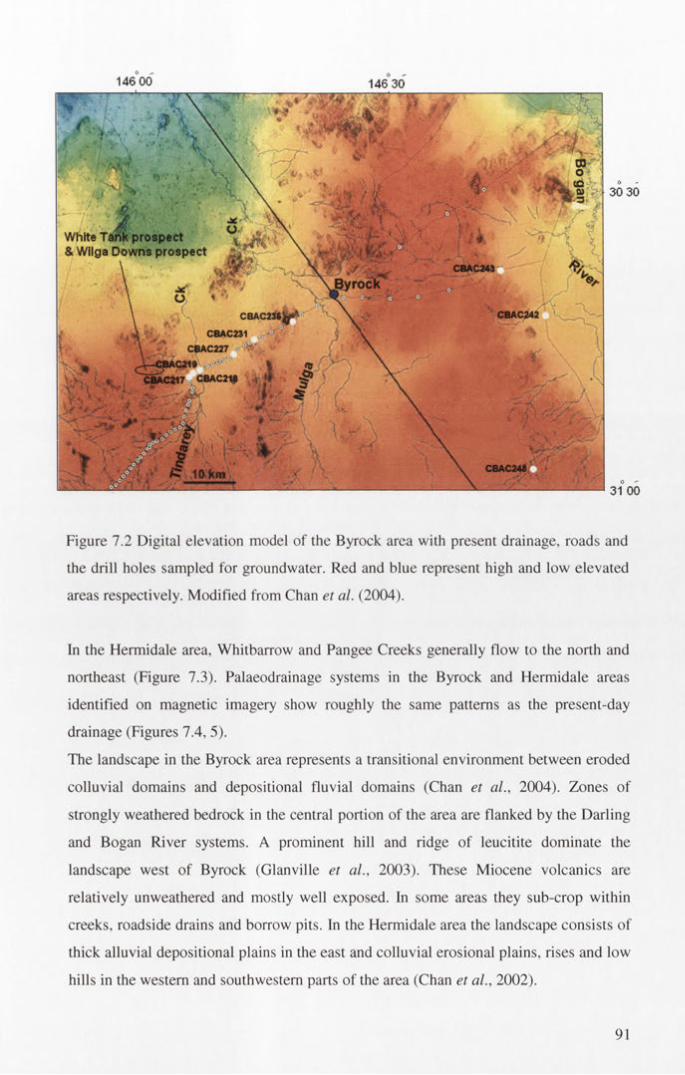
146 00 146 30
30 30
31 00
Figure 7.2 Digital elevation model of the Byrock area with present drainage, roads and
the drill holes sampled for groundwater. Red and blue represent high and low elevated
areas respectively. Modified from Chan et al. (2004).
In the Hermidale area, Whitbarrow and Pangee Creeks generally flow to the north and
northeast (Figure 7.3). Palaeodrainage systems in the Byrock and Hermidale areas
identified on magnetic imagery show roughly the same patterns as the present-day
drainage (Figures 7.4, 5).
The landscape in the Byrock area represents a transitional environment between eroded
colluvial domains and depositional fluvial domains (Chan et al., 2004). Zones of
strongly weathered bedrock in the central portion of the area are flanked by the Darling
and Bogan River systems. A prominent hill and ridge of leucitite dominate the
landscape west of Byrock (Glanville et al., 2003). These Miocene volcanics are
relatively unweathered and mostly well exposed. In some areas they sub-crop within
creeks, roadside drains and borrow pits. In the Hermidale area the landscape consists of
thick alluvial depositional plains in the east and colluvial erosional plains, rises and low
hills in the western and southwestern parts of the area (Chan et al., 2002).
91

m . . ;
H e i m i d a l e
W hitbarrow
A *t V PangeeCr ecK
M j
, . ■ 4 - 7 -
CBAC231CBAC217.
218,219
)fjCBAC248.’10 Km
146=00 146° 30’
30=30
31°00
Figure 7.3 Digital elevation model of the Hermidale area with present drainage. Red
and blue represent high and low elevated areas respectively. Modified from Chan et al.
(2002). Gaps in data due to mining lease restriction.
Figure 7.4 Magnetics imagery (1.5 vertical derivative) of the Byrock area showing
magnetic drainage lines (paleodrainage), magnetic basement and the groundwater drill
holes. Present day drainage is in blue. Modified from Chan et al. (2004).
92

w m m ® -CB AC 146% '!
CBAC140
CBAC1541[CBAC158!
;/ i &
CBAC160,
tkFC BAC 1 87 'i;
CBAC186
CBAC1855'/4l'£$C B A C 182
^B A C 183 { {wmmmCBAC181' ;3£IS: CBAC184,<
20 Km V
4 5 0 0 0 0 500000
6500000
6450000
Figure 7.5 Magnetics imagery (1.5 vertical derivative) of the Hermidale area showing
magnetic drainage lines (paleodrainage), magnetic basement, the drill holes that
intersected groundwater (black dots) and the drill holes from which the groundwaters
were sampled (red dots). Present day drainage is in blue. Modified from Chan et al.
(2004).
7.3 HYDROGEOLOGY
The groundwater in the Byrock area was intersected within weathered silty sandstones
interbedded with phyllite, felsic volcanic and siltstone with breccia (Figure 7.6). In the
Hermidale area it was detected within weathered phyllitic siltstones sandstones (Figures
7.7,8). The first appearance of groundwater in the drill hole was recorded as the water
table depth (Chan et al., 2002; 2004). These depths were used to identify the
groundwater flow directions and to calculate the hydraulic gradients along the flow
93

path. The water table mirrors topography suggesting that the aquifers are unconfined.
The general flow directions in the Byrock and Hermidale areas are from southwest to
northeast (Figures 7.9,10). The hydraulic gradients are low (< 0.0035), which suggest
slow groundwater flow.
7.4 ELECTRICAL CONDUCTIVITY, pH/Eh AND TEMPERATURE
Groundwater compositions are tabulated in Appendix 3. Electrical conductivity (EC)
ranges from 843pS/cm to 31600 pS/cm. In the Byrock area the EC is significantly
variable and the lowest value (843pS/cm) was recorded to the west of Byrock
(CBAC235). In this area the aquifer is mainly in weakly weathered leucitite rocks
(Glanville et al., 2003). These rocks form Byrock Hill and are covered by very thin
transported sediments. Therefore the fresh groundwater is possibly a result of minimal
water-rock interaction between rainwater and the weakly weathered aquifer rocks. Low
160 --
150 -
140 -
130 -
I 120 -
1-
C B A C 217 C B A C 219
L o c a t io n
CBAC221 C B A C 225 C B A C 227
100 -
Wter tableTransported sedimentsClaystoneFelsic volcanicsSilty sandstone / phylliteMeta- siltstone and breccia
Figure 7.6 Cross-section showing how the water table mirrors topography along the
groundwater flow between and CBAC217 and CBAC227 in the western part of the
Byrock area (see Figure 7.9 for location).
94

280 -i
260
240
220
5 200»!■«czt— 180W
j J Transported g ravel,sand and clay
K B fhyllite /sütstone unit
. . . A. . . Ground surface
— - — End oi the hole
-----*— Watei T able
CBAC140 CBAC154 CBAC158
Locution
Figure 7.7 Lithologic cross-section showing how the water table mirrors topography
along the groundwater flow between CBAC140 and CBAC158 in the northern part of
the Hermidale area (see Figure 7.10 for location).
330
290 -
270 -
230
230 -
210 -
190 -
170 -
150C B A C 1S 4
Lot afion
i . j * : - T ra n s p o rtd e g ra v e l .s a n d .c lay
P h y l l i t e / e i l t e t o n e u n i t
G ro u n d s u r fa c e
w a t« t a b le
E n d o f th e h o le
Figure 7.8 Lithologic cross-section showing how the water table mirrors topography
along the groundwater flow between CBAC173 and CBAC182 in the southern part of
Hermidale area (see Figure 7.10 for location).
9 5
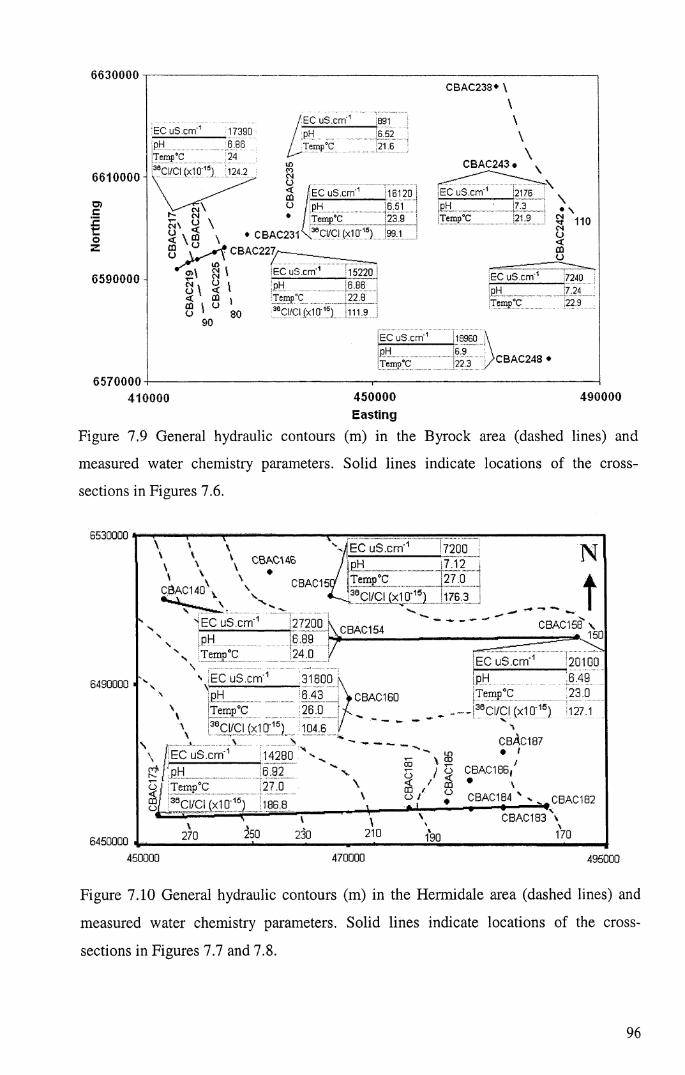
6630000CBAC233* \
6610000
o>£szt -oz
6590000
EC uS.cm'1 17390/ EC uS.cm'1
/ PH8916.52
pH 6.86 / Temp°C 21.6
\
CBAC243'
/ EC uS.cm'1 16120 EC uS.cm'1 2176/p H 6.51 PH 7,3/ Temp°C 23.9 Temp°C 21.9
\ 36CI/CI (x10'15) 99.1
rv i »
CBAC227/
S > Oo \ << CD CD \ U ( \ 1 80
EC uS.cm'1 15220pH 6.86Temp°C 22.836CI/CI(x10'15) 111.9
EC uS.cm''
EC uS.cm''pHTemp°C
_18960 "e.9 22.3
pHTernp°C
CBAC248 ♦
\• \
3 110CNO<CDO
_7240_7.24229
6570000410000 490000450000
Easting
Figure 7.9 General hydraulic contours (m) in the Byrock area (dashed lines) and
measured water chemistry parameters. Solid lines indicate locations o f the cross-
sections in Figures 7.6.
6530000"^1 EC uS.cm -1 7200
CBAC146 / p H 7.12
CBAC15c/ TemP°c 270^ —_36CI/CI (x10‘15) 176.3CÖAC140
CBAC15EIEC uS.cm’ 27200'6.8924.0
CBAC154 * . 150
EC uS.cm' 20100 6.49
Temp°C 23.0
36CI/CI (x10'15) 127.1
31600 \ 6.43 N
Temp°C 26.0 \ i36CI/CI (x10'15) 104.6 /
6490000CBAC160
CBÄC187• I14280
6.9227.0
CBAC184
CBAC183 \
6450000 .470000450000 495000
Figure 7.10 General hydraulic contours (m) in the Hermidale area (dashed lines) and
measured water chemistry parameters. Solid lines indicate locations of the cross-
sections in Figures 7.7 and 7.8.
96
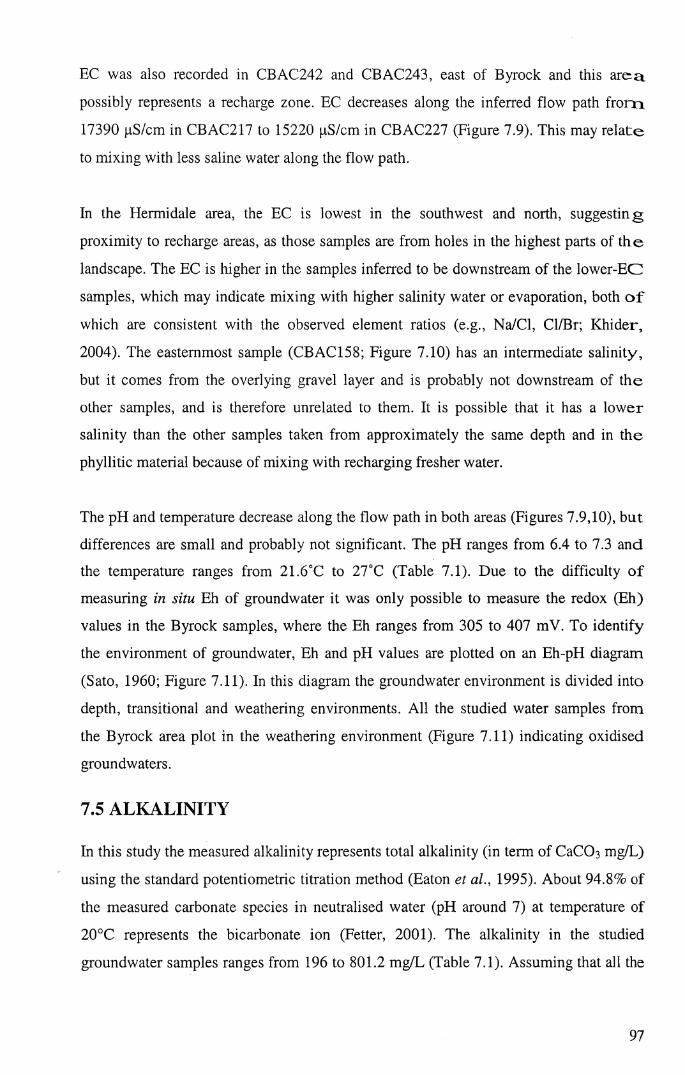
EC was also recorded in CBAC242 and CBAC243, east of Byrock and this a re a
possibly represents a recharge zone. EC decreases along the inferred flow path from
17390 pS/cm in CBAC217 to 15220 pS/cm in CBAC227 (Figure 7.9). This may relate
to mixing with less saline water along the flow path.
In the Hermidale area, the EC is lowest in the southwest and north, suggesting
proximity to recharge areas, as those samples are from holes in the highest parts of the
landscape. The EC is higher in the samples inferred to be downstream of the lower-EC!
samples, which may indicate mixing with higher salinity water or evaporation, both o f
which are consistent with the observed element ratios (e.g., Na/Cl, Cl/Br; Khider,
2004). The easternmost sample (CBAC158; Figure 7.10) has an intermediate salinity,
but it comes from the overlying gravel layer and is probably not downstream of the
other samples, and is therefore unrelated to them. It is possible that it has a lower
salinity than the other samples taken from, approximately the same depth and in the
phyllitic material because of mixing with recharging fresher water.
The pH and temperature decrease along the flow path in both areas (Figures 7.9,10), but
differences are small and probably not significant. The pH ranges from 6.4 to 7.3 and
the temperature ranges from 21.6°C to 27°C (Table 7.1). Due to the difficulty of
measuring in situ Eh of groundwater it was only possible to measure the redox (Eh)
values in the Byrock samples, where the Eh ranges from 305 to 407 mV. To identify
the environment of groundwater, Eh and pH values are plotted on an Eh-pH diagram
(Sato, 1960; Figure 7.11). In this diagram the groundwater environment is divided into
depth, transitional and weathering environments. All the studied water samples from
the Byrock area plot in the weathering environment (Figure 7.11) indicating oxidised
groundwaters.
7.5 ALKALINITY
In this study the measured alkalinity represents total alkalinity (in term of CaCCL mg/L)
using the standard potentiometric titration method (Eaton et al., 1995). About 94.8% of
the measured carbonate species in neutralised water (pH around 7) at temperature of
20°C represents the bicarbonate ion (Fetter, 2001). The alkalinity in the studied
groundwater samples ranges from 196 to 801.2 mg/L (Table 7.1). Assuming that all the
97

alkalinity in these samples is a result of inorganic carbon species, the concentration of
bicarbonate and carbonate can be calculated using eqs.l and 2 (Deutsch, 1997).
Table 7.1 Sample depth, Electrical conductivity (EC), pH, Eh, temperature and
alkalinity of the groundwater samples from the Byrock and Hermidale areas.
Source Drill hole Sample depth (m) EC uS.cm '1 PH Eh mV Temp C ALK mg/LByrock CBAC 217 47.3 17390 6.9 350 24 654 2Byrock CBAC 217a 47.1 17300 6.8 355 23.6 648.7Byrock CBAC218 46.2 14820 6.7 344 22.3 543.9Byrock CBAC219 43.4 14960 7.1 344 21.7 445.9Byrock CBAC227 39.2 15220 6.9 350 22.8 373.6Byrock CBAC 227a 39.0 15178 6.9 348 22.6 662.5Byrock CBAC231 38.6 16120 6.5 340 23.9 294.0Byrock CBAC235 18.6 891 6.5 407 21.6 434.9Byrock CBAC 235a 183 843 6.7 400 22 4 451.5Byrock CBAC242 11.8 7240 7.2 305 22.9 801.2Byrock CBAC243 28.0 2176 7.3 354 21.9 632.1Byrock CBAC243 34 0 18960 6.9 383 22.3 557 4Hermidale CBAC 150 50.0 7200 7.1 27.0 494.9Hermidale CBAC 154 55.0 27200 6.9 24.0 240.1Hermidale CBAC 158 30.0 20100 6.5 23.0 247.5Hermidale CBAC 160 65.0 31600 6.4 26.0 196.0Hermidale CBAC 173 18.0 14280 6.9 27.0 485.1
o.so -Surface
0.60 -
♦ CBAC i rJZ 0.40 - ■ CBAC218
A CBAC219X CBAC227
0.20 -
A CBAC231 • CBAC235 + CBAC242
Transitional Zone
0.00 -
□ CBAC243Depth.EnvironmentO CBAC248
10.0 110 13.0 14.0
pH
Figure 7.11 Eh-pH diagram (Sato, 1960) showing water stability of Byrock water
samples.
98
n e o s '(mg/L)= [alkalinity(mg/L)/ {1+ (2xl0'IO3/10‘pH )}x50] x61 ( 1)
CO3'2(mg/L)= [alkalinity(mg/L)/ {2+ (10‘pH /10103)}x50] x60.................. (2)
The calculated concentrations of HCO3" for the studied groundwater samples are
tabulated in Appendix 3.
7.6 MAJOR IONS GEOCHEMISTRY
Analysis of how major ions and compounds are distributed in the aquifers assists the
interpretation of the aquifer mechanics and reveals flow paths and potential recharge
areas. For example HCO3' concentration was used as an indicator of flow direction,
preferential permeability and possible mixing (Herczeg et al, 1991; Wolfgang and
White, 2000).
The distributions of HCO3 in the Girilambone area (Appendix 3) show higher values
(> 590 mg/L) towards the southeastern part of the Byrock area, and the HCO3 '
concentration decreases along the flow path from CBAC217 to CBAC231. A high
concentration of HCO3' was also recorded from the highland area (possible recharge
area) of the Bogan River catchment east and northeast of Byrock. In the Hermidale
region, the likely recharge areas are in the southeast (CBAC173) and north (CBAC150)
of the region and generally characterised by high concentrations of HC03‘. Similarly
Na/Cl (in mmol/L) shows a general increase in values moving towards the southeast,
east and northeast in the Byrock area and from north to southwest in the Hermidale
area. The northeastern portion of the Hermidale area (CBAC158) shows a relatively
high Na/Cl value.
Calcium, Mg and K distributions all increase along the inferred flow path. In the
Byrock area Ca, Mg and K change from 316 mg/L, 697mg/L and 131 (mg/L)
respectively in CBAC217 to 342, 752 and 162 in CBAC227 within 8 km.
Correspondingly the concentrations of Ca, Mg and K in the recharge area of the
Hermidale region (CBAC173) are 168, 276 and 16.2 and they change along the inferred
flow path to 531,1297 and 109 respectively in CBAC160. In other words these cations
99
are increasing in the studied drill holes (except CBAC158) down the flow path ,
indicating mineralogical changes and/or an increase in weathered material in the aquifer
rocks. Low concentration of Ca, Mg and K in CBAC158 are possibly related to mixin g
of fresh water from surface.
7.7 GROUNDWATER TYPE AND ORIGIN OF DISSOLVED IONS
Based on the major ion contents, three water types are identified (Figure 7.12). This
Piper diagram shows that the groundwater compositions at the studied sites of the
Girilambone region vary, but are generally Na-Cl dominant. The different patterns may
reflect the evolutionary stages of the water, mixing of waters or mineralogical changes
in the aquifer composition. The waters in this region can be classified as follows:
• Chloride type, where the anion is chloride and the cation is mainly sodium and
/or potassium. This type of water occurs in almost all the studied sites (except
CBAC235 and CBAC243) in the Byrock and Hermidale areas (Figure 7.12).
The EC measurements showed that the majority of the waters are over the 5000
pS/cm level of conductivity (Table 7.1) and this is mostly related to
predominant occurrence of sodium chloride.
• Calcium-bicarbonate type. This type of water is reported only from CBAC235
(Byrock area). It is characterised by high Ca, Mg and HCO3" contents, alkalinity
of 434.87 mg/L and EC of 891 pS/cm (Table 7.1). Bicarbonate is possibly
generated by the reaction of water with CaCCE. The abundance of calcium and
magnesium probably indicates interaction of the water with the leucitite rocks at
this site.
• Bicarbonate and chloride type. This type of water occurs in CBAC243 (Byrock
area) and includes high contents of HCO3', Cf and Na+ with high alkalinity
(632.1 mg/L) and EC (2176 pS/cm).
The dissolved ions in groundwater are mainly derived from two main processes (e.g.,
Rabemanana et al., 2005). These are:
1. Water-rock interaction
The most common water-rock interaction processes (weathering of silicates and
carbonates) tend to release base cations (particularly Na+ and Ca2+) and alkalinity
100
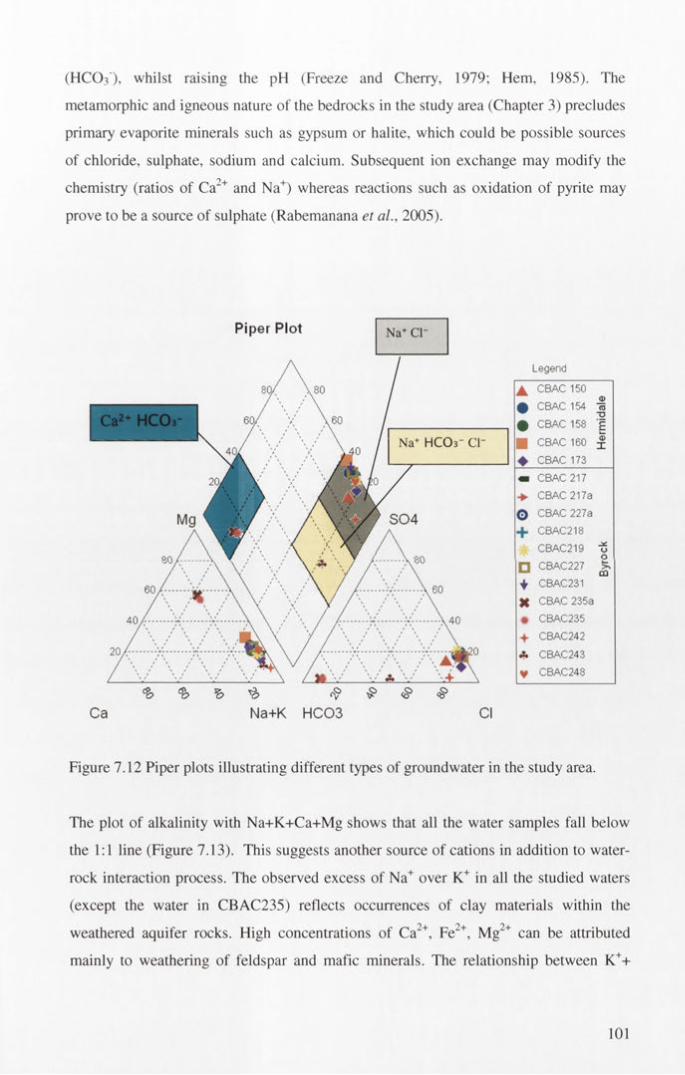
(HCO.O, whilst raising the pH (Freeze and Cherry, 1979; Hem, 1985). The
metamorphic and igneous nature of the bedrocks in the study area (Chapter 3) precludes
primary evaporite minerals such as gypsum or halite, which could be possible sources
of chloride, sulphate, sodium and calcium. Subsequent ion exchange may modify the
chemistry (ratios of Ca2+ and Na+) whereas reactions such as oxidation of pyrite may
prove to be a source of sulphate (Rabemanana et al., 2005).
Ca1? ^ ^ ^ ^
Na+K HC03 Cl
Legend
▲ CBAC 150
• CBAC 154 15
•T 5
CBAC 158 E
■ O CD > O o Her
♦ CBAC 173
«1 CBAC 217
-► CBAC 217a
o CBAC 227a
+ CBAC218
CBAC219 o
□ CBAC227O Q
+ CBAC231
X CBAC 235a
• CBAC235
+ CBAC242
A CBAC243
V CBAC248
Figure 7.12 Piper plots illustrating different types of groundwater in the study area.
The plot of alkalinity with Na+K+Ca+Mg shows that all the water samples fall below
the 1:1 line (Figure 7.13). This suggests another source of cations in addition to water-
rock interaction process. The observed excess of Na+ over K+ in all the studied waters
(except the water in CBAC235) reflects occurrences of clay materials within the
weathered aquifer rocks. High concentrations of Ca2+, Fe2+, Mg2+ can be attributed
mainly to weathering of feldspar and mafic minerals. The relationship between K++
101

Na+ and Ca2++Mg2+ suggests a predominant felsic component in nearly all the studied
sites, except CBAC235 (Figure 7.14). Water in the latter has more likely been i n
contact with carbonate and/or mafic rocks. However, the occurrence of leucitite in th e
aquifer of CBAC235 (Glanville et ai, 2003) supports the mafic origin.
t1<
14
12
10
S
6
4
0
Equiline 1:1
♦ CBAC235
■ CBAC218
ACBAC219
-CBAC243
O CBAC242
♦ CBAC 217
+ CBAC227
□ CBAC231
—CB AC 1:50
O CBAC 134
XCBAC138
ACBAC160
XCBAC173
0 100 200 300 400
Na+K+Ca+Mg nieq/L
Figure 7.13 Scatterplots of alkalinity vs (Na+K+Ca+Mg) for the Byrock and Hermidale
groundwater samples.
♦ C B A C 235A. C B A C 2 1 8O C B A C 2 1 9
C B A C 2 4 3x C B A C 2 4 2♦ C B A C 248+ C B A C 2 1 7- C B A C 227
— C B A C 231C B A C 150
a C B A C 154A C B A C 158
F e ls ic A C B A C 1 6 0■ C B A C 1 7 3
I-C -HINTa* nanoIX.
Figure 7.14 Scatterplots of (Ca2++Mg2+) vs (K++Na+) showing possible aquifer rock
types in the Byrock and Hermidale areas.
102

2. Salinisation
The increase in salinity essentially describes the evaporative concentration of solutes a t
the surface or in the shallow subsurface (e.g., Thomas et al., 1989; Nativ et al., 1997 ).
This may include evaporative concentration at the surface, concentration of solutes by
evapotranspiration in the subsurface, precipitation and subsequent re-dissolution o f
secondary evaporite minerals in the unsaturated zone from evapo-concentrated waters.
The solutes that are subject to this process are possibly derived from water-rock
/regolith interaction (Na+, Ca2+and HCO3 ) or from external sources, such as marine
salts (Na+, CY and S042') arriving in the rainfall recharge (Rabemanana et al., 2005).
The significant correlation between the Na+ and CT ions indicates that the major part o f
the salinity in the groundwater is a result of NaCl (Figure 7.15). Na/Br-Cl/Br
relationships for Byrock and Hermidale groundwaters generally show three groups o f
samples (Figure 7.16):
• samples approximately parallel to 1:1 line (i.e. CBAC150, 154, 173, 218, 219,
242) in which both Na/Br and Cl/Br are comparable, possibly showing the
influence of evaporation;
• samples with high Na/Br and low Cl/Br. This group (i.e. CBAC235, 243) has
excess of Na+, which likely reflects cation exchange and/or silicates weathering
(i.e., albite dissolution) due to water-rock interaction; and
• samples with increased Cf, high Cl/Br and low Na/Br (e.g., CBAC227, 231 and
260), which indicates mixing with higher salinity water.
There is a strong correlation between S042' and Cf suggesting that their accumulation
in the groundwater is the result of a common process (evapo-concentration or
dissolution of secondary evaporite mineral; Figure 7.17). Chloride-S04 ’ data diverge
from the seawater (SW)-rainwater (RW) line, indicating addition of S O f, which
possibly related to oxidative weathering of pyrite and/or the dissolution of anhydrite
(Dogramaci et al, 2001; Rabemanana et al., 2005).
The Ca2+ and S 042" contents at two sites (CBAC150 and 227; Figure 7.18)
approximates the seawater trend, which suggests concentration by evaporation or
dissolution of gypsum. Some of the samples show relative enrichment in S04 '
103
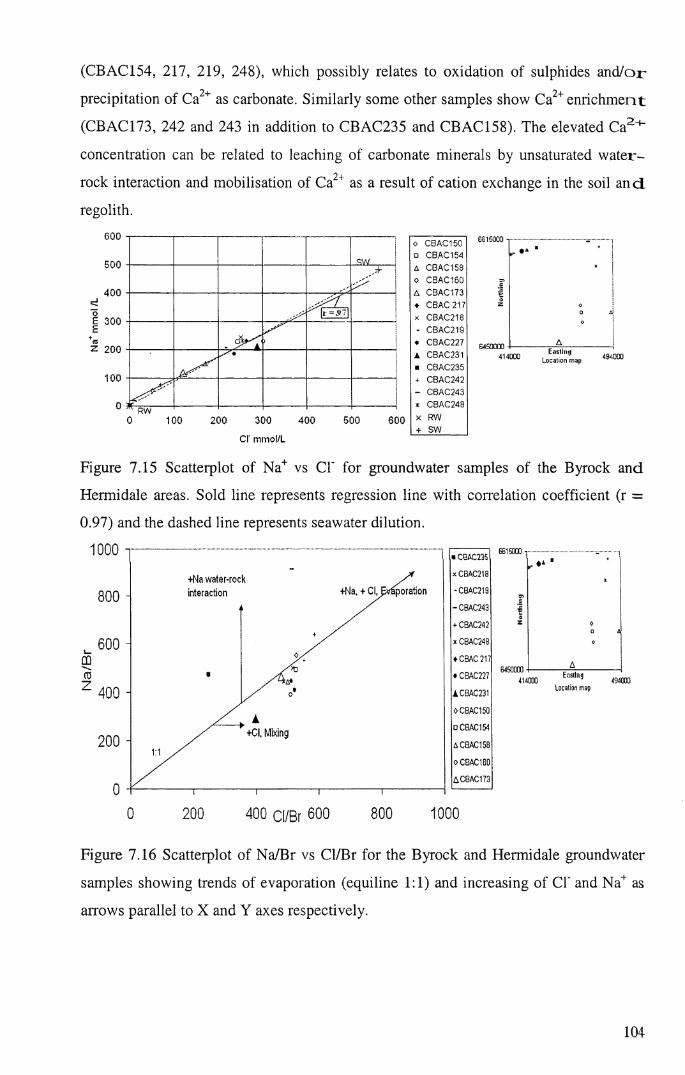
(CBAC154, 217, 219, 248), which possibly relates to oxidation of sulphides and/o r
precipitation of Ca2+ as carbonate. Similarly some other samples show Ca2+enrichment
(CBAC173, 242 and 243 in addition to CBAC235 and CBAC158). The elevated Ca2s~
concentration can be related to leaching of carbonate minerals by unsaturated water-
rock interaction and mobilisation of Ca2 as a result of cation exchange in the soil and.
regolith.
z 200
Cl' mmol/L
0 CBAC150□ CBAC154
A CBAC1580 CBAC160
A CBAC173♦ CBAC 217X CBAC218- CBAC219• CBAC227
A CBAC231■ CBAC235+ CBAC242- CBAC243* CBAC248X RW+ SW
Figure 7.15 Scatterplot of Na+ vs Cl' for groundwater samples of the Byrock and
Hermidale areas. Sold line represents regression line with correlation coefficient (r =
0.97) and the dashed line represents seawater dilution.
+Na water-rock interaction +Na, + Cl, Evaporation -CBAC219
-CBAC243
+ CBAC242
* CBAC248
♦ CBAC217
• CBAC227
ACBAC23I
OCBAC150
□ CBAC154+CI. MixingA CBAC158
o CBAC160
ACBAC173
0 200 400 ci/Br 600 800 1000
6615000 ■
6450000 •
414000Eostiinj
location map
Figure 7.16 Scatterplot of Na/Br vs Cl/Br for the Byrock and Hermidale groundwater
samples showing trends of evaporation (equiline 1:1) and increasing of Cl" and Na+ as
aiTows parallel to X and Y axes respectively.
104
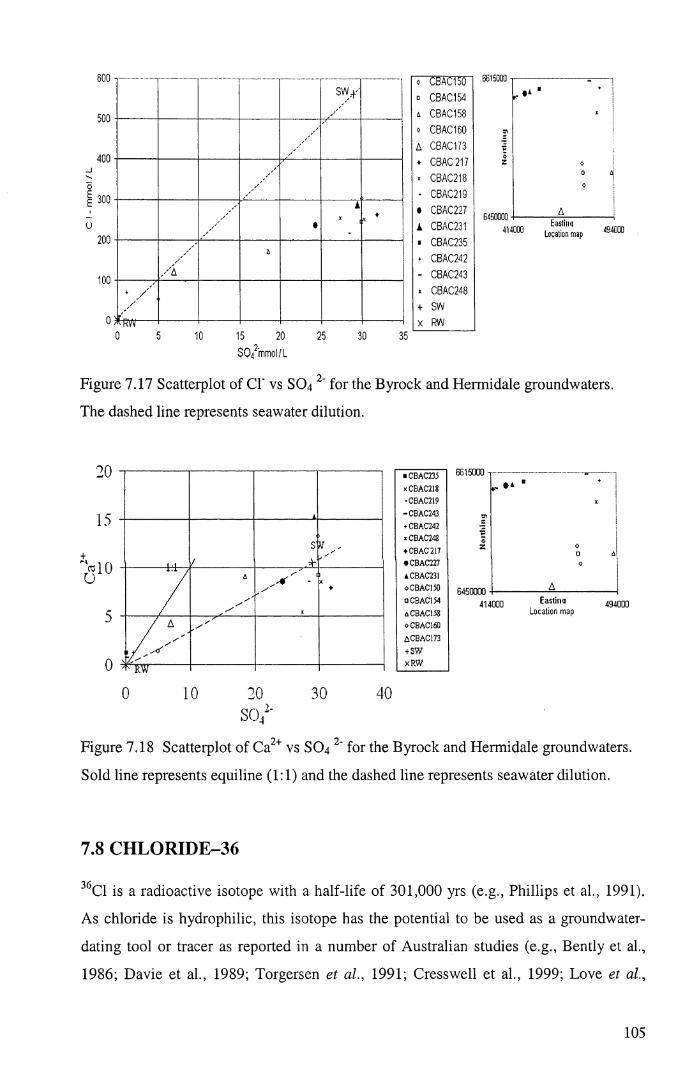
$C>42mrriol/L
0 CBAC150□ CBAC154A CBAC1580 CBAC160A CBAC173♦ CBAC217X CBAC218
CBAC219♦ CBAC2271 CBAC231a CBAC235* CBAC242- CBAC243x CBAC248+ SWX RW
6615000
6450000Eastimi
Location map414000
Figure 7.17 Scatterplot of Cl' vs S04 2~ for the Byrock and Hermidale groundwaters.
The dashed line represents seawater dilution.
SO /'
■ CBAC235 x CBAC218 -CBAC219 - CBAC243* CBAC242 x CBAC248♦ CBAC217• CBAC227 ACBAC231 OCBAC150 □ CBAC154 aC B A C I58 0 C B A C I6O ACBAC173 + S W x R W
6615000
Eastin« Location map
494000
Figure 7.18 Scatterplot of Ca2+ vs S04 2‘ for the Byrock and Hermidale groundwaters.
Sold line represents equiline (1:1) and the dashed line represents seawater dilution.
7.8 CHLORIDE-36
36C1 is a radioactive isotope with a half-life of 301,000 yrs (e.g., Phillips et al., 1991).
As chloride is hydrophilic, this isotope has the potential to be used as a groundwater-
dating tool or tracer as reported in a number of Australian studies (e.g., Bently et ah,
1986; Davie et ah, 1989; Torgersen et al., 1991; Cresswell et ah, 1999; Love et al.,
105

2000; Lehmann et al., 2003, Wischusen et eil, 2004). These studies, along with ,C)C l
groundwater studies elsewhere (Phillips et al., 1986) and more general atmospheric 36C l
studies (Bird et al., 1991; Keywood, 1995; Phillips et a l, 1986) give background
information on the formation of l6Cl in the atmosphere and its likely behaviour i n
groundwater systems, including epigene and hypogene production effects.
36C1 is produced in the atmosphere, in near-surface rocks, and in the deep subsurface.
Atmospheric fallout is derived from cosmic-ray interaction, mainly with argon in th e
stratosphere and shows a strong latitudinal dependence, with greatest fallout at m id-
latitude (Wischusen et al., 2004). Chloride -36 is also produced in the deep subsurface
through neutron-capture on °C1, supplying l6Cl to groundwater systems (Bentley et a l.,
1986).
The atmosphere also contains stable chloride derived from sea-spray, and from
remobilised terrestrial salts. This stable chloride combines with 36C1. The j6Cl/Cl ratio
can be measured readily on a few milligrams of chloride using accelerator mass
spectrometry (Elmore et a l, 1979) and varies in natural systems from several hundred
parts in 1015 of total chloride, down to a background of a few parts in 1015 (e.g.,
Cresswell, et al., 1999).
The 36C1/C1 ratio may be used to estimate ages of groundwaters if three assumptions are
made. These are: the only sink for 36C1 in the aquifer is radioactive decay; the only
source for additional 36C1 is normal deep subsurface production, or that additional
sources can be identified; and, quantified; and the production rate for '6C1 is the same
now as at the time of recharge (Andrews and Fontes, 1991). The groundwater may then
be dated using the following standard decay equation:
t = -lA,(lnAt/Ao) ............................................................(3)
Where At is the 36C1/C1 ratio for the groundwater sample, Ao is the ‘1(,C1/C1 ratio for the
recharge (or input function) and 1A, is the mean life of 36Cl: 434,25 lyr (Cresswell et
al., 1999).
106

Seven Byrock and Hermidale water samples were analysed for '6C1 by the Nuclear
Physics Department of the Australian National University (Table 7.2). Details of th e
method of analysis and a description of the Accelerator Mass Spectrometer used a re
outlined by Fifield et al. (1987). The plotted ratio of 36C1/C1 against total chloride
content in the Hermidale area together with representative trends for the processes
indicated, showed that the '6C1/C1 ratios are relatively high in CBAC173 and
CBAC150, lowest in CBAC160 and intermediate in CBAC158 (Figure 7.19). The ratio
decreases along the inferred flow path, although the easternmost sample (CBAC158)
has a higher ratio. The high values indicate the water is proximal to recharge, and the
lowest value in CBAC160 is probably a result of evaporation and mixing o f
groundwaters along the flow path. The intermediate ratio at CBAC158 could be a result
of mixing with a less saline and lower chlorine ratio water. Alternatively the
groundwater is from a different source than to that in the east. For example, the
groundwater from CBAC158 could be from the transported gravel layer (Figure 7.7).
Similarly, plotting 36C1/C1 along the flow path from the drill hole CBAC217 to
CBAC231 in the Byrock area showed an increase in 36C1/C1 ratio in CBAC227 that
possibly relates to dilution of groundwater as a result of mixing with lower salinity
(fresh) water (Figure 7.20).
To estimate the age of groundwater in the study area the,6Cl content of the rainfall
needs to be known. These data are not available for the study area. However, the
,6C1/C1 ratio in rainfall for central Australia has been calculated as 325xl0‘15
(Keywood, 1995; Keywood et al., 1997). If this value of 36C1/C1 is used as input for the
Girilambone region then the value seems to be reduced during recharge by additional
chloride input from local salts in the unsaturated zone or from aerosols and dust wind-
blown from local playa lakes. Consequently if the assumptions pertaining to Eq. 3 are
assumed valid, and an input ratio of 325xlO'15 is used, calculated groundwater ages
range from 241,000 to 492,000 years in the Hermidale area and from 418,00 to 516,000
years in the Byrock area (Table 7.2).
7.9 IDENTIFICATION OF AQUIFER MINERALS
In environments where ore minerals have been preserved for long periods of time, it is
reasonable to assume that either the groundwater-aquifer rock system is at equilibrium,
107

or that rates of chemical reactions are so slow that a steady state, or locally equilibrated
state exists. Aquifer minerals that can be calculated from groundwater composition a r e
those that either formed out of constituents carried in the groundwater, or are m inerals
formed from chemical interaction between the groundwater and minerals within rock:
units that predated groundwater flows. In order to understand the changes in the
Table 7.2 1(,C1 determinations for the Byrock and Hermidale groundwaters.
Sample Location 36CI/CI (x10"15) Error 3bCI age(years)C BAC150 Hermidale 176.3 8.9 265527C BAC158 Hermidale 127.1 6.5 407698CBAC160 Hermidale 104.6 5.8 492428C BAC 173 Hermidale 186.8 8.6 240564C BÄC217 Byrock 124.2 6.8 417561CBAC227 Byrock 111.9 6.2 463006CBAC231 Byrock 99.1 cn bo 515913
200.0
\ » o
160.0
1400
120.0
g 1000
800
6 00
4 00
200
OO0 2000 4000 6000 8000 10000 12000
Chloride concentration (mg/l)
CBAC173CBAC150 *
* E va p o ra tio n
CBAC158•
\ ” 36C1 D ecay o n ly CBAC160•
Sam ple 36CI Cl |x10'15) Error CBAC150 176.3 8.9C8AC158 1271 6 5CBAC160 104.6 5.8CBAC173 186.8 8.6
'<’C l P n
^ MI1IM j
RECTCu » rSORPTION
>duction
L
FILTRATI
nn l in n
*C 11
------------------- p ,
ETAPORAT
fDecay
Figure 7.19 16C1 /Cl versus chloride for the Byrock groundwater samples. Process
trends are shown by arrows (Bird et al., 1991).
108

140 i
CBAC217♦
120 -
CBAC227ou
•O|V |
100 - Cl P r o d u c t i o nA
S or p t i o nM—
Dilutio n
Filtration—►
80
E v a p o r a t i o n
Cl D e c a y _ _ _ _ _ _
S a m p l e **cyc\ tx io - 't i Ei i oi
217 124.2 6.3
227 111.9 6.2
231 99.1 5.8
CBAC231♦
T
8000 10000Chloride concentration ( rng/L)
12000
Figure 7.20 16C1 /Cl versus chloride for the Hermidale groundwater samples. Process
trends are shown by arrows (Bird et al., 1991).
hydrogeochemistry and the interaction between groundwater and regolith, the measured
element concentrations in the groundwater were plotted on activity-activity diagrams
and mineral saturation indices for all samples were calculated. The Geochemist’s
Workbench Release 6.0 (Bethke, 2005) with the associated thermo.dat database of
thermodynamic properties was used for all calculations.
7.9.1 WEATHERING OF SILICATE MINERALS
The concentrations (activities) of the major cations and anions can be employed to
understand solution-silicate mineral equilibria in terms of pH. Depending upon the
relative concentrations of major cations, it is possible to identify the chemical
weathering stage and type of source rock. The suite of silicates with which each
groundwater sample is saturated can be used as another type of signature for classifying
aquifer lithology (Giblin, 2001). The initial weathering product of silicate minerals in
which the groundwater is saturated is gibbsite and as the weathering process continues
more silica is dissolved into the groundwater and the next principal saturated mineral
will be kaolinite (Helgeson et al., 1969). Depending upon the concentrations of major
109
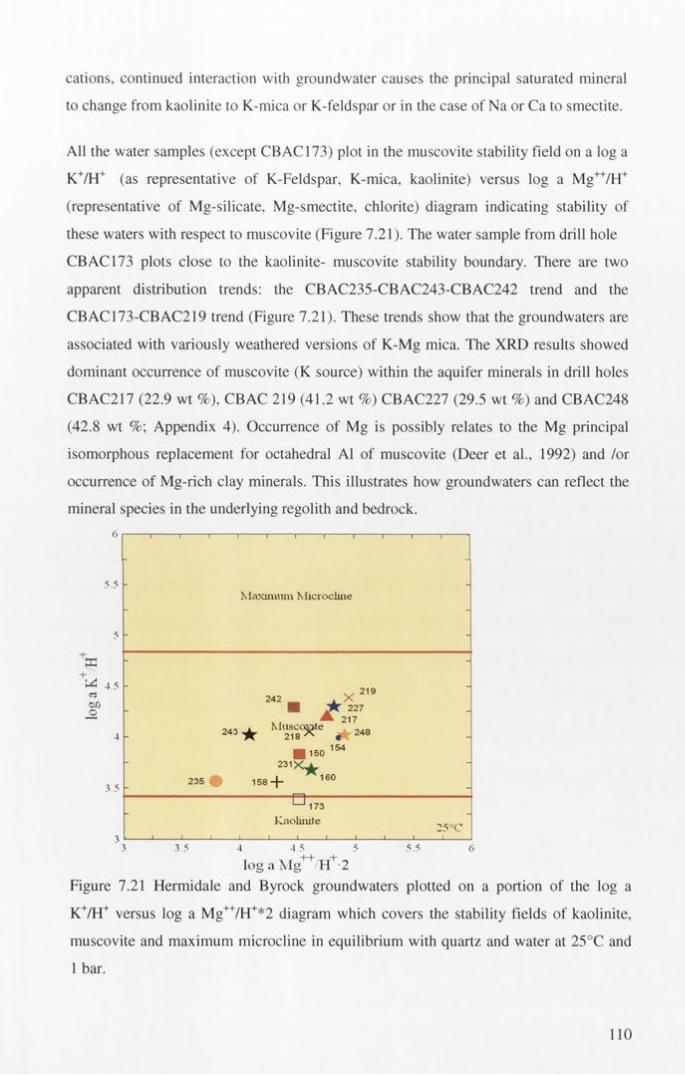
cations, continued interaction with groundwater causes the principal saturated mineral
to change from kaolinite to K-mica or K-feldspar or in the case of Na or Ca to smectite.
All the water samples (except CBAC173) plot in the muscovite stability field on a log a
K+/H+ (as representative of K-Feldspar, K-mica, kaolinite) versus log a Mg++/H+
(representative of Mg-silicate, Mg-smectite, chlorite) diagram indicating stability of
these waters with respect to muscovite (Figure 7.21). The water sample from drill hole
CBAC173 plots close to the kaolinite- muscovite stability boundary. There are two
apparent distribution trends: the CBAC235-CBAC243-CBAC242 trend and the
CBAC173-CBAC219 trend (Figure 7.21). These trends show that the groundwaters are
associated with variously weathered versions of K-Mg mica. The XRD results showed
dominant occurrence of muscovite (K source) within the aquifer minerals in drill holes
CBAC217 (22.9 wt %), CBAC 219 (41.2 wt % ) CBAC227 (29.5 wt %) and CBAC248
(42.8 wt %; Appendix 4). Occurrence of Mg is possibly relates to the Mg principal
isomorphous replacement for octahedral A1 of muscovite (Deer et al., 1992) and /or
occurrence of Mg-rich clay minerals. This illustrates how groundwaters can reflect the
mineral species in the underlying regolith and bedrock.
Maximum Microcline
log a Mg1+H f 2Figure 7.21 Hermidale and Byrock groundwaters plotted on a portion of the log a
K+/H+ versus log a Mg++/H+*2 diagram which covers the stability fields of kaolinite,
muscovite and maximum microcline in equilibrium with quartz and water at 25°C and
1 bar.
110
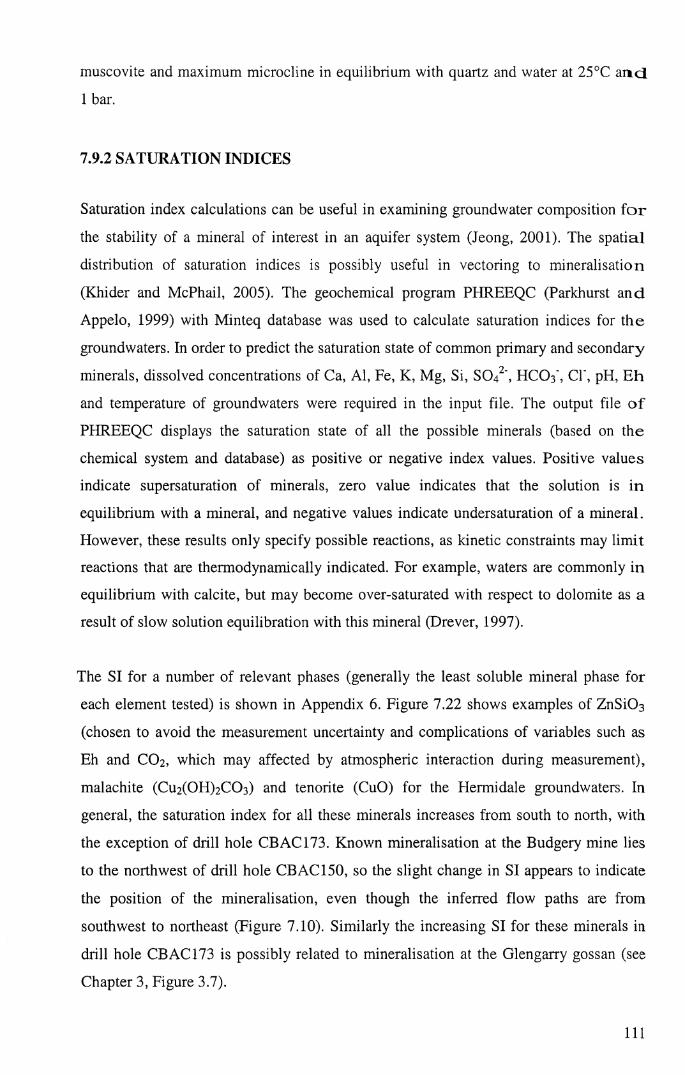
muscovite and maximum microcline in equilibrium with quartz and water at 25°C a n d
1 bar.
7.9.2 SATURATION INDICES
Saturation index calculations can be useful in examining groundwater composition fo r
the stability of a mineral of interest in an aquifer system (Jeong, 2001). The spatial
distribution of saturation indices is possibly useful in vectoring to mineralisation
(Khider and McPhail, 2005). The geochemical program PHREEQC (Parkhurst and
Appelo, 1999) with Minteq database was used to calculate saturation indices for the
groundwaters. In order to predict the saturation state of common primary and secondary
minerals, dissolved concentrations of Ca, Al, Fe, K, Mg, Si, SO42', HCO3', CP, pH, Eh
and temperature of groundwaters were required in the input file. The output file o f
PHREEQC displays the saturation state of all the possible minerals (based on the
chemical system and database) as positive or negative index values. Positive values
indicate supersaturation of minerals, zero value indicates that the solution is in
equilibrium with a mineral, and negative values indicate undersaturation of a mineral.
However, these results only specify possible reactions, as kinetic constraints may limit
reactions that are thermodynamically indicated. For example, waters are commonly in
equilibrium with calcite, but may become over-saturated with respect to dolomite as a
result of slow solution equilibration with this mineral (Drever, 1997).
The SI for a number of relevant phases (generally the least soluble mineral phase for
each element tested) is shown in Appendix 6 . Figure 7.22 shows examples of ZnSi03
(chosen to avoid the measurement uncertainty and complications of variables such as
Eh and CO2, which may affected by atmospheric interaction during measurement),
malachite (Cu2(0 H)2C0 3 ) and tenorite (CuO) for the Hermidale groundwaters. In
general, the saturation index for all these minerals increases from south to north, with
the exception of drill hole CBAC173. Known mineralisation at the Budgery mine lies
to the northwest of drill hole CBAC150, so the slight change in SI appears to indicate
the position of the mineralisation, even though the inferred flow paths are from
southwest to northeast (Figure 7.10). Similarly the increasing SI for these minerals in
drill hole CBAC173 is possibly related to mineralisation at the Glengarry gossan (see
Chapter 3, Figure 3.7).
I ll
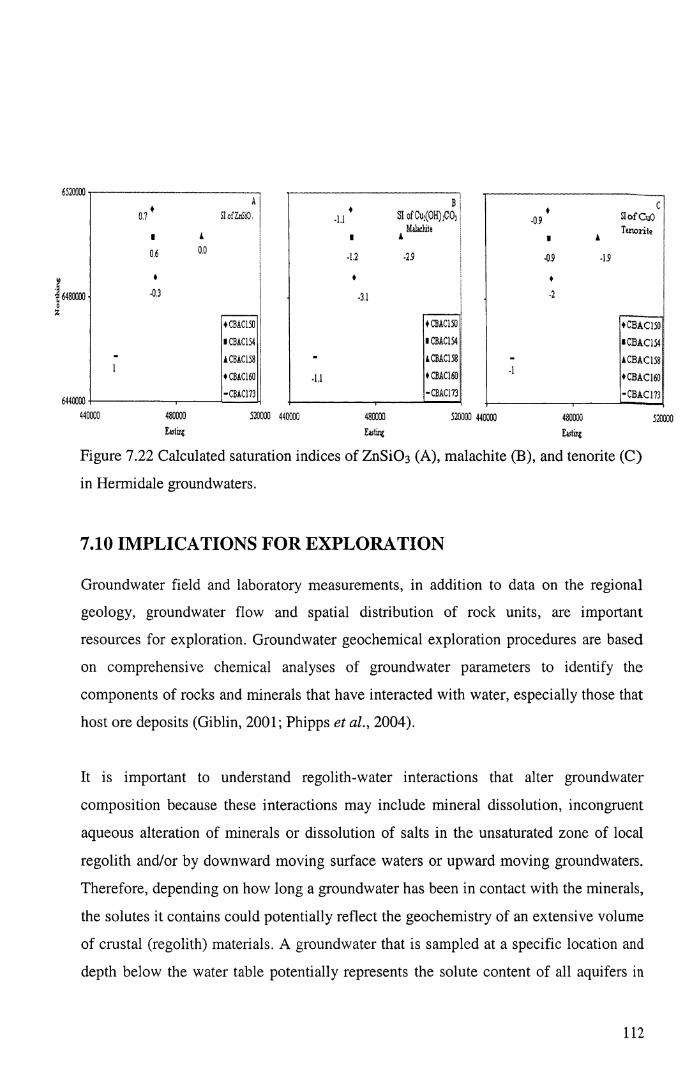
6520000
SI o f CuO
TenoriteI A
•0.9 -19
♦
-2
♦ CBAC150 ■CBAC154 ACBAC158♦ CBAC160 -CBAC173
440000 480000 520000 440000 480000 520000 440000 480000 520000Easting Easing Easting
Figure 7.22 Calculated saturation indices of ZnSiC>3 (A), malachite (B), and tenorite (C)
in Hermidale groundwaters.
A B
0 . 7 * SI o f ZnSiO . ] 1 * S I o f C U : ( O H ) ; C O ;M alach ite
l A i A
0 .6 0 0 - 1 .2 - 2 .9
a ♦
-0 .3 -3 .1
♦ C B A C 150 ♦ C B A C 1 5 0
IC B A C 1 5 4 l C B A C 1 5 4
A C B A C 1 5 8 - A C B A C 1 5 8
♦ C B A C 160 •1 .1 ♦ C B A C 1 6 0
-C B A C 1 7 3 - C B A C 1 7 3
7.10 IMPLICATIONS FOR EXPLORATION
Groundwater field and laboratory measurements, in addition to data on the regional
geology, groundwater flow and spatial distribution of rock units, are important
resources for exploration. Groundwater geochemical exploration procedures are based
on comprehensive chemical analyses of groundwater parameters to identify the
components of rocks and minerals that have interacted with water, especially those that
host ore deposits (Giblin, 2001; Phipps et al, 2004).
It is important to understand regolith-water interactions that alter groundwater
composition because these interactions may include mineral dissolution, incongruent
aqueous alteration of minerals or dissolution of salts in the unsaturated zone of local
regolith and/or by downward moving surface waters or upward moving groundwaters.
Therefore, depending on how long a groundwater has been in contact with the minerals,
the solutes it contains could potentially reflect the geochemistry of an extensive volume
of crustal (regolith) materials. A groundwater that is sampled at a specific location and
depth below the water table potentially represents the solute content of all aquifers in
112
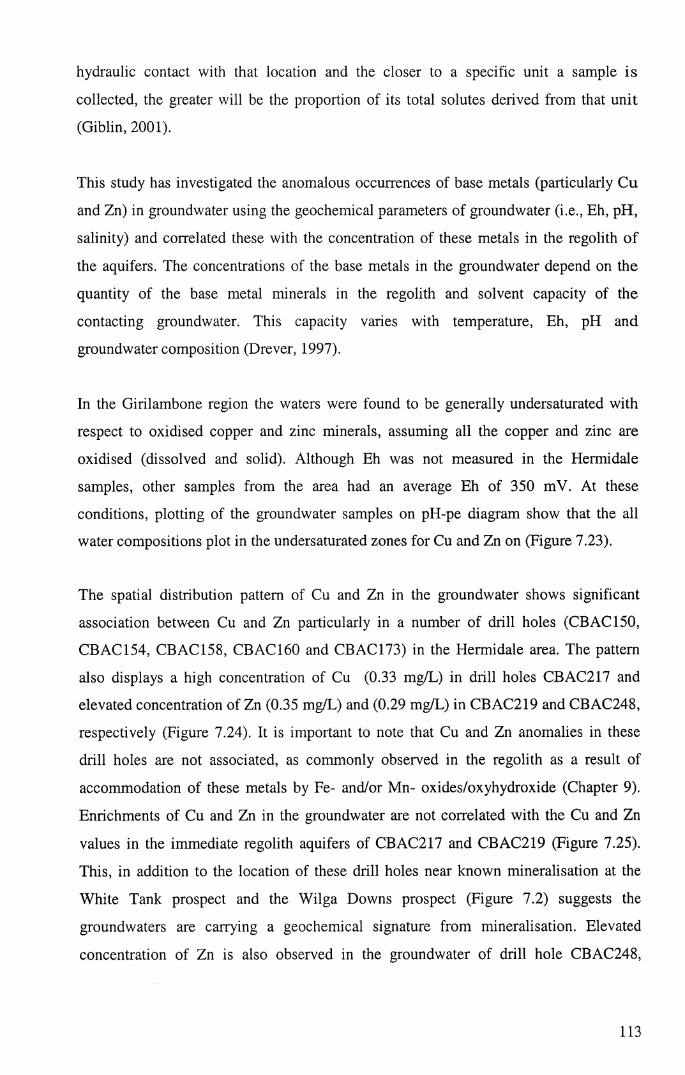
hydraulic contact with that location and the closer to a specific unit a sample is
collected, the greater will be the proportion of its total solutes derived from that unit
(Giblin, 2001).
This study has investigated the anomalous occurrences of base metals (particularly Cu
and Zn) in groundwater using the geochemical parameters of groundwater (i.e., Eh, pH,
salinity) and con-elated these with the concentration of these metals in the regolith of
the aquifers. The concentrations of the base metals in the groundwater depend on the
quantity of the base metal minerals in the regolith and solvent capacity of the
contacting groundwater. This capacity varies with temperature, Eh, pH and
groundwater composition (Drever, 1997).
In the Girilambone region the waters were found to be generally undersaturated with
respect to oxidised copper and zinc minerals, assuming all the copper and zinc are
oxidised (dissolved and solid). Although Eh was not measured in the Hermidale
samples, other samples from the area had an average Eh of 350 mV. At these
conditions, plotting of the groundwater samples on pH-pe diagram show that the all
water compositions plot in the undersaturated zones for Cu and Zn on (Figure 7.23).
The spatial distribution pattern of Cu and Zn in the groundwater shows significant
association between Cu and Zn particularly in a number of drill holes (CBAC150,
CBAC154, CBAC158, CBAC160 and CBAC173) in the Hermidale area. The pattern
also displays a high concentration of Cu (0.33 mg/L) in drill holes CBAC217 and
elevated concentration of Zn (0.35 mg/L) and (0.29 mg/L) in CBAC219 and CBAC248,
respectively (Figure 7.24). It is important to note that Cu and Zn anomalies in these
drill holes are not associated, as commonly observed in the regolith as a result of
accommodation of these metals by Fe- and/or Mn- oxides/oxyhydroxide (Chapter 9).
Enrichments of Cu and Zn in the groundwater are not con-elated with the Cu and Zn
values in the immediate regolith aquifers of CBAC217 and CBAC219 (Figure 7.25).
This, in addition to the location of these drill holes near known mineralisation at the
White Tank prospect and the Wilga Downs prospect (Figure 7.2) suggests the
groundwaters are carrying a geochemical signature from mineralisation. Elevated
concentration of Zn is also observed in the groundwater of drill hole CBAC248,
113

The distribution pattern of groundwater electrical conductivity, and contents of SO42 ,
Cl', Cu2+ and Zn2+ show remarkable correlation between Cu2+ and the salinity
parameters (EC, SO42 and Cl',), which indicate significant influence of salinisation on
Cu concentration and solubility (Figure 7.26). It has been reported (Giblin, 2001) that
under equivalent Eh, pH conditions Cu solubility proportionally increases with chloride
concentration of groundwater.
Cuprite
Copper
Chalcocite
Sphalerite Covel lite
Figure 7.23. The Hermidale and Byrock groundwater compositions, mineral stability
fields and aqueous species predominance areas. Diagrams are calculated assuming
representative conditions of the samples: (A) a zn species = 8.7 x 10‘7 (B) a cu species = 1.3 x
107 with a S042’ = 4.1 xlO'3 and a HCO3 = 9.9x 10~3. Sample labels in B are as in A.
114
1 .00 T
□ Cu ing/L
o ^r 00 o oo r- CO (j> h- x— ko CM CO 00ko LO kO CO r-- T— T— T— CM co oo ^r ^r ^r'— T— T— T— T— CM CM CM CM CM CM CM CM CM
O o O o o o O O O o O O o O< < < < < < < < < < < < < <CD CD m ffi ÜÜ tn m m GÜ CD m CD CD CDO O o o U u o O O o O O O
Figure 7.24. The distribution pattern of Cu and Zn in the groundwater of the Byrock
and Hermidale drill holes.
CBAC217 CBAC219 CBAC248Concentration (ppm) Concentration (ppm) Concentration (ppm)
0 50 too 0 50 too 0 100 200
0
10
20
§ 30
8*
G 40
50
60
70
Figure 7.25 Distribution profiles of Cu and Zn in the regolith of the Byrock drill holes
CBAC217, CBAC219 and CBAC248 with water table (green square) and sample (red
triangle) levels.
i f—*— Cu (ppm)
— Zn (ppm)
■ WT
A WS
-
- -----^ . «-----------
\ \
L I f\ \
uV >
i k T 7 ^
. fA /______ I
L \ .K
II 1
•
■I I
f
r
115
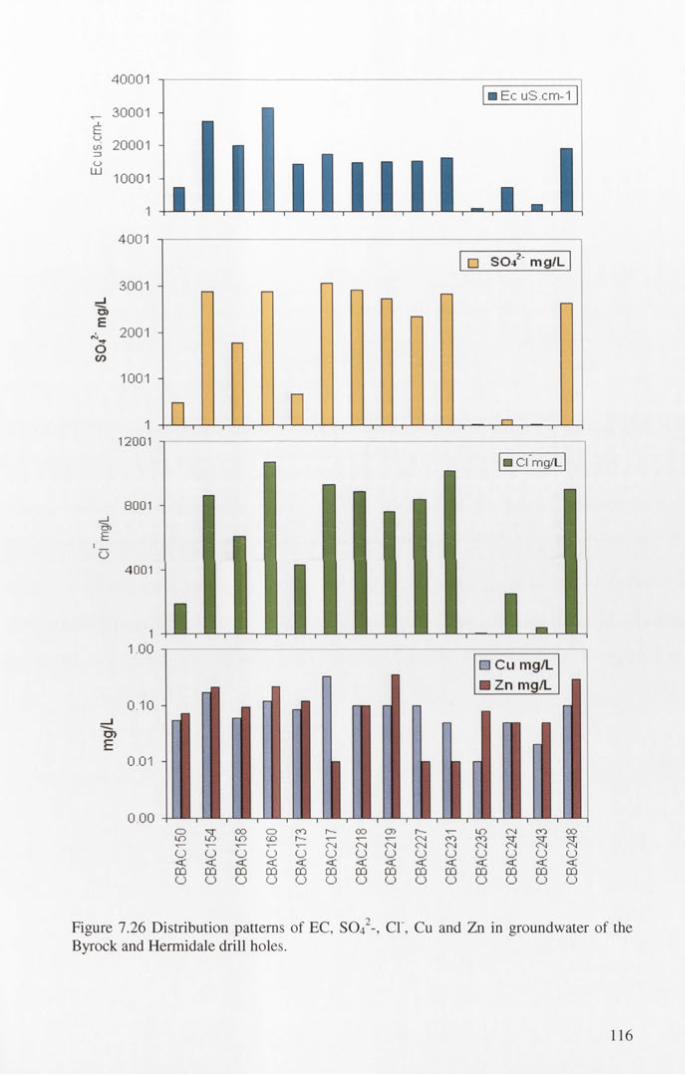
40001 -r
CD -=T CO O OQ I— OO CO r - - LO 0-4 OOL O u o u o c o r ' - ^ - T - ^ o ^ o o o O ' q - ’Nr^ ^ ^ ^ t — ON CN C^) 0 4 CN CN CN CNO O O O O O O O O O O O OC Ü C Ü C Ü C ü Ü Ü C Ü Q j C Ü D j C Ü Ü j Qj CDO O O O O O O O O O O O O
Figure 7.26 Distribution patterns of EC, SO42-, Cl , Cu and Zn in groundwater of the Byrock and Hermidale drill holes.
116
CB
AC
248

7.11 SUMMARY AND CONCLUSIONS
Analysis of groundwater samples from the Byrock and Hermidale areas showed that tlie
groundwater is moving slowly through the regionally extensive weathered phyllitic
siltstone-sandstone layer of the in situ regolith. Water levels mirror topography,
indicating an unconfined aquifer system, and groundwater is flowing in general to the
northeast in the Hermidale area and similarly in part of the Byrock area. The
groundwater in the region is mainly of chloride type, rich in Na, Cl and S04 .The other
calcium-bicarbonate and bicarbonate-chloride types are less common. The correlation
between Br/Cl and Na/Cl shows three processes affected the groundwater composition.
These are evaporation, in which both ratios increase; water-rock interaction; and water
mixing, in which Na/Br and Cl/Br increase respectively. Salinity and 36C1/C1 values
indicate that mixing of groundwater is likely. Calculation of groundwater ages based on
36C1/C1 showed that the ages range from 241,000 to 492,000 years in the Hermidale
area and from 418,000 to 516,000 years in the Byrock area. The waters are
undersaturated with respect to oxidised copper and zinc minerals. Calculated saturation
indices of ZnSiO^, malachite and tenorite appear to show a vector towards known
mineralisation at some sites in the area. The correlation between the groundwater and
regolith composition suggests at least two sites (drill holes 217 and 219) of potential
mineralisation.
117
8. CHAPTER EIGHT: WEATHERING PROCESSES AND PROVENANCE
8.1 INTRODUCTION
Clastic sedimentary rocks contain a record of their provenance and of the processes that
have operated during weathering, erosion, sedimentation, and after deposition. In most
cases, the geochemical “signals” from both provenance and processes are intermingled,
and complex (McLennan et al., 2003), and accordingly this record can be difficult to
understand. In the last thirty years major developments in petrography and
geochemistry have greatly advanced our ability to evaluate the detailed sources and
history of sedimentary rocks and in turn use this information to recognise parental
material, tectonic association, diagenesis and climate (Gu et al., 2002; Lentz, 2003).
Different weathering and erosional regimes can produce regolith with different
mineralogical and chemical characteristics. In this way landscape evolution leaves a
geochemical signature. Geochemical data from regolith can be used to: differentiate
regolith materials with different regolith histories (e.g., Robertson et cii, 1997; McQueen,
2006); determine the parent rock type and provenance (e.g., Hallberg, 1984; Roser and
Korsch, 1988; 1999; Roser et al, 2002; Khider and McQueen, 2005) and to identify
geochemical alteration/dispersion haloes of mineral deposits (e.g., Whitbread and
Moore, 2004).
This chapter examines the significance of geochemical parameters (i.e., elemental
ratios) and indices (e.g., Chemical Alteration Index (CIA)) to understand how
geochemistry can be used to evaluate the provenance and weathering history of
terrigenous regolith materials in the Girilambone region. Data from this study are
compared with available geochemical analyses of felsic and mafic igneous intrusives
and identified sedimentary rock units (Girilambone and Cobar Groups) from the Cobar-
Girilambone region. In this study, 190 bottom of the hole samples of saprolite and
saprock (compared to saprock, saprolite has more than 20% of weatherable minerals
altered, Eggleton, 2001) from the Byrock, Sussex and Hermidale areas were analysed
(Appendix 2).
118

The main stratigraphic units in the Girilambone region are the Girilambone Group
(Cambro-Ordovician) and Kopyje Group (Late Silurian-Early Devonian; Chan et al
2001; 2002; 2004). Stratigraphy and bedrock geology of the study area were discussed,
in detail in Chapter 3.
8.2 GEOCHEMICAL APPROACHES TO EVALUATE SEDIMENTARY PROCESSES
A dominant control on the chemical composition of clastic sediments is the
composition of the source rocks or provenance (McLennan et al., 2003). Typically
these sources comprise a complex mixture of upper crustal igneous/metamorphic
lithologies, volcanic arc-related lithologies and recycled sedimentary rocks (McLennan
et al, 1990; Johnsson, 1993; McLennan et al., 1993). A variety of other sources such as
localised volcanic and mafic intrusives may also be locally important. Chemical
analyses of the main rock-forming minerals and representative Australian rock types
(parent material) in each category have been reviewed in a number of studies (e.g.,
Joplin, 1963; 1965; Taylor and McLennan, 1985; Gray and Murphy, 1999; 2002).
These analyses can be use for broad comparisons with saprolith.
A variety of sedimentary processes, including weathering, transport (sorting) and
diagenesis can cause profound changes to compositions (McLennan et al., 2003);
however, the potential influences exerted on sediment geochemistry by these processes
are reasonably well understood (Fralick, 2003). Source rock composition will, to a large
degree, control the amount and type of framework grains, in contrast to finer material
capable of being generated elsewhere (Heins, 1993; Palomares and Arribas, 1993).
The presence of more than one unknown variable (weathering rate, sorting, climate,
metasomatic and metamorphic influences) in the equation relating sediment
composition to its controlling factors makes a linear solution to the problem of
determining sources area composition from sediment composition impossible (Fralick,
2003). A partial solution can be obtained if all variables but one are constant. For
example, in the saprolith the sediments are adjacent to source area and on the local
scale these sediments have undergone similar weathering and diagenetic processes.
119
Thus the chemical differences could be ascribed to differences in chemical composition
of the source rock.
An alternative approach is to identify elements in the geochemical data set whose
concentration depends only on the parent material or other factors (i.e., sorting, climate,
etc.), which can be determined and quantified. The major problem in using sediment
geochemistry to infer source area composition is in establishing which elements are
immobile (Fralick, 2003). MacLean (1990) has developed a technique for determining
elemental mobility during alteration of volcanics, including a continuously fractionated
series, and suggests that sedimentary rocks with primary continuity of chemical
composition are amenable to the procedure. The basic tenet of the technique is that
immobile elements will increase or decrease in concentration as mobile elements are
lost from, or gained by, the rock. The technique of plotting immobile-immobile,
mobile-immobile and mobile-mobile element ratios can be used to identify the source
rock composition and hydrodynamic influence or sorting (Barrett and MacLean, 1991).
Additional information can be obtained on the alteration history of a data set by
employing a second technique. This technique rests on the premise that chemical
weathering acts, over time to destroy all major primary mineral phases except quartz as
a framework constituent of sand. Given that quartz-rich (high Si0 2 %) sands are more
mature, this assumption seems to be generally tenable (Fralick, 2003). Therefore
plotting element concentration in contrast to Si02 provides further information about
relative mobility, sorting and source rocks as discussed below.
8.2.1 TESTING ELEMENT IMMOBILITY
One method of testing element immobility involves plotting pairs of elements that are
suspected of being immobile, e.g., Al, Ti, Zr, Nb, Y, Sc, La, Ce and Th (Bhatia and
Crook, 1986; Condie and Sinha, 1996; Fralick, 2003; Niu, 2004).
In this study, and for saprolith after sedimentary rocks, saprolith sediment element pairs
involving AI2O3, T i02, Nb, Sc, La, Ce and Th form the strongest correlation (R2 ranges
from 0.4 to 0.8) with linear arrays along lines extending through the origin (Figure 8.1).
Thorium displayed an insignificant (R2 =0.1) linear pattern with A I2 O 3 (Figure 8.1 H).
120

The distribution of points in Figure 8.1 requires that ALO3, TiC>2, Nb, Sc, Ce and L a .
were immobile and hydraulically fractionated in a similar manner. Deviations fro m
linearity may be caused by the main mineral phases containing these elem ents.
Zirconium and La (except La vs. Ce Figure 8.2B) are not significantly correlated w ith
the other elements (Figures 8.1- 2). The patterns produced by Zr when plotted against
chemically immobile elements show a broad indirect correlation with AI2O3 (Figure 8 . 1
D) whereas its correlation with TiC^is not significant.
Plotting AI2O3, TiCL, Nb, Sc, Zr and Th against SiC>2 concentrations in the saprolith
provides further insight into chemical and hydrodynamic behaviour of their m ajor
mineral phases (Figure 8.2 F-K). Trends in Zr data indicate that Zr is proportionally
increasing with SiC>2, which suggests that Zr is preferentially concentrated in the
quartz-rich (high SiÜ2) relatively coarse fraction (Figure 8.2 J). However, deviation
from this trend may be related to a variation in source composition or recycling
processes (see below). Figures 8.2 (A, B, C) clearly indicate that Ti, A1 and Nb are
concentrated in the clay (low SiÜ2) fraction.
8.2.2 WEATHERING AND CHEMICAL INDEX OF ALTERATION (CIA)
Weathering is the process that most significantly influences the geochemistry of
terrigenous sedimentary rocks. Geochemical relationships associated with weathering
phenomena are discussed in Chapter 9. Typical weathering of the upper continental
crust is dominated by the alteration of feldspar, and during weathering and transport
plagioclase is less stable than K-feldspar leading to an increase in K-feldspar/ plagioclase and
K20/Na20 ratios (Nesbitt, 2003). If the relatively resistant mineral quartz is neglected the
average of the feldspar group of minerals composes approximately 70% of the upper
crust (Nesbitt and Young, 1984; Taylor and McLennan, 1985). Thus, much of the effect
on major-element compositions can be evaluated in the geochemical system using the
relative mole fractions of Al2 0 3 -(CaO*+Na2 0 )-K20 (coded as A-CN-K diagram;
Nesbitt and Young, 1984).
A weathering index (CIA) can be formulated using these components such that:
CIA= 100* [A120 3/ (Al20 3+C a0*+ N a20+K 20)] (Nesbitt and Young, 1982; 1984;
1996) where CaO* refers only to the calcium associated with silicate minerals.
121
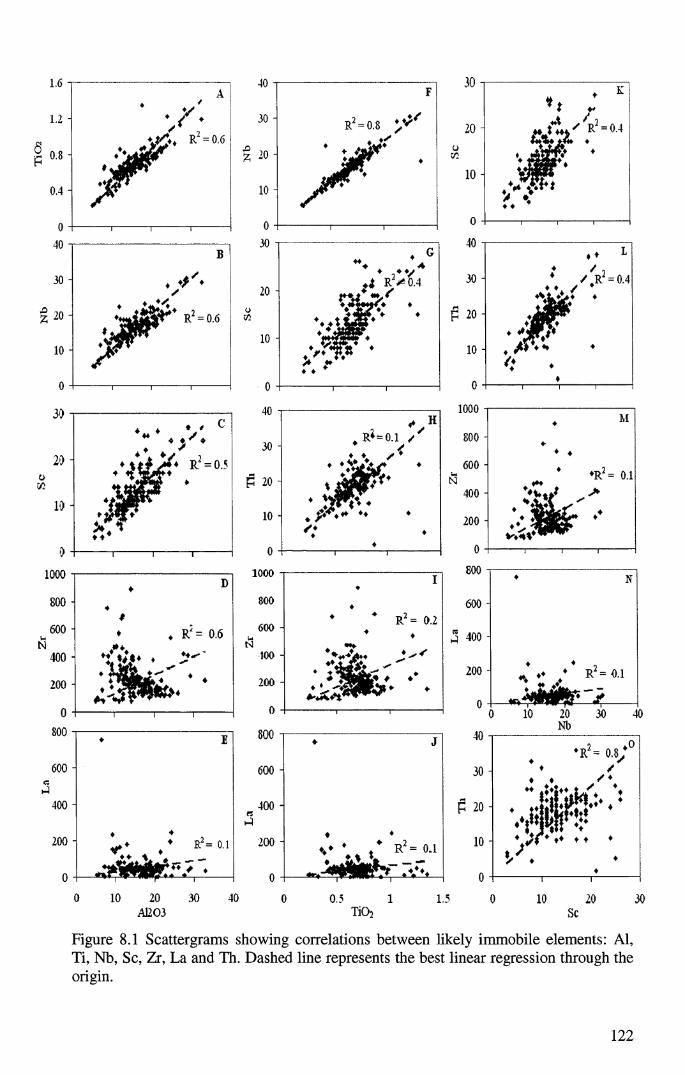
1-------1’O
N
A4 v '
** 0
I-------1-----3
S5
F
R2 = 0 8
i---------rS?
S
. K* 1 r
♦♦ f L ' R =0.4a£ 0 8 - H
0.4 -
•y>>% 20-
10 -
4 ♦Um* Sc
o
v j O K *
, v f .? . ••
£ 20
10 -
0
30
B
✓
*u*i2t&** R 2 = 0.6
* j R n
Sc
t— Iv
O
> o
o
c
♦ G*** A
4 R 2«* 0.4
« & ? / . . . . d i p *♦ ♦ il*3tV
4♦ ' ♦ ♦/» ♦♦♦ ♦
-tu
30 -
p 20 -
10 -
n - • •
-
4
V ‘
II £
^
i 1 i V 1 1 11000
. . . * v c
. . .* > 4
•LJSä J b
- , j w f
♦ ♦ •
-4U
30
P 20
10
«* H# R * = 0 .1 /♦ ♦ ✓ <
.
800
600
N400
200
♦ M
♦ ♦
♦R2 = 0 1
*♦ v %J >
' J k • '
* * ,
rvv0 10 20 30 40
.412030.5 1
Ti0>21.5 10 20
Sc
Figure 8.1 Scattergrams showing correlations between likely immobile elements: Al, Ti, Nb, Sc, Zr, La and Th. Dashed line represents the best linear regression through the origin.
122
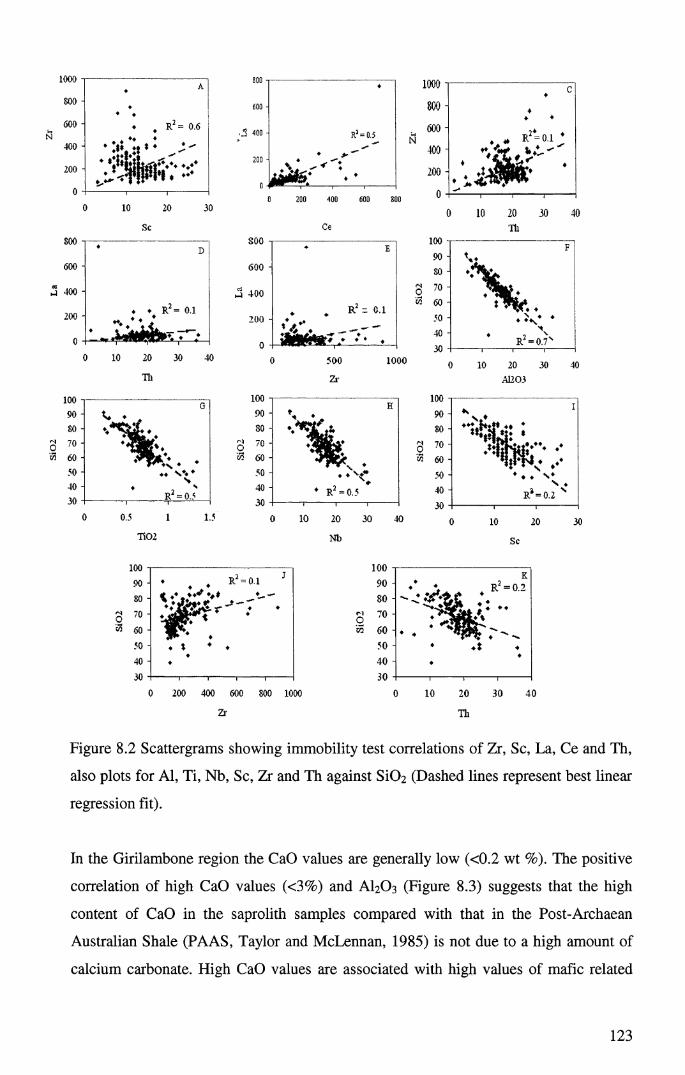
Ti02
20
NI)
A1203
Figure 8.2 Scattergrams showing immobility test correlations of Zr, Sc, La, Ce and Th,
also plots for Al, Ti, Nb, Sc, Zr and Th against SiC>2 (Dashed lines represent best linear
regression fit).
In the Girilambone region the CaO values are generally low (<0.2 wt %). The positive
correlation of high CaO values (<3%) and AI2O3 (Figure 8.3) suggests that the high
content of CaO in the saprolith samples compared with that in the Post-Archaean
Australian Shale (PAAS, Taylor and McLennan, 1985) is not due to a high amount of
calcium carbonate. High CaO values are associated with high values of mafic related
123

elements (i.e., Ni, Cr, Co, Appendix 2). These associations together with the observed
absence of carbonate minerals in these samples (Chan et al., 2001; 2002; 2004) strongly
support a silicate related origin for the Ca.
Sodium is commonly the most useful dissolved indicator of silicate weathering. This is
because it is easy to measure and it is derived almost entirely from the hydrolysis of a
single dominant mineral (plagioclase). It is also the most nearly conservative of the
major cations (ranked last in both soil exchange preference and biological utilization;
Staufer 1990). However, high Na values in the regolith may also be related to occurrences of
added salts (e.g., NaCl), therefore it might be necessary to correct for Na20 using Cl analysis
(McLennan et al., 2003). This correction for sodium concentration (Na* = Na - 0.86C1
Staufer, 1990) reflects the conventional understanding that Na:Cl in wet and dry
deposition follows the marine ratio and that both ions behave conservatively once in
solution (Staufer, 1990).
The samples in this study generally have low Na20 contents (<1 wt%; Appendix 2) and
applying the correction to high values (>1%) of Na20 showed that the amount of
additional Na that is probably derived from the salt source is insignificant (Appendix
2).
3
2.5
2O .
1.5 ‘■ u
1
0.5
0
0 10 20 30 40
AI2O3
Figure 8.3 Scattergram showing correlation between AI0O3 and high CaO concentration
values in base of the hole saprolith samples from the Girilambone region. Post-
Archaean Australian Shale (PAAS) is from Taylor and McLennan (1985).
124

Weathering trends can be displayed on the A-CN-K triangular plot (Figure 8.4A). O n
this diagram the initial stages of weathering form a trend parallel to the (Ca0 +Na20) -
AI2O3 side of the diagram, whereas advanced weathering shows a marked loss in K20
as compositions move towards the AI2O3 apex (Figure 8.4 A). The trends follow m ix ing
lines representing the removal of alkalies and Ca in solution during the breakdown o f
first plagioclase and then potassium feldspar and ferromagnesian silicates (McLennan
et al., 2003).
The CIA and weathering trends on triangular plots have been used in two different
ways (Rollinson, 1993). Firstly, chemical changes in a recent weathering profile such a s
that illustrated in Figure 8.4A are used as a template to evaluate the chemical history o f
ancient profiles. Deviations from such trends can be used to infer chemical changes
resulting from diagenesis or metasomatism (Nesbitt and Young, 1984; 1989). The
second is that the A-CN-K diagram was based on the relationship between feldspar
weathering and Al concentration of modem muds (silt, clay). While it has been
successfully used to understand the chemical composition and weathering history o f
ancient muds, it is not so readily applied to sandstone particularly when the sands are
not well sorted (Nesbitt, 2003). It is also important to remember that when dealing with
weathering of sedimentary rocks, the sediment forming the rock has already gone
through previous cycles of weathering and that this is part of the overall geochemical
composition.
CIA values typically range from about 50 or less for most unweathered igneous and
metamorphic rocks to 100 for pure aluminosilicate residues such as kaolinite
(McLennan et al., 2003). The CIA scale is shown to the left on Figure 8.4.
To identify the effect of weathering, all the bottom of hole saprolith samples from this
study were plotted onto the A-CN-K diagram, including samples characterised by
apparent igneous (mafic-intermediate) composition, and the CIA was calculated (Figure
8.4B). Slightly weathered sediments as characterised by CIA value, show a range from
50 to 70. They plot adjacent to the weathering trends of andesitic - granitic igneous
rocks (Figure 8.4B). The deeply weathered samples plot along the muscovite-illite trend
close to the Al-K boundary with high Al content. It has been observed that high
125

Aa i ,o 3Kaolmite, Gibbsife, Chlorite Deeply w eatlieieil
Advanced weatliei ing ' trendMite
Muscovite
K-metasomatism 90
Slightly weathered
/ / 7 —i f \ , 7 A v e r s e / Plagiodase granite
y M . Granodiorite ' Andesite
/ [Ginnodtontic tieadl iM.inc-andesttic hend j
... V-: \ / \Clinopyi oxene m \ >
Figure 8.4 Ternary plots of molecular proportions of AI2O3- (Na20+Ca0*)-K20 with
the Chemical Index of Alteration (CIA) scale shown on the left modified from
McLennan and Murray (1999). (A) Shows selected idealized igneous and sedimentary
minerals and weathering trends for selected upper crustal igneous lithologies. (B)
Shows bottom of the hole saprolith samples from the Girilambone region for slightly
and deeply weathered zones and the suggested weathering trends. IWL represents the
ideal feldspar weathering line.
A1 concentration in marine sediments relates to fine-grained aluminosilicate detrital
fractions (Calverts, 1976). Potassium is mostly associated with potassium feldspar (K
AlSi30 8) and illite ((K, H30) Al2 [(OH) 2 Si3AlOi0]) (Shimmield and Mowbray, 1991;
Martinez et al., 1999; Yarincik et al., 2000). High A1 values in these samples (CIA
>75) indicate a significant amount of potassium-rich clay, probably produced by
advanced weathering processes.
On the A-CN-K diagram the chemical compositions of the slightly weathered igneous
rocks show mafic-andesitic and granodioritic weathering trends. The data also display
remarkable clustering of points at the muscovite-illite weathering zone parallel to a
general weathering trend of granite (Figure 8.4B). These trends are parallel to the ideal
feldspar weathering line (IWL) indicating that weathering was the (only) dominant
process (McLennan et al., 2003). However leaching of Ca, Na and K during weathering
causes a change to bulk composition of the residual weathering products along these
126

lines from granite to illite (Figure 8.4A, Nesbitt, 2003). Three arbitrarily chosen bul k
compositions of the weathering residues labelled 1, 2 and 3 (Figure 8.4B) represent
gradual leaching of Ca, Na and K along the granitic weathering trend. The CIA o f
residue 1 is about 55 and the weathering trend of granite intersects the A-K boundary a t
residue 2 where the CIA value is about 80. Along or parallel to the A-K boundary th e
bulk compositions of the samples from sample 2 to sample 3 contain no Ca or Na, hence a ll
plagioclase of the initial granitic material has been weathered to clay (primarily kaolinite bu t
others as well). Illite is likely to have formed after K-feldspar and mica (Nesbitt, 2003). A
depletion of K is typically used as an index for maturity of sediments (Zabel et aL ,
2001); hence K/Al would be a useful proxy for the intensity of weathering.
8.2.3 METASOMATISM
Recognition of metasomatism is important when evaluating the chemical characteristics
of the original sediments prior to interpreting the effects of weathering (Fedo et al. ,
1997; Nesbitt and Young, 1997). Potassium- Na-, and Mg- metasomatism have been
studied in paleosols (Nesbitt and Young, 1989; Rainbird et al., 1990). The effects of K-
metasomatism are readily discerned in paleosol profiles produced on igneous rocks
because their weathering trends can be accurately predicted; they are sub-parallel to the
CN-A1 boundary of A-CN-K diagram (Nesbitt, 2003). Addition of potassium to
partially weathered samples, for example, results in systematic increase in K therefore
the metasomatized samples diverge systematically from the weathering trend toward
the K apex (Figure 8.4A). Similarly, the weathering trend towards illite diverges from
IWL (Figure 8.4A) due to syn- or post-depositional K-enrichment in the clay fraction
(Fedo et al., 1995), which suggests significant K- metasomatism of clay minerals
(Roser et al., 2002; Nesbitt, 2003).
In this study a significant deviation from the ideal weathering trend is generally
observed in some of the saprolith samples. This deviation coincides with the K-
metasomatism trend (Nesbitt, 2003, Figure 8.4A), which possibly diverged from the
weathering trend of mafic-andesitic and granodioritic sources. The mafic-andesitic
weathering trend is identified for samples numbered 166-163-234-198 (Figure 8.4B).
Some samples (i.e., 200, 201) diverge from this trend toward K enrichment suggesting
that these samples were derived from K-metasomatised mafic source rocks
127
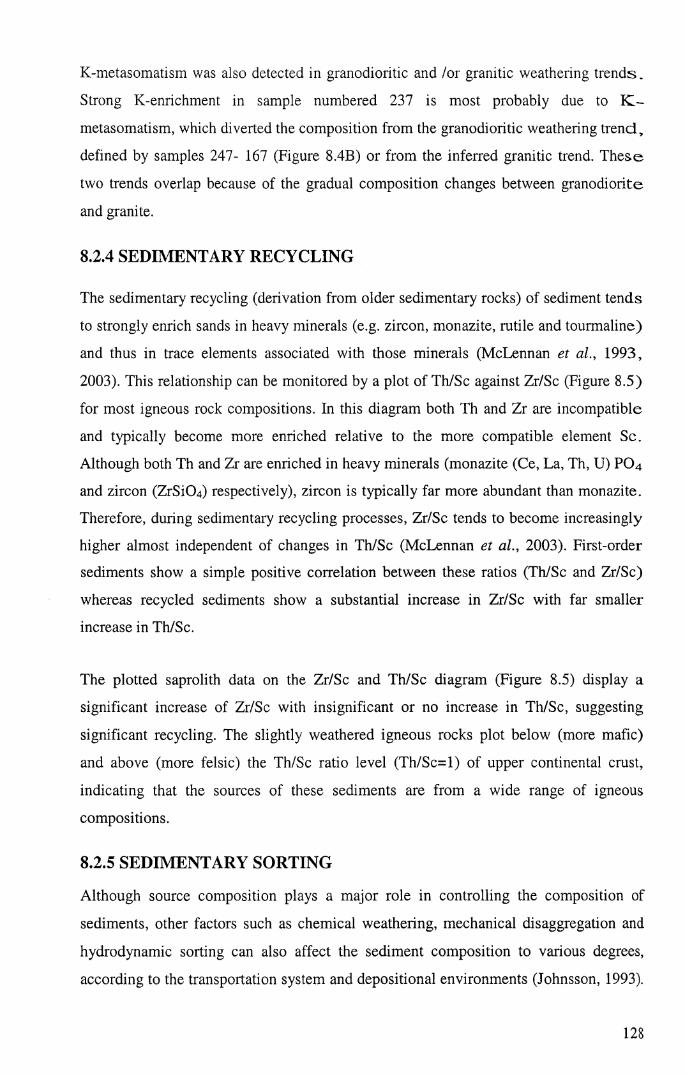
K-metasomatism was also detected in granodioritic and /or granitic weathering trends.
Strong K-enrichment in sample numbered 237 is most probably due to IC-
metasomatism, which diverted the composition from the granodioritic weathering trend,
defined by samples 247- 167 (Figure 8.4B) or from the inferred granitic trend. These
two trends overlap because of the gradual composition changes between granodiorite
and granite.
8.2.4 SEDIMENTARY RECYCLING
The sedimentary recycling (derivation from older sedimentary rocks) of sediment tends
to strongly enrich sands in heavy minerals (e.g. zircon, monazite, rutile and tourmaline)
and thus in trace elements associated with those minerals (McLennan et al., 1993,
2003). This relationship can be monitored by a plot of Th/Sc against Zr/Sc (Figure 8.5)
for most igneous rock compositions. In this diagram both Th and Zr are incompatible
and typically become more enriched relative to the more compatible element Sc.
Although both Th and Zr are enriched in heavy minerals (monazite (Ce, La, Th, U) P04
and zircon (ZrSiCL) respectively), zircon is typically far more abundant than monazite.
Therefore, during sedimentary recycling processes, Zr/Sc tends to become increasingly
higher almost independent of changes in Th/Sc (McLennan et al., 2003). First-order
sediments show a simple positive correlation between these ratios (Th/Sc and Zr/Sc)
whereas recycled sediments show a substantial increase in Zr/Sc with far smaller
increase in Th/Sc.
The plotted saprolith data on the Zr/Sc and Th/Sc diagram (Figure 8.5) display a
significant increase of Zr/Sc with insignificant or no increase in Th/Sc, suggesting
significant recycling. The slightly weathered igneous rocks plot below (more mafic)
and above (more felsic) the Th/Sc ratio level (Th/Sc=l) of upper continental crust,
indicating that the sources of these sediments are from a wide range of igneous
compositions.
8.2.5 SEDIMENTARY SORTING
Although source composition plays a major role in controlling the composition of
sediments, other factors such as chemical weathering, mechanical disaggregation and
hydrodynamic sorting can also affect the sediment composition to various degrees,
according to the transportation system and depositional environments (Johnsson, 1993).
128

During sediment transport, whether in air or water, minerals begin to separate
according to size, density and shape. For the major mineralogical components (and thus
major elements) the processes of weathering and sorting may be difficult to
differentiate because weathering processes continue during the sediment transport
process (Johnsson, 1993).
10.00
1.00
(-)oo^ 0.10H
0.01
0.000.1 1.0 10.0 100.0
Z i Sc
Figure 8.5 Plot of Th/Sc versus Zr/Sc for saprolith of the Girilambone region showing
both the oceanic-upper crustal differentiation line and the trend of sediment recycling.
Data for the PAAS, upper continental crust (UCC) and oceanic crusts (OC) are from
Taylor and McLennan (1985). The Th/Sc ratio of 1 marks the boundary of upper
continental crust.
Sedimentary sorting produces alternating shales and sandstones with complementary
chemistries. The preferential partitioning of quartz and zircon in the coarse-grained
fraction of the sediments results in a strong fractionation between SiC>2, Zr and other
components (e.g., AI2O3, TiCF). In other words, the sedimentary sorting causes a
systematic fractionation between SiCF (quartz) and ALO3 (clay) and also between Zr
(zircon) and other minor or trace elements that are preferentially retained in the fine-
grained fraction. As a consequence, shales may be defined chemically as having higher
AhCVSiCF and TiCF/Zr ratios than sandstone (Garcia et al., 1994).
Oceanic-upper crust differentiation line Sediment recy cling
(zircon addition)
■ Weathered igneous rocks ■ PA A S
■ UCC
♦ OC
129
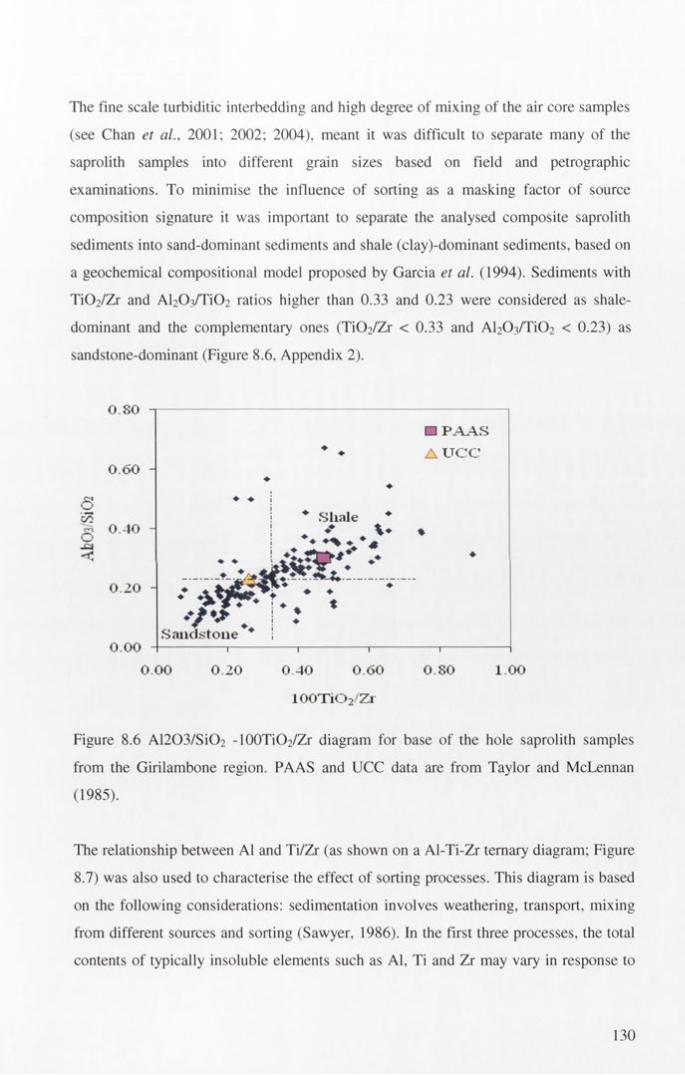
The fine scale turbiditic interbedding and high degree of mixing of the air core samples
(see Chan et al., 2001; 2002; 2004), meant it was difficult to separate many of the
saprolith samples into different grain sizes based on field and petrographic
examinations. To minimise the influence of sorting as a masking factor of source
composition signature it was important to separate the analysed composite saprolith
sediments into sand-dominant sediments and shale (clay)-dominant sediments, based on
a geochemical compositional model proposed by Garcia et al. (1994). Sediments with
Ti02/Zr and AkCVTiC^ ratios higher than 0.33 and 0.23 were considered as shale-
dominant and the complementary ones (Ti02/Zr < 0.33 and Al20 ; /r i0 2 < 0.23) as
sandstone-dominant (Figure 8.6, Appendix 2).
o.so
0.60
ß
£ 0 40' w '
c
0.20
0.00
Figure 8.6 A1203/Si02 -100TiO2/Zr diagram for base of the hole saprolith samples
from the Girilambone region. PA AS and UCC data are from Taylor and McLennan
(1985).
The relationship between Al and Ti/Zr (as shown on a Al-Ti-Zr ternary diagram; Figure
8.7) was also used to characterise the effect of sorting processes. This diagram is based
on the following considerations: sedimentation involves weathering, transport, mixing
from different sources and sorting (Sawyer, 1986). In the first three processes, the total
contents of typically insoluble elements such as Al, Ti and Zr may vary in response to
□ PA A S♦ ♦ A UCC
♦ ♦♦ ♦
* Shale ♦
♦ A ..-2* ♦
♦
_____
** • / ♦.»
Sandstone
♦ ♦< ♦
\ ♦ 1
0.20 0 40 0.60 0.80 1.00
100TiC>2 Zr
130

leaching of the soluble elements, but their relative proportions are transferred from the
source area into bulk sediment without any or with little modification (Zhang et al.,
1998). This material is then sorted according to the hydraulic properties of its mineral
components and the mechanical and chemical fractionations between complementary
shales and sandstone are generated (Garcia et al., 1994; Mongelli et al., 1998). The
centre of the Al-Ti-Zr diagram is proposed as the average of bulk sediment (ABS),
which represents a conventional chemical boundary between shales and sandstones
(Garcia et al., 1994). The diagram also reflects the differentiation of igneous rocks. The
ACOVTiCF ratio of igneous rocks is highly sensitive to magmatic differentiation and
igneous and sedimentary trends crosscut on the Al-Ti-Zr diagram (Garcia et al., 1994).
15A120 3 15Al20 3
Shale dom inant
Sandstone dom inant
Gianodiontes
Im m a tu re ta n d s to u e
' " / / / . » „ G abbi os
M ah n e sandstone
Figure 8.7 Ternary plot of 15Al203-300Ti02-Zr summarising the geochemical relations
between common sedimentary (solid line boundary) and plutonic (dotted line
boundary) trends (after Garcia et al., 1994; A). The saprolith samples from the
Girilambone region displays shale, immature sandstone, mafic and felsic igneous
composition (B). Numbers represent drill holes.
Plotting the saprolith samples on the Al-Ti- Zr diagram showed a scatter of points along
the shale-sandstone trend and the mafic-felsic igneous differentiation trend (Figure
8.7B). Chemical variation in the shale-dominant field is less than its sandstone-
dominant counterpart. This is consistent with simple mass-balance considerations. As
131

quartz is abundant in sandstones, the absolute Al + Ti + Zr content is lower than
complementary shales (Garcia et al., 1994). Sandstone-dominant plots trend toward
immature sandstone indicating a significant amount of silt and clay within these
samples. The diagram also shows that bottom of the hole samples from drill holes
CBAC163, 166, 198, 200, 201 and 234 plot adjacent to the mafic igneous field, and
others (CBAC167, 233, 237 and 247) plot in the intermediate (granodioritic) igneous
field (Figure 8.7.B).
8.3 BEDROCK, WEATHERING AND SEDIMENT COMPOSITIONS
8.3.1 WEATHERING ZONES
Chemical weathering of Al-silicates produces a new suite of minerals including clay
minerals, secondary oxides, and hydroxides. The distribution of these constituents
within an idealized profile is shown in Figure 8.8 (Nesbitt et al., 1997; Nesbitt, 2003).
Secondary minerals generally predominate near the top of weathering profiles whereas
primary minerals and rock fragments are more abundant nearer the base. Softer portions
of profiles are also likely to be eroded in preference to competent material. Therefore it
is essential to identify whether the mineralogy of the derived sediments reflects the
mineralogy of the eroded weathering products or the mineralogy of pristine bedrock. In
this study, this was investigated as follows:
• identifying the original source composition using the A-CN- K diagram and
weathering trends;
• recognising the zone and degree of weathering by calculating the CIA value for
each and comparing that with the weathering zone model proposed by Nesbitt et
al. (1997; Figure 8.8). The least weathered samples (lowest CIA value) are the
closest to the original composition;
• calculating the CIA for all dominant lithologies (sand and shale). The studied
saprolith materials were most probably derived from the underlying sedimentary
bedrocks .The CIA represents the scale of weathering calculated relative to
fresh feldspar concentration in the original composition from which the
sedimentary bedrocks were produced; and
132
• classifying the samples based on their immobile geochemical signature
(immobile elemental ratios). Samples from the same source composition a n d
different weathering zones (which have undergone different degrees o f
weathering) will display similar immobile ratios and various CIA values.
W Ä0/'/'/'/B CRelationships among the average sancf)
and bulk composition within each zone, l and parental bedrock compositions JSediments Derived
from a Granodlorite
Composition of Sand
Z o n e II
Z o n e III
Av. Bulk CompositionCIA V alues
A Z o n e I
Z o n e II
■-Zone III
- Z one
Sedlmenrs Derived from a Granite
Composition of Sand
'o n e III
Z one IV
B ed ro ck
Av. Bulk Composition CIA vdkjcs a
100 r,-"Zone 1/ Av-'Zone II
/ Q —Z one III
B e d ro c k
Figure 8.8 An idealized weathering profile developed on granitic bedrock after Nesbitt
et al. (1997). Qualitative changes in the proportions of clay minerals are plotted to the
left of the profile, and qualitative changes in quartz, total clay minerals, total feldspars
and rock fragment proportions are plotted to the right of the profile (A). Four
weathering zones are shown (I-IV) on Quartz-Plagioclase-K-feldspar (Qz -Pl-Ks) and
A-CN-K diagrams illustrate qualitatively the mineralogy and bulk composition of the
four weathering zones in sediments derived from granite and granodiorite (B).
As previously discussed, the A-CN-K diagram and the identified weathering trends
strongly suggest granite- and granodiorite-type compositions as the main primary
source of the sedimentary rocks, now weathered to saprolith in the Girilambone region
(Figure 8.4). The saprolith materials are classified based on CIA values using the
classification of the weathering zone (Nesbitt et a l., 1997) into Zone I (CIA>85), Zone
II (85>CIA>75), Zone III (75>CIA > 55) Zone IV (CIA <55). The original source
composition, weathering trend and chemical composition of the saprolith materials in
these zones are displayed in Figure 8.9. According to this model, Zone IV and Zone III
133
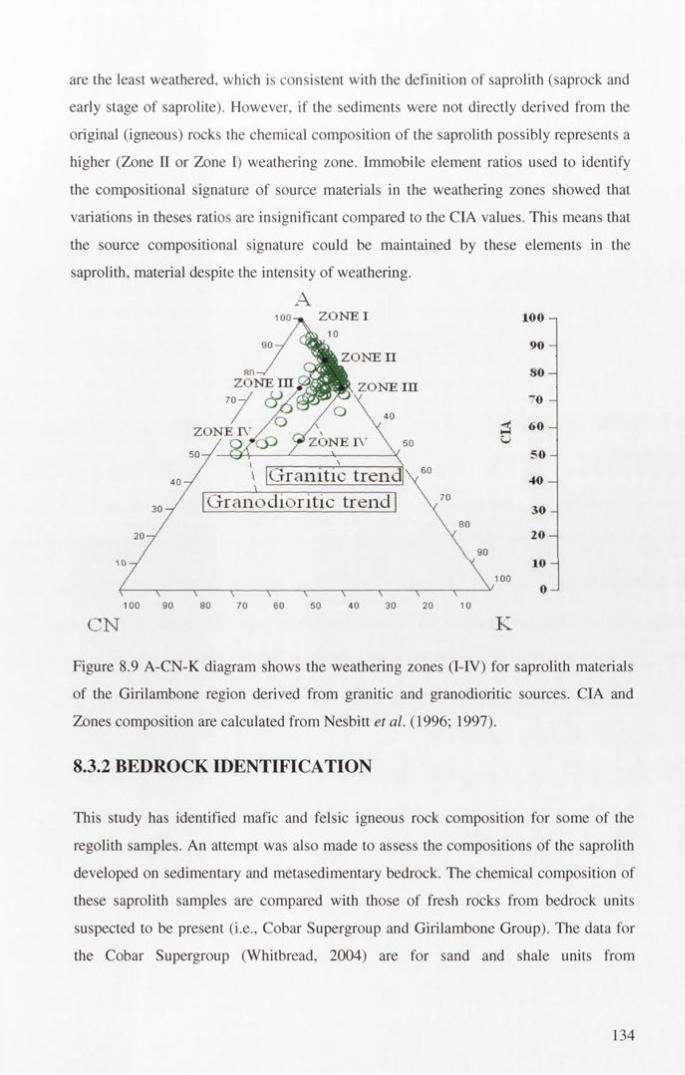
are the least weathered, which is consistent with the definition of saprolith (saprock and
early stage of saprolite). However, if the sediments were not directly derived from the
original (igneous) rocks the chemical composition of the saprolith possibly represents a
higher (Zone II or Zone I) weathering zone. Immobile element ratios used to identify
the compositional signature of source materials in the weathering zones showed that
variations in theses ratios are insignificant compared to the CIA values. This means that
the source compositional signature could be maintained by these elements in the
saprolith, material despite the intensity of weathering.
AZO NE I
ZO NE II
ZONE in ZO NE m
ZONE IVZO NE IV
G ran itic trend! \G ran o d io ritic trend
100
90 -
80 —
■"0 -
60 -
50 -
40 -
30 -
2 0 -
10 -
0 -
Figure 8.9 A-CN-K diagram shows the weathering zones (I-IV) for saprolith materials
of the Girilambone region derived from granitic and granodioritic sources. CIA and
Zones composition are calculated from Nesbitt et al. (1996; 1997).
8.3.2 BEDROCK IDENTIFICATION
This study has identified mafic and felsic igneous rock composition for some of the
regolith samples. An attempt was also made to assess the compositions of the saprolith
developed on sedimentary and metasedimentary bedrock. The chemical composition of
these saprolith samples are compared with those of fresh rocks from bedrock units
suspected to be present (i.e., Cobar Supergroup and Girilambone Group). The data for
the Cobar Supergroup (Whitbread, 2004) are for sand and shale units from
134

unmineralised sites in the Elura area. Those for the Girilambone Group are from
Ackerman (2005).
To minimise the effects of weathering processes the comparison between the data se ts
is based on likely immobile element associations. Conservative elements (Ti, Al, C e,
La) are reported to be relatively immobile in both sand and shale units of the Cobar
Supergroup (Whitbread, 2004). Rare Earth Element (REE) distributions are widely
used to characterize source composition of detrital sediments (Taylor and Mclennan,
1985; Cullers, et al., 1987; Zhang et al., 1998). Linear correlation and mass balance
consideration indicate that clays are more important than zircon (or other heavy
minerals) in hosting both light and heavy REE in cratonic shales (Condie, 1991). Trace
element behaviour is also reported to be largely controlled by the dominant clay or the
degree of weathering (Kronberg et al., 1979).
Aluminium and Ti are relatively immobile and significantly correlated in the saprolith
samples (Figure 8.1). However the Ti0 2 /Al203 ratio is susceptible to sorting because
TiÜ2 significantly concentrates in the sand fraction, (as detrital rutile and ilmenite)
whereas AI2O3 concentrates in the clay fraction. Therefore the TiCE/ALOs ratio
combined with any conserved element (i.e., Ce or La) was used to cover all the
chemical compositional changes including that caused by sedimentary sorting.
Plotting 30TiÜ2/ A I 2 O 3 against Ce and La showed a clustering of the majority of the
data in limited concentration ranges for Ce (46-119 ppm) and La (22-51 ppm) in
comparison with the relatively wide range of 30TiO2/Al2O3 ratios (Figure 8.10,11).
Plotting fresh sandstone and shale data from the Cobar Supergroup (Whitbread, 2004)
indicates that portions of the saprolith are possibly weathered from rock units similar to
the Cobar Supergroup in composition. Various saprolith materials (sandstone, shale)
from different weathering zones are grouped together on the Ti/Th - Ce/La diagram
(Figure 8.12) indicating that they have similar chemical composition and were therefore
derived from similar sources. In this context saprolith materials that are related to the
Cobar Supergroup are clustered in limited ranges of Ti/Th (0.039 > Ti/Th > 0.03) and
Ce/La (2.2> Ce/La > 1.9) ratios, whereas the Girilambone group is characterised by
relatively small range of Ti/Th (0.03 > Ti/Th > 0.005) and Ce/La (2.3 > Ce/La > 1.8;
Figure 8.11).
135

In order to identify the weathering influences on the La/Ce ratio, Ce and La were
normalised to chondrite (Taylor and McLennan, 1985) and the normalised
(La/Ce)N is plotted against the CIA in Figure 8.13. The saprolith materials showed a
wide range of change in (La/Ce)N within the most weathered zone (Zone II, CIA= 75-
85) and no correlation was observed between (La/Ce)N and CIA. On the other hand
La/Ce ratios show a limited range (1-1.5) from the least weathered samples. This
indicates that the (La/Ce)n values can be used reliably as a geochemical signature to
identify the underlying bedrock in less weathered saprolith samples (with CIA value up
to 75).
Cobar Sg. fresh sand and shale field
a Sand dominant
x Shale doininanatA 2.0
Ce (ppm)
Figure 8.10 Scattergram of 30TiO2/Al2O3 and Ce showing the correlation between
Cobar Supergroup fresh rock compositions and the saprolith of the Girilambone region.
Data of Cobar Supergroup (Sg) are from Whitbread (2004).
136
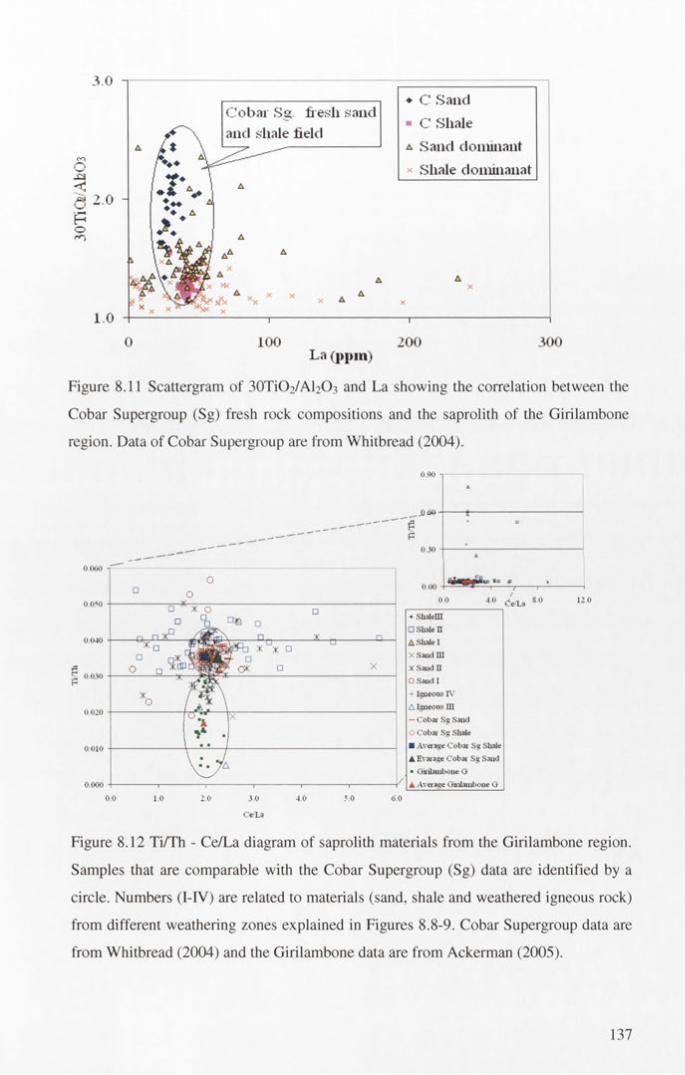
3.0 T♦ C Sand ■ C Shale a Sand dominant x Shale dominanat
Cobai Sg hesli sand and shale field
A 2.0 -
Figure 8.11 Scattergram of 30TiO2/Al2Oi and La showing the correlation between the
Cobar Supergroup (Sg) fresh rock compositions and the saprolith of the Girilambone
region. Data of Cobar Supergroup are from Whitbread (2004).
3.0
Ce'La
Figure 8.12 Ti/Th - Ce/La diagram of saprolith materials from the Girilambone region.
Samples that are comparable with the Cobar Supergroup (Sg) data are identified by a
circle. Numbers (I-IV) are related to materials (sand, shale and weathered igneous rock)
from different weathering zones explained in Figures 8.8-9. Cobar Supergroup data are
from Whitbread (2004) and the Girilambone data are from Ackerman (2005).
137

0.5 —x Shale -Dominant a Sandstone -dominant ♦ Cobai Sg Sand
■ Cobai Sg. Shale
5.5 -
5.0 -
4.5 -
4.0 -
0.0
CIA
Figure 8.13 CIA - (Ce/La)N diagram of saprolith materials from the Girilambone
region showing (Ce/La)N of the Cobar Supergroup data range (1.0- to 1.5). Cobar
Supergroup (Sg) data are from Whitbread (2004). Ce and La were normalised to
chondrite (Taylor and McLennan, 1985).
8.4 SUMMARY AND CONCLUSIONS
Analysis of the least weathered regolith present in bottom of the hole samples has
shown that elemental ratios and the CIA index are useful for identifying the parent rock
of weathered samples.
A-CN-K plots have identified the effect of weathering, showing that some of the
samples are slightly weathered (CIA=50-70) with andesitic-granitic igneous rock
composition. The deeply weathered (>70 CIA) samples plot adjacent to muscovite-
illite weathering zone parallel to a general weathering trend of granite. A significant
deviation from the ideal granodioritic and/ or granitic weathering trends was observed
on the A-CN-K diagram associated with K enrichment. This K enrichment is possibly
due to K-metasomatism or alternatively it indicates high K granitic source rocks.
138

Ratios of Zr/Sc and Th/Sc diagram indicate that some of the least weathered samples
are mafic (relatively low Zr/Sc and Th/Sc). The deeply weathered samples showed a n
independent increase in Zn/Sc, which indicates significant recycling.
The ratios of AfCVSiCb vs 100 TiCL/Zr and 15Al203-Zr-300Ti02 reveal the effect o f
sedimentary sorting. These ratios also show that sandstone-dominant samples
approximate immature sandstones indicating significant amounts of silt and clay,
whereas the shale- dominant field is relatively limited. Mafic intermediate and felsic
igneous compositions are also identified.
Saprolith materials (after sandstone and shale) from the less weathered zones are
grouped together on the Ti/Th and Ce/La diagram, indicating that they have similar
chemical composition and are therefore derived from similar sources. The majority o f
saprolith samples show Ti/Th and Ce/La ratios within the range found in fresh Cobar
Supergroup or Girilambone turbidites. Some show depletion in Ce and La and some
enrichment suggesting these samples were derived from different source rocks or that
Ce and La have been mobilised in the most weathered regolith.
139

9. CHAPTER NINE: ELEMENT DISPERSION IN CALCRETE- MANGANESE- IRON-DOMINANT REGOLITH
9.1 INTRODUCTION
Element distributions in the regolith are determined by:
• the mineralogy of the regolith and the stability of their primary host minerals;
• the influence of ground and surface waters; and
• the influence of biota (Lewis et al., 1987; Butt et al., 1998; Britt et al., 2001;
Anand and Paine, 2002). These factors are all affected by the prevailing climatic
regimes (Koinig et al., 2003). In general, only processes related to past regimes of long
duration, to extreme climates or to recent regimes leave a significant imprint. Thus, in
much of Australia many of the dominant geochemical (and mineralogical)
characteristics of the regolith are related to weathering under humid climates with high
water tables and generally acid conditions, whereas others are due to later, possibly still
active, events related to arid, alkaline environments with lower water tables. The
features produced by these later events appear as modifications of the pre-existing
regolith and tend to be reflected by the concentrations of minor components (Ollier and
Pain, 1996; Taylor and Shirtliff, 2003).
This chapter explores the relationships between weathering-controlled element
dispersion and regolith accumulations of carbonate (Ca- and Mg- rich), iron oxides/
oxyhydroxides (Fe-rich) and manganese oxides/oxyhydroxides (Mn-rich). This
subdivision of regolith is based on knowledge of the regolith materials in the
Girilambone region and the observed element associations. A better understanding of
host phases for the various trace elements can help predict regolith-related background
variations in element abundances and advise the most appropriate regolith sampling
media for particular elements. This in turn should improve geochemical exploration in
the region.
140

9.2 ELEMENT ASSOCIATIONS AND DISPERSION IN REGOLITH CARBONATE ZONES.
9.2.1 INTRODUCTION
Regolith carbonate (commonly called calcrete) is defined by Wright & Tucker (199L)
as near-surface, terrestrial, accumulations of predominantly calcium carbonate, which
occurs in a variety of forms from powdery to nodular to highly indurated. Calcrete is
widely distributed in semi-arid regions (e.g., Goudie, 1983; Nahon, 1991; Wright and
Tucker, 1991; Hema and Navin, 2004; Durand et al., 2006) and has been used as a
sampling medium in geochemical exploration for gold and some base metals (e.g.,
Lintem and Butt, 1993; 1998; Hill et al., 1999; McQueen et al., 1999; Chen et al. ,
2002). Calcrete forms by cementation and displacive and replacive precipitation o f
predominantly calcium-rich carbonate into soil profiles, transported and in situ regolith
and bedrocks, in areas where pore water and groundwater become saturated with
respect to calcium carbonate (Durand et al., 2006). Calcrete composition varies from
calcite-dominant to dolomite-dominant (Chen et al., 2002).
9.2.2 NATURE AND REGIONAL DISTRIBUTION OF REGOLITH CARBONATE
There are many types of regolith carbonates and classification schemes. Wright and
Tucker (1991) proposed a morphological classification (Table 9.1). Various forms that
have genetic implications are not defined in this classification. Calcretes can also be
classified by their hydrological setting. Wright and Tucker (1991; Figure 9.1)
genetically classified the regolith carbonates based on hydrological setting into:
• phreatic (valley) or groundwater non-pedogenic calcrete-forms in areas around
the groundwater table;
• capillary fringe non-pedogenic calcrete-forms in the capillary fringe of phreatic
zone;
• gravitational zone non-pedogenic calcrete develops in the gravitational water zone
of the vadose zone;
• pedogenic calcrete developed in the soil moisture vadose zone; and
• superficial non-pedogenic calcrete which forms on the regolith surface .
141

Table 9.1 Morphological classification of calcrete (from Wright and Tucker, 1991).
Type Description
Calcareous soil Very weakly cemented or uncemented soil
with small accumulations as grain coatings,
patches of powdery carbonate including
needle-fibre calcite, carbonate filled fractures
and small nodules
Calcified soil A firmly cemented soil, just friable; few
nodules. 10-50% carbonate
Powder calcrete A fine, usually loose powder of calcium
carbonate as a continuous body with little or
no nodule development
Pseudotubule calcrete All, or nearly all, the secondary carbonate
forms encrustations around roots or fills root
or other tubes
Nodular calcrete Discrete soft to very hard concretions of
carbonate cemented and/or replaced soil.
Concretions may occur with laminated
coatings to form pisoids
Honeycomb calcrete Partly coalesced nodules with interstitial
areas of less indurated material between
Hardpan calcrete An indurated horizon, sheet-like, typically
with a complex internal fabric, with sharp
upper surface, gradational lower surface
Laminar calcrete Indurated sheet of carbonate, typically
undulöse. Usually, but not always, over
hardpans or indurated substrate
Boulder/cobble calcrete Disrupted hardpans due to fracturing,
dissolution and rhizobrecciation including
tree heave). Not always boulder grade (clasts
are rounded due to dissolution)
142
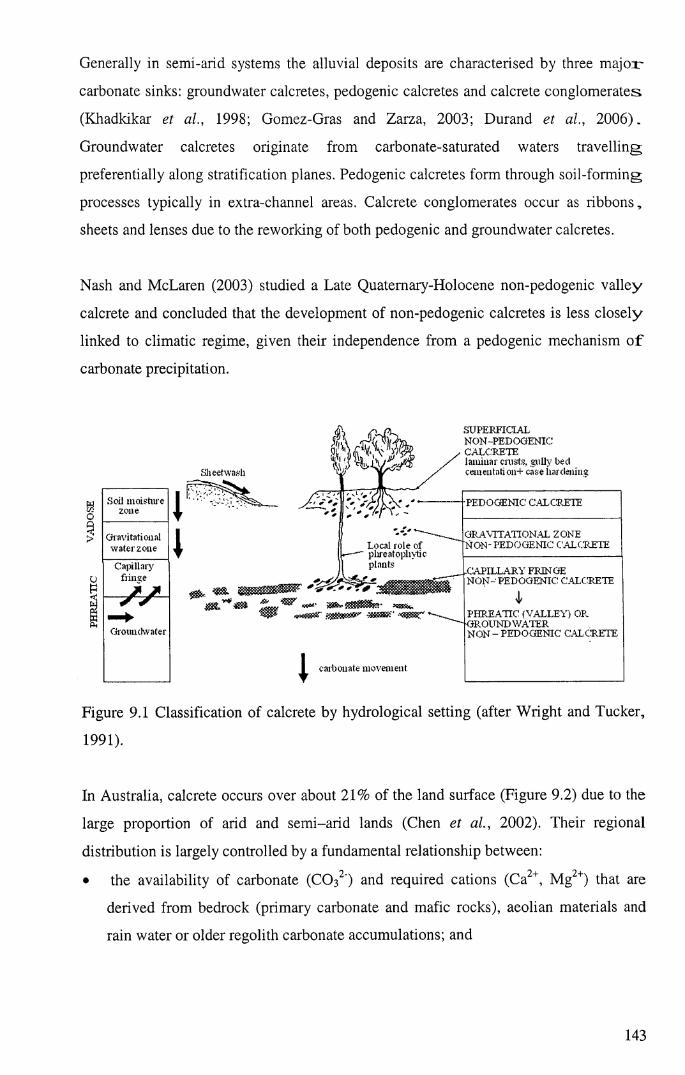
Generally in semi-arid systems the alluvial deposits are characterised by three m a jo r
carbonate sinks: groundwater calcretes, pedogenic calcretes and calcrete conglomerates
(Khadkikar et al., 1998; Gomez-Gras and Zarza, 2003; Durand et al., 2006).
Groundwater calcretes originate from carbonate-saturated waters travelling
preferentially along stratification planes. Pedogenic calcretes form through soil-forming
processes typically in extra-channel areas. Calcrete conglomerates occur as ribbons,
sheets and lenses due to the reworking of both pedogenic and groundwater calcretes.
Nash and McLaren (2003) studied a Late Quaternary-Holocene non-pedogenic valley
calcrete and concluded that the development of non-pedogenic calcretes is less closely
linked to climatic regime, given their independence from a pedogenic mechanism o f
carbonate precipitation.
Soil moisture zone
Gravitational water zone
Capillaryfiiuge
Groundwater
Sheet wash
1 Local i ole of plueatophvüc plants
1carbonate movement
SUPERFICIALNON-PEDOGENICCALCRETElaminar emsts. gully bedcementation+ case hardening
PEDOGENIC CAL CRETE
GRAVITATIONAL ZONEN o n - p e d o g e n i c c a l c r e t e
CAPILLARY FRINGE N O N - PEDOGENIC CALCRETE
PHREATIC: (VALLEY) ORGROUNDWATERNON - PEDOGENIC CALCRETE
Figure 9.1 Classification of calcrete by hydrological setting (after Wright and Tucker,
1991).
In Australia, calcrete occurs over about 21% of the land surface (Figure 9.2) due to the
large proportion of arid and semi-arid lands (Chen et al., 2002). Their regional
distribution is largely controlled by a fundamental relationship between:
• the availability of carbonate (C O 3 2 ) and required cations (Cai+, Mg2+) that are
derived from bedrock (primary carbonate and mafic rocks), aeolian materials and
rain water or older regolith carbonate accumulations; and
143
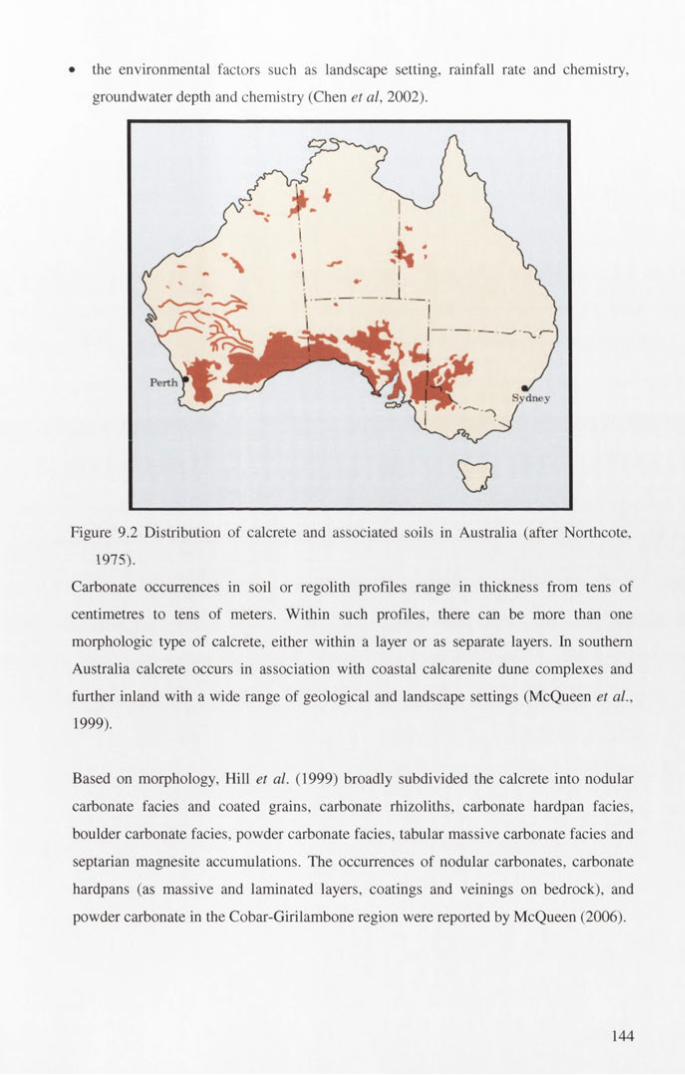
• the environmental factors such as landscape setting, rainfall rate and chemistry,
groundwater depth and chemistry (Chen et al, 2002).
PerthSydney
Figure 9.2 Distribution of calcrete and associated soils in Australia (after Northcote,
1975).
Carbonate occurrences in soil or regolith profiles range in thickness from tens of
centimetres to tens of meters. Within such profiles, there can be more than one
morphologic type of calcrete, either within a layer or as separate layers. In southern
Australia calcrete occurs in association with coastal calcarenite dune complexes and
further inland with a wide range of geological and landscape settings (McQueen et al.,
1999).
Based on morphology, Hill et al. (1999) broadly subdivided the calcrete into nodular
carbonate facies and coated grains, carbonate rhizoliths, carbonate hardpan facies,
boulder carbonate facies, powder carbonate facies, tabular massive carbonate facies and
septarian magnesite accumulations. The occurrences of nodular carbonates, carbonate
hardpans (as massive and laminated layers, coatings and veinings on bedrock), and
powder carbonate in the Cobar-Girilambone region were reported by McQueen (2006).
144

The distribution of calcrete in southeastern Australia appears to be similar to that
observed in Western Australia (Lintem and Butt, 1998) with the widespread pedogenic
groundwater types occurring south of about latitude 30°S (i.e., an extension of a feature
equivalent to the Menzies Line in Western Australia). North of this zone groundwater-
related valley calcrete and red-brown hardpans are more common (Hill et al., 1999).
In this study it was difficult to recognise the morphological characteristics of most of
the calcrete in the pulverised composite samples, but observations of exposed calcrete
throughout the region indicate at least four calcrete facies in regolith with elevated
values of CaO (>1.0 wt %) and MgO (>1.0 wt%). These facies are: i) coated grains and
nodular carbonate; ii) powdery carbonates; iii) massive or laminated carbonate
hardpans; and iv) filling carbonate that occur as veins (see also Khider and McQueen,
2006; McQueen, 2006). The first two are weakly consolidated carbonate and generally
associated with carbonate hardpan, which is common within soil and alluvial/colluvial
sediments. The third facies occurs in regolith profiles where carbonate-bearing
solutions have ponded, typically within in situ regolith or along the boundary between
the transported and in situ regolith (the T/I boundary). The fourth facies forms filling
along cracks in transported and in situ regolith and fracture-fillings in saprock/ bedrock
(Figure 9.3).
The regolith profiles and regolith-landform toposequences indicate that the regolith
carbonate (calcrete) facies vary both vertically within a profile and laterally across the
landscape. The number and thickness of carbonate-rich “horizons’ varies widely,
possibly due to multiple episodes of calcrete precipitation and re-dissolution (Figures
9.4-9). In the in situ regolith the carbonate horizon is 1-8 m thick and generally
associated with the T/I boundary (Figures 9.7-9), whereas in the transported regolith the
carbonate is a single near-surface layer, approximately 1 to 3 m thick (Figures 9.4-6).
Generally, the carbonate-rich layers are within the top 10 m of the regolith (Figures 9.4-
9).
9.2.3 CALCRETE COMPOSITION
Compositional variability of carbonate-bearing regolith can be shown using the
components MgO, CaO and the major non- carbonate component AI2 O3 (Figure 9.10).
The proportion of carbonate in the samples varies from several wt% to nearly pure
145

carbonate. Most samples have a significant non-carbonate component, as reflected by
the concentration of compositions towards the AI2 O3 apex of the ternary plot. All the
data show a significant MgO content reflecting both the common presence of dolomite
(Figures 9.11-12) and a non-carbonate contribution of MgO from clay minerals. X-ray
Carbonateveinlet
CBAC 85 (l-2m)Laminated mudstone with carbonate veinlet
CBAC 40 (1-2 m)Sandy silty mudstone with carbonate veinlet
3
CBAC 88 (4-5 m)White quartz lode showing vermicular quartz chlonte intergrowth, broken and invaded by calcrete
Figure 9.3 Examples of calcrete from the Girilambone region showing carbonate filling
cracks (1-3) and replacing pre-existing materials (3)(samples from aircore drilling,
Fleming et al., 2001).
146

LUEggo
LUESg
CBAC239 mEgg
6600000 mN
CBAC236 ■■ :.........................CBAC231 .
CBAC226 • CBAC219 &m+ m
C B A C 2 1 6 * "
CBAC212 CBAC210 /
•CBAC2Q0 a CBAC196 *
CBAC193 •■
CBAC246• •
CBAC242■
o : 10
: kilometers
6560000 mN
20
Dull holeo t <3\ o o
T— OJ OJO O O< «!r t pq t fu o u
>o £ 00 o \CM
CMCM
cnCM s
mCM
SOCM
00CM m
CMc o
so Pi O'. 03 mo
CM c m cm c m CMO Ö
CMo
CM CM CM CM CMO
CM CM CM Ö CM CM CM
< < < < < < < < « ! <3 < < < < <c <c < !PQÜ
PQU
PQU
PQO
PQO
PQO
PQO
PQU
PQO
PQU
PQO
PQO
PQO
PQU
PQO
PQ5
P4O
PQO
wO
•s 40 -
Ti anspoited In-situ Boundary Regolith carbonate
Figure 9.4 Drill hole plots showing the transported/m situ boundary and distribution of
calcrete-bearing zones in the transported regolith of the Byrock area from the
Girilambone region. D rill hole locations are shown on the associated map.
147

CBA
C14
I
ooooCM
LUEooooID
C B A C 15^
CBAC155»
LUEoooo00
CBAC159«CBA C 157» C B AC160«
CBAC161 •C B A C 16 2 *
6480000 mN CBA C 163»
; CBAC165«•
C 6A C 168«
0 5 10 CBAC1 71 •C B A C 186*
k ilo m e te rs
CBAC18 0« ' B ' l y : i *«7BAC184«
CBAC173»
I)iiH holeCMtn
C°iSTi'■nso £
O. § CMSO
ooso
snso
soso
ooso
p § 00 S COsoCO
O 5 Q 5 5 Q O Q O Q 5 Q 5 u 5 5 O o< <; < < c < <5 «; < <: <; <: c < <PQO
ppo
PPO
PjQu
PPo
PPO
PBU PPO
ppu
PPO
PPo
PMo pbo
pbo
PBO
PBO
PBO
PPO
PPO
Transported In-si tu Boundary Regolith carbonate
Figure 9.5 Drill hole plots showing the transported/m situ boundary and distribution of
calcrete-bearing zones in the transported regolith of the Hermidale area from the
Girilambone region. D rill hole locations are shown on the associated map.
148

C8AC1 O^j
E
4
• • CBAC92• CBAC77
CBAC73
CBAC69
6560000 mN
* CBAC129 • CBAC132
CBAC137
UUEoo
6540000 mN. CBAC37• •• * •• •
CBAC32
CBAC23
t + CBAC16 CBAC12
kilometers
CBAC44CBAC50
6520000 mN• CBAC2
CBAC1
’—1 CMu o < << PQ PQu o
■=T CO CM CMO O < < PQ PQ O O
CM CO CO COU O < < PQ PQo u
D ill hole>•0 T T> 00 0 \fc ro Tru o o o o o«! < ; < ; < ; <(,pq pq pq pq pq pqo o o o o o
0 " - c i o \ ( « \ ^ i r i ^ o o ( N m T r i ni r i > n u o \ o r ' r ' r ^ r ^ r ' O N C 7 i a \ o \O O U O U U O O O O O U Ü
p q p q p q p q p q p q p q p q p q p q p q p q p qo o c o o o o o u o o o o
C \ CM WO CM c o c o
c~~ oo co co6 5c <:pq PQ O O
Figure 9.6 Drill hole plots showing the transported/m situ boundary and distribution of
calcrete-bearing zones in the transported regolith of the Sussex area from the
Girilambone region. Drill hole locations are shown on the associated map.
149

CBA
C18
I
LUE
1gT f
LUEooo5
C0AC239
C0AC24O■
LUEo§o9
CBAC244CBAC246
6600000 mN
CBAC214a
CBAC211 im
CBAC206 /: CBAC201 j P
CBAC197 f C0AC194 X
CBAC-L91 /CBAC188 /
0 : 10 20
kilometers
6560000 mN
CBA.C248a
Dill hole
U O O O O O O O O O O O O Ü
go o
go o
Ov] co 2 o\ o 00
Ö Ö Ö Ö Ö Ö uCNJU Ö Ö Ö
ooÖ Ö Ö Ö
< < < < <5 < < < < < < < < < cPQo
PQo
PQo
PQO
P3o o
PAO
PQU
p£)O
PQO
PQO
p£iO
PQO
PHo
PQO
PHu
----- Transposed iii-sihi boundaryI Spotic mteival of carbonate
Figure 9.7 D rill hole plots showing the transported/m situ boundary and distribution of
calcrete-bearing zones in the in situ regolith of the Byrock area from the Girilambone
region. Drill hole locations are shown on the associated map.

CBAC
13:
LU LU LUE: E Eo o; o
65^000 mN o • ... .8o 5 C0ÄC145*•
TOCBACI^p* CBAC150«
CBAC139« *
CBAC159«
CBAC162*6480000 mN . . CBAC163»
CBAC165«" CBAC167«
CBAC169«
CBAC172«
o__________ 10__________20
kilometers CBAC173«CBA£1 76« •
C§AC180*
Dull hole^ ■ ^ j ’ ^ r ^ v r ^ ^ ' ^ r u o u o w o s o6 5 o o 5 o o u o o 5p Q p Q p q p c i p Q r t p c i p a p Q p q p ao o o o o o o o o o o
COso 3 woso g o\SO CM in rS CX) §5 5 5 5 5 5 o O 5 5 5 5< < C < < < < < < </VS < cPQO p£)o o PQO pqo rto o o u PMo PMo P Mo
----- Transported / in-situ boundaiyI Spotic interval of carbonate
Figure 9.8 Drill hole plots showing the transported/m situ boundary and distribution of
calcrete-bearing zones in the in situ regolith of the Hermidale area from the
Girilambone region. Drill hole locations are shown on the associated map.
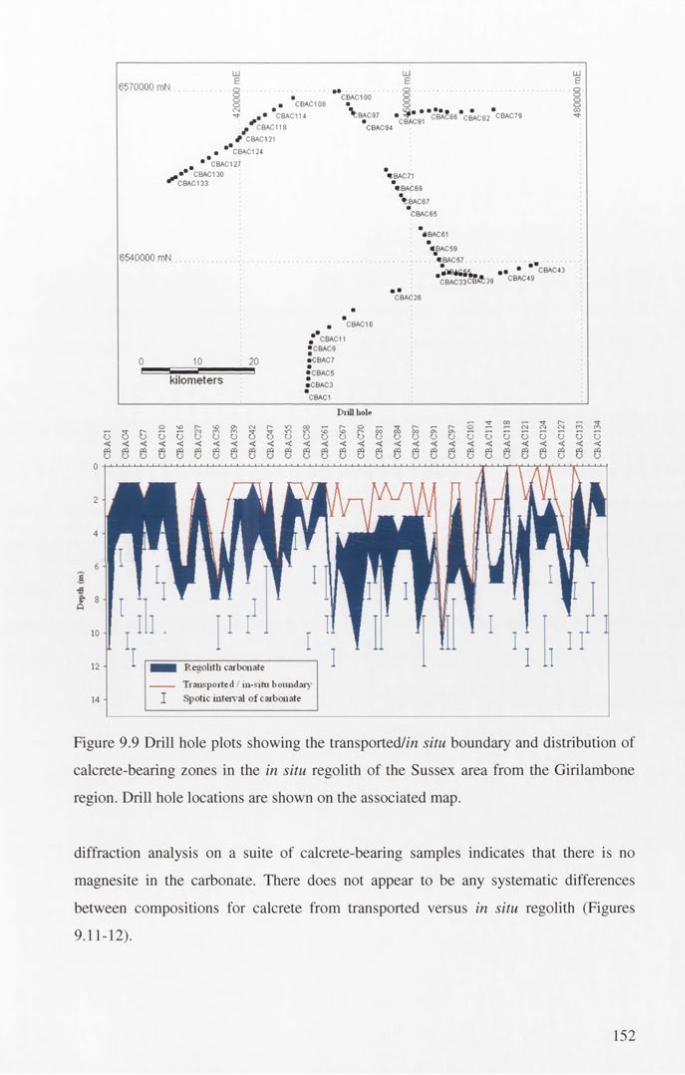
$570.0.00 mN
y■ CBAC118
/ CBAC121
■ CBAC108 "cBAC114 V b AC97 • c^ , " * CBA?86*CBAC82 CBAC79
■ * CBAC124
m * *CBAC127 CBAC130
CBAC133
6540000 mN
e^AC71«BAC69
VBAC67
*CBAC65
"ca
"#BAC61
*«BAC59. «BAC57.................................
. • • * CCBAC33CBaT;39 CBAC49
CBAC16
kilometers
a CBAC11•CBAC9•CBAC7
• CBAC5■C6AC3
*CBAC1
5 C c c
Drill hole
■ « r » n u - ,i v o v o r ^ c o c o c o o \ a \o o u o u b u o o u o
p Q C Q t f ) p Q p Q t f ) f £ | f C i t f i p 4 p C l p Q t f l P Q p C | « r t r t f £ l P Q P C i C Q « P Q P Q C Q p a p QO O O U Ü Ü U Ü Ü O U O O U O O O O U O Ü U O O U Ü O O
Regolith carbonate
Transported / in-sihi boundaryI Spotic interval o f carbonate
Figure 9.9 Drill hole plots showing the transported/m situ boundary and distribution of
calcrete-bearing zones in the in situ regolith of the Sussex area from the Girilambone
region. Drill hole locations are shown on the associated map.
diffraction analysis on a suite of calcrete-bearing samples indicates that there is no
magnesite in the carbonate. There does not appear to be any systematic differences
between compositions for calcrete from transported versus in situ regolith (Figures
9.11-12).
152

CaO100^
/ \ \ 1025% Dolomite A \ /A '
50% Dolomite
1 0 - / * Carbonate in transported regolitho Carbonate in saprolite ( in situ) regolith
y __________ „___________ „___________ „___________ „___________ „___________ „ ___________ „___________ ___^ J o O ' A A A A A A A A 7V
100 90 80 70 60 50 40 30 20 10
Figure 9.10 Triangular (MgO-CaO-AFCh) compositional diagram of the transported
and in-situ regolith from the Girilambone region.
Calcite
Dolomite
0 10 20 30 40 50
MgO wt%
Figure 9.11 Bivariate MgO-CaO diagram of the transported calcrete-bearing regolith
from the Girilambone region.
153

16 1
Calcite
Dolomite
0 10 20 30 40 50MgO wt%
Figure 9.12 Bivariate MgO-CaO diagram of the in situ calcrete-bearing from the
Girilambone region.
Potassium and A1 contents in the regolith carbonate commonly represent the
composition of relict muscovite and clay minerals. The distribution pattern of regolith
carbonate compositions on the K2O-AI2O3 diagram shows a trend toward the illite-
muscovite composition (Figure 9.13 A). A small number of samples plot close to the
kaolinite composition, which indicates more advanced weathered or reworked
components of clay. There was no significant correlation of CaO or MgO with AI2O3,
K2O or Fe20.3 (Figure 9.13).
Fe20 3 in the regolith carbonate samples ranges from 0.74 % to 8.4 %. In gold-enriched
horizons (see below), there appears to be an antipathetic relationship between Ca, Mg
and Fe. This suggests that Fe is not significantly present in the carbonate but most
likely present as iron oxide/oxyhydroxide impurities.
9.2.4. GOLD CONCENTRATION IN CALCRETE
Previous investigation of exposed calcrete in the Cobar-Girilambone region has
indicated a clear association of Au with calcrete (McQueen et al. 1999; McQueen
2006). In areas away from known mineralisation calcrete generally contains less than
0.001 ppm Au (the detection limit). Detectable Au is found in calcrete at sites close to
154

aO °
o
or down drainage from known gold mineralisation, with 0.004 ppm considered a
regional threshold and 0.012 ppm a local (deposit) threshold (McQueen, 2006).
In this study, the calculated thresholds of gold are 0.006 ppm and 0.009 ppm in the
regolith carbonate (calcrete) of the transported and in situ regolith respectively. There is
no direct correlation between the carbonate content (CaO and MgO concentrations) and
Au concentration in calcrete-bearing regolith zones. To understand the distribution of
Au in the calcrete zone selected profiles of high-Au content from the calcrete of the in
situ and transported regolith were examined.
• Muscoute A Kaobuite♦ Hüte
0 8 -Q 8 -
a CaO
Figure 9.13 Scattergrams of major components in the regolith carbonate zones of the
Girilambone region.
155

9 .2 .4 .1 A S S O C IA T IO N O F A U W IT H C A L C R E T E IN T H E IN SITU R E G O L IT H
Elevated Au values associated with calcrete from in situ regolith range from 0.005 ppm
to 0.025 ppm (Appendix 7). Four examples occur in drill holes CBAC2, CBAC41,
CBAC188 and CBAC204.
In CBAC2 and CBAC188 calcrete has accumulated along and just below the T/I
boundary (Figures 9.14, 15). The highest Au values in these drill holes do not coincide
with the highest Ca or Mg contents, suggesting that the calcrete is not directly
accumulating Au. Gold contents also vary within the regolith carbonate zone. In
CBAC2 the highest Au content is in the middle of the regolith carbonate zone and is
associated with elevated Bi and lower Fe contents (Figure 9.14). The compositional
trends in CBAC2 show elevated Ca in the upper part of the profile decreasing more
rapidly than Mg content with depth. This would be consistent with mixed calcite-
dolomite in the upper part of the calcrete zone (1 m) and predominantly dolomite below
(2 m; Appendix 4).
0 0.005 0.01 0 1 2 0 2 4 6 8
T/I boundary
Regolith carbonate
Au ppm
Figure 9.14 Distributions of Au, Bi, CaO, MgO and total Fe2 Ü3 (wt %) through the
regolith carbonate zone within in situ regolith in drill hole CBAC2.
There is also significant Ca enrichment near the top of the regolith carbonate zone in
drill hole CBAC188. The Au content increases with depth through the carbonate zone
156
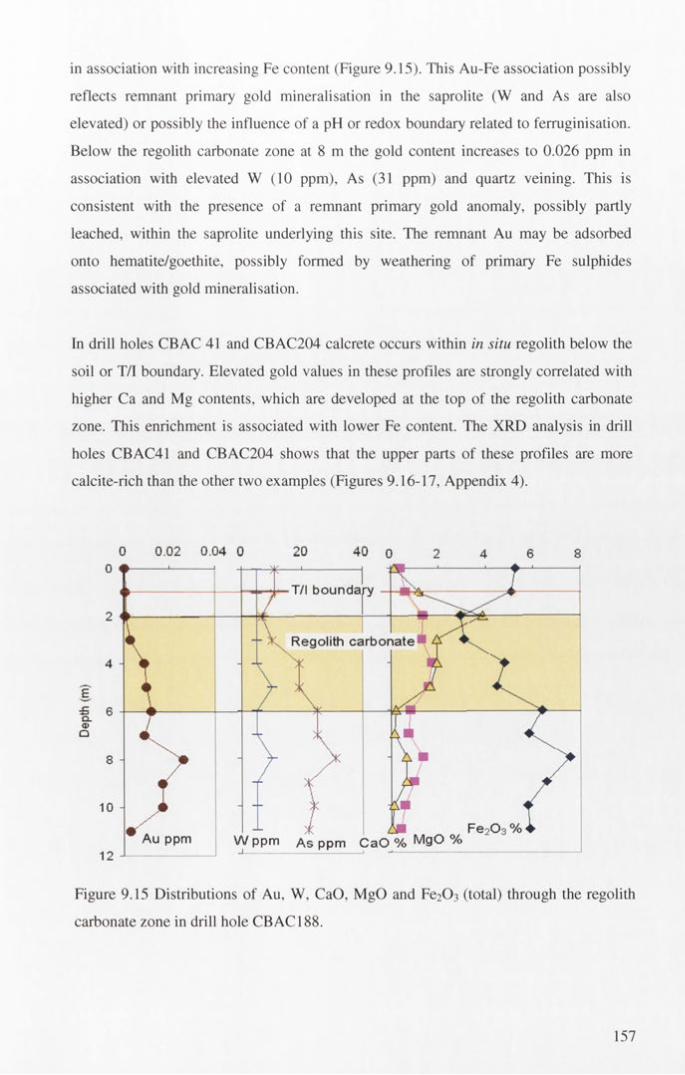
in association with increasing Fe content (Figure 9.15). This Au-Fe association possibly
reflects remnant primary gold mineralisation in the saprolite (W and As are also
elevated) or possibly the influence of a pH or redox boundary related to ferruginisation.
Below the regolith carbonate zone at 8 m the gold content increases to 0.026 ppm in
association with elevated W (10 ppm), As (31 ppm) and quartz veining. This is
consistent with the presence of a remnant primary gold anomaly, possibly partly
leached, within the saprolite underlying this site. The remnant Au may be adsorbed
onto hematite/goethite, possibly formed by weathering of primary Fe sulphides
associated with gold mineralisation.
In drill holes CBAC 41 and CBAC204 calcrete occurs within in situ regolith below the
soil or T/I boundary. Elevated gold values in these profiles are strongly correlated with
higher Ca and Mg contents, which are developed at the top of the regolith carbonate
zone. This enrichment is associated with lower Fe content. The XRD analysis in drill
holes CBAC41 and CBAC204 shows that the upper parts of these profiles are more
calcite-rich than the other two examples (Figures 9.16-17, Appendix 4).
0 0.02 0.04 00 ♦
T/I boundary
- - v Regolith carbonate
12 -1Au ppm w ppm As ppm CaO % M 9 ° %
Figure 9.15 Distributions of Au, W, CaO, MgO and Fe2 Ü 3 (total) through the regolith
carbonate zone in drill hole CBAC 188.
157
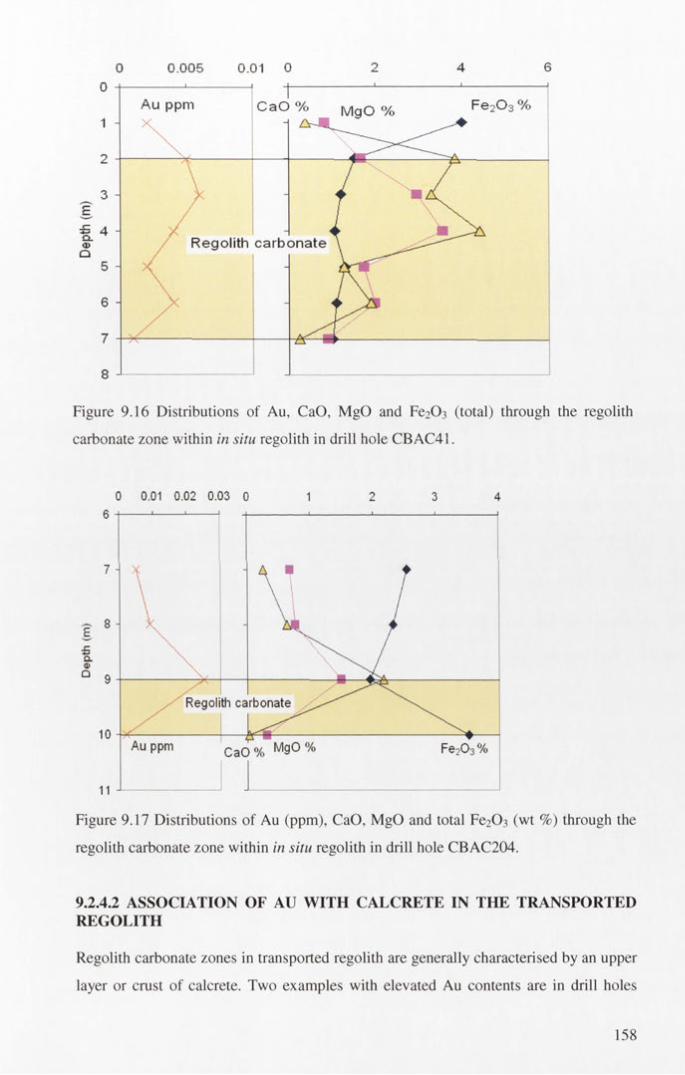
0 0.005 0.01 0 2 4 6
Au ppm CaO % MgO %
Regolith carbonate
Figure 9.16 Distributions of Au, CaO, MgO and Fe2Ü3 (total) through the regolith
carbonate zone within in situ regolith in drill hole CBAC41.
0 0.01 0.02 0.03 0 1 2 3 4
Regolith carbonate
Au ppm CaO % M9 ° °/o
Figure 9.17 Distributions of Au (ppm), CaO, MgO and total Fe203 (wt %) through the
regolith carbonate zone within in situ regolith in drill hole CBAC204.
9.2.4.2 ASSOCIATION OF AU WITH CALCRETE IN THE TRANSPORTED REGOLITH
Regolith carbonate zones in transported regolith are generally characterised by an upper
layer or crust of calcrete. Two examples with elevated Au contents are in drill holes
158
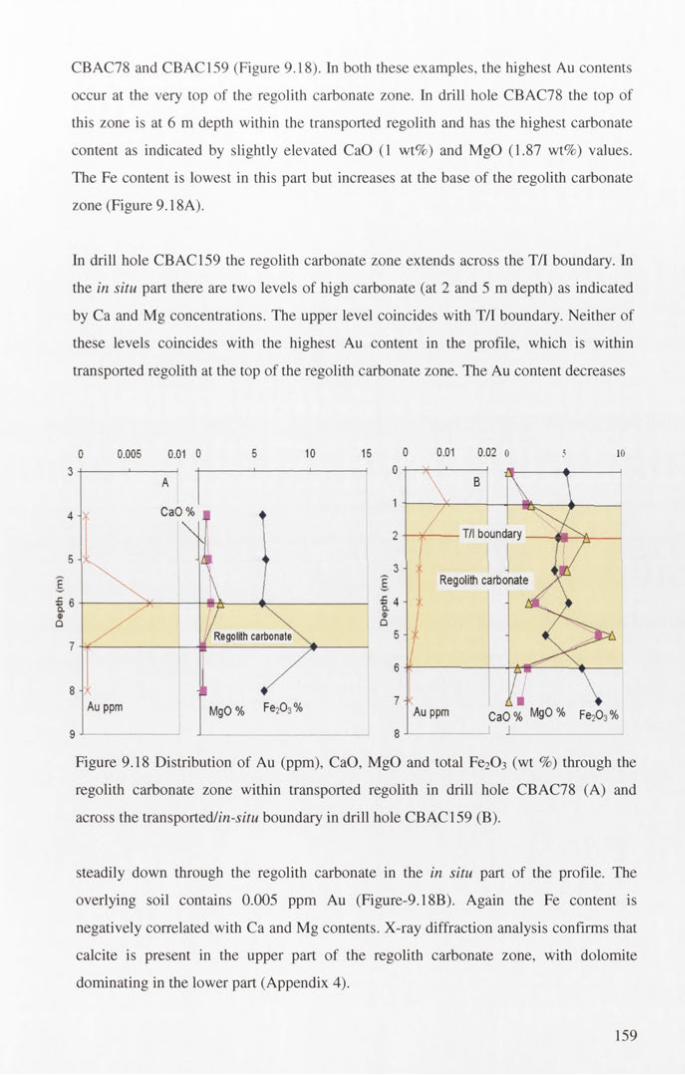
CBAC78 and CBAC159 (Figure 9.18). In both these examples, the highest Au contents
occur at the very top of the regolith carbonate zone. In drill hole CBAC78 the top of
this zone is at 6 m depth within the transported regolith and has the highest carbonate
content as indicated by slightly elevated CaO (1 wt%) and MgO (1.87 wt%) values.
The Fe content is lowest in this part but increases at the base of the regolith carbonate
zone (Figure 9.18A).
In drill hole CBAC159 the regolith carbonate zone extends across the T/I boundary. In
the in situ part there are two levels of high carbonate (at 2 and 5 m depth) as indicated
by Ca and Mg concentrations. The upper level coincides with T/I boundary. Neither of
these levels coincides with the highest Au content in the profile, which is within
transported regolith at the top of the regolith carbonate zone. The Au content decreases
0 0.005 0.01 0 5 10 15 0 0.01 0.02 0 5 10
CaO %
T/I boundary
Regolith carbonate
Regolith carbonate
Au ppm CaO % m9 ° % Fe20 3 %
Figure 9.18 Distribution of Au (ppm), CaO, MgO and total Fe203 (wt %) through the
regolith carbonate zone within transported regolith in drill hole CBAC78 (A) and
across the transported/m-sz7w boundary in drill hole CBAC159 (B).
steadily down through the regolith carbonate in the in situ part of the profile. The
overlying soil contains 0.005 ppm Au (Figure-9.18B). Again the Fe content is
negatively correlated with Ca and Mg contents. X-ray diffraction analysis confirms that
calcite is present in the upper part of the regolith carbonate zone, with dolomite
dominating in the lower part (Appendix 4).
159
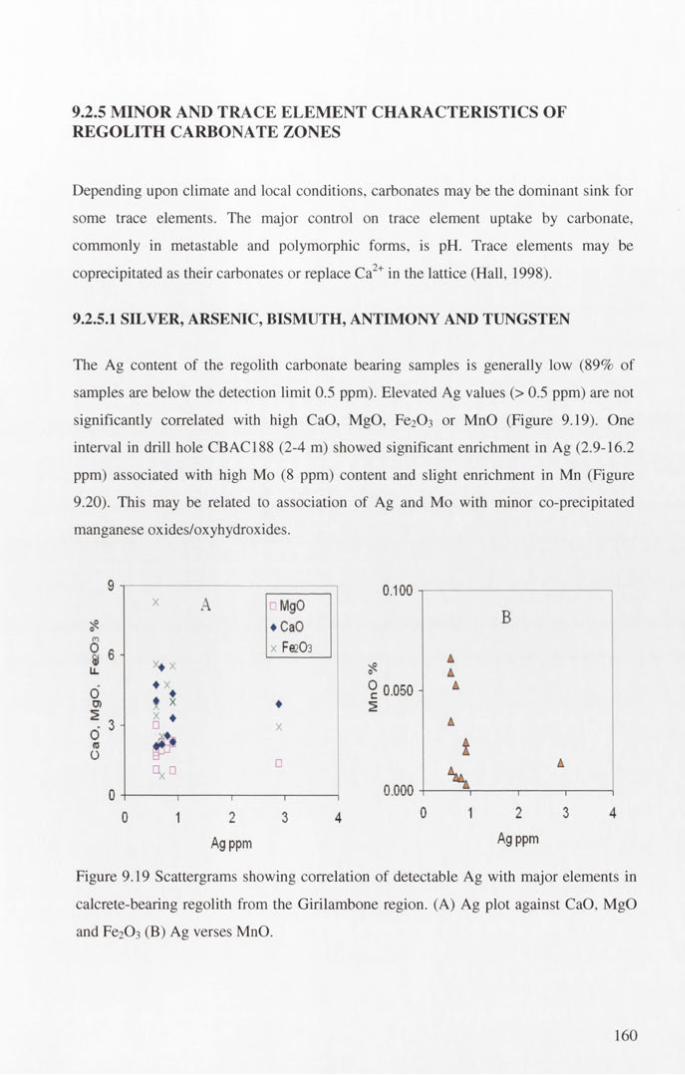
9.2.5 MINOR AND TRACE ELEMENT CHARACTERISTICS OF REGOLITH CARBONATE ZONES
Depending upon climate and local conditions, carbonates may be the dominant sink for
some trace elements. The major control on trace element uptake by carbonate,
commonly in metastable and polymorphic forms, is pH. Trace elements may be
coprecipitated as their carbonates or replace Ca2+ in the lattice (Hall, 1998).
9.2.5.1 SILVER, ARSENIC, BISMUTH, ANTIMONY AND TUNGSTEN
The Ag content of the regolith carbonate bearing samples is generally low (89% of
samples are below the detection limit 0.5 ppm). Elevated Ag values (> 0.5 ppm) are not
significantly correlated with high CaO, MgO, Fe20i or MnO (Figure 9.19). One
interval in drill hole CBAC188 (2-4 m) showed significant enrichment in Ag (2.9-16.2
ppm) associated with high Mo (8 ppm) content and slight enrichment in Mn (Figure
9.20). This may be related to association of Ag and Mo with minor co-precipitated
manganese oxides/oxyhydroxides.
2*CO
0 fi
Li.
6O)
; 3
A □ MgO ♦ CaO x F0 2O3
0.100 1
B
X * X 25AA
♦ X 4 ♦ 9 0,050 - A
* X ♦X ♦□ X A
0 i
1 I
□
1 0.000 - s 1 1 1
2Ag ppm
2 3Ag ppm
Figure 9.19 Scattergrams showing correlation of detectable Ag with major elements in
calcrete-bearing regolith from the Girilambone region. (A) Ag plot against CaO, MgO
and Fe203 (B) Ag verses MnO.
160
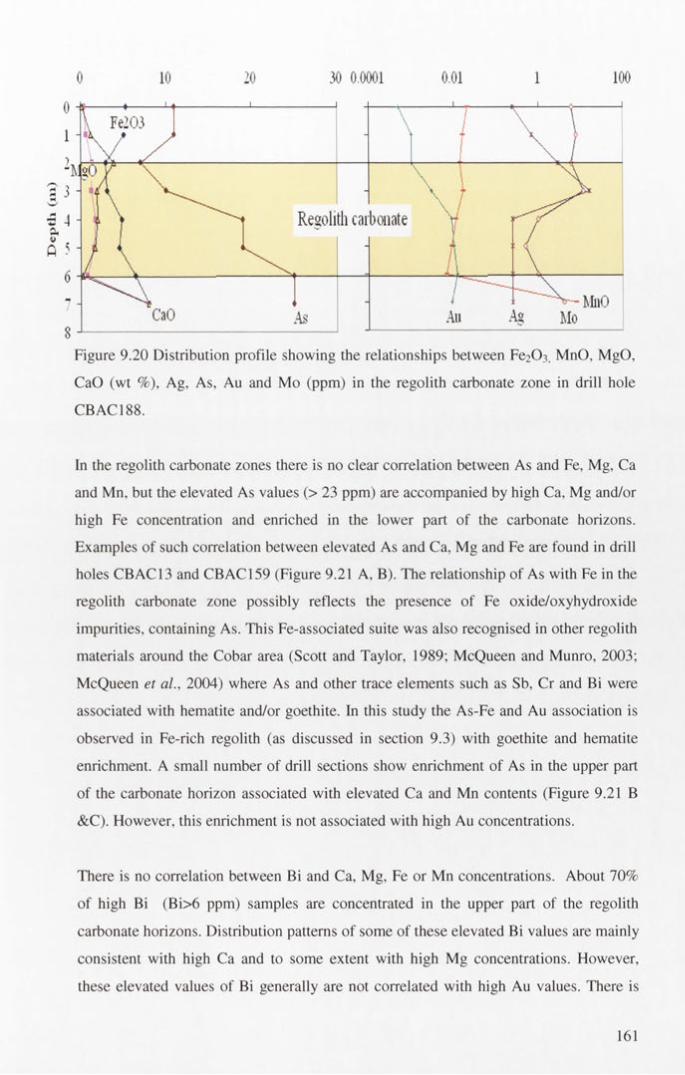
I>ej
0 10 20 30 0.0001 0.01 1 100
Regolith carbonate
Figure 9.20 Distribution profile showing the relationships between Fe2 Ü3 , MnO, MgO,
CaO (wt %), Ag, As, Au and Mo (ppm) in the regolith carbonate zone in drill hole
CBAC188.
In the regolith carbonate zones there is no clear correlation between As and Fe, Mg, Ca
and Mn, but the elevated As values (> 23 ppm) are accompanied by high Ca, Mg and/or
high Fe concentration and enriched in the lower part of the carbonate horizons.
Examples of such correlation between elevated As and Ca, Mg and Fe are found in drill
holes CBAC13 and CBAC159 (Figure 9.21 A, B). The relationship of As with Fe in the
regolith carbonate zone possibly reflects the presence of Fe oxide/oxyhydroxide
impurities, containing As. This Fe-associated suite was also recognised in other regolith
materials around the Cobar area (Scott and Taylor, 1989; McQueen and Munro, 2003;
McQueen et al., 2004) where As and other trace elements such as Sb, Cr and Bi were
associated with hematite and/or goethite. In this study the As-Fe and Au association is
observed in Fe-rich regolith (as discussed in section 9.3) with goethite and hematite
enrichment. A small number of drill sections show enrichment of As in the upper part
of the carbonate horizon associated with elevated Ca and Mn contents (Figure 9.21 B
&C). Flowever, this enrichment is not associated with high Au concentrations.
There is no correlation between Bi and Ca, Mg, Fe or Mn concentrations. About 70%
of high Bi (Bi>6 ppm) samples are concentrated in the upper part of the regolith
carbonate horizons. Distribution patterns of some of these elevated Bi values are mainly
consistent with high Ca and to some extent with high Mg concentrations. However,
these elevated values of Bi generally are not correlated with high Au values. There is
161

no correlation between Sb and Fe, Mn, Ca and Mg. Elevated Sb >10 ppm is also not
comelated with high Au values.
Tungsten has a relatively homogeneous distribution in the regolith carbonate zones.
Elevated W (>10 ppm) is not comelated with high Au contents except in drill hole
CBAC188 where the enrichment of W coincides with consistent enrichment in Au
down the hole (Figure 9.15). This enrichment in Au and W is not associated with the Fe
pattem, which suggests the W and Au are hosted by mineral other than iron
oxides/oxyhydroxides (e.g. they may be present as gold and W minerals in quartz-vein
material).
9.2.5.2 BARIUM AND STRONTIUM
Barium is strongly enriched in the regolith carbonate zone (Appendix 7). Samples with
high Ba content (> lOOOppm) are concentrated in the upper part of the carbonate
accumulations (77% of high Ba samples). A small number of high Ba samples occur at
the base and within the carbonate horizons (17 % and 8 % respectively). Typical host
minerals for Ba are feldspar and barite. High Ba contents (particularly in feldspar) can
give some indication of proximity to ore (Scott, 1992). In the presence of carbonate, a
common alteration product of barite (BaS04) is witherite (BaCCA; Deer et al., 1992).
Elevated concentrations of Ba (> 1000 ppm) have been previously reported with
secondary carbonate minerals in soils (Kabata-Pendias and Pendias, 1984).
There is no close correlation between Ba, Ca and Mg in the regolith carbonate zone
(Figure 9.22A, B). However, barium is significantly correlated with S in carbonate
associated with transported regolith (r2 = 0.7, Figure 9.22C). This suggest that the Ba is
present as barite, rather than as a substituting for Ca in carbonate. Such a relationship
between Ba and S in calcrete has been previously reported (e.g. Butt, 1991; McQueen,
2006). Barium is weakly correlated with S in the carbonate zones from in situ regolith
(Figure 9.22 D), which probably indicates that barite is not the major host mineral. A
very high concentration (1.88 %) of S was detected from the regolith carbonate horizon
in drill hole CBAC213 (5-6 m depth). This enrichment is associated with relatively
high Sr (Figure 9.23), which possibly indicates the presence of Sr-rich barite or Ba-
bearing celestite (SrS04). However, there is not a direct correlation between Sr and Ba
162
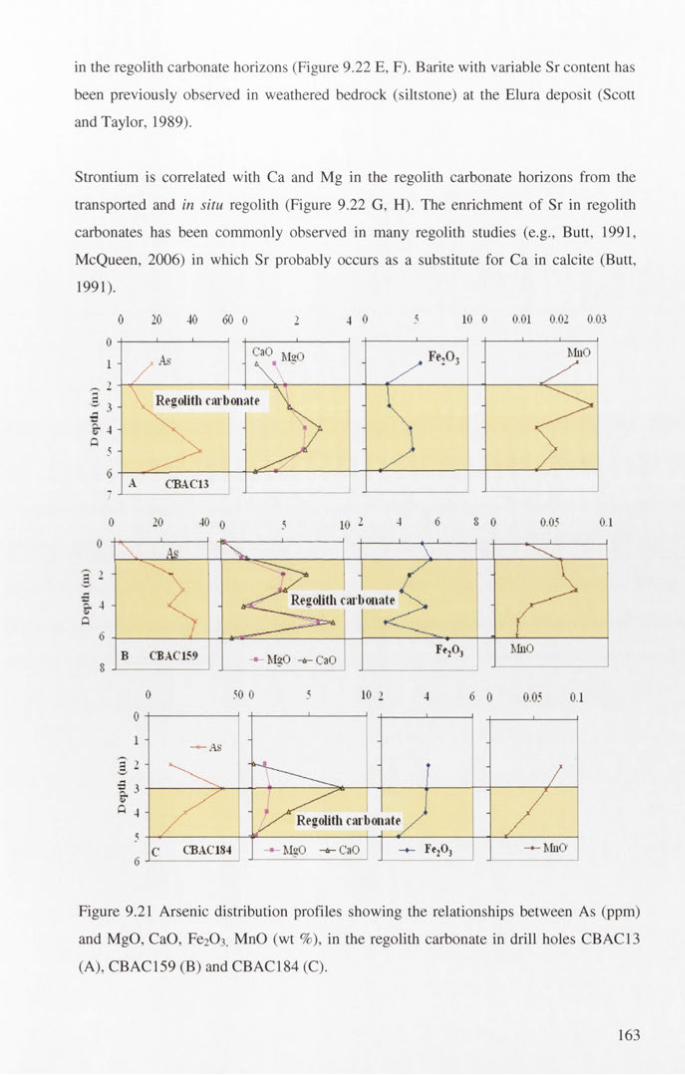
in the regolith carbonate horizons (Figure 9.22 E, F). Barite with variable Sr content has
been previously observed in weathered bedrock (siltstone) at the Elura deposit (Scott
and Taylor, 1989).
Strontium is correlated with Ca and Mg in the regolith carbonate horizons from the
transported and in situ regolith (Figure 9.22 G, H). The enrichment of Sr in regolith
carbonates has been commonly observed in many regolith studies (e.g., Butt, 1991,
McQueen, 2006) in which Sr probably occurs as a substitute for Ca in calcite (Butt,
1991).
Ö 20 40 60 0 2 4 0 5 10 0 0.01 0.02 003
Regolith carbonater 3 -
* 7 ___
0 20 40 o 5 io 2 4 6 8 0 0.05 0.1
Regolith carbonate
CBAC159
Regolith carbonate
Figure 9.21 Arsenic distribution profiles showing the relationships between As (ppm)
and MgO, CaO, Fe2 C>3 ; MnO (wt %), in the regolith carbonate in drill holes CBAC13
(A), CBAC159 (B) and CBAC184 (C).
163
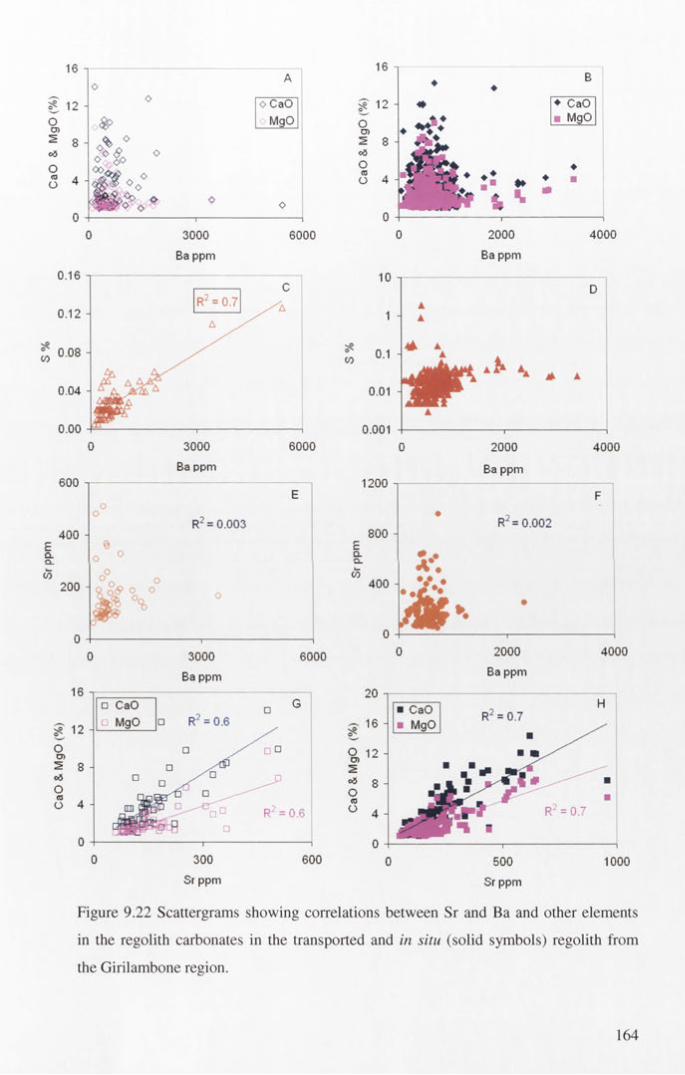
16 -i
12
8 H
oÜ)
od
Oois
A ^ > Om o •
A1 V
♦ ♦B
o CaO £ 12 - # ♦ CaOMgO O ■ MgO
3000 Ba ppm
6000l
2000
Ba ppm
4000
4000
4000
Figure 9.22 Scattergrams showing correlations between Sr and Ba and other elements
in the regolith carbonates in the transported and in situ (solid symbols) regolith from
the Girilambone region.
164

Figure 9.23 Showing distributions of Sr ppm, Ba ppm, S wt %, CaO wt % and MgO wt
% in the calcrete bearing zone profile in drill hole CBAC213.
9.2.5.3 OTHER TRACE ELEMENTS
A number of trace elements analysed in the regolith carbonate zones (including Cu, Zn,
Pb, Cr, Ni, Ti) show positive correlation with Fe and are negatively correlated with Ca
and Mg, suggesting that these elements are contained within iron oxide/oxyhydroxide
impurities in the carbonate zone. This Fe-associated suite of trace elements is
recognised and discussed in detail in the Fe-rich facies (see below).
9.2.6 ORIGIN OF CARBONATE
A potential source of Ca and Mg and all other elements concentrated in regolith
carbonate is the bedrock. Other sources include aeolian dust, marine aerosols,
rainwater, groundwater and vegetation. In arid and semi-arid climates aeolian dust is
probably the most significant source of Ca and Mg added to the regolith surfaces
(Goudie, 1973; Taylor and Eggleton, 2001). Many playas contain significant Ca- and
Mg-rich clay minerals and carbonates. During dry lake phases, these can be blown from
the lake surfaces and deposited down-wind.
In the Cobar-Girilambone region most of the bedrocks have low contents of Ca and Mg
(in the Cobar Supergroup rocks typically have <1.5% CaO wt % and < 3.2% MgO wt
%, McQueen 2006; and the Girilambone Group rocks have <0.56 wt % CaO and < 2.45
wt % MgO, Ackerman, 2005). This suggests that the weathered bedrock is not a major
source of these elements. Analysis of Srx7/Srs6 ratios in calcrete from across the region
has shown values ranging from 0.71195 to 0.71624, consistent with a predominantly
165
marine source for the Sr (McQueen, 2006). This suggests that the Sr and geochemicall y
associated Ca have probably been introduced in dust, aerosols or rainwater from
seawater or marine-derived carbonate accumulations (Dart et al., 2005). Considerably
elevated levels of many trace elements and gold in areas of known bedroclc
concentrations indicate the bedrock as a source of these elements.
9.2.7 SUMMARY AND CONCLUSIONS
In the Girilambone region, calcrete is widespread within a zone of variable thickness in
the upper 10 m of the regolith. The calcrete typically consists of dispersed calcite-
dolomite, generally with calcite predominating in the upper part of the zone and
dolomite predominant towards the base. The highest Au contents in a profile are not
necessary associated with the position of maximum calcrete development. Typically,
the high Au concentration is at the top of the calcrete zone, but not all cases. There is
generally a negative correlation between elevated Au and Fe2 Ü3 content in this part o f
the regolith. Some in situ profile show an association of elevated gold with higher
Fe2 Ü3 content, but this is probably remnant primary Au in ferruginous saprolite.
The association of Au with calcrete in the Girilambone region appears to reflect a
chemical environment within both transported and in situ regolith that is conducive to
precipitation of both carbonate and mobilised gold rather than a direct control on gold
fixation by calcrete.
There is no positive correlation between Cu, Zn, Pb, Cr, Ni and Ti concentration and
CaO and MgO contents in the calcrete zone. However, these elements show positive
correlation with Fe2 Ü3 content suggesting that they are contained within iron
oxide/oxyhydroxide impurities in the carbonate zone.
9.3 ELEMENT ASSOCIATIONS AND DISPERSION IN Mn-RICH REGOLITH
9.3.1 INTRODUCTION
Manganese-enriched zones are common in many deeply weathered terrains (e.g.,
Taylor and Ruxton, 1987). This section will describe the spatial distribution of Mn-rich
166

horizons, Mn oxide/oxyhydroxide minerals and the associated element concentrations.
Their possible relationship with groundwater will also be investigated.
9.3.2 OCCURRENCE OF Mn-RICH HORIZONS
Manganese oxides occur in soils as deposits in cracks and veins, as coatings and stains
on soil aggregates or as a cementing material. They may also be dispersed throughout
the soil as microscopic accumulations, or concentrated as nodules up to about 2 cm in
diameter (Taylor et al., 1983).
In the Girilambone region Mn-enriched zones mainly occur within the in situ regolith
(Figure 9.24). Manganese enrichment is highest in the west and south of the Hermidale
area (e.g., drill hole CBAC174) and generally decreases toward the east. The Hermidale
area is characterised by outcrops of saprolith that form rises and low hills (Chan et al.,
2002) partly developed on the Babinda Volcanics (Suppel and Gilligan, 1993). It is also
thought to be a groundwater recharge area (Khider and McPhail, 2005). In the northern
part of the region (Byrock area) the depth of Mn accumulation increases down the
topographic slope to the northeast.
9.3.3 MANGANESE OXIDE/ OXYHYDROXIDE MINERALS
Manganese occurs in a number of valance states in nature (Day, 1963). A large number
of oxides and oxyhydroxides exist, in which there is extensive substitution of Mn (II)
and Mn (III) for Mn (IV), and of OH' for O2' (Taylor et al., 1983). Manganese oxides
also display a remarkable diversity of atomic architectures, many of which easily
accommodate a wide assortment of other metal cations. In addition, Mn is abundant in
most geological systems and forms minerals under a wide range of chemical and
temperature conditions, and through biological interactions (Post, 1999).
The basic building block for most of the Mn oxide atomic structures is the Mn06
octahedron. These octahedra can be assembled by sharing edges and/or comers into a
large variety of different structural arrangements, most of which fall into one of two
major groups: (i) chain, or tunnel, structures and (ii) layer structures. The tunnel Mn
oxides are constructed of single, double, or triple chains of edge-sharing MnOß
octahedra, and the chains share corners with each other to produce frameworks that
have tunnels with square or rectangular cross sections. The larger tunnels are partially
filled with water molecules and /or cations (Bums and Bums, 1975; Post, 1999).
167
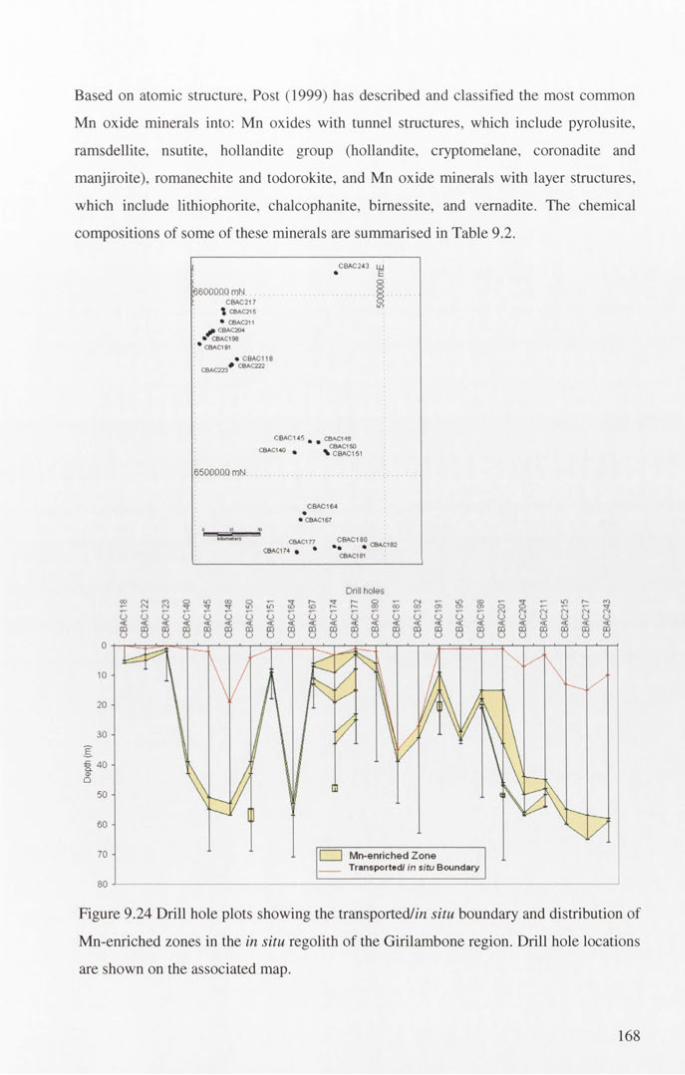
Based on atomic structure, Post (1999) has described and classified the most common
Mn oxide minerals into: Mn oxides with tunnel structures, which include pyrolusite,
ramsdellite, nsutite, hollandite group (hollandite, cryptomelane, coronadite and
manjiroite), romanechite and todorokite, and Mn oxide minerals with layer structures,
which include lithiophorite, chalcophanite, bimessite, and vemadite. The chemical
compositions of some of these minerals are summarised in Table 9.2.
■66000.QQ mN.CBAC21 7
i CBAC215
• CBAC211 I CBAC204
CBAC198 ' CBAC191
X'• CB
• CBAC118 . ♦ C8AC222
| CBAC119 CBAC1S0
% CBAC1 51
6500D0.Q mN.
CBAC164
• CBAC167
Drill holesCO CN
CM0 0CN
O I D 0 0 8 £ S CD 8 5CNOO S
CDo >
OOo > 5 3 CD OO
5 o o 5 o o u o u o g g u o u u o o Ö oCM<_>
CN OMO
CN
c do
CDO
mo
mo
CDO
mo
c do
c do
mo
CDO
mo
mu
mo
c ou
mo
CDO
c oo
CDO
mo
mo
<CO m
O
<CO m
o
I I Mn-enriched Zone ____ Transported/ in situ Boundary
Figure 9.24 Drill hole plots showing the transported/m situ boundary and distribution of
Mn-enriched zones in the in situ regolith of the Girilambone region. Drill hole locations
are shown on the associated map.
168
The hollandite group minerals have the general formula A0 - 2 (B+Mn4+)80 i 6. xH20 . T h e
A site can be occupied by large cations such as K +, Ba2+, Na+, Cu+, Pb2+, Rb2+, Sr2+,
etc., whereas the B site includes Mn3+, Mn4+, Fe?+, Si4+, and Mg2+ (Bums and B um s,
1975). Cryptomelane, hollandite and coronadite are K, Ba and Pb end-members of a
solid-solution series, respectively (Bystrom and Bystrom, 1950). Nicholson (1992) u sed
a high Ba concentration as an indication of secondary enrichment of Mn during
weathering. Nickel, Cu and Co are commonly reported in lithiophorite, where the Ni an d
Cu concentrate in the Al-OH sheets and Co in the Mn layers (Ostwald, 1984).
Lithiophorite has been synthesized by substitution of aluminium and lithium into a
birnessite-type mineral (Giovanoli et al., 1973). Although lithiophorite generally
contains a reasonable amount of Li (0.2-3 wt%, Post, 1999), no Li was detected by this
technique, which probably needs further investigation.
In this study samples from Mn- enriched horizons were analysed to determine the
morphology and chemical composition of Mn-oxide/oxyhydroxide minerals.
Manganese-rich grains and Mn-coated dark coloured grains were collected from five
Mn-dominant intervals in the drill holes CBAC 176 (37-39 m), CBAC177 (8-9 m, 13-
15 m), arid CBAC 180 (6-7 m, 7-8 m). The samples were examined using scanning
electron microscope (SEM) and energy dispersive X-ray analysis (EDXA).
The analysis showed that Mn-oxides/oxyhydroxides in these samples occur as
microcrystalline masses and well-developed platy crystals (Figures 9.25, 27, 29, 31).
The microcrystalline masses are commonly present as compact botryoidal aggregates,
coating the clay particles and/or as clusters of Mn oxides/oxyhydroxides between clay
crystals (Figures 9.25, 27, 29). Manganese oxides in soils in general were reported to be
very fine grained, commonly poorly crystalline or amorphous (McKeague et al., 1968;
Childs, 1975). The energy dispersive X-ray analysis (EDXA) spectra of Mn
microcrystalline masses showed that Mn oxides/oxyhydroxides are associated with K
and Al and Si in addition to Co and Cu (Figures 9-25, 26). Occurrences of K and Si in
association with Al are possibly related to muscovite and cryptomelane (Figures 9.25,
26 A), whereas the association of Mn, Al, Co and Cu in the absence of K and Si (Figure
9.26 B) suggests occurrence of lithiophorite. Chemical composition of the
microcrystalline Mn minerals that coat clay and/or quartz crystals shown in Figure 9.27
169

confirmed occurrences of clay/mica with high A1 and low K contents (possibly
muscovite and kaolinite), quartz (high Si content) and lithiophorite with incorporated
Co, Cu, Ni (Figure 9.28). The spectra of the microcrystalline Mn minerals that clustered
between clay crystals shown in Figure 9.29 showed Mn associated with Al, Si, Na, Ca,
Mg, P. Pb, K, Fe and Ba (Figure 9.30), where Al, Si, Na, Ca, Mg and K represent a
common clay assemblage and AI, Mn, K, Ba, Pb and P possibly represent hollandite
group minerals.
Table 9.2 Chemical compositions of the common Mn oxide minerals (from Post, 1999)Mineral Chemical formulaPyrolusite MnC>2
Ramsdellite MnC>2
Nsutite Mn(0,OH) 2Hollandite Bax (Mn4+, Mn3+ ) 8 0 16Cryptomelane Kx (Mn4+, Mn 3+ )8 0 16Manjiroite Nax (Mn4+, Mn 3+ )8 O i6Coronadite Pbx (Mn4+, Mn 3+ )8 0 16Romanechite Ba 6.e(Mn4+, Mn3+)5 O 10. 1.34H20Todorokite (Ca.Na, K)x (Mn4+, Mn3+) 6 0 12. 3.5 HzOLithiophorite LiAI2(Mn24+ Mn3+) 0 6 (OH) 6Chalcophanite Zn Mn3 0 7 3H20Birnessite (Na,Ca) Mn7O i4. 2.8 H20Vernadite Mn02.nH20
Figure 9.25 SEM photomicrograph showing large flakes of mica (muscovite) and
microcrystalline Mn oxides (cryptomelane) in a sample from a Mn-enriched horizon (7-
8 m depth) in drill hole CBAC180. Scale bar is 10 pm.
170
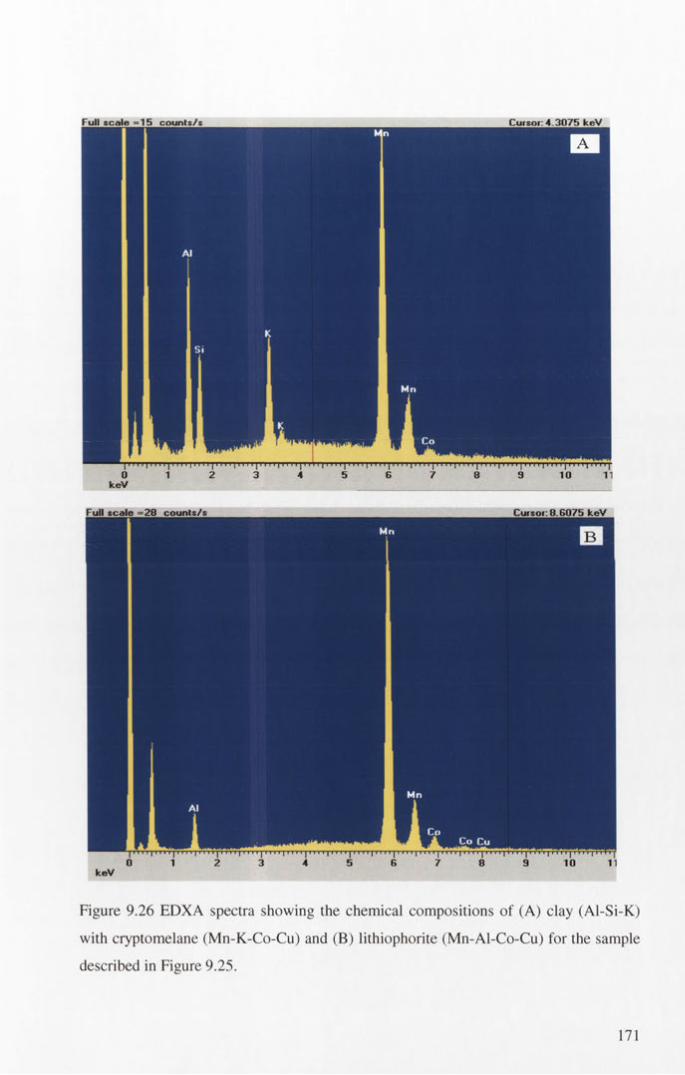
Figure 9.26 EDXA spectra showing the chemical compositions of (A) clay (Al-Si-K)
with cryptomelane (Mn-K-Co-Cu) and (B) lithiophorite (Mn-Al-Co-Cu) for the sample
described in Figure 9.25.
171

Oxides including lithiophorite coating clay and quartz in a sample from a Mn-enriched
horizon (13-15 m depth) in drill hole CBAC177. Scale bar is 10 pm.
Figure 9.28 EDXA spectrum showing the chemical compositions of clay (Al-Si-K) with
quartz (high Si) and lithiophorite (Mn-Al-Ni -Co-Cu) for the sample described in
Figure 9.27.
172

Figure 9.29 SEM photomicrograph showing microcrystalline Mn oxides clustered
between clay crystals in a sample from Mn-enriched horizon (13-15 m depth) in drill
hole CBAC177.Scale bar is 10 pm.
Figure 9.30 EDXA spectrum showing the chemical compositions of clay (Al-Si-K, Na,
and Mg) and hollandite group (Mn- (Ba, K, Pb and Na) with some Fe for the sample
described in Figure 9.29.
173
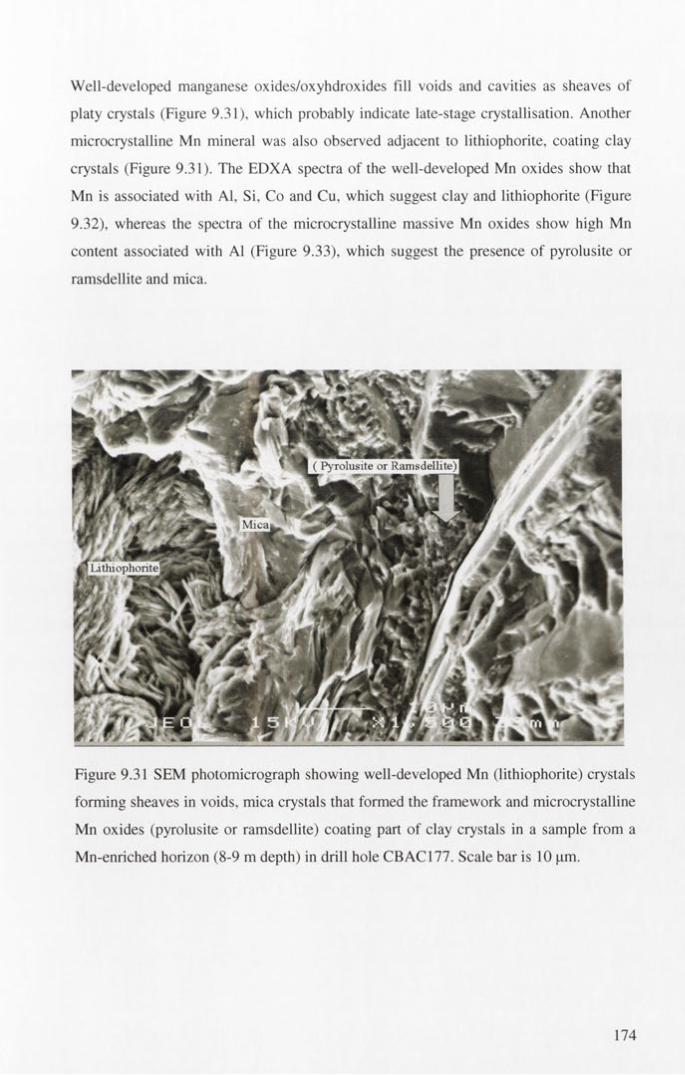
Well-developed manganese oxides/oxyhdroxides fill voids and cavities as sheaves of
platy crystals (Figure 9.31), which probably indicate late-stage crystallisation. Another
microcrystalline Mn mineral was also observed adjacent to lithiophorite, coating clay
crystals (Figure 9.31). The EDXA spectra of the well-developed Mn oxides show that
Mn is associated with Al, Si, Co and Cu, which suggest clay and lithiophorite (Figure
9.32), whereas the spectra of the microcrystalline massive Mn oxides show high Mn
content associated with Al (Figure 9.33), which suggest the presence of pyrolusite or
ramsdellite and mica.
Figure 9.31 SEM photomicrograph showing well-developed Mn (lithiophorite) crystals
forming sheaves in voids, mica crystals that formed the framework and microcrystalline
Mn oxides (pyrolusite or ramsdellite) coating part of clay crystals in a sample from a
Mn-enriched horizon (8-9 m depth) in drill hole CBAC177. Scale bar is 10 pm.
174

Figure 9.32 EDXA spectrum showing the chemical compositions of clay (Al-Si) and
well-developed Mn oxides (lithiophorite, Mn-Al-Co-Cu) for the sample described in
Figure 9.31.
Figure 9.33 EDXA spectrum showing the chemical compositions of microcrystalline
Mn oxides (pyrolusite) for the sample described in Figure 9.31.
175

9.3.4 ACCUMULATION OF MANGANESE OXIDES AND OXYHYDROXIDES
The relative importance of Mn and Fe oxides/oxyhydroxides as scavengers depends
upon: pH-Eh conditions; degree of crystallinity of the oxides and therefore th e ir
reactivity; their relative abundances; and the presence of organic matter as a competing
adsorbing and chelating fixing agent (Hall, 1998). Elements will show a preference f o r
uptake by either Mn or Fe oxides depending on local conditions. Oxidation o f
manganese is catalysed by fine particles in soils (Morgan and Stumm, 1964). H em
(1964) reported that the oxidation is catalysed by MnÜ2 at pH 7.8 or higher, but not a t
7.2. He also discussed the oxidation of manganese by precipitated Fe (OH)3, and
concluded that it is the result of low activity of available Fe2+ in slightly acid solution.
It is difficult to present a typical weathering profile for Mn accumulation because i t
depends on the nature of the original parent rock and, particularly, on its structure
(Nahon et al., 1992). A general model of weathering for parent rocks consisting
essentially of manganiferous silicates (Figure 9.34) was constructed by Nahon and Parc
(1990) and Parc (1989). Hausmannite and manganite would not be expected to be
present in the regolith because these minerals are unstable during weathering and they
are either oxidised or disproportionated to give more oxidised Mn minerals under acid
and alkaline conditions respectively (Taylor et al., 1983).
PYROLUSIRAMSDELLITE
RAMSDELL1TE
GROUTITE
SPESSARTRHODONITE
MANGANITE
CRYPTOMELANE
PYROXMANG
BIRNESSITE
Mn-AMPHIB
LITHIOPHORITE
Figure 9.34 Mineral sequences in the weathering of Mn-bearing silicates. Heavy arrow
indicates retromorphosis of oxides, (after Nahon et al., 1992).
176
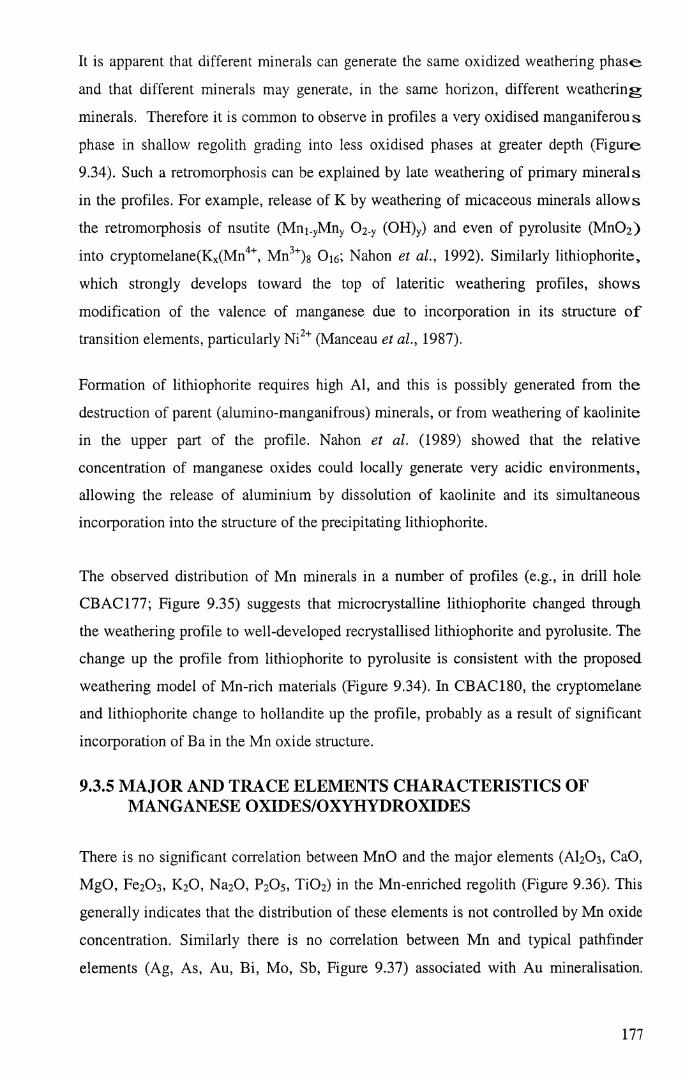
It is apparent that different minerals can generate the same oxidized weathering phase
and that different minerals may generate, in the same horizon, different weathering
minerals. Therefore it is common to observe in profiles a very oxidised manganiferous
phase in shallow regolith grading into less oxidised phases at greater depth (Figure
9.34). Such a retromorphosis can be explained by late weathering of primary minerals
in the profiles. For example, release of K by weathering of micaceous minerals allows
the retromorphosis of nsutite (Mni.yMny C>2-y (OH)y) and even of pyrolusite (MnOz)
into cryptomelane(Kx(Mn4+, M n'+)g Oi6', Nahon et al., 1992). Similarly lithiophorite,
which strongly develops toward the top of lateritic weathering profiles, shows
modification of the valence of manganese due to incorporation in its structure o f
transition elements, particularly Ni2+ (Manceau et al., 1987).
Formation of lithiophorite requires high Al, and this is possibly generated from the
destruction of parent (alumino-manganifrous) minerals, or from weathering of kaolinite
in the upper part of the profile. Nahon et al. (1989) showed that the relative
concentration of manganese oxides could locally generate very acidic environments,
allowing the release of aluminium by dissolution of kaolinite and its simultaneous
incorporation into the structure of the precipitating lithiophorite.
The observed distribution of Mn minerals in a number of profiles (e.g., in drill hole
CBAC177; Figure 9.35) suggests that microcrystalline lithiophorite changed through
the weathering profile to well-developed recrystallised lithiophorite and pyrolusite. The
change up the profile from lithiophorite to pyrolusite is consistent with the proposed
weathering model of Mn-rich materials (Figure 9.34). In CBAC180, the cryptomelane
and lithiophorite change to hollandite up the profile, probably as a result of significant
incorporation of Ba in the Mn oxide structure.
9.3.5 MAJOR AND TRACE ELEMENTS CHARACTERISTICS OF MANGANESE OXIDES/OXYHYDROXIDES
There is no significant correlation between MnO and the major elements (A I2 O 3 , CaO,
MgO, Fe203, K20 , Na20 , P 2 O 5 , Ti02) in the Mn-enriched regolith (Figure 9.36). This
generally indicates that the distribution of these elements is not controlled by Mn oxide
concentration. Similarly there is no correlation between Mn and typical pathfinder
elements (Ag, As, Au, Bi, Mo, Sb, Figure 9.37) associated with Au mineralisation.
177

However these results must be cautiously interpreted because some of these elements
have a large number of censored (BDL) values (Appendix 7).
CBAC176
Mil0«
0 0 1 0.2 0.3
CBAC1"
Mu°o
1
CBAC180
Mil0«
0.1 0.2 0.3
Pvroliisiteor
RamsdelliteWell-developed
litluoplioriteHollandite
Lithiophonte
Hollandite+
Litluopliorite
Figure 9.35 Distribution profile of Mn (wt %) and Mn-minerals in drill holes
CBAC176, CBAC177 and CBAC180.
9.3.5.1 GOLD CONCENTRATION IN Mn-RICH REGOLITH
In the Mn-rich regolith Au contents range from <0.001 ppm to 0.077 ppm (Appendix 7)
and Au shows noticeable concentration in some Mn- rich horizons. Therefore selected
high-Au concentration profiles were examined to understand the relationship between
Au and Mn-rich regolith. Significant enrichments of Au (Au > 0.01 ppm) were
detected from drill holes CBAC 119, CBAC191, CBAC195, CBAC198, CBAC201 and
CBAC211. Generally Au was enriched either at the top or at the base of the Mn-rich
horizons (Figures 9.38, 40).
178

? 0.4 -
♦
r* 0.4 -
5 0.4 -
0 4 -
Mn°°o MiiO0 o
Figure 9.36 Scattergrams of major elements in the Mn-enriched regolith of the
Girilambone region. MnO vs. MgO (A), CaO (B), Na20 (C), K20 (D), P20 5 (E), Fe20 3
(F), A120 3 (G) and T i0 2 (H).
179

g 1*
Figure 9.37 Scattergrams of trace elements in the Mn-enriched regolith of the
Girilambone region. MnO vs. Ag (A), As (B), Bi (C), Au (D), Mo (E) and Sb (F).
In drill hole CBAC119 three Mn-enriched horizons were recognised. In the upper
horizon (0-2 m depth) the elevated Mn concentration is associated with an anomalous
range of Au values (0.012-0.019 ppm) and significant enrichment in Sb (Figure 9.38).
This horizon also shows a slight enrichment in Fe. However, the distribution pattern of
Au coincides with Mn, which possibly indicates co-precipitation and /or adsorption of
Au on Mn oxides. In the middle Mn-rich horizon (4-6 m depth) increasing Mn content
is associated with elevated As, Sb and to some extent with Au contents, particularly in
the lower part of the horizon, but the distribution pattern of Au within the horizon is
more comparable with Mg and Ca patterns (Figure 9.38). This possibly indicates that
the calcification has a stronger influence on the Au dispersion than Mn scavenging
processes, or that the accumulation of Mn in the upper part of the horizon occurred
after Au-carbonate precipitation. In the lower horizon (9-10 m depth) the slight
enrichment in Au (0.006 ppm) coincides with Mn enrichment; however, this horizon
overlies a carbonate-rich layer at 10-11 m depth and therefore the elevated Au value
180
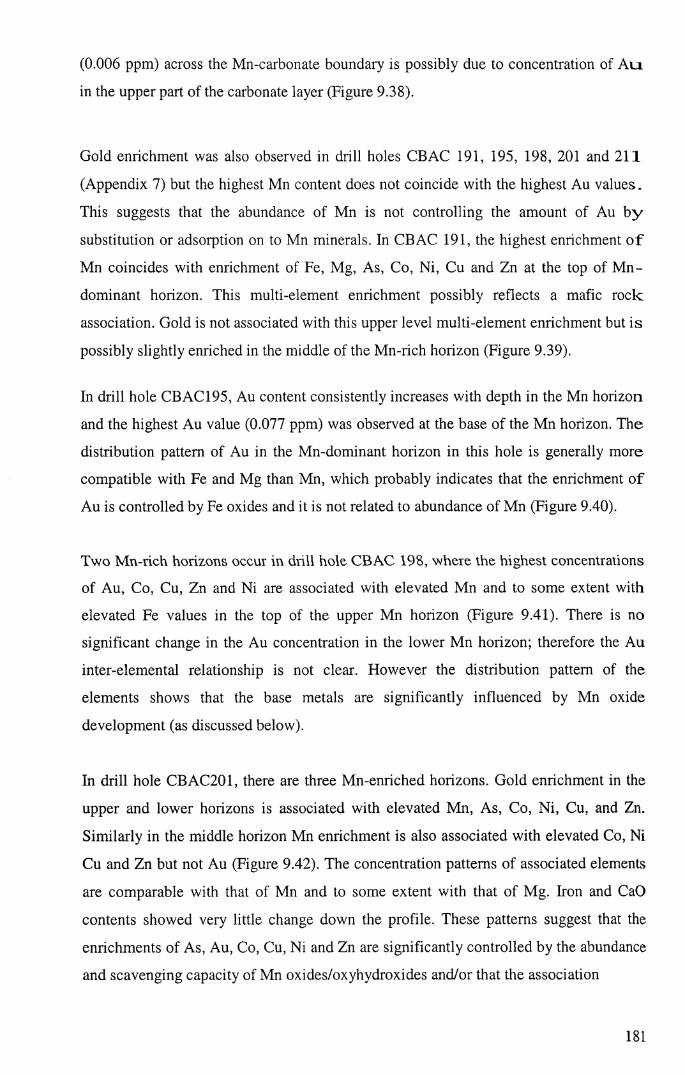
(0.006 ppm) across the Mn-carbonate boundary is possibly due to concentration of Ali
in the upper part of the carbonate layer (Figure 9.38).
Gold enrichment was also observed in drill holes CBAC 191, 195, 198, 201 and 211
(Appendix 7) but the highest Mn content does not coincide with the highest Au values.
This suggests that the abundance of Mn is not controlling the amount of Au by
substitution or adsorption on to Mn minerals. In CBAC 191, the highest enrichment o f
Mn coincides with enrichment of Fe, Mg, As, Co, Ni, Cu and Zn at the top of Mn-
dominant horizon. This multi-element enrichment possibly reflects a mafic rock
association. Gold is not associated with this upper level multi-element enrichment but is
possibly slightly enriched in the middle of the Mn-rich horizon (Figure 9.39).
In drill hole CBAC 195, Au content consistently increases with depth in the Mn horizon
and the highest Au value (0.077 ppm) was observed at the base of the Mn horizon. The
distribution pattern of Au in the Mn-dominant horizon in this hole is generally more
compatible with Fe and Mg than Mn, which probably indicates that the enrichment of
Au is controlled by Fe oxides and it is not related to abundance of Mn (Figure 9.40).
Two Mn-rich horizons occur in drill hole CBAC 198, where the highest concentrations
of Au, Co, Cu, Zn and Ni are associated with elevated Mn and to some extent with
elevated Fe values in the top of the upper Mn horizon (Figure 9.41). There is no
significant change in the Au concentration in the lower Mn horizon; therefore the Au
inter-elemental relationship is not clear. However the distribution pattem of the
elements shows that the base metals are significantly influenced by Mn oxide
development (as discussed below).
In drill hole CBAC201, there are three Mn-enriched horizons. Gold enrichment in the
upper and lower horizons is associated with elevated Mn, As, Co, Ni, Cu, and Zn.
Similarly in the middle horizon Mn enrichment is also associated with elevated Co, Ni
Cu and Zn but not Au (Figure 9.42). The concentration patterns of associated elements
are comparable with that of Mn and to some extent with that of Mg. Iron and CaO
contents showed very little change down the profile. These patterns suggest that the
enrichments of As, Au, Co, Cu, Ni and Zn are significantly controlled by the abundance
and scavenging capacity of Mn oxides/oxyhydroxides and/or that the association
181

0 i 2 3 0 0 1 0.2 0.3 3 8 13 18 0 0.01 0.02
Mn-enriched
Mn-enriched
Mn-enriched
Regolith-c aib oil ate
AuCBAC119
MnO
Figure 9.38 Distribution profiles of the trace elements Au, As, W, and Sb (ppm), and
major elements Fe2Ü3 total, MnO, MgO and CaO (wt %) in the Mn-enriched horizon of
drill hole CBAC 119.
0 0.02 0.04 0 0.5 1 3 S 5 105 205
MilO
Mn-enriched
f 20 -
CBAC191
Figure 9.39 Distribution profiles of the trace elements Au, As, Co, Ni, Cu, Cr, and Zn
(ppm), and major elements Fe203 total, MnO, MgO and CaO (wt %) in the Mn-
enriched horizon of drill hole CBAC191.
182
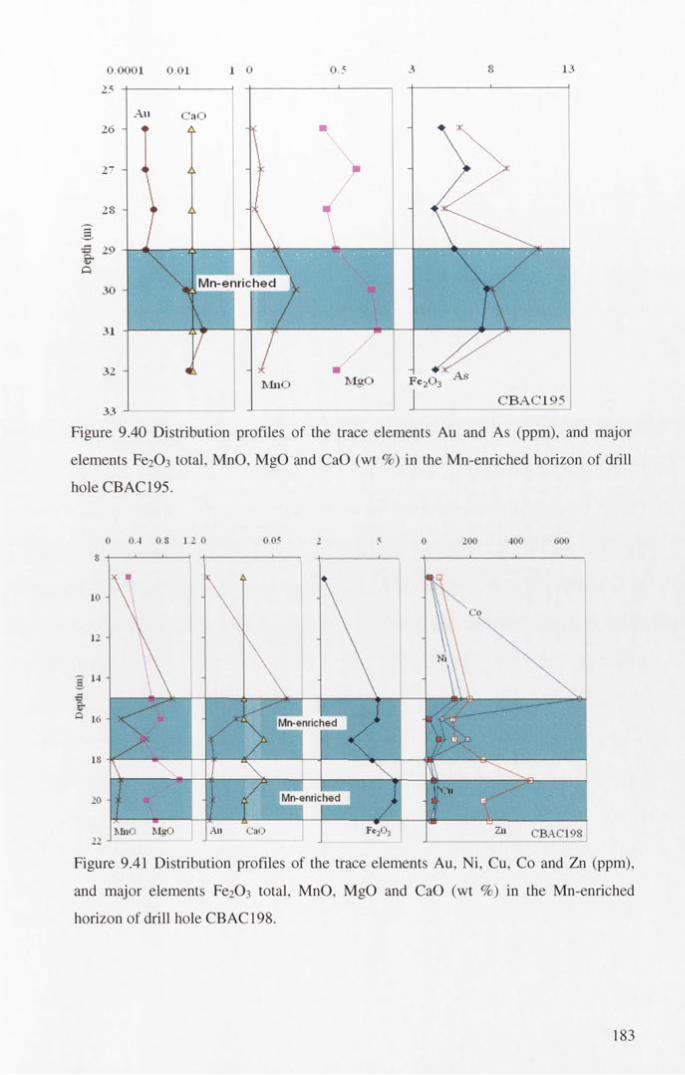
Mn-enrichecl
mmmmm 'W&tmm
> o
1 0 0.5
Figure 9.40 Distribution profiles of the trace elements Au and As (ppm), and major
elements Fe2 C>3 total, MnO, MgO and CaO (wt %) in the Mn-enriched horizon of drill
hole CBAC195.
o 0001
25
0 01
CaOA
Figure 9.41 Distribution profiles of the trace elements Au, Ni, Cu, Co and Zn (ppm),
and major elements Fe20i total, MnO, MgO and CaO (wt %) in the Mn-enriched
horizon of drill hole CBAC198.
183

reflects the original source rock assemblages. Arsenic is dominantly adsorbed on to
manganese- and/or iron- oxides/oxyhydroxides (e.g., Akai et al., 2004) and the internal
structure of manganese oxides/oxyhydroxides may control the occurrence of some of
these elements. For example, it has been found that uptake of Ag by poorly crystallised
Mn oxides depends upon the amount of exchangeable of internal ions such as Na and K
(Anderson et al., 1973).
Two Mn horizons were observed in drill hole CBAC211 (Figure 9.43). Distribution
patterns of Ni, Cu and Zn significantly coincide with that of Mn. This association is
commonly observed in saprolith containing mafic rocks. Elevated Au concentrations
are noticed within the upper horizon and at the top of the lower horizon and the
distribution pattern of Au particularly in the lower horizon does not match that of Ni,
Cu and Zn. This suggests an independent enrichment of Au (probably transported).
Iron and Ca show some enrichment in the lower horizon, but the distribution patterns of
Fe and Ca are incomparable with the base metals, Au and Mn (Figure 9.43).
Figure 9.42 Distribution profiles of Au, As, Ni, Cu, Co, Cr and Zn (ppm), and major
elements Fe2Cb total, MnO, MgO and CaO (wt %) in the Mn-enriched horizon of drill
hole CBAC201.
184

0 001 001 0 1 1 10 100 43
45
A I
15 49frQ
51
53
55
Figure 9.43 Distribution profiles of Au, Ni, Cu, and Zn (ppm), and major elements
Fe2 Ü3 total, MnO, MgO and CaO (wt %) in the Mn-enriched horizon of drill hole
CBAC211.
93.5.2 MINOR AND TRACE ELEMENT CHARACTERISTICS
The distribution patterns of trace elements in the Mn-dominant samples showed
significant correlation between Mn and Co (r=0.65), Cu (r=0.76) and Ni (r=0.7). A
small number of samples show more marked positive correlation trends between these
elements and Mn (Figure 9.44). The accumulation of Co in manganese
oxides/oxyhydroxides in the soil has been studied extensively (McKenzie, 1975, 1970;
Taylor, 1968). Chemical dissolution experiments showed that Co and to a lesser degree
Ni are dominated by Mn redox cycling (Taylor et al., 2005). However, a small part of
the Ni was reported to be associated with Co and Al in lithiophorite-asbolane mixed
layer Mn-oxides (Manceau et al., 2002; Quantin et al., 2002). It has been found that an
average of about 80 wt% of the total soil Co and part of the total Ni contents are
associated with the manganese oxides. This possibly relates to the high sorptive
capacities of manganese oxides, particularly for heavy metals. The adsorption
capacities onto Mn02 at pH 4.0 are 1.4 mmolg"1 and 1.0 mmolg"1 for Co and Zn
respectively (Loganathan and Burau, 1973). Similarly, the adsorption capacity on
Mn02 for Cu at pH 5.0 is 1.8 mmolg1 (McKenzie, 1970). McLaren and Crawford
(1973) showed that in a suite of soils the adsorption of copper by soil components
followed the order Mn oxides > organic matter > Fe oxides > clay minerals. In
synthetic hydrous Mn oxides with adsorbed of Co, Zn, Ca and Na, the Mn was released
185

to the solution during the adsorption of Co and Zn but not Ca and Na. It was deduced
that Co interchanged with surface-bound H+ and structural Mn2+, and Mn'1+, Zn with
and Mn2+, and Ca only with H+ (Loganathan and Burau, 1973).
Element distribution patterns for the Girilambone samples also show that some M n
enrichment is positively correlated with elevated Ba, Cr, Pb and Zn (Figure 9.44 A, C ,
E, G). The association of Co, Ba, Pb and Ni with Mn oxides is well documented in the
geochemical literature (e.g. Taylor, 1968; Childs, 1975; Golden et al., 1993; White and
Dixon, 1996; Zaidelman and Nikiforova, 1998; Vaniman et al., 2002; Neaman et al.,
2004). Barium behaviour is generally controlled by the biogenic precipitation and
dissolution of barite and to a lesser degree by Mn redox cycling (Schenau, et al., 2001;
Cornu et al., 2005; Taylor, et al., 2005).
Observations show that the adsorption capacity of Pb on Mn oxides exceeds that of Fe
oxides on a molar basis by approximately an order of magnitude (Dong and Hua, 2001;
Dong et al., 2003). Tan et al. (2006) showed that Ba, Co, Cu, Ni, Pb and Zn were
significantly correlated with MnÜ2 in iron-manganese nodules, whereas Cr is only
correlated with Fe20 3 in the surrounding soil. Negra et al. (2005) studied the relation
between Mn oxides and Cr in the soil and they concluded that soils with more total
reducible Mn generally demonstrated greater net Cr content. This pattem was
moderated by soil pH and relative Mn oxidation state. The greater Mn abundance and
greater Mn4+/ Mn ratio in soil Mn oxides increase Cr oxidation
In this study a broad comelation between Mn and Cr and the general trends of Cr
increasing with Fe203 content (Figure 9.44 H) probably reflect iron oxide control of Cr
distribution. However the positive comelation between of Cr with Mn observed in some
Mn-enriched samples (Figure 9.44 C) indicates that the relationship between these two
elements is more complex.
The significant positive correlations between elevated Mn values and elevated Co, Ni
Cu and Zn strongly suggest that these metals were preferably extracted and
accommodated by Mn-oxides/oxyhydroxides. Examples from drill holes CBAC122,
CBAC177, CBAC198 and CBAC211 show that the highest Mn value (the peak)
coincides with the highest value of these metals (Figure 9.45). These enrichments are
186

consistent with the concentrations of Pb, Zn, Cu Co and Ni observed in Mn oxides from
EDXA spectra (Figures 9.26, 9.28, 9.30, 9.32-33).
1000 -
500 -
800 t
600 -
400 -
200 -
200 t
Q- 100 -
250 t
200 -
5. 150 -
0.0 0.5 1 0 1 5 2.0
250 -I
200 - / EE /ä uo - • /
Pb o o__
1_
♦
O
Oi__
_1_
* % *
350 t
300 -250 -
5 . 200 -
150 -100 -
1200 -
1000 -
800 -600 -400 - 0.004200 -
MnO %
160 -
MnO % Fej° 3 %
Figure 9.44 Scattergrams showing the correlation between Mn and Ba, Co, Cr, Pb, Ni
and Zn (A-G respectively), and the correlation between Fe2 Ü3 total and Cr (H) in the Mn-
enriched regolith of the Girilambone region. Apparent additional correlations are
represented by blue and red lines.
187
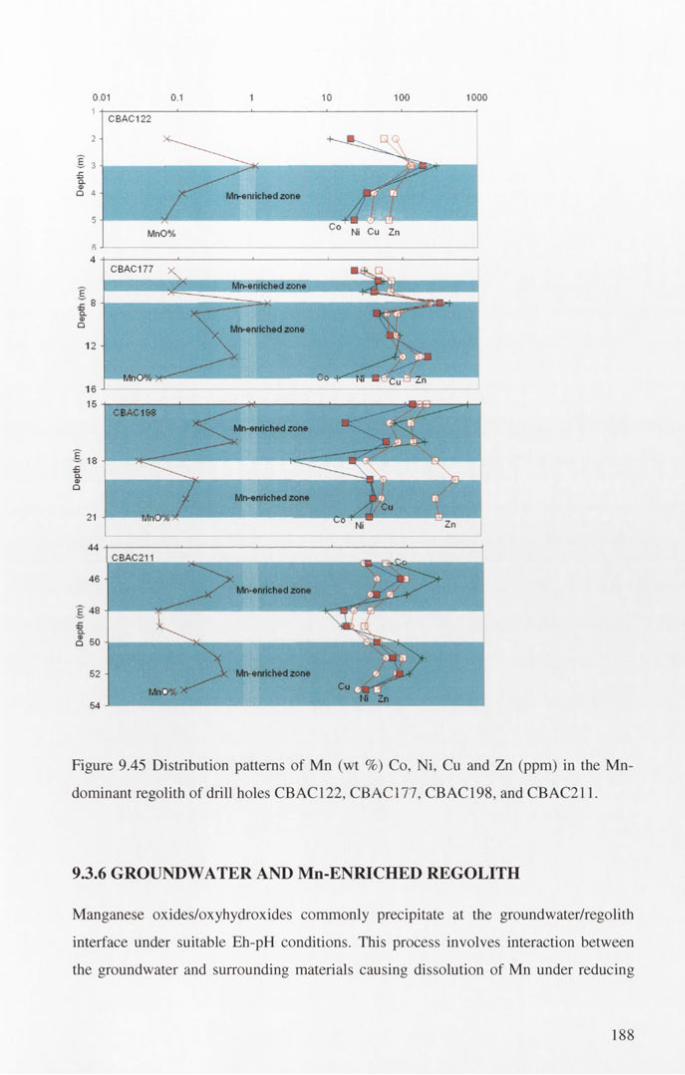
0.01 100 1000
CBAC122
Mn-enriched zone
MnO%
CBAC177
Mn-enriclied zone
Figure 9.45 Distribution patterns of Mn (wt %) Co, Ni, Cu and Zn (ppm) in the Mn-
dominant regolith of drill holes CBAC122, CBAC177, CBAC198, and CBAC211.
9.3.6 GROUNDWATER AND Mn-ENRICHED REGOLITH
Manganese oxides/oxyhydroxides commonly precipitate at the groundwater/regolith
interface under suitable Eh-pH conditions. This process involves interaction between
the groundwater and surrounding materials causing dissolution of Mn under reducing
1 8 8
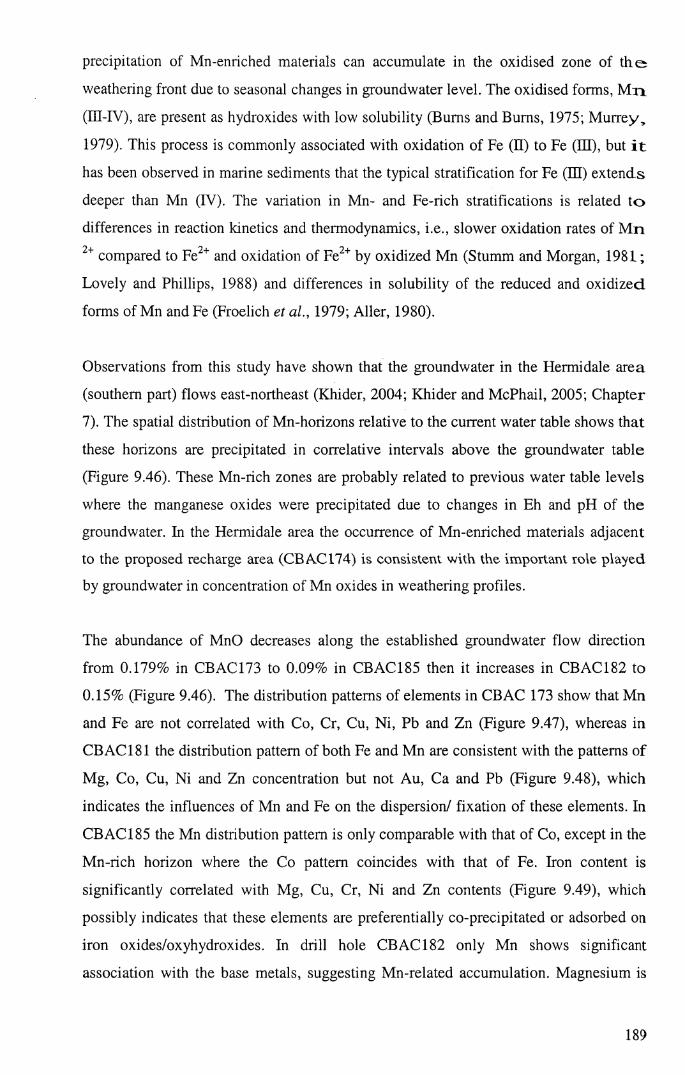
precipitation of Mn-enriched materials can accumulate in the oxidised zone of th e
weathering front due to seasonal changes in groundwater level. The oxidised forms, M n
(II1-IV), are present as hydroxides with low solubility (Bums and Bums, 1975; Murrey,
1979). This process is commonly associated with oxidation of Fe (II) to Fe (III), but i t
has been observed in marine sediments that the typical stratification for Fe (III) extends
deeper than Mn (IV). The variation in Mn- and Fe-rich stratifications is related to
differences in reaction kinetics and thermodynamics, i.e., slower oxidation rates of Mn
“+ compared to Fe2+ and oxidation of Fe2+ by oxidized Mn (Stumm and Morgan, 1981;
Lovely and Phillips, 1988) and differences in solubility of the reduced and oxidized
forms of Mn and Fe (Froelich et al., 1979; Aller, 1980).
Observations from this study have shown that the groundwater in the Hermidale area
(southern part) flows east-northeast (Khider, 2004; Khider and McPhail, 2005; Chapter
7). The spatial distribution of Mn-horizons relative to the current water table shows that
these horizons are precipitated in correlative intervals above the groundwater table
(Figure 9.46). These Mn-rich zones are probably related to previous water table levels
where the manganese oxides were precipitated due to changes in Eh and pH of the
groundwater. In the Hermidale area the occurrence of Mn-enriched materials adjacent
to the proposed recharge area (CBAC174) is consistent with the important role played
by groundwater in concentration of Mn oxides in weathering profiles.
The abundance of MnO decreases along the established groundwater flow direction
from 0.179% in CBAC173 to 0.09% in CBAC185 then it increases in CBAC182 to
0.15% (Figure 9.46). The distribution patterns of elements in CBAC 173 show that Mn
and Fe are not correlated with Co, Cr, Cu, Ni, Pb and Zn (Figure 9.47), whereas in
CBAC181 the distribution pattern of both Fe and Mn are consistent with the patterns of
Mg, Co, Cu, Ni and Zn concentration but not Au, Ca and Pb (Figure 9.48), which
indicates the influences of Mn and Fe on the dispersion/ fixation of these elements. In
CBAC 185 the Mn distribution pattern is only comparable with that of Co, except in the
Mn-rich horizon where the Co pattern coincides with that of Fe. Iron content is
significantly correlated with Mg, Cu, Cr, Ni and Zn contents (Figure 9.49), which
possibly indicates that these elements are preferentially co-precipitated or adsorbed on
iron oxides/oxyhydroxides. In drill hole CBAC 182 only Mn shows significant
association with the base metals, suggesting Mn-related accumulation. Magnesium is
189
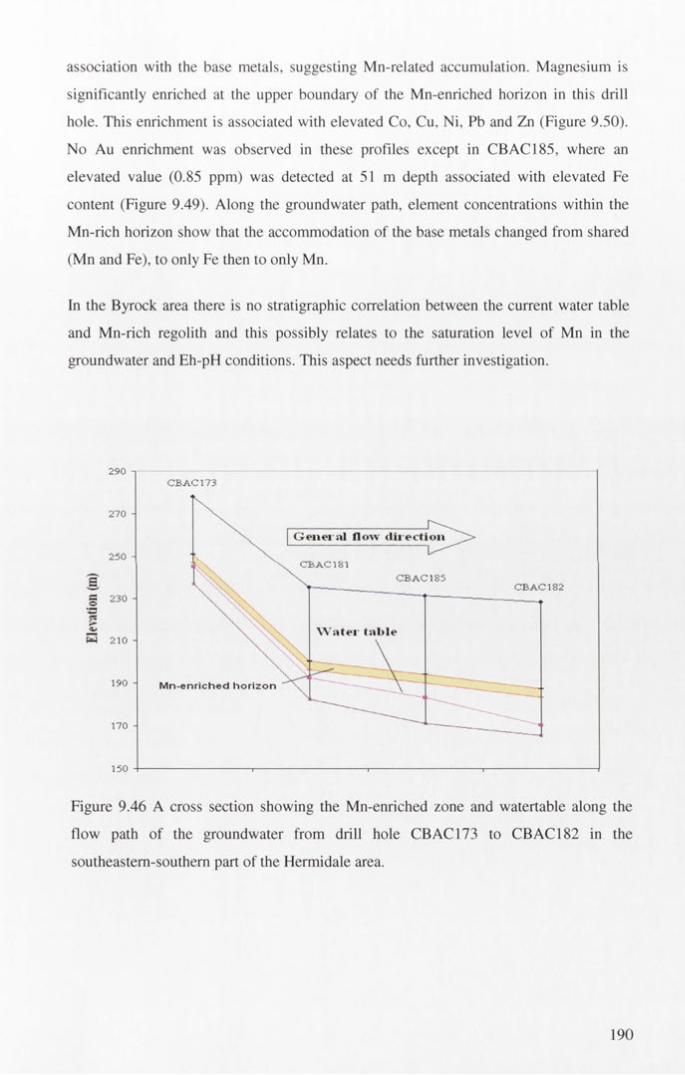
association with the base metals, suggesting Mn-related accumulation. Magnesium is
significantly enriched at the upper boundary of the Mn-enriched horizon in this drill
hole. This enrichment is associated with elevated Co, Cu, Ni, Pb and Zn (Figure 9.50).
No Au enrichment was observed in these profiles except in CBAC185, where an
elevated value (0.85 ppm) was detected at 51 m depth associated with elevated Fe
content (Figure 9.49). Along the groundwater path, element concentrations within the
Mn-rich horizon show that the accommodation of the base metals changed from shared
(Mn and Fe), to only Fe then to only Mn.
In the Byrock area there is no stratigraphic correlation between the current water table
and Mn-rich regolith and this possibly relates to the saturation level of Mn in the
groundwater and Eh-pH conditions. This aspect needs further investigation.
§£5
Figure 9.46 A cross section showing the Mn-enriched zone and watertable along the
flow path of the groundwater from drill hole CBAC173 to CBAC182 in the
southeastern-southern part of the Hermidale area.
190

Figure 9.47 Showing the distribution patterns of the trace elements Au, Co, Pb, Ni, Cu,
Zn and Cr (ppm) and their relationships with MnO and Fe2 Ü 3 total (wt %) in the Mn-
enriched regolith in drill hole CBAC173.
5 6 0.0001 0.001 0.01 0.1 1 0 40
CBAC181
Mn-enriched zone£ 37 -
CaO MnO MgO Co Pb
Figure 9.48 Showing the distribution patterns of the trace elements Au, Co, Pb, Ni, Cu,
Zn and Cr (ppm) and their relationships with MnO, CaO, MgO and Fe20.2 total (wt %)
in the Mn-enriched regolith of drill hole CBAC181.
191
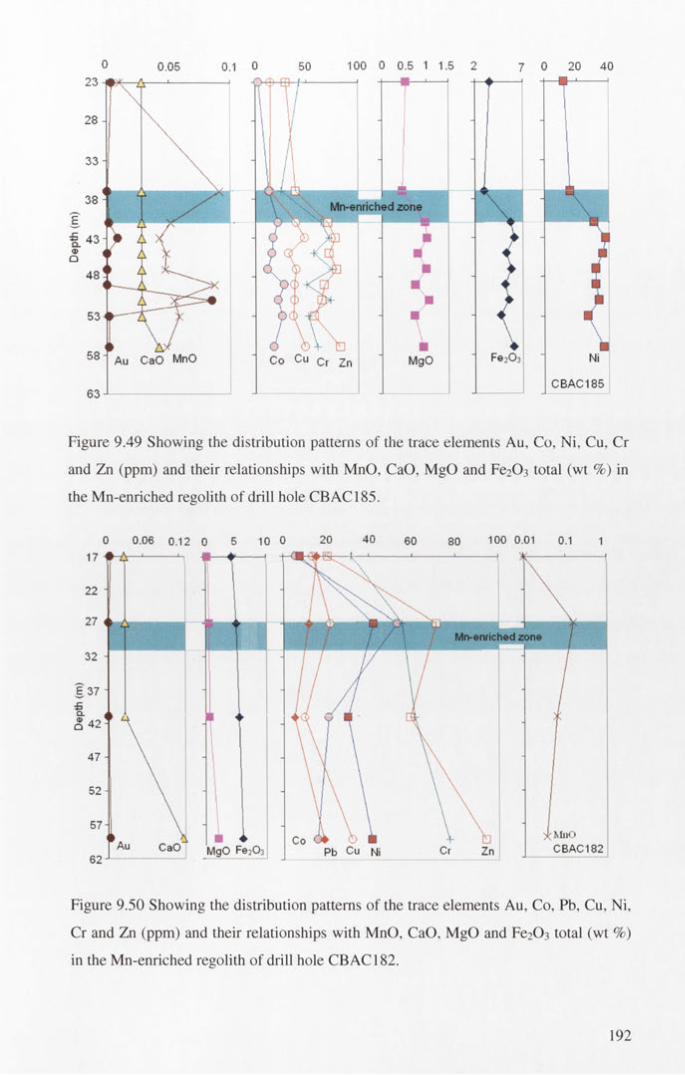
100 0 0.5 1 1.5 20.1 0
Mn-enriched zone
Au CaO MnO Co Cu Cr Zn
CBAC185
Figure 9.49 Showing the distribution patterns of the trace elements Au, Co, Ni, Cu, Cr
and Zn (ppm) and their relationships with MnO, CaO, MgO and Fe203 total (wt %) in
the Mn-enriched regolith o f drill hole CBAC185.
0 0.06 0.12 0 5 10 0 20 40 60 80 100 0.01 0.1 1■es.- k -■
27 n AMn-enriched zone
MnOCBAC182Pb Cu Ni
Figure 9.50 Showing the distribution patterns of the trace elements Au, Co, Pb, Cu, Ni,
Cr and Zn (ppm) and their relationships with MnO, CaO, MgO and Fe203 total (wt %)
in the Mn-enriched regolith of drill hole CBAC182.
192

9.3.7 SUMMARY AND CONCLUSIONS
In the Girilambone region Mn-enriched zones show a variable distribution in the
regolith. Manganese enrichment is most noticeable in the in situ regolith. The highest
MnO content is observed in the southwest of the Hermidale area and generally
decreases toward the east. Lithiophorite, cryptomelane, pyrolusite and hollandite
compositions have been identified by energy dispersive X-ray analysis (EDXA). The
Mn-oxides/oxyhydroxides in these zones occur as microcrystalline masses or well-
developed platy crystals.
Manganese oxide/oxyhydroxide content is generally correlated with that of Fe, Mg, As,
Co, Ni, Cu and Zn. This is particularly the case in mafic rock dominant areas indicating
that a mafic element suit released during weathering was accommodated by Mn oxide
minerals. Gold enrichment is not associated with this multi-element enrichment nor is it
correlated with the overall MnO abundance, which probably indicates its
dispersion/fixation is not being controlled by incorporation or adsorption by manganese
oxides/oxyhydroxides. The relative spatial distribution of Mn- rich horizons with
respect to groundwater level shows stratified concentration of Mn oxides above the
present water level along the groundwater flow path, indicating previous water table
levels where the manganese oxides were precipitated due to chemical changes.
9.4 ELEM ENT ASSOCIATION AND DISPERSIO N IN Fe- ENRICH ED REGOLITH
9.4.1 INTRODUCTION
Iron is considered one of the most important elements in regolith geochemistry, because
of its ability to undergo oxidation and reduction (ferric to ferrous), the high capacity for
some Fe oxyhydroxides to adsorb large amounts of trace elements across broad pH
ranges and its abundance in the crust. Iron oxide-rich zones are common in the regolith
of the Girilambone region (Chan et a l 2002; 2004).
Ferruginous regolith has potential as a sampling medium in mineral exploration in
many deeply weathered terrains (Anand, 2001) and anomalies of geochemical
pathfinders have been reported in ferruginous regolith in Australia (Anand et a l 1993;
193
Anand, 2001) and around the world (Freyssinet et al., 1989; Costa, 1993; Costa et a /.,
1999).
In the Girilambone region Fe-enriched regolith (with > 8.5 wt% Fe2Ü3 as total Fe)
shows variable distribution (Appendix 7). The greatest Fe enrichment is in the central
part of the study area (Sussex area), where Fe is predominantly concentrated in the
transported regolith particularly as ferruginous clasts (Figure 9.51). Toward the south
(Hermidale area), the number and thickness of Fe-enriched horizons are significantly
decreased (Figure 9.52). In the northern part (Byrock area) Fe-enrichment is observed
in the in situ regolith in the west (where transported cover is thinner) and mainly in
transported regolith in the east (Figure 9.53).
9.4.2 IRON OXIDE / OXYHYDROXIDE MINERALS
Iron oxides/oxyhydroxides can be distributed evenly throughout a weathering profile,
or preferentially concentrated in particular horizons. Iron is mobile within a weathering
profile because of its ease of reduction under anaerobic conditions and its susceptibility
to be complexed (Taylor et al., 1983). Iron oxides/oxyhydroxides can exist as
concentrations in mottles, cemented aggregates, discrete fine particles and as coatings
on grains and crack faces.
The most common soil iron oxides/oxyhydroxides are goethite (a-FeOOH),
lepidocrocite (y-FeOOH), hematite (a-FezCF), maghemite (y-Fe2 0 3 ) ferrihydrite
(FIFesOgAFLO) and magnetite (Fe3 0 4 ). With the exception of magnetite (which
generally exists as a residual primary mineral), all are products of pedogenesis and
derived either directly from primary sources of iron, or from the transformation of
earlier pedogenic forms under new environmental conditions (Taylor et al., 1983).
Magnetite can also be oxidized in a solid-state transformation to maghemite; such a
transformation is favoured by smaller particle size and a moist environment
(Feitknecht, 1965).
As well as pH, Eh and temperature other local environmental variables can influence
the precipitation of iron oxides/oxyhydroxides. These include for example, the
inhibition of crystallization (eg. the effect of added silicate, phosphate etc.), change in
194

mineral species and the modification of crystal morphology (Schwertmann and Taylor,
1972; Taylor et al., 1983).
6570000 mN
*CBAC1
*CBAC127
#CBAC133*CBAC137
6540000 mN
*CB fcm • • b*a c 92*CBAC87 * *CBAC8°* CBAC94
•CBAC77
*CBAC75
*€BAC73 *CBAC71
(JBAC65CBAC64
*CBAC61
*CBAC58
, CBAC54» » • • • CBAC32 CBAC40
•C3AC*2>AC29 *CBAC21
*CBAC43
# **CBAC19 ^ CBAC16 *CBAC12
Oi-CNCOH-incOcOT-CNI^-OCON-oOo j n < D c o o ) T - ( M t N f f l O T - f ' j a « c O T - f - j ' t o o T - t i r i ^ ( N n u i < D N ( O O T - N c o o ) O i - ( N n " t i / ) t D O ) O o o o o o o o T - T - c M r j o o n n .— t — t — t ~ r — fsi 04 04 C4 04 CO CO CO ^ O“ lO if) IO IO CO CO CO N N N S- O'- r - r— OO 00 00 00 00 O) O) O) O) O) G) O) O) t— t— t— t — .— T— t — t — t— t — t — .— t — T- t—O O O O O O O O O O U O O U O O O O U O O O O U O O O O O O O O O O O O O O O O O O O O O O O O O O O O O O O O O O < < < < < < < < < < < < < < < < < < < < < < < < < < < < < < < < < < < < < < < < < < < < ; < < < < < < : < < < < < < < < cümcQmmmmcQirimmmQQcncDcQoQcDcocücocDCDcücQCQcücococücücacDcocüDücücücDCQiricacQcocDcücücDGüGücücüaDCQCücücücüo o o o o o o o o o o o o o o o o o o o o o o o o o o o o o o o o o o o o o o o o o o o o o o o o o o o o o o o o o
Fe-enriched regolith
Transported / In situ boundary
Figure 9.51 Plan showing the location of drill holes with observed Fe-enriched zones in the regolith from the Sussex area and profiles of these holes.
195

LUeg •C B A C 146
1•C B A C 145
•C B A C 144•
♦CBAC142
6510000 mN..........
♦CBAC152
6480000 mN
•C B A C 165
•CBAC171
0 7 .5 15
k ilo m e te rs•C B A C 179
• C B A c f e
Figure 9.52 Plan showing the location of drill holes with observed Fe-enriched zones in
the regolith from the Hermidale area and profiles of these holes.
196
CBA
C17
!
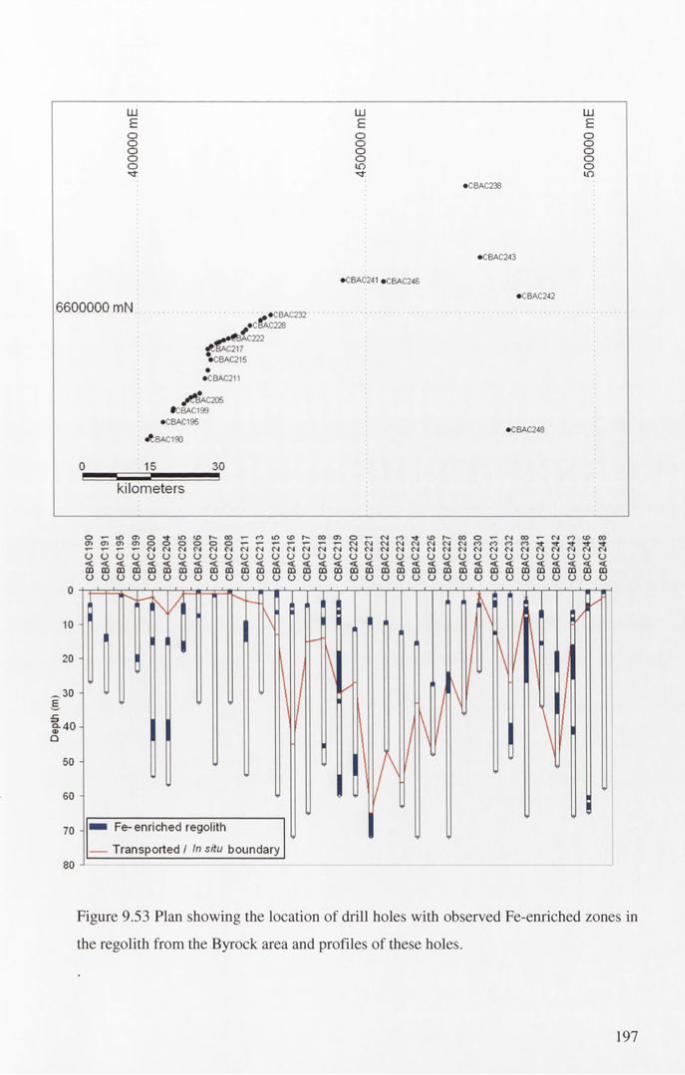
LUEooooox f
LUEooooLO
LUEoooQOin
♦CBAC238
•CBAC243
•CBAC241 #CBAC246
6600000 mN
^**^feAC222 £BAC217♦CBAC215
^♦CBAC228♦CBAC232
♦CBAC211
J*^3AC205•CBA.C199
•CBAC195
<ft:BAC190
•CBAC242
•CBAC248
0 15 30
kilometers
i o c n o T f L O C D r - C D T - r oc n c n o o o o o o ^ — ▼-
i o (£> N CO O )
CM CM CM CM CM CM CM c j N c j r i MO ' — C\1 fO x f (D N (O O '— <Ni CO '— C\J CO CD OON N C-J N N f j N N (O n n D ^ t - t " t - tM C ' I C I M M M N M M M C J M M M N M C Jo o o o o o o o
< < < < < < < <C Ü C D C Ü C D Ü 3 C Q C 0 C QO O O O O O O O
o o o o o o o o o< < < < < < < < <C O C Q C O C Q O Q C Q C D C Q C DO O O O O O O O O
O O O O O O O O O< < < < < < < < <C Q C O C Q C D C D C Q Q Q C D C ÜO O O O O O O O O
o o o o o o o o< < < < < < < <C Ü C Ü C O O Q C Q C Q O Q C Oo o o o o o o o
■ i Fe-enriched regolith
— Transported / In situ boundary
Figure 9.53 Plan showing the location of drill holes with observed Fe-enriched zones in
the regolith from the Byrock area and profiles o f these holes.
197

In this study hematite, goethite and maghemite were identified by X-ray diffraction in
the Fe-enriched horizons. Some of these horizons (i.e. in drill holes CBAC215,
CBAC243 and CBAC246) are characterised by the presence of only goethite, whereas
in others (i.e. CBAC103 and CBAC224) hematite is the dominant iron oxide mineral.
Maghemite is less abundant and it is only observed in a few Fe-enriched horizons
(Appendix 4).
9.4.3 TRACE ELEMENT CHARACTERISTICS OF Fe-ENRICHED REGOLITH
Some in situ regolith samples shows apparent correlations between Fe, As and Cu
contents (Figure 9.54 B, F). In the Fe-enriched transported regolith there is not a strong
con-elation between the content of total Fe2 Ü3 and the trace elements except for As and
Cr (Figure 9.54).
9.4.3.1 GOLD IN Fe-ENRICHED REGOLITH
Gold shows significant concentration in some of the Fe-rich horizons. However, there
is no direct correlation between Au and Fe content (Figure 9.54 A). Enrichments of Au
(> 0.009 ppm) were detected in samples from drill holes CBAC32, CBAC81,
CBAC103, CBAC143, CBAC204 and CBAC219. Some of these drill holes (i.e. CBAC
103, CBAC204 and CBAC219) are selected to display the relationship between Au and
Fe distribution in the regolith profile.
In drill hole CBAC 103 there are three Fe-enriched horizons. The lower horizon extends
across the T/I boundary. There are two levels of Au enrichment 0.026 ppm and 0.018
ppm recognised in the transported regolith at 7-8 m and 18-24 m depth respectively
(Figure 9.55, Appendix 7). The upper Au enrichment zone is associated with significant
enrichment in Fe and As. The drill hole log and field observations indicate a marked
increase in ferruginous magnetic gravel and granules at this level. Mineralogical
analysis shows high hematite content (21 wt%) with some goethite (1.2 wt%) and
maghemite (4.4 wt%) at this level (Appendix 4). This possibly explains the enrichment
of Au at this level as a result of mechanical accumulation of Au-bearing ferruginous
sediments.
198

0.03 T160x As Trans x Au Trans
A Au In situA As In situ120 -
— Linear (As Trans) R2 =0.003 Trans R2 =0 006 In situ
0.02 -
Q- 80 -
tec R2 = 0.47
400 nx Cr Trans a Cr In situ
— Linear (Cr Trans)
x Zn Trans a Zn In situ
300 - 300 -R2 =0.003 Trans
R2=0.003 In situR2 = 0.66c l 2 0 0 - AX A a 200 -
100 - 100 -
x x
450 tx Cu Trans A Cu In situ
x Pb Trans a Pb In situ
120 - R2 =0.16 Trans a R2 =0.03 In situ
R2 =0 04 Trans R2 =0.04 In situ300 -
cl 80 -
150 - A X x
X X
Figure 9.54 Scattergrams of trace elements in the Fe-enriched regolith of the
Girilambone region. Fe2C>3 % vs. Au (A), As (B), Zn (C), Cr (D), Pb (E) and Cu (F).
Dashed lines represent apparent additional correlations.
In the lower Au-enriched horizon, Au content generally increases with that of Fe and
As, but is also significantly correlated with Mn content (Figure 9.55). The
mineralogical analysis shows a lack of well crystalline iron oxide minerals (Appendix
4), which possibly indicates occurrences of Fe within the amorphous and /or clay
materials. The relationship between Au and Mn in Fe-rich zones needs further
investigation, including detailed microanalysis of components.
199

In CBAC204 the Fe-enriched zone consists of pink saprolite. The identified iron-
oxide/oxyhydroxide minerals in this zone are goethite (8.6 wt%) and hematite (1.2
wt%; Appendix 7). Iron is associated with As and Au and the highest Au value
coincides with highest As and Fe contents (Figure 9.56). A positive correlation between
Au enrichment and Fe2C>3 abundance possibly indicates adsorption of Au and As onto
Fe oxides/oxyhydroxides during chemical weathering of Au-rich materials.
0.0001 0.001 0.01 100
Figure 9.55 Distribution profiles of Au and As (ppm) and the major elements Fe2Ü 3
(total), MnO, CaO and MgO (wt%) in the Fe-enriched horizons of drill hole CBAC103.
0.0001 0.001 0.01 0.1 1 1 10 100
Fe-enriched
Au MnO CaO
CBAC204
Figure 9.56 Distribution profiles o f Au and As (ppm) and the major elements Fe2Ü 3
total, MnO, CaO and MgO (wt%) in the Fe-enriched horizons of drill hole CBAC204.
200

9.4.3.2 ZINC, COPPER AND LEAD ASSOCIATED WITH Fe OXIDES/ OXYHYDROXIDES
Because of the economic significance of gossans, there have been many studies, which
have shown a strong correlation between Cu and Fe content of weathered rocks (see
Taylor and Eggleton, 2001). Eh, pH and CO2 (g) pressure are important factors in
controlling the Cu-Fe relationship (e.g. Thomber, 1985; Mosser and Zeegers, 1988). In
a similar context a comparative study of iron oxides (Rose and Bianchi-Mosquera,
1993) showed that under neutral conditions (pH=7) goethite adsorbed all the available
metal, whereas hematite preferentially adsorbed all the Pb, Zn, Co and Ni with only 70
% of Cu and Ag.
In the Girilambone region there is significant correlation between elevated Fe values
and high concentration of Cu, Zn and Pb. Distribution patterns in the regolith profiles
strongly suggests that these metals were preferably adsorbed or accommodated by Fe-
oxides/ oxyhydroxides. In drill holes CBAC27 and CBAC246 there is a comparable
relationship between Fe and Zn content within and above the Fe-enriched horizons
(Figures 9.57-58). In CBAC27, XRD analysis shows 11.2 wt% of goethite in the upper
horizon (9-19 m depth) and 17.9 wt% goethite with 0.3 wt% hematite in the lower
horizon (Appendix 4). Similarly, two Fe-enriched horizons with elevated Zn and Cu
concentrations occur in drill hole CBAC 246 with 0.7 wt% and 6.7wt% of goethite (the
only detected iron oxide mineral) in the upper and the lower horizons respectively
(Figure 9.58, Appendix 4)). Petrographic and field observation show the Fe-enriched
zone consists of finely laminated siltstone with ferruginous rock chips in CBAC27 and
granitic saprolite with schistose-like texture and ferruginous induration in CBAC 246
(Chan et al., 2001; 2004).
The significant correlation between Fe and Zn content and distribution of ferruginous
weathered bedrock suggest that the Fe-Zn association reflects an original bedrock
association in CBAC27 and /or the mobilised Zn during the weathering of the bedrock
accompanied afterward with Fe in goethite.
201
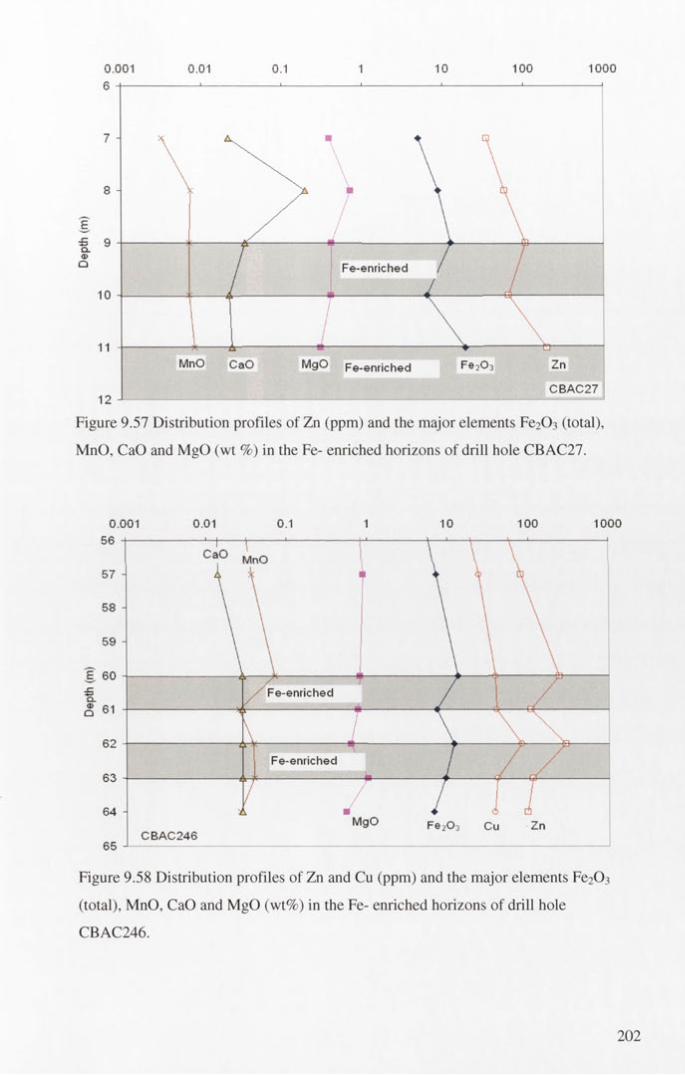
0.001 0.01 0.1 1 10 100 1000
Fe-enriched
Fe-enriched
CBAC27
Figure 9.57 Distribution profiles of Zn (ppm) and the major elements Fe2 Ü 3 (total),
MnO, CaO and MgO (wt %) in the Fe- enriched horizons of drill hole CBAC27.
0.001 0.01 0.1 1 10 100 1000
Fe-enriched
Fe-enriched
CBAC246
Figure 9.58 Distribution profiles of Zn and Cu (ppm) and the major elements Fe2 C>3
(total), MnO, CaO and MgO (wt%) in the Fe- enriched horizons of drill hole
CBAC246.
202
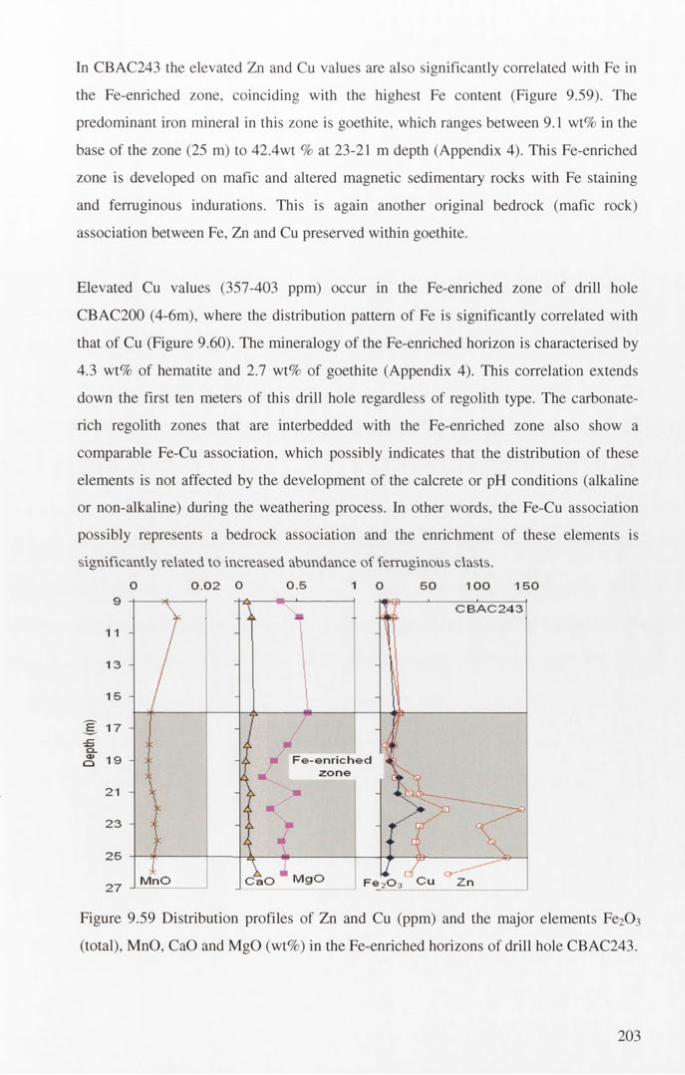
In CBAC243 the elevated Zn and Cu values are also significantly correlated with Fe in
the Fe-enriched zone, coinciding with the highest Fe content (Figure 9.59). The
predominant iron mineral in this zone is goethite, which ranges between 9.1 wt% in the
base of the zone (25 m) to 42.4wt % at 23-21 m depth (Appendix 4). This Fe-enriched
zone is developed on mafic and altered magnetic sedimentary rocks with Fe staining
and ferruginous indurations. This is again another original bedrock (mafic rock)
association between Fe, Zn and Cu preserved within goethite.
Elevated Cu values (357-403 ppm) occur in the Fe-enriched zone of drill hole
CBAC200 (4-6m), where the distribution pattern of Fe is significantly correlated with
that of Cu (Figure 9.60). The mineralogy of the Fe-enriched horizon is characterised by
4.3 wt% of hematite and 2.7 wt% of goethite (Appendix 4). This correlation extends
down the first ten meters of this drill hole regardless of regolith type. The carbonate-
rich regolith zones that are interbedded with the Fe-enriched zone also show a
comparable Fe-Cu association, which possibly indicates that the distribution of these
elements is not affected by the development of the calcrete or pH conditions (alkaline
or non-alkaline) during the weathering process. In other words, the Fe-Cu association
possibly represents a bedrock association and the enrichment of these elements is
significantly related to increased abundance of ferruginous clasts.O 0.02 O 0.5 1 0 50 100 150
C B A C 2 4 3
£ 1 7 -
F e - e n r i c h e dz o n e
M nO
Figure 9.59 Distribution profiles of Zn and Cu (ppm) and the major elements Fe2 Ü3
(total), MnO, CaO and MgO (wt%) in the Fe-enriched horizons of drill hole CBAC243.
203
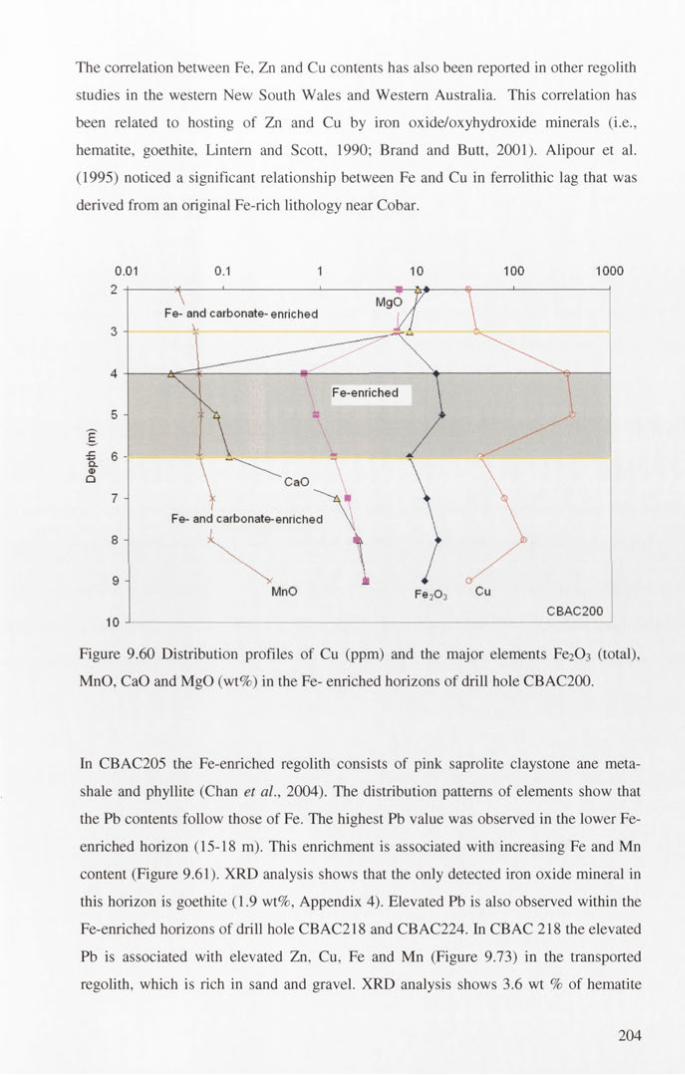
The correlation between Fe, Zn and Cu contents has also been reported in other regolith
studies in the western New South Wales and Western Australia. This correlation has
been related to hosting of Zn and Cu by iron oxide/oxyhydroxide minerals (i.e.,
hematite, goethite, Lintem and Scott, 1990; Brand and Butt, 2001). Alipour et al.
(1995) noticed a significant relationship between Fe and Cu in ferrolithic lag that was
derived from an original Fe-rich lithology near Cobar.
0.01 0.1 1 10 100 1000
Fe- and carbonate-enriched
Fe-enriched
Fe- and carbonate-enriched
CBAC200
Figure 9.60 Distribution profiles of Cu (ppm) and the major elements Fe2 Ü 3 (total),
MnO, CaO and MgO (wt%) in the Fe- enriched horizons of drill hole CBAC200.
In CBAC205 the Fe-enriched regolith consists of pink saprolite claystone ane meta-
shale and phyllite (Chan et al., 2004). The distribution patterns of elements show that
the Pb contents follow those of Fe. The highest Pb value was observed in the lower Fe-
enriched horizon (15-18 m). This enrichment is associated with increasing Fe and Mn
content (Figure 9.61). XRD analysis shows that the only detected iron oxide mineral in
this horizon is goethite (1.9 wt%, Appendix 4). Elevated Pb is also observed within the
Fe-enriched horizons of drill hole CBAC218 and CBAC224. In CBAC 218 the elevated
Pb is associated with elevated Zn, Cu, Fe and Mn (Figure 9.73) in the transported
regolith, which is rich in sand and gravel. XRD analysis shows 3.6 wt % of hematite
204
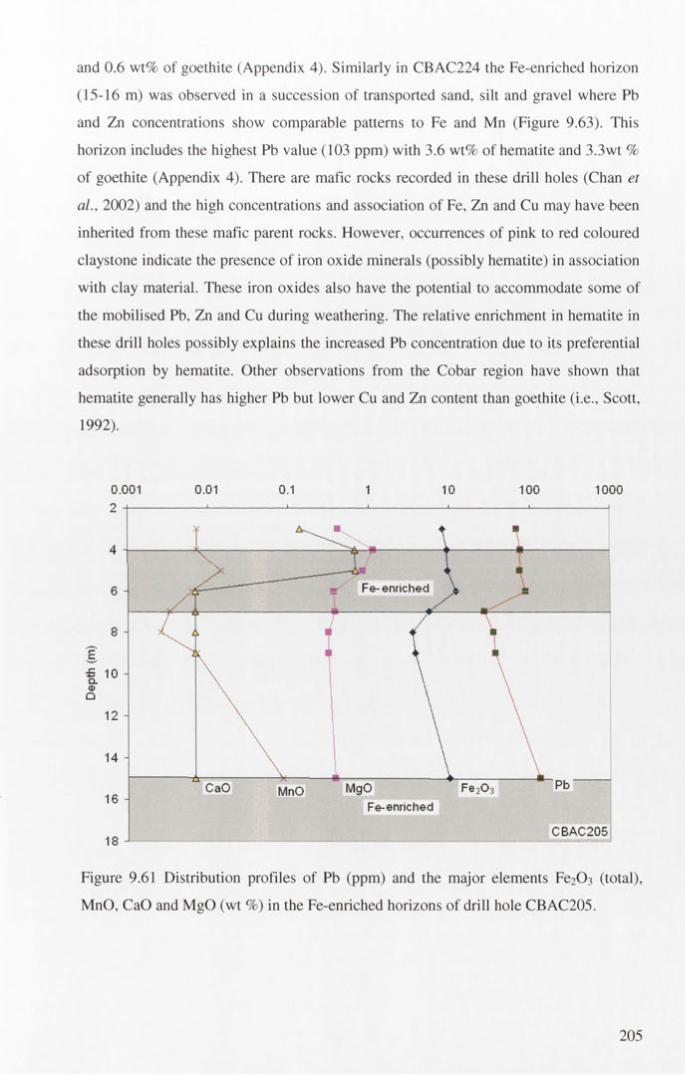
and 0.6 wt% of goethite (Appendix 4). Similarly in CBAC224 the Fe-enriched horizon
(15-16 m) was observed in a succession of transported sand, silt and gravel where Pb
and Zn concentrations show comparable patterns to Fe and Mn (Figure 9.63). This
horizon includes the highest Pb value (103 ppm) with 3.6 wt% of hematite and 3.3wt %
of goethite (Appendix 4). There are mafic rocks recorded in these drill holes (Chan et
a l., 2002) and the high concentrations and association of Fe, Zn and Cu may have been
inherited from these mafic parent rocks. However, occurrences of pink to red coloured
claystone indicate the presence of iron oxide minerals (possibly hematite) in association
with clay material. These iron oxides also have the potential to accommodate some of
the mobilised Pb, Zn and Cu during weathering. The relative enrichment in hematite in
these drill holes possibly explains the increased Pb concentration due to its preferential
adsorption by hematite. Other observations from the Cobar region have shown that
hematite generally has higher Pb but lower Cu and Zn content than goethite (i.e., Scott,
1992).
0.001 0.01 0.1 1 10 100 10002
4
6
8
g£ 10 CL <Va
12
14
16
18
Figure 9.61 Distribution profiles of Pb (ppm) and the major elements Fe2C>3 (total),
MnO, CaO and MgO (wt %) in the Fe-enriched horizons of drill hole CBAC205.
¥ A- I ♦ ■L x s . v I
A-----------L \ ■
A-—— - Fe-enriched V -___________ S i . _________ 1
T 1AN
1
rkM
------------------------'>s'
s'''s
'1_
__>L______________
.
CaO MnO MgO Fe203 pt>Fe-enriched
CBAC205
205

0 10 20 30 o 100 200 0 2 4 0 0 02 0 04
Mild)C Zn
Fe-enriched
CBAC21815 - 1-
Figure 9.62 Distribution profiles of Pb, Cu and Zn (ppm) and the major elements Fe2 C>3
(total), MnO, CaO and MgO (wt%) in the Fe-enriched horizons of drill hole CBAC218.0.001 0.01 0 1 1 10 100 1000
Fe-enriched
MnOCBAC224
22 - L -
Figure 9.63 Distribution profiles of Pb, Cu and Zn (ppm) and the major elements Fe2 Ü3
(total), MnO, CaO and MgO (wt%) in the Fe-enriched horizons of drill hole CBAC224.
2 0 6
9.4.4 SUMMARY AND CONCLUSIONS
Iron-enriched zones are unevenly distributed in the regolith profiles of the Girilambone
region. Iron- enrichment predominantly occurs in the central part of the study a rea
(Sussex area) where Fe is concentrated in the transported regolith. This significantly
decreases towards the south (Hermidale area). In the northern Byrock area, F e -
enrichment is observed in the in-situ regolith in the west generally in the transported
regolith in the east.
Some enrichment of Au and As is associated with the increased abundance o f
ferruginous magnetic gravels in the Fe-enriched zone, which possibly indicates a
mechanical dispersion of remnant primary Au in ferruginous regolith.
Higher contents of Fe, Zn and Cu occur in areas where there are weathered mafic rocks.
There is generally not a strong correlation between hematite or goethite content and
concentration of Au, As, Zn, Cu and Pb in the Fe-enriched zones. This suggests that for
these background sites the known propensity for iron oxides/oxyhydroxides to take up
these elements is not strongly expressed, probably because of the low abundances o f
the trace elements.
207

10. CHAPTER TEN: CONCLUSIONS AND RECOMMENDATIONS
This study has used a combination of geochemical analysis of the regolith materials a n d
groundwater in the Girilambone region and made the following key findings:
• Threshold and anomaly values for target and pathfinder elements vary in different
regolith materials and facies. The spatial distribution of anomalous values in th e
top metre, transported and in situ regolith have been identified.
• Multivariate cluster analysis and principal component analysis can be used to identify
major element associations in the regolith. Four major element associations have been
identified in the Girilambone regolith using these methods.
• Groundwater can be used to vector toward potential mineralisation and ,6C1 isotope
data can be used to identify the possible age of groundwater.
• Key geochemical signatures can be used to discriminate the main bedrock units (i.e.,
Girilambone Group and Cobar Supergroup) through the overlying saprolith. The A-
CN-K diagram can be used to determine the likely original source composition,
weathering and metasomatism trends of the saprolith materials;
• Secondary enrichments of calcrete, manganese and iron oxides significantly control
the target and pathfinder elements dispersions in the regolith.
• The highest Au contents in the regolith carbonate zone are not necessarily
associated with the position of maximum calcrete development and Au
enrichment has occurred at the top of the calcrete zone;
• The stratified occurrence of Mn in the in situ regolith is due to precipitation of
Mn along previous water table levels. There is a significant correlation between
Mn oxides/oxyhydroxides and As, Co, Ni, Cu and Zn in these Mn-enriched zones;
• There are significant concentrations of Au in some Fe-enriched horizons, although
there is no direct correlation between Au and Fe content; and
• There are significant correlations between Fe and elevated Zn and Cu in areas where
there are mafic rocks.
208

10.1 ANOMALY, BACKGROUND AND ELEMENT ASSOCIATIONS
The threshold values of target and pathfinder elements are calculated in the clay-silt-
gravel facies, regolith carbonate facies, Fe-dominant facies and Mn-dominant facies o f
the top meter, transported and in situ regolith material using Boxplot and MAD
methods. The boxplot method is more efficient in separating anomalies from the
background “noise” in the regolith. Potential mineralisation in the northeast of the
central part of the region (Sussex area) was identified based on anomalous enrichments
of Au, Cu, Zn and to some extent Pb along the regolith profile from drill hole
CBAC119 to CBAC125. High threshold values for As, Cr and V are observed in the
Fe-enriched facies where weathered mafic rocks are present. These elements are
accommodated by the secondary Fe oxide/oxyhydroxide minerals (hematite and
goethite). Establishing appropriate threshold values will greatly assist future mineral
exploration in the Girilambone region.
Four major element associations are identified by cluster analysis. These are element
suites associated with Ca and Mg (carbonate group), with MnO (Mn-oxide/
oxyhydroxide), with FezCA (iron oxide/oxyhydroxide) and with mafic rock (Ni and Cr).
Principal component analysis indicates similar groups, representing calcretization
(Ca+Mg), adsorption (Fe-Mn oxides) and bedrock influences. Recognising these
important regolith-related element associations will assist in selection of the most
suitable sampling media and geochemical interpretation during mineral exploration.
10.2 GROUNDWATER CHEMISTRY AND HYDROGEOLOGY
Groundwater aquifers are present within the in situ regolith where there are weathered
phyllitic siltstone-sandstone units. Water levels mirror topography, indicating an
unconfined aquifer system, and groundwater is flowing in general to the northeast in
the Hermidale area and similarly in part of the Byrock area. The groundwater in the
region is mainly chloride type, rich in Na, Cl and SO4 .The other calcium-bicarbonate
and bicarbonate-chloride types are less common. The main processes that have affected
the groundwater composition are evaporation, water-rock interaction and mixing. Each
of these processes left a compositional touch, which can be recognised by significant
209

changes in Na/Br and Cl/Br ratios. A significant increase in the 36C1/C1 ratio along th e
groundwater flow path indicates mixing of groundwaters of different ages.
Groundwater ages calculated from 36C1/C1 indicate that the groundwater in the ByrocR
area is older (418000-516000 years) than that in the Hermidale area (241000-492000
years). The waters are undersaturated with respect to oxidised copper and z in c
minerals. Calculated saturation indices of ZnSiCA, malachite and tenorite for th e
Hermidale groundwaters appear to show a vector towards known mineralisation (i.e. th e
Budgery deposit northwest of drill hole 150 and the Glengarry gossan south of drill
hole CBAC173). The correlation between the groundwater and regolith composition
suggests at least another two sites (drill holes 217 and 219) of potential mineralisation.
10.3 SEDIMENTARY WEATHERING PROCESSES AND SOURCE COMPOSITION
The degree of weathering of saprolith in the Girilambone region can be determined
using the Chemical Index of Alteration (CIA) and plots of major components (A-CN-K
diagram). Four zones of weathering I to IV are recognised based on CIA values. Zone
IV is the least weathered and zone I the most weathered. The A-CN-K diagram gives
good results for the finer grained lithologies but is not useful for sandstones particularly
where they are poorly sorted. Deviations from the weathering trends infer chemical
changes resulting from diagenesis or metasomatism.
Immobile element ratios Zr/Sc versus Th/Sc can be used to identify sedimentary
recycling in source rocks for the regolith. A significant increase in Zr/Sc with insignificant
or no increase in Th/Sc, suggests significant recycling of sediment making up the protolith.
Comparing these ratios with those for known rock composition indicate a wide range of
igneous rock compositions for the sediment source.
Al20 3 /Si02 and T i0 2/Zr ratios can be used in association with the 15Al203-300Ti02-Zr
diagram to discriminate between sandstone, shale and mafic to felsic igneous
compositions. Sandstone-dominant saprolith plots trend toward immature sandstone
indicating a significant amount of silt and clay within these samples. This diagram also
discriminates the saprolith derived from mafic igneous rocks (eg. in drill holes
CBAC163, 166, 198, 200, 201, 234) from that derived from an intermediate
(granodioritic) igneous source (eg. in drill holes CBAC167, 233, 237 and 247).
210
Ti/Th and Ce/La ratios can be used to discriminate between saprolith materials that are
derived from the Cobar Supergroup and the Girilambone Group. Cobar Supergroup
rocks show a limited range of Ti/Th ratios (0.039 - 0.03) and of Ce/La ratios (2.2- 1.9),
whereas those related to the Girilambone Group are characterised by relatively lower
ranges of Ti/Th (0.005- 0.03) and Ce/La (1.8- 2.3).
10.4 ELEMENT DISPERSION IN CALCRETE- MANGANESE- IRON -DOMINANT REGOLITH
Calcrete, Fe-Mn oxides or oxyhydroxides are important host regolith materials for Au
and base metals (Cu, Zn, Pb) in transported and in situ regolith in the Girilambone
region. Calcrete is widespread within a zone of variable thickness in the upper 10 m of
the regolith. The calcrete typically consists of dispersed calcite-dolomite, generally
with calcite predominating in the upper part of the zone and dolomite predominant
towards the base. The highest Au contents in a profile are not necessary associated with
the position of maximum calcrete development. Typically, the highest Au concentration
is at the top of the calcrete zone, but not in all cases. There is generally a negative
correlation between elevated Au and Fe20 3 content in this part of the regolith. Some in
situ profiles show an association of elevated Au with higher Fe2Ü3 content, but this is
probably remnant primary Au in ferruginous saprolite.
The association of Au with calcrete in the Girilambone region appears to reflect a
chemical environment within both transported and in situ regolith that is conducive to
precipitation of both carbonate and mobilised gold rather than a direct control on gold
fixation by calcrete. There is no positive correlation between Cu, Zn, Pb, Cr, Ni and Ti
concentrations and CaO and MgO contents in the calcrete zone. However, these
elements show positive correlation with Fe2Ü3 content suggesting these elements are
contained within iron oxide/oxyhydroxide impurities in the carbonate zone.
The Mn-enriched zone is variably distributed in the regolith of the Girilambone region,
but is generally best developed in the in situ regolith. The highest MnO content is in the
southwest of the Hermidale area and generally decreases toward the east. Lithiophorite,
cryptomelane, pyrolusite and hollandite are the dominant Mn minerals. They are
211

generally present as microcrystalline masses or well-developed platy crystals in cavities
and spaces in Mn-rich zones.
Manganese oxide content is positively correlated with multi-element enrichments of F e ,
Mg, As, Co, Ni, Cu and Zn, typically in mafic rock dominant areas. This indicates a
mafic suite of elements that has been released during weathering. Gold enrichment i s
not associated with this multi-element enrichment and it is not correlated with MnO
abundance, which probably indicates an independent host mechanism. A stratified
concentration of Mn oxides above the present water level along the groundwater flow
path indicates previous water levels where the manganese oxides were precipitated due
to redox changes.
Iron-enriched zones are unevenly distributed in the regolith profile of the Girilambone
region with predominant enrichment in the central part of the study area (Sussex area)
where Fe is concentrated in the transported regolith. This significantly decreases
towards the south (Hermidale area). In the northern part (Byrock area) Fe- enrichment
is observed in the in situ regolith in the west and in the transported regolith in the east.
Enrichments of Au and As are associated with ferruginous magnetic gravels in the Fe-
enriched zone, which possibly indicates a mechanical dispersion of Au in ferruginous
regolith.
Elevated Fe, Zn and Cu contents are associated with weathered mafic rocks in the
region. These enrichments reflect higher background level of these elements in the
original mafic bedrock and possibly scavenging of Pb by more abundant Fe oxides.
Generally across the region there is no clear correlation between hematite or goethite
content (identified by high Fe-contents) and concentration of Au, As, Zn, Cu and Pb.
This suggests that the well-known preferential adsorption of these elements by these
minerals has not been sufficient to produce an observable correlation on a regional
scale.
10.5 RECOMMENDATIONS FOR FURTHER WORK
• Sampling and analysis of separate regolith lithotypes is important in identifying
appropriate pathfinders for mineral exploration. Composite sampling over 1 metre
212

intervals is a successful and convenient method to detect variations, particularly
within the first ten-meters of the regolith profile. Surface (top metre) composite
samples are not recommended for exploration and should only be utilised when
the regolith mixing facies are well recognised.
• Groundwater samples collected by sample bailer have been found useful fo r
detecting regional variation in groundwater geochemistry. This type of sampling
is recommended for regional exploration, particularly when the recharge times are
too long for preliminary pumping to be practical. They can provide a better
understanding of water-rock and water- regolith interactions and the resulting
presence of some dissolved metal complexes.
• Roadside drilling is too restricted to provide a full understanding of the spatial
distribution of the regolith, groundwater and geochemical anomalies. In any
drilling project in the future, the drill holes should be selected to provide greater
coverage of the region.
• Sampling the upper part of the calcrete zone within shallow transported and in
situ regolith during air-core drilling is recommended, as part of the strategy for
gold exploration in this region. Identifying this zone from drill cuttings in the field
is probably best done by testing samples with hydrochloric acid and careful visual
observation. This can be verified from the Ca and Mg content of samples,
following chemical analysis.
• Threshold values of elements need to be established for different types of regolith
material and also tested, particularly in an area of known mineral occurrences by
implementation of an orientation survey around and away from the mineral
occurrence.
• Geochemical anomalies in different regolith facies showed enrichments of Au,
Cu, Zn and to some extent Pb in a profile extending from drill hole CBAC119 to
CBAC125 in the northwest Sussex area. Further detailed investigation is strongly
recommended for this area.
• Anomalous Zn and Cu in the groundwater from drill holes CBAC217 and
CBAC219 (Byrock area) suggest further investigation is warranted around these
areas probably southeast of CBAC217.
• The scarcity of hydrogeologic information suggests a need for further work on the
groundwater in the Girilambone region.
213

• For a better understanding of weathering process, CIA, A-CN-K diagram a n d
other element ratios techniques need to be applied across the regolith profile (as a
study case, particularly in areas of known bedrock geology) to establish th e
weathering history from fresh bedrock to deeply weathered regolith.
• Further investigation of some underlying bedrock compositions (particularly for
the Girilambone Group) is required to fully evaluate the application of Ti/Th an d
Ce/La geochemical signatures.
214
REFERENCES
Abonyi, J., Tamas, F.D. and Tritthart, J., 2004. Exploratory Data Analysis of trace e lem ents
in Clinker. Advances in Cement Research, 16: 9-16.
Ackerman, B.R., 2005. Regolith geochemical exploration in the Girilambone district of N e w
South Wales. Ph D Thesis, University of Wollongong, 631 pp.
Ackerman, B.R. and Chivas, A.R., 2004. The subsurface geochemical expression of
concealed mineralistion, Tritton copper deposit, Girilambone district. In: M cQueen,
K.G. and Scott, K.M. (Editors), Exploration field workshop Cobar region, 2004. C R C
LEME, Cobar, pp. 1-4.
Aitchison, J., 1986. Statistical analysis of compositional data. Methuen Inc, New York, 4 1 6
pp.
Aitchison, J., Barcelo-Vidal, C., Martin-Femandez, J.A. and Pawelowsky-Glahn, V., 2000.
Ratio analysis and compositional distance. Mathematical Geology, 32: 271-275.
Alehin, B., 1980. Soil conservation and reclamation of areas of eolian soil in western N SW .
In: Wasson, R. (Editor), Quaternary dust mantles of China, New Zealand and Australia.
Australian National University, Canberra, pp. 243-249.
Alipour, S., Cohen, D.R. and Dunlop, A.C., 1995. Geochemical characteristic of lag in the
Cobar area, NSW. IGES abstracts, 17: 119-121.
Alipour, S., Cohen, D.R. and Dunlop, A.C., 1997. Characteristics of magnetic and non-
magnetic lag in the Cobar area, NSW. Journal of Geochemical Exploration, 58: 15-28
Alipour, S., Dunlop, A.C. and Cohen, D.R., 1996. Morphology of lag in the Cobar region,
New South Wales. AGSO Journal of Australian Geology & Geophysics, 16: 253-262.
Aller, R.C., 1980. Diagenetic processes near the sediment-water interface of Long Island
Sound II. Fe and Mn. Advances in Geophysics, 22: 351-415.
Anderson, B.J., Jenne, E.A. and Chao, T.T., 1973. The sorption of silver by poorly
crystallized manganese oxides. Geochimica et Cosmochimica Acta, 37: 611-622.
Andrews, E.C., 1915. The Canbelego , Budgery and Budgerygar mines, Part II of the Cobar
Copper and Gold- Field. Mineral Resources, 18. NSW Department of Mines, Sydney,
121 pp.
215

Andrews, J.N. and Fontes, J.C., 1991. Importance of in situ production of Chlorine-36,
Argon-36 and Carbon-14 in hydrology and hydrogeochemistry, isotope techniques in
water resources development, International Atomic Energy Agency, Vienna, 245-269
pp.
Australian Bureau of Meteorology, www.bom.gov.au, accessed in 2006.
Baes, C.F. and Mesmer, R.E., 1976. The hydrolysis of cations. Wiley, New York, 487 pp.
Barnett, V. and Toby, L., 1994. Outliers in statistical data. Wiley, New York, 463 pp.
Barrett, T.J. and MacLean, W.H., 1991. Chemical, mass and oxygen isotope changes during
extreme hydrothermal alteration of an Archean rhyolite, Noranda, Quebec. Economic
Geology, 86: 406-414.
Baudo, R., Barbero, P., Beltrami, M. and Rossi, D., 2000. Chemical composition of the
sediment from lake 20 (Antarctica). Journal of Limnology, 59: 55-60.
Bentley, H.W., Phillips, F.M. and Davis, S.N., 1986. Chlorine-36 in the terrestrial
environment. In: Fritz, P. and Fontes, J.C. (Editors), Handbook of environmental
isotope geochemistry. Elsevier, New York, pp. 422-475.
Bentley, H.W., Phillips, F.M., Davis, S.N., Habermehl, M.A., Airey, P.L., Calf, G.E.,
Elmore, D., Grove, H.E. and Torgeson, T., 1986. Chlorine-36 dating of very old
groundwater. The Great Artesian Basin, Australia. Water Resources Research, 22:
1991-2001.
Berthelsen, R., 1998. The geology of the Tritton copper deposit. Australian Institute of
Geoscientists Bulletin, 23: 15-23.
Bethke, C.M., 2005. The Geochemist's Workbench Release 6.0. RockWare, Golden, USA.
Bird, J.R., Davie, R.F., Chivas, A.R., Fifield, L.K. and Ophel, T.R., 1991. 36C1 production
and distribution in Australia. Palaeography, Palaeoclimatology, Palaeoecology, 84:
299-307.
Blevin, P.L. and Jones, M., 2004. Granites of the Bourke-Byrock-Brewarrina region, NSW.
In: McQueen, K.G. and Scott, K.M. (Editors), Exploration field workshop Cobar region
2004. CRC LEME, pp. 10-14.
Borrego, P. and Gutierrez, M., 2000. Mapping soil geochemical anomalies in the Mesa
Quadrangle, Arizona, using NURE data. Environmental Geoscience, 7: 80-89.
Brand, N.W. and Butt, C.R.M., 2001. Weathering element distribution and geochemical
dispersion at Mt Keith, Western Australia: Implication for nickel sulphide exploration.
Geochemistry: Exploration, Environment, Analysis, 1: 391-407.
216
Brunker, R.L., 1970. Explanatory notes on the Cobar 1:250 000 geological sheet. GeologLcal
Survey of New South Wales, Sydney, 33 pp.
Bucker, C., Shimeld, J., Hunze, S. and Bruckmann, W., 2000. Data report: Logging whiile
drilling data analysis of Leg 171 A, a multivariate statistical approach. In: Moore, J~.C.
and Klaus, A. (Editors), Proceedings of the Ocean Drilling Program, pp. 1-29.
Bums, R.G. and Bums, V.M., 1975. Manganese oxides. In: Bums, R.G. (Editor), M arine
Minerals. Mineralogical Society of America, Washington D. C., pp. 1-46.
Bums, R.G. and Bums, V.M., 1979. Manganese oxides. In: Bums, R.G. (Editor), M arine
Minerals. Reviews in Mineralogy. Mineralogical Society of American, W ashington,
D.C., pp. 1-46.
Butt, C.R.M., 1987. A basis for geochemical exploration models for tropical terrains.
Chemical Geology, 60: 5-16.
Butt, C.R.M., 1991. Dispersion of gold and associated elements in the lateritic regolith,
Mystery Zone, Mt Percy, Kalgoorlie, Western Australia, 1. CSIRO Division of
exploration geoscience restricted report 156R, 60 pp.
Butt, C.R.M., 1998. Geochemical background, Mt Percy, Kalgoorlie, Western Australia,
CRC LEME Open File Report 54, 103 pp.
Butt, C.R.M., Lintem, M.J. and Anand, R.R., 2000. Evolution of regoliths and landscapes in
deeply weathered terrain- implications for geochemical exploration. Ore Geology
Reviews, 16: 167-183.
Butt, C.R.M., Robertson, I.D.M., Scott, K.M. and Cornelius, M., 2005. Regolith expression
of Australian ore systems. CRC LEME, Perth, 424 pp.
Butt, C.R.M., Williams, P.A., Gray, D.J., Robertson, I.D.M., Schorin, K.H., Churchward,
H.M., McAndrew, J., Barnes, S.J. and Tenhaeff, M.F.J., 1992. Geochemical exploration
for platinum group elements in weathered terrain. Final report. 332, CSIRO Division o f
Exploration Gescience.
Butt, C.R.M. and Zeegers, H., 1989. Classification of geochemical exploration models for
tropically weathered terrains. Journal of Geochemical Exploration, 32: 65-74.
Byrnes, J.G., 1993. Bourke 1:250 000 metallogenic map SH/55-10: Metallogenic study and
mineral deposits data sheets. Geological survey of New South Wales, Sydney, 127 pp.
Bystrom, A. and Bystrom, A.M., 1950. The crystal structure of hollandite, the related
manganese oxide minerals and MnCB. Acta Crystallogr, 3: 146-154.
217

Caims, C.J., McQueen, K.G. and Leah, P.A., 2001. Mineralogical controls on e lem en t
dispersion in regolith over two mineralised shear zones near the Peak, Cobar, N~ew
South Wales. Journal of Geochemical Exploration, 72: 1-21.
Cameron, E.M., Hamilton, S.M., Leyboume, M.I., Hall, G.E.M. and McClenaghan, M.B.,
2004. Finding deeply buried deposits using geochemistry. Geochemistry:
Exploration, Environment, Analysis, 4: 7-32.
Campbell, I.B. and Claridge, G.G.C., 1992. Soil of cold climate regions. In: Martini, I.P. a n d
Chesworth, W. (Editors), Weathering, soil and paleosols. Elsevier, pp. 183-201.
Caritat, P.de. and Kirste, D., 2004. Groundwater geochemistry as a tool for m ineral
exploration under cover- the Cumemona Province, PACRIM 2004 Congress: Hi T ech
and World Competitive Mineral Success Stories Around the Pacific Rim. AusIMJVI,
Adelaide, Series 5/2004:219.
Caritat, P.de., Kirste, D., Carr, G. and McCulloh, M., 2003. Vectoring towards mineralisation
under cover using groundwater geochemistry: an example from the Cum am ona
province. In: Roach, I.C. (Editor), Advances in Regolith. CRCLEME, pp. 49-52.
Caritat, P.de., Kirste, D. Carr, G and McCulloh, M., 2005. Groundwater in the Broken H ill
region, Australia: recognising interaction with bedrock and mineralisation using S, S r
and Pb isotopes. Applied Geochemistry, 20: 767-787.
Carr, G., Andrew, A., Denton, G., Giblin, A., Korsch, M. and Whitford, D., 1999. The "Glass
Earth" - Geochemical frontiers in exploration through cover.
http://www.smedg.org.au/Sym99glass. Accessed in 2005
Carr, P.F., Fergusson, C.L., Pemberton, J.W., Colquhoun, G.P., Murray, S.L. and Watkins,
J. , 2003. Late Ordovician island-arc volcanic rocks, Northern Capertee Zone, Lachlan
Fold Belt, New South Wales. Australian Journal of Earth Sciences, 50: 319-330.
Cartwright, I., Weaver, T.R., Fulton, S., Nichol, C., Reid, M. and Cheng, X., 2004.
Hydrogeochemical and isotopic constraints on the origins of dryland salinity, Murray
basin, Victoria, Australia. Applied Geochemistry, 19: 1233-1254.
Chan, R.A., Greene, R.S.B., De Souzakovacs, N., Maly, B.E.R., McQueen, K.G. and Scott,
K. M., 2001. Regolith, geomorphology, geochemistry and mineralisation of the Sussex-
Coolabah area in the Cobar-Girilambone region, north-western Lachlan Fold Belt,
NSW. 166, CRC LEME, 56 pp.
218
Chan, R.A., Greene, R. S. B., Hicks, M , Le Gleuher, M., McQueen, K. G., Scott, K. M. and
Tate, S. E., 2004. Regolith architecture and geochemistry of the Byrock area,
Girilambone region, North-Western NSW. 159, CRC LEME, 71 pp.
Chan, R.A., Greene, R.S.B., Hicks, M., Maly, B.E.R., McQueen, K.G. and Scott, K.M.,
2002. Regolith architecture and geochemistry of the Hermidale area of the Girilambone
region, north-western Lachlan Fold Belt, NSW. 179, CRC LEME, 48 pp.
Chappell, B.W., 1998. Basement of the Lachlan Fold Belt: the evidence from S-type granites.
GEMOC Abstract.
Chen, X.Y., Lintem, M.J. and Roach, I.C., 2002. Calcrete characteristics, distribution and use
in mineral exploration. CRC LEME, 160 pp.
Chen, X.Y., McKenzie, N.J. and Roach, I.C., 2002. Distribution in Australia: calcrete
landscapes. In: Chen, X.Y., Lintem, M.J. and Roach, I.C. (Editors), Calcrete:
characteristics, distribution and use in mineral exploration. CRC LEME, pp. 110-138.
Childs, C.W., 1975. Composition of iron-manganese minerals concretions from some New
Zealand soils. Geoderma, 13: 141-152.
Clesceri, L.S., Greenberg, A.E. and Trussed, R.R. (Editors), 1989. Standard methods for the
examination of water and wastewater, 17th edition, Washington D.C.
Coakes, S. and Steed, L., 2001. SPSS: analysis without anguish: version 10.0 for Windows.
John Wiley & Sons Australia, Ltd, Brisbane, 266 pp.
Cohen, D.R., 2001. Exploration geochemical data processing course notes, Guide to software
and data sets. University of New South Wales.
Cohen, D.R., Rutherford, N.F., Dunlop, A.C. and Alipour, S., 1996. Geochemical exploration
in the Cobar region. In: Cook, W.G., Ford, A.J.H., McDermott, J.J., Standish, P.N.,
Stegman, C.L. and Stegman, T.M. (Editors), The Cobar mineral field-A 1996
perspective. The Australasian Institute of Mining and Metallurgy, pp. 125-155.
Cohen, D.R., Shen, X.C., Dunlop, A.C. and Rutherford, N.F., 1998. A comparison of
selective extraction soil geochemistry and biogeochemistry in the Cobar area, New
South Wales. Journal of Geochemical Exploration, 61: 173-189.
Condie, K.C., 1991. Another look at rare earth elements in shale. Geochimica et
Cosmochimica Acta, 55: 2527-2531.
Cornu, S., Deschatrettes, V., Salvador-Blanes, S., Clozel, B., Haerdy, M., Branchut, S. and
Forestier, L.L., 2005. Trace element accumulation in Mn-Fe-oxide nodules of a
planosolic horizon. Geoderma, 125: 11-24.
219
Cresswell, R.G., Wischusen, J.D.H., Fifield, L.K. and Jacobson, G., 1999. Assessment of
recharge to groundwater systems in the arid southwestern part of Northern T errito ry ,
Australia, using chlorine-36. Hydrogeology Journal, 7: 393-404.
Cullers, R., Barrett, T., Carlson, R. and Robinson, B., 1987. Rare-Earth element a .nd
mineralogic changes in Holocene soil and stream sediments: A case study in the W e t
Mountains, Colorado, USA. Chemical Geology, 63: 275-297.
Cunningham, G.M., 1981. Plants of western New South Wales, Soil Conservation Service o f
New South Wales, Sydney, 32 pp.
Dale, M.B., 1995. Exploratory data analysis. Advanced Systems Institute, National R esource
Information Centre, ACT, 344 pp.
Dart, R.C., Barovich, K.M. and Chittleborough, D., 2005. Pedogenic carbonates strontium
isotopes and their relationship with Australian dust processes. In: Roach, I.C. (Editor),
Regolith 2005: Ten years of CRC LEME, pp. 64-66.
David, M., 1977. Geostatistical ore reserve estimation. Elsevier, Amsterdam, 364 pp.
Davie, R.F., Keilet, J.R., Fifield, L.K., Evans, W.R., Calf, G.E., Bird, J.R., Topham, S. a n d
Ophel, T.R., 1989. Chlorine-36 measurements in the Murray Basin: preliminary results
from the Victorian and South Australia Mallee region. BMR Journal of Geology an d
Geophysics, 11: 261-272.
Davis, J.C., 2002. Statistics and data analysis in geology. Wily, New York, 638 pp.
Day, F.H., 1963. The chemical elements in nature. Harrap, London, 372 pp.
De Ross, G.J., 1978. Report on exploration on EL 1087,Beanbah- Cobar region.
G S1978/362, Geological Survey of New South Wales, pp.
Deer, W.A., Howie, R.A. and Zussman, J., 1992. An introduction to the rock forming
minerals. Pearson-Prentice Hall, 696 pp.
Deutsch, W.J., 1997. Groundwater geochemistry, fundamentals and applications to
contamination. Lewis Publishers, Boca Raton, 220 pp.
Dogramaci, S.S., Herczeg, A.L., Schiff, S.L. and Bone, Y., 2001. Controls on 34S and 180 o f
dissolved sulfate in aquifers of the Murray Basin, Australia and their use as indicators
of flow processes. Applied Geochemistry, 16: 475-488.
Dong, D., Derry, L.A. and Lion, L.W., 2003. Pb scavenging from a freshwater lake by Mn
Oxides in heterogeneous surface coating materials. Water Research, 37: 1662-1666
Dong, D. and Hua, Y.L.X., 2001. Investigation of Fe, Mn oxides and organic material in
surface coating and Pb, Cd adsorption to surface coating developed in different natural
waters. Microchemical Journal, 70: 25-33.
220
Drever, J.I., 1997. The geochemistry of natural waters: surface and groundwater
environments. Prentice Hall, Upper Saddle River, 436 pp.
Duk-Rodkin, A., Chan, R.A. and McQueen, K.G., 2003. Drainage evolution and implications
for neotectonics and mineral exploration in the Cobar uplands, NSW. In: Roach, I.C.
(Editor), Advances in Regolith. CRCLEME, pp. 104-109.
Dunlop, A.C., Atherden, P.R. and Govett, G.J.S., 1983. Lead distribution in drainage
channels about the Elura zinc- lead- silver deposit, Cobar, New South Wales, Australia.
Journal of Geochemical Exploration, 18: 195-204.
Durand, N., Gunnell, Y., Curmi, P. and Ahmad, S.M., 2006. Pathways of calcrete
development on weathered silicate rocks in Tamil Nadu, India: Mineralogy, Chemistry
and paleoenvironmental implications. Sedimentary Geology, 192: 1-18.
Eastmet Minerals, N.L., 1970. E.L. 1977 (Application No.437) report for the fourth quarter
of Tenure (incorporating the second and third quarter). GS1970/463, Mineral search
and development, 5 pp.
Eaton, A.D., Clesceri, L.S. and Greenberg, A.E., 1995. Standard methods for the examination
of water and wastewater. Am. Public Health Association, Washington, DC, 2-25- 2-28
pp.
Edwards, D.S., Kennard, J.M., Preston, J.C., Summons, R.E., Boreham, C.J. and Zumberge,
J.E., 2000. Bonaparte Basin, Geochemical characteristics of hydrocarbon families and
petroleum systems. AGSO Research Newsletter: pp. 14- 19.
Eggleton, R.A., 2001. The regolith glossary surficial geology, soils and landscape. CRC
LEME, Canberra, 144 pp.
Elliotts, J. and Martin, A.R., 1991. Alaskan-type intrusive complexes of the Fifield belt,
central New South Wales. In: Elliott, S.J. and Martin, A.R. (Editors), Geology and
Mineralization of the Fifield Platinum Province, New South Wales. Geological
Society of Australia, pp. 4-11.
Ellis, J.C. and Gilbert, C.F., 1980. How to handle " less-than" data when forming summaries.
ER764, Water Research Centre, Medmenham, England,
Elmore, D., Fulton, B.R., Clover, M.R., Marsden, J.R., Gove, H.E., Naylor, H., Purser, K.H.,
Kilius, L.K., Beukens, R.P. and Litherland, A.E., 1979. Analysis of 36C1 in
environmental water samples using an electrostatic accelerator. Nature, 277: 22-25.
Fedo, C.M., Nesbitt, H.W. and Young, G.M., 1995. Unraveling the effects of potassium
metasomatism in sedimentary rocks and paleosols, with implications for
paleoweathering conditions and provenance. Geology, 23: 921-924.
221

Fedo, C.M., Young, G. M, Nesbitt, H. W. and Hancher, J.M., 1997. Potassic and sodic
metasomatism in the Southern Province of Canadian Shield: Evidence from
Paleoproterozoic Serpent Formation, Huronian Supergroup, Canada. Precambrian
Research, 84: 17-36.
Feitknecht, W., 1965. Oxidation of Fe3 0 4 and Fe. Colloq Int. CNRS, 122: 121-126.
Felton, A., 1981. Geology of the Canbelego 1:100 000 geological sheet 8134. Geological
Survey of New South Wales, Sydney, 171 pp.
Fergusson, C.L., 2003. Ordovician-Silurian accretion tectonics of the Lachlan Fold Belt,
southeastern Australia. Australian Journal of Earth Sciences, 50: 475-490.
Fergusson, C.L. and Coney, P.J., 1992. Convergence and interplate deformation in the
Lachlan Fold Belt of southeastern Australia. Tectonophysics, 214: 417-439.
Fifield, L.K., Ophel, T.R., Bird, J.R., Calf, G.E., Allison, G.B. and Chivas, A.R., 1987. The
Cl measurement program at the Australian National University. Nuclear Instruments
and Methods in Physics Research, 29: 114-119.
Fleming, G. and Hicks, M., 2002. Second programme of shallow reconnaissance aircore
drilling, Hermidale area, Cobar NSW., NSW Department of Mineral resources
GS2002/018.
Fleming, G., Hicks, M. and Barron, L., 2001. First programme of shallow reconnaissance
aircore drilling, Sussex area. Cobar NSW, Geological Survey of New South Wales,
GS2001/200 & GS2001/319.
Fleming, G., Hicks, M., Buckley, P., Needham, J., Barron, L. and Spencer, R., 2002. Cobar
project, Preliminary magnetic basement interpretation. Department of Mineral
Resources New South Wales.
Fletcher , W.K., 1981. Analytical methods in geochemical prospecting, Amsterdam, 255 pp.
Fogarty, J.M., 1996. Exploration for leachable copper deposits in the Girilambone district. In:
Cook, W.G., Ford, A.J.H., McDermott, J.J., Standish, P.N., Stegman, C.L. and
Stegman, T.M. (Editors), The Cobar Mineral Field - a 1996 perspective. Australasian
Institute of Mining and Metallurgy, pp. 179-193.
Fogarty, J.M., 1998. Girilambone district copper deposits. In: Berkman, D.A. and
Mackenzie, D.H. (Editors), Geology of Australia and Papua New Guinean Mineral
deposits. Australasian Institute of Mining and Metallurgy Monograph 22, pp. 593-600.
Fogarty, J.M., 2001. Tritton Copper deposit Project Update. Minfo, 69: 34-36.
222
Forelich, P.N., Klinkhammer, G.P., Bender, M.L., Luedtke, N.A., Heath, G.R., Cullen, HD.,
Dauphin, P., Hammond, D., Hartman, B. and Maynard, V., 1979. Early oxidation of
organic matter in pelagic sediments of the eastern equatorial Atlantic: Subo:xic
diagenesis. Geochimica et Cosmochimica Acta, 43:1075-1090.
Foster, D.A., Gray, D.R. and Bucher, M., 1999. Chronology of deformation within t h e
turbidite-dominated Lachlan Fold Belt: implications for the tectonic evolution of
eastern Australia and Gondwana. Tectonics, 18: 452-485.
Fralick, P., 2003. Geochemistry of clastic sedimentary rocks: ratio techniques. In: L en tz ,
D.R. (Editor), Geochemistry of sediments and sedimentary rocks: evolutionary
considerations to mineral deposit-forming environments. Geological Association o f
Canada, pp. 85-103.
Freeze, A.R. and Cherry, J.A., 1979. Groundwater. Prentice Hall, Englewood Cliffs, 604 p p .
Friedl, G., Wehrli, B. and Manceau, A., 1997. Solid phases in the cycling of manganese in
eutrophic lakes: New insights from EXAFS spectroscopy. Geochimica et
Cosmochimica Acta, 61: 275-290.
Garcia, D., Fonteilles, M.and Moutte, J., 1994. Sedimentary fractionations between Al, Ti
and Zr and the genesis of strongly peraluminous granites. Journal of Geology, 102:
411-322.
Gedeon, A.Z. and Butt, C.R.M., 1990. Morphology and geochemistry of particulate gold in
the lateritic regolith, Mystery Zone, Mt.Percy, Kalgoorlie, Western Australia. Report
No:124R„ Australian Mineral Industries Research association Limited, 41pp.
Giblin, A.M., 1996a. Applications of groundwater geochemistry to mineral exploration in the
Narromine-Nyngan region of NSW. G S1996/201, NSW Department of Mineral
Resources.
Giblin, A.M., 1996b. Applications of groundwater geochemistry to the detection o f
prospective basement beneath Mesozoic cover, Mesozoic Geology of the Eastern
Australian Plate Extended Abstracts No 43. Geological Society of Australia, pp. 186-
194.
Giblin, A.M., 2001. Groundwaters, geochemical pathfinders to concealed ore deposits.
CSIRO, 70 pp.
Giblin, A.M. and Dickson, B.L., 1992. Source, distribution and economic significance of
trace element in groundwaters from Lake Tyrrell, Victoria, Australia. Chemical
Geology, 96: 133-149.
223

Giblin, A. M. and Rutherford, N.F., 2003. Groundwaters as pathfinders to concealed ore
deposits. Australian Institute of Geoscientists AIG News Quarterly Newsletter, 71: 1-5.
Giles, A.D. and Marshall, B., 2004. Genetic significance of fluid inclusions in the CSA Cu-
Pb- Zn deposit, Cobar, Australia. Ore Geology Reviews, 24: 241-266.
Gilligan, L.B., 1982. The origin and evolution of the Mount Boppy gold deposit, Canbelego
and related mineralisation. MAS Thesis, New South Wales Institute of Technology,
Sydney, 198 pp.
Gilligan, L.B. and Byrnes, J.G., 1995. Cobar 1:250 000 Metallogenic Map SH/55-14:
Metallogenic study and mineral deposit data sheet. Geological Survey of New South
Wales, Sydney, 240 pp.
Giovanoli, R., Buhler, H. and Sokolowaka, K., 1973. Synthetic lithiophorite: electron
micrography and X-ray diffraction. Journal of Microscopy, 18: 271-84.
Glanville, D.H., Roach, I.C. and McQueen, K.G., 2003. Regolith-landform mapping, leucitite
basalt and the landscape evolution of the Byrock region, NW NSW. In: Roach, I.C.
(Editor), Advances in regolith. CRC LEME, pp. 144-148.
Gleit, A., 1985. Estimation for small normal data sets with detection limits. Environmental
Science and Technology, 19: 1201-1206.
Glen, R.A., 1985. Basement control on the deformation of cover basins: an example from the
Cobar district in the Lachlan Fold Belt, Australia. Journal of Structural Geology, 7:
301-315.
Glen, R.A., 1987. Copper and gold-rich deposits in deformed turbidites at Cobar, Australia:
their structural control and hydrothermal origin. Economic Geology, 82: 124-140.
Glen, R.A., 1988. Basin inversion, thrusts and ore deposits at Cobar, New South Wales: A
preliminary report, Geological Survey New South Wales, 21-26 pp.
Glen, R.A., 1990. Inversion of transtensional basins in the western part of the Lachlan Fold
Belt New South Wales, with emphasis on the Cobar basin. Journal of Structural
Geology, 12: 601-620.
Glen, R.A., 1992. Thrust, extensional and strike-slip tectonics in an evolving Paleozoic
orogen- a structural synthesis of the Lachlan orogen of southeastern Australia.
Tectonophysics, 214: 314-380.
Glen, R.A., 1994. Geology of the Cobar 1:100,000 sheet 8035, Geological Survey of New
South Wales, Sydney.
Glen, R.A., 1995. Thrusts and thrust-associated mineralization in the Lachlan Orogen.
Economic Geology, 90: 1402-1429.
224

Glen, R.A., Clare, A. and Spencer, R., 1996. Extrapolating the Cobar basin model to “th e
regional scale: Devonian basin-formation and inversion in west New South Wales. In:
Cook W. G., Ford A.J.H., McDermott, J.J., Standish, P.N., Stegman, C.L. and Stegm a.n,
T.M. (Editors), The Cobar Mineral Field- A 1996 perspective. The Australasian
Institute for Mining and Metallurgy, pp 43-83.
Glen, R.A., Dallmeyer, R.D. and Black, L.P., 1992. Isotopic dating of basin inversion- t h e
Paleozoic Cobar basin, Lachlan Orogen, Australia. Tectonophysics, 214: 249-268.
Glen, R.A. and Fleming, G., 2000. A new exploration province in New South Wales: T h e
Girilambone Group. In: McQueen, K.G. and Stegman, C.L. (Editors), Central W e s t
Symposium, Cobar 2000: Extended Abstract. CRC LEME, Perth, pp. 36-37.
Golden, D.C., Dixon, J.B. and Kanehiro, Y., 1993. The manganese oxide m ineral,
lithiophorite, in an Oxisol from Hawaii. Australian Journal of Soil Research, 31: 51-66.
Gomez-Gras, D. and Zarza, A.M.A., 2003. Reworked calcrete: their significance in th e
reconstruction of alluvial sequences (Permian and Triassic, Minorca, Balearic Islands,
Spain. Sedimentary Geology, 158: 299-319.
Goncalves, C.A. and Ewert, L., 1998. Evaluation of the geochemical logging data in ho le
959d: Cte D'ivoire-ghana transform margin. In: Mascle, J., Lohmann, G.P. an d
Moullade, M. (Editors), Proceeding of the Ocean Drilling Program, Scientific Results,
pp. 171-179.
Goudie, A.S., 1973. Duricrusts in tropical and subtropical landscapes. Clarendon Press,
Oxford, 174 pp.
Goudie, A., 1983. Calcrete. In: Goudie, A. and Pye, P. (Editors), Chemical sediments and
geomorphology. Academic Press, New York, pp. 93-131.
Govett, G.J.S., Dunlop, A.C. and Atherden, P.R., 1984. Electrogeochemical techniques in
deeply weathered terrain in Australia. Journal of Geochemical Exploration, 21: 311-
331.
Gray, D.J., 1991. Hydrogeochemistry in the Mount Gibson gold district. 120R, CSIRO
Australia, Division of exploration geoscience, 80 pp.
Gray, D.R., 1997. Tectonics of the southeastern Australia Lachlan Fold Belt: Structural and
thermal aspects. In: Burg, J.P. and Ford, M. (Editors), Orogeny Through Time.
Geological Society of London Special Publication, pp. 149-177.
Gray, D.R. and Foster, D.A., 1997. Orogenic concepts-application and definition: Lachlan
Fold Belt, Eastern Australia. American Journal of Science, 297: 859-891.
225
Gray, D.R. and Foster, D.A., 1998. Character and kinematics of faults within turbidite-
dominated Lachlan Orogen: implications for tectonic evolution of eastern Australia.
Journal of Structural Geology, 20: 1691-1720.
Gray, D.R., Foster, D.A. and Bierlein, F.P., 2002. Geodynamics and metallogeny of the
Lachlan Fold Belt. Australian Journal of Earth Sciences, 49: 1041-1056.
Gray, J.M. and Murphy, B.W., 1999. Parent material and soils: A guide to the influence of
parent material on soil distribution in Eastern Australia. Technical report No.45, NSW
Department of Land and water Conservation, Sydney.
Gray, J.M. and Murphy, B.W., 2002. Parent material and soil distribution. Natural Resource
Management, 5: 1-12.
Grunfeld, K., 2005. Dealing with outliers and censored values in multi-element geochemical
data- a visualization approach using XmdvTool. Applied Geochemistry, 20: 341-352.
Grunsky, E.C. and Smee, B.W., 1999. The differentiation of soil types and mineralization
from multi-element geochemistry using multivariate methods and digital topography.
Journal of Geochemical Exploration, 67: 287-299.
Guerzoni, S., Portaro, R., Trincardi, F., Molinaroli, E., Langone, L., Correggiari, A.,
Vigliotti, L., Pistolato, M., De Falco, G. and Boccini, V., 1996. Statistical analysis of
grain-size, geochemical and mineralogical data in core CM92-43, Central Adriatic
basin. Mem. 1st. Ital. Idrobiol., 55: 231-245.
Hall, G.E.M., 1998. Analytical perspective on trace element species of interest in
exploration. Journal of Geochemical Exploration, 61: 1-19.
Hall, Relph and Associates, 1969. Quarterly report on exploration license No. 177, 3 pp.
Hartigan, J.A., 1975. Clustering algorithms. Wiley, New York, 332 pp.
Hawkes, H.E. and Webb, J.S., 1962. Geochemistry in mineral exploration. Harper and Row,
New York, 415 pp.
Heins, W.A., 1993. Source rock texture versus climate and topography as controls on the
composition of modem, plutoniclastic sand. In: Johnsson, M.J. and Basu, A. (Editors),
Processes controlling the composition of clastic sediments. Geological Society of
America, Special Paper no.284, pp. 135-146.
Helgeson, H., Garrels, R.M. and Mackenzie, F.T., 1969. Evaluation of irreversible reactions
in geochemical processes involving minerals and aqueous solutions: I Applications.
Geochimica et Cosmochimica Acta, 33: 455-481.
226
Helsel, D.R., 1990. Less than obvious: statistical treatment of data below the detection linnit.
Environmental Science and Technology, 24: 1767-1774.
Helsel, D.R. and Hirsch, R.M., 1992. Statistical methods in water resources. E lsev ier,
Amsterdam, 294 pp.
Hem, J.D., 1964. Deposition and solution of manganese oxides. U.S. Geol. Survey W a te r
Supply Paper 1667B.
Hem, J.D., 1985. Study and interpretation of the chemical characteristics of natural w a ter,
U.S. Geological Survey Water-Supply Paper 2254.
Hema, A. and Navin, S., 2004. Pedogenic calcretes from Coimbatore area, Tamil N adu:
micromorphology, geochemistry and paleoclimate significance, UNESCO and IA E A ,
38 pp.
Herczeg, A.L., Torgersen, T., Chivas, A.R. and Habermehl, M.A., 1991. Geochemistry o f
groundwaters from the Great Artesian Basin, Australia. Journal of Hydrology, 126:
225-245.
Hesp, W.R. and Rigby, D., 1975. Aspects of tin metallogensis in the Tasman geosyncline,
eastern Australia, as reflected by cluster and factor analyses. Journal of Geochemical
Exploration, 4: 331-347.
Hill, S.M., McQueen, K.G. and Foster, K.A., 1999. Regolith carbonate accumulations in
western and central NSW: characteristics and potential as an exploration sampling
medium. In: Taylor, G.M. and Pain, C.F. (Editors), New approaches to an o ld
continent. Proceedings of Regolith 98 Conference. CRCLEME, Kalgoorlie, WA, pp.
191-208.
Hill, S.M., Taylor, G.M. and McQueen, K.G., 1998. Discussion genesis of some calcretes in
the southern Yilgam Craton, Western Australia: implications for mineral exploration.
Australian Journal of Earth Sciences, 45: 177-178.
Hornung, R.W. and Reed, L.D., 1990. Estimation of average concentration in the presence o f
non-detectable values. Applied Occupational and Environmental Hygiene, 5: 46-51.
Hudak, P.F., 1999. Chloride and nitrate distributions in the Hickory aquifer, central Texas,
USA. Environment International, 25: 393-401.
Hwang, C.K., Cha, J.M., Kim, K.W. and Lee, H.K., 2001. Application of multivariate
statistical analysis and a geographic information system to trace element contamination
in the Chungnam Coal Mine area, Korea. Applied Geochemistry, 16: 1455-1464.
James, C.H., 1970. A rapid method for calculating the statistical precision of geochemical
prospecting analysis. Institution of Mining and Metallurgy, 79: B88-B90.
227

Jeong, C.H., 2001. Mineral-water interaction and hydrogeochemistry in the Samkwang mine
area, Korea. Journal of Geochemistry, 35: 1-12.
Jerram, D.A. and Cheadle, M.J., 2000. On the cluster analysis of grains and crystals in rocks.
American Mineralogist, 85: 47-67.
Johnson, R.A. and Wiehern, D.W., 1982. Applied multivariate statistical analysis. Prentice-
Hall, 594 pp.
Johnsson, M.J., 1993. The system controlling the composition of clastic sediments. In:
Johnsson, M.J. and Basu, A. (Editors), Processes controlling the composition of clastic
sediments. Geological Society of America Special Paper no. 284, 342 pp.
Joplin, G.A., 1963. Chemical analysis of Australian rocks. Part I: Igneous and Metamorphic.
BMR Geology and Geophysics, Bulletin No.65.
Joplin, G.A., 1965. Chemical analysis of Australian rocks. Part II: Sedimentary rocks. BMR
Geology and Geophysics, Bulletin No.78.
Kabata-Pendias, A. and Pendias, H., 1984. Trace elements in soils and plants. CRC Press,
Boca Raton, 315 pp.
Kauranne, L.K., Salminen, R. and Eriksson, K., 1992. Regolith exploration geochemistry in
Arctic and Temperate terrains. Elsevier, 444 pp.
Kelly, W., Ratliff, T.A.J. and Nenadic, C., 1992. Basic statistics for laboratories. Van
Nostrand Reinhold, New York. 175pp.
Keywood, M.D., 1995. Origins and sources of atmospheric precipitation from Australia:
Chlorine-36 and major ion chemistry. PhD Thesis, Australian National University, 207
pp.
Keywood, M.D., Chivas, A.R., Fifield, L.K., Cresswell, R.G. and Ayers, G.P., 1997. The
accession of chloride to the western half of the Australian Continent. Australian Journal
of Soil Research, 35: 1177-1189.
Khadkikar, A.S., Merh, S.S., Malik, J.N. and Chamyal, L.S., 1998. Calcretes in Semi-arid
alluvial system: formative pathways and sinks. Sedimentary Geology, 116: 251-260.
Khider, K., 2004. Geochemical dispersion of elements in Byrock- Hermidale groundwaters,
Cobar region NSW. In: Roach, I.C. (Editor), Regolith 2004. CRC LEME, pp. 175-180.
Khider, K. and McPhail, D.C., 2005. Hydrogeology and hydrogeochemistry in the
Herimidale area, NSW. In: Roach, I.C. (Editor), Ten years of CRC LEME. CRC
LEME, pp. 165-169.
228

Khider, K. and McQueen, K.G., 2005. Geochemical discrimination of weathered bedrock: in
the Hermidale-Byrock region of northwestern NSW. In: Roach, I.C. (Editor), Ten ye-ars
of CRC LEME. CRC LEME, pp. 170-175.
Khider, K. and McQueen, K.G., 2006. Gold dispersion in calcrete-bearing regolith of t h e
Girilambone region, western NSW. In: Fitzpatrick, R.W. and Shand, P. (E ditors),
Regolith 2006: consolidation and dispersion of ideas. CRC LEME, pp. 190-195.
Kilpatrick, D. and Fleming, D.P., 1980. Lower Ordovician sediments in the Wagga T rough:
discovery of early Bendigonian graptolites near Eskdale, northeast Victoria. Journal
Geological Society of Australia, 27: 69-73.
Kotlyard, B.B., Singer, D.A., Jachens, R.C. and Theodore, T.G., 1998. Regional analysis th e
distribution of gold deposits in northeast Nevada using NURE arsenic data a n d
geophysical data, Open-file. 338, 234-242 pp.
Krige, D.G., 1960. On the departure of ore value distributions from the lognormal model in
South African gold mines. J. S. Afr. Inst. Min. Metall. (November): 231-244.
Kronberg, B.I., Fyfe, W.S., Leonardos, J.O.H. and Santos, A.M., 1979. The chemistry o f
some Brazilian soils: element mobility during intense weathering. Chemical Geology,
24: 211-229.
Krumbein, W.C. and Graybill, F.A., 1965. An introduction to statistical models in geology.
International series in the earth sciences. McGraw-Hill Book Comp., New York.
Lalor, G.C. and Zhang, C.S., 2002. Multivariate outlier detection and remediation in
geochemical databases. Science of the Total Environment., 281: 99-109.
Last, J.M. (Editor), 1988. A dictionary of epidemiology. Oxford Medical Publications,
Oxford University, New York.
Leah, P.A., 1996. relict lateritic weathering profiles in the Cobar district, NSW. In: Cook W .
G., Ford, A.J.H., McDermott, J.J., Standish, P.N., Stegman, C.L. and Stegman, T.M.
(Editors), The Cobar Mineral Field- A 1996 Perspective. Australasian Institute o f
Mining and Metallurgy, Melbourne, pp. 157-177.
Lee, J.Y., Cheon, J.Y., Lee, K.K., Lee, S.Y. and Lee, M.H., 2001. Statistical evaluation o f
geochemical parameters distribution in a ground water system contaminated with
petroleum hydrocarbons. Journal of Environmental Quality, 35: 1548-1563.
229

Lehmann, B.E., Love, A., Purtschert, R., Collon, P., Loosli, H.H., Kutschera, W., Beyerle,
Aeschbach-Hertig, W., Kipfer, R., Frape, S.K., Herczeg, A., Moran, J., Tolstikhin, I.N.
and Groning, M., 2003. A comparison of groundwater dating with 81Kr, 36C1 and 4He in
four wells of the Great Artesian Basin, Australia. Earth and Planetary Science Letters,
211: 237-2550.
Lentz, D.R., 2003. Geochemistry of sediments and sedimentary rocks: historical to research
perspectives. In: Lentz, D.R. (Editor), Geochemistry of sediments and sedimentary
rocks: Evolutionary considerations to mineral deposit-forming environments.
Geological Association of Canada, pp. 1-6.
Levinson, A.A., 1974. Introduction to exploration geochemistry. Applied Publishing Ltd.,
Wilmette, Illinois, 924 pp.
Leyboume, M.I., Goodfellow, W.D. and Boyle, D.R., 2002. Sulfide oxidation and
groundwater transport of base metals at the Halfmile Lake and Restigouche Zn-Pb
massive sulfide deposits, Bathurst Mining Camp, New Brunswick. Geochemistry:
Exploration, Environment, Analysis, 2: 37-44.
Limpert, E., Stahel, W.A. and Abbt, M., 2001. Log-normal distributions across the sciences:
keys and clues. Bioscience, 51: 341-352.
Lintem, M.J., 1997. Calcrete sampling for gold exploration. MESA Journal, 5: 5-8.
Lintem, M.J. and Butt, C.R.M., 1993. Pedogenic carbonate; an important sampling medium
for gold exploration in semi- arid areas. Explor. Res. News, 7: 7-11.
Lintem, M.J. and Butt, C.R.M., 1998. Gold exploration using pedogenic carbonate (calcrete).
Geol. Soc. Aust. Spec. Publ., 20: 200 -208.
Lintem, M.J. and Scott, K.M., 1990. The distribution of gold and other elements in soils and
vegetation at Panglo, Western Australia., CSIRO, Report No.l29R.
Loganathan, P. and Burau, R.G., 1973. Sorption of metal ions by a hydrous manganese
oxide. Geochimica et Cosmochimica Acta, 37: 1277-1293.
Love, A.J., Herczeg, A.L., Samson, L., Cresswell, R.G. and Fifield, L.K., 2000. Sources of
chloride and implications for Cl-36 dating of old groundwater, southwestern Great
Artesian Basin, Australia. Water Resources Research, 36: 1561-1574.
Lovely, D.R. and Phillips, E.J.P., 1988. Manganese inhibition of microbial iron reduction in
anaerobic sediments. Geomicrobiology Journal, 6: 145-155.
Lubin, J.H., Colt, J.S., D., C., Davis, S., Cerhan, J.R., Severson, R.K., Bernstein, L. and
Hartge, P., 2004. Epidemiologic evaluation of measurement data in the presence of
detection limits. Environmental Health Perspectives, 112: 1691-1696.
230
MacLean, W.H., 1990. Mass change calculations in altered rock series. Mineralium Deposi ta ,
25: 44-49.
Maerz, N.H. and Zhou, W., 1999. Multivariate analysis of bore hole discontinuity data, R o c k
mechanics for Industry, Proceedings of the 37th US Rock Mechanics Symposium, V a il ,
Colorado, pp. 431-438.
Manceau, A., Llorca, S. and Galas, G., 1987. Crystal chemistry of cobalt and nickel in
lithiophorite and asbolane from New Caledonia. Geochimica et Cosmochimica A c ta ,
51: 105-114.
Manceau, A., Tamura, N., Marcus, M.A., MacDowell, A.A., Celestre, R.S., Sublett, R .E .,
Sposito, G. and Pandore, H.A., 2002. Deciphering Ni sequestration in so il
ferromanganese nodules by combined X-ray fluorescence, absorption and diffraction at
micrometer scale of resolution. American Mineralogist, 87: 1494-1499.
Mantei, E.J., Gutierrez, M. and Zhou, Y., 1996. Use of normalized metal concentrations in
the Mn oxides/ hydrous oxides extraction phase of stream sediments to enhance th e
difference between a landfill emission plume and background. Applied Geochemistry,
11: 803-810.
Martinez, P., Bertrand, P., Shimmield, G.B., Cochrane K., Jorissen, F.J., Foster, J. an d
Dignan, M., 1999. Upwelling intensity and ocean productivity changes off Cape Blanc
(northwest Africa) during the last 70,000 years: Geochemical and micropaleontological
evidence. Marine Geology, 158: 57-74.
McKeague, J.A., Damman, A.W. and Heringa, P.K., 1968. Iron-manganese and other pans in
some soils of Newfoundland. Canadian Journal of Soil Science, 48: 243-253.
McKenzie, R.M., 1970. The reaction of cobalt with manganese dioxide minerals. Australian
Journal of Soil Research, 8: 97-106.
McKenzie, R.M., 1975. An electron microprobe study of the relationships between heavy
metals and manganese and iron in soils and ocean floor nodules. Australian Journal of
Soil Research, 13: 177-188.
McLaren, R.G. and Crawford, D.V., 1973. Studies on soil copper II. The specific adsorption
of copper by soil. Journal of Soil Sciences, 24: 172-181.
McLennan, S.M., Bock, B., Hemming, S.R., Hurowitz, J.A., Lev, S.M. and McDaniel, D.K.,
2003. The roles of provenance and sedimentary processes in the geochemistry of
sedimentary rocks. In: Lentz, D.R. (Editor), Geochemistry of sediments and
sedimentary rocks: evolutionary considerations to mineral deposit-forming
environments. Geological Association of Canada, pp. 7-37.
231

McLennan, S.M., Hemming, S., McDaniel, D.K. and Hanson, G.N., 1993. Geochemical
approaches to sedimentation, provenance, and tectonics. In: Johnsson, M.J. and Basu,
A. (Editors), Processes controlling the composition of clastic sediments. Geological
Society of America, Special Paper, no.284, pp. 21-40p.
McLennan, S.M. and Murray, R.W., 1999. Geochemistry of sediments. In: Marshall, C.P.
and Fairbridge, R.W. (Editors), Encyclopedia of Geochemistry. Kluwer Academic
Publishers, pp. 282-292.
McLennan, S.M., Taylor, S.R., McCulloch, M.T. and Maynard, J.B., 1990. Geochemical and
Nd-Sr isotopic composition of deep-sea turbidites: Crustal evolution and plate tectonic
associations. Geochimica et Cosmochimica Acta, 54: 2015-2050.
McPhail, D.C., Summerhayes, E., Welch, S. and Brugger, J., 2003. The geochemistry and
mobility of zinc in the regolith. In: Roach, I.C. (Editor), Advances in regolith. CRC
LEME, pp. 287-291.
McQueen, K.G., 2004a. Element fractionation and mineral hosts in the regolith, Abstracts-
LEME AMEC Mineral Exploration Seminar, pp. 19-22.
McQueen, K.G., 2004b. Field trip guide and locality descriptions. CRC LEME, 32 pp.
McQueen, K.G., 2004c. Girilambone synthesis. Abstracts-LEME AMEC Mineral
Exploration Seminar, 4-7 pp.
McQueen, K.G., 2006. Calcrete geochemistry in the Cobar-Girilambone region, New South
Wales, CRC LEME open file report 200, 31 pp.
McQueen, K.G., Hill, S.M. and Foster, K.A., 1999. The nature and distribution of regolith
carbonate accumulations in southeastern Australia and their potential as a sampling
medium in geochemical exploration. Journal of Geochemical Exploration, 67: 67-82
McQueen, K.G. and Munro, D.C., 2003. Weathering- controlled fractionations of ore
pathfinder elements at Cobar, NSW. In: Roach, I.C. (Editor), Advances in Regolith.
CRCLEME, pp. 296-300.
McQueen, K.G., Munro, D.C., Gray, D.J. and Le Gleuher, M., 2004. Weathering-controlled
fractionation of ore and pathfinder elements Part II: the lag story unfolds. In: Roach,
I.C. (Editor), Regolith 2004. CRC LEME, pp. 231-246.
Menzies, I., 1969. Hydrogeology. In: Brunker, R.L. (Editor), 1; 250,000 Geological Series
Explanatory notes Nymagee, pp. 31.
Miesch, A.T., 1967. Theory of error in geochemical data. U.S. Geol. Surv. Prof. Paper 574A,
17 pp.
232

Mongelli, G., Cullers, R.L., Dinelli, E. and Ruttura, A., 1998. Elemental mobility during the
weathering of exposed lower crust: the kinzigitic paragneisse from the Serre, Calabria,
southern Italy. Terra Nova, 10: 190-195.
Morgan, J.J. and Stumm, W., 1964. Colloid chemical properties of manganese dioxide.
Journal of Colloid Science, 19: 347-59.
Morris, P.A., Pirajno, F. and Shevchenko, S., 2003. Proterozoic mineralization identified by
integrated regional regolith geochemistry, geophysics and bedrock mapping in Western
Australia. Geochemistry: Exploration, Environment, Analysis, 3: 13-28.
Mosser, C. and Zeegers, H., 1988. The mineralogy and geochemistry of two copper-rich
weathering profiles in Burkina Faso, West Africa. Journal of Geochemical Exploration,
30: 145-166.
Munro, D.C., 2003. Regolith geology and geochemical dispersion of the Yarrawonga-Peak
area, Cobar, New South Wales, Honours Thesis, University of Canberra, 49 pp.
Murray, R.W., 1979. Iron oxides. In: Bums, R.G. (Editor), Marine minerals. Mineralogical
Society of Amenca, Washington, D.C., pp. 47-98.
Nahon, D., 1991. Introduction to the petrology of soils and chemical weathering. Wiley, New
York, 313 pp.
Nahon, D., Boulange, B. and Colin, F., 1992. Metallogeny of weathering: an introduction. In:
Martini, I.P. and Chesworth, W. (Editors), Weathering, soils and paleosols.
Developments in earth surface processes 2. Elsevier, Amsterdam, pp. 445-471.
Nahon, D., Herbillon, A. and Beauvais, A., 1989. The epigenetic replacement of kaolinite by
lithiophorite in a manganese-lateritic profile, Brazil. Geoderma, 44: 247-259.
Nahon, D. and Parc, S., 1990. Lateritic concentration of manganese oxyhydroxides and
oxides. International Journal of Earth Sciences, 79: 319-326.
Nash, J.T., Day, W.C. and Wilson, A.B., 2001. Geochemical data for historic mining areas,
central western slope, Colorado. Open- File Report 01-003, USGS, 13 pp.
Nash, D. and McLaren, S.J., 2003. Kalahari valley calcretes: their nature, origin, and
environmental significance. Quaternary International, 111: 3-22.
Native, R., Adar, E., Dahan, E. and Nissim, I., 1997. Water salinization on arid regions-
observations from Negev desert. Journal of Hydrology, 196: 271-296.
Neaman, A., Mouele, F., Trolard, F. and Bourne, G., 2004. Improved methods for selective
dissolution of Mn oxides: applications for studying trace element associations. Applied
Geochemistry, 19: 973-979.
233
Neef, G., 2004. Stratigraphy, sedimentology, structure and tectonics of lower Ordovician and
Devonian strata of south Mootwingee, Darling basin, western New South Wales.
Australian Journal of Earth Sciences, 51: 15-29
Neef, G. and Bottrill, R.S., 2001. Stratigraphy, structure and tectonics of Lower Ordovician
and Devonian strata of the central part of the Wonominta Blook, western New South
Wales. Australian Journal of Earth Sciences, 48: 317-330.
Negra, C., Ross, D.S. and Lanzirotti, A., 2005. Oxidizing behavior of soil manganese:
Interactions among abundance, oxidation state, and pH. Soil Sei. Soc. Am. J., 69: 87-
95.
Nesbitt, H.W., 2003. Petrogenesis of siliciclastic sediments and sedimentary rocks. In: Lentz,
D.R. (Editor), Geochemistry of sediments and sedimentary rocks: evolutionary
considerations to mineral deposit-forming environments. Geological Association of
Canada, pp. 39-51.
Nesbitt, H.W., Fedo, C.M. and Young, G.M., 1997. Quartz and feldspar stability, steady and
non-steady state weathering and petrogenesis of siliciclastic sands and muds. Journal of
Geology, 105: 173-191.
Nesbitt, H.W. and Young, G.M., 1982. Early Proterozoic climates and plate motions inferred
from major element chemistry of lutites. Nature, 299: 715-717.
Nesbitt, H.W. and Young, G.M., 1984. Prediction of some weathering trends of plutonic and
volcanic rocks based on thermodynamic and kinetic considerations. Geochimica et
Cosmochimica Acta, 48: 1523-34.
Nesbitt, H.W. and Young, G.M., 1989. Formation and diagenesis of weathering profiles.
Journal of Geology, 97: 129-147.
Nesbitt, H.W. and Young, G.M., 1996. Petrogenesis of sediments in the absence of chemical
weathering: effects of abrasion and sorting on bulk composition and mineralogy.
Sedimentology, 43: 341-358.
Nesbitt, H.W. and Young, G.M., 1997. Sedimentation in the Venezuelan Basin, circulation in
the Caribbean Sea, and onset of North Hemisphere glaciation. Journal of Geology, 105:
531-544.
Nesbitt, H.W., Young, G.M., Mclxnnan, S.M. and Keays, R.R., 1996. Effects of chemical
weathering and sorting on the petrogenesis of siliciclastic sediments, with implications
for provenance studies. Journal of Geology, 104: 525-542.
234
Nicholson, K., 1992. Contrasting mineralogical-geochemical signatures of m anganese
oxides: guides to metallogenesis. Economic Geology, 87:1253-1264.
N1ST/SEMATECH, 2005. e Handbook of statistical methods, http://www.itl.nist.gov.
Nord Pacific Ltd, 1998. Tritton copper deposit. Minfo, 61: 33-36.
Norrish, K. and Chappell, B.W., 1967. X-ray fluorescence spectrography. In: Zussman, J.
(Editor), Physical methods in determinative mineralogy. Academic Press, New Y oxk,
pp. 201-272.
Northcote, K.H., 1975. Atlas of Australian soils. CSIRO, Melbourne.
Obial, R.C. and James, C.H., 1973. Use of cluster analysis in geochemical prospecting, w ith
particular references to southern Derbyshire, England. In: Jones, M.J. (Editor),
Geochemical exploration 1972. The Institution of Mining and Metallurgy, pp. 237-257.
Ohta, A., Imai, N.,Terashima, S. and Tachibana,Y., 2005. Application of multi-element
statistical analysis for regional geochemical mapping in Central Japan. Applied
Geochemistry, 20:1017-1037.
Ohta, A., Imai, N., Terashima, S., Tachibana, Y., Ikehara, K. and Nakajima, T., 2004.
Geochemical mapping in Hokuriku, Japan: Influence of surface geology, mineral
occurrences and mass movement from terrestrial to marine environments. Applied
Geochemistry, 19: 1453-1469.
Ollier, C. and Pain, C., 1996. Regolith, soils and landforms. Wiley, Chichester, 316 pp.
Oren, O., Yechieli, Y., Böhlke, J.K. and Doby, A., 2004. Contamination of groundwater
under cultivated fields in an arid environment central Arave Valley, Israel. Journal o f
Hydrology, 290: 312-328.
Ostwald, J., 1984. Two varieties of lithiophorite in some Australian deposits. Mineralogical
Magazine, 48: 383-388.
Palomares, M. and Arribas, J., 1993. Modem stream sands from compound crystalline
sources: composition and sand generation index. In: Johnsson, M.J. and Basu, A.
(Editors), Processes controlling the composition of clastic sediments. Geological
Society of America, Special Paper No.284, pp. 313-322.
Pan Australian Mining Ltd, 1986. Exploration reports, ELs 2339 and 2405, Crowal Creek-
Yarran Creek-Harts Tank area. GS1986/262, Geological Survey of New South Wales.
Parc, S., Nahon, D., Tardy, Y. and Vieillard, P., 1989. Estimated solubility products and
fields of stability for cryptomelane, nsutite, bimessite and lithiophorite based on natural
lateritic weathering sequences. American Mineralogist, 74: 466-475.
235

Parkhurst, D.L. and Appelo, C.A.J., 1999. User's guide to PHREEQC (version 2) a co m pu ter
program for speciation, batch reaction, one dimensional transport, and in v e rse
geochemical calculations. Water-Resources Investigations Report 99-4259. U n ite d
State Geological Survey, 312 pp.
Peruzzo, L. and Busa, T., 2000. Geochemical correlation and distinction between simi la r
Meta-sedimentary unite from the Eastern Alps. Journal of Conference A bstracts
"Goldschmidt 2000", 5: 786.
Phillips, F.M., Bentley, H.W., Davis, S.N., Elmore, D. and B., S.G., 1986. Chlorine-36
dating of very old groundwater 2, Milk River aquifer, Alberta Canada. Water Resources
Research, 22: 2003-2016.
Phillips, F.M., Bentley, H.W. and Elmore, D., 1986. Chlorine-36 dating of old ground w a te r
in sedimentary basins., The third Canadian/American conference on hydrology.
National water well association, Dublin, Ohio, USA,, Banff, Alberta, Canada,, pp. 14-3-
150.
Phillips, F.M., Zreda, M.G., Smith, S.S., Elmore, D., Kubik, P.W., Dom, R.l. and Roddy,
D.J., 1991. Age and geomorphic history of Meteor Crater, Arizona, from cosmogenic
16C1 and 14 C in rock varnish. Geochimica et Cosmochimica Acta, 55: 2695-2698.
Phipps, G.C., Boyle, D.R. and Clark, I.D., 2004. Groundwater geochemistry and exploration
methods: Myra Falls volcanogenic massive-sulphide deposits, Vancouver Island,
British Columbia, Canada. Geochemistry: Exploration, Environment, Analysis, 4: 329-
340.
Piang, T.K., 1996. A study of Element dispersion, secondary mineral distribution and
weathering history at the McKinnons gold deposit, Cobar, N.S.W., Australia. Honours
Thesis, University of Canberra, Canberra, 126 pp.
Pilro, M.C. and Giblin, A.M., 2004. Application of groundwater-mineral equilibrium
calculations to geochemical exploration for sediment-hosted uranium: observation from
the Embayment, South Australia. Geochemistry: Exploration, Environment, Analysis,
4: 113-127.
Plant, J., Jeffery, K. Gill, E. and Fage, C., 1975. The systematic determination of accuracy
and precision in geochemical exploration data. Journal of Geochemical Exploration, 4:
467-486.
Plouffe, A. and Bond, J.D., 2003. Till geochemistry of the Finlayson lake (105G), Glenlyon
(105L) and east Carmacks (1151) map areas, Yukon Territory. Geological Survey of
Canada, Open file 4479: 17pp.
236

Pogson, D.J., 1982. Stratigraphy, structure and tectonics: Nymagee-Melrose, central w este rn
New South Wales. M.A.Sc. Thesis, New South Wales Institute of Technology, Sydn&y.
Pogson, D.J., 1991. Geology of the Bobadah 1; 100 000 Geological sheet, Geological Sunday
of New South Wales, Sydney.
Popov, K., 2002. Geochemical associations in Radka Ore Distric. Annual of the University o f
Mining and geology "St.Ivan Rilski", 45 part 1, Geology: 57-63.
Post, J.E., 1999. Manganese oxide minerals: crystals structures and economic a_nd
environmental significance. Proceedings of the National Academy of Science, 9 6 :
3447-3454.
Powell, C.M., 1984. Uluru and Adelaide regimes Ordovician to earliest Silurian marginal s e a
and island arc. Phanerozoic earth history of Australia. Oxford University Press., 2 9 0 -
303 pp.
Pwa, A., McQueen, K.G., Scott, K.M. and Van Moort, J.C., 1999. Regolith geochemical
exploration using acid insoluble residues as a sample medium for gold and base m etal
deposits in the Cobar region, N.S.W., Australia. Journal of Geochemical Exploration,
67: 15-31.
Pwa, A., Siegele, R. Cohen, D.R. Stelcer, E. and van Moort, J.C., 2002. Proton included X -
ray emission and proton induced gamma ray emission analysis in geochemical
exploration for gold and base metal deposits. Nuclear Instruments and Methods in
Physics Research, B190: 501-504.
Quantin, C., Becquer, T. and Berthelin, J., 2002. Mn-oxides: a major source of easily
mobilisable Co and Ni under reducing conditions in New Caledonia ferralsols. C.R.
Geoscience, 334: 273-278.
Rabemanana, V., Violette, S., Marsily, G.D., Robain, H., Deffontaines, B., Andrieux, P .,
Bensimon, M. and Parriaux, A., 2005. Origin of the high variability of water mineral
content in the bedrock aquifer of Southern Madagascar. Journal of Hydrology, 310:
143-156.
Rainbird, R.H., Nesbitt, H.W. and Donaldson, J.A., 1990. Formation and diagenesis of a sub-
Huronian saprolith: comparison with a modem weathering profile. Journal of Geology,
98: 801-822.
Ramsey, M.H., Thompson, M. and Hale, M., 1992. Objective evaluation of precision
requirements for geochemical analysis using robust analysis of variance. Journal of
Geochemical Exploration, 44: 23-36.
237

Rayner, E.O., 1961. The Peak area, Cobar mineral field, New South Wales. Technical Report
6, Department of Mines, New South Wales, 49-62 pp.
Rayner, E.O., 1969. The copper ores of the Cobar region, New South Wales, Geological
Survey New South Wales, 131 pp.
Reese, R.A., 2005. Boxplots, or box-and-whisker plots, offer simple visual summaries of
samples of data. Significance, September: 134-135.
Register of Australian Mining, 2003/2004. Resource Information Unit, 739 pp.
Reimann, C. and Filzmoser, P., 2000. Normal and lognormal data distribution in
geochemistry: death of a myth. Consequences for the statistical treatment of
geochemical and environmental data. Environmental Geology, 39: 1001-1014.
Reimann, C., Filzmoser, P. and Garrett, R.G., 2005. Background and threshold: critical
comparison of methods of determination. Science of the Total Environment., 346: 1-16.
Reinders, J., Hanesch, M. and Dearing, J.A., 2003. Statistical analysis of a multiparameter
database of Welsh topsoils and rock magnetic characterisation of pollution cluster.
Geophysical Research Abstract, 5.
Rendu, J.M., 1988. Applications in geology. In: Crow, E.L. and Shimizu, K. (Editors),
Lognormal distributions theory and applications. Marcel Dekker, INC., New York, pp.
357 -365.
Robertson, I.D.M. and Taylor, G.F., 1987. Depletion haloes in fresh rocks surrounding the
Cobar ore bodies, N.S.W., Australia: Implications for exploration and ore genesis.
Journal of Geochemical Exploration, 27: 77-101.
Rollinson, H., 1993. Using geochemical data: evaluation, presentation, interpretation.
Pearson Prentice Hall, London, 352 pp.
Rose, A.W. and Bianchi-Mosquera, G.C., 1993. Adsorption of Cu, Pb, Zn, Co, Ni and Ag on
goethite and hematite: a control on metal mobilization from red beds into stratiform
copper deposits. Economic Geology, 88: 1226-1236.
Roser, B.P., Coombs, D.S., Korsch, R.J. and Campbell, J.D., 2002. Whole-rock geochemical
variations and evolution of the arc-derived Murihiku Terrane, New Zealand. Geological
Magazine, 139: 665-685.
Roy, A., 1981. Application of cluster analysis in the interpretation of geochemical data from
the Sargilpalli lead-zinc mine area, Sundergarh district, Orissa (India). Journal of
Geochemical Exploration, 14: 245-264.
238

Roy, M., Clark, P.U., Raisbeck, G.M. and Yiou, F., 2004. Geochemical constraints on t h e
regolith hypothesis for the middle Pleistocene transition. Earth and Planetary S c ience
Letters, 227: 281-296.
Rutherford, N.F., 2000. Geochemistry in the weathered profile, Cobar, NSW, Central W ^ s t
Symposium Cobar 2000: Geology, Landscapes and Mineral Exploration. E xtended
Abstracts. CRCLEME.
Salman, S.R. and Rukah, Y.H., 1999. Multivariate and principal component statistical
analysis of contamination in urban and agricultural soils from north Jordan .
Environmental Geology, 38: 265-270.
Sato, M., 1960. Oxidation of sulfide ore bodies, 1. Geochemical environment in terms of E h
and pH. Economic Geology, 55: 928-961.
Sawyer, E.W., 1986. The influence of source rock type, chemical weathering and sorting o n
the geochemistry of clastic sediments from the Quetico Metasedimentry Belt, Superior
Province. Chemical Geology, 55: 77-95.
Scheibner, E., 1983. Suspect terranes in the Tasman Fold Belt System (Eastern Australia),
Circum- Pacific Terrane Conference, Stanford University, pp. 170-174.
Scheibner, E., 1999. The geological evolution of New South Wales-a brief review.
Geological Survey of New South Wales, Sydney, 32 pp.
Scheibner, E. and Basden, H. (Editors), 1996. Geology of New South Wales- Synthesis,
Volume 1 Structural Framework. Memoir Geology, 13. Geological survey of N ew
South Wales, 295 pp.
Schenau, S.J., Prins, M.A., De Lange, G.J. and Monnin, C., 2001. Barium accumulation in
the Arabian Sea: Controls on barite preservation in marine sediments. Geochimica et
Cosmochimica Acta, 65: 1545-1556.
Schwertmann, U. and Taylor, R.M., 1972. The influence of silicate on the transformation o f
lepidocrocite to goethite. Clay and Clay Minerals, 20: 159-164.
Scott, K.M., 1992. The geochemistry of minerals at the polymetallic Wagga Tank deposit.
CSIRO, Report No.344R, pp.
Scott, K.M., 2002. Behaviour of geochemical pathfinder elements during weathering and
pedogenesis in SE Australia. Transactions of the 17th World Congress of Soil Science,
Thailand,, pp. 11.
Scott, K.M., Rabone, G. and Chaffee, M.A., 1991. Weathering and its effect upon
geochemical dispersion at the polymetallic Wagga Tank deposit, N.S.W., Australia.
Journal of Geochemical Exploration, 40: 413-426.
239

Scott, K.M. and Taylor, G.F., 1989. Weathering of pyritic and pyrrhotitic ore on 1 drill le'-vel
and above, Elura Zn-Pb-Ag orebody, N. S. W., CSIRO, Report no. 55R, pp.
Shen, X.C., Dunlop, A.C. and Cohen, D.R., 1998. Geochemical dispersion in residual a_nd
transported regolith along drainage systems near the CSA mine, Cobar, New S o u th
Wales. In: Taylor, G. and Pain, C. (Editors), Regolith 98 Australian regolith a_nd
mineral exploration: new approaches to an old continent. CRCLEME, Kalgoorlie, W A ,
pp. 263-270.
Shields, P., 1996. Geology of the Girilambone Copper deposit. In: Cook W. G., Ford A .J.H .,
McDermott, J.J., Standish, P.N., Stegman, C.L. and Stegman, T.M. (Editors), T h e
Cobar Mineral Field - a 1996 perspective. Australasian Institute of Mining a n d
Metallurgy, Melbourne, pp. 293-304.
Shimmield, G.B. and Mowbray, S.R., 1991. The inorganic geochemical record of th e
northwest Arabian Sea: A history of productivity variation over the last 400 ka fro m
Sites 722 and 724. Proceedings of Ocean Drilling Program Science Results, 117: 4 0 9 -
429.
Sokal, R.R. and Sneath, P.H.A., 1963. Principles of numerical taxonomy. Freeman, S an
Francisco, 359 pp.
Staufer, R.E., 1990. Granite weathering and the sensitivity of alpine lakes to acid deposition.
Limnol. Oceanogr., 35: 1112-1134.
Stegman, C.L. and Pocock, J.A., 1996. The Cobar gold field- a geological perspective. In:
Cook W. G., Ford, A.J.H., McDermott, J.J., Standish, P.N., Stegman, C.L. and
Stegman, T.M. (Editors), The Cobar Mineral Field -A 1996 Perspective. Australasian
Institute of Mining and Metallurgy, Melbourne, pp. 229-264.
Stegman, C.L. and Stegman, T., 1996. The history of mining in the Cobar field. In: Cook W .
G., Ford, A.J.H., McDermott, J.J., Standish, P.N., Stegman, C.L. and Stegman, T.M.
(Editors), The Cobar Mineral Field - a 1996 perspective. Australasian Institute o f
Mining and Metallurgy, Melbourne, pp. 3-39.
Stumm, W. and Morgan, J.J., 1981. Aquatic Chemistry. Wiley, New York, 780 pp.
Sun, Y. and Seccombe, P.K., 2000. Fluid evolution and stable isotope constraints on
component sources at the Elura deposit, Cobar. In: McQueen, K.G. and Stegman, C.L.
(Editors), Central West Symposium Cobar, Extended abstracts. CSIRO, Perth, WA, pp.
117-121.
240

Suppel, D.W. and Gilligan, L.B., 1993. Nymagee 1:250 000 Metallogenic map SI/55 -2 :
Metallogenic study and mineral deposits data sheet. Geological Survey of New S o u th
Wales, Sydney.
SWDIV and EFAWEST, 1998. Procedural guidance for statistically analyzing environmental
background data. Naval facilities engineering command, 56 pp.
Tan, W.F., Liu, F., Li, Y.H., Hu, H.Q. and Huang, Q.Y., 2006. Elemental composition a n d
geochemical characteristics of iron-manganese nodules in main soils of C h ina .
Pedosphere, 16: 72-81.
Tate, S.E., 2003. Characterisation of aeolian materials in the Girilambone region, n o r th -
western Lachlan Fold Belt, NSW. Honours Thesis, Australian National University, 2 0 8
pp.
Taylor, G. and Eggleton, R.A., 2001. Regolith geology and geomorphology. John Wiley &
Sons, Chichester, 375 pp.
Taylor, G. and Butt, C.R.M., 1998. The Australian regolith and mineral exploration. A G SO
Journal of Australian Geology & Geophysics, 17: 55-67.
Taylor, G. and Ruxton, B.P., 1987. A duricrust catena in south-east Australia. Zeitschrift fu r
Geomorphologie, 31: 385-410.
Taylor, G. and Shirtliff, G., 2003. Weathering: cyclical or continuous? An Australian
perspective. Australian Journal of Earth Sciences, 50: 1-9.
Taylor, G.F., Wilmshurst, J.R., Togashi, Y. and Andrew, A.S., 1984. Geochemical and
mineralogical haloes about the Elura Zn- Pb-Ag orebody, western New South Wales.
Journal of Geochemical Exploration, 22: 265-290.
Taylor, J.H., Smith, E.J., Davison, W. and Sugiyama, M., 2005. Resolving and modeling the
effects of Fe and Mn redox cycling on trace metal behavior in a seasonally anoxic lake.
Geochimica et Cosmochimica Acta, 69: 1947-1960.
Taylor, R.M., 1968. The association of manganese and cobalt in soils-further observations.
Journal of Soil Sciences, 19: 77-80.
Taylor, R.M., McKenzie, R.M., Fordham, A.W. and Gilman, G.P., 1983. Oxide minerals, In:
Soil: an Australian viewpoint. Division of Soils, CSIRO, Melbourne.
Taylor, S.R. and McLennan, S.M., 1985. The Continental Crust: its composition and
evolution. Oxford '.Blackwell Scientific, 312 pp.
Thamdrup, B., 2000. Bacterial manganese and iron reduction in aquatic sediments. Advances
in Microbial Ecology, 16: 41-48.
241

Thomas, J.M., Welch, A.H. and Preissler, A.M., 1989. Geochemical evolution of
groundwater in Smith Creek Valley- a hydrologically closed basin in Central N evada ,
USA. Applied Geochemistry, 4: 493-510.
Thompson, M., 1983. Control procedures in geochemical analysis. In: Howarth, R.J. (E d ito r),
Statistics and data analysis in geochemical prospecting. Elsevier, Amsterdam, pp. 3 9 -
58.
Thompson, M., 1992. data quality in applied geochemistry: the requirements, and how to
achieve them. Journal of Geochemical Exploration, 44: 3-22.
Thompson, M. and Howarth, R.J., 1978. A new approach to the estimation of analytical
precision. Journal of Geochemical Exploration, 9: 23-3-.
Thomber, M.R., 1985. Supergene alteration of sulphides.vii. Distribution of elements during
the gossan-forming process. Chemical Geology, 53: 270-301.
Tonuie, E., Caritat, P. and Leyh, W., 2003. Geochemical signature of mineralization in
weathered sediments and bedrock, Thunderdome prospect, Broken Hill region, w estern
New South Wales, Australia: implications for mineral exploration under cover.
Geochemistry: Exploration, Environment, Analysis, 3: 263-280.
Torgeson, T., Habermehl, M.A., Phillips, F.M., Elmore, D., Kubik, P., Geoffrey-Jones, B .,
Hemmick, T. and Gove, H.E., 1991. Chlorine 36 dating of very old groundwater?
Further studies in the Great Artesian Basin, Australia. Water Resources Research, 27:
3201-3213.
Torrey, C. and White, P.D., 2004. The Pipeline Ridge discovery. In: McQueen, K.G. and
Scott, K.M. (Editors), Exploration field workshop Cobar region 2004. CRCLEME, pp.
101-104.
Tritton Resources Limited, 2003. Overview of the Tritton assets.
Tukey, J.M., 1977. Exploratory data analysis. Behavioral science: Quantitative methods.
Addison-Wesley, Reading, 688 pp.
Vandenberg, A.H.M. and Stewart, I.R., 1992. Ordovician terranes of the southeastern
Lachlan Fold Belt : stratigraphy, structure and paleogeographic reconstruction.
Tectonophysics, 214: 159-176.
Vaniman, D.T., Chipera, S.J., Bish, D.L., Duff, M.C. and Hunter, D.B., 2002. Crystal
chemistry of clay-Mn oxides associations in soils, fractures, and matrix of the Bandelier
Tuff Pajarito Mesa, New Mexico. Geochimica et Cosmochimica Acta, 66: 1349-1374.
Ward, J.H., 1963. Hierarchical grouping to optimize an objective function. Journal of the
American Statistical Association, 58: 236-244.
242
Whitbread, 2004. Lithogeochemical alteration around the Century and Elura Zn-F*b-
Ag deposits: detecting alteration expressions in deep and near surface environm ents.
Ph.D. Thesis, University of Canberra, 330 pp.
Whitbread, M.A. and Moore, C.L., 2004. Two lithogeochemical approaches to t h e
identification of alteration patterns at the Elura Zn-Pb-Ag deposit, Cobar, New S o u th
Wales, Australia: use of Pearce Element Ratio analysis and Isocon analysis.
Geochemistry: Exploration, Environment, Analysis, 4: 129-141.
White, D.E., Hem, J.D. and Waring, G.A., 1963. Chemical composition of subsurface w aters,
U.S. Geological Survey Professional Paper 440-F, 67 pp.
White, G.N. and Dixon, J.B., 1996. Iron and manganese distribution in nodules from a young
Texas vertisol. Soil Sei. Soc. Am. J., 60: 1254-1262.
Whitford, D.J., Andrew, A.S., Carr, G.R. and Giblin, A.M., 1998. Application of iso tope
studies of Australian groundwater to mineral exploration: The Abra Prospect, w estern
Australia. In: Arehart, G.B. and Hulston, J.R. (Editors), Proceeding of the 9 th
International Symposium on Water- Rock Interaction, pp. 583-586.
Whiticar, M.J. and Harris, S.A., 2000. Compound Specific Isotope Correlation
(CSIC):Biogeochemical Fingerprints of Organic Compounds. GeoCanada: 1-4.
Wischusen, J.D.H., Fifield, L.K. and Cresswell, R.G., 2004. Hydrogeology of Palm Valley,
central Australia; a Pleistocene flora refuge? Journal of Hydrology, 293: 20-46.
Wolfgang, C.A. and White, I., 2000. Pilliga Sandstone hydrogeochemistry, Great Artesian
Basin, Australia, Proceedings of the IAH Congress on Groundwater, vol 30, pp 683-
687.
Wright, V.P. and Tucker, M.E., 1991. Calcretes: an introduction. In: Wright, V.P. and
Tucker, M.E. (Editors), Calcrete. International Association of Sedimentologists Reprint
Series 2, pp. 1-22.
Wybom, D. and Chappell, B.W., 1986. The petrogenetic significance of chemically related
plutonic and volcanic rock units. Geological Magazine, 123: 619-628.
Yarincik, K.M., Murray, R.W. and Peterson, L.C., 2000. Climatically sensitive eolian and
hemipelagic deposition in the Cariaco Basin,Venezuela, over the past 578,000 years:
Results from Al/Ti and K/Al. Paleoceanography, 15: 210-228.
Young, C.J., Merchant, B.J. and Aster, C., 2001. Comparison of cluster analysis methods for
identifying regional events. 23rd Seismic Research review: Worldwide Monitoring of
Nuclear Explosions: 229-238.
243

Yu, K.C., Tsai, L.J., Chen, S.H. and Ho, S.T., 2001. Correlation analysis on binding b eh av io r
of heavy metals with sediment matrices. Water Research, 35: 2417-2428.
Zabel, M., Schneider, R.R., Wagner, T., Adegbie, A.T., Vries, U. and Kolonie, S., 2001. L a te
Quaternary climate changes in Central Africa as inferred from terrigenous input to t h e
Niger Fan. Quaternary Research, 56: 207-217.
Zaidelman, F.R. and Nikiforova, A.S., 1998. Manganese-iron concentration in soils and th e i r
change under the effect of gleyification on parent materials of different genesis.
Euasian Soil Sei., 31: 817-825.
Zhang, C. and Lalor, G., 2003. Multivariate relationships and spatial distribution o f
geochemical features of soils in Jamaica. Chemical Speciation and Bioavailability, 1 4 :
57 -65.
Zhang, L., Sun, M., Wang, S. and Yu, X., 1998. The composition of shale from the O rdos
basin, China: effects of sources weathering and diagenesis. Sedimentary Geology, 116:
129-141.
Zhou, W. and Maerz, N.H., 2001. Multi variate clustering analysis of discontinuity data;
Implementation and applications, Rock mechanics in the national interest; Proceeding
of the 38th U.S. rock mechanics symposium, Washington, D.C., pp. 861-868.
244
APPENDICES
The attached CD includes a digital copy for all the appendices. These appendices are:
Appendix 1: Includes the data of ICP multi acid digestion analysis for the regolith of
the Byrock, Sussex and Hermidale areas in the Girilambone region.
Appendix 2: Includes the data of ICP and XRF analysis for bottom of the hole
samples in the Girilambone region.
Appendix 3: Includes the data of geochemical analysis of groundwater in the Byrock
and Hermidale areas.
Appendix 4: Includes the data of XRD analysis data for selective samples from the
calcrete bearing, Mn- and Fe- enriched zones in the regolith of the
Girilambone region.
Appendix 5: Includes standard, blanks, replicates and duplicates data.
Appendix 6: Includes the data of saturation indices for minerals as calculated from the
groundwaters.
Appendix 7: Includes all the regolith facies and the anomaly table of pathfinders
Appendix 8: Includes the probability P-P diagram for the important elements (i.e., As, Au, Cu, Co, Cr, Ni, Pb, Zn) in all the studied facies (i.e., clay-enriched, carbonate-enriched, iron-enriched and manganese-enriched) of the top metre, transported and in situ regolith in the study area.
245