Monsoon Wind Power Project, Sekong and Attapue Provinces ...

1 23
Environmental Science and PollutionResearch ISSN 0944-1344 Environ Sci Pollut ResDOI 10.1007/s11356-013-2462-7
Geochemical behaviour of dissolved traceelements in a monsoon-dominated tropicalriver basin, Southwestern India
G. P. Gurumurthy, K. Balakrishna,M. Tripti, Stéphane Audry, Jean Riotte,J. J. Braun & H. N. Udaya Shankar

1 23
Your article is protected by copyright and
all rights are held exclusively by Springer-
Verlag Berlin Heidelberg. This e-offprint is
for personal use only and shall not be self-
archived in electronic repositories. If you wish
to self-archive your article, please use the
accepted manuscript version for posting on
your own website. You may further deposit
the accepted manuscript version in any
repository, provided it is only made publicly
available 12 months after official publication
or later and provided acknowledgement is
given to the original source of publication
and a link is inserted to the published article
on Springer's website. The link must be
accompanied by the following text: "The final
publication is available at link.springer.com”.
RESEARCH ARTICLE
Geochemical behaviour of dissolved trace elementsin a monsoon-dominated tropical river basin,Southwestern India
G. P. Gurumurthy & K. Balakrishna & M. Tripti &Stéphane Audry & Jean Riotte & J. J. Braun &
H. N. Udaya Shankar
Received: 21 August 2013 /Accepted: 13 December 2013# Springer-Verlag Berlin Heidelberg 2013
Abstract The study presents a 3-year time series data ondissolved trace elements and rare earth elements (REEs) in amonsoon-dominated river basin, the Nethravati River in trop-ical Southwestern India. The river basin lies on the metamor-phic transition boundary which separates the PeninsularGneiss and Southern Granulitic province belonging to Arche-an and Tertiary–Quaternary period (Western Dharwar Craton).The basin lithology is mainly composed of granite gneiss,charnockite and metasediment. This study highlights the im-portance of time series data for better estimation of metalfluxes and to understand the geochemical behaviour of metalsin a river basin. The dissolved trace elements show seasonalityin the river water metal concentrations forming two distinctgroups of metals. First group is composed of heavy metals andminor elements that show higher concentrations during dryseason and lesser concentrations during the monsoon season.Second group is composed of metals belonging to lanthanidesand actinides with higher concentration in the monsoon and
lower concentrations during the dry season. Although themetal concentration of both the groups appears to be con-trolled by the discharge, there are important biogeochemicalprocesses affecting their concentration. This includes redoxreactions (for Fe, Mn, As, Mo, Ba and Ce) and pH-mediatedadsorption/desorption reactions (for Ni, Co, Cr, Cu andREEs). The abundance of Fe and Mn oxyhydroxides as aresult of redox processes could be driving the geochemicalredistribution of metals in the river water. There is a Ceanomaly (Ce/Ce*) at different time periods, both negativeand positive, in case of dissolved phase, whereas there ispositive anomaly in the particulate and bed sediments. TheCe anomaly correlates with the variations in the dissolvedoxygen indicating the redistribution of Ce between particulateand dissolved phase under acidic to neutral pH and lowerconcentrations of dissolved organic carbon. Unlike other trop-ical and major world rivers, the effect of organic complexationonmetal variability is negligible in the Nethravati River water.
Keywords Nethravati–Gurupur Rivers . Dissolved traceelements . REEs . Redox processes . Sorption reaction .
Tropical river . Cerium anomaly
Introduction
The geochemical studies of dissolved trace elements haveattracted scientific attention due to their non-degradabilityand bioaccumulation in the environment. Trace elements,dissolved or particulate, present in the hydrological systemcould be derived either from natural or anthropogenic sources.The biogeochemical processes in the aquatic system controlthe solubility, bioavailability, toxicity and ultimate fate of tracemetals through their discharge into the open oceans. Thesebiogeochemical processes include biological uptake, organic/
Responsible editor: Céline Guéguen
G. P. GurumurthyManipal Centre for Natural Sciences, Manipal University,Manipal 576104, India
K. Balakrishna (*) :M. Tripti :H. N. Udaya ShankarDepartment of Civil Engineering,Manipal Institute of Technology, Manipal University,Manipal 576104, Indiae-mail: [email protected]
S. Audry : J. Riotte : J. J. BraunGET UMR 5563, Université Paul Sabatier,IRD and CNRS, 14, avenue E. Belin, 31400 Toulouse, France
J. Riotte : J. J. BraunIndo-French Cell for Water Sciences, Joint IRD-IISc Laboratory,Indian Institute of Science, Bangalore 560012, India
Environ Sci Pollut ResDOI 10.1007/s11356-013-2462-7
Author's personal copy
inorganic complexation, precipitation, sorption and redox re-actions (Shiller et al. 1997; Morford and Emerson 1999; Lionet al. 1982; van den Berg et al. 1987; Froelich et al. 1979).These biogeochemical processes often determine the conser-vative–nonconservative behaviour of metals and their resi-dence time in the fluvial system. An understanding of biogeo-chemical processes that control trace element concentration indifferent river systems is required to understand the geochem-ical mass balance, the partitioning of trace elements betweenthe particulate and dissolved phases and their residence timein the open ocean.
Most of the available data on dissolved trace elementconcentrations focus either on human-affected systems ofindustrialised countries or major rivers of the world. Also,the reported metal flux estimates are based on single sampling(Gaillardet et al. 2003) with high uncertainties. Consideringthe variability of trace elements with seasons (Shiller 1997,2002, 2010) and their diel cycles (Nimick et al. 2003, 2005,2010), precise flux estimation requires time series elementalconcentrations.
This paper presents time series (3-year monitoring on amonthly basis) of dissolved trace element and rare earthelement (REE) concentrations on a monsoon-dominated hu-mid tropical river, the Nethravati–Gurupur basin. In spite ofrapid industrial and population growth in the Indian subcon-tinent, there are very limited geochemical datasets on dis-solved (Ajmal et al. 1985; Rengarajan and Sarin 2004; Triptiet al. 2013a) and particulate trace metal (Ramesh et al. 1990;Chakrapani and Subramanian 1996; Stummeyer et al. 2002)chemistry of the river basins. Most of these studies are eitherrestricted to urban stretch of a river or based on few heavy
metals. With this background, the present research is taken upto meet the following objectives: (a) to generate time seriesdissolved trace element dataset of the surface waters draininggranite gneissic terrain, which happens to be first on theNethravati–Gurupur River basin, (b) to understand the bio-geochemical processes and associated elemental redistributionin a monsoon-dominated humid tropical river basin and (c) tounderstand the temporal variability of trace element and REEconcentrations in the river basin. A smaller catchmentwith lesser heterogeneity in the lithology provides betterinsights on the geochemical parameters controlling theconcentration variability.
Materials and methodology
Study area
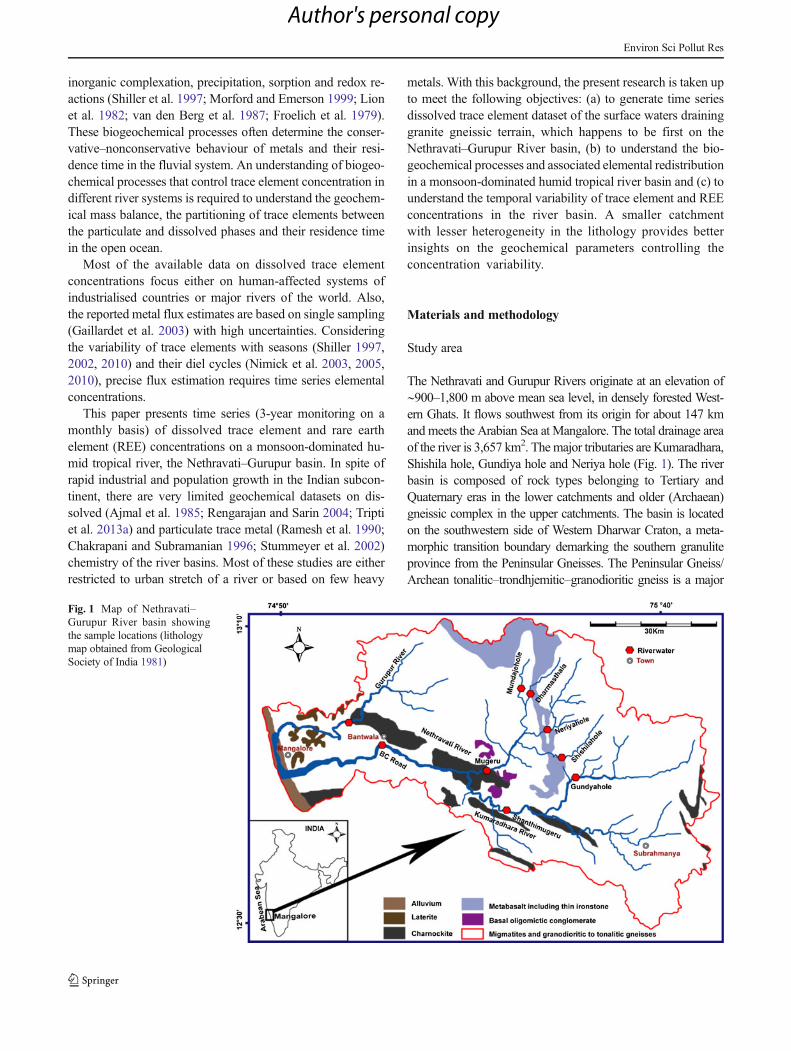
The Nethravati and Gurupur Rivers originate at an elevation of∼900–1,800 m above mean sea level, in densely forested West-ern Ghats. It flows southwest from its origin for about 147 kmand meets the Arabian Sea at Mangalore. The total drainage areaof the river is 3,657 km2. Themajor tributaries are Kumaradhara,Shishila hole, Gundiya hole and Neriya hole (Fig. 1). The riverbasin is composed of rock types belonging to Tertiary andQuaternary eras in the lower catchments and older (Archaean)gneissic complex in the upper catchments. The basin is locatedon the southwestern side of Western Dharwar Craton, a meta-morphic transition boundary demarking the southern granuliteprovince from the Peninsular Gneisses. The Peninsular Gneiss/Archean tonalitic–trondhjemitic–granodioritic gneiss is a major
Fig. 1 Map of Nethravati–Gurupur River basin showingthe sample locations (lithologymap obtained from GeologicalSociety of India 1981)
Environ Sci Pollut Res
Author's personal copy
litho unit with an age of 3.3 to 3.4 Ga (Bhaskar Rao et al. 1991).The greenstone–amphibolitic facies metamorphic rocks andgranulites could be seen in patches. The basin is lithologicallycomposed of about 83 % migmatites and granodiorites, 6 %metasediments, 5 % charnockites and 2 % laterites and amphib-olites (Fig. 1). The bedrock weathering process in theNethravati–Gurupur River basin is intense and is induced bywarm temperature and higher surface runoff. Silicate weatheringis dominating in the area because of the nature of the bedrock.The weathering of primary minerals leads to kaolinite to gibbsitesecondary mineral formation in the soil profiles (Gurumurthyet al. 2012). The discharge of Nethravati River together withGurupur River accounts for 8 % of the total water discharge ofwest-flowing rivers of Peninsular India (Rao 1979; Subramanianet al. 1987) to the Arabian Sea. The Nethravati and GurupurRiver flow depends on seasons; about 93% of the total dischargeis between June and October (southwest monsoon). The dis-charge during the lean flow season could be contributed by the
groundwater. The discharge variation is quite similar in all thefour gauging stations (Fig. 2a) of the Nethravati–Gurupur basin.Therefore, in the following discussion, the discharge data fromstationMugeru, where the discharge data is available throughoutthe year, is used to compare the temporal variation of metals inthe river water. The river carries huge amount of sediments fromthe forested regions of Western Ghats during the rainy season.While the sediment transport during the base flow season is quitenegligible, average annual sediment discharge from NethravatiRiver at Bantwala station is 1.25×10⁶ t (Dwarakish et al. 2009).
Sampling and analysis
The surface water samples were collected from the centre ofthe river in 1 L polypropylene bottles for dissolved tracemetal, major ion and dissolved organic carbon (DOC) mea-surement. The water samples were collected over a period of3 years between 2006 (from October 2006 to September
Oct
-06
Nov
-06
Dec
-06
Jan-
07F
eb-0
7M
ar-0
7A
pr-0
7M
ay-0
7Ju
n-07
Jul-0
7A
ug-0
7S
ep-0
7Ja
n-09
Feb
-09
Mar
-09
Apr
-09
May
-09
Jun-
09Ju
l-09
Aug
-09
Sep
-09
Oct
-09
Nov
-09
Dec
-09
Jan-
10F
eb-1
0M
ar-1
0A
pr-1
0M
ay-1
0Ju
n-10
Jul-1
0A
ug-1
0S
ep-1
0O
ct-1
0N
ov-1
0D
ec-1
0
Dis
char
ge (
m3 s
ec-1
)
0
1000
2000
3000
4000
BC Road, BantwalaMugeru, Nethravati riverShanthimugeru, Kumaradhara RiverAdoor, Gurupur River
(a)
Oct
-06
Nov
-06
Dec
-06
Jan-
07F
eb-0
7M
ar-0
7A
pr-0
7M
ay-0
7Ju
n-07
Jul-0
7A
ug-0
7S
ep-0
7Ja
n-09
Feb
-09
Mar
-09
Apr
-09
May
-09
Jun-
09Ju
l-09
Aug
-09
Sep
-09
Oct
-09
Nov
-09
Dec
-09
Jan-
10F
eb-1
0M
ar-1
0A
pr-1
0M
ay-1
0Ju
n-10
Jul-1
0A
ug-1
0S
ep-1
0O
ct-1
0N
ov-1
0D
ec-1
0
Dis
char
ge
(m
3 se
c-1)
0
200
400
600
800
1000
1200
1400
1600
pH
, DO
an
d D
OC
0
2
4
6
8
10
QpH
DO (mg L-1)
DOC (mg l-1)
(b)
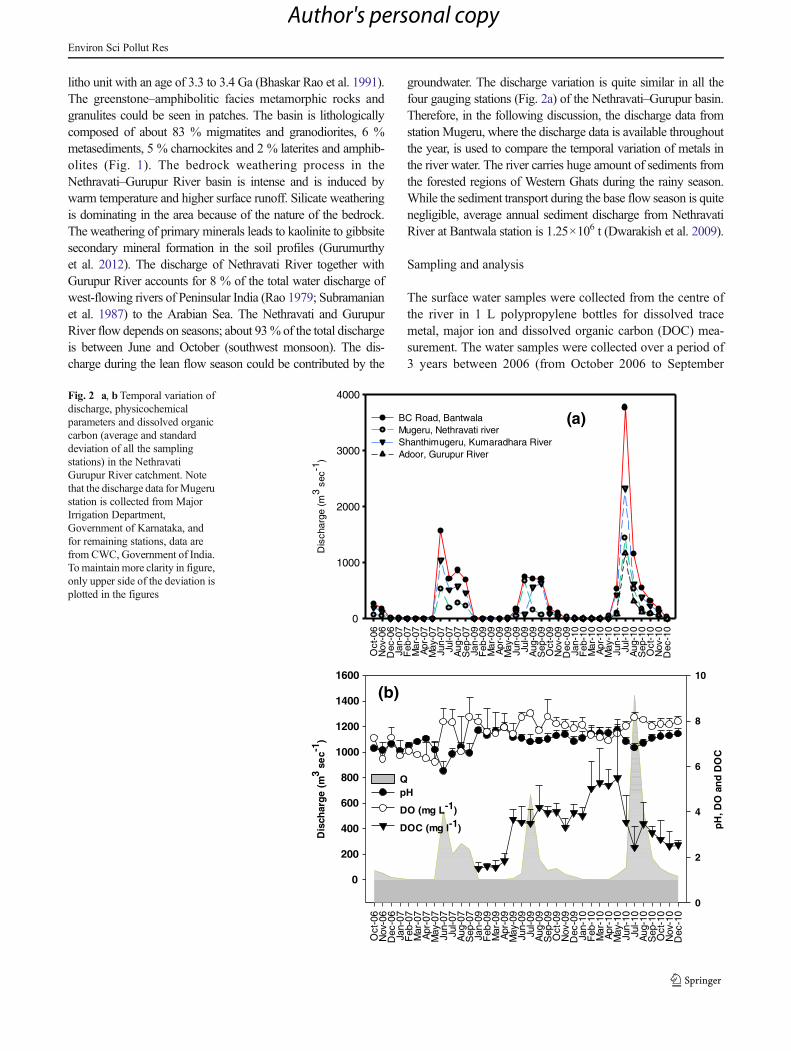
Fig. 2 a, b Temporal variation ofdischarge, physicochemicalparameters and dissolved organiccarbon (average and standarddeviation of all the samplingstations) in the NethravatiGurupur River catchment. Notethat the discharge data forMugerustation is collected from MajorIrrigation Department,Government of Karnataka, andfor remaining stations, data arefrom CWC, Government of India.Tomaintainmore clarity in figure,only upper side of the deviation isplotted in the figures
Environ Sci Pollut Res
Author's personal copy
2007) and 2011 (January 2009 to December 2010), everymonth. Five water samples were collected from the NethravatiRiver and its tributaries between October 2006 and September2007, while eight water samples were collected fromNethravati and Gurupur Rivers between January 2009 andDecember 2010. Onsite parameters such as pH, electricalconductivity (EC) and dissolved oxygen (DO) were recordedduring sample collection using HACH® multiparameter ap-paratus connected to probes. Samples were immediately fil-tered through 0.22-μm pore size polycarbonate filters(Nuclepore), fitted in a Sartorius polycarbonate filter holderoperated through Mytivac hand vacuum pump. Filtration wascarried out under HEPA-filtered laminar flow bench. The first100 mL of the filtration was systematically discarded to cleanthe membrane and filtration apparatus. Filtered solutions forcations and trace element measurements were acidified withdouble-distilled HNO3 to pH<2 and stored in pre-cleanedpolypropylene bottles until analysis. The samples for DOCwere acidified with ultrapure HNO3.
The river particulate samples were collected from the mainstream of river Nethravati during the southwest monsoonperiod. The particulate concentration during non-monsoonalperiod was negligible and hence samples were not collected.Five samples each were collected during August and Septem-ber 2009 sampling campaign, while three samples each werecollected during the July and August 2010 sampling cam-paign. Five litres of turbid water was collected in a polypro-pylene container and transported to the laboratory. In thelaboratory, samples were filtered as described for dis-solved metals. The residue left over the filter was thenwashed with a jet of filtered water (same sample) to acentrifuge tube. The residue was then centrifuged usingREMI make centrifuge at 4,000 rpm to separate theparticulates from the water. The centrifuge tubes werethen dried at 60 °C in hot air oven until completedryness. The dried samples were then weighed to obtainthe final weight of the suspended particulate matter(SPM). The SPM was preserved for further processingand analysis.
Bed sediment samples were collected from the river chan-nel during the months of April 2010 and December 2010. Fivesamples (about 2 kg) were collected in each sampling seasoneither from the middle of the river (in most of the stations) orfew metres away from the bank using polythene scoop andtransferred to a polythene bag and tied using rubber band. Thebed sediments were wet sieved using a 63-μm (240mesh size)nylon sieve (supplied by Coleparmers®). The fine fraction(<63 μm) was allowed to settle in Teflon/polypropylene con-tainers for 2–3 days and dried at 60 °C until complete dryness.Utmost care was taken to avoid metal contact during thesample handling (sieving and powdering). The dried samplewas finely powdered using an agate mortar and pestle andstored in polythene bags for further processing.
The acid digestion was carried out in a clean room througha microwave digesting system (Mars 5, CEM make) atGeosciences Environnement Toulouse (GET), France. Allthe acid reagents used during the digestion and subsequentdilution were ultrapure (HF, HCl) and double-distilled(HNO3) grade. About 100 mg of finely powdered sediment/suspended sediment samples was acid digested using a mix-ture of nitric acid, hydrochloric acid and hydrofluoric acid. Amodified EPA 3052 protocol has been applied to digest thesolid samples.
Analytical methods
The major anion concentrations were measured through ionchromatography (Dionex® ICS-90 and ICS-1100) at Indo-French Cell for Water Sciences, Indian Institute of Science,Bangalore and GET, France. The cation concentrations weremeasured through Horiba Jobin Yvon Ultima-2 inductivelycoupled plasma-atomic emission spectrometer at GET. Theaccuracy of measurement was within 3 % of certified refer-ence values (ION-915 and Rain 97). The DOC concentrationswere measured through total organic carbon analyser at GET.The precision of measurement was better than 3 %. Traceelement concentrations in water samples were measured usinga quadrupole ICP-MS 7500ce (Agilent Technologies). Ana-lytical drift was controlled and calibrated by an internal Re-Instandard. Corrections for oxide and hydroxide isobaric
Table 1 The measured and certified values for the reference material(SLRS-5)
Certified referencematerial SLRS-5
Certified value(μg L−1)
Average measuredvalues (μg L−1)
Error in% (±)
Al 49.5±5.0 47.555 3.9
Sb 0.3 0.27695 7.7
As 0.413±0.039 0.3836 7.1
Ba 14.0±0.5 13.995 0.0
Be 0.005 0.01 0.0
Co 0.05 0.0559 11.8
Cu 17.4±1.3 17.315 0.5
Fe 91.2±5.8 88.33 3.1
Mn 4.33±0.18 4.211 19.4
Mo 0.27 0.21755 11.6
Ni 0.476±0.064 0.5311 4.0
Sr 53.6±1.3 51.435 18.1
U 0.1 0.07615 4.8
Zn 0.845±0.095 1.05 0.8
Ca 8.45±0.095 8.3815 7.5
Mg 2.54±0.16 2.731 9.4
K 0.839±0.036 0.9178 1.1
Na 5.38±0.10 5.321 3.9
Environ Sci Pollut Res
Author's personal copy
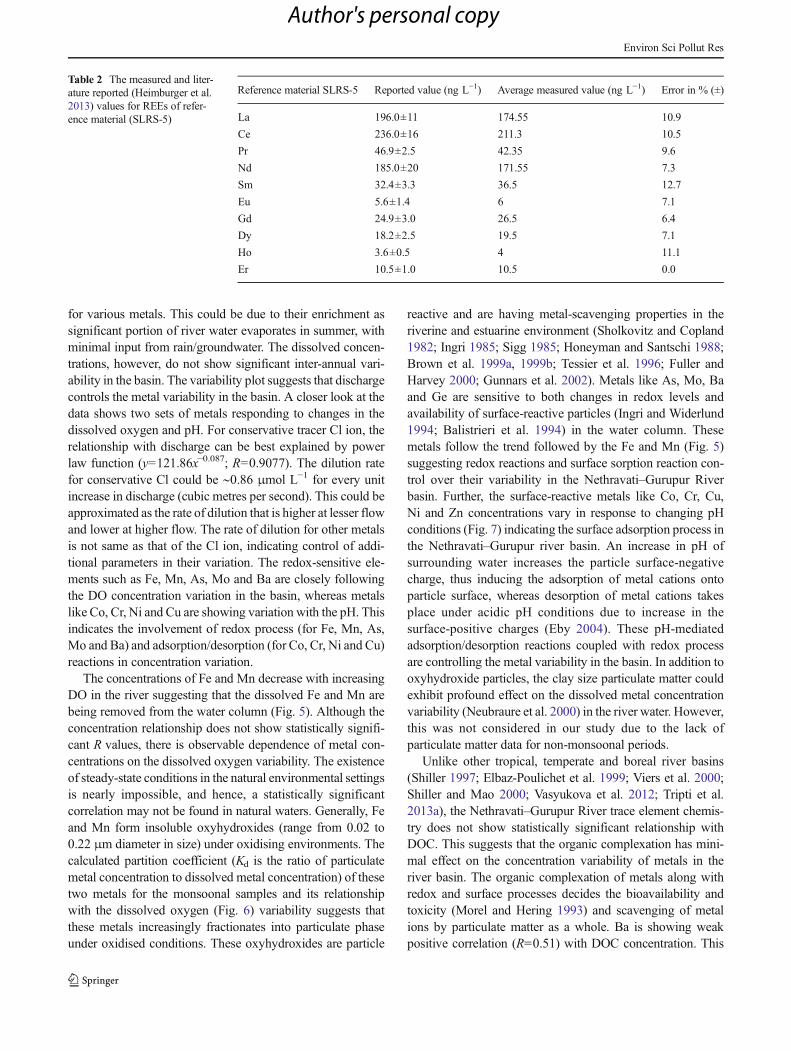
interferences were made for the REE (Aries et al. 2000). Theanalytical methods employed were quality checked by repeat-ed measurement of certified international reference water(SLRS-5). The certified and measurement values of SLRS-5are presented in Table 1, and the measurements were within10 % of the certified values for most of the metals and theanalytical error (relative standard deviation) was less than 5 %for concentrations ten times higher than the detection limits.The measured concentrations of REE in SLRS-5 are in goodagreement (better than 13 %) with the values proposed byHeimburger et al. (2013) in their inter-laboratory calibrationstudy (Table 2). In case of bed sediments and suspendedparticulates, certified international reference sediment (SRM1646a) was used to validate the results. The measurementswere within 5% of the certified values, and the analytical error
(relative standard deviation) was within 5 % for concentra-tions ten times higher than the detection limits.
Calculation of discharge-weighted concentrationsand elemental fluxes
Data for daily water discharge of Nethravati–GurpurRivers were collected from Central Water Commission(CWC), Government of India and Karnataka State Irri-gation Department, Government of Karnataka. The dis-charge data at BC Road, Bantwala was considered forNethravati River and discharge data at Adoor was consid-ered for Gurupur River because of their proximity to the rivermouth. Discharge-weighted elemental concentration was cal-culated using the following formula:
Weighted mean concentration mg L−1� � ¼ C mg L−1� �� �Q m3s−1� �
= ∑Q m3s−1� ��� �
where Q is discharge and C is concentration.The fluxes of chemical elements were calculated using the
formula below:
Specific flux tons km2 year−1� � ¼ Q m3s−1
� �� �C mg L−1� �� �
= A½ �
where Q is discharge, C is discharge-weighted mean concen-tration and A is surface area of the basin.
Results and discussions
Variation in physicochemical parameters, DOC, dissolvedtrace elements and REEs
The pH of river water is mildly acidic to mildly alkaline withan average of 7.2. The pH of river water was observed to belesser at higher discharge and vice versa (Fig. 2b). A drop inpH during monsoon could be due to weathering of acidicigneous basement rocks in the catchment and acidic pH rain-water input. The DO concentrations in the river water followthe discharge trend, i.e. higher during monsoonal months andlesser during non-monsoon months (Fig. 2b). The major ionconcentrations show inverse relationship with discharge sug-gesting monsoonal dilution. Like any other tropical riverbasin, the discharge and major ion concentration relationshipcan be explained by power law reduction equation (Probstet al. 1992). The concentrations of DOC were increasingduring non-monsoonal months, while there is a drop in theconcentrations during monsoon (Fig. 2b). In spite of havingthick vegetation in the basin, the river DOC concentrations inboth seasons are relatively lesser than other tropical river
basins of Africa (Viers et al. 2000; Braun et al. 2005) andSouth America (Dupré et al. 1999). The reason for low DOCin the study area could be due to rapid oxidation of organicmatter in the dominant red/lateritic soil basement under warmtemperature and higher humidity (Jenkinson et al. 1991;Kirschbaum 1995; Trumbore et al. 1996; Cao andWoodward 1998). This interpretation is supported by a studycarried out on the soils of Karnataka, particularly in theMangalore region, having lower soil organic carbon(26.2 to 38.0 mg kg−1 of water-soluble carbon in the0–15-cm soil depth; Sudhir et al. 2006) compared to theworld river basins and other Indian River basins (Ludwiget al. 1996). Unlike major elements and trace elements,the dissolved organic carbon composition shows inter-annual variation in the basin. DOC was observed to belesser during 2009 dry season while higher during 2010dry season. In monsoon of both 2009 and 2010, the riverDOC concentration was at moderate. This variation couldbe explained by variations in the in situ primary produc-tivity in the river as observed in the previous study onstable carbon isotope (Tripti et al. 2013b).
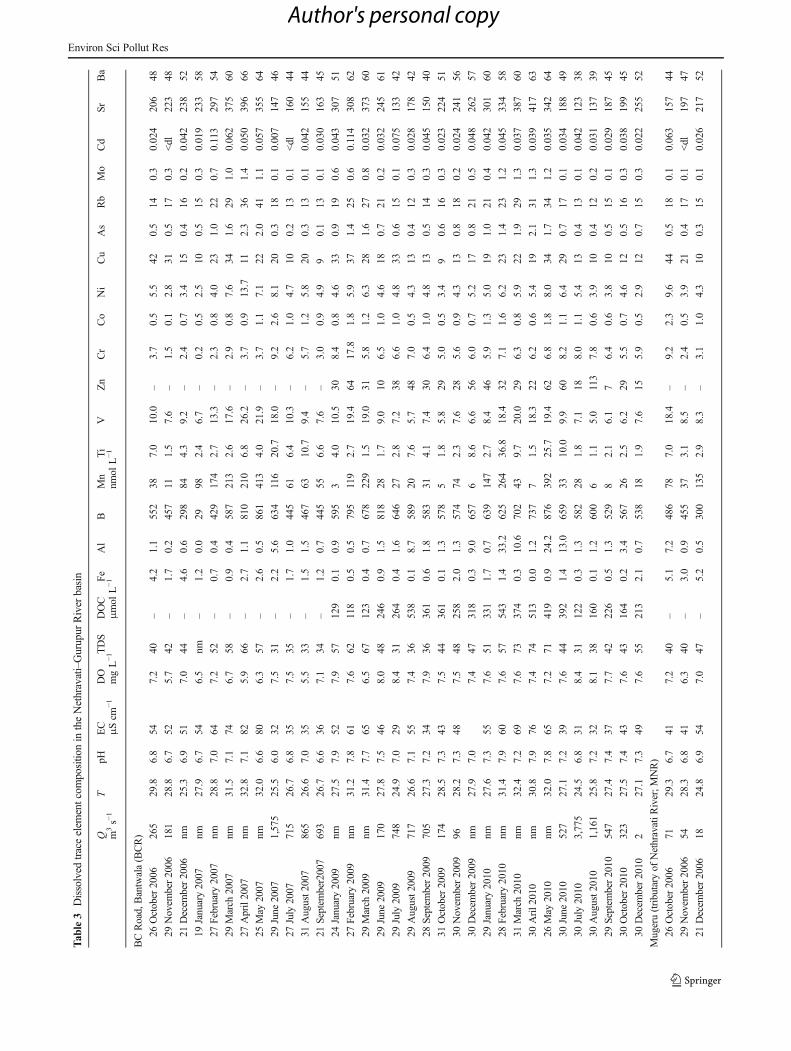
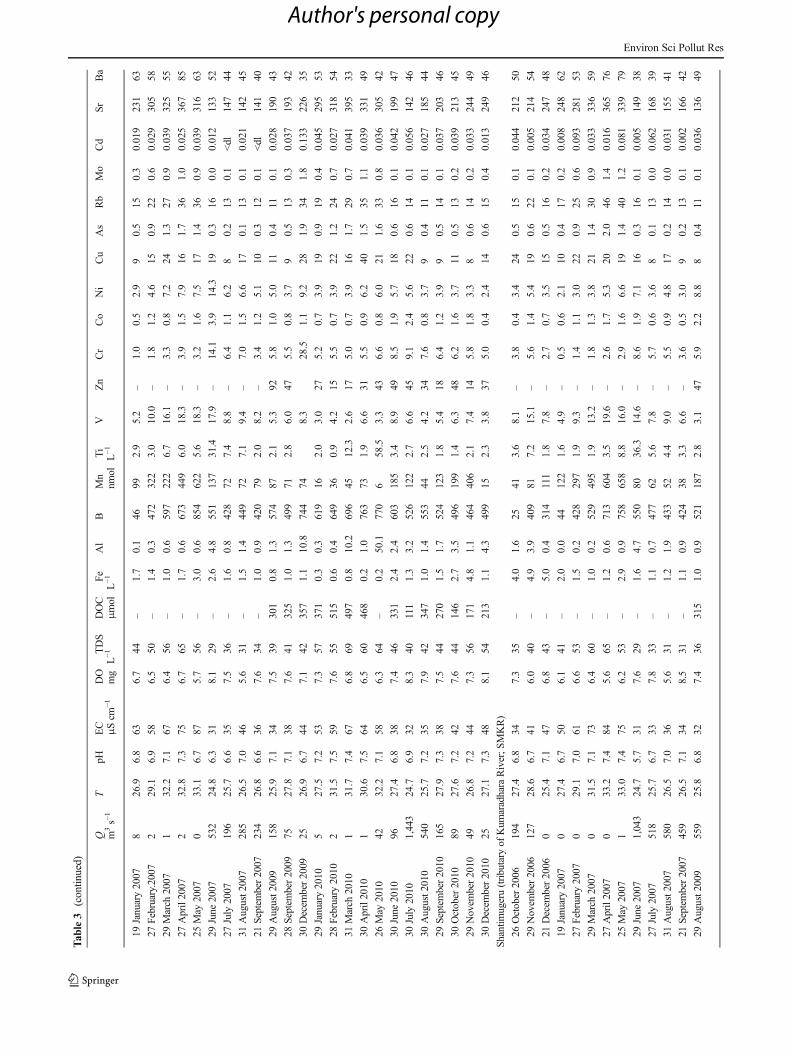
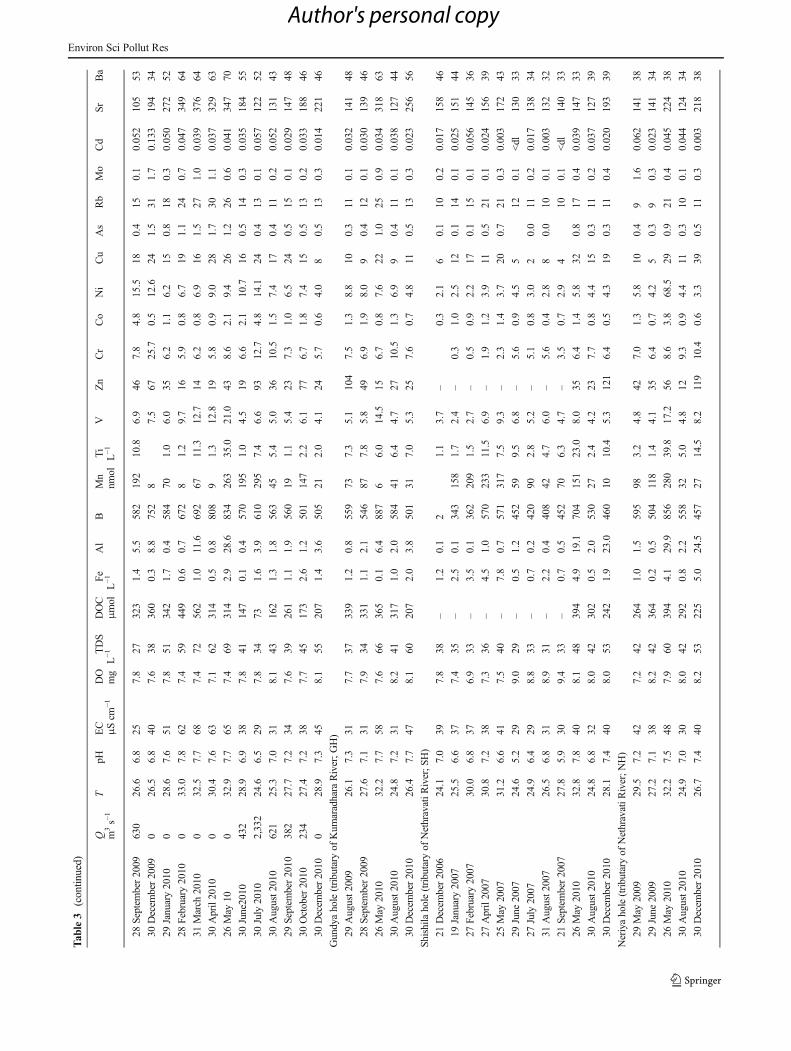
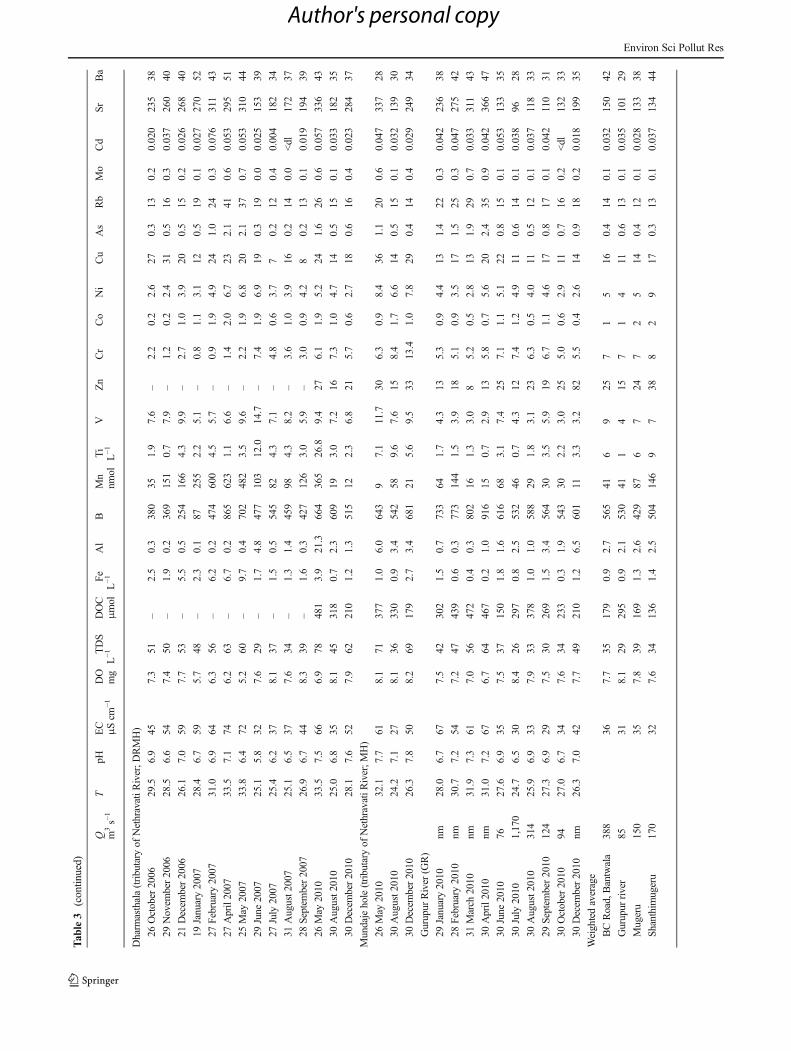
The dissolved trace element concentrations at differentperiods of sampling and their discharge-weighted concentra-tions are given in Tables 3 and 4. The dissolved metal con-centration variability on a monthly basis is plotted in Figs. 3and 4. The concentrations of dissolved trace elements (V, Ba,Cr, Co, Ni, Mn, Zn, Fe Mo, Cu and As; Fig. 3) in theNethravati River are observed to be higher during the non-monsoon period and lesser duringmonsoon season, indicatingdilution by discharge. The concentrations of trace elementsduring non-monsoon period were higher by two to six times
Environ Sci Pollut Res
Author's personal copy
for various metals. This could be due to their enrichment assignificant portion of river water evaporates in summer, withminimal input from rain/groundwater. The dissolved concen-trations, however, do not show significant inter-annual vari-ability in the basin. The variability plot suggests that dischargecontrols the metal variability in the basin. A closer look at thedata shows two sets of metals responding to changes in thedissolved oxygen and pH. For conservative tracer Cl ion, therelationship with discharge can be best explained by powerlaw function (y=121.86x−0.087; R=0.9077). The dilution ratefor conservative Cl could be ∼0.86 μmol L−1 for every unitincrease in discharge (cubic metres per second). This could beapproximated as the rate of dilution that is higher at lesser flowand lower at higher flow. The rate of dilution for other metalsis not same as that of the Cl ion, indicating control of addi-tional parameters in their variation. The redox-sensitive ele-ments such as Fe, Mn, As, Mo and Ba are closely followingthe DO concentration variation in the basin, whereas metalslike Co, Cr, Ni and Cu are showing variation with the pH. Thisindicates the involvement of redox process (for Fe, Mn, As,Mo and Ba) and adsorption/desorption (for Co, Cr, Ni and Cu)reactions in concentration variation.
The concentrations of Fe and Mn decrease with increasingDO in the river suggesting that the dissolved Fe and Mn arebeing removed from the water column (Fig. 5). Although theconcentration relationship does not show statistically signifi-cant R values, there is observable dependence of metal con-centrations on the dissolved oxygen variability. The existenceof steady-state conditions in the natural environmental settingsis nearly impossible, and hence, a statistically significantcorrelation may not be found in natural waters. Generally, Feand Mn form insoluble oxyhydroxides (range from 0.02 to0.22 μm diameter in size) under oxidising environments. Thecalculated partition coefficient (Kd is the ratio of particulatemetal concentration to dissolved metal concentration) of thesetwo metals for the monsoonal samples and its relationshipwith the dissolved oxygen (Fig. 6) variability suggests thatthese metals increasingly fractionates into particulate phaseunder oxidised conditions. These oxyhydroxides are particle
reactive and are having metal-scavenging properties in theriverine and estuarine environment (Sholkovitz and Copland1982; Ingri 1985; Sigg 1985; Honeyman and Santschi 1988;Brown et al. 1999a, 1999b; Tessier et al. 1996; Fuller andHarvey 2000; Gunnars et al. 2002). Metals like As, Mo, Baand Ge are sensitive to both changes in redox levels andavailability of surface-reactive particles (Ingri and Widerlund1994; Balistrieri et al. 1994) in the water column. Thesemetals follow the trend followed by the Fe and Mn (Fig. 5)suggesting redox reactions and surface sorption reaction con-trol over their variability in the Nethravati–Gurupur Riverbasin. Further, the surface-reactive metals like Co, Cr, Cu,Ni and Zn concentrations vary in response to changing pHconditions (Fig. 7) indicating the surface adsorption process inthe Nethravati–Gurupur river basin. An increase in pH ofsurrounding water increases the particle surface-negativecharge, thus inducing the adsorption of metal cations ontoparticle surface, whereas desorption of metal cations takesplace under acidic pH conditions due to increase in thesurface-positive charges (Eby 2004). These pH-mediatedadsorption/desorption reactions coupled with redox processare controlling the metal variability in the basin. In addition tooxyhydroxide particles, the clay size particulate matter couldexhibit profound effect on the dissolved metal concentrationvariability (Neubraure et al. 2000) in the river water. However,this was not considered in our study due to the lack ofparticulate matter data for non-monsoonal periods.
Unlike other tropical, temperate and boreal river basins(Shiller 1997; Elbaz-Poulichet et al. 1999; Viers et al. 2000;Shiller and Mao 2000; Vasyukova et al. 2012; Tripti et al.2013a), the Nethravati–Gurupur River trace element chemis-try does not show statistically significant relationship withDOC. This suggests that the organic complexation has mini-mal effect on the concentration variability of metals in theriver basin. The organic complexation of metals along withredox and surface processes decides the bioavailability andtoxicity (Morel and Hering 1993) and scavenging of metalions by particulate matter as a whole. Ba is showing weakpositive correlation (R=0.51) with DOC concentration. This
Table 2 The measured and liter-ature reported (Heimburger et al.2013) values for REEs of refer-ence material (SLRS-5)
Reference material SLRS-5 Reported value (ng L−1) Average measured value (ng L−1) Error in % (±)
La 196.0±11 174.55 10.9
Ce 236.0±16 211.3 10.5
Pr 46.9±2.5 42.35 9.6
Nd 185.0±20 171.55 7.3
Sm 32.4±3.3 36.5 12.7
Eu 5.6±1.4 6 7.1
Gd 24.9±3.0 26.5 6.4
Dy 18.2±2.5 19.5 7.1
Ho 3.6±0.5 4 11.1
Er 10.5±1.0 10.5 0.0
Environ Sci Pollut Res
Author's personal copy
Tab
le3
Dissolved
traceelem
entcom
positio
nin
theNethravati–Gurupur
River
basin
QT
pHEC
DO
TDS
DOC
FeAl
BMn
Ti
VZn
Cr
Co
Ni
Cu
As
Rb
Mo
Cd
SrBa
m3s−
1μScm
−1mgL−1
μmol
L−1
nmol
L−1
BCRoad,Bantwala(BCR)
26October
2006
265
29.8
6.8
547.2
40–
4.2
1.1
552
387.0
10.0
–3.7
0.5
5.5
420.5
140.3
0.024
206
48
29Novem
ber2006
181
28.8
6.7
525.7
42–
1.7
0.2
457
111.5
7.6
–1.5
0.1
2.8
310.5
170.3
<dl
223
48
21Decem
ber2006
nm25.3
6.9
517.0
44–
4.6
0.6
298
844.3
9.2
–2.4
0.7
3.4
150.4
160.2
0.042
238
52
19January2007
nm27.9
6.7
546.5
nm–
1.2
0.0
2998
2.4
6.7
–0.2
0.5
2.5
100.5
150.3
0.019
233
58
27February
2007
nm28.8
7.0
647.2
52–
0.7
0.4
429
174
2.7
13.3
–2.3
0.8
4.0
231.0
220.7
0.113
297
54
29March
2007
nm31.5
7.1
746.7
58–
0.9
0.4
587
213
2.6
17.6
–2.9
0.8
7.6
341.6
291.0
0.062
375
60
27April2007
nm32.8
7.1
825.9
66–
2.7
1.1
810
210
6.8
26.2
–3.7
0.9
13.7
112.3
361.4
0.050
396
66
25May
2007
nm32.0
6.6
806.3
57–
2.6
0.5
861
413
4.0
21.9
–3.7
1.1
7.1
222.0
411.1
0.057
355
64
29June
2007
1,575
25.5
6.0
327.5
31–
2.2
5.6
634
116
20.7
18.0
–9.2
2.6
8.1
200.3
180.1
0.007
147
46
27July
2007
715
26.7
6.8
357.5
35–
1.7
1.0
445
616.4
10.3
–6.2
1.0
4.7
100.2
130.1
<dl
160
44
31August2
007
865
26.6
7.0
355.5
33–
1.5
1.5
467
6310.7
9.4
–5.7
1.2
5.8
200.3
130.1
0.042
155
44
21Septem
ber2007
693
26.7
6.6
367.1
34–
1.2
0.7
445
556.6
7.6
–3.0
0.9
4.9
90.1
130.1
0.030
163
45
24January2009
nm27.5
7.9
527.9
57129
0.1
0.9
595
34.0
10.5
308.4
0.8
4.6
330.9
190.6
0.043
307
51
27February
2009
nm31.2
7.8
617.6
62118
0.5
0.5
795
119
2.7
19.4
6417.8
1.8
5.9
371.4
250.6
0.114
308
62
29March
2009
nm31.4
7.7
656.5
67123
0.4
0.7
678
229
1.5
19.0
315.8
1.2
6.3
281.6
270.8
0.032
373
60
29June
2009
170
27.8
7.5
468.0
48246
0.9
1.5
818
281.7
9.0
106.5
1.0
4.6
180.7
210.2
0.032
245
61
29July
2009
748
24.9
7.0
298.4
31264
0.4
1.6
646
272.8
7.2
386.6
1.0
4.8
330.6
150.1
0.075
133
42
29August2
009
717
26.6
7.1
557.4
36538
0.1
8.7
589
207.6
5.7
487.0
0.5
4.3
130.4
120.3
0.028
178
42
28Septem
ber2009
705
27.3
7.2
347.9
36361
0.6
1.8
583
314.1
7.4
306.4
1.0
4.8
130.5
140.3
0.045
150
40
31October
2009
174
28.5
7.3
437.5
44361
0.1
1.3
578
51.8
5.8
295.0
0.5
3.4
90.6
160.3
0.023
224
51
30Novem
ber2009
9628.2
7.3
487.5
48258
2.0
1.3
574
742.3
7.6
285.6
0.9
4.3
130.8
180.2
0.024
241
56
30Decem
ber2009
nm27.9
7.0
7.4
47318
0.3
9.0
657
68.6
6.6
566.0
0.7
5.2
170.8
210.5
0.048
262
57
29January2010
nm27.6
7.3
557.6
51331
1.7
0.7
639
147
2.7
8.4
465.9
1.3
5.0
191.0
210.4
0.042
301
60
28February
2010
nm31.4
7.9
607.6
57543
1.4
33.2
625
264
36.8
18.4
327.1
1.6
6.2
231.4
231.2
0.045
334
58
31March
2010
nm32.4
7.2
697.6
73374
0.3
10.6
702
439.7
20.0
296.3
0.8
5.9
221.9
291.3
0.037
387
60
30Aril2
010
nm30.8
7.9
767.4
74513
0.0
1.2
737
71.5
18.3
226.2
0.6
5.4
192.1
311.3
0.039
417
63
26May
2010
nm32.0
7.8
657.2
71419
0.9
24.2
876
392
25.7
19.4
626.8
1.8
8.0
341.7
341.2
0.035
342
64
30June
2010
527
27.1
7.2
397.6
44392
1.4
13.0
659
3310.0
9.9
608.2
1.1
6.4
290.7
170.1
0.034
188
49
30July
2010
3,775
24.5
6.8
318.4
31122
0.3
1.3
582
281.8
7.1
188.0
1.1
5.4
130.4
130.1
0.042
123
38
30August2
010
1,161
25.8
7.2
328.1
38160
0.1
1.2
600
61.1
5.0
113
7.8
0.6
3.9
100.4
120.2
0.031
137
39
29Septem
ber2010
547
27.4
7.4
377.7
42226
0.5
1.3
529
82.1
6.1
76.4
0.6
3.8
100.5
150.1
0.029
187
45
30October
2010
323
27.5
7.4
437.6
43164
0.2
3.4
567
262.5
6.2
295.5
0.7
4.6
120.5
160.3
0.038
199
45
30Decem
ber2010
227.1
7.3
497.6
55213
2.1
0.7
538
181.9
7.6
155.9
0.5
2.9
120.7
150.3
0.022
255
52
Mugeru(tributary
ofNethravatiR
iver;M
NR)
26October
2006
7129.3
6.7
417.2
40–
5.1
7.2
486
787.0
18.4
–9.2
2.3
9.6
440.5
180.1
0.063
157
44
29Novem
ber2006
5428.3
6.8
416.3
40–
3.0
0.9
455
373.1
8.5
–2.4
0.5
3.9
210.4
170.1
<dl
197
47
21Decem
ber2006
1824.8
6.9
547.0
47–
5.2
0.5
300
135
2.9
8.3
–3.1
1.0
4.3
100.3
150.1
0.026
217
52
Environ Sci Pollut Res
Author's personal copy
Tab
le3
(contin
ued)
QT
pHEC
DO
TDS
DOC
FeAl
BMn
Ti
VZn
Cr
Co
Ni
Cu
As
Rb
Mo
Cd
SrBa
m3s−
1μScm
−1mg
L−1
μmol
L−1
nmol
L−1
19January2007
826.9
6.8
636.7
44–
1.7
0.1
4699
2.9
5.2
–1.0
0.5
2.9
90.5
150.3
0.019
231
63
27February.2007
229.1
6.9
586.5
50–
1.4
0.3
472
322
3.0
10.0
–1.8
1.2
4.6
150.9
220.6
0.029
305
58
29March
2007
132.2
7.1
676.4
56–
1.0
0.6
597
222
6.7
16.1
–3.3
0.8
7.2
241.3
270.9
0.039
325
55
27April2007
232.8
7.3
756.7
65–
1.7
0.6
673
449
6.0
18.3
–3.9
1.5
7.9
161.7
361.0
0.025
367
85
25May
2007
033.1
6.7
875.7
56–
3.0
0.6
854
622
5.6
18.3
–3.2
1.6
7.5
171.4
360.9
0.039
316
63
29June
2007
532
24.8
6.3
318.1
29–
2.6
4.8
551
137
31.4
17.9
–14.1
3.9
14.3
190.3
160.0
0.012
133
52
27July
2007
196
25.7
6.6
357.5
36–
1.6
0.8
428
727.4
8.8
–6.4
1.1
6.2
80.2
130.1
<dl
147
44
31August2
007
285
26.5
7.0
465.6
31–
1.5
1.4
449
727.1
9.4
–7.0
1.5
6.6
170.1
130.1
0.021
142
45
21Septem
ber2007
234
26.8
6.6
367.6
34–
1.0
0.9
420
792.0
8.2
–3.4
1.2
5.1
100.3
120.1
<dl
141
40
29August2
009
158
25.9
7.1
347.5
39301
0.8
1.3
574
872.1
5.3
925.8
1.0
5.0
110.4
110.1
0.028
190
43
28Septem
ber2009
7527.8
7.1
387.6
41325
1.0
1.3
499
712.8
6.0
475.5
0.8
3.7
90.5
130.3
0.037
193
42
30Decem
ber2009
2526.9
6.7
447.1
42357
1.1
10.8
744
748.3
28.5
1.1
9.2
281.9
341.8
0.133
226
35
29January2010
527.5
7.2
537.3
57371
0.3
0.3
619
162.0
3.0
275.2
0.7
3.9
190.9
190.4
0.045
295
53
28February
2010
231.5
7.5
597.6
55515
0.6
0.4
649
360.9
4.2
155.5
0.7
3.9
221.2
240.7
0.027
318
54
31March
2010
131.7
7.4
676.8
69497
0.8
10.2
696
4512.3
2.6
175.0
0.7
3.9
161.7
290.7
0.041
395
33
30April2010
130.6
7.5
646.5
60468
0.2
1.0
763
731.9
6.6
315.5
0.9
6.2
401.5
351.1
0.039
331
49
26May
2010
4232.2
7.1
586.3
64–
0.2
50.1
770
658.5
3.3
436.6
0.8
6.0
211.6
330.8
0.036
305
42
30June
2010
9627.4
6.8
387.4
46331
2.4
2.4
603
185
3.4
8.9
498.5
1.9
5.7
180.6
160.1
0.042
199
47
30July
2010
1,443
24.7
6.9
328.3
40111
1.3
3.2
526
122
2.7
6.6
459.1
2.4
5.6
220.6
140.1
0.056
142
46
30August2
010
540
25.7
7.2
357.9
42347
1.0
1.4
553
442.5
4.2
347.6
0.8
3.7
90.4
110.1
0.027
185
44
29Septem
ber2010
165
27.9
7.3
387.5
44270
1.5
1.7
524
123
1.8
5.4
186.4
1.2
3.9
90.5
140.1
0.037
203
46
30October
2010
8927.6
7.2
427.6
44146
2.7
3.5
496
199
1.4
6.3
486.2
1.6
3.7
110.5
130.2
0.039
213
45
29Novem
ber2010
4926.8
7.2
447.3
56171
4.8
1.1
464
406
2.1
7.4
145.8
1.8
3.3
80.6
140.2
0.033
244
49
30Decem
ber2010
2527.1
7.3
488.1
54213
1.1
4.3
499
152.3
3.8
375.0
0.4
2.4
140.6
150.4
0.013
249
46
Shantim
ugeru(tributary
ofKum
aradhara
River;S
MKR)
26October
2006
194
27.4
6.8
347.3
35–
4.0
1.6
2541
3.6
8.1
–3.8
0.4
3.4
240.5
150.1
0.044
212
50
29Novem
ber2006
127
28.6
6.7
416.0
40–
4.9
3.9
409
817.2
15.1
–5.6
1.4
5.4
190.6
220.1
0.005
214
54
21Decem
ber2006
025.4
7.1
476.8
43–
5.0
0.4
314
111
1.8
7.8
–2.7
0.7
3.5
150.5
160.2
0.034
247
48
19January2007
027.4
6.7
506.1
41–
2.0
0.0
44122
1.6
4.9
–0.5
0.6
2.1
100.4
170.2
0.008
248
62
27February
2007
029.1
7.0
616.6
53–
1.5
0.2
428
297
1.9
9.3
–1.4
1.1
3.0
220.9
250.6
0.093
281
53
29March
2007
031.5
7.1
736.4
60–
1.0
0.2
529
495
1.9
13.2
–1.8
1.3
3.8
211.4
300.9
0.033
336
59
27April2007
033.2
7.4
845.6
65–
1.2
0.6
713
604
3.5
19.6
–2.6
1.7
5.3
202.0
461.4
0.016
365
76
25May
2007
133.0
7.4
756.2
53–
2.9
0.9
758
658
8.8
16.0
–2.9
1.6
6.6
191.4
401.2
0.081
339
79
29June
2007
1,043
24.7
5.7
317.6
29–
1.6
4.7
550
8036.3
14.6
–8.6
1.9
7.1
160.3
160.1
0.005
149
38
27July
2007
518
25.7
6.7
337.8
33–
1.1
0.7
477
625.6
7.8
–5.7
0.6
3.6
80.1
130.0
0.062
168
39
31August2
007
580
26.5
7.0
365.6
31–
1.2
1.9
433
524.4
9.0
–5.5
0.9
4.8
170.2
140.0
0.031
155
41
21Septem
ber2007
459
26.5
7.1
348.5
31–
1.1
0.9
424
383.3
6.6
–3.6
0.5
3.0
90.2
130.1
0.002
166
42
29August2
009
559
25.8
6.8
327.4
36315
1.0
0.9
521
187
2.8
3.1
475.9
2.2
8.8
80.4
110.1
0.036
136
49
Environ Sci Pollut Res
Author's personal copy
Tab
le3
(contin
ued)
QT
pHEC
DO
TDS
DOC
FeAl
BMn
Ti
VZn
Cr
Co
Ni
Cu
As
Rb
Mo
Cd
SrBa
m3s−
1μScm
−1mg
L−1
μmol
L−1
nmol
L−1
28Septem
ber2009
630
26.6
6.8
257.8
27323
1.4
5.5
582
192
10.8
6.9
467.8
4.8
15.5
180.4
150.1
0.052
105
53
30Decem
ber2009
026.5
6.8
407.6
38360
0.3
8.8
752
87.5
6725.7
0.5
12.6
241.5
311.7
0.133
194
34
29January2010
028.6
7.6
517.8
51342
1.7
0.4
584
701.0
6.0
356.2
1.1
6.2
150.8
180.3
0.050
272
52
28February
2010
033.0
7.8
627.4
59449
0.6
0.7
672
81.2
9.7
165.9
0.8
6.7
191.1
240.7
0.047
349
64
31March
2010
032.5
7.7
687.4
72562
1.0
11.6
692
6711.3
12.7
146.2
0.8
6.9
161.5
271.0
0.039
376
64
30April2010
030.4
7.6
637.1
62314
0.5
0.8
808
91.3
12.8
195.8
0.9
9.0
281.7
301.1
0.037
329
63
26May
100
32.9
7.7
657.4
69314
2.9
28.6
834
263
35.0
21.0
438.6
2.1
9.4
261.2
260.6
0.041
347
70
30June2010
432
28.9
6.9
387.8
41147
0.1
0.4
570
195
1.0
4.5
196.6
2.1
10.7
160.5
140.3
0.035
184
55
30July
2010
2,332
24.6
6.5
297.8
3473
1.6
3.9
610
295
7.4
6.6
9312.7
4.8
14.1
240.4
130.1
0.057
122
52
30August2
010
621
25.3
7.0
318.1
43162
1.3
1.8
563
455.4
5.0
3610.5
1.5
7.4
170.4
110.2
0.052
131
43
29Septem
ber2010
382
27.7
7.2
347.6
39261
1.1
1.9
560
191.1
5.4
237.3
1.0
6.5
240.5
150.1
0.029
147
48
30October
2010
234
27.4
7.2
387.7
45173
2.6
1.2
501
147
2.2
6.1
776.7
1.8
7.4
150.5
130.2
0.033
188
46
30Decem
ber2010
028.9
7.3
458.1
55207
1.4
3.6
505
212.0
4.1
245.7
0.6
4.0
80.5
130.3
0.014
221
46
Gundyahole(tributary
ofKum
aradhara
River;G
H)
29August2
009
26.1
7.3
317.7
37339
1.2
0.8
559
737.3
5.1
104
7.5
1.3
8.8
100.3
110.1
0.032
141
48
28Septem
ber2009
27.6
7.1
317.9
34331
1.1
2.1
546
877.8
5.8
496.9
1.9
8.0
90.4
120.1
0.030
139
46
26May
2010
32.2
7.7
587.6
66365
0.1
6.4
887
66.0
14.5
156.7
0.8
7.6
221.0
250.9
0.034
318
63
30August2
010
24.8
7.2
318.2
41317
1.0
2.0
584
416.4
4.7
2710.5
1.3
6.9
90.4
110.1
0.038
127
44
30Decem
ber2010
26.4
7.7
478.1
60207
2.0
3.8
501
317.0
5.3
257.6
0.7
4.8
110.5
130.3
0.023
256
56
Shishilahole(tributary
ofNethravatiR
iver;S
H)
21Decem
ber2006
24.1
7.0
397.8
38–
1.2
0.1
21.1
3.7
–0.3
2.1
60.1
100.2
0.017
158
46
19January2007
25.5
6.6
377.4
35–
2.5
0.1
343
158
1.7
2.4
–0.3
1.0
2.5
120.1
140.1
0.025
151
44
27February
2007
30.0
6.8
376.9
33–
3.5
0.1
362
209
1.5
2.7
–0.5
0.9
2.2
170.1
150.1
0.056
145
36
27April2007
30.8
7.2
387.3
36–
4.5
1.0
570
233
11.5
6.9
–1.9
1.2
3.9
110.5
210.1
0.024
156
39
25May
2007
31.2
6.6
417.5
40–
7.8
0.7
571
317
7.5
9.3
–2.3
1.4
3.7
200.7
210.3
0.003
172
43
29June
2007
24.6
5.2
299.0
29–
0.5
1.2
452
599.5
6.8
–5.6
0.9
4.5
512
0.1
<dl
130
33
27July
2007
24.9
6.4
298.8
33–
0.7
0.2
420
902.8
5.2
–5.1
0.8
3.0
20.0
110.2
0.017
138
34
31August2
007
26.5
6.8
318.9
31–
2.2
0.4
408
424.7
6.0
–5.6
0.4
2.8
80.0
100.1
0.003
132
32
21Septem
ber2007
27.8
5.9
309.4
33–
0.7
0.5
452
706.3
4.7
–3.5
0.7
2.9
410
0.1
<dl
140
33
26May
2010
32.8
7.8
408.1
48394
4.9
19.1
704
151
23.0
8.0
356.4
1.4
5.8
320.8
170.4
0.039
147
33
30August2
010
24.8
6.8
328.0
42302
0.5
2.0
530
272.4
4.2
237.7
0.8
4.4
150.3
110.2
0.037
127
39
30Decem
ber2010
28.1
7.4
408.0
53242
1.9
23.0
460
1010.4
5.3
121
6.4
0.5
4.3
190.3
110.4
0.020
193
39
Neriyahole(tributary
ofNethravatiR
iver;N
H)
29May
2009
29.5
7.2
427.2
42264
1.0
1.5
595
983.2
4.8
427.0
1.3
5.8
100.4
91.6
0.062
141
38
29June
2009
27.2
7.1
388.2
42364
0.2
0.5
504
118
1.4
4.1
356.4
0.7
4.2
50.3
90.3
0.023
141
34
26May
2010
32.2
7.5
487.9
60394
4.1
29.9
856
280
39.8
17.2
568.6
3.8
68.5
290.9
210.4
0.045
224
38
30August2
010
24.9
7.0
308.0
42292
0.8
2.2
558
325.0
4.8
129.3
0.9
4.4
110.3
100.1
0.044
124
34
30Decem
ber2010
26.7
7.4
408.2
53225
5.0
24.5
457
2714.5
8.2
119
10.4
0.6
3.3
390.5
110.3
0.003
218
38
Environ Sci Pollut Res
Author's personal copy
Tab
le3
(contin
ued)
QT
pHEC
DO
TDS
DOC
FeAl
BMn
Ti
VZn
Cr
Co
Ni
Cu
As
Rb
Mo
Cd
SrBa
m3s−
1μScm
−1mg
L−1
μmol
L−1
nmol
L−1
Dharm
asthala(tributary
ofNethravatiR
iver;D
RMH)
26October
2006
29.5
6.9
457.3
51–
2.5
0.3
380
351.9
7.6
–2.2
0.2
2.6
270.3
130.2
0.020
235
38
29Novem
ber2006
28.5
6.6
547.4
50–
1.9
0.2
369
151
0.7
7.9
–1.2
0.2
2.4
310.5
160.3
0.037
260
40
21Decem
ber2006
26.1
7.0
597.7
53–
5.5
0.5
254
166
4.3
9.9
–2.7
1.0
3.9
200.5
150.2
0.026
268
40
19January2007
28.4
6.7
595.7
48–
2.3
0.1
87255
2.2
5.1
–0.8
1.1
3.1
120.5
190.1
0.027
270
52
27February
2007
31.0
6.9
646.3
56–
6.2
0.2
474
600
4.5
5.7
–0.9
1.9
4.9
241.0
240.3
0.076
311
43
27April2007
33.5
7.1
746.2
63–
6.7
0.2
865
623
1.1
6.6
–1.4
2.0
6.7
232.1
410.6
0.053
295
51
25May
2007
33.8
6.4
725.2
60–
9.7
0.4
702
482
3.5
9.6
–2.2
1.9
6.8
202.1
370.7
0.053
310
44
29June
2007
25.1
5.8
327.6
29–
1.7
4.8
477
103
12.0
14.7
–7.4
1.9
6.9
190.3
190.0
0.025
153
39
27July
2007
25.4
6.2
378.1
37–
1.5
0.5
545
824.3
7.1
–4.8
0.6
3.7
70.2
120.4
0.004
182
34
31August2
007
25.1
6.5
377.6
34–
1.3
1.4
459
984.3
8.2
–3.6
1.0
3.9
160.2
140.0
<dl
172
37
28Septem
ber2007
26.9
6.7
448.3
39–
1.6
0.3
427
126
3.0
5.9
–3.0
0.9
4.2
80.2
130.1
0.019
194
39
26May
2010
33.5
7.5
666.9
78481
3.9
21.3
664
365
26.8
9.4
276.1
1.9
5.2
241.6
260.6
0.057
336
43
30August2
010
25.0
6.8
358.1
45318
0.7
2.3
609
193.0
7.2
167.3
1.0
4.7
140.5
150.1
0.033
182
35
30Decem
ber2010
28.1
7.6
527.9
62210
1.2
1.3
515
122.3
6.8
215.7
0.6
2.7
180.6
160.4
0.023
284
37
Mundajehole(tributary
ofNethravatiR
iver;M
H)
26May
2010
32.1
7.7
618.1
71377
1.0
6.0
643
97.1
11.7
306.3
0.9
8.4
361.1
200.6
0.047
337
28
30August2
010
24.2
7.1
278.1
36330
0.9
3.4
542
589.6
7.6
158.4
1.7
6.6
140.5
150.1
0.032
139
30
30Decem
ber2010
26.3
7.8
508.2
69179
2.7
3.4
681
215.6
9.5
3313.4
1.0
7.8
290.4
140.4
0.029
249
34
Gurupur
River
(GR)
29January2010
nm28.0
6.7
677.5
42302
1.5
0.7
733
641.7
4.3
135.3
0.9
4.4
131.4
220.3
0.042
236
38
28February
2010
nm30.7
7.2
547.2
47439
0.6
0.3
773
144
1.5
3.9
185.1
0.9
3.5
171.5
250.3
0.047
275
42
31March
2010
nm31.9
7.3
617.0
56472
0.4
0.3
802
161.3
3.0
85.2
0.5
2.8
131.9
290.7
0.033
311
43
30April2010
nm31.0
7.2
676.7
64467
0.2
1.0
916
150.7
2.9
135.8
0.7
5.6
202.4
350.9
0.042
366
47
30June
2010
7627.6
6.9
357.5
37150
1.8
1.6
616
683.1
7.4
257.1
1.1
5.1
220.8
150.1
0.053
133
35
30July
2010
1,170
24.7
6.5
308.4
26297
0.8
2.5
532
460.7
4.3
127.4
1.2
4.9
110.6
140.1
0.038
9628
30August2
010
314
25.9
6.9
337.9
33378
1.0
1.0
588
291.8
3.1
236.3
0.5
4.0
110.5
120.1
0.037
118
33
29Septem
ber2010
124
27.3
6.9
297.5
30269
1.5
3.4
564
303.5
5.9
196.7
1.1
4.6
170.8
170.1
0.042
110
31
30October
2010
9427.0
6.7
347.6
34233
0.3
1.9
543
302.2
3.0
255.0
0.6
2.9
110.7
160.2
<dl
132
33
30Decem
ber2010
nm26.3
7.0
427.7
49210
1.2
6.5
601
113.3
3.2
825.5
0.4
2.6
140.9
180.2
0.018
199
35
Weightedaverage
BCRoad,Bantwala
388
367.7
35179
0.9
2.7
565
416
925
71
516
0.4
140.1
0.032
150
42
Gurupur
river
8531
8.1
29295
0.9
2.1
530
411
415
71
411
0.6
130.1
0.035
101
29
Mugeru
150
357.8
39169
1.3
2.6
429
876
724
72
514
0.4
120.1
0.028
133
38
Shanthim
ugeru
170
327.6
34136
1.4
2.5
504
146
97
388
29
170.3
130.1
0.037
134
44
Environ Sci Pollut Res
Author's personal copy

Table 4 Trace element and REE composition of Nethravati–Gurupur Rivers
DOS Th U Y Ga Ge Zr Cs La Nd Ce Pr Sm Eu Gd Dy Ho Er Tm Yb Lupmol L−1
BC Road, Bantwala (BCR)
26 October 2006 38 15 387 274 339 89 39 426 316 1,102 120 75 20 69 36 11 24 1 21 5
29 November 2006 9 7 45 150 269 35 38 7 12 85 3 9 3 4 1 6 3 1
21 December 2006 24 16 387 196 266 54 43 477 383 1,224 113 50 24 47 47 7 22 1 17 3
19 January 2007 12 22 235 126 184 23 36 393 264 1,133 102 41 22 44 32 8 21 0 15 1
27 February 2007 17 25 157 338 243 45 51 223 158 552 39 29 16 27 14 5 11 <dl 9 2
29 March 2007 11 27 100 509 213 20 68 125 74 341 25 16 16 14 14 4 10 <dl 8 <dl
27 April 2007 23 35 155 504 324 63 74 188 125 541 37 19 20 10 13 3 7 <dl 8 2
25 May 2007 19 24 146 378 269 65 84 180 98 487 35 26 14 15 12 5 15 <dl 1 0
29 June 2007 74 73 2,939 774 318 174 99 2,620 2,286 7,133 636 477 122 478 330 64 161 8 153 17
27 July 2007 28 21 819 268 292 63 39 856 731 2,244 183 139 34 103 98 18 49 2 34 5
31 August 2007 35 30 1,247 248 256 85 47 1,790 996 3,085 299 180 57 191 135 28 75 4 62 7
21 September 2007 13 17 823 195 236 52 39 983 618 1,933 189 121 38 85 87 17 54 2 36 5
24 January 2009 12 19 – 279 208 33 380 60 49 51 17 26 15 25 18 11 17 11 15 11
27 February 2009 32 42 – 468 413 78 841 197 164 234 55 89 44 60 48 35 45 31 45 29
29 March 2009 9 24 – 368 219 24 274 154 134 329 33 44 14 30 21 7 14 7 16 7
29 June 2009 23 35 – 218 216 31 284 982 920 2,042 226 189 48 168 132 29 66 17 64 15
29 July 2009 17 32 – 158 185 36 272 1,055 1,054 2,239 255 203 46 191 130 31 78 15 61 15
29 August 2009 8 14 – 280 190 21 263 106 125 234 30 35 14 24 23 9 16 6 17 8
28 September 2009 22 29 – 169 183 59 264 620 682 1,311 156 154 45 148 123 28 72 16 64 16
31 October 2009 5 9 – 140 181 12 268 49 61 97 15 33 10 14 14 5 10 3 11 4
30 November 2009 15 18 – 184 160 16 272 493 444 1,114 116 101 25 79 55 11 36 6 30 7
30 December 2009 17 21 – 361 253 42 273 107 108 213 39 49 22 37 32 20 22 18 23 17
29 January 2010 20 28 – 242 259 53 293 315 277 701 85 89 33 53 52 26 39 20 33 23
28 February 2010 18 41 – 1,095 272 60 279 311 265 834 72 80 30 55 47 21 35 18 26 17
31 March 2010 16 31 – 585 268 51 296 78 64 158 28 45 20 30 29 17 25 15 20 14
30 April 2010 10 22 – 359 245 24 302 31 31 38 14 27 12 14 13 11 17 9 11 8
26 May 2010 15 30 – 910 256 47 358 257 219 722 58 64 19 46 32 13 20 11 22 9
30 June 2010 26 37 – 426 207 80 298 913 877 2,011 207 185 54 166 135 30 80 16 66 15
30 July 2010 23 22 – 154 183 58 277 513 575 1,128 131 132 40 110 86 26 58 16 53 16
30 August 2010 16 19 – 169 211 43 274 168 190 351 54 62 27 44 47 19 38 16 33 15
29 September 2010 29 23 – 157 187 55 275 327 351 727 82 86 26 72 57 18 36 13 34 12
30 October 2010 20 19 – 281 218 52 261 214 218 464 61 66 25 52 42 17 30 16 27 14
30 December 2010 7 12 – 148 169 15 252 245 225 500 51 56 14 38 29 7 21 5 14 4
Mugeru (tributary of Nethravati River; MNR)
26 October 2006 58 72 3,037 798 499 148 118 1,817 1,902 6,657 501 405 99 421 372 65 186 11 161 25
29 November 2006 29 15 431 226 298 86 52 338 286 1,093 94 65 22 56 53 10 27 0 18 3
21 December 2006 24 15 406 165 205 69 41 385 363 1,138 113 78 23 61 46 8 35 0 14 2
19 January 2007 19 16 285 142 164 26 45 343 306 1,079 91 41 22 64 44 11 24 1 25 3
27 February 2007 16 24 168 254 183 38 57 195 130 465 44 12 14 20 27 7 10 0 7 1
29 March 2007 8 28 160 281 190 26 88 287 112 533 43 25 18 12 17 5 19 2 1
27 April 2007 20 33 205 335 270 367 113 208 115 484 46 17 22 16 16 5 20 0 8 2
25 May 2007 10 24 198 339 345 36 110 239 157 618 48 17 19 18 23 6 17 6 2
29 June 2007 114 74 3,955 938 444 193 102 3,674 3,283 7,283 924 607 187 617 456 89 226 13 183 25
27 July 2007 17 17 734 183 213 43 46 925 522 1,609 150 104 26 113 75 14 44 1 32 7
31 August 2007 32 32 1,570 367 337 89 55 1,285 1,136 3,125 300 216 59 195 172 35 90 5 80 10
21 September 2007 12 24 1,267 286 258 69 34 1,142 883 2,764 265 163 44 193 134 26 76 4 72 9
29 August 2009 13 18 – 124 182 21 280 333 321 677 80 86 21 72 59 14 33 10 32 9
Environ Sci Pollut Res
Author's personal copy
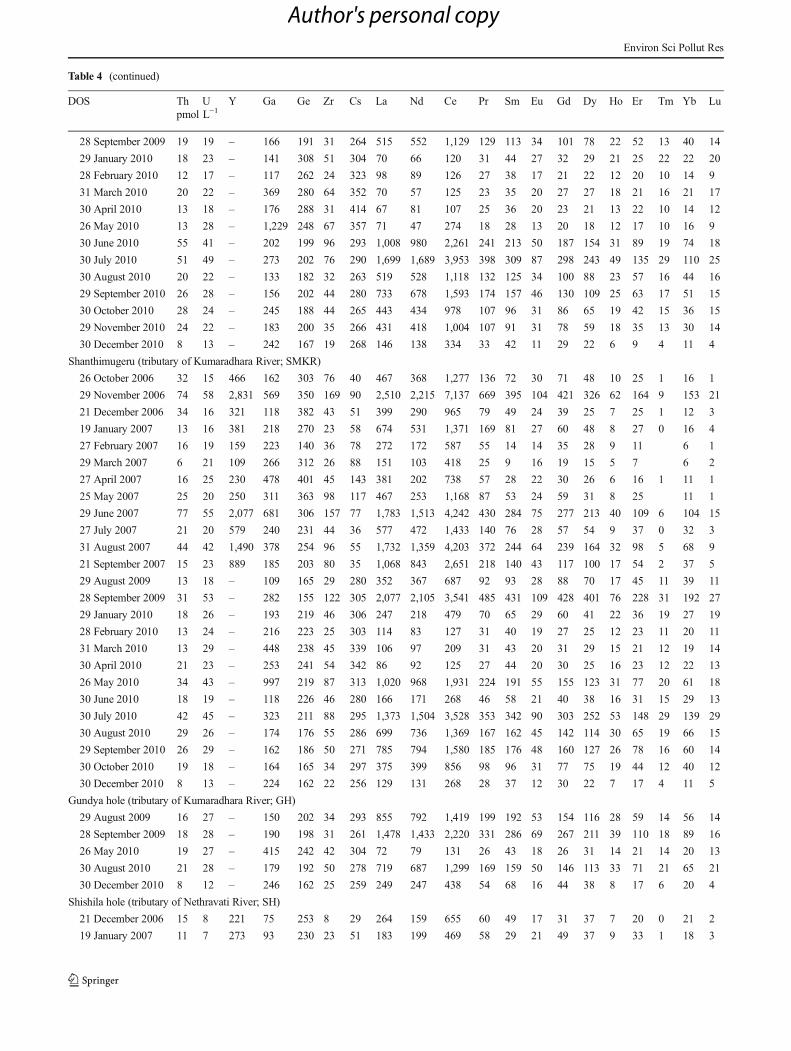
Table 4 (continued)
DOS Th U Y Ga Ge Zr Cs La Nd Ce Pr Sm Eu Gd Dy Ho Er Tm Yb Lupmol L−1
28 September 2009 19 19 – 166 191 31 264 515 552 1,129 129 113 34 101 78 22 52 13 40 14
29 January 2010 18 23 – 141 308 51 304 70 66 120 31 44 27 32 29 21 25 22 22 20
28 February 2010 12 17 – 117 262 24 323 98 89 126 27 38 17 21 22 12 20 10 14 9
31 March 2010 20 22 – 369 280 64 352 70 57 125 23 35 20 27 27 18 21 16 21 17
30 April 2010 13 18 – 176 288 31 414 67 81 107 25 36 20 23 21 13 22 10 14 12
26 May 2010 13 28 – 1,229 248 67 357 71 47 274 18 28 13 20 18 12 17 10 16 9
30 June 2010 55 41 – 202 199 96 293 1,008 980 2,261 241 213 50 187 154 31 89 19 74 18
30 July 2010 51 49 – 273 202 76 290 1,699 1,689 3,953 398 309 87 298 243 49 135 29 110 25
30 August 2010 20 22 – 133 182 32 263 519 528 1,118 132 125 34 100 88 23 57 16 44 16
29 September 2010 26 28 – 156 202 44 280 733 678 1,593 174 157 46 130 109 25 63 17 51 15
30 October 2010 28 24 – 245 188 44 265 443 434 978 107 96 31 86 65 19 42 15 36 15
29 November 2010 24 22 – 183 200 35 266 431 418 1,004 107 91 31 78 59 18 35 13 30 14
30 December 2010 8 13 – 242 167 19 268 146 138 334 33 42 11 29 22 6 9 4 11 4
Shanthimugeru (tributary of Kumaradhara River; SMKR)
26 October 2006 32 15 466 162 303 76 40 467 368 1,277 136 72 30 71 48 10 25 1 16 1
29 November 2006 74 58 2,831 569 350 169 90 2,510 2,215 7,137 669 395 104 421 326 62 164 9 153 21
21 December 2006 34 16 321 118 382 43 51 399 290 965 79 49 24 39 25 7 25 1 12 3
19 January 2007 13 16 381 218 270 23 58 674 531 1,371 169 81 27 60 48 8 27 0 16 4
27 February 2007 16 19 159 223 140 36 78 272 172 587 55 14 14 35 28 9 11 6 1
29 March 2007 6 21 109 266 312 26 88 151 103 418 25 9 16 19 15 5 7 6 2
27 April 2007 16 25 230 478 401 45 143 381 202 738 57 28 22 30 26 6 16 1 11 1
25 May 2007 25 20 250 311 363 98 117 467 253 1,168 87 53 24 59 31 8 25 11 1
29 June 2007 77 55 2,077 681 306 157 77 1,783 1,513 4,242 430 284 75 277 213 40 109 6 104 15
27 July 2007 21 20 579 240 231 44 36 577 472 1,433 140 76 28 57 54 9 37 0 32 3
31 August 2007 44 42 1,490 378 254 96 55 1,732 1,359 4,203 372 244 64 239 164 32 98 5 68 9
21 September 2007 15 23 889 185 203 80 35 1,068 843 2,651 218 140 43 117 100 17 54 2 37 5
29 August 2009 13 18 – 109 165 29 280 352 367 687 92 93 28 88 70 17 45 11 39 11
28 September 2009 31 53 – 282 155 122 305 2,077 2,105 3,541 485 431 109 428 401 76 228 31 192 27
29 January 2010 18 26 – 193 219 46 306 247 218 479 70 65 29 60 41 22 36 19 27 19
28 February 2010 13 24 – 216 223 25 303 114 83 127 31 40 19 27 25 12 23 11 20 11
31 March 2010 13 29 – 448 238 45 339 106 97 209 31 43 20 31 29 15 21 12 19 14
30 April 2010 21 23 – 253 241 54 342 86 92 125 27 44 20 30 25 16 23 12 22 13
26 May 2010 34 43 – 997 219 87 313 1,020 968 1,931 224 191 55 155 123 31 77 20 61 18
30 June 2010 18 19 – 118 226 46 280 166 171 268 46 58 21 40 38 16 31 15 29 13
30 July 2010 42 45 – 323 211 88 295 1,373 1,504 3,528 353 342 90 303 252 53 148 29 139 29
30 August 2010 29 26 – 174 176 55 286 699 736 1,369 167 162 45 142 114 30 65 19 66 15
29 September 2010 26 29 – 162 186 50 271 785 794 1,580 185 176 48 160 127 26 78 16 60 14
30 October 2010 19 18 – 164 165 34 297 375 399 856 98 96 31 77 75 19 44 12 40 12
30 December 2010 8 13 – 224 162 22 256 129 131 268 28 37 12 30 22 7 17 4 11 5
Gundya hole (tributary of Kumaradhara River; GH)
29 August 2009 16 27 – 150 202 34 293 855 792 1,419 199 192 53 154 116 28 59 14 56 14
28 September 2009 18 28 – 190 198 31 261 1,478 1,433 2,220 331 286 69 267 211 39 110 18 89 16
26 May 2010 19 27 – 415 242 42 304 72 79 131 26 43 18 26 31 14 21 14 20 13
30 August 2010 21 28 – 179 192 50 278 719 687 1,299 169 159 50 146 113 33 71 21 65 21
30 December 2010 8 12 – 246 162 25 259 249 247 438 54 68 16 44 38 8 17 6 20 4
Shishila hole (tributary of Nethravati River; SH)
21 December 2006 15 8 221 75 253 8 29 264 159 655 60 49 17 31 37 7 20 0 21 2
19 January 2007 11 7 273 93 230 23 51 183 199 469 58 29 21 49 37 9 33 1 18 3
Environ Sci Pollut Res
Author's personal copy
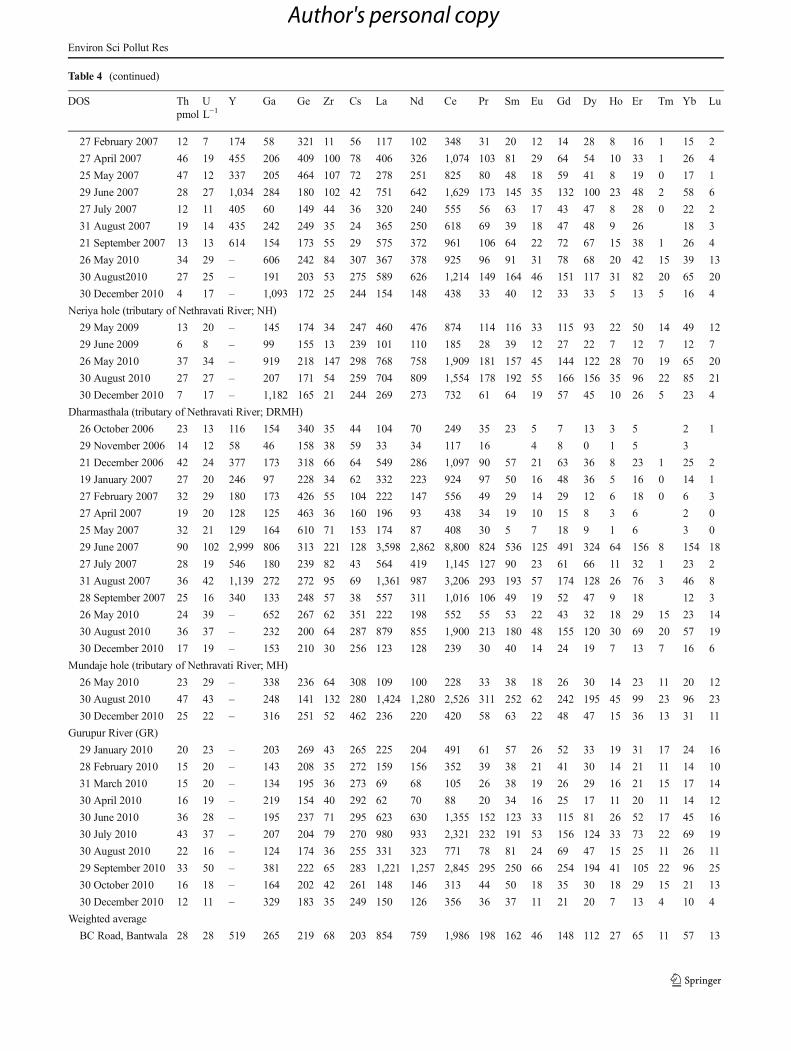
Table 4 (continued)
DOS Th U Y Ga Ge Zr Cs La Nd Ce Pr Sm Eu Gd Dy Ho Er Tm Yb Lupmol L−1
27 February 2007 12 7 174 58 321 11 56 117 102 348 31 20 12 14 28 8 16 1 15 2
27 April 2007 46 19 455 206 409 100 78 406 326 1,074 103 81 29 64 54 10 33 1 26 4
25 May 2007 47 12 337 205 464 107 72 278 251 825 80 48 18 59 41 8 19 0 17 1
29 June 2007 28 27 1,034 284 180 102 42 751 642 1,629 173 145 35 132 100 23 48 2 58 6
27 July 2007 12 11 405 60 149 44 36 320 240 555 56 63 17 43 47 8 28 0 22 2
31 August 2007 19 14 435 242 249 35 24 365 250 618 69 39 18 47 48 9 26 18 3
21 September 2007 13 13 614 154 173 55 29 575 372 961 106 64 22 72 67 15 38 1 26 4
26 May 2010 34 29 – 606 242 84 307 367 378 925 96 91 31 78 68 20 42 15 39 13
30 August2010 27 25 – 191 203 53 275 589 626 1,214 149 164 46 151 117 31 82 20 65 20
30 December 2010 4 17 – 1,093 172 25 244 154 148 438 33 40 12 33 33 5 13 5 16 4
Neriya hole (tributary of Nethravati River; NH)
29 May 2009 13 20 – 145 174 34 247 460 476 874 114 116 33 115 93 22 50 14 49 12
29 June 2009 6 8 – 99 155 13 239 101 110 185 28 39 12 27 22 7 12 7 12 7
26 May 2010 37 34 – 919 218 147 298 768 758 1,909 181 157 45 144 122 28 70 19 65 20
30 August 2010 27 27 – 207 171 54 259 704 809 1,554 178 192 55 166 156 35 96 22 85 21
30 December 2010 7 17 – 1,182 165 21 244 269 273 732 61 64 19 57 45 10 26 5 23 4
Dharmasthala (tributary of Nethravati River; DRMH)
26 October 2006 23 13 116 154 340 35 44 104 70 249 35 23 5 7 13 3 5 2 1
29 November 2006 14 12 58 46 158 38 59 33 34 117 16 4 8 0 1 5 3
21 December 2006 42 24 377 173 318 66 64 549 286 1,097 90 57 21 63 36 8 23 1 25 2
19 January 2007 27 20 246 97 228 34 62 332 223 924 97 50 16 48 36 5 16 0 14 1
27 February 2007 32 29 180 173 426 55 104 222 147 556 49 29 14 29 12 6 18 0 6 3
27 April 2007 19 20 128 125 463 36 160 196 93 438 34 19 10 15 8 3 6 2 0
25 May 2007 32 21 129 164 610 71 153 174 87 408 30 5 7 18 9 1 6 3 0
29 June 2007 90 102 2,999 806 313 221 128 3,598 2,862 8,800 824 536 125 491 324 64 156 8 154 18
27 July 2007 28 19 546 180 239 82 43 564 419 1,145 127 90 23 61 66 11 32 1 23 2
31 August 2007 36 42 1,139 272 272 95 69 1,361 987 3,206 293 193 57 174 128 26 76 3 46 8
28 September 2007 25 16 340 133 248 57 38 557 311 1,016 106 49 19 52 47 9 18 12 3
26 May 2010 24 39 – 652 267 62 351 222 198 552 55 53 22 43 32 18 29 15 23 14
30 August 2010 36 37 – 232 200 64 287 879 855 1,900 213 180 48 155 120 30 69 20 57 19
30 December 2010 17 19 – 153 210 30 256 123 128 239 30 40 14 24 19 7 13 7 16 6
Mundaje hole (tributary of Nethravati River; MH)
26 May 2010 23 29 – 338 236 64 308 109 100 228 33 38 18 26 30 14 23 11 20 12
30 August 2010 47 43 – 248 141 132 280 1,424 1,280 2,526 311 252 62 242 195 45 99 23 96 23
30 December 2010 25 22 – 316 251 52 462 236 220 420 58 63 22 48 47 15 36 13 31 11
Gurupur River (GR)
29 January 2010 20 23 – 203 269 43 265 225 204 491 61 57 26 52 33 19 31 17 24 16
28 February 2010 15 20 – 143 208 35 272 159 156 352 39 38 21 41 30 14 21 11 14 10
31 March 2010 15 20 – 134 195 36 273 69 68 105 26 38 19 26 29 16 21 15 17 14
30 April 2010 16 19 – 219 154 40 292 62 70 88 20 34 16 25 17 11 20 11 14 12
30 June 2010 36 28 – 195 237 71 295 623 630 1,355 152 123 33 115 81 26 52 17 45 16
30 July 2010 43 37 – 207 204 79 270 980 933 2,321 232 191 53 156 124 33 73 22 69 19
30 August 2010 22 16 – 124 174 36 255 331 323 771 78 81 24 69 47 15 25 11 26 11
29 September 2010 33 50 – 381 222 65 283 1,221 1,257 2,845 295 250 66 254 194 41 105 22 96 25
30 October 2010 16 18 – 164 202 42 261 148 146 313 44 50 18 35 30 18 29 15 21 13
30 December 2010 12 11 – 329 183 35 249 150 126 356 36 37 11 21 20 7 13 4 10 4
Weighted average
BC Road, Bantwala 28 28 519 265 219 68 203 854 759 1,986 198 162 46 148 112 27 65 11 57 13
Environ Sci Pollut Res
Author's personal copy
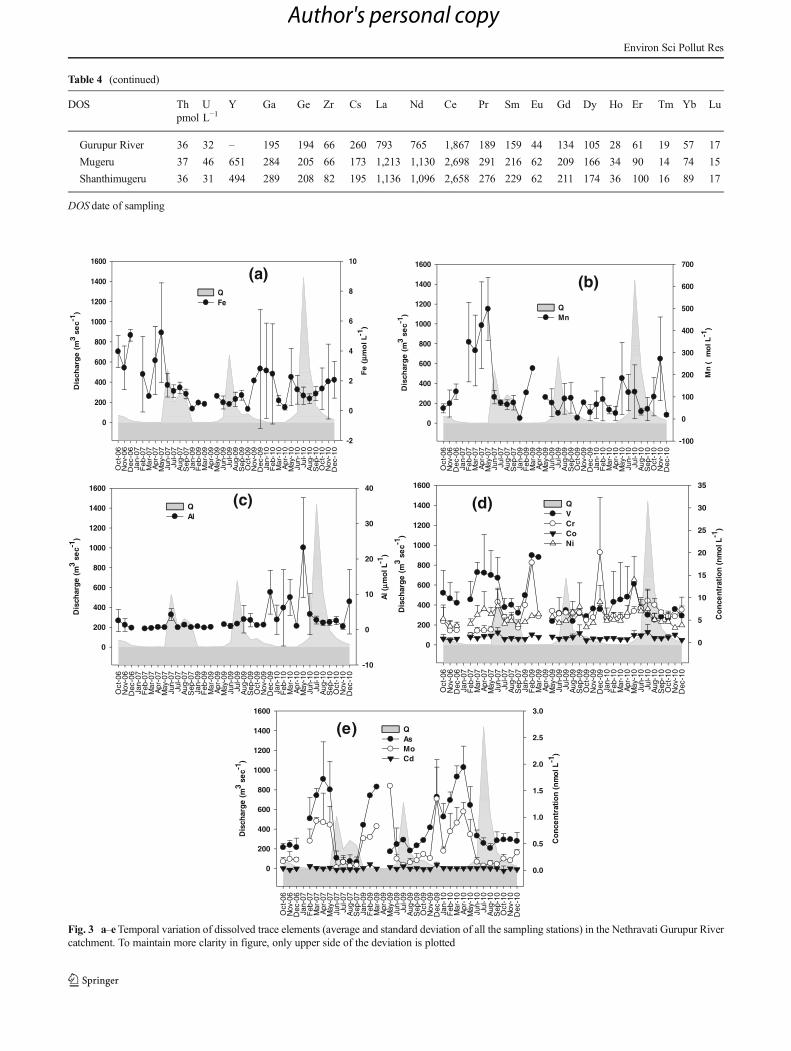
Table 4 (continued)
DOS Th U Y Ga Ge Zr Cs La Nd Ce Pr Sm Eu Gd Dy Ho Er Tm Yb Lupmol L−1
Gurupur River 36 32 – 195 194 66 260 793 765 1,867 189 159 44 134 105 28 61 19 57 17
Mugeru 37 46 651 284 205 66 173 1,213 1,130 2,698 291 216 62 209 166 34 90 14 74 15
Shanthimugeru 36 31 494 289 208 82 195 1,136 1,096 2,658 276 229 62 211 174 36 100 16 89 17
DOS date of sampling
Oct-
06
Nov-
06
Dec-0
6Ja
n-0
7F
eb-0
7M
ar-
07
Apr-
07
May-
07
Jun-0
7Ju
l-07
Aug-0
7S
ep-0
7Ja
n-0
9F
eb-0
9M
ar-
09
Apr-
09
May-
09
Jun-0
9Ju
l-09
Aug-0
9S
ep-0
9O
ct-
09
Nov-
09
Dec-0
9Ja
n-1
0F
eb-1
0M
ar-
10
Apr-
10
May-
10
Jun-1
0Ju
l-10
Aug-1
0S
ep-1
0O
ct-
10
Nov-
10
Dec-1
0
Dis
char
ge
(m
3 se
c-1)
0
200
400
600
800
1000
1200
1400
1600
Fe
(m
ol L-1
)
-2
0
2
4
6
8
10
QFe
(a)
Oct
-06
Nov
-06
Dec
-06
Jan-
07F
eb-0
7M
ar-0
7A
pr-0
7M
ay-0
7Ju
n-07
Jul-0
7A
ug-0
7S
ep-0
7Ja
n-09
Feb
-09
Mar
-09
Apr
-09
May
-09
Jun-
09Ju
l-09
Aug
-09
Sep
-09
Oct
-09
Nov
-09
Dec
-09
Jan-
10F
eb-1
0M
ar-1
0A
pr-1
0M
ay-1
0Ju
n-10
Jul-1
0A
ug-1
0S
ep-1
0O
ct-1
0N
ov-1
0D
ec-1
0
Dis
char
ge
(m
3 se
c-1)
0
200
400
600
800
1000
1200
1400
1600
Mn
(m
ol L
-1)
-100
0
100
200
300
400
500
600
700
QMn
(b)
Oct
-06
Nov
-06
Dec
-06
Jan-
07F
eb-0
7M
ar-0
7A
pr-0
7M
ay-0
7Ju
n-07
Jul-0
7A
ug-0
7S
ep-0
7Ja
n-09
Feb
-09
Mar
-09
Apr
-09
May
-09
Jun-
09Ju
l-09
Aug
-09
Sep
-09
Oct
-09
Nov
-09
Dec
-09
Jan-
10F
eb-1
0M
ar-1
0A
pr-1
0M
ay-1
0Ju
n-10
Jul-1
0A
ug-1
0S
ep-1
0O
ct-1
0N
ov-1
0D
ec-1
0
Dis
char
ge
(m
3 se
c-1)
0
200
400
600
800
1000
1200
1400
1600
Al (
mo
l L-1
)
-10
0
10
20
30
40
QAl
(c)
Oct
-06
Nov
-06
Dec
-06
Jan-
07F
eb-0
7M
ar-0
7A
pr-0
7M
ay-0
7Ju
n-07
Jul-0
7A
ug-0
7S
ep-0
7Ja
n-09
Feb
-09
Mar
-09
Apr
-09
May
-09
Jun-
09Ju
l-09
Aug
-09
Sep
-09
Oct
-09
Nov
-09
Dec
-09
Jan-
10F
eb-1
0M
ar-1
0A
pr-1
0M
ay-1
0Ju
n-10
Jul-1
0A
ug-1
0S
ep-1
0O
ct-1
0N
ov-1
0D
ec-1
0
Dis
char
ge
(m
3 se
c-1)
0
200
400
600
800
1000
1200
1400
1600
Co
nce
ntr
atio
n (
nm
ol L
-1)
0
5
10
15
20
25
30
35
Q V Cr Co Ni
(d)
Oct
-06
Nov
-06
Dec
-06
Jan-
07F
eb-0
7M
ar-0
7A
pr-0
7M
ay-0
7Ju
n-07
Jul-0
7A
ug-0
7S
ep-0
7Ja
n-09
Feb
-09
Mar
-09
Apr
-09
May
-09
Jun-
09Ju
l-09
Aug
-09
Sep
-09
Oct
-09
Nov
-09
Dec
-09
Jan-
10F
eb-1
0M
ar-1
0A
pr-1
0M
ay-1
0Ju
n-10
Jul-1
0A
ug-1
0S
ep-1
0O
ct-1
0N
ov-1
0D
ec-1
0
Dis
char
ge
(m
3 se
c-1)
0
200
400
600
800
1000
1200
1400
1600
Co
nce
ntr
atio
n (
nm
ol L
-1)
0.0
0.5
1.0
1.5
2.0
2.5
3.0
QAsMoCd
(e)
Fig. 3 a–eTemporal variation of dissolved trace elements (average and standard deviation of all the sampling stations) in the Nethravati Gurupur Rivercatchment. To maintain more clarity in figure, only upper side of the deviation is plotted
Environ Sci Pollut Res
Author's personal copy
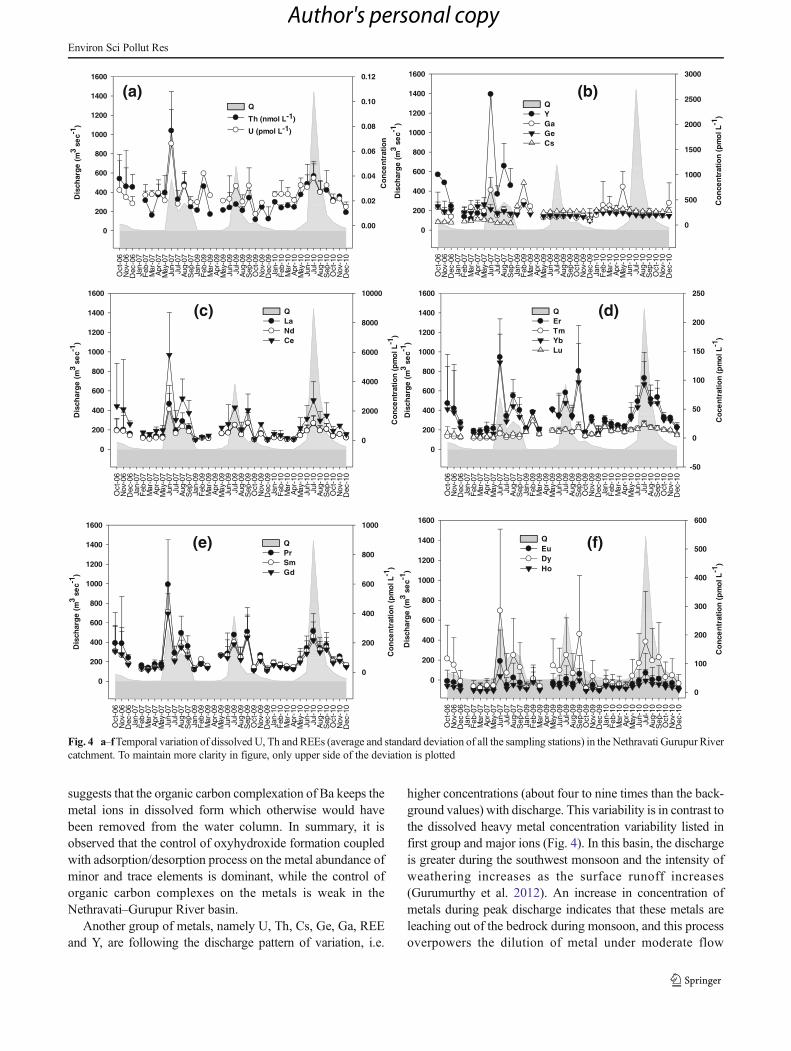
suggests that the organic carbon complexation of Ba keeps themetal ions in dissolved form which otherwise would havebeen removed from the water column. In summary, it isobserved that the control of oxyhydroxide formation coupledwith adsorption/desorption process on the metal abundance ofminor and trace elements is dominant, while the control oforganic carbon complexes on the metals is weak in theNethravati–Gurupur River basin.
Another group of metals, namely U, Th, Cs, Ge, Ga, REEand Y, are following the discharge pattern of variation, i.e.
higher concentrations (about four to nine times than the back-ground values) with discharge. This variability is in contrast tothe dissolved heavy metal concentration variability listed infirst group and major ions (Fig. 4). In this basin, the dischargeis greater during the southwest monsoon and the intensity ofweathering increases as the surface runoff increases(Gurumurthy et al. 2012). An increase in concentration ofmetals during peak discharge indicates that these metals areleaching out of the bedrock during monsoon, and this processoverpowers the dilution of metal under moderate flow
Oct
-06
Nov
-06
Dec
-06
Jan-
07F
eb-0
7M
ar-0
7A
pr-0
7M
ay-0
7Ju
n-07
Jul-0
7A
ug-0
7S
ep-0
7Ja
n-09
Feb
-09
Mar
-09
Apr
-09
May
-09
Jun-
09Ju
l-09
Aug
-09
Sep
-09
Oct
-09
Nov
-09
Dec
-09
Jan-
10F
eb-1
0M
ar-1
0A
pr-1
0M
ay-1
0Ju
n-10
Jul-1
0A
ug-1
0S
ep-1
0O
ct-1
0N
ov-1
0D
ec-1
0
Dis
char
ge
(m
3 se
c-1)
0
200
400
600
800
1000
1200
1400
1600
Co
nce
ntr
atio
n
0.00
0.02
0.04
0.06
0.08
0.10
0.12
Q
Th (nmol L-1)
U (pmol L-1)
(a)
Oct
-06
Nov
-06
Dec
-06
Jan-
07F
eb-0
7M
ar-0
7A
pr-0
7M
ay-0
7Ju
n-07
Jul-0
7A
ug-0
7S
ep-0
7Ja
n-09
Feb
-09
Mar
-09
Apr
-09
May
-09
Jun-
09Ju
l-09
Aug
-09
Sep
-09
Oct
-09
Nov
-09
Dec
-09
Jan-
10F
eb-1
0M
ar-1
0A
pr-1
0M
ay-1
0Ju
n-10
Jul-1
0A
ug-1
0S
ep-1
0O
ct-1
0N
ov-1
0D
ec-1
0
Dis
char
ge
(m
3 se
c-1)
0
200
400
600
800
1000
1200
1400
1600
Co
nce
ntr
atio
n (
pm
ol L
-1)
0
500
1000
1500
2000
2500
3000
QYGaGeCs
(b)O
ct-0
6N
ov-0
6D
ec-0
6Ja
n-07
Feb
-07
Mar
-07
Apr
-07
May
-07
Jun-
07Ju
l-07
Aug
-07
Sep
-07
Jan-
09F
eb-0
9M
ar-0
9A
pr-0
9M
ay-0
9Ju
n-09
Jul-0
9A
ug-0
9S
ep-0
9O
ct-0
9N
ov-0
9D
ec-0
9Ja
n-10
Feb
-10
Mar
-10
Apr
-10
May
-10
Jun-
10Ju
l-10
Aug
-10
Sep
-10
Oct
-10
Nov
-10
Dec
-10
Dis
char
ge
(m
3 se
c-1)
0
200
400
600
800
1000
1200
1400
1600
Co
nce
ntr
atio
n (
pm
ol L
-1)
0
2000
4000
6000
8000
10000
QLa Nd Ce
(c)
Oct
-06
Nov
-06
Dec
-06
Jan-
07F
eb-0
7M
ar-0
7A
pr-0
7M
ay-0
7Ju
n-07
Jul-0
7A
ug-0
7S
ep-0
7Ja
n-09
Feb
-09
Mar
-09
Apr
-09
May
-09
Jun-
09Ju
l-09
Aug
-09
Sep
-09
Oct
-09
Nov
-09
Dec
-09
Jan-
10F
eb-1
0M
ar-1
0A
pr-1
0M
ay-1
0Ju
n-10
Jul-1
0A
ug-1
0S
ep-1
0O
ct-1
0N
ov-1
0D
ec-1
0
Dis
char
ge
(m
3 se
c-1)
0
200
400
600
800
1000
1200
1400
1600
Co
cen
trat
ion
(p
mo
l L-1
)
-50
0
50
100
150
200
250
QEr Tm Yb Lu
(d)
Oct
-06
Nov
-06
Dec
-06
Jan-
07F
eb-0
7M
ar-0
7A
pr-0
7M
ay-0
7Ju
n-07
Jul-0
7A
ug-0
7S
ep-0
7Ja
n-09
Feb
-09
Mar
-09
Apr
-09
May
-09
Jun-
09Ju
l-09
Aug
-09
Sep
-09
Oct
-09
Nov
-09
Dec
-09
Jan-
10F
eb-1
0M
ar-1
0A
pr-1
0M
ay-1
0Ju
n-10
Jul-1
0A
ug-1
0S
ep-1
0O
ct-1
0N
ov-1
0D
ec-1
0
Dis
char
ge
(m
3 se
c-1)
0
200
400
600
800
1000
1200
1400
1600
Co
nce
ntr
atio
n (
pm
ol L
-1)
0
200
400
600
800
1000
QPr Sm Gd
(e)
Oct
-06
Nov
-06
Dec
-06
Jan-
07F
eb-0
7M
ar-0
7A
pr-0
7M
ay-0
7Ju
n-07
Jul-0
7A
ug-0
7S
ep-0
7Ja
n-09
Feb
-09
Mar
-09
Apr
-09
May
-09
Jun-
09Ju
l-09
Aug
-09
Sep
-09
Oct
-09
Nov
-09
Dec
-09
Jan-
10F
eb-1
0M
ar-1
0A
pr-1
0M
ay-1
0Ju
n-10
Jul-1
0A
ug-1
0S
ep-1
0O
ct-1
0N
ov-1
0D
ec-1
0
Dis
char
ge
(m
3 se
c-1)
0
200
400
600
800
1000
1200
1400
1600
Co
nce
ntr
atio
n (
pm
ol L
-1)
0
100
200
300
400
500
600
QEuDy Ho
(f)
Fig. 4 a–fTemporal variation of dissolved U, Th and REEs (average and standard deviation of all the sampling stations) in the Nethravati Gurupur Rivercatchment. To maintain more clarity in figure, only upper side of the deviation is plotted
Environ Sci Pollut Res
Author's personal copy
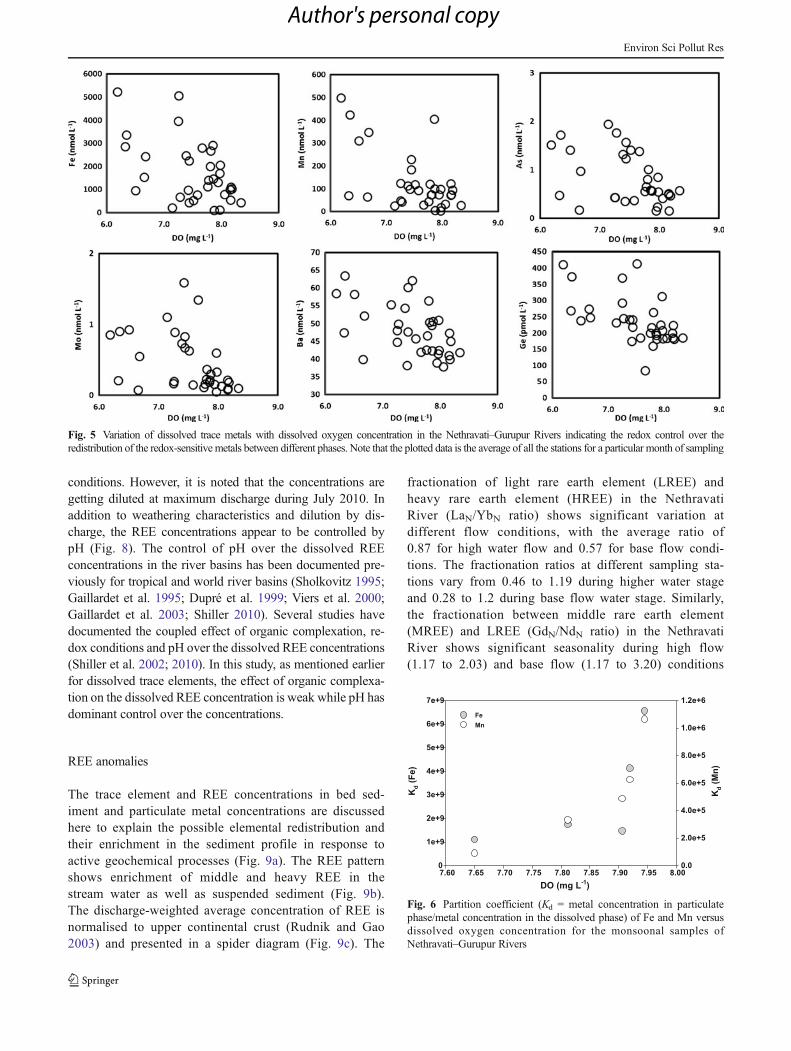
conditions. However, it is noted that the concentrations aregetting diluted at maximum discharge during July 2010. Inaddition to weathering characteristics and dilution by dis-charge, the REE concentrations appear to be controlled bypH (Fig. 8). The control of pH over the dissolved REEconcentrations in the river basins has been documented pre-viously for tropical and world river basins (Sholkovitz 1995;Gaillardet et al. 1995; Dupré et al. 1999; Viers et al. 2000;Gaillardet et al. 2003; Shiller 2010). Several studies havedocumented the coupled effect of organic complexation, re-dox conditions and pH over the dissolved REE concentrations(Shiller et al. 2002; 2010). In this study, as mentioned earlierfor dissolved trace elements, the effect of organic complexa-tion on the dissolved REE concentration is weak while pH hasdominant control over the concentrations.
REE anomalies
The trace element and REE concentrations in bed sed-iment and particulate metal concentrations are discussedhere to explain the possible elemental redistribution andtheir enrichment in the sediment profile in response toactive geochemical processes (Fig. 9a). The REE patternshows enrichment of middle and heavy REE in thestream water as well as suspended sediment (Fig. 9b).The discharge-weighted average concentration of REE isnormalised to upper continental crust (Rudnik and Gao2003) and presented in a spider diagram (Fig. 9c). The
fractionation of light rare earth element (LREE) andheavy rare earth element (HREE) in the NethravatiRiver (LaN/YbN ratio) shows significant variation atdifferent flow conditions, with the average ratio of0.87 for high water flow and 0.57 for base flow condi-tions. The fractionation ratios at different sampling sta-tions vary from 0.46 to 1.19 during higher water stageand 0.28 to 1.2 during base flow water stage. Similarly,the fractionation between middle rare earth element(MREE) and LREE (GdN/NdN ratio) in the NethravatiRiver shows significant seasonality during high flow(1.17 to 2.03) and base flow (1.17 to 3.20) conditions
Fig. 5 Variation of dissolved trace metals with dissolved oxygen concentration in the Nethravati–Gurupur Rivers indicating the redox control over theredistribution of the redox-sensitive metals between different phases. Note that the plotted data is the average of all the stations for a particular month of sampling
DO (mg L-1)7.60 7.65 7.70 7.75 7.80 7.85 7.90 7.95 8.00
Kd (
Fe)
0
1e+9
2e+9
3e+9
4e+9
5e+9
6e+9
7e+9K
d (M
n)
0.0
2.0e+5
4.0e+5
6.0e+5
8.0e+5
1.0e+6
1.2e+6
FeMn
Fig. 6 Partition coefficient (Kd = metal concentration in particulatephase/metal concentration in the dissolved phase) of Fe and Mn versusdissolved oxygen concentration for the monsoonal samples ofNethravati–Gurupur Rivers
Environ Sci Pollut Res
Author's personal copy
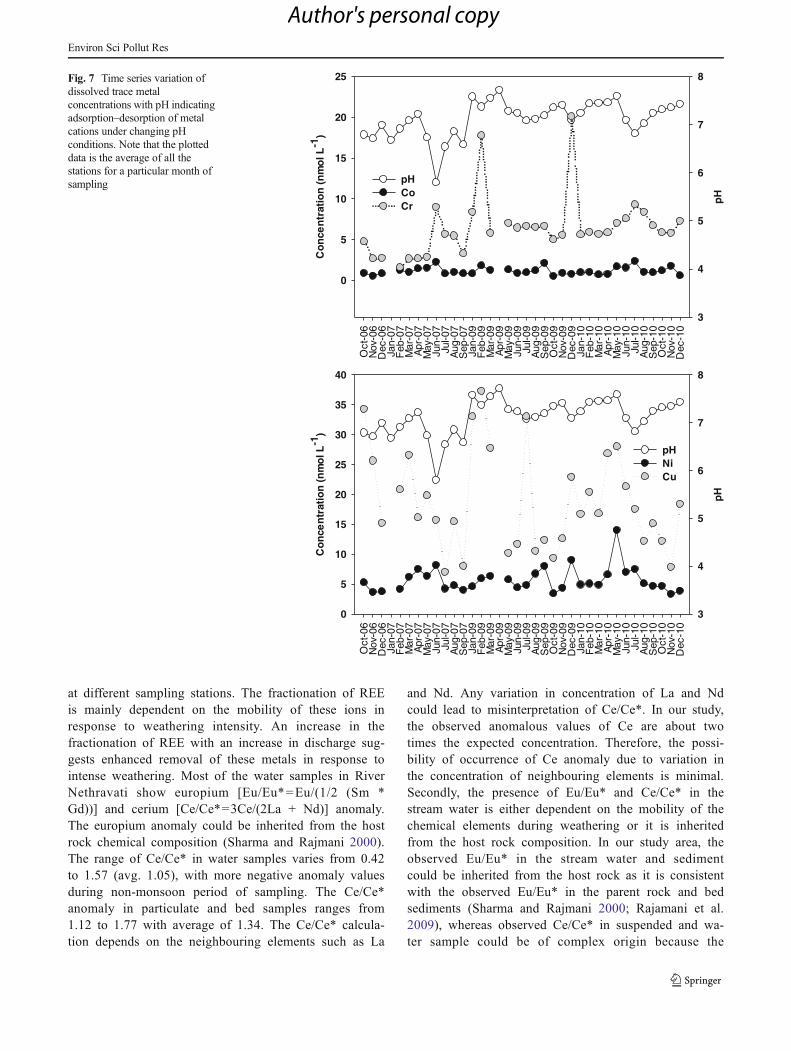
at different sampling stations. The fractionation of REEis mainly dependent on the mobility of these ions inresponse to weathering intensity. An increase in thefractionation of REE with an increase in discharge sug-gests enhanced removal of these metals in response tointense weathering. Most of the water samples in RiverNethravati show europium [Eu/Eu*=Eu/(1/2 (Sm *Gd))] and cerium [Ce/Ce*=3Ce/(2La + Nd)] anomaly.The europium anomaly could be inherited from the hostrock chemical composition (Sharma and Rajmani 2000).The range of Ce/Ce* in water samples varies from 0.42to 1.57 (avg. 1.05), with more negative anomaly valuesduring non-monsoon period of sampling. The Ce/Ce*anomaly in particulate and bed samples ranges from1.12 to 1.77 with average of 1.34. The Ce/Ce* calcula-tion depends on the neighbouring elements such as La
and Nd. Any variation in concentration of La and Ndcould lead to misinterpretation of Ce/Ce*. In our study,the observed anomalous values of Ce are about twotimes the expected concentration. Therefore, the possi-bility of occurrence of Ce anomaly due to variation inthe concentration of neighbouring elements is minimal.Secondly, the presence of Eu/Eu* and Ce/Ce* in thestream water is either dependent on the mobility of thechemical elements during weathering or it is inheritedfrom the host rock composition. In our study area, theobserved Eu/Eu* in the stream water and sedimentcould be inherited from the host rock as it is consistentwith the observed Eu/Eu* in the parent rock and bedsediments (Sharma and Rajmani 2000; Rajamani et al.2009), whereas observed Ce/Ce* in suspended and wa-ter sample could be of complex origin because the
Oct
-06
Nov
-06
Dec
-06
Jan-
07F
eb-0
7M
ar-0
7A
pr-0
7M
ay-0
7Ju
n-07
Jul-0
7A
ug-0
7S
ep-0
7Ja
n-09
Feb
-09
Mar
-09
Apr
-09
May
-09
Jun-
09Ju
l-09
Aug
-09
Sep
-09
Oct
-09
Nov
-09
Dec
-09
Jan-
10F
eb-1
0M
ar-1
0A
pr-1
0M
ay-1
0Ju
n-10
Jul-1
0A
ug-1
0S
ep-1
0O
ct-1
0N
ov-1
0D
ec-1
0
pH
3
4
5
6
7
8
Co
nce
ntr
atio
n (
nm
ol L
-1)
0
5
10
15
20
25
pH Co Cr
Oct
-06
Nov
-06
Dec
-06
Jan-
07F
eb-0
7M
ar-0
7A
pr-0
7M
ay-0
7Ju
n-07
Jul-0
7A
ug-0
7S
ep-0
7Ja
n-09
Feb
-09
Mar
-09
Apr
-09
May
-09
Jun-
09Ju
l-09
Aug
-09
Sep
-09
Oct
-09
Nov
-09
Dec
-09
Jan-
10F
eb-1
0M
ar-1
0A
pr-1
0M
ay-1
0Ju
n-10
Jul-1
0A
ug-1
0S
ep-1
0O
ct-1
0N
ov-1
0D
ec-1
0
pH
3
4
5
6
7
8
Co
nce
ntr
atio
n (
nm
ol L
-1)
0
5
10
15
20
25
30
35
40
pH Ni Cu
Fig. 7 Time series variation ofdissolved trace metalconcentrations with pH indicatingadsorption–desorption of metalcations under changing pHconditions. Note that the plotteddata is the average of all thestations for a particular month ofsampling
Environ Sci Pollut Res
Author's personal copy
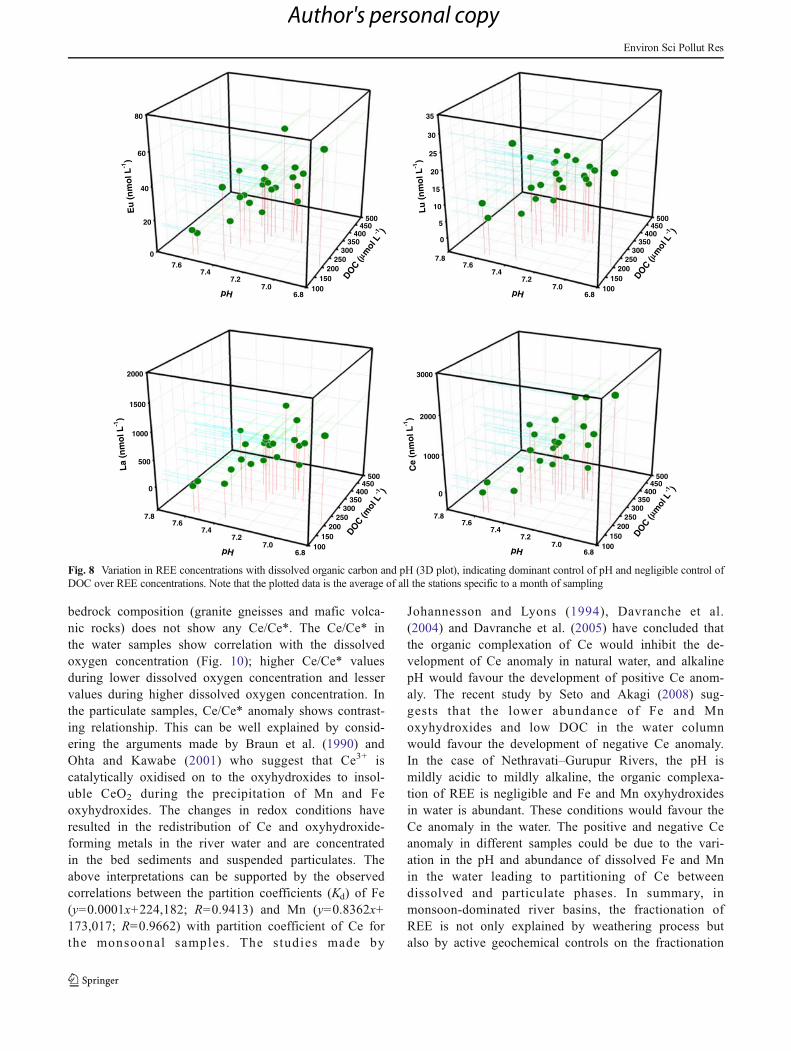
bedrock composition (granite gneisses and mafic volca-nic rocks) does not show any Ce/Ce*. The Ce/Ce* inthe water samples show correlation with the dissolvedoxygen concentration (Fig. 10); higher Ce/Ce* valuesduring lower dissolved oxygen concentration and lesservalues during higher dissolved oxygen concentration. Inthe particulate samples, Ce/Ce* anomaly shows contrast-ing relationship. This can be well explained by consid-ering the arguments made by Braun et al. (1990) andOhta and Kawabe (2001) who suggest that Ce3+ iscatalytically oxidised on to the oxyhydroxides to insol-uble CeO2 during the precipitation of Mn and Feoxyhydroxides. The changes in redox conditions haveresulted in the redistribution of Ce and oxyhydroxide-forming metals in the river water and are concentratedin the bed sediments and suspended particulates. Theabove interpretations can be supported by the observedcorrelations between the partition coefficients (Kd) of Fe(y=0.0001x+224,182; R=0.9413) and Mn (y=0.8362x+173,017; R=0.9662) with partition coefficient of Ce forthe monsoonal samples. The studies made by
Johannesson and Lyons (1994), Davranche et al.(2004) and Davranche et al. (2005) have concluded thatthe organic complexation of Ce would inhibit the de-velopment of Ce anomaly in natural water, and alkalinepH would favour the development of positive Ce anom-aly. The recent study by Seto and Akagi (2008) sug-gests that the lower abundance of Fe and Mnoxyhydroxides and low DOC in the water columnwould favour the development of negative Ce anomaly.In the case of Nethravati–Gurupur Rivers, the pH ismildly acidic to mildly alkaline, the organic complexa-tion of REE is negligible and Fe and Mn oxyhydroxidesin water is abundant. These conditions would favour theCe anomaly in the water. The positive and negative Ceanomaly in different samples could be due to the vari-ation in the pH and abundance of dissolved Fe and Mnin the water leading to partitioning of Ce betweendissolved and particulate phases. In summary, inmonsoon-dominated river basins, the fractionation ofREE is not only explained by weathering process butalso by active geochemical controls on the fractionation
0
20
40
60
80
100150
200250
300350
400450
500
6.87.0
7.27.4
7.6
Eu
(n
mo
l L-1
)
DOC (
mol
L-1 )
pH
0
5
10
15
20
25
30
35
100150
200250
300350
400450
500
6.87.0
7.27.4
7.67.8
Lu
(n
mo
l L-1
)
DOC (
mol
L-1 )
pH
0
500
1000
1500
2000
100150
200250
300350
400450
500
6.87.0
7.27.4
7.67.8
La
(nm
ol L
-1)
DOC (m
ol L
-1 )
pH
0
1000
2000
3000
100150
200250
300350
400450
500
6.87.0
7.27.4
7.67.8
Ce
(nm
ol L
-1)
DOC (
mol
L-1 )
pH
Fig. 8 Variation in REE concentrations with dissolved organic carbon and pH (3D plot), indicating dominant control of pH and negligible control ofDOC over REE concentrations. Note that the plotted data is the average of all the stations specific to a month of sampling
Environ Sci Pollut Res
Author's personal copy
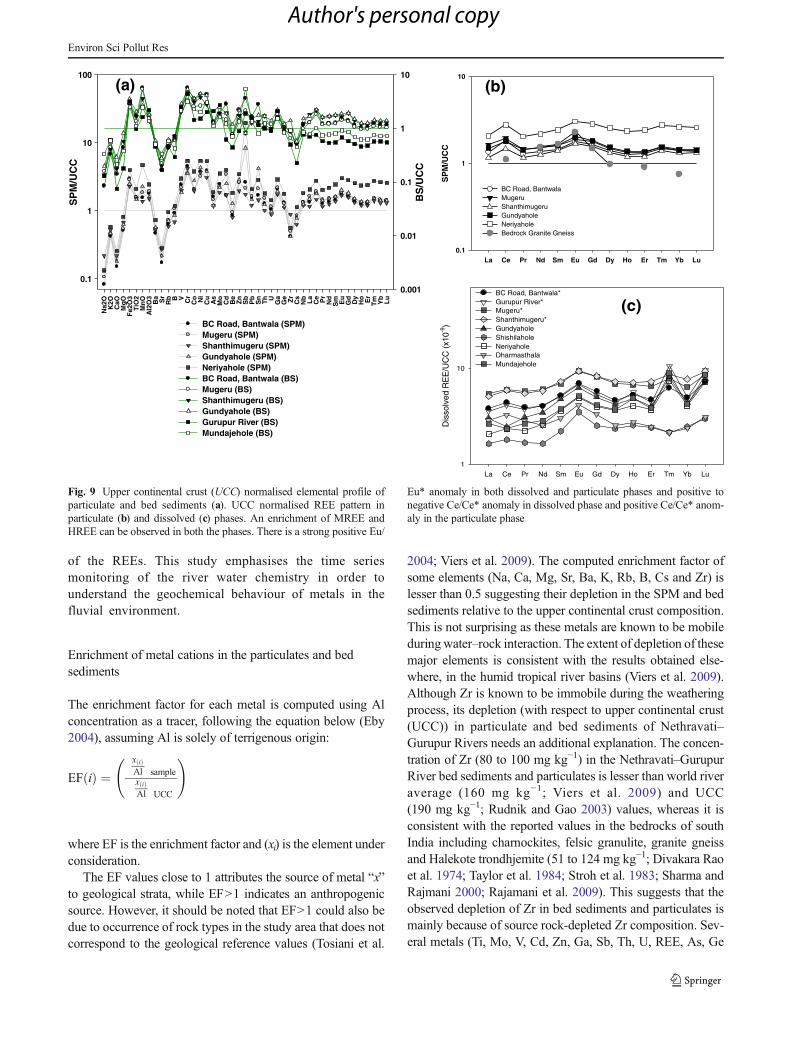
of the REEs. This study emphasises the time seriesmonitoring of the river water chemistry in order tounderstand the geochemical behaviour of metals in thefluvial environment.
Enrichment of metal cations in the particulates and bedsediments
The enrichment factor for each metal is computed using Alconcentration as a tracer, following the equation below (Eby2004), assuming Al is solely of terrigenous origin:
EF ið Þ ¼x ið ÞAl
� �sample
x ið ÞAl
� �UCC
!
where EF is the enrichment factor and (xi) is the element underconsideration.
The EF values close to 1 attributes the source of metal “x”to geological strata, while EF>1 indicates an anthropogenicsource. However, it should be noted that EF>1 could also bedue to occurrence of rock types in the study area that does notcorrespond to the geological reference values (Tosiani et al.
2004; Viers et al. 2009). The computed enrichment factor ofsome elements (Na, Ca, Mg, Sr, Ba, K, Rb, B, Cs and Zr) islesser than 0.5 suggesting their depletion in the SPM and bedsediments relative to the upper continental crust composition.This is not surprising as these metals are known to be mobileduringwater–rock interaction. The extent of depletion of thesemajor elements is consistent with the results obtained else-where, in the humid tropical river basins (Viers et al. 2009).Although Zr is known to be immobile during the weatheringprocess, its depletion (with respect to upper continental crust(UCC)) in particulate and bed sediments of Nethravati–Gurupur Rivers needs an additional explanation. The concen-tration of Zr (80 to 100 mg kg−1) in the Nethravati–GurupurRiver bed sediments and particulates is lesser than world riveraverage (160 mg kg−1; Viers et al. 2009) and UCC(190 mg kg−1; Rudnik and Gao 2003) values, whereas it isconsistent with the reported values in the bedrocks of southIndia including charnockites, felsic granulite, granite gneissand Halekote trondhjemite (51 to 124 mg kg−1; Divakara Raoet al. 1974; Taylor et al. 1984; Stroh et al. 1983; Sharma andRajmani 2000; Rajamani et al. 2009). This suggests that theobserved depletion of Zr in bed sediments and particulates ismainly because of source rock-depleted Zr composition. Sev-eral metals (Ti, Mo, V, Cd, Zn, Ga, Sb, Th, U, REE, As, Ge
La Ce Pr Nd Sm Eu Gd Dy Ho Er Tm Yb Lu
SP
M/U
CC
0.1
1
10
BC Road, BantwalaMugeruShanthimugeruGundyaholeNeriyaholeBedrock Granite Gneiss
(b)
La Ce Pr Nd Sm Eu Gd Dy Ho Er Tm Yb Lu
Dis
solv
ed R
EE
/UC
C (
x10-9
)
1
10
BC Road, Bantwala*Gurupur River*Mugeru*Shanthimugeru*GundyaholeShishilaholeNeriyaholeDharmasthalaMundajehole
(c)Na2
OK
2OC
aOM
gO
Fe2
O3
TiO
2M
nO
Al2
O3
Ba Sr
Rb B V Cr
Co Ni
Cu
As
Mo
Cd
Be
Zn
Sb
Pb
Sn
Th U
Ga
Ge Zr
Cs
Nb La
Ce Pr
Nd
Sm Eu
Gd
Dy
Ho Er
Tm Yb
Lu
SP
M/U
CC
0.1
1
10
100
BS
/UC
C
0.001
0.01
0.1
1
10
BC Road, Bantwala (SPM)Mugeru (SPM)Shanthimugeru (SPM)Gundyahole (SPM)Neriyahole (SPM)BC Road, Bantwala (BS)Mugeru (BS)Shanthimugeru (BS)Gundyahole (BS)Gurupur River (BS)Mundajehole (BS)
(a)
Fig. 9 Upper continental crust (UCC) normalised elemental profile ofparticulate and bed sediments (a). UCC normalised REE pattern inparticulate (b) and dissolved (c) phases. An enrichment of MREE andHREE can be observed in both the phases. There is a strong positive Eu/
Eu* anomaly in both dissolved and particulate phases and positive tonegative Ce/Ce* anomaly in dissolved phase and positive Ce/Ce* anom-aly in the particulate phase
Environ Sci Pollut Res
Author's personal copy

and Pb—in the increasing order of EF) with enrichment factorranging between 0.5 and 1.5 form the second group of metals.The concentrations of these metals are close to the uppercontinental crust values suggesting lesser mobility duringweathering and transport/negligible anthropogenic contribu-tion. However, it is worth noting that the U, Th and REE(except Ce) are slightly depleted compared to the world riveraverage. This could be due to an increase in the fractionationof these metals due to intense weathering process. The thirdgroup of metals which are enriched (EF>1.5) relative to theupper continental crust are Fe, Mn, Cr, Ni and Cu. Heavymetals such as Cu, Ni and Cr are showing EF>2 suggestingenrichment of these metals with respect to UCC composition.The enrichment could be due to geochemical redistribution bygeochemical processes or due to additional supply from hu-man activity. The enrichment of these metals due to humanactivity is unlikely as suggested by active geochemical redis-tribution processes in the river basin. Fe and Mn are showingenrichment in the particulates and bed sediments which couldbe induced by the redox redistribution of metals as discussedearlier. The manganese in suspended particulates is lessenriched compared to bed sediments. This could be due toseasonal difference in the samples.
Estimated elemental fluxes into the Arabian Sea
The annual flux of trace elements to the Arabian Sea isestimated using the discharge data from four river gaugingstations located across Nethravati River at BC Road, Bantwala(outlet), Mugeru (Nethravati River at Uppinangadi),Shanthimugeru (Kumaradhara River at Uppinangadi) andone station across Gurupur river located at Adoor. Monthlyelemental composition and daily discharge data are used forcalculating the fluxes. The calculated elemental fluxes aretabulated in Table 5. Since the river discharge is highly
seasonal, about 90 % of the dissolved load is being dischargedbetween June and October. Although the discharge fluxes ofmetals from these two rivers into the Arabian Sea are negligi-ble, the elemental fluxes may have significant effect on thecoastal and near shore biogeochemical cycles of metals.
Conclusions
A systematic time series monitoring of dissolved trace ele-ments and REEs along with physicochemical parameters car-ried out over a period of 3 years is used to understand thetemporal variation in the metal concentrations in a monsoon-dominated humid tropical river basin of Southwestern India.There is a strong seasonal variability in dissolved trace ele-ment and REE concentrations and forms two distinct groupsof metal assemblages having contrasting variability. In addi-tion to discharge and weathering characteristics, the biogeo-chemical processes are responsible for the variability of metalsin the basin which include redox reactions (Fe, Mn, As, Mo,Ba and Ce) and pH-mediated adsorption/desorption reactions(Ni, Co, Cr, Co and REEs). The abundance of oxyhydroxidesas a result of redox transformation of Fe and Mn could bedriving the geochemical redistribution of metals in the river.Cerium anomaly in the dissolved phase (both negative andpositive anomaly) and particulate phase (positive anomaly) isobserved in the river basin. This could be induced by redoxreactions under acidic–neutral pH and lesser organic carbonabundance. Unlike other tropical and major world rivers, theeffect of organic complexation on metal variability is negligi-ble in the river basin. This study emphasises the importance oftime series data in understanding the geochemical behaviourof metals in a river basin and in estimating the metal fluxes tothe adjacent sea.
DO (mg L-1)
6.0 6.5 7.0 7.5 8.0 8.5
Ce/
Ce*
0.2
0.4
0.6
0.8
1.0
1.2
1.4
1.6
1.8
(a)
DO (mg L-1)
7.2 7.4 7.6 7.8 8.0 8.2 8.4 8.6
Ce/
Ce*
(S
PM
)
0.9
1.0
1.1
1.2
1.3
1.4
1.5
ShanthimugeruBC Road, BantwalaMugeruGundyaholeNeriyahole
(b)
Fig. 10 Variation of Ce/Ce* anomaly in dissolved (a) and particulate (b)phase with dissolved oxygen concentration in the Nethravati River basin.The particulate samples are only frommonsoon months of sampling from
different sampling stations. Note that the plotted data is the average of allthe stations for a particular month of sampling
Environ Sci Pollut Res
Author's personal copy

Table 5 Weighted average concentration and specific fluxes of dissolved major, minor and trace elements in the Nethravati–Gurupur River basin
Metal Unit BCR GR MNR SMRK Unit BCR GR MNR SMKRWeighted average concentration Specific fluxes
Fe μmol L−1 0.9 0.9 1.3 1.4 t km−2 year−1 0.16 0.16 0.20 0.22
Al μmol L−1 2.7 2.1 2.6 2.5 t km−2 year−1 0.24 0.19 0.19 0.20
B μmol L−1 565 530 429 504 kg km−2 year−1 20.4 18.7 12.5 16.0
Ti nmol L−1 5.9 1.2 6.2 8.9 kg km−2 year−1 0.95 0.19 0.80 1.25
V nmol L−1 8.5 4.1 6.8 7.1 kg km−2 year−1 1.45 0.69 0.94 1.06
Cr nmol L−1 6.9 6.8 7.0 8.1 kg km−2 year−1 1.21 1.15 0.98 1.24
Co nmol L−1 1.1 1.0 1.6 2.5 kg km−2 year−1 0.22 0.19 0.26 0.43
Ni nmol L−1 5.2 4.4 5.3 8.9 kg km−2 year−1 1.03 0.85 0.84 1.53
Cu nmol L−1 16 11 14 17 kg km−2 year−1 3.40 2.33 2.40 3.12
As nmol L−1 0.4 0.6 0.4 0.3 kg km−2 year−1 0.10 0.15 0.08 0.08
Rb nmol L−1 14.0 13.3 11.5 12.7 kg km−2 year−1 4.00 3.69 2.66 3.19
Mo nmol L−1 0.1 0.1 0.1 0.1 kg km−2 year−1 0.05 0.02 0.02 0.02
Cd nmol L−1 0.0 0.0 0.0 0.0 kg km−2 year−1 0.012 0.010 0.009 0.012
Sn nmol L−1 0.3 3.8 0.2 0.2 kg km−2 year−1 0.12 1.48 0.07 0.09
Ba nmol L−1 42.1 28.7 38.0 44.2 kg km−2 year−1 19.3 12.8 14.1 17.8
Th nmol L−1 0.0 0.0 0.0 0.0 kg km−2 year−1 0.02 0.03 0.02 0.02
U pmol L−1 28 32 46 31 kg km−2 year−1 0.02 0.02 0.03 0.02
Sr nmol L−1 150 101 133 134 kg km−2 year−1 44.1 28.9 31.5 34.5
Mn nmol L−1 40 40 86 143 kg km−2 year−1 7.32 7.17 12.75 23.15
Y pmol L−1 519 651 494 kg km−2 year−1 0.15 – 0.16 0.13
Ga pmol L−1 265 195 284 289 kg km−2 year−1 0.062 0.044 0.054 0.059
Ge pmol L−1 219 194 205 208 kg km−2 year−1 0.053 0.046 0.040 0.044
Zr pmol L−1 68 66 66 82 kg km−2 year−1 0.021 0.020 0.016 0.022
Cs pmol L−1 203 260 173 195 kg km−2 year−1 0.090 0.112 0.062 0.076
Nb pmol L−1 75 151 115 93 kg km−2 year−1 0.023 0.046 0.028 0.025
Rh pmol L−1 0.4 0.0 0.1 0.2 kg km−2 year−1 0.000 – 0.000 0.000
La pmol L−1 854 793 1,213 1,136.1 kg km−2 year−1 0.397 0.359 0.455 0.464
Nd pmol L−1 759 765 1,130 1,095.9 kg km−2 year−1 0.366 0.359 0.441 0.464
Ce pmol L−1 1,986 1,867 2,698 2,658.5 kg km−2 year−1 0.931 0.851 1.022 1.094
Pr pmol L−1 198 189 291 276.1 kg km−2 year−1 0.093 0.087 0.111 0.114
Sm pmol L−1 162 159 216 228.5 kg km−2 year−1 0.082 0.078 0.088 0.101
Eu pmol L−1 46 44 62 61.7 kg km−2 year−1 0.023 0.022 0.025 0.028
Gd pmol L−1 148 134 209 210.6 kg km−2 year−1 0.078 0.069 0.089 0.097
Tb pmol L−1 9 0 13 9 kg km−2 year−1 0.005 – 0.006 0.004
Dy pmol L−1 112 105 166 174 kg km−2 year−1 0.061 0.055 0.073 0.083
Ho pmol L−1 27 28 34 36 kg km−2 year−1 0.015 0.015 0.015 0.017
Er pmol L−1 65 61 90 100 kg km−2 year−1 0.036 0.033 0.041 0.049
Tm pmol L−1 11 19 14 16 kg km−2 year−1 0.006 0.010 0.006 0.008
Yb pmol L−1 57 57 74 89 kg km−2 year−1 0.033 0.032 0.035 0.045
Lu pmol L−1 13 17 15 17 kg km−2 year−1 0.008 0.010 0.007 0.009
Hf pmol L−1 12 22 14 13 kg km−2 year−1 0.007 0.013 0.007 0.007
Zn nmol L−1 25 15 24 38 kg km−2 year−1 5.506 3.263 4.252 7.391
Sb nmol L−1 0.1 0.1 0.1 0.1 kg km−2 year−1 0.045 0.041 0.020 0.025
Pb nmol L−1 0.3 0.6 0.4 0.5 kg km−2 year−1 0.197 0.389 0.233 0.305
ΣREE nmol L−1 4,447 4,240 6,226 6,107 kg km−2 year−1 2.714 2.521 2.916 3.107
BCRBC Road, Bantwala, GRGurupur River, MNRMugeru (tributary of Nethravati River), SMKR Shanthimugeru (tributary of Kumaradhara River)
Environ Sci Pollut Res
Author's personal copy

Acknowledgments This work is funded by the Ministry of Environ-ment and Forests (19/36/2006-RE), Government of India, through aresearch project to KB. INSU-EC2CO (CNRS) and IRD, France are alsothanked for partially funding this research work. We thank all technicalstaff at GET, Toulouse for their help during the analysis of samples. Thefirst author (GPG) is thankful to the Embassy of France in India and theInternational Association of Geochemistry for providing Sandwich Ph.D.fellowship to do a part of this work at GET, Toulouse, France and forproviding Ph.D. Student Research Grant, respectively. This work is partof GPG’s Ph D thesis submitted to Manipal University, Manipal and thework is carried out at Department of Civil Engineering, Manipal Instituteof Technology, Manipal University, Manipal, India.
References
Ajmal M, Khan MA, Nomani AA (1985) Distribution of heavy metals inwater and sediments of selected sites of Yamuna River (India).Environ Monit Assess 5(2):205–214
Aries S, Valladon M, Polve M, Dupré B (2000) A routine method foroxide and hydroxide interference corrections in ICP-MS chemicalanalysis of environmental and geological samples. GeostandNewslett J Geostand Geoanal 24:19–31
Balistrieri LS, Murray JW, Paul B (1994) Geochemical cycling of traceelements in a biogenic meromictic lake. Geochim Cosmochim Acta58(19):3993–4008
Bhaskar Rao YJ, Naha K, Srinivasan R, Gopalan K (1991) Geology,geochemistry and geochronology of the Archean Peninsular Gneissaround Gorur, Hassan District, Karnataka, India. Indian Acad Sci(Earth and Planetary Sciences) Proceedings 100:399–412
Braun J-J, Pagel M, Muller JP, Bilong P, Michard A, Guillet B (1990)Cerium anomalies in lateritic profiles. Geochim Cosmochim Acta51:597–605
Braun J-J, NdamNgoupayou JR, Viers J, Dupré B, Bedimo Bedimo J-P,Boeglin J-L, Robain H, Nyeck B, Freydier R, SighaNkamdjou L,Rouiller J, Muller J-P (2005) Present weathering rates in a humidtropical watershed: Nsimi, South Cameroon. Geochim CosmochimActa 69:357–387
Brown DA, Sherriff BL, Sawicki JA, Sparling R (1999a) Precipitation ofiron minerals by a natural microbial consortium. GeochimCosmochim Acta 63:2163–2169
Brown GE, Henrich VE, Casey WH, Clark DL, Eggleston C, Felmy A,Goodman DW, Gratzel M, Maciel G, McCarthy MI, Nealson KH,Sverjensky DA, Toney MF, Zachara JM (1999b) Metal oxide sur-faces and their interactions with aqueous solutions and microbialorganisms. Chem Rev 99:77–174
Cao M, Woodward FI (1998) Dynamic responses of terrestrial ecosystemcarbon cycling to global climate change. Nature 393:249–252
Chakrapani GJ, Subramanian V (1996) Fractionation of heavy metals andphosphorus in suspended sediments of the Yamuna River, India.Environ Monit Assess 43(2):117–124
Davranche M, Pourret O, Gruau G, Dia A (2004) Impact of humatecomplexation on the adsorption of REE onto Fe oxyhydroxide. JColloid Interface Sci 277:271–279
Davranche M, Pourret O, Gruau G, Dia A, Le Coz-Bouhnik M (2005)Adsorption of REE (III)–humate complexes onto MnO2: experi-mental evidence for cerium anomaly and lanthanide tetrad effectsuppression. Geochim Cosmochim Acta 69:4825–4835
Divakra Rao V, Naqvi SM, Sathyanarayana K, Hussain SM (1974)Geochemistry and origin of the Peninsular Gneisses of Karnataka.J Geol Soc India 15:270–277
Dupré B, Viers J, Dandurand JL, PolveM, Bénézeth P, Vervier P, Braun J-J (1999) Major and trace elements associated with colloids in
organic-rich river waters: ultrafiltration of natural and spiked solu-tions. Chem Geol 160(1):63–80
Dwarakish G S, Abdu Rahiman K U, Natesan U (2009) Changes in riverhydrology and coastal sedimentation by dams in Periyar Riverbasin Keraa, India. Proceedings of the 4th IASME/WSEASInternational Conference on Water Resources, Hydraulics andHydrology (WHH-09).
Eby GN (2004) Principles of environmental geochemistry, 1st edn.Brooks Cole, Stamford
Elbaz-Poulichet F, Seyler P, Maurice-Bourgoin L, Guyot JL, Dupuy C(1999) Trace element geochemistry in the upper Amazon drainagebasin (Bolivia). Chem Geol 157:319–334
Froelich P, Klinkhammer GP, Bender MAA, Luedtke NA, Heath GR,Cullen D, Maynard V (1979) Early oxidation of organic matter inpelagic sediments of the eastern equatorial Atlantic: suboxic diagen-esis. Geochim Cosmochim Acta 43(7):1075–1090
Fuller CC, Harvey JR (2000) Reactive uptake of trace metals in thehyporheic zone of a mining-contaminated stream, Pinal Creek,Arizona. Environ Sci Technol 34:1150–1155
Gaillardet J, Dupré B, Allègre CJ (1995) A global geochemical massbudget applied to the Congo Basin Rivers: erosion rates and conti-nental crust composition. Geochim CosmochimActa 59:3469–3485
Gaillardet J, Viers J, Dupré B (2003) Trace element in river waters. In:Drever JI, Holland HD, Turekian KK (eds) Surface and groundwa-ter, weathering, erosion and soils, treatise on geochemistry, vol. 5.Pergamon, New York
Geological Survey of India (1981) Geological and mineral map ofKarnataka and Goa. Compiled by Swaminath et al. published underthe direction of Krishnamurthy, V.S., Director General, GeologicalSurvey of India
Gunnars A, Blomqvist S, Johansoon P, Andersson C (2002) Formation ofFe(III) oxyhydroxide colloids in freshwater and brackish seawater,with incorporation of phosphate and calcium. Geochim CosmochimActa 66:745–758
Gurumurthy GP, Balakrishna K, Riotte J, Audry S, Braun JJ, ShankarUHN, Manjunatha BR (2012) Controls on intense silicateweathering in a tropical river, Southwestern India. Chem Geol300–301:61–69
Heimburger A, Tharaud M, Monna F, Losno R, Desboeufs K, NguyenEB (2013) SLRS-5 elemental concentrations of thirty-three uncerti-fied elements deduced from SLRS-5/SLRS-4 ratios. GeostandGeoanal Res 37(1):77–85
Honeyman BD, Santschi PH (1988) Metals in aquatic systems. EnvironSci Technol 22:862–871
Ingri J (1985) Geochemistry of ferromanganese concretions and associ-ated sediments in the Gulf of Bothnia. Ph.D. thesis, LuleåUniversity, Luleå, Sweden
Ingri J, Widerlund A (1994) Uptake of alkali and alkaline-earth elementson suspended iron and manganese in the Kalix River, northernSweden. Geochim Cosmochim Acta 58:5433–5442
Jenkinson DS, Adams DE, Wild A (1991) Model estimates of CO2
emissions from soil in response to global warming. Nature 351:304–306
Johannesson KH, LyonsWB (1994) The rare earth element geochemistryof Mono Lake water and the importance of carbonate complexing.Limnol Oceanogr 39:1141–1154
Kirschbaum MUF (1995) The temperature dependence of soil organicmatter decomposition, and the effect of global warming on soilorganic C storage. Soil Biol Biochem 27(6):753–760
Lion LW, Altmann RS, Leckie JO (1982) Trace-metal adsorption char-acteristics of estuarine particulate matter: evaluation of contributionsof iron/manganese oxide and organic surface coatings. Environ SciTechnol 16(10):660–666
Ludwig W, Probst J-L, Kempe S (1996) Predicting the oceanic input oforganic carbon by continental erosion. Glob Biogeochem Cycles10(1):23–41
Environ Sci Pollut Res
Author's personal copy
Morel FMM, Hering JG (1993) Principles and applications of aquaticgeochemistry. Wiley, New York
Morford JL, Emerson S (1999) The geochemistry of redox sensitive tracemetals in sediments. Geochim Cosmochim Acta 63(11):1735–1750
Neubraure U, Nowack B, Furrer G, Schulin R (2000) Heavy metalsorption on clay minerals affected by the siderophoredesferrrioxamine B. Environ Sci Technol 34:2749–2755
NimickDA, Gammons CH, Cleasby TE,Madison JP, Skaar D, Brick CM(2003) Diel cycles in dissolved metal concentrations in streams:occurrence and possible causes.Water Resour Res 39(9):1247–1259
Nimick DA, Cleasby TE, McCleskey RB (2005) Seasonality of dielcycles of dissolved trace-metal concentrations in a RockyMountain stream. Environ Geol 47:603–614
Nimick DA, Gammons CH, Parker SR (2010) Diel biogeochemicalprocesses and their effect on the aqueous chemistry of streams: areview. Chem Geol 283:3–17
Ohta A, Kawabe I (2001) REE (III) adsorption onto Mn dioxide (δ-MnO2) and Fe oxyhydroxide: Ce (III) oxidation by δ-MnO2.Geochim Cosmochim Acta 65(5):695–703
Probst JL, Nkounkou RR, Krempp G, Bricquet JP, Thiebaux JC, OlivryJC (1992) Dissolved major elements exported by the Congo and theUbangui rivers during the period 1987–1989. J Hydrol 135:237–257
Rajamani V, Tripathi JK, Malviya VP (2009) Weathering of lower crustalrocks in the Kaveri river catchment, southern India: implications tosediment geochemistry. Chem Geol 265:410–419
Ramesh RV, Subramanian, Van Grieken R (1990) Heavy metal distribu-tion in sediments of Krishna river basin, India. Environ Geol WaterSci 19(3):207–216
Rao KL (1979) India’s water wealth. Orient Longman, New Delhi, p 276Rengarajan R, SarinMM (2004) Distribution of rare earth elements in the
Yamuna and the Chambal rivers, India. Geochem J 38(6):551–569Rudnik RL, Gao S (2003) Composition of the continental crust. In:
Drever JI, Holland HD, Turekian KK (eds) Surface and groundwa-ter, weathering, erosion and soils, vol 5. Treatise on geochemistry.Pergamon, New York
Seto M, Akagi T (2008) Chemical condition for the appearance of anegative Ce anomaly in stream waters and groundwaters. GeochemJ 42:371–380
Sharma A, Rajmani V (2000) Weathering of gneissic rocks in the upperreaches of Cauvery River, south India: implications to neotectonicsof the region. Chem Geol 166:203–223
Shiller AM (1997) Dissolved trace elements in the Mississippi River:seasonal, interannual, and decadal variability. Geochim CosmochimActa 61:4321–4330
Shiller AM (2002) Seasonality of dissolved rare earth elements in thelower Mississippi River. Geochem Geophys Geosyst 3(11):1–14
Shiller AM (2010) Dissolved rare earth elements in a seasonally snow-covered, alpine/subalpine watershed, Loch Vale, Colorado.Geochim Cosmochim Acta 74:2040–2052
Shiller AM, Mao L (2000) Dissolved vanadium in river water: effect ofsilicate weathering. Chem Geol 165:13–22
Sholkovitz ER (1995) The aquatic chemistry of rare earth elements inrivers and estuaries. Aquat Chem 1:1–34
Sholkovitz ER, Copland D (1982) The chemistry of suspended matter inestuary water, a biologically productive lake with seasonally anoxichypolimnion. Geochim Cosmochim Acta 46:393–410
Sigg L (1985) Metal transfer mechanisms in lakes; the role of settlingparticles. In: Chemical processes in lakes. Wiley, New York, pp283–310 (ed. W. Stumm)
Stroh P T, Monrad J R, Fullagar P D, Naqvi S M, Hussain S M andRogers JJW, (1983) 3000MYold Halekote trondhjemite: a record ofstabilization of the Dharwar craton. In: Naqvi SM, Rogers JJW (eds)Precambrian of South India: Geological Society of IndiaMemorandum 4, 365–376
Stummeyer J, Marchig V, Knabe W (2002) The composition ofsuspended matter from Ganges-Brahmaputra sediment dispersalsystem during low sediment transport season. Chem Geol 185:125–147
SubramanianV, BikshamG, Ramesh R (1987) Environmental geology ofpeninsular river basins of India. J Geol Soc India 29:205–220
Sudhir K, Jose G, Prakasha H C, Gowda J N A (2006) Organic carbonstatus of a laterite and a red soil under long term rice cultivation inKarnataka, India. 18th World Congress of Soil Science, July 9–15,2006 Philadelphia, Pennsylvania, USA
Taylor P N, Moorbath S, Chadwick B, Ramakrishnan M and ViswanathaM N (1984) Petrography, chemistry and isotopic ages of PeninsularGneiss, Dharwar acid volcanic rocks and the Chitradurga Granitewith special reference to the late Archean evolution of the KarnatakaCraton, southern India. Precambrian Research, 23, 349-375
Tessier A, Fortin D, Belzile N, Devitre BR (1996) Metal sorption todiagenetic iron and manganese oxyhydroxides and associated or-ganic matter: narrowing the between field and laboratory measure-ments. Geochim Cosmochim Acta 60:387–404
Tosiani T, Loubet M, Viers J, Yanes C, Dupré B, Tapia J (2004) Majorand trace elements in river borne materials from the Cuyuni Basin(southern Venezuela): evidence for organo-colloidal control on thedissolved load and elemental redistribution between the dissolvedand suspended load. Chem Geol 211(3–4):305–334
Tripti M, Gurumurthy GP, Balakrishna K, Chadaga MD (2013a)Dissolved trace element biogeochemistry of a tropical river.Southwest India Environ Sci Pollut Res 20(6):4067–4077
Tripti M, Lambs L, Otto T, Gurumurthy GP, Teisserenc R, Moussa I,Balakrishna K, Probst JL (2013b) First assessment of water andcarbon cycles in two tropical coastal rivers of south-west India: anisotopic approach. Rapid Commun Mass Spectrom 27:1681–1689
Trumbore SE, Chadwick O, Amundson A (1996) Rapid exchange be-tween soil carbon and atmospheric carbon dioxide driven by tem-perature change. Science 272:393–396
van den Berg CM, Merks AG, Duursma EK (1987) Organic complexa-tion and its control of the dissolved concentrations of copper andzinc in the Scheldt estuary. Estuar Coast Shelf Sci 24(6):785–797
Vasyukova E, Pokrovsky OS, Viers J, Dupré B (2012) New operationalmethod of testing colloid complexation with metals in natural wa-ters. Appl Geochem 27(6):1226–1237
Viers J, Dupré B, Braun J-J, Deberdt S, Angeletti B, NdamNgoupayou J,Michard A (2000) Major and trace element abundances, and stron-tium isotopes in the Nyong basin rivers (Cameroon): constraints onchemical weathering processes and element transport mechanismsin humid tropical environments. Chem Geol 169:211–241
Viers J, Dupré B, Gaillardet J (2009) Chemical composition of suspendedsediments in world rivers: new insights from a new database. SciTotal Environ 407(2):853–868
Environ Sci Pollut Res
Author's personal copy
Copyright © 2022 FDOKUMEN