Vortex‐Dominated Aeolian Activity at InSight's Landing Site ...
51
Abstract We report the aeolian changes observed in situ by NASA's InSight lander during the first 400 sols of operations: Granule creep, saltation, dust removal, and the formation of dark surface tracks. Aeolian changes are infrequent and sporadic. However, on sols, when they do occur, they consistently appear between noon to 3 p.m., and are associated with the passage of convective vortices during periods of high vortex activity. Aeolian changes are more frequent at elevated locations, such as the top surfaces of rocks and lander footpads. InSight observed these changes using, for the first time, simultaneous in- situ and orbital imaging and high-frequency meteorological, seismological, and magnetic measurements. Seismometer measurements of ground acceleration constrain the timing and trajectory of convective vortex encounters, linking surface changes to source vortices. Magnetometer measurements show perturbations in magnetic field strength during the passage of convective vortices consistent with charged- particle motion. Detachment of sand-scale particles occurs when high background winds and vortex- induced turbulence provide a peak surface friction wind speed above the classic saltation fluid threshold. However, detachment of dust- and granule-scale particles also occurred when the surface friction wind speed remained below this threshold. This may be explained by local enhancement of the surface roughness and other effects described here and further studied in Part 2 (Baker et al., 2021). The lack of saltation and bright dust-coated surfaces at the InSight landing site implies surface stability and the onset of particle motion may be suppressed by dust “cushioning.” This differentiates the InSight landing site from other areas on Mars that exhibit more aeolian activity. Plain Language Summary Aeolian activity, the movement of dust and sand by the wind, is common on Earth and has been observed on other planets, including Mars. A new Mars lander, InSight, has for the first time monitored aeolian changes by combining imaging with weather, seismic and CHARALAMBOUS ET AL. © 2021. The Authors. This is an open access article under the terms of the Creative Commons Attribution License, which permits use, distribution and reproduction in any medium, provided the original work is properly cited. Vortex-Dominated Aeolian Activity at InSight's Landing Site, Part 1: Multi-Instrument Observations, Analysis, and Implications C. Charalambous 1 , J. B. McClean 2 , M. Baker 3 , W. T. Pike 1 , M. Golombek 4 , M. Lemmon 5 , V. Ansan 6 , C. Perrin 7 , A. Spiga 8,9 , R. D. Lorenz 10 , M. E. Banks 11 , N. Murdoch 12 , S. Rodriguez 6 , C. M. Weitz 13 , J. A. Grant 14 , N. H. Warner 15 , J. Garvin 10 , I. J. Daubar 16 , E. Hauber 17 , A. E. Stott 1 , C. L. Johnson 18,19 , A. Mittelholz 20 , T. Warren 21 , S. Navarro 22 , L. M. Sotomayor 22 , J. Maki 4 , A. Lucas 7 , D. Banfield 23 , C. Newman 24 , D. Viúdez-Moreiras 22 , J. Pla-García 22 , P. Lognonné 7 , and W. B. Banerdt 4 1 Department of Electrical and Electronic Engineering, South Kensington Campus, Imperial College London, London, UK, 2 Now at MIT Haystack Observatory, Westford, MA, USA, 3 Morton K. Blaustein Department of Earth and Planetary Sciences, Johns Hopkins University, Baltimore, MD, USA, 4 Jet Propulsion Laboratory, California Institute of Technology, Pasadena, CA, USA, 5 Space Science Institute, Boulder, CO, USA, 6 Laboratoire de Planétologie et Géodynamique, UMR 6112-CNRS, Université de Nantes, Nantes Cedex 3, France, 7 Institut de physique du globe de Paris, CNRS, Université de Paris, Paris, France, 8 Laboratoire de Météorologie Dynamique/Institut Pierre-Simon Laplace, Sorbonne Université, Centre National de la Recherche Scientifique, École Polytechnique, École Normale´ Supérieure, Campus Pierre et Marie Curie BC99, Paris, France, 9 Institut Universitaire de France, Paris, France, 10 Johns Hopkins Applied Physics Laboratory, Laurel, MD, USA, 11 NASA Goddard Space Flight Center, Greenbelt, MD, USA, 12 Institut Supérieur de l'Aéronautique et de l'Espace (ISAE-SUPAERO), Toulouse, France, 13 Planetary Science Institute, Tucson, AZ, USA, 14 Center for Earth and Planetary Studies, National Air and Space Museum, Smithsonian Institution, Washington, DC, USA, 15 Department of Geological Sciences, State University of New York at Geneseo, 1 College Circle, Geneseo, NY, USA, 16 Department of Earth, Environmental, and Planetary Sciences, Brown University, Providence, RI, USA, 17 German Aerospace Center, Institute of Planetary Research, Berlin, Germany, 18 Department of Earth, Ocean and Atmospheric Sciences, University of British Columbia, Vancouver, BC, Canada, 19 Planetary Science Institute, Tucson, AZ, USA, 20 Institute of Geophysics, ETH Zürich, Zürich, Switzerland, 21 Department of Physics, University of Oxford, Oxford, UK, 22 Centro de Astrobiologíca (CSIC-INTA), Madrid, Spain, 23 Cornell Center for Astrophysics and Planetary Science, Cornell University, Ithaca, NY, USA, 24 Aeolis Research, Chandler, AZ, USA Key Points: • Aeolian activity at InSight is observed using imaging, meteorological, seismological, and magnetic field measurements for the first time on Mars • Infrequent episodes of creep, dust removal, saltation, and track formation coincide with passage of convective vortices in early afternoon • Paucity of observations of saltation coupled with the bright appearance of dust-coated surfaces suggests surface stability around InSight Supporting Information: Supporting Information may be found in the online version of this article. Correspondence to: C. Charalambous, constantinos.charalambous@imperial. ac.uk Citation: Charalambous, C., McClean, J. B., Baker, M., Pike, W. T., Golombek, M., Lemmon, M., et al. (2021). Vortex- dominated aeolian activity at InSight's landing site, Part 1: Multi-instrument observations, analysis, and implications. Journal of Geophysical Research: Planets, 126, e2020JE006757. https:// doi.org/10.1029/2020JE006757 Received 30 OCT 2020 Accepted 29 MAR 2021 10.1029/2020JE006757 Special Section: InSight at Mars RESEARCH ARTICLE 1 of 51
-
Upload
khangminh22 -
Category
Documents
-
view
1 -
download
0
Transcript of Vortex‐Dominated Aeolian Activity at InSight's Landing Site ...

Abstract We report the aeolian changes observed in situ by NASA's InSight lander during the first 400 sols of operations: Granule creep, saltation, dust removal, and the formation of dark surface tracks. Aeolian changes are infrequent and sporadic. However, on sols, when they do occur, they consistently appear between noon to 3 p.m., and are associated with the passage of convective vortices during periods of high vortex activity. Aeolian changes are more frequent at elevated locations, such as the top surfaces of rocks and lander footpads. InSight observed these changes using, for the first time, simultaneous in-situ and orbital imaging and high-frequency meteorological, seismological, and magnetic measurements. Seismometer measurements of ground acceleration constrain the timing and trajectory of convective vortex encounters, linking surface changes to source vortices. Magnetometer measurements show perturbations in magnetic field strength during the passage of convective vortices consistent with charged-particle motion. Detachment of sand-scale particles occurs when high background winds and vortex-induced turbulence provide a peak surface friction wind speed above the classic saltation fluid threshold. However, detachment of dust- and granule-scale particles also occurred when the surface friction wind speed remained below this threshold. This may be explained by local enhancement of the surface roughness and other effects described here and further studied in Part 2 (Baker et al., 2021). The lack of saltation and bright dust-coated surfaces at the InSight landing site implies surface stability and the onset of particle motion may be suppressed by dust “cushioning.” This differentiates the InSight landing site from other areas on Mars that exhibit more aeolian activity.
Plain Language Summary Aeolian activity, the movement of dust and sand by the wind, is common on Earth and has been observed on other planets, including Mars. A new Mars lander, InSight, has for the first time monitored aeolian changes by combining imaging with weather, seismic and
CHARALAMBOUS ET AL.
© 2021. The Authors.This is an open access article under the terms of the Creative Commons Attribution License, which permits use, distribution and reproduction in any medium, provided the original work is properly cited.
Vortex-Dominated Aeolian Activity at InSight's Landing Site, Part 1: Multi-Instrument Observations, Analysis, and ImplicationsC. Charalambous1 , J. B. McClean2 , M. Baker3 , W. T. Pike1, M. Golombek4 , M. Lemmon5 , V. Ansan6 , C. Perrin7 , A. Spiga8,9 , R. D. Lorenz10 , M. E. Banks11 , N. Murdoch12 , S. Rodriguez6 , C. M. Weitz13 , J. A. Grant14 , N. H. Warner15 , J. Garvin10 , I. J. Daubar16 , E. Hauber17 , A. E. Stott1 , C. L. Johnson18,19 , A. Mittelholz20 , T. Warren21, S. Navarro22 , L. M. Sotomayor22 , J. Maki4 , A. Lucas7 , D. Banfield23 , C. Newman24 , D. Viúdez-Moreiras22 , J. Pla-García22 , P. Lognonné7 , and W. B. Banerdt4
1Department of Electrical and Electronic Engineering, South Kensington Campus, Imperial College London, London, UK, 2Now at MIT Haystack Observatory, Westford, MA, USA, 3Morton K. Blaustein Department of Earth and Planetary Sciences, Johns Hopkins University, Baltimore, MD, USA, 4Jet Propulsion Laboratory, California Institute of Technology, Pasadena, CA, USA, 5Space Science Institute, Boulder, CO, USA, 6Laboratoire de Planétologie et Géodynamique, UMR 6112-CNRS, Université de Nantes, Nantes Cedex 3, France, 7Institut de physique du globe de Paris, CNRS, Université de Paris, Paris, France, 8Laboratoire de Météorologie Dynamique/Institut Pierre-Simon Laplace, Sorbonne Université, Centre National de la Recherche Scientifique, École Polytechnique, École Normale´ Supérieure, Campus Pierre et Marie Curie BC99, Paris, France, 9Institut Universitaire de France, Paris, France, 10Johns Hopkins Applied Physics Laboratory, Laurel, MD, USA, 11NASA Goddard Space Flight Center, Greenbelt, MD, USA, 12Institut Supérieur de l'Aéronautique et de l'Espace (ISAE-SUPAERO), Toulouse, France, 13Planetary Science Institute, Tucson, AZ, USA, 14Center for Earth and Planetary Studies, National Air and Space Museum, Smithsonian Institution, Washington, DC, USA, 15Department of Geological Sciences, State University of New York at Geneseo, 1 College Circle, Geneseo, NY, USA, 16Department of Earth, Environmental, and Planetary Sciences, Brown University, Providence, RI, USA, 17German Aerospace Center, Institute of Planetary Research, Berlin, Germany, 18Department of Earth, Ocean and Atmospheric Sciences, University of British Columbia, Vancouver, BC, Canada, 19Planetary Science Institute, Tucson, AZ, USA, 20Institute of Geophysics, ETH Zürich, Zürich, Switzerland, 21Department of Physics, University of Oxford, Oxford, UK, 22Centro de Astrobiologíca (CSIC-INTA), Madrid, Spain, 23Cornell Center for Astrophysics and Planetary Science, Cornell University, Ithaca, NY, USA, 24Aeolis Research, Chandler, AZ, USA
Key Points:• Aeolian activity at InSight
is observed using imaging, meteorological, seismological, and magnetic field measurements for the first time on Mars
• Infrequent episodes of creep, dust removal, saltation, and track formation coincide with passage of convective vortices in early afternoon
• Paucity of observations of saltation coupled with the bright appearance of dust-coated surfaces suggests surface stability around InSight
Supporting Information:Supporting Information may be found in the online version of this article.
Correspondence to:C. Charalambous,[email protected]
Citation:Charalambous, C., McClean, J. B., Baker, M., Pike, W. T., Golombek, M., Lemmon, M., et al. (2021). Vortex-dominated aeolian activity at InSight's landing site, Part 1: Multi-instrument observations, analysis, and implications. Journal of Geophysical Research: Planets, 126, e2020JE006757. https://doi.org/10.1029/2020JE006757
Received 30 OCT 2020Accepted 29 MAR 2021
10.1029/2020JE006757
Special Section:InSight at Mars
RESEARCH ARTICLE
1 of 51
Journal of Geophysical Research: Planets
1. IntroductionWind is one of the most important geomorphological agents on present-day Mars (Bridges & Ehlmann, 2018; Bridges, Ayoub et al., 2012; Bridges, Bourke et al., 2012; Lapotre & Rampe, 2018). Evidence of aeolian ac-tivity includes the migration of dunes, ripples, wind streaks, and sediment-filled impact craters (Bridges & Ehlmann, 2018). Dust particles can enter into long-term suspension in the form of global dust storms, influ-encing weather and climate through changes in the radiative balance (Gierasch & Goody, 1972; Madeleine et al., 2011). Dust deposition on solar arrays reduces power output, and wind-blown surface material poses potential risks that can hinder the performance of and damage instruments, presenting a hazard to future human exploration (Hecht et al., 2017; Levine et al., 2018).
The role that wind-driven processes play in the geomorphology of Mars is complex and only partially under-stood, in particular, the mechanism of aeolian transport and the initiation and sustenance of particle mo-tion (Kok et al., 2012). Aeolian change is initiated when a particle from a mobile sediment source detaches from the surface due to a surface friction wind speed u* above the fluid threshold u*t. Particle detachment is the prerequisite to any subsequent motion: creep (grains continuously coupled to the surface), reptation (low-energy hopping particles), saltation (particle lofting followed by re-impact(s)), and suspension. Once particle entrainment is initiated, particle motion in sand-laden wind can be maintained as long as the sur-face friction wind speed exceeds the impact threshold u*i (Almeida et al., 2008; Bagnold, 1941; Kok, 2010a). This threshold is controlled by both the horizontal drag force imparted by the wind and the momentum transferred to the particle bed by impacts of saltating grains (Bagnold, 1941; Kok et al., 2012).
Due to the low density of Mars' atmosphere, the fluid threshold surface friction of wind speed is higher than on Earth (Bagnold, 1941; Iversen & White, 1982; Newman et al., 2002). The surface friction wind speed predicted by atmospheric models and measured on the surface rarely exceeds this higher fluid thresh-old (Bridges et al., 2017; Kok et al., 2012; Newman et al., 2017), yet aeolian features and dust suspen-sion are observed under present-day Martian atmospheric conditions (Bridges, Ayoub et al., 2012; Bridges, Bourke et al., 2012; Ewing et al., 2017; Greeley, Balme, et al., 2003; Greeley, Kuzmin, et al., 2003; Lapotre et al., 2016, 2018; Silvestro et al., 2010; Sullivan et al., 2008, 2005).
Images acquired from landed cameras have captured in-situ evidence of aeolian activity on Mars, both with-in disturbed piles and natural bedforms (Baker, Lapotre, et al., 2018; Baker, Newman, et al., 2018; Moore et al., 1985; Sullivan et al., 2008). Redistribution of surface dust and active dust devils (Balme & Gree-ley, 2006; Ellehoj et al., 2010) have also been observed from surface and orbital imaging, demonstrating that dust, with a significantly higher fluid threshold than sand, is also mobilized on Mars (Arvidson et al., 1983; Ellehoj et al., 2010; Greeley et al., 2010; Metzger et al., 1999). For example, while both Viking Landers 1 and 2 observed a paucity of surface changes, erosion and modification of surface material in lander-disturbed areas were observed during rare dust storm events (Arvidson et al., 1983; Moore, 1985). At Gusev Cra-ter, Mars Exploration Rover (MER) Spirit observed dust devils, movement of sand-size grains during solar conjunction, and accumulation of grains on the rover deck (Greeley, Arvidson et al., 2006). In Meridiani Planum, MER Opportunity observed coarse-grained ripples that may have been recently active (Jerolmack et al., 2006; Sullivan et al., 2005). Erasure and alteration of rover tracks by deposition and erosion were also observed by both MER rovers over the timescale of a few days (Geissler et al., 2010). Despite the paucity of observed aeolian surface activity at the Mars Pathfinder and Phoenix landing site, multiple dust devils were observed by both landers (Ellehoj et al., 2010; Ferri et al., 2003). In Gale Crater, Curiosity investigated the Bagnold Dunes (Bridges & Ehlmann, 2018) and observed significant aeolian changes, from motion at the
CHARALAMBOUS ET AL.
10.1029/2020JE006757
2 of 51
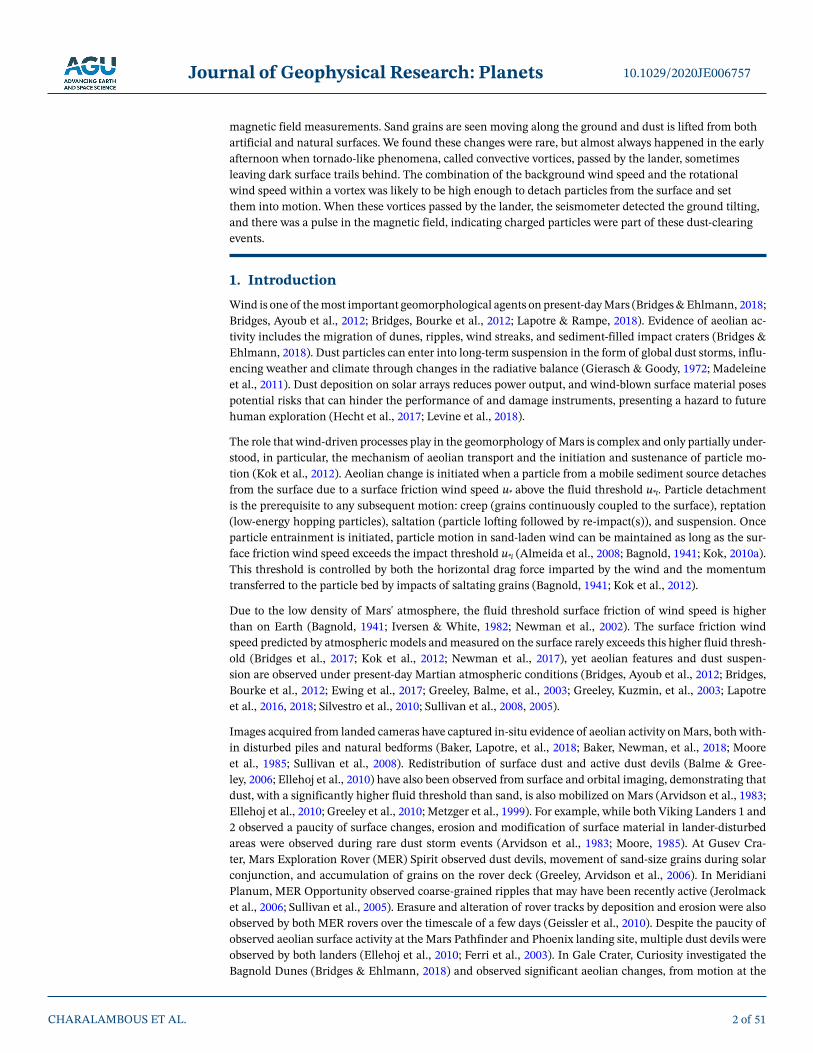
magnetic field measurements. Sand grains are seen moving along the ground and dust is lifted from both artificial and natural surfaces. We found these changes were rare, but almost always happened in the early afternoon when tornado-like phenomena, called convective vortices, passed by the lander, sometimes leaving dark surface trails behind. The combination of the background wind speed and the rotational wind speed within a vortex was likely to be high enough to detach particles from the surface and set them into motion. When these vortices passed by the lander, the seismometer detected the ground tilting, and there was a pulse in the magnetic field, indicating charged particles were part of these dust-clearing events.

Journal of Geophysical Research: Planets
coarse-sand to granules scale, grain flows on dune surfaces (Bridges et al., 2017), to motion of ripples and mass grain movement at more active times of year (Baker, Lapotre, et al., 2018; Baker, Newman, et al., 2018), to the detection of over a hundred dust devils over the course of the mission (e.g., Guzewich et al., 2019).
On Mars, wind- and convective vortex-driven aeolian activity vary both spatially and temporally. Seasons on Mars are normally expressed as ranges of Ls, known as the areocentric solar longitude, or Mars-Sun angle. Ls = 0° corresponds to the northern spring equinox. Wind-driven aeolian activity at multiple sites has been observed to peak in late southern spring through summer (Ayoub et al., 2014; Baker, Lapotre, et al., 2018; Baker, Newman, et al., 2018; Lapotre & Rampe, 2018), a time of year at which the global circulation and associated surface wind stresses are generally strongest. The strong global circulation in southern summer (compared to that in northern summer) is primarily due to the southern hemisphere being elevated in alti-tude with respect to the north (Richardson & Wilson, 2002), but there are two important secondary effects that further increase its strength: (i) perihelion (the closest approach to the Sun) occurring close to southern summer solstice (Ls = 270°) at Ls = 251°, and (ii) feedbacks between wind-driven dust lifting, atmospheric dust heating, and circulation strength. However, the global circulation is not the only control on winds, so the timing of peak aeolian activity is location-dependent. For example, strong daytime slope winds associ-ated with significant topography may oppose the direction of winds associated with the southern summer circulation. In such cases, peak wind stresses (hence aeolian activity) may occur in a different season, when global and regional/local flows interfere constructively. Indeed, winds appear slightly stronger in south-ern winter at InSight's location. Convective vortex-driven aeolian activity may be more directly tied to the annual cycle of solar insolation, although other factors such as winds are likely important, and typically peaks in the early afternoon during the local late spring through the fall (Greeley, Arvidson et al., 2006; Murphy et al., 2016; Neakrase et al., 2016; Newman et al., 2019; Perrin et al., 2020; Reiss et al., 2016; Spiga et al., 2020; Whelley & Greeley, 2006, 2008).
For all observed aeolian changes on Mars, however, significant limitations of previous meteorological data hamper the attempt to constrain the atmospheric conditions and horizontal wind speeds that initiated mobilization. Although landed spacecraft have observed motion of surface materials, very few observa-tions had simultaneous wind speed measurements needed to address aeolian transport dynamics (Geissler et al., 2010). Viking 1 and 2 provided information on the diurnal and seasonal variation of aeolian changes, but rarely recorded high-frequency wind speed data (Hess et al., 1977); Pathfinder's wind sensor could not produce calibrated wind speeds but allowed the wind direction to be inferred (Schofield et al., 1997); Phoe-nix returned sporadic, low-frequency measurements of the wind speed (Holstein-Rathlou et al., 2010); and Curiosity's wind sensor was damaged during landing, with winds being reliably measured only from certain azimuths, leading to difficulty in interpretation before the wind sensor eventually became inoperable (New-man et al., 2017; Viúdez-Moreiras et al., 2019a, 2019b).
In November 2018, the Interior Exploration using Seismic Investigations, Geodesy and Heat Transport (In-Sight) mission landed in a degraded impact crater (Homestead Hollow) in western Elysium Planitia at 4.502°N, 135.623°E (Golombek, Warner, et al., 2020; Warner et al., 2020). InSight is a geophysics mission with Seismic Experiment for Interior Structure (SEIS, Lognonné et al., 2019, 2020), as its primary instru-ment. To distinguish between seismic signals and environmentally induced noise, InSight measures mul-tiple environmental parameters continuously using the on-deck mounted Auxiliary Payload Sensor Suite (APSS, Banfield et al., 2019): Wind speed and direction, temperature, pressure, and the vector magnetic field. Two cameras provide regular imaging of the surface, allowing for change detection. Hence, InSight is ideally suited to monitor local aeolian changes with combined imaging, meteorological, surface, and magnetic measurements (Spiga et al., 2018). Furthermore, solar array currents can be used for atmospheric investigations (Lorenz, Lemmon, et al., 2020), and seismic data from SEIS can be used to study induced ground motion from short-lived atmospheric phenomena, such as convective vortices and turbulent wind gusts, as well as longer-scale ambient, acoustic and gravity waves (e.g., Charalambous et al., 2020; Lognonne et al., 2020; Murdoch et al., 2020).
In this study, we highlight the most prominent aeolian changes observed by InSight during the first 400 sols of operations. The observed period is from northern winter at Ls = 296° (sol 0) to northern summer at Ls = 134° (sol 400), and begins after the peak of wind-driven aeolian activity identified near perihelion by both orbital and ground observations in other regions (e.g., Ayoub et al., 2014; Lapotre & Rampe, 2018). We
CHARALAMBOUS ET AL.
10.1029/2020JE006757
3 of 51
Journal of Geophysical Research: Planets
present comprehensive observations of vortex-induced aeolian change on Mars that combine in-situ imaging and meteorological, seismic, mag-netic, and solar array current measurements with orbital imaging. These observations are detailed in Section 3. In Section 4, we use these observa-tions to infer properties of both the surface and the vortices responsible for aeolian changes. We discuss sediment availability and characterize the aerodynamic roughness length. We use meteorological and seismic measurements to link individual aeolian changes to vortices, and for the most energetic vortex, we estimate its properties and constrain its en-counter time and geometry. We also identify for the first time on Mars simultaneous vortex-induced dust lifting and perturbations in magnetic field strength, and discuss potential sources of these perturbations. In Section 5, we compare the observed aeolian changes to those predicted by classic fluid threshold theory. We investigate if discrepancies can be explained by alternative enhancing mechanisms that could act individu-ally, or simultaneously, to increase the surface friction wind speed and/or reduce the fluid threshold. We discuss limitations and biases in the meas-urements and observations. In Section 6, we present the implications of our observations on the current understanding of aeolian transportation mechanisms at the InSight landing site. Finally, we propose potential solutions to the limitations identified and areas for future aeolian studies at the InSight landing site in Section 7.
In Part 2 (Baker et al., 2021), we place these individual observations into the broader context of the geology and meteorology of the region by in-tegrating the full APSS data set, multiyear orbital change detection, and atmospheric models. Part 2 also expands the comparison of simultaneous observational and meteorological data presented herein to aeolian activ-ity predicted by multiple transport models to further investigate martian threshold conditions and probe the dominant erosive forces acting on the surface during vortex encounters.
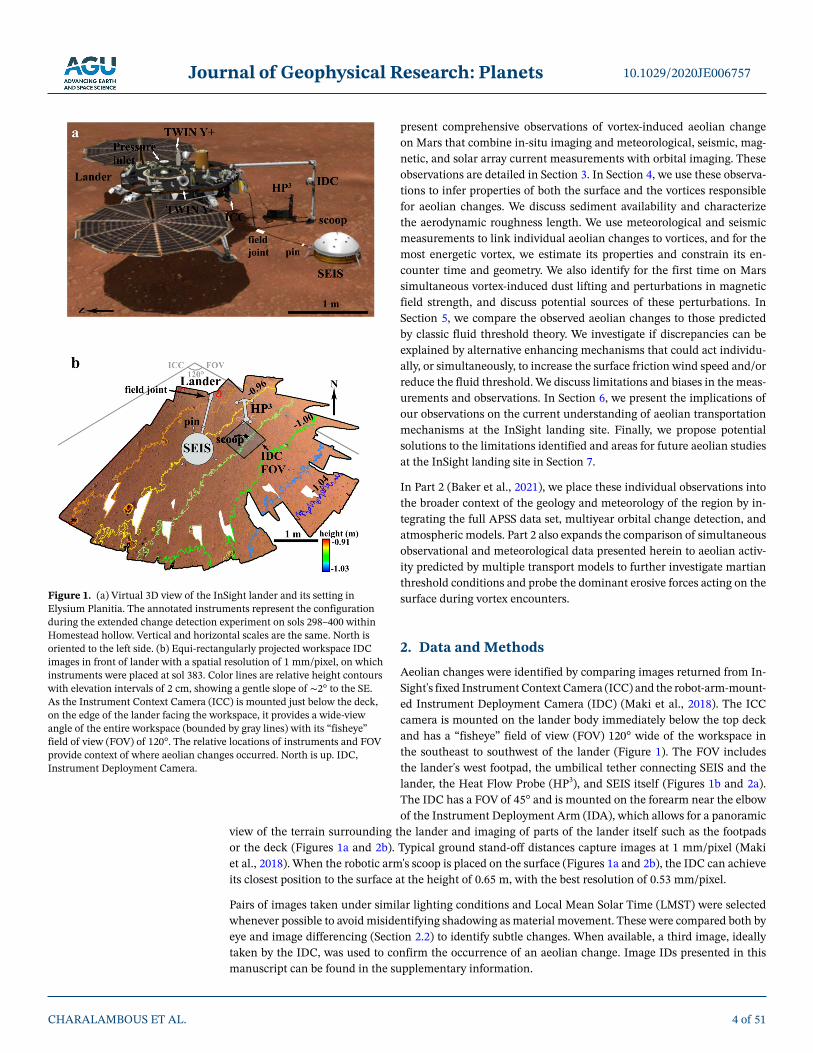
2. Data and MethodsAeolian changes were identified by comparing images returned from In-Sight's fixed Instrument Context Camera (ICC) and the robot-arm-mount-ed Instrument Deployment Camera (IDC) (Maki et al., 2018). The ICC camera is mounted on the lander body immediately below the top deck and has a “fisheye” field of view (FOV) 120° wide of the workspace in the southeast to southwest of the lander (Figure 1). The FOV includes the lander's west footpad, the umbilical tether connecting SEIS and the lander, the Heat Flow Probe (HP3), and SEIS itself (Figures 1b and 2a). The IDC has a FOV of 45° and is mounted on the forearm near the elbow of the Instrument Deployment Arm (IDA), which allows for a panoramic
view of the terrain surrounding the lander and imaging of parts of the lander itself such as the footpads or the deck (Figures 1a and 2b). Typical ground stand-off distances capture images at 1 mm/pixel (Maki et al., 2018). When the robotic arm's scoop is placed on the surface (Figures 1a and 2b), the IDC can achieve its closest position to the surface at the height of 0.65 m, with the best resolution of 0.53 mm/pixel.
Pairs of images taken under similar lighting conditions and Local Mean Solar Time (LMST) were selected whenever possible to avoid misidentifying shadowing as material movement. These were compared both by eye and image differencing (Section 2.2) to identify subtle changes. When available, a third image, ideally taken by the IDC, was used to confirm the occurrence of an aeolian change. Image IDs presented in this manuscript can be found in the supplementary information.
CHARALAMBOUS ET AL.
10.1029/2020JE006757
4 of 51
Figure 1. (a) Virtual 3D view of the InSight lander and its setting in Elysium Planitia. The annotated instruments represent the configuration during the extended change detection experiment on sols 298–400 within Homestead hollow. Vertical and horizontal scales are the same. North is oriented to the left side. (b) Equi-rectangularly projected workspace IDC images in front of lander with a spatial resolution of 1 mm/pixel, on which instruments were placed at sol 383. Color lines are relative height contours with elevation intervals of 2 cm, showing a gentle slope of ∼2° to the SE. As the Instrument Context Camera (ICC) is mounted just below the deck, on the edge of the lander facing the workspace, it provides a wide-view angle of the entire workspace (bounded by gray lines) with its “fisheye” field of view (FOV) of 120°. The relative locations of instruments and FOV provide context of where aeolian changes occurred. North is up. IDC, Instrument Deployment Camera.

Journal of Geophysical Research: Planets
SEIS and APSS measurements provided ground acceleration, wind speed and direction, pressure drop (∆P), and vector magnetic fields B. While ∆P is a measure of vortex intensity, it is a lower bound unless the vortex passes over the pressure inlet (Balme & Greeley, 2006; see limitations in Section 4.4). The ∆P also allows approximations of both horizontal wind speeds and shear stresses to be inferred (Lorenz, 2016, see also Section 4.4). For completeness, we note both the maximum wind speed and pressure drop between the image-bracketed period during which aeolian changes were identified. Although usually, the two meas-urements coincide due to tangential wind speeds driven by energetic vortices, occasionally the two occur at separate times, and this is noted in the catalog of surface changes. Passing convective vortices were rec-ognized by the synchrony of an abrupt pressure drop, seismic ground deformation, increase in wind speed, and shifts in wind direction, including reversals.
2.1. Image Search and Comparison
Our image search included all (hundreds) acquired images that could form a before-and-after pair during the 400 sols. Some of these images were part of an aeolian change-detection campaign, however, most images were daily engineering observations and these identified most of the aeolian changes. ICC imag-es allowed identification of bulk surface changes through differencing, while IDC campaigns permitted identification of finer changes, such as creep of individual mm-sized grains. Because only bulk surface changes can be observed from the ICC, the IDC is also required to resolve at the particle scale and observe fine changes. Bulk surface changes are normally detected as changes in the albedo of the surface, where darkening is interpreted as removal of dust and/or redistribution of fine material.
Detection of fine-grain motion before sol 298 is hampered as IDC took limited images close to the surface before it was positioned over the HP3 mole for engineering purposes. Therefore, for the period before sol 298, mainly bulk surface changes could be observed, with best resolution that varied several millimeters per pixel over different areas. However, efforts in the diagnostics of the HP3 hammering after sol 298 permitted at least one IDC image to be acquired each sol at specific times of 07:55 LMST, 11:50 LMST, and 15:50 LMST, allowing for investigation of the exact same area with optimally spaced intervals, steady positioning, and ideal lighting conditions for image differencing. This positioning can resolve individual grain motion of a diameter d > 1 mm. The camera configuration is shown in the lander 3D setting of Figure 1a, with the FOV shown in Figure 2b.
CHARALAMBOUS ET AL.
10.1029/2020JE006757
5 of 51
Figure 2. (a) The actual FOV from the ICC as located in Figure 1, with the various instruments annotated. The planar FOV of IDC is indicated by the outlined rectangle and viewed in (b), with instruments annotated. ICC, Instrument Context Camera; IDC, Instrument Deployment Camera; FOV, field of view.
Journal of Geophysical Research: Planets
2.2. Image Differencing
We define the image difference of two images as the single-passed difference of intensity value at each pixel. Two images are compared as pixel arrays, where we assume the first image It−T is the background array we attempt to remove at time t–T, where T defines the temporal distance. The difference, D, of the two pixel-ar-ray values is simply defined as:
–, , , ,t t TD i j I i j I i j
where i is the i-th row and j is the j-th column in the pixel array from a total number of pixels M that must be equal in the two arrays It−T and I, hence, the resolution. Direct differencing can be noisy due to high sensitiv-ity to lighting and motion, therefore binning, via a two-dimensional median filtering of an n × n pixel kernel (usually 2 × 2), is applied to reduce noise and graininess, and to improve subpixel misalignments. Further image enhancement techniques are also applied such as contrast stretching, histogram equalization and adaptive histogram equalization (see Figure S1 for comparison). We also apply grayscale thresholding to al-low changes to emerge as white pixels, which we then superpose as a layer onto the raw images. This allows us to highlight a summary of the changes in the FOV to a reader not familiar with the reference background.
Aligned pixels and a comparable photometric environment present the best conditions for optimal image differencing. As the robotic arm is easily vibrated by wind gusts, and thus shifting in pixel location, IDC im-age differencing is more challenging than for the fixed ICC. On such occasions, manual image registration is required. IDC image differencing was improved on the occasions the robotic arm's scoop was pressed into the regolith with images captured under similar photometric conditions (Figure 2b).
2.3. Wind, Air Temperature, and Pressure Data
The Temperature and Wind for InSight (TWINS) sensor booms employ hot-wire anemometry, based on Cu-riosity's Rover Environmental Monitoring Station (REMS). The booms are located by the edge of InSight's deck and face outward over InSight's west and east solar panels and therefore measure horizontal winds facing in opposite directions (Figure 1a). The two booms stand at ∼1.2 m from the surface but each with a slightly different height (less than 10-cm difference) due to the small tilt of the lander (Banfield et al., 2020). We use the local coordinate system, InSight's local lander level (LL) in which the Y+ boom faces to the east with the Y− to the west (X+ is in the North, see Figure 1a).
Data are recorded continuously on board the lander at 1 sps (samples per second) for the wind and air tem-perature, and at 20 sps for the pressure, with wind/air temperature and pressure data transmitted at 0.1/2 sps (1/10 sps after sol ∼165). Downlink requests for specific events of interest allow small time windows of pressure data to be transmitted at 20 sps. There is an estimated measurement error of 1 m s−1 for wind speed, 22.5° for wind direction and 5 K for temperature (Banfield et al., 2020). The wind speed and direction are obtained after reconstruction from the Y+ to Y− boom measurements that considers the position of each boom compared to the prevailing wind, with further corrections based on computational fluid dynamics designed to account for wind interaction with the lander elements.
The two booms can only capture average winds at different peak speeds at the closest point of a vortex en-counter as both the high speed and increased turbulence make wind retrieval challenging. One boom may therefore better capture the wind speed at any given moment—with the choice changing during the short timescales of a vortex encounter. We therefore use the maximum of the two boom measurements during all vortex encounters, and infer ambient wind speed and direction from the selected boom.
2.4. Seismic and Magnetic Data
Throughout the study, the seismic and magnetic field components follow N (northward), E (eastward), and Z (downward), similarly applied to the local lander level used by TWINS. The SEIS assembly, deployed on the surface, is comprised of a duo of independent three-axis seismometers: The oblique very broad band (VBB) and short period (SP) seismometers (Lognonné et al., 2019). Data are continuously recorded at sam-pling rates of 20 sps, transmitted at 0.2 sps up to sol 183. The sampling rate was increased to 2 sps on sol
CHARALAMBOUS ET AL.
10.1029/2020JE006757
6 of 51
Journal of Geophysical Research: Planets
183, dropping back down to 0.2 sps on sol 261, followed by a data gap due to the solar conjunction. After solar conjunction (from sol 284 onwards), the data downlink was resumed with 2 sps data. Downlink requests for specific events of interest allow small-time windows to be transmitted at 20 sps. We use the continuous data in this study.
3. Observations of Aeolian ChangesSeveral types of aeolian change were observed by the IDC or ICC camer-as including: (1) dust removal from spacecraft components, (2) surface creep of very coarse sand and granules, saltation and pile collapse on the surface, (3) dust coating removal, (4) surface track formation, and (5) rare localized surface darkenings on dusty surfaces. All changes were located in the southern areas of InSight, with none observed in the two northern quadrants, likely due to the paucity of images acquired in those areas. In this section, we examine each of the prominent changes observed during the first 400 sols of InSight operations with images and measurements. Movies demonstrating each of these changes can be found in the Sup-porting information.
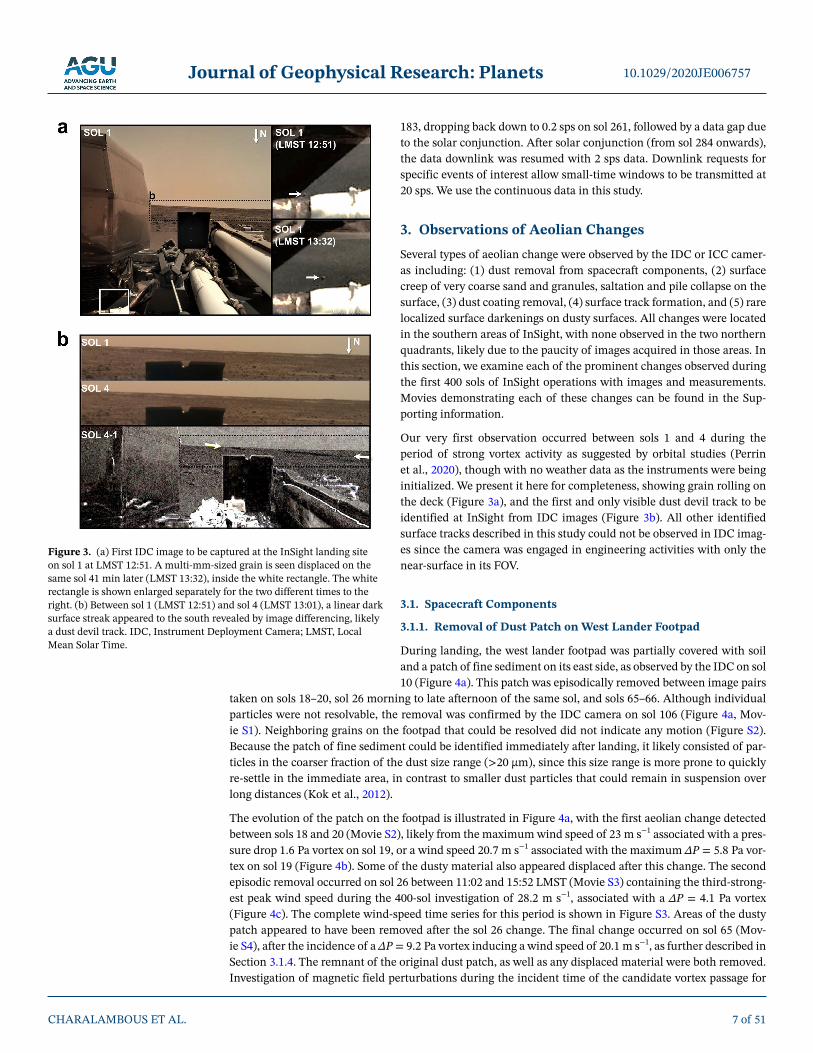
Our very first observation occurred between sols 1 and 4 during the period of strong vortex activity as suggested by orbital studies (Perrin et al., 2020), though with no weather data as the instruments were being initialized. We present it here for completeness, showing grain rolling on the deck (Figure 3a), and the first and only visible dust devil track to be identified at InSight from IDC images (Figure 3b). All other identified surface tracks described in this study could not be observed in IDC imag-es since the camera was engaged in engineering activities with only the near-surface in its FOV.
3.1. Spacecraft Components
3.1.1. Removal of Dust Patch on West Lander Footpad
During landing, the west lander footpad was partially covered with soil and a patch of fine sediment on its east side, as observed by the IDC on sol 10 (Figure 4a). This patch was episodically removed between image pairs
taken on sols 18–20, sol 26 morning to late afternoon of the same sol, and sols 65–66. Although individual particles were not resolvable, the removal was confirmed by the IDC camera on sol 106 (Figure 4a, Mov-ie S1). Neighboring grains on the footpad that could be resolved did not indicate any motion (Figure S2). Because the patch of fine sediment could be identified immediately after landing, it likely consisted of par-ticles in the coarser fraction of the dust size range (>20 µm), since this size range is more prone to quickly re-settle in the immediate area, in contrast to smaller dust particles that could remain in suspension over long distances (Kok et al., 2012).
The evolution of the patch on the footpad is illustrated in Figure 4a, with the first aeolian change detected between sols 18 and 20 (Movie S2), likely from the maximum wind speed of 23 m s−1 associated with a pres-sure drop 1.6 Pa vortex on sol 19, or a wind speed 20.7 m s−1 associated with the maximum ∆P = 5.8 Pa vor-tex on sol 19 (Figure 4b). Some of the dusty material also appeared displaced after this change. The second episodic removal occurred on sol 26 between 11:02 and 15:52 LMST (Movie S3) containing the third-strong-est peak wind speed during the 400-sol investigation of 28.2 m s−1, associated with a ∆P = 4.1 Pa vortex (Figure 4c). The complete wind-speed time series for this period is shown in Figure S3. Areas of the dusty patch appeared to have been removed after the sol 26 change. The final change occurred on sol 65 (Mov-ie S4), after the incidence of a ∆P = 9.2 Pa vortex inducing a wind speed of 20.1 m s−1, as further described in Section 3.1.4. The remnant of the original dust patch, as well as any displaced material were both removed. Investigation of magnetic field perturbations during the incident time of the candidate vortex passage for
CHARALAMBOUS ET AL.
10.1029/2020JE006757
7 of 51
Figure 3. (a) First IDC image to be captured at the InSight landing site on sol 1 at LMST 12:51. A multi-mm-sized grain is seen displaced on the same sol 41 min later (LMST 13:32), inside the white rectangle. The white rectangle is shown enlarged separately for the two different times to the right. (b) Between sol 1 (LMST 12:51) and sol 4 (LMST 13:01), a linear dark surface streak appeared to the south revealed by image differencing, likely a dust devil track. IDC, Instrument Deployment Camera; LMST, Local Mean Solar Time.

Journal of Geophysical Research: Planets
CHARALAMBOUS ET AL.
10.1029/2020JE006757
8 of 51
Figure 4. West lander footpad changes. Episodic changes on the footpad occurred on three distinct occasions, identified from daily ICC images up to sol 66. (a) IDC image of the dusty patch indicated by the arrow on the footpad, taken on sol 10 when it was first identified (Movie S1); individual ICC images for each episodic change, occurring between afternoon on sol 18 and noon on sol 20 (Movie S2), noon on sol 26 and afternoon same sol (Movie S3), and between noon on sol 65 and morning of sol 66 (Movie S4), with the area marked in white depicting the evolution of the patch; high-resolution IDC image from sol 106. (b) and (c) (i) Wind speed, (ii) wind direction, (iii) pressure, (iv) solar array current, and (v) magnetic field measurements during the candidate vortex encounters for sols 19 and 26, respectively. Vertical dashed lines indicate the time of the measured peak wind speed from each vortex event. ICC, Instrument Context Camera; IDC, Instrument Deployment Camera.
Journal of Geophysical Research: Planets
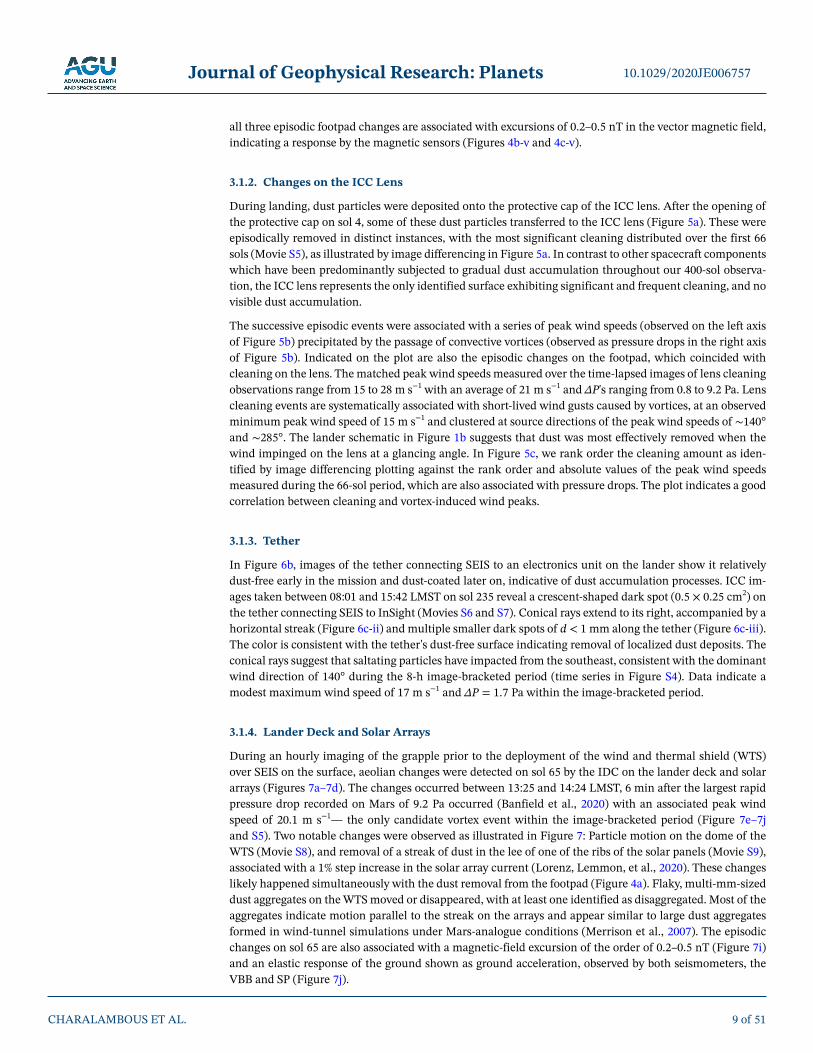
all three episodic footpad changes are associated with excursions of 0.2–0.5 nT in the vector magnetic field, indicating a response by the magnetic sensors (Figures 4b-v and 4c-v).
3.1.2. Changes on the ICC Lens
During landing, dust particles were deposited onto the protective cap of the ICC lens. After the opening of the protective cap on sol 4, some of these dust particles transferred to the ICC lens (Figure 5a). These were episodically removed in distinct instances, with the most significant cleaning distributed over the first 66 sols (Movie S5), as illustrated by image differencing in Figure 5a. In contrast to other spacecraft components which have been predominantly subjected to gradual dust accumulation throughout our 400-sol observa-tion, the ICC lens represents the only identified surface exhibiting significant and frequent cleaning, and no visible dust accumulation.
The successive episodic events were associated with a series of peak wind speeds (observed on the left axis of Figure 5b) precipitated by the passage of convective vortices (observed as pressure drops in the right axis of Figure 5b). Indicated on the plot are also the episodic changes on the footpad, which coincided with cleaning on the lens. The matched peak wind speeds measured over the time-lapsed images of lens cleaning observations range from 15 to 28 m s−1 with an average of 21 m s−1 and ∆P's ranging from 0.8 to 9.2 Pa. Lens cleaning events are systematically associated with short-lived wind gusts caused by vortices, at an observed minimum peak wind speed of 15 m s−1 and clustered at source directions of the peak wind speeds of ∼140° and ∼285°. The lander schematic in Figure 1b suggests that dust was most effectively removed when the wind impinged on the lens at a glancing angle. In Figure 5c, we rank order the cleaning amount as iden-tified by image differencing plotting against the rank order and absolute values of the peak wind speeds measured during the 66-sol period, which are also associated with pressure drops. The plot indicates a good correlation between cleaning and vortex-induced wind peaks.
3.1.3. Tether
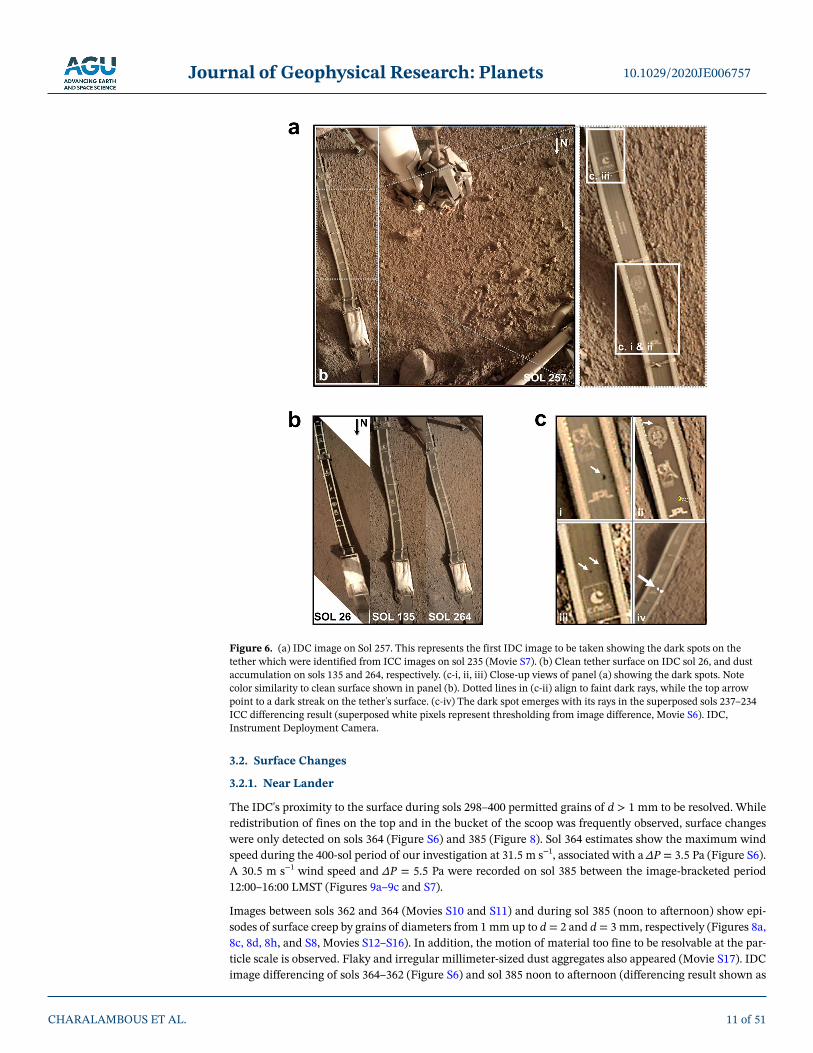
In Figure 6b, images of the tether connecting SEIS to an electronics unit on the lander show it relatively dust-free early in the mission and dust-coated later on, indicative of dust accumulation processes. ICC im-ages taken between 08:01 and 15:42 LMST on sol 235 reveal a crescent-shaped dark spot (0.5 × 0.25 cm2) on the tether connecting SEIS to InSight (Movies S6 and S7). Conical rays extend to its right, accompanied by a horizontal streak (Figure 6c-ii) and multiple smaller dark spots of d < 1 mm along the tether (Figure 6c-iii). The color is consistent with the tether's dust-free surface indicating removal of localized dust deposits. The conical rays suggest that saltating particles have impacted from the southeast, consistent with the dominant wind direction of 140° during the 8-h image-bracketed period (time series in Figure S4). Data indicate a modest maximum wind speed of 17 m s−1 and ∆P = 1.7 Pa within the image-bracketed period.
3.1.4. Lander Deck and Solar Arrays
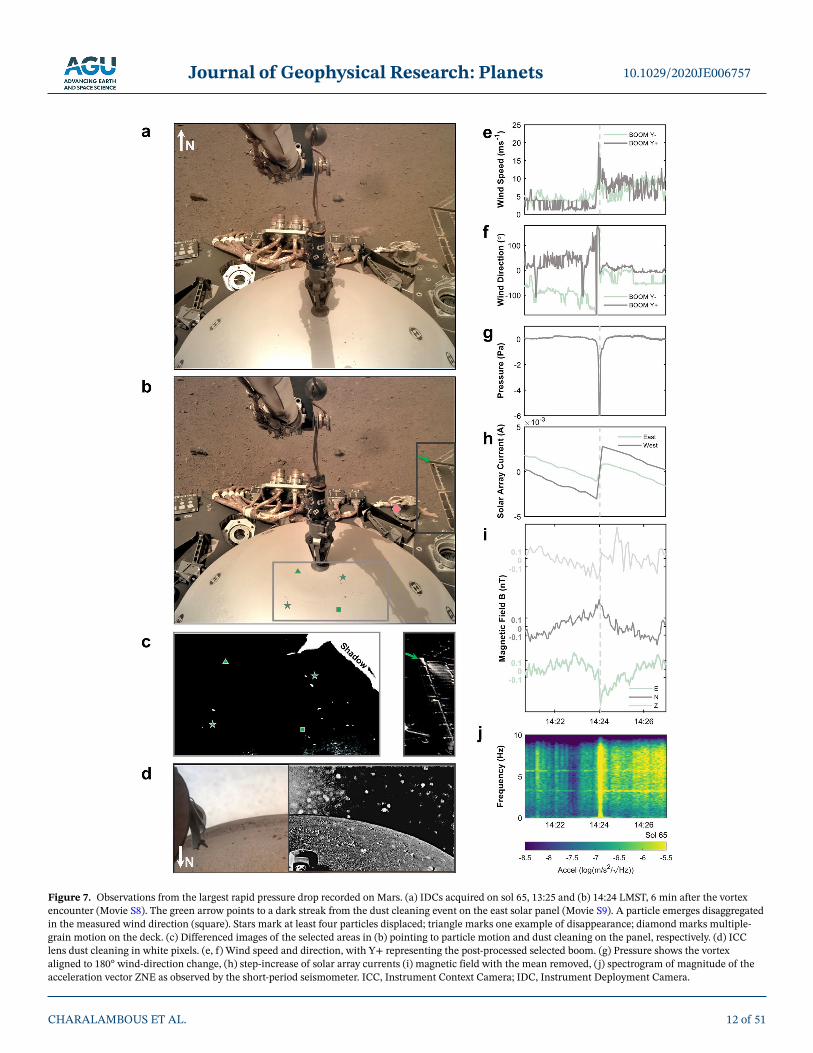
During an hourly imaging of the grapple prior to the deployment of the wind and thermal shield (WTS) over SEIS on the surface, aeolian changes were detected on sol 65 by the IDC on the lander deck and solar arrays (Figures 7a–7d). The changes occurred between 13:25 and 14:24 LMST, 6 min after the largest rapid pressure drop recorded on Mars of 9.2 Pa occurred (Banfield et al., 2020) with an associated peak wind speed of 20.1 m s−1— the only candidate vortex event within the image-bracketed period (Figure 7e–7j and S5). Two notable changes were observed as illustrated in Figure 7: Particle motion on the dome of the WTS (Movie S8), and removal of a streak of dust in the lee of one of the ribs of the solar panels (Movie S9), associated with a 1% step increase in the solar array current (Lorenz, Lemmon, et al., 2020). These changes likely happened simultaneously with the dust removal from the footpad (Figure 4a). Flaky, multi-mm-sized dust aggregates on the WTS moved or disappeared, with at least one identified as disaggregated. Most of the aggregates indicate motion parallel to the streak on the arrays and appear similar to large dust aggregates formed in wind-tunnel simulations under Mars-analogue conditions (Merrison et al., 2007). The episodic changes on sol 65 are also associated with a magnetic-field excursion of the order of 0.2–0.5 nT (Figure 7i) and an elastic response of the ground shown as ground acceleration, observed by both seismometers, the VBB and SP (Figure 7j).
CHARALAMBOUS ET AL.
10.1029/2020JE006757
9 of 51

Journal of Geophysical Research: Planets
CHARALAMBOUS ET AL.
10.1029/2020JE006757
10 of 51
Figure 5. (a) ICC image on sol 0 with cap on followed by sol 4 after it was taken off and dust was deposited onto the lens. Rightmost panel shows the differencing result of sols 65–4. White pixels indicate the abundant dust particles removed during this period (see also Movie S5). (b) The sequential episodic ICC cleaning events are broken down from sol 14, when weather data exists, until sol 65, which resulted in the final differencing of (a). Wind speed is presented in dark gray and pressure drops are presented in turquoise (pressure with a moving mean window of 500 s removed). Image differencing from periods where photometric values were not substantially different are accompanied. Ticks denote that cleaning occurred, most visibly noticeable in the upper part of differencing, above the horizon, providing a detection area that is mostly unaffected by shadowing. (c) Rank order of dust cleaning amount against measured peak wind speed, with a table indicating the last image from which the rank order was visually determined in (b). ICC, Instrument Context Camera.
Journal of Geophysical Research: Planets
3.2. Surface Changes
3.2.1. Near Lander
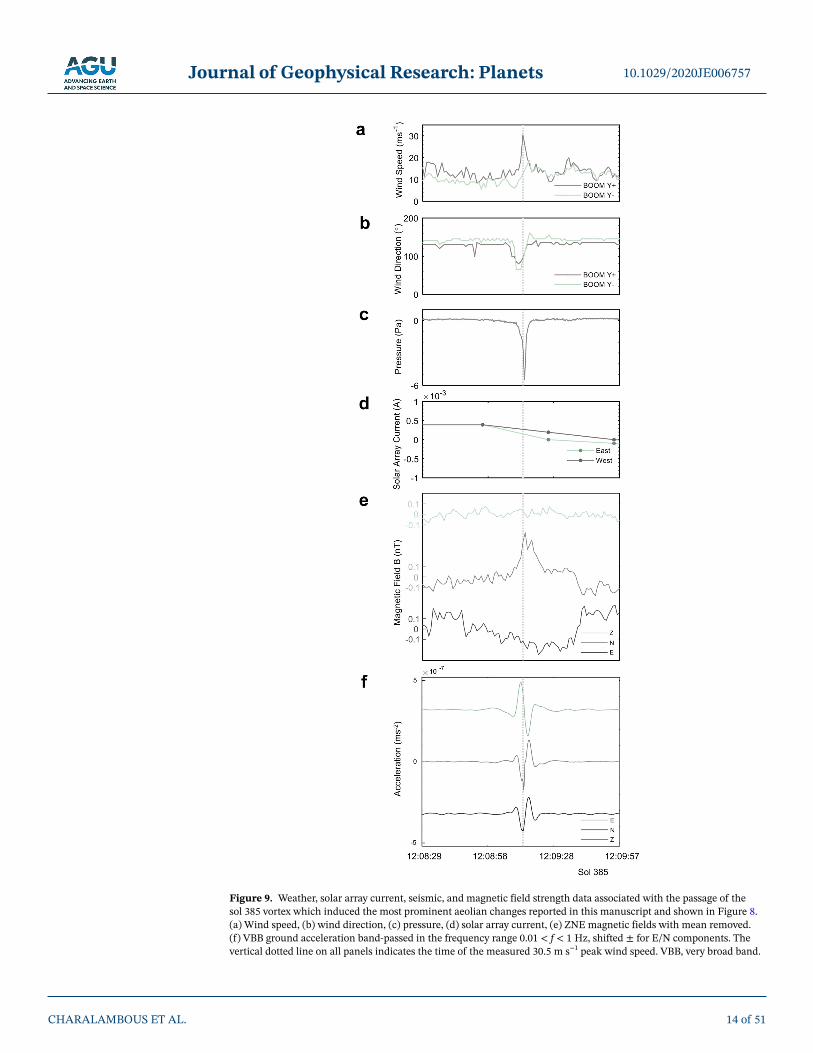
The IDC's proximity to the surface during sols 298–400 permitted grains of d > 1 mm to be resolved. While redistribution of fines on the top and in the bucket of the scoop was frequently observed, surface changes were only detected on sols 364 (Figure S6) and 385 (Figure 8). Sol 364 estimates show the maximum wind speed during the 400-sol period of our investigation at 31.5 m s−1, associated with a ∆P = 3.5 Pa (Figure S6). A 30.5 m s−1 wind speed and ∆P = 5.5 Pa were recorded on sol 385 between the image-bracketed period 12:00–16:00 LMST (Figures 9a–9c and S7).
Images between sols 362 and 364 (Movies S10 and S11) and during sol 385 (noon to afternoon) show epi-sodes of surface creep by grains of diameters from 1 mm up to d = 2 and d = 3 mm, respectively (Figures 8a, 8c, 8d, 8h, and S8, Movies S12–S16). In addition, the motion of material too fine to be resolvable at the par-ticle scale is observed. Flaky and irregular millimeter-sized dust aggregates also appeared (Movie S17). IDC image differencing of sols 364–362 (Figure S6) and sol 385 noon to afternoon (differencing result shown as
CHARALAMBOUS ET AL.
10.1029/2020JE006757
11 of 51
Figure 6. (a) IDC image on Sol 257. This represents the first IDC image to be taken showing the dark spots on the tether which were identified from ICC images on sol 235 (Movie S7). (b) Clean tether surface on IDC sol 26, and dust accumulation on sols 135 and 264, respectively. (c-i, ii, iii) Close-up views of panel (a) showing the dark spots. Note color similarity to clean surface shown in panel (b). Dotted lines in (c-ii) align to faint dark rays, while the top arrow point to a dark streak on the tether's surface. (c-iv) The dark spot emerges with its rays in the superposed sols 237–234 ICC differencing result (superposed white pixels represent thresholding from image difference, Movie S6). IDC, Instrument Deployment Camera.
Journal of Geophysical Research: Planets
CHARALAMBOUS ET AL.
10.1029/2020JE006757
12 of 51
Figure 7. Observations from the largest rapid pressure drop recorded on Mars. (a) IDCs acquired on sol 65, 13:25 and (b) 14:24 LMST, 6 min after the vortex encounter (Movie S8). The green arrow points to a dark streak from the dust cleaning event on the east solar panel (Movie S9). A particle emerges disaggregated in the measured wind direction (square). Stars mark at least four particles displaced; triangle marks one example of disappearance; diamond marks multiple-grain motion on the deck. (c) Differenced images of the selected areas in (b) pointing to particle motion and dust cleaning on the panel, respectively. (d) ICC lens dust cleaning in white pixels. (e, f) Wind speed and direction, with Y+ representing the post-processed selected boom. (g) Pressure shows the vortex aligned to 180° wind-direction change, (h) step-increase of solar array currents (i) magnetic field with the mean removed, (j) spectrogram of magnitude of the acceleration vector ZNE as observed by the short-period seismometer. ICC, Instrument Context Camera; IDC, Instrument Deployment Camera.
Journal of Geophysical Research: Planets
CHARALAMBOUS ET AL.
10.1029/2020JE006757
13 of 51
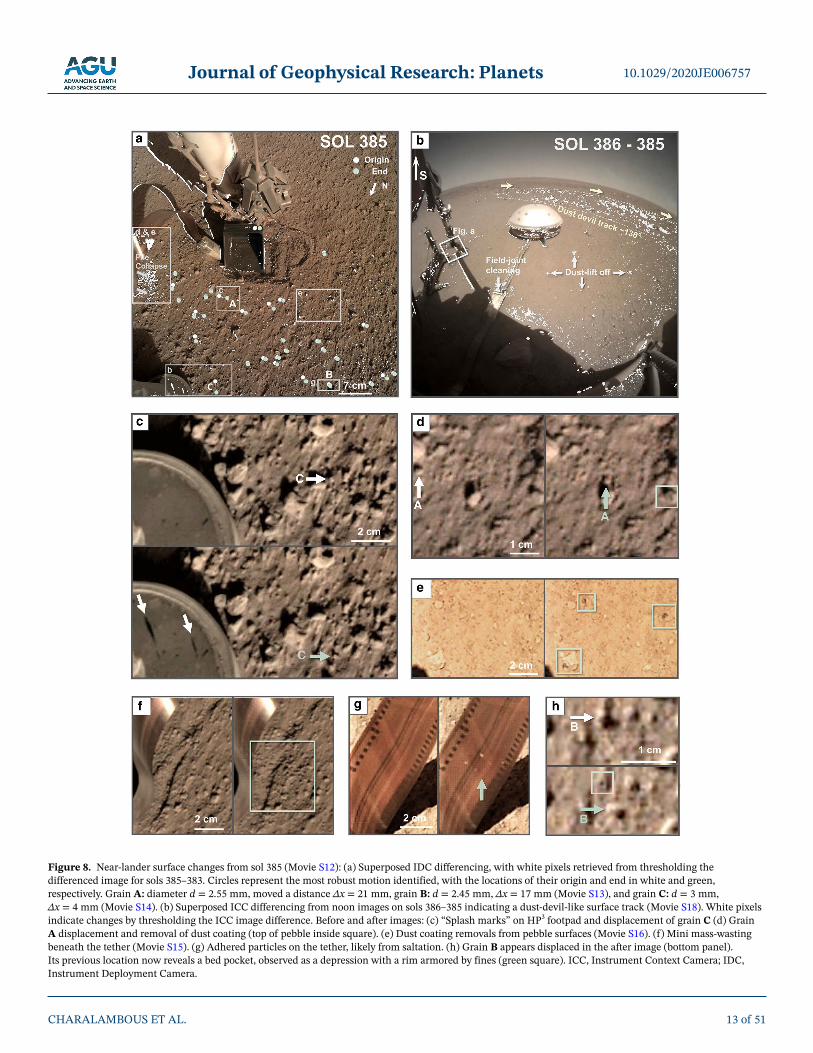
Figure 8. Near-lander surface changes from sol 385 (Movie S12): (a) Superposed IDC differencing, with white pixels retrieved from thresholding the differenced image for sols 385–383. Circles represent the most robust motion identified, with the locations of their origin and end in white and green, respectively. Grain A: diameter d = 2.55 mm, moved a distance ∆x = 21 mm, grain B: d = 2.45 mm, ∆x = 17 mm (Movie S13), and grain C: d = 3 mm, ∆x = 4 mm (Movie S14). (b) Superposed ICC differencing from noon images on sols 386–385 indicating a dust-devil-like surface track (Movie S18). White pixels indicate changes by thresholding the ICC image difference. Before and after images: (c) “Splash marks” on HP3 footpad and displacement of grain C (d) Grain A displacement and removal of dust coating (top of pebble inside square). (e) Dust coating removals from pebble surfaces (Movie S16). (f) Mini mass-wasting beneath the tether (Movie S15). (g) Adhered particles on the tether, likely from saltation. (h) Grain B appears displaced in the after image (bottom panel). Its previous location now reveals a bed pocket, observed as a depression with a rim armored by fines (green square). ICC, Instrument Context Camera; IDC, Instrument Deployment Camera.
Journal of Geophysical Research: Planets
CHARALAMBOUS ET AL.
10.1029/2020JE006757
14 of 51
Figure 9. Weather, solar array current, seismic, and magnetic field strength data associated with the passage of the sol 385 vortex which induced the most prominent aeolian changes reported in this manuscript and shown in Figure 8. (a) Wind speed, (b) wind direction, (c) pressure, (d) solar array current, (e) ZNE magnetic fields with mean removed. (f) VBB ground acceleration band-passed in the frequency range 0.01 < f < 1 Hz, shifted ± for E/N components. The vertical dotted line on all panels indicates the time of the measured 30.5 m s−1 peak wind speed. VBB, very broad band.
Journal of Geophysical Research: Planets
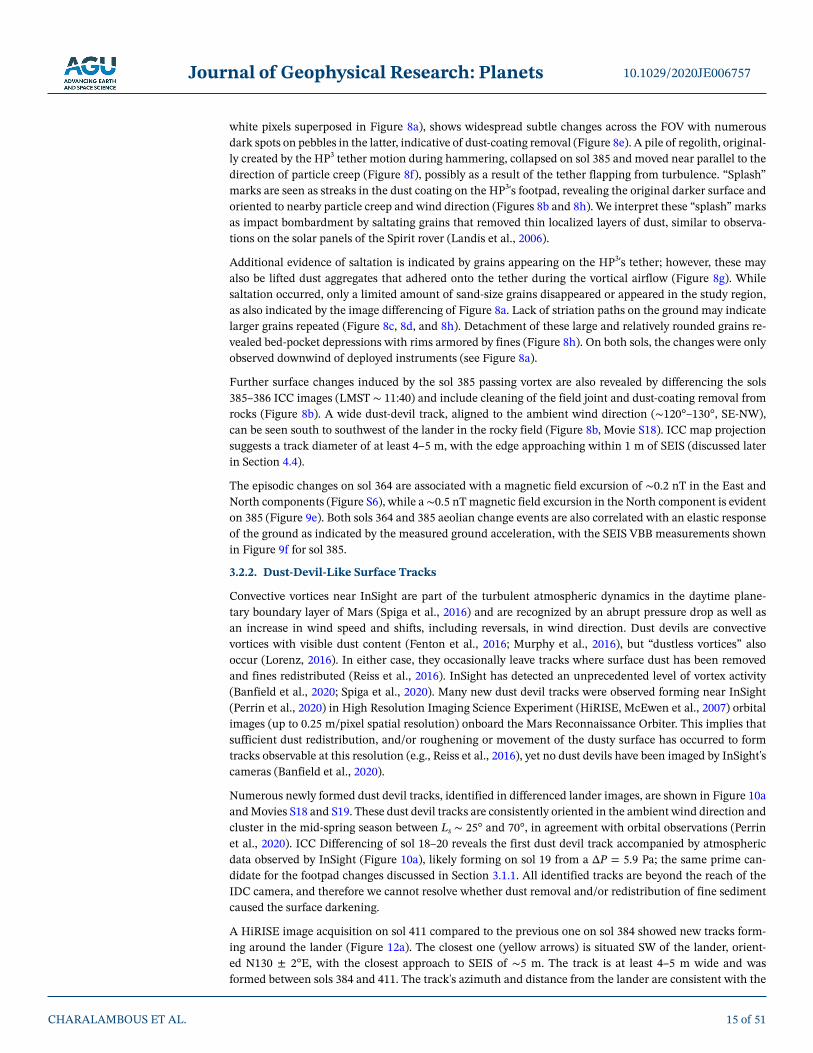
white pixels superposed in Figure 8a), shows widespread subtle changes across the FOV with numerous dark spots on pebbles in the latter, indicative of dust-coating removal (Figure 8e). A pile of regolith, original-ly created by the HP3 tether motion during hammering, collapsed on sol 385 and moved near parallel to the direction of particle creep (Figure 8f), possibly as a result of the tether flapping from turbulence. “Splash” marks are seen as streaks in the dust coating on the HP3's footpad, revealing the original darker surface and oriented to nearby particle creep and wind direction (Figures 8b and 8h). We interpret these “splash” marks as impact bombardment by saltating grains that removed thin localized layers of dust, similar to observa-tions on the solar panels of the Spirit rover (Landis et al., 2006).
Additional evidence of saltation is indicated by grains appearing on the HP3's tether; however, these may also be lifted dust aggregates that adhered onto the tether during the vortical airflow (Figure 8g). While saltation occurred, only a limited amount of sand-size grains disappeared or appeared in the study region, as also indicated by the image differencing of Figure 8a. Lack of striation paths on the ground may indicate larger grains repeated (Figure 8c, 8d, and 8h). Detachment of these large and relatively rounded grains re-vealed bed-pocket depressions with rims armored by fines (Figure 8h). On both sols, the changes were only observed downwind of deployed instruments (see Figure 8a).
Further surface changes induced by the sol 385 passing vortex are also revealed by differencing the sols 385–386 ICC images (LMST ∼ 11:40) and include cleaning of the field joint and dust-coating removal from rocks (Figure 8b). A wide dust-devil track, aligned to the ambient wind direction (∼120°–130°, SE-NW), can be seen south to southwest of the lander in the rocky field (Figure 8b, Movie S18). ICC map projection suggests a track diameter of at least 4–5 m, with the edge approaching within 1 m of SEIS (discussed later in Section 4.4).
The episodic changes on sol 364 are associated with a magnetic field excursion of ∼0.2 nT in the East and North components (Figure S6), while a ∼0.5 nT magnetic field excursion in the North component is evident on 385 (Figure 9e). Both sols 364 and 385 aeolian change events are also correlated with an elastic response of the ground as indicated by the measured ground acceleration, with the SEIS VBB measurements shown in Figure 9f for sol 385.
3.2.2. Dust-Devil-Like Surface Tracks
Convective vortices near InSight are part of the turbulent atmospheric dynamics in the daytime plane-tary boundary layer of Mars (Spiga et al., 2016) and are recognized by an abrupt pressure drop as well as an increase in wind speed and shifts, including reversals, in wind direction. Dust devils are convective vortices with visible dust content (Fenton et al., 2016; Murphy et al., 2016), but “dustless vortices” also occur (Lorenz, 2016). In either case, they occasionally leave tracks where surface dust has been removed and fines redistributed (Reiss et al., 2016). InSight has detected an unprecedented level of vortex activity (Banfield et al., 2020; Spiga et al., 2020). Many new dust devil tracks were observed forming near InSight (Perrin et al., 2020) in High Resolution Imaging Science Experiment (HiRISE, McEwen et al., 2007) orbital images (up to 0.25 m/pixel spatial resolution) onboard the Mars Reconnaissance Orbiter. This implies that sufficient dust redistribution, and/or roughening or movement of the dusty surface has occurred to form tracks observable at this resolution (e.g., Reiss et al., 2016), yet no dust devils have been imaged by InSight's cameras (Banfield et al., 2020).
Numerous newly formed dust devil tracks, identified in differenced lander images, are shown in Figure 10a and Movies S18 and S19. These dust devil tracks are consistently oriented in the ambient wind direction and cluster in the mid-spring season between Ls ∼ 25° and 70°, in agreement with orbital observations (Perrin et al., 2020). ICC Differencing of sol 18–20 reveals the first dust devil track accompanied by atmospheric data observed by InSight (Figure 10a), likely forming on sol 19 from a ∆P = 5.9 Pa; the same prime can-didate for the footpad changes discussed in Section 3.1.1. All identified tracks are beyond the reach of the IDC camera, and therefore we cannot resolve whether dust removal and/or redistribution of fine sediment caused the surface darkening.
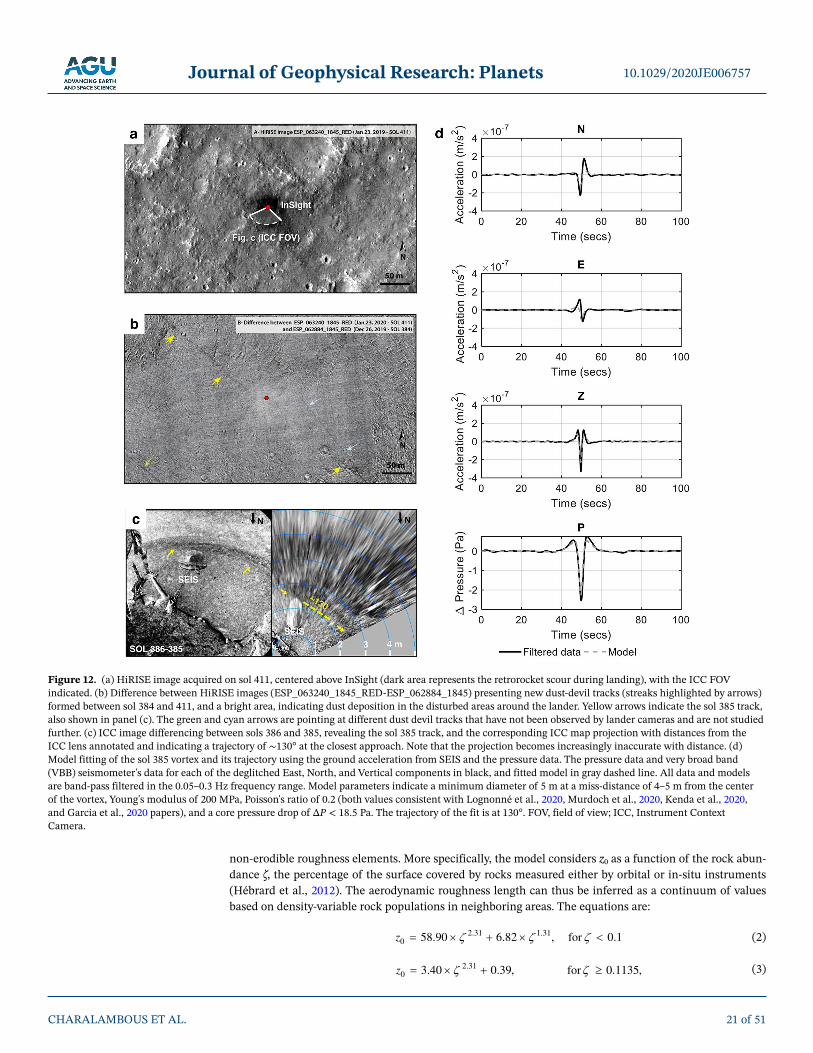
A HiRISE image acquisition on sol 411 compared to the previous one on sol 384 showed new tracks form-ing around the lander (Figure 12a). The closest one (yellow arrows) is situated SW of the lander, orient-ed N130 ± 2°E, with the closest approach to SEIS of ∼5 m. The track is at least 4–5 m wide and was formed between sols 384 and 411. The track's azimuth and distance from the lander are consistent with the
CHARALAMBOUS ET AL.
10.1029/2020JE006757
15 of 51

Journal of Geophysical Research: Planets
lander-imaged dust devil track that formed on sol 385 (Figure 12). Although the image-differenced bright zone around the lander indicates some dust deposition occurred in the disturbed landing site over the peri-od of sols 384–411 (more easily identifiable due to changes in the dark-toned disturbed surface in contrast to the already bright-toned surroundings), ICC differencing for the same period still reveals the track (Fig-ure S9b). This indicates the amount of dust deposited over this period was insufficient to erase the track, in agreement with the estimated erasure period of >90 sols in the Elysium region (Reiss & Lorenz, 2016).
Only two tracks have so far been observed by both orbital and ground-based cameras; the first formed on sol 202 ∼19 m away from the InSight lander (Figure 10a, analysis in Banerdt et al., 2020). The second track is the sol 385 track we have identified in this study, formed by a vortex passing at a distance of less than 5 m. The sol 385 is the closest track to a lander on Mars inducing observed in-situ grain motion, with the track
CHARALAMBOUS ET AL.
10.1029/2020JE006757
16 of 51
Figure 10. (a) Differencing of afternoon images of sols 20–16, 167–164, 180–179, 203–198, 205–203, 232–228, 261–253, and 386–385 reveal dust-devil-like tracks. Note that the arrows along the tracks do not necessarily indicate the direction of vortex travel. The white spots across FOV of the differencing between sols 20 and 16 demonstrate an ICC lens cleaning event and the first likely surface track observed from ICC imaging that is also accompanied with meteorological data. (b) Compilation of all changes, incorporating atmospheric conditions of the candidate vortices favored to have induced motion. The daily number of pressure drops >0.3 Pa are shown by squares. The ambient wind speed is adapted from Spiga et al. (2020) and plotted as dots. The symbols in the top row of the legend indicate the main character of each change. The inverted triangle labeled “Surface” is attributed to aeolian changes identified by high-resolution images on the surface, and “DD tracks” (diamond) are dust-devil-like dark linear features identified in the distance from ICC image differencing. Arrows indicate the wind direction and each symbol is color-coded by the magnitude of the associated pressure drop. ICC, Instrument Context Camera; FOV, field of view.
Journal of Geophysical Research: Planets
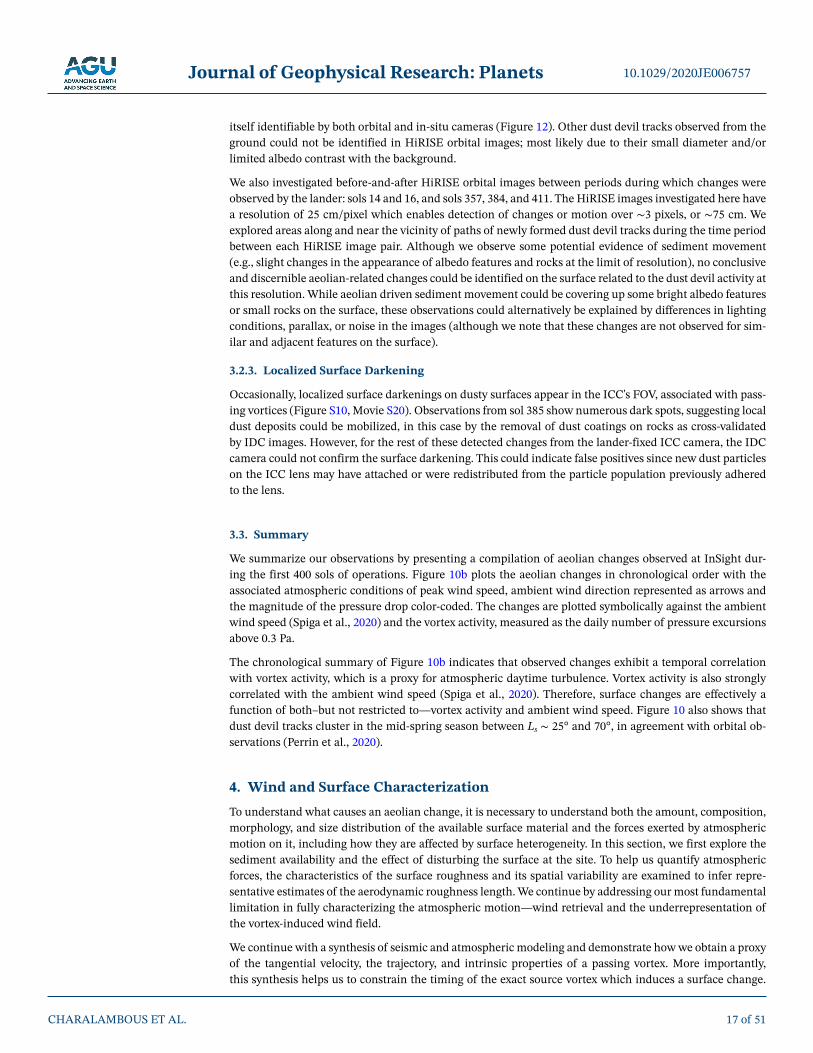
itself identifiable by both orbital and in-situ cameras (Figure 12). Other dust devil tracks observed from the ground could not be identified in HiRISE orbital images; most likely due to their small diameter and/or limited albedo contrast with the background.
We also investigated before-and-after HiRISE orbital images between periods during which changes were observed by the lander: sols 14 and 16, and sols 357, 384, and 411. The HiRISE images investigated here have a resolution of 25 cm/pixel which enables detection of changes or motion over ∼3 pixels, or ∼75 cm. We explored areas along and near the vicinity of paths of newly formed dust devil tracks during the time period between each HiRISE image pair. Although we observe some potential evidence of sediment movement (e.g., slight changes in the appearance of albedo features and rocks at the limit of resolution), no conclusive and discernible aeolian-related changes could be identified on the surface related to the dust devil activity at this resolution. While aeolian driven sediment movement could be covering up some bright albedo features or small rocks on the surface, these observations could alternatively be explained by differences in lighting conditions, parallax, or noise in the images (although we note that these changes are not observed for sim-ilar and adjacent features on the surface).
3.2.3. Localized Surface Darkening
Occasionally, localized surface darkenings on dusty surfaces appear in the ICC's FOV, associated with pass-ing vortices (Figure S10, Movie S20). Observations from sol 385 show numerous dark spots, suggesting local dust deposits could be mobilized, in this case by the removal of dust coatings on rocks as cross-validated by IDC images. However, for the rest of these detected changes from the lander-fixed ICC camera, the IDC camera could not confirm the surface darkening. This could indicate false positives since new dust particles on the ICC lens may have attached or were redistributed from the particle population previously adhered to the lens.
3.3. Summary
We summarize our observations by presenting a compilation of aeolian changes observed at InSight dur-ing the first 400 sols of operations. Figure 10b plots the aeolian changes in chronological order with the associated atmospheric conditions of peak wind speed, ambient wind direction represented as arrows and the magnitude of the pressure drop color-coded. The changes are plotted symbolically against the ambient wind speed (Spiga et al., 2020) and the vortex activity, measured as the daily number of pressure excursions above 0.3 Pa.
The chronological summary of Figure 10b indicates that observed changes exhibit a temporal correlation with vortex activity, which is a proxy for atmospheric daytime turbulence. Vortex activity is also strongly correlated with the ambient wind speed (Spiga et al., 2020). Therefore, surface changes are effectively a function of both–but not restricted to—vortex activity and ambient wind speed. Figure 10 also shows that dust devil tracks cluster in the mid-spring season between Ls ∼ 25° and 70°, in agreement with orbital ob-servations (Perrin et al., 2020).
4. Wind and Surface CharacterizationTo understand what causes an aeolian change, it is necessary to understand both the amount, composition, morphology, and size distribution of the available surface material and the forces exerted by atmospheric motion on it, including how they are affected by surface heterogeneity. In this section, we first explore the sediment availability and the effect of disturbing the surface at the site. To help us quantify atmospheric forces, the characteristics of the surface roughness and its spatial variability are examined to infer repre-sentative estimates of the aerodynamic roughness length. We continue by addressing our most fundamental limitation in fully characterizing the atmospheric motion—wind retrieval and the underrepresentation of the vortex-induced wind field.
We continue with a synthesis of seismic and atmospheric modeling and demonstrate how we obtain a proxy of the tangential velocity, the trajectory, and intrinsic properties of a passing vortex. More importantly, this synthesis helps us to constrain the timing of the exact source vortex which induces a surface change.
CHARALAMBOUS ET AL.
10.1029/2020JE006757
17 of 51
Journal of Geophysical Research: Planets
Finally, we conclude the section by discussing possible sources for the correlated magnetic perturbations observed at the passage of a vortex inducing aeolian changes.
4.1. Sediment Availability and Geomorphic Stability at InSight
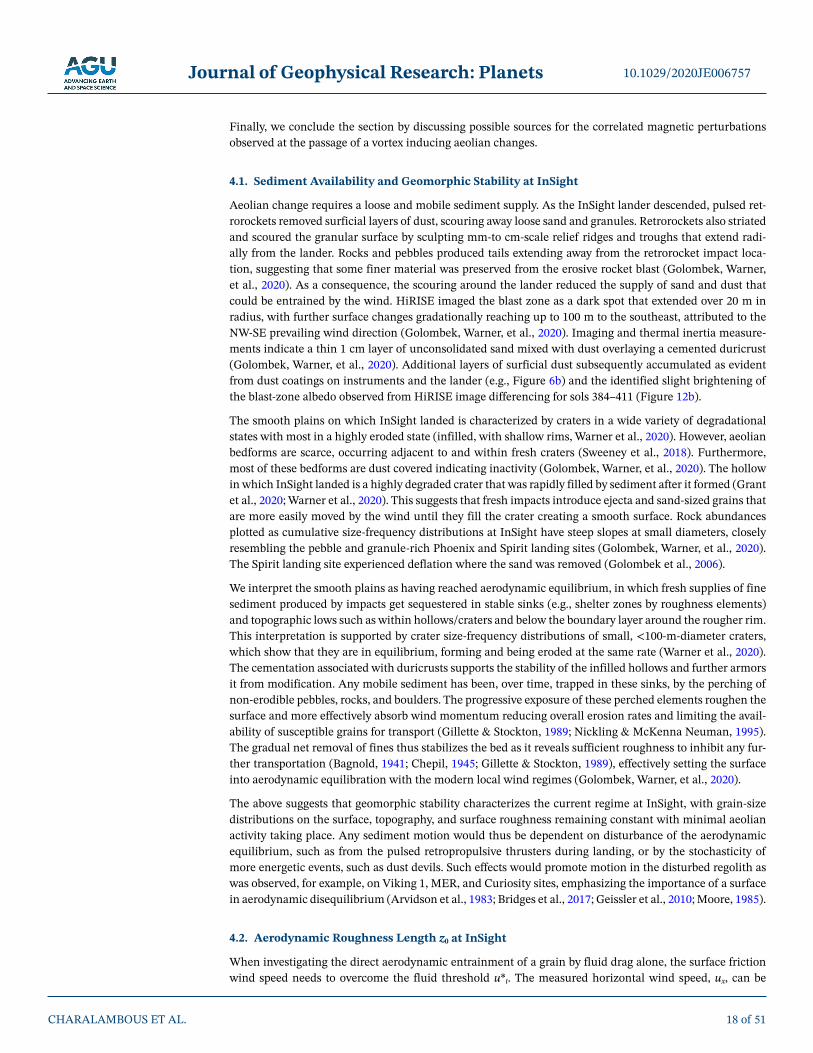
Aeolian change requires a loose and mobile sediment supply. As the InSight lander descended, pulsed ret-rorockets removed surficial layers of dust, scouring away loose sand and granules. Retrorockets also striated and scoured the granular surface by sculpting mm-to cm-scale relief ridges and troughs that extend radi-ally from the lander. Rocks and pebbles produced tails extending away from the retrorocket impact loca-tion, suggesting that some finer material was preserved from the erosive rocket blast (Golombek, Warner, et al., 2020). As a consequence, the scouring around the lander reduced the supply of sand and dust that could be entrained by the wind. HiRISE imaged the blast zone as a dark spot that extended over 20 m in radius, with further surface changes gradationally reaching up to 100 m to the southeast, attributed to the NW-SE prevailing wind direction (Golombek, Warner, et al., 2020). Imaging and thermal inertia measure-ments indicate a thin 1 cm layer of unconsolidated sand mixed with dust overlaying a cemented duricrust (Golombek, Warner, et al., 2020). Additional layers of surficial dust subsequently accumulated as evident from dust coatings on instruments and the lander (e.g., Figure 6b) and the identified slight brightening of the blast-zone albedo observed from HiRISE image differencing for sols 384–411 (Figure 12b).
The smooth plains on which InSight landed is characterized by craters in a wide variety of degradational states with most in a highly eroded state (infilled, with shallow rims, Warner et al., 2020). However, aeolian bedforms are scarce, occurring adjacent to and within fresh craters (Sweeney et al., 2018). Furthermore, most of these bedforms are dust covered indicating inactivity (Golombek, Warner, et al., 2020). The hollow in which InSight landed is a highly degraded crater that was rapidly filled by sediment after it formed (Grant et al., 2020; Warner et al., 2020). This suggests that fresh impacts introduce ejecta and sand-sized grains that are more easily moved by the wind until they fill the crater creating a smooth surface. Rock abundances plotted as cumulative size-frequency distributions at InSight have steep slopes at small diameters, closely resembling the pebble and granule-rich Phoenix and Spirit landing sites (Golombek, Warner, et al., 2020). The Spirit landing site experienced deflation where the sand was removed (Golombek et al., 2006).
We interpret the smooth plains as having reached aerodynamic equilibrium, in which fresh supplies of fine sediment produced by impacts get sequestered in stable sinks (e.g., shelter zones by roughness elements) and topographic lows such as within hollows/craters and below the boundary layer around the rougher rim. This interpretation is supported by crater size-frequency distributions of small, <100-m-diameter craters, which show that they are in equilibrium, forming and being eroded at the same rate (Warner et al., 2020). The cementation associated with duricrusts supports the stability of the infilled hollows and further armors it from modification. Any mobile sediment has been, over time, trapped in these sinks, by the perching of non-erodible pebbles, rocks, and boulders. The progressive exposure of these perched elements roughen the surface and more effectively absorb wind momentum reducing overall erosion rates and limiting the avail-ability of susceptible grains for transport (Gillette & Stockton, 1989; Nickling & McKenna Neuman, 1995). The gradual net removal of fines thus stabilizes the bed as it reveals sufficient roughness to inhibit any fur-ther transportation (Bagnold, 1941; Chepil, 1945; Gillette & Stockton, 1989), effectively setting the surface into aerodynamic equilibration with the modern local wind regimes (Golombek, Warner, et al., 2020).
The above suggests that geomorphic stability characterizes the current regime at InSight, with grain-size distributions on the surface, topography, and surface roughness remaining constant with minimal aeolian activity taking place. Any sediment motion would thus be dependent on disturbance of the aerodynamic equilibrium, such as from the pulsed retropropulsive thrusters during landing, or by the stochasticity of more energetic events, such as dust devils. Such effects would promote motion in the disturbed regolith as was observed, for example, on Viking 1, MER, and Curiosity sites, emphasizing the importance of a surface in aerodynamic disequilibrium (Arvidson et al., 1983; Bridges et al., 2017; Geissler et al., 2010; Moore, 1985).
4.2. Aerodynamic Roughness Length z0 at InSight
When investigating the direct aerodynamic entrainment of a grain by fluid drag alone, the surface friction wind speed needs to overcome the fluid threshold u*t. The measured horizontal wind speed, ux, can be
CHARALAMBOUS ET AL.
10.1029/2020JE006757
18 of 51
Journal of Geophysical Research: Planets
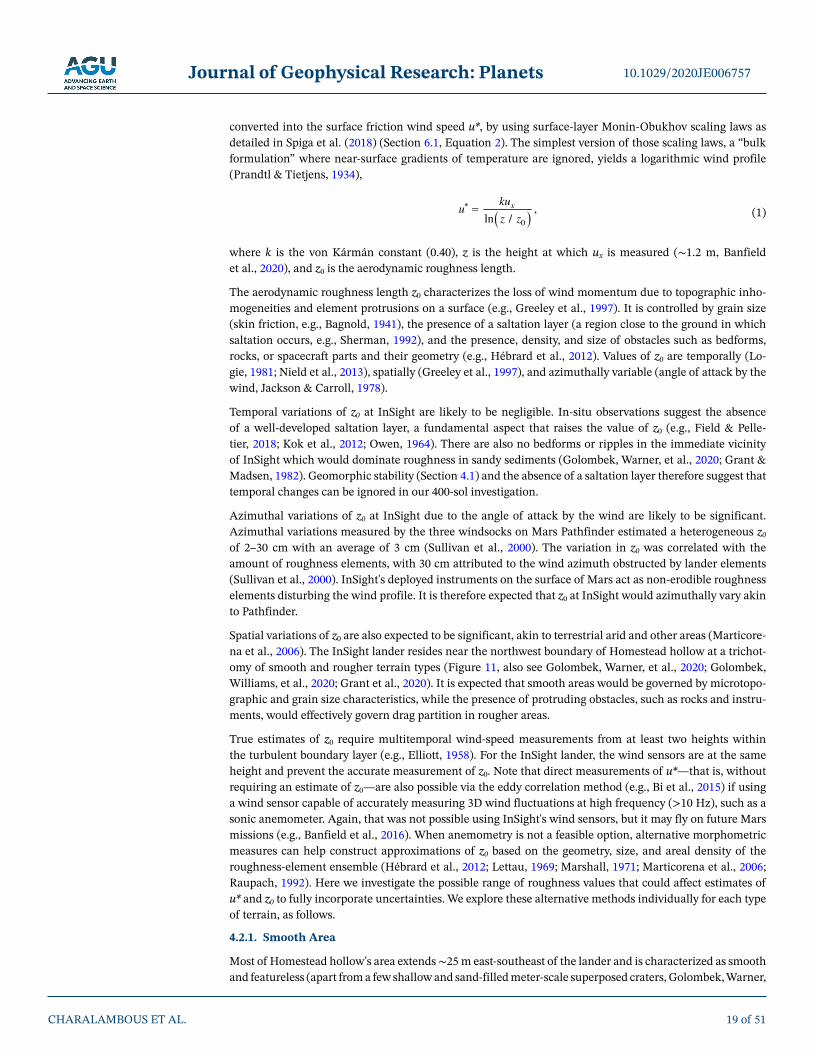
converted into the surface friction wind speed u*, by using surface-layer Monin-Obukhov scaling laws as detailed in Spiga et al. (2018) (Section 6.1, Equation 2). The simplest version of those scaling laws, a “bulk formulation” where near-surface gradients of temperature are ignored, yields a logarithmic wind profile (Prandtl & Tietjens, 1934),
0,
ln /xkuu
z z (1)
where k is the von Kármán constant (0.40), z is the height at which ux is measured (∼1.2 m, Banfield et al., 2020), and z0 is the aerodynamic roughness length.
The aerodynamic roughness length z0 characterizes the loss of wind momentum due to topographic inho-mogeneities and element protrusions on a surface (e.g., Greeley et al., 1997). It is controlled by grain size (skin friction, e.g., Bagnold, 1941), the presence of a saltation layer (a region close to the ground in which saltation occurs, e.g., Sherman, 1992), and the presence, density, and size of obstacles such as bedforms, rocks, or spacecraft parts and their geometry (e.g., Hébrard et al., 2012). Values of z0 are temporally (Lo-gie, 1981; Nield et al., 2013), spatially (Greeley et al., 1997), and azimuthally variable (angle of attack by the wind, Jackson & Carroll, 1978).
Temporal variations of z0 at InSight are likely to be negligible. In-situ observations suggest the absence of a well-developed saltation layer, a fundamental aspect that raises the value of z0 (e.g., Field & Pelle-tier, 2018; Kok et al., 2012; Owen, 1964). There are also no bedforms or ripples in the immediate vicinity of InSight which would dominate roughness in sandy sediments (Golombek, Warner, et al., 2020; Grant & Madsen, 1982). Geomorphic stability (Section 4.1) and the absence of a saltation layer therefore suggest that temporal changes can be ignored in our 400-sol investigation.
Azimuthal variations of z0 at InSight due to the angle of attack by the wind are likely to be significant. Azimuthal variations measured by the three windsocks on Mars Pathfinder estimated a heterogeneous z0 of 2–30 cm with an average of 3 cm (Sullivan et al., 2000). The variation in z0 was correlated with the amount of roughness elements, with 30 cm attributed to the wind azimuth obstructed by lander elements (Sullivan et al., 2000). InSight's deployed instruments on the surface of Mars act as non-erodible roughness elements disturbing the wind profile. It is therefore expected that z0 at InSight would azimuthally vary akin to Pathfinder.
Spatial variations of z0 are also expected to be significant, akin to terrestrial arid and other areas (Marticore-na et al., 2006). The InSight lander resides near the northwest boundary of Homestead hollow at a trichot-omy of smooth and rougher terrain types (Figure 11, also see Golombek, Warner, et al., 2020; Golombek, Williams, et al., 2020; Grant et al., 2020). It is expected that smooth areas would be governed by microtopo-graphic and grain size characteristics, while the presence of protruding obstacles, such as rocks and instru-ments, would effectively govern drag partition in rougher areas.
True estimates of z0 require multitemporal wind-speed measurements from at least two heights within the turbulent boundary layer (e.g., Elliott, 1958). For the InSight lander, the wind sensors are at the same height and prevent the accurate measurement of z0. Note that direct measurements of u*—that is, without requiring an estimate of z0—are also possible via the eddy correlation method (e.g., Bi et al., 2015) if using a wind sensor capable of accurately measuring 3D wind fluctuations at high frequency (>10 Hz), such as a sonic anemometer. Again, that was not possible using InSight's wind sensors, but it may fly on future Mars missions (e.g., Banfield et al., 2016). When anemometry is not a feasible option, alternative morphometric measures can help construct approximations of z0 based on the geometry, size, and areal density of the roughness-element ensemble (Hébrard et al., 2012; Lettau, 1969; Marshall, 1971; Marticorena et al., 2006; Raupach, 1992). Here we investigate the possible range of roughness values that could affect estimates of u* and z0 to fully incorporate uncertainties. We explore these alternative methods individually for each type of terrain, as follows.
4.2.1. Smooth Area
Most of Homestead hollow's area extends ∼25 m east-southeast of the lander and is characterized as smooth and featureless (apart from a few shallow and sand-filled meter-scale superposed craters, Golombek, Warner,
CHARALAMBOUS ET AL.
10.1029/2020JE006757
19 of 51

Journal of Geophysical Research: Planets
et al., 2020; Golombek, Williams, et al., 2020; Warner et al., 2020). Consequently, the mean erodible grain size and rocket-induced multi-millimeter relief ridges (Garvin et al., 2019; Golombek, Warner, et al., 2020) will dominate the effective z0 to this extent (Bagnold, 1941; Greeley & Iversen, 1985).
For a smooth surface composed of a grain population with fixed diameter d, the value of z0 will scale pro-portionally to d/30 (Bagnold, 1941; Greeley & Iversen, 1985). For an irregular but smooth erodible surface of nonuniform grain sizes, a reasonable representation of z0 is 2Do/30, where Do is the median grain size diameter (Sherman, 1992). This latter scenario represents the smooth area at InSight with a median grain diameter of 3–5.3 mm (Weitz et al., 2020) for which we estimate z0 ∼0.02–0.035 cm.
Since the proposed relationship only considers the grain-scale roughness, we also investigate the contribu-tion of microtopography to z0 to incorporate the multi-millimeter ridge relief excavated by the retrorockets. The vertical relief extracted from digital elevation models (DEMs) can better represent complex natural geometries and can be defined by the root mean square (RMS) of the height profile. Studies have exploited DEMs constructed from structure-from-motion (SfM) techniques to infer z0 values (Irvine-Fynn et al., 2014; Miles et al., 2017; Rounce et al., 2015). When a site contains a mixture of nonuniform particles in a fine matrix, such as the case of InSight (Golombek, Warner, et al., 2020), z0 varies as 1/15–1/20 the RMS of the detrended profile of the surface, or the RMS height (Lancaster et al., 1991). For a vertical RMS height of ∼1.9 mm (Garvin et al., 2019), this yields a z0 in the range of 0.01–0.013 cm. Therefore, despite the simplicity of the grain-size-dependent “2Do/30” rule in contrast to the complexity of the DEMs, the two methods yield a nearly consistent z0 for the smooth area.
A third method developed by Hébrard et al. (2012) can be adopted here based on a rock-strewn z0 de-pendence. The model considers the average proportion of protruding rocks as obstacles and relates this via an empirical relationship to z0. Both rocks and instruments can be incorporated into this approach as
CHARALAMBOUS ET AL.
10.1029/2020JE006757
20 of 51
Figure 11. (a) Panoramic view (incorporating multiple IDC images) to the south of the lander indicating the trichotomy of rock-dense variable areas (Image credit: NASA/JPL-Caltech). (b) The field of view to the south of the lander from the ICC camera, including the element-dense workspace area with deployed instruments (c) Cumulative fractional areas by rocks over different landing sites on Mars and distinction between areas at InSight, including the workspace by incorporating the HP3 and WTS instruments as roughness elements. Surface rock counts are Viking lander 2 from Moore and Keller (1990, 1991), Mars Pathfinder from Golombek et al. (2003), Spirit Mission Success (CMS), from Golombek et al. (2005, 2006), Phoenix from Heet et al. (2009), and InSight from Golombek, Warner, et al. (2020).
Journal of Geophysical Research: Planets
non-erodible roughness elements. More specifically, the model considers z0 as a function of the rock abun-dance ζ, the percentage of the surface covered by rocks measured either by orbital or in-situ instruments (Hébrard et al., 2012). The aerodynamic roughness length can thus be inferred as a continuum of values based on density-variable rock populations in neighboring areas. The equations are:
2.31 1.310 58.90 6.82 , for 0.1135,z (2)
(3)z02 31
3 40 0 39 0 1135 . . , . ,. for
CHARALAMBOUS ET AL.
10.1029/2020JE006757
21 of 51
Figure 12. (a) HiRISE image acquired on sol 411, centered above InSight (dark area represents the retrorocket scour during landing), with the ICC FOV indicated. (b) Difference between HiRISE images (ESP_063240_1845_RED-ESP_062884_1845) presenting new dust-devil tracks (streaks highlighted by arrows) formed between sol 384 and 411, and a bright area, indicating dust deposition in the disturbed areas around the lander. Yellow arrows indicate the sol 385 track, also shown in panel (c). The green and cyan arrows are pointing at different dust devil tracks that have not been observed by lander cameras and are not studied further. (c) ICC image differencing between sols 386 and 385, revealing the sol 385 track, and the corresponding ICC map projection with distances from the ICC lens annotated and indicating a trajectory of ∼130° at the closest approach. Note that the projection becomes increasingly inaccurate with distance. (d) Model fitting of the sol 385 vortex and its trajectory using the ground acceleration from SEIS and the pressure data. The pressure data and very broad band (VBB) seismometer's data for each of the deglitched East, North, and Vertical components in black, and fitted model in gray dashed line. All data and models are band-pass filtered in the 0.05–0.3 Hz frequency range. Model parameters indicate a minimum diameter of 5 m at a miss-distance of 4–5 m from the center of the vortex, Young's modulus of 200 MPa, Poisson's ratio of 0.2 (both values consistent with Lognonné et al., 2020, Murdoch et al., 2020, Kenda et al., 2020, and Garcia et al., 2020 papers), and a core pressure drop of ∆P < 18.5 Pa. The trajectory of the fit is at 130°. FOV, field of view; ICC, Instrument Context Camera.
Journal of Geophysical Research: Planets
Local rock abundance in the smooth terrain of the sand-rich Homestead Hollow is low and it is estimated at a ζ ∼ 1%–2% due to the dearth of rocks larger than 10 cm (Charalambous et al., 2019; Golombek, Warn-er, et al., 2020). From Equation 2, this yields a z0 = 0.03 cm, in reasonable agreement to the RMS height (z0 = 0.01–0.02 cm) and the rule-of-thumb mean grain-size methods (z0 = 0.02–0.035 cm).
4.2.2. Rough Area
To the west of the lander, the hollow transitions to a rockier field which extends to an even rougher in-ter-crater terrain beyond the boundary of the hollow (Golombek, Warner, et al., 2020; Golombek, Williams, et al., 2020; Grant et al., 2020). The higher relative abundance of rocks in these areas would dominate sandy sediments in the effective roughness calculation, as they act as protrusions inducing “form” drag in the surface geometry (Grant & Madsen, 1982).
The rockier area to the southwest-west, the northern terrains and beyond the hollow's boundary, suggest a rock abundance that varies from 3% to 5% (Charalambous et al., 2019; Golombek, Warner, et al., 2020). These rockier areas are more representative of the typical InSight site (Golombek, Kass, et al., 2020). From Equation 1, a ζ ∼ 3%–5% yields z0 ≈ 0.1–0.2 cm, congruent with pre-landing z0 estimates of the landing site (Golombek et al., 2018; Spiga et al., 2018). Inferred estimates of z0 before InSight's landing using rock abundance measurements from orbital studies varied from ∼ 0.1 to 0.25 cm (Golombek et al., 2018; Spiga et al., 2018). This z0 range of values is consistent with the rockier field, suggesting that rockier areas repre-sent the wider average roughness of the InSight landing site which closely resembles the Spirit landing site (Golombek, Warner, et al., 2020; Golombek, Williams, et al., 2020; Weitz et al., 2020)
4.2.3. Instrument Deployment Area
A local zone of high surface roughness is produced by the deployed instruments which act as non-erodible roughness elements. This raises the local equivalent rock abundance in the workspace area to over 15% (Fig-ures 11c), higher than the Viking lander 2 (VL2) site (ζ = 14%, Golombek et al., 2012; Hébrard et al., 2012) which estimated an approximate z0 ≈ 1 cm (Sutton et al., 1978). Using Equation 3, this equivalent rock abundance in the workspace yields a z0 ≈ 1 cm, consistent with the VL2 measurements and lower than MPF which rests in a rougher terrain with ζ = 18%.
4.2.4. Summary of z0 Values
The variability in the density distribution of rocks within Homestead hollow thus suggests that z0 values are spatially highly heterogeneous. The presence of the spacecraft and deployed components enhances z0 local-ly by at least an order of magnitude. In summary, the smooth area to the east-southeast is estimated with a z0 = 0.01–0.035 cm; the rougher terrain in the southwest to the northeast with z0 ≈ 0.1–0.2 cm; the local instrument deployment area has an estimated z0 ≈ 1 cm. The z0 range derived here is adopted in Section 5 for investigating the fluid threshold and other detachment-enhancing mechanisms for particle motion initia-tion. A fully developed aerodynamic roughness length map at InSight varying as a function of wind azimuth and frontal obstacle areas will be the topic of a future study.
4.3. Wind Retrieval and Reliability
The TWINS sensors were selected to help decouple atmospherically induced seismic signals (Giardini et al., 2020; Lognonne et al., 2020) and configured to measure intermediate winds from 0 to 20 m s−1 (the maximum wind value varies depending on the Reynolds number). For this reason, during close vortex en-counters, the sensor can become saturated, often preventing estimates of wind speed and direction during post-processing on Earth.
We have identified consistent wind data gaps up to 5 s during near-lander vortex encounters, particularly during the main episodic aeolian changes on sols 19, 26, 65, and 385 (but also other candidate events form-ing surface tracks). These are missed opportunities in probing the most energetic part of the vortex, critical for inferring threshold-of-motion conditions. For example, during the passage of the sol 385 key event with a ∆P = 5.5 Pa, the observed transient pressure drop is ∼7 s in duration, suggesting the aeolian chang-es induced were short-lived. TWINS, measuring at 1 sample per second, was not able to retrieve reliable
CHARALAMBOUS ET AL.
10.1029/2020JE006757
22 of 51
Journal of Geophysical Research: Planets
measurements, marked as spurious points, during the closest encounter with the vortex due to high vortic-ity conditions. This led to data gaps (Figure S11) lasting at least 3 s from the 7-s duration event of sol 385.
Assuming low vortical conditions for reliable wind retrieval, two further limitations are introduced by the dimensional characteristics of vortices and the geometry of the encounter. First, if the wind sensors do not penetrate the wall of a vortex, they only sample the decayed outer wind-field velocities (Reiss et al., 2016). Second, the transient tangential velocities cannot be captured at one sample per second even in the case of a direct encounter at the wall, particularly for faster-moving tighter vortices.
4.4. Seismic and Atmospheric Modeling of the Source Vortex
Due to its very high sensitivity, SEIS is capable of detecting atmospheric phenomena such as convective vortices, infrasound, and gravity waves. As such, recent studies have utilized SEIS as a meteorological in-strument (Banerdt et al., 2020; Charalambous et al., 2020; Martire et al., 2020). The passage of a convective vortex, regardless of its dust content, provides a negative load that causes an elastic response in the ground detected seismically as a tilt (Lorenz et al., 2015) allowing tracking of vortices more effectively than possible with a meteorological package (Lorenz et al., 2015).
The unique combination of multi-instrument observations with in-situ and orbital imaging at InSight can therefore provide an unprecedented insight into the dynamics of dust devils on Mars and their ability to erode the surface. Although no direct observations of dust devils were observed by imaging at InSight, we have identified subtle surface tracks formed by nearby vortices through image differencing of sequential images. Investigation of images from HiRISE can reveal the same track providing a highly accurate trajec-tory over long distances (e.g., sol 385, Figure 12b). Establishing the exact time of passage of the vortex is the logical next step; the source vortex must be isolated from many other candidates occurring during the time between two images bracketing an aeolian change. This period is often more than one sol because late-af-ternoon images render image differencing ineffective in detecting changes.
Identifying the source vortex is required to infer the dynamics of the encounter and its properties. For exam-ple, the time series of the source vortex azimuth can help identify whether changes might be associated with strong turbulent wakes downwind of roughness elements. The core pressure drop drives the peak surface friction wind speed and can provide a proxy of the tangential velocities (Lorenz, 2016) which TWINS cannot capture due to high vorticity or simply not sampling the wall of the vortex.
Given a pair of images in which a track is detected, the time of its formation can only be bounded by the times at which the images were taken. Because multiple candidate vortices can occur within the timeframe of two images, the pressure solution becomes ill-defined for the identification of the source vortex; the max-imum pressure drop in that period does not necessarily indicate the closest encounter due to a size/distance degeneracy (e.g., Lorenz, 2016; Murdoch et al., 2020). This degeneracy arises since the acquired pressure drop of a weak, smaller vortex passing close to the lander cannot be distinguished from a larger, more ener-getic vortex passing further away, and vice versa. Therefore, although coincident maximum pressure drops/maximum wind speeds can be indicators of energetic close encounters, a newly observed dust devil track cannot be definitively associated with these peak measurements.
We also cannot rely on the rule of maximum wind speed as a close pass leads to an under-sampled wind speed. Therefore, all vortices must be examined for wind-data gaps, as identified wind peaks could be un-related to the source vortex. In addition, the lower peak wind speeds encountered beyond the “wall” of a vortex (Reiss et al., 2016) decreasingly represent the trigger for aeolian change identified at increasing distances from the wind-sensor location.
Indirect analysis is therefore required to constrain the source vortex, with the size/distance degeneracy par-tially resolved only when the vortex passes directly over the meteorological station (Lorenz, 2016). Although rare, the 9 Pa vortex on sol 65 may represent such an occurrence (Lorenz, Lemmon, et al., 2020). When a vortex “misses” the station, the combined analysis of seismic and atmospheric measurements can help improve the estimation of the trajectory, improving on the large errors associated with wind measurements alone (Kahanpää & Viúdez-Moreiras, 2019; Ringrose et al., 2003; Tratt et al., 2003). The trajectory can be reconstructed from the signature of the surface tilt acceleration without imaging (Murdoch et al., 2020),
CHARALAMBOUS ET AL.
10.1029/2020JE006757
23 of 51
Journal of Geophysical Research: Planets
while imaging provides additional information associated with the intrinsic properties of the sub-surface and the vortex, including the vortex size and strength, and miss distance (Banerdt et al., 2020). Seismic analysis thus allows us to improve miss distance estimates, confirm the trajectory and, importantly, to de-termine to which side of SEIS a given vortex passed. The latter is crucial when matching an aeolian change in a particular location to a given vortex.
This synergism thus provides an opportunity to better characterize the nature of aeolian activity. In the following section, we demonstrate how an interdependent synthesis of atmospheric and seismic modeling can provide such results by investigating the most significant event, which occurred on sol 385. The sol 385 event is our most instrumented event, providing a detailed look at the dynamics of a dust-devil with joint close-up grain motion observations coupled to a surface track observed by both in-situ and orbital images.
4.4.1. Atmospheric Modeling
A vortex, such as a dust devil, yields characteristic histories of pressure and wind as it passes a fixed station. As discussed in Ryan and Lucich (1983) and Lorenz (2016), the wind direction and speed history can be modeled by the superposition of a circumferential vortical flow on the uniform background wind which is assumed to advect the vortex system. In the case of a diametric encounter (with zero miss distance), the wind speed has a double peak (where the strongest winds at the “wall” vector sum to the background). If a clockwise vortex passes to the east of the station, the circumferential wind reinforces the background, and a wind peak is seen; this geometry and its mirror image may be termed “additive” encounters. On the other hand, a clockwise vortex passing to the west results in a wind drop, because the circumferential wind opposes the background in a “contraflow” encounter.
The sol 385 encounter is in the former category, with the wind speed being enhanced from 12 m s−1 to 30 m s−1. There is no evidence of a double peak in the wind speed—either the encounter was not diametric, or the en-counter was so rapid that the double peak was not resolved: Given that the local ambient wind was 12 m s−1, to resolve separate twin peaks at 1 sample per second the diameter would have to be larger than 24 m. A diameter this large is unlikely, as the width of dust devil tracks at the landing site is consistent with dust devils of smaller diameters. The pressure drop measured is ∼5.5 Pa, thus, the core pressure drop ∆P0 must be at least this large. Assuming cyclostrophic balance, the peak tangential wind speed VT must therefore be at least ∼ (∆P0/ρ)^0.5, where ρ is the atmospheric density (Lorenz, 2016). We measured ρ ∼ 0.014 kg m−3 at the specific time of this vortex (Ls = 127°), and thus find the tangential wind VT > 20 m s−1. The sum of this value and the background wind (∼12 m s−1) yields a minimum estimate of the maximum wind in the vortical system above 32 m s−1, consistent with the lower bound set by the measured peak wind.
These parameters imply a vortex diameter, D, of 10 m or less passing less than one diameter from the lander and would imply that the maximum wind in the system was not much more than the maximum that was observed by the lander. A reasonable approximation of the miss distance, x, can be recovered from vΓ/2 if x >> D/2, where v is the advection velocity and Γ full-width at half maximum of the pressure profile (Lorenz, 2016; Murdoch et al., 2020). For sol 385, with a v = 12 m s−1 and Γ ∼ 1 s the miss distance is thus approximated at ∼ 6 m from the pressure inlet on the lander deck, and ∼5 m from the ICC camera (Figure 12c). If we adopt the proposition that the track seen in the ICC image on sol 385 corresponds to this event, then it passed to the west of the lander at a miss distance of ∼4–5 m as inferred from in-situ and orbital imaging (Figure 12b), yielding the observed winds if it were rotating counterclockwise. Because vor-tices are commonly advected by the ambient wind speed in the ambient wind direction (Balme et al., 2012; Spiga et al., 2020), the orientation of the sol 385 is therefore in agreement with the measured trajectory in the N130° (blowing from SE to NW) ambient wind direction along the dust devil track inferred from both in-situ and orbital cameras.
4.4.2. Seismic Modeling
Fitting the observed ground tilt and pressure drop to those predicted by regolith elasticity and vortex pres-sure models (Lorenz et al., 2015; Murdoch et al., 2020) allows an independent determination of the dust devil trajectory to help validate the selection of the sol 385 candidate event (Figure 12). To determine this, we need to use the seismic data which provide an initial estimate of the trajectory by indicating the direction of ground tilt, and then a more precise reconstruction by fitting the full waveform. In practice, we use the following methodology: we model the waveform of the seismic signal expected given the dust devil track,
CHARALAMBOUS ET AL.
10.1029/2020JE006757
24 of 51
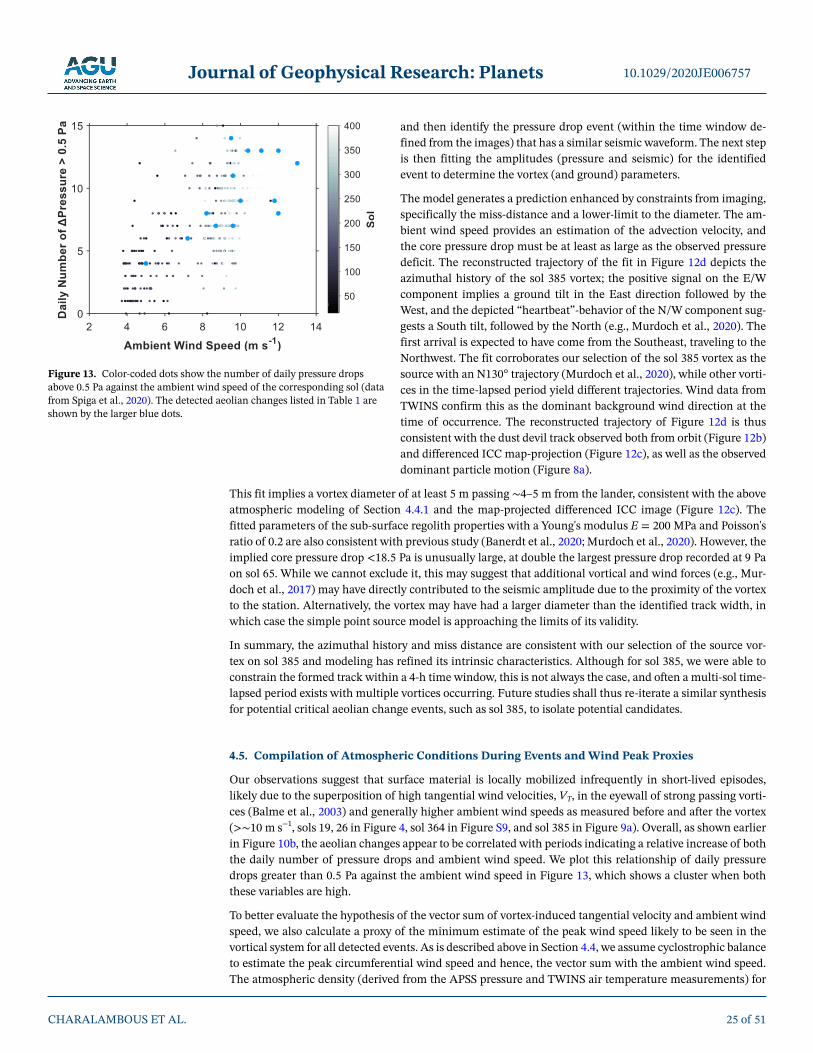
Journal of Geophysical Research: Planets
and then identify the pressure drop event (within the time window de-fined from the images) that has a similar seismic waveform. The next step is then fitting the amplitudes (pressure and seismic) for the identified event to determine the vortex (and ground) parameters.
The model generates a prediction enhanced by constraints from imaging, specifically the miss-distance and a lower-limit to the diameter. The am-bient wind speed provides an estimation of the advection velocity, and the core pressure drop must be at least as large as the observed pressure deficit. The reconstructed trajectory of the fit in Figure 12d depicts the azimuthal history of the sol 385 vortex; the positive signal on the E/W component implies a ground tilt in the East direction followed by the West, and the depicted “heartbeat”-behavior of the N/W component sug-gests a South tilt, followed by the North (e.g., Murdoch et al., 2020). The first arrival is expected to have come from the Southeast, traveling to the Northwest. The fit corroborates our selection of the sol 385 vortex as the source with an N130° trajectory (Murdoch et al., 2020), while other vorti-ces in the time-lapsed period yield different trajectories. Wind data from TWINS confirm this as the dominant background wind direction at the time of occurrence. The reconstructed trajectory of Figure 12d is thus consistent with the dust devil track observed both from orbit (Figure 12b) and differenced ICC map-projection (Figure 12c), as well as the observed dominant particle motion (Figure 8a).
This fit implies a vortex diameter of at least 5 m passing ∼4–5 m from the lander, consistent with the above atmospheric modeling of Section 4.4.1 and the map-projected differenced ICC image (Figure 12c). The fitted parameters of the sub-surface regolith properties with a Young's modulus E = 200 MPa and Poisson's ratio of 0.2 are also consistent with previous study (Banerdt et al., 2020; Murdoch et al., 2020). However, the implied core pressure drop <18.5 Pa is unusually large, at double the largest pressure drop recorded at 9 Pa on sol 65. While we cannot exclude it, this may suggest that additional vortical and wind forces (e.g., Mur-doch et al., 2017) may have directly contributed to the seismic amplitude due to the proximity of the vortex to the station. Alternatively, the vortex may have had a larger diameter than the identified track width, in which case the simple point source model is approaching the limits of its validity.
In summary, the azimuthal history and miss distance are consistent with our selection of the source vor-tex on sol 385 and modeling has refined its intrinsic characteristics. Although for sol 385, we were able to constrain the formed track within a 4-h time window, this is not always the case, and often a multi-sol time-lapsed period exists with multiple vortices occurring. Future studies shall thus re-iterate a similar synthesis for potential critical aeolian change events, such as sol 385, to isolate potential candidates.
4.5. Compilation of Atmospheric Conditions During Events and Wind Peak Proxies
Our observations suggest that surface material is locally mobilized infrequently in short-lived episodes, likely due to the superposition of high tangential wind velocities, VT, in the eyewall of strong passing vorti-ces (Balme et al., 2003) and generally higher ambient wind speeds as measured before and after the vortex (>∼10 m s−1, sols 19, 26 in Figure 4, sol 364 in Figure S9, and sol 385 in Figure 9a). Overall, as shown earlier in Figure 10b, the aeolian changes appear to be correlated with periods indicating a relative increase of both the daily number of pressure drops and ambient wind speed. We plot this relationship of daily pressure drops greater than 0.5 Pa against the ambient wind speed in Figure 13, which shows a cluster when both these variables are high.
To better evaluate the hypothesis of the vector sum of vortex-induced tangential velocity and ambient wind speed, we also calculate a proxy of the minimum estimate of the peak wind speed likely to be seen in the vortical system for all detected events. As is described above in Section 4.4, we assume cyclostrophic balance to estimate the peak circumferential wind speed and hence, the vector sum with the ambient wind speed. The atmospheric density (derived from the APSS pressure and TWINS air temperature measurements) for
CHARALAMBOUS ET AL.
10.1029/2020JE006757
25 of 51
Figure 13. Color-coded dots show the number of daily pressure drops above 0.5 Pa against the ambient wind speed of the corresponding sol (data from Spiga et al., 2020). The detected aeolian changes listed in Table 1 are shown by the larger blue dots.

Journal of Geophysical Research: Planets
each of these main aeolian change events was used, and overall yielded an estimated average of ρ ∼ 0.015 kg m−3. These peak wind speed predictions only provide a first-order estimate of the lower bound due to lim-itations discussed in Section 4.3 and since only in a diametric encounter can we retrieve the representative magnitude of the core pressure drop. For all changes, the measured peak wind speeds can be explained by the sum of VT and ambient wind speed, which provide a minimum estimate of the peak wind speed likely to be seen in the vortical system. Complemented by these predictions, we present the first catalog of aeolian changes observed at InSight during the first 400 sols of operations in Table 1.
4.6. Magnetic Field Signatures
For all near-lander observations with episodes of dust entrainment during a vortex passage, there are associ-ated excursions of 0.1–0.5 nT in the vector magnetic field, B, indicating a magnetic response to the passage of a vortex (sols 19 and 26 in Figure 4, sol 65 in Figure 7, sol 385 in Figure 9e, sol 364 in Figure S9). This is consistent with Johnson et al. (2020), who identified small magnetic field changes (<1 nT) for 20% of the first 54 identified pressure drop events in the InSight data. Our observations provide for the first time on Mars hints that vortices entraining sediment, as observed from imaging, can result in associated magnetic signatures.
Magnetic field perturbations may provide a probe of the electric charge present on mobilized dust grains. This could be produced by, for example, triboelectric charging (Eden & Vonnegut, 1973; Farrell, 2004; Jack-son, & Carroll, 2006; Kurgansky et al., 2007). Although the charging mechanism is only poorly under-stood, both laboratory experiments and modeling suggest that electric discharges could occur in energetic atmospheric phenomena on Mars, such as dust storms and dust devils (Kok and Renno, 2009; Harrison et al., 2016). The collisional mixing of size-variable grains in a dust devil could induce this triboelectric charging (Eden & Vonnegut, 1973). The segregation of finer sediment driven up into the dry atmosphere, relative to the larger grains maintained at the lower column, also enhances the electric field due to both mass and charge separation (Harrison et al., 2016). In turn, the rotational motion of charges in a vortex gen-erates a weak magnetic field. In the following, we discuss this and other possible mechanisms that might lead to the observed IFG (InSight Fluxgate Magnetometer) signals.
We investigate three mechanisms: (1) a passing dust devil can cast a shadow on the solar panels, reduc-ing the solar array current (SAC), and changing the current-induced magnetic field strength; (2) a passing convective vortex might lift dust from the solar panels, increasing the current, changing the magnetic field strength; (3) moving charges and currents within a passing dust/sand devils could affect the magnetic field strength as discussed above. Changes in dust coverage on the panels would result in a step increase in SAC and step change in magnetic fields. Of the five examples shown in this study associated with dust removal, all except sols 26 and 65 have resolvable B-field signals that occur on the horizontal components (BN and BE). The signal on sol 65 (Figure 7) shows a sharp change in BE and BZ with a step-change in current, sug-gesting this as the source on this sol. These excursions in B for sol 65 also occur simultaneously with the peak wind speed, 180° wind-reversal, maximum pressure drop, and maximum ground acceleration. Howev-er, changes in the SAC for the other main dust removal events on sols 19, 26, 364, and 385 are not detected, which likely indicates that a cleaning event similar to sol 65 did not occur on either solar panel.
Shadows cast by dust devils, and the resulting change in SACs, could also play a significant role in the B-field excursion. To understand the problem, we use the Local True Solar Time (LTST) which is directly related to the position of the Sun in the Martian sky at the InSight landing site. It provides information on the angle from which objects are illuminated and shadows cast. At the sun's zenith, LTST solar noon, a shadow is cast at the anti-solar azimuth angle, however, the shadow's length and direction vary seasonally. On sol 385 (Figure 8), the dust devil passes to the west of the lander in a SE-NW direction at ∼12:30 LTST. The magnetic field excursion could be related to the changes in the solar array from the dust devil shadow, and this could also be the case for the aeolian change events on sols 19, 26, and 364. However, SAC-induced fields cannot be confidently confirmed because of the low cadence of SAC data at the time of the events (30-s sampling).
We can ask whether the magnetic field changes on sol 385 are consistent with the directional change in the field expected from a downward directed current within the vortex that would result solely from
CHARALAMBOUS ET AL.
10.1029/2020JE006757
26 of 51
Journal of Geophysical Research: Planets
triboelectric charging. The direction of the passing dust devil would result in a SE magnetic field perturba-tion, in contrast to the observed perturbation in BN. Similarly, no single mechanism can easily account for the signals observed on the other three sols shown here. Overall, shadow signals related to vortices appear to be both rare and very small (<∼1%, Lorenz, Lemmon, et al., 2020). This may be consistent with dust release associated only with occasional surface grain movement as observed in the present study, via sand abrasion and/or breakup of dust aggregates. Large-scale dust-lifting, due to direct lifting or to the “Delta-P effect” (Balme and Hagermann, 2006) appears not to occur at InSight in the seasons observed in this study, that is, Ls 296°–134°.
Although we cannot confidently identify the source of these magnetic field excursions, their contempora-neous occurrence with the vortex may establish a probe into the character of the vortex. The three main source mechanisms share one component—lifted dust. This suggests that these were not “dustless” vortices, effectively deeming them “dust devils”, although the dust content may be too low to be optically visible by cameras (Banfield et al., 2020). The limited number of aeolian changes coupled with B-field perturbations in vortex encounters does not permit a statistical analysis similar to Franzese et al. (2018) which demon-strated that electric field signatures in terrestrial dust devils are correlated with the magnitude of the pres-sure drop, surface friction wind speed, miss-distance, and dust concentration. Long-term monitoring of aeolian changes over at least 1 Martian year in combination with increased SAC sampling rates (from sol 426 onwards, see Section 7.4) should provide a more systematic understanding of the source mechanisms of these magnetic field excursions.
5. Investigation of Wind-Induced Detachment Threshold and Enhancing MechanismsIn this section, we compare aeolian changes predicted by classic fluid-drag theory combined with the sur-face roughness values estimated above and the aeolian changes observed. We discuss separately each of the observed transportation mechanisms of saltation, creep, and dust removal. We also consider nonclassical detachment mechanisms including drag-induced and impact-driven creep, saltation clusters, sandblasting, grain electrification, thermophoresis, and the delta-P effect, and compare the resulting predictions with the aeolian changes observed. Finally, we consider the extent to which deviations from the assumptions in the theories could explain the observations, in particular, the effects of small-scale topography and roughness inhomogeneities, landing site disturbance, large-scale topography, and sand-entrainment susceptibility.
5.1. Classic Fluid Threshold
The variation of the classic fluid threshold shear velocity (Bagnold, 1941; Iversen & White, 1982; Shao & Lu, 2000) with grain diameter and surface roughness is shown in Figure 14a. The fluid threshold is expressed as a wind speed at the height of 1.2 m, rather than a surface friction wind speed, so that predic-tions can be more easily compared to observations. The fluid threshold is also plotted for a range of surface roughnesses, from 0.1 to 10 mm, covering from the smoothest regions of the landing site to the local region where instruments are deployed. The site average z0, characterized by the rocky and intercrater fields, is ∼2 mm. The fluid threshold curves are constructed by using the average atmospheric density during the main near-lander aeolian change events (sols 19, 26, 65, 364, and 385 with 0.014 < ρ < 0.016 kg m−3, see Table 1), estimated at ρ ∼ 0.015 kg m−3. To attempt to establish a fluid threshold, we first convert each of the measured and predicted (Table 1, columns wind speed and peak wind speed proxy, respectively) vortex-as-sociated peak wind speeds, ux, into peak surface friction wind speeds, u*, by assuming the logarithmic wind profile of Equation 1. Each peak surface friction wind speed u* can then be compared to the fluid threshold shear velocity u∗
T predicted by the classic saltation model of Shao and Lu (2000).
Also shown in Figure 14a are rectangles, which indicate the observed and hypothesized ranges of grain di-ameter and wind speed for which aeolian changes were observed. There are four such rectangles: saltation, creep/reptation, and dust coating removal from rocks or the lander footpad. The width of the rectangles is given by the hypothesized grain diameter size range of observed motion below the resolution limit d ∼ 1 mm, while the actual observed size range corresponds to the width of the rectangle extending beyond d > 1 mm. The height of each rectangle denotes the lower bound of wind speeds for the induced changes,
CHARALAMBOUS ET AL.
10.1029/2020JE006757
27 of 51
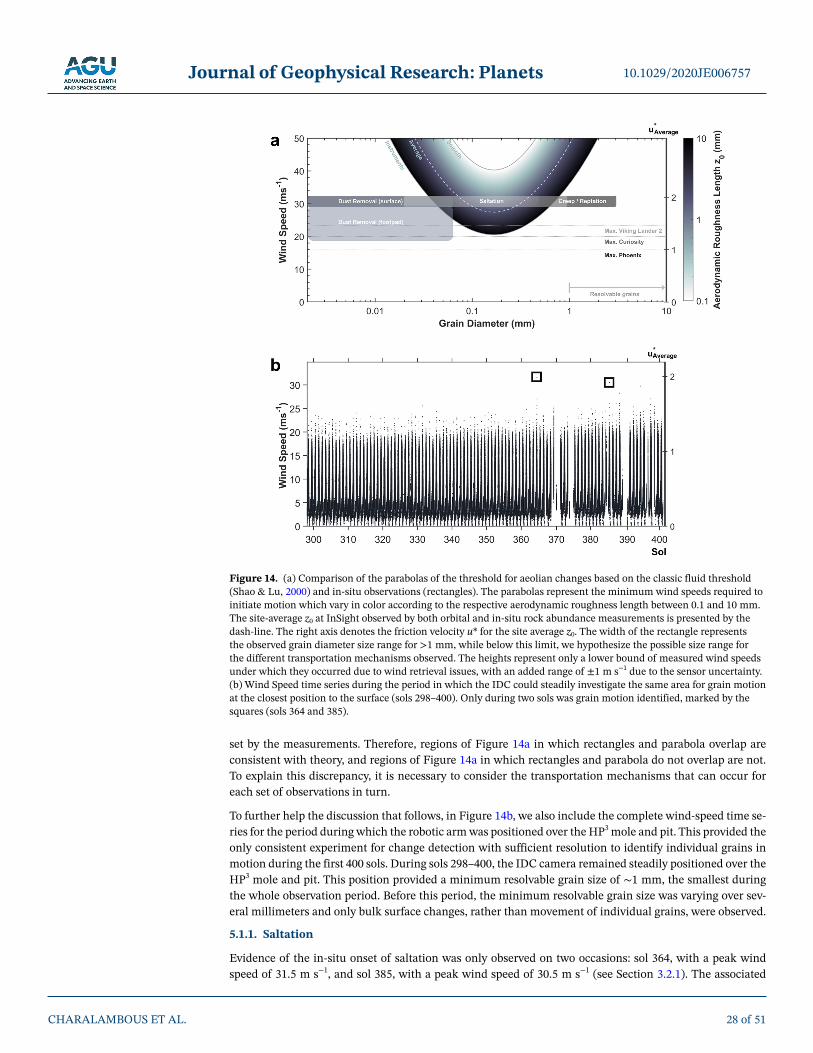
Journal of Geophysical Research: Planets
set by the measurements. Therefore, regions of Figure 14a in which rectangles and parabola overlap are consistent with theory, and regions of Figure 14a in which rectangles and parabola do not overlap are not. To explain this discrepancy, it is necessary to consider the transportation mechanisms that can occur for each set of observations in turn.
To further help the discussion that follows, in Figure 14b, we also include the complete wind-speed time se-ries for the period during which the robotic arm was positioned over the HP3 mole and pit. This provided the only consistent experiment for change detection with sufficient resolution to identify individual grains in motion during the first 400 sols. During sols 298–400, the IDC camera remained steadily positioned over the HP3 mole and pit. This position provided a minimum resolvable grain size of ∼1 mm, the smallest during the whole observation period. Before this period, the minimum resolvable grain size was varying over sev-eral millimeters and only bulk surface changes, rather than movement of individual grains, were observed.
5.1.1. Saltation
Evidence of the in-situ onset of saltation was only observed on two occasions: sol 364, with a peak wind speed of 31.5 m s−1, and sol 385, with a peak wind speed of 30.5 m s−1 (see Section 3.2.1). Τhe associated
CHARALAMBOUS ET AL.
10.1029/2020JE006757
28 of 51
Figure 14. (a) Comparison of the parabolas of the threshold for aeolian changes based on the classic fluid threshold (Shao & Lu, 2000) and in-situ observations (rectangles). The parabolas represent the minimum wind speeds required to initiate motion which vary in color according to the respective aerodynamic roughness length between 0.1 and 10 mm. The site-average z0 at InSight observed by both orbital and in-situ rock abundance measurements is presented by the dash-line. The right axis denotes the friction velocity u* for the site average z0. The width of the rectangle represents the observed grain diameter size range for >1 mm, while below this limit, we hypothesize the possible size range for the different transportation mechanisms observed. The heights represent only a lower bound of measured wind speeds under which they occurred due to wind retrieval issues, with an added range of ±1 m s−1 due to the sensor uncertainty. (b) Wind Speed time series during the period in which the IDC could steadily investigate the same area for grain motion at the closest position to the surface (sols 298–400). Only during two sols was grain motion identified, marked by the squares (sols 364 and 385).

Journal of Geophysical Research: Planets
surface friction wind speed is approximately 2 m s−1 for an aerodynamic surface roughness representative of the regions in which saltation was observed of at least 0.2 cm (Section 4.2). For this surface friction wind speed, the Shao and Lu (2000) model predict that grains with diameters between ∼70 and 400 µm will sal-tate. Since the minimum resolvable grain size is approximately 1 mm, observations of surface changes and evidence of scarce saltation are consistent with the motion of sub-mm grains, and do not rule out motion of ∼70–400 µm grains. However, the possibility remains that these surface changes were caused by the motion of grains with diameters outside the range of saltating diameters predicted by Shao and Lu (2000), but below the minimum resolvable grain diameter (d < 1 mm).
Surprisingly, more aeolian changes were observed on sol 385 than on sol 364. This apparent discrepancy is likely explained by two factors. First, a larger pressure drop was observed on sol 385 compared to sol 364, which suggests a closer encounter, or a more energetic vortex. Second, a closer encounter or more energetic vortex is likely to have had higher tangential wind speed and vorticity, both of which may contribute to
CHARALAMBOUS ET AL.
10.1029/2020JE006757
29 of 51
Time before (LMST)
Time after (LMST)
Candidate event (LMST)
Ls (°)
Wind speed
(m s−1)
Wind direction
(°)
Pressure drop (Pa)
Air density
(kg m−3)
Ambient wind speed
(m s−1)
Peak wind speed proxy
(m s−1) Aeolian change
Sol 001 13:32 Sol 004 13:01 – 298 – – – – – – Surface track, ICC lens
Sol 018 13:38 Sol 020 13:02 Sol 019 14:58a 307 21 290 5.8 0.016 12 31 Surface track, Footpad, ICC lens
Sol 026 11:03 Sol 026 15:53 Sol 026 14:35 312 28.2 310 4 0.016 10 26 Footpad, ICC lens
Sol 065 13:26 Sol 065 14:31 Sol 065 14:24 334 20.1 55 9.2 0.015 5 30 Solar array, WTS/Deck, Footpad, ICC lens
Sol 164 16:41 Sol 166 16:41 Sol 166 13:14b 25 16.5 135 4.1 0.016 8.2 24.1 Surface track
Sol 166 16:41 Sol 167 16:20 Sol 167 12:10 26 18.9 132 4.3 0.017 9.6 25.7 Surface track
Sol 167 16:20 Sol 168 16:17 Sol 168 11:58c 27 16 137 3.4 0.016 9.5 24.1 Surface darkening
Sol 179 16:31 Sol 180 16:31 Sol 180 12:34 32 16.2 157 2.3 0.016 7.2 19 Surface track
Sol 201 17:23 Sol 202 16:41 Sol 202 13:10d 42 13 126 0.5 0.016 9.5 27.4 Surface track
Sol 203 13:46 Sol 205 13:26 Sol 204 10:52e 44 18.9 139 2.1 0.018 11.1 22 Surface track
Sol 230 17:31 Sol 232 13:16 Sol 231 12:38f 56 16.4 138 6.8 0.017 8.7 28.9 Surface track
Sol 235 08:01 Sol 235 15:43 Sol 235 10:46 58 16.0 130 1.6 0.018 9 18 Tether spots/dust removal
Sol 258 16:33 Sol 259 13:11 Sol 259 12:16g 68 21.4, 17.7 134 0.7, 1 0.018 11.8 19.2 Surface track
Sol 259 13:11 Sol 261 15:31 Sol 261 11:50h 69 21.3, 13.5 121 NA (2.3) 0.016 10.4 22.2 Surface track
Sol 362 15:54 Sol 364 15:54 Sol 364 13:06 116 31.5 90 3.5 0.014 13 29 Creep, possible saltation
Sol 385 11:56 Sol 385 15:54 Sol 385 12:09 127 30.5 130 5.5 0.014 12 32 Creep, saltation, dust removal, pile collapse, surface track
Note. Each line represents a monitoring period that was identified to contain an observed aeolian change. The first two columns denote the times of image acquisition before and after an aeolian change was identified in either the ICC or IDC cameras. The candidate event is identified as the maximum wind speed which is usually attributed to the maximum pressure drop occurring within the period, unless otherwise stated. The wind speed column represents the measured speeds recorded by TWINS. The wind direction represents the ambient before the event, as measured by TWINS. The peak wind speed proxy column provides the minimum estimate of the peak wind speed likely to be seen in the vortical system as modeled in Section 4.4.1. Bold indicates wind speed data gaps exist at the closest approach of the vortex.aPeak wind speed 23.6 m s−1 associated with a 1.6 Pa pressure drop, while ∆Pmax = 5.8 Pa associated with 21 m s−1 with data gaps. bPeak wind speed 17.3 m s−1 not associated with pressure drop, while ∆Pmax = 4.1 Pa associated with 16.5 m s−1 with data gaps. cPeak wind speed 17.6 m s−1 not associated with pressure drop. Two almost equivalent ∆Pmax = 3.5 and 3.4 Pa inducing wind peaks of 14.5 m s−1 and 16 m s−1. The former however is associated with multiple data gaps during the most energetic part of the vortex suggesting a close encounter and is thus selected as the formative event. dStudied and identified in Banerdt et al., 2020. Track was associated with a vortex of 0.5 Pa with a 13 m s−1 peak, suggesting this only sampled beyond the edge of the vortex. We have thus used their derived estimates of core pressure drop (∆P = 5.5 Pa) here to measure the wind speed proxy. eThis surface track geometrically overlaps with sol 202 surface track, suggesting disturbance of the previously formed track. fPeak wind speed 19.3 m s−1 not associated with pressure drop, while ∆Pmax = 6.8 Pa associated with 21 m s−1 with data gaps. gTwo candidate events: ∆Pmax = 0.7 Pa, ux = 21.4 m s−1 and ∆Pmax = 0.7 Pa, ux = 21.4 m s−1. hPeak wind speed 21.3 m s−1 not associated with pressure drop, while ∆Pmax = 2.3 Pa associated with 13.5 m s−1 peak with multiple data gaps.
Table 1 Catalog of Identified Aeolian Changes up to Sol 400 (Ls 296°–134°)
Journal of Geophysical Research: Planets
unreliable wind speed retrieval (Figure S13). Wind data for sol 364 were, instead, fully retrieved. Given the wind retrieval impediment and 1 m s−1 sensor uncertainty, this sets a lower bound on the sol 385 peak wind speed that is likely to be equal to or greater than that of sol 364.
Other near-lander aeolian changes were observed on sols 19, 26, 65, with measured peak wind speeds of 20.3–28 m s−1. The associated surface friction wind speed for the lower bound is ∼1.3 m s−1, for which the Shao and Lu (2000) model predicts no grain motion. However, the actual wind speed is likely to have been higher than the measured wind speed. The minimum estimate to the prediction of the actual wind speed during these changes suggests > 28 m s−1 (Table 1) which corresponds to a surface friction wind speed of at least ∼1.8 m s−1, for which the Shao and Lu (2000) model predicts the motion of grains of diameter of at least ∼100 < d < 250 μm. During these events, the minimum resolvable grain size was several mm, therefore again, observations do not rule out motion of ∼100 < d < 250 μm grains. Because changes at InSight are only subtle and since the IDC camera was at various relatively higher positions from the surface to resolve finer motion prior to sol 298, there is a high likelihood these observations were missed by the IDC.
Invoking the high-resolution period for which grain motion could be identified during sols 298–400 (Fig-ure 14b), the low number of saltation episodes is consistent with Shao and Lu's (2000) model, which predicts less than five episodes of saltation (defined as instances of the wind speed exceeding the fluid threshold at 27 m s−1 at an average ρ ∼ 0.015 kg m−3) for the most easily mobilizable grain in the site average z0 = 0.2 cm.
5.1.1.1. Impact Threshold
Saltation, once initiated, is sustained provided that the surface friction wind speed remains above the im-pact threshold u*i, which is ∼0.05–0.4 times the fluid threshold (Almeida et al., 2008; Claudin and Andre-otti, 2006; Kok, 2010a; Kok et al., 2012; Pähtz et al., 2012; Renno et al., 2013). The ambient wind speed was ∼12 m s−1 for a significant time after both surface-change events on sols 364 and 385. This ambient wind speed corresponds to a surface friction wind speed that exceeds the upper bound of the impact threshold estimate above for the most easily mobilized particles of d ∼ 150 μm. However, sustained saltation was not observed in situ. Further, no surface changes outside of the sol 385 dust devil track were observed in HiRISE images taken from orbit.
On sol 235, multiple dark spots appeared on the tether (Figure 6). This could be interpreted as evidence of sal-tating grain impacts. Around the time that these dark spots appeared, the ambient wind speed was 10 m s−1, with a corresponding surface friction wind speed of 0.63 m s−1, between the impact and fluid thresholds. This suggests that the putative saltating particles could have been sourced from an upwind region, per-haps from a distant vortex not detected by APSS measurements, with saltation sustained above the impact threshold. It is therefore expected that the impact threshold may occasionally sustain small amounts of saltating particles at InSight.
5.1.2. Surface Creep
Surface creep was also observed on sols 364 and 385—the only two instances during which the measured wind speed exceeded ∼31 m s−1. Very coarse sand to granule-sized grains of 1–3 mm in diameter, moved by up to 20 mm from visible bed-pocket depressions armored by fines (Figure 8h). The classic fluid thresh-old requires the equivalent of u*t = 3–5 m s−1 for direct aerodynamic entrainment by saltation of 1–3 mm granules. The lower bound of this range, u*t = 3 m s−1, was not exceeded despite an estimated u* = 2.6 ms−1 downwind of the densely populated workspace area, where the surface roughness is z0 ∼ 1 cm.
5.1.3. Dust Coating Removal
Removal of dust (d < 62.5 µm) from the west lander footpad was observed on sols 19, 26, and 65 (Figure 1a) at times when the measured vortex-induced wind speed exceeded 20.3 m s−1. This wind speed is a lower bound since gaps of up to 5 s are present in the data during the vortex encounters on all three sols (Table 1). On all three sols, the wind direction was approximately from the north with an aerodynamic surface rough-ness for the site average in the north of 0.2 cm (Section 4.2). For z0 = 0.2 cm, the measured wind speed of 20.3 m s−1 corresponds to a surface friction wind speed of 1.3 m s−1, for which the Shao and Lu (2000) model predicts no saltation (Figure 14). Saltation of <62.5 μm grains is also not expected for the prediction of the minimum peak wind speed estimate of >28 m s−1 for all these events.
CHARALAMBOUS ET AL.
10.1029/2020JE006757
30 of 51

Journal of Geophysical Research: Planets
If the actual wind speed was reliably measured close to the lower bound of 20.3 ms−1, then it would appear insufficient for dust removal. Figure 14b indicates multiple exceedances of 20 ms−1 wind speed not always associated with a pressure drop, that is, possibly corresponding to mere turbulent gusts. These exceedances of 20 m s−1 wind speed did not result in dust removal, suggesting that wind speed alone may not be a suf-ficient condition for dust removal. Hence, either the wind speed was higher or there are additional factors required to reach the threshold for removal.
We also consider the possibility that the footpad sediment patch is formed by larger particles. Figure 14a indicates an overlap at >∼45 µm with the model threshold curve. This partial overlap suggests that direct aerodynamic entrainment could have occurred in the instrument-deployment areas with z0 = 1 cm, near the maximum of the measured and the minimum estimate of the predicted peak wind speed 28 m s−1. Sig-nificant uncertainties in the wind retrieval and/or in the local z0 could thus provide one explanation to the observed dust removal on the footpad, if the above assumptions are true.
On the other hand, for the finer dust size range, removal of dust coatings on rocks (likely of airfall particles with d < 10 μm, Johnson et al., 2002; Pike et al., 2011), was observed only on sol 385 below the predicted minimum mobilized particle size. To lift d < 10 μm dust-particle coatings from rocks at ux ∼ 31.5 m s−1, as observed in the rocky areas and downwind instruments in the deployment area, a value of z0 > 10 cm is required. In contrast, dust-sized particles with d < 62.5 µm demand a z0 > 0.25 cm, corresponding to rocky areas, instrument-deployment areas, and beyond—areas in which surface changes were observed on sol 385. While such locally high values of z0 can be reasoned as proxies of immediate turbulent wakes in the deployment area (Section 4.2), it is highly unlikely to be the case for the rocky field.
Alternatively, the above discrepancy in dust removal could be explained by wind-speed measurement lim-itations setting significantly lower bounds during vortex encounters, and/or by the failure to include other intrinsic parameters (e.g., heterogeneous grain size distribution), alternative detachment-enhancing mech-anisms, and surface characteristics not incorporated in Shao and Lu's (2000) model. These are discussed below in Section 5.2.
5.1.4. Comparison of Fluid Threshold With Wind Measurements of Other Missions
We have seen that, at InSight, the observed surface changes only happen during vortex encounters, in con-trast to changes observed by Curiosity (Bridges et al., 2017; Baker, Lapotre, et al., 2018; Baker, Newman, et al., 2018) and orbital image studies indicating dunes on Mars are moving without dust devils (e.g., Ayoub et al., 2014; Bridges, Ayoub et al., 2012; Bridges, Bourke et al., 2012; Chojnacki et al., 2019; Lapotre & Ram-pe, 2018). Comparisons to threshold-of-motion conditions between other sites on Mars are complex since surface (e.g., roughness, grain size distributions) and atmospheric properties (e.g., atmospheric density) vary between sites.
One example of the complexity of inter-site comparisons is Curiosity. While some of Curiosity's wind speed measurements are likely to have exceeded the effective upper limit of 20 m s−1 (Viúdez-Moreiras et al. 2019a, 2019b), the uncertainties for such measurements were high, thus limiting the extent to which it can test the predictions of the Shao and Lu (2000) model; the MarsWRF model predicts peak surface friction wind speeds in the range 0.8–1.4 m s−1 (Baker, Lapotre, et al., 2018; Baker, Newman, et al., 2018). In addition, daily surface changes were attributed to peak wind speeds at nighttime (when REMS largely could not measure due to noise) during southern spring and summer, caused by the constructive interfer-ence between strong regional-scale northerlies and katabatic slope winds (Baker, Newman, et al., 2018). Sand transport at this time is further facilitated by the ∼50% increase in near-surface atmospheric density between the daytime and nighttime (Baker, Newman, et al., 2018). This in turn increases the wind shear stress, τ = ρu*
2, and reduces the fluid threshold by ∼25% as predicted by Shao and Lu (2000) for the mo-bilization of ∼150 μm particles. In contrast, at InSight nighttime wind speeds (Banfield et al., 2020; Spiga et al., 2020; Viúdez-Moreiras et al., 2020) could be significantly lower in some seasons than at Curiosity (Viúdez-Moreiras et al., 2019a, 2019b) and so far, no aeolian change has been attributed to a period outside of the convective daytime regime. The influence of regional-scale northerly winds is apparent at both sites during northern winter, but slope winds caused by the extreme topography at Gale crater reinforce these regional winds at night, thus promoting sediment transport at this time.
CHARALAMBOUS ET AL.
10.1029/2020JE006757
31 of 51
Journal of Geophysical Research: Planets
The Phoenix landing site has a surface roughness similar to InSight (Golombek, Kass, et al., 2020) of z0 = 5–6 ± 3 mm (Holstein-Rathlou et al., 2010). Assuming an atmospheric density of ∼0.02 kg m−3 (Davy et al., 2010), the Shao and Lu (2000) model predicts no motion for the maximum measured wind speeds of 16 m s−1 with a u*max = 1.1 m s−1 (Holstein-Rathlou et al., 2010). This prediction is consistent with the lack of aeolian surface changes observed at the Phoenix landing site outside of a few dust devil tracks (Ellehoj et al., 2010).
The Viking 2 landing site has a surface roughness of z0 = 1 cm. Again, assuming an atmospheric density of 0.02 kg m−3, wind speeds >19 m s−1 are required for the onset of saltation (Shao & Lu, 2000). While meas-ured wind gusts exceeded 19 m s−1 during dust storms (Ryan & Henry, 1979), these high wind speed events were extremely rare in measurements spanning over 1,050 sols (Lorenz, 1996), consistent with the paucity of surface changes outside of dust storms at the site (Moore, 1985).
5.1.5. Limitations of Classical Theory
Classic fluid drag theory defines the fluid threshold as the surface friction wind speed at which there is onset of continuous saltation over the entire particle bed (Bagnold, 1941; Iversen & White, 1982; Shao & Lu, 2000). In practice, the onset of saltation is sporadic and occurs in localized areas of the particle bed (Almeida et al., 2008; Kok, 2010a; Kruss et al., 2020; Musiolik et al., 2018; Sullivan & Kok, 2017; Swann et al., 2020). As a result, surface changes can occur at surface friction wind speeds lower than the fluid threshold. One recent study (Swann et al., 2020) has suggested that saltation can be initiated at a sur-face friction wind speed between 0.4 and 0.6 of the classic fluid threshold value (Bagnold, 1941; Iversen & White, 1982; Shao & Lu, 2000).
Assuming an atmospheric density of 0.02 kg m−3, the Swann et al. (2020) study predicts that the fluid threshold for sporadic saltation of 200-μm grains is u*t = 0.68 m s−1. This corresponds to a wind speed of 11 m s−1 for an aerodynamic surface roughness of 0.2 cm. Measured wind speeds at InSight often exceeded 11 ms−1. During our IDC change detection experiment from sol 298 to 400, the wind speed exceeded 11 m s−1 for a cumulative duration of over 222 h, or 9% of this period. In comparison, for the aerodynamic surface roughness of 0.01 cm in the smoother areas, the reduced fluid threshold corresponds to a wind speed of 16 ms−1, with a cumulative duration of wind speeds exceeding this of over 25 h, or 1% of the period. Despite this, surface changes were only observed for wind speeds of at least 20 m s−1 (measured); 28 m s−1 (predic-tion of minimum peak wind estimate). Fines on the top and in the bucket of the scoop were redistributed, likely by turbulence, on a near-daily basis, though this is not counted as saltation.
In addition to the classic theory not describing the sporadic and localized nature of saltation onset being sporadic, there are limitations to the applicability of the law of the wall of Equation 1. The logarithmic dependence of wind speed on height assumed by the law is valid for time and spatially averaged atmos-pheric velocity profiles with unidirectional, steady-state winds (see Section 6.1 in Spiga et al., 2018). In contrast, the transient wind profile at InSight during the vortex-induced aeolian rapidly changes direction and speed. Furthermore, deployed instruments and the lander compromise the validity of the model as the local airflow encounters a discontinuity during which horizontal and vertical accelerations take place before the flow returns to its steady state, logarithmic profile (Elliot, 1958). This effect becomes more pro-nounced during interactions of vortical airflow with roughness elements, during which atmosphere-to-sur-face energy exchange is heavily modified. The spatiotemporal interactions between the airflow, roughness elements, and the particle bed are complex and not reliably incorporated in aeolian models that assume the law of the wall. Finally, the near-surface stability could play a significant role in the calculation of surface friction wind speeds (Haberle et al., 1993). This would require the use of InSight observations as described in Spiga et al. (2020) and the complete model of Equation 2 in Spiga et al. (2018) assuming, for instance, Monin-Obukhov functions as described in Colaïtis et al. (2013) (appendix).
These, and other limitations of the classic theory, such as not including grain shape, bed, and relative pro-trusion, grain-size distribution (see Section 5.3 below; also see Pähtz et al., 2020 for a review) mean that classic theory can only provide a first estimate of the fluid threshold.
CHARALAMBOUS ET AL.
10.1029/2020JE006757
32 of 51
Journal of Geophysical Research: Planets
5.2. Enhancing Mechanisms for Grain Detachment
A variety of alternative grain detachment mechanisms have been proposed to address the above limitations, including drag-induced rolling (Merrison et al., 2007); impact-driven creep (e.g., Baker, Lapotre, et al., 2018; Baker, Newman, et al., 2018); saltation clusters (Sullivan & Kok, 2017); thermophoresis (Wurm et al., 2008); “sandblasting” by bigger particles (Greeley, 2002); electrification of particles (Kok & Renno, 2006, 2008; Neakrase et al., 2016); the “delta-P” (suction) effect (Greeley, Balme, et al., 2003) and areas of “optimal roughness” (Neakrase & Greeley, 2010). All of these alternative mechanisms may be simultaneously or individually active in a dust devil, which would enhance particle lifting. Neakrase et al. (2016) generalize most of these mechanisms into the “enhanced vortex entrainment effect” (EVE-effect). The EVE-effect also depends on parameters such as availability of erodible grains, pore space in the regolith, surface roughness, electrostatics, grain shape, and size distribution, amongst others. These alternative mechanisms, whether acting individually or in concert in the EVE-effect, act to enhance aeolian transportation, and could explain the discrepancies identified in our fluid threshold investigation. In the next two sections, we discuss these mechanisms and effects, while Part 2 (Baker et al., 2021) further investigates how some of the effects intro-duced in this section may be generating enhanced sediment transport within vortices.
5.2.1. Transportation-Specific Mechanisms
5.2.1.1. Drag-Induced Rolling
The surface friction wind speed at which drag-induced rolling begins is significantly smaller than the sur-face friction wind speed for saltation (Merrison et al., 2007). Observations of 1–3 mm diameter granule movement on sols 364 and 385 are consistent with drag-induced rolling for which the threshold surface friction wind speed is u*t_roll = 1.7–1.8 m s−1 (De Vet et al., 2014; Merrison et al., 2007). Due to the short-lived peak in wind speed during the vortex encounter, the granules could only travel a short distance. Our companion paper investigates this mechanism in more detail (Baker et al., 2021).
5.2.1.2. Impact-Driven Creep
Impact-driven creep occurs when larger particles move along the surface due to impacts from smaller saltat-ing grains (e.g., Baker, Newman, et al., 2018). Because impact-driven creep requires saltation, its threshold surface friction wind speed is effectively the same as the threshold surface friction wind speed for saltation. Once saltation is initiated, the number of larger particles in creep increases with the number of smaller particles in saltation. Observations of 1–3 mm diameter granule movement on sols 364 and 385, when the measured surface friction wind speed exceeded the threshold for saltation, could therefore be consistent with this mechanism. However, because of the small amount of sand grains in saltation at the InSight land-ing site, evidence for impact-driven creep is also sparse as suggested by the displacement of just a few of the exposed granules in the camera's FOV.
5.2.1.3. Saltation Clusters
Variations in grain shape and size, turbulent fluctuations of surface wind stress, and bed roughness cause some grains to be more susceptible to mobilization than others at surface friction wind speeds below the fluid threshold (further discussed in Section 5.2.3.3, also see Swann et al., 2020). Sullivan and Kok (2017) modeled these sporadic grain mobilizations and found that the mobilized grains can acquire enough kinetic energy to splash other grains, which themselves acquire enough kinetic energy to splash other grains, and so on, until a “saltation cluster” is formed. Figure 14a shows that the majority of observed saltation is con-sistent with the Shao & Lu (2000) fluid threshold. Either saltation clusters were active below this threshold and were not observed, or saltation clusters were not active at the InSight landing site. Given the heteroge-neity of the surface at the InSight landing site, it seems likely that saltation clusters would be initiated (e.g, via the local turbulence induced by the vortex flow interaction). One possible explanation for the observed creep/reptation of larger grains is impact by grains in an incipient saltation cluster. However, it is debatable whether incipient saltation clusters could be sustained, due to the lack of readily mobilizable surface mate-rial and infrequent saltation episodes at the landing site.
CHARALAMBOUS ET AL.
10.1029/2020JE006757
33 of 51
Journal of Geophysical Research: Planets
5.2.1.4. Sandblasting
When saltating grains impact the dust bed, their kinetic energy is transferred to the bed, dismantling dust aggregates and injecting dust particles (<20 µm) into suspension (Greeley, 2002). In contrast to sand-sized grains, dust-sized particles exhibit strong interparticle cohesive forces since their surface-area-to-mass ra-tio is much larger (Greeley & Iversen, 1985; Iversen et al., 1976; Kok, 2010b). Boundary layer wind-shear alone is insufficient to overcome these cohesive forces, and is therefore a weak source-mechanism of dust emission (Kok, 2010b).
Despite evidence of saltation at InSight and predictions for saltation onset by the maximum measured and predicted peak wind speeds in the vortex system (Table 1, Figure 14a), we hypothesize that due to the in-situ observations of little sand in saltation, otherwise efficient particle-detachment mechanisms such as sandblasting and saltation clusters are hampered and may never fully develop. This is further supported by the lack of widespread, simultaneous, and frequent dust removal from surfaces: the observed instances of dust removal were localized (for example, at the west lander footpad and west solar panel rib), did not occur simultaneously and uniformly, and were infrequent. In turn, the resulting ineffectiveness of sandblasting kicking up dust in the upward convective flow of a vortex could also explain the lack of visible dust devil observations at InSight.
5.2.2. Electrodynamical, Thermal, and Pressure Effects
5.2.2.1. Grain Electrification
Grain electrification can reduce the fluid threshold for saltation (Esposito et al., 2016; Holstein-Rathlou et al., 2012; Merrison et al., 2012; Rasmussen et al., 1996, 2009; Renno and Kok, 2008); increase the con-centration of saltating particles and alter their ballistic trajectories, causing increased dust removal at im-pact (Kok & Renno, 2006); and aid dust aggregate formation (Bell et al., 2000; Greeley, 2002; Merrison et al., 2002, 2007). For example, weakly-bonded and low-density sand-sized aggregates formed of dust par-ticles were discovered by the MER Spirit rover and can form coatings on rocks and smaller grains (Pike et al., 2011; Sullivan et al., 2008). These aggregates are more easily mobilized because of their low density, and can break apart, emitting dust (Kok et al., 2014; Merrison et al., 2007). Millimeter-sized dust aggregates were observed on the WTS. These aggregates are similar in size and shape to dust aggregates formed from Mars simulant dust in wind tunnel experiments on Earth (Merrison et al., 2007). These aggregates moved in the same direction as the wind, and disintegrated after the largest pressure drop on sol 65 (Figure 7). Millimeter-sized dust aggregates also appeared in the study region after the vortex passage of sol 364. The observation of aggregates both during sols 65 and 364 could be evidence of grain electrification. However, there is little evidence of grain electrification increasing the concentration of saltating particles.
5.2.2.2. Thermophoresis
Thermophoresis is the ejection of dust-sized particles because of thermal gradients in the surface dust layer (Wurm et al., 2008). Wurm et al. (2008) experimentally determined a threshold value for thermophoretic dust ejection on Mars expressed as the ratio of the surface irradiance to the surface temperature, and is approximately 1.5 W m−2 K−1 for dust layers with “reduced cohesion,” defined as dust layers with near-zero cohesive forces. The reduction of cohesive forces is hypothesized to be caused by wind stress. Therefore, thermophoresis would be expected at times of high surface irradiance, low surface temperature, and high wind stress. To determine whether or not thermophoresis is active at the InSight landing site, further study could look for evidence of any increase in dust lifting with higher surface irradiance and lower surface tem-perature (using HP3 radiometer), but at the same wind stress.
5.2.2.3. ∆P Effect (Suction)
A limited number of studies have attempted to quantify the impact of the vertical pressure gradient on threshold wind speeds (e.g., Greeley & Iversen, 1985). Although we do not currently have a robust under-standing of this relationship, it is nonetheless well-understood that the ∆P effect within a vortex helps facil-itate sediment transport under certain conditions. See Part 2 (Baker et al., 2021) for further analysis of how this vortex-specific effect may be influencing sediment motion at Homestead hollow. Here, we specifically explore the possibility of dust lifting via the back-venting effect (e.g., Balme & Hagermann, 2006).
CHARALAMBOUS ET AL.
10.1029/2020JE006757
34 of 51
Journal of Geophysical Research: Planets
As a vortex passes over porous regolith, it can establish a pressure gradient from higher pressure in the regolith to lower pressure in the vortex. Gas flows out of the regolith, providing an upwards drag force on surface material that reduces the fluid threshold (Balme & Hagermann, 2006; Bila et al., 2020; Greeley, Balme, et al., 2003; Neakrase et al., 2006).
During our 400-sol investigation, dust removal occurred from thin, typically monolayers, of dust on top of impermeable, rigid surfaces both natural (protruding rocks and pebbles), and artificial (lander footpad, solar panel, field-joint, tether). During the sol 385 event, dust was preferentially removed from pebbles and rocks, compared to intervening areas of the regolith bed. Dust removal was observed on pebbles and rocks of size ∼1 cm to the largest rocks visible to the west of the ICC FOV.
Since pebbles and rocks are non-porous, the back-venting delta-P effect was not a contributor to the dust removal from their surfaces. The comparatively small amount of dust removal from regolith, which is likely to be more porous than individual pebbles and rocks (Golombek, Warner, et al., 2020), implies that there is no large-scale dust removal due to the ∆P effect at InSight in the seasons observed so far, from Ls = 296° –134°. However, we cannot exclude the back-venting ∆P effect as the mechanism for dust removal resulting in the observed surface tracks, as they too are distant to be inspected.
5.2.3. Mechanical and Surface-Related Effects
In this section, we explore mechanical characteristics of the surface that could enhance sediment entrain-ment during the atmosphere-ground interaction of the vortical airflow. These characteristics are: small-scale topography and roughness inhomogeneities; surface disturbance due to landing; large-scale topog-raphy; and variations in sediment entrainment susceptibility. While not an exhaustive investigation, these characteristics are of particular relevance to the observations of surface changes at the InSight landing site. In Part 2 (Baker et al., 2021), we investigate the influence of surface properties and sediment availability on aeolian activity through comparison with orbital observations at Homestead hollow and other landing sites.
5.2.3.1. Effect of Topography and Roughness Inhomogeneities
Orbital studies have recently shown that dune motion can be driven by large-scale topographical and ther-mophysical surface property (e.g., albedo) variations (Chojnacki et al., 2019). For example, slope and ther-mally induced winds (Spiga & Lewis, 2010) control ripple migration, dune motion, and widespread sedi-ment motion at Gale crater (Baker, Newman, et al., 2018; Bridges et al., 2017). Curiosity is the only mission to have landed in an area of such large topographical variations and such frequent and prevalent surface changes (Baker, Newman, et al., 2018).
Large-scale variations in topography and surface roughness (e.g., impact ejecta) can similarly force large-scale turbulence and eddy structures into the boundary layer (Spiga & Lewis, 2010). Wind directions can also be topographically controlled, leading to complex, convergent flow patterns that enhance surface fric-tion wind speed. Where mobilizable sediment and an unobstructed fetch length are available, the sporadic onset of saltation, which will occur first at such topographically favored areas without the need of a vortex, may allow full development of cascaded transport at lower wind speeds (Swann et al., 2020). For example, wind speeds of less than 20 m s−1 were reliably measured at Gale crater. This wind speed corresponds to a maximum surface friction wind speed of 1.4 m s−1, which is lower than that required for initiation of drag-induced rolling of resolvable (1.5 mm) grains, 1.7 m s−1. Yet, widespread surface changes were ob-served (Baker, Newman et al., 2018; Newman et al., 2017).
InSight is located in Elysium Planitia, an area without large-scale topographical or thermophysical surface property variations. As a result, particle motion at InSight requires a vortex for initiation, and it is therefore at the local scale that the observed surface changes will be influenced by topography and spatial variations in surface roughness. Here, we examine the relative locations of observed surface changes to evaluate this effect. We remind the reader that removal of dust did not occur uniformly in all areas. Instead, dust was preferentially removed from rocks, and also from localized areas: the lee of the rib of the west solar panel, protruding areas of the SEIS field joint, and the west lander footpad, where multiple cleaning episodes were seen. These observations seem at odds with the mechanisms of sandblasting, grain electrification, saltation clusters, and the ∆P effect, all of which would be expected to remove dust from a widespread area. In ad-dition, surface changes were observed in areas downwind of roughness elements (e.g., rocks and deployed
CHARALAMBOUS ET AL.
10.1029/2020JE006757
35 of 51

Journal of Geophysical Research: Planets
instruments). In these areas, the mechanisms of sandblasting and saltation clusters cannot be effective, as the roughness elements would establish shelter from saltating grains. We thus hypothesize that surface changes in these areas may have been enhanced by locally turbulent wind fields generated by the roughness elements themselves.
Wind-tunnel studies and modeling under both terrestrial and Martian conditions have consistently shown that, while topographic gradients and roughness inhomogeneities—including rocks and pebbles—directly increase the aerodynamic roughness and therefore reduce the average wind speed, they also locally enhance sediment entrainment by increasing surface friction wind speed over short distances (e.g., Fu et al., 2019; Greeley et al., 1994, 2000; Kim et al., 2014; Neakrase & Greeley, 2010; Okin, 2008; Sutton & Neuman, 2008; Sutton, & McKenna-Neuman, 2008; White et al., 1997; Yang & Shao, 2005). As the airflow separates, a turbulent zone develops around individual elements shedding multiple vortex systems, and in particular, the “horseshoe” vortex and pairs of counterrotating vortices which extend in the wake of the element (e.g., Kim et al., 2014; Sutton & Neuman, 2008; Sutton, & McKenna-Neuman, 2008). Areas of elevated shear stress are especially observed in configurations where roughness elements are isolated and sparse (e.g., Kim et al., 2014; Neakrase & Greeley, 2010; Sutton & Neuman, 2008; Sutton, & McKenna-Neuman, 2008). Optimal configurations permit paired vortices and convergent air flows to form, creating zones of elevated surface friction wind speed enhancing sediment transport. In all studies, a certain roughness spatial con-figuration and density are identified, above which the elements collectively act as momentum sinks of the shed vortex systems, effectively suppressing the entrainment of material (Neakrase & Greeley, 2010; Sutton & Neuman, 2008; Sutton, & McKenna-Neuman, 2008). We next evaluate evidence for enhancement at each of the locations where surface changes were observed.
First, we examine dust removal from rocks and pebbles. There is an extremely sparse literature on the effect of roughness under Mars analog atmospheric conditions; nevertheless, White et al. (1997) and Greeley et al. (2000) have shown that dust coatings on geological features, such as pebbles, can be more easily mobi-lized by direct aerodynamic entrainment in moderately rough surfaces, in contrast to smooth ones. A fluid threshold surface friction wind speed as low as ∼2 m s−1 for a surface roughness of 0.1 cm was identified by White et al. (1997). This fluid threshold could explain our observations for preferential erosion of dust from rocks and pebbles on sol 385, for which the measured wind speed was ∼31.5 m s−1, surface friction wind speed 2 m s−1 and surface roughness 0.2 cm. In contrast, direct entrainment of dust from smooth surfaces was found not to be as effective by the same wind tunnel experiments, requiring higher surface friction wind speeds (Greeley et al., 2000; White et al., 1997). The traditional fluid threshold curve of Figure 14 theorizes a value of u∗T ≈ 4.2–5 m s−1 for ρ ∼ 0.015–0.02 kg m−3 and 10 μm particles, which requires wind speeds >90 m s−1 for the smooth area with z0 ∼ 200 μm. This could explain, for example, the paucity of any observations in the ∼25 m smooth expanse to the east-southeast of the lander. Local enhancement of dust removal from roughness elements is likely caused by the compounding effect of protrusion: as a roughness element increases in size, it protrudes further into the boundary layer, where wind speed is higher, and it more effectively obstructs the incident air-flow, generating more turbulent horseshoe, tip, arch, and trail-ing vortices (Pattenden et al., 2005). Observations by Curiosity also report preferential dust removal from protruding artificial and geological elements, in contrast to horizontal surfaces that are mainly subjected to dust accumulation (Yingst et al., 2020). Preferential stripping of dust deposits from rocks and protrusions was also observed at Viking during a global dust storm (Moore, 1985).
We next examine the mobilization of surface material by looking at the location of surface tracks. Nine out of 10 surface tracks were observed in rougher terrain, which has a high rock abundance and would thus promote a higher surface-to-atmosphere exchange of mass and energy. The remaining surface track, puta-tively formed on sol 231, extends across both rougher and smoother terrain. It is still observed with a higher contrast in the rougher terrain, indicative of more intense surface motion in that area (Figure 10a), with only subtle darkening in the smoother area. Wind-tunnel experiments simulating vortex interactions with roughness elements in Mars conditions have produced similar behavior, in which entrainment is enhanced in rougher compared to smooth surfaces (Neakrase & Greeley, 2010). At a particular roughness-element spacing that is not too sparse nor too dense to create shadow protection zones or momentum sinks, air-flow perturbations enhance sediment flux, particularly of fine (<100 μm) particles, producing an “optimal roughness” (Neakrase & Greeley, 2010). For vortices, the optimal roughness depends on the size of both the
CHARALAMBOUS ET AL.
10.1029/2020JE006757
36 of 51
Journal of Geophysical Research: Planets
vortex and the roughness elements. The optimal roughness allows the development of zones where the vec-tor sum of the individual, or convergent, eddy velocities and the wind velocity is large, increasing surface friction wind speed and promoting transport (Sutton & Neuman, 2008; Sutton, & McKenna-Neuman, 2008). Therefore, counterintuitively, surface material can be potentially mobilized at sub fluid threshold surface friction wind speeds more effectively than in unsheltered areas (Grilliot et al., 2018; Luo et al., 2014; McKen-na Neuman & Bédard, 2015; Neakrase & Greeley, 2010; Sutton & Neuman, 2008; Sutton, & McKenna-Neu-man, 2008). The rocky field may be an area of optimal roughness enhancing the erosional capability par-ticularly of smaller, less energetic vortices, and consequently, their ability to form tracks.
Enhancement of aeolian changes can also occur where the component parts of the lander itself act as roughness elements. Examples include frequent redistribution of fines on the top and in the bucket of the scoop; mm-sized grain motion on the deck without any new sand-sized grains appearing (e.g., sols 1–4, Figure 3a, sol 65, Figure 7); localized fine-sediment removal from the footpad; and surface changes downwind of the robotic arm and scoop. The footpad was likely subjected to turbulence generated by the inverted-tripod lander leg, since the vortex for all three episodes of footpad dust removal (sols 19, 26, and 65) arrived from the north, inevitably encountering the lander first. Additional contributors to turbulence may have been the retrorocket-excavated pits beneath the lander and the “Ace of Spades” rock, a 30-cm-diame-ter angular block (Grant et al., 2020; Warner et al., 2020). A local zone of intense turbulence and elevated surface shear stress could thus explain observed isolated dust removal. A similar local zone, downwind of the HP3 mole and scoop of the robotic arm while it was pinned on the surface, could explain grain motion on sols 364 and 385. During both events, the incident airflow was likely obstructed by these elements (e.g., Figure 8a). Finally, the only dust coating removal on the solar panel occurred as a localized streak in the lee of the rib, again likely enhanced by perturbations from the rib's protrusion (Figure 7).
The above hypothesis and observations emphasize the importance of small roughness elements in enhanc-ing surface motion on Mars. These small roughness elements are normally not resolved by the grid spac-ing of global climate models, which are sometimes used to predict aeolian activity (Newman et al., 2017). Therefore, future study should examine the effect of roughness elements at InSight.
5.2.3.2. Effect of Surface Disturbance due to Landing
During InSight's landing, the retrorockets removed dust deposits and exposed disturbed fine sediments, effectively setting the landing site out of aerodynamic equilibrium (Golombek, Warner, et al., 2020). One consequence of this disturbance is the accumulation of disturbed material at the lander-facing side of near-by rocks in the rocky field, while surface material on the opposite side remaining sheltered and undisturbed (Golombek, Warner, et al., 2020). Since disturbed sediments are likely set in disequilibrium with the site's wind thresholds, they may permit a preferential sediment entrainment in contrast to distant undisturbed areas. Redistribution of this transport-susceptible material in the rocky field, in combination with the op-timally-rough terrain in the rocky field, could explain why the majority of surface tracks appeared in that area. This would be consistent with the preferential wind-induced surface changes identified within dis-turbed areas of the Viking Lander 2 (Moore, 1985), MER rovers (Geissler et al., 2010; Sullivan et al., 2008), and Curiosity (Baker, Newman, et al., 2018).
Another consequence of the disturbance is the relative deficiency of surface dust coatings within 20 m of the lander, which could account for the absence of observed dust devils. Such a deficiency of dust coatings may have also effectively prevented us from identifying the true effect of alternative detachment mecha-nisms, such as the back-venting ∆P effect. The significantly fainter trace of the sol 385 dust devil track in the vicinity of Homestead hollow as observed from orbit (Figure 12b) supports this hypothesis, and is also consistent with other surface tracks becoming fainter in the hollow, as identified in orbital images (Perrin et al., 2020). It must be noted, however, that these fainter traces may also be a consequence of insufficient albedo contrast between the trace and the surrounding surface: the blast zone has low albedo, whereas the surrounding areas have higher albedo. Long-term redeposition of dust at the landing site may slowly restore its albedo, possibly allowing the alternative detachment mechanisms and tracks to be more easily detected.
5.2.3.3. Sediment Entrainment Susceptibility at InSight
While the alternative detachment mechanisms above may be active at the InSight landing site, they are hampered by a lack of readily transportable sediment. This is in stark contrast to dunes and ripples at
CHARALAMBOUS ET AL.
10.1029/2020JE006757
37 of 51

Journal of Geophysical Research: Planets
Gale crater, which provide an abundant supply of sand grains (Weitz et al., 2018), and other sites on Mars which show widespread and persistent sediment activity (Bridges, Ayoub et al., 2012; Bridges, Bourke et al., 2012; Chojnacki et al., 2015, 2019; Silvestro et al., 2013). The lack of mobilizable sand at InSight can also be inferred from the inactive bedforms in topographic lows and adjacent to craters observed from orbit (Golombek et al., 2018; Baker et al., 2021).
One possible explanation for the lack of readily transportable sediment at the InSight landing site is in-creased cohesive forces between sand grains caused by the presence of dust. A sand bed can stabilize quick-ly in the presence of dust, even under high wind stresses. In wind tunnel experiments, after stabilization, neither sand nor dust was emitted without the injection of new sand grains into the wind tunnel upwind of the particle bed (Greeley, 2002). This explanation is consistent with observations from previous missions. Microscopy images from the Phoenix lander (Pike et al., 2011) revealed sand grains coated with dust ag-gregates at a landing site with few surface changes. Inactive bedforms at Meridiani Planum, Gusev crater, and Gale all exhibit dust-coated coarse sand overlaying fine-grained interiors (Day & Kocurek, 2016; Minitti et al., 2013; Sullivan et al., 2008; Weitz et al., 2006, 2018), whereas active dunes at Gale crater were dust-free (Weitz et al., 2018).
Orbital images show bright deposits at the InSight landing site, suggesting that it is well mantled by dust, and in-situ observations show that sand and coarser grains are intermixed and coated with dust (Golombek, Warner, et al., 2020). Only sporadic saltation in scattered, small areas was identified in in-situ observations (e.g., sols 235 and 385) consistent with a stable bed that has been dominantly subjected to dust deposition. In addition to dust increasing cohesion between larger grains, a dust layer can also absorb momentum from saltating particles as they impact the dust layer, acting as a “cushion.” This process may be akin to ball-mill grinding; size reduction is progressively achieved by the impact of balls until the system reaches a standstill by the cushioning effect of produced fines (Austin & Bagga, 1981).
Another possible explanation for the lack of readily transportable sediment is the high-variance particle size distribution observed at InSight (Golombek, Warner, et al., 2020). Grain-size distribution is one of the con-trol parameters for the fluid threshold surface friction wind speed (Kok et al., 2012; Sullivan & Kok, 2017; Zhu et al., 2019). In heterogeneous beds, the average protrusion of smaller grains is lower compared to ho-mogeneous beds and smaller grains tend to surround the preferentially exposed larger grains. As a result, it is more difficult for the smaller grains to be entrained (Yager et al., 2018; Zhu et al., 2019; Pähtz et al., 2020). For example, Figure 8h shows detachment of a 3-mm granule which leaves behind an individual bed pock-et, observed as a depression with a rim armored by fines. An additional effect of heterogeneous beds is that larger grains and rocks extract momentum from saltating grains, shortening the rebound trajectories significantly and hindering the likelihood of grain ejection by subsequent impacts (White et al., 1976; Zhu et al., 2019). In comparison, active bedforms at the Bagnold Dune Field in Gale crater were observed to have low-variance particle size distributions, composed of sand grains in the most easily mobilizable size range (median 100–150 µm, Weitz, Sullivan, et al., 2018). Thus, both dust- and grain-size heterogeneity reduce the sediment entrainment susceptibility at the InSight landing site. Because InSight is likely representative of much of Mars, for example, the Spirit landing site (Golombek, Warner, et al., 2020; Sullivan et al., 2008; Weitz et al., 2020), these effects are likely to be widespread.
Wind peaks at InSight often exceed those observed at Curiosity and other sites, although as discussed above, Curiosity's wind sensor was not sensitive to wind speeds above ∼20 m s−1 but did measure winds up to this value (e.g., Bridges et al., 2017) suggesting that stronger winds occurred during those measurement periods. In addition, Curiosity was unable to measure winds for most of the nighttime period due to ex-cessive electronic noise at cold temperatures, which is when most aeolian changes were inferred to occur (Baker, Newman, et al., 2018). However, it is important to note that wind peaks at InSight are instead only short-lived. The entrainment susceptibility of a sediment is known to be a function of both magnitude and duration (Pähtz et al., 2020), and thus the transience of passing vortices may be inadequate in fully initiating saltation.
Finally, the susceptibility of the sediment to mobilization also depends on the properties of the underly-ing substrate. The geometry of the substrate and any additional adhesion forces introduced by it, such as electrostatic forces, can influence the forces required to mobilize sediment, particularly for dust removal
CHARALAMBOUS ET AL.
10.1029/2020JE006757
38 of 51

Journal of Geophysical Research: Planets
(Corn, 1961; Rimai et al., 1994). Various substrate surface materials are introduced by the lander (e.g., the footpad) and the deployed instruments which could increase or decrease susceptibility of sediment depos-ited on those surfaces. For example, the footpad may have enhanced the susceptibility of the sediment on its surface that could explain the recurrent localized changes observed: the footpad is a different material to the regolith; sediment on the footpad surface is higher in the boundary layer; and sediment on the foot-pad surface is likely to be size-sorted, making it less heterogeneous. In a similar manner, exposed bedrock and indurated regolith substrates at Gale crater increase average grain protrusion, enhancing grain motion (Baker, Newman, et al., 2018).
6. Implications for Aeolian Change at the InSight Landing Site6.1. Saltation at the InSight Landing Site is Rare and Vortex Dependent
Observations of aeolian-induced grain motion within Homestead hollow appear to be mostly related to the passage of vortices and correlated with sequences of enhanced vortex activity and stronger ambient wind speeds. The scarcity of observed saltation episodes, short transport distances measured for larger grains, and multidirectional winds associated with the vortices, implies that grain movement is more variable in direction and local in distance than it would be in freestream winds. While saltation is likely initiated by the erosive forces of a vortex, the lack of observable changes downwind strengthens the hypothesis of scarce and sporadic sand in saltation. If sustained saltation occurs, it is likely only with a meager amount of saltat-ing grains. Such a weak sand gardening rate is supported by the in-situ high-resolution imaging on sol 385 which shows only scattered and subtle changes beyond the main track. These scattered and subtle changes cannot be resolved in HiRISE images (25 cm/pixel), despite our identification of the sol 385 track from orbit.
The lack of observations of creep, outside of sols 364 and 385, also suggests that there is a paucity of sal-tation at the InSight landing site. Any saltation that is triggered by energetic vortices is likely to be multi-directional, short-lived, and sporadic, and therefore does not involve a fetch length long enough to fully develop into cascaded transport, despite the impact threshold being exceeded (Bauer et al., 2009; Carneiro et al., 2015; Gillette et al., 1996; Sullivan & Kok, 2017; Swann et al., 2020). Since cascaded transport is hypothesized to travel long distances on Mars (Almeida et al., 2008; Kok, 2010a; Rasmussen et al., 2015; Sullivan & Kok, 2017), any developed cascade should reach the InSight landing site and induce surface changes, for example causing grains to move via impact-driven creep (e.g., Kok, 2010a). We hypothesize that saltation is suppressed by the high heterogeneity in grain size and the presence of dust that cushions impacting grains and increases cohesion. This suppression is in contrast to other locations on Mars that have low heterogeneity and dust-free active bedforms.
Finally, in-situ and orbital observations show a lack of aeolian bedforms at and around the InSight landing site (Baker et al., 2021; Golombek, Warner, et al., 2020), which further suggests little active sand transport, and few wind-transportable grains. Bedforms are only present today within or surrounding relatively fresh impact craters where the sand-size material is out of equilibrium with surface conditions. There are very few fresh craters within the view range of the InSight lander.
6.2. Dust Devils Are Sand Poor and Lift Little Dust
The evidence of scarce amounts of saltating sand grains during vortex events also tells us a more fundamen-tal attribute about dust devils at InSight. The lack of new sand-size sediment appearing in the study regions supports the hypothesis that minimal sand was entrained at the base—the “skirt”—of passing dust devils. A dust devil's skirt normally consists of larger ejected sand grains that cannot be transported to greater heights but are rather redeposited locally (Balme & Greeley, 2006). Unlike typical examples of columnar dust devils on Earth (Murphy et al., 2016), skirts at InSight are likely not sand-rich, thus not leaving sufficient sand-size grains in their wake. However, vortices were not “dustless”—they must have been at least partially dusty as supported by dust removal in various observations and the potential mechanisms, which involve dust, that could have produced magnetic field perturbations. The InSight observations are thus consistent with the paucity of sand-skirt observations of dust devils at Gusev crater (Greeley, Whelley et al., 2006). The evidence of dust removal thus sets a paradox: why do we not observe dust devils if we have evidence that some dust is being lifted? It appears that the dust content may be too low to be visible by cameras. The low dust content
CHARALAMBOUS ET AL.
10.1029/2020JE006757
39 of 51

Journal of Geophysical Research: Planets
could be related due to the combination of local site disturbance removing surficial dust layers and the lack of sand in saltation, which hampers the effectiveness of mechanisms such as sandblasting which could kick up dust in the dust devil column. Long-term redeposition of dust at the landing site may slowly restore its albedo and introduce sufficient dust cover deposits, possibly allowing alternative detachment mechanisms, such as the ∆P effect and tracks to be more easily detected.
6.3. The Net Sediment Flux of Homestead Hollow is Close to Zero
Due to the implications presented above in Section 6.1, wind-induced grain motion within Homestead hol-low may result in little net flux of most sediment into or out of the hollow over time. Although some dust may be lofted and transported out of the hollow during the passage of vortices, this is a small proportion of the total flux. The hollow interior may, therefore, consist of a layer that is active and up to several grain di-ameters thick, but where the movement of its grains as well as deposition and removal of dust does not lead to appreciable changes in the inventory of infilling sediments over time. Such an interpretation is consistent with the presence of a weakly cemented or duricrust layer near the top of the hollow fill that implies long-term stability of the surface and sequestering of most infilling sediments (Golombek, Warner, et al., 2020; Grant et al., 2020; Warner et al., 2020). The paucity of evidence for wholesale transport of grains into and through the hollow as might be expected by saltation induced by free-stream winds, coupled with the bright appearance of most hollows in the vicinity of Homestead, further supports the conclusion that the hollow interior surface is largely stable, and that grain motion is local and predominantly related to the passage of atmospheric vortices.
6.4. Dust Deposition is the Dominant Mechanism and Erosion is Minimal
With the lack of saltation, dust deposition is the dominant mechanism of surface change at the InSight landing site. Multiple observations support this: gradual accumulation of dust on the lander (Figure 6b); brightening of the darkened, low-albedo area of the blast zone from orbital images over 27 sols (sols 384–411, Figure 12b); unchanging, dust-mantled bedforms (Baker et al., 2021; Golombek, Warner, et al., 2020); gradual reduction of solar array output (Lorenz, Lemmon, et al., 2020); and fading of dust devil tracks ob-served from orbit (Perrin et al., 2020). Further, little deposited dust is removed: wind streaks and dust-man-tled bedforms remain bright and unchanging (Day & Rebolledo, 2019); and only one small solar panel cleaning event was observed (Lorenz, Lemmon, et al., 2020). Our observations, during Ls ∼ 296°–134°, are consistent with observations of net dust deposition at Curiosity until the end of the aphelion season (Ls ∼ 300°–180°). However, observations at Curiosity also indicate cyclic deposition and removal of dust (e.g., Vicente-Retortillo et al., 2018) and previous observations of surface changes on Mars show a season-ality (e.g., Ayoub et al., 2014), with a peak in activity around perihelion (Ls = 251°). Therefore, seasonality cannot be excluded until a full Mars year of observations is completed. Dust deposition as the dominant mechanism, and the lack of solar panel cleaning events, has implications for the long-term survival of In-Sight and other solar-powered spacecraft in similar locations (e.g., Lorenz & Reiss, 2015).
6.5. Higher Surface Roughness Promotes Aeolian Change
Every observed surface change at the InSight landing site is associated with a vortex. However, not all vortices are associated with surface changes. Of the 40 most energetic vortex passages with a measured pressure drop of at least 3 Pa (Lorenz, Spiga, et al., 2020), only one-third caused a surface change observed in our study. In comparison, 9 out of 10 vortices during sols 0–66 caused ICC cleaning events. This suggests that the ICC lens is more susceptible to, and/or is a more sensitive detector, of aeolian change as expected from a vertically mounted surface subjected to turbulence. There could be multiple reasons for the lack of vortex-induced surface changes.
First, vortices are more likely to cause surface changes if they pass over areas of higher surface roughness. Areas of higher surface roughness cause local increases in surface friction wind speed, making it more likely that the fluid threshold is exceeded. In addition, roughness elements shed multiple vortices that can inter-act (Section 5.2.3.1), which again causes local increases in surface friction wind speed. This reason is also supported by the lack of surface changes observed in the smooth area, despite the majority of seismically
CHARALAMBOUS ET AL.
10.1029/2020JE006757
40 of 51
Journal of Geophysical Research: Planets
detected vortices being in that geomorphologically softer region (Murdoch et al., 2020). Local and isolated changes downwind roughness elements further strengthen this observation.
Second, although the pressure sensor can detect pressure drops in any direction, the ICC used to identify surface changes only observes 120° of azimuth, toward the south, while the arm-mounted IDC camera rare-ly acquired images to the North. This produces an observational bias, and the one-third fraction of azimuth observed is consistent with the one-third of the 40 most energetic vortex passages that were observed to cause a surface change. However, this bias is affected to some degree by the direction of travel of vortices, which is usually aligned with the ambient wind direction.
Third, the measured pressure drop only provides an estimate of the true core pressure drop in the vortex. The same measured pressure drop can be caused by either a large, distant vortex, or a nearby, small vortex.
Finally, the observations reported in this paper are only for two-thirds of a Mars year. There may be seasonal variations in vortex and/or surface properties that make surface changes less likely at the observed time of year (Part 2, Baker et al., 2021).
7. Future Work7.1. Improving Wind Speed Measurements During Vortex Encounters
InSight is the first mission to provide high-frequency measurements of wind speed in energetic vortices (pressure drops of up to 9 Pa) with instantaneous wind speed peaks of up to 31.5 m s−1. Such short-lived peaks in wind speed have been unresolved by other missions. In addition, other missions do not have simul-taneous high-frequency meteorological data and observations of surface changes. Since sediment motion at InSight is heavily dependent on the instantaneous forces applied by close vortex encounters, accurately measuring peak wind speeds is critical to infer surface friction wind speeds required for grain detachment. However, limitations in the wind retrieval and the geometry of the encounter during a vortex's passage hamper the estimation of a representative peak wind speed (Section 4.1) and require future efforts to bet-ter constrain current estimates. Simple predictions of vortex-induced peak wind speeds from atmospheric modeling presented in this work suggest that wind speeds are likely significantly underestimated. While future change detection experiments will enrich statistics to help confirm the tendencies observed here, a more promising solution would be to improve the wind retrieval algorithm employed by TWINS. To poten-tially retrieve peaks of interest during periods of frequent vortex episodes, it is possible to reconfigure the wind sensors by reducing the Overheat Temperature Setpoint (OTS) of TWINS for a certain period, which has two consequences: (1) it will allow the sensor to measure high wind speeds without saturating and (2) it will increase the minimum wind speed that can be measured by the sensor. By restricting these set-tings during the daytime, the focus will shift toward measuring strong wind gusts and vortex-induced wind peaks, while the critical nighttime measurements during which seismic events are detected will remain unaffected (Giardini et al., 2020; Lognonné et al., 2020). Alternatively, even if the OTS is not reduced, it is possible to use the raw maximum readings to determine an approximate maximum wind speed given the sensor configuration settings.
These wind retrieval limitations should also inform future missions. If it is assumed that surface material is instantaneously mobilized when the surface friction wind speed exceeds the fluid threshold in short duration peaks, determination of the fluid threshold surface friction wind speed requires a higher sample rate than InSight's 1 sps, and the capability to accurately measure high wind speeds, with their attendant turbulence and vorticity. These twin requirements of high sample rate and high-wind-speed measurement capability may favor a specialized “peak wind sensor.” In contrast to typical wind sensors, which operate at a low sample rate, are designed to accurately measure typical wind speeds, and operate continuously, a peak wind sensor would operate at a very high sample rate, be designed to accurately measure peak wind speeds, and would only operate in short bursts, beginning when its accompanying continuous wind sensor detected the onset of a peak in wind speed. In this way, power and data volume could be kept manageable. In addition, having wind speed sensors at several heights would help to estimate z0 and its dependence on wind azimuth.
CHARALAMBOUS ET AL.
10.1029/2020JE006757
41 of 51
Journal of Geophysical Research: Planets
7.2. Improving Vortex Peak Wind Speed and Core Pressure Drop Measurements Using Seismic Data
As discussed earlier in Sections 4.1 and 4.4, APSS only provides a lower bound on peak wind speed and core pressure drop for a vortex encounter. This limitation could be overcome by combining atmospheric and seismic measurements. First, together with imaging, seismic measurements can help to constrain vortex parameters such as the core pressure drop. The core pressure drop then allows the tangential wind speed to be estimated for both distant and near-lander encounters. Second, since seismic data is recorded at 100 sps in comparison to 1 sps TWINS data, instantaneous peak wind speeds during close vortex encounters may be retrievable through comodulation, a framework in which SEIS is used as a wind sensor (Charalambous et al., 2020). Comodulation may also provide redundancy in the wind speed and pressure measurements by detecting vortices without APSS, potentially allowing SEIS to behave as a meteorological, in addition to a seismological, instrument.
Since a vortex trajectory can be reconstructed from ground tilt without imaging (Murdoch et al., 2020), further exploration would be interesting in answering two questions: did energetic vortices pass within the FOV of the cameras, but not cause a surface change and, if so, then were these vortices mainly confined to the smooth plains to the east-southeast of the lander? Analyses by Murdoch et al. (2020) and Banerdt et al. (2020) suggest that the vast majority of vortex encounters are detected to the east of the station, which they attribute to a geomorphologically softer regolith that more easily deforms. Future analysis of the spa-tial variation of vortex detection sensitivity is critical to understand the effects of both surface roughness and regolith rigidity on vortex-induced surface changes.
Finally, particles that impact the tether may also be detected by the seismometers. Since the tether is con-nected to SEIS and is sensitive to electric fields, charged grains could induce an electric field noise detecta-ble by SEIS (Clinton et al., 2017). Comodulation approaches (Charalambous et al., 2020), together with po-larization analysis (Stutzmann et al., 2020), can help identify seismic signals originating from such sources. These could help identify and constrain the timing of events such as the putative saltation impacts on the SEIS tether during sol 235, and whether these originated from ejections from a distant vortex identifiable as a precursor in the ground tilt sensed by SEIS.
7.3. Improving Estimates of Surface Roughness
The InSight lander is the first mission to have deployed instruments permanently on the surface, effectively introducing non-erodible roughness elements that interact with the vortical airflow. In addition, we have shown that the hollow exhibits a natural spatial heterogeneity of roughness elements. Many aeolian mod-eling studies on Mars assume a spatially uniform z0 (e.g., Forget et al., 1999; Greeley, Balme, et al., 2003; Greeley, Kuzmin, et al., 2003; Newman et al., 2002; Spiga & Lewis, 2010; Swann et al., 2020), however, this only represents ideal circumstances that are exceptional in nature. The finer-scale topographic variations that we have considered in this study are not resolved by the grid spacing of models in which predictions for wind-induced motion are hampered (e.g., Newman et al., 2017).
An accurate determination of the impact of roughness elements on the near-surface aerodynamics is cen-tral to estimating threshold-of-motion conditions, and in turn, understanding both temporal and spatial patterns of wind erosion on Mars. Furthermore, the spatial heterogeneity of roughness element density at the landing site requires that the geometry, spatial configuration, and size distribution as a function of wind azimuth must be incorporated into wind-induced aeolian erosion models. The wind direction has an impact on an area's effective surface roughness in that an object's resistance to wind flow is a function of the object's cross-sectional area perpendicular to the wind (Holland et al., 2008). However, because the vortex flow induces a helical flow path in contrast to freestream wind direction, the interaction with the roughness elements becomes even more complex. This demands a full characterization of small-scale topographic and roughness variations at the site as a function of wind direction incorporating the effect of the fetch length (Elliot, 1958). In addition, CFD modeling may be required to account for turbulence by local thermal and physical perturbations (e.g., heaters inside the robotic arm or WTS, Lognonné et al., 2019). Future change detection and imaging experiments at InSight will continue to refine the surface roughness, and thus z0, with the goal of determining a full 360° map of aerodynamic roughness lengths.
CHARALAMBOUS ET AL.
10.1029/2020JE006757
42 of 51
Journal of Geophysical Research: Planets
7.4. Understanding the Source of Magnetic Field Perturbations
It remains difficult to determine the source of the magnetic perturbations measured during vortex encoun-ters (Section 4.5). One potential source, triboelectric charging of grains, is incompletely understood (Harri-son et al., 2016), and another potential source, SACs, are sampled at a very low rate (every 30 s) that exceeds the duration of a typical vortex encounter. The latter issue has been recently mitigated to some extent by increasing the sample rate to a minimum of every 4 s from sol 426 onwards and will help better discriminate sources induced by SAC variations at the passage of a dust devil.
7.5. Future Change Detection Experiments and Long-Term Monitoring
After completion of arm activities, the arm is planned to be placed into a retirement pose. This retirement pose allowing long-term monitoring of surface changes. Before being placed into this retirement pose, the robotic arm will scrape the surface to produce a sand pile. The sand pile will provide contrast to the more stabilized surface and a supply of mobilizable grains.
Long-term monitoring will reveal the seasonal variation of surface activity and sediment flux, and build up a catalog of surface changes along with the environmental conditions in which they occurred. Understand-ing seasonal variation is important for atmospheric models that predict dust activity and weather on Mars. Because surface changes at InSight are largely caused by vortices, long-term monitoring at this location will contribute to our understanding of dust devil physics.
Long-term monitoring will also characterize how, and over what timescale, a disturbed landing site returns to aerodynamic equilibrium. Once the landing site has returned to aerodynamic equilibrium, it will be possible to compare the level of activity with that observed now. This characterization could be further investigated by measuring the mm-scale local microtopographic relief (Garvin et al., 2019) and albedo of the blast zone over time.
8. ConclusionAeolian changes during Ls 296°–134° at the InSight landing site—dust entrainment, creep of grains d < 3 mm, and saltation—are rare and are only caused by the passage of vortices. Surface changes caused by vortices are preferentially located in areas of higher surface roughness and downwind of roughness ele-ments such as rocks and deployed instruments, and the vortices themselves are sand-poor and lift little dust. Dust deposition is the dominant mechanism, and erosion is minimal. As a result, the net sediment flux into and out of Homestead hollow is close to zero and surface change observations are chiefly confined within surface dust devil tracks, as observed from orbit.
The short-lived peaks in wind speed induced by these vortices are resolved for the first time by InSight's high-frequency wind measurements, opening a unique avenue into the better understanding of vortices as an important driver of surface motion on Mars. In addition, episodic aeolian changes are correlated with ex-cursions in both seismic and magnetic signals as might be expected from vortex-induced ground movement and charged-particle motion, respectively.
While the observed saltation is broadly consistent with the predictions of classic fluid threshold (Shao & Lu, 2000), the observed dust removal and surface creep is not. A variety of alternative mechanisms for en-hancing grain detachment were discussed. Many of these mechanisms require a supply of saltating sand. However, at the InSight landing site, sand susceptible to saltation is in short supply, likely due to the pres-ence of dust and high heterogeneity of particle size. Therefore, the most promising alternative mechanisms do not depend on saltating particles, but on the local enhancement of surface friction wind speed. This local enhancement arises where the vector sum of the background and vortex-induced wind speed velocities is highest, and where surface friction wind speed is increased due to interaction with roughness elements. Further promising mechanisms and effects were identified: disturbed sediment, impact-driven creep, drag-induced rolling, and the ∆P effect, with the latter two further investigated in Part 2, Baker et al. (2021).
The main limitations of this study are uncertainties in the wind retrieval and aerodynamic surface rough-ness length. For future observations from InSight, these limitations can be addressed by adjusting the OTS
CHARALAMBOUS ET AL.
10.1029/2020JE006757
43 of 51
Journal of Geophysical Research: Planets
of the TWINS wind sensor to allow retrieval of higher wind speeds, and by completing a 360° panorama image of the landing site followed by modeling the interaction of the boundary layer with the roughness elements.
In summary, these observations reveal a quiescent, dust-deposition-dominated landing site, at which it is likely that only vortices are able to cause the rare, localized aeolian changes observed. In these vortices, par-ticle lifting processes are enhanced and can interact. The geomorphologic characteristics, surface processes (e.g., gravity, impacts, and wind), and geologic history of the smooth volcanic plains at the InSight landing site are representative of other Hesperian to Early Amazonian-age regolith-covered lava plains across Mars (Golombek et al., 2018). This not only includes the well-studied Spirit landing site on the Gusev plains (Sul-livan et al., 2008; Weitz et al., 2020), but more broadly, the vast ridged plains of the northern lowlands. The observations of sediment motion near the InSight lander may therefore be representative of the style and magnitude of aeolian activity for a large swath of Mars, where moderately dust-covered landscapes are at or near equilibrium with surface processes.
Data Availability StatementThe authors acknowledge NASA, UK Space Agency, CNES, their partner agencies and Institutions (UKSA, IC, SSO, DLR, JPL, IPGP-CNRS, ETHZ, and MPS-MPG) and the flight operations team at JPL, SISMOC, MSDS, IRIS-DMC, and PDS for acquiring and providing InSight data, including SEED SEIS data. SEIS raw data are in “Insight Mars SEIS Data Service (2019) together with IPGP, JPL, CNES, ETHZ, ICL, MPS, ISAE-Supaero, LPG, MFSC” (2019) with http://doi.org/10.18715/SEIS.INSIGHT.XB_2016. The seis-mic, atmospheric, and magnetic measurement data presented here are also publicly available in InSight Mars SEIS Data Service (2019a) SEIS Bundle with http://doi.org/10.17189/1517570, APSS TWINS Bun-dle (Mora, 2019a, 2019b) with http://doi.org/10.17189/1518950, APSS PS Bundle (Mora, 2019a, 2019b) with http://doi.org/10.17189/151893, and IFG Mars Bundle (Joy & Russell, 2019) with http://doi.org/10.17189/1519202. InSight seismic, atmospheric, and IFG data presented here are also available through the Planetary Data System (PDS) Geosciences node, but also through the Incorporated Research Institutions for Seismology (IRIS) Data Management Center under network code XB and through the Data center of Institut de Physique du Globe, Paris (http://seis-insight.eu). InSight Lander camera images are publicly available through the IDC/ICC Bundle (Deen et al., 2019) with http://doi.org/10.17189/1510484. IDs of images presented in this manuscript are in Section S1. Orbital images presented here are available on the HiRISE website: https://hirise.lpl.arizona.edu/. Processed data are available in Charalambous (2021) with http://doi.org/10.5281/zenodo.4564482.
ReferencesAlmeida, M. P., Parteli, E. J. R., Andrade, J. S., & Herrmann, H. J. (2008). Giant saltation on Mars. Proceedings of the National Academy of
Sciences, 105(17), 6222–6226. https://doi.org/10.1073/pnas.0800202105Arvidson, R. E., Guinness, E. A., Moore, H. J., Tillman, J., & Wall, S. D. (1983). Three Mars years: Viking lander 1 imaging observations.
Science, 222(4623), 463–468. https://doi.org/10.1126/science.222.4623.463Austin, L. G., & Bagga, P. (1981). An analysis of fine dry grinding in ball mills. Powder Technology, 28(1), 83–90. https://doi.
org/10.1016/0032-5910(81)87014-3Ayoub, F., Avouac, J. P., Newman, C. E., Richardson, M. I., Lucas, A., Leprince, S., & Bridges, N. T. (2014). Threshold for sand mobility on
Mars calibrated from seasonal variations of sand flux. Nature Communications, 5(1), 1–8. https://doi.org/10.1038/ncomms6096Bagnold, R. (1941). The physics of blown sand and desert dunes.Baker, M. M., Lapotre, M. G. A., Minitti, M. E., Newman, C. E., Sullivan, R., Weitz, C. M., et al. (2018). The Bagnold dunes in southern
summer: Active sediment transport on Mars observed by the Curiosity rover. Geophysical Research Letters, 45(17), 8853–8863. https://doi.org/10.1029/2018gl079040
Baker, M. M., Newman, C., Charalambous, C., Golombek, M., Spiga, A., Banfield, D., et al. (2021). Vortex-dominated aeolian activity at In-Sight's landing site, Part 2: Local meteorology, transport dynamics, and model analysis. Journal of Geophysical Research: Planets, 126(4), e2020JE006514. https://doi.org/10.1029/2020je006514
Baker, M. M., Newman, C. E., Lapotre, M. G. A., Sullivan, R., Bridges, N. T., & Lewis, K. W. (2018). Coarse sediment transport in the modern Martian environment. Journal of Geophysical Research: Planets, 123(6), 1380–1394. https://doi.org/10.1002/2017je005513
Balme, M., & Greeley, R. (2006). Dust devils on Earth and Mars. Reviews of Geophysics, 44, 3003. https://doi.org/10.1029/2005RG000188Balme, M., & Hagermann, A. (2006). Particle lifting at the soil-air interface by atmospheric pressure excursions in dust devils. Geophysical
Research Letters, 33(19). https://doi.org/10.1029/2006gl026819Balme, M. R., Metzger, S., Towner, M., Ringrose, T., Greeley, R., & Iversen, J. (2003). Friction wind speeds in dust devils: A field study.
Geophysical Research Letters, 30(16). https://doi.org/10.1029/2003gl017493
CHARALAMBOUS ET AL.
10.1029/2020JE006757
44 of 51
AcknowledgmentsThe authors thank the HiRISE team for the timely acquisition of orbital images used. The authors also thank the JGR Editor Deanne Rogers, associate editor German Martinez and both the referees, Matt Balme and Simone Silvestro, for their insightful suggestions and constructive review on greatly im-proving this manuscript. The authors would also like to thank Menghan Wang for constructive criticism of the manuscript. A portion of this study was supported by the InSight Project at the Jet Propulsion Laboratory, Califor-nia Institute of Technology, under a contract with the National Aeronautics and Space Administration. French co-authors acknowledge support from the Centre National d'Études Spatiales (CNES). Additional funding support was provided by Agence Nationale de la Recherche (ANR-19-CE31-0008-08 MAGIS). I. J. Daubara was supported by NASA Grants 80NM0018F0719 and 80NSSC20K0971. R. D. Lorenz was supported by NASA Grant 80NSS-C18K1626. This is InSight Contribution number 166.
Journal of Geophysical Research: Planets
Balme, M. R., Pathare, A., Metzger, S. M., Towner, M. C., Lewis, S. R., Spiga, A., et al. (2012). Field measurements of horizontal forward motion velocities of terrestrial dust devils: Toward a proxy for ambient winds on Mars and Earth. Icarus, 221(2), 632–645. https://doi.org/10.1016/j.icarus.2012.08.021
Banerdt, W. B., Smrekar, S. E., Banfield, D., Giardini, D., Golombek, M., Johnson, C. L., et al. (2020). Initial results from the InSight mission on Mars. Nature Geoscience, 13, 1–7. https://doi.org/10.1038/s41561-020-0544-y
Banfield, D., Rodriguez-Manfredi, J. A., Russell, C. T., Rowe, K. M., Leneman, D., & Lai, H. R. (2019). InSight auxiliary payload sensor suite (APSS). Space Science Reviews, 215(1), 1–33.
Banfield, D., Schindel, D. W., Tarr, S., & Dissly, R. W. (2016). A Martian acoustic anemometer. Journal of the Acoustical Society of America, 140(1420). https://doi.org/10.1121/1.4960737
Banfield, D., Spiga, A., Newman, C., Forget, F., Lemmon, M., Lorenz, R., et al. (2020). The atmosphere of Mars as observed by InSight. Nature Geoscience, 13(3), 190–198. https://doi.org/10.1038/s41561-020-0534-0
Bauer, B. O., Davidson-Arnott, R. G. D., Hesp, P. A., Namikas, S. L., Ollerhead, J., & Walker, I. J. (2009). Aeolian sediment transport on a beach: Surface moisture, wind fetch, and mean transport. Geomorphology, 105(1–2), 106–116. https://doi.org/10.1016/j.geomorph.2008.02.016
Bell, J. F., McSween, H. Y., Crisp, J. A., Morris, R. V., Murchie, S. L., Bridges, N. T., et al. (2000). Mineralogic and compositional prop-erties of Martian soil and dust: Results from Mars Pathfinder. Journal of Geophysical Research, 105(E1), 1721–1755. https://doi.org/10.1029/1999je001060
Bi, X., Gao, Z., Liu, Y., Liu, F., Song, Q., Huang, J., et al. (2015). Observed drag coefficients in high winds in the near offshore of the South China Sea. Journal of Geophysical Research: Atmospheres, 120, 6444–6459. https://doi.org/10.1002/2015JD02317210.1002/2015jd023172
Bila, T., Wurm, G., Onyeagusi, F. C., & Teiser, J. (2020). Lifting grains by the transient low pressure in a Martian dust devil. Icarus, 339, 113569. https://doi.org/10.1016/j.icarus.2019.113569
Bridges, N. T., Ayoub, F., Avouac, J.-P., Leprince, S., Lucas, A., & Mattson, S. (2012). Earth-like sand fluxes on Mars. Nature, 485(7398), 339–342. https://doi.org/10.1038/nature11022
Bridges, N. T., Bourke, M. C., Geissler, P. E., Banks, M. E., Colon, C., Diniega, S., et al. (2012). Planet-wide sand motion on Mars. Geology, 40(1), 31–34. https://doi.org/10.1130/g32373.1
Bridges, N. T., & Ehlmann, B. L. (2018). The Mars science laboratory (MSL) Bagnold Dunes campaign, Phase I: Overview and introduction to the special issue. Journal of Geophysical Research, 123, 3–19. https://doi.org/10.1002/2017JE005401
Bridges, N. T., Sullivan, R., Newman, C. E., Navarro, S., van Beek, J., Ewing, R. C., et al. (2017). Martian aeolian activity at the Bag-nold Dunes, Gale Crater: The view from the surface and orbit. Journal of Geophysical Research, 122, 2077–2110. https://doi.org/10.1002/2017JE005263
Carneiro, M. V., Rasmussen, K. R., & Herrmann, H. J. (2015). Bursts in discontinuous aeolian saltation. Scientific Reports, 5, 11109. https://doi.org/10.1038/srep11109
Charalambous, C. (2021). Data from the article: Vortex-dominated aeolian activity at InSight's landing site, Part 1: Multi-instrument observa-tions, analysis and implications. Zenodo. https://doi.org/10.5281/ZENODO.4564482
Charalambous, C., Golombek, M., Pike, T., Warner, N. H., Weitz, C., Ansan, V., et al. (2019). Rock distributions at the InSight landing site and implications based on fragmentation theory. Paper presented at 50th Lunar and Planetary Science. Houston: Lunar and Planetary Institute.
Charalambous, C., Stott, A. E., Pike, T., McClean, J., Warren, T., Spiga, A., et al. (2020). A comodulation analysis of atmospheric energy in-jection into the ground motion at InSight, Mars. Journal of Geophysical Research: Planets, 126(4). https://doi.org/10.1029/2020je006538
Chepil, W. S. (1945). Dynamics of wind erosion: I. Nature of movement of soil by wind. Soil Science, 60(4), 305–320. https://doi.org/10.1097/00010694-194510000-00004
Chojnacki, M., Banks, M. E., Fenton, L. K., & Urso, A. C. (2019). Boundary condition controls on the high-sand-flux regions of Mars. Geology, 47(5), 427–430. https://doi.org/10.1130/g45793.1
Chojnacki, M., Johnson, J. R., Moersch, J. E., Fenton, L. K., Michaels, T. I., & Bell, J. F., III (2015). Persistent aeolian activity at En-deavor crater, Meridiani Planum, Mars; New observations from orbit and the surface. Icarus, 251, 275–290. https://doi.org/10.1016/j.icarus.2014.04.044
Claudin, P., & Andreotti, B. (2006). A scaling law for aeolian dunes on Mars, Venus, Earth, and for subaqueous ripples. Earth and Planetary Science Letters, 252(1-2), 30–44. https://doi.org/10.1016/j.epsl.2006.09.004
Clinton, J. F., Giardini, D., Lognonné, P., Banerdt, B., van Driel, M., Drilleau, M., et al. (2017). Preparing for InSight: An invitation to participate in a blind test for Martian seismicity. Seismological Research Letters, 88(5), 1290–1302. https://doi.org/10.1785/0220170094
Colaïtis, A., Spiga, A., Hourdin, F., Rio, C., Forget, F., & Millour, E. (2013). A thermal plume model for the Martian convective boundary layer. Journal of Geophysical Research: Planets, 118(7), 1468–1487. https://doi.org/10.1002/jgre.20104
Corn, M. (1961). The adhesion of solid particles to solid surfaces, I. A review. Journal of the Air Pollution Control Association, 11(11), 523–528. https://doi.org/10.1080/00022470.1961.10468032
Davy, R., Davis, J. A., Taylor, P. A., Lange, C. F., Weng, W., Whiteway, J., & Gunnlaugson, H. P. (2010). Initial analysis of air temperature and related data from the Phoenix MET station and their use in estimating turbulent heat fluxes. Journal of Geophysical Research, 115(E3). https://doi.org/10.1029/2009je003444
Day, M., & Kocurek, G. (2016). Observations of an aeolian landscape: From surface to orbit in Gale Crater. Icarus, 280, 37–71. https://doi.org/10.1016/j.icarus.2015.09.042
Day, M., & Rebolledo, L. (2019). Intermittency in wind-driven surface alteration on Mars interpreted from wind streaks and measurements by InSight. Geophysical Research Letters, 46(22), 12747–12755. https://doi.org/10.1029/2019gl085178
Deen, R., Abarca, H., Zamani, P., & Maki, J. (2019). InSight cameras bundle. NASA Planetary Data System. https://doi.org/10.17189/1510484De Vet, S. J., Merrison, J. P., Mittelmeijer-Hazeleger, M. C., Van Loon, E. E., & Cammeraat, L. H. (2014). Effects of rolling on wind-induced
detachment thresholds of volcanic glass on Mars. Planetary and Space Science, 103, 205–218. https://doi.org/10.1016/j.pss.2014.07.012Eden, H. F., & Vonnegut, B. (1973). Electrical breakdown caused by dust motion in low-pressure atmospheres: Considerations for Mars.
Science, 180(4089), 962–963. https://doi.org/10.1126/science.180.4089.962Ellehoj, M. D., Gunnlaugsson, H. P., Taylor, P. A., Kahanpää, H., Bean, K. M., Cantor, B. A., et al. (2010). Convective vortices and dust devils
at the Phoenix Mars mission landing site. Journal of Geophysical Research, 115(E4). https://doi.org/10.1029/2009je003413Elliott, W. P. (1958). The growth of the atmospheric internal boundary layer. Eos, Transactions American Geophysical Union, 39(6), 1048–
1054. https://doi.org/10.1029/tr039i006p01048Esposito, F., Molinaro, R., Popa, C. I., Molfese, C., Cozzolino, F., Marty, L., et al. (2016). The role of the atmospheric electric field in the
dust-lifting process. Geophysical Research Letter, 43(10), 5501–5508. https://doi.org/10.1002/2016gl068463
CHARALAMBOUS ET AL.
10.1029/2020JE006757
45 of 51
Journal of Geophysical Research: Planets
Ewing, R. C., Lapotre, M. G. A., Lewis, K. W., Day, M., Stein, N., Rubin, D. M., et al. (2017). Sedimentary processes of the Bagnold Dunes: Implications for the eolian rock record of Mars. Journal of Geophysical Research: Planets, 122(12), 2544–2573.
Farrell, W. M. (2004). Electric and magnetic signatures of dust devils from the 2000–2001 MATADOR desert tests. Journal of Geophysical Research, 109, E03004. https://doi.org/10.1029/2003je002088
Fenton, L., Reiss, D., Lemmon, M., Marticorena, B., Lewis, S., & Cantor, B. (2016). Orbital observations of dust lofted by daytime convective turbulence. Space Science Reviews, 203(1), 89–142. https://doi.org/10.1007/s11214-016-0243-6
Ferri, F., Smith, P. H., Lemmon, M., & Rennó, N. O. (2003). Dust devils as observed by Mars Pathfinder. Journal of Geophysical Research: Planets, 108(E12). https://doi.org/10.1029/2000je001421
Field, J. P., & Pelletier, J. D. (2018). Controls on the aerodynamic roughness length and the grain-size dependence of aeolian sediment transport. Earth Surface Processes and Landforms, 43(12), 2616–2626. https://doi.org/10.1002/esp.4420
Forget, F., Hourdin, F., Fournier, R., Hourdin, C., Talagrand, O., Collins, M., et al. (1999). Improved general circulation models of the Martian atmosphere from the surface to above 80 km. Journal of Geophysical Research, 104(E10), 24155–24175. https://doi.org/10.1029/1999je001025
Franzese, G., Esposito, F., Lorenz, R., Silvestro, S., Popa, C. I., Molinaro, R., et al. (2018). Electric properties of dust devils. Earth and Plan-etary Science Letters, 493, 71–81. https://doi.org/10.1016/j.epsl.2018.04.023
Fu, L. T., Fan, Q., & Huang, Z. L. (2019). Wind speed acceleration around a single low solid roughness in atmospheric boundary layer. Scientific Reports, 9(1), 1–11. https://doi.org/10.1038/s41598-019-48574-7
Garcia, R. F., Kenda, B., Kawamura, T., Spiga, A., Murdoch, N., Lognonné, P. H., et al. (2020). Pressure effects on the SEIS-InSight instru-ment, improvement of Seismic records, and characterization of long period atmospheric waves from ground displacements. Journal of Geophysical Research: Planets, 125(7), e2019JE006278. https://doi.org/10.1029/2019je006278
Garvin, J. B., Dotson, R., Williams, N., Maki, J., Deen, R., Abarca, H., et al. (2019). Microtopography of the Mars InSight landing site: Ge-ological implications. Surface of Mars, 4(5), 7–8.
Geissler, P. E., Sullivan, R., Golombek, M., Johnson, J. R., Herkenhoff, K., Bridges, N., et al. (2010). Gone with the wind: Eolian erasure of the Mars rover tracks. Journal of Geophysical Research, 115, E00F11. https://doi.org/10.1029/2010JE003674
Giardini, D., Lognonné, P., Banerdt, W. B., Pike, W. T., Christensen, U., Ceylan, S., et al. (2020). The seismicity of Mars. Nature Geoscience, 13(3), 205–212. https://doi.org/10.1038/s41561-020-0539-8
Gierasch, P. J., & Goody, R. M. (1972). The effect of dust on the temperature of the Martian atmosphere. Journal of the Atmospheric Scienc-es, 29(2), 400–402. https://doi.org/10.1175/1520-0469(1972)029<0400:teodot>2.0.co;2
Gillette, D. A., Herbert, G., Stockton, P. H., & Owen, P. R. (1996). Causes of the fetch effect in wind erosion. Earth Surface Processes and Landforms, 21(7), 641–659. https://doi.org/10.1002/(sici)1096-9837(199607)21:7<641::aid-esp662>3.0.co;2-9
Gillette, D. A., & Stockton, P. H. (1989). The effect of nonerodible particles on wind erosion of erodible surfaces. Journal of Geophysical Research, 94(D10), 12885–12893. https://doi.org/10.1029/jd094id10p12885
Golombek, M. P., Arvidson, R. E., Bell, J. F., Christensen, P. R., Crisp, J. A., Crumpler, L. S., et al. (2005). Assessment of Mars exploration rover landing site predictions. Nature, 436(7047), 44–48. https://doi.org/10.1038/nature03600
Golombek, M. P., Crumpler, L. S., Grant, J. A., Greeley, R., Cabrol, N. A., Parker, T. J., et al. (2006). Geology of the Gusev cratered plains from the Spirit rover transverse. Journal of Geophysical Research, 111(E2). https://doi.org/10.1029/2005je002503
Golombek, M. P., Grant, J. A., Parker, T. J., Kass, D. M., Crisp, J. A., Squyres, S. W., et al. (2003). Selection of the Mars exploration rover landing sites. Journal of Geophysical Research: Planets, 108(E12). https://doi.org/10.1029/2003je002074
Golombek, M. P., Grott, M., Kargl, G., Andrade, J., Marshall, J., Warner, N., et al. (2018). Geology and physical properties investigations by the InSight lander. Space Science Reviews, 214(5), 84. https://doi.org/10.1007/s11214-018-0512-7
Golombek, M. P., Huertas, A., Kipp, D., & Calef, F. (2012). Detection and characterization of rocks and rock size-frequency distributions at the final four mars science laboratory landing sites. International Journal of Mars Science and Exploration, 7, 1–22.
Golombek, M. P., Kass, D., Williams, N., Warner, N., Daubar, I., Piqueux, S., et al. (2020). Assessment of InSight landing site predictions. Journal of Geophysical Research: Planets, 125, e2020JE006502. https://doi.org/10.1029/2020JE006502
Golombek, M. P., Warner, N. H., Grant, J. A., Hauber, E., Ansan, V., Weitz, C. M., et al. (2020). Geology of the InSight landing site on Mars. Nature Communications, 11, 1–11. https://doi.org/10.1038/s41467-020-14679-1
Golombek, M. P., Williams, N., Warner, N. H., Parker, T., Williams, M. G., Daubar, I., et al. (2020). Location and setting of the Mars InSight lander, instruments, and landing site. Earth and Space Science, 7, e2020EA001248. https://doi.org/10.1029/2020EA001248
Grant, J. A., Warner, N. H., Weitz, C. M., Golombek, M. P., Wilson, S. A., Baker, M., et al. (2020). Degradation of Homestead hollow at the InSight landing site based on the distribution and properties of local deposits. Journal of Geophysical Research: Planets, 125(4), e2019JE006350. https://doi.org/10.1029/2019je006350
Grant, W. D., & Madsen, O. S. (1982). Movable bed roughness in unsteady oscillatory flow. Journal of Geophysical Research, 87(C1), 469–481. https://doi.org/10.1029/jc087ic01p00469
Greeley, R. (2002). Saltation impact as a means for raising dust on Mars. Planetary and Space Science, 50, 151–155. https://doi.org/10.1016/S0032-0633(01)00127-1
Greeley, R., Arvidson, R. E., Barlett, P. W., Blaney, D., Cabrol, N. A., Christensen, P. R., et al. (2006). Gusev crater: Wind-related features and processes observed by the Mars Exploration Rover Spirit. Journal of Geophysical Research: Planets, 111(E2).
Greeley, R., Balme, M. R., Iversen, J. D., Metzger, S., Mickelson, R., Phoreman, J., & White, B. (2003). Martian dust devils: Laboratory sim-ulations of particle threshold. Journal of Geophysical Research, 108(E5). https://doi.org/10.1029/2002je001987
Greeley, R., Blumberg, D. G., McHone, J. F., Dobrovolskis, A., Iversen, J. D., Lancaster, N., et al. (1997). Applications of spaceborne radar lab-oratory data to the study of aeolian processes. Journal of Geophysical Research, 102(E5), 10971–10983. https://doi.org/10.1029/97je00518
Greeley, R., & Iversen, J. D. (1985). Wind as a geological process on Earth, Mars. Titan Cambridge University Press. https://doi.org/10.1017/cbo9780511573071
Greeley, R., Kuzmin, R. O., Rafkin, S. C. R., Michaels, T. I., & Haberle, R. (2003). Wind-related features in Gusev crater, Mars. Journal of Geophysical Research, 108(E12), 8077. https://doi.org/10.1029/2002JE002006
Greeley, R., Lacchia, M., White, B., Leach, R., Trilling, D., & Pollack, J. (1994). Dust on Mars: New values for wind threshold, In Paper presented at Lunar and Planetary Science Conference (Vol. 25, p. 467).
Greeley, R., Waller, D. A., Cabrol, N. A., Landis, G. A., Lemmon, M. T., Neakrase, L. D., & Whelley, P. L. (2010). Gusev crater, Mars: Obser-vations of three dust devil seasons. Journal of Geophysical Research, 115(E7). https://doi.org/10.1029/2010je003608
Greeley, R., Whelley, P. L., Arvidson, R. E., Cabrol, N. A., Foley, D. J., Franklin, B. J., & Thompson, S. D. (2006). Active dust dev-ils in Gusev crater, Mars: observations from the Mars exploration rover spirit. Journal of Geophysical Research, 111(E12). https://doi.org/10.1029/2006je002743
CHARALAMBOUS ET AL.
10.1029/2020JE006757
46 of 51
Journal of Geophysical Research: Planets
Greeley, R., Wilson, G., Coquilla, R., White, B., & Haberle, R. (2000). Windblown dust on Mars: Laboratory simulations of flux as a function of surface roughness. Planetary and Space Science, 48(12–14), 1349–1355. https://doi.org/10.1016/s0032-0633(00)00115-x
Grilliot, M., Walker, I., & Bauer, B. (2018). Airflow dynamics over a beach and foredune system with large woody debris. Geosciences, 8(5), 147. https://doi.org/10.3390/geosciences8050147
Guzewich, S. D., Lemmon, M., Smith, C. L., Martínez, G., Vicente-Retortillo, Á., Newman, C. E., et al. (2019). Mars Science Laboratory ob-servations of the 2018/Mars year 34 global dust storm. Geophysical Research Letters, 46(1), 71–79. https://doi.org/10.1029/2018gl080839
Haberle, R. M., Pollack, J. B., Barnes, J. R., Zurek, R. W., Leovy, C. B., Murphy, J. R., et al. (1993). Mars atmospheric dynamics as simulated by the NASA Ames general circulation model: 1. The zonal-mean circulation. Journal of Geophysical Research, 98(E2), 3093–3123. https://doi.org/10.1029/92je02946
Harrison, R. G., Barth, E., Esposito, F., Merrison, J., Montmessin, F., Aplin, K. L., et al. (2016). Applications of electrified dust and dust dev-il electrodynamics to Martian atmospheric electricity. Space Science Review, 203(1), 299–345. https://doi.org/10.1007/s11214-016-0241-8
Hébrard, E., Listowski, C., Coll, P., Marticorena, B., Bergametti, G., M¨a¨att¨anen, A., et al. (2012). An aerodynamic roughness length map derived from extended Martian rock abundance data. Journal of Geophysical Research, 117(E4), E04008. https://doi.org/10.1029/2011je003942
Hecht, M. H., McClean, J. B., Pike, W. T., Smith, P. H., Madsen, M. B., Rapp, D., & Team, M. (2017). MOXIE, ISRU, and the history of in situ studies of the hazards of dust in human exploration of Mars, In Dust in the atmosphere of Mars and its impact on human exploration (Vol. 1966).
Heet, T. L., Arvidson, R. E., Cull, S. C., Mellon, M. T., & Seelos, K. D. (2009). Geomorphic and geologic settings of the Phoenix Lander mission landing site. Journal of Geophysical Research, 114(E1). https://doi.org/10.1029/2009je003416
Hess, S. L., Henry, R. M., Leovy, C. B., Ryan, J. A., & Tillman, J. E. (1977). Meteorological results from the surface of Mars: Viking 1 and 2. Journal of Geophysical Research, 82, 4559–4574. https://doi.org/10.1029/js082i028p04559
Holland, D. E., Berglund, J. A., Spruce, J. P., & McKellip, R. D. (2008). Derivation of effective aerodynamic surface roughness in ur-ban areas from airborne Lidar terrain data. Journal of Applied Meteorology and Climatology, 47(10), 2614–2626. https://doi.org/10.1175/2008jamc1751.1
Holstein-Rathlou, C., Gunnlaugsson, H. P., Merrison, J. P., Bean, K. M., Cantor, B. A., Davis, J. A., et al. (2010). Winds at the Phoenix land-ing site. Journal of Geophysical Research, 115(12), E00E18. https://doi.org/10.1029/2009JE003411
Holstein-Rathlou, C., Merrison, J. P., Brædstrup, C. F., & Nørnberg, P. (2012). The effects of electric fields on wind driven particulate detachment. Icarus, 220(1), 1–5.
InSight Mars SEIS Data Service. (2019a). SEIS raw data, Insight Mission. IPGP, JPL, CNES, ETHZ, ICL, MPS, ISAE-Supaero, LPG, MFSC. https://doi.org/10.18715/SEIS.INSIGHT.XB_2016
Insight Mars SEIS Data Service. (2019b). InSight SEIS data Bundle. PDS Geosciences (GEO) node. https://doi.org/10.17189/1517570Irvine-Fynn, T. D. L., Sanz-Ablanedo, E., Rutter, N., Smith, M. W., & Chandler, J. H. (2014). Measuring glacier surface roughness using plot-
scale, close-range digital photogrammetry. Journal of Glaciology, 60(223), 957–969. https://doi.org/10.3189/2014jog14j032Iversen, J. D., Pollack, J. B., Greeley, R., & White, B. R. (1976). Saltation threshold on Mars: The effect of interparticle force, surface rough-
ness, and low atmospheric density. Icarus, 29(3), 381–393. https://doi.org/10.1016/0019-1035(76)90140-8Iversen, J. D., & White, B. R. (1982). Saltation threshold on Earth, Mars and Venus. Sedimentology, 29(1), 111–119. https://doi.
org/10.1111/j.1365-3091.1982.tb01713.xJackson, B. S., & Carroll, J. J. (1978). Aerodynamic roughness as a function of wind direction over asymmetric surface elements. Bounda-
ry-Layer Meteorology, 14(3), 323–330. https://doi.org/10.1007/bf00121042Jackson, T. L., & Farrell, W. M. (2006). Electrostatic fields in dust devils: An analog to Mars. IEEE Transactions on Geoscience and Remote
Sensing, 44, 2942–2949. https://doi.org/10.1109/tgrs.2006.875785Jerolmack, D. J., Mohrig, D., Grotzinger, J. P., Fike, D. A., & Watters, W. A. (2006). Spatial grain size sorting in eolian ripples and estimation
of wind conditions on planetary surfaces: Application to Meridiani Planum, Mars. Journal of Geophysical Research: Planets, 111(E12).Johnson, C. L., Mittelholz, A., Langlais, B., Russell, C. T., Ansan, V., Banfield, D., et al. (2020). Crustal and time-varying magnetic fields at
the InSight landing site on Mars. Nature Geoscience, 13(3), 199–204. https://doi.org/10.1038/s41561-020-0537-xJohnson, J. R., Christensen, P. R., & Lucey, P. G. (2002). Dust coatings on basaltic rocks and implications for thermal infrared spectroscopy
of Mars. Journal of Geophysical Research, 107(E6), 2–1. https://doi.org/10.1029/2000je001405Joy, S. P., & Russell, C. T. (2019). InSight IFG Magnetometer Mars calibrated data collection [data set]. Planetary Plasma Interactions Node.
Retrieved from https://doi.org/10.17189/1519202Kahanpää, H., & Viúdez-Moreiras, D. (2019). Wind and pressure measurements of dust devils by Mars Science Laboratory. EPSC.
EPSC-DPS2019.Kenda, B., Drilleau, M., Garcia, R. F., Kawamura, T., Murdoch, N., Compaire, N., et al. (2020). Subsurface structure at the InSight land-
ing site from compliance measurements by seismic and meteorological experiments. Journal of Geophysical Research: Planets, 125(6), e2020JE006387. https://doi.org/10.1029/2020je006387
Kim, H. S., Nabi, M., Kimura, I., & Shimizu, Y. (2014). Numerical investigation of local scour at two adjacent cylinders. Advances in Water Resources, 70, 131–147. https://doi.org/10.1016/j.advwatres.2014.04.018
Kok, J. F. (2010a). An improved parameterization of wind-blown sand flux on Mars that includes the effect of hysteresis. Geophysical Research Letters, 37(12). https://doi.org/10.1029/2010gl043646
Kok, J. F. (2010b). Difference in the wind speeds required for initiation versus continuation of sand transport on Mars: Implications for dunes and dust storms. Physical Review Letters, 104(7), 074502. https://doi.org/10.1103/physrevlett.104.074502
Kok, J. F., Mahowald, N. M., Fratini, G., Gillies, J. A., Ishizuka, M., Leys, J. F., et al. (2014). An improved dust emission model-Part 1: Model description and comparison against measurements. Atmospheric Chemistry and Physics, 14(23). https://doi.org/10.5194/acp-14-13023-2014
Kok, J. F., Parteli, E. J. R., Michaels, T. I., & Karam, D. B. (2012). The physics of wind-blown sand and dust. Reports on Progress in Physics, 75(10), 106901. https://doi.org/10.1088/0034-4885/75/10/106901
Kok, J. F., & Renno, N. O. (2006). Enhancement of the emission of mineral dust aerosols by electric forces. Geophysical Research Letters, 33(19). https://doi.org/10.1029/2006gl026284
Kok, J. F., & Renno, N. O. (2008). Electrostatics in wind-blown sand. Physical Review Letters, 100(1), 014501. https://doi.org/10.1103/physrevlett.100.014501
Kok, J. F., & Renno, N. O. (2009). Electrification of wind-blown sand on Mars and its implications for atmospheric chemistry. Geophysical research letters, 36(5). https://doi.org/10.1029/2008gl036691
CHARALAMBOUS ET AL.
10.1029/2020JE006757
47 of 51

Journal of Geophysical Research: Planets
Kruss, M., Musiolik, G., Demirci, T., Wurm, G., & Teiser, J. (2020). Wind erosion on Mars and other small terrestrial planets. Icarus, 337, 113438. https://doi.org/10.1016/j.icarus.2019.113438
Kurgansky, M. V., Baez, L., & Ovalle, E. M. (2007). A simple model of the magnetic emission from a dust devil. Journal of Geophysical Research, 112, E11008. https://doi.org/10.1029/2007je002952
Lancaster, N., Greeley, R., & Rasmussen, K. R. (1991). Interaction between unvegetated desert surfaces and the atmospheric boundary layer: A preliminary assessment In O.E. Barndorff-Nielsen, & B.B. Willetts (Eds.), Aeolian grain transport (pp. 89–102). Springer. https://doi.org/10.1007/978-3-7091-6703-8_7
Landis, G. A., Herkenhoff, K., Greeley, R., Thompson, S., & Whelley, P. (2006). Dust and sand deposition on the MER solar arrays as viewed by the microscopic imager. LPI.
Lapotre, M. G. A., Ewing, R. C., Lamb, M. P., Fischer, W. W., Grotzinger, J. P., Rubin, D. M., et al. (2016). Large wind ripples on mars: A record of atmospheric evolution. Science, 353(6294), 55–58. https://doi.org/10.1126/science.aaf3206
Lapotre, M. G. A., Ewing, R. C., Weitz, C. M., Lewis, K. W., Lamb, M. P., Ehlmann, B. L., & Rubin, D. M. (2018). Morphologic diversity of Mar-tian ripples: Implications for large-ripple formation. Geophysical Research Letters, 45(19), 10–229. https://doi.org/10.1029/2018GL079029
Lapotre, M. G. A., & Rampe, E. B. (2018). Curiosity's investigation of the Bagnold Dunes, Gale crater: Overview of the two-phase scientific campaign and introduction to the special collection. Geophysical Research Letters, 45(19), 10–200. https://doi.org/10.1029/2018gl079032
Lettau, H. (1969). Note on aerodynamic roughness-parameter estimation on the basis of roughness-element description. Journal of Ap-plied Meteorology, 8(5), 828–832. https://doi.org/10.1175/1520-0450(1969)008<0828:noarpe>2.0.co;2
Levine, J. S., Winterhalter, D., & Kerschmann, R. L. (2018). Dust in the atmosphere of Mars and its impact on human exploration. Cambridge Scholars Publishing.
Logie, M. (1981). Wind tunnel experiments on dune sands. Earth Surface Processes and Landforms, 6(3-4), 365–374. https://doi.org/10.1002/esp.3290060315
Lognonné, P., Banerdt, W. B., Giardini, D., Pike, W. T., Christensen, U., Laudet, P., et al. (2019). SEIS: Insight's seismic experiment for internal structure of Mars. Space Science Reviews, 215(1), 12. https://doi.org/10.1007/s11214-018-0574-6
Lognonné, P., Banerdt, W. B., Pike, W. T., Giardini, D., Christensen, U., Garcia, R. F., et al. (2020). Constraints on the shallow elastic and anelastic structure of Mars from InSight seismic data. Nature Geoscience, 13(3), 213–220. https://doi.org/10.1038/s41561-020-0536-y
Lorenz, R. D. (1996). Martian surface wind speeds described by the Weibull distribution. Journal of Spacecraft and Rockets, 33(5), 754–756. https://doi.org/10.2514/3.26833
Lorenz, R. D. (2016). Heuristic estimation of dust devil vortex parameters and trajectories from single-station meteorological observations: Application to InSight at Mars. Icarus, 271, 326–337. https://doi.org/10.1016/j.icarus.2016.02.001
Lorenz, R. D., Kedar, S., Murdoch, N., Lognonné, P., Kawamura, T., Mimoun, D., & Bruce Banerdt, W. (2015). Seismometer detection of dust devil vortices by ground tilt. Bulletin of the Seismological Society of America, 105(6), 3015–3023. https://doi.org/10.1785/0120150133
Lorenz, R. D., Lemmon, M. T., Maki, J., Banfield, D., Spiga, A., Charalambous, C., et al. (2020). Scientific observations with the InSight solar arrays: Dust, clouds, and eclipses on Mars. Earth and Space Science, 7, e2019EA000992. https://doi.org/10.1029/2019EA000992
Lorenz, R. D., & Reiss, D. (2015). Solar panel clearing events, dust devil tracks, and in-situ vortex detections on Mars. Icarus, 248, 162–164. https://doi.org/10.1016/j.icarus.2014.10.034
Lorenz, R. D., Spiga, A., Lognonné, P., Plasman, M., Newman, C. E., & Charalambous, C. (2020). The whirlwinds of Elysium: A catalog and meteorological characteristics of “dust devil” vortices observed by InSight on Mars. Icarus, 355, 114119. https://doi.org/10.1016/j.icarus.2020.114119
Luo, W., Dong, Z., Qian, G., & Lu, J. (2014). Near-wake flow patterns in the lee of adjacent obstacles and their implications for the for-mation of sand drifts: A wind tunnel simulation of the effects of gap spacing. Geomorphology, 213, 190–200. https://doi.org/10.1016/j.geomorph.2014.01.008
Madeleine, J. B., Forget, F., Millour, E., Montabone, L., & Wolff, M. J. (2011). Revisiting the radiative impact of dust on Mars using the LMD global climate model. Journal of Geophysical Research: Planets, 116(E11). https://doi.org/10.1029/2011je003855
Maki, J. N., Golombek, M., Deen, R., Abarca, H., Sorice, C., Goodsall, T., et al. (2018). The color cameras on the insight lander. Space Science Reviews, 214(6), 105. https://doi.org/10.1007/s11214-018-0536-z
Marshall, J. K. (1971). Drag measurements in roughness arrays of varying density and distribution. Agricultural Meteorology, 8, 269–292. https://doi.org/10.1016/0002-1571(71)90116-6
Marticorena, B., Kardous, M., Bergametti, G., Callot, Y., Chazette, P., Khatteli, H., et al. (2006). Surface and aerodynamic roughness in arid and semiarid areas and their relation to radar backscatter coefficient. Journal of Geophysical Research, 111(F3). https://doi.org/10.1029/2006jf000462
Martire, L., Garcia, R. F., Rolland, L., Spiga, A., Lognonné, P. H., Banfield, D., et al. (2020). Martian infrasound: Numerical modeling and analysis of InSight's data. Journal of Geophysical Research: Planets, 125(6), e2020JE006376. https://doi.org/10.1029/2020je006376
McEwen, A. S., Eliason, E. M., Bergstrom, J. W., Bridges, N. T., Hansen, C. J., Delamere, W. A., et al. (2007). Mars reconnaissance orbiter's High Resolution Imaging Science Experiment (HiRISE). Journal of Geophysical Research, 112(5), 1–40. https://doi.org/10.1029/2005JE002605
McKenna Neuman, C., & Bédard, O. (2015). A wind tunnel study of flow structure adjustment on deformable sand beds containing a surface-mounted obstacle. Journal of Geophysical Research: Earth Surface, 120(9), 1824–1840. https://doi.org/10.1002/2015jf003475
Merrison, J. P., Bertelsen, P., Frandsen, C., Gunnlaugsson, P., Knudsen, J. M., Lunt, S., et al. (2002). Simulation of the Martian dust aerosol at low wind speeds. Journal of Geophysical Research, 107(E12), 16-1.
Merrison, J. P., Gunnlaugsson, H. P., Hogg, M. R., Jensen, M., Lykke, J. M., et al. (2012). Factors affecting the electrification of wind-driven dust studied with laboratory simulations. Planetary and Space Science, 60(1), 328–335. https://doi.org/10.1016/j.pss.2011.10.008
Merrison, J. P., Gunnlaugsson, H. P., Nørnberg, P., Jensen, A. E., & Rasmussen, K. R. (2007). Determination of the wind induced de-tachment threshold for granular material on Mars using wind tunnel simulations. Icarus, 191(2), 568–580. https://doi.org/10.1016/j.icarus.2007.04.035
Metzger, S. M., Carr, J. R., Johnson, J. R., Parker, T. J., & Lemmon, M. T. (1999). Dust devil vortices seen by the Mars Pathfinder camera. Geophysical Research Letters, 26(18), 2781–2784. https://doi.org/10.1029/1999gl008341
Miles, E. S., Steiner, J. F., & Brun, F. (2017). Highly variable aerodynamic roughness length (z0) for a hummocky debris-covered glacier. Journal of Geophysical Research: Atmospheres, 122(16), 8447–8466. https://doi.org/10.1002/2017jd026510
Minitti, M. E., Kah, L. C., Yingst, R. A., Edgett, K. S., Anderson, R. C., Beegle, L. W., et al. (2013). MAHLI at the Rock-nest sand shadow: Science and science-enabling activities. Journal of Geophysical Research: Planets, 118(11), 2338–2360. https://doi.org/10.1002/2013je004426
Moore, H. J. (1985). The Martian dust storm of Sol 1742. Journal of Geophysical Research, 90(S01), 163–174. https://doi.org/10.1029 /jb090is01p00163
CHARALAMBOUS ET AL.
10.1029/2020JE006757
48 of 51
Journal of Geophysical Research: Planets
Moore, H. J., & Keller, J. M. (1990). Surface-material maps of the Viking landing sites on Mars (abstract), in Reports of Planetary Geology and Geophysics Progr. 1990, NASA Tech. Memo., TM4210, 533-535.
Moore, H. J., & Keller, J. M. (1991). Surface-material maps of Viking landing sites on Mars (pp. 160–162).Mora, L. (2019a). APSS PS data. Atmospheres Node. https://doi.org/10.17189/1518939Mora, L. (2019b). APSS TWINS data. Atmospheres Node. https://doi.org/10.17189/1518950Murdoch, N., Mimoun, D., Garcia, R. F., Rapin, W., Kawamura, T., Lognonné, P., et al. (2017). Evaluating the wind-induced mechanical
noise on the InSight seismometers. Space Science Reviews, 211(1–4), 429–455. https://doi.org/10.1007/s11214-016-0311-yMurdoch, N., Spiga, A., Lorenz, R. D., Garcia, R. F., Perrin, C., Widmer-Schnidrig, R., et al. (2020). Constraining Martian regolith parame-
ters and vortex trajectories from combined seismic and meteorological measurements, Journal of Geophysical Research: Planets. 126(2), e2020JE006410.
Murphy, J., Steakley, K., Balme, M., Deprez, G., Esposito, F., Kahanpää, H., et al. (2016). Field measurements of terrestrial and Martian dust devils. Space Science Reviews, 203(1–4), 39–87. https://doi.org/10.1007/s11214-016-0283-y
Musiolik, G., Kruss, M., Demirci, T., Schrinski, B., Teiser, J., Daerden, F., et al. (2018). Saltation under Martian gravity and its influence on the global dust distribution. Icarus, 306, 25–31. https://doi.org/10.1016/j.icarus.2018.01.007
Neakrase, L. D. V., Balme, M. R., Esposito, F., Kelling, T., Klose, M., Kok, J. F., et al. (2016). Particle lifting processes in dust devils. Space Science Reviews, 203(1), 347–376. https://doi.org/10.1007/s11214-016-0296-6
Neakrase, L. D. V., & Greeley, R. (2010). Dust devils in the laboratory: Effect of surface roughness on vortex dynamics. Journal of Geophys-ical Research, 115(E5). https://doi.org/10.1029/2009je003465
Neakrase, L. D. V., Greeley, R., Iversen, J. D., Balme, M. R., & Eddlemon, E. E. (2006). Dust flux within dust devils: Preliminary laboratory simulations. Geophysical Research Letters, 33(19). https://doi.org/10.1029/2006gl026810
Newman, C. E., Gómez-Elvira, J., Marin, M., Navarro, S., Torres, J., Richardson, M. I., et al. (2017). Winds measured by the rover environ-mental monitoring station (REMS) during the mars science laboratory (MSL) rover's Bagnold Dunes campaign and comparison with numerical modeling using MarsWRF. Icarus, 291, 203–231. https://doi.org/10.1016/j.icarus.2016.12.016
Newman, C. E., Kahanpää, H., Richardson, M. I., Martínez, G. M., Vicente-Retortillo, A., & Lemmon, M. T. (2019). MarsWRF Convective vortex and dust devil predictions for Gale crater over 3 Mars years and comparison with MSL-REMS observations. Journal of Geophysi-cal Research: Planets, 124, 3442–3468. https://doi.org/10.1029/2019JE006082
Newman, C. E., Lewis, S. R., Read, P. L., & Forget, F. (2002). Modeling the Martian dust cycle, 1. Representations of dust transport process-es. Journal of Geophysical Research, 107(E12), 6–1. https://doi.org/10.1029/2002JE001910
Nickling, W. G., & Neuman, C. M. (1995). Development of deflation lag surfaces. Sedimentology, 42(3), 403–414. https://doi.org/10.1111/j.1365-3091.1995.tb00381.x
Nield, J. M., Chiverrell, R. C., Darby, S. E., Leyland, J., Vircavs, L. H., & Jacobs, B. (2013). Complex spatial feedbacks of tephra redistri-bution, ice melt and surface roughness modulate ablation on tephra covered glaciers. Earth Surface Processes and Landforms, 38(1), 95–102. https://doi.org/10.1002/esp.3352
Okin, G. S. (2008). A new model of wind erosion in the presence of vegetation. Journal of Geophysical Research, 113(F2). https://doi.org/10.1029/2007jf000758
Owen, P. R. (1964). Saltation of uniform grains in air. Journal of Fluid Mechanics, 20(2), 225–242. https://doi.org/10.1017/s0022112064001173Pähtz, T., Clark, A. H., Valyrakis, M., & Durán, O. (2020). The physics of sediment transport initiation, cessation, and entrainment across
aeolian and fluvial environments. Reviews of Geophysics, 58(1), e2019RG000679. https://doi.org/10.1029/2019rg000679Pähtz, T., Kok, J. F., & Herrmann, H. J. (2012). The apparent roughness of a sand surface blown by wind from an analytical model of salta-
tion. New Journal of Physics, 14(4), 043035. https://doi.org/10.1088/1367-2630/14/4/043035Pattenden, R. J., Turnock, S. R., & Zhang, X. (2005). Measurements of the flow over a low-aspect-ratio cylinder mounted on a ground plane.
Experiments in Fluids, 39(1), 10–21. https://doi.org/10.1007/s00348-005-0949-9Perrin, C., Rodriguez, S., Jacob, A., Lucas, A., Spiga, A., Murdoch, N., et al. (2020). Monitoring of dust-devil tracks around the InSight
landing site, Mars, and comparison with in-situ atmospheric data. Geophysical Research Letters. 47(10), e2020GL087234.Pike, W. T., Staufer, U., Hecht, M. H., Goetz, W., Parrat, D., Sykulska-Lawrence, H., et al. (2011). Quantification of the dry history of the
Martian soil inferred from in situ microscopy. Geophysical Research Letters, 38(24). https://doi.org/10.1029/2011gl049896Prandtl, L., & Tietjens, O. G. (1934). Applied hydro- and aeromechanics. Dover Publications, Inc.Rasmussen, K. R., Iversen, J. D., & Rautahemio, P. (1996). Saltation and wind-flow interaction in a variable slope wind tunnel. Geomorphol-
ogy, 17(1–3), 19–28. https://doi.org/10.1016/0169-555x(95)00090-rRasmussen, K. R., Kok, J. F., & Merrison, J. P. (2009). Enhancement in wind-driven sand transport by electric fields. Planetary and Space
Science, 57(7), 804–808. https://doi.org/10.1016/j.pss.2009.03.001Rasmussen, K. R., Valance, A., & Merrison, J. (2015). Laboratory studies of aeolian sediment transport processes on planetary surfaces.
Geomorphology, 244, 74–94. https://doi.org/10.1016/j.geomorph.2015.03.041Raupach, M. R. (1992). Drag and drag partition on rough surfaces. Boundary-Layer Meteorology, 60(4), 375–395. https://doi.org/10.1007/
bf00155203Reiss, D., Fenton, L., Neakrase, L., Zimmerman, M., Statella, T., Whelley, P., et al. (2016). Dust devil tracks. Space Science Reviews, 203(1–4),
143–181. https://doi.org/10.1007/s11214-016-0308-6Reiss, D., & Lorenz, R. D. (2016). Dust devil track survey at Elysium Planitia, Mars: Implications for the InSight landing sites. Icarus, 266,
315–330. https://doi.org/10.1016/j.icarus.2015.11.012Renno, N. O., Halleaux, D., Elliott, H., & Kok, J. F. (2013). The lifting of aerosols and their effects on atmospheric dynamics In S. J. Mack-
well, et al. (Eds.), Comparative Climatology of Terrestrial Planets (pp. 355–365). Tucson: University of Arizona. https://doi.org/10.2458/asu_uapress_9780816530595-ch14
Renno, N. O., & Kok, J. F. (2008). Electrical activity and dust lifting on Earth, Mars, and beyond. Planetary Atmospheric Electricity, 137, 419–434. https://doi.org/10.1007/978-0-387-87664-1_26
Richardson, M. I., & Wilson, R. J. (2002). A topographically forced asymmetry in the Martian circulation and climate. Nature, 416(6878), 298–301. https://doi.org/10.1038/416298a
Rimai, D. S., Demejo, L. P., & Bowen, R. C. (1994). Mechanics of particle adhesion. Journal of Adhesion Science and Technology, 8(11), 1333–1355. https://doi.org/10.1163/156856194x00645
Ringrose, T. J., Towner, M. C., & Zarnecki, J. C. (2003). Convective vortices on Mars: A reanalysis of Viking Lander 2 meteorological data, Sols 1–60. Icarus, 163(1), 78–87. https://doi.org/10.1016/s0019-1035(03)00073-3
Rounce, D. R., Quincey, D. J., & McKinney, D. C. (2015). Debris-covered glacier energy balance model for Imja-Lhotse Shar Glacier in the Everest region of Nepal. The Cryosphere, 9(6), 2295–2310. https://doi.org/10.5194/tc-9-2295-2015
CHARALAMBOUS ET AL.
10.1029/2020JE006757
49 of 51
Journal of Geophysical Research: Planets
Ryan, J. A., & Henry, R. M. (1979). Mars atmospheric phenomena during major dust storms, as measured at surface. Journal of Geophysical Research, 84(B6), 2821–2829. https://doi.org/10.1029/jb084ib06p02821
Ryan, J. A., & Lucich, R. D. (1983). Possible dust devils, vortices on Mars. Journal of Geophysical Research, 88(C15), 11005–11011. https://doi.org/10.1029/jc088ic15p11005
Schofield, J. T., Barnes, J. R., Crisp, D., Haberle, R. M., Larsen, S., Magalhães, J. A., et al. (1997). The Mars Pathfinder Atmospheric Struc-ture Investigation/Meteorology (ASI/MET) experiment. Science, 278, 1752–1758. https://doi.org/10.1126/science.278.5344.1752
Shao, Y., & Lu, H. (2000). A simple expression for wind erosion threshold friction velocity. Journal of Geophysical Research, 105(D17), 22437–22443. https://doi.org/10.1029/2000jd900304
Sherman, D. J. (1992). An equilibrium relationship for shear velocity and apparent roughness length in aeolian saltation. Geomorphology, 5(3–5), 419–431. https://doi.org/10.1016/0169-555x(92)90016-h
Silvestro, S., Fenton, L. K., Vaz, D. A., Bridges, N. T., & Ori, G. G. (2010). Ripple migration and dune activity on Mars: Evidence for dynamic wind processes. Geophysical Research Letters, 37(20). https://doi.org/10.1029/2010gl044743
Silvestro, S., Vaz, D. A., Ewing, R. C., Rossi, A. P., Fenton, L. K., Michaels, T. I., et al. (2013). Pervasive aeolian activity along rover Curiosi-ty's traverse in Gale Crater, Mars. Geology, 41(4), 483–486. https://doi.org/10.1130/g34162.1
Spiga, A., Banfield, D., Teanby, N. A., Forget, F., Lucas, A., Kenda, B., et al. (2018). Atmospheric science with InSight. Space Science Reviews, 214(7), 109. https://doi.org/10.1007/s11214-018-0543-0
Spiga, A., Barth, E., Gu, Z., Hoffmann, F., Ito, J., Jemmett-Smith, B., et al. (2016). Large-eddy simulations of dust devils and convective vortices. Space Science Reviews, 203(1–4), 245–275. https://doi.org/10.1007/s11214-016-0284-x
Spiga, A., & Lewis, S. R. (2010). Martian mesoscale and microscale wind variability of relevance for dust lifting. Mars, 5, 146–158. https://doi.org/10.1555/mars.2010.0006
Spiga, A., Murdoch, N., Lorenz, R., Forget, F., Newman, C., Rodriguez, S., et al. (2020). A study of daytime convective vortices and turbu-lence in the Martian Planetary Boundary Layer based on half-a-year of InSight atmospheric measurements and large-eddy simulations. Journal of Geophysical Research: Planets, 126(1), e2020JE006511.
Stutzmann, E., Schimmel, M., Lognonné, P. H., Horleston, A. C., Ceylan, S., van Driel, M., et al. (2020). Polarized ambient noise on Mars. Earth and Space Science, 836, 41. https://doi.org/10.1002/essoar.10503376.1
Sullivan, R., Arvidson, R., Bell, III, J. F., Gellert, R., Golombek, M., Greeley, R., et al. (2008). Wind-driven particle mobility on Mars: In-sights from Mars Exploration Rover observations at “El Dorado” and surroundings at Gusev Crater. Journal of Geophysical Research: Planets, 113(E6). https://doi.org/10.1029/2008JE003101
Sullivan, R., Banfield, D., Bell, J. F., Calvin, W., Fike, D., Golombek, M., et al. (2005). Aeolian processes at the Mars exploration rover Me-ridiani Planum landing site. Nature, 436(7047), 58–61.
Sullivan, R., Greeley, R., Kraft, M., Wilson, G., Golombek, M., Herkenhoff, K., et al. (2000). Results of the Imager for Mars Pathfinder windsock experiment. Journal of Geophysical Research: Planets, 105(E10), 24547–24562.
Sullivan, R., & Kok, J. F. (2017). Aeolian saltation on Mars at low wind speeds. Journal of Geophysical Research, 122(10), 2111–2143. https://doi.org/10.1002/2017je005275
Sutton, J. L., Leovy, C. B., & Tillman, J. E. (1978). Diurnal variations of the Martian surface layer meteorological parame-ters during the first 45 sols at two Viking lander sites. Journal of the Atmospheric Sciences, 35, 2346–2355. https://doi.org/10.1175/1520-0469(1978)035<2346:dvotms>2.0.co;2
Sutton, S. L. F., & Neuman, C. M. (2008). Variation in bed level shear stress on surfaces sheltered by nonerodible roughness elements. Journal of Geophysical Research, 113(F3). https://doi.org/10.1029/2007jf000967
Sutton, S. L., & McKenna-Neuman, C. M. (2008). Sediment entrainment to the lee of roughness elements: Effects of vortical structures. Journal of Geophysical Research, 113(F2). https://doi.org/10.1029/2007jf000783
Swann, C., Sherman, D. J., & Ewing, R. C. (2020). Experimentally derived thresholds for windblown sand on Mars. Geophysical Research Letters, 47(3), e2019GL084484. https://doi.org/10.1029/2019gl084484
Sweeney, J., Warner, N. H., Ganti, V., Golombek, M. P., Lamb, M. P., Fergason, R., & Kirk, R. (2018). Degradation of 100-m-scale rocky ejec-ta craters at the InSight landing site on Mars and implications for surface processes and erosion rates in the Hesperian and Amazonian. Journal of Geophysical Research, 123(10), 2732–2759. https://doi.org/10.1029/2018je005618
Tratt, D. M., Hecht, M. H., Catling, D. C., Samulon, E. C., & Smith, P. H. (2003). In situ measurement of dust devil dynamics: Toward a strategy for Mars. Journal of Geophysical Research, 108(E11). https://doi.org/10.1029/2003je002161
Vicente-Retortillo, Á., Martínez, G. M., Renno, N., Newman, C. E., Ordonez-Etxeberria, I., Lemmon, M. T., et al. (2018). Seasonal deposition and lifting of dust on Mars as observed by the Curiosity rover. Scientific reports, 8(1), 1–8. https://doi.org/10.1038/s41598-018-35946-8
Viúdez-Moreiras, D., Gómez-Elvira, J., Newman, C. E., Navarro, S., Marin, M., Torres, J., & de la Torre-Juárez, M. (2019a). Gale surface wind characterization based on the Mars science laboratory REMS dataset. Part I: Wind retrieval and Gale's wind speeds and directions. Icarus, 319, 909–925. https://doi.org/10.1016/j.icarus.2018.10.011
Viúdez-Moreiras, D., Gómez-Elvira, J., Newman, C. E., Navarro, S., Marin, M., Torres, J., & de la Torre-Juárez, M. (2019b). Gale surface wind characterization based on the Mars Science Laboratory REMS dataset. Part II: Wind probability distributions. Icarus, 319, 645–656. https://doi.org/10.1016/j.icarus.2018.10.010
Viúdez-Moreiras, D., Newman, C. E., Forget, F., Lemmon, M., Banfield, D., Spiga, A., et al. (2020). Effects of a large dust storm in the near-surface atmosphere as measured by InSight in Elysium Planitia, Mars. Comparison with contemporaneous measurements by Mars Science Laboratory. Journal of Geophysical Research: Planets, 125(9), e2020JE006493. https://doi.org/10.1029/2020JE006493
Warner, N. H., Grant, J. A., Wilson, S. A., Golombek, M. P., DeMott, A., Charalambous, C., et al. (2020). An impact crater origin for the InSight landing site at Homestead hollow, Mars: Implications for near surface stratigraphy, surface processes, and erosion rates. Journal of Geophysical Research: Planets, 125(4), e2019JE006333. https://doi.org/10.1029/2019je006333
Weitz, C. M., Anderson, R. C., Bell, J. F., Farrand, W. H., Herkenhoff, K. E., Johnson, J. R., et al. (2006). Soil grain analyses at Meridiani Planum, Mars. Journal of Geophysical Research, 111(E12). https://doi.org/10.1029/2005je002541
Weitz, C. M., Grant, J. A., Golombek, M. P., Warner, N. H., Hauber, E., Ansan, V., et al. (2020). Comparison of InSight Homestead hollow to hollows at the Spirit landing site. Journal of Geophysical Research: Planets, 125(7), e2020JE006435. https://doi.org/10.1029/2020je006435
Weitz, C. M., Sullivan, R. J., Lapotre, M. G. A., Rowland, S. K., Grant, J. A., Baker, M., & Yingst, R. A. (2018). Sand grain sizes and shapes in eolian bedforms at Gale Crater, Mars. Geophysical Research Letters, 45(18), 9471–9479. https://doi.org/10.1029/2018gl078972
Whelley, P. L., & Greeley, R. (2006). Latitudinal dependency in dust devil activity on Mars. Journal of Geophysical Research, 111(E10).Whelley, P. L., & Greeley, R. (2008). The distribution of dust devil activity on Mars. Journal of Geophysical Research, 113(E7).White, B. R., Greeley, R., Iversen, J. D., & Pollack, J. B. (1976). Estimated grain saltation in a Martian atmosphere. Journal of Geophysical
Research, 81(32), 5643–5650. https://doi.org/10.1029/jb081i032p05643
CHARALAMBOUS ET AL.
10.1029/2020JE006757
50 of 51
Journal of Geophysical Research: Planets
White, B. R., Lacchia, B. M., Greeley, R., & Leach, R. N. (1997). Aeolian behavior of dust in a simulated Martian environment. Journal of Geophysical Research, 102(E11), 25629–25640. https://doi.org/10.1029/97je01753
Wurm, G., Teiser, J., & Reiss, D. (2008). Greenhouse and thermophoretic effects in dust layers: The missing link for lifting of dust on Mars. Geophysical Research Letters, 35(10). https://doi.org/10.1029/2008gl033799
Yager, E. M., Schmeeckle, M. W., & Badoux, A. (2018). Resistance is not futile: Grain resistance controls on observed critical Shields stress variations. Journal of Geophysical Research: Earth Surface, 123(12), 3308–3322. https://doi.org/10.1029/2018JF004817
Yang, Y., & Shao, Y. (2005). Drag partition and its possible implications for dust emission. Water, Air, and Soil Pollution: Focus, 5(3–6), 251–259. https://doi.org/10.1007/s11267-005-0742-z
Yingst, R. A., Bray, S., Herkenhoff, K., Lemmon, M., Minitti, M. E., Schmidt, M. E., et al. (2020). Dust cover on Curiosity's Mars Hand Lens Imager (MAHLI) calibration target: Implications for deposition and removal mechanisms. Icarus, 351, 113872. https://doi.org/10.1016/j.icarus.2020.113872
Zhu, W., Huo, X., Zhang, J., Wang, P., Pähtz, T., Huang, N., & He, Z. (2019). Large effects of particle size heterogeneity on dynamic saltation threshold. Journal ofGeophysical Research: Earth Surface, 124(8), 2311–2321. https://doi.org/10.1029/2019jf005094
CHARALAMBOUS ET AL.
10.1029/2020JE006757
51 of 51