Molecular-level transformation of dissolved organic matter ...
28
1 1 Molecular-level transformation of dissolved organic 2 matter during oxidation by ozone and hydroxyl radical 3 Christina K. Remucal 1,2 *, Elisabeth Salhi 3 , Nicolas Walpen 3 , and Urs von Gunten 3,4 4 5 1 Environmental Chemistry and Technology Program 6 University of Wisconsin-Madison 7 Madison, Wisconsin 53706 8 2 Department of Civil and Environmental Engineering 9 University of Wisconsin-Madison 10 Madison, Wisconsin 53706 11 3 Swiss Federal Institute of Aquatic Science and Technology (Eawag) 12 8600 Dübendorf, Switzerland 13 4 School of Architecture, Civil and Environmental Engineering (ENAC), École Polytechnique 14 Fédérale de Lausanne (EPFL), 1015 Lausanne, Switzerland 15 16 17 18 19 20 21 * Corresponding author address: 660 N. Park St., Madison, WI 53706; e-mail: [email protected]; 22 telephone: (608) 262-1820; fax: (608) 262-0454; Twitter: @remucal. 23 24 Page 1 of 28 ACS Paragon Plus Environment Environmental Science & Technology This document is the accepted manuscript version of the following article: Remucal, C. K., Salhi, E., Walpen, N., & von Gunten, U. (2020). Molecular-level transformation of dissolved organic matter during oxidation by ozone and hydroxyl radical. Environmental Science and Technology, 54(16), 10351-10360. https://doi.org/10.1021/acs.est.0c03052
-
Upload
khangminh22 -
Category
Documents
-
view
1 -
download
0
Transcript of Molecular-level transformation of dissolved organic matter ...

1
1
Molecular-level transformation of dissolved organic 2
matter during oxidation by ozone and hydroxyl radical 3
Christina K. Remucal1,2*, Elisabeth Salhi3, Nicolas Walpen3, and Urs von Gunten3,4 4
5
1Environmental Chemistry and Technology Program 6
University of Wisconsin-Madison 7
Madison, Wisconsin 53706 8
2Department of Civil and Environmental Engineering 9
University of Wisconsin-Madison 10
Madison, Wisconsin 53706 11
3Swiss Federal Institute of Aquatic Science and Technology (Eawag) 12
8600 Dübendorf, Switzerland 13
4School of Architecture, Civil and Environmental Engineering (ENAC), École Polytechnique 14
Fédérale de Lausanne (EPFL), 1015 Lausanne, Switzerland 15
16
17 18 19 20 21
* Corresponding author address: 660 N. Park St., Madison, WI 53706; e-mail: [email protected];22
telephone: (608) 262-1820; fax: (608) 262-0454; Twitter: @remucal. 23
24
Page 1 of 28
ACS Paragon Plus Environment
Environmental Science & Technology
This document is the accepted manuscript version of the following article: Remucal, C. K., Salhi, E., Walpen, N., & von Gunten, U. (2020). Molecular-level transformation of dissolved organic matter during oxidation by ozone and hydroxyl radical. Environmental Science and Technology, 54(16), 10351-10360. https://doi.org/10.1021/acs.est.0c03052

2
TOC Art 25
26
27
0
1
2
0 0.5 10
1
2
0 0.5 1
H:C
O:C
Dissolved Organic Matter (DOM)
H:C
O:C
more aromatic
more saturated
+ O3 and •OH + •OH
reac
tive
DOM
form
ulas
Page 2 of 28
ACS Paragon Plus Environment
Environmental Science & Technology

3
Abstract 28
Ozonation of drinking and wastewater relies on ozone (O3) and hydroxyl radical (•OH) as 29
oxidants. Both oxidants react with dissolved organic matter (DOM) and alter its composition, but 30
the selectivity of the two oxidants and mechanisms of reactivity with DOM moieties are largely 31
unknown. The reactions of O3 and •OH with two DOM isolates were studied by varying specific 32
ozone doses (0.1 – 1.3 mg-O3/mg-C) at pH 7. Additionally, conditions that favor O3 (i.e., addition 33
of an •OH scavenger) or •OH (i.e., pH 11) were investigated. Ozonation decreases aromaticity, 34
apparent molecular weight, and electron donating capacity (EDC) of DOM, with large changes 35
observed when O3 is the main oxidant (e.g., EDC decreases 63 – 77% for 1.3 mg-O3/mg-C). Both 36
O3 and •OH react with highly aromatic, reduced formulas detected using high-resolution mass 37
spectrometry (O:C = 0.48 ± 0.12; H:C = 1.06 ± 0.23), while •OH also oxidizes more saturated 38
formulas (H:C = 1.64 ± 0.26). Established reactions between model compounds and O3 (e.g., 39
addition of 1-2 oxygen atoms) or •OH (e.g., addition of one oxygen atom and decarboxylation) are 40
observed and produce highly oxidized DOM (O:C > 1.0). This study provides molecular-level 41
evidence for the selectivity of O3 as an oxidant within DOM. 42
43
Page 3 of 28
ACS Paragon Plus Environment
Environmental Science & Technology

4
Introduction 44
Ozone (O3) is applied during drinking and wastewater treatment for disinfection and organic 45
contaminant oxidation.1-4 O3 is highly selective and reacts mainly with olefins, activated aromatic 46
systems, and neutral amines with second-order rate constants that range 10 orders of magnitude.5 47
Additionally, hydroxyl radical (•OH) is produced through reactions of O3 with inorganic and 48
organic compounds (e.g., phenols), often leading to radical chain decomposition reactions.6, 7 •OH 49
is a less selective oxidant and reacts with most water constituents with nearly diffusion-controlled 50
second order rate constants.5 51
The fate of dissolved organic matter (DOM) during ozonation has implications for the 52
efficacy of ozonation and for water quality. DOM scavenges O3 and •OH, reducing the lifetime of 53
both oxidants and limiting the extent of disinfection and target compound oxidation.8 DOM 54
reactivity depends on both its concentration and composition.9-11 Ozonation of DOM results in 55
limited mineralization of dissolved organic carbon (DOC),12-18 but can dramatically alter DOM 56
composition. For example, ozonation changes DOM photoreactivity19-21 and produces highly 57
bioavailable assimilable organic carbon (AOC).22-25 Low molecular weight organic by-products 58
associated with AOC include carboxylic acids, aldehydes, and ketones (Supporting Information 59
Figure S1).24-30 However, identified ozonation-induced transformation products account for a 60
fraction of the oxidized DOM23, 29 and do not include polar, non-volatile compounds that are not 61
amenable to gas chromatography.2 62
DOM analysis using bulk measurements provides insight into how ozonation alters DOM 63
composition. Spectroscopic measurements of DOM after reaction with ozone consistently show 64
decreases in fluorescence12, 13, 31 and specific UV absorbance.12, 13, 16-18, 21 Decreasing molecular 65
weight is reported by size exclusion chromatography (SEC) coupled with organic carbon 66
Page 4 of 28
ACS Paragon Plus Environment
Environmental Science & Technology

5
detection13, 32 and by sequential ultrafiltration,14 while XAD fractionation shows a shift from 67
hydrophobic to polar hydrophilic material.12-14, 29, 33 Finally, electron donating capacity (EDC) of 68
DOM decreases after oxidation, with large changes observed at low specific ozone doses.31, 34, 35 69
EDC is an operationally-defined measurement of phenolic moieties in DOM that show antioxidant 70
properties.36-38 Phenols are highly reactive with ozone,25, 28, 39 suggesting that these moieties are 71
important targets for O3 oxidation. 72
High-resolution mass spectrometry provides molecular-level insight into DOM 73
transformation. This semi-quantitative technique has been used to assess DOM reactivity during 74
other drinking and wastewater treatment processes,40-44 but has only been applied to ozonated DOM 75
in a few cases. The most mechanistic study analyzes a high [DOC] sample by QTOF-MS, revealing 76
shifts from reduced formulas to highly oxidized formulas and providing evidence of 77
decarboxylation.15 Compared to biological activated carbon treatment and chlorination, ozonation 78
results in large changes in DOM composition as observed using Orbitrap and FT-ICR MS, such as 79
formation of saturated, oxidized formulas16-18 and polar carbonyl species.45 Thus, high-resolution 80
mass spectrometry shows promise for investigating changes in DOM and specific reaction 81
mechanisms, but it has not been applied to study the impact of ozone dose on DOM or to distinguish 82
between reactions of O3 and •OH. 83
The aim of this study is to test the hypotheses that phenolic moieties within DOM are 84
susceptible to oxidation by O3 and that •OH also reacts less selectively with other formulas. We 85
compare the impact of the oxidants on two DOM isolates by using an •OH-scavenger to isolate the 86
direct impact of O3 and by conducting experiments at elevated pH that favor •OH. Since bulk-level 87
studies show that large changes are observed at low ozone doses, we vary the specific ozone dose 88
to investigate the dose needed to result in molecular-level changes in DOM. Mass spectrometry 89
Page 5 of 28
ACS Paragon Plus Environment
Environmental Science & Technology

6
analysis is combined with UV-vis spectroscopy and EDC measurements, which are shown to be 90
highly complementary. This study provides molecular-level insight into the reactions of O3 and 91
•OH with DOM. 92
Materials and Methods 93
Materials. Suwannee River natural organic matter (SRNOM; 2R101N) and Upper 94
Mississippi River natural organic matter (UMRNOM; 1R110N) isolates were obtained from the 95
International Humic Substances Society (Denver, CO). We used DOM isolates to avoid solid phase 96
extraction (SPE), which is used to remove inorganic ions that lead to ion suppression. SPE 97
recoveries of DOM are low (30 – 60%),16 with poor retention of low molecular weight compounds 98
that we hypothesize are generated during ozonation. SRNOM and UMRNOM represent DOM that 99
is more terrestrial and more microbially-derived, respectively.46 Details on other materials are 100
available in Section S1. 101
Ozone Exposure Experiments. DOM stock solutions (40 mg-C/L DOM, 3 mM NaHCO3) 102
were sparged with 2% CO2 in air for ~30 minutes to achieve a pH of 7.0, which was verified using 103
a Metrohm 632 pH meter. The solutions were adjusted with appropriate volumes of an ozone stock 104
solution, ultrapure water, and tertiary-butanol (t-BuOH), as discussed below. This approach 105
maintained a pH of 7.00 ± 0.14 over the 20-hour experiment. Bicarbonate was selected because 106
other inorganic buffers (e.g., phosphate) cause ion suppression during electrospray ionization, 107
whereas organic buffers react much more rapidly with •OH and interfere with DOC analysis. DOM 108
reaction with carbonate radical anion is negligible compared to •OH under the experimental 109
conditions (Section S2). 110
DOM solutions (20 mg-C/L) were ozonated in triplicate in 16-mL glass vials with no 111
headspace in the absence and presence of t-BuOH (50 mM) as an •OH scavenger. The ozone stock 112
Page 6 of 28
ACS Paragon Plus Environment
Environmental Science & Technology

7
solution was added under vigorous mixing (15 sec) to yield specific ozone doses of 0, 0.1, 0.2, 0.5, 113
0.75, and 1.3 mg-O3/mg-C. The vials were sealed and stored in the dark at room temperature for 114
20 hours, resulting in complete ozone consumption. Mass spectrometry analyses were conducted 115
within 8 hours. 116
Additional experiments with 0 and 0.5 mg-O3/mg-C were conducted using 20 mg-C/L 117
SRNOM in unbuffered ultrapure water adjusted to pH 11 using NaOH. This pH results in rapid 118
decomposition of ozone (t1/2 ~9 seconds), yielding •OH.5, 47 The final pH after the 20-hour 119
experiment was 10.5 ± 0.2. 120
Bulk measurements. DOC concentrations were measured in samples without t-BuOH 121
using a Shimadzu TOC-L CSH total organic carbon analyzer. Absorbance of all samples was 122
measured using a Cary 100 UV-vis spectrophotometer. SUVA254 is calculated by dividing the 123
absorbance at 254 nm by [DOC]48 and E2:E3 is the ratio of absorbance at 250 nm to absorbance at 124
365 nm.49 EDC was measured photometrically as described previously50 (Section S4). Previous 125
studies demonstrate that t-BuOH does not interfere with UV-vis or EDC measurements.19, 34 Bulk 126
measurements were performed in triplicate experimental replicates. 127
Orbitrap Mass Spectrometry. DOM samples were diluted 40:60 with acetonitrile and 128
injected into a QExactive Plus mass spectrometer (Thermo Fisher Scientific) using negative mode 129
electrospray ionization. Data processing was performed in R as described previously and 130
considered C1-8013C0-1H1-140O0-80N0-1S0-1 formulas (<0.5 ppm error).51-55 Bray-Curtis dissimilarity 131
analysis considered the presence and absence of formulas.53-55 Principal components analysis 132
(PCA) relied on the relative intensity of all identified formulas. Weighted averages of elemental 133
ratios (H:Cw and O:Cw), double bond equivalents (DBEw), and molecular weight (MWw) were 134
calculated using the relative intensity of each formula within a sample.43, 55 Relative intensities of 135
Page 7 of 28
ACS Paragon Plus Environment
Environmental Science & Technology

8
common formulas were related to ozone doses using Spearman rank correlations.53 Details on 136
instrumental settings and calculations are provided in Section S5. 137
138
Results and Discussion 139
Bulk changes in DOM composition. Ozonation experiments were conducted in the 140
presence of an •OH scavenger to investigate the expected preferential reactions of O3 with phenolic 141
moieties within DOM. While these reactions occur at individual DOM moieties, changes in bulk 142
DOM properties such as UV absorption or EDC provide insight into the relative reactivity of O3 143
and •OH and are complementary to high-resolution mass spectrometry. Furthermore, analyses of 144
bulk properties enable comparison with existing literature. The agreement in bulk analyses across 145
studies suggests that the molecular-level changes discussed below may be widely applicable. 146
Upon ozonation, similar changes in UV-vis absorption properties are observed for 147
Suwannee River NOM and Upper Mississippi River NOM. SRNOM is lower in E2:E3 than 148
UMRNOM (i.e., 4.69 vs. 5.22, respectively; Table S3) and higher in SUVA254 (i.e., 3.34 vs. 2.92 149
L mg-C-1 m-1, respectively). Because E2:E3 is inversely correlated with molecular weight49, 54 and 150
SUVA254 correlates with aromaticity,48 this indicates that SRNOM has higher molecular weight 151
and aromaticity. The higher measured EDC of SRNOM compared to UMRNOM (i.e., 3.29 vs. 2.47 152
mmole-/g-C; Table S3) indicates that SRNOM contains more phenolic groups, in agreement with 153
titrated phenol content46 and flow-injection EDC measurements37 of these isolates. 154
DOM can react with both O3 and •OH during ozonation at circumneutral pH in the absence 155
of t-BuOH.1 Under these conditions, [DOC] decreases by up to 13% for SRNOM and 9% for 156
UMRNOM (Figure S3; Table S3). Limited mineralization of DOM by ozone13-18 or by •OH in 157
advanced oxidation processes (AOPs)56, 57 is well demonstrated. 158
Page 8 of 28
ACS Paragon Plus Environment
Environmental Science & Technology

9
However, changes in UV-vis spectra reveal that the DOM composition is altered. Relative 159
and absolute A254 decreases and E2:E3 increases with increasing specific ozone dose at pH 7 160
(Figures 1 and S4, respectively), with similar relative changes observed for both NOM isolates. 161
The increase in E2:E3 suggests preferential oxidation of conjugated molecules that absorb at high 162
wavelengths, which may be correlated with a decrease in molecular weight. Similar decreases in 163
molecular weight due to ozonation are observed using direct measurements such as SEC1, 13, 15 and 164
sequential ultrafiltration,14 as well as using UV-vis spectroscopy-derived parameters.21, 33, 34, 58 165
Large decreases in SUVA254 are observed with increasing specific O3 doses (Figures 1c and S4c), 166
which agrees with previous observations12, 13, 16-18, 34 and correlates with decreasing aromaticity. 167
EDC decreases significantly at 0.1 and 0.2 mg-O3/mg-C, with smaller decreases at higher 168
specific ozone doses (Figures 1d and S4d), suggesting partial oxidation of phenolic moieties. 169
Large decreases in EDC at low specific ozone doses are observed using SEC followed by 170
spectrophotometric detection or flow injection analysis with electrochemical detection.1, 31, 34, 35 171
This is attributed to electrophilic attack on activated aromatic compounds (e.g., phenols) by ozone. 172
The addition of t-BuOH as an •OH scavenger leaves O3 as the dominant oxidant and results 173
in larger changes of many bulk DOM properties. The presence of t-BuOH has no effect on A254. 174
However, the increases in E2:E3 and decreases in EDC are much larger when DOM is exposed to 175
only O3 compared to both O3 and •OH (Figures 1 and S4). These results agree with relative 176
differences in UV-vis spectra and EDC measurements observed in past studies that used t-BuOH 177
as a scavenger.21, 33, 34 Part of the enhanced oxidation may be attributable to higher O3 exposure 178
because •OH-induced chain reactions promoting O3 decay are inhibited when t-BuOH is added, 179
resulting in longer O3 lifetimes.5, 34 However, the results are consistent with a shift from less 180
selective oxidation by •OH to more selective oxidation by ozone. For example, O3 preferentially 181
Page 9 of 28
ACS Paragon Plus Environment
Environmental Science & Technology

10
reacts with DOM that absorbs at high wavelengths, whereas •OH reactions result in more uniform 182
absorbance changes (Figure S5), as observed previously.33 Collectively, these results suggest 183
preferential reactivity of O3 with DOM that is more colored and phenolic in nature. Changes in 184
[DOC] and SUVA254 cannot be compared because [DOC] measurements were not possible in 185
samples with added t-BuOH. 186
Interestingly, experiments conducted at pH 11 reveal minimal change in bulk DOM 187
properties. Increasing the pH to 11 decreases the O3 lifetime and enhances the rate of •OH 188
formation.5 While normalized values of [DOC], A254, and SUVA254 all decrease slightly, these 189
changes are small compared to the changes observed at pH 7 (Figures 1 and S4). Furthermore, the 190
increase in E2:E3 is only 10% and the decrease in EDC is within experimental error compared to 191
the initial value. Although these results are limited to a single specific ozone dose, they are opposite 192
the trends observed when t-BuOH is added and indicate that •OH does not decrease EDC even if it 193
reacts with EDC-relevant moieties. For example, the reaction of •OH with aromatic and phenolic 194
moieties results in hydroxylated products that also exert a high EDC.39 195
Changes in molecular composition of DOM. Orbitrap mass spectrometry is used to assess 196
the molecular composition of SRNOM and UMRNOM before and after ozonation. An average of 197
1386 C1-80H1-140O0-80N0-1S0-1 formulas are identified in each sample (Table S4). A higher 198
percentage of formulas in UMRNOM contain nitrogen (18.8 ± 1.4%) and sulfur (8.0 ± 1.5%) 199
compared to SRNOM (12.8 ± 1.7% and 4.2 ± 2.2%, respectively) in agreement with relative bulk 200
measurements of N and S in these isolates (Table S1).46 The formulas identified in UMRNOM are 201
slightly more saturated than those in SRNOM when comparing both H:Cw (1.27 versus 1.21) and 202
DBEw (6.48 versus 7.11) in agreement with SUVA254 measurements (Table S3). The number of 203
formulas decreases with increasing ozone dose for experiments conducted in the absence t-BuOH 204
Page 10 of 28
ACS Paragon Plus Environment
Environmental Science & Technology

11
due to loss of CHO-containing formulas. Formulas are visualized in van Krevelen diagrams, which 205
plot the ratio of H:C versus O:C for each identified formula (Figures S6 – S8). 206
Bray-Curtis dissimilarity analysis and principal components analysis are used to assess 207
overall differences in the DOM isolates. The control samples with and without t-BuOH cluster 208
together during both analyses, demonstrating that the •OH scavenger does not impact MS analysis 209
(Figure S9 – S11). Furthermore, PCA performed using all analyzed samples shows that UMRNOM 210
and SRNOM are distinct from each other. After exposure to ozone, the samples with t-BuOH 211
cluster distinctly from samples without the scavenger. Furthermore, the samples cluster further 212
away from each other with increasing specific ozone dose. For both isolates, the largest difference 213
is observed between 0.2 and 0.5 mg-O3/mg-C (Figure S11), which agrees with changes in bulk 214
measurements (Figure 1). These analyses reveal that there are molecular-level differences in DOM 215
after reaction with O3 and/or •OH. However, they do not provide information about the nature of 216
these differences. 217
Weighted averages of elemental ratios provide insight into how DOM changes when 218
exposed to O3 and •OH. The largest changes are observed in relative or absolute O:Cw, which 219
increase with increasing specific ozone doses at pH 7 (Figures 1e and S13b, respectively). The 220
increase in relative O:Cw is greater in the absence of t-BuOH, suggesting that the combination of 221
O3 and •OH results in more oxidation. The increase in O:Cw in SRNOM at pH 11 is similar to pH 222
7. However, the overall oxidant exposure (i.e., [O3] and [•OH]ss) differs across the three different 223
experimental conditions. Previous studies also report increasing O:Cw after ozonation, with large 224
changes in SRFA with 2.5 mg-O3/mg-C (O:Cw/O:Cw,0 = 3.5)15 and modest changes in wastewater 225
and drinking water with ~1.2 mg-O3/mg-C (O:Cw/O:Cw,0 = 1.05 – 1.06).17, 44 226
Page 11 of 28
ACS Paragon Plus Environment
Environmental Science & Technology

12
Measurements of DOM aromaticity (i.e., H:Cw and DBEw) do not follow the same trends. 227
A decrease in aromaticity is expected based on the large decreases in SUVA254 (Figures 1c and 228
S4c) and DBEw drops by 16% on average at the highest specific ozone dose. Furthermore, similar 229
decreases are observed with and without t-BuOH (Figures 1f and S13c). In contrast, H:Cw is 230
constant with increasing specific ozone dose (Figures S12a and S13a). These results are 231
unexpected because H:Cw and DBEw usually follow the same trends and agree well with SUVA254 232
in whole water and size-fractionated DOM.43, 53-55 However, two previous studies similarly report 233
no change in H:Cw but a decrease in DBEw in water treated with a single ozone dose, suggesting 234
that this divergence in MS-derived aromaticity measurements may be common in ozone-treated 235
samples.17, 44 These results highlight the unique information gained from molecular-level analysis, 236
rather than bulk measurements, as well as the use of multiple metrics to assess reactivity. 237
The average molecular weight observed using Orbitrap MS decreases after ozonation. MWw 238
decreases by an average of 36 m/z at the highest ozone dose for UMRNOM and SRNOM with and 239
without t-BuOH (Figures S12b and S13d). While the MWw decrease agrees with the increase in 240
E2:E3, these results must be interpreted cautiously. High-resolution MS is selective because only 241
molecules with ionizable functional groups are amenable to electrospray ionization, which means 242
that MWw may not be representative of the overall molecular weight of DOM. For example, high-243
resolution MS analysis of size-fractionated DOM shows no noticeable difference in MWw.54, 59 244
The changes in weighted averages derived from MS data agree with the well-established 245
oxidation mechanism of phenols. Phenol reacts with O3 to form primary products including 246
catechol, hydroquinone, benzoquinone, and muconic acid.25, 28, 39 These products undergo further 247
oxidation to smaller carboxylic acids, such as maleic, oxalic, and formic acids. The oxidation of 248
phenol results in large increases in O:C (e.g., from 0.17 for phenol to 2.0 for formic acid), but only 249
Page 12 of 28
ACS Paragon Plus Environment
Environmental Science & Technology

13
a modest increase in H:C (Figure S2a). Furthermore, the oxidation products have lower DBE and 250
molecular weight compared to phenol (Figure S2b). The known high reactivity of O3 with phenolic 251
compounds, as well as the agreement between trends observed in DOM isolates after ozonation 252
and predicted trends based on phenol oxidation (compare Figures 1e, 1f, and S2), support the 253
hypothesis that phenolic moieties are critical reactive functional groups in DOM. 254
Formulas susceptible to reaction with ozone and hydroxyl radical. High-resolution 255
mass spectrometry data demonstrates the reactivity of O3 and •OH with DOM at the molecular 256
level. The data is first analyzed by identifying formulas that are only present in the control sample 257
(i.e., denoted as “abated”) and by identifying formulas that are present in the ozonated samples but 258
not in the control (i.e., denoted as “formed”). The number of formulas formed is nearly identical 259
with and without t-BuOH for both isolates (Figures 2a and S14a). However, large differences are 260
observed in the number of abated formulas. For example, 425 formulas are abated in SRNOM when 261
both O3 and •OH are present, but only 201 formulas are abated when O3 is the dominant reactant 262
(1.3 mg-O3/mg-C). At pH 11, 741 formulas are abated compared to the formation of 57 formulas. 263
These results indicate that both •OH and O3 contribute to the abatement of MS-detectable formulas, 264
but that O3 reacts with fewer formulas. This can be qualitatively explained by the lower selectivity 265
of •OH compared to O3. 266
The formulas abated and formed during reaction with O3 and •OH with SRNOM (Figures 267
2c and 2d) or UMRNOM (Figure S15) have clear differences in their composition. The group of 268
formulas abated in presence of t-BuOH is more tightly clustered at lower H:Cw values (e.g., average 269
H:Cw of abated SRNOM formulas in all five ozone doses = 0.93 ± 0.02) compared to the formulas 270
abated in absence of t-BuOH (1.03 ± 0.03; Figure S14d). Formulas abated in SRNOM at pH 11 271
(i.e., primarily •OH as an oxidant) occupy a wide range in H:C (Figure S16), similar to what is 272
Page 13 of 28
ACS Paragon Plus Environment
Environmental Science & Technology

14
observed at pH 7 without t-BuOH (Figure 2c). For both isolates, the formed formulas are highly 273
oxidized compared to the abated formulas (Figures 2b and S14b) and occupy a similarly wide 274
range of H:C regardless of the presence of t-BuOH. Collectively, the analysis of unique formulas 275
abated and formed during exposure to ozone indicate that O3 preferentially consumes more 276
aromatic DOM compared to •OH and that the oxidation products have similar composition under 277
all conditions. 278
Previous studies investigated abated and formed formulas in samples treated by ozone, as 279
well as in •OH-based AOPs. Reaction with a combination of O3 and •OH generally results in 280
removal of unsaturated (i.e., aromatic) formulas to form formulas that are more saturated and more 281
oxidized. Although past work is limited to a single ozone dose in each study, the trend is consistent 282
in wastewater effluent17 and in drinking water samples.16, 18 These results are supported by 13C-283
NMR analysis, which reveals loss in aromaticity due to removal of phenolic content and an increase 284
in aliphatic and carboxyl content.12 Similarly, more highly saturated formulas are abated and a 285
higher number of formulas are completely removed when •OH is the primary oxidant in a UV/H2O2 286
AOP compared to ozonation.16 Furthermore, a separate analysis of SRFA after reaction in an AOP 287
provides additional evidence of reaction of •OH with aliphatic formulas.57 Our results also suggest 288
preferential abatement of aromatic formulas when O3 is present; however, the differences in abated 289
and formed formulas are much larger and the O:C range is much higher in this study. We attribute 290
this result to the use of SPE in previous studies,16-18, 45, 57 which shows poor recovery of the highly 291
oxidized transformation products observed here. 292
Preferential reactivity of O3 compared to •OH is also observed in formulas that decrease in 293
relative intensity during ozonation but are not completely abated. This analysis considers formulas 294
that are present in the control sample and in the five specific ozone doses. The relative intensity of 295
Page 14 of 28
ACS Paragon Plus Environment
Environmental Science & Technology
15
each formula is compared to the specific ozone dose using a Spearman rank correlation (Section 296
S5). Formulas that decrease in intensity with increasing ozone dose are denoted in cool colors (i.e., 297
rho values of -0.6 to -1.0 indicate strong negative correlations),60 suggesting that these formulas 298
react during ozonation. 299
During exposure of DOM to O3 and •OH, less oxidized formulas (i.e., low O:C) consistently 300
decrease in intensity (Figures 3a and S17a), which we attribute to reaction with the oxidants. In 301
contrast, formulas that increase in intensity (i.e., potential oxidation products) are highly oxidized 302
(Figures 3b and S17b). The shift between consumed formulas and produced formulas at an O:C 303
ratio of ~0.6 is also observed if only CHON formulas are considered (Figures S17 and S18), which 304
is expected because O3 oxidizes N-containing compounds, such as amines, through partially similar 305
mechanisms as phenols.5 The H:C value of formulas that undergo oxidation span a wide range 306
when both O3 and •OH are present (Figure 3a), with many formulas with H:C >1.5 decreasing in 307
intensity. Similarly, the formulas that increase in relative intensity after ozonation vary widely in 308
H:C but rarely reach >1.5. 309
A clear shift toward more oxidized formulas is also observed in UMRNOM and SRNOM 310
when t-BuOH is present. In this case, however, a diagonal divide is observed between oxidized and 311
produced formulas in both isolates (i.e., formulas with negative correlations vs. formulas with 312
positive correlations with specific ozone dose; Figures 3c, 3d, and S19). The formulas that undergo 313
oxidation by O3 are much more tightly clustered compared to Figure 3a, with fewer high H:C 314
formulas reacting. This difference in reactivity when O3 is the primary oxidant is also observed 315
when CHON formulas are considered separately (Figures S18 and S19). In contrast, the shift in 316
oxidized to produced formulas under conditions in which •OH is the primary oxidant is solely from 317
Page 15 of 28
ACS Paragon Plus Environment
Environmental Science & Technology

16
low O:C to high O:C; there is no preferential reactivity of low H:C formulas (i.e., no correlation 318
with aromaticity; Figure S20). 319
The difference in reactivity between O3 and •OH is further demonstrated by combining 320
Spearman rank correlations determined in all pH 7 samples (Figure 3e; Section S5). Formulas that 321
undergo oxidation (i.e., decrease in intensity with increasing specific ozone dose) in both isolates 322
regardless of the presence of t-BuOH are denoted as O3 and •OH reactive (Figure 3e). These 323
formulas are reduced (i.e., average O:C = 0.48 ± 0.12) and aromatic in nature (i.e., H:C = 1.06 ± 324
0.23), corresponding to lignin- and tannin-like formulas.61, 62 Formulas that only decrease in 325
intensity when t-BuOH is absent are only amenable to oxidation by •OH and are highly aliphatic 326
(i.e., H:C = 1.64 ± 0.26). Formulas in the same region are also reactive at pH 11 (Figure S20). The 327
same analysis for produced formulas does not provide such a clear distinction (Figure S21), 328
although it is noteworthy that most of the produced formulas are associated with both O3 and •OH. 329
Collectively, Spearman rank correlations demonstrate that O3 preferentially oxidizes highly 330
aromatic formulas, whereas more aliphatic formulas are susceptible to oxidation by •OH (Figure 331
3e). These results agree with the differences observed in formulas completely consumed during 332
ozonation (Figure 2), as well as with the reactivity of these oxidants with individual compounds.5 333
This selectivity primarily applies to formulas within DOM undergoing oxidation, with similar 334
products produced by both O3 and •OH. The non-selectivity of product formation is expected 335
because O3 and •OH can produce similar products, such as carboxylic acids, ketones, and 336
aldehydes.25, 57 To our knowledge, this is the first study to delineate between O3-reactive and •OH-337
reactive formulas in DOM at a molecular level. 338
DOM reaction mechanisms. The mechanisms of O3 and •OH oxidation are investigated 339
by identifying product formulas that correspond to known oxidation pathways (Table S5). For 340
Page 16 of 28
ACS Paragon Plus Environment
Environmental Science & Technology
17
example, •OH reacts with organic compounds through pathways such as hydroxylation (e.g., 341
aromatic rings, olefins) or decarboxylation (e.g., carboxylic acids), resulting in products with one 342
added oxygen or with the loss of CO2.3, 5, 63 Analogously, O3 reacts through the addition of one 343
(e.g., phenols, olefins, tertiary amines) or two oxygen atoms (multiple reaction sites).1, 3, 5, 64 For 344
each pathway, we constructed a mass list based on the formulas in each control sample (e.g., control 345
sample formulas after the loss of CO2) and searched for these predicted products in the reacted 346
samples. In the case of oxygen addition, it is possible that a product could be attributable to both 347
+1O and +2O pathways (e.g., C7H8O4 could result from C7H8O3 + 1O and/or C7H8O2 + 2O). If both 348
parent formulas are present in the control sample, these formulas are denoted as +1O/+2O. 349
There is clear evidence of oxygen addition in DOM after ozonation. For example, 350
UMRNOM in the absence of t-BuOH contains 31 – 39 formulas corresponding to +1O addition, 351
25 – 88 formulas corresponding to +2O addition, and 56 – 110 formulas that are attributable to 352
either transformation pathway (Table S6). The number of oxygen addition formulas generally 353
increases with specific ozone dose and most product formulas have O:C ratios >0.5 (Figures 3f 354
and S22). Similar trends in the number of unique oxidized products and in the type of formulas 355
produced are observed in presence of t-BuOH and in both sets of SRNOM samples. We 356
hypothesized that a higher proportion of +2O transformation formulas would be present in samples 357
with the •OH scavenger. However, most of the detected formulas are denoted +1O/+2O (i.e., 58.5 358
± 10.6% of formulas with added oxygen averaged across all samples). Thus, it is not possible to 359
distinguish between preferential oxidation by O3 or •OH based on the comparison of oxygen 360
addition products. 361
In contrast, there is a clear distinction in the number of formulas attributable to 362
decarboxylation with and without t-BuOH. For example, 88 – 186 -CO2 formulas are observed in 363
Page 17 of 28
ACS Paragon Plus Environment
Environmental Science & Technology
18
UMRNOM exposed to both O3 and •OH, whereas only 18 – 57 -CO2 formulas are observed in 364
UMRNOM in the presence of the •OH scavenger (Figures 3f and S23; Table S6). This agrees with 365
the ability of •OH to react with DOM via decarboxylation.63, 65, 66 The number of decarboxylated 366
formulas in SRNOM are similar with and without the scavenger, as well as at pH 11. While this 367
result does not follow the trend observed in UMRNOM, the number of -CO2 formulas in SRNOM 368
samples is low (i.e., 15 – 31), suggesting that SRNOM is less amenable to reacting by this 369
mechanism. Similar transformation products via the pathways studied here are detected in non-370
target analysis of ozone transformation products of micropollutants3 and a QTOF-MS study found 371
evidence of decarboxylation in SRFA.15 372
Implications for Water Treatment. Ozonation significantly alters DOM composition with 373
minimal mineralization. UV-vis spectroscopy and EDC measurements reveal decreases in 374
aromaticity, apparent molecular weight, and phenolic content, with larger changes observed when 375
t-BuOH is added and O3 is dominant. These bulk-level results agree with studies using similar 376
techniques12, 13, 16-18, 21, 31, 34, 35 and, importantly, agree with molecular-level results observed by 377
Orbitrap MS. For example, formulas that are shown to be reactive with O3 (Figure 3) occupy the 378
same region of the van Krevelen diagram as formulas positively correlated with SUVA254 and 379
negatively correlated with E2:E3.43, 53, 55 The consistency in our data set with bulk-level results 380
suggests that the molecular-level transformations observed here may be common in ozone-treated 381
waters. 382
O3 reacts selectively with activated aromatic systems (e.g., phenols).5 This study confirms 383
that O3-reactive formulas within DOM are highly aromatic in nature, occupying the same space on 384
the van Krevelen diagram as phenols and lignin-like compounds. Additionally, transformation 385
pathways observed in model compounds, including in non-target analysis of micropollutants,3 are 386
Page 18 of 28
ACS Paragon Plus Environment
Environmental Science & Technology

19
observed, suggesting that well-established oxidation mechanisms also occur with individual DOM 387
moieties. 388
DOM is an important scavenger of O3 and •OH, competing with target compounds during 389
ozonation. The reactivity of DOM with these oxidants depends on its composition. For example, 390
more aromatic, high-molecular weight DOM is more reactive with O3,11, 14 while rate constants for 391
the reactions between •OH and DOM are less variable.1, 11, 13 Although this study was not designed 392
to quantify reaction kinetics, it provides a mechanistic understanding for correlations between O3 393
rate constants and measurements of aromaticity.67 Furthermore, it provides molecular-level 394
evidence for why DOM with higher phenolic content and higher EDC is a potent O3 scavenger.31 395
The composition of oxidized DOM has implications for subsequent water treatment 396
processes and for waters that receive ozonated effluent. Ozone produces DOM that is highly 397
bioavailable, yet the compounds associated with AOC (e.g., carboxylic acids and aldehydes) only 398
comprise a fraction of the organic carbon.2, 23, 25, 68-70 The polar, higher molecular weight formulas 399
detected by high-resolution MS may also contribute to AOC because aromatic DOM is less 400
bioavailable and formulas with high O:C are selectively degraded.71-73 DOM composition also has 401
implications for abiotic processes, such as photodegradation. Many of the oxidized product 402
formulas observed here occupy the same van Krevelen space as formulas associated with triplet 403
DOM and singlet oxygen production,53, 55 confirming observations that ozonation increases 404
quantum yields of these species in undiluted wastewater.20, 21 Finally, the molecular composition 405
of DOM observed after ozonation is highly oxidized, with many formulas with O:C values that are 406
outside the range encountered in natural and engineered waters (i.e., >1.0).17, 41, 42, 53, 55, 65 Future 407
studies should determine if these high O:C formulas are unique to ozone-treated samples, or if these 408
Page 19 of 28
ACS Paragon Plus Environment
Environmental Science & Technology

20
formulas are simply not well retained by SPE and therefore not routinely observed in high-409
resolution MS studies of DOM. 410
411
Acknowledgements 412
C.K.R. acknowledges funding from ETH Zürich and resources from Eawag during her 413
sabbatical stay. The authors thank M. Sander, S. Canonica, and K. McNeill for helpful discussions, 414
S. Hug and T. Rüttimann for experimental design, and P. Longrée for assistance with MS analysis. 415
416
Supporting Information 417
Figures S1 – S23 and Tables S1 – S6 are included in Supporting Information. The material 418
is available free of charge via http://pubs.acs.org. 419
420 421 422
Page 20 of 28
ACS Paragon Plus Environment
Environmental Science & Technology

21
423 424
Figure 1. Relative changes in bulk parameters and weighted averages derived from Orbitrap MS 425 data for UMRNOM and SRNOM as a function of the specific ozone dose. (a) Absorbance at 254 426 nm, (b) E2:E3, (c) specific UV absorbance (SUVA254), (d) electron donating capacity (EDC), (e) 427 O:Cw, and (f) DBEw in UMRNOM with and without t-BuOH at pH 7, SRNOM with and without 428 t-BuOH at pH 7, and SRNOM at pH 11. Error bars represent the standard deviation of triplicate 429 bulk measurements. 430
431
0
0.2
0.4
0.6
0.8
1
0 0.5 1 1.5
UMRNOMUMRNOM tBuOHSRNOMSRNOM tBuOHpH 11
extra
A25
4 / A
254,
0
Specific ozone dose (mg-O3/mg-C)
UMRNOMUMRNOM + t-BuOHSRNOMSRNOM + t-BuOHSRNOM pH 11
0
0.5
1
1.5
2
2.5
0 0.5 1 1.5
E2:
E 3 /
E 2:E
3,0
Specific ozone dose (mg-O3/mg-C)
0
0.2
0.4
0.6
0.8
1
0 0.5 1 1.5
SUVA
254 /
SU
VA25
4,0
Specific ozone dose (mg-O3/mg-C)
(a)
0
0.2
0.4
0.6
0.8
1
0 0.5 1 1.5
EDC
/ ED
C0
Specific ozone dose (mg-O3/mg-C)
0.9
1
1.1
1.2
1.3
1.4
1.5
0 0.5 1 1.5
O:C
w /
O:C
w,0
Specific ozone dose (mg-O3/mg-C)
0.7
0.8
0.9
1
1.1
0 0.5 1 1.5
DB
E w /
DB
E w,0
Specific ozone dose (mg-O3/mg-C)
(b) (c)
(d) (e) (f)
Page 21 of 28
ACS Paragon Plus Environment
Environmental Science & Technology

22
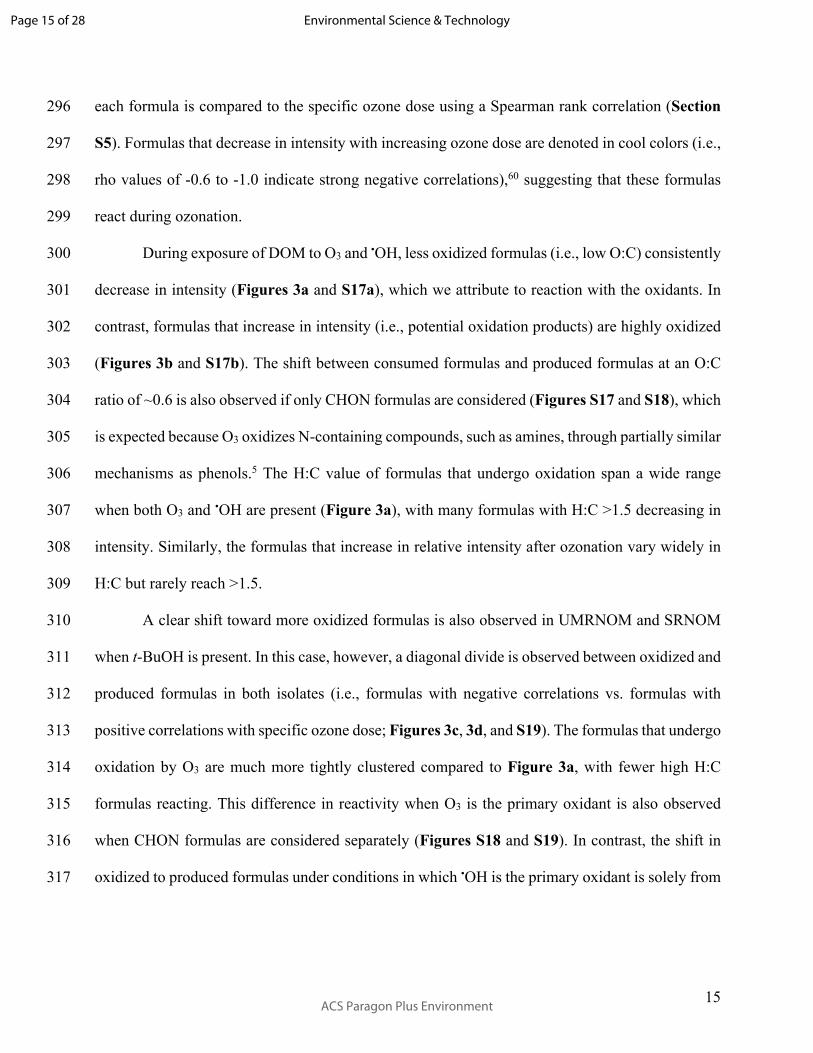
432 Figure 2. (a) Number of unique formulas abated or formed in SRNOM with and without t-BuOH 433 as a function of the specific ozone dose. (b) Weighted O:C of unique formulas abated or formed in 434 SRNOM. van Krevelen diagrams for formulas present only before ozonation (blue) or present only 435 after ozonation (red) in (c) SRNOM in 1.3 mg-O3/mg-C without t-BuOH at pH 7 and (d) SRNOM 436 in 1.3 mg-O3/mg-C with t-BuOH at pH 7. 437
438 439 440
0
0.2
0.4
0.6
0.8
0 0.5 1 1.5
SR.lostSR.tBuOH.lostSR.formedSR.tBuOH.formed
extra
O:C
w
Specific ozone dose (mg-O3/mg-C)
SRNOM abatedSRNOM + t-BuOH abatedSRNOM formedSRNOM + t-BuOH formed
0
0.5
1
1.5
2
0 0.5 1 1.5
PresentH.CAbsentH.C
other
H:C
O:C
FormedAbated
0
100
200
300
400
500
0 0.5 1 1.5
SR.lostSR.tBuOH.lostSR.formedSR.tBuOH.formed
extra
Num
ber o
f For
mul
as
Specific ozone dose (mg-O3/mg-C)
SRNOM abatedSRNOM + t-BuOH abatedSRNOM formedSRNOM + t-BuOH formed
(a)
(c)
0
0.5
1
1.5
2
0 0.5 1 1.5
PresentH.CAbsentH.C
other
H:C
O:C
FormedAbated
(b)
(d)
Page 22 of 28
ACS Paragon Plus Environment
Environmental Science & Technology

23
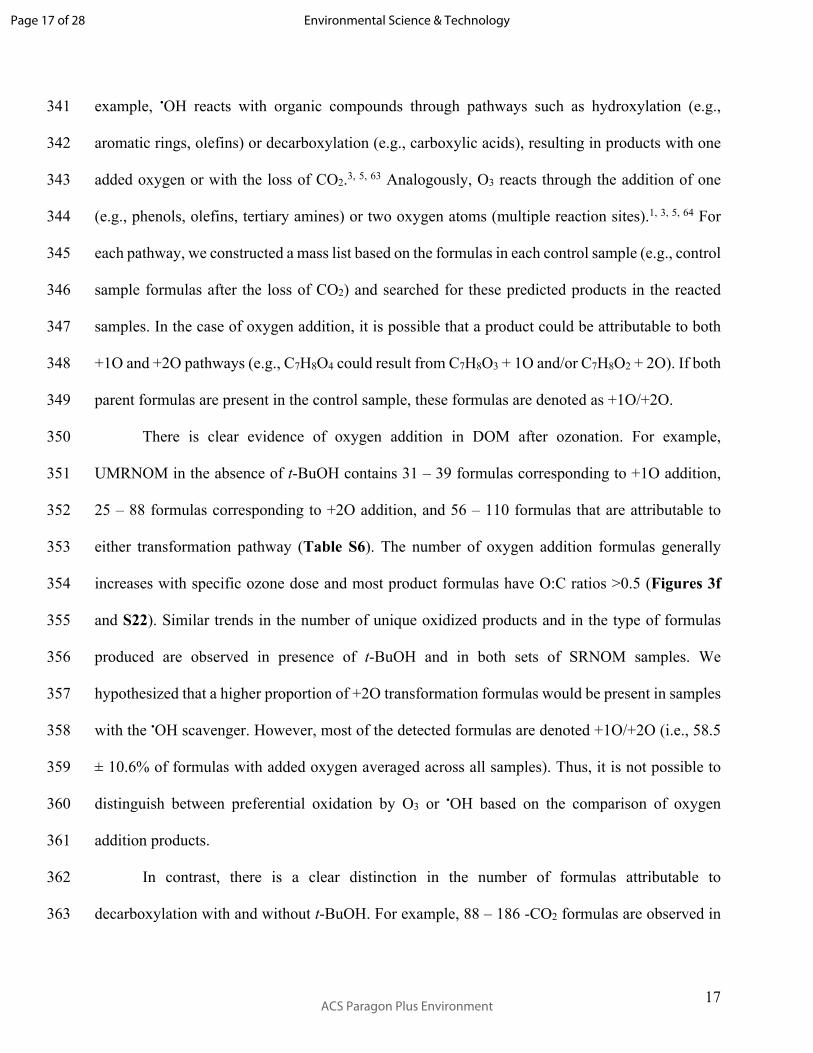
441 Figure 3. Formulas that (a) decrease or (b) increase in relative intensity with increasing specific 442 ozone dose in UMRNOM samples (nsamples = 6; nformulas = 890). Formulas that (c) decrease or (d) 443 increase in relative intensity with increasing specific ozone dose in UMRNOM samples with added 444 t-BuOH (nsamples = 6; nformulas = 1052). Rho values determined by Spearman rank correlations are 445 noted in the legend (negative rho values = negative correlation with ozone dose; positive rho values 446 = positive correlation; Section S5). (e) Formulas that are only reactive with •OH (nformulas = 53) 447 compared to formulas that are reactive with O3 and •OH (nformulas = 191) in UMRNOM and SRNOM 448 (nsamples = 24). (f) van Krevelen diagrams for transformation products with one or two added oxygen 449 atoms and decarboxylation products in UMRNOM at 0.5 mg-O3/mg-C. 450 451
0
0.5
1
1.5
2
0 0.5 1
H.C.negH.C.med.negH.C.most.neg
extra
H:C
O:C
0.0 to -0.3-0.3 to -0.6-0.6 to -1.0
0 0.5 1
H.C.posH.C.med.posH.C.most.pos
extra
O:C
0.0 to 0.30.3 to 0.60.6 to 1.0
0
0.5
1
1.5
2
0 0.5 1
H.C.both
H.C.OHonly
extra
H:C
O:C
O3 and •OH•OH only
(a)
0
0.5
1
1.5
2
0 0.5 1
H.C.negH.C.med.negH.C.most.neg
extra
H:C
O:C
0.0 to -0.3-0.3 to -0.6-0.6 to -1.0
0 0.5 1
H.C.posH.C.med.posH.C.most.pos
extra
O:C
0.0 to 0.30.3 to 0.60.6 to 1.0
0
0.5
1
1.5
2
0 0.5 1 1.5
H.C.CO2H.C.1OH.C.2OH.C.both
extra
H:C
O:C
-CO2
+1O+2O+1O/+2O
(b) (e)
(c) (d) (f)
Page 23 of 28
ACS Paragon Plus Environment
Environmental Science & Technology
24
References 452
1. von Sonntag, C.; von Gunten, U., Chemistry of ozone in water and wastewater treatment: 453 From basic prinicples to appications. IWA: London, 2012. 454
2. von Gunten, U., Ozonation of drinking water: Part II. Disinfection and by-product 455 formation in presence of bromide, iodide or chlorine. Water Res. 2003, 37, (7), 1469-1487. 456
3. Schollée, J. E.; Bourgin, M.; von Gunten, U.; McArdell, C. S.; Hollender, J., Non-target 457 screening to trace ozonation transformation products in a wastewater treatment train 458 including different post-treatments. Water Res. 2018, 142, 267-278. 459
4. Völker, J.; Stapf, M.; Miehe, U.; Wagner, M., Systematic review of toxicity removal by 460 advanced wastewater treatment technologies via ozonation and activated carbon. Environ. 461 Sci. Technol. 2019, 53, (13), 7215-7233. 462
5. von Gunten, U., Ozonation of drinking water: Part I. Oxidation kinetics and product 463 formation. Water Res. 2003, 37, (7), 1443-1467. 464
6. Staehelin, J.; Hoigné, J., Decomposition of ozone in water in the presence of organic solutes 465 acting as promoters and inhibitors of radical chain reactions. Environ. Sci. Technol. 1985, 466 19, (12), 1206-1213. 467
7. Buffle, M.-O.; von Gunten, U., Phenols and amine induced HO• generation during the initial 468 phase of natural water ozonation. Environ. Sci. Technol. 2006, 40, 3057-3063. 469
8. von Gunten, U., Oxidation processes in water treatment: Are we on track? Environ. Sci. 470 Technol. 2018, 52, (9), 5062-5075. 471
9. Elovitz, M. S.; von Gunten, U.; Kaiser, H.-P., Hydroxyl radical/ozone ratios during 472 ozonation processes. II. The effect of temperature, pH, alkalinity, and DOM properties. 473 Ozone Sci. Eng. 2000, 22, 123-150. 474
10. Appiani, E.; Page, S. E.; McNeill, K., On the use of hydroxyl radical kinetics to assess the 475 number-average molecular weight of dissolved organic matter. Environ. Sci. Technol. 2014, 476 48, (20), 11794-11802. 477
11. Westerhoff, P.; Aiken, G.; Amy, G.; Debroux, J., Relationships between the structure of 478 natural organic matter and its reactivity towards molecular ozone and hydroxyl radicals. 479 Water Res. 1999, 33, (10), 2265-2276. 480
12. Westerhoff, P.; Debroux, J.; Aiken, G.; Amy, G., Ozone‐induced changes in natural organic 481 matter (NOM) structure. Ozone Sci. Eng. 1999, 21, (6), 551-570. 482
13. Rosario-Ortiz, F. L.; Mezyk, S. P.; Wert, E. C., Effect of ozone oxidation on the molecular 483 and kinetic properties of effluent organic matter. J. Adv. Oxid. Technol. 2008, 11, (3), 529-484 535. 485
14. Gong, J.; Liu, Y.; Sun, X., O3 and UV/O3 oxidation of organic constituents of biotreated 486 municipal wastewater. Water Res. 2008, 42, (4-5), 1238-1244. 487
15. These, A.; Reemtsma, T., Structure-dependent reactivity of low molecular weight fulvic 488 acid molecules during ozonation. Environ. Sci. Technol. 2005, 39, (21), 8382-8387. 489
16. Phungsai, P.; Kurisu, F.; Kasuga, I.; Furumai, H., Molecular characteristics of dissolved 490 organic matter transformed by O3 and O3/H2O2 treatments and the effects on formation of 491 unknown disinfection by-products. Water Res. 2019, 159, 214-222. 492
Page 24 of 28
ACS Paragon Plus Environment
Environmental Science & Technology

25
17. Phungsai, P.; Kurisu, F.; Kasuga, I.; Furumai, H., Molecular characterization of low 493 molecular weight dissolved organic matter in water reclamation processes using Orbitrap 494 mass spectrometry. Water Res. 2016, 100, 526-536. 495
18. Phungsai, P.; Kurisu, F.; Kasuga, I.; Furumai, H., Changes in dissolved organic matter 496 composition and disinfection byproduct precursors in advanced drinking water treatment 497 processes. Environ. Sci. Technol. 2018, 52, (6), 3392-3401. 498
19. Wenk, J.; Aeschbacher, M.; Sander, M.; von Gunten, U.; Canonica, S., Photosensitizing 499 and inhibitory effects of ozonated dissolved organic matter on triplet-induced contaminant 500 transformation. Environ. Sci. Technol. 2015, 49, (14), 8541-8549. 501
20. Mostafa, S.; Rosario-Ortiz, F. L., Singlet oxygen formation from wastewater organic 502 matter. Environ. Sci. Technol. 2013, 47, (15), 8179-8186. 503
21. Leresche, F.; Mckay, G.; Kurtz, T.; von Gunten, U.; Canonica, S.; Rosario-Ortiz, F. L., 504 Effects of ozone on the photochemical and photophysical properties of dissolved organic 505 matter. Environ. Sci. Technol. 2019, 53, 5622-5632. 506
22. van der Kooij, D.; Hijnen, W. A. M.; Kruithof, J. C., The effects of ozonation, biological 507 filtration and distribution on the concentration of easily assimilable organic carbon (AOC) 508 in drinking water. Ozone Sci. Eng. 1989, 11, (3), 297-311. 509
23. Weinberg, H., Disinfection byproducts in drinking water: The analytical challenge. Anal. 510 Chem. 1999, 71, (23), 801A-808A. 511
24. Richardson, S. D.; Thruston, A. D.; Caughran, T. V.; Chen, P. H.; Collette, T. W.; Floyd, 512 T. L.; Schenck, K. M.; Lykins, B. W.; Sun, G.; Majetich, G., Identification of new ozone 513 disinfection byproducts in drinking water. Environ. Sci. Technol. 1999, 33, 3368-3377. 514
25. Hammes, F.; Salhi, E.; Köster, O.; Kaiser, H.-P.; Egli, T.; von Gunten, U., Mechanistic and 515 kinetic evaluation of organic disinfection by-product and assimilable organic carbon (AOC) 516 formation during the ozonation of drinking water. Water Res. 2006, 40, (12), 2275-2286. 517
26. Huang, W.-J.; Fang, G.-C.; Wang, C.-C., The determination and fate of disinfection by-518 products from ozonation of polluted raw water. Sci. Total Environ. 2005, 345, (1-3), 261-519 272. 520
27. Liu, C.; Tang, X.; Kim, J.; Korshin, G. V., Formation of aldehydes and carboxylic acids in 521 ozonated surface water and wastewater: A clear relationship with fluorescence changes. 522 Chemosphere 2015, 125, 182-190. 523
28. Ramseier, M. K.; von Gunten, U., Mechanisms of phenol ozonation: Kinetics of formation 524 of primary and secondary reaction products. Ozone Sci. Eng. 2009, 31, (3), 201-215. 525
29. Świetlik, J.; Dąbrowska, A.; Raczyk-Stanisławiak, U.; Nawrocki, J., Reactivity of natural 526 organic matter fractions with chlorine dioxide and ozone. Water Res. 2004, 38, (3), 547-527 558. 528
30. Wert, E. C.; Rosario-Ortiz, F. L.; Drury, D. D.; Snyder, S. A., Formation of oxidation 529 byproducts from ozonation of wastewater. Water Res. 2007, 41, (7), 1481-1490. 530
31. Önnby, L.; Salhi, E.; Mckay, G.; Rosario-Ortiz, F. L.; von Gunten, U., Ozone and chlorine 531 reactions with dissolved organic matter - Assessment of oxidant-reactive moieties by 532 optical measurements and the electron donating capacities. Water Res. 2018, 144, 64-75. 533
32. Hammes, F.; Meylan, S.; Salhi, E.; Koster, O.; Egli, T.; Gunten, U. V., Formation of 534 assimilable organic carbon (AOC) and specific natural organic matter (NOM) fractions 535 during ozonation of phytoplankton. Water Res. 2007, 41, (7), 1447-1454. 536
Page 25 of 28
ACS Paragon Plus Environment
Environmental Science & Technology

26
33. Audenaert, W.; Vandierendonck, D.; Van Hulle, S.; Nopens, I., Comparison of ozone and 537 HO• induced conversion of effluent organic matter (EfOM) using ozonation and UV/H2O2 538 treatment. Water Res. 2013, 47, 2387-2398. 539
34. Wenk, J.; Aeschbacher, M.; Salhi, E.; Canonica, S.; von Gunten, U.; Sander, M., Chemical 540 oxidation of dissolved organic matter by chlorine dioxide, chlorine, and ozone: Effects on 541 its optical and antioxidant properties. Environ. Sci. Technol. 2013, 47, (19), 11147-11156. 542
35. Önnby, L.; Walpen, N.; Salhi, E.; Sander, M.; von Gunten, U., Two analytical approaches 543 quantifying the electron donating capacities of dissolved organic matter to monitor its 544 oxidation during chlorination and ozonation. Water Res. 2018, 144, 677-689. 545
36. Aeschbacher, M.; Graf, C.; Schwarzenbach, R. P.; Sander, M., Antioxidant properties of 546 humic substances. Environ. Sci. Technol. 2012, 46, (9), 4916-4925. 547
37. Walpen, N.; Schroth, M. H.; Sander, M., Quantification of phenolic antioxidant moieties in 548 dissolved organic matter by flow-injection analysis with electrochemical detection. 549 Environ. Sci. Technol. 2016, 50, (12), 6423-6432. 550
38. Walpen, N.; Getzinger, G. J.; Schroth, M. H.; Sander, M., Electron-donating phenolic and 551 electron-accepting quinone moieties in peat dissolved organic matter: Quantities and redox 552 transformations in the context of peat biogeochemistry. Environ. Sci. Technol. 2018, 52, 553 (9), 5236-5245. 554
39. Mvula, E.; von Sonntag, C., Ozonolysis of phenols in aqueous solution. Org. Biomolec. 555 Chem. 2003, 1, (10), 1749. 556
40. Zhang, H.; Zhang, Y.; Shi, Q.; Ren, S.; Yu, J.; Ji, F.; Luo, W.; Yang, M., Characterization 557 of low molecular weight dissolved natural organic matter along the treatment trait of a 558 waterworks using Fourier transform ion cyclotron resonance mass spectrometry. Water Res. 559 2012, 46, (16), 5197-5204. 560
41. Gonsior, M.; Schmitt-Kopplin, P.; Stavklint, H.; Richardson, S. D.; Hertkorn, N.; 561 Bastviken, D., Changes in dissolved organic matter during the treatment processes of a 562 drinking water plant in Sweden and formation of previously unknown disinfection 563 byproducts. Environ. Sci. Technol. 2014, 48, (21), 12714-12722. 564
42. Lavonen, E. E.; Kothawala, D. N.; Tranvik, L. J.; Gonsior, M., Tracking changes in the 565 optical properties and molecular composition of dissolved organic matter during drinking 566 water production. Water Res. 2015, 85, 286-294. 567
43. Maizel, A. C.; Remucal, C. K., The effect of advanced secondary municipal wastewater 568 treatment on the molecular composition of dissolved organic matter. Water Res. 2017, 122, 569 42-52. 570
44. Andersson, A.; Lavonen, E.; Harir, M.; Gonsior, M.; Hertkorn, N.; Schmitt-Kopplin, P.; 571 Kylin, H.; Bastviken, D., Selective removal of natural organic matter during drinking water 572 production changes the composition of disinfection by-products. Environ. Sci. Water Res. 573 Tech. 2020, 6, (3), 779-794. 574
45. Liu, X.; Liu, R.; Zhu, B.; Ruan, T.; Jiang, G., Characterization of carbonyl disinfeciton by-575 products during ozonation, chlorination, and chloramination of dissolved organic matter. 576 Environ. Sci. Technol. 2020, 54, (4), 2218-2227. 577
46. International Humic Substances Society, 2019, http://humic-substances.org/ 578
Page 26 of 28
ACS Paragon Plus Environment
Environmental Science & Technology

27
47. Buffle, M.-O.; Schumacher, J.; Meylan, S.; Jekel, M.; von Gunten, U., Ozonation and 579 advanced oxidation of wastewater: Effect of O3 dose, pH, DOM and HO•-scavengers on 580 ozone decomposition and HO• generation. Ozone Sci. Eng. 2006, 28, (4), 247-259. 581
48. Weishaar, J. L.; Aiken, G. R.; Bergamaschi, B. A.; Fram, M. S.; Fujii, R.; Mopper, K., 582 Evaluation of specific ultraviolet absorbance as an indicator of the chemical composition 583 and reactivity of dissolved organic carbon. Environ. Sci. Technol. 2003, 37, (20), 4702-584 4708. 585
49. Helms, J. R.; Stubbins, A.; Ritchie, J. D.; Minor, E. C.; Kieber, D. J.; Mopper, K., 586 Absorption spectral slopes and slope ratios as indicators of molecular weight, source, and 587 photobleaching of chromophoric dissolved organic matter. Limnol. Oceanogr. 2008, 53, 588 (3), 955-969. 589
50. Walpen, N.; Houska, J.; Salhi, E.; Sander, M.; von Gunten, U., Quantification of the 590 electron donating capacity and UV absorbance of dissolved organic matter during 591 wastewater ozonation by an assay and an automated analyzer. In review. 592
51. Kujawinski, E. B.; Behn, M. D., Automated analysis of electrospray ionization Fourier 593 transform ion cyclotron resonance mass spectra of natural organic matter. Anal. Chem. 594 2006, 78, (13), 4363-4373. 595
52. Koch, B. P.; Dittmar, T.; Witt, M.; Kattner, G., Fundamentals of molecular formula 596 assignment to ultrahigh resolution mass data of natural organic matter. Anal. Chem. 2007, 597 79, (4), 1758-1763. 598
53. Berg, S. M.; Whiting, Q. T.; Herrli, J. A.; Winkels, R.; Wammer, K. H.; Remucal, C. K., 599 The role of dissolved organic matter composition in determining photochemical reactivity 600 at the molecular level. Environ. Sci. Technol. 2019, 53, (20), 11725-11734. 601
54. Maizel, A. C.; Remucal, C. K., Molecular composition and photochemical reactivity of 602 size-fractionated dissolved organic matter. Environ. Sci. Technol. 2017, 51, (4), 2113-2123. 603
55. Maizel, A. C.; Li, J.; Remucal, C. K., Relationships between dissolved organic matter 604 composition and photochemistry in lakes of diverse trophic status. Environ. Sci. Technol. 605 2017, 51, (17), 9624-9632. 606
56. Bazri, M. M.; Barbeau, B.; Mohseni, M., Impact of UV/H2O2 advanced oxidation treatment 607 on molecular weight distribution of NOM and biostability of water. Water Res. 2012, 46, 608 (16), 5297-5304. 609
57. Varanasi, L.; Coscarelli, E.; Khaksari, M.; Mazzoleni, L. R.; Minakata, D., Transformations 610 of dissolved organic matter induced by UV photolysis, hydroxyl radicals, chlorine radicals, 611 and sulfate radicals in aqueous-phase UV-based advanced oxidation processes. Water Res. 612 2018, 135, 22-30. 613
58. Nöthe, T.; Fahlenkamp, H.; von Sonntag, C., Ozonation of wastewater: Rate of ozone 614 consumption and hydroxyl radical yield. Environ. Sci. Technol. 2009, 43, (15), 5990-5995. 615
59. Remucal, C. K.; Cory, R. M.; Sander, M.; McNeill, K., Low molecular weight components 616 in an aquatic humic substance as characterized by membrane dialysis and Orbitrap mass 617 spectrometry. Environ. Sci. Technol. 2012, 46, (17), 9350-9359. 618
60. McCabe, A. J.; Arnold, W. A., Reactivity of triplet excited states of dissolved natural 619 organic matter in stormflow from mixed-use watersheds. Environ. Sci. Technol. 2017, 51, 620 (17), 9718-9728. 621
Page 27 of 28
ACS Paragon Plus Environment
Environmental Science & Technology
28
61. Kujawinski, E. B.; Longnecker, K.; Blough, N. V.; del Vecchio, R.; Finlay, L.; Kitner, J. 622 B.; Giovannoni, S. J., Identification of possible source markers in marine dissolved organic 623 matter using ultrahigh resolution mass spectrometry. Geochim. Cosmochim. Acta 2009, 73, 624 (15), 4384-4399. 625
62. Sleighter, R. L.; Hatcher, P. G., The application of electrospray ionization coupled to 626 ultrahigh resolution mass spectrometry for the molecular characterization of natural organic 627 matter. J. Mass Spectrom. 2007, 42, (5), 559-574. 628
63. von Sonntag, C.; Schuchmann, H. P., Peroxyl radicals in aqueous solution. In Peroxyl 629 Radicals, Alfassi, Z. B., Ed. John Wiley & Sons: 1997; pp 173-234. 630
64. Borowska, E.; Bourgin, M.; Hollender, J.; Kienle, C.; McArdell, C. S.; von Gunten, U., 631 Oxidation of cetirizine, fexofenadine and hydrochlorothiazide during ozonation: Kinetics 632 and formation of transformation products. Water Res. 2016, 94, 350-362. 633
65. Ward, C. P.; Cory, R. M., Complete and partial photo-oxidation of dissolved organic matter 634 draining permafrost soils. Environ. Sci. Technol. 2016, 50, (7), 3545-3553. 635
66. Barazesh, J. M.; Prasse, C.; Wenk, J.; Berg, S.; Remucal, C. K.; Sedlak, D. L., Trace 636 element removal in distributed drinking water treatment systems by cathodic H2O2 637 production and UV photolysis. Environ. Sci. Technol. 2017, 52, (1), 195-204. 638
67. Elovitz, M. S.; von Gunten, U.; Kaiser, H.-P., The influence of dissolved organic matter 639 character on ozone decomposition rates and Rct. In Natural organic matter and disinfection 640 by-products: Characterization and control in drinking water, Barrett, S. E.; Krasner, S. W.; 641 Amy, G. L., Eds. American Chemical Society: Washington D.C., 2000; Vol. ACS 642 Symposium Series 761, pp 248-269. 643
68. Ramseier, M. K.; Peter, A.; Traber, J.; von Gunten, U., Formation of assimilable organic 644 carbon during oxidation of natural waters with ozone, chlorine dioxide, chlorine, 645 permanganate, and ferrate. Water Res. 2011, 45, (5), 2002-2010. 646
69. Zimmermann, S. G.; Wittenwiler, M.; Hollender, J.; Krauss, M.; Ort, C.; Siegrist, H.; von 647 Gunten, U., Kinetic assessment and modeling of an ozonation step for full-scale municipal 648 wastewater treatment: Micropollutant oxidation, by-product formation and disinfection. 649 Water Res. 2011, 45, (2), 605-617. 650
70. Richardson, S. D.; Simmons, J. E.; Rice, G., Disinfection byproducts: The next generation. 651 Environ. Sci. Technol. 2002, 36, (9), 198A-205A. 652
71. Kim, S.; Kaplan, L. A.; Hatcher, P. G., Biodegradable dissolved organic matter in a 653 temperate and a tropical stream determined from ultra-high resolution mass spectrometry. 654 Limnol. Oceanogr. 2006, 51, (2), 1054-1063. 655
72. Osborne, D. M.; Podgorski, D. C.; Bronk, D. A.; Roberts, Q.; Sipler, R. E.; Austin, D.; 656 Bays, J. S.; Cooper, W. T., Molecular-level characterization of reactive and refractory 657 dissolved natural organic nitrogen compounds by atmospheric pressure photoionization 658 coupled to Fourier transform ion cyclotron resonance mass spectrometry. Rapid Commun. 659 Mass Sp. 2013, 27, (20), 5336-5344. 660
73. Sleighter, R. L.; Cory, R. M.; Kaplan, L. A.; Abdulla, H. A. N.; Hatcher, P. G., A coupled 661 geochemical and biogeochemical approach to characterize the bioreactivity of dissolved 662 organic matterfrom a headwater stream. J. Geophys. Res. B 2014, 119, 1520-1537. 663
664
Page 28 of 28
ACS Paragon Plus Environment
Environmental Science & Technology