Effect of pH and dissolved organic matter on the abundance of nirK and nirS denitrifiers in spruce...
10
Effect of pH and dissolved organic matter on the abundance of nirK and nirS denitrifiers in spruce forest soil Jir ˇı ´ Ba ´rta • Tereza Melichova ´ • Daniel Vane ˇk • Toma ´s ˇ Picek • Hana S ˇ antru ˚c ˇkova ´ Received: 31 October 2009 / Accepted: 11 March 2010 Ó Springer Science+Business Media B.V. 2010 Abstract Acid N depositions in the Bohemian Forest during the second half of the last century caused enormous soil acidification which led to the leaching of essential nutrients including nitrates. We investigated the effect of dissolved organic matter (DOM) and pH on the abundance of 16S RDNA, nirK and nirS gene copies in four spruce forest sites. Soil samples for molecular based quantification (qPCR) were taken from the organic litter and humus layers. The amounts of dissolved organic carbon (DOC) and dissolved nitrogen (DN) were much lower in highly acidified soils. We found a strong correlation between nirK denitrifiers and the amount of available P (r = 0.83, p \ 0.001), which suggested a higher nutrient sensitivity of this group of denitrifying bacteria. Additionally, we found that correlations between the amount of nirK denitrifiers and DOC and pH are exponentional showing two important thresh- old values, being 4.8 mol kg -1 and 5, respectively. The amount of nirK denitrifiers rapidly decreased below these values. The amount of nirK and nirS denitrifiers was higher in the organic litter horizon than the organic humus horizon at all sampling sites. Keywords Dissolved organic matter Available phosphorus nirK and nirS denitrifiers Acid forest soil N depositions qPCR Introduction Spruce forest soils in Central Europe were exposed to high nitrogen (N) depositions during the second half of the last century. Atmospheric N deposition is the major anthropogenic source of N in terrestrial ecosystems of the United States, Asia and Europe (Galloway et al. 2003; Galloway and Cowling 2002; Waldrop and Zak 2006). Because of N limitation in temperate forests, additional N input can stimulate plant growth and increase aboveground carbon (C) storage (Nadelhoffer et al. 1999; Magill et al. 1997; Waldrop and Zak 2006). However, high N depositions can decrease soil pH, which leads to reduction of the soil acid neutralizing capacity and leaching of a plant’s essential cations (Ca 2? , Mg 2? and K ? ) (Dauer et al. 2007; Tomlinson 2003; Pawlowski 1997) and NO 3 - from the forest soils (Kopa ´cek et al. 2002a, b;S ˇ antru ˚c ˇkova ´ et al. 2006). One of the reasons for higher NO 3 - leaching could be the reduction in the amount of denitrifying bacteria in the acid forest soils. However, direct evidence is missing. Denitrification is the main anaerobic biotic process leading to loses of fixed N as well as removal of excess soluble nitrate (NO 3 - ) and nitrite (NO 2 - ) J. Ba ´rta (&) T. Melichova ´ D. Vane ˇk T. Picek H. S ˇ antru ˚c ˇkova ´ Department of Ecosystem Biology, Faculty of Science, University of South Bohemia, Branis ˇovska ´ 31, 370 05 Ceske Budejovice, Czech Republic e-mail: [email protected] 123 Biogeochemistry DOI 10.1007/s10533-010-9430-9
-
Upload
independent -
Category
Documents
-
view
0 -
download
0
Transcript of Effect of pH and dissolved organic matter on the abundance of nirK and nirS denitrifiers in spruce...
Effect of pH and dissolved organic matter on the abundanceof nirK and nirS denitrifiers in spruce forest soil
Jirı Barta • Tereza Melichova • Daniel Vanek •
Tomas Picek • Hana Santruckova
Received: 31 October 2009 / Accepted: 11 March 2010
� Springer Science+Business Media B.V. 2010
Abstract Acid N depositions in the Bohemian
Forest during the second half of the last century
caused enormous soil acidification which led to the
leaching of essential nutrients including nitrates. We
investigated the effect of dissolved organic matter
(DOM) and pH on the abundance of 16S RDNA, nirK
and nirS gene copies in four spruce forest sites. Soil
samples for molecular based quantification (qPCR)
were taken from the organic litter and humus layers.
The amounts of dissolved organic carbon (DOC) and
dissolved nitrogen (DN) were much lower in highly
acidified soils. We found a strong correlation between
nirK denitrifiers and the amount of available P
(r = 0.83, p \ 0.001), which suggested a higher
nutrient sensitivity of this group of denitrifying
bacteria. Additionally, we found that correlations
between the amount of nirK denitrifiers and DOC and
pH are exponentional showing two important thresh-
old values, being 4.8 mol kg-1 and 5, respectively.
The amount of nirK denitrifiers rapidly decreased
below these values. The amount of nirK and nirS
denitrifiers was higher in the organic litter horizon
than the organic humus horizon at all sampling sites.
Keywords Dissolved organic matter �Available phosphorus � nirK and nirS denitrifiers �Acid forest soil � N depositions � qPCR
Introduction
Spruce forest soils in Central Europe were exposed to
high nitrogen (N) depositions during the second half of
the last century. Atmospheric N deposition is the major
anthropogenic source of N in terrestrial ecosystems of
the United States, Asia and Europe (Galloway et al.
2003; Galloway and Cowling 2002; Waldrop and Zak
2006). Because of N limitation in temperate forests,
additional N input can stimulate plant growth and
increase aboveground carbon (C) storage (Nadelhoffer
et al. 1999; Magill et al. 1997; Waldrop and Zak 2006).
However, high N depositions can decrease soil pH,
which leads to reduction of the soil acid neutralizing
capacity and leaching of a plant’s essential cations
(Ca2?, Mg2? and K?) (Dauer et al. 2007; Tomlinson
2003; Pawłowski 1997) and NO3- from the forest soils
(Kopacek et al. 2002a, b; Santruckova et al. 2006). One
of the reasons for higher NO3- leaching could be the
reduction in the amount of denitrifying bacteria in the
acid forest soils. However, direct evidence is missing.
Denitrification is the main anaerobic biotic process
leading to loses of fixed N as well as removal of
excess soluble nitrate (NO3-) and nitrite (NO2
-)
J. Barta (&) � T. Melichova � D. Vanek �T. Picek � H. Santruckova
Department of Ecosystem Biology, Faculty of Science,
University of South Bohemia, Branisovska 31, 370 05
Ceske Budejovice, Czech Republic
e-mail: [email protected]
123
Biogeochemistry
DOI 10.1007/s10533-010-9430-9
from the soil environment. The second step in
denitrification, the reduction of NO2- to nitric oxide
(NO), distinguishes ‘‘true’’ denitrifiers from other
NO3--respiring bacteria. This reaction is catalyzed
by two different types of nitrite reductases, either a
cytochrome cd1 encoded by the nirS gene (nirS
denitrifiers) or a Cu-containing enzyme encoded by
the nirK gene (nirK denitrifiers). NirS denitrifiers are
located mostly in the rhizosphere, while nirK denit-
rifiers are more abundant in bulk soil (Henry et al.
2004; Tiedje 1988). In this step of the denitrification
process, gaseous NO can escape from the environ-
ment. Therefore, a change in the amount of nirK
and nirS denitrifiers can regulate NO3- and NO2
-
leaching from acid forest soils.
Henry et al. (2004) found that the amount of nirK
denitrifiers can range from 104 to 106 gene copies per
gram of soil. This high difference was explained by
different amounts of soil organic carbon (Kandeler
et al. 2006); higher amounts of organic carbon were
positively correlated with nirK denitrifiers but not nirS
denitrifiers. The nirK denitrifiers are more taxonom-
ically diverse than nirS denitrifiers, however, the latter
are more abundant. They represent approximately
0.4% of total soil bacteria while the nirK less than
0.2% (Kandeler et al. 2006). It seems that the more
taxonomically diverse group of nirK denitrifiers is
more sensitive to environmental changes and nutrient
availability than the nirS denitrifiers. In highly acid-
ified spruce forest soils, the low pH affects many
biological and physical processes. The most important
factor is the amount of dissolved organic matter
(DOM), which rapidly decreases in low pH soils
(Greenland 1971; David et al. 1989). A lower amount
of DOM leads to lower nutrient availability for soil
bacteria and decreases their numbers. Recently, it was
shown that low pH negatively affected the activity of a
pure culture of Pseudomonas mandelii (nirS denitri-
fier) (Saleh-Lakha et al. 2009). These authors found
that the expression of the nirS gene was significantly
lower when the pH of the medium dropped below 5.
However, data from in situ experiments are still
missing.
The objectives of this work were to:
(i) evaluate the effect of DOM and pH on the
abundance of nirK and nirS denitrifiers;
(ii) compare the amount of nirK and nirS denitri-
fiers in different soil horizons.
Materials and methods
Study site description
Soil was collected from four different sampling sites in
October 2008. Two sites are located in the Bohemian
Forest in South Bohemia in the watersheds of two
glacial lakes (Plesne, PL and Certovo, CT) and two
sites are located in the Jizera Mountains (Cerna hora
(CH) and Snezne vezicky (SV)). In each site, four
random spots in three replicates were chosen. Soil was
collected from the organic litter layer (0–2 cm) and
organic humus layer (5–15 cm).
PL and CT are situated at 48�470 and 49�100 N,
and 13�520 and 13�110 E, respectively, at altitudes
from 1030 to 1090 m a.s.l. Both sites were affected
by the high acid N depositions of the last century.
Recently, both sites were subjected to large distur-
bances caused by bark beetle infestions. Watershed of
PL is covered with a 160 year-old Norway spruce
(Picea abies) forest with small areas of ash. The
bedrock is composed of granites. CL watershed is
covered with 90–150 year-old Norway spruce forests,
with sparse white fir (Abies alba) and European beech
(Fagus sylvatica); the bedrock is predominantly
composed of mica-schist (muscovite gneiss) with
quartzite intrusions. The understorey of both water-
sheds is dominated by hair grass (Avenella flexuosa),
reedgrass (Calamagrostis villosa), blueberry (Vacci-
nium myrtillus), and lady fern (Athyrium alpestre,
Svoboda et al. 2006). Soil types are mostly cambi-
sols, podzols and litosols on steep slopes in both
watersheds. Basic physico-chemical and biochemical
properties of the soils are described by Kopacek et al.
(2002a, b) and Vesely (1994).
CH and SV are situated at 50�490 and 50�500 N, and
15�110 and 15�130 E, respectively, at altitudes from
1055 to 1085 m a.s.l. Both sites are covered with
90–150 year-old Norway spruce forests (P. abies). The
bedrock is composed of granites. Soil types are mostly
podzols. The understorey of both sites is dominated by
hair grass (A. flexuosa), reedgrass (C. villosa), and
blueberry (V. myrtillus).
Soil chemical analyses
Total C and N (CTOT and NTOT, respectively) and
oxalate extractable P (POX) were analyzed in air-
dried, finely ground soil. CTOT and NTOT were
Biogeochemistry
123
measured using an elemental analyzer (NC Thermo-
Quest, Germany). Dissolved organic carbon (DOC)
and dissolved nitrogen (DN) were extracted step by
step in both cold water (CW) and hot water (HW):
water:soil, 10:1, v/w, 30 min at 20�C and 16 h at
80�C, respectively. DOC and DN in the CW and HW
extracts were determined on a TOC/TN analyzer
(SKALAR FORMACS HT). POX was determined by
extraction of 0.5 g of litter with 50 ml of acid
ammonium oxalate solution (0.2 M H2C2O4 ? 0.2 M
(NH4)2 C2O4 at pH 3) according to Cappo et al.
(1987), but with a three-step instead of continuous
extraction (Kopacek et al. 2002a). POX is supposed
to characterize the biological bioavailability of P in
soil (Koopmans et al. 2004; Pote et al. 1996;
Schwertmann 1964; van der Zee et al. 1987). Active
pH was determined in the CW extracts.
Extraction of DNA
Three replicates of each soil sample (0.25 g) were
taken for DNA extraction. For the isolation of
genomic DNA from soil, the Power Soil DNA
Isolation kit (MoBio Laboratories Inc. Carlsbad,
CA, USA) was used according to manufacturer’s
instructions with some modification. A Mini Bead-
Beater (BioSpec Products, Inc; speed of 6 m s-1 for
45 s) was used for better disruption of cell walls.
DNA was stored in 1.5 ml Eppendorf microtubes in a
freezer (-20�C) until the next analyses.
qPCR assay
Quantitative PCR was performed with an ABI Step
One (Applied Biosystems) by using SYBR green as the
detection system in a reaction mixture of 20 ll
containing 0.5 lM (each) primer; 10 ll of Power
SYBR�Green PCR master mix, including AmpliTaq
Gold� DNA Polymerase, Power SYBR�Green PCR
buffer, deoxynucleoside triphosphate mix with dUTP,
SYBR green I, ROX, and 5 mM MgCl2 (Power
SYBR�Green PCR Master Mix; Applied Biosystems,
USA); and 2 ll of tempalte DNA corresponding to
10 ng of total DNA. Bovine serum albumin (BSA,
500 ng/reaction; Fermentas, Italy) and dimethylsulf-
oxide (DMSO, 12.5 lmol/reaction) were used to
enhance PCR efficiency. 16S rDNA gene copy num-
bers were determined using the eubacterial primers
341f (5-CCT ACG GGA GGC AGC AG-3) and 515r
(5-ATT CCG CGG CTG GCA-3) as described by
Henry et al. (2004). The conditions for 16S rDNA real-
time PCRs were 600 s at 95�C for enzyme activation
(based on manufacturer recommendation) and 30
cycles of 15 s at 95�C, 30 s at 60�C and 30 s at 72�C
for the denaturation, annealing and extension steps,
respectively (Lopez-Gutierrez et al. 2004). The prim-
ers nirK876 (50-ATY GGC GGV CAY GGC GA-30)and nirK1040 (50-GCC TCG ATC AGR TTR TGG TT-
30) were used for quantification of nirK denitrifiers
(Henry et al. 2006). For the quantification of nirS
denitrifiers, the primers nirSCd3aF (50-AACGY-
SAAGGARACSGG-30) and nirSR3 cd (50-GASTTCGGRTGSGTCTTSAYGAA-30) were used
as described by Kandeler et al. (2006). The conditions
for nirK and nirS real-time PCRs were described
elsewhere (Henry et al. 2006; Kandeler et al. 2006).
Fluorescence was measured after each extension step.
Melting curve and agarose electrophoresis (1.5% w/v,
110 V, 45 min) was performed for quality verification
of the PCR product after each qPCR. Thermal cycling,
fluorescent data collection, and data analysis were
carried out with ABI Step One. Two independent
qPCRs were performed for each gene and soil repli-
cate. Standard curves were obtained with serial tenfold
plasmid dilutions of a known amount of plasmid DNA
containing a fragment of the 16S rDNA, nirK and nirS
genes, respectively.
The extracted DNA from the soil samples was also
tested for the inhibitory effects of co-extracted
substances (i.e. humic and fulvic acids) by determin-
ing the 16S rDNA, nirK and nirS gene copy numbers
in tenfold and 100-fold dilutions of the soil DNA
extract. In addition, standard plasmid DNA was
quantified with and without the addition of environ-
mental DNA, and the obtained values were included
into the calculation of 16S rDNA, nirK and nirS gene
copy numbers as correction factors. Also DNA
extraction efficiency (ng DNA per g soil) was
included into the calculation.
Using the SYBR green assay and degenerate
primers for the nirK and nirS genes, it was possible
to discriminate against the primer dimer fluorescence
by acquiring data at a temperature of 80�C, which is
above the melting point of these by-products (Henry
et al. 2006). This temperature was verified by melting
curve analysis (data not shown). The gene copies in
the no template controls (NTCs) were 0 and less than
ten copies for nirK and nirS, respectively. Less than
Biogeochemistry
123
ten copies per assay were observed for the 16S rDNA
gene. According to threshold cycles (CT) of standards
and the NTC values, a detection limit of approxi-
mately 10–100 gene copies per assay was achieved
for nirK, nirS and 16S rDNA quantification, which
corresponds to 102–103 gene copies per gram of
dry soil.
Statistical evaluation
Basic statistical analyses were performed using Stat-
istica 8.0 (StatSoft). One-way ANOVA (soil layer as
independent variable), followed by the Tukey HSD
test was used for testing the differences between
soil quality characteristics of the four sampling sites.
One-way ANOVA (site as independent variable),
followed by the Tukey HSD test was used for testing
the differences between the amount of nirK, nirS and
16S rDNA gene copies of the four sampling sites.
Linear regression was used to test the correlation of
DOC, DN, DOCCW, DNCW, and pH with the 16S
rDNA, nirK and nirS gene copy numbers. Correlation
coefficients (r) with p values were evaluated.
For pH and DOC, an exponential relationship was
compared (R2PH ¼ 0:802; R2
DOC ¼ 0:756), because it
fitted better the experimental data values and
explained more variability than the linear relationship
(R2pH ¼ 0:728; R2
DOC ¼ 0:742).
Results
Amount of DOM in different soil horizons
and sampling sites
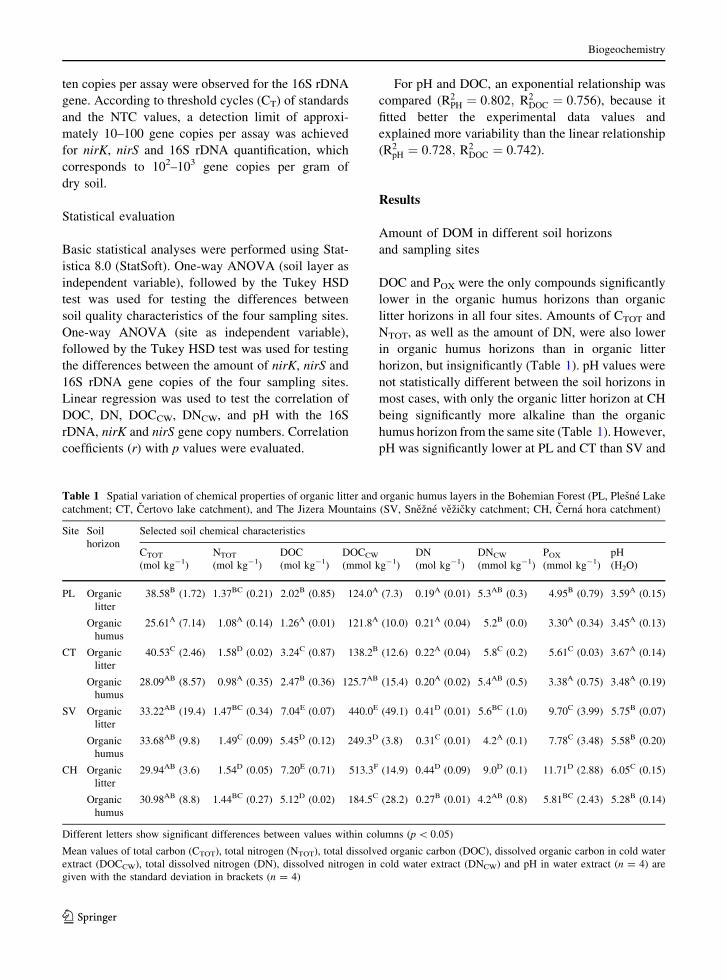
DOC and POX were the only compounds significantly
lower in the organic humus horizons than organic
litter horizons in all four sites. Amounts of CTOT and
NTOT, as well as the amount of DN, were also lower
in organic humus horizons than in organic litter
horizon, but insignificantly (Table 1). pH values were
not statistically different between the soil horizons in
most cases, with only the organic litter horizon at CH
being significantly more alkaline than the organic
humus horizon from the same site (Table 1). However,
pH was significantly lower at PL and CT than SV and
Table 1 Spatial variation of chemical properties of organic litter and organic humus layers in the Bohemian Forest (PL, Plesne Lake
catchment; CT, Certovo lake catchment), and The Jizera Mountains (SV, Snezne vezicky catchment; CH, Cerna hora catchment)
Site Soil
horizon
Selected soil chemical characteristics
CTOT
(mol kg-1)
NTOT
(mol kg-1)
DOC
(mol kg-1)
DOCCW
(mmol kg-1)
DN
(mol kg-1)
DNCW
(mmol kg-1)
POX
(mmol kg-1)
pH
(H2O)
PL Organic
litter
38.58B (1.72) 1.37BC (0.21) 2.02B (0.85) 124.0A (7.3) 0.19A (0.01) 5.3AB (0.3) 4.95B (0.79) 3.59A (0.15)
Organic
humus
25.61A (7.14) 1.08A (0.14) 1.26A (0.01) 121.8A (10.0) 0.21A (0.04) 5.2B (0.0) 3.30A (0.34) 3.45A (0.13)
CT Organic
litter
40.53C (2.46) 1.58D (0.02) 3.24C (0.87) 138.2B (12.6) 0.22A (0.04) 5.8C (0.2) 5.61C (0.03) 3.67A (0.14)
Organic
humus
28.09AB (8.57) 0.98A (0.35) 2.47B (0.36) 125.7AB (15.4) 0.20A (0.02) 5.4AB (0.5) 3.38A (0.75) 3.48A (0.19)
SV Organic
litter
33.22AB (19.4) 1.47BC (0.34) 7.04E (0.07) 440.0E (49.1) 0.41D (0.01) 5.6BC (1.0) 9.70C (3.99) 5.75B (0.07)
Organic
humus
33.68AB (9.8) 1.49C (0.09) 5.45D (0.12) 249.3D (3.8) 0.31C (0.01) 4.2A (0.1) 7.78C (3.48) 5.58B (0.20)
CH Organic
litter
29.94AB (3.6) 1.54D (0.05) 7.20E (0.71) 513.3F (14.9) 0.44D (0.09) 9.0D (0.1) 11.71D (2.88) 6.05C (0.15)
Organic
humus
30.98AB (8.8) 1.44BC (0.27) 5.12D (0.02) 184.5C (28.2) 0.27B (0.01) 4.2AB (0.8) 5.81BC (2.43) 5.28B (0.14)
Different letters show significant differences between values within columns (p \ 0.05)
Mean values of total carbon (CTOT), total nitrogen (NTOT), total dissolved organic carbon (DOC), dissolved organic carbon in cold water
extract (DOCCW), total dissolved nitrogen (DN), dissolved nitrogen in cold water extract (DNCW) and pH in water extract (n = 4) are
given with the standard deviation in brackets (n = 4)
Biogeochemistry
123

CH. Comparing the highly acidic soils (PL and CT)
with the more alkaline soils (SV and CH) we can see
also significantly higher amounts of DOM and POX at
SV and CH soils than at PL and CT soils (Table 1).
Amounts of 16S rDNA, nirK and nirS gene copy
numbers in soil horizons
The total number of 16S rDNA gene copy numbers in
the organic litter horizon was significantly higher at
SV and CH than PL and CT (Fig. 1). A similar
pattern was observed for the nirK denitrifiers. On the
contrary, nirS denitrifiers showed the opposite trend.
However, the number of nirS denitrifiers was two
orders lower than the number of nirK denitrifiers
(Fig. 1).
The total number of bacteria at the organic humus
horizon was significantly lower than the organic litter
layer and significantly higher at SV and CH (Fig. 1).
The amount of nirS denitrifiers was again two orders
lower and was on the detection limit of the qPCR
methodology.
5,93E+08
1,36E+09
0,0E+00
1,0E+09
2,0E+09
3,0E+09
4,0E+09
5,0E+09
6,0E+09
7,0E+09
8,0E+09
9,0E+09
PL CT SV CH
gen
e co
pie
s.g
-1
organic litter horizon
16SrDNA
c
d
b
a
2,99E+08 3,09E+08
PL CT SV CH
organic humus horizon16SrDNA
a a
b
c
2,75E+04 1,49E+040,0E+00
2,0E+05
4,0E+05
6,0E+05
8,0E+05
1,0E+06
1,2E+06
1,4E+06
1,6E+06
PL CT SV CH
gen
e co
pie
s.g
-1
nirK
a a
b
bc
2,30E+04 4,22E+04
PL CT SV CH
nirK
a a
b b
3,75E+020,0E+00
1,0E+04
2,0E+04
3,0E+04
4,0E+04
5,0E+04
6,0E+04
7,0E+04
0,0E+00
1,0E+09
2,0E+09
3,0E+09
4,0E+09
5,0E+09
6,0E+09
7,0E+09
8,0E+09
9,0E+09
0,0E+00
2,0E+05
4,0E+05
6,0E+05
8,0E+05
1,0E+06
1,2E+06
1,4E+06
1,6E+06
0,0E+00
1,0E+04
2,0E+04
3,0E+04
4,0E+04
5,0E+04
6,0E+04
7,0E+04
PL CT SV CH
gen
e co
pie
s.g
-1
nirS
a
b
c
d
2,06E+03 1,59E+03
PL CT SV CH
nirS
a a
b
ND
Fig. 1 Total amount of bacteria (16SrDNA gene copy numbers), and nirK and nirS denitrifiers in organic litter and organic humus
horizons at PL, CT, SV and CH. ND not detected. Different letters show significant differences between sites (n = 4, p \ 0.05)
Biogeochemistry
123
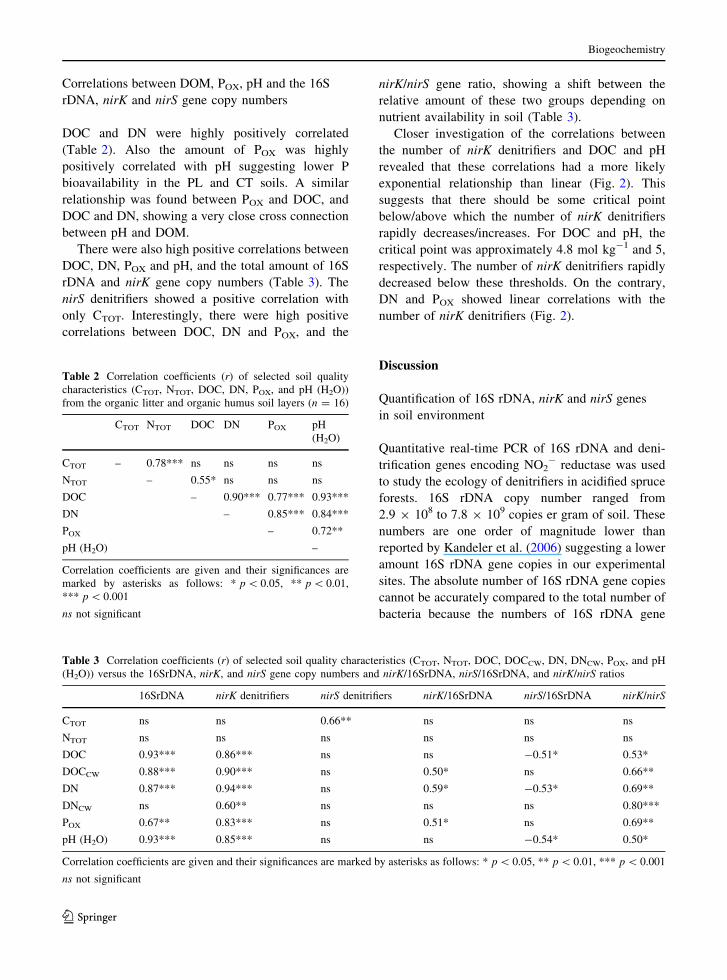
Correlations between DOM, POX, pH and the 16S
rDNA, nirK and nirS gene copy numbers
DOC and DN were highly positively correlated
(Table 2). Also the amount of POX was highly
positively correlated with pH suggesting lower P
bioavailability in the PL and CT soils. A similar
relationship was found between POX and DOC, and
DOC and DN, showing a very close cross connection
between pH and DOM.
There were also high positive correlations between
DOC, DN, POX and pH, and the total amount of 16S
rDNA and nirK gene copy numbers (Table 3). The
nirS denitrifiers showed a positive correlation with
only CTOT. Interestingly, there were high positive
correlations between DOC, DN and POX, and the
nirK/nirS gene ratio, showing a shift between the
relative amount of these two groups depending on
nutrient availability in soil (Table 3).
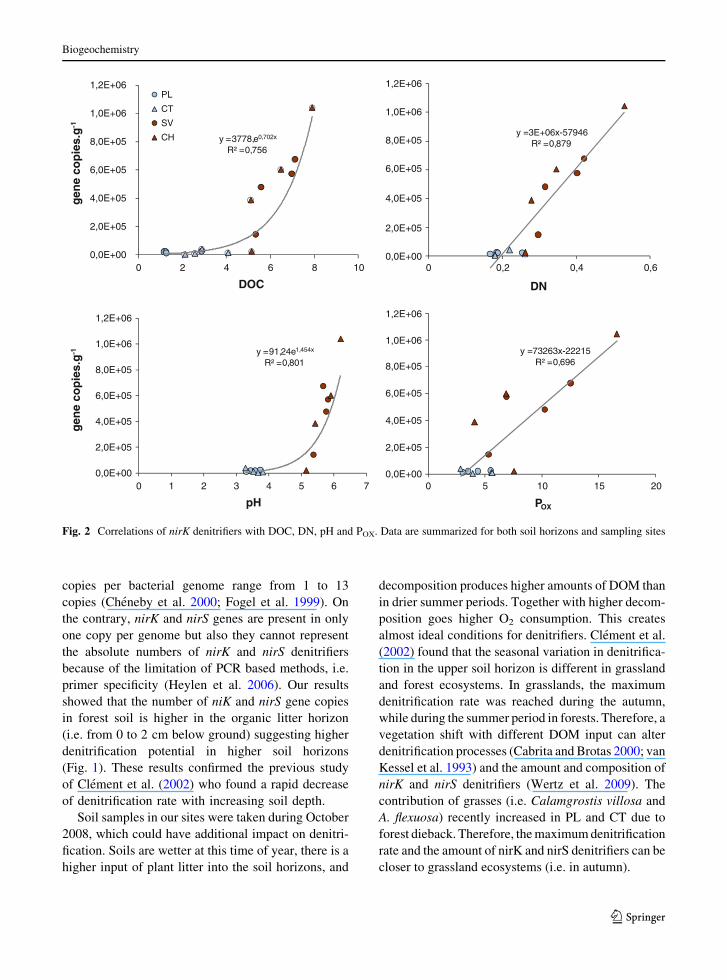
Closer investigation of the correlations between
the number of nirK denitrifiers and DOC and pH
revealed that these correlations had a more likely
exponential relationship than linear (Fig. 2). This
suggests that there should be some critical point
below/above which the number of nirK denitrifiers
rapidly decreases/increases. For DOC and pH, the
critical point was approximately 4.8 mol kg-1 and 5,
respectively. The number of nirK denitrifiers rapidly
decreased below these thresholds. On the contrary,
DN and POX showed linear correlations with the
number of nirK denitrifiers (Fig. 2).
Discussion
Quantification of 16S rDNA, nirK and nirS genes
in soil environment
Quantitative real-time PCR of 16S rDNA and deni-
trification genes encoding NO2- reductase was used
to study the ecology of denitrifiers in acidified spruce
forests. 16S rDNA copy number ranged from
2.9 9 108 to 7.8 9 109 copies er gram of soil. These
numbers are one order of magnitude lower than
reported by Kandeler et al. (2006) suggesting a lower
amount 16S rDNA gene copies in our experimental
sites. The absolute number of 16S rDNA gene copies
cannot be accurately compared to the total number of
bacteria because the numbers of 16S rDNA gene
Table 2 Correlation coefficients (r) of selected soil quality
characteristics (CTOT, NTOT, DOC, DN, POX, and pH (H2O))
from the organic litter and organic humus soil layers (n = 16)
CTOT NTOT DOC DN POX pH
(H2O)
CTOT – 0.78*** ns ns ns ns
NTOT – 0.55* ns ns ns
DOC – 0.90*** 0.77*** 0.93***
DN – 0.85*** 0.84***
POX – 0.72**
pH (H2O) –
Correlation coefficients are given and their significances are
marked by asterisks as follows: * p \ 0.05, ** p \ 0.01,
*** p \ 0.001
ns not significant
Table 3 Correlation coefficients (r) of selected soil quality characteristics (CTOT, NTOT, DOC, DOCCW, DN, DNCW, POX, and pH
(H2O)) versus the 16SrDNA, nirK, and nirS gene copy numbers and nirK/16SrDNA, nirS/16SrDNA, and nirK/nirS ratios
16SrDNA nirK denitrifiers nirS denitrifiers nirK/16SrDNA nirS/16SrDNA nirK/nirS
CTOT ns ns 0.66** ns ns ns
NTOT ns ns ns ns ns ns
DOC 0.93*** 0.86*** ns ns -0.51* 0.53*
DOCCW 0.88*** 0.90*** ns 0.50* ns 0.66**
DN 0.87*** 0.94*** ns 0.59* -0.53* 0.69**
DNCW ns 0.60** ns ns ns 0.80***
POX 0.67** 0.83*** ns 0.51* ns 0.69**
pH (H2O) 0.93*** 0.85*** ns ns -0.54* 0.50*
Correlation coefficients are given and their significances are marked by asterisks as follows: * p \ 0.05, ** p \ 0.01, *** p \ 0.001
ns not significant
Biogeochemistry
123
copies per bacterial genome range from 1 to 13
copies (Cheneby et al. 2000; Fogel et al. 1999). On
the contrary, nirK and nirS genes are present in only
one copy per genome but also they cannot represent
the absolute numbers of nirK and nirS denitrifiers
because of the limitation of PCR based methods, i.e.
primer specificity (Heylen et al. 2006). Our results
showed that the number of niK and nirS gene copies
in forest soil is higher in the organic litter horizon
(i.e. from 0 to 2 cm below ground) suggesting higher
denitrification potential in higher soil horizons
(Fig. 1). These results confirmed the previous study
of Clement et al. (2002) who found a rapid decrease
of denitrification rate with increasing soil depth.
Soil samples in our sites were taken during October
2008, which could have additional impact on denitri-
fication. Soils are wetter at this time of year, there is a
higher input of plant litter into the soil horizons, and
decomposition produces higher amounts of DOM than
in drier summer periods. Together with higher decom-
position goes higher O2 consumption. This creates
almost ideal conditions for denitrifiers. Clement et al.
(2002) found that the seasonal variation in denitrifica-
tion in the upper soil horizon is different in grassland
and forest ecosystems. In grasslands, the maximum
denitrification rate was reached during the autumn,
while during the summer period in forests. Therefore, a
vegetation shift with different DOM input can alter
denitrification processes (Cabrita and Brotas 2000; van
Kessel et al. 1993) and the amount and composition of
nirK and nirS denitrifiers (Wertz et al. 2009). The
contribution of grasses (i.e. Calamgrostis villosa and
A. flexuosa) recently increased in PL and CT due to
forest dieback. Therefore, the maximum denitrification
rate and the amount of nirK and nirS denitrifiers can be
closer to grassland ecosystems (i.e. in autumn).
y =3E+06x-57946R² =0,879
0 0,2 0,4 0,6
DN
y =3778,e0,702x
R² =0,756
0,0E+00
2,0E+05
4,0E+05
6,0E+05
8,0E+05
1,0E+06
1,2E+06
10
gen
e co
pie
s.g
-1
DOC
PL
CT
SV
CH
y =91,24e1,454x
R² =0,801
0,0E+00
2,0E+05
4,0E+05
6,0E+05
8,0E+05
1,0E+06
1,2E+06
0,0E+00
2,0E+05
4,0E+05
6,0E+05
8,0E+05
1,0E+06
1,2E+06
0,0E+00
2,0E+05
4,0E+05
6,0E+05
8,0E+05
1,0E+06
1,2E+06
0 2 4 6 8
0 1 2 3 4 5 6 7
gen
e co
pie
s.g
-1
pH
y =73263x-22215R² =0,696
0 5 10 15 20
POX
Fig. 2 Correlations of nirK denitrifiers with DOC, DN, pH and POX. Data are summarized for both soil horizons and sampling sites
Biogeochemistry
123
Amount of DOM in acid forest soils
The amount of DOM in soil pore water plays a
crucial role in the availability of nutrients for soil
microorganisms. When the amount of DOM is low it
becomes limiting for soil microorganisms leading to
starvation and reduction of biochemical processes.
The major factor influencing the amount of DOM is
pH (Quails and Raines 1992; Greenland 1971; David
et al. 1989). Soils at PL and CT are highly acidic,
which leads to significantly lower amounts of DOC,
DN and available P (POX) than at SV and CH
(Table 1). Close relationships between these DOM
fractions and pH were confirmed in our soils
(Table 2). Three major mechanisms were proposed
to explain this relation: (i) formation of insoluble
compounds and subsequent flocculation of organic
molecules, (ii) adsorption of organic molecules on
clay material through cation bridging and (iii)
complexation of organic molecules with polyvalent
cations (Greenland 1971). All three processes seem to
be operating. However, complexation of OM with
polyvalent cations should be the most important
process in our soils. In PL and CT, acidification was
interconnected with higher mobility of toxic Al3?
forms, which can precipitate DOM making it
unavailable for biological processes (Kana and Ko-
pacek 2006; Northup et al. 1998; Tomlinson 2003).
Schindler et al. (1992) described the negative effect
of Al3? on OM solubility in acidified lakes. These
authors found that DOC may also precipitate with
Fe(OH)3 at pH \4, which leads to an additional
decrease of DOC amount. Moreover, high concen-
trations of Al3? can damage bacterial membranes
leading to higher bacterial mortality (Yaganza et al.
2004), which corresponds with our results of a one
order magnitude decrease in 16S rDNA gene copies
at PL and CT (Fig. 1). All of these effects could
explain the exponential relationship between the
number of nirK denitrifiers and DOC, and the rapid
reduction of nirK denitrifiers at pH \4 at these sites.
Correlation between the amount of denitrifiers
and available DOM
As mentioned above, PL and CT were strongly
affected by a bark beetle infestation, which has led to
an enormous spruce forest dieback and high amount
of spruce needles which have accumulated in the
organic litter horizon. The relatively slow decompo-
sition of spruce needles (Barta et al. 2010) produces a
high amount of organic acids, which leads to
secondary acidification of PL and CT (Santruckova
et al. 2004, 2006, 2007).
Therefore, in these extremely acidic soils, both
Al3? and Fe3? ions co-precipitate organic matter
which leads to an enormous nutrient limitation for
soil microorganisms. The nirK denitrifiers seem to be
more sensitive to these nutrient changes than nirS
denitrifiers. These results are in agreement with
Kandeler et al. (2006). However, the nirK denitrifiers
are still more abundant than nirS denitrifiers in our
sites. They are more abundant in the bulk soil where
selective pressure and nutrient limitation are higher
than in the rhizosphere where the nirS denitrifiers are
preferred (Henry et al. 2004). The nirS denitrifiers
have one advantage over the nirK denitrifier which is
that plants exhude compounds which stimulate the
overall growth of bacteria in the rhizosphere (Rosch
et al. 2002; Livsey and Barklund 1992). Thus, the
lower amount of DOM in bulk soil does not have so
dramatic effect on shift of nirS gene abundance.
Recently, some studies showed that the nirK gene
may be more preferable for horizontal gene transfer
(HRT) than the nirS gene. The nirK gene was found
in highly taxonomically diverse bacterial groups. The
gene was ‘‘spread’’ among the same habitat and does
not correlate with 16S rDNA phylogeny as the nirS
does (Heylen et al. 2006). At PL and CT, the lower
amount of DOM could therefore decrease the rate of
HRT between soil bacteria making them less effec-
tive in reducing higher amounts of NO3- and NO2
-.
These can than leach from the forest ecosystem.
In our previous work we found that P availability
(POX) plays an important role in litter decomposition
at PL and CT and is more important than the
availability of C and N. Also the composition of
bacterial and fungal communities strongly correlated
with the amount of POX. The overall biodiversity and
enzymatic activity of decomposing microorganisms
were much higher in litter with higher amount of POX
(i.e. grasses) than in litter which contained low
amount of POX (i.e. spruce needles) (Barta et al.
2010). In our current study, we found that also the
amount of nirK denitrifiers strongly depends on POX
(Table 3). Litter decomposition and nutrient avail-
ability in the upper soil horizons are closely con-
nected. Lower microbial biodiversity on spruce
Biogeochemistry
123
needles can lead to lower decomposition and lower
amount of released nutrients into the upper soil
horizons (Sinsabaugh et al. 2002, 2005). Addition-
ally, lower ligninolytic enzymatic activity leaves a
higher amount of recalcitrant polyphenolics which
are not available to most soil bacteria including
denitrifiers (Snajdr et al. 2008). Therefore, it seems
that this is an additional process to those mentioned
above, which leads to the reduction of denitrification
potential in acidified spruce forests.
The nirK/nirS ratio
The amount of nirS denitrifiers did not show any
correlation with DOM, however, there was a high
positive correlation between DOM and the nirK/nirS
ratio. A higher amount of DOM shifts the ratio to the
nirK denitrifiers while in lower amounts of DOM the
ratio decreases with a higher relative contribution of
nirS denitrifiers. These results are in agreement with
Winder and Levy-Booth (2009). These authors studied
the effect of clear-cutting in Douglas-fir stands and
found a similar reduction in the amount of denitrifiers.
In conclusion, DOM appears to strongly affect the
amount of denitrifying bacteria, especially the nirK
denitrifiers, which are highly sensitive to the amount
of DOM and soil pH. This can reduce denitrification
rate in the organic litter and organic humus horizons,
which can lead to increased NO3- and NO2
-
leaching from highly acidic spruce forest soils.
Acknowledgements This study was supported by the Czech
Science Foundation, project 526/08/0751 and 206/07/1200 and
the project MSM 6007665801. We acknowledge the laboratory
and field assistance provided by our colleagues and students.
We also thank the authorities of NP Sumava and The Jizera
Mountains for permission to study the spruce forest
ecosystems. We thank our American colleague Dr. Keith
Edwards for language correction.
References
Barta J, Applova M, Vanek D, Kristufkova M, Santruckova H
(2010) Effect of available P and phenolics on mineral N
release in acidified spruce forest: connection with lignin-
degrading enzymes and bacterial and fungal communities.
Biogeochemistry 97:71–87
Cabrita MT, Brotas V (2000) Seasonal variation in denitrifi-
cation and dissolved nitrogen fluxes in intertidal sedi-
ments of the Tagus estuary, Portugal. Mar Ecol 202: 51–
65
Cappo KA, Blume LJ, Raab GA, Bartz JK, Engels JL (1987)
Analytical methods manual for the direct/delayed
response project soil survey. US EPA, Las Vegas (sec-
tions 8–11)
Cheneby D, Philippot L, Hartmann A, Henault F, Germon JC
(2000) 16S rRNA analysis for characterization of deni-
trifying bacteria isolated from three agricultural soils.
FEMS Microbiol Ecol 34:121–128
Clement JC, Pinay G, Marmonier P (2002) Seasonal dynamics
of denitrification along topohydrosequences in three dif-
ferent riparian wetlands. J Environ Qual 31:1025–1037
Dauer JM, Chorover J, Chadwick OA, Oleksyn J, Tjoelker
MG, Hobbie SE, Reich PB, Eissen-stat DM (2007) Con-
trols over leaf and litter calcium concentrations among
temperate trees. Biogeochemistry 86:175–187
David MB, Vance GF, Rissing JM, Stevenson FJ (1989)
Organic carbon fractions in extracts of O and B horizons
from a New England spodsols: effect of acid treatment.
J Environ Qual 18:212–217
Fogel GB, Collins CR, Li J, Brunk CF (1999) Prokaryotic
genome size and SSU rDNA copy number: estimation of
microbial relative abundance from a mixed population.
Microb Ecol 38:93–113
Galloway JN, Cowling EB (2002) Reactive nitrogen and the
world: 200 years of change. Ambio 31:64–71
Galloway JN, Aber JD, Erisman JW, Seitzinger SP, Howarth
RW, Cowling EB, Cosby BJ (2003) The nitrogen cascade.
Bioscience 53:341–356
Greenland DJ (1971) Adsorption of humic and fulvic acids by
soils. Soil Sci 111:34–43
Henry S, Baudion E, Lopez-Guiterez JC, Martin-Laurent F,
Brauman A, Philippot L (2004) Quantification of deni-
trifying bacteria in soils by nirK gene targeted real-time
PCR. J Microbiol Methods 59:327–335
Henry S, Bru D, Stres B, Hallet S, Philippot L (2006) Quan-
titative detection of the nosZ gene, encoding nitrous oxide
reductase, and comparison of the abundances of 16S
rRNA, narG, nirK, and nosZ genes in soils. Appl Environ
Microbiol 72:5181–5189
Heylen K, Gevers D, Vanparys B, Wittebolle L, Geets J, Boon
N, De Vos P (2006) The incidence of nirS and nirK and
their genetic heterogeneity in cultivated denitrifiers.
Environ Microbiol 8:2012–2021
Kana J, Kopacek J (2006) Impact of soil sorption characteris-
tics and bedrock composition on phosphorus concentra-
tions in two Bohemian Forest Lakes. Water Air Soil Pollut
173:243–259
Kandeler E, Deighlmayr K, Tscherko D, Bru D, Philippot L
(2006) Abundance of narG, nirS, nirK, and nosZ genes of
denitrifying bacteria during primary successions of a
glacier foreland. Appl Environ Microbiol 72:5957–5962
Koopmans GF, Chardon WJ, de Willigen P, van Riemsdijk
WH (2004) Phosphorus desorption dynamics in soil and
the link to a dynamic concept of bioavailability. J Environ
Qual 33:1393–1402
Kopacek J, Kana J, Santruckova H, Porcal P, Hejzlar J, Picek
T, Vesely J (2002a) Physical, chemical, and biochemical
characteristics of soils in watersheds of the Bohemian
Forest Lakes: I. Plesne Lake. Silva Gabreta 8:43–62
Kopacek J, Kana J, Santruckova H, Porcal P, Hejzlar J, Picek
T, Simek M, Vesely J (2002b) Physical, chemical, and
Biogeochemistry
123
biochemical characteristics of soils in watersheds of the
Bohemian Forest Lakes: II.Certovo and Cerne Lakes.
Silva Gabreta 8:63–93
Livsey S, Barklund P (1992) Lophodermium piceae and Rhi-zosphaera kalkhoffii in fallen needles of Norway spruce
(Picea abies). Eur J For Pathol 22:204–216
Lopez-Gutierrez J, Henry S, Hallet S, Martin-Laurent F, Ca-
troux G, Philippot L (2004) Quantification of a novel
group of nitrate-reducing bacteria in the environment by
real-time PCR. J Microbiol Methods 57:399–407
Magill AH, Aber JD, Hendricks JJ, Bowden RD, Melillo JM,
Steudler PA (1997) Biogeochemical response of forest
ecosystems to simulated chronic nitrogen deposition. Ecol
Appl 7:402–415
Nadelhoffer KJ, Emmett BA, Gundersen P, Kjonaas OJ,
Koopmans CJ, Schleppi P, Tietema A (1999) Nitrogen
deposition makes a minor contribution to carbon seques-
tration in temperate forests. Nature 398:145–148
Northup RR, Dahlgren RA, McColl JG (1998) Polyphenols as
regulators of plant-litter-soil interactions in northern
Californias pygmy forest: a positive feedback? Biogeo-
chemistry 42:189–220
Pawłowski L (1997) Acidification: its impact on the environ-
ment and mitigation strategies. Ecol Eng 8:271–288
Pote DH, Daniel TC, Sharpley AN, Moore PA, Edwards DR,
Nichols DJ (1996) Relating extractable soil phosphorus to
phosphorus losses in runoff. Soil Sci Am J 60:855–859
Quails RG, Raines BL (1992) Biodegradability of dissolved
organic matter in forest throughfall, soil solution, and
stream water. Soil Sci Soc Am J 56:578–586
Rosch C, Mergel A, Bothe H (2002) Biodiversity of denitri-
fying and dinitrogen-fixing bacteria in an acid forest soil.
Appl Environ Microbiol 68:3818–3829
Saleh-Lakha S, Shannon KE, Henderson SL, Goyer C, Trevors
JT, Zebarth BJ, Buton DL (2009) Effect of pH and tem-
perature on denitrification gene expression and activity in
Pseudomonas mandelii. Appl Environ Microbiol 75:
3903–3911
Santruckova H, Vrba J, Picek T, Kopacek J (2004) Soil bio-
chemical activity and phosphorus transformations and
losses from acidified forest soils. Soil Biol Biochem 36:
1569–1576
Santruckova H, Kristufkova M, Vanek D (2006) Decomposi-
tion rate and nutrient release from plant litter of Norway
spruce forest in the Bohemian Forest. Biologia (Bratisl)
61:S499–S508
Santruckova H, Santrucek J, Setlik J, Svoboda M, Kopacek J
(2007) Carbon isotopes in tree rings of Norway spruce
exposed to atmospheric pollution. Environ Sci Technol
41:5778–5782
Schindler DW, Bayley SE, Curtis PJ, Parker BR, Stainton MP,
Kelly CA (1992) Natural and man-caused factors affect-
ing the abundance and cycling of dissolved organic
substances in Precambrian shield lakes. Hydrobiology
229:1–21
Schwertmann U (1964) Differenzierung der eisenoxiden des
bodens duerch extraction mit amoniumoxalaat losung. Z
Pflanzenerahr Dung Bodenkd 105:194–202
Sinsabaugh RL, Carreiro MM, Repert DA (2002) Allocation of
extracellular enzymatic activity in relation to litter com-
position, N deposition, and mass loss. Biogeochemistry
60:1–24
Sinsabaugh RL, Gallo ME, Lauber C, Waldrop MP, Zak DR
(2005) Extracellular enzyme activities and soil organic
matter dynamics for northern hardwood forests receiv-
ing simulated nitrogen deposition. Biogeochemistry 75:
201–215
Snajdr J, Valaskova V, Merhautova V, Herinkova J, Cajthaml
T, Baldrian P (2008) Spatial variability of enzyme activ-
ities and microbial biomass in the upper layers of Quercuspetraea forest soil. Soil Biol Biochem 40:2068–2075
Svoboda M, Matejka K, Kopacek J (2006) Biomass and ele-
ment pools of understory vegetation in the catchments of
Certovo Lake and Plesne Lake in the Bohemian Forest.
Biologia (Bratisl) 61:S509–S521
Tiedje JM (1988) Ecology of denitrification and dissimilatory
nitrate reduction to ammonium. In: Zehnder A (ed)
Biology of anaerobic microorganisms. Wiley, New York,
pp 179–244
Tomlinson GH (2003) Acid deposition, nutrient leaching and
forest growth. Biogeochemistry 65:51–81
van der Zee SEATM, Fokkink LGJ, van Riemsdijk WH (1987)
A new technique for assessment of reversibly adsorbed
phosphate. Soil Sci Am J 51:599–604
van Kessel C, Pennock DJ, Farrell RE (1993) Seasonal varia-
tions in denitrification and nitrous oxide evolution at the
landscape scale. Soil Sci Soc Am J 57:988–995
Vesely J (1994) Investigation of the nature of the Sumava
lakes: a review. J Natl Mus Nat Hist Ser 163:103–120
Waldrop MP, Zak DR (2006) Response of oxidative enzyme
activities to nitrogen deposition affects soil concentrations
of dissolved organic carbon. Ecosystems 9:921–933
Wertz S, Dandie CE, Goyer C, Trevors JT, Pattern CL (2009)
Diversity of nirK denitrifying genes and transcripts in an
agricultural soil. Appl Environ Microbiol 75:7365–7377
Winder RS, Levy-Booth DJ (2009) Quantification of nitrogen
cycling functional gene abundance in soil of variably-
retained stands of Douglas-fir (Pseudotsuga menziesii ssp.
menziesii (Mirb.) Franco). Working papers of the Finnish
Forest Research Institute 128:225
Yaganza ES, Rioux D, Simard M, Arul Jl, Tweddell RJ (2004)
Ultrastructural alterations of Erwinia carotovora subsp.
atroseptica caused by treatment with aluminum chloride
and sodium metabisulfite. Appl Environ Microbiol 70:
6800–6808
Biogeochemistry
123


![genetic variation of norway spruce (picea abies [l.] karst ...](https://static.fdokumen.com/doc/165x107/633d6582b988f9753c06267d/genetic-variation-of-norway-spruce-picea-abies-l-karst-.jpg)