Sources, Distributions, and Dynamics of Dissolved Organic ...
26
ORIGINAL RESEARCH published: 18 October 2016 doi: 10.3389/fmars.2016.00198 Frontiers in Marine Science | www.frontiersin.org 1 October 2016 | Volume 3 | Article 198 Edited by: Toshi Nagata, University of Tokyo, Japan Reviewed by: X. Antón Álvarez-Salgado, Spanish National Research Council, Spain Gerhard Kattner, Alfred Wegener Institute, Germany *Correspondence: Yuan Shen [email protected] Specialty section: This article was submitted to Marine Biogeochemistry, a section of the journal Frontiers in Marine Science Received: 17 August 2016 Accepted: 26 September 2016 Published: 18 October 2016 Citation: Shen Y, Benner R, Robbins LL and Wynn JG (2016) Sources, Distributions, and Dynamics of Dissolved Organic Matter in the Canada and Makarov Basins. Front. Mar. Sci. 3:198. doi: 10.3389/fmars.2016.00198 Sources, Distributions, and Dynamics of Dissolved Organic Matter in the Canada and Makarov Basins Yuan Shen 1 *, Ronald Benner 1, 2 , Lisa L. Robbins 3 and Jonathan G. Wynn 4 1 Marine Science Program, University of South Carolina, Columbia, SC, USA, 2 Department of Biological Sciences, University of South Carolina, Columbia, SC, USA, 3 US Geological Survey, St. Petersburg Coastal and Marine Science Center, St. Petersburg, FL, USA, 4 School of Geosciences, University of South Florida, Tampa, FL, USA A comprehensive survey of dissolved organic carbon (DOC) and chromophoric dissolved organic matter (CDOM) was conducted in the Canada and Makarov Basins and adjacent seas during 2010–2012 to investigate the dynamics of dissolved organic matter (DOM) in the Arctic Ocean. Sources and distributions of DOM in polar surface waters were very heterogeneous and closely linked to hydrological conditions. Canada Basin surface waters had relatively low DOC concentrations (69 ± 6 μmol L −1 ), CDOM absorption (a 325 : 0.32 ± 0.07 m −1 ) and CDOM-derived lignin phenols (3 ± 0.4 nmol L −1 ), and high spectral slope values (S 275–295 : 31.7 ± 2.3 1 μm − ), indicating minor terrigenous inputs and evidence of photochemical alteration in the Beaufort Gyre. By contrast, surface waters of the Makarov Basin had elevated DOC (108 ± 9 μmol L −1 ) and lignin phenol concentrations (15 ± 3 nmol L −1 ), high a 325 values (1.36 ± 0.18 m −1 ), and low S 275–295 values (22.8 ± 0.8 μm −1 ), indicating pronounced Siberian river inputs associated with the Transpolar Drift and minor photochemical alteration. Observations near the Mendeleev Plain suggested limited interactions of the Transpolar Drift with Canada Basin waters, a scenario favoring export of Arctic DOM to the North Atlantic. The influence of sea-ice melt on DOM was region-dependent, resulting in an increase (Beaufort Sea), a decrease (Bering-Chukchi Seas), and negligible change (deep basins) in surface DOC concentrations and a 325 values. Halocline structures differed between basins, but the Canada Basin upper halocline and Makarov Basin halocline were comparable in their average DOC (65–70 1 1 μmol L − ) and lignin phenol concentrations (3–4 nmol L − ) and S 275–295 values (22.9–23.7 μm −1 ). Deep-water DOC concentrations decreased by 6–8 μmol L −1 with increasing depth, water mass age, nutrient concentrations, and apparent oxygen utilization. Maximal estimates of DOC degradation rates (0.036–0.039 μmol L −1 yr −1 ) in the deep Arctic were lower than those in other ocean basins, possibly due to low water temperatures. DOC concentrations in bottom waters (>2500 m; 46 ± 2 μmol L −1 ) of the Canada and Makarov Basins were slightly lower than those reported for deep waters of the Eurasian Basin and Nordic Seas. Elevated a 325 values (by 10–20%) were observed near the seafloor, indicating biological activity in Arctic basin sediments. Keywords: dissolved organic carbon, chromophoric dissolved organic matter, lignin phenols, Arctic Ocean, Canada Basin, Makarov Basin, transpolar drift, sea-ice melt
-
Upload
khangminh22 -
Category
Documents
-
view
1 -
download
0
Transcript of Sources, Distributions, and Dynamics of Dissolved Organic ...

ORIGINAL RESEARCHpublished: 18 October 2016
doi: 10.3389/fmars.2016.00198
Frontiers in Marine Science | www.frontiersin.org 1 October 2016 | Volume 3 | Article 198
Edited by:
Toshi Nagata,University of Tokyo, Japan
Reviewed by:
X. Antón Álvarez-Salgado,Spanish National Research Council,
SpainGerhard Kattner,
Alfred Wegener Institute, Germany
*Correspondence:
Yuan [email protected]
Specialty section:
This article was submitted toMarine Biogeochemistry,a section of the journal
Frontiers in Marine Science
Received: 17 August 2016Accepted: 26 September 2016Published: 18 October 2016
Citation:
Shen Y, Benner R, Robbins LL andWynn JG (2016) Sources,
Distributions, and Dynamics ofDissolved Organic Matter in theCanada and Makarov Basins.
Front. Mar. Sci. 3:198.doi: 10.3389/fmars.2016.00198
Sources, Distributions, and Dynamicsof Dissolved Organic Matter in theCanada and Makarov BasinsYuan Shen1*, Ronald Benner 1, 2, Lisa L. Robbins 3 and Jonathan G. Wynn4
1 Marine Science Program, University of South Carolina, Columbia, SC, USA, 2 Department of Biological Sciences, Universityof South Carolina, Columbia, SC, USA, 3 US Geological Survey, St. Petersburg Coastal and Marine Science Center, St.Petersburg, FL, USA, 4 School of Geosciences, University of South Florida, Tampa, FL, USA
A comprehensive survey of dissolved organic carbon (DOC) and chromophoric dissolved
organic matter (CDOM) was conducted in the Canada and Makarov Basins and adjacent
seas during 2010–2012 to investigate the dynamics of dissolved organic matter (DOM)
in the Arctic Ocean. Sources and distributions of DOM in polar surface waters were
very heterogeneous and closely linked to hydrological conditions. Canada Basin surface
waters had relatively low DOC concentrations (69 ± 6 µmol L−1), CDOM absorption
(a325: 0.32 ± 0.07 m−1) and CDOM-derived lignin phenols (3 ± 0.4 nmol L−1), and high
spectral slope values (S275–295: 31.7 ± 2.3 1µm− ), indicating minor terrigenous inputs
and evidence of photochemical alteration in the Beaufort Gyre. By contrast, surface
waters of the Makarov Basin had elevated DOC (108 ± 9 µmol L−1) and lignin phenol
concentrations (15 ± 3 nmol L−1), high a325 values (1.36 ± 0.18 m−1), and low S275–295values (22.8 ± 0.8 µm−1), indicating pronounced Siberian river inputs associated
with the Transpolar Drift and minor photochemical alteration. Observations near the
Mendeleev Plain suggested limited interactions of the Transpolar Drift with Canada Basin
waters, a scenario favoring export of Arctic DOM to the North Atlantic. The influence of
sea-ice melt on DOM was region-dependent, resulting in an increase (Beaufort Sea), a
decrease (Bering-Chukchi Seas), and negligible change (deep basins) in surface DOC
concentrations and a325 values. Halocline structures differed between basins, but the
Canada Basin upper halocline and Makarov Basin halocline were comparable in their
average DOC (65–70 1 1µmol L− ) and lignin phenol concentrations (3–4 nmol L− ) and
S275–295 values (22.9–23.7 µm−1). Deep-water DOC concentrations decreased by 6–8
µmol L−1 with increasing depth, water mass age, nutrient concentrations, and apparent
oxygen utilization. Maximal estimates of DOC degradation rates (0.036–0.039 µmol L−1
yr−1) in the deep Arctic were lower than those in other ocean basins, possibly due to
low water temperatures. DOC concentrations in bottom waters (>2500 m; 46 ± 2 µmol
L−1) of the Canada and Makarov Basins were slightly lower than those reported for deep
waters of the Eurasian Basin and Nordic Seas. Elevated a325 values (by 10–20%) were
observed near the seafloor, indicating biological activity in Arctic basin sediments.
Keywords: dissolved organic carbon, chromophoric dissolved organic matter, lignin phenols, Arctic Ocean,
Canada Basin, Makarov Basin, transpolar drift, sea-ice melt

Shen et al. DOM in the Arctic Ocean
INTRODUCTION
The Arctic Ocean is a relatively small, enclosed basincharacterized by pronounced riverine influence and complexhydrography. This region accounts for only 1% of the globalocean volume but captures ∼11% of global riverine freshwaterand organic carbon (Opsahl et al., 1999; Jakobsson et al.,2004; Rachold et al., 2004). Ocean waters from the NorthPacific and Atlantic enter the Arctic Ocean via the BeringStrait and the Nordic Seas (Rudels, 2009). Much of the waterand dissolved organic matter (DOM) entering the Arctic ismodified by biological and physicochemical processes, suchas sea-ice formation and melting, during passage over theextensive continental shelves and residence in basins (Jonesand Anderson, 1986; Cooper et al., 2005; Shen et al., 2012).Modification of waters on continental shelves supplies densewater and bioreactive elements to the basin interior.
The distributions and fates of DOM in the Arctic Oceanhave been the focus of research for understanding both regionaland global carbon cycles (Gordon and Cranford, 1985; Wheeleret al., 1997; Benner et al., 2005; Anderson and Amon, 2015).Previous studies have noted considerable spatial and temporalheterogeneity in the abundance and distribution of DOM(Wheeler et al., 1997; Guay et al., 1999; Benner et al., 2005;Mathis et al., 2005; Letscher et al., 2011). Analysis of dissolvedlignin phenols reveals strong and variable terrigenous signaturesthroughout polar surface waters (Opsahl et al., 1999; Benner et al.,2004, 2005). Terrigenous DOM is transported from continentalshelves to interior basins by a variety of pathways (Fichot et al.,2013). The routing of continental runoff is susceptible to localwind patterns, and it exerts a strong influence on the transitof DOM along and across the broad shelves (Guay et al., 2001;Fichot et al., 2013; Carmack et al., 2015). Upon exiting the shelf,DOM is entrained into the basin-scale wind-driven circulationand redistributed in the basins for varying periods of time (up to20 yr) prior to export to the north Atlantic Ocean (Bauch et al.,1995; Rutgers van der Loeff et al., 1995; Hansell et al., 2004).
Wind-driven circulation in the upper Arctic Ocean includesthe anticyclonic Beaufort Gyre centered in the southern CanadaBasin and the Transpolar Drift extending from the Siberianmargin to Fram Strait (Rudels, 2009). The Beaufort Gyrecreates a strong convergence that favors long-term retention andprocessing of DOM within the gyre, whereas the fast-movingTranspolar Drift serves to export DOM with less alteration(Mysak, 2001; Bluhm et al., 2015). These two circulationsystems drive large cross-basin variability in the distributionsand fates of DOM (Hansell et al., 2004; Benner et al., 2005).Previous measurements of dissolved organic carbon (DOC),lignin phenols, and chromophoric DOM (CDOM) absorption inpolar surface waters have indicated a much stronger terrigenoussignal over the Makarov Basin than in the adjacent MendeleevPlain and Canada Basin (Guay et al., 1999; Benner et al.,2005; Letscher et al., 2011; Guéguen et al., 2015). However,variations in atmospheric forcing can alter the axis of theTranspolar Drift and force a sizable portion of Siberian runoffand terrigenous DOM into the Beaufort Gyre for extendedperiods (Proshutinsky and Johnson, 1997; Mysak, 2001; Morison
et al., 2012), thereby resulting in less export of Arctic DOMto the North Atlantic Ocean. A more detailed survey ofDOM components is needed to better capture this spatial andtemporal variability and to understand responses to climatechange.
The impact of sea-ice melt on DOC and CDOMconcentrations and distributions is also variable and difficult toresolve. Several studies in the Chukchi Sea have reported thatmelting of sea ice dilutes concentrations of DOC and CDOMin surface waters (Mathis et al., 2005, 2007; Logvinova et al.,2016). By contrast, observations on river-influenced shelvesindicate a high abundance of terrigenous material in sea ice andthe potential for increasing DOC concentrations with sea-icemelting (Eicken, 2004; Eicken et al., 2005). Concentrations ofDOC determined in several ice cores from the Arctic basins arehighly variable (∼100 to over 700µmol L−1) (Thomas et al.,1995; Melnikov, 1997; Opsahl et al., 1999), and melting of this icewould result in a slight increase or a negligible change in surfacemixed layer DOC concentrations (Anderson, 2002; Andersonand Amon, 2015). The varying results of these studies suggestthe impact of sea ice on DOM is region-dependent and warrantsfurther study.
Relatively few studies have presented DOC concentrationsin deep waters of the Arctic Ocean. With a few exceptions(Anderson et al., 1994; Bussmann and Kattner, 2000), moststudies have reported moderate variability (5–10 µmol L−1) inDOC concentrations at depths >1000m (Amon, 2004; Benneret al., 2005; Davis and Benner, 2005; Mathis et al., 2005;Griffith et al., 2012). It is less clear how DOM is distributedthroughout the deep Arctic. Profiles of transient tracers (e.g.,chlorofluorocarbons) in the Arctic basins indicate the meanventilation age of water increases with depth in the deep layer(>1000m;∼100–300 yr; Tanhua et al., 2009). Griffith et al. (2012)examined two full-depth profiles of the !14C of DOC in theCanada Basin and their data show a notable decrease in !14Cwith increasing depth from 1000 to 2500m (Griffith et al., 2012).The observed variations in the age of water and DOC suggestthat DOC could be degraded in the deep Arctic and may exhibitunique vertical concentration gradients absent in other oceanbasins.
The primary objective of this study is to improveunderstanding of the sources, concentrations and distributionsof DOM, and the processes that shape patterns of spatialand temporal variability. We present a comprehensive dataset of DOC, CDOM, and CDOM-derived lignin phenolconcentrations in waters of the western Arctic Ocean,extending from the Chukchi and Beaufort shelves, acrossthe Chukchi Borderland and Canada Basin, and poleward tothe Mendeleev Plain and Makarov Basin. Sources of freshwaterare quantified to examine the regional influence of meteoricwater and sea-ice melt on DOM in polar surface waters.The patterns observed in Arctic surface waters are discussedin the context of climate-driven changes in circulation. Inaddition, depth profiles are analyzed to evaluate verticalvariability in DOC and CDOM across the Canada and MakarovBasins, with a particular emphasis on halocline and deepwaters.
Frontiers in Marine Science | www.frontiersin.org 2 October 2016 | Volume 3 | Article 198

Shen et al. DOM in the Arctic Ocean
METHODS
Study Region and Sample CollectionWater samples were collected during three summer cruises(August–September) on the USCGC Healy in 2010, 2011,and 2012 (HLY1002, HLY1102, HLY1202; Figure 1; Robbinset al., 2013a,b,c, 2014). Surface waters were collected at adepth of ∼8m using an underway flow-through system. Profilesamples were collected at various depths (2–3800m) at 17stations using a rosette sampler equipped with 24 Niskin bottlesand a Conductivity-Temperature-Depth (CTD) probe (Sea-Bird SBE45) used to measure water salinity, temperature, andpressure. A total of 770 water samples were collected for analysesof DOC, CDOM, and δ18O, with about 700 matching samplesfor inorganic nutrient analysis. Samples for measurementsof DOC and CDOM were collected in pre-cleaned 60-mLamber glass bottles and frozen immediately at −20◦C untilanalysis in the laboratory. Samples for measurement of nutrientconcentrations (phosphate, nitrate + nitrite, ammonium, andsilicate) were frozen immediately at −80◦C in scintillation vialsprior to analysis. Samples for measurement of oxygen isotopiccomposition (δ18O values) were collected in glass vials and storedat 4◦C prior to analysis. Nutrient analyses were completed using aSEAL AA3 four-channel segmented flow analyzer at the NutrientAnalytical Facility at theWoods Hole Oceanographic Institution,Woods Hole, MA. Additional total silicon concentrations weremeasured on separate samples using an Agilent Inductively-coupled Plasma Mass Spectrometry at the University of SouthFlorida, St. Petersburg, FL. δ18O values are reported on theStandard Mean Ocean Water (SMOW) international referencescale and were measured by Isotope Ratio Mass Spectrometry(Thermo Finnigan Delta V) at the University of South Florida,Tampa, FL.
The broad spatial scale of sampling in this study covereda wide range of environments that varied substantially in sea-ice cover (Figure 1). Surface waters in the Bering Sea, ChukchiSea, and southern Canada Basin were mostly ice-free, whereasareas north of 80◦N were largely covered by sea ice during thesampling periods. Sea-ice area in the Arctic Ocean reached alow of 3.0 × 10⁶ km2 during the HLY1202 cruise (Parkinsonand Comiso, 2013). Comparisons in summer sea ice coveramong 2010, 2011, and 2012 revealed a notable ice reduction in2012 in the northern Chukchi Borderland, southern MendeleevPlain, and the central and southern areas of the Canada Basin(Figure 1). In this study, the geographic names and boundariesof oceanic regions were defined according to Marine Regions(http://www.marineregions.org) with modifications.
Analyses of DOC and CDOM, andEstimation of Dissolved LigninConcentrationsWater samples for measurements of DOC and CDOM werethawed and filtered in the laboratory through pre-combusted(450◦C, 4 h) Whatman GF/F filters (0.7-µm pore size) priorto analysis. Concentrations of DOC were measured by hightemperature combustion using a Shimadzu total organic carbon(TOC) TOC-VCSN analyzer equipped with an autosampler.
The Shimadzu platinum catalyst was conditioned by repeatedinjections of acidified Milli Q UV-Plus water (pH 2–3) priorto sample analysis (Benner and Strom, 1993). Before injection,samples were acidified with 2mol L−1 hydrochloric acid (HCl) topH 2–3 and were sparged with ultra-high purity oxygen for 2 minto remove the inorganic carbon as CO2. The injection volumewas 100-µL. Milli Q water and deep-sea reference standards(University of Miami) were injected every 6th sample. Values ofblanks (Milli Q UV-Plus water) were negligible throughout themeasurements of seawater samples. The coefficient of variation(CV) of four repeated injections of a given sample was typically±0.9%. The final concentrations of DOC were quantified usingan external calibration curve generated with five concentrationsof standards (glucosamine; Sigma Chemical CO.) that bracketedthe range of values observed in the samples.
Absorbance spectra (250–800 nm) of filtered water sampleswere measured using a Shimadzu ultraviolet-visible 1601 dual-beam spectrophotometer and 5-cm cylindrical quartz cuvettes.Water samples were warmed to room temperature priorto analysis. Absorbance was blank corrected (the averageabsorbance between 690 and 700 nm) and then converted toNapierian absorption coefficient, aλ (m−1), using Equation (1)
aλ = 2.303Aλ
r(1)
where Aλ is the absorbance measured across path length r at awavelength of λ. The spectral slope coefficient (S) was calculatedusing a linear regression of log-linearized aλ1 as in Equation (2)
aλ1 = aλ2 exp[−S(λ1 − λ2)] (2)
where, aλ1 and aλ2 are absorption coefficients at wavelengths λ1and λ2 (λ1 > λ2). S in the 275–295 nm spectral range is reportedas S275–295 with units of µm−1.
Concentrations of dissolved lignin phenols were retrievedfrom CDOM absorption coefficients as in Fichot et al. (2016),using Equations (3, 4). When a250 is <4 m−1,
ln(TDLP9) = 0.7672× a263 − 0.3987 (3)
when a250 is ≥4 m−1,
ln(TDLP9) = −2.282× ln(a350)− 8.209× ln(a275)
+ 11.365× ln(a295)+ 2.909 (4)
Concentrations of total dissolved lignin phenols (TDLP9) are thesum of nine dissolved lignin phenols (p-hydroxybenzaldehyde,p-hydroxyacetophenone, p-hydroxybenzoic acid, vanillin,acetovanillone, vanillic acid, syringaldehyde, acetosyringone, andsyringic acid) and are reported in units of nmol L−1. These twomodels were constructed from paired measurements of dissolvedlignin and CDOM in oceanic samples that were collected mostlyin the Arctic Ocean (Fichot et al., 2016) and are thereforeapplicable to this study. Herein, the models were applied only tothe upper 300m of the water column (i.e., polar mixed layer andhalocline waters) where riverine inputs were evident from themeasured oxygen isotopic composition (δ18O) and calculatedmeteoric water fraction.
Frontiers in Marine Science | www.frontiersin.org 3 October 2016 | Volume 3 | Article 198

Shen et al. DOM in the Arctic Ocean
FIGURE 1 | Map of the study region and sampling locations in the western Arctic Ocean. Water samples were collected from the surface (8m) and depth
profiles (2–3800m; denoted by numbers) during three summer cruises in 2010, 2011, and 2012. The blue, red, and black dashed lines show the average sea-ice
edge for September 2010, 2011, and 2012, respectively. AR, Alpha Ridge; BS, Beaufort Sea; CB, Canada Basin; CBL, Chukchi Borderland (Chukchi Plateau,
Northwind Plain and Ridge); ESS, East Siberian Sea; LR, Lomonosov Ridge; MB, Makarov Basin; MP, Mendeleev Plain; MR, Mendeleev Ridge; SS, Sever Spur.
CDOM Freeze/Thaw ExperimentsThe effects of filtration and freeze/thaw on CDOM propertiesof seawater were determined using waters collected in thesurface (45m) and deep (1200m) Atlantic Ocean. Six replicatesof seawater samples were collected from each depth in pre-cleaned (450◦C, 4 h) glass vials. The samples divided into threetreatments: (1) filtered and refrigerated at 4◦C; (2) filteredand frozen at −20◦C; (3) frozen without filtration and filteredprior to analysis. For each treatment, one set of replicates(n = 3) was filtered through GF/F filters (0.7-µm pore size;Whatman R⃝) and the other set (n= 3) was filtered through Supormembranes (0.2-µm pore size; Supor R⃝-200, Life Sciences). Therefrigerated samples were analyzed immediately upon returnto the home laboratory (within 6 days of collection), andthe frozen samples were stored at −20◦C for 28 days beforeanalysis. The analysis of CDOM absorbance and calculationsof absorption coefficient (aλ) and spectral slope coefficient(S275–295) followed procedures described in the previoussection.
Quantifying Water Source ContributionsSeawater in the Arctic Ocean can be characterized as amixture of freshwater sources, such as meteoric water (MW;precipitation and river runoff) and sea-ice melt (SIM), withseawater sources such as Pacific water (PW), and Atlantic water(ATW). Each water source can be characterized by a distinctcombination of chemical tracers that range from conservative
(e.g., salinity and oxygen isotopic composition, i.e., δ18O values)to semi-conservative (e.g., nutrient concentrations or alkalinity).For example, Arctic MW, including river runoff and directprecipitation, has a distinct combination of very low salinityand nutrient concentrations combined with 18O-depleted δ18Ovalues (≈−20‰). SIM has low salinity (slightly above zero) andnutrients due to brine rejection, combined with δ18O valuessimilar to that of its source water due to a relatively small18O/16O fractionation factor (about +2.6‰, i.e., sea ice is moreenriched in 18O than the surface seawater; MacDonald et al.,1995; Melling and Moore, 1995). Thus, two tracer parameters,salinity and δ18O, provide a robust estimate of MW and SIMadditions to seawater, the latter of which is characterized byhigh salinity and δ18O values near 0 (Robbins et al., 2013a).In order to further separate seawater sources, a third tracer isnecessary, and various semi-conservative parameters have beenused (e.g., silicate, phosphate, nutrient ratios, etc.) with variableresults (Alkire et al., 2015). In general, these are based on theobservation that PW has higher concentrations of nutrientscompared to ATW as well as somewhat lower salinity andδ18O values.
Using this mass-balance method, fractions of n water sourcescan be calculated by solving a set of n linear equations, whichrequire (n− 1) tracers (i.e., salinity and δ18O separate water into3 sources, one additional tracer is required to separate into foursources). In this study, we utilize only the freshwater sourceestimates of SIM and MW. Thus, variations between ATW and
Frontiers in Marine Science | www.frontiersin.org 4 October 2016 | Volume 3 | Article 198

Shen et al. DOM in the Arctic Ocean
PW sources that depends on the tracer method chosen do notaffect the results here. We use the full three-parameter tracers asfollows:
fMW + fSIM + fPM + fATW = 1
fMW(SMW)+ fSIM(SSIM)+ fPW(SPW)+ fATW(SATW) = Sobserved
fMW(δ18OMW)+ fSIM(δ18OSIM)+ fPW(δ18OPW)
+ fATW(δ18OATW) = δ18Oobserved
fMW(SiMW)+ fSIM(SiSIM)+ fPW(SiPW)
+ fATW(SiATW) = Siobserved
where, f, S, and Si refer to fraction, salinity, and silicateconcentration, respectively. The subscripted abbreviations (MW,SIM, PW, and ATW) denote the four water sources. End-membervalues of the tracers used follow Bauch et al. (1995), Yamamoto-Kawai et al. (2008), and Robbins et al. (2013a): MW: S = 0, δ18O= −20‰, Si = 10 µmol kg−1; SIM: S = 4, δ18O = δ18Osurface
+2.6‰, Si = 1 µmol kg−1; PW: S = 32.5, δ18O = −0.8‰, Si= 40 µmol kg−1; ATW: S = 34.87, δ18O = 0.3‰, Si = 6 µmolkg−1. We follow Bauch et al. (1995) in using dissolved silicateconcentration (Si) as the third semi-conservative tracer, but f PWand f ATW are not used in this study.
Statistical AnalysisStatistical differences between variables that were normallyor not normally distributed were assessed using independentSamples T-test (two-tailed, α = 0.05) or Mann-Whitney U-test (two-tailed, α = 0.05), respectively. The normality of datadistribution and equality of variances were tested using theKolmogorov–Smirnov test (two-tailed, a = 0.05) and Levene’stest (two-tailed, a = 0.05), respectively. The statistical analyseswere performed in SPSS 20.0 (IBM Statistical Package forthe Social Sciences Inc.). The significance of least-squareslinear regression was determined using the enter approachin SPSS.
Methodological Considerations for DOCand CDOM Measurements and Estimationof Lignin Phenol ConcentrationsA total of 132 DOC reference standards (DOCref) were measuredalong with the Arctic samples to evaluate the performance ofthe DOC analyses (Supplementary Table 1). Concentrations ofDOCref ranged from 42.2 to 45.9µmol L−1 (avg.: 44.1± 0.9µmolL−1) and were well within the reported range (42–45 µmol L−1).Concentrations of DOCref determined during sample analysisfor the three cruises showed similar variability and the meanswere not significantly different (T-test, p > 0.05). Precisionof the analysis, represented by coefficient of variation (%) orstandard deviation (µmol L−1) of DOCref concentrations, wasbetter than 2.0% or 1.0 µmol L−1. These results demonstratehigh consistency and reproducibility of the DOC analysis,which facilitates evaluation of the natural variability in DOCconcentrations.
Water samples for optical measurements are preferably storedat 4◦C, but logistical issues often require the storage andshipping of frozen samples. Some studies observed substantialchanges in CDOM absorbance and fluorescence intensity infreshwater samples following freeze/thaw (Spencer et al., 2007;Fellman et al., 2008; Hudson et al., 2009), while others didnot (Spencer et al., 2010; Yamashita et al., 2010). Very fewstudies have determined the influence of freeze/thaw on CDOMproperties in seawater. In this study, comparisons betweenrefrigerated (4◦C) and frozen (−20◦C) seawater samples showedrelatively minor differences (<10%) in CDOM absorptioncoefficients at 250–400 nm and in S275–295, regardless ofsampling locations (Supplementary Figure 1). Freezing appearedto result in some loss of CDOM at lower wavelengths, whichwas less apparent in samples that were stored unfiltered(Supplementary Figures 1C,D). Paired analyses of 0.7- and0.2-µm filtered samples in each experiment showed similar(mostly <5% difference) CDOM absorption coefficients andS275–295. These results indicated a minor impact of freezingon CDOM properties in seawater, consistent with previousassessments using seawater samples (Del Castillo and Coble,2000; Conmy, 2008). In support of this, CDOM absorptioncoefficients and S275–295 measured in the HLY1102 samplesin this study were very comparable to those measured inrefrigerated (4◦C) samples collected along a similar cruisetrack during the same period of time (Guéguen et al.,2015).
This study presents detailed distributions of dissolved ligninphenols in the upper Arctic Ocean. To evaluate the validity ofthe CDOM-derived lignin values, we compared the calculatedTDLP9 concentrations to those measured previously usingthe CuO oxidation method in similar regions of the ArcticOcean. Surface TDLP9 concentrations estimated here in theBeaufort Sea, Canada Basin, and Makarov Basin were 2–22, 2–4, and 9–20 nmol L−1, respectively. These values aresimilar to those measured in the Mackenzie River Plume(8–30 nmol L−1), Beaufort shelf (3–24 nmol L−1), southernCanada Basin (mostly 2.2–3.0 nmol L−1), and eastern MakarovBasin (10–20 nmol L−1) in samples collected between 2002and 2009 (Fichot et al., 2016; Benner, unpublished; Kaiser etal., in review). These comparisons from similar locations butin different years indicate the CDOM–derived estimates oflignin phenol concentrations are within the ranges of measuredvalues.
RESULTS
Surface Distributions of Salinity, MeteoricWater, and Sea-Ice MeltSurface distributions of salinity, meteoric water, and sea-ice melt were highly variable in the western Arctic Ocean(Figure 2 and Table 1). The most saline surface waters wereobserved in the Makarov Basin (30.50 ± 0.78), whereas theleast saline waters were found in the Beaufort Sea (24.81± 3.32). Surface salinities in the Canada Basin (26.54 ±
2.06) were among the lowest measured in the deep basins.
Frontiers in Marine Science | www.frontiersin.org 5 October 2016 | Volume 3 | Article 198

Shen et al. DOM in the Arctic Ocean
FIGURE 2 | Distributions of (A) salinity, (B) fraction of meteoric water (fMW), and (C) fraction of sea-ice melt (fSIM) in surface waters (8m) of the
western Arctic Ocean. The blue, red, and black dashed lines show the average sea-ice edge for September 2010, 2011, and 2012, respectively. BS, Beaufort Sea;
CB, Canada Basin; CBL, Chukchi Borderland; MP, Mendeleev Plain; MB, Makarov Basin.
A notable change in surface salinity (by ∼3) occurred acrossthe ice front at ∼78◦N in the Canada Basin and near theboundary between the Chukchi Borderland andMendeleev Plain(Figure 2A).
Fractions of meteoric water (fMW) in coastal regions werelow in the Bering-Chukchi Seas (0.00–0.15) and high inthe Beaufort Sea (0.12–0.32) (Figure 2B and SupplementaryTable 2). The fMW values in the deep basins were relativelyconstant, averaging 0.18 ± 0.01, 0.17 ± 0.01, and 0.15 ±
0.02 in the Canada Basin, Mendeleev Plain, and MakarovBasin, respectively (Supplementary Table 2). Fractions ofsea-ice melt (f SIM) were highly variable in coastal regions,varying from −0.04 to 0.15 in the Bering-Chukchi Seasand from −0.02 to 0.20 in the Beaufort Sea (Figure 2Cand Supplementary Table 2). Negative f SIM indicate brinerejection from sea-ice formation. The f SIM in the deep basinsshowed a reverse trend to that of salinity, with elevatedvalues in the southern Canada Basin (0.10–0.20) and negativevalues in the Makarov Basin (−0.04–0.02). A rapid northwarddecrease in f SIM also occurred across the ice front at ∼78◦N(Figure 2C).
Surface Distributions of DOC, CDOM, andDissolved Lignin PhenolsThe DOC and TDLP9 concentrations and values of a325and S275–295 in surface waters of the western Arctic Oceanvaried∼3.5-fold (42–148µmol L−1),∼22-fold (1–22 nmol L−1),∼13-fold (0.16–2.06m−1), and ∼1.8-fold (21.5–38.9 µm−1),respectively (Figure 3). The highest DOC, a325, and TDLP9, andlowest S275–295 were observed in the Beaufort Sea (DOC: 104 ±
23 µmol L−1; a325: 1.06 ± 0.52 m−1; S275–295: 25.8 ± 2.2µm−1;TDLP9: 10 ± 6 nmol L−1) and the Makarov Basin (DOC: 108 ±9 µmol L−1; a325: 1.36 ± 0.18 m−1; S275–295: 22.8 ± 0.8µm−1;TDLP9: 15 ± 3 nmol L−1) (Table 1). Much lower DOC andTDLP9 concentrations and a325 values and higher S275–295 valueswere found in the Canada Basin (DOC: 69 ± 6µmol L−1; a325:0.32 ± 0.07 m−1; S275–295: 31.7 ± 2.3µm−1; TDLP9: 3 ± 0.4nmol L−1) and its adjacent areas (Chukchi Borderland, SeverSpur, andMendeleev Plain). Surface distributions of DOM acrossthe Canada Basin, Chukchi Borderland, and Mendeleev Plainshowed no apparent latitudinal trends (Figure 3).
The different DOM signature in the Makarov Basin was dueto the influence of the Transpolar Drift. A subset of the dataset
Frontiers in Marine Science | www.frontiersin.org 6 October 2016 | Volume 3 | Article 198
Shen et al. DOM in the Arctic Ocean
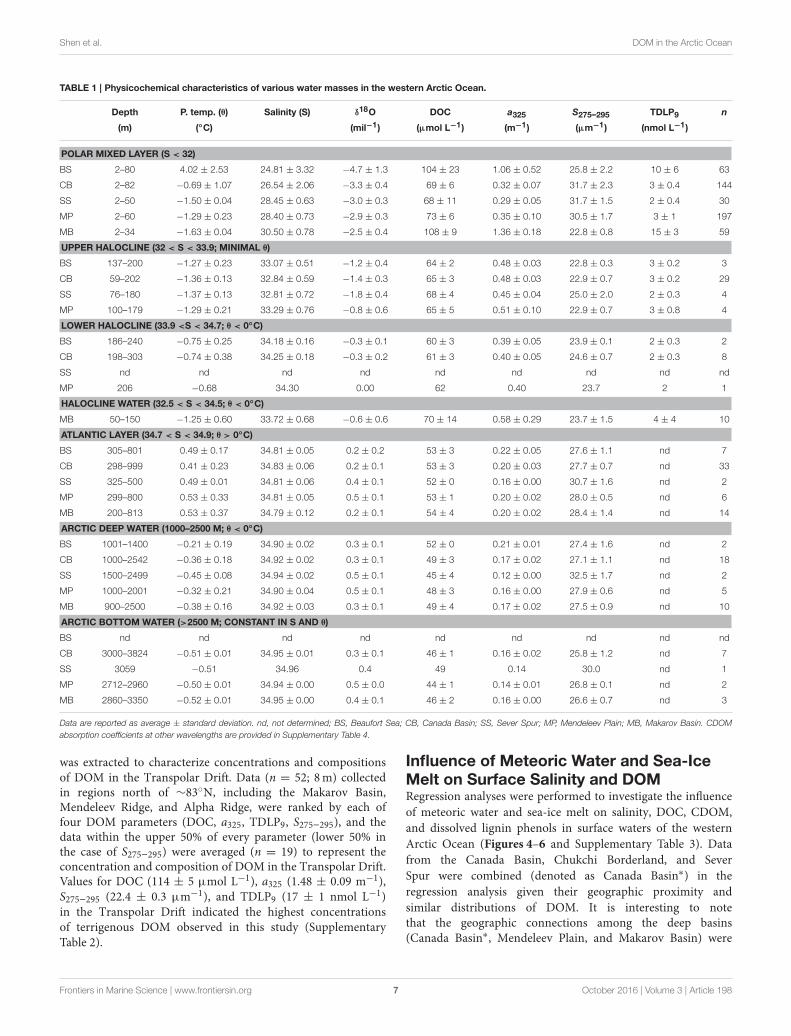
TABLE 1 | Physicochemical characteristics of various water masses in the western Arctic Ocean.
Depth P. temp. (θ) Salinity (S) δ18O DOC a325 S275–295 TDLP9 n
(m) (◦C) (mil−1) (µmol L−1) (m−1) (µm−1) (nmol L−1)
POLAR MIXED LAYER (S < 32)
BS 2–80 4.02 ± 2.53 24.81 ± 3.32 −4.7 ± 1.3 104 ± 23 1.06 ± 0.52 25.8 ± 2.2 10 ± 6 63
CB 2–82 −0.69 ± 1.07 26.54 ± 2.06 −3.3 ± 0.4 69 ± 6 0.32 ± 0.07 31.7 ± 2.3 3 ± 0.4 144
SS 2–50 −1.50 ± 0.04 28.45 ± 0.63 −3.0 ± 0.3 68 ± 11 0.29 ± 0.05 31.7 ± 1.5 2 ± 0.4 30
MP 2–60 −1.29 ± 0.23 28.40 ± 0.73 −2.9 ± 0.3 73 ± 6 0.35 ± 0.10 30.5 ± 1.7 3 ± 1 197
MB 2–34 −1.63 ± 0.04 30.50 ± 0.78 −2.5 ± 0.4 108 ± 9 1.36 ± 0.18 22.8 ± 0.8 15 ± 3 59
UPPER HALOCLINE (32 < S < 33.9; MINIMAL θ)
BS 137–200 −1.27 ± 0.23 33.07 ± 0.51 −1.2 ± 0.4 64 ± 2 0.48 ± 0.03 22.8 ± 0.3 3 ± 0.2 3
CB 59–202 −1.36 ± 0.13 32.84 ± 0.59 −1.4 ± 0.3 65 ± 3 0.48 ± 0.03 22.9 ± 0.7 3 ± 0.2 29
SS 76–180 −1.37 ± 0.13 32.81 ± 0.72 −1.8 ± 0.4 68 ± 4 0.45 ± 0.04 25.0 ± 2.0 2 ± 0.3 4
MP 100–179 −1.29 ± 0.21 33.29 ± 0.76 −0.8 ± 0.6 65 ± 5 0.51 ± 0.10 22.9 ± 0.7 3 ± 0.8 4
LOWER HALOCLINE (33.9 <S < 34.7; θ < 0◦C)
BS 186–240 −0.75 ± 0.25 34.18 ± 0.16 −0.3 ± 0.1 60 ± 3 0.39 ± 0.05 23.9 ± 0.1 2 ± 0.3 2
CB 198–303 −0.74 ± 0.38 34.25 ± 0.18 −0.3 ± 0.2 61 ± 3 0.40 ± 0.05 24.6 ± 0.7 2 ± 0.3 8
SS nd nd nd nd nd nd nd nd nd
MP 206 −0.68 34.30 0.00 62 0.40 23.7 2 1
HALOCLINE WATER (32.5 < S < 34.5; θ < 0◦C)
MB 50–150 −1.25 ± 0.60 33.72 ± 0.68 −0.6 ± 0.6 70 ± 14 0.58 ± 0.29 23.7 ± 1.5 4 ± 4 10
ATLANTIC LAYER (34.7 < S < 34.9; θ > 0◦C)
BS 305–801 0.49 ± 0.17 34.81 ± 0.05 0.2 ± 0.2 53 ± 3 0.22 ± 0.05 27.6 ± 1.1 nd 7
CB 298–999 0.41 ± 0.23 34.83 ± 0.06 0.2 ± 0.1 53 ± 3 0.20 ± 0.03 27.7 ± 0.7 nd 33
SS 325–500 0.49 ± 0.01 34.81 ± 0.06 0.4 ± 0.1 52 ± 0 0.16 ± 0.00 30.7 ± 1.6 nd 2
MP 299–800 0.53 ± 0.33 34.81 ± 0.05 0.5 ± 0.1 53 ± 1 0.20 ± 0.02 28.0 ± 0.5 nd 6
MB 200–813 0.53 ± 0.37 34.79 ± 0.12 0.2 ± 0.1 54 ± 4 0.20 ± 0.02 28.4 ± 1.4 nd 14
ARCTIC DEEP WATER (1000–2500 M; θ < 0◦C)
BS 1001–1400 −0.21 ± 0.19 34.90 ± 0.02 0.3 ± 0.1 52 ± 0 0.21 ± 0.01 27.4 ± 1.6 nd 2
CB 1000–2542 −0.36 ± 0.18 34.92 ± 0.02 0.3 ± 0.1 49 ± 3 0.17 ± 0.02 27.1 ± 1.1 nd 18
SS 1500–2499 −0.45 ± 0.08 34.94 ± 0.02 0.5 ± 0.1 45 ± 4 0.12 ± 0.00 32.5 ± 1.7 nd 2
MP 1000–2001 −0.32 ± 0.21 34.90 ± 0.04 0.5 ± 0.1 48 ± 3 0.16 ± 0.00 27.9 ± 0.6 nd 5
MB 900–2500 −0.38 ± 0.16 34.92 ± 0.03 0.3 ± 0.1 49 ± 4 0.17 ± 0.02 27.5 ± 0.9 nd 10
ARCTIC BOTTOM WATER (>2500 M; CONSTANT IN S AND θ)
BS nd nd nd nd nd nd nd nd nd
CB 3000–3824 −0.51 ± 0.01 34.95 ± 0.01 0.3 ± 0.1 46 ± 1 0.16 ± 0.02 25.8 ± 1.2 nd 7
SS 3059 −0.51 34.96 0.4 49 0.14 30.0 nd 1
MP 2712–2960 −0.50 ± 0.01 34.94 ± 0.00 0.5 ± 0.0 44 ± 1 0.14 ± 0.01 26.8 ± 0.1 nd 2
MB 2860–3350 −0.52 ± 0.01 34.95 ± 0.00 0.4 ± 0.1 46 ± 2 0.16 ± 0.00 26.6 ± 0.7 nd 3
Data are reported as average ± standard deviation. nd, not determined; BS, Beaufort Sea; CB, Canada Basin; SS, Sever Spur; MP, Mendeleev Plain; MB, Makarov Basin. CDOMabsorption coefficients at other wavelengths are provided in Supplementary Table 4.
was extracted to characterize concentrations and compositionsof DOM in the Transpolar Drift. Data (n = 52; 8m) collectedin regions north of ∼83◦N, including the Makarov Basin,Mendeleev Ridge, and Alpha Ridge, were ranked by each offour DOM parameters (DOC, a325, TDLP9, S275–295), and thedata within the upper 50% of every parameter (lower 50% inthe case of S275–295) were averaged (n = 19) to represent theconcentration and composition of DOM in the Transpolar Drift.Values for DOC (114 ± 5 µmol L−1), a325 (1.48 ± 0.09 m−1),S275–295 (22.4 ± 0.3 µm−1), and TDLP9 (17 ± 1 nmol L−1)in the Transpolar Drift indicated the highest concentrationsof terrigenous DOM observed in this study (SupplementaryTable 2).
Influence of Meteoric Water and Sea-IceMelt on Surface Salinity and DOMRegression analyses were performed to investigate the influenceof meteoric water and sea-ice melt on salinity, DOC, CDOM,and dissolved lignin phenols in surface waters of the westernArctic Ocean (Figures 4–6 and Supplementary Table 3). Datafrom the Canada Basin, Chukchi Borderland, and SeverSpur were combined (denoted as Canada Basin∗) in theregression analysis given their geographic proximity andsimilar distributions of DOM. It is interesting to notethat the geographic connections among the deep basins(Canada Basin∗, Mendeleev Plain, and Makarov Basin) were
Frontiers in Marine Science | www.frontiersin.org 7 October 2016 | Volume 3 | Article 198

Shen et al. DOM in the Arctic Ocean
FIGURE 3 | Distributions of (A) dissolved organic carbon (DOC), (B) CDOM absorption coefficient at 325 nm (a325), (C) CDOM spectral slope
coefficient at 275–295nm (S275–295), and (D) total dissolved lignin phenols (TDLP9) in surface waters (8m) of the western Arctic Ocean. The blue, red,
and black dashed lines show the average sea-ice edge for September 2010, 2011, and 2012, respectively. BS, Beaufort Sea; CB, Canada Basin; CBL, Chukchi
Borderland; MP, Mendeleev Plain; MB, Makarov Basin.
revealed by the continuum of salinity and DOM distributions(Figures 4–6).
Salinity in surface waters was influenced to varying extentsby meteoric water and sea-ice melt inputs (Figure 4 andSupplementary Table 3). Meteoric water showed a moderatedilution effect on the surface salinity in the Beaufort Sea (R2 =
0.630, p < 0.001), Mendeleev Plain (R2 = 0.461, p < 0.001),and Makarov Basin (R2 = 0.613, p < 0.001; Figure 4A). Thisdilution effect was much weaker in Canada Basin∗ (R2 = 0.287)and was not apparent in the Bering-Chukchi Seas (R2 = 0.005).In comparison, sea-icemelt showed amoderate to strong dilutioninfluence on the surface salinity in all regions (R2 = 0.420–0.920,
p < 0.001) except the Makarov Basin (Figure 4B). The influenceof sea-ice melt was most pronounced in the Canada Basin∗ (R2 =0.920, p < 0.001) and it gradually diminished in the MendeleevPlain (R2 = 0.420, p < 0.001) and Makarov Basin (R2 = 0.273, p< 0.001).
Relationships between meteoric water and DOM parameterswere spatially variable (Figure 5 and Supplementary Table 3),with moderate to strong relationships in coastal regions (Bering-Chukchi Seas and Beaufort Sea: R2 = 0.595–0.764, p < 0.001)and weak or no relationships in the deep basins (CanadaBasin∗, Mendeleev Plain, and Makarov Basin: R2 = 0.01–0.25).Increasing meteoric water in the Bering-Chukchi and Beaufort
Frontiers in Marine Science | www.frontiersin.org 8 October 2016 | Volume 3 | Article 198

Shen et al. DOM in the Arctic Ocean
34
30
26
22
18
0.200.150.100.050.00-0.05
SIM
2 = 0.693
2 = 0.920
2 = 0.465
2 = 0.420
34
30
26
22
18
Sa
linity
0.350.300.250.200.150.100.050.00
MW
2 = 0.630
2 = 0.613
2 = 0.461
Bering-Chukchi Beaufort Sea Canada Basin* Mendeleev Plain Makarov Basin
A B
FIGURE 4 | Relationships between salinity and (A) meteoric water fraction (fMW) and (B) sea-ice melt fraction (fSIM) in surface waters (8m) of the
western Arctic Ocean. Data in the Canada Basin, Chukchi Borderland, and Sever Spur were combined (denoted as Canada Basin*) in the regression analysis.
A B
C D
140
120
100
80
60
40
DO
C (
µm
ol L
-1)
2 = 0.764
2 = 0
.628
Bering-Chukchi Beaufort Sea Canada Basin* Mendeleev Plain Makarov Basin
2.0
1.5
1.0
0.5
0.0
a32
5 (
m-1
)
2 = 0.595
2 = 0
.741
40
35
30
25
20
S2
75-2
95 (
µm
-1)
0.350.300.250.200.150.100.050.00
MW
2 = 0.714
25
20
15
10
5
0
TD
LP
9 (
nm
ol L
-1)
0.350.300.250.200.150.100.050.00
MW
2 = 0
.704
2 = 0.611
FIGURE 5 | Relationships between meteoric water fraction (fMW) and (A) dissolved organic carbon (DOC), (B) CDOM absorption coefficient at 325nm
(a325), (C) CDOM spectral slope coefficient at 275–295 nm (S275–295), and (D) total dissolved lignin phenols (TDLP9) in surface waters (8 m) of the
western Arctic Ocean. Data in the Canada Basin, Chukchi Borderland, and Sever Spur were combined (denoted as Canada Basin*) in the regression analysis.
Seas resulted in higher concentrations of DOC, a325, and TDLP9,and lower S275–295. One exception occurred in the Bering-Chukchi Seas, where S275–295 values showed little variation withmeteoric water (Figure 5C).
The influence of sea-ice melt on DOM was also variableamong regions (Figure 6 and Supplementary Table 3). Inthe Bering-Chukchi Seas, increasing sea-ice melt resulted indecreasing DOC concentrations (R2 = 0.501, p < 0.001), a325
Frontiers in Marine Science | www.frontiersin.org 9 October 2016 | Volume 3 | Article 198

Shen et al. DOM in the Arctic Ocean
A B
C D
140
120
100
80
60
40
DO
C (
µm
ol L
-1)
2 = 0.316
2 = 0.501
Bering-Chukchi Beaufort Sea Canada Basin* Mendeleev Plain Makarov Basin
2.0
1.5
1.0
0.5
0.0
a325 (
m-1
)
2 = 0.400
2 = 0.507
40
35
30
25
20
S2
75
-29
5 (
µm
-1)
0.200.150.100.050.00-0.05
SIM
2 = 0.347
2 = 0.721
25
20
15
10
5
0
TD
LP
9 (
nm
ol L
-1)
0.200.150.100.050.00-0.05
SIM
2 = 0.364
2 = 0.332
FIGURE 6 | Relationships between sea-ice melt fraction (fSIM) and (A) dissolved organic carbon (DOC), (B) CDOM absorption coefficient at 325 nm
(a325), (C) CDOM spectral slope coefficient at 275–295 nm (S275–295), and (D) total dissolved lignin phenols (TDLP9) in surface waters (8 m) of the
western Arctic Ocean. Data in the Canada Basin, Chukchi Borderland, and Sever Spur were combined (denoted as Canada Basin*) in the regression analysis.
values (R2 = 0.507, p < 0.001), TDLP9 concentrations (R2 =
0.332, p < 0.05), and increasing S275–295 values (R2 = 0.721, p< 0.001). By contrast, increasing sea-ice melt in the BeaufortSea led to higher DOC concentrations (R2 = 0.316, p < 0.001),a325 values (R2 = 0.400, p < 0.001), TDLP9 concentrations (R2
= 0.364, p < 0.001), and lower S275–295 values (R2 = 0.347,p < 0.001). Sea-ice melt in the deep basins showed weak orno relationships with DOM parameters (R2 = 0–0.12). Oneexception was found in S275–295, which increased significantlywith sea-ice melt in the Canada Basins∗ (R2 = 0.237, p < 0.001;Figure 6C).
Water Masses in the Western Arctic OceanWater masses in the Arctic Ocean are distinguishable by theirphysical and chemical properties (Jones et al., 1995; Rudelset al., 1996; Shimada et al., 2005; Rudels, 2009). In this study,six water masses were identified in the western Arctic Oceanbased primarily on salinity and potential temperature (Table 1).The polar mixed layer (PML) occupied the upper 30–80m ofthe water column (shallower in the Makarov Basin) and hadrelatively low salinity (<32.0). The upper halocline (UH) residedbelow the PML at depths of 80–200m and centered at a salinityof 33.1. The UH waters had higher concentrations of brine (i.e.,negative f SIM values) and nutrients (e.g., silicate) and lowertemperatures than ambient waters (Figure 7 and Table 1). These
characteristics were prominent in the Beaufort Sea, CanadaBasin, and Mendeleev Plain but were absent in the MakarovBasin. The lower halocline (LH) was found at depths of 200–300m with higher salinities ranging from 33.9 to 34.7. Upperand lower haloclines were not distinguishable in the MakarovBasin, where a cold halocline (θ < 0◦C) was present at depthsof 50–150m with salinities ranging from 32.5 to 34.5 (Steeleand Boyd, 1998; Rudels et al., 2004; Bauch et al., 2016). Belowthe halocline waters, the denser (34.7 < S < 34.9) and warmer(θ > 0◦C) Atlantic waters were identified at depths down to∼1000 m. Below the Atlantic waters are the cold (θ < 0◦C) Arcticdeep (1000–2500 m) and bottom (>2500 m) waters. Salinitiesincreased and temperatures decreased with depth in Arctic deepwaters and they became relatively constant in Arctic bottomwaters (Table 1).
Vertical Distributions of DOC and CDOM inthe Deep BasinsConcentrations of DOC varied ∼2 to 3-fold with depth inthe basins, ranging from 44 to 88 µmol L−1 and from 42 to100µmol L−1 in the Canada Basin and adjacent areas (SeverSpur and Mendeleev Plain) and from 43 to 129 µmol L−1 inthe Makarov Basin (Figure 8 and Table 1). Depth distributionsof DOC concentrations in the Canada Basin and adjacent areaswere very similar and showed no apparent latitudinal trends
Frontiers in Marine Science | www.frontiersin.org 10 October 2016 | Volume 3 | Article 198

Shen et al. DOM in the Arctic Ocean
FIGURE 7 | Sections (70◦N–88◦N) of (A) sea-ice melt fraction (fSIM) and
(B) silicate (SiO4) in the upper 500m of the Canada and Makarov
Basins. Solid dots represent sampling sites and solid lines depict the contour
lines of salinity.
(Figure 8A). Comparisons between the Canada and MakarovBasins revealed different distributions of DOC concentrations inthe upper 300m of the water column (Figure 8C). In the CanadaBasin, DOC concentrations were slightly elevated in the PML (69± 6µmol L−1) and gradually decreased with increasing depthfrom the halocline (UH: 65 ± 3µmol L−1; LH: 61 ± 3µmolL−1) to the Atlantic layer (53 ± 3 µmol L−1) and to Arctic deep(49 ± 3µmol L−1) and bottom waters (46 ± 1 µmol L−1). Incomparison, concentrations of DOC in the Makarov Basin weregreatly elevated in the PML (108 ± 9 µmol L−1) and decreasedrapidly and conservatively with salinity (R2 = 0.78, p < 0.001, n= 10) in the halocline layer (70 ± 14 µmol L−1; Figure 8B). TheDOC concentrations in the Atlantic layer (54± 4 µmol L−1) andthe Arctic deep (49 ± 4µmol L−1) and bottom waters (46 ± 2µmol L−1) in the Makarov Basin were very similar to those in theCanada Basin (Mann-Whitney U-Test, p > 0.05; Figure 8C andTable 1).
A striking gradient in DOC concentrations was observed indeep waters of the Canada and Makarov Basins (Figures 8C, 9).Concentrations of DOC decreased by 6–8 µmol L−1 withincreasing water mass age at depths of ∼1000–2500m(Figure 9 and Table 1). Declines in DOC concentrationswere significantly related to increases in salinity and apparentoxygen utilization (AOU) (DOC = 3434 − 96.85 × salinity− 0.05 × AOU: R2 = 0.62, p < 0.001) and inorganicnitrogen and silicate concentrations (R2 = 0.50–0.70, p< 0.001). Concentrations of DOC in Arctic bottom water(>2500 m) were less variable with depth, consistent withthe relatively constant physical properties in these waters(Table 1).
The a325 values in the deep basins were much more variablethan DOC concentrations, varying ∼4-fold (0.13–0.55 m−1)in the Canada Basin and ∼13-fold (0.13–1.70 m−1) in theMakarov Basin (Figure 10 and Table 1). As observed with DOC,distributions of a325 were quite different between the two basinsin the upper 300m of the water column (Figure 10C). The a325in the Canada Basin was relatively low in the PML (0.32 ± 0.07m−1) and showed a maximum of 0.48 ± 0.03m−1 in the UH,below which a325 decreased conservatively with salinity in the LHand upper Atlantic layer (200–300 m: R2 = 0.933, p < 0.001, n= 18; Figure 10A). In comparison, a325 in the Makarov Basinreached a maximum of 1.36 ± 0.18m−1 in the PML, and thevalues decreased rapidly and conservatively with salinity in thehalocline layer (0.58 ± 0.29 m−1; R2 = 0.92, p < 0.001, n =
10; Figure 10B). The a325 below 300m showed similar valuesand distributions between the two basins (Mann-Whitney U-Test, p > 0.1). Deep-sea gradients in a325 were observed andthey showed opposite trends between the Arctic deep water andArctic bottom water (Figure 10C). The a325 in Arctic deep waterdecreased substantially with depth in the Canada Basin (from0.20 to 0.15 m−1) and Makarov Basin (from 0.19 to 0.13 m−1), afeature similar to the decline in DOC concentrations. By contrast,a325 values in Arctic bottom water at all eight stations weresignificantly elevated (by 10–20%) toward the seafloor (T-Test,p < 0.05; Figure 10C).
The S275–295 ranged from 21.3 to 38.1 µm−1 with depth in theCanada Basin and from 21.5 to 31.3 µm−1 in the Makarov Basin(Figure 11 and Table 1). The S275–295 in the Canada Basin waselevated in the PML (31.7 ± 2.3 µm−1) and decreased rapidly toa minimum of 22.9± 0.7 µm−1 in the UH, below which S275–295increased with depth and the values varied mostly between 25and 28 µm−1 (Figure 11A). In the Makarov Basin, S275–295values were low in the PML (22.8 ± 0.8 µm−1) and increasedwith depth in the halocline (23.7 ± 1.5 µm−1; Figure 11B).The S275–295 values below 300m were comparable to those atmatching depths in the Canada Basin (Mann-Whitney U-Test,p > 0.05; Figure 11C). Lower S275–295 values were observed nearthe seafloor of the Canada and Makarov Basins.
Relationships between DOC and CDOMThese data provided an opportunity to evaluate relationshipsbetween DOC concentrations and CDOM absorption in theArctic Ocean. A total of 755 paired measurements in this studyrevealed a strong relationship between DOC concentrationsand CDOM absorption (e.g., a325: R2 = 0.77–0.87, p <
0.001; Supplementary Figure 2). This feature is absent in thePacific, Atlantic, and Indian Oceans (Nelson et al., 2010), andit allows the developments of empirical models to retrieveDOC concentrations from CDOM measurements in the ArcticOcean. By re-parameterizing a previously developed multi-linearregression model (Fichot and Benner, 2011) using the presentdata set, two sub-models separated by a cutoff value of a275 =
1.42m−1 (i.e., the median) were established.When a275 ≤ 1.42 m−1,
ln[DOC] = 3.881± 0.036+ 0.763± 0.057× ln(a275)
− 0.375± 0.061× ln(a295) (5)
Frontiers in Marine Science | www.frontiersin.org 11 October 2016 | Volume 3 | Article 198

Shen et al. DOM in the Arctic Ocean
A B C
120100806040
DOC (µmol L-1
)
HLY 1102Stn 4Stn 5Stn 6
Makarov Basin
H
800
600
400
200
0
De
pth
(m
)
908070605040
DOC (µmol L-1
)
4000
3000
2000
1000
CBSSMP
Canada Basin & adjacent areas
UH
LH
120100806040
DOC (µmol L-1
)
Canada & Makarov Basins
4x10³
3
2
1
6055504540
CBMB
FIGURE 8 | Depth distributions of dissolved organic carbon (DOC) in Arctic Basins. (A) Canada Basin (CB), Sever Spur (SS), and Mendeleev Plain (MP); (B)
Makarov Basin (MB); (C) comparisons between the Canada and Makarov Basins. The color bars in (A,B) highlight the upper (UH) and lower (LH) halocline in the
Canada Basin and the halocline (H) in the Makarov Basin. The inset in (C) is expanded at depths below 1000 m.
When a275 > 1.42 m−1,
ln[DOC] = 3.643± 0.032+ 1.223± 0.055× ln(a275)
− 0.701± 0.049× ln(a295) (6)
The standard error of each regression coefficient is given in theequations. The estimated concentrations of DOC exhibited afairly strong relationship with the measured values (R2 = 0.951,p < 0.001; Figure 12). The error associated with the retrievalof DOC concentration using this approach was generally within15%. The broad range of DOC and CDOM values included in thedata suggests the models could be applicable to other regions ofthe Arctic Ocean.
DISCUSSION
Abundance and Distribution of DOM inSurface WatersThis study demonstrated that the abundance and distributionof DOM in polar surface waters were very heterogeneous andstrongly linked to hydrological conditions. High concentrationsof DOC and lignin phenols, high values of a325, and low valuesof S275–295 were observed in surface waters of the Beaufort Sea.These concentrations and values were significantly correlated tofMW, reflecting the influence of the Mackenzie River. Elevated
4000
3500
3000
2500
2000
1500
1000
De
pth
(m
)
5854504642
DOC (µmol L-1
Mean CFC age (yr) Mean CFC age (yr)
)
Canada B.
DOC
Age
4000
3500
3000
2500
2000
1500
1000
5854504642
DOC (µmol L-1 )
400 200 0 400 200 0
Makarov B.
Age
DOC
A B
FIGURE 9 | Depth distributions of dissolved organic carbon (DOC) and
mean chlorofluorocarbon (CFC) age in the Arctic deep and bottom
waters: (A) Canada Basin and (B) Makarov Basin. Data of CFC age were
obtained from Tanhua et al. (2009).
DOC (>100 µmol L−1) and lignin phenol concentrations(>10 nmol L−1) were present in the northwest region of theBeaufort Sea, indicating the transport of riverine DOM to surface
Frontiers in Marine Science | www.frontiersin.org 12 October 2016 | Volume 3 | Article 198

Shen et al. DOM in the Arctic Ocean
1.81.41.00.60.2325 (m
-1)
HLY 1102Stn 4Stn 5Stn 6
Makarov Basin
H
800
600
400
200
0
De
pth
(m
)
0.70.60.50.40.30.20.1325 (m
-1)
4000
3000
2000
1000
CBSSMP
Canada Basin & adjacent areas
UH
LH
1.81.41.00.60.2325 (m
-1)
Canada & Makarov Basins
4x10³
3
2
1
0.240.200.160.12
CBMB
A B C
FIGURE 10 | Depth distributions of CDOM absorption coefficient (a325) in Arctic Basins. (A) Canada Basin (CB), Sever Spur (SS), and Mendeleev Plain (MP);
(B) Makarov Basin (MB); (C) comparisons between the Canada and Makarov Basins. The color bars in (A,B) highlight the upper (UH) and lower (LH) halocline in the
Canada Basin and the halocline (H) in the Makarov Basin. The inset in (C) is expanded at depths below 1000m, with hatched lines denoting the seafloor depth at
each station.
waters in the Canada Basin. Previous investigations (2002–2004)do not report such high concentrations of DOC in similarregions (mostly 65–80 µmol L−1; Mathis et al., 2005; Shenet al., 2012). This large inter-annual variability in terrigenousDOM concentrations is consistent with a recent change in therouting of Mackenzie River outflow, which has shifted froma predominantly eastward path to a northwestward path since2006 in response to climatic variability (Fichot et al., 2013). Therouting switch enhanced the input of terrigenous DOM to theCanada Basin.
Contrasting DOM characteristics were present in surfacewaters of the Canada and Makarov Basins, reflecting distinctsources and processing of DOM. Surface waters of the CanadaBasin contained relatively high fMW (0.18 ± 0.01) but hadlower DOC concentrations (Table 2) and CDOM absorption(Stedmon et al., 2011; Guéguen et al., 2015) compared to otherArctic Basins. This feature appears to result from a substantialcontribution of precipitation in the inflowing waters from thePacific Ocean and a lesser contribution of freshwater fromcontinental runoff (Woodgate and Aagaard, 2005; Yamamoto-Kawai et al., 2008). Although high f SIM was observed in surfacewaters, as discussed below, this had a negligible influence onthe surface DOC concentrations. Relatively low concentrationsof lignin phenols (2–4 nmol L−1) were observed over largeareas of the Canada Basin, due in part to minor contributionsof continental runoff. Surface waters in the Beaufort Gyre have
a decadal residence time that allows substantial removal ofDOM (Rutgers van der Loeff et al., 1995; Hansell et al., 2004;Cooper et al., 2005). The S275–295 values were high (>30 µm−1)and elevated in ice-free waters, indicating photobleaching andpotential removal of DOC due to coupled photochemical andbiological degradation (Fichot and Benner, 2014).
By contrast, surface waters in the Makarov Basin had a lowerfMW (0.15 ± 0.02) but were characterized by much higher DOCconcentrations and CDOM absorption and lower S275–295valuescompared to Canada Basin surface waters (Table 2). The highconcentrations of lignin phenols (15 ± 3 nmol L−1) in surfacewaters were indicative of a strong Siberian river influenceassociated with the Transpolar Drift (Opsahl et al., 1999;Benner et al., 2005). The Siberian rivers (e.g., Lena River)have higher concentrations of DOC than the Mackenzie River(Anderson and Amon, 2015; and reference therein). In addition,unlike the long-term processing in the Canada Basin, DOMentering the Makarov Basin is rapidly transported (<1–3 yr)by the Transpolar Drift (Rutgers van der Loeff et al., 1995).Concentrations of DOC (114 ± 5 µmol L−1) and ligninphenols (17 ± 1 nmol L−1) determined here for the TranspolarDrift (>83◦N) were comparable to values measured at similarsalinities (∼30) in waters off the Siberian shelves (Guay et al.,1999; Kattner et al., 1999; Kaiser et al., in review), suggestingminor losses of DOM occurred during transport to the centralArctic.
Frontiers in Marine Science | www.frontiersin.org 13 October 2016 | Volume 3 | Article 198

Shen et al. DOM in the Arctic Ocean
A B C
3632282420275-295 (µm
-1)
HLY 1102Stn 4Stn 5Stn 6
Makarov Basin
H
800
600
400
200
0
De
pth
(m
)
3632282420275-295 (µm
-1)
4000
3000
2000
1000
CBSSMP
Canada Basin & adjacent areas
UH
LH
3632282420275-295 (µm
-1)
Canada & Makarov Basins
CBMB
FIGURE 11 | Depth distributions of CDOM spectral slope coefficient (S275–295) in Arctic Basins. (A) Canada Basin (CB), Sever Spur (SS), and Mendeleev
Plain (MP); (B) Makarov Basin (MB); (C) comparisons between the Canada and Makarov Basins. The color bars in (A,B) highlight the upper (UH) and lower (LH)
halocline in the Canada Basin and the halocline (H) in the Makarov Basin.
The axis of the Transpolar Drift is variable and shifts betweenthe Mendeleev and Lomonosov Ridges, depending on the phaseof the Arctic Oscillation (AO) (Guay et al., 2001; Mysak, 2001;Steele et al., 2004). A negative AO phase dominated the summersof 2010–2011 and resulted in a deflection of the Transpolar Drifttoward the Lomonosov Ridge and a strengthened Beaufort Gyre.Under these conditions the Eurasian runoff and terrigenousDOM entrained in the Transpolar Drift would be confinedmainly to regions between the Mendeleev and LomonosovRidges (Mysak, 2001). Such routing of the Transpolar Drift wassubstantiated by observations of relatively low concentrations ofDOC, lignin phenols and a325 values, and high values of S275–295over the Mendeleev Plain. This route would bypass the CanadaBasin and thereby favors export of DOM to the North AtlanticOcean. These results revealed contrasting distributions and fatesof DOM between the Canada and Makarov Basins and furtherhighlighted strong hydrographic controls on the DOC cycle inthe Arctic Ocean.
Influence of Sea-Ice Melt on DOM inSurface WatersThe effect of sea-ice melt on DOC concentrations in underlyingwaters depends on the biota and organic compounds withinthe ice. Sea-ice formation excludes DOM as well as salts(Giannelli et al., 2001; Amon, 2004), whereas ice algae, othermicroorganisms and entrained sediments with associated organic
matter can contribute high concentrations of organic carbonto the ice (Smith et al., 1997; Eicken, 2004; Gradinger, 2009).The spatial and temporal variability of biota and organic matterin Arctic sea ice are high (Thomas et al., 1995; Smith et al.,1997; Song et al., 2011), thereby complicating the net impactof sea-ice melt on DOC concentrations. Previous studies reportsimilarly variable observations (Anderson, 2002; Eicken, 2004;Mathis et al., 2005, 2007; Anderson and Amon, 2015; Logvinovaet al., 2016).
Results of this study demonstrated that the influence of sea-ice melt on concentrations and compositions of DOM in polarsurface waters was region-dependent. Contrasting effects of sea-ice melt were observed along the margin between the BeaufortSea and the Bering-Chukchi Seas, and it appeared to be related tothe influence of continental runoff. Sea ice formed on the river-influenced Beaufort Shelf includes suspended riverine materials(i.e., “dirty” ice; Eicken et al., 2005). Melting of this “dirty” icecan potentially release high concentrations of terrigenous organicmatter and increase DOM concentrations in the surface layer.The significance of these processes was apparent in the BeaufortSea from the observation of elevated lignin concentrations inwaters containing higher fMW.
In the Bering-Chukchi Seas negative relationships betweenDOC, lignin phenols, CDOM and fMW indicated a lowabundance of organic matter in the ice. Terrigenousinputs inferred from fMW (0.07 ± 0.04) and lignin phenol
Frontiers in Marine Science | www.frontiersin.org 14 October 2016 | Volume 3 | Article 198

Shen et al. DOM in the Arctic Ocean
160
140
120
100
80
60
40
Est
imate
d D
OC
(µm
ol L
-1)
160140120100806040
Measured DOC (µmol L-1
)
— 1 to 1 line- - +/- 15% error
= 0.951; = 755
275 ≤ 1.42 m-1
275 > 1.42 m-1
FIGURE 12 | Plot of DOC estimated from CDOM analysis vs. measured
DOC. Estimated DOC is calculated from CDOM absorption coefficients at 275
nm (a275) and 295 nm (a295) using two multi-linear regression models
separated by a275 = 1.42m−1 cutoff. The regression coefficients used in the
two models are provided in Equations (5) and (6).
concentrations (4 ± 3 nmol L−1) were relatively low in theBering-Chukchi Seas. Ice algae production in this region is high(Gosselin et al., 1997; Gradinger, 2009), but algal contributions ofDOM are often confined to the bottom of the ice (Thomas et al.,1995; Smith et al., 1997; Song et al., 2011). Previous analyses ofice cores in the Chukchi Sea indicate variable but generally lowerDOC concentrations and CDOM absorption than found inadjacent surface waters (Krembs et al., 2002; Mathis et al., 2007;Logvinova et al., 2016). Our results add to these observationsindicating a dilution effect of sea-ice melt on DOM in theBering-Chukchi Seas during August-September.
The influence of sea-ice melt on DOM in surface waters ofthe deep basins is minor. Extensive sea-ice melt was observedin surface waters of the Canada Basin and southern MendeleevPlain. However, the melting of sea ice did not result in significantchanges in surface concentrations of DOC, lignin phenols, anda325 values in the region. The lack of significant response to sea-ice melt indicates concentrations of DOM in the melted ice werecomparable to those in the underlying waters. Considering thelarge difference in terrigenous influence, sea ice in the CanadaBasin andMendeleev Plain likely containedmuch less DOM thansea ice found in the central Arctic and Fram Strait (e.g.,<100–300µmol L−1; Melnikov, 1997; Opsahl et al., 1999).
Abundance and Distribution of DOM inHalocline and Atlantic WatersHalocline waters of the Canada and Makarov Basins displayeddistinct DOM distributions related to their sources andformation. A prominent feature in the Canada Basin was themaximal a325 (0.48 ± 0.03 m−1) and minimal S275–295 (22.9
± 0.7 µm−1) in the upper halocline, which indicated highermolecular weight chromophores and minimal photobleaching.Upper halocline waters are derived from brine rejection duringsea-ice formation over the Chukchi and East Siberian shelves,where nutrients and organic matter released from sedimentsare added to the dense brines and advected into the CanadaBasin (Jones and Anderson, 1986; Cooper et al., 1997, 2005).These processes are an important source of CDOM in the upperhalocline (Cooper et al., 2005; Guéguen et al., 2007; Stedmonet al., 2011) and they were apparent from our observations ofnegative f SIM and elevated inorganic nutrients. Concentrationsof dissolved lignin phenols in the upper halocline (3 ± 0.2nmol L−1) were similar to values (3 ± 0.4 nmol L−1) insurface waters, indicating a terrigenous signature associatedwith brine waters. These results are consistent with previousobservations of relatively high concentrations of lignin phenolsand!14C in DOC of upper halocline waters (Benner et al., 2004),demonstrating a contemporary riverine DOM source. Previousobservations of elevated CDOM in the upper halocline weremainly from the southern Canada Basin (Cooper et al., 2005;Guéguen et al., 2007; Nakayama et al., 2011). Our results indicatethese CDOM characteristics can be traced throughout the centraland northern Canada Basin.
In contrast with the Canada Basin, DOC concentrations andCDOM absorption in the Makarov Basin were highest in surfacewaters and decreased rapidly with depth in the upper 200m ofthe water column. The average values of DOC concentrations(70 ± 14 µmol L−1), a325 values (0.58 ± 0.29 m−1), S275–295values (23.7 ± 1.5 µm−1), and lignin phenol concentrations (4± 4 nmol L−1) in the halocline were comparable to those inupper halocline of the Canada Basin. Atlantic water that flowsthrough Fram Strait and is modified over the Eurasian shelvessupplies the halocline in the Makarov Basin (Rudels et al., 1996,2004; Bauch et al., 2016). The Atlantic inflow waters in theFram Strait have relatively low concentrations of DOC (∼61µmol L−1) and CDOM (a350 < 0.2 m−1) (Opsahl et al., 1999;Amon et al., 2003; Granskog et al., 2012). Sea-ice formation andbrine rejection over the Siberian shelves can transport elevatedconcentrations of DOC and CDOM from Siberian rivers to thehalocline. The relatively high concentrations of lignin phenolsindicate an important riverine contribution to the DOC andCDOM in halocline waters. Distributions of DOC, a325, andlignin phenols along the salinity gradient in the halocline werelargely conservative (R2 = 0.78–0.92), indicating minimal loss ofDOM components during transport within halocline waters ofthe Makarov Basin.
The DOC concentrations and CDOM absorption in Atlanticwaters below the halocline were similar between the CanadaBasin and Makarov Basin. Comparisons with previous DOCmeasurements revealed two particular features: little inter-annual variability within the Canada and Makarov Basins anda concentration gradient between the Canadian and EurasianBasins. Average concentrations of DOC in Atlantic watersdecreased from 60 ± 5 µmol L−1 in the Nansen Basin to 56 ±
2 µmol L−1 in the Amundsen Basin, and to 52–55 µmol L−1 inthe Canada Basin (Table 2). These DOC values were also lowerthan those in the inflowing Atlantic water (<600m; 61µmol L−1;
Frontiers in Marine Science | www.frontiersin.org 15 October 2016 | Volume 3 | Article 198

Shen et al. DOM in the Arctic Ocean
TABLE 2 | Concentrations of dissolved organic carbon (DOC) in Arctic Basins.
Region Latitude, longitude Depth (m) DOC (µmol L−1) n References
POLAR MIXED LAYER
Canada Basin 72–83◦N, 127–162◦W 0–80 69 ± 6 (52–88) 144 This study
Canada Basin 70–75◦N, 127–138◦W ∼10 69 ± 11 (61–88) 8 Letscher et al., 2011
Canada Basin 71–74◦N, 134–160◦W 0–30 74 ± 4 (66–81) 19 Davis and Benner, 2005; Shen et al., 2012
Canada Basin 71–74◦N, 145–160◦W – 71 ± 4 (50–90) 54 Mathis et al., 2005
Makarov Basin 85–88◦N, 143◦E–153◦W 0–35 108 ± 9 (81–129) 59 This study
Makarov Basin 80–81◦N, 157◦E–177◦W ∼10 92 ± 26 (70–124) 5 Letscher et al., 2011
Makarov Basin 81–87◦N, 167–179◦E 0–25 107 ± 19 15 Wheeler et al., 1997
Amundsen Basin 80–81◦N, 128–148◦E ∼10 93 ± 4 (90–102) 6 Letscher et al., 2011
Amundsen Basin 88–90◦N, 32–148◦E 0–25 99 ± 8 9 Wheeler et al., 1997
Nansen Basin 78–81◦N, 116–122◦E ∼10 83 ± 10 (71–99) 6 Letscher et al., 2011
Nansen Basin 84–86◦N, 34–38◦E 0–25 65 ± 11 8 Wheeler et al., 1997
HALOCLINE WATER
Canada Basin 72–84◦N, 128–158◦W 50–300 64 ± 3 (57–75) 37 This study
Canada Basin 70–74◦N, 134–160◦W 50–250 66 ± 6 (53–79) 77 Davis and Benner, 2005; Shen et al., 2012
Canada Basin 71–74◦N, 145–160◦W – 63 ± 3 (59–68) 59 Mathis et al., 2005
Makarov Basin 86–88◦N, 166–176◦W 50–150 70 ± 14 (56–101) 10 This study
Makarov Basin 81–87◦N, 167–179◦E 30–150 82 ± 22 13 Wheeler et al., 1997
Makarov Basin 78–81◦N, 160–173◦E 58 97 ± 11 (64–124) 27 Guay et al., 1999
Amundsen Basin 88–90◦N, 32–148◦E 30–150 74 ± 7 7 Wheeler et al., 1997
Amundsen Basin 79–80◦N, 130–138◦E 58 74 ± 9 (64–91) 15 Guay et al., 1999
Nansen Basin 84–86◦N, 34–38◦E 30–150 66 ± 10 10 Wheeler et al., 1997
ATLANTIC WATER
Canada Basin 72–84◦N, 128–158◦W 300–1000 53 ± 3 (50–63) 33 This study
Canada Basin 72–74◦N, 152–160◦W 300–800 55 ± 4 (50–69) 22 Davis and Benner, 2005
Canada Basin 72–74◦N, 152–158◦W 300–800 52 ± 6 (45–62) 6 Benner, unpublished
Canada Basin 71–74◦N, 150–160◦W – 53 ± 2 (48–57) 39 Mathis et al., 2005
Makarov Basin 86–88◦N, 166–176◦W 200–800 54 ± 4 (44–62) 14 This study
Makarov Basin 81–87◦N, 167–179◦E 200–300 55 ± 5 5 Wheeler et al., 1997
Amundsen Basin 88–90◦N, 32–148◦E 200–300 56 ± 2 2 Wheeler et al., 1997
Nansen Basin 84–86◦N, 34–38◦E 200–300 60 ± 5 2 Wheeler et al., 1997
Nordic Seas – 50–600 58 ± 5 54 Amon et al., 2003
ARCTIC DEEP AND BOTTOM WATERS
Canada Basin 72–84◦N, 128–158◦W 1000–2500 49 ± 3 (44–56) 18 This study
Canada Basin 72–74◦N, 152–160◦W 1000–2500 50 ± 3 (44–55) 21 Davis and Benner, 2005
Canada Basin 72–74◦N, 152–160◦W 1000–2500 49 ± 2 (46–52) 8 Benner, unpublished
Canada Basin 72–84◦N, 128–158◦W 2500–4000 46 ± 1 (44–47) 7 This study
Canada Basin 72–74◦N, 152–160◦W 2500–4000 47 ± 3 (43–51) 8 Davis and Benner, 2005
Canada Basin 72–74◦N, 152–160◦W 2500–4000 47 ± 5 (41–51) 3 Benner, unpublished
Canada Basin 71–74◦N, 150–160◦W >1000 47 ± 1 (45–50) 19 Mathis et al., 2005
Makarov Basin 85◦N, 140–170◦E >1000 56 (29–100) 32 Bussmann and Kattner, 2000
Makarov Basin 86–88◦N, 166–176◦W 1000–2500 49 ± 4 (43–54) 10 This study
Makarov Basin 86–88◦N, 166–176◦W 2500–3500 46 ± 2 (44–49) 3 This study
Amundsen Basin – >1000 54 (34–79) 67 Bussmann and Kattner, 2000
Nansen Basin – >1000 50 (36–112) 53 Bussmann and Kattner, 2000
Eurasian Basin – 1800–2500 50 ± 2 20 Amon et al., 2003
NORDIC SEAS
Greenland Sea – 2500–4000 50 ± 2 22 Amon et al., 2003
Greenland Sea 75◦N, 0◦W 1000–4000 48 ± 0.3 10 Hansell and Carlson, 1998
Norwegian Sea 70–72◦N, 0–2◦W 2000–3500 48 ± 2 4 Amon et al., 2003
Data are reported as average ± standard deviation (range).
Frontiers in Marine Science | www.frontiersin.org 16 October 2016 | Volume 3 | Article 198

Shen et al. DOM in the Arctic Ocean
Opsahl et al., 1999; Amon et al., 2003), indicating DOC removalfrom Atlantic waters during transport in the Arctic Ocean.
DOC and CDOM in Deep Arctic WatersConcentrations of DOC in the deep Arctic Ocean exhibiteda strong vertical gradient at depths of 1000–2500m and arelatively homogenous distribution at depths >2500 m. Thevariability in deep DOC concentrations observed in this studywas considerably lower than that reported by Bussmann andKattner (2000) (Table 2). On average, concentrations of DOC indeep waters (1000–2500 m) of the Canada Basin (49 ± 3 µmolL−1) and Makarov Basin (49 ± 4 µmol L−1) were similar to butslightly lower than those in deep waters of the Amundsen Basin(54 µmol L−1), Nansen Basin (50 µmol L−1), outflowing deepwaters from the Eurasian Basin (1800–2500m; 50± 2µmol L−1),and Nordic Seas deep waters (1000–4000 m; 48–50 µmol L−1;Table 2). Concentrations of DOC in bottomwaters of the Canadaand Makarov Basins (>2500 m; 46 ± 2 µmol L−1) were lowerthan those in any Arctic water masses mentioned above, but theywere higher than concentrations in deep waters of other majorocean basins (35–45 µmol L−1; Druffel et al., 1992; Hansell andCarlson, 1998).
There are few CDOM measurements in Arctic deep waters.The a325 measured herein at depths>1000m in the Canada Basin(0.17 ± 0.02 m−1) and Makarov Basin (0.16 ± 0.02 m−1) werewithin the range in deep waters (>2000 m) of the South Atlanticand North Indian Oceans, but were slightly elevated relative tothose in deep waters (>2000 m; 0.10–0.15 m−1) of the Pacific,North Atlantic, and South Indian Oceans (Nelson et al., 2010).
An outstanding feature of the deep-Arctic data was thatconcentrations of DOC decreased (by 6–8 µmol L−1) withincreasing water mass ages from depths of 1000m to 2500m inthe Canada and Makarov Basins. Such a loss of DOC resembledthe gradient (6 ± 1 µmol L−1) observed in North AtlanticDeep Water from 65◦N to 19◦N (Carlson et al., 2010). Thedecline in deep Arctic DOC concentrations was significantlyrelated to an increase in salinity, apparent oxygen utilizationand nutrient concentrations, indicating that physical mixing andmicrobial degradation are responsible for the decline in DOCconcentrations. The radiocarbon content of DOC in CanadaBasin deep water decreases from −380‰ at 1000 m, a valueclose to that in North Atlantic deep water, to −466‰ at 2500m(Griffith et al., 2012). The difference in !14C (−86‰) indicatesthe DOC ages vary by over 700 yr between 1000 and 2500 m,whereas the CFC-based ventilation age of water increases by∼200 yr. These differences between DOC and ventilation agesindicate the DOC that is removed is 14C-enriched relative to thebulk DOC.
Assuming the decrease in deep-water DOC concentrationswas all due to microbial degradation, estimates of maximaldegradation rates can be derived from the regression slopebetween DOC concentrations and ventilation ages at depths of1000–2500m (R2 = 0.51–0.83, p < 0.001). The estimated ratesranged from 0.036µmol C L−1 yr−1 in the Canada Basin to 0.039µmol C L−1 yr−1 in the Makarov Basin, and they represent theupper limits for DOC biodegradation in these deep waters. Thesevalues were 2–3 orders of magnitude lower than those (0.2–5
µmol C L−1 yr−1) estimated in the mesopelagic zone of theNorth Pacific and North Atlantic (Carlson et al., 2010; Kaiser andBenner, 2012), and they were also lower than those (0.04–0.20µmol C L−1 yr−1) in deep waters (>1000 m) of the GreenlandGyre, North Atlantic Ocean, Mediterranean Sea, and East JapanSea (Amon et al., 2003; Carlson et al., 2010; Kim et al., 2015).These comparisons indicate slow microbial degradation of DOCin deep waters of the Arctic Ocean. In addition to the relativelylow abundance of bioavailable DOM in deep waters (Amon andBenner, 2003; Davis and Benner, 2005), low water temperatures(<0◦C) could also influence rates of microbial degradation ofDOM in the deep ocean (e.g., Kim et al., 2015).
An unexpected elevation of a325 (by 10–20%) with minorchanges in DOC concentrations was observed near the seafloor(mostly <50m above the bottom) in the Canada and MakarovBasins. Our observations differ from those of Bussmann andKattner (2000) who reported losses of DOC near the seaflooraround the Lomonosov Ridge. The elevated a325 we observednear the seafloor was associated with lower S275–295 valuesand higher nutrient concentrations, suggesting that the elevatedCDOM was largely derived from benthic remineralization oforganic matter in sediments. This observation is in agreementwith growing data on benthic abundance, diversity, and carbondemand indicating active biological processing in sediments ofdeep Arctic Ocean basins (Clough et al., 1997; Klages et al., 2004;Bluhm et al., 2011). Overall, these data indicate DOC and CDOMin Arctic Ocean deep and bottom waters are more dynamic thanpreviously recognized.
AUTHOR CONTRIBUTIONS
LR and RB designed the study. LR and JW collected the DOM,nutrient and isotope samples onboard the Healy. JW analyzed theisotope samples. YS analyzed the DOC and CDOM. YS and RBwrote the manuscript with comments from LR and JW.
ACKNOWLEDGMENTS
We thank the captains and crews of the US Coast Guard CutterHealy during cruises HLY1002, 1102, and 1202. We also thankBrian Edwards, Chief Scientist on HLY1002, and Larry Mayerand Andy Armstrong, Co-Chief Scientists onHLY1102 and 1202,for their support of this non-interference science during the U.S.Extended Continental Shelf Task Force cruises. This work wasfunded by the USGS Coastal and Marine Geology Program andOffice of Regional Executive-Alaska, and by NSF Division ofPolar Programs (PLR-1220032) and NOAA Office of ClimateObservation. RB and YS acknowledge support from the NSFDivision of Polar Programs (PLR-1504137). Any use of trade,firm, or product names is for descriptive purposes only and doesnot imply endorsement by the U.S. Government.
SUPPLEMENTARY MATERIAL
The Supplementary Material for this article can be foundonline at: http://journal.frontiersin.org/article/10.3389/fmars.2016.00198
Frontiers in Marine Science | www.frontiersin.org 17 October 2016 | Volume 3 | Article 198

Shen et al. DOM in the Arctic Ocean
REFERENCES
Alkire, M. B., Morison, J., and Andersen, R. (2015). Variability in the meteoricwater, sea-ice melt, and Pacific water contributions to the central Arctic Ocean,2000–2014. J. Geophys. Res. 120, 1573–1598. doi: 10.1002/2014JC010023
Amon, R. (2004). “The role of dissolved organic matter for the organic carbon cyclein the Arctic Ocean,” in The Organic Carbon Cycle in the Arctic Ocean, eds R.Stein and R. MacDonald (Berlin: Springer-Verlag), 83–99.
Amon, R. M. W., and Benner, R. (2003). Combined neutral sugars as indicators ofthe diagenetic state of dissolved organic matter in the Arctic Ocean. Deep-SeaRes. Part I 50, 151–169. doi: 10.1016/S0967-0637(02)00130-9
Amon, R. M. W., Budeus, G., and Meon, B. (2003). Dissolved organic carbondistribution and origin in the Nordic Seas: exchanges with the Arctic Ocean andthe North Atlantic. J. Geophys. Res.-Oceans 108, C7. doi: 10.1029/2002JC001594
Anderson, L. (2002). “DOC in the Arctic Ocean,” in Biogeochemistry of MarineDissolved Organic Matter, eds D. A. Hansell and C. A. Carlson (Boston, MA:Academic Press), 665–683.
Anderson, L. G., and Amon, R. M. W. (2015). “DOM in the Arctic Ocean,”in Biogeochemistry of Marine Dissolved Organic Matter, 2nd Edn., eds D. A.Hansell and C. A. Carlson (Boston, MA: Academic Press), 609–633.
Anderson, L. G., Olsson, K., and Skoog, A. (1994). Distribution of dissolvedinorganic and organic carbon in the Eurasian Basin of the Arctic Ocean. J.Geophys. Res. 99, 3273–3283. doi: 10.1029/93JC02977
Bauch, D., Cherniavskaia, E., and Timokhov, L. (2016). Shelf basin exchangealong the Siberian continental margin: modification of Atlantic Waterand Lower Halocline Water. Deep-Sea Res. Part I 115, 188–198. doi:10.1016/j.dsr.2016.06.008
Bauch, D., Schlosser, P., and Fairbanks, R. G. (1995). Freshwater balance andthe sources of deep and bottom waters in the Arctic Ocean inferred fromthe distribution of H2
18O. Prog. Oceanogr. 35, 53–80. doi: 10.1016/0079-6611(95)00005-2
Benner, R., Benitez-Nelson, B., Kaiser, K., and Amon, R. M. W. (2004). Export ofyoung terrigenous dissolved organic carbon from rivers to the Arctic Ocean.Geophys. Res. Lett. 31, L05305. doi: 10.1029/2003GL019251
Benner, R., Louchouarn, P., and Amon, R. M. W. (2005). Terrigenous dissolvedorganic matter in the Arctic Ocean and its transport to surface and deepwaters of the North Atlantic. Global Biogeochem. Cycles 19, GB2025. doi:10.1029/2004GB002398
Benner, R., and Strom, M. (1993). A critical evaluation of the analytical blankassociated with DOC measurements by high-temperature catalytic oxidation.Mar. Chem. 41, 153–160. doi: 10.1016/0304-4203(93)90113-3
Bluhm, A. B., Ambrose W. G. Jr., Bergmann, M., Clough, L. M., Gebruk, A. V.,Hasemann, C., et al. (2011). Diversity of the arctic deep-sea benthos. Mar.Biodivers. 41, 87–107. doi: 10.1007/s12526-010-0078-4
Bluhm, A. B., Kosobokova, K., and Carmack, E. (2015). A tale of two basins: anintegrated physical and biological perspective of the deep Arctic Ocean. Prog.Oceanogr. 139, 89–121. doi: 10.1016/j.pocean.2015.07.011
Bussmann, I., and Kattner, G. (2000). Distribution of dissolved organic carbon inthe central Arctic Ocean: the influence of physical and biological properties. J.Mar. Syst. 27, 209–219. doi: 10.1016/S0924-7963(00)00068-3
Carlson, C. A., Hansell, D. A., Nelson, N. B., Siegel, D. A., Smethie, W. M.,Khatiwala, S., et al. (2010). Dissolved organic carbon export and subsequentremineralization in the mesopelagic and bathypelagic realms of the NorthAtlantic basin. Deep-Sea Res. Part II Top. Stud. Oceanogr. 57, 1433–1445. doi:10.1016/j.dsr2.2010.02.013
Carmack, E., Winsor, P., and Williams, W. (2015). The contiguous panarcticRiverine Coastal Domain: a unifying concept. Prog. Oceanogr. 139, 13–23. doi:10.1016/j.pocean.2015.07.014
Clough, L. M., Ambrose, W. G., Cochran, J. K., Barnes, C., Renaud, P. E., and Aller,R. C. (1997). Infaunal density, biomass and bioturbation in the sediments of theArctic Ocean. Deep-Sea Res. Part II Top. Stud. Oceanogr. 44, 1683–1704. doi:10.1016/S0967-0645(97)00052-0
Conmy, R. N. (2008).Temporal and Spatial Patterns in Optical Properties of ColoredDissolved Organic Matter on Florida’s Gulf Coast: Shelf to Stream to Aquifer.Ph.D. thesis, University of South Florida.
Cooper, L. W., Benner, R., McClelland, J. W., Peterson, B. J., Holmes, R. M.,Raymond, P. A., et al. (2005). Linkages among runoff, dissolved organic carbon,and the stable oxygen isotope composition of seawater and other water mass
indicators in the Arctic Ocean. J. Geophys. Res.-Biogeosci. 110, G02013. doi:10.1029/2005JG000031
Cooper, L. W., Whitledge, T. E., Grebmeier, J. M., and Weingartner, T. (1997).The nutrient, salinity, and stable oxygen isotope composition of Bering andChukchi Seas waters in and near the Bering Strait. J. Geophys. Res.-Oceans 102,12563–12573. doi: 10.1029/97JC00015
Davis, J., and Benner, R. (2005). Seasonal trends in the abundance, compositionand bioavailability of particulate and dissolved organic matter in theChukchi/Beaufort Seas and western Canada Basin. Deep-Sea Res. Part II Top.Stud. Oceanogr. 52, 3396–3410. doi: 10.1016/j.dsr2.2005.09.006
Del Castillo, C. E., and Coble, P. G. (2000). Seasonal variability of the coloreddissolved organic matter during the 1994–95 NE and SW monsoons in theArabian Sea. Deep-Sea Res. Part II Top. Stud. Oceanogr. 47, 1563–1579. doi:10.1016/S0967-0645(99)00154-X
Druffel, E. R. M., Williams, P. M., Bauer, J. E., and Ertel, J. R. (1992). Cyclingof dissolved and particulate organic matter in the open Ocean. J. Geophys.Res.-Oceans 97, 15639–15659. doi: 10.1029/92JC01511
Eicken, H. (2004). “The role of Arctic sea ice in transporting and cycling terrestrialorganic matter,” in The Organic Carbon Cycle in the Arctic Ocean, eds R. Steinand R. W. MacDonald (Berlin: Springer-Verlag), 45–53.
Eicken, H., Gradinger, R., Gaylord, A., Mahoney, A., Rigor, I., and Melling, H.(2005). Sediment transport by sea ice in the Chukchi and Beaufort Seas:increasing importance due to changing ice conditions? Deep-Sea Res. Part IITop. Stud. Oceanogr. 52, 3281–3302. doi: 10.1016/j.dsr2.2005.10.006
Fellman, J. B., D’Amore, D. V., and Hood, E. (2008). An evaluation offreezing as a preservation technique for analyzing dissolved organic C, Nand P in surface water samples. Sci. Total Environ. 392, 305–312. doi:10.1016/j.scitotenv.2007.11.027
Fichot, C. G., and Benner, R. (2011). A novel method to estimate DOCconcentrations from CDOM absorption coefficients in coastal waters. Geophys.Res. Lett. 38, L03610. doi: 10.1029/2010GL046152
Fichot, C. G., and Benner, R. (2014). The fate of terrigenous dissolved organiccarbon in a river-influenced ocean margin. Global Biogeochem. Cycles 28, 1–19.doi: 10.1002/2013GB004670
Fichot, C. G., Benner, R., Kaiser, K., Shen, Y., Amon, R. M., Ogawa, H., et al.(2016). Predicting dissolved lignin phenol concentrations in the coastal oceanfrom chromophoric dissolved organic matter (CDOM) absorption coefficients.Front. Mar. Sci. 3:7. doi: 10.3389/fmars.2016.00007
Fichot, C. G., Kaiser, K., Hooker, S. B., Amon, R. M. W., Babin, M., Bélanger, S.,et al. (2013). Pan-Arctic distributions of continental runoff in the Arctic Ocean.Sci. Rep. 3:1053. doi: 10.1038/srep01053
Giannelli, V., Thomas, D. N., Haas, C., Kattner, G., Kennedy, H., and Dieckmann,G. S. (2001). Behaviour of dissolved organic matter and inorganic nutrientsduring experimental sea-ice formation. Ann. Glaciol. 33, 317–321. doi:10.3189/172756401781818572
Gordon, D. C., and Cranford, P. J. (1985). Detailed distribution of dissolvedand particulate organic matter in the Arctic Ocean and comparison withother oceanic regions. Deep-Sea Res. Part I 32, 1221–1232. doi: 10.1016/0198-0149(85)90005-6
Gosselin, M., Levasseur, M., Wheeler, P. A., Horner, R. A., and Booth, B. C.(1997). New measurements of phytoplankton and ice algal production in theArctic Ocean. Deep-Sea Res. Part II Top. Stud. Oceanogr. 44, 1623–1644. doi:10.1016/S0967-0645(97)00054-4
Gradinger, R. (2009). Sea-ice algae: major contributors to primary productionand algal biomass in the Chukchi and Beaufort Seas during May/June2002. Deep-Sea Res. Part II Top. Stud. Oceanogr. 56, 1201–1212. doi:10.1016/j.dsr2.2008.10.016
Granskog, M. A., Stedmon, C. A., Dodd, P. A., Amon, R. M., Pavlov, A. K., Steur,L., et al. (2012). Characteristics of colored dissolved organic matter (CDOM)in the Arctic outflow in the Fram Strait: assessing the changes and fate ofterrigenous CDOM in the Arctic Ocean. J. Geophys. Res.-Oceans 117, C12. doi:10.1029/2012JC008075
Griffith, D. R., McNichol, A. P., Xu, L., McLaughlin, F. A., MacDonald, R. W.,Brown, K. A., et al. (2012). Carbon dynamics in the western Arctic Ocean:insights from full-depth carbon isotope profiles of DIC, DOC, and POC.Biogeosciences 9, 1217–1224. doi: 10.5194/bg-9-1217-2012
Guay, C. K., Falkner, K. K., Muench, R. D., Mensch, M., Frank, M., andBayer, R. (2001). Wind-driven transport pathways for Eurasian Arctic river
Frontiers in Marine Science | www.frontiersin.org 18 October 2016 | Volume 3 | Article 198

Shen et al. DOM in the Arctic Ocean
discharge. J. Geophys. Res.-Oceans 106, 11469–11480. doi: 10.1029/2000JC000261
Guay, C. K., Klinkhammer, G. P., Falkner, K. K., Benner, R., Coble, P. G.,Whitledge, T. E., et al. (1999). High-resolution measurements of dissolvedorganic carbon in the Arctic Ocean by in situ fiber-optic spectrometry.Geophys.Res. Lett. 26, 1007–1010. doi: 10.1029/1999GL900130
Guéguen, C., Guo, L. D., Yamamoto-Kawai, M., and Tanaka, N. (2007).Colored dissolved organic matter dynamics across the shelf-basin interfacein the western Arctic Ocean. J. Geophys. Res.-Oceans 112, C5. doi:10.1029/2006JC003584
Guéguen, C., Itoh,M., Kikuchi, T., Eert, J., andWilliams,W. J. (2015). Variability indissolved organic matter optical properties in surface waters in the AmerasianBasin. Front. Mar. Sci. 2:78. doi: 10.3389/fmars.2015.00078
Hansell, D. A., and Carlson, C. A. (1998). Deep-ocean gradients in theconcentration of dissolved organic carbon. Nature 395, 263–266. doi:10.1038/26200
Hansell, D. A., Kadko, D., and Bates, N. R. (2004). Degradation of terrigenousdissolved organic carbon in the western Arctic Ocean. Science 304, 858–861.doi: 10.1126/science.1096175
Hudson, N., Baker, A., Reynolds, D. M., Carliell-Marquet, C., and Ward, D.(2009). Changes in freshwater organic matter fluorescence intensity withfreezing/thawing and dehydration/rehydration. J. Geophys. Res. 114, G00F08.doi: 10.1029/2008JG000915
Jakobsson, M., Grantz, A., Kristoffersen, Y., andMacnab, R. (2004). “Physiographyand bathymetry of the Arctic Ocean,” in The Organic Carbon Cycle in the ArcticOcean, eds R. Stein and R. MacDonald (Berlin: Springer-Verlag), 1–6.
Jones, E. P., and Anderson, L. G. (1986). On the origin of the chemical-properties of the Arctic-ocean halocline. J. Geophys. Res.-Oceans 91, 759–767.doi: 10.1029/jc091ic09p10759
Jones, E., Rudels, B., and Anderson, L. (1995). Deep waters of the Arctic Ocean:origins and circulation. Deep-Sea Res. Part I 42, 737–760. doi: 10.1016/0967-0637(95)00013-V
Kaiser, K., and Benner, R. (2012). Organic matter transformations in theupper mesopelagic zone of the North Pacific: chemical composition andlinkages to microbial community structure. J. Geophys. Res. 117, C01023. doi:10.1029/2011JC007141
Kattner, G., Lobbes, J. M., Fitznar, H. P., Engbrodt, R., Nöthig, E. M., and Lara,R. J. (1999). Tracing dissolved organic substances and nutrients from the LenaRiver through Laptev Sea (Arctic). Mar. Chem. 65, 25–39. doi: 10.1016/S0304-4203(99)00008-0
Kim, T.-H., Kim, G., Lee, S.-A., and Dittmar, T. (2015). Extraordinary slowdegradation of dissolved organic carbon (DOC) in a cold marginal sea. Sci. Rep.5:13808. doi: 10.1038/srep13808
Klages, M., Boetius, A., Christensen, J., Deubel, H., Piepenburg, D., Schewe, I., et al.(2004). “The benthos of Arctic seas and its role for the organic carbon cycle atthe seafloor,” in The Organic Carbon Cycle in the Arctic Ocean, eds R. Stein andR. MacDonald (Berlin: Springer-Verlag), 139–167.
Krembs, C. E., Eicken, H., Junge, K., and Deming, J. (2002). High concentrationsof exopolymeric substances in Arctic winter sea ice: implications for the polarocean carbon cycle and cryoprotection of diatoms. Deep-Sea Res. Part I 49,2163–2181. doi: 10.1016/S0967-0637(02)00122-X
Letscher, R. T., Hansell, D. A., and Kadko, D. (2011). Rapid removal of terrigenousdissolved organic carbon over the Eurasian shelves of the Arctic Ocean. Mar.Chem. 123, 78–87. doi: 10.1016/j.marchem.2010.10.002
Logvinova, C. L., Frey, K. E., and Cooper, L. W. (2016). The potential role of seaice melt in the distribution of chromophoric dissolved organic matter in theChukchi and Beaufort Seas. Deep-Sea Res. Part II Top. Stud. Oceanogr. 130,28–42. doi: 10.1016/j.dsr2.2016.04.017
MacDonald, R. W., Paton, D. W., Carmack, E. C., and Omstedt, A. (1995).The freshwater budget and under-ice spreading of Mackenzie River waterin the Canadian Beaufort Sea based on salinity and 18O/16O measurementsin water and ice. J. Geophys. Res. 100, 895–919. doi: 10.1029/94JC02700
Mathis, J. T., Hansell, D. A., and Bates, N. R. (2005). Strong hydrographiccontrols on spatial and seasonal variability of dissolved organic carbon in theChukchi Sea. Deep-Sea Res. Part II Top. Stud. Oceanogr. 52, 3245–3258. doi:10.1016/j.dsr2.2005.10.002
Mathis, J. T., Hansell, D. A., Kadko, D., Bates, N. R., and Cooper, L. W. (2007).Determining net dissolved organic carbon production in the hydrographicallycomplex western Arctic Ocean. Limnol. Oceanogr. 52, 1789–1799. doi:10.4319/lo.2007.52.5.1789
Melling, H., and Moore, R. M. (1995). Modification of halocline source watersduring freezing on the Beaufort Sea shelf: evidence from oxygen isotopesand dissolved nutrients. Cont. Shelf Res. 15, 89–113. doi: 10.1016/0278-4343(94)P1814-R
Melnikov, I. A. (1997). The Arctic Sea Ice Ecosystem. Amsterdam: Gordon andBreach Science Publisher.
Morison, J., Kwok, R., Peralta-Ferriz, C., Alkire, M., Rigor, I., Andersen, R., et al.(2012). Changing arctic ocean freshwater pathways. Nature 481, 66–70. doi:10.1038/nature10705
Mysak, L. A. (2001). Patterns of Arctic circulation. Science 293, 1269–1270. doi:10.1126/science.1064217
Nakayama, Y., Fujita, S., Kuma, K., and Shimada, K. (2011). Iron and humic-type fluorescent dissolved organic matter in the Chukchi Sea and CanadaBasin of the western Arctic Ocean. J. Geophys. Res.-Oceans 116, C7. doi:10.1029/2010JC006779
Nelson, N. B., Siegel, D. A., Carlson, C. A., and Swan, C. M. (2010). Tracingglobal biogeochemical cycles and meridional overturning circulation usingchromophoric dissolved organic matter. Geophys. Res. Lett. 37, L03610. doi:10.1029/2009GL042325
Opsahl, S., Benner, R., and Amon, R. M. W. (1999). Major flux of terrigenousdissolved organic matter through the Arctic Ocean. Limnol. Oceanogr. 44,2017–2023. doi: 10.4319/lo.1999.44.8.2017
Parkinson, C. L., and Comiso, J. C. (2013). On the 2012 record low Arctic sea icecover: combined impact of preconditioning and an August storm.Geophys. Res.Lett. 40, 1356–1361. doi: 10.1002/grl.50349
Proshutinsky, A. Y., and Johnson, M. A. (1997). Two circulation regimes of thewind-driven Arctic Ocean. J. Geophys. Res.-Oceans 102, 12493–12514. doi:10.1029/97JC00738
Rachold, V., Eicken, H., Gordeev, V., Grigoriev, M. N., Hubberten, H.-W., Lisitzin,A. P., et al. (2004). “Modern terrigenous organic carbon input to the ArcticOcean,” in The Organic Carbon Cycle in the Arctic Ocean, eds R. Stein and R.MacDonald (Berlin: Springer-Verlag), 33–55.
Robbins, L. L., Wynn, J. G., Lisle, J. T., Yates, K. K., Knorr, P. O., Byrne, R. H.,et al. (2013a). Baseline monitoring of the Western Arctic Ocean estimates 20%of Canadian Basin surface waters are undersaturated with respect to aragonite.PLoS ONE 8:e73796. doi: 10.1371/journal.pone.0073796
Robbins, L. L., Wynn, J., Knorr, P. O., Onac, B., Lisle, J. T., McMullen, K., et al.(2014). USGS Arctic Ocean Carbon Cruise 2012: Field Activity L-01-12-AR toCollect Carbon Data in the Arctic Ocean, August-September 2012. Reston, VA:U.S. Geological Survey Data Series, 862. doi: 10.3133/ds862
Robbins, L. L., Yates, K. K., Gove, M. D., Knorr, P. O., Wynn, J., Byrne, R. H., et al.(2013b). USGS Arctic Ocean Carbon Cruise 2010, Field Activity H-3-10-AR toCollect Carbon Data in the Arctic Ocean, August- September 2010. Reston, VA:U.S. Geological Survey Data Series, 741. Available online at: http://pubs.usgs.gov/ds/741/
Robbins, L. L., Yates, K. K., Knorr, P. O., Wynn, J., Lisle, J. T., Buczkowski, B.,et al. (2013c). USGS Arctic Ocean Carbon Cruise 2011, USGS Field Activity H-01-11-AR to Collect Carbon Data in the Arctic Ocean, August- September 2011.Reston, VA: U.S. Geological Survey Data Series, 748. Available online at: http://pubs.usgs.gov/ds/748/
Rudels, B. (2009). “Arctic Ocean Circulation,” in Encyclopedia of Ocean Sciences,2nd Edn., eds J. H. Steele, S. A. Thorpe, and K. K. Turekian (Oxford: AcademicPress), 211–225.
Rudels, B., Anderson, L., and Jones, E. (1996). Formation and evolution of thesurface mixed layer and halocline of the Arctic Ocean. J. Geophys. Res. 101,8807–8821. doi: 10.1029/96JC00143
Rudels, B., Jones, E. P., Schauer, U., and Eriksson, P. (2004). Atlantic sources ofthe Arctic Ocean surface and halocline waters. Polar Res. 23, 181–208. doi:10.1111/j.1751-8369.2004.tb00007.x
Rutgers van der Loeff, M. M., Key, R. M., Scholten, J., Bauch, D., and Michel,A. (1995). 228Ra as a tracer for shelf water in the Arctic Ocean. Deep-SeaRes. Part II Top. Stud. Oceanogr. 42, 1533–1553. doi: 10.1016/0967-0645(95)00053-4
Frontiers in Marine Science | www.frontiersin.org 19 October 2016 | Volume 3 | Article 198

Shen et al. DOM in the Arctic Ocean
Shen, Y., Fichot, C. G., and Benner, R. (2012). Dissolved organic mattercomposition and bioavailability reflect ecosystem productivity in the WesternArctic Ocean. Biogeosciences 9, 4993–5005. doi: 10.5194/bg-9-4993-2012
Shimada, K., Itoh, M., Nishino, S., McLaughlin, F., Carmack, E., and Proshutinsky,A. (2005). Halocline structure in the Canada Basin of the Arctic Ocean.Geophys. Res. Lett. 32, 3. doi: 10.1029/2004GL021358
Smith, R., Gosselin, M., Kudoh, S., Robineau, B., and Taguchi, S. (1997). DOC andits relationship to algae in bottom ice communities. J. Mar. Syst. 11, 71–80. doi:10.1016/S0924-7963(96)00029-2
Song, G., Xie, H., Aubry, C., Zhang, Y., Gosselin, M., Mundy, C., et al. (2011).Spatiotemporal variations of dissolved organic carbon and carbon monoxide infirst-year sea ice in the western Canadian Arctic. J. Geophys. Res.-Oceans 116,C9. doi: 10.1029/2010JC006867
Spencer, R. G., Bolton, L., and Baker, A. (2007). Freeze/thaw and pHeffects on freshwater dissolved organic matter fluorescence and absorbanceproperties from a number of UK locations. Water Res. 41, 2941–2950. doi:10.1016/j.watres.2007.04.012
Spencer, R. G. M., Hernes, P. J., Ruf, R., Baker, A., Dyda, R. Y., Stubbins,A., et al. (2010). Temporal controls on dissolved organic matter and ligninbiogeochemistry in a pristine tropical river, Democratic Republic of Congo. J.Geophys. Res. 115, G03013. doi: 10.1029/2009JG001180
Stedmon, C., Amon, R., Rinehart, A., and Walker, S. (2011). The supply andcharacteristics of colored dissolved organic matter (CDOM) in the ArcticOcean: pan Arctic trends and differences. Mar. Chem. 124, 108–118. doi:10.1016/j.marchem.2010.12.007
Steele, M., and Boyd, T. (1998). Retreat of the cold halocline layer in the ArcticOcean. J. Geophys. Res.-Oceans 103, 10419–10435. doi: 10.1029/98JC00580
Steele, M., Morison, J., Ermold, W., Rigor, I., Ortmeyer, M., and Shimada, K.(2004). Circulation of summer Pacific halocline water in the Arctic Ocean. J.Geophys. Res.-Oceans 109, C02027. doi: 10.1029/2003jc002009
Tanhua, T., Jones, E. P., Jeansson, E., Jutterström, S., Smethie, W. M., Wallace, D.W., et al. (2009). Ventilation of the Arctic Ocean: mean ages and inventories
of anthropogenic CO2 and CFC-11. J. Geophys. Res.-Oceans 114, C1. doi:10.1029/2008JC004868
Thomas, D. N., Lara, R. J., Eicken, H., Kattner, G., and Skoog, A. (1995).Dissolved organic matter in Arctic multi-year sea ice during winter: majorcomponents and relationship to ice characteristics. Polar Biol. 15, 477–483. doi:10.1007/bf00237461
Wheeler, P. A., Watkins, J. M., and Hansing, R. L. (1997). Nutrients, organiccarbon and organic nitrogen in the upper water column of the Arctic Ocean:implications for the sources of dissolved organic carbon. Deep-Sea Res. Part IITop. Stud. Oceanogr. 44, 1571–1592.
Woodgate, R. A., and Aagaard, K. (2005). Revising the bering straitfreshwater flux into the Arctic Ocean. Geophys. Res. Lett. 32, L02602. doi:10.1029/2004gl021747
Yamamoto-Kawai, M., McLaughlin, F., Carmack, E., Nishino, S., and Shimada, K.(2008). Freshwater budget of the Canada Basin, Arctic Ocean, from salinity,δ18O, and nutrients. J. Geophys. Res. 113, C01007. doi: 10.1029/2006JC003858
Yamashita, Y., Maie, N., Briceño, H., and Jaffé, R. (2010). Opticalcharacterization of dissolved organic matter in tropical rivers of the GuayanaShield, Venezuela. J. Geophys. Res. 115, G00F10. doi: 10.1029/2009JG000987
Conflict of Interest Statement: The authors declare that the research wasconducted in the absence of any commercial or financial relationships that couldbe construed as a potential conflict of interest.
Copyright © 2016 Shen, Benner, Robbins and Wynn. This is an open-access articledistributed under the terms of the Creative Commons Attribution License (CC BY).The use, distribution or reproduction in other forums is permitted, provided theoriginal author(s) or licensor are credited and that the original publication in thisjournal is cited, in accordance with accepted academic practice. No use, distributionor reproduction is permitted which does not comply with these terms.
Frontiers in Marine Science | www.frontiersin.org 20 October 2016 | Volume 3 | Article 198

Supplementary Table 1. Summary of dissolved organic carbon (DOC) reference standards measured during sample analysis for the three cruises in 2010-2012.
HLY1002 HLY1102 HLY1202 All cruises Range (µmol L-1) 43.2 - 45.9 42.5 - 45.8 42.2 - 45.6 42.2 - 45.9
Q1 (µmol L-1) 44.2 43.6 43.0 43.5 Q3 (µmol L-1) 45.3 44.6 44.4 44.6
Median (µmol L-1) 44.6 44.4 43.6 44.2 Mean (µmol L-1) 44.8 44.2 43.7 44.1 SD (±µmol L-1) 0.7 0.8 0.9 0.9
CV (±%) 1.7 1.7 2.0 2.0 n 28 60 44 132
Seawater reference standards were collected in the Florida Strait (750 m) by the University of Miami, with reported concentrations of DOC ranging from 42-45 µmol L-1. HLY1002, HLY1102, and HLY1202 refer to Healy 2010, Healy 2011, and Healy 2012 cruises, respectively. Q1 = first quartile; Q3 = third quartile; SD = standard deviation; CV = coefficient of variation; n = number of reference samples.

Supplementary Table 2. Physicochemical characteristics of surface waters (8 m) in the western Arctic Ocean.
Bering and Chukchi Seas
Beaufort Sea
Canada Basin
Chukchi Borderland
Sever Spur
Mendeleev Plain
Makarov Basin
Transpolar Drift
(n = 22) (n = 52) (n = 108) (n = 54) (n = 26) (n = 185) (n = 48) (n = 19)
T (˚C) 0.52-4.72 (4.11±2.67)
−0.90-5.15 (4.70±1.89)
−1.51-−1.08 (−0.60±1.18)
−1.32-−0.51 (−0.47±0.61)
−1.58-−1.50 (−1.51±0.03)
−1.53-−1.41 (−1.29±0.22)
−1.68-−1.62 (−1.62±0.04)
−1.67-−1.52 (−1.62±0.04)
Salinity 28.74-32.60 (30.46±1.11)
19.11-30.53 (24.03±2.85)
23.59-28.90 (25.73±1.32)
23.15-27.62 (25.80±0.86)
27.31-29.43 (28.34±0.52)
27.01-28.96 (28.26±0.40)
28.71-31.35 (30.33±0.74)
28.88-31.28 (30.46±0.61)
δ18O (‰) −3.1-0.6 (−1.3±0.9)
−6.8-−2.0 (−5.0±1.1)
−4.0−-2.9 (−3.4±0.2)
−3.7-−3.1 (−3.5±0.2)
−3.6-−2.5 (−3.0±0.3)
−3.6-−2.6 (−3.0±0.2)
−3.7-−1.2 (−2.6±0.4)
−3.3-2.2 (−2.6±0.2)
fMW 0.00-0.15 (0.07±0.04)
0.12-0.32 (0.25±0.05)
0.16-0.21 (0.18±0.01)
0.17-0.20 (0.19±0.01)
0.14-0.20 (0.17±0.02)
0.15-0.20 (0.17±0.01)
0.13-0.20 (0.15±0.02)
0.13-0.18 (0.15±0.01)
fSIM −0.04-0.15 (0.05±0.06)
−0.02-0.20 (0.08±0.06)
0.01-0.16 (0.10±0.04)
0.05-0.18 (0.09±0.03)
0.01-0.05 (0.03±0.01)
0.01-0.06 (0.04±0.01)
−0.04-0.02 (−0.02±0.01)
−0.04-0.02 (−0.02±0.02)
DOC (µmol L-1) 60-114 (81±16) 69-148 (108±21) 52-88 (69±6) 60-87 (72±5) 42-85 (68±11) 52-100 (73±6) 81-129 (107±9) 109-129 (114±5)
a250 (m-1) 1.84-5.23 (2.75±0.85)
2.33-8.80 (5.47±1.90)
1.55-2.70 (2.27±0.24)
1.86-2.65 (2.29±0.12)
1.20-2.65 (2.02±0.32)
1.65-4.60 (2.39±0.40)
4.02-6.85 (5.73±0.59)
5.76-6.85 (6.21±0.32)
a263 (m-1) 1.53-4.50 (2.34±0.76)
1.87-7.65 (4.69±1.69)
1.25-2.19 (1.84±0.19)
1.51-2.15 (1.84±0.10)
0.99-2.02 (1.65±0.26)
1.33-3.87 (1.93±0.35)
3.44-5.98 (4.95±0.53)
4.99-5.98 (5.38±0.28)
a275 (m-1) 1.25-3.74 (1.94±0.65)
1.40-6.29 (3.80±1.41)
0.93-1.69 (1.40±0.15)
1.13-1.64 (1.40±0.08)
0.77-1.52 (1.28±0.20)
0.99-3.13 (1.49±0.29)
2.80-4.97 (4.06±0.45)
4.11-4.97 (4.43±0.24)
a295 (m-1) 0.73-2.35 (1.16±0.42)
0.73-4.01 (2.32±0.93)
0.47-0.93 (0.73±0.09)
0.57-0.86 (0.74±0.05)
0.42-0.82 (0.68±0.10)
0.51-1.89 (0.81±0.19)
1.73-3.23 (2.58±0.31)
2.63-3.23 (2.84±0.17)
a325 (m-1) 0.36-1.20 (0.61±0.26)
0.29-2.06 (1.14±0.50)
0.18-0.40 (0.30±0.04)
0.22-0.34 (0.30±0.02)
0.16-0.35 (0.28±0.05)
0.21-0.90 (0.34±0.10)
0.86-1.68 (1.33±0.17)
1.38-1.68 (1.48±0.09)
a350 (m-1) 0.21-0.74 (0.37±0.15)
0.16-1.25 (0.68±0.31)
0.10-0.23 (0.17±0.03)
0.12-0.20 (0.17±0.01)
0.10-0.21 (0.16±0.03)
0.12-0.53 (0.19±0.06)
0.52-1.02 (0.80±0.11)
0.82-1.02 (0.89±0.06)
S275-295 (µm-1) 23.2-38.9 (26.4±3.3)
22.5-33.0 (25.7±2.2)
29.2-38.1 (32.5±1.6)
30.6-35.6 (32.3±1.1)
29.9-36.1 (31.7±1.4)
25.2-34.0 (30.7±1.4)
21.7-24.6 (23.0±0.8)
21.7-23.0 (22.4±0.3)
TDLP9 (nmol L-1) 2-12 (4±3) 3-22 (11±5) 2-4 (3±0) 2-3 (3±0) 1-3 (2±0) 2-9 (3±1) 9-20 (15±3) 15-20 (17±1)
Data are reported as range and (average ± standard deviation).

Supplementary Table 3. Results of regression analysis of salinity, DOC, and CDOM properties with respect to fractions of meteoric
water (fMW) and sea ice melt (fSIM) in the Arctic surface waters (8 m).
Bering-Chukchi
(n = 20) Beaufort Sea (n = 45) Canada Basin†
(n = 177) Mendeleev Plain (n = 169) Makarov Basin
(n = 46) R2 Slope Int. R2 Slope Int. R2 Slope Int. R2 Slope Int. R2 Slope Int.
Independent variable: fMW Salinity 0.005 -2.16 30.6 0.630** -50.1 36.5 0.287** -63.6 37.7 0.461** -30.9 33.4 0.613** -35.2 35.7 DOC 0.764** 363 53.4 0.628** 350 23.2 0.038* 111 49.6 0.000 -15.0 75.4 0.025 78.7 95.3 a325 0.595** 4.48 0.28 0.741** 9.14 -1.12 0.009 0.30 0.24 0.003 -0.62 0.44 0.020 -1.41 1.54 S275-295 0.162 -19.0 27.1 0.714** -33.1 33.6 0.081** 34.2 26.2 0.021 22.0 27.1 0.245** 23.0 19.5 TDLP9 0.611** 54.3 0.85 0.704** 98.7 -13.3 0.107** 9.97 0.89 0.002 -5.49 3.96 0.031 -25.2 18.3
Independent variable: fSIM
Salinity 0.465** -12.7 31.1 0.693** -40.7 26.9 0.920** -34.3 29.1 0.420** -27.6 29.2 0.273** -27.8 29.9 DOC 0.501** -177 86.8 0.316** 182 97.5 0.001 5.86 69.4 0.006 -51.3 74.8 0.122* -205 104 a325 0.507** -2.57 0.71 0.400** 5.12 0.82 0.018 -0.13 0.30 0.026* -1.62 0.40 0.072 -3.15 1.28 S275-295 0.721** 25.8 24.6 0.347** -17.6 26.5 0.237** 17.6 30.9 0.059* 34.0 29.5 0.022 8.15 23.1 TDLP9 0.332* -24.8 5.70 0.364** 54.89 7.52 0.026 1.49 2.57 0.021 -16.3 3.63 0.042 -34.8 13.9 †Data in the Canada Basin, Chukchi Borderland, and Sever Spur were combined in the regression analysis given their geographic proximity and similar distributions of DOC and CDOM. Significant (p < 0.05) and highly significant (p < 0.001) relationships are denoted by one (*) and two asterisks (**), respectively.

Supplementary Table 4. CDOM absorption coefficients of various water masses in the western Arctic Ocean. Depth a250 a263 a275 a295 a350
Region (m) (m-1) (m-1) (m-1) (m-1) (m-1) n Polar mixed layer (S < 32)
Beaufort Sea 2-80 2.04-8.80 (5.12±2.00) 1.66-7.65 (4.38±1.78) 1.35-6.29 (3.54±1.48) 0.73-4.01 (2.16±0.97) 0.16-1.25 (0.63±0.31) 63 Canada Basin 2-82 1.55-2.87 (2.30±0.24) 1.25-2.37 (1.86±0.20) 0.93-1.86 (1.42±0.16) 0.47-1.08 (0.76±0.11) 0.10-0.30 (0.18±0.04) 144 Sever Spur 2-50 1.20-2.65 (2.04±0.32) 0.99-2.04 (1.67±0.26) 0.77-1.61 (1.29±0.20) 0.42-0.91 (0.69±0.10) 0.10-0.25 (0.17±0.03) 30 Mendeleev Plain 2-60 1.65-4.60 (2.40±0.40) 1.33-3.87 (1.94±0.35) 0.99-3.13 (1.50±0.30) 0.51-1.89 (0.82±0.19) 0.12-0.53 (0.20±0.06) 197 Makarov Basin 2-34 4.02-6.91 (5.80±0.58) 3.44-5.98 (5.01±0.52) 2.80-4.98 (4.12±0.44) 1.73-3.23 (2.63±0.31) 0.52-1.04 (0.82±0.11) 59
Upper halocline (32 < S < 33.9; minimal θ) Beaufort Sea 137-200 2.02-2.29 (2.15±0.14) 1.64-1.84 (1.73±0.10) 1.34-1.51 (1.42±0.08) 0.87-0.95 (0.90±0.04) 0.28-0.33 (0.30±0.02) 3 Canada Basin 59-202 1.92-2.42 (2.16±0.12) 1.56-1.98 (1.77±0.10) 1.27-1.60 (1.44±0.08) 0.79-1.03 (0.91±0.05) 0.25-0.35 (0.31±0.02) 29 Sever Spur 76-180 1.83-2.18 (2.04±0.16) 1.51-1.87 (1.69±0.15) 1.23-1.55 (1.40±0.13) 0.77-0.90 (0.85±0.06) 0.25-0.29 (0.28±0.02) 4 Mendeleev Plain 100-179 2.06-2.80 (2.30±0.34) 1.68-2.36 (1.89±0.32) 1.36-1.94 (1.54±0.28) 0.85-1.26 (0.98±0.19) 0.27-0.41 (0.31±0.06) 4
Lower halocline (33.9 <S < 34.7; θ < 0˚C) Beaufort Sea 186-240 1.72-2.01 (1.87±0.21) 1.37-1.59 (1.48±0.16) 1.10-1.27 (1.19±0.12) 0.69-0.80 (0.74±0.08) 0.22-0.27 (0.25±0.04) 2 Canada Basin 198-303 1.61-2.11 (1.90±0.20) 1.27-1.70 (1.52±0.17) 0.99-1.35 (1.22±0.15) 0.59-0.84 (0.75±0.10) 0.20-0.28 (0.25±0.04) 8 Sever Spur nd nd nd nd nd nd nd Mendeleev Plain 206 1.86 1.48 1.20 0.75 0.25 1
Halocline water (32.5 < S < 34.5; θ < 0˚C) Makarov Basin 50-150 1.60-4.96 (2.62±1.07) 1.28-4.24 (2.18±0.95) 1.03-3.51 (1.78±0.80) 0.62-2.27 (1.12±0.53) 0.18-0.75 (0.36±0.18) 10
Atlantic layer (34.7 < S < 34.9; θ > 0˚C) Beaufort Sea 305-801 1.14-1.56 (1.29±0.14) 0.84-1.21 (0.96±0.12) 0.65-0.97 (0.74±0.10) 0.38-0.58 (0.43±0.07) 0.11-0.21 (0.14±0.03) 7 Canada Basin 298-999 1.02-1.49 (1.22±0.10) 0.78-1.15 (0.92±0.08) 0.61-0.90 (0.70±0.07) 0.34-0.52 (0.41±0.04) 0.09-0.17 (0.13±0.02) 33 Sever Spur 325-500 0.94-1.10 (1.02±0.11) 0.72-0.79 (0.76±0.05) 0.57-0.59 (0.58±0.02) 0.31-0.34 (0.32±0.02) 0.08-0.10 (0.09±0.01) 2 Mendeleev Plain 299-800 1.11-1.31 (1.23±0.07) 0.85-1.00 (0.93±0.05) 0.66-0.77 (0.72±0.04) 0.39-0.44 (0.41±0.02) 0.11-0.13 (0.12±0.01) 6 Makarov Basin 200-813 0.92-1.39 (1.21±0.12) 0.70-1.07 (0.92±0.09) 0.55-0.85 (0.72±0.07) 0.31-0.51 (0.41±0.05) 0.09-0.16 (0.12±0.02) 14
Arctic deep water (1000-2500 m; θ < 0˚C) Beaufort Sea 1001-1400 1.22-1.25 (1.24±0.02) 0.90-0.93 (0.91±0.02) 0.69-0.70 (0.70±0.01) 0.41-0.41 (0.41±0.01) 0.13-0.15 (0.14±0.02) 2 Canada Basin 1000-2542 0.94-1.56 (1.09±0.14) 0.69-1.22 (0.80±0.12) 0.51-0.94 (0.61±0.10) 0.30-0.56 (0.36±0.06) 0.10-0.18 (0.12±0.02) 18 Sever Spur 1500-2499 0.81-0.81 (0.81±0.00) 0.59-0.59 (0.59±0.00) 0.46-0.47 (0.46±0.01) 0.25-0.25 (0.25±0.00) 0.07-0.07 (0.07±0.00) 2 Mendeleev Plain 1000-2001 0.96-1.15 (1.02±0.08) 0.70-0.86 (0.75±0.07) 0.54-0.66 (0.57±0.05) 0.31-0.39 (0.33±0.03) 0.08-0.11 (0.09±0.01) 5 Makarov Basin 900-2500 0.78-1.23 (1.02±0.14) 0.56-0.90 (0.75±0.11) 0.43-0.70 (0.58±0.08) 0.26-0.40 (0.34±0.05) 0.08-0.12 (0.10±0.02) 10
Arctic bottom water (>2500 m; constant in S and θ) Beaufort Sea nd nd nd nd nd nd nd Canada Basin 3000-3824 0.90-1.05 (0.97±0.06) 0.64-0.75 (0.70±0.04) 0.48-0.57 (0.53±0.03) 0.28-0.36 (0.32±0.03) 0.08-0.13 (0.10±0.02) 7 Sever Spur 3059 0.89 0.64 0.49 0.28 0.08 1 Mendeleev Plain 2712-2960 0.85-0.92 (0.88±0.05) 0.60-0.65 (0.63±0.04) 0.46-0.50 (0.48±0.03) 0.27-0.30 (0.28±0.02) 0.06-0.08 (0.07±0.01) 2 Makarov Basin 2860-3350 0.84-0.98 (0.93±0.08) 0.62-0.71 (0.68±0.05) 0.49-0.57 (0.53±0.04) 0.29-0.33 (0.31±0.02) 0.10-0.11 (0.10±0.01) 3
Data are reported as range and (average ± standard deviation).

1
Supplementary Figure 1: Comparisons in CDOM absorption coefficients at 250-400 nm between refrigerated (4˚C) and frozen (−20˚C) seawater samples. (A, C) Surface (45 m) and (B, D) deep (1200 m) waters were collected in two sets of triplicates and divided into three treatments. Treatment I: filtered and stored at 4˚C; treatment II: filtered and frozen at −20˚C; treatment III: frozen (−20˚C) without filtration and filtered prior to analysis. For each treatment, one set of replicates was filtered through GF/F filters (0.7-µm pore size; shown in red open circles) and the other set was filtered through Supor membranes (0.2-µm pore size; shown in blue open circles). CDOM absorption coefficients increase with decreasing wavelengths. Each point represents the average of three replicate measurements at a given wavelength, with a standard error less than 5% in most (85%) of the data. The points would fall on the one-to-one line if values in the frozen sample match those in the refrigerated sample. The dashed lines represent +/- 10% change relative to the one-to-one line.
1.5
1.2
0.9
0.6
0.3
0.0
λ in
froze
n sa
mpl
e - t
reat
men
t III
(m-1
)
1.51.20.90.60.30.0
λ in refrigerated sample - treatment I (m-1)
— 1 to 1 line- - +/- 10% change
Surface water1.2
1.0
0.8
0.6
0.4
0.2
0.01.21.00.80.60.40.20.0
λ in refrigerated sample - treatment I (m-1)
— 1 to 1 line- - +/- 10% change
Deep water
1.2
1.0
0.8
0.6
0.4
0.2
0.01.21.00.80.60.40.20.0
— 1 to 1 line- - +/- 10% change
Deep water1.5
1.2
0.9
0.6
0.3
0.0
λ in
froze
n sa
mpl
e - t
reat
men
t II (
m-1
)
1.51.20.90.60.30.0
— 1 to 1 line- - +/- 10% change
Surface water
0.7 µm filtration0.2 µm filtration

1
Supplementary Figure 2: Relationships between dissolved organic carbon (DOC) and CDOM absorption coefficient at 325 nm (a325) in the Arctic Ocean. The main plot includes all water samples collected at various depths (2-3800 m) in the water column, and the inset is an enlarged view of the relationship for lower DOC and a325 values. There is a bifurcation in the relationship between DOC and a325, with a steeper slope at a325 > 0.35 m-1 (i.e., median value) than at a325 ≤ 0.35 m-1.
2.0
1.5
1.0
0.5
0.0
a 325
(m-1
)
140120100806040
Measured DOC (µmol L-1)
325 ≤ 0.35: = 0.77, = 479325 > 0.35: = 0.87, = 276
0.5
0.4
0.3
0.2
0.1806040