Fluorescent dissolved organic matter in marine sediment pore waters
Upload
khangminh22Category
view
5download
0
1
Retrogressive thaw slumps temper dissolved organic carbon delivery to streams of the Peel Plateau, 1
NWT, Canada 2
3
Cara A. Bulger1, Suzanne E. Tank1, and Steven V. Kokelj2 4
5
1Department of Biological Sciences, University of Alberta, Edmonton, AB, T6G 2E9, Canada 6
2Northwest Territories Geological Survey, Government of the Northwest Territories, Yellowknife, NT, 7
X1A 1K3, Canada 8
Correspondence to: Cara A. Bulger ([email protected]) 9
10
11

2
Abstract 12
In Siberia and Alaska, permafrost thaw has been associated with significant increases in the delivery of 13
dissolved organic carbon (DOC) to recipient stream ecosystems. Here, we examine the effect of 14
retrogressive thaw slumps (RTS) on DOC concentration and transport, using data from eight RTS features 15
on the Peel Plateau, NT, Canada. Like extensive regions of northwestern Canada, the Peel Plateau is 16
comprised of thick, ice-rich tills that were deposited at the margins of the Laurentide Ice Sheet. RTS 17
features are now widespread in this region, with headwall exposures up to 30 m high, and total 18
disturbed areas often exceeding 30 ha. We find that intensive slumping on the Peel Plateau is universally 19
associated with decreasing DOC concentrations downstream of slumps, even though the composition of 20
slump-derived dissolved organic matter (DOM; assessed using specific UV absorbance and slope ratios) 21
is similar to permafrost-derived DOM from other regions. Comparisons of upstream and downstream 22
DOC flux relative to fluxes of total suspended solids suggest that the substantial fine-grained sediments 23
released by RTS features may sequester DOC. Runoff obtained directly from slump rillwater, above entry 24
into recipient streams, indicates that the deepest RTS features, which thaw the greatest extent of 25
buried, Pleistocene-aged glacial tills, release low concentration DOC when compared to paired 26
upstream, un-disturbed locations, while shallower features, with exposures that are more limited to a 27
relict Holocene active layer, have within-slump DOC concentrations more similar to upstream sites. 28
Finally, fine-scale work at a single RTS site indicates that temperature and precipitation serve as primary 29
environmental controls on above-slump and below-slump DOC flux, but that the relationship between 30
climatic parameters and DOC flux is complex for these dynamic thermokarst features. These results 31
demonstrate that we should expect clear variation in thermokarst-associated DOC mobilization across 32
Arctic regions, but that within-region variation in thermokarst intensity and landscape composition is 33
also important for determining the biogeochemical response. Geological and climate legacy shape the 34
physical and chemical composition of permafrost, and thermokarst potential. As such, these factors 35
must be considered in predictions of land-to-water carbon mobilization in a warming Arctic. 36

3
1. Introduction 37
Anthropogenic climate change is significantly affecting the Arctic cryosphere (IPCC, 2014). 38
Temperature increases in circumpolar regions are predicted to be at least 40 % greater than the global 39
mean, while precipitation is also expected to increase significantly in most locations (IPCC, 2014). The 40
resulting degradation of permafrost is forecast to have wide-ranging effects, because thawing has the 41
potential to greatly alter the physical, chemical, and biological functioning of landscapes (Frey and 42
McClelland, 2009; Khvorostyanov et al., 2008a, 2008b; Kokelj et al., 2017b; Schuur et al., 2008, 2013). In 43
particular, permafrost acts as a long term storage medium for solutes and sediments, and as a barrier to 44
the participation of permafrost-sequestered constituents within active biogeochemical cycles (Frey and 45
McClelland 209; Vonk et al. 2015b). Consequently, permafrost thaw can enhance linkages between 46
terrestrial and aquatic systems, via increased transport of terrestrial compounds from land to water 47
(Kokelj et al. 2013; Tanski et al., 2016; Vonk et al., 2015b). Given that circumpolar stores of permafrost 48
carbon are estimated to be almost double that of the atmospheric carbon pool (Hugelius et al., 2014), 49
there is great potential for large increases in carbon mobilization as a result of permafrost thaw (Schuur 50
et al., 2015). Within this context, the mobilization of dissolved organic carbon (DOC) from previously 51
frozen soils is of particular interest, because DOC acts as the primary substrate for the microbially-52
mediated mineralization of organic carbon to carbon dioxide (Battin et al., 2008), and serves as the 53
primary vehicle for the delivery of terrestrial carbon to the Arctic Ocean (Dittmar and Kattner, 2003; 54
Holmes et al., 2012; Spencer et al., 2015). As a result, the implications of thaw-mediated DOC 55
mobilization may range from effects on the permafrost-carbon feedback, to the ecological and 56
biogeochemical functioning of streams, rivers, and the nearshore ocean (e.g. Fritz et al. 2017; Tank et 57
al., 2012b; Vonk et al., 2015b). 58
Permafrost thaw can manifest in many different forms, ranging from an increase in active layer 59
thickness and terrain subsidence, to thermokarst features that significantly reconfigure the physical 60
structure of landscapes (Kokelj and Jorgenson, 2013). Of these, thermokarst has the potential to rapidly 61
4
expose significant quantities of previously-frozen soils to biological and chemical processing (Abbott et 62
al., 2014, 2015; Malone et al., 2013; Tanski et al. 2017). One of the most conspicuous manifestations of 63
thermokarst is the retrogressive thaw slump (RTS; Fig. 1), which develops as a result of mass wasting in 64
ice-rich glacial deposits across northwestern Canada, Alaska, and western Siberia (Kokelj et al., 2017b), 65
and in Yedoma regions of Alaska and Siberia (Murton et al., 2017). Thaw slumps are widespread 66
throughout glaciated terrain in the western Canadian Arctic (Kokelj et al., 2017b; Lantuit et al. 2012), 67
including on the Peel Plateau (Lacelle et al., 2015). These dynamic landforms develop via the ablation of 68
an ice-rich headwall and are particularly efficient at thawing thick zones of ice-rich permafrost and 69
translocating large volumes of sediment from slopes to downstream environments (see Fig. 1). RTS 70
features remain active for decades (Lantuit et al. 2012). They typically stabilize following sediment 71
accumulation at the base of the headwall (Kokelj et al., 2015), but can reactivate causing thaw within 72
the scar zone and upslope expansion of the disturbance (Kokelj et al., 2013; Lantuit and Pollard, 2008). 73
During periods of activity, thawed materials accumulate as a saturated slurry in the slump scar zone (see 74
Fig. 1b) and are transported downslope by mass flow processes, which are accelerated by meltwater- 75
and rainfall-induced saturation (Kokelj et al. 2015). Surface runoff can also remove solutes and 76
suspended sediment from the thawed substrate to downstream environments. Although variation in 77
temperature, precipitation and solar radiation have been correlated with development rates and growth 78
of RTS features (Kokelj et al., 2009, 2013, 2015; Lacelle et al., 2010; Lewkowicz, 1986, 1987), we know 79
little about how these and other environmental drivers might control permafrost-DOC dynamics at the 80
individual-slump to small watershed scale. 81
On the Peel Plateau, an individual thaw slump can impact tens of hectares of terrain, displace 82
hundreds of thousands of cubic meters of sediments, and significantly alter surface water sediment and 83
solute loads (Kokelj et al., 2013; Malone et al., 2013), and thus downstream ecosystems (Chin et al., 84
2016; Malone et al., 2013). The magnitude of these disturbances and their cumulative impacts is great 85
enough to alter solute loads in the Peel River (70,000 km2 watershed area; Kokelj et al., 2013), even 86
5
though only a small portion of that river’s total catchment area (<1%) is influenced by thermokarst 87
(Kokelj et al., 2017b; Segal et al., 2016). This contrasts with many other thaw-affected regions, where 88
increases in solute loads following permafrost disturbance can be transient and have little overall effect 89
on annual solute fluxes (e.g., in High Arctic regions affected by active layer detachments; Lafrenière & 90
Lamoureux, 2013). In addition, permafrost thaw on the Peel Plateau is notable in that it exposes vast 91
quantities of mineral-rich glacial till, which is overlain by a relatively shallow layer of slightly more 92
organic-rich soils (Duk-Rodkin and Hughes, 1992; Kokelj et al. 2017a). Although this till-associated, RTS-93
susceptible landscape type is found across the Laurentide and Barents-Kara glacial margins of Canada, 94
Alaska, and Siberia ( Kokelj et al. 2017b), it contrasts with regions of Alaska and eastern Siberia that are 95
either Yedoma-rich or were covered by patchy or thin drift during the late Pleistocene, and have been a 96
focus for study of permafrost-DOC interactions to date (Abbott et al., 2014, 2015; Drake et al., 2015; 97
Mann et al., 2012; Vonk et al., 2013b). 98
Thermokarst has been documented to enhance DOC concentrations in recipient aquatic 99
ecosystems in several Arctic regions (Frey and McClelland, 2009; Tank et al., 2012a; Vonk et al., 2013a; 100
Vonk and Gustafsson, 2013). In Alaska, streams affected by thaw slumps have higher DOC 101
concentrations than un-affected systems across various terrain types (2-3 fold increase; Abbot et al., 102
2014), while in eastern Siberia the DOC concentration in runoff from thawing Yedoma is considerably 103
greater than concentrations in recipient river systems (~30-fold elevation; Spencer et al. 2015). 104
However, multiple factors, including variable carbon content in permafrost soils (Hugelis et al. 2014) and 105
variation in ground ice type and volume (Fritz et al. 2015) may affect DOC release from permafrost. In 106
regions where thermokarst transports fine-grained sediments to aquatic systems, sorption processes 107
may also be important, because dissolved organic matter (DOM) can readily sorb to mineral soils (e.g., 108
Kothawala et al. 2009). Sorption to mineral sediments can cause DOM to be rapidly removed from 109
solution in stream systems (Kaiser and Guggenberger, 2000; Kothawala et al. 2009; McDowell, 1985), 110
while enabling the downstream transport and continued sequestration of organic carbon (Hedges et al., 111

6
1997). This process may be particularly important for regulating DOC dynamics in glacial margin 112
landscapes, where a predisposition to thaw slumping results in an abundance of thermokarst-related 113
slope disturbances which mobilize fine-grained glacial sediment stores to downstream systems (Kokelj 114
et al., 2017a, 2017b; Lantuit et al. 2012; Rampton, 1988). Despite this, we know little about the 115
downstream consequences of permafrost thaw for carbon biogeochemistry in till-dominated glacial 116
landscapes, which are emerging as some of the most geomorphically dynamic permafrost environments 117
in the circumpolar Arctic. 118
The objective of this study was to quantify how RTS features affect the concentration and 119
composition of DOC across a series of slump-affected streams on the Peel Plateau, and to examine how 120
observed variation in slump morphometry affects DOC dynamics in downstream environments. We 121
further investigated how short-term variation in precipitation, temperature, and solar radiation affect 122
DOC delivery from land to water, using measurements of DOC flux above and below a single RTS feature. 123
We targeted the thermokarst-sensitive Peel Plateau for this work, which is characteristic of till-rich, 124
glacial margin landscapes throughout Canada, Alaska, and Siberia (Kokelj et al. 2017b). By comparing our 125
results to those from elsewhere, we highlight how broad variation in permafrost soil composition, 126
permafrost genesis, and Quaternary history may drive variation in land-freshwater DOC dynamics across 127
divergent regions of the warming circumpolar Arctic. 128
129
130
2 Study Site 131
2.1 General study site description 132
Our study was conducted on the Peel Plateau, situated in the eastern foothills of the Richardson 133
Mountains, NWT, Canada, in the zone of continuous permafrost (Fig. 1a). The fluvially-incised Plateau 134
ranges in elevation from 100 to 650 masl. The region was covered by the Laurentide Ice Sheet (LIS) for a 135
brief period (a maximum of 2,000-3,000 years) 18,500 cal yr BP (Lacelle et al., 2013). The bedrock of the 136
7
region is Lower Cretaceous marine shale from the Arctic River formation (Norris, 1984) and siltstone 137
overlain by Late Pleistocene glacial, glacio-fluvial and glacio-lacustrine sediments (Duk-Rodkin and 138
Hughes, 1992). These Pleistocene deposits host ice-rich permafrost, overlain by a shallow and commonly 139
organic-rich active layer. Radiocarbon dating in the region has placed the age of relict ground ice in the 140
late Pleistocene (18,100 ± 60 14Cyr BP; Lacelle et al., 2013). Upper layers of permafrost thawed during 141
the early Holocene and host younger, Holocene-aged organic materials (Lacelle et al., 2013). These are 142
distinguished from deeper Pleistocene-aged permafrost by a thaw unconformity (Burn 1997; Fig. 1), 143
which developed when warmer climate during the early Holocene prompted the thawing of near-144
surface permafrost. The regional increase in active layer thickness integrated organic matter into the 145
thawed soils and enabled the leaching of soluble ions (see Fig. 1c-d). Climate cooling and permafrost 146
aggradation have archived this notable stratigraphic variation in geochemistry, organic matter content, 147
and cryostructure (Burn 1997; Fritz et al. 2012; Kokelj et al., 2002; Lacelle et al., 2014; Murton and 148
French, 1994). 149
Ice-marginal glacigenic landscapes such as the Peel Plateau host thick layers of ice-rich 150
sediments, and thus have a predisposed sensitivity to climate-driven thaw slump activity (Kokelj et al., 151
2017). On the Peel Plateau, slumping is largely constrained by the maximum extent of the LIS, because 152
the thick layers of ice-rich permafrost necessary for RTS activity are typically not present beyond the 153
glacial limits (Lacelle et al., 2015). Fluvial incision provides the topographic gradient necessary for thaw 154
slump development and RTS features are common; ranging in size from numerous small features, to 155
those greater than 20 ha, which are rare (<5% prevalence; Lacelle et al., 2015). The recent intensification 156
of slumping on the Peel Plateau is driven in part by increasing air temperatures and summer rainfall 157
intensity (Kokelj et al., 2015). This intensification is also increasing the thaw of the deepest layer of ice-158
rich, organic-poor, Pleistocene-aged glacigenic tills that underlie this region. The pattern of abundant 159
thaw slump development across ice-marginal glaciated permafrost landscapes extends from the Peel 160
Plateau across the western Canadian Arctic, and persists at continental scales (Kokelj et al., 2017b). 161

8
162
2.2 Regional climate 163
The regional climate is typical of the subarctic with long, cold winters and short, cool summers. 164
Mean annual air temperature (1981-2010) at the Fort McPherson weather station (Fig. 1a) is -7.3 ⁰C 165
with average summer (June-August) temperatures of 13.3 ⁰C (Environment Canada, 2015). A warming 166
trend of 0.77 ⁰C per decade since 1970 has been recorded; however these increases are most apparent 167
in the winter months (Burn and Kokelj, 2009). Our sample period spanned the thaw months of July and 168
August; average 1981-2010 temperatures for those months, recorded at Fort McPherson, are 15.2 and 169
11.8 ⁰C, respectively, similar to temperatures at Fort McPherson during 2014 (15.6 and 11.6 ⁰C), but 170
slightly higher than 2014 averages observed at a recently established meteorological station on the Peel 171
Plateau (Fig. 1a; 13.2 ⁰C in July and 9.5 ⁰C in August). Annual cumulative rainfall (1981-2010) at Fort 172
McPherson averages 145.9 mm, with July and August having the highest rainfall levels at 46.4 and 39.1 173
mm (Environment Canada, 2015). In 2014, rainfall for July and August was 71 and 121 mm at Fort 174
McPherson, and 128.7 and 170.7 mm on the Peel Plateau. This continues the trend for this region of 175
increasingly wet summers with numerous extreme rainfall events (Kokelj et al., 2015). 176
177
3 Methods 178
3.1 Slump site selection 179
Eight RTS features were selected from across the study region, using aerial surveys and previous 180
knowledge of the region (Fig. 1; Fig. S1; Table 1). Selected slumps were characterized by a debris tongue 181
that connected the slump to the valley bottom and directly impacted a stream system. Sampling at each 182
slump occurred at three discrete locations: upstream, within-slump, and downstream of slump influence 183
(Fig. 1b). Upstream sites were trunk streams that connected with the slump flow path further 184
downstream, and were un-affected by any major geomorphic disturbance and thus representative of an 185
undisturbed, pristine environment. Within-slump sampling occurred at points of channelized slump 186
9
runoff within the scar zone or upper debris tongue. Downstream sampling locations were below the 187
confluence of the sampled upstream flow and all within-slump runoff paths, and were chosen to be 188
representative of slump impact on aquatic ecosystems across the Peel Plateau landscape. In one 189
instance (Slump HD, August 17), a fluidized flow event between sampling events saturated the scar zone 190
and obliterated within-slump channelized surface flow. As a result, the within-slump sample taken at 191
this site was not representative of typical channelized slump runoff that characterized all other slump 192
sampling conditions, and has been discarded from all analyses. 193
A general classification of the slumps is difficult as these features are influenced by a diverse 194
range of geomorphic processes that vary in intensity over time (Table 1; Fig. S1). Three of the slumps 195
(FM4, FM2, FM3) are classified as ‘mega slumps’, characterized by areas greater than 5 ha, a headwall 196
greater than 4 m in height, and a debris tongue that connects the slope to the valley below (Kokelj et al., 197
2013, 2015). Of these, FM4 possesses a headwall approximately 20 m in height, but was largely 198
stabilized in 2014 (Fig. S1). FM2 is among the largest active slumps in the region, with a headwall 25-30 199
m high and visible as a much smaller feature in air photos since 1944 (Lacelle et al. 2015). Slump FM3, 200
which was the focus for ‘environmental controls’ work (further described below), covers an area of 201
approximately 10 ha with a headwall of approximately 10 m height and a debris tongue that extends 202
nearly 600 m down valley (Table 1). Headwall retreat rate at FM3 over a 20 year period has been 203
calculated at 12.5 m yr-1 (Lacelle et al., 2015). FM2 and FM3 geochemistry and geomorphology were 204
previously described by Malone et al. (2013). SD is the smallest and youngest slump that we studied, 205
and was initiated when diversion of a small creek caused lateral bank erosion. In 2014, the SD headwall 206
was 2-4 m high with no defined debris tongue and a scar zone extending approximately 20m upslope. 207
The remaining slump sites (HA, HB, HC, HD) were all well-developed active RTS features with headwalls 208
similar to, or smaller than, FM3, but with smaller debris tongues (Table 1). With the exception of SD, 209
slump headwalls exposed permafrost well below a thaw unconformity, indicating that Pleistocene-aged, 210
unweathered glacigenic materials were being thawed (Lacelle et al., 2013). 211

10
212
3.2 Field sampling and data collection 213
3.2.1 The effect of slumping on DOC and stream water chemistry 214
The majority of our sampling was conducted during the summer of 2014. Of the eight slumps 215
that were sampled, three were accessed from the Dempster Highway three times over the sampling 216
season, one (FM3; see also Sect. 3.2.2) was accessed twice from the highway, and four were accessed 217
twice via helicopter (Table 1). At each of the upstream, downstream, and within-slump sampling 218
locations, specific conductivity, pH, and temperature were recorded using a YSI Pro Plus multi-219
parameter meter. Water samples were collected from directly below the stream surface into 1 L acid 220
washed HDPE bottles and allowed to sit in chilled, dark conditions for 24 h to enable the considerable 221
sediments in these samples to partially settle out of suspension. Sample water was then filtered with 222
pre-combusted (475 ⁰C, 4 hours) Whatman GF/F filters (0.7 μm pore size). Filtered sample water was 223
transferred into 40 mL acid washed, pre-combusted glass bottles for DOC analysis, or 60 mL acid washed 224
HDPE bottles for the analysis of absorbance and major ions. DOC samples were acidified with 225
hydrochloric acid (1 µL mL-1), following Vonk et al. (2015b). The GF/F filters were retained for analysis of 226
total suspended solids (TSS). Samples for stable water isotopes were collected directly from streams into 227
acid washed 40 mL HDPE bottles with no headspace and sealed. During summer 2016, samples were 228
additionally collected from a subset of slump locations (FM2, FM3, FM4 and SD) for the 14C signature of 229
DOC at upstream and within-slump sites. DO14C samples were collected in acid-washed polycarbonate 230
bottles, allowed to settle for 24 h, and filtered using pre-combusted Whatman GF/F filters into pre-231
combusted glass media bottles with phenolic screw caps and butyl septa. All samples were refrigerated 232
until analysis. Absorbance samples were analyzed within 1 week of collection, cation samples within 4 233
months of collection, and DOC (including 14C) samples within 1-2 months of collection. Samples for Fe 234
and δ18O were analyzed within 6 months of collection. 235
236

11
3.2.2 Environmental controls on DOC flux 237
To explore how environmental variables control the flux of DOC from RTS-affected streams, we 238
visited slump FM3 an additional 17 times beyond the sampling described above. This intensively-studied 239
site was chosen to be representative of active Peel Plateau slumps that are eroding Holocene- to 240
Pleistocene-aged sediments. During each visit, we measured discharge at the upstream and downstream 241
locations to calculate DOC flux, and collected upstream and downstream DOC concentration samples. 242
Downstream discharge was measured using an OTT C2 current meter at three locations across the small 243
stream and at 40 % depth. Due to the shallow, low flow conditions at the upstream site, upstream 244
discharge was measured using the cross sectional method (Ward and Robinson, 2000). In both cases, 245
discharge was calculated as the product of velocity and stream cross-sectional area. Local daily climate 246
data were obtained from an automated meteorological station established in 2010 by the Government 247
of the Northwest Territories (Kokelj et al. 2015). The station is located within 2 km of slump FM3 (Fig. 248
1a) and is instrumented for the measurement of air temperature, rainfall, and net radiation. 249
250
3.3 Laboratory analyses 251
3.3.1 Major ions, dissolved organic carbon, δ18O and DO14C 252
Cation concentrations (Ca2+, Mg2+, Na+) were analyzed on a Perkin Elmer Analyst 200 Atomic 253
Absorption Spectrometer at York University. A subset of collected samples were analyzed for total 254
dissolved Fe at the University of Alberta on an Inductively Coupled Plasma - Optical Emission 255
Spectrometer (Thermo Scientific ICAP6300), to allow for the correction of our Specific UV Absorbance 256
results (see below). DOC samples were analyzed on a Shimadzu TOC-V analyzer; DOC was calculated as 257
the mean of the best 3 of 5 injections with a coefficient of variation of <2%; the precision of a 10 mg L-1 258
caffeine standard across all sample runs was 0.32 mg L-1. A Picarro liquid water isotope analyzer was 259
used to measure δ18O at the University of Alberta, following filtration (0.45 µm cellulose acetate, 260
Sartorius) into 2 mL autosampler vials (National Scientific), without headspace. The precision of our 261
12
δ18O analysis is ± 0.2 %. The radiocarbon signature of DOC was measured following extraction and 262
purification at the A.E. Lalonde AMS facility (University of Toronto) using a 3MV tandem accelerator 263
mass spectrometer (High Voltage Engineering) following established methodologies (Lang et al., 2016; 264
Palstra and Meijer, 2014; Zhou et al., 2015), and is reported with an error estimate of 1σ. 265
266
3.3.2 Total suspended solids 267
Samples for TSS were filtered in the field for later analysis, ensuring that there was enough 268
sediment on the pre-combusted (475 ⁰C, 4 hours) and pre-weighed GF/F filters. Filters were stored 269
frozen, dried at 60 ⁰C for 8 hours, placed in a desiccator overnight and promptly weighed. TSS was 270
calculated as the difference in filter weight before and after sediment loading, divided by volume 271
filtered. 272
273
3.3.3 Dissolved organic matter spectral characteristics 274
DOM composition was assessed using absorbance-based metrics. A 5 cm quartz cuvette was 275
used to obtain UV-visible spectra data from 250-750 nm, using a Genesys 10 UV-Vis spectrophotometer. 276
A baseline correction was applied to eliminate any minor interference from particles < 0.7 µm (Green 277
and Blough 1994). Specific UV absorbance at 254 nm (SUVA254), which is correlated with DOM 278
aromaticity (Weishaar and Aiken, 2003), was calculated by dividing the decadal absorbance at 254 nm 279
(m-1) by the DOC concentration (mg L-1). SUVA254 values were corrected for Fe interference following 280
Poulin et al. (2014) using maximum Fe concentrations from laboratory analyses or as reported in Malone 281
et al. (2013). Spectral slopes between 275 and 295 nm, and 350 and 400 nm (S275-295, S350-400) were 282
calculated following Helms et al. (2008), and are reported as positive values to adhere to mathematical 283
conventions. Slope ratios (SR), which correlate with DOM molecular weight (Helms et al., 2008), were 284
calculated as the ratio of S275-295 to S350-400. 285
286

13
3.4 Statistical analyses and calculations 287
Statistical analyses were completed in R version 3.1.3 (R Core Team, 2015) using packages ‘nlme’ 288
(Pinheiro et al., 2015), ‘lmtest’ (Zeileis and Hothorn, 2002), ‘lmSupport’ (Curtin, 2015), ‘car’ (Fox and 289
Weisberg, 2011), and ‘zoo’ (Zeileis and Grothendieck, 2005). The effect of slumping on stream chemistry 290
and optical characteristics was assessed using linear mixed effects models in the ‘nlme’ package of R. For 291
each parameter, analyses were split into two separate models that included data for upstream and 292
downstream chemistry, and upstream and within-slump chemistry. We used this approach to separately 293
assess the effects of slumping downstream of slump systems, and to compare the composition of slump 294
runoff to nearby, pristine environments. For each analysis, we included slump location (see Table 1) as a 295
random effect, and considered models that either nested Julian date within the random effect of slump 296
location, or allowed Julian date to occur as a fixed effect. The best model was chosen using the Akaike 297
Information Criterion (AIC), and best-fit models were refit with a variance structure to ensure that 298
model assumptions were met. The variance structures varIdent (for within-slump site and slump 299
location) and varFixed (for Julian date) were used together (using varComb) and in isolation for this 300
purpose (Zuur et al., 2009). AIC values for the weighted and un-weighted models were again compared 301
to choose a final model of best fit for each analysis. 302
We used the high-frequency data from slump FM3 to assess how environmental conditions 303
(rainfall, temperature, solar radiation) and TSS affect DOC delivery to slump-affected streams. To do 304
this, we conducted multiple linear regressions, using AIC values to determine models of best fit 305
(Burnham and Anderson, 2002). To enable a specific assessment of environmental controls on 306
downstream DOC flux, upstream DOC flux was separated out into a distinct regression analysis, because 307
upstream DOC flux was strongly correlated with flux downstream, and therefore overwhelmed all 308
environmental variables in the downstream model. Models were tested for serial correlation using the 309
auto-correlation function, and models with variance inflation factors greater than 10 or significant 310
Durbin Watson test results (indicative of correlated variables; Durbin & Watson, 1950; Hair et al., 1995) 311
14
were discarded. Residuals were examined to ensure the model was a good fit for the data (Zuur et al., 312
2009). We considered both time-of-sampling (0 h) and past (48, 72, and 120 h) environmental conditions 313
in our analyses. Because cumulative values for environmental variables (i.e. accumulated rainfall in the 314
previous 48, 72 and 120 h) showed a strong positive correlation to one another, we used temporally 315
shifted data (i.e. rainfall 48, 72 and 120 h prior to the DOC flux measurement) in the final model. Similar 316
models were also constructed to examine the effects of environmental drivers on DOC concentration. 317
Differences in paired upstream-downstream measures of DOC flux and concentration at slump FM3 318
were also assessed using a Wilcoxon Signed Rank Test, a non-parametric analog to the paired-t test. 319
Following our finding of decreasing DOC concentrations downstream of slumps (see Sect. 4.1 320
and 5.1) we used data from slump FM3, where we have upstream, downstream, and within-slump DOC 321
concentration measurements, and upstream and downstream discharge measurements, to calculate a 322
mass balance for DOC across the three sampling locations. These data – available for all three locations 323
on two dates during the summer of 2014 – were used to calculate DOC flux at upstream and 324
downstream sites as fluxDOCdown = [DOC]down • dischargedown or fluxDOCup = [DOC]up • dischargeup, and at 325
within-slump sites as fluxDOCwithin = [DOC]within • (dischargedown – dischargeup). We calculate a similar mass 326
balance for TSS, which we use as a rough tracer for the inflow of slump runoff over the < 1 km span 327
between upstream and downstream locations at this site. 328
329
4. Results 330
4.1 DOC concentration across slump sites 331
While DOC concentrations ranged broadly across pristine streams on the Peel Plateau (Fig. 2; 332
from 5.4 to 26.1 mg L-1 at upstream, pristine sites), concentrations consistently declined downstream of 333
slumps, when compared to paired, upstream locations (p<0.001; Fig. 2; Table 2). Although this effect 334
was modest (typically less than 20 %; Fig. 2), it occurred reliably across all slump sites. In contrast, 335
comparisons of upstream and within-slump sites showed no consistent trend in DOC concentration, 336

15
when evaluated across all slump locations (p=0.153; Fig. 2; Table 2). Instead, the effects of slumping on 337
the DOC concentration of slump runoff varied by site. At the largest, most well-developed slump 338
complexes (FM4, FM2, and FM3), where debris tongues are extensive and thaw extends well into the 339
deepest layer of Pleistocene-aged glacigenic materials, DOC concentrations tended to be lower in slump 340
runoff than at the paired upstream sites (Fig. 2). At more modestly-sized slumps (HB, HC, and HD), 341
where modern and relict Holocene active layers comprise a greater proportion of thawed materials, 342
within-slump DOC concentrations tended to be higher than values upstream (Fig. 2). Within each site, 343
DOC concentrations were relatively consistent across the 2-3 sampling periods (Fig. 2). 344
345
4.2 Bulk chemistry of pristine waters and slump runoff 346
To better understand how the input of slump runoff affects downstream DOC, we examined 347
concentrations of major ions, conductivity and TSS as ‘tracers’ of slump activity, because these 348
constituents have previously been shown to be significantly affected by slumping in this region (Kokelj et 349
al., 2005, 2013; Malone et al., 2013; Thompson et al., 2008). Major ion (Ca2+, Mg2+, Na+) concentrations 350
in slump runoff were considerably greater than in pristine streams (a 2.7 to 11.7-fold increase; Fig. 3b-d; 351
Table 2). These patterns were similar, though muted, at slump-affected downstream sites, where major 352
ion concentrations were 1.5 to 3.5-fold greater than at pristine sites (Fig. 3b-d; Table 2). Mean 353
conductivity also increased significantly as a result of slumping (p< 0.001; Table 2): within-slump sites 354
had conductivity values that were 9.2-fold greater than upstream sites, while downstream values were 355
an average of 2.6 times greater than those upstream (Fig. 3e). Finally, TSS was also significantly elevated 356
at slump-affected sites (p< 0.001; Table 2) with concentrations being more than two orders of 357
magnitude greater within slumps, and more than one order of magnitude greater downstream, when 358
compared to upstream sites (Fig. 3a). The effect of slump runoff on downstream chemistry is also 359
reflected in DOC: ion, and DOC: TSS ratios, which decreased markedly between upstream and 360
downstream locations. For example, molar ratios of (Ca2+ + Mg2+): DOC averaged 0.78 ± 0.37 (mean ± 361
16
standard error) upstream of slumps, but 2.07 ± 0.45 downstream, while average gram-weight ratios of 362
TSS: DOC were 32 ± 12 upstream, but 1454 ± 332 at downstream locations. 363
364
4.3 Spectral and isotopic characteristics 365
SUVA254, which is positively correlated with DOM aromaticity (Weishaar and Aiken, 2003), was 366
significantly lower within slumps, and downstream of slumps, than in upstream, pristine, environments 367
(p<0.001; Fig. 4; Table 2). Mean within-slump SUVA254 was less than half of that observed for pristine 368
waters (Fig. 4), while downstream values declined by approximately 20 %. In accordance with the 369
SUVA254 results, S275-295, S350-400, and SR were all significantly greater within slumps when compared to 370
upstream sites (p<0.001; Fig. 4; Table 2), indicating lower DOM molecular weight within slumps (Helms 371
et al., 2008). Differences in slope parameters between upstream and downstream locations were muted 372
relative to the within-slump: upstream comparisons (Fig. 4), with S275-295 (p=0.011) and SR (p<0.001) 373
increasing significantly, but more modestly, downstream of slumps, and S350-400 declining slightly 374
(p=0.001; Fig. 4; Table 2). 375
Upstream δ18O averaged -20.1 ‰ ± 0.12, which corresponds to a modern active-layer pore 376
water δ18O signature for this region (Lacelle et al., 2013; Fig. 5). Within-slump δ18O was discernibly 377
depleted when compared to upstream locations, with mean values of -22.7 ‰ ± 0.72, which falls 378
between previously-identified regional endmembers for Pleistocene-aged ground ice (18,100 ± 60 14C yr 379
BP) and the modern active layer (Lacelle et al., 2013; Fig. 5). Within-slump δ18O was also much more 380
variable between RTS features than upstream and downstream δ18O values. Similar to upstream sites, 381
downstream δ18O clustered near the modern active layer δ18O endmember, but with a small depletion 382
that was consistent with a contribution from slump inflow (-20.7‰ ± 0.21). 383
To further investigate the effect of water source on DOM composition, we examined the 384
relationship between SUVA254 and δ18O. More depleted samples taken from within-slump sites had 385
clearly depressed SUVA254 values when compared to samples with more enriched δ18O (Fig. 5). Of the 386

17
large, most well-developed slumps that were identified in Sect. 4.1, two (FM2 and FM3), in addition to 387
site HB, had δ18O values that were more depleted than the Holocene-aged icy diamicton values reported 388
in Lacelle et al. (2013), suggesting some contribution of runoff from older, Pleistocene-aged permafrost 389
(Fig. 5). It is likely that the δ18O signal at the relatively stable mega-slump site (FM4) was somewhat 390
diluted by the 7.2 mm of rainfall that fell in the 48 hours preceding our sample. Although sites FM3 and 391
SD received 12.4 and 3.5 mm of rain, respectively, in the 48 hours prior to sampling, these are both 392
much more active slump sites, and thus less prone to dilution of the slump outwash signature. There 393
was no significant rainfall immediately preceding sampling at any other sites. 394
The radiocarbon signature of DOC from upstream and within-slump locations at sites FM4, FM2, 395
FM3, and SD largely mirrors the δ18O results. DOC from sites upstream of slump disturbance was 396
approximately modern in origin (ranging from 217 ± 24 14C yr BP to modern in age; Table 3). In contrast, 397
within-slump waters from site FM2 and FM3 were early Holocene-aged (9592 ± 64, and 8167 ± 39 14C yr 398
BP, respectively; Table 3). Slump runoff from site SD was older than at upstream sites, but younger than 399
for the larger slumps, described above (1157 ± 23 14C yr BP; Table 3). 400
401
4.4 Patterns and environmental drivers of DOC flux 402
Similar to our findings for the distributed sampling scheme (Fig. 2), downstream DOC 403
concentration was consistently lower than concentrations upstream, across the 19 paired 404
measurements taken at the intensively studied site FM3 (p<0.001, N=19, W=0; Wilcoxon Signed Rank 405
Test; mean decline of 2.5 ± 0.2 mg L-1, compared to a mean upstream concentration of 13.6 ± 0.5 mg L-406
1). To explore environmental drivers of DOC movement within this landscape, however, we focus on 407
DOC flux, which allows a direct assessment of slump-mediated DOC addition to this system. 408
Downstream DOC flux (mg s-1) tended to be slightly greater than upstream flux on most, but not all, 409
sampling occasions (Fig. 6). As a result, paired comparisons indicate no statistical difference between 410
upstream and downstream DOC flux at this site (Wilcoxon signed rank test; p=0.096, N=19, W=53). 411
18
Because upstream and downstream DOC flux were strongly correlated to one another (r2 = 0.94; 412
p<0.0001), our downstream model was run without upstream DOC flux as a predictor variable. The best-413
fit multiple linear regression model for downstream DOC flux (r2 = 0.84; p<0.01) retained seven 414
variables, of which two were significant (Table 4). Of these, air temperature (72 h prior to sampling) 415
showed a negative relationship with downstream DOC flux while rainfall (0 h; time of sampling) showed 416
a strong positive relationship (Table 4). The best-fit model for upstream DOC flux (r2 = 0.87; p<0.001) 417
also retained seven variables, of which four were significant (p<0.05; Table 4). Similar to the 418
downstream analysis, air temperature (0 h, 72 h) displayed a negative relationship, and time-of-419
sampling (0 h) rainfall a strong positive relationship, with DOC flux (Table 4). However, 120 h rainfall 420
showed a negative relationship with DOC flux in this model. Regressions assessing controls on 421
downstream DOC flux relative to upstream flux (i.e., as a ratio, or the difference between the two 422
values) were not significant. Models to explore controls on upstream and downstream DOC 423
concentration were also relatively similar to one another, showing strong, positive relationships 424
between DOC concentration and air temperature, and more modest negative relationships between 425
DOC concentration and net radiation (Table 4). 426
427
428
5. Discussion 429
5.1 Retrogressive thaw slumps and carbon delivery to streams of the Peel Plateau 430
In both Eastern Siberia (Spencer et al. 2015; Vonk et al., 2013b) and Alaska (Abbott et al., 2014) 431
permafrost slumping has been associated with significant increases in DOC mobilization from terrestrial 432
to aquatic systems. Our data show that this was not the case on the Peel Plateau, where the landscape-433
induced variation in DOC concentration among pristine stream sites was much greater than the change 434
in stream water DOC as a result of slumping. Across all of our study sites, DOC concentrations 435
consistently declined downstream of slumps when compared to upstream locations, while at an 436

19
intensively-sampled slump, DOC flux did not differ significantly between upstream and downstream 437
locations. In contrast, comparisons of channelized slump runoff (our within-slump sites) and paired un-438
affected sites showed no consistent DOC trend. Instead, DOC concentrations in slump runoff were either 439
greater than, or less than, their comparison upstream locations, in a manner that differed depending on 440
slump morphological characteristics such as slump size and headwall height (Fig. 1; see further 441
discussion in Sect. 5.3). The moderate effect of slumping on DOC concentration occurred despite the 442
significant influence of these disturbances on the delivery of many biogeochemical constituents to 443
recipient streams. For example, conductivity was approximately one order of magnitude greater, and 444
TSS two orders of magnitude greater, in slump-derived runoff than at upstream, un-affected sites. This 445
led to substantially increased TSS:DOC and (Ca + Mg):DOC ratios downstream of slumps, when 446
compared to pristine, upstream locations. 447
Decreasing DOC concentrations downstream of slumps, despite increasing concentrations of 448
indicators of slump activity (major ions, TSS) could be driven by several, potentially co-occurring factors. 449
In some locations, decreases may be partially caused by low DOC concentrations in slump outflow (a 450
dilution effect; see slumps FM2, FM3, and FM4 in Fig. 2; further discussed in Sect. 5.3). However, our 451
results suggest that DOC sorption to suspended inorganic sediments could also play a role in regulating 452
DOC dynamics in slump-affected systems. At multiple sites (HB, HC, and HD), DOC concentrations 453
declined downstream of slumps despite a modest elevation in DOC concentration in slump drainage 454
waters (Fig. 2). Thermokarst contributes significant amounts of fine-grained glacigenic sediment to 455
fluvial systems on the Peel Plateau (Kokelj et al., 2013; silty-clay sediment classification for FM3 in 456
Lacelle et al., 2013). DOC sorption can occur in seconds to minutes in freshwater systems (Qualls and 457
Haines, 1992), with fine-grained materials being particularly conducive to this process (Kothawala et al., 458
2009). Data from site FM3, where we have upstream and downstream discharge data coupled with DOC 459
and TSS concentrations at upstream, downstream, and within-slump locations on two separate dates, 460
allows possible DOC sorption to be assessed. On these dates, DOC flux declined downstream of the 461
20
slump (i.e., fluxDOCdown < fluxDOCup), despite a clear and measurable efflux of DOC from the slump to the 462
receiving stream system (fluxDOCwithin; Fig. 7). This same calculation using TSS as a rough tracer of slump 463
inflow shows the calculated efflux of TSS from this slump (fluxTSSwithin) to be almost identical to the 464
increase in TSS flux downstream of the disturbance (as fluxTSSdown – fluxTSSup; Fig. 7). Thus, it seems likely 465
that relatively rapid processes, such as sorption to mineral surfaces, are affecting DOC dynamics in 466
thermokarst-affected fluvial systems on the Peel Plateau. 467
Although a similar decrease in DOC concentration with slumping has been found for lakes in this 468
region (Kokelj et al., 2005), our findings contrast with those from other previously-studied areas of the 469
Arctic, where thermokarst leads to an efflux of high-DOC waters from slump features (e.g., Abbott et al., 470
2014; Vonk et al., 2013a). However, ice-marginal glaciated landscapes are common throughout the 471
western Canadian Arctic, and in many other Arctic regions. The thick, mineral-rich, carbon-poor tills with 472
high ice contents that characterize these landscapes are predisposed to intense thaw slumping and the 473
mobilization of glacigenic sediments from slope to stream (Kokelj et al., 2017b). As a result, DOC 474
‘sequestration’ following slumping seems unlikely to be limited to the Peel Plateau. Given the high TSS 475
export and apparent organic carbon sorption to glacigenic sediments observed with slumping on the 476
Peel Plateau, we expect that substantial organic carbon is mobilized from these disturbances in the 477
particle-attached, rather than dissolved, form (i.e., as particulate organic carbon; POC). Quantifying this 478
POC mobilization and fate once subject to contemporary biogeochemical processing, and the 479
mechanisms that enable DOC sequestration to occur, are key avenues for future research on the Peel 480
Plateau and elsewhere. 481
482
5.2 The effect of retrogressive thaw slumps on DOM composition 483
Although DOC concentrations did not increase in RTS-affected streams, absorbance metrics 484
clearly indicate that slump-derived DOM on the Peel Plateau is compositionally different than DOM from 485
upstream locations. Upstream waters had significantly higher SUVA254 values than downstream and 486

21
within-slump sites (Table 2, Fig. 4). Similarly, while the average SR of Peel Plateau upstream waters (0.74 487
± 0.005) was within the range of SR typically associated with fresh, terrestrial DOM (~ 0.70; Helms et al., 488
2008), values were significantly greater within-slump (0.92 ± 0.015) and downstream (0.89 ± 0.009) 489
(Table 2, Fig. 4), indicating decreasing DOM molecular weight as a result of RTS activity. High SUVA254 490
values accompanied by low SR at upstream sites suggest that water flow in undisturbed catchments is 491
restricted to shallow, organic-rich flowpaths through the active layer, with permafrost inhibiting water 492
contributions from deeper, groundwater or mineral-associated sources (Balcarczyk et al., 2009; 493
MacLean et al., 1999; Mann et al., 2012; O’Donnell et al., 2010; Street et al. 2016). In contrast, within-494
slump and downstream measurements indicate a clear transition in DOM source. 495
The comparatively low SUVA254, and high SR values for downstream and within-slump sites 496
indicate that permafrost-derived carbon on the Peel Plateau is characterized by relatively low molecular 497
weight and aromaticity, and is thus similar in its composition to permafrost carbon from other regions. 498
For example, SUVA254 values were low in waters draining active thaw slumps when compared to 499
stabilized and undisturbed sites on the North Slope of Alaska (Abbott et al., 2014), while in Siberia, 14C-500
depleted DOM from small tributary streams affected by thermokarst had lower SUVA254 values 501
compared to younger DOM from the Kolyma River mainstem (Mann et al., 2015; Neff et al., 2006). 502
Although SUVA254 values for waters draining Peel Plateau thaw slumps are slightly lower than those 503
reported for Siberian Yedoma disturbances (Mann et al., 2015), the overall similarity of permafrost-504
derived DOM composition across these various regions is striking, given the regional differences in 505
permafrost origin and landscape history. For example, the DOM released by permafrost thaw on the 506
Peel Plateau is till-associated, and early-Holocene in mean age, while east Siberian Yedoma is composed 507
of loess-derived Pleistocene deposits that sequestered carbon in association with synengetic permafrost 508
aggradation. This suggests that common processes may enable the organic matter contained in 509
permafrost soils to become compositionally similar across diverse Arctic regions. Such compositional 510
similarity also indicates that permafrost-origin DOM from the Peel Plateau – similar to that from other 511

22
regions (Abbott et al., 2014; Drake et al., 2015) – may be readily degraded by bacteria, despite the 512
divergent origin of this carbon. 513
514
5.3 The effect of slump morphometry on runoff water biogeochemistry 515
δ18O and DO14C data provide further evidence that intense slumping enables novel sources of 516
water and solutes to be transported to fluvial systems on the Peel Plateau. For most of the RTS features 517
that we studied, the δ18O signature of within-slump waters ranged from similar to the ‘icy diamicton’ 518
that overlies the early Holocene thaw unconformity, to that for underlying Pleistocene-aged ground ice 519
(Lacelle et al., 2013; Fig. 5). Similarly, DO14C from a subset of sites indicates slump-derived DOC is early 520
Holocene in age for all but the shallowest slump surveyed. This suggests that our slump outflow samples 521
were likely comprised of a mixture of Pleistocene-, Holocene-, and modern-sourced water (see Fig. 1c-522
e), but that the contribution of these end-members varied across slumps depending on the relative 523
volume of different stratigraphic units being mobilized. 524
The between-site variation in δ18O signature (Fig. 5) and relative DOC concentration (Fig. 2b) of 525
slump runoff waters appears to be related to differences in slump morphometry (size, headwall height, 526
and the length and area of the debris tongue; see Table 1 and Fig. 1c-e) across sites. The well-developed, 527
larger slump complexes (FM4, FM2 and FM3) were more likely to have δ18O signatures that lie between 528
end-member values for Holocene-aged icy diamicton and Pleistocene-aged ground ice (Fig. 5; although 529
note that dry and stabilized FM4 differs somewhat from this trend). These well-developed slumps also 530
stood out as displaying within-slump DOC concentrations that were lower than at upstream comparison 531
sites (Fig. 2b). The headwall exposure at these largest slumps exposes Pleistocene-aged permafrost to 532
several m depth (see Fig. 1c), while the evacuation of scar zone materials has produced extensive debris 533
tongues up to several km long (Table 1, Figs. 1b, S1e and S1g). This significant exposure of mineral-rich, 534
Pleistocene-aged glacial till contributes solutes from low-carbon mineral soils and low-DOC ground ice 535
(Fritz et al. 2015; Tanskii et al. 2016) to runoff, while entraining fine-grained sediments which provide 536

23
mineral surface area for possible DOC adsorption. Adsorption may be further enhanced as slump and 537
stream runoff continue to entrain sediments as flows incise the lengthy debris tongue deposits. In 538
contrast, slumps with slightly shallower headwalls (HA, HB, HC, HD; see Fig. 1d), and less well-developed 539
debris tongues (Table 1), appear to elicit a slightly different response than the largest slumps discussed 540
above. At these mid-sized sites, within-slump DOC concentrations were typically higher than those 541
found at upstream comparison sites (Fig. 2b), which may reflect the greater relative inputs from thawing 542
of the Holocene-aged relict active layer, and decreased interaction with debris tongue deposits at these 543
smaller disturbances. Similarly, runoff δ18O tends to lie between Holocene and modern end-member 544
values at these sites (though note the more depleted value for HB; Fig. 5), indicating a lower relative 545
contribution of Pleistocene-aged ground ice to slump outflow waters. 546
Finally, the youngest and shallowest slump surveyed (SD), exposed only near-surface permafrost 547
soils for leaching and geochemical transport (Figs. 1e and S1; Table 1), and not the underlying mineral 548
and ice-rich glacigenic substrates. Accordingly, the effects of slumping on stream chemistry, optical 549
parameters, and isotopes were muted at SD when compared to the larger slumps discussed above. 550
These morphometry-related shifts in the downstream effects of slumping suggest that we should expect 551
non-linearity in the biogeochemical response as RTS features develop over time, particularly if slumping 552
continues to intensify with future warming on the Peel Plateau (e.g., Kokelj et al., 2017b), underscoring 553
the importance of long-term monitoring on the Peel Plateau and elsewhere. 554
555
5.4 Environmental controls on DOC flux and concentration 556
Air temperature and rainfall exerted the strongest control on DOC flux at our intensively studied 557
site, which was chosen to be representative of active Peel Plateau slumps eroding Holocene- to 558
Pleistocene-aged sediments (slump FM3; Fig. 6; Table 4). Upstream of the slump, rainfall was positively 559
correlated, and air temperature negatively correlated, with DOC flux. However, precipitation events 560
were negatively related to temperature (Fig. 6), suggesting that over a single season, precipitation 561

24
served as the primary environmental control on upstream DOC flux. DOC concentration was relatively 562
constant with upstream discharge (r=-0.342, p=0.151), indicating that precipitation controlled DOC flux 563
largely as a result of changes in runoff, and that DOC was not source-limited over the time scale of our 564
investigation. However, upstream DOC concentration was positively related to temperature (Table 4), 565
suggesting a link between biological activity and within-soil DOC production (c.f. Pumpanen et al., 2014). 566
These upstream-of-slump results are consistent with work from other undisturbed permafrost and 567
boreal regions, where precipitation and catchment runoff have been shown to control DOC flux in 568
streams (Prokushkin et al., 2005; Pumpanen et al., 2014), and increasing temperature has been shown 569
to increase DOC production in soils (Christ and David, 1996; Neff and Hooper, 2002; Prokushkin et al., 570
2005; Yanagihara et al., 2000). They are also consistent with the concept that the permafrost barrier 571
forces runoff to travel through the shallow active layer, where high hydraulic conductivity leads to rapid 572
transport of carbon into fluvial systems (O’Donnell et al., 2010; Striegl et al., 2005). 573
Slumping did not significantly affect downstream DOC flux at the intensively studied slump site, 574
when compared to DOC flux upstream (Fig. 6; Sect. 4.4). Although concentration consistently declined 575
downstream at FM3 (Sect. 4.1 and 4.4), downstream DOC flux was either slightly higher, or slightly 576
lower, than upstream flux; a result that seems likely to play out at other, comparable Peel Plateau 577
slumps, given the coherent concentration patterns that we observed across this landscape. Concordant 578
with the lack of slump effect on DOC flux, neither the ratio of (downstream: upstream) or difference 579
between (downstream – upstream) upstream and downstream DOC flux could be explained by any of 580
our environmental variables, while the environmental controls on downstream flux were almost 581
identical to those upstream (Table 4). The lack of clear environmental control on relative downstream: 582
upstream DOC flux occurred despite the fact that precipitation has been shown to be a strong driver of 583
sediment movement from slump features on the Peel Plateau, at time scales similar to those used for 584
this work (Kokelj et al., 2015). 585
Considering the Peel Plateau landscape as a whole, it appears that precipitation serves as a 586

25
primary, positive control on DOC flux. Thus, this study adds DOC production to the list of changes – such 587
as increasing slump activity and sediment mobilization – that can be expected with the increased 588
precipitation that is affecting this region, and is predicted for many Arctic locations (IPCC, 2014; Kokelj et 589
al., 2015). However, it appears that slumping does not over-ride the landscape-scale control on DOC flux 590
in this system – at least at the scale of this single-season – perhaps because processes like DOC sorption 591
mask the influx of slump-derived DOC (Fig. 6). This result highlights the complexity of the interaction 592
between changing climatic parameters and DOC dynamics on the Peel Plateau, where thaw slumps of 593
increasing size mobilize till, glaciolacustrine, glaciofluvial, and organic deposits, while also draining 594
contemporary active layers across a shrub-tundra to spruce forest upland gradient. DOC dynamics are 595
thus affected by both water and carbon generation across these variable landform types, and by 596
biogeochemical interactions such as mineral adsorption in recipient systems. Future work to tease apart 597
the interactions between changing climatic parameters, slump development, and resultant 598
biogeochemical effects is clearly warranted, with the recognition that environmental controls on slump 599
activity, and thus downstream biogeochemistry, can be expected to show marked regional variation (see 600
for example, work from Eureka Sound; Grom & Pollard 2008). 601
602
6. Conclusions: Dissolved carbon mobilization across diverse permafrost landscapes 603
Carbon dynamics in Arctic aquatic systems are influenced by numerous factors, including 604
geology, Quaternary and glacial history, soil composition, vegetation, active layer dynamics, and the 605
nature and intensity of thermokarst. As a result, the effect of permafrost thaw on DOC concentration 606
and flux should – at a fundamental level – vary across broad, regional scales. Our results demonstrate 607
that we can expect marked inter-regional variation in DOC transport to streams in response to 608
permafrost degradation. For example, declines in DOC concentration downstream of slumps on the Peel 609
Plateau clearly differ from what has been found in eastern Siberia and regions of Alaska, where 610
thermokarst releases substantial quantities of DOC (e.g., Spencer et al. 2015), and increases DOC 611

26
concentrations in downstream systems (Abbott et al. 2015). Efforts that incorporate information 612
concerning the geology and Quaternary history of thawing landscapes, the physical and geochemical 613
composition of permafrost soils, and the nature and intensity of thermokarst processes within 614
landscapes (see, for example, Olefeldt et al. 2016) will considerably increase our ability to predict 615
climate-driven changes in carbon delivery from land to water on a pan-Arctic scale. 616
At finer scales, this work underscores the variability of thermokarst effects within regions, and 617
the local-scale control on this variability. On the Peel Plateau, between-site differences in the 618
biogeochemical effect of thermokarst are related to variation in soil stratigraphy (i.e., the relative depth 619
of the Holocene-aged paleo-active layer) and ever-evolving slump morphometry. Although striking 620
within-region variability in biogeochemical response to thermokarst has been seen elsewhere (e.g., 621
Watanabe et al., 2011), responses in other regions occur as a result of very different – and region-622
specific – landscape-level drivers. This landscape-specificity also extends to the non-linear 623
biogeochemical response as thermokarst features develop over time. Changes in downstream 624
biogeochemistry with slump development are very different on the Peel Plateau, for example, than in 625
other regions (e.g., Abbot et al. 2015), while temporal non-linearity can also be expected for other types 626
of permafrost thaw (Kokelj et al. 2002, Vonk et al. 2016) such as increasing active layer thickness 627
(Romanovsky et al. 2010). It seems clear that a tiered approach, targeted within regions to understand 628
local controls on thaw-driven DOC mobilization, and across regions to document the effects of broad-629
scale variation imposed by geological and climate legacy, is required to understand future 630
biogeochemical functioning of thermokarst-affected landscapes in a warming circumpolar Arctic. 631
632
633

27
Data availability: Data associated with this manuscript have been made available in Tables S1 and S2. 634
635
Competing interests: The authors declare that they have no conflict of interest. 636
637
Acknowledgements 638
Financial support for this research was provided by Ontario Graduate Scholarship, York University 639
Fieldwork Cost Fund, York University Research Cost Fund, Northern Scientific Training Program, NSERC 640
Discovery and Northern Research Supplement grants to SET, the Campus Alberta Innovates Program, 641
and the Polar Continental Shelf Program. We would like to thank Scott Zolkos for his support as a field 642
assistant and for the production of Figure 1; S. Tetlichi, D. Neyando, and P. Snowshoe for field sampling 643
assistance; and the Tetlit Gwich’in (Fort McPherson) Renewable Resources Council. Sarah Shakil and 644
Scott Zolkos assisted with the collection of samples for DO14C; Justin Kokoszka performed geospatial 645
calculations of slump area and debris tongue length. Comments from Michael Fritz and one anonymous 646
reviewer greatly improved the content of the manuscript. NWT Geological Survey contribution number 647
xxyy. 648
649
28
Literature Cited 650
Abbott, B. W., Larouche, J. R., Jones, J. B., Bowden, W. B., and Balser, A. W.: Elevated dissolved organic 651 carbon biodegradability from thawing and collapsing permafrost, J. Geophys. Res., 119, 2049–2063, 652 doi:10.1002/2014JG002678, 2014. 653
Abbott, B. W., Jones, J. B., Godsey, S. E., Larouche, J. R., and Bowden, W. B.: Patterns and persistence of 654 hydrologic carbon and nutrient export from collapsing upland permafrost, Biogeosciences, 12, 655 3725–3740, doi:10.5194/bg-12-3725-2015, 2015. 656
Balcarczyk, K. L., Jones, J. B., Jaffé, R., and Maie, N.: Stream dissolved organic matter bioavailability and 657 composition in watersheds underlain with discontinuous permafrost, Biogeochemistry, 94, 255–270, 658 doi:10.1007/s10533-009-9324-x, 2009. 659
Battin, T. J., Kaplan, L. A., Findlay, S., Hopkinson, C. S., Marti, E., Packman, A. I., Newbold, J. D., and 660 Sabater, F.: Biophysical controls on organic carbon fluxes in fluvial networks, Nat. Geosci., 1, 95–100, 661 doi:10.1038/ngeo101, 2008. 662
Burn, C. R.: Cryostratigraphy, paleogeography, and climate change during the early Holocene warm 663 interval, western Arctic coast, Canada. Can. J. Earth Sci. 34, 912-925, doi: 10.1139/e17-076, 1997. 664
Burn, C. R. and Kokelj, S. V: The environment and permafrost of the Mackenzie Delta area, Permafr. 665 Periglac. Process., 20, 83–105, doi:10.1002/ppp.655, 2009. 666
Burnham, K. P. and Anderson, D. R.: Model Selection and Multi- Model Inference: A Practical 667 Information-Theoretic Approach, Springer, New York., 2002. 668
Chin, K. S., Lento, J., Culp, J. M., Lacelle, D., and Kokelj, S. V.: Permafrost thaw and intense thermokarst 669 activity decreases abundance of stream benthic macroinvertebrates, Glob. Chang. Biol., 22, 2715–670 2728, doi:10.1111/gcb.13225, 2016. 671
Christ, M. J. and David, M. B.: Temperature and moisture effects on the production of dissolved organic 672 carbon in a Spodosol, Soil Biol. Biochem., 28, 1191–1199, doi:10.1016/0038-0717(96)00120-4, 1996. 673
Curtin, J.: lmSupport: Support for Linear Models. R package version 2.9.2., 2015. 674
Dittmar, T. and Kattner, G.: The biogeochemistry of the river and shelf ecosystem of the Arctic Ocean: a 675 review, Mar. Chem., 83, 103–120, doi:10.1016/S0304-4203(03)00105-1, 2003. 676
Drake, T. W., Wickland, K. P., Spencer, R. G. M., McKnight, D. M., and Striegl, R. G.: Ancient low–677 molecular-weight organic acids in permafrost fuel rapid carbon dioxide production upon thaw, Proc. 678 Natl. Acad. Sci., 112, 13946–13951, doi:10.1073/pnas.1511705112, 2015. 679
Duk-Rodkin, A. and Hughes, O. L.: Surficial Geology, Fort McPherson-Bell River. Yukon-Northwest 680 Territories. Geological Survey of Canada, Map 1745A, scale 1:250 000, Geological Survey of Canada, 681 Map 1745A, scale 1:250 000, 1992. 682
Durbin, J. and Watson, G. S.: Testing for serial correlation in least squares regression I, Biometrika, 37, 683 409–428, 1950. 684

29
Environment Canada: Canadian Climate Normals 1981-2010 Station Data, Fort McPherson, 2015. 685
Fox, J. and Weisberg, S.: An {R} Companion to Applied Regression, Second Edition. Thousand Oaks CA: 686 Sage. http://socserv.socsci.mcmaster.ca/jfox/Books/Companion., 2011. 687
Frey, K. E. and McClelland, J. W.: Impacts of permafrost degradation on arctic river biogeochemistry, 688 Hydrol. Process., 23, 169–182, doi:10.1002/hyp, 2009. 689
Fritz, M., Vonk, J. E., and Lantuit, H.: Disappearing Arctic coastlines, Nat. Clim. Change, 7, 6-7, 690 doi:10.1038/nclimate3188, 2017. 691
Fritz, M., Opel, T., Tanski, G., Herzschuh, U., Meyer, H., Eulenburg, A., and Lantuit, H.: Dissolved organic 692 carbon (DOC) in Arctic ground ice, The Cryosphere, 9, 737-752, doi:10.5194/tc-9-737-2015, 2015. 693
Fritz, M., Wetterich, S., Schirrmeister, L., Meyer, H., Lantuit, H., Preusser, F., and Pollard, W. H.: Eastern 694 Beringia and beyond: Late Wisconsinan and Holocene landscape dynamics along the Yukon Coastal 695 Plain, Canada. Palaeogeogr. Palaeoclimatol. Palaeoecol., 319–320, 28–45, doi: 696 10.1016/j.palaeo.2011.12.015, 2012. 697
Fulton, R. J.: Surficial Materials of Canada, Natural Resources Canada., 1995. 698
Green, S. A. and Blough, N. V.: Optical absorption and fluorescence properties of chromophoric 699 dissolved organic matter in natural waters, Limnol. Oceanogr., 39, 1903–1916, 700 doi:10.4319/lo.1994.39.8.1903, 1994. 701
Hair, J. F. J., Anderson, R. E., Tatham, R. L., and Black, W. C.: Multivariate Data Analysis, 3rd ed., 702 Macmillan, New York., 1995. 703
Hedges, J. I., Keil, R. G., and Benner, R.: What happens to terrestrial organic matter in the ocean?, Org. 704 Geochem., 27, 195–212, 1997. 705
Helms, J. R., Stubbins, A., Ritchie, J. D., Minor, E. C., Kieber, D. J., and Mopper, K.: Absorption spectral 706 slopes and slope ratios as indicators of molecular weight, source, and photobleaching of 707 chromophoric dissolved organic matter, Limnol. Oceanogr., 53, 955–969, 708 doi:10.4319/lo.2008.53.3.0955, 2008. 709
Holmes, R. M., McClelland, J. W., Peterson, B. J., Tank, S. E., Bulygina, E., Eglinton, T. I., Gordeev, V. V., 710 Gurtovaya, T. Y., Raymond, P. A., Repeta, D. J., Staples, R., Striegl, R. G., Zhulidov, A. V., and Zimov, S. 711 A.: Seasonal and annual fluxes of nutrients and organic matter from large rivers to the Arctic Ocean 712 and surrounding seas, Estuaries and Coasts, 35, 369–382, doi:10.1007/s12237-011-9386-6, 2012. 713
Hugelius, G., Strauss, J., Zubrzycki, S., Harden, J. W., Schuur, E. A. G., Ping, C. L., Schirrmeister, L., Grosse, 714 G., Michaelson, G. J., Koven, C. D., O’Donnell, J. A., Elberling, B., Mishra, U., Camill, P., Yu, Z., 715 Palmtag, J., and Kuhry, P.: Estimated stocks of circumpolar permafrost carbon with quantified 716 uncertainty ranges and identified data gaps, Biogeosciences, 11, 6573–6593, doi:10.5194/bg-11-717 6573-2014, 2014. 718
IPCC: Topic 2: Future Climate Changes, Risks, and Impacts In Climate Change 2014: Synthesis Report. 719 Contribution of Working Groups I, II and III to the Fifth Assessment Report of the Intergovernmental 720 Panel on Climate Change [Core Writing Team, R.K. Pachauri and L.A. Meyer (eds.)]. IPCC, Geneva, 721
30
Switzerland, 151 pp, Geneva, Switzerland., 2014. 722
Kaiser, K. and Guggenberger, G.: The role of DOM sorption to mineral surfaces in the preservation of 723 organic matter in soils, Org. Geochem., 31, 711–725, doi:10.1016/S0146-6380(00)00046-2, 2000. 724
Khvorostyanov, D. V., Krinner, G., Ciais, P., Heimann, M., and Zimov, S. A.: Vulnerability of permafrost 725 carbon to global warming. Part I: Model description and role of heat generated by organic matter 726 decomposition, Tellus, Ser. B Chem. Phys. Meteorol., 60 B, 250–264, doi:10.1111/j.1600-727 0889.2007.00333.x, 2008a. 728
Khvorostyanov, D. V., Ciais, P., Krinner, G., Zimov, S. A., Corradi, C., and Guggenberger, G.: Vulnerability 729 of permafrost carbon to global warming. Part II: Sensitivity of permafrost carbon stock to global 730 warming, Tellus, Ser. B Chem. Phys. Meteorol., 60 B, 265–275, doi:10.1111/j.1600-731 0889.2007.00336.x, 2008b. 732
Kokelj, S. V, Tunnicliffe, J. F., and Lacelle, D.: The Peel Plateau of northwestern Canada : an ice-rich 733 hummocky moraine landscape in transition, in Landscapes and Landforms of western Canada, 734 edited by O. Slaymaker, pp. 109–122, Springer International Publishing, Switzerland., 2017a. 735
Kokelj, S. V. and Jorgenson, M. T.: Advances in thermokarst research, Permafr. Periglac. Process., 24, 736 108–119, doi:10.1002/ppp.1779, 2013. 737
Kokelj, S. V., Smith, C. A., and Burn, C. R.: Physical and chemical characteristics of the active layer and 738 permafrost, Herschel Island, western Arctic Coast, Canada, Permafr. Periglac. Process., 13, 171–185, 739 doi:10.1002/ppp.417, 2002. 740
Kokelj, S. V., Jenkins, R. E., Milburn, D., Burn, C. R., and Snow, N.: The influence of thermokarst 741 disturbance on the water quality of small upland lakes, Mackenzie Delta region, Northwest 742 Territories, Canada, Permafr. Periglac. Process., 16, 343–353, doi:10.1002/ppp.536, 2005. 743
Kokelj, S. V., Lantz, T. C., Kanigan, J. C., Smith, S. L., and Coutts, R.: Origin and polycyclic behaviour of 744 tundra thaw slumps, Mackenzie Delta region, Northwest Territories, Canada, Permafr. Periglac. 745 Process., 20, 173–184, doi:10.1002/ppp, 2009. 746
Kokelj, S. V., Lacelle, D., Lantz, T. C., Tunnicliffe, J., Malone, L., Clark, I. D., and Chin, K. S.: Thawing of 747 massive ground ice in mega slumps drives increases in stream sediment and solute flux across a 748 range of watershed scales, J. Geophys. Res. Earth Surf., 118, 681–692, doi:10.1002/jgrf.20063, 2013. 749
Kokelj, S. V., Tunnicliffe, J., Lacelle, D., Lantz, T. C., Chin, K. S., and Fraser, R.: Increased precipitation 750 drives mega slump development and destabilization of ice-rich permafrost terrain, northwestern 751 Canada, Glob. Planet. Change, 129, 56–68, doi:10.1016/j.gloplacha.2015.02.008, 2015. 752
Kokelj, S. V., Lantz, T. C., Tunnicliffe, J., Segal, R., and Lacelle, D.: Climate-driven thaw of permafrost 753 preserved glacial landscapes, northwestern Canada, Geology, 45, 371–374, doi:10.1130/G38626.1, 754 2017b. 755
Kothawala, D. N., Moore, T. R., and Hendershot, W. H.: Soil properties controlling the adsorption of 756 dissolved organic carbon to mineral soils, Soil Sci. Soc. Am. J., 73, 1831–1842, 757 doi:10.2136/sssaj2008.0254, 2009. 758
31
Lacelle, D., Bjornson, J., and Lauriol, B.: Climatic and geomorphic factors affecting contemporary (1950-759 2004) activity of retrogressive thaw slumps on the Aklavik Plateau, Richardson Mountains, NWT, 760 Canada, Permafr. Periglac. Process., 21, 1–15, doi:10.1002/ppp.666, 2010. 761
Lacelle, D., Lauriol, B., Zazula, G., Ghaleb, B., Utting, N., and Clark, I. D.: Timing of advance and basal 762 condition of the Laurentide Ice Sheet during the last glacial maximum in the Richardson Mountains, 763 NWT, Quat. Res. (United States), 80, 274–283, doi:10.1016/j.yqres.2013.06.001, 2013. 764
Lacelle, D., Fontaine, M., Forest, A. P., and Kokelj, S.: High-resolution stable water isotopes as tracers of 765 thaw unconformities in permafrost: A case study from western Arctic Canada, Chem. Geol., 368, 85–766 96, doi:10.1016/j.chemgeo.2014.01.005, 2014. 767
Lacelle, D., Brooker, A., Fraser, R. H., and Kokelj, S. V.: Distribution and growth of thaw slumps in the 768 Richardson Mountains–Peel Plateau region, northwestern Canada, Geomorphology, 235, 40–51, 769 doi:10.1016/j.geomorph.2015.01.024, 2015. 770
Lafrenière, M. J. and Lamoureux, S. F.: Thermal perturbation and rainfall runoff have greater impact on 771 seasonal solute loads than physical disturbance of the active layer, Permafr. Periglac. Process., 24, 772 241–251, doi:10.1002/ppp.1784, 2013. 773
Lang, S. Q., McIntyre, C. P., Bernasconi, S. M., Früh-Green, G. L., Voss, B. M., Eglinton, T. I., and Wacker, 774 L.: Rapid 14C analysis of dissolved organic carbon in non-saline waters, Radiocarbon, 58, 505–515, 775 doi:10.1017/RDC.2016.17, 2016. 776
Lantuit, H. and Pollard, W. H.: Fifty years of coastal erosion and retrogressive thaw slump activity on 777 Herschel Island, southern Beaufort Sea, Yukon Territory, Canada, Geomorphology, 95, 84–102, 778 doi:10.1016/j.geomorph.2006.07.040, 2008. 779
Lantuit, H., Pollard, W. H., Couture, N., Fritz, M., Schirrmeister, L., Meyer, H., and Hubberten, H.W.: 780 Modern and late Holocene retrogressive thaw slump activity on the Yukon Coastal Plain and 781 Herschel Island, Yukon Territory, Canada. Permafrost Periglacial Process. 23, 39–51, doi: 782 10.1002/ppp.1731, 2012. 783
Lantz, T. C. and Kokelj, S. V.: Increasing rates of retrogressive thaw slump activity in the Mackenzie Delta 784 region, N.W.T., Canada, Geophys. Res. Lett., 35, 1–5, doi:10.1029/2007GL032433, 2008. 785
Lewkowicz, A. G.: Rate of short-term ablation of exposed ground ice, Banks Island, Northwest 786 Territories, Canada, J. Glaciol., 32, 511–519, 1986. 787
Lewkowicz, A. G.: Headwall retreat of ground-ice slumps, Banks Island, Northwest Territories, Can. J. 788 Earth Sci., 24, 1077–1085, doi:10.1139/e87-105, 1987. 789
MacLean, R., Oswood, M. W., Irons, J. G., and McDowell, W. H.: The effect of permafrost on stream 790 biogeochemistry: A case study of two streams in the Alaskan (U.S.A.) taiga, Biogeochemistry, 47, 791 239–267, doi:10.1007/BF00992909, 1999. 792
Malone, L., Lacelle, D., Kokelj, S., and Clark, I. D.: Impacts of hillslope thaw slumps on the geochemistry 793 of permafrost catchments (Stony Creek watershed, NWT, Canada), Chem. Geol., 356, 38–49, 794 doi:10.1016/j.chemgeo.2013.07.010, 2013. 795

32
Manley, W. F. and Kaufman, D. S.: Alaska PaleoGlacier Atlas: Institute of Arctic and Alpine Research 796 (INSTAAR), University of Colorado., 2002. 797
Mann, P. J., Davydova, A., Zimov, N., Spencer, R. G. M., Davydov, S., Bulygina, E., Zimov, S., and Holmes, 798 R. M.: Controls on the composition and lability of dissolved organic matter in Siberia’s Kolyma River 799 basin, J. Geophys. Res. Biogeosciences, 117, G01028, doi:10.1029/2011JG001798, 2012. 800
Mann, P. J., Eglinton, T. I., McIntyre, C. P., Zimov, N., Davydova, A., Vonk, J. E., Holmes, R. M., and 801 Spencer, R. G. M.: Utilization of ancient permafrost carbon in headwaters of Arctic fluvial networks, 802 Nat. Commun., 6, 7856, doi: 10.1038/ncomms8856, 2015. 803
McDowell, W. H.: Kinetics and mechanisms of dissolved organic carbon retention in a headwater stream, 804 Biogeochemistry, 1, 329–352, 1985. 805
Murton, J. and French, H.: Cryostructures in permafrost, Tuktoyaktuk coastlands, western arctic Canada, 806 Can. J. Earth Sci., 31, 737–747, doi:10.1139/e94-067, 1994. 807
Murton, J. B., Edwards, M. E., Lozhkin, A. V, Anderson, P. M., Savvinov, G. N., Bakulina, N., Bondarenko, 808 O. V, Cherepanova, M. V, Danilov, P. P., Boeskorov, V., Goslar, T., Grigoriev, S., Gubin, S. V, Korzun, J. 809 A., Lupachev, A. V, Tikhonov, A., Tsygankova, V. I., Vasilieva, G. V., and Zanina, O. G.: Preliminary 810 paleoenvironmental analysis of permafrost deposits at Batagaika megaslump, Yana Uplands, 811 northeast Siberia, Quat. Res., 87, 314–330, doi:10.1017/qua.2016.15, 2017. 812
Neff, J. C. and Hooper, D. U.: Vegetation and climate controls on potential CO2, DOC and DON 813 production in northern latitude soils, Glob. Chang. Biol., 8, 872–884, doi:10.1046/j.1365-814 2486.2002.00517.x, 2002. 815
Neff, J. C., Finlay, J. C., Zimov, S. A., Davydov, S. P., Carrasco, J. J., Schuur, E. A. G., and Davydova, A. I.: 816 Seasonal changes in the age and structure of dissolved organic carbon in Siberian rivers and streams, 817 Geophys. Res. Lett., 33, 1–5, doi:10.1029/2006GL028222, 2006. 818
Norris, D. K.: Geology of the northern Yukon and northwestern District of Mackenzie. Geological Survey 819 of Canada, Map 1581A, scale 1:500 000, 1984. 820
O’Donnell, J. A., Aiken, G. R., Kane, E. S., and Jones, J. B.: Source water controls on the character and 821 origin of dissolved organic matter in streams of the Yukon River basin, Alaska, J. Geophys. Res. 822 Biogeosciences, 115, 1–12, doi:10.1029/2009JG001153, 2010. 823
Olefeldt, D., Goswami, S., Grosse, G., Hayes, D., Hugelius, G., Kuhry, P., McGuire, A. D., Romanovsky, V. 824 E., Sannel, A. B. K., Schuur, E. A. G., and Turetsky, M. R.: Circumpolar distribution and carbon storage 825 of thermokarst landscapes, 7, 13043, 2016. 826
Palstra, S. and Meijer, H.: Biogenic carbon fraction of biogas and natural gas fuel mixtures determined 827 with 14C, Radiocarbon, 56, 7–28, doi:10.2458/56.16514, 2014. 828
Pinheiro, J., Bates, D., DebRoy, S., Sarkar, D., and R Core Team: nlme: Linear and nonlinear mixed effects 829 models. R package version 3.1-120, http://CRAN.R-project.org/package=nlme>., 2015. 830
Poulin, B. A., Ryan, J. N., and Aiken, G. R.: Effects of iron on optical properties of dissolved organic 831 matter, Environ. Sci. Technol., 48, 10098–10106, doi:10.1021/es502670r, 2014. 832
33
Prokushkin, A. S., Kajimoto, T., Prokushkin, S. G., McDowell, W. H., Abaimov, A. P., and Matsuura, Y.: 833 Climatic factors influencing fluxes of dissolved organic carbon from the forest floor in a continuous-834 permafrost Siberian watershed, Can. J. For. Res., 35, 2130–2140, doi:10.1139/x05-150, 2005. 835
Pumpanen, J., A, L., Heli, M., Kolari, P., Ilvesniemi, H., Mammarella, I., Hari, O., Nikinmaa, E., Heinonsalo, 836 J., Back, J., Ojala, A., Berninger, F., and Vesala, T.: Precipitation and net ecosystem exchange are the 837 most important drivers of DOC flux in upland boreal catchments, J. Geophys. Res. Biogeosciences, 838 119, 1861–1878, doi:10.1002/2014JG002705, 2014. 839
Qualls, R. and Haines, B. L.: Measuring adsorption isotherms using continuous, unsaturated flow through 840 intact soil cores, Soil Sci. Soc. Am. J., 56, 456–460, doi:10.2136/sssaj1992.03615995005600020019x, 841 1992. 842
R Core Team: R: A Language and Environment for Statistical Computing, R Foundation for Statistical 843 Computing, Vienna, Austria. http://www.r-project.org/., 2015. 844
Rampton, V. N.: Quaternary geology of the Tuktoyaktuk coastlands, Northwest Territories, Geol. Surv. 845 Canada, 1988. 846
Romanovsky, V. E., Smith, S. L., and Christiansen, H. H.: Permafrost thermal state in the polar Northern 847 Hemisphere during the international polar year 2007–2009: a synthesis, Permafrost Periglacial 848 Process., 21, 106-116, doi: 10.1002/ppp.689, 2010. 849
Schuur, E., Bockheim, J., Canadell, J. G., Euskirchen, E., Field, C. B., Goryachkin, S. V, Hagemann, S., 850 Kuhry, P., Lafleur, P. M., Lee, H., Nelson, M. F. E., Rinke, A., Romanovsky, V. E., Shiklomanov, N., 851 Tarnocai, C., Venevsky, S., Vogel, J. G., and Zimov, S. A.: Vulnerability of permafrost carbon to 852 climate change : Implications for the global carbon cycle, Bioscience, 58, 701–714, 853 doi:10.1641/B580807, 2008. 854
Schuur, E. A. G., Abbott, B. W., Bowden, W. B., Brovkin, V., Camill, P., Canadell, J. G., Chanton, J. P., 855 Chapin, F. S., Christensen, T. R., Ciais, P., Crosby, B. T., Czimczik, C. I., Grosse, G., Harden, J., Hayes, D. 856 J., Hugelius, G., Jastrow, J. D., Jones, J. B., Kleinen, T., Koven, C. D., Krinner, G., Kuhry, P., Lawrence, 857 D. M., McGuire, A. D., Natali, S. M., O’Donnell, J. A., Ping, C. L., Riley, W. J., Rinke, A., Romanovsky, V. 858 E., Sannel, A. B. K., Schädel, C., Schaefer, K., Sky, J., Subin, Z. M., Tarnocai, C., Turetsky, M. R., 859 Waldrop, M. P., Walter Anthony, K. M., Wickland, K. P., Wilson, C. J., and Zimov, S. A.: Expert 860 assessment of vulnerability of permafrost carbon to climate change, Clim. Change, 119, 359–374, 861 doi:10.1007/s10584-013-0730-7, 2013. 862
Schuur, E. A. G., McGuire, A. D., Grosse, G., Harden, J. W., Hayes, D. J., Hugelius, G., Koven, C. D., and 863 Kuhry, P.: Climate change and the permafrost carbon feedback, Nature, 520, 171–179, 864 doi:10.1038/nature14338, 2015. 865
Segal, R. A., Lantz, T. C., and Kokelj, S. V: Acceleration of thaw slump activity in glaciated landscapes of 866 the Western Canadian Arctic, Environ. Res. Lett., 11, 34025, doi:10.1088/1748-9326/11/3/034025, 867 2016. 868
Spencer, R. G. M., Mann, P. J., Dittmar, T., Eglinton, T. I., Mcintyre, C., Holmes, R. M., Zimov, N., and 869 Stubbins, A.: Detecting the signature of permafrost thaw in Arctic rivers, Geophys. Res. Lett., 42, 870 doi:10.1002/2015GL063498, doi:10.1002/2015GL063498, 2015. 871

34
Street, L. E., Dean, J. F., Billett, M. F., Baxter, R., Dinsmore, K. J., Lessels, J. S., Subke, J.-A., Tetzlaff, D., 872 and Wookey, P. A.: Redox dynamics in the active layer of an Arctic headwater catchment; examining 873 the potential for transfer of dissolved methane from soils to stream water, J. Geophys. Res. 874 Biogeosci., 121, 2776-2792, doi: 10.1002/2016JG003387, 2016. 875
Striegl, R. G., Aiken, G. R., Dornblaser, M. M., Raymond, P. A., and Wickland, K. P.: A decrease in 876 discharge-normalized DOC export by the Yukon River during summer through autumn, Geophys. 877 Res. Lett., 32, 1–4, doi:10.1029/2005GL024413, 2005. 878
Tank, S. E., Raymond, P. A., Striegl, R. G., McClelland, J. W., Holmes, R. M., Fiske, G. J., and Peterson, B. 879 J.: A land-to-ocean perspective on the magnitude, source and implication of DIC flux from major 880 Arctic rivers to the Arctic Ocean, Global Biogeochem. Cycles, 26, GB4018, 881 doi:10.1029/2011GB004192, 2012a. 882
Tank, S. E., Manizza, M., Holmes, R. M., McClelland, J. W., and Peterson, B. J.: The processing and impact 883 of dissolved riverine nitrogen in the Arctic Ocean, Estuaries and Coasts, 35, 401–415, 884 doi:10.1007/s12237-011-9417-3, 2012b. 885
Tanski, G., Couture, N., Lantuit, H., Eulenburg, A., and Fritz, M.: Eroding permafrost coasts release low 886 amounts of dissolved organic carbon (DOC) from ground ice into the nearshore zone of the Arctic 887 Ocean, Glob. Biogeochem. Cycles, 30, 1054–1068, doi:10.1002/2015GB005337, 2016. 888
Tanski, G., Lantuit, H., Ruttor, S., Knoblauch, C., Radosavljevic, B., Strauss, J., Wolter, J., Irrgang, A. M., 889 Ramage, J., and Fritz, M.: Transformation of terrestrial organic matter along thermokarst-affected 890 permafrost coasts in the Arctic. Sci. Total Environ. 581–582, 434-447, doi: 891 10.1016/j.scitotenv.2016.12.152, 2017. 892
Thompson, M. S., Prowse, T. D., Kokelj, S. V., and Wrona, F. J.: The impact of sediments derived from 893 thawing permafrost on tundra lake water chemistry: An experimental approach, Proc. Ninth Int. 894 Conf. Permafr., 29, 1763–1768, 2008. 895
Vonk, J. E. and Gustafsson, Ö.: Permafrost-carbon complexities, Nat. Geosci., 6, 675–676, 896 doi:10.1038/ngeo1937, 2013. 897
Vonk, J. E., Mann, P. J., Dowdy, K. L., Davydova, A., Davydov, S. P., Zimov, N., Spencer, R. G. M., Bulygina, 898 E. B., Eglinton, T. I., and Holmes, R. M.: Dissolved organic carbon loss from Yedoma permafrost 899 amplified by ice wedge thaw, Environ. Res. Lett., 8, 35023, doi:10.1088/1748-9326/8/3/035023, 900 2013a. 901
Vonk, J. E., Mann, P. J., Davydov, S., Davydova, A., Spencer, R. G. M., Schade, J., Sobczak, W. V., Zimov, 902 N., Zimov, S., Bulygina, E., Eglinton, T. I., and Holmes, R. M.: High biolability of ancient permafrost 903 carbon upon thaw, Geophys. Res. Lett., 40, 2689–2693, doi:10.1002/grl.50348, 2013b. 904
Vonk, J. E., Tank, S. E., Mann, P. J., Spencer, R. G. M., Treat, C. C., Striegl, R. G., Abbott, B. W., and 905 Wickland, K. P.: Biodegradability of dissolved organic carbon in permafrost soils and waterways: a 906 meta-analysis, Biogeosciences, 12, 6915–6930, doi:10.5194/bgd-12-8353-2015, 2015a. 907
Vonk, J. E., Tank, S. E., Bowden, W. B., Laurion, I., Vincent, W. F., Alekseychik, P., Amyot, M., Billet, M. F., 908 Canário, J., Cory, R. M., Deshpande, B. N., Helbig, M., Jammet, M., Karlsson, J., Larouche, J., 909 Macmillan, G., Rautio, M., Walter Anthony, K. M., and Wickland, K. P.: Reviews and syntheses: 910

35
Effects of permafrost thaw on Arctic aquatic ecosystems, Biogeosciences, 12, 7129–7167, 911 doi:10.5194/bg-12-7129-2015, 2015b. 912
Ward, R. C. and Robinson, M.: Principles of Hydrology, Fourth Edition, McGraw-Hill International (UK) 913 Limited., 2000. 914
Watanabe, S., Laurion, I., Chokmani, K., Pienitz, R., and Vincent, W. F.: Optical diversity of thaw ponds in 915 discontinuous permafrost: A model system for water color analysis, J. Geophys. Res. Biogeosciences, 916 116, doi:10.1029/2010JG001380, 2011. 917
Weishaar, J. and Aiken, G.: Evaluation of specific ultra-violet absorbance as an indicator of the chemical 918 content of dissolved organic carbon, Environ. Chem., 37, 4702–4708, doi:10.1021/es030360x, 2003. 919
Woods, G. C., Simpson, M. J., Pautler, B. G., Lamoureux, S. F., Lafrenière, M. J., and Simpson, A. J.: 920 Evidence for the enhanced lability of dissolved organic matter following permafrost slope 921 disturbance in the Canadian High Arctic, Geochim. Cosmochim. Acta, 75, 7226–7241, 922 doi:10.1016/j.gca.2011.08.013, 2011. 923
Yanagihara, Y., Koike, T., Matsuura, Y., Mori, S., Shibata, H., Satoh, F., Masuyagina, O., Zyryanova, O., 924 Prokushkin, A. S., Prokushkin, S. G., and Abaimov, A. P.: Soil respiration on the contrasting north- 925 and south-facing slopes of a larch forests in Central Siberia, Eurasian J. For. Res., 1, 19–29, 2000. 926
Zeileis, A. and Grothendieck, G.: zoo: S3 infrastructure for regular and irregular time series, J. Stat. 927 Softw., 14, 1–27, 2005. 928
Zeileis, A. and Hothorn, T.: Diagnostic checking in regression relationships., R News, 2, 7–10, 2002. 929
Zhou, Y., Guo, H., Lu, H., Mao, R., Zheng, H., and Wang, J.: Analytical methods and application of stable 930 isotopes in dissolved organic carbon and inorganic carbon in groundwater, Rapid Commun. Mass 931 Spectrom., 29, 1827–1835, doi:10.1002/rcm.7280, 2015. 932
Zuur, A. F., Ieno, E. N., Walker, N., Saveliev, A. A., and Smith, G. M.: Mixed Effects Models and Extensions 933 in Ecology with R, Springer, New York., 2009. 934
935
936
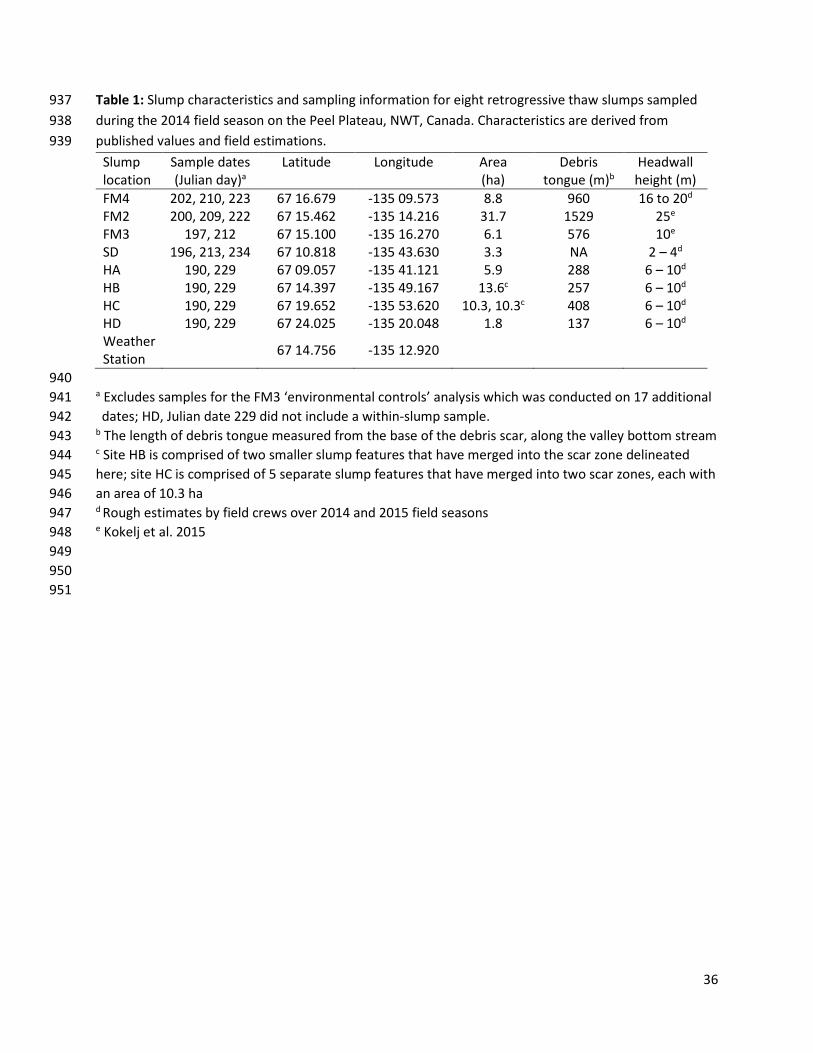
36
Table 1: Slump characteristics and sampling information for eight retrogressive thaw slumps sampled 937 during the 2014 field season on the Peel Plateau, NWT, Canada. Characteristics are derived from 938 published values and field estimations. 939
Slump location
Sample dates (Julian day)a
Latitude
Longitude
Area (ha)
Debris tongue (m)b
Headwall height (m)
FM4 202, 210, 223 67 16.679 -135 09.573 8.8 960 16 to 20d FM2 200, 209, 222 67 15.462 -135 14.216 31.7 1529 25e FM3 197, 212 67 15.100 -135 16.270 6.1 576 10e SD 196, 213, 234 67 10.818 -135 43.630 3.3 NA 2 – 4d HA 190, 229 67 09.057 -135 41.121 5.9 288 6 – 10d HB 190, 229 67 14.397 -135 49.167 13.6c 257 6 – 10d HC 190, 229 67 19.652 -135 53.620 10.3, 10.3c 408 6 – 10d HD 190, 229 67 24.025 -135 20.048 1.8 137 6 – 10d Weather Station 67 14.756 -135 12.920
940 a Excludes samples for the FM3 ‘environmental controls’ analysis which was conducted on 17 additional 941 dates; HD, Julian date 229 did not include a within-slump sample. 942
b The length of debris tongue measured from the base of the debris scar, along the valley bottom stream 943 c Site HB is comprised of two smaller slump features that have merged into the scar zone delineated 944 here; site HC is comprised of 5 separate slump features that have merged into two scar zones, each with 945 an area of 10.3 ha 946 d Rough estimates by field crews over 2014 and 2015 field seasons 947 e Kokelj et al. 2015 948 949 950 951
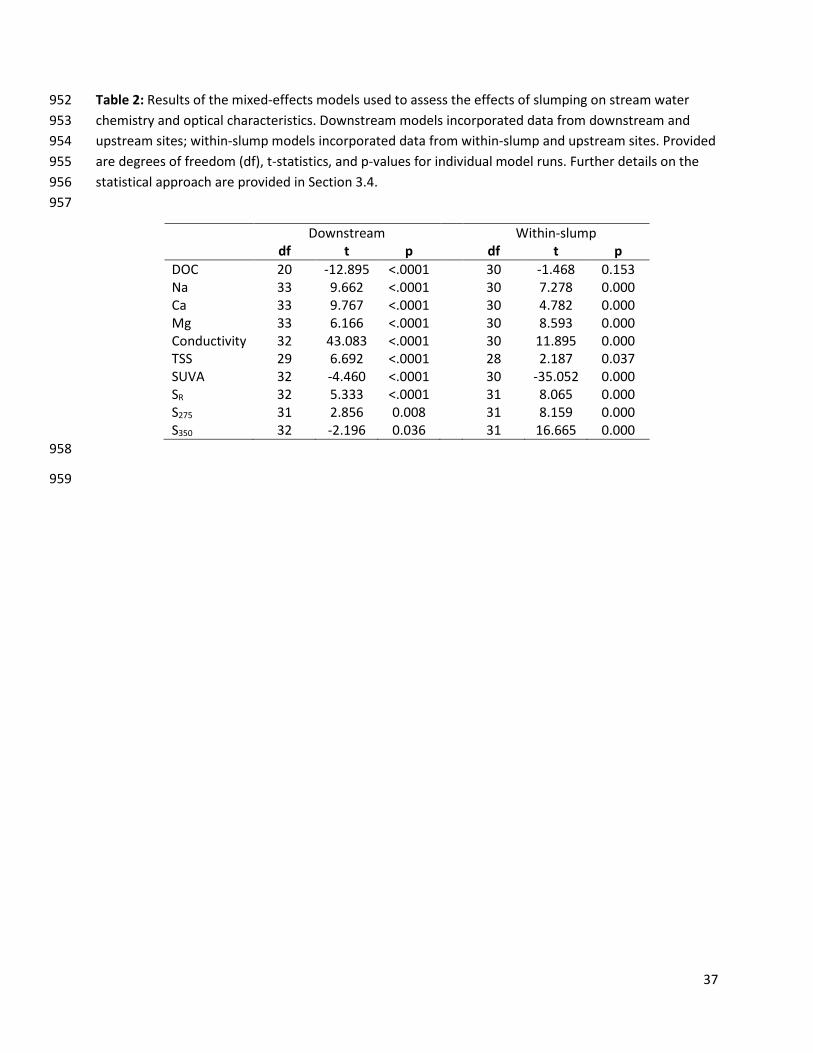
37
Table 2: Results of the mixed-effects models used to assess the effects of slumping on stream water 952 chemistry and optical characteristics. Downstream models incorporated data from downstream and 953 upstream sites; within-slump models incorporated data from within-slump and upstream sites. Provided 954 are degrees of freedom (df), t-statistics, and p-values for individual model runs. Further details on the 955 statistical approach are provided in Section 3.4. 956 957
Downstream Within-slump df t p df t p DOC 20 -12.895 <.0001 30 -1.468 0.153 Na 33 9.662 <.0001 30 7.278 0.000 Ca 33 9.767 <.0001 30 4.782 0.000 Mg 33 6.166 <.0001 30 8.593 0.000 Conductivity 32 43.083 <.0001 30 11.895 0.000 TSS 29 6.692 <.0001 28 2.187 0.037 SUVA 32 -4.460 <.0001 30 -35.052 0.000 SR 32 5.333 <.0001 31 8.065 0.000 S275 31 2.856 0.008 31 8.159 0.000 S350 32 -2.196 0.036 31 16.665 0.000
958
959

38
Table 3: Measured fraction modern carbon (F14C) and estimated calendar years before present for 14C of 960 dissolved organic carbon samples collected upstream of, and within drainage waters of, selected slump 961 sites. Data were collected during the summer of 2016. nc indicates sample not collected. Error 962 estimates indicate 1σ. 963
964
F14C 14C yr BP Site Upstream Within-slump Upstream Within-slump FM4 0.9734 ± 0.0029 nc 217 ± 24 nc FM2 0.9764 ± 0.0032 0.3030 ± 0.0024 192 ± 27 9592 ± 64 FM3 1.0023 ± 0.0030 0.3618 ± 0.0018 modern 8167 ± 39 SD 1.0216 ± 0.0035 0.8659 ± 0.0025 modern 1157 ± 23
965
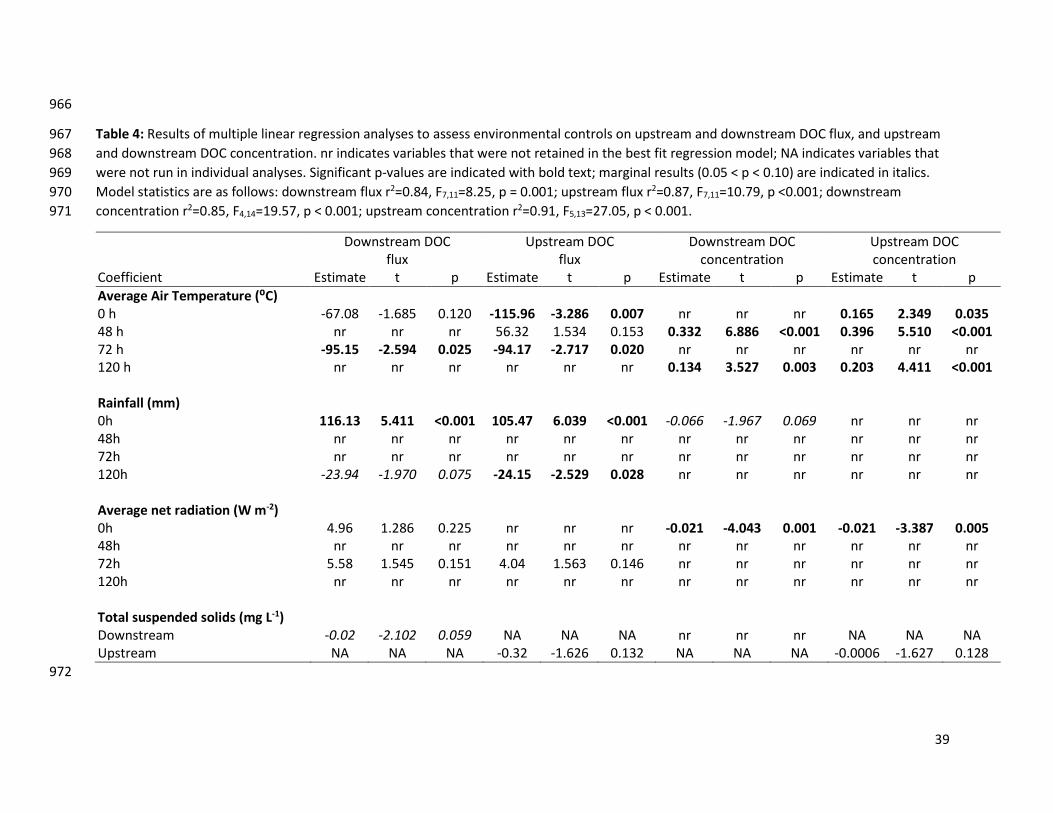
39
966
Table 4: Results of multiple linear regression analyses to assess environmental controls on upstream and downstream DOC flux, and upstream 967 and downstream DOC concentration. nr indicates variables that were not retained in the best fit regression model; NA indicates variables that 968 were not run in individual analyses. Significant p-values are indicated with bold text; marginal results (0.05 < p < 0.10) are indicated in italics. 969 Model statistics are as follows: downstream flux r2=0.84, F7,11=8.25, p = 0.001; upstream flux r2=0.87, F7,11=10.79, p <0.001; downstream 970 concentration r2=0.85, F4,14=19.57, p < 0.001; upstream concentration r2=0.91, F5,13=27.05, p < 0.001. 971
Downstream DOC flux
Upstream DOC flux
Downstream DOC concentration
Upstream DOC concentration
Coefficient Estimate t p Estimate t p Estimate t p Estimate t p Average Air Temperature (⁰C) 0 h -67.08 -1.685 0.120 -115.96 -3.286 0.007 nr nr nr 0.165 2.349 0.035 48 h nr nr nr 56.32 1.534 0.153 0.332 6.886 <0.001 0.396 5.510 <0.001 72 h -95.15 -2.594 0.025 -94.17 -2.717 0.020 nr nr nr nr nr nr 120 h nr nr nr nr nr nr 0.134 3.527 0.003 0.203 4.411 <0.001 Rainfall (mm) 0h 116.13 5.411 <0.001 105.47 6.039 <0.001 -0.066 -1.967 0.069 nr nr nr 48h nr nr nr nr nr nr nr nr nr nr nr nr 72h nr nr nr nr nr nr nr nr nr nr nr nr 120h -23.94 -1.970 0.075 -24.15 -2.529 0.028 nr nr nr nr nr nr Average net radiation (W m-2) 0h 4.96 1.286 0.225 nr nr nr -0.021 -4.043 0.001 -0.021 -3.387 0.005 48h nr nr nr nr nr nr nr nr nr nr nr nr 72h 5.58 1.545 0.151 4.04 1.563 0.146 nr nr nr nr nr nr 120h nr nr nr nr nr nr nr nr nr nr nr nr Total suspended solids (mg L-1) Downstream -0.02 -2.102 0.059 NA NA NA nr nr nr NA NA NA Upstream NA NA NA -0.32 -1.626 0.132 NA NA NA -0.0006 -1.627 0.128
972

40
Figure captions: 973
Fig. 1: Location and morphometry of thaw slumps on the Peel Plateau, Northwest Territories, Canada. 974 Panel A depicts the stream networks and location of the eight retrogressive thaw slumps studied. Panel 975 B depicts representative sampling locations at each slump site; FM3 depicted. Panels C-E depict 976 representative thaw-slump headwall stratigraphies. Panel C shows a mega-slump (FM3, the smallest 977 mega-slump, is depicted); panel D shows a moderate-sized slump (HB); panel E shows the smallest 978 slump that was sampled (SD). In panels C and D, the approximate location of the modern active layer (a), 979 early Holocene-aged relict active layer (b), and Pleistocene-aged glacigenic materials (c) is shown. Photo 980 credit: Scott Zolkos. 981
Fig. 2: The effect of retrogressive thaw slumps on stream water dissolved organic carbon (DOC) 982 concentration. Each data point represents the mean and standard error of measurements across all 983 sampling dates, as described in Table 1. The bottom two panels show the ratio of within-slump: 984 upstream, and downstream: upstream DOC concentrations within individual slumps, with points 985 indicating the mean and standard error of this ratio across sample dates. 986
Fig. 3: Box and whisker plots to illustrate the effects of retrogressive thaw slump activity on stream 987 geochemistry. Each boxplot includes data from across all slumps and sampling periods, and indicates 988 median values, 25th and 75th percentiles (box extremities), 10th and 90th percentiles (whiskers), and 989 outlier points. U=upstream sites; W=within-slump sites; D=downstream sites. 990
Fig. 4: The effect of retrogressive thaw slumps on the optical properties of stream water dissolved 991 organic matter. Each data point represents the mean and standard error of measurements across all 992 sampling dates, as described in Table 1. Shown are specific UV absorbance (SUVA254), spectral slopes 993 between 275-295 and 350-400 nm (S275-295; S350-400) and the slope ratio (SR). 994
Fig. 5: Paired oxygen isotopic (δ18O ‰) and SUVA254 (L mg C-1 m-1) data, to demonstrate the relationship 995 between source water age and dissolved organic matter composition. Reference δ18O values are from 996 Lacelle et al. (2013): the modern active layer value is derived from active layer pore water in this region, 997 icy diamicton has been souced as Holocene in origin, and the δ18O value for Pleistocene-aged ground ice 998 is the most positive value for this region. 999
Fig. 6: Environmental conditions (solar radiation, precipitation and mean daily air temperature) and DOC 1000 flux upstream and downstream of slump FM3 across a month-long sample period (July 12-August 12, 1001 2014). Corresponding multiple linear regressions are described in Table 4. 1002
Fig. 7: Within-slump fluxes of dissolved organic carbon (DOC) and TSS, compared to the calculated 1003 (downstream - upstream) fluxes for these two constituents. 1004
1005

41
1006 Fig. 1: Location and morphometry of thaw slumps on the Peel Plateau, Northwest Territories, Canada. 1007 Panel A depicts the stream networks and location of the eight retrogressive thaw slumps studied. Panel 1008 B depicts representative sampling locations at each slump site; FM3 depicted. Panels C-E depict 1009 representative thaw-slump headwall stratigraphies. Panel C shows a mega-slump (FM3, the smallest 1010 mega-slump, is depicted); panel D shows a moderate-sized slump (HB); panel E shows the smallest 1011 slump that was sampled (SD). In panels C and D, the approximate location of the modern active layer (a), 1012 early Holocene-aged relict active layer (b), and Pleistocene-aged glacigenic materials (c) is shown. Photo 1013 credit: Scott Zolkos. 1014

42
1015
1016
1017
Fig. 2: The effect of retrogressive thaw slumps on stream water dissolved organic carbon (DOC) 1018 concentration. Each data point represents the mean and standard error of measurements across all 1019 sampling dates, as described in Table 1. The bottom two panels show the ratio of within-slump: 1020 upstream, and downstream: upstream DOC concentrations within individual slumps, with points 1021 indicating the mean and standard error of this ratio across sample dates. 1022
1023

43
1024
Fig. 3: Box and whisker plots to illustrate the effects of retrogressive thaw slump activity on stream 1025 geochemistry. Each boxplot includes data from across all slumps and sampling periods, and indicates 1026 median values, 25th and 75th percentiles (box extremities), 10th and 90th percentiles (whiskers), and 1027 outlier points. U=upstream sites; W=within-slump sites; D=downstream sites. 1028
1029
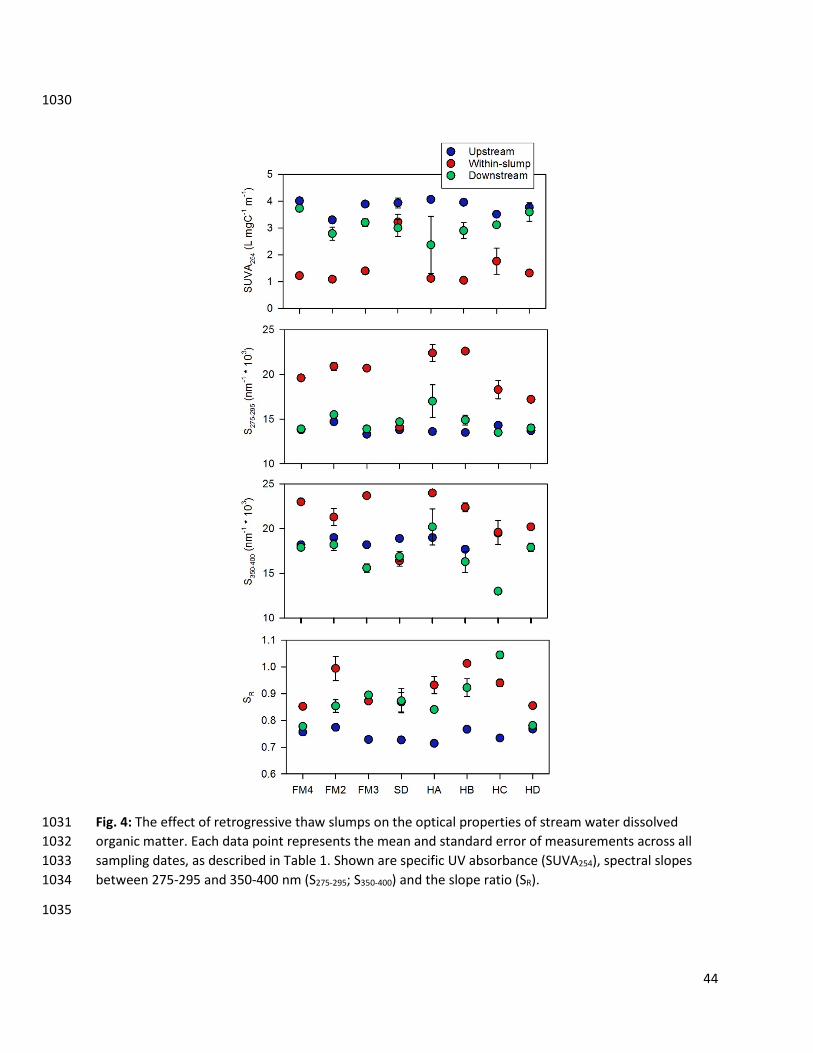
44
1030
Fig. 4: The effect of retrogressive thaw slumps on the optical properties of stream water dissolved 1031 organic matter. Each data point represents the mean and standard error of measurements across all 1032 sampling dates, as described in Table 1. Shown are specific UV absorbance (SUVA254), spectral slopes 1033 between 275-295 and 350-400 nm (S275-295; S350-400) and the slope ratio (SR). 1034
1035
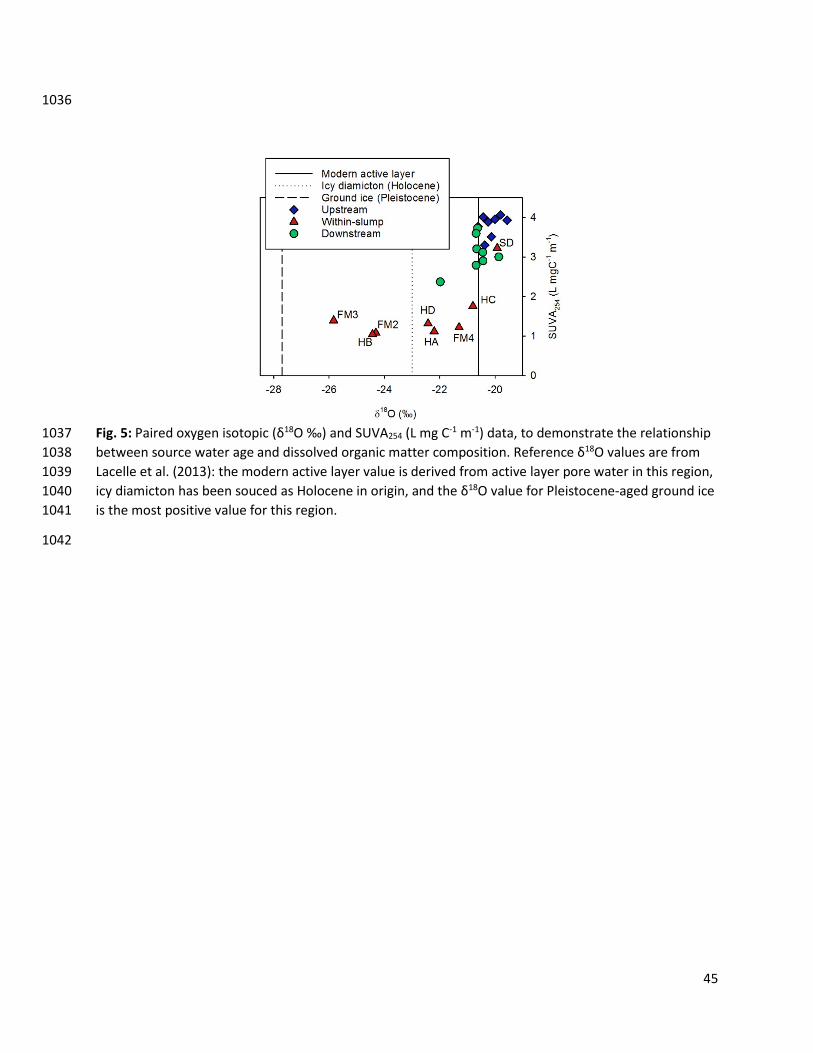
45
1036
Fig. 5: Paired oxygen isotopic (δ18O ‰) and SUVA254 (L mg C-1 m-1) data, to demonstrate the relationship 1037 between source water age and dissolved organic matter composition. Reference δ18O values are from 1038 Lacelle et al. (2013): the modern active layer value is derived from active layer pore water in this region, 1039 icy diamicton has been souced as Holocene in origin, and the δ18O value for Pleistocene-aged ground ice 1040 is the most positive value for this region. 1041
1042

46
1043
Fig. 6: Environmental conditions (solar radiation, precipitation and mean daily air temperature) and DOC 1044 flux upstream and downstream of slump FM3 across a month-long sample period (July 12-August 12, 1045 2014). Corresponding multiple linear regressions are described in Table 4. 1046
1047
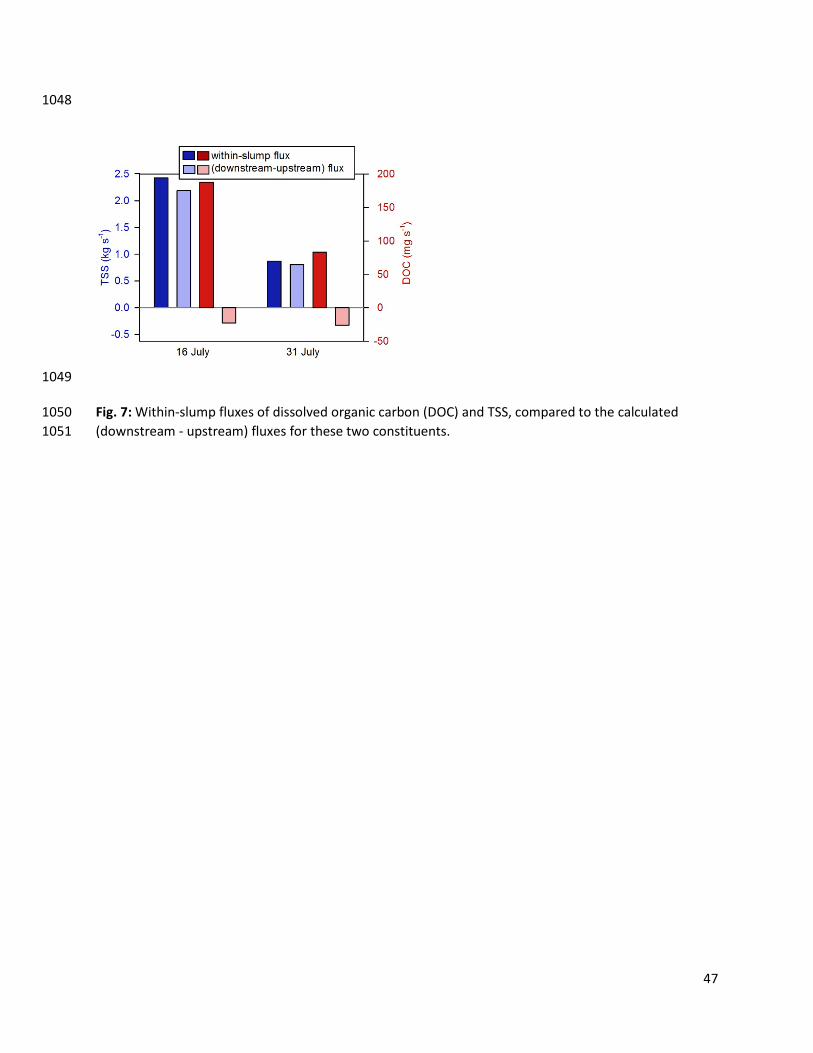
47
1048
1049
Fig. 7: Within-slump fluxes of dissolved organic carbon (DOC) and TSS, compared to the calculated 1050 (downstream - upstream) fluxes for these two constituents. 1051
Copyright © 2022 FDOKUMEN