Diagnostic Simplexes for Dissolved-Gas Analysis - MDPI
16
energies Article Diagnostic Simplexes for Dissolved-Gas Analysis James Dukarm 1, * , Zachary Draper 1 and Tomasz Piotrowski 2 1 Delta-X Research Inc., Victoria, BC V8R6T4, Canada; [email protected] 2 Institute of Electrical Power Engineering, Lodz University of Technology, 90-924 Lodz, Poland; [email protected] * Correspondence: [email protected] Received: 26 October 2020; Accepted: 3 December 2020; Published: 7 December 2020 Abstract: A Duval triangle is a diagram used for fault type identification in dissolved-gas analysis of oil-filled high-voltage transformers and other electrical apparatus. The proportional concentrations of three fault gases (such as methane, ethylene, and acetylene) are used as coordinates to plot a point in an equilateral triangle and identify the fault zone in which it is located. Each point in the triangle corresponds to a unique combination of gas proportions. Diagnostic pentagons published by Duval and others seek to emulate the triangles while incorporating five fault gases instead of three. Unfortunately the mapping of five gas proportions to a point inside a two-dimensional pentagon is many-to-one; consequently, dissimilar combinations of gas proportions are mapped to the same point in the pentagon, resulting in mis-diagnosis. One solution is to replace the pentagon with a four-dimensional simplex, a direct generalization of the Duval triangle. In a comparison using cases confirmed by inspection, the simplex outperformed three ratio methods, Duval triangle 1, and two pentagons. Keywords: Duval triangle; Duval pentagon; Mansour pentagon; barycentric; simplex; fault type 1. Introduction The classic Duval triangle [1], shown in Figure 1, uses concentrations (absolute or incremental) of methane, ethylene, and acetylene dissolved in the insulating oil of a transformer to locate a point in the interior of an equilateral triangle that has been subdivided into fault zones corresponding to the six basic International Electrotechnical Commission (IEC) fault types (see Table 1) plus a mixture DT of electrical discharge and thermal. The fault zone in which the point lies indicates the generic fault type that is most likely to produce those three fault gases in the proportions given. The triangle was considered more effective than the major gas ratio diagnostic methods of Rogers and Doernenburg (described in [2,3]), as the methods comparison in Section 9 below confirms. Although the original Duval triangle (now called Triangle 1) is very effective, it has been supplemented with two more Duval triangles–one (Triangle 4) based on hydrogen, methane, and ethane, and the other (Triangle 5) based on methane, ethane, and ethylene–to produce more refined fault type identification using hydrogen and all four of the low molecular weight hydrocarbon gases, generated from transformer oil by high temperatures and electrical discharges, that are commonly used for dissolved-gas analysis (DGA) [4]. All Duval triangles require that the relevant three gas concentrations be reduced to three gas proportions (each gas concentration represented as a fraction of the total). Those gas proportions are then used as barycentric coordinates to locate a point inside the triangle or on an edge. The details of that are explained in the Triangle Coordinates section, and it is also explained why each point represents exactly one set of gas proportions. Recently Duval published two diagnostic pentagons [5] based on hydrogen, methane, ethane, ethylene and acetylene. Duval pentagon 1, covering the six basic IEC fault types plus sub-type S, Energies 2020, 13, 6459; doi:10.3390/en13236459 www.mdpi.com/journal/energies
-
Upload
khangminh22 -
Category
Documents
-
view
0 -
download
0
Transcript of Diagnostic Simplexes for Dissolved-Gas Analysis - MDPI

energies
Article
Diagnostic Simplexes for Dissolved-Gas Analysis
James Dukarm 1,* , Zachary Draper 1 and Tomasz Piotrowski 2
1 Delta-X Research Inc., Victoria, BC V8R6T4, Canada; [email protected] Institute of Electrical Power Engineering, Lodz University of Technology, 90-924 Lodz, Poland;
[email protected]* Correspondence: [email protected]
Received: 26 October 2020; Accepted: 3 December 2020; Published: 7 December 2020�����������������
Abstract: A Duval triangle is a diagram used for fault type identification in dissolved-gas analysis ofoil-filled high-voltage transformers and other electrical apparatus. The proportional concentrationsof three fault gases (such as methane, ethylene, and acetylene) are used as coordinates to plot apoint in an equilateral triangle and identify the fault zone in which it is located. Each point in thetriangle corresponds to a unique combination of gas proportions. Diagnostic pentagons published byDuval and others seek to emulate the triangles while incorporating five fault gases instead of three.Unfortunately the mapping of five gas proportions to a point inside a two-dimensional pentagonis many-to-one; consequently, dissimilar combinations of gas proportions are mapped to the samepoint in the pentagon, resulting in mis-diagnosis. One solution is to replace the pentagon witha four-dimensional simplex, a direct generalization of the Duval triangle. In a comparison usingcases confirmed by inspection, the simplex outperformed three ratio methods, Duval triangle 1,and two pentagons.
Keywords: Duval triangle; Duval pentagon; Mansour pentagon; barycentric; simplex; fault type
1. Introduction
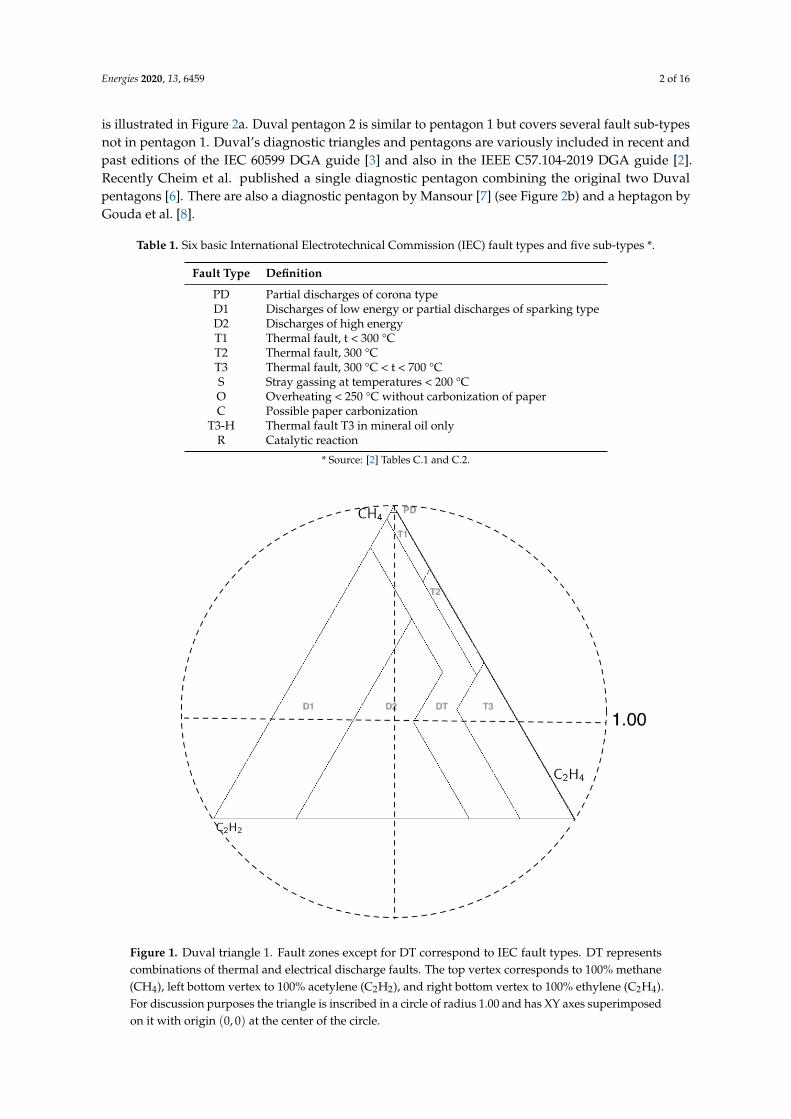
The classic Duval triangle [1], shown in Figure 1, uses concentrations (absolute or incremental) ofmethane, ethylene, and acetylene dissolved in the insulating oil of a transformer to locate a point inthe interior of an equilateral triangle that has been subdivided into fault zones corresponding to thesix basic International Electrotechnical Commission (IEC) fault types (see Table 1) plus a mixture DTof electrical discharge and thermal. The fault zone in which the point lies indicates the generic faulttype that is most likely to produce those three fault gases in the proportions given. The triangle wasconsidered more effective than the major gas ratio diagnostic methods of Rogers and Doernenburg(described in [2,3]), as the methods comparison in Section 9 below confirms.
Although the original Duval triangle (now called Triangle 1) is very effective, it has beensupplemented with two more Duval triangles–one (Triangle 4) based on hydrogen, methane,and ethane, and the other (Triangle 5) based on methane, ethane, and ethylene–to produce more refinedfault type identification using hydrogen and all four of the low molecular weight hydrocarbon gases,generated from transformer oil by high temperatures and electrical discharges, that are commonlyused for dissolved-gas analysis (DGA) [4].
All Duval triangles require that the relevant three gas concentrations be reduced to three gasproportions (each gas concentration represented as a fraction of the total). Those gas proportions arethen used as barycentric coordinates to locate a point inside the triangle or on an edge. The detailsof that are explained in the Triangle Coordinates section, and it is also explained why each pointrepresents exactly one set of gas proportions.
Recently Duval published two diagnostic pentagons [5] based on hydrogen, methane, ethane,ethylene and acetylene. Duval pentagon 1, covering the six basic IEC fault types plus sub-type S,
Energies 2020, 13, 6459; doi:10.3390/en13236459 www.mdpi.com/journal/energies
Energies 2020, 13, 6459 2 of 16
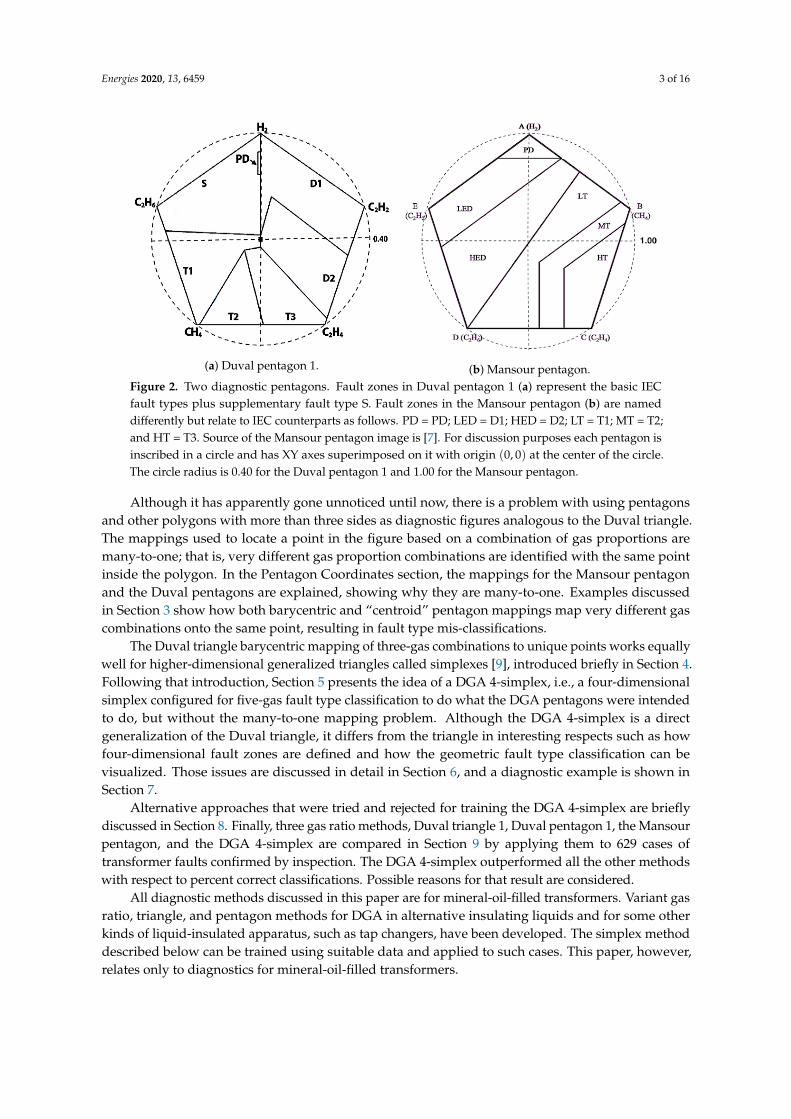
is illustrated in Figure 2a. Duval pentagon 2 is similar to pentagon 1 but covers several fault sub-typesnot in pentagon 1. Duval’s diagnostic triangles and pentagons are variously included in recent andpast editions of the IEC 60599 DGA guide [3] and also in the IEEE C57.104-2019 DGA guide [2].Recently Cheim et al. published a single diagnostic pentagon combining the original two Duvalpentagons [6]. There are also a diagnostic pentagon by Mansour [7] (see Figure 2b) and a heptagon byGouda et al. [8].
Table 1. Six basic International Electrotechnical Commission (IEC) fault types and five sub-types *.
Fault Type Definition
PD Partial discharges of corona typeD1 Discharges of low energy or partial discharges of sparking typeD2 Discharges of high energyT1 Thermal fault, t < 300 °CT2 Thermal fault, 300 °CT3 Thermal fault, 300 °C < t < 700 °CS Stray gassing at temperatures < 200 °CO Overheating < 250 °C without carbonization of paperC Possible paper carbonization
T3-H Thermal fault T3 in mineral oil onlyR Catalytic reaction
* Source: [2] Tables C.1 and C.2.
Figure 1. Duval triangle 1. Fault zones except for DT correspond to IEC fault types. DT representscombinations of thermal and electrical discharge faults. The top vertex corresponds to 100% methane(CH4), left bottom vertex to 100% acetylene (C2H2), and right bottom vertex to 100% ethylene (C2H4).For discussion purposes the triangle is inscribed in a circle of radius 1.00 and has XY axes superimposedon it with origin (0, 0) at the center of the circle.
Energies 2020, 13, 6459 3 of 16
(a) Duval pentagon 1. (b) Mansour pentagon.Figure 2. Two diagnostic pentagons. Fault zones in Duval pentagon 1 (a) represent the basic IECfault types plus supplementary fault type S. Fault zones in the Mansour pentagon (b) are nameddifferently but relate to IEC counterparts as follows. PD = PD; LED = D1; HED = D2; LT = T1; MT = T2;and HT = T3. Source of the Mansour pentagon image is [7]. For discussion purposes each pentagon isinscribed in a circle and has XY axes superimposed on it with origin (0, 0) at the center of the circle.The circle radius is 0.40 for the Duval pentagon 1 and 1.00 for the Mansour pentagon.
Although it has apparently gone unnoticed until now, there is a problem with using pentagonsand other polygons with more than three sides as diagnostic figures analogous to the Duval triangle.The mappings used to locate a point in the figure based on a combination of gas proportions aremany-to-one; that is, very different gas proportion combinations are identified with the same pointinside the polygon. In the Pentagon Coordinates section, the mappings for the Mansour pentagonand the Duval pentagons are explained, showing why they are many-to-one. Examples discussedin Section 3 show how both barycentric and “centroid” pentagon mappings map very different gascombinations onto the same point, resulting in fault type mis-classifications.
The Duval triangle barycentric mapping of three-gas combinations to unique points works equallywell for higher-dimensional generalized triangles called simplexes [9], introduced briefly in Section 4.Following that introduction, Section 5 presents the idea of a DGA 4-simplex, i.e., a four-dimensionalsimplex configured for five-gas fault type classification to do what the DGA pentagons were intendedto do, but without the many-to-one mapping problem. Although the DGA 4-simplex is a directgeneralization of the Duval triangle, it differs from the triangle in interesting respects such as howfour-dimensional fault zones are defined and how the geometric fault type classification can bevisualized. Those issues are discussed in detail in Section 6, and a diagnostic example is shown inSection 7.
Alternative approaches that were tried and rejected for training the DGA 4-simplex are brieflydiscussed in Section 8. Finally, three gas ratio methods, Duval triangle 1, Duval pentagon 1, the Mansourpentagon, and the DGA 4-simplex are compared in Section 9 by applying them to 629 cases oftransformer faults confirmed by inspection. The DGA 4-simplex outperformed all the other methodswith respect to percent correct classifications. Possible reasons for that result are considered.
All diagnostic methods discussed in this paper are for mineral-oil-filled transformers. Variant gasratio, triangle, and pentagon methods for DGA in alternative insulating liquids and for some otherkinds of liquid-insulated apparatus, such as tap changers, have been developed. The simplex methoddescribed below can be trained using suitable data and applied to such cases. This paper, however,relates only to diagnostics for mineral-oil-filled transformers.

Energies 2020, 13, 6459 4 of 16
2. Triangle Coordinates
2.1. Barycentric and Cartesian Coordinates in the Triangle
A Duval triangle is an equilateral triangular figure subdivided into fault zones. The method ofconverting three gas concentrations into gas proportions, then using those as coordinates to locatea point inside a Duval triangle is easily explained in terms of affine plane geometry, in which theEuclidean plane E2 is regarded as an affine space [10] over itself, allowing intuitively reasonableoperations such as getting a point by adding a displacement vector to a point
P +−→PQ = Q (1)
and also getting a displacement vector from point P to point Q by subtracting the two points:
−→PQ = Q− P (2)
The three vertexes V0, V1, V2 of a triangle are affinely independent and form an affine coordinateframe in E2 because they are not collinear, i.e., the vectors
−−→V0V1 = V1 − V0 and
−−→V0V2 = V2 − V0
are linearly independent. Because of that, every point P inside or on the triangle is a unique affinecombination of the triangle vertexes, i.e., there is exactly one triplet of non-negative coefficients a0, a1, a2
such thata0 + a1 + a2 = 1 (3)
andP = a0V0 + a1V1 + a2V2. (4)
In that case, (a0, a1, a2) are called the barycentric coordinates of the point P. Every triplet ofnon-negative numbers satisfying condition (3) determines a unique point inside or on the triangle.Furthermore, the barycentric coordinates of a point do not depend on the (x, y) Cartesian coordinatesystem used to specify the locations of the triangle vertexes and the dimensions of the triangle.The vertexes of the triangle have barycentric coordinates (1, 0, 0), (0, 1, 0), and (0, 0, 1). The barycentriccoordinates (1/3, 1/3, 1/3) correspond to the centroid of the triangle.
A convenient way to relate barycentric coordinates to Cartesian (x, y) coordinates is to consideran equilateral triangle having all its vertexes on the standard unit circle with center at the originO = (0, 0) of a two-dimensional Cartesian coordinate system, as shown in Figure 1. The Cartesiancoordinates of any point Q on the standard unit circle are (cos θ, sin θ), where θ is the angle measuredcounterclockwise from the positive X-axis to the radius OQ. Vertex V0 is at the top with Cartesiancoordinates (0, 1). Vertex V1 is at bottom left, with coordinates (−
√3/2,−1/2), and V2 is at bottom
right, with coordinates (√
3/2,−1/2).In Duval triangle 1 (Figure 1), vertex V0 is associated with 100% methane, V1 with 100% acetylene,
and V2 with 100% ethylene. To locate a point P representing 10 µL/L of methane, 5 µL/L of acetylene,and 35 µL/L of ethylene, divide each gas concentration by the total
10 + 5 + 35 = 50
which gives barycentric coordinates
(10/50, 5/50, 35/50) = (0.2, 0.1, 0.7).
Energies 2020, 13, 6459 5 of 16
Then by (4) the Cartesian coordinates of P are
P = 0.2V0 + 0.1V1 + 0.7V2
= 0.2(0, 1) + 0.1(−√
3/2,−1/2) + 0.7(√
3/2,−1/2)
= (0.3√
3, 0.2− 0.4)
= (0.52,−0.20)
(5)
This point P is in the T3 fault zone.
3. Pentagon Coordinates
3.1. Mansour Pentagon
The Mansour diagnostic pentagon [7] has vertexes labeled A to E going clockwise from thetop, corresponding to the 100% proportion level for each of the gases hydrogen, methane, ethylene,ethane, acetylene in that order as shown in Figure 2b. The prescribed method for locating a pointinside the Mansour pentagon corresponding to a set of gas concentrations starts with constructingnormalized coordinates (a0, a1, a2, a3, a4) (in ABCDE order) by dividing each gas concentration by theof all the concentrations. The subsequent steps described in [7] are equivalent to using the normalizedcoordinates to calculate an affine combination of vertexes analogous to (4) and (5) to locate a point Prepresenting the gas data.
P = a0 A + a1B + a2C + a3D + a4E (6)
The analogy with the Duval triangle fails badly, however. The vertexes of a pentagon do not forman affine coordinate frame in the plane E2. That is because the four vectors
−→AB,−→AC,−→AD,−→AE cannot
be linearly independent in two dimensions. Consequently there is not a one-to-one correspondencebetween pentagon points P and normalized coordinates (a0, a1, a2, a3, a4). The following exampledemonstrates this problem.
Ten triangles can be defined in any pentagon, corresponding to the ten possible choices of threeout of five pentagon vertexes. Five of those triangles are defined by a vertex and its two immediateneighbours (example: ABE). The other five triangles are defined by a vertex and the side opposite(example: ACD). Those ten triangles overlap so that every interior point of the pentagon is locatedin at least three and up to five of those triangles. Now consider Case 1 of [7], shown as the leftmostnumerical column in Table 2. The sum of the gas concentrations in Case 1 is 414 µL/L, so the normalizedcoordinates for Case 1 in ABCDE order are (0.314, 0.338, 0.290, 0.0580, 0.000). The corresponding point,shown in Figure 3b, has Cartesian coordinates p = (0.458, 0.137) and lies within triangles ABC, ABD,BCE, and BDE.
Consider triangle ABC for example. We would like to know the barycentric coordinates of P inABC. Call those (a, b, c). Since we know the Cartesian coordinates of vertexes A, B, C, and point P,we can write down and solve the equations
aA + bB + cC = P (7)
using the fact that a + b + c = 1, i.e., c = 1 − a − b. There are really two equations–onefor the X coordinates and one for the Y coordinates–and two unknowns a, b. The solution isa = 0.372, b = 0.2444, c = 0.3836, the barycentric coordinates of point P in triangle ABC.
Now here is the crucial point. Since a + b + c = 1, and
aA + bB + cC = P, (8)
we also haveaA + bB + cC + 0D + 0E = P, (9)
Energies 2020, 13, 6459 6 of 16
which means that (a, b, c, 0, 0) are also normalized pentagon coordinates of P. They are differentfrom the ones found for Case 1, but they map to the same point P in the Mansour pentagon.Multiplying a, b, c by the gas sum 414 for Case 1 gives the example gas concentrations H2 = 154,CH4 = 101.2, and C2H4 = 158.8 shown in the ABC column of Table 2.
Table 2. Mansour pentagon coincident cases.
Vertex Gas Case 1 ABC ABD BCE BDE
A H2 130 154 55.8 0.0 0.0B CH4 140 101.2 260.0 255.2 294.5C C2H4 120 158.8 0.0 63.7 0.0D C2H6 24 0.0 98.2 0.0 63.7E C2H2 0 0.0 0.0 95.2 55.8
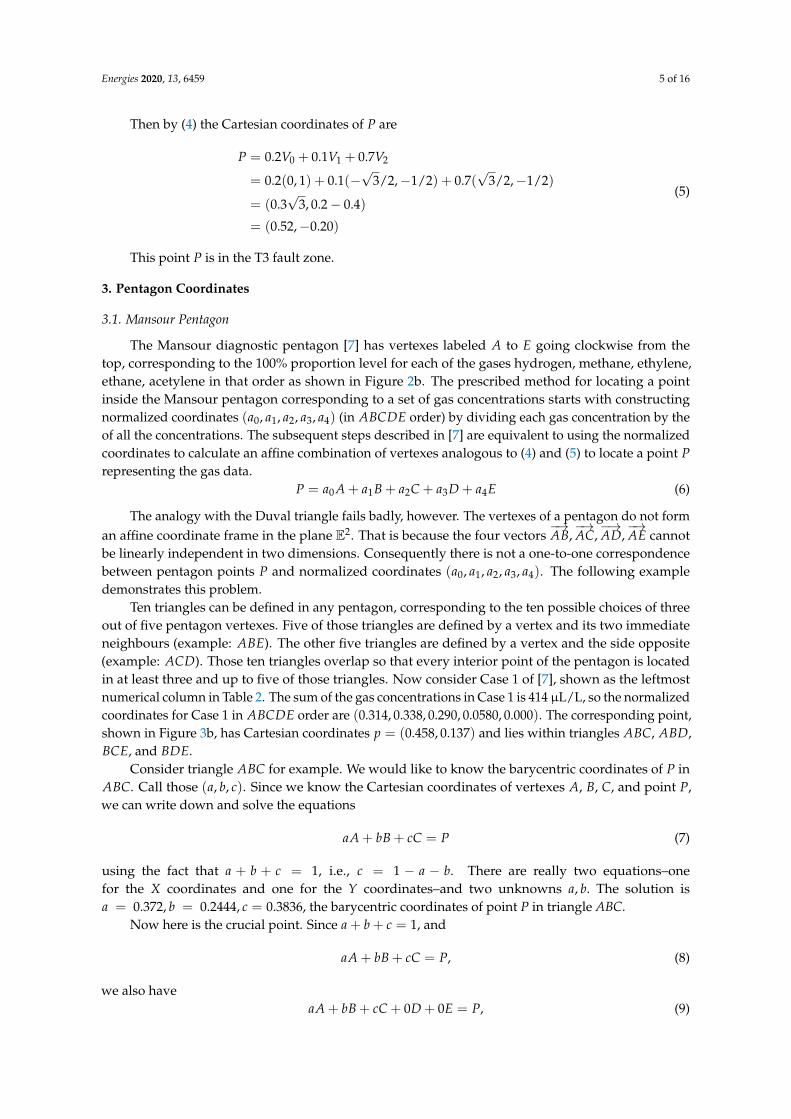
In Duval triangle 1, Case 1 corresponds to a point in T2, and the ABC example corresponds toa point in T3 (see Figure 3a). Likewise, P has barycentric coordinates (d, e, f ) in triangle ABD thatbecome normalized pentagon coordinates (d, e, 0, f , 0) in the pentagon; and so on for all the examplesshown in Table 2. Plotting in triangle 1 all the various examples that map to P in the Mansour pentagonillustrates that data corresponding to widely different fault types are not distinguished from Case 1 bythe Mansour pentagon.
(a) Duval triangle 1. (b) Mansour pentagon.Figure 3. Gas data plotted from the examples in Table 2. Case 1 falls in the T2 zone of Duval triangle 1,and the other four examples fall in PD, T3, and D1. In the Mansour pentagon, all five examples arelocated at a single point in the LT (T1) zone.
3.2. Duval Pentagon
Duval’s pentagons [5,6] do not use the affine combination of vertexes method to locate apoint with given normalized coordinates. Instead, using the counterclockwise order V0, · · · , V4
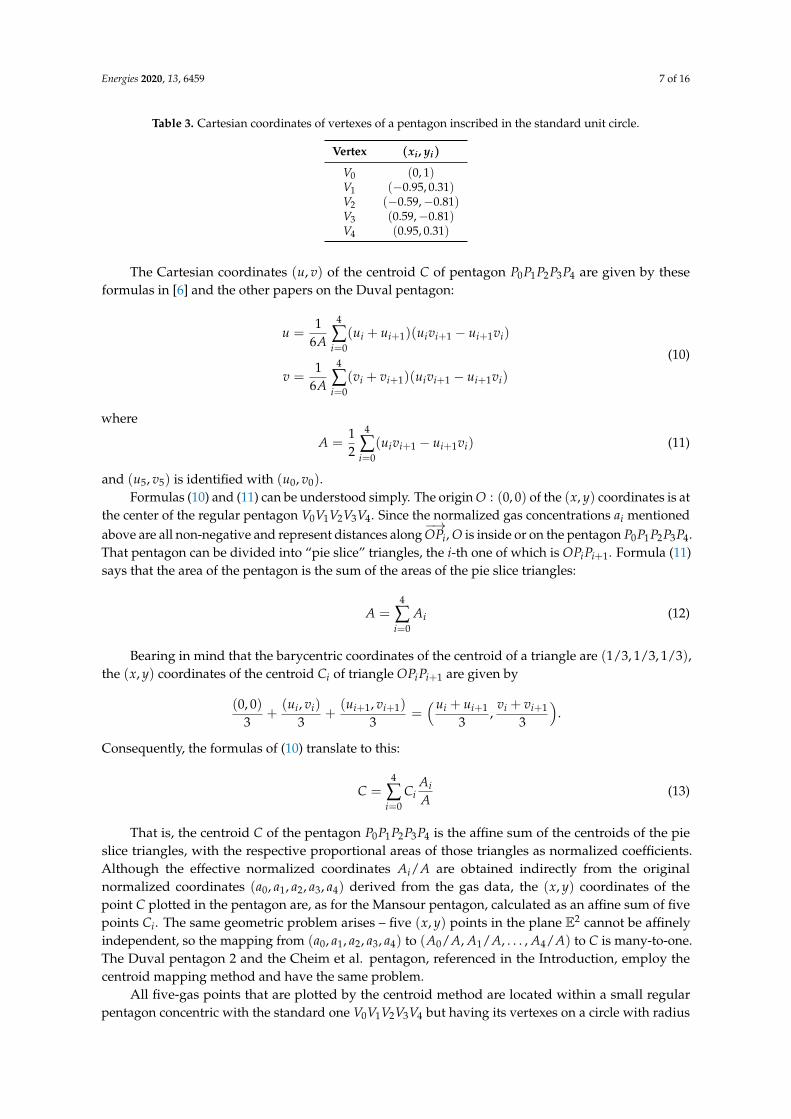
of vertexes corresponding to hydrogen, ethane, methane, ethylene, and acetylene in that order,normalized coordinates (a0, a1, a2, a3, a4) are mapped to the centroid of a pentagon with vertexesat P0 : (a0, 0, 0, 0, 0), P1 : (0, a1, 0, 0, 0), ..., P4 : (0, 0, 0, 0, a4). That pentagon in general has unequalsides and may not be convex, i.e., it may contain one or more interior angles greater than 180 degrees.Cartesian coordinates (ui, vi) for each point Pi, i = 0, . . . , 4, are calculated as Pi = aiVi using theCartesian coordinates for the vertexes given, for example, in Table 3, which are based on inscribing thepentagon in a standard unit circle, as discussed above for the Duval triangle.
Energies 2020, 13, 6459 7 of 16
Table 3. Cartesian coordinates of vertexes of a pentagon inscribed in the standard unit circle.
Vertex (xi, yi)
V0 (0, 1)V1 (−0.95, 0.31)V2 (−0.59,−0.81)V3 (0.59,−0.81)V4 (0.95, 0.31)
The Cartesian coordinates (u, v) of the centroid C of pentagon P0P1P2P3P4 are given by theseformulas in [6] and the other papers on the Duval pentagon:
u =1
6A
4
∑i=0
(ui + ui+1)(uivi+1 − ui+1vi)
v =1
6A
4
∑i=0
(vi + vi+1)(uivi+1 − ui+1vi)
(10)
where
A =12
4
∑i=0
(uivi+1 − ui+1vi) (11)
and (u5, v5) is identified with (u0, v0).Formulas (10) and (11) can be understood simply. The origin O : (0, 0) of the (x, y) coordinates is at
the center of the regular pentagon V0V1V2V3V4. Since the normalized gas concentrations ai mentionedabove are all non-negative and represent distances along
−→OPi, O is inside or on the pentagon P0P1P2P3P4.
That pentagon can be divided into “pie slice” triangles, the i-th one of which is OPiPi+1. Formula (11)says that the area of the pentagon is the sum of the areas of the pie slice triangles:
A =4
∑i=0
Ai (12)
Bearing in mind that the barycentric coordinates of the centroid of a triangle are (1/3, 1/3, 1/3),the (x, y) coordinates of the centroid Ci of triangle OPiPi+1 are given by
(0, 0)3
+(ui, vi)
3+
(ui+1, vi+1)
3=(ui + ui+1
3,
vi + vi+1
3
).
Consequently, the formulas of (10) translate to this:
C =4
∑i=0
CiAiA
(13)
That is, the centroid C of the pentagon P0P1P2P3P4 is the affine sum of the centroids of the pieslice triangles, with the respective proportional areas of those triangles as normalized coefficients.Although the effective normalized coordinates Ai/A are obtained indirectly from the originalnormalized coordinates (a0, a1, a2, a3, a4) derived from the gas data, the (x, y) coordinates of thepoint C plotted in the pentagon are, as for the Mansour pentagon, calculated as an affine sum of fivepoints Ci. The same geometric problem arises – five (x, y) points in the plane E2 cannot be affinelyindependent, so the mapping from (a0, a1, a2, a3, a4) to (A0/A, A1/A, . . . , A4/A) to C is many-to-one.The Duval pentagon 2 and the Cheim et al. pentagon, referenced in the Introduction, employ thecentroid mapping method and have the same problem.
All five-gas points that are plotted by the centroid method are located within a small regularpentagon concentric with the standard one V0V1V2V3V4 but having its vertexes on a circle with radius

Energies 2020, 13, 6459 8 of 16
1/3. According to [5], the Duval pentagon with fault zones plotted in it, as in Figure 2a, correspondsto a pentagon inscribed in a circle with radius 2/5, large enough to contain all the mapped points.That is why the radius of the circle circumscribed around the Duval pentagon 1 in Figure 2a is 0.40instead of 1.00.
Table 4 provides an example of the “centroid” mapping of two gas patterns to the same point in aDuval pentagon. Case 1 from [7] and Table 2 is compared with another example, which unlike Case 1contains a significant amount of acetylene. Although Case 1 maps into the T2 zone of Duval triangle 1and the “Other” case maps into D2, both cases correspond to the same centroid point with Cartesiancoordinates (−0.0215,−0.120) in the T3 zone of Duval pentagon 1, as shown in Figure 4.
(a) Duval triangle 1. (b) Duval pentagon 1.Figure 4. Gas data plotted from the examples in Table 4. Case 1 and Other fall in fault zones T2 and D2,respectively, in Duval triangle 1. In Duval pentagon 1, both cases plot as the same point in the T3 zone.
Table 4. Different gas patterns mapped to the same centroid point in a Duval pentagon.
Vertex Gas Case 1 Other
V0 H2 130 79.1V1 C2H6 24 26.1V2 CH4 140 261.2V3 C2H4 120 125.8V4 C2H2 0 75
The reason that this geometric flaw in DGA pentagons has not been noticed up to now is thatthe pentagons appear to perform well on average, so evidently the many-to-one mapping problem isnot as fatal as it might seem from the examples in Tables 2 and 4, although those examples may castdoubt on the accuracy of pentagon diagnoses in individual cases. One may suspect that occasionalgeometrically caused mis-classifications might cause the pentagons to perform less well on averagethan a hypothetical geometric figure for which (as for the triangle) affine barycentric coordinates canbe mapped one-to-one to interior points. That is, perhaps a better-performing five-gas diagnosticfigure could be a four-dimensional generalized triangle, i.e., a 4-simplex.
4. Simplexes
A simplex is a generalized triangle, except that a simplex contains both its boundary and its interiorpoints, whereas strictly speaking a triangle contains only its edges. For example, a two-dimensional(flat) simplex is a triangle with its interior points. A three-dimensional simplex is a tetrahedron withits interior points. Higher-dimensional simplexes are hard to imagine, but the two-dimensional facesof all of them are triangular.
Energies 2020, 13, 6459 9 of 16
The equilateral triangular figure discussed in the Triangle Coordinates section is otherwise knownas the standard two-dimensional simplex ∆2. The standard n-dimensional simplex ∆n is definedmathematically as the set of all (n + 1)-tuples (a0, . . . , an) of non-negative real numbers such that:
n
∑i=0
ai = 1 (14)
Those (n + 1)-tuples are called “points.” The individual numbers ai in the tuple are called thebarycentric coordinates of the point. Barycentric coordinates are unique for simplexes of all dimensions,i.e., different sets of barycentric coordinates represent different points. This fact is crucial for the use ofa 4-simplex as a four-dimensional 5-gas DGA classifier that does not have the pentagon’s many-to-onemapping problem. The application of the 4-simplex to DGA will be discussed in the next section.
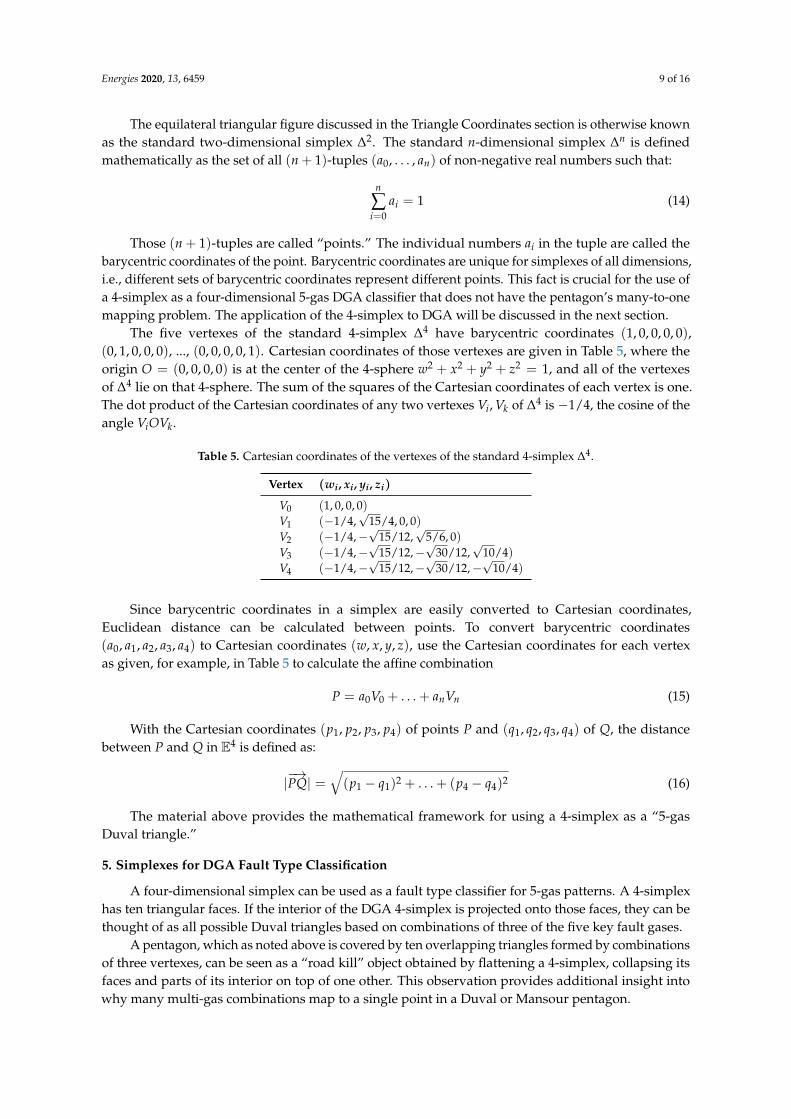
The five vertexes of the standard 4-simplex ∆4 have barycentric coordinates (1, 0, 0, 0, 0),(0, 1, 0, 0, 0), ..., (0, 0, 0, 0, 1). Cartesian coordinates of those vertexes are given in Table 5, where theorigin O = (0, 0, 0, 0) is at the center of the 4-sphere w2 + x2 + y2 + z2 = 1, and all of the vertexesof ∆4 lie on that 4-sphere. The sum of the squares of the Cartesian coordinates of each vertex is one.The dot product of the Cartesian coordinates of any two vertexes Vi, Vk of ∆4 is −1/4, the cosine of theangle ViOVk.
Table 5. Cartesian coordinates of the vertexes of the standard 4-simplex ∆4.
Vertex (wi, xi, yi, zi)
V0 (1, 0, 0, 0)V1 (−1/4,
√15/4, 0, 0)
V2 (−1/4,−√
15/12,√
5/6, 0)V3 (−1/4,−
√15/12,−
√30/12,
√10/4)
V4 (−1/4,−√
15/12,−√
30/12,−√
10/4)
Since barycentric coordinates in a simplex are easily converted to Cartesian coordinates,Euclidean distance can be calculated between points. To convert barycentric coordinates(a0, a1, a2, a3, a4) to Cartesian coordinates (w, x, y, z), use the Cartesian coordinates for each vertexas given, for example, in Table 5 to calculate the affine combination
P = a0V0 + . . . + anVn (15)
With the Cartesian coordinates (p1, p2, p3, p4) of points P and (q1, q2, q3, q4) of Q, the distancebetween P and Q in E4 is defined as:
|−→PQ| =√(p1 − q1)2 + . . . + (p4 − q4)2 (16)
The material above provides the mathematical framework for using a 4-simplex as a “5-gasDuval triangle.”
5. Simplexes for DGA Fault Type Classification
A four-dimensional simplex can be used as a fault type classifier for 5-gas patterns. A 4-simplexhas ten triangular faces. If the interior of the DGA 4-simplex is projected onto those faces, they can bethought of as all possible Duval triangles based on combinations of three of the five key fault gases.
A pentagon, which as noted above is covered by ten overlapping triangles formed by combinationsof three vertexes, can be seen as a “road kill” object obtained by flattening a 4-simplex, collapsing itsfaces and parts of its interior on top of one other. This observation provides additional insight intowhy many multi-gas combinations map to a single point in a Duval or Mansour pentagon.
Energies 2020, 13, 6459 10 of 16
Although the DGA 4-simplex is difficult to visualize, it is computationally easy to work with.The method of defining fault zones by plotting linear boundaries does not generalize nicely to fourdimensions, however, so the fault type classifications have to be handled differently.
A good solution is to estimate a multivariate nonparametric probability density function for eachfault type on the points of ∆4, based upon a training set of pre-classified five-gas patterns. This methodcan be adapted to work with different insulating liquids, different apparatus types, and differentpossible diagnostic classifications. For example, pre-classified transformer DGA data from oil-filledtransformers can be used to train the DGA 4-simplex to recognize standard transformer fault types.Alternatively, DGA data for a particular model or type of on-load tap changer can be used to distinguishbetween normal operation and abnormal conditions such as contact coking, excessive arcing, and soon for that LTC model. In any case, because the fault type classification is based on what amounts tooverlapping four-dimensional contour maps of probability density for different fault types, the DGA4-simplex allows the possibility of producing a mixed diagnosis.
6. Four-Simplex Probability Density Training
The Duval triangle fault zones are defined by linear boundaries plotted within the triangle.The analogous fault zone boundaries for a five-gas DGA 4-simplex would be hyperplanes, which wouldbe difficult to define and visualize. Instead, multivariate kernel density estimation (KDE) [11] canbe applied to a training set of several thousand pre-classified cases of five-gas data to estimate amultivariate probability density function for each fault type. That function provides a probabilitydensity value for each fault type at every point of the DGA 4-simplex.
Eventually it will be desirable to train the DGA 4-simplex using a large database of trainingcases based directly on diagnoses confirmed by transformer inspection, employing any assortment offault types that is considered appropriate. Not having a large database of inspection cases, however,we decided to use Duval triangles 1, 4, and 5 to assign fault types in a large database of electric utilityDGA data that is available to us, creating a large training set for initial experimentation and evaluationof the DGA 4-simplex.
Fault types trained for this initial study were PD, T1, T2, T3, D1, and D2, as well as DT, D,(all D1 and D2 cases) and T (all T1, T2, and T3 cases). See Table 1 for fault type definitions. Fault typesS and O were treated as T1, since they overlap with the T1 temperature range and are shown as T1 bytriangle 1. Fault type C (thermal with paper carbonization), of which there were about 100 examples,was omitted from the training set since it can represent either T2 or T3. The fault types DT, D, and Tare used internally as described below but not reported as final classification results.
The training set was derived from a large database containing multiple years of DGA datacontributed to us for research by three major North American electric utilities. Software was used toidentify gassing events, defined as temporal sequences of consecutive oil samples from an individualtransformer where hydrogen and hydrocarbon gas concentrations are increasing. Such gassing eventsgenerally represent time intervals during which the transformer oil is being stressed or decomposed byhigh temperature or electrical discharges. The duration of a gassing event was not considered–only theincremental changes in fault gas concentrations between the beginning and the end of the event wererecorded and then evaluated according to Duval triangles 1, 4, and 5 according to the recommendationsof [4] to obtain a fault type. The five “pentagon gas” increments for a gassing event, along with thefault type derived as noted above, constituted one training example. In all, 7133 training exampleswere derived from the database.
Gas increments over gassing events were used for the training examples instead of gasconcentrations reported for each oil sample because a gassing event and its gas increments representgas that is generated in response to a problem or combination of problems, excluding residual gas thatmay have accumulated for various reasons over years or decades preceding that gassing event.
Energies 2020, 13, 6459 11 of 16
7. DGA 4-Simplex Classification Reporting
To see how fault type classification by the DGA 4-simplex works, consider Case 1 from [7]and Tables 2 and 4. In the natural order hydrogen, methane, ethane, ethylene, acetylene the gasconcentrations (µL/L) are 130, 140, 24, 120, 0. The software divides each gas concentration by thetotal concentration 414 (µL/L) to get barycentric coordinates β = (0.314, 0.338, 0.058, 0.290, 0.000).Those coordinates are used to calculate an affine sum like (15) to obtain the four-dimensional Cartesiancoordinates of a point inside the simplex. Those coordinates are P = (0.143, 0.219,−0.147, 0.215).
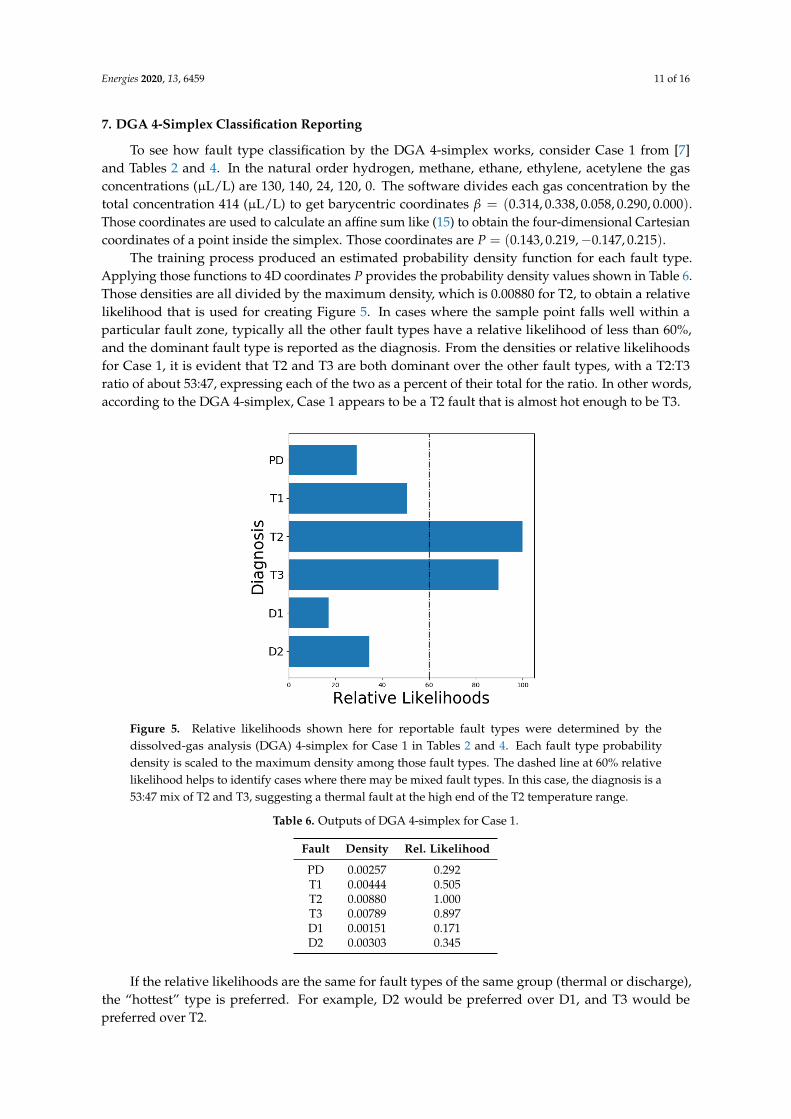
The training process produced an estimated probability density function for each fault type.Applying those functions to 4D coordinates P provides the probability density values shown in Table 6.Those densities are all divided by the maximum density, which is 0.00880 for T2, to obtain a relativelikelihood that is used for creating Figure 5. In cases where the sample point falls well within aparticular fault zone, typically all the other fault types have a relative likelihood of less than 60%,and the dominant fault type is reported as the diagnosis. From the densities or relative likelihoodsfor Case 1, it is evident that T2 and T3 are both dominant over the other fault types, with a T2:T3ratio of about 53:47, expressing each of the two as a percent of their total for the ratio. In other words,according to the DGA 4-simplex, Case 1 appears to be a T2 fault that is almost hot enough to be T3.
Figure 5. Relative likelihoods shown here for reportable fault types were determined by thedissolved-gas analysis (DGA) 4-simplex for Case 1 in Tables 2 and 4. Each fault type probabilitydensity is scaled to the maximum density among those fault types. The dashed line at 60% relativelikelihood helps to identify cases where there may be mixed fault types. In this case, the diagnosis is a53:47 mix of T2 and T3, suggesting a thermal fault at the high end of the T2 temperature range.
Table 6. Outputs of DGA 4-simplex for Case 1.
Fault Density Rel. Likelihood
PD 0.00257 0.292T1 0.00444 0.505T2 0.00880 1.000T3 0.00789 0.897D1 0.00151 0.171D2 0.00303 0.345
If the relative likelihoods are the same for fault types of the same group (thermal or discharge),the “hottest” type is preferred. For example, D2 would be preferred over D1, and T3 would bepreferred over T2.
Energies 2020, 13, 6459 12 of 16
If non-reported fault type DT has a higher probability density than all the IEC fault types, the mostlikely thermal fault type and the most likely discharge fault type are reported as joint diagnostic results,along with a likelihood ratio computed from the density values of non-reported fault type T andnon-reported fault type D.
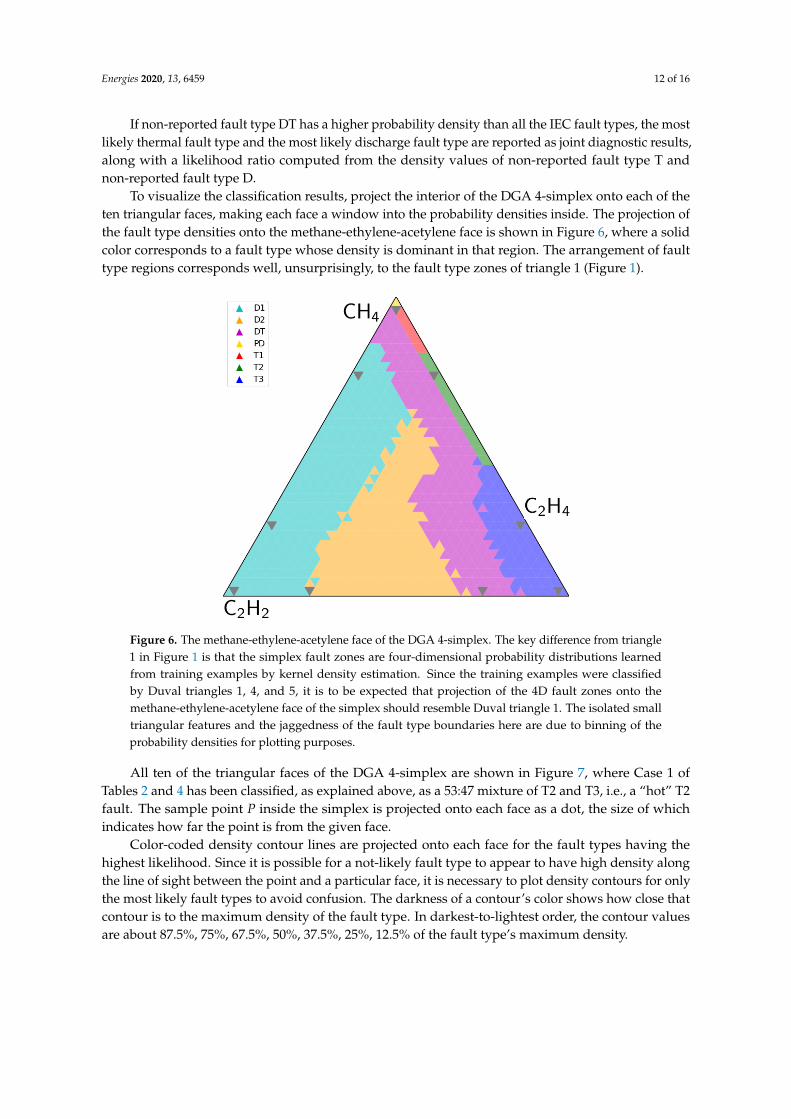
To visualize the classification results, project the interior of the DGA 4-simplex onto each of theten triangular faces, making each face a window into the probability densities inside. The projection ofthe fault type densities onto the methane-ethylene-acetylene face is shown in Figure 6, where a solidcolor corresponds to a fault type whose density is dominant in that region. The arrangement of faulttype regions corresponds well, unsurprisingly, to the fault type zones of triangle 1 (Figure 1).
Figure 6. The methane-ethylene-acetylene face of the DGA 4-simplex. The key difference from triangle1 in Figure 1 is that the simplex fault zones are four-dimensional probability distributions learnedfrom training examples by kernel density estimation. Since the training examples were classifiedby Duval triangles 1, 4, and 5, it is to be expected that projection of the 4D fault zones onto themethane-ethylene-acetylene face of the simplex should resemble Duval triangle 1. The isolated smalltriangular features and the jaggedness of the fault type boundaries here are due to binning of theprobability densities for plotting purposes.
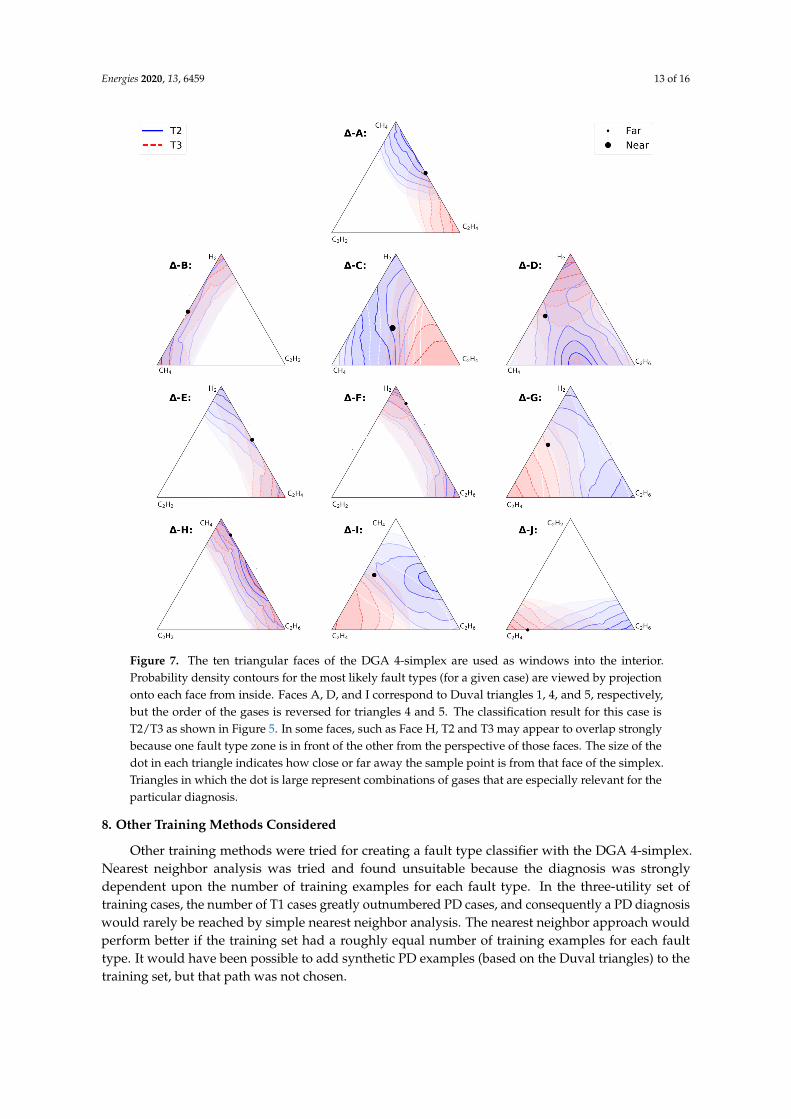
All ten of the triangular faces of the DGA 4-simplex are shown in Figure 7, where Case 1 ofTables 2 and 4 has been classified, as explained above, as a 53:47 mixture of T2 and T3, i.e., a “hot” T2fault. The sample point P inside the simplex is projected onto each face as a dot, the size of whichindicates how far the point is from the given face.
Color-coded density contour lines are projected onto each face for the fault types having thehighest likelihood. Since it is possible for a not-likely fault type to appear to have high density alongthe line of sight between the point and a particular face, it is necessary to plot density contours for onlythe most likely fault types to avoid confusion. The darkness of a contour’s color shows how close thatcontour is to the maximum density of the fault type. In darkest-to-lightest order, the contour valuesare about 87.5%, 75%, 67.5%, 50%, 37.5%, 25%, 12.5% of the fault type’s maximum density.
Energies 2020, 13, 6459 13 of 16
Figure 7. The ten triangular faces of the DGA 4-simplex are used as windows into the interior.Probability density contours for the most likely fault types (for a given case) are viewed by projectiononto each face from inside. Faces A, D, and I correspond to Duval triangles 1, 4, and 5, respectively,but the order of the gases is reversed for triangles 4 and 5. The classification result for this case isT2/T3 as shown in Figure 5. In some faces, such as Face H, T2 and T3 may appear to overlap stronglybecause one fault type zone is in front of the other from the perspective of those faces. The size of thedot in each triangle indicates how close or far away the sample point is from that face of the simplex.Triangles in which the dot is large represent combinations of gases that are especially relevant for theparticular diagnosis.
8. Other Training Methods Considered
Other training methods were tried for creating a fault type classifier with the DGA 4-simplex.Nearest neighbor analysis was tried and found unsuitable because the diagnosis was stronglydependent upon the number of training examples for each fault type. In the three-utility set oftraining cases, the number of T1 cases greatly outnumbered PD cases, and consequently a PD diagnosiswould rarely be reached by simple nearest neighbor analysis. The nearest neighbor approach wouldperform better if the training set had a roughly equal number of training examples for each faulttype. It would have been possible to add synthetic PD examples (based on the Duval triangles) to thetraining set, but that path was not chosen.
Energies 2020, 13, 6459 14 of 16
A decision tree classifier was found to be the most successful at matching the validation set,but the effect of that classifier was simply to rediscover the Duval triangle fault zones and reproducethe Duval triangle results, in effect using three gases at a time to determine the fault type classification.
9. DGA 4-Simplex Effectiveness
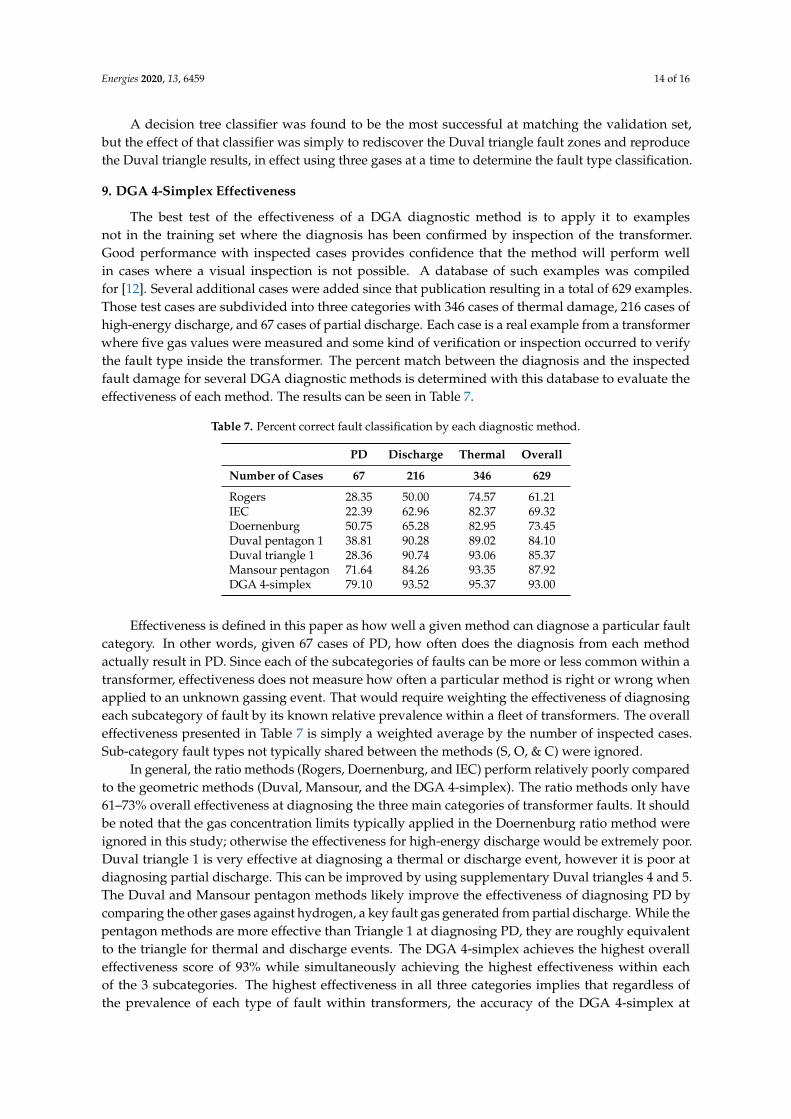
The best test of the effectiveness of a DGA diagnostic method is to apply it to examplesnot in the training set where the diagnosis has been confirmed by inspection of the transformer.Good performance with inspected cases provides confidence that the method will perform wellin cases where a visual inspection is not possible. A database of such examples was compiledfor [12]. Several additional cases were added since that publication resulting in a total of 629 examples.Those test cases are subdivided into three categories with 346 cases of thermal damage, 216 cases ofhigh-energy discharge, and 67 cases of partial discharge. Each case is a real example from a transformerwhere five gas values were measured and some kind of verification or inspection occurred to verifythe fault type inside the transformer. The percent match between the diagnosis and the inspectedfault damage for several DGA diagnostic methods is determined with this database to evaluate theeffectiveness of each method. The results can be seen in Table 7.
Table 7. Percent correct fault classification by each diagnostic method.
PD Discharge Thermal Overall
Number of Cases 67 216 346 629
Rogers 28.35 50.00 74.57 61.21IEC 22.39 62.96 82.37 69.32Doernenburg 50.75 65.28 82.95 73.45Duval pentagon 1 38.81 90.28 89.02 84.10Duval triangle 1 28.36 90.74 93.06 85.37Mansour pentagon 71.64 84.26 93.35 87.92DGA 4-simplex 79.10 93.52 95.37 93.00
Effectiveness is defined in this paper as how well a given method can diagnose a particular faultcategory. In other words, given 67 cases of PD, how often does the diagnosis from each methodactually result in PD. Since each of the subcategories of faults can be more or less common within atransformer, effectiveness does not measure how often a particular method is right or wrong whenapplied to an unknown gassing event. That would require weighting the effectiveness of diagnosingeach subcategory of fault by its known relative prevalence within a fleet of transformers. The overalleffectiveness presented in Table 7 is simply a weighted average by the number of inspected cases.Sub-category fault types not typically shared between the methods (S, O, & C) were ignored.
In general, the ratio methods (Rogers, Doernenburg, and IEC) perform relatively poorly comparedto the geometric methods (Duval, Mansour, and the DGA 4-simplex). The ratio methods only have61–73% overall effectiveness at diagnosing the three main categories of transformer faults. It shouldbe noted that the gas concentration limits typically applied in the Doernenburg ratio method wereignored in this study; otherwise the effectiveness for high-energy discharge would be extremely poor.Duval triangle 1 is very effective at diagnosing a thermal or discharge event, however it is poor atdiagnosing partial discharge. This can be improved by using supplementary Duval triangles 4 and 5.The Duval and Mansour pentagon methods likely improve the effectiveness of diagnosing PD bycomparing the other gases against hydrogen, a key fault gas generated from partial discharge. While thepentagon methods are more effective than Triangle 1 at diagnosing PD, they are roughly equivalentto the triangle for thermal and discharge events. The DGA 4-simplex achieves the highest overalleffectiveness score of 93% while simultaneously achieving the highest effectiveness within eachof the 3 subcategories. The highest effectiveness in all three categories implies that regardless ofthe prevalence of each type of fault within transformers, the accuracy of the DGA 4-simplex at
Energies 2020, 13, 6459 15 of 16
distinguishing between these subcategories will also be the greatest compared to the other methodspresented here.
The success of the DGA 4-simplex compared to Duval triangle 1 and the pentagons can likely beattributed to the following:
• Points in the DGA 4-simplex have unique barycentric coordinates, avoiding the possibility ofmis-classifying some cases as in the pentagon examples of Tables 2 and 4.
• The initial training set used for the DGA 4-simplex used classifications provided by the Duvaltriangle 1 with additional logic to use supplementary Duval triangles 4 and 5.
• The DGA 4-simplex is slightly more effective than Duval triangle 1 for thermal and dischargecases, perhaps because it formulates a more complex fault boundary with probability densities in4-space instead of using zones delineated by straight lines in the plane.
Ideally, the DGA 4-simplex should be independently trained on data of strictly inspectedcases in order to maximize the effectiveness of the methodology. The data used here to test theeffectiveness of each method would be a good starting point for that. However, for the purposes ofthis paper we reserved the inspection data as an independent validation set for fair comparison of thevarious methods.
10. Conclusions
We discussed the problems that arise with using a pentagon method to do DGA diagnosticinterpretation. The problem stems from having a plane affine coordinate system in which thecoordinates are not affinely independent. The triangle plots take advantage of affine independenceto guarantee that all points within the triangle have unique barycentric coordinates, allowing threevariables to define a two dimensional space. Because the pentagon vertexes can never be affinelyindependent in a plane, the Mansour and Duval mappings of normalized 5-gas coordinates to pointsin the pentagon are many-to-one. Examples are presented to show how some gas combinations aremapped to inappropriate fault zones.
The purpose of the pentagon methods is to use all five of the key fault gases typicallyconsidered in transformer DGA, especially using hydrogen to classify partial discharge. To fulfillthat propose, we propose an alternative solution employing a higher-dimensional version of thetriangle, i.e., a four-dimensional simplex, which can be visualized by projecting its interior onto its tentriangular faces. Points in the simplex represent combinations of the five key gases. We also proposeusing kernel density estimation to determine the likelihood of each fault type at each point within theDGA 4-simplex. We verify the effectiveness of this method and show that it out-performs other DGAinterpretation methods in accuracy of classifying an independently collected set of DGA exampleswhere inspections verified the diagnosis.
Author Contributions: Writing—original draft preparation, J.D. and Z.D.; mathematical content, J.D.; coding,training, and testing of DGA 4-simplex, Z.D.; inspection-based data and effectiveness evaluation, T.P.; figures J.D.,Z.D., and T.P. All authors have read and agreed to the published version of the manuscript.
Funding: Publication fees for this research were paid by Delta-X Research Inc., Victoria, BC, Canada.
Conflicts of Interest: The authors declare no conflict of interest.
Abbreviations
The following abbreviations are used in this manuscript:
DGA Dissolved-gas analysisD1, D2 Low-/high-energy electrical dischargeO Overheating below 250 °CPD Partial dischargeS Stray gassing with overheating below 200 °C

Energies 2020, 13, 6459 16 of 16
T1, T2, T3 Low-/medium-/high-range thermal faultLED, HED Low-/high-energy electrical dischargeLT, MT, HT Low-/medium-/high-range thermal fault
References
1. Duval, M. A review of faults detectable by gas-in-oil analysis in transformers. IEEE Electr. Insul. Mag. 2002,18, 8–17. [CrossRef]
2. IEEE Guide for the Interpretation of Gases Generated in Mineral Oil-Immersed Transformers; IEEE Std C57.104-2019(Revision of IEEE Std C57.104-2008); IEEE: Piscataway, NJ, USA, 2019; pp. 1–98. [CrossRef]
3. Mineral Oil-Filled Electrical Equipment in Service–Guidance on the Interpretation of Dissolved and Free GasesAnalysis, 3rd ed.; Number IEC 60599-2015-09; International Electrotechnical Commission: Geneva,Switzerland, 2015.
4. Duval, M. The Duval triangle for load tap changers, non-mineral oils and low temperature faults intransformers. IEEE Electr. Insul. Mag. 2008, 24, 22–29. [CrossRef]
5. Duval, M.; Lamarre, L. The Duval pentagon-a new complementary tool for the interpretation of dissolvedgas analysis in transformers. IEEE Electr. Insul. Mag. 2014, 30, 9–12. [CrossRef]
6. Cheim, L.; Duval, M.; Haider, S. Combined Duval Pentagons: A Simplified Approach. Energies 2020, 13, 2859.[CrossRef]
7. Mansour, D.E.A. Development of a new graphical technique for dissolved gas analysis in power transformersbased on the five combustible gases. IEEE Trans. Dielectr. Electr. Insul. 2015, 22, 2507–2512. [CrossRef]
8. Gouda, O.E.; El-Hoshy, S.H.; El-Tamaly, H.H. Proposed Heptagon Graph for DGA Interpretation of OilTransformers. IET Gener. Transm. Distrib. 2017, 12, 490–498. [CrossRef]
9. Zalgaller, V.A. (Ed.) Encyclopedia of Mathematics. Simplex. 2020. Available online: http://encyclopediaofmath.org/index.php?title=Simplex&oldid=48707 (accessed on 1 December 2020).
10. Dolgachev, I.P.; Shirokov, A.P. (Eds.) Encyclopedia of Mathematics. Affine Space. 2020. Available online:http://encyclopediaofmath.org/index.php?title=Affine_space&oldid=45147 (accessed on 1 December 2020).
11. Weglarczyk, S. Kernel density estimation and its application. In ITM Web Conferences; EDP Sciences:Les Ulis, France, 2018; Volume 23, p. 00037; Available online: https://doi.org/10.1051/itmconf/20182300037(accessed on 1 December 2020). [CrossRef]
12. Piotrowski, T. Effectiveness assessment of selected graphical techniques for the interpretation of measuredconcentrations of gases dissolved in transformer oil. Prz. Elektrotech. 2019, 7, 11. [CrossRef]
Publisher’s Note: MDPI stays neutral with regard to jurisdictional claims in published maps and institutionalaffiliations.
© 2020 by the authors. Licensee MDPI, Basel, Switzerland. This article is an open accessarticle distributed under the terms and conditions of the Creative Commons Attribution(CC BY) license (http://creativecommons.org/licenses/by/4.0/).