SITE C DIAGNOSTIC TOOL
99
SITE C DIAGNOSTIC TOOL SUMMARY ID Site C Diagnostic Tool Description Diagnostic tools were developed to provide a logical framework to assess the capability of the FAHMFP to detect and diagnose causes of observed changes to aquatic ecosystem and species objectives, and to help assess whether the FAHMFP is robust enough to meet its objectives. Furthermore, they provide a tool to help managers use monitoring data in the future to diagnose the causes of changes to indicators, to determine whether those causes are related to the Site C Clean Energy Project (the Project) or some other source, and to select appropriate management actions. Key Project components / locations Relevant to all monitoring components Monitoring Category Decision Support Tool Closely related programs All monitoring programs Authors Christian Beaudrie 1 , Brian Ma 2 , Eric Parkinson 2 , and Marc Porter 2 1 – Compass Resource Management 2 – ESSA Technologies Ltd Citation Beaudrie, C., B.O. Ma, E. Parkinson, and M. Porter. 2017. Site C Diagnostic Tool. Prepared for BC Hydro. Pp. 100. Site C Fisheries and Aquatic Habitat Monitoring and Follow-up Program Diagnostic Tool Summary 1
-
Upload
khangminh22 -
Category
Documents
-
view
0 -
download
0
Transcript of SITE C DIAGNOSTIC TOOL

SITE C DIAGNOSTIC TOOL SUMMARY
ID Site C Diagnostic Tool
Description Diagnostic tools were developed to provide a logical framework to assess the capability of the FAHMFP to detect and diagnose causes of observed changes to aquatic ecosystem and species objectives, and to help assess whether the FAHMFP is robust enough to meet its objectives. Furthermore, they provide a tool to help managers use monitoring data in the future to diagnose the causes of changes to indicators, to determine whether those causes are related to the Site C Clean Energy Project (the Project) or some other source, and to select appropriate management actions.
Key Project components / locations
Relevant to all monitoring components
Monitoring Category Decision Support Tool
Closely related programs All monitoring programs
Authors Christian Beaudrie1, Brian Ma2, Eric Parkinson2, and Marc Porter2 1 – Compass Resource Management 2 – ESSA Technologies Ltd
Citation Beaudrie, C., B.O. Ma, E. Parkinson, and M. Porter. 2017. Site C Diagnostic Tool. Prepared for BC Hydro. Pp. 100.
Site C Fisheries and Aquatic Habitat Monitoring and Follow-up Program Diagnostic Tool Summary 1

TABLE OF CONTENTS
Summary .................................................................................................................................................................... 1 1. Diagnostic Tool Overview ............................................................................................................................... 4
1.1 Background .......................................................................................................................................................... 4 1.2 Impact Pathways .................................................................................................................................................. 4 1.3 Application ........................................................................................................................................................... 5 1.5 Conclusion ......................................................................................................................................................... 10
2. Fish Community summary................................................................................................................................ 11 2.1 Background ........................................................................................................................................................ 11 2.2 Conceptual Model ............................................................................................................................................. 12 2.3 Defining Impact Pathways ................................................................................................................................. 14 2.4 Evaluation of Monitoring Plan Needs ................................................................................................................ 19 2.5 Possible Management Actions ........................................................................................................................... 20 2.6 Summary ............................................................................................................................................................ 20
3. Kokanee summary ........................................................................................................................................... 21 3.1 Background ........................................................................................................................................................ 21 3.2 Conceptual Model ............................................................................................................................................. 21 3.3 Defining Impact Pathways ................................................................................................................................. 22 3.4 Evaluation of Monitoring Program Needs ......................................................................................................... 25 3.5 Possible Management Actions ........................................................................................................................... 25 3.6 Summary ............................................................................................................................................................ 25
4. Bull Trout summary ......................................................................................................................................... 27 4.1 Introduction ....................................................................................................................................................... 27 4.2 Background ........................................................................................................................................................ 27 4.3 Conceptual Model ............................................................................................................................................. 27 4.4 Defining Impact Pathways ................................................................................................................................. 29 4.5 Evaluation of Monitoring Plan Needs ................................................................................................................ 40 4.6 Possible Management Actions ........................................................................................................................... 41 4.7 Summary ............................................................................................................................................................ 41
5. Goldeye summary ............................................................................................................................................ 42 5.1 Introduction ....................................................................................................................................................... 42 5.2 Background ........................................................................................................................................................ 42 5.3 Conceptual Model ............................................................................................................................................. 43 5.4 Defining Impact Pathways ................................................................................................................................. 43 5.5 Evaluation of Monitoring Plan Needs ................................................................................................................ 46 5.6 Possible Management Actions ........................................................................................................................... 46 5.7 Summary ............................................................................................................................................................ 47
6. Walleye summary ............................................................................................................................................ 48 6.1 Background ........................................................................................................................................................ 48 6.2 Conceptual Model ............................................................................................................................................. 49 6.3 Defining Impact Pathways ................................................................................................................................. 50 6.4 Evaluation of Monitoring Program Needs ......................................................................................................... 55 6.5 Possible Management Actions ........................................................................................................................... 55 6.6 Summary ............................................................................................................................................................ 56
7. Rainbow Trout Summary ................................................................................................................................. 57 7.1 Introduction ....................................................................................................................................................... 57 7.2 Background ........................................................................................................................................................ 57 7.3 Conceptual Model ............................................................................................................................................. 59 7.3 Defining Impact Pathways ................................................................................................................................. 62 7.4 Evaluation of Monitoring Plan Needs ................................................................................................................ 75 7.5 Possible Management Actions ........................................................................................................................... 75 7.6 Summary ............................................................................................................................................................ 75
Site C Fisheries and Aquatic Habitat Monitoring and Follow-up Program Diagnostic Tool Summary 2

8. Arctic Grayling Summary .................................................................................................................................. 76 8.1 Introduction ....................................................................................................................................................... 76 8.2 Background ........................................................................................................................................................ 76 8.3 Conceptual Model ............................................................................................................................................. 76 8.3 Defining Impact Pathways ................................................................................................................................. 82 8.4 Evaluation of Monitoring Plan Needs ................................................................................................................ 94 8.5 Possible Management Actions ........................................................................................................................... 94 8.6 Summary ............................................................................................................................................................ 95
References ........................................................................................................................................................... 96
Site C Fisheries and Aquatic Habitat Monitoring and Follow-up Program Diagnostic Tool Summary 3

1. DIAGNOSTIC TOOL OVERVIEW
A series of Diagnostic Tools (DT) were created to support the development of a robust Site C Fisheries and Aquatic Habitat Monitoring and Follow-up Program (FAHMFP). These DTs provide a logical framework to assess the capability of the FAHMFP to detect and diagnose causes of observed changes to aquatic ecosystem and species objectives, and to help assess whether the FAHMFP is robust enough to meet its objectives. Furthermore, they provide a tool to help managers use monitoring data in the future to diagnose the causes of changes to indicators, to determine whether those causes are related to the Site C Clean Energy Project (the Project) or some other source, and to select appropriate management actions. This document describes the development of the logical framework underpinning the DTs, outlines how the DTs were used to support the development of the FAHMFP, and describes how the DTs may be used in the future to aid in diagnosing causes of potential changes to aquatic ecosystem and species objectives.
1.1 BACKGROUND
Aquatic ecosystem and species objectives were identified for the Project as defined by the Province (BC Government 2009), and a set of indicators were defined to measure these objectives. Using a combination of pre-project monitoring information and modeling, the Project’s Environmental Impact Statement (EIS) predicted the effects of Project construction and operation on the aquatic ecosystem and species. The FAHMFP is designed to address aquatic ecosystem and species objectives by using the EIS predictions to form a series of Management Questions (MQs), hypotheses, and tasks.
The DTs are used to support the FAHMFP and to help guide potential future monitoring and mitigation activities. They are logic models that can help assign potential mechanisms or causes to an observed change (e.g., Bull Trout spawner abundance declining in the Site C Local Assessment Area [LAA]). If the mechanism leading to an outcome is identified, future monitoring and/or offsetting activities can be more effectively directed. These models are based on a set of sub-hypotheses, which break EIS predictions down into potential mechanisms that could cause the observed change. The relationship between the EIS predictions, observed changes, sub-hypotheses, and the potential mechanisms are described using Impact Pathway diagrams.
DTs and accompanying summary documents were developed for a number of fish species populations, including: Arctic Grayling, Rainbow Trout, Bull Trout, Walleye, Goldeye, Kokanee, and the broader fish community in the Site C LAA.
1.2 IMPACT PATHWAYS
Each DT is developed around an Impact Pathway diagram that serves as a framework for evaluating monitoring needs and for diagnosing potential causes of an observed Outcome for a Provincial Objective. Impact Pathways are conceptual descriptions of how changes in one or more physical, chemical, or biological factors may lead to a change in the Outcome for an Aquatic Ecosystem or Species Objective. Impact Pathways link changes in an observed Outcome with potential causes of those changes, thereby describing the mechanisms that may have led to the change. Impact Pathway diagrams may consist of one or many pathways (i.e., branches), that lead to an Outcome, with each branch containing one or more Impact Mechanisms that influence one another in a causal manner (nodes). In an example of a single branch Impact Pathway (Figure 1), the Outcome (dark blue box) indicates a negative change in an Objective (Maintain Bull Trout Status) that may have resulted from an Impact Pathway (light blue boxes) that starts with Reservoir Productivity relative to that predicted in the EIS.
Site C Fisheries and Aquatic Habitat Monitoring and Follow-up Program Diagnostic Tool Summary 4

Figure 1. Simple Impact Pathway diagram for a decline in Bull Trout (BT) spawner abundance. Light blue shaded boxes indicate an Impact Pathway with a series of related causes that lead to the observed outcome in the dark blue box.
More complex Impact Pathway diagrams (Figure 2) include multiple Impact Pathways that all lead to the same Outcome. Impact Pathway diagrams identify potential causes of an Outcome but do not provide any information on which Impact Pathway(s) are more plausible. The DTs are used to identify the most plausible Pathway(s) by comparing a set of observations on the current state of the system with estimates of what monitoring observations would be expected for each level in the impact pathway.
Figure 2. An example of a more complex Impact Pathway diagram for a decline in Bull Trout (BT) spawner abundance. Light blue shaded boxes indicate Impact Mechanisms contributing to the Impact Pathway, while the dark blue box indicates the observed outcome.
Some Impact Pathways were excluded from the DTs because they were considered highly unlikely or difficult to test. For example, possible future climate changes could affect Bull Trout directly or have cascading effects on trophic interactions in the Peace River that would affect Bull Trout abundance, but it would be very difficult to evaluate such effects and/or to attribute them to a changing climate.
1.3 APPLICATION
Each Diagnostic Tool was designed with two purposes in mind: 1) to provide a means for reviewing and confirming the adequacy of proposed monitoring for diagnosing causes of a deviation from EIS-predicted outcomes, and 2) to
Site C Fisheries and Aquatic Habitat Monitoring and Follow-up Program Diagnostic Tool Summary 5

aid managers in utilizing available monitoring data in the future to diagnose causes of observed deviations from EIS-predicted outcomes to help guide future monitoring and mitigation activities. This section outlines how the DTs were developed to illustrate their utility for these two purposes.
1) Reviewing and confirming the adequacy of proposed monitoring for diagnosing causes of a deviation from EIS-predicted outcomes.
Each DT provides a basis for reviewing planned monitoring tasks to support the development of a robust monitoring plan that is capable of diagnosing the cause of an observed outcome using Impact Pathways. For example, a decline in Bull Trout spawner abundance may be caused by ‘poor juvenile to adult survival’, which may in turn be caused by ‘high predation from Site C reservoir fauna’ (as indicated in Figure 2), then a monitoring program would be needed to monitor Bull Trout adults as well as predator abundance over time. These needs can be compared against the proposed monitoring plan to identify data gaps and add supplementary or contingent monitoring where required to enable diagnosis of change. The intent is that the DTs will help to evaluate whether the FAHMFP is robust by identifying potential data needs for more detailed analyses aimed at diagnosing causes of observed changes to aquatic ecosystem and species objectives.
The first step in the creation of the DTs involved the development of Impact Pathways, as described above. These pathways were based on the rationale for EIS predictions, and utilized sub-hypotheses to define causal mechanisms that explain observed deviations from EIS-predicted outcomes. Next, each pathway was mapped onto a matrix (Figure 3), with one Impact Pathway (and sub-hypothesis) assigned to each row in the matrix. Each column represents an indicator (e.g. growth rate of sub-adult Bull Trout) collected as part of a monitoring task in the FAHMFP. A single monitoring task may collect information on several indicators.
Figure 3. An example mapping Impact Pathways to a DT matrix for a decline in Bull Trout (BT) spawner abundance. Numbers correspond to the hierarchical organization of nodes. Main pathways are labeled with numbers 1, 2, 3, 4, and sub-nodes are labeled as 2.1, 2.2, 2.3, etc.
Site C Fisheries and Aquatic Habitat Monitoring and Follow-up Program Diagnostic Tool Summary 6
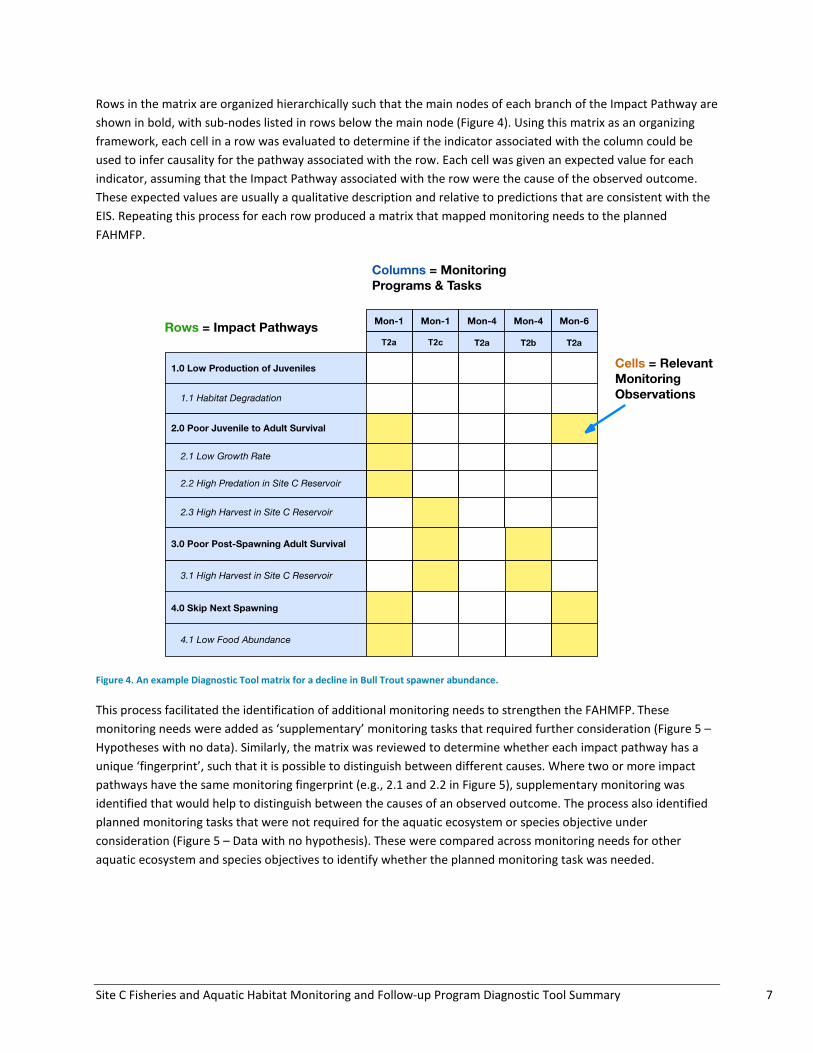
Rows in the matrix are organized hierarchically such that the main nodes of each branch of the Impact Pathway are shown in bold, with sub-nodes listed in rows below the main node (Figure 4). Using this matrix as an organizing framework, each cell in a row was evaluated to determine if the indicator associated with the column could be used to infer causality for the pathway associated with the row. Each cell was given an expected value for each indicator, assuming that the Impact Pathway associated with the row were the cause of the observed outcome. These expected values are usually a qualitative description and relative to predictions that are consistent with the EIS. Repeating this process for each row produced a matrix that mapped monitoring needs to the planned FAHMFP.
Figure 4. An example Diagnostic Tool matrix for a decline in Bull Trout spawner abundance.
This process facilitated the identification of additional monitoring needs to strengthen the FAHMFP. These monitoring needs were added as ‘supplementary’ monitoring tasks that required further consideration (Figure 5 – Hypotheses with no data). Similarly, the matrix was reviewed to determine whether each impact pathway has a unique ‘fingerprint’, such that it is possible to distinguish between different causes. Where two or more impact pathways have the same monitoring fingerprint (e.g., 2.1 and 2.2 in Figure 5), supplementary monitoring was identified that would help to distinguish between the causes of an observed outcome. The process also identified planned monitoring tasks that were not required for the aquatic ecosystem or species objective under consideration (Figure 5 – Data with no hypothesis). These were compared across monitoring needs for other aquatic ecosystem and species objectives to identify whether the planned monitoring task was needed.
Site C Fisheries and Aquatic Habitat Monitoring and Follow-up Program Diagnostic Tool Summary 7

Figure 5. An example Diagnostic Tool matrix for a decline in Bull Trout spawner abundance that identifies additional monitoring needs and extraneous monitoring tasks.
2) Diagnosing causes of observed deviations from EIS-predicted outcomes based on available monitoring data.
The DTs are organized such that monitoring data collected over time can be compared against the DT matrix using a weight of evidence approach to help identify likely causes of observed impacts on aquatic ecosystem or species objectives. Each DT is Excel-spreadsheet based, and is laid out with potential causes of an observed impact in rows (impact pathways), monitoring programs and tasks in columns, and expected monitoring results in each cell (indicating what you would expect to observe from that monitoring task for each impact pathway). A manager would use the tool by entering in a summary of monitoring observations in the ‘Actual Monitoring Observations’ row in orange at the top of the spreadsheet, and comparing those observations to ‘expected’ observations in each row of the matrix to find a row that matches. The collected monitoring information would suggest one (or several rows) of the matrix as the potential cause of the observed impact. Figure 6 illustrates an example DT matrix for Bull Trout.
By matching the ‘fingerprint’ of the actual monitoring observations to the estimated observations, a manager can deduce the likely cause of an observed change in a species. In instances where uncertainty in actual observations lead to a match with multiple impact pathways with a similar fingerprint, the DT will help the manager to visually identify which monitoring tasks require further observational effort in order to make a confident diagnosis.
Site C Fisheries and Aquatic Habitat Monitoring and Follow-up Program Diagnostic Tool Summary 8

Figure 6. An example Diagnostic Tool Matrix for Bull Trout spawner abundance. Orange cells at the top indicate actual monitoring observations from the FAHMFP. Yellow cells near the bottom denote expected monitoring observations should the cause in the corresponding row (impact pathway) be the actual cause of the observed decrease in Bull Trout abundance. Empty white cells indicate that there are no expected observations for this combination of impact pathway and monitoring indicator.
Estimating Indicator Values for Each Cell
The Diagnostic Tools are designed to be transparent and adaptable and are based on best available science. Expected values in cells are based on expert opinion expressed on a qualitative scale, usually with respect to an EIS expectation. Expert opinion was elicited from a small team of scientists through multiple rounds of review and iteration to refine judgments of expected monitoring observations for each impact pathway. Expected value estimates reflect the expert’s best judgments, and these judgments can be updated in the future by revising expected values in cells as new information becomes available. Additionally, new monitoring tasks can be added in the future, or existing monitoring tasks revised, and the associated estimates can be updated as necessary. DT summary documents were created to provide a background on assumptions and hypotheses considered in the development of each DT.
The development of each DT started with a conceptual model of the dynamics of the system. For a species, this would include breaking the lifecycle down into a series of stages and the identification of mortality, growth and movement processes associated with each stage. Relevant indicators for each stage are identified for each Monitoring Program task and included into the DT as columns.
The response of each indicator to a hypothesized Impact Pathway is based on general ecological principles, observations from other species and sites, and existing data on the ecology of the Peace River aquatic community. For example, density dependent growth and survival is common for salmonids in both lakes and streams (e.g. Hume and Parkinson 1987, Post et al. 1999), including Bull Trout juveniles in other systems (Bustard 2013, Johnston and Post 2009). Survival has been linked to growth conditions both theoretically (Walters and Juanes 1993) and experimentally (Biro et al 2006). As a result, any Impact Pathway that postulates lower growth or survival for Bull Trout at a particular location or life stage can be logically linked to indirect indicators of growth such as body condition, stomach contents, density of prey species, primary production and high-risk behavior, in addition to direct measures of Bull Trout growth, survival or predator densities at a particular location or stage.
Site C Fisheries and Aquatic Habitat Monitoring and Follow-up Program Diagnostic Tool Summary 9
There can be substantial uncertainties associated with the predicted response of an indicator, given an Impact Pathway. These uncertainties can lead to discrepancies between the predicted response and the observed response or the response anticipated by users. Some of these discrepancies can be resolved by re-examining the logic associated with the Impact Pathway but others are the result of genuine uncertainty. For example, changes in food density may not result in observable changes in growth or mortality rates for a variety of reasons. Individual fish could maintain their food intake by engaging in risky feeding behavior and accepting higher mortality rate or vice versa. At a particular location or life history stage, both growth and survival may be insensitive to changes in food density because of limitations in abundance that occur at other locations or stage. Responses can also be muted if several Impact Pathways combine to produce an undesirable Outcome.
DTs should be regarded as decision support tools that help users to identify patterns in observed data that are consistent with individual Impact Pathways. They are designed as a transparent and rigorous tool for applying a weight of evidence (WOE) approach to analyzing the implications of monitoring data on an ongoing basis. Ambiguity in these patterns should be expected and should be used to identify inconsistencies in the logic model, needs for supplemental data collection, and alternative analyses of existing data.
1.5 CONCLUSION
DT summary documents are provided for a number of aquatic ecosystem and species objectives. These documents outline conceptual models0F
1, Impact Pathways, monitoring needs, and additional monitoring actions identified through the DT development process, as well as potential mitigation actions for each Impact Pathway. The Excel-based DTs are also provided (accompanying this document), along with brief instructions on their use.
DTs have been developed for the following indicators:
1. Site C reservoir and Peace River fish communities 2. Kokanee in Site C reservoir 3. Bull Trout in Site C reservoir and the Peace River 4. Goldeye in the Peace River 5. Walleye in the Peace River 6. Rainbow Trout in the Site C Reservoir and downstream Peace River 7. Arctic Grayling in the Moberly River and downstream Peace River
The intent is that these DTs will supplement the EIS process by providing a means of assessing the robustness of the FAHMFP as it pertains to these indicators, and by identifying data needs for more detailed analyses. The DTs may also serve as a future tool for managers to diagnose problems and determine appropriate management actions.
1 Model of the biology of the indicator and the impact pathways that would lead to specific observed outcomes
Site C Fisheries and Aquatic Habitat Monitoring and Follow-up Program Diagnostic Tool Summary 10

2. FISH COMMUNITY SUMMARY
2.1 BACKGROUND
This report provides an overview of the components of the Site C Fisheries and Aquatic Habitat Monitoring and Follow-up Program (FAHMFP) designed to monitor overall impacts on ecosystem and species objectives in the Site C Local Assessment Area (LAA).
The Site C FAHMFP is built on the recognition that the construction and operation of the Site C Project is expected to result in changes to the Peace River ecosystem that have been predicted in the EIS and that will require ongoing monitoring to compare to predictions. Monitoring may be adjusted based on the results and efficacy of the methods. As stated in the EIS, “the assessment of potential effects on fish and fish habitat was designed by taking into account the draft Fish, Wildlife and Ecosystem Resources and Objectives for the Lower Peace River Watershed Site C Project Area (BC Government 2011)”. BC Government (2011) objectives are defined in terms of “valued environmental components (VECs)”, which are “characteristics or attributes that, if degraded, would compromise the integrity of the key values” and are outlined by the Province’s fish objectives (BC Government 2009). Values are identified as “Environmental elements that are important in maintaining environmental sustainability and ecological integrity.”
Monitoring the fish community status focuses on high level objectives that are additional to the status of indicator species. These Ecosystem Objectives are stated in BC Government (2009, Table 3, p11):
1. Ecosystem Integrity and Productivity: a. Zoogeography of fish fauna; b. Productive capacity of the native fish community; and c. Structure and function of aquatic community.
2. Sustainable Use: a. Sustain an adequate fisheries resource to support First Nations’ traditional uses and treaty rights; and b. Optimize recreational angling opportunities, participation and local benefits.
More specifically, ecosystem values associated with the fish community in the Project LAA are high because:
“It [the Lower Peace Region] is unique in that species and sub-species of Pacific, Beringia and Great Plains origin come into contact with one another. Different terms are used to describe this zone of contact and mixing; this report uses the term interface zone.
For fish, the interface zone is an area of contact and mixing between species and sub-species from three glacial refugia, the Pacific, Beringia and Great Plains (McPhail 2007). The zone includes contact and mixing between separate species, and also between different lineages within species (i.e., different sub-species or populations). It has only been lightly studied to date, but continues to be investigated. The key features of the interface zone in relation to MOE1F
2 objectives are: total productivity, diversity of the east and west faunas, and the structure and function of the community assemblages (e.g., competition and predator-prey interactions, meta-population dynamics).”2F
3
2 BC Ministry of Environment 3 BC Government 2009, p5
Site C Fisheries and Aquatic Habitat Monitoring and Follow-up Program - Fish Community Diagnostic Tool Summary 11

The Fish Community Diagnostic Tool is designed to detect issues across multiple species. If any particular individual species is flagged across several indicators, then the species-specific Diagnostic Tools should be used to diagnose the cause of the observed deviation from the EIS predictions.
2.2 CONCEPTUAL MODEL
Site C Reservoir represents a change in ecosystem characteristics that will affect the values associated with fish communities directly and indirectly:
“The Project may destroy fish habitat by placing a permanent physical structure on that habitat, or the Project may alter fish habitat by changing the physical or chemical characteristics of that habitat in such a way as to make it unusable by fish. Destruction or alteration of important habitats may be critical to the sustainability of a species population.”
“The Project may affect fish health and survival. It may cause direct mortality of fish or indirect mortality of fish by changing system productivity, food resource type and abundance, and environmental conditions on which fish depend (e.g., water temperature).”
“The Project may affect fish movement by physically blocking upstream and downstream migration of fish or by causing water velocities that exceed the swimming capabilities of fish, which results in hindered or blocked upstream migration of fish. Blocked or hindered fish movement has consequences to the species population. Fish may not be able to access important habitats in a timely manner or not at all (e.g., spawning habitats). Blocked fish movement may result in genetic fragmentation of the population. ”3F
4
Each effect is associated with indicators that are integrated into the monitoring plan:
“Change in fish habitat: Quality and quantity of fish habitats, habitat availability, water depth, velocity, water temperature, sedimentation, water quality, ice regime, aquatic productivity, and food resources, competition for food and habitat.”
“Change in fish health and survival: Species diversity; fish population distribution, fish population relative abundance, fish population biomass, sedimentation, stranding, fish entrainment, total dissolved gas.“
“Change in fish movement: Fish species population, movement patterns and general life history parameters (i.e., access to habitats), swim speeds, entrainment.”4F
5
The effects of these changes have been incorporated into a conceptual model that describes how the Project may impact the Ecosystem Objectives articulated in BC Government (2009):
“The construction and operation of the proposed Site C reservoir (bottom of Figure 1.1) [Figure 7] can potentially affect fish both directly (e.g., mortality in turbines), or indirectly through changes to their habitats, migratory pathways, or food sources.”5F
6
The monitoring program incorporates indicators of changes in fish habitat, fish health and survival, and fish movement (boxes in Figure 7) that are used to link indicators associated with Ecosystem Objectives (total fish
4 EIS Volume 2, Section 12.1.2, p4 5 EIS Volume 2, Section 12.1.4, p5, Table 12.4 6 EIS, Volume 2, Appendix P3, Section 1.0, p. 1
Site C Fisheries and Aquatic Habitat Monitoring and Follow-up Program - Fish Community Diagnostic Tool Summary 12

production, biomass, and species composition; Figure 7, top) to Project activities (Figure 7, bottom) through impact pathways (IPs; Figure 7, arrows).
Five sets of indicators are incorporated into this model:
1) Changes in fish habitat quality, quantity and connectivity are driven by changes in physical, chemical and geomorphic processes (via IP 2)
2) Changes in primary production and biomass of phytoplankton and periphyton are driven by changes in physical, chemical and geomorphic processes both directly (via IP 4) and indirectly (via IP 3a)
3) Changes in fish food availability (secondary production and biomass of benthos and zooplankton) are driven by changes in both primary productivity (via IP 5) and fish habitat (via IP3b)
4) Changes in total fish production, biomass, and species composition are driven by changes in habitat and connectivity both directly (via IP 3c) and indirectly through effects on fish food supply (via IP 3b, via IP 6)
5) In addition to direct measures of fish population status, Sustainable Use Objectives will be evaluated by monitoring harvest of selected species that are currently caught in recreational fisheries (Walleye, Rainbow Trout, Bull Trout, Northern Pike, Kokanee, Arctic Grayling, Mountain Whitefish), the only fisheries for which harvest rate data were available (Robichaud et al. 2010)
This conceptual model provides a basis for the analysis conducted in this section. The other sections in this report focused on single species, and, therefore, do not provide a community-wide examination of the fish community. This Fish Community Summary attempts to address uncertainties regarding ecosystem and environmental implications that are not covered in other species summary documents. However, it does not attempt to address the full range of implications and uncertainties addressed in the EIS. The expanded Impact Pathway diagrams used in this section complement those in the EIS conceptual model (Figure 7) by focusing on causal linkages between indicators of ecosystem status that can be incorporated into an ongoing monitoring program.
Site C Fisheries and Aquatic Habitat Monitoring and Follow-up Program - Fish Community Diagnostic Tool Summary 13

Figure 7. Conceptual model of the ecosystem changes and processes that may lead to undesirable outcomes for Ecosystem Objectives. This figure is a reproduction of Figure 1.1 in EIS Volume 2, Appendix P3.
2.3 DEFINING IMPACT PATHWAYS
The Diagnostic Tool development process involved identifying Impact Pathways where a change in one or more physical, chemical, or biological factors may impact species composition, total fish production, harvestable fish production, and biomass, in the Site C Reservoir and downstream of the Site C dam. More detailed Impact Pathway diagrams Figure 14(Figure 8, Figure 9, Figure 10) were created that summarize potential causes of changes in the species composition, production, and biomass of the fish community in the Site C LAA. Each Impact Pathway is associated with an impact hypothesis based on the expected response of fish and their habitats, which will be monitored under the Site C Aquatic Monitoring Program.
Site C construction and operation (e.g. flooding, clearing, debris; dam design; magnitude & frequency of fluctuation)
Change in Physical, chemical and geomorphic processes(e.g. temperature, ice, nutrients, sediment, oxygen, flooding)
Change in Physical / chemical habitat attributes & connectivity Change in Primary production & biomass
Change in Secondary production & biomass (zooplankton; benthos)
Change in Total fish production, biomass & species composition (in both reservoir and downstream)
1
2 4
5
6
3c3b
3a
Site C Fisheries and Aquatic Habitat Monitoring and Follow-up Program - Fish Community Diagnostic Tool Summary 14

Figure 8. Diagram of Impact Pathways that could potentially lead to a decrease in total fish production and total harvestable fish production and biomass in the Site C reservoir. The numbers in orange circles indicate the main branches (e.g., 1 and 2) and sub-branches (e.g., 1.1, 1.2, etc.) of the impact pathways.
Figure 9. Diagram of Impact Pathways that could potentially lead to a decrease in total fish production and total harvestable fish production and biomass in the Peace River downstream of the Site C dam. The numbers in orange circles indicate the main branches (e.g., 1 and 2) and sub-branches (e.g., 1.1, 1.2, etc.) of the impact pathways.
Site C Fisheries and Aquatic Habitat Monitoring and Follow-up Program - Fish Community Diagnostic Tool Summary 15

Figure 10. Diagram of Impact Pathways that could potentially lead to a change in fish species composition downstream in the Peace River downstream of the Site C dam. The numbers in orange circles indicate the main branches (e.g., 1 and 2)
Fish species composition within the Site C Reservoir was also explored as an Impact Pathway. However, it was deemed unnecessary since the ecosystem will be transformed from a river to a reservoir and is not expected to have the same species composition as the pre-project environment. Conservation values in the reservoir, and ecological considerations for affected species, are discussed in the other species summary documents in this package.
Key Impact Pathways that could potentially affect total fish production, total harvestable fish production, and biomass are identified in Table 1 for both the Site C Reservoir and downstream of the Site C dam. Impact Pathways include a reduction in food availability due to low entrainment of food or low food production, high harvest of one or more fish species, poor habitat quality, or increased predation or competition with other fish species. The impacts summarized in each of these pathways may be caused by the construction and/or operation of the Site C dam, or by causes unrelated to Site C. Those factors that are attributable to Site C could represent mitigation and compensation opportunities.
Key Impact Pathways that could affect fish species composition downstream of the Site C dam are also identified in Table 1. These Impact Pathways include decreased habitat connectivity, a decline in habitat diversity in the Peace River, and poor habitat quality in the Peace River downstream of the Site C dam. These impacts may be caused by the construction and/or operation of the Site C dam, or by causes unrelated to Site C. Factors that are attributable to Site C could represent mitigation and compensation opportunities. With respect to impacts on habitat connectivity, a mechanism of impact is physical isolation caused by the dam resulting in genetic divergence or genetic isolation of one or more species. If divergence is detected, then a potential management action may include translocation of the affected fish species.
Site C Fisheries and Aquatic Habitat Monitoring and Follow-up Program - Fish Community Diagnostic Tool Summary 16
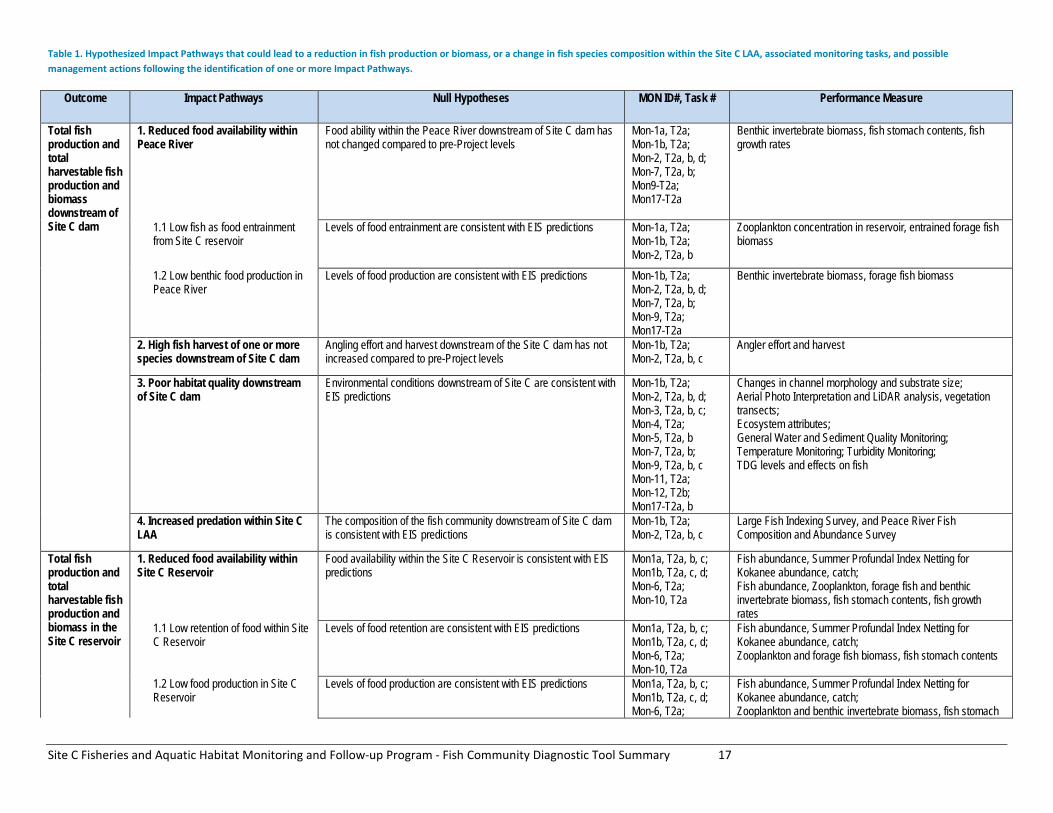
Table 1. Hypothesized Impact Pathways that could lead to a reduction in fish production or biomass, or a change in fish species composition within the Site C LAA, associated monitoring tasks, and possible management actions following the identification of one or more Impact Pathways.
Outcome Impact Pathways Null Hypotheses MON ID#, Task # Performance Measure
Total fish production and total harvestable fish production and biomass downstream of Site C dam
1. Reduced food availability within Peace River
Food ability within the Peace River downstream of Site C dam has not changed compared to pre-Project levels
Mon-1a, T2a; Mon-1b, T2a; Mon-2, T2a, b, d; Mon-7, T2a, b; Mon9-T2a; Mon17-T2a
Benthic invertebrate biomass, fish stomach contents, fish growth rates
1.1 Low fish as food entrainment from Site C reservoir
Levels of food entrainment are consistent with EIS predictions Mon-1a, T2a; Mon-1b, T2a; Mon-2, T2a, b
Zooplankton concentration in reservoir, entrained forage fish biomass
1.2 Low benthic food production in Peace River
Levels of food production are consistent with EIS predictions Mon-1b, T2a; Mon-2, T2a, b, d; Mon-7, T2a, b; Mon-9, T2a; Mon17-T2a
Benthic invertebrate biomass, forage fish biomass
2. High fish harvest of one or more species downstream of Site C dam
Angling effort and harvest downstream of the Site C dam has not increased compared to pre-Project levels
Mon-1b, T2a; Mon-2, T2a, b, c
Angler effort and harvest
3. Poor habitat quality downstream of Site C dam
Environmental conditions downstream of Site C are consistent with EIS predictions
Mon-1b, T2a; Mon-2, T2a, b, d; Mon-3, T2a, b, c; Mon-4, T2a; Mon-5, T2a, b Mon-7, T2a, b; Mon-9, T2a, b, c Mon-11, T2a; Mon-12, T2b; Mon17-T2a, b
Changes in channel morphology and substrate size; Aerial Photo Interpretation and LiDAR analysis, vegetation transects; Ecosystem attributes; General Water and Sediment Quality Monitoring; Temperature Monitoring; Turbidity Monitoring; TDG levels and effects on fish
4. Increased predation within Site C LAA
The composition of the fish community downstream of Site C dam is consistent with EIS predictions
Mon-1b, T2a; Mon-2, T2a, b, c
Large Fish Indexing Survey, and Peace River Fish Composition and Abundance Survey
Total fish production and total harvestable fish production and biomass in the Site C reservoir
1. Reduced food availability within Site C Reservoir
Food availability within the Site C Reservoir is consistent with EIS predictions
Mon1a, T2a, b, c; Mon1b, T2a, c, d; Mon-6, T2a; Mon-10, T2a
Fish abundance, Summer Profundal Index Netting for Kokanee abundance, catch; Fish abundance, Zooplankton, forage fish and benthic invertebrate biomass, fish stomach contents, fish growth rates
1.1 Low retention of food within Site C Reservoir
Levels of food retention are consistent with EIS predictions Mon1a, T2a, b, c; Mon1b, T2a, c, d; Mon-6, T2a; Mon-10, T2a
Fish abundance, Summer Profundal Index Netting for Kokanee abundance, catch; Zooplankton and forage fish biomass, fish stomach contents
1.2 Low food production in Site C Reservoir
Levels of food production are consistent with EIS predictions Mon1a, T2a, b, c; Mon1b, T2a, c, d; Mon-6, T2a;
Fish abundance, Summer Profundal Index Netting for Kokanee abundance, catch; Zooplankton and benthic invertebrate biomass, fish stomach
Site C Fisheries and Aquatic Habitat Monitoring and Follow-up Program - Fish Community Diagnostic Tool Summary 17

Outcome Impact Pathways Null Hypotheses MON ID#, Task # Performance Measure
Mon-10, T2a contents, fish growth rates
2. High fish harvest of one or more species in Site C Reservoir
Angling effort and harvest in the Site C reservoir is the same or lower than pre Project levels on the inundated Peace River
Mon1a, T2a, b, c; Mon1b, T2a, c; Mon-10, T2a
Angler effort and harvest
3. Poor habitat quality in Site C Reservoir
Environmental conditions in the Site C Reservoir are consistent with EIS predictions
Mon1a, T2a, b; Mon1b, T2a, c, d; Mon-6, T2a; Mon-8, T2b, c; Mon-10, T2a; Mon-11, T2a, b;
Aerial Photo Interpretation and LiDAR analysis, vegetation transects; Ecosystem attributes; General Water and Sediment Quality Monitoring; Temperature Monitoring; Turbidity Monitoring; TDG levels and effects on fish; Geomorphic changes in the reservoir, aquatic plant abundance
4. Increased predation or competition with other fish species within Site C Reservoir
The composition of the fish community in the Site C Reservoir is consistent with EIS predictions
Mon1a, T2a, b; Mon1b, T2a, c, d; Mon-10, T2a
Site C Reservoir Hydroacoustic, Trawl, and Gillnet Survey
Change in fish species composition downstream of the Site C dam
1. Habitat connectivity negatively impacted by Site C dam
Impacts on habitat connectivity are consistent with EIS predictions Mon1b, T2a; Mon-2, T2a, b, c, d; Mon-3, T2a, b; Mon-4, T2a; Mon-5, T2a, b; Mon-7, T2a, b; Mon-10, T2b, c; Mon-13, T2b; Mon-14, T2
Entrainment rates and survival; Fishway effectiveness; Trap and Haul effectiveness; Genetic analysis of small fish species
2. Decline in habitat diversity in Peace River
Habitat diversity in the Peace River downstream of the Site C dam is consistent with EIS predictions
Mon1b, T2a; Mon-2, T2a, b, c, d; Mon-3, T2a, b; Mon-4, T2a; Mon-5, T2a, b; Mon-7, T2a, b; Mon-9, T2a; Mon-12, T2a
Aerial Photo Interpretation and LiDAR analysis, vegetation transects; Ecosystem attributes; General Water and Sediment Quality Monitoring; Temperature Monitoring; Turbidity Monitoring
3. Poor habitat quality downstream of Site C dam
Environmental conditions downstream of Site C are consistent with EIS predictions
Mon1b, T2a; Mon-2, T2a, b, c, d; Mon-3, T2a, b; Mon-4, T2a; Mon-5, T2a, b; Mon-7, T2a, b; Mon-9, T2a, b, c; Mon-11, T2a; Mon-12, T2a, b; Mon-17, T2b
Changes in channel morphology and substrate size; Aerial Photo Interpretation and LiDAR analysis, vegetation transects; Ecosystem attributes; General Water and Sediment Quality Monitoring; Temperature Monitoring; Turbidity Monitoring; TDG levels and effects on fish
Site C Fisheries and Aquatic Habitat Monitoring and Follow-up Program - Fish Community Diagnostic Tool Summary 18

2.4 EVALUATION OF MONITORING PLAN NEEDS
Monitoring programs and associated tasks were assessed in terms of their relevance to fish community objectives to evaluate the currently proposed Site C FAHMFP (Compass and ESSA 2015). Sixteen monitoring programs and 28 associated tasks are relevant to fish community objectives monitoring questions (Table 3). Monitoring programs and associated tasks were organized according to their relevance to various impact pathways, which are in turn linked to fish community objectives. Tasks within monitoring programs will measure indicators of physical and chemical habitat, primary and secondary production (zooplankton, insects), as well as indicators of fish diversity and abundance (Table 3).
The FAHMFP assesses status and trends in the fish community through direct monitoring of fish species and environmental attributes of the Site C LAA. Direct measures of fish abundance and diversity in the Peace River will include information from the Peace River Large Fish Indexing Survey (Mon-2, T2a), the Peace River Fish Composition and Abundance Survey (Mon-2, T2b) and the Peace River Creel Survey (Mon-2, T2c). A task to Monitor Stranding Sites (Mon-12, T2b) will provide information on juvenile fish status and mortality, helping to refine downstream channel mitigation actions to reduce stranding. Data on Entrainment Rates (Mon-10, T2b) will provide estimates of the biomass subsidy transferred to the Peace River from Site C Reservoir.
The effects of the dam on habitat connectivity will be monitored through the near-term effects of the dam on entrainment rates (Mon-10, T2b, c), the effectiveness of the mitigation activities – fishway (Mon-13) and trap and haul release locations (Mon-14, T2a). Longer term, the effects of the dam on genetic diversity of small fish species will be monitored by Mon-15, T2a, b) in order to provide information on the effects of the Project on meta-population structure.
In Site C Reservoir, the Site C FAHMFP focuses on fish abundance rather than diversity. Indicators of abundance will be monitored under the Site C Reservoir Hydroacoustic, Trawl, and Gillnet Survey (Mon-1a, T2a) and the Site C Reservoir Creel Survey (Mon-1a, T2c). Trends in biomass subsidies from upstream reservoirs will be assessed under the Williston Peace Reach Kokanee Spawner Survey (Mon-10, T2a). Summer Profundal Index Netting (SPIN; Mon-1a, T2b) will provide abundance data for large piscivores.
Creel surveys (Mon-1a, T2c; Mon-2, T2c) in the Peace River and Site C Reservoir will measure recreational angler response to ecosystem changes and collect data on the size, age, and species of fish harvested in the Site C LAA. Specific monitoring of First Nations harvesting activities is not proposed; however, any information provided by First Nation on harvest as well as the creel surveys (Mon-1a, T2c and Mon-2, T2c) will collect opportunistic data that will help document total harvest.
Physical habitat and water quality data will be collected from both the Peace River and Site C Reservoir and will be used as explanatory covariates in the analysis of changes in fish communities. The primary tasks that will collect data on fish habitat and food availability are in Mon-6 and Mon-7 for reservoir and Peace River habitats, respectively. Ecosystem attributes (T2b) include: measurements of habitat area, photosynthetic light, turbidity and suspended solids concentrations, water residence time, water temperatures, water quality (pH, electrochemical conditions), nutrient concentrations, trophic state, algal biomass and composition, and fish stomach contents. These data will be supplemented by more specialized data on select aspects of the physical environment, Mon-4 and Mon-5 for the reservoir and Peace River habitats, respectively, including cross section surveys (T2c), Grain Size Sampling (T2b), and Aerial Photo Interpretation (T2a). Water and sediment quality monitoring will be included in Mon-8 (reservoir) and Mon-9 (Peace River), and includes general water and sediment quality monitoring (T2a), temperature monitoring (T2b), and turbidity monitoring (T2c). Additional
Site C Fisheries and Aquatic Habitat Monitoring and Follow-up Program - Kokanee Diagnostic Tool Summary 19

changes to the Peace River physical habitat will be monitored under Mon-3, which includes the major tasks of monitoring changes in channel morphology (T2a), substrate size (T2b), and the effectiveness of any offsetting programs (T2c). Changes in the reservoir habitat are monitored in Mon-16 by tracking geomorphic changes based on LiDAR and aerial photographs (T2a), and the colonization of aquatic vegetation (T2b).
Information on the standing crop and production of aquatic insects and zooplankton will be monitored under twin tasks on Biomass and Availability of Fish Food Organisms in the Peace River (Mon-7, T2a) and Site C Reservoir (Mon-6, T2a). Fish stomach contents will be used to link these data to upper trophic levels. Algal biomass and factors affecting primary production also will be collected under these tasks.
2.5 POSSIBLE MANAGEMENT ACTIONS
The Impact Pathways outlined in Table 3 would not necessarily trigger a mitigation or offsetting response by BC Hydro. A decrease in total fish production or total harvestable fish production and biomass, or a change in fish species composition within the Site C LAA could be the result of a variety of causes, only some of which could relate directly to Site C operations. A separate process involving discussions with stakeholders will further develop management actions; this process has not been completed at the time of the development of this document.
2.6 SUMMARY
This analysis, facilitated by the Fish Community Diagnostic Tool, suggests that monitoring proposed in the Site C Fisheries and Aquatic Habitat Monitoring and Follow-up Program to monitor impacts on species composition, total fish production, total harvestable fish production, and biomass within the Site C LAA provides some ability to diagnose likely causes for observed changes.
Site C Fisheries and Aquatic Habitat Monitoring and Follow-up Program - Kokanee Diagnostic Tool Summary 20

3. KOKANEE SUMMARY
3.1 BACKGROUND
This report provides an overview of the components of the Site C Fisheries and Aquatic Habitat Monitoring and Follow-up Program (FAHMFP) designed to monitor Kokanee (Oncorhynchus nerka) in the Site C Local Assessment Area (LAA).
Kokanee are a pelagic freshwater fish species that is widely distributed throughout BC (McPhail 2007). Kokanee colonize lacustrine habitats of many large lakes within BC and have been introduced into numerous small lakes throughout the province. Kokanee spawn in both streams and lakes during the fall and are generally sexually mature at the end of their 3rd or 4th summer, depending on the population and productivity of the system (Sebastian et al. 2009). In the Peace River system, Kokanee are native to some headwater lakes, and supplemental stocking has been conducted in Williston reservoir (Langston and Murphy 2008) where they successfully reproduce (Langston and Zemlak 1998; Sebastian et al. 2009). Kokanee are the dominant pelagic species in Williston reservoir (Sebastian et al. 2009).
3.2 CONCEPTUAL MODEL
Ecosystem modeling in support of the Site C EIS predicted that Kokanee abundance between Peace Canyon Dam and Site C will increase following the creation of the Site C Reservoir:
“Results indicated about a 3-fold increase in the total biomass of three groups of fish in the proposed Site C Reservoir relative to what currently exists in the Peace River….. The changes in overall biomass were driven most strongly by a substantial increase in group 3 planktivorous fish species (Kokanee and lake whitefish) over both the early stage and long term.”6F
7.
“The model predicts the development of a Kokanee population in the Site C Reservoir with two sources of recruitment. Most adult Kokanee in the Site C Reservoir would enter the reservoir via entrainment from Williston reservoir as younger fish. A much smaller proportion of adult Kokanee would be the progeny of adult Kokanee that spawn in tributaries to the Site C Reservoir.7F
8”
The EIS predicts that Kokanee will be an important prey source for piscivores in Site C Reservoir:
“Estimated post development biomasses of Bull Trout, burbot, and northern pike are predicated on the assumption that these species would be able to switch the portion of their diet that currently is based on mountain whitefish and Arctic Grayling (species expected to decrease) over to Kokanee or suckers (expected to increase). “8F
9.
Monitoring programs proposed under the Site C FAHMFP provide some ability to determine key sources of Kokanee recruitment into Site C Reservoir, entrainment out of the Site C Reservoir, and mortality and productivity within the Site C Reservoir.
7 EIS, Volume 2, Appendix P3, Executive Summary, p v 8 EIS, Volume 2, Appendix Q3, Executive Summary, p. 2 9 EIS, Volume 2, Appendix P3, Section 6.6.1, p. 60
Site C Fisheries and Aquatic Habitat Monitoring and Follow-up Program - Kokanee Diagnostic Tool Summary 21

3.3 DEFINING IMPACT PATHWAYS
The Diagnostic Tool development process involved identifying Impact Pathways by which a change in one or more physical, chemical, or biological factors may impact Kokanee density9F
10. An Impact Pathway diagram (Figure 14) summarizes potential causes of Kokanee decline in the Site C LAA. Each Impact Pathway identifies a mechanism for a change in Kokanee density. Each Impact Pathway is related to a null hypothesis alongside the monitoring program tasks and performance measures that test them (Table 3).
Key uncertainties that affect our understanding of impacts on Kokanee abundance/density include the following:
1. sources of recruitment (i.e., recruitment through entrainment from Williston and Peace Canyon reservoirs or Site C Reservoir tributaries);
2. interactions (predation and competition) with Lake Trout; and 3. entrainment rates at Site C.
10 Kokanee density is used in the Diagnostic Tool because it provides a measure of prey abundance for other indicator species.
Site C Fisheries and Aquatic Habitat Monitoring and Follow-up Program - Kokanee Diagnostic Tool Summary 22

Figure 11. Diagram of Impact Pathways that could potentially lead to decreased Kokanee densities in Site C Reservoir. The numbers in orange circles indicate the main branches (e.g., 1 and 2) and sub-branches (e.g., 1.1, 1.2, etc.) of the Impact Pathways.
Kokanee recruitment (Impact Pathway 1) will be a key contributor to changes in Kokanee density within Site C Reservoir, with the majority of recruitment expected to come from entrainment from Williston and Peace Canyon reservoirs. Natural recruitment from Site C Reservoir tributaries is possible once a population of Kokanee is established within the reservoir (Table 3).
Kokanee production within the Site C Reservoir (Impact Pathway 2) is a function of food availability (e.g., low food availability due to high flushing rates or low primary productivity) and competition for food.
Changes in Kokanee mortality within Site C Reservoir (Impact Pathway 3) or at Site C (Impact Pathway 4) can cause changes in Kokanee density. High Kokanee harvest by anglers, high entrainment through Site C, and high Kokanee predation can influence Kokanee mortality rates and Kokanee abundance in the Site C Reservoir. Kokanee predation by Bull Trout (Impact Pathway 3.1) is a desired management outcome as Kokanee are predicted to be the primary food source for Bull Trout in Site C Reservoir.
Site C Fisheries and Aquatic Habitat Monitoring and Follow-up Program - Kokanee Diagnostic Tool Summary 23

Table 2. Hypothesized Impact Pathways that could lead to lower abundance, growth, or survival of Kokanee within Site C Reservoir, associated monitoring tasks, and possible management actions following the identification of one or more Impact Pathways.
Impact Pathways Null Hypotheses MON ID#, Task # Performance Measure 1. Low Kokanee recruitment The density of Kokanee in Site C Reservoir is the same as pre-Project
levels. Mon-1a, T2a, b, c; Mon-1b, T2c, d; Mon-10, T2b, c; Mon-18, T2c
Kokanee density/abundance
1.1 Low Kokanee entrainment from Williston reservoir and Peace Canyon reservoir
Kokanee entrainment from upstream reservoirs is the same or greater than pre-Project levels
Mon-1a, T2a, b, c; Mon-1b, T2c; Mon-10, T2b;
Kokanee spawners in Williston tributaries
1.2 High entrainment mortality at W.A.C. Bennett Dam and Peace Canyon Dam
The combined effect of Kokanee entrainment mortality from the W.A.C. Bennett and Peace Canyon dams as well as predation mortality in Dinosaur Reservoir, is the same or lower than EIS assumptions
Mon-1a, T2a, b, c; Mon-1b, T2c, d; Mon-10, T2c;
Relative entrainment index through comparison of Kokanee abundance in Williston reservoir and Site C Reservoir (Mon-10, T2a, and Mon-1a, T2a, respectively).
1.3 Low recruitment of Kokanee fry from tributaries
Kokanee do not recruit from Site C Reservoir tributaries Mon-1a, T2a, b, c; Mon-1b, T2c; Mon-18, T2c
Kokanee spawners in Site C Reservoir tributaries
2. Low Kokanee production within Site C Reservoir
Kokanee growth rate is the same or higher than EIS predictions Mon-1a, T2a, b, c; Mon-1b, T2c; Mon-6, T2a
Age/Size structure of juvenile Kokanee
2.1 Low food availability Food availability is the same or higher than EIS predictions Mon-1a, T2a, b, c; Mon-1b, T2c; Mon-6, T2a
Stomach contents; Biomass of fish food organisms (e.g., low spring or summer Daphnia density), ecosystem attributes
2.2 High competition for food Abundance of other planktivorous fish species are the same or lower than predicted in the EIS.
Mon-1a, T2a, b, c; Mon-1b, T2c; Mon-6, T2a
Relative abundance of planktivorous fish species
3. High Kokanee mortality in Site C Reservoir
The ratio of the Age-X+1 to Age-X is less than predicted given entrainment rates into and out of the Site C Reservoir (Model-based results)
Mon-1a, T2a, b, c; Mon-1b, T2c; Mon-6, T2a
Kokanee density/abundance, relative abundance of age classes
3.1 High Kokanee predation Kokanee predation is not sufficient to account for the change in the ratio of Age-X+1 to Age-X
Mon-1a, T2a, b, c; Mon-1b, T2c; Mon-6, T2a
Stomach contents of other species, Bull Trout and Lake Trout abundance
3.2 High Kokanee harvest Kokanee harvest is not sufficient to account for the change in the ratio of Age-X+1 to Age-X.
Mon-1a, T2a, b, c; Mon-1b, T2c; Mon-6, T2a
Kokanee harvest in Site C Reservoir
4. High entrainment of Kokanee at Site C Kokanee entrainment is not sufficient to account for the change in the ratio of Age-X+1 to Age-X.
Mon-1a, T2a, b, c; Mon-1b, T2c; Mon-2, T2a, b; Mon-6, T2a; Mon-10, T2b
Kokanee entrainment rate, entrainment survival
Site C Fisheries and Aquatic Habitat Monitoring and Follow-up Program - Kokanee Diagnostic Tool Summary 24

3.4 EVALUATION OF MONITORING PROGRAM NEEDS
Monitoring programs and associated tasks were assessed in terms of their relevance to Kokanee biology to evaluate the comprehensiveness and rigour of the currently proposed Site C FAHMFP (Compass and ESSA 2015). Six monitoring programs and 10 associated tasks are relevant to Kokanee management questions (Table 3).
The Site C FAHMFP addresses key uncertainties for Kokanee while monitoring status and trends in Kokanee abundance and habitat to compare against EIS predictions. Uncertainty regarding sources of recruitment for Kokanee will be addressed by monitoring recruitment in the Williston Peace Reach under the Williston Peace Reach Kokanee Spawner Survey (Mon-10, T2a), and contingent monitoring of natural recruitment from Site C Reservoir tributaries (Mon-1b, T2c). Uncertainty regarding loss through entrainment will be addressed in the Site C Fish Entrainment Monitoring Program, which will estimate Kokanee entrainment rates and entrainment survival rates at Site C (Mon-10, T2b and T2c, respectively). Lake Trout abundance, size, and age within Site C Reservoir will be estimated using Summer Profundal Index Netting (Mon-1a, T2b).
Status and trends in the Kokanee population will be monitored in the Site C Reservoir Fish Community Monitoring Program (Mon-1a). Based on the power analysis, proposed monitoring should be sufficient to detect the predicted large magnitude increases (64% per year10F
11) after 5 years of post-operations sampling (should such increases occur within that time period), and more subtle changes (12% per year11F
12) should be detectable after 12 years of monitoring. Shortfalls in abundance greater than 35% compared to EIS predictions should be detected (Ma et al. 2014). The Site C Reservoir Hydroacoustic, Trawl and Gillnet Survey (Mon-1a, T2a) will provide Kokanee density and abundance estimates in Site C Reservoir. This information will be supplemented by the Site C Reservoir Creel Survey (Mon-1a, T2c). If Kokanee abundance and density do not trend upwards, contingent monitoring is planned if natural recruitment occurs in the Site C Reservoir tributaries (Site C Reservoir Tributaries Fish Population Indexing Survey; Mon-1b, T2c). Environmental conditions in Site C Reservoir, including primary productivity, will be monitored by Mon-6, which will provide insight when interpreting Kokanee data. Monitoring environmental parameters will help diagnose causes of declines, should declines be detected, with the support of the Diagnostic Tool.
3.5 POSSIBLE MANAGEMENT ACTIONS
The Impact Pathways outlined in Table 3 would not necessarily trigger a mitigation or offsetting response by BC Hydro. A decline in Kokanee density in Site C Reservoir could be the result of a variety of causes, only some of which could relate directly to Site C operations. A separate process involving discussions with stakeholders will further develop management actions; this process has not been completed at the time of the development of this document.
3.6 SUMMARY
This analysis, facilitated by the Kokanee Diagnostic Tool, suggests that monitoring proposed in the Site C Fisheries and Aquatic Habitat Monitoring and Follow-up Program monitors key uncertainties associated with Kokanee
11 Corresponding to the rate required to achieve the “Most Likely” outcome for Kokanee densities in EIS, Volume 2, App. P3. Methods are shown in Ma et al. 2014. 12 Corresponding to the rate required to achieve the “Low” outcome for Kokanee densities in EIS, Volume 2, App P3. Methods are shown in Ma et al. 2014.
Site C Fisheries and Aquatic Habitat Monitoring and Follow-up Program - Kokanee Diagnostic Tool Summary 25

abundance and density within Site C Reservoir, and provides some ability to diagnose likely causes for those changes.
Site C Fisheries and Aquatic Habitat Monitoring and Follow-up Program - Kokanee Diagnostic Tool Summary 26

4. BULL TROUT SUMMARY
4.1 INTRODUCTION
This report provides an overview of the components of the Site C Fisheries and Aquatic Habitat Monitoring and Follow-up Program (FAHMFP) designed to monitor the status of Bull Trout (Salvelinus confluentus) in the Site C Local Assessment Area (LAA). The objective of monitoring is to maintain or enhance the status of Bull Trout using monitoring activities and mitigation measures that are detailed in the EIS.
4.2 BACKGROUND
Bull Trout present distinctive sampling challenges for assessing population status. The Site C Clean Energy Project Environmental Impact Statement (EIS) notes the following:
“Complex migratory patterns are common in Bull Trout (McPhail 2007). The current Halfway/Peace population follows a fluvial life-history where sub-adult and adult fish inhabit different parts of the same river system... Following reservoir construction, part of the population would be expected to follow an adfluvial life-history, where adults reside in a lake or reservoir but spawning and sub-adult rearing takes place in tributary streams” (EIS App Q3).
Migration past Site C is an integral part of the life history of a component of this population and the EIS “highlighted Bull Trout as being the priority species for detailed evaluation of fish passage technologies, since there is high certainty that fish passage could serve to meet management objectives” (EIS App Q2).
The monitoring program for Bull Trout is based on clear management objectives (Government of BC 2011), which are reiterated in the EIS as follows:
“conservation objectives and performance measures concerning: abundance, species distribution, population structure, size and age distribution”12F
13 measured in terms of “adult abundance (upstream and downstream of Site C), mean age, [percent] with access to spawning habitat, and connectivity to upstream (spawning areas)”13F
14.
Additional performance measures include “Bull Trout (passage) mortality (adults and juveniles)” and “total Bull Trout angler days”14F
15.
In addition to the performance measures identified in the EIS, the monitoring plan provides supplementary information that will be used in diagnosing the cause of any change in status that is observed under the monitoring plan described in the EIS.
4.3 CONCEPTUAL MODEL
Appendix Q3 of the EIS provides a summary of the interactions between Bull Trout life history events and the operation of Site C. As summarized in the caption of Appendix Q3, Figure 2.2 (illustrated here as Figure 13),
13 EIS, Appendix Q2, Section 2.1.2, p17 14 EIS, Appendix Q2, Section 2.1.2.1, p21 15 EIS, Appendix Q2, Section 2.1.2.5, p24
Site C Fisheries and Aquatic Habitat Monitoring and Follow-up Program - Bull Trout Diagnostic Tool Summary 27

“All eggs and sub-adults reside in the Upper Halfway River drainage. At age-3, sub-adults migrate downstream to one of 3 areas (Tributary, Reservoir, Tailwater). Downstream passage of sub-adults to the tailwater cannot be mitigated because of technical difficulties. Fish in the reservoir can be entrained into an Entrained Sub-Population that resides in the tailwater… Adult fish migrate to the Upper Halfway River during the summer and spawn in September. Upstream passage can be provided as a mitigation measure for fish that reside in the tailwater. Without Upstream Passage mitigation, these fish are trapped below the dam and cannot reproduce successfully. Following spawning, adults move downstream to their original adult rearing areas. Entrainment mitigation at the dam can assist adults to pass the dam safely. Post-spawning adults from the Entrained Sub-Population migrate to the reservoir, not the tailwater following spawning because their initial movement past the dam was involuntary rather than the result of a voluntary, directed migration.”15F
16
In accordance with this model, this document reviews Bull Trout monitoring as it pertains to the following life history stages (Figure 12):
A) Eggs to Juveniles in the Halfway River watershed B) Migration of Juveniles and post-spawning adults into Site C reservoir C) Survival and Growth of Juveniles to Adults in the Site C Reservoir D) Entrainment of Juveniles and Adults E) Survival and Growth of Juveniles to mature Adults downstream of Site C F) Upstream Passage of mature Adults
Figure 12: Conceptual model of Bull Trout life stages and migrations in a post-Project landscape. The lettered symbols refer to the different life-history stages discussed in the text.
In this list of life history stages, and in Figure 13 below, juveniles are defined as fish that reside in upper Halfway River tributaries for 2-4 years before their initial downstream migration to the lower Halfway River, the Site C
16 EIS, Appendix Q3, Section 2.5.1, p21
Site C Fisheries and Aquatic Habitat Monitoring and Follow-up Program - Bull Trout Diagnostic Tool Summary 28

Reservoir, or the Peace River downstream of Site C. A subadult is post-juvenile fish that will not prepare to spawn in a given year (prior 1st maturation), or that skips spawning). A mature adult is a fish that will attempt to migrate to the upper Halfway River to spawn (Homel et al., 2008; Muhlfeld et al., 2003).
Figure 13. Conceptual model of Bull Trout life stages and migrations after the development of Site C (adapted from EIS App Q3). The letters correspond to the life-history stages discussed in text.
4.4 DEFINING IMPACT PATHWAYS
The Diagnostic Tool development process involved the identification of Impact Pathways by which a change in one or more physical, chemical, or biological factors may lead to an impact on Bull Trout spawner abundance. Impact Pathway diagrams were created for upstream of Site C and tributaries (Figure 14) and the Peace River downstream
Site C Fisheries and Aquatic Habitat Monitoring and Follow-up Program - Bull Trout Diagnostic Tool Summary 29

of the Site C Dam (
Figure 15) to identify potential causes of Bull Trout decline in the Site C LAA should a decline occur.
Key uncertainties for Bull Trout include the following:
8. Whether Bull Trout will continue to move into Site C reservoir and downstream past the Site C Project; 9. Whether entrainment through Site C will reduce Bull Trout abundance in Site C reservoir; 10. Whether Bull Trout can be effectively moved upstream from downstream of the dam; 11. Whether there will be sufficient prey in Site C reservoir to maintain high condition Bull Trout; 12. Whether Bull Trout will be the top predator in Site C reservoir (vs. Lake Trout); and 13. Whether Bull Trout overharvest will threaten the population.
Site C Fisheries and Aquatic Habitat Monitoring and Follow-up Program - Bull Trout Diagnostic Tool Summary 30

Each Impact Pathway is associated with an impact hypothesis presented in Table 3 and discussed below. Each hypothesis outlined in Table 3 represents a mechanism-based sub-hypothesis to the EIS predicted changes to Bull Trout. This level of detail extends beyond the EIS predictions.
Figure 14. Diagram of impact pathways for the Halfway River and Site C reservoir that could potentially lead to decreased Bull Trout spawner abundance in the Site C LAA. The green, dotted, boxes indicate corresponding life history stages, and the numbers in orange circles indicate the main branches (e.g., 1, 2, 3, etc.) and sub-branches (e.g., 1.1, 1.2, etc.) of the impact pathways. The letter and number hierarchy for life stage and impact pathways are consistent with those in Tables 1, 2, and 3.
Site C Fisheries and Aquatic Habitat Monitoring and Follow-up Program - Bull Trout Diagnostic Tool Summary 31

Figure 15. Diagram of impact pathways for entrainment and downstream of Site C that could potentially lead to decreased Bull Trout spawner abundance in the Site C LAA. The green, dotted, boxes indicate corresponding life history stages, and the numbers in orange circles indicate the main branches (e.g., 1, 2, 3, etc.) and sub-branches (e.g., 1.1, 1.2, etc.) of the impact pathways. The letter and number hierarchy for life stage and impact pathways are consistent with those in Tables 1, 2, and 3.
Each of the bullets below corresponds to the six life history stages and corresponding impact pathways as outlined in Table 3, Figure 14 (A, B, and C), and Figure 15 (D, E, and F).
A) Eggs to Juveniles in Halfway River
Impact pathways that affect the egg-juvenile stage have been limited to general descriptions because factors affecting juvenile abundance are unlikely to be related to Site C construction and operation. However,
Site C Fisheries and Aquatic Habitat Monitoring and Follow-up Program - Bull Trout Diagnostic Tool Summary 32

identification of factors that cause a decline in juveniles may be useful in identifying enhancement opportunities for mitigation or compensation for impacts at other stages in the life cycle.
B) Migration of Juveniles and Post-spawning adults into Site C reservoir
One impact pathway was identified that affects the downstream migration of juveniles from the Halfway River into Site C reservoir. If reservoir habitat is unattractive and a higher than expected proportion of migrants refuse to enter the reservoir, then this may induce density-dependent reductions in growth and/or survival.
C) Survival and Growth of Juveniles to Adults in Site C reservoir
In the reservoir, outcomes are broken down into three categories according to the life stage associated with the hypothesized impact pathway. The impact pathways are similar, but the outcomes can be measured independently. Juvenile to adult survival is the most difficult to measure because of the difficulty in tagging or counting juveniles and the long, variable lag before a cohort is recovered as an adult. In contrast, post-spawning adult survival and the interval between spawning can be assessed using tag recoveries from adults on the spawning grounds.
Low food abundance has been shown to result in behaviours that are associated with higher risks of predation in a variety of species, including some salmonids (Ahrens et al. 2012). This impact hypothesis is most applicable to juvenile fish that have lower energy demands and are vulnerable to a wider range of predators. Under this mechanism, low growth rates may not be observed if fish are able to fully compensate for lower food densities by engaging in riskier feeding behaviour. Four secondary hypotheses were considered that could lead to lower food abundance. Site C reservoir is expected to be oligotrophic, but the pelagic food web is subsidized by zooplankton and fish entrained from upstream reservoirs. Bull Trout <35 cm are more dependent on the benthic food web and, therefore, are expected to be more sensitive to low reservoir productivity. The upstream subsidy also means that high entrainment of Kokanee and low pelagic Kokanee densities are not necessarily indicative of low Kokanee availability if Bull Trout are able to successfully exploit the influx of fish entrained into the reservoir through Peace Canyon Dam. Ecopath modeling under the EIS suggests that food resources for Bull Trout may be limiting16F
17. A poorly understood interaction between Bull Trout and Lake Trout has also led to population collapse of Bull Trout in lakes and reservoirs where lake trout are native or introduced (Guy et al 2011).
Bull Trout generally do well in reservoirs, but the Halfway River Bull Trout population is adapted to a large river and may have difficulty competing with other reservoir adapted species such as Lake Trout and Walleye. Bull Trout are also vulnerable to overharvest. Harvest of the Halfway River Bull Trout population is currently prohibited, but some harvest is legal for most Bull Trout populations in BC reservoirs. High turbidity has been included as a possible hypothesis because of the expected impact of Site C on turbidity. However, given the current turbid nature of the lower Halfway and Peace rivers, and the presence of healthy Bull Trout populations in glacial lakes, this impact pathway seems unlikely.
Two additional Impact Pathways include poor post-spawning adult survival and delayed repeat spawning, both of which have been observed in Bull Trout. A delay in repeat spawning can be seen as a simple energy budget issue, but the mechanism that leads to low post-spawning adult survival is not clear.
D) Entrainment of Juveniles to Adults
17 EIS, Appendix P3, Section 6.5, p58
Site C Fisheries and Aquatic Habitat Monitoring and Follow-up Program - Bull Trout Diagnostic Tool Summary 33

Impact pathways related to two general types of entrainment were developed. The first results from a directed downstream migration of juveniles and post-spawning adults soon after they enter the reservoir. The second consists of inadvertent entrainment of all ages at any time during their residence in the reservoir.
E) Survival and Growth of Juveniles to Adults downstream of the Site C Dam
Impact pathways in the Peace River downstream of the Site C Dam are identical to those in the reservoir, with the addition of sublethal entrainment effects that increase the likelihood of subsequent predation mortality. Mortality from sublethal effects of turbine passage (disorientation, lethargic behavior, sublethal injury) is typically treated separately from immediate mortality because it can be a significant fraction of total entrainment mortality, but is more difficult to measure than immediate mortality.
F) Upstream Passage of Adults
Factors that affect upstream passage are directly attributable to the Project and represent a mitigation opportunity, which will be extensively evaluated. Impact processes include Bull Trout are not able to find the fishway, or are not motivated to migrate.
Site C Fisheries and Aquatic Habitat Monitoring and Follow-up Program - Bull Trout Diagnostic Tool Summary 34

Table 3.Hypothesized Impact Pathways that lead to lower abundance, growth, and survival of Bull Trout within the Site C LAA, associated monitoring tasks, and possible management actions following the identification of one or more impact pathways.
Life Stage Impact Pathways Null Hypotheses Mon ID #, Task # Performance Measure Implication if Null Hypothesis Rejected
A) Eggs to Juveniles: Migrant survival and growth in the tributaries
1. Poor egg to juvenile growth and survival in tributaries
The production of juvenile Bull Trout migrants is the same or higher than pre-Project level
Mon-1a, T2a, b, c; Mon-1b, T2a, b, c; Mon-2, T2a, c; Mon-18, T2c
N/A Bull Trout juvenile production is lower than pre-Project
1.1 Habitat degradation in tributaries
Indicators of juvenile habitat quality are the same or greater than pre-Project values
Mon-1a, T2a, b, c; Mon-1b, T2a, b, c; Mon-2, T2a, c; Mon-18, T2c
N/A Low Bull Trout juvenile production is associated with watershed degradation
B) Juveniles and Post-spawning adults: Downstream migration from tributaries into Site C reservoir
2. Poor downstream migration from tributaries into Site C reservoir
The proportion of age-3 Bull Trout and post-spawning adults that remain in the Halfway River watershed is the same or lower than pre-Project levels
Mon-1a, T2a, b, c; Mon-1b, T2a, b; Mon-2, T2a;
Relative abundance; proportion of individuals moving
Greater proportion of juveniles or post-spawning adults remain in the Halfway River compared to pre-Project
2.1 Lower density-dependent growth in the Lower Halfway River
Growth of sub-adult Bull Trout in the Halfway River is the same or greater than pre-Project levels
Mon-1a, T2a, b, c; Mon-1b, T2a, b; Mon-2, T2a;
Growth; proportion of individuals moving
Growth and/or survival is lower in the reservoir than it was in the pre-Project Peace River
C) Juveniles to Adults: Survival and growth in Site C reservoir
3. Poor juvenile to adult survival in Site C reservoir
Survival from age-3 to 1st spawning is the same or higher than pre-Project levels
Mon-1a, T2a, b, c; Mon-1b, T2a, b, c; Mon-2, T2a; Mon-4, T2a; Mon-5, T2a, b; Mon-6, T2a, b; Mon-8, T2a, b, c; Mon-10, T2a
Growth; proportion of individuals moving
Lower survival from age-3 to 1st spawning compared to pre-Project
3.1 Low growth rate leads to higher mortality
Growth and/or survival from age-3 to 1st spawning is the same or higher than pre-Project levels
Mon-1a, T2a, b, c; Mon-1b, T2a, b, c; Mon-2, T2a; Mon-4, T2a; Mon-5, T2a, b; Mon-6, T2a, b; Mon-8, T2a, b, c; Mon-10, T2a
Growth; proportion of individuals moving
Growth and/or survival is lower in the reservoir than it was in the Peace River
3.2 High predation from Site C reservoir fauna
Predation rates on age-3 and older migrants are the same or lower than pre-Project levels
Mon-1a, T2a, b, c; Mon-1b, T2a, b, c; Mon-2, T2a;
Relative abundance Higher predation rates on Age-3 and older migrants compared to pre-Project
Site C Fisheries and Aquatic Habitat Monitoring and Follow-up Program - Bull Trout Diagnostic Tool Summary 35

3.3 High harvest Harvest rates over all life stages are lower than maximum acceptable level
Mon-1a, T2a, b, c; Mon-1b, T2a, b, c; Mon-2, T2a;
Angler catch Harvest mortality is higher than acceptable at one or more locations
4. Poor post-spawning adult survival in Site C reservoir
Proportion of post-spawning adults returning to spawn in subsequent years is the same or higher than pre-Project levels
Mon-1a, T2a, b, c; Mon-1b, T2a, b, c; Mon-2, T2a; Mon-4, T2a; Mon-6, T2a, b; Mon-8, T2a, b, c; Mon-10, T2a
Spawner numbers, proportion of individuals moving
Proportion of post-spawning adults returning to spawn in subsequent years is less than pre-Project
4.1 Low Food Abundance Condition of Bull Trout in the reservoir is the same or higher than estimates for the pre-Project Peace River
Mon-1a, T2a, b, c; Mon-1b, T2a, b, c; Mon-2, T2a; Mon-10, T2a
Growth Post-spawning adults do not regain condition
4.2 High predation Predation rates on post-spawning adults in the reservoir from birds or mammals is the same or lower than estimates for the pre-Project Peace River
Mon-1a, T2a, b, c; Mon-1b, T2a, b, c; Mon-2, T2a;
Relative abundance Predation rates on post-spawning adults in reservoir is greater than pre-Project
4.3 High harvest Harvest rates summed over all sites and stages are lower than maximum acceptable level
Mon-1a, T2a, b, c; Mon-1b, T2a, b, c; Mon-2, T2a;
Angler catch Harvest mortality is higher than acceptable at one or more locations
5. Skip next spawning (from Site C reservoir)
Proportion of post-spawning adults spawning in consecutive years is same or higher than pre-Project
Mon-1a, T2a, b, c; Mon-1b, T2a, b, c; Mon-2, T2a; Mon-6, T2a, b; Mon-8, T2c; Mon-10, T2a,b
Spawner numbers, proportion of individuals moving
Proportion of post-spawning adults spawning in consecutive years is less than pre-Project
5.1 Low food abundance Abundance of prey species (KO, LW, SU) lower than EIS prediction
Mon-1a, T2a, b, c; Mon-1b, T2a, b, c; Mon-2, T2a; Mon-6, T2a, b; Mon-10, T2a,b
Relative abundance Forage fish densities are lower than expected at one or more locations
5.2 High turbidity (cannot find prey)
Turbidity is the same or lower than EIS predictions
Mon-1a, T2a, b, c; Mon-1b, T2a, b, c; Mon-2, T2a; Mon-8, T2c;
Turbidity Turbidity is higher than pre-Project inhibiting ability to find prey
D) Juveniles to Adults: Entrainment loss to downstream
6. High Bull Trout entrainment rate The proportion of Bull Trout moving through Site C is the same or lower than EIS predictions
Mon-1a, T2a, b, c; Mon-1b, T2a, b, c; Mon-2, T2a, c; Mon-10, T2b, c; Mon-14, T2
Proportion of entrained individuals
Proportion of Bull Trout entrained through Site C is higher than predicted
6.1 High entrainment of juveniles and post-spawning adults
Bull Trout juveniles are entrained through Site C at the same or lower rate than pre-Project migration estimates.
Mon-1a, T2a, b, c; Mon-1b, T2a, b, c; Mon-2, T2a, c;
Proportion of entrained individuals
Entrainment involves higher than expected numbers of juveniles
Site C Fisheries and Aquatic Habitat Monitoring and Follow-up Program - Bull Trout Diagnostic Tool Summary 36

Mon-10, T2b, c; Mon-14, T2
6.2 Inadvertent entrainment of all ages
All ages of Bull Trout are entrained through Site C at the same or lower rate than EIS predictions
Mon-1a, T2a, b, c; Mon-1b, T2a, b, c; Mon-2, T2a, c; Mon-10, T2b, c; Mon-14, T2
Proportion of entrained individuals
All ages are entrained at a higher than expected rate
Bull Trout post-spawning adults are entrained through Site C at the same or lower rate than EIS predictions
Mon-1a, T2a, b, c; Mon-1b, T2a, b, c; Mon-2, T2a, c; Mon-10, T2b, c; Mon-14, T2
Proportion of entrained individuals
Adults are entrained at a higher than expected rate
E) Juveniles to Adults: Poor Survival and Growth in the Peace RIver downstream of Site C Dam
7. Poor juvenile to adult survival in the Peace RIver downstream of Site C Dam
The survival of Bull Trout that move downstream of Site C is the same or higher than pre-Project levels
Mon-1a, T2b, c; Mon-1b, T2a, b, c; Mon-2, T2a, c; Mon-3, T2a, b, c; Mon-5, T2a, b; Mon-7, T2a, b; Mon-9, T2a, b, c; Mon-10, T2c; Mon-11, T2a, b; Mon-14, T2
Proportion of individuals moving
Survival of juveniles and adults is lower than pre-project
7.1 Immediate entrainment mortality
Immediate mortality of entrained fish is not significantly higher than EIS predictions.
Mon-1a, T2b, c; Mon-1b, T2a, b, c; Mon-2, T2a, c; Mon-10, T2c; Mon-11, T2a, b; Mon-14, T2
Proportion of entrained individuals that die immediately
Direct entrainment mortality is higher than expected
7.2 Sublethal entrainment effects leading to mortality
Mortality rates of Bull Trout that survive turbine passage are similar to long-term residents of the Peace River downstream of the Site C Dam
Mon-1a, T2b, c; Mon-1b, T2a, b, c; Mon-2, T2a, c; Mon-10, T2c; Mon-11, T2a, b; Mon-14, T2
Mortality rate of Bull Trout in the Peace River downstream of the Site C Dam
Entrainment results in latent mortality
7.3 Low growth rate leads to higher mortality
Growth and/or survival from age-3 to 1st spawning is the same or higher than pre-Project levels
Mon-1a, T2b, c; Mon-1b, T2a, b, c; Mon-2, T2a, c; Mon-3, T2a, b, c; Mon-5, T2a, b; Mon-7, T2a, b; Mon-9, T2a, b, c; Mon-10, T2c; Mon-11, T2a, b; Mon-14, T2
Relative abundance Growth and/or survival is lower in the the Peace RIver downstream of the Site C Damthan it was in the orginal Peace River
Site C Fisheries and Aquatic Habitat Monitoring and Follow-up Program - Bull Trout Diagnostic Tool Summary 37

7.4 High predation from fauna in the Peace RIver downstream of Site C Dam
Predation rates on age 3 and older migrants are the same or lower than pre-Project levels
Mon-1a, T2b, c; Mon-1b, T2a, b, c; Mon-2, T2a, c; Mon-11, T2a, b; Mon-14, T2
Relative abundance Predator populations are higher than expected at one or more locations.
7.5 High harvest Harvest rates over all life stages are lower than maximum acceptable level
Mon-1a, T2b, c; Mon-1b, T2a, b, c; Mon-2, T2a, c; Mon-14, T2
Angler catch Harvest mortality is higher than acceptable at one or more locations
8. Poor post-spawning adult survival in the Peace RIver downstream of Site C Dam
Proportion of post-spawning adults returning to spawn in subsequent years is the same or higher than pre-Project levels
Mon-1a, T2a; Mon-1b, T2a, b, c; Mon-2, T2a; Mon-3, T2a; Mon-4, T2a; Mon-5, T2a, b; Mon-7, T2a, b; Mon-9, T2a, b, c
Proportion of individuals moving
Proportion of post-spawning adults returning to spawn is lower than pre-Project
8.1 Low food abundance Condition of Bull Trout in the Peace River is the same or higher than pre-Project levels
Mon-1a, T2a; Mon-1b, T2a, b, c; Mon-2, T2a; Mon-3, T2a; Mon-4, T2a; Mon-5, T2a, b; Mon-7, T2a, b; Mon-9, T2a, b, c
Relative abundance of other species
Post-spawning adults do not regain condition
8.2 High predation (from mammals, birds)
Predation rates on post-spawning adults in the Peace River downstream of the Site C Dam is the same or lower than pre-Project levels
Mon-1b, T2a, b, c; Mon-2, T2a;
Relative abundance Predation rates on post-spawning adults in the Peace RIver downstream of the Site C Dam is higher than pre-Project
8.3 High harvest Harvest rates over all life stages are lower than maximum acceptable level
Mon-2, T2c Angler catch Harvest mortality is higher than acceptable at one or more locations
9. Skip next spawning (from the Peace RIver downstream of Site C Dam )
Proportion of post-spawning adults spawning in consecutive years is same or higher than pre-Project levels
Mon-1a, T2a, b, c; Mon-1b, T2a, b, c; Mon-2, T2a, c, d; Mon-3, T2a, b; Mon-4, T2a; Mon-5, T2a, b; Mon-7, T2a, b; Mon-9, T2a, b, c
Relative abundance Proportion of post-spawning adults spawning in consecutive years is lower than pre-Project
Site C Fisheries and Aquatic Habitat Monitoring and Follow-up Program - Bull Trout Diagnostic Tool Summary 38

9.1 Low food abundance Abundance of prey species is lower than EIS prediction
Mon-1a, T2a, b, c; Mon-1b, T2a, b, c; Mon-2, T2a, c, d; Mon-3, T2a, b; Mon-4, T2a; Mon-5, T2a, b; Mon-7, T2a, b; Mon-9, T2a, b, c
Relative abundance of other fish species; abundance of lower trophic level food items
Abundance of prey species is lower than predicted
9.2 Cannot find prey Turbidity is the same or lower than EIS predictions
Mon-1a, T2a, b, c; Mon-1b, T2a, b, c; Mon-2, T2a, c, d; Mon-7, T2b; Mon-9, T2ac
Turbidity Bull Trout are less able to find prey compared to pre-Project conditions
F) Mature Adults: Upstream passage
10. Low upstream passage The number of Bull Trout entering the fishway is the same or greater than the estimated number of mature Halfway Bull Trout in the Peace River downstream of Site C Dam
Mon-1a, T2a, c; Mon-1b, T2a, b, c; Mon-2, T2a, c, d; Mon-14, T2a
Relaitve abundance; Proportion of individuals moving
The number of Bull Trout entering the fishway is lower than estimated
10.1 Low upstream passage Most[1] Bull Trout that are thought to be mature migrate to the base of the dam
Mon-1a, T2a, c; Mon-1b, T2a, b, c; Mon-2, T2a, c, d; Mon-14, T2a
Proportion of individuals moving
Mature Bull Trout do not approach the dam
Site C Fisheries and Aquatic Habitat Monitoring and Follow-up Program - Bull Trout Diagnostic Tool Summary 39

4.5 EVALUATION OF MONITORING PLAN NEEDS
The Site C FAHMFP and associated tasks were assessed in terms of their relevance to Bull Trout biology. Fourteen monitoring programs and 29 associated tasks were identified as being relevant to Bull Trout monitoring questions (Table 3). In tributaries to the Halfway River, proposed Bull Trout sampling includes measurements that will estimate abundance via spawner and redd counts (Mon-1b, T2b). These data will be supplemented with fish resistivity counters, PIT tag detection array systems, and telemetry array systems (Mon-1b, T2d). During select study years, small fish boat electroshocking will provide a means of capturing and tagging subadult Bull Trout prior to these fish exiting the Halfway River system. Resistivity counters and array systems will provide a cost-effective means of ground-truthing spawner count data (Mon-1b), and telemetry data will be central to understanding Bull Trout movement.
In Site C reservoir, the relative abundance of Bull Trout will be assessed under the Site C reservoir Hydroacoustic, Trawl, and Gillnet Survey (Mon-1a, T2a) and Summer Profundal Index Netting (SPIN; Mon-1a, T2b). SPIN also will measure Bull Trout (and Lake Trout) size and age. Lake Trout could be a main competitor to Bull Trout in Site C reservoir. Bull Trout catch also will be included in the Site C reservoir Creel Survey (Mon-1a, T2c), which will provide data to assess Bull Trout overharvest in the reservoir. Mon-6 and Mon-8 will measure primary productivity and environmental conditions in the reservoir, which will provide insight when interpreting Bull Trout data in the reservoir. Bull Trout absolute abundance will be measured indirectly based on models that factor in spawner abundance from redd counts, downstream Peace River adult abundance, and movement rates.
In the Peace River, entrainment rates and entrainment survival of Bull Trout will be monitored under the Site C Fish Entrainment Monitoring Program (Mon-10, T2b and T2c). The relative abundance of Bull Trout downstream of Site C will be assessed under the Peace River Large Fish Indexing Survey (Mon-2, T2a) and the Peace River Fish Composition and Abundance Survey (Mon-2, T2b). The Peace River Creel Survey (Mon-2, T2c) will provide additional abundance estimates and also provide data to assess whether Bull Trout are overharvested downstream of Site C. Mon-7 and Mon-9 will measure primary productivity and environmental conditions downstream of the dam, which will provide insight when interpreting Bull Trout data downstream of the dam.
In both Site C reservoir and the Peace River, monitoring environmental parameters will help diagnose causes of declines should declines be detected. Results also can be applied to the Diagnostic Tool.
The efficacy of the trap and haul facility at capturing Bull Trout is assessed under the Site C Fishway Effectiveness Monitoring Program (Mon-13), and the release location efficacy will be assessed under the Site C Trap and Haul Fish Release Location Monitoring Program (Mon-14). The effect of the trap and haul facility on Bull Trout spawner abundance will depend on both trap and haul efficiency and actual entrainment rates. The results from the power analyses (Ma et al. 2014) suggest that there will be overall low power to detect an effect of the trap and haul facility on Bull Trout spawner abundance because of high natural year-to-year variability and sampling error associated with spawner counts (by redd counts). However, a direct comparison of the number of Bull Trout captured in the trap and haul facility on a yearly basis will still be possible. Modelling also can offer insight into the expected effects of efficiency on spawner abundance. Complementary methods of assessing Bull Trout movement, such as a PIT tag detection array system, will be important to continue to determine the long term movement patterns of Bull Trout between Site C reservoir and the Peace River.
Site C Fisheries and Aquatic Habitat Monitoring and Follow-up Program - Bull Trout Diagnostic Tool Summary 40

4.6 POSSIBLE MANAGEMENT ACTIONS
The Impact Pathways outlined in Table 3 would not necessarily trigger a mitigation or offsetting response by BC Hydro. A decline in Bull Trout abundance in the Site C LAA could be the result of a variety of causes, only some of which could relate directly to Site C operations. A separate process involving discussions with stakeholders will further develop management actions; this process has not been completed at the time of the development of this document.
4.7 SUMMARY
This analysis, facilitated by the Bull Trout Diagnostic Tool, suggests that monitoring proposed in the Site C FAHMFP is sufficient to detect changes to Bull Trout spawner abundance within the Site C LAA, and provides some ability to diagnose likely causes for those changes.
Site C Fisheries and Aquatic Habitat Monitoring and Follow-up Program - Bull Trout Diagnostic Tool Summary 41

5. GOLDEYE SUMMARY
5.1 INTRODUCTION
This report provides an overview of the components of the Site C Fisheries and Aquatic Habitat Monitoring and Follow-up Program (FAHMFP) designed to monitor Goldeye (Hiodon alosoides) in the Site C Local Assessment Area (LAA).
5.2 BACKGROUND
Goldeye are endemic to North America, occurring in Canada from western Ontario to the Rocky Mountains and north to Great Slave Lake, with an isolated pocket of distribution directly south of James Bay in Ontario and Quebec (McPhail 2007). Goldeye are a blue-listed species (i.e., a species of special concern) in British Columbia, and classified as “secure” in Alberta (EIS, Section 12, Table 12.5). They can be found in a variety of habitats including warm, silty/turbid, slow-moving waters of large rivers, quiet shallow lakes, ponds, marshes, and muddy shallows of large lakes. Goldeye are adapted to low light and turbid water conditions and are essentially nocturnal. They are mainly surface feeders, consuming aquatic insects, snails, small fish, and any other edible organisms they encounter. Goldeye can exhibit both riverine and adfluvial life history types. Goldeye reach maturity at approximately age-6 to age-7 and spawn annually in the spring. Young-of-the-year Goldeye are found in rivers in areas of large eddies as well as shallow areas with limited water movement. Juvenile and adult Goldeye may move upstream during summer feeding periods and then return to overwintering areas in the late fall.
Goldeye were selected as an indicator species to monitor the environmental sustainability and ecological integrity of key values by the Province for the following reasons:
• “not well studied within the Lower Peace River Watershed and elsewhere; • representative of coolwater fauna, tolerant of turbidity, and highly migratory; and • representative of Great Plains origin (BC Government 2011)17F
18”
With respect to the Site C Project, the most important characteristic of Peace River Goldeye is their migratory behavior, which is described in the following summaries from the EIS (Section 12):
“Goldeye is a migratory species that can travel long distances from wintering habitats downstream to spawning and feeding habitats to as far upstream as the Moberly River. The Goldeye population spawns in the Peace River and in several tributaries, primarily in Alberta.18F
19”
“Radio-tagged Goldeye moved long distances and the total range of movement encompassed approximately 700 km of river from Vermillion Chutes to the Pine River confluence in British Columbia. Although the majority of Goldeye were highly migratory, not all fish moved past the Dunvegan site during annual migrations. A portion of the sample population remained downstream (of Dunvegan). Peak upstream migrations were most likely to occur between May and July. Downstream (migrations) were most likely to occur between August and October when fish returned to wintering habitats.
18 EIS, Volume 2, Appendix O, pp. 65 19 EIS, Volume 2, Section 12.3.2.3, pp. 12-25
Site C Fisheries and Aquatic Habitat Monitoring and Follow-up Program - Goldeye Diagnostic Tool Summary 42
Radio-tagged Goldeye frequented confluence areas of several tributaries, generally were not recorded moving upstream into the tributary. Exceptions include upstream migrations by Goldeye into the Smoky River near the Town of Peace River, Alberta, as well as the Clear River and Beatton River near the B.C./Alberta boundary. The presence of Goldeye in (Peace River) tributaries during the spawning period suggested that tributaries may be used for spawning by Goldeye.19F
20”
5.3 CONCEPTUAL MODEL
The life history of Peace River Goldeye will not be directly affected by the physical presence of the Site C dam and reservoir as their current distribution is restricted to the Peace River downstream of the Pine River confluence (EIS, Volume 2, Appendix O).
The EIS predicts changes to Goldeye abundance downstream of the Site C Project. Goldeye abundance is expected to decrease because
“Spawning migration is cued by temperature. Lower temperatures, less turbid water, and flow fluctuations will make conditions less preferable for Goldeye20F
21.”
Monitoring programs proposed under the Site C FAHMFP provide some ability to distinguish between changes in Goldeye abundance caused by factors within the Site C LAA versus factors outside of Site C LAA.
5.4 DEFINING IMPACT PATHWAYS
The Diagnostic Tool development process involved the identification of Impact Pathways where a change in one or more physical, chemical, or biological factor may impact Goldeye abundance. An impact pathway diagram (Figure 14) was created that summarizes potential causes of Goldeye decline in the Site C LAA. Each Impact Pathway is associated with an impact hypothesis on the expected response for Goldeye and its habitat that will be monitored under the Site C Aquatic Monitoring Program.
The EIS predicts changes to Goldeye abundance downstream of the Site C Project. Goldeye abundance is expected to decrease because:
“Spawning migration is cued by temperature. Lower temperatures, less turbid water, and flow fluctuations will make conditions less preferable for Goldeye21F
22.”
The life history of Goldeye implies that if they do decline, key uncertainties include the following:
1. whether changes in conditions inside the Site C LAA will result in changes in Goldeye survival and migration into the Site C LAA; and
2. whether changes in conditions outside the Site C LAA downstream in Alberta will result in changes in Goldeye survival and migration into the Site C LAA.
20 EIS, Volume 2, Appendix O, Section 6.1.1.4, pp. 132 21 EIS, Volume 2, Appendix P3, Table 6D.2 22 EIS, Volume 2, Appendix P3, Table 6D.2
Site C Fisheries and Aquatic Habitat Monitoring and Follow-up Program - Goldeye Diagnostic Tool Summary 43
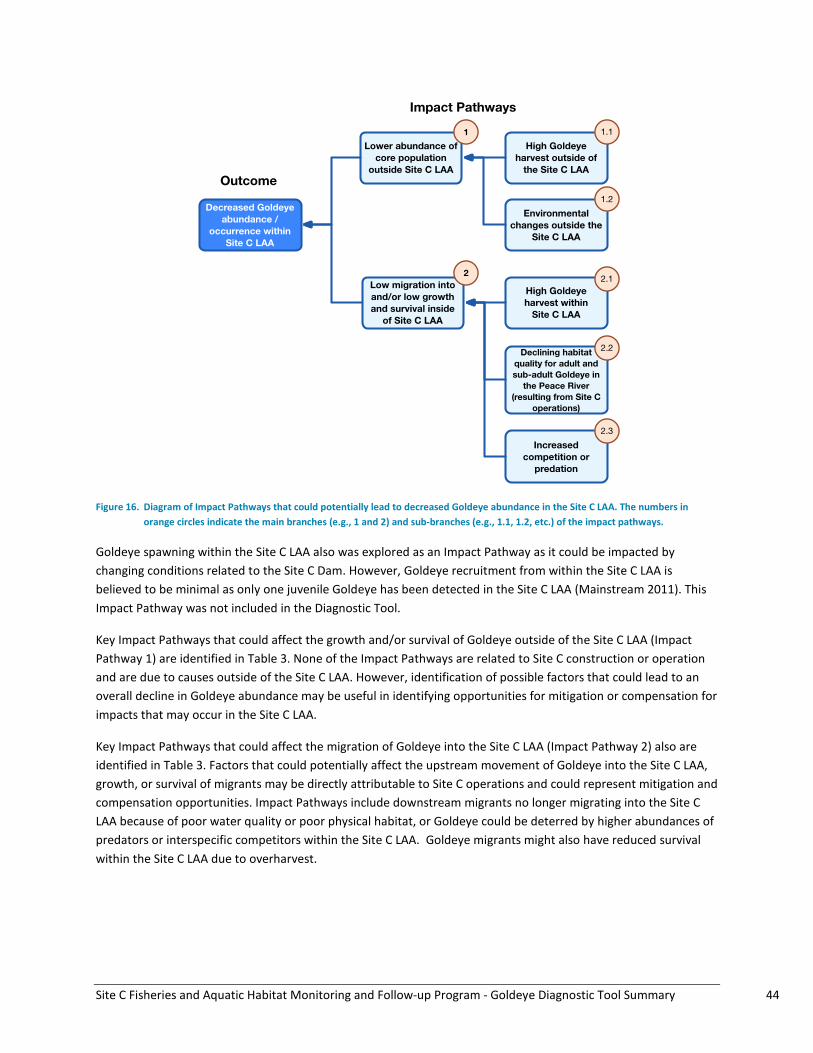
Figure 16. Diagram of Impact Pathways that could potentially lead to decreased Goldeye abundance in the Site C LAA. The numbers in orange circles indicate the main branches (e.g., 1 and 2) and sub-branches (e.g., 1.1, 1.2, etc.) of the impact pathways.
Goldeye spawning within the Site C LAA also was explored as an Impact Pathway as it could be impacted by changing conditions related to the Site C Dam. However, Goldeye recruitment from within the Site C LAA is believed to be minimal as only one juvenile Goldeye has been detected in the Site C LAA (Mainstream 2011). This Impact Pathway was not included in the Diagnostic Tool.
Key Impact Pathways that could affect the growth and/or survival of Goldeye outside of the Site C LAA (Impact Pathway 1) are identified in Table 3. None of the Impact Pathways are related to Site C construction or operation and are due to causes outside of the Site C LAA. However, identification of possible factors that could lead to an overall decline in Goldeye abundance may be useful in identifying opportunities for mitigation or compensation for impacts that may occur in the Site C LAA.
Key Impact Pathways that could affect the migration of Goldeye into the Site C LAA (Impact Pathway 2) also are identified in Table 3. Factors that could potentially affect the upstream movement of Goldeye into the Site C LAA, growth, or survival of migrants may be directly attributable to Site C operations and could represent mitigation and compensation opportunities. Impact Pathways include downstream migrants no longer migrating into the Site C LAA because of poor water quality or poor physical habitat, or Goldeye could be deterred by higher abundances of predators or interspecific competitors within the Site C LAA. Goldeye migrants might also have reduced survival within the Site C LAA due to overharvest.
Site C Fisheries and Aquatic Habitat Monitoring and Follow-up Program - Goldeye Diagnostic Tool Summary 44
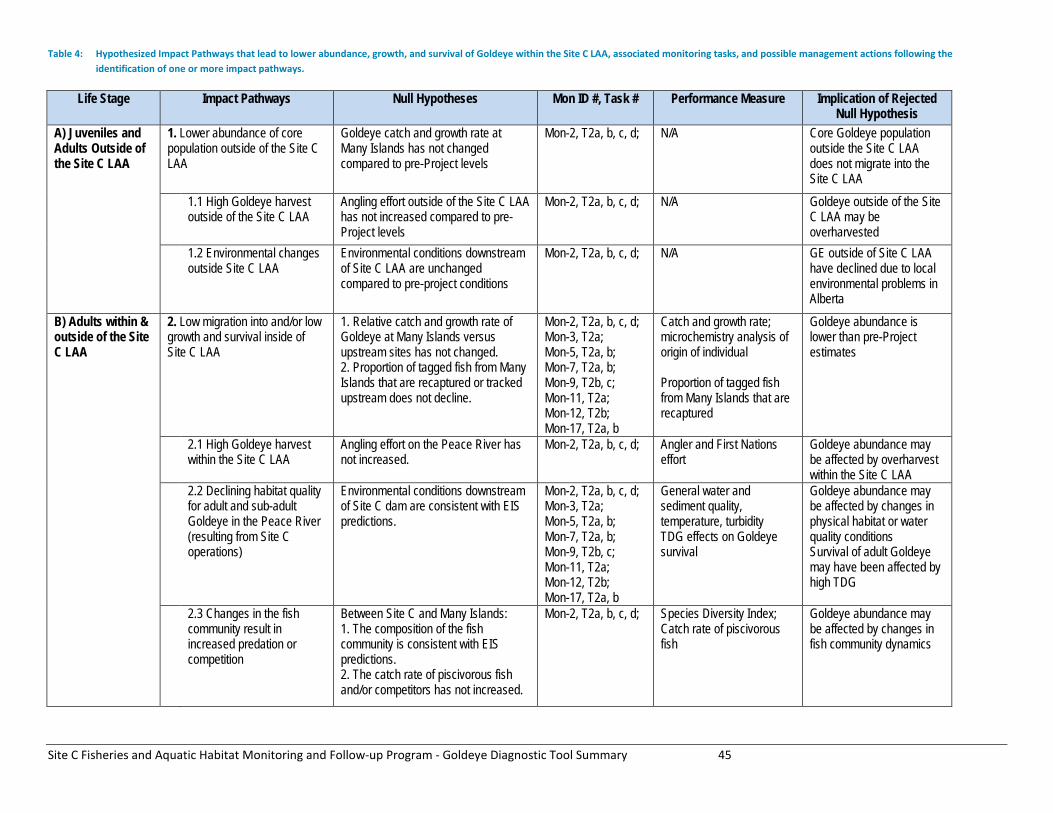
Table 4: Hypothesized Impact Pathways that lead to lower abundance, growth, and survival of Goldeye within the Site C LAA, associated monitoring tasks, and possible management actions following the identification of one or more impact pathways.
Life Stage Impact Pathways Null Hypotheses Mon ID #, Task # Performance Measure Implication of Rejected Null Hypothesis
A) Juveniles and Adults Outside of the Site C LAA
1. Lower abundance of core population outside of the Site C LAA
Goldeye catch and growth rate at Many Islands has not changed compared to pre-Project levels
Mon-2, T2a, b, c, d; N/A Core Goldeye population outside the Site C LAA does not migrate into the Site C LAA
1.1 High Goldeye harvest outside of the Site C LAA
Angling effort outside of the Site C LAA has not increased compared to pre-Project levels
Mon-2, T2a, b, c, d; N/A Goldeye outside of the Site C LAA may be overharvested
1.2 Environmental changes outside Site C LAA
Environmental conditions downstream of Site C LAA are unchanged compared to pre-project conditions
Mon-2, T2a, b, c, d; N/A GE outside of Site C LAA have declined due to local environmental problems in Alberta
B) Adults within & outside of the Site C LAA
2. Low migration into and/or low growth and survival inside of Site C LAA
1. Relative catch and growth rate of Goldeye at Many Islands versus upstream sites has not changed. 2. Proportion of tagged fish from Many Islands that are recaptured or tracked upstream does not decline.
Mon-2, T2a, b, c, d; Mon-3, T2a; Mon-5, T2a, b; Mon-7, T2a, b; Mon-9, T2b, c; Mon-11, T2a; Mon-12, T2b; Mon-17, T2a, b
Catch and growth rate; microchemistry analysis of origin of individual Proportion of tagged fish from Many Islands that are recaptured
Goldeye abundance is lower than pre-Project estimates
2.1 High Goldeye harvest within the Site C LAA
Angling effort on the Peace River has not increased.
Mon-2, T2a, b, c, d; Angler and First Nations effort
Goldeye abundance may be affected by overharvest within the Site C LAA
2.2 Declining habitat quality for adult and sub-adult Goldeye in the Peace River (resulting from Site C operations)
Environmental conditions downstream of Site C dam are consistent with EIS predictions.
Mon-2, T2a, b, c, d; Mon-3, T2a; Mon-5, T2a, b; Mon-7, T2a, b; Mon-9, T2b, c; Mon-11, T2a; Mon-12, T2b; Mon-17, T2a, b
General water and sediment quality, temperature, turbidity TDG effects on Goldeye survival
Goldeye abundance may be affected by changes in physical habitat or water quality conditions Survival of adult Goldeye may have been affected by high TDG
2.3 Changes in the fish community result in increased predation or competition
Between Site C and Many Islands: 1. The composition of the fish community is consistent with EIS predictions. 2. The catch rate of piscivorous fish and/or competitors has not increased.
Mon-2, T2a, b, c, d; Species Diversity Index; Catch rate of piscivorous fish
Goldeye abundance may be affected by changes in fish community dynamics
Site C Fisheries and Aquatic Habitat Monitoring and Follow-up Program - Goldeye Diagnostic Tool Summary 45

5.5 EVALUATION OF MONITORING PLAN NEEDS
Site C Monitoring Programs and associated tasks were assessed in terms of their relevance to Goldeye biology to evaluate the proposed Site C FAHMFP. Eight monitoring programs and 15 associated tasks are relevant to Goldeye monitoring questions (Table 3). Importantly, Mon-2, T2a will extend the Large Fish Indexing Program to the Many Islands area in Alberta, which will cover a larger proportion of the Goldeye migratory range, increasing the amount of data available for this species. This will provide a means of monitoring Goldeye abundance within the Site C LAA, which will be supplemented by creel survey information (Mon-2, T2c). Environmental conditions will be monitored by Mon-7 and Mon-9. Monitoring environmental parameters will help diagnose causes of declines, should a decline be detected.
The Large Fish Indexing Program is tentatively scheduled for the late summer period (i.e., mid-August to mid-September). This time period was selected for several reasons, including maintaining compatibility with historical datasets, increasing sampling efficiency by sampling when turbidity is low, and reducing negative impacts to Bull Trout by sampling when adults are not present in the Peace River mainstem (i.e., when they are spawning in select tributaries). Goldeye generally migrate into the Site C LAA during the spring as water turbidity increases. These individuals migrate downstream out of the Site C LAA over the summer as water turbidity decreases. The proposed time period for Mon-2, T2a is near the end of the Goldeye migratory period.
If poor catch data from Construction Year 1 suggests that the Peace River Large Fish Indexing Survey will not yield sufficient data to monitor Goldeye populations in the Site C LAA, a dedicated contingent monitoring task will be implemented to monitor Goldeye. The contingent assessment will consist of boat electroshocking in the spring (i.e., mid-May to early June) near the confluences of major Peace River tributaries in Sections 7 and 822F
23, most notably the Beatton, Kiskatinaw, Alces, Pouce Coupe, and Clear rivers.
As part of the continued collection of baseline data, microchemistry analysis will be performed on stored fin rays or otoliths to determine the proportion of Goldeye originating from outside the Site C LAA (Mon-2, T2a). Baseline microchemistry analysis suggested that very few of the 25 Goldeye sampled originated from within the Site C LAA23F
24. If Goldeye abundance declines, contingent microchemistry analysis would occur during the operations phase to determine if the proportion of of Goldeye originating from outside of the Site C LAA changes.
Goldeye abundance, movement, and harvest downstream of the Site C LAA will not be directly measured. Monitoring the population downstream of the Site C LAA could help determine if a decline in Goldeye within the Site C LAA was a result of actions downstream of the Site C LAA. Although there is a risk that a Goldeye decline outside of the Site C LAA could occur, the microchemistry analysis should act as a cost-effective method for detecting this change.
5.6 POSSIBLE MANAGEMENT ACTIONS
The Impact Pathways outlined in Table 3 would not necessarily trigger a mitigation or offsetting response by BC Hydro. A decline in Goldeye abundance in the Site C LAA could be the result of a variety of causes, only some of which could relate directly to Site C operations. A separate process involving discussions with stakeholders will further develop management actions; this process has not been completed at the time of the development of this document.
23 EIS, Volume 2, Appendix O 24 EIS, Volume 2, Appendix O
Site C Fisheries and Aquatic Habitat Monitoring and Follow-up Program - Walleye Diagnostic Tool Summary 46

5.7 SUMMARY
This analysis, facilitated by the Goldeye Diagnostic Tool, suggests that monitoring proposed in the Site C FAHMFP is sufficient to detect changes to Goldeye abundance within the Site C LAA, and provides some ability to diagnose likely causes for those changes.
Site C Fisheries and Aquatic Habitat Monitoring and Follow-up Program - Walleye Diagnostic Tool Summary 47

6. WALLEYE SUMMARY
6.1 BACKGROUND
This report provides an overview of the components of the Site C Fisheries and Aquatic Habitat Monitoring and Follow-up Program (FAHMFP) designed to monitor Walleye (Sander vitreus) in the Site C Local Assessment Area (LAA).
Walleye are endemic and widely distributed in North America (McPhail 2007; Hartman 2009). Their native distribution in BC includes the Peace, Liard, and Hay rivers. Walleye were introduced into the Columbia River in Washington State and have since migrated north into BC. In BC, Walleye are listed as “yellow” under the provincial Conservation Framework, described as secure and not requiring special conservation measures. Walleye are common in turbid lakes, reservoirs, and large rivers. Adult Walleye generally feed on small fish but they are known to ingest other organisms such as amphipods, crayfish, insects, and worms. Cannibalism is common in Walleye populations and has been known to affect population structure. Walleye avoid high light intensity (e.g., daylight) when possible by remaining in dark, turbid or deep waters, generally feeding in shallow water at dawn and dusk. Some populations of Walleye are highly migratory. This species can exhibit riverine, adfluvial, or lacustrine life history types. They are broadcast spring spawners. spawning generally occurs over shallow rocky areas of rivers or windswept shallows in lakes. Newly hatched fry disperse into the upper levels of open water. In late summer, young-of-the-year move into deep water and associate with the bottom. Both sexes mature later in populations with lower growth rates but male Walleye typically mature at age-2 to age-4; female Walleye typically mature at age-3 to age-6. Once mature, Walleye generally spawn each year. Typically, mature Walleye migrate from over-wintering areas to spawning locations, followed by post-spawning migrations to summer foraging areas.
Walleye were selected as an indicator species to monitor the environmental sustainability and ecological integrity of key values in the Peace River for the following reasons (BC Government 2011):
• they are a high value target for anglers; • they are well studied within the Lower Peace River Watershed and elsewhere; • they are a representative of cool/coldwater fauna, tolerant of turbidity, and are highly migratory; and • they are representative of Great Plains origins.
Peace River Walleye engage in annual migrations, which are described in the following summary from the Site C EIS:
“Walleye undertake post-spawning feeding movements in the Peace River from spawning areas in the Beatton River, Clear River, and Pouce Coupe River to as far upstream as the Halfway River, a distance of 100 km. Some of these Walleye enter and move upstream into larger tributaries such as the Pine River, Moberly River, and Halfway River.24F
25 “
Juvenile Walleye appear to migrate to the mainstem Peace River as age-0 and age-1 individuals at lengths ranging from 50 to 200 mm fork length (FL):
“All young Walleye (Age 0 and 1) were recorded in Section 7 and Section 8 (Figure 6.4.9). Age 0 fish were recorded at and immediately downstream of the Beatton River confluence in Section 7 and immediately
25 EIS, Volume 2, Section 12.3.2.3, p. 26
Site C Fisheries and Aquatic Habitat Monitoring and Follow-up Program - Walleye Diagnostic Tool Summary 48

downstream of the Pouce Coupe River confluence in Section 8. Young Walleye were also recorded in main channel and side channel areas away from tributary confluences.”25F
26
Most Walleye appear to over-winter in the Peace River, within the LAA, downstream of Site C:
“Most Walleye that moved up the Beatton River in spring were fish that over-wintered (October-April) within the vicinity of the Beatton River mouth”26F
27
6.2 CONCEPTUAL MODEL
Walleye in the Peace River spawn in tributaries downstream of Site C and outside of the Site C LAA. Baseline microchemistry analysis suggests that most of the 40 Walleye sampled within the Site C LAA were recruited from upstream reaches tributaries to the Peace River downstream of Site C, which are adjacent to, but not within, the Site C LAA:
“The major source of recruitment for Walleye collected from the Peace River is the Beatton River watershed. Sources from this system included the mainstem Beatton River, several of its tributaries (Milligan River, Blueberry Creek, and Fish Creek), and Charlie Lake. Peace River Walleye also recruited from the Pine River watershed (mainstem Pine River and Murray River), as well as from tributaries in Alberta that included the Pouce Coupe River and Smoky River in Alberta. A portion of the sample whose source could be identified also recruited from the Peace River.27F
28”
Downstream of Site C, the EIS indicates that Walleye (and other coolwater species) are expected to persist but decline in abundance due to unfavorable habitat changes:
“Walleye, and Goldeye populations would remain downstream of the Pine River due to the regulated flow regime, cooler summer water temperatures, and the reduced sediment load during freshet. Burbot, northern pike, and Walleye may not reside in the Peace River between the Site C Dam and the Pine River confluence, but still might forage upstream of the Pine when conditions are favorable. Goldeye would migrate as far upstream as the Beatton River. Similarly, the regulated flow regime caused by operations of the Project might limit sucker and minnow populations to at least downstream of the Pine River and as far downstream as the Beatton River.
The extent of the change on all (coolwater) fish populations downstream of the Pine River would be based primarily on the degree to which Pine River and other tributary inputs (i.e., Beatton River, Kiskatinaw River, Clear River, and Pouce Coupe River) would attenuate the flow and thermal and ice regime as a result of the operations of the Project.28F
29”
Upstream of Site C, the EIS suggests that the future status of Walleye is not clear:
“It is uncertain whether Walleye would reside in the reservoir. Walleye regularly occur in the Site C reservoir section of the Peace River. Walleye would be upstream of the dam and generating station construction zone at the time of scheduled closure of the Peace River in Year 4 of construction. The resulting construction headpond would allow Walleye to remain upstream until creation of the Site C
26 EIS, Volume 2, App. O, Section 6.4.1.1, p. 158 27 EIS, Volume 2, App. O, Section 6.1.1.2, p. 129 28 EIS, Volume 2, App. O, Section 6.4.2, p. 172 29 EIS, Volume 2, Section 12.4.2, p. 48
Site C Fisheries and Aquatic Habitat Monitoring and Follow-up Program - Walleye Diagnostic Tool Summary 49

reservoir. If sufficient numbers of Walleye are present at the time of reservoir formation, a population could become established. Walleye is a species that can exploit reservoir habitats, and there would be abundant food resources. In addition, historical spawning and rearing habitats traditionally utilized by the Peace River Walleye population (i.e., Halfway River system) would be available.29F
30”
6.3 DEFINING IMPACT PATHWAYS
The Diagnostic Tool development process involved identifying Impact Pathways where a change in one or more physical, chemical, or biological factors may impact Walleye abundance. An Impact Pathway diagram (Figure 14) was created that summarizes potential causes of declining Walleye abundance in the Site C LAA. Each Impact Pathway is associated with an impact hypothesis based on the expected response of the Walleye population and its habitats, which will be monitored under the Site C FAHMFP.
The proportion of the Walleye population that spawn and rear as juveniles in tributaries that enter the Peace River above Many Islands, Alberta remains a key uncertainty in understanding changes in Walleye abundance. Most of the spawning and juvenile habitat for Walleye in these tributaries is unaffected by the Site C Project and is therefore outside the Site C LLA. To determine whether drivers of change are related to Site C, the population structure of Walleye in the Peace River within the Site C LAA will be further refined using microchemistry analysis. If further analysis confirms that the core Walleye population reproduces and rears for some time in tributary areas outside the Site C LAA, then changes in Walleye abundance may not be causally related to Site C construction and operation.
Since Walleye are not expected to be present in the Site C reservoir, the spatial scope of the Walleye diagnostic tool is limited to the downstream portion of the Site C LAA.
30 EIS, Volume 2, Section 12.4.1, p. 41
Site C Fisheries and Aquatic Habitat Monitoring and Follow-up Program - Walleye Diagnostic Tool Summary 50

Figure 17. Diagram of Impact Pathways that could potentially lead to decreased Walleye abundance in the Site C LAA. The numbers in orange circles indicate the main branches (e.g., 1 and 2) and sub-branches (e.g., 1.1, 1.2, etc.) of the Impact Pathways. The pathways under branch 2 involve both direct and indirect mortality that can be detected using monitoring data collected under the Site C FAHMFP. The Site C LAA includes the Peace River mainstem downstream of Site C to the Many Islands area in Alberta, and tributary confluences along the mainstem downstream of Site C. The upper reaches of tributaries downstream of Site C are not included in the Site C LAA.
Key Impact Pathways that could potentially affect Walleye recruitment are identified in Table 3. Decreased recruitment from outside the Site C LAA could be the result of factors unrelated to Site C. For example, local habitat impacts in Alberta (e.g., pollution, sediment runoff, etc.) or high harvest rates outside the Site C LAA could lead to short- or long-term impacts to Walleye populations within the Site C LAA. Such influences would be beyond the influence of Site C and outside BC Hydro’s ability to control. In contrast, other issues may be directly or indirectly related to Site C (e.g., poor habitat/water quality for juvenile Walleye, high predation rates within the
Site C Fisheries and Aquatic Habitat Monitoring and Follow-up Program - Walleye Diagnostic Tool Summary 51

Site C LAA). As such, identifying Impact Pathways to explain changes would be important for informing mitigation and/or offsetting options for BC Hydro.
Key Impact Pathways that could increase mortality rates for adult Walleye within the Site C LAA are also identified in Table 3. These factors may be directly attributable to Site C and understanding causes of change could inform mitigation and/or offsetting strategies. These potential Impact Pathways include high Walleye harvest in the BC portion of the Peace River, high total dissolved gas (TDG), poor physical habitat or water quality, reduced prey abundance, interaction with competitor species, and local environmental impacts that are unrelated to Site C.
Site C Fisheries and Aquatic Habitat Monitoring and Follow-up Program - Walleye Diagnostic Tool Summary 52

Table 5. Hypothesized Impact Pathways that could lead to lower abundance, growth, or survival of Walleye within the Site C LAA, associated monitoring tasks, and performance measures following the identification of one or more Impact Pathways.
Life Stage Impact Pathways Null Hypotheses MON ID#, Task # Performance Measure
Juvenile and adult Walleye outside of the Site C LAA
1. Decreased recruitment from outside of Site C LAA
Recruitment of Walleye from outside the Site C LAA has not changed compared to pre-Project levels
Mon-2, T2a,b,c,d,e;
Catch and the origin of individuals through microchemistry analysis.
1.1 Declining habitat quality in tributaries unrelated to Site C
The rate/extent of local disturbances (e.g. pollution, sediment inputs, etc.) within tributaries have not changed compared to pre-Project levels
Mon-2, T2a,b,c,d,e;
N/A
1.2 High Walleye harvest outside of Site C LAA
Harvest of Walleye outside of the Site C LAA has not changed compared to pre-Project levels
Mon-2, T2a,b,c,d,e;
N/A
1.3 Predation on juvenile Walleye
Rates of predation of juvenile Walleye outside of the Site C LAA have not changed compared to pre-Project levels
Mon-2, T2a,b,c,d,e;
N/A
Adult Walleye within Site C LAA
2. Low migration into and/or low growth and survival inside the Site C LAA
Adult mortality and migration within the Site C LAA has not changed compared to pre-Project levels
Mon-1a, T2a; Mon-2, T2a,b,c,d,e; Mon-3, T2a,c; Mon-5, T2a, b; Mon-7, T2a, b; Mon-8, T2a, b, c; Mon-9, T2a, b, c; Mon-11, T2a; Mon-12, T2b; Mon-17, T2a, b
Catch and growth rate; microchemistry analysis of origin of individual; Proportion of PIT tagged fish from Many Islands that are recaptured
2.1 High Walleye harvest within the Site C LAA
Angling effort on the Peace River has not increased compared to pre-Project levels
Mon-2, T2a,b,c,d,e; Angler and First Nations effort
2.2 Declining habitat quality for adult and sub-adult Walleye in the Peace River (resulting from Site C operations)
Environmental conditions downstream of Site C are consistent with EIS predictions.
Mon-2, T2a,b,c,d,e; Mon-3, T2a,c; Mon-5, T2a, b; Mon-7, T2a, b;
Water and sediment quality, temperature, turbidity, and/or TDG effects on Walleye survival
Site C Fisheries and Aquatic Habitat Monitoring and Follow-up Program - Walleye Diagnostic Tool Summary 53

Life Stage Impact Pathways Null Hypotheses MON ID#, Task # Performance Measure
Mon-8, T2a, b, c; Mon-9, T2a, b, c; Mon-11, T2a; Mon-12, T2b; Mon-17, T2a, b
2.3 Declining habitat quality for adult and sub-adult Walleye in the Peace River (unrelated to Site C)
Local disturbances (e.g., pollution, sediment inputs) to the Peace mainstem have not changed compared to pre-Project conditions
Mon-2, T2a,b,c,d,e; Mon-3, T2a,c; Mon-5, T2a, b; Mon-7, T2a, b; Mon-8, T2a, b, c; Mon-9, T2a, b, c; Mon-11, T2a;
Water and sediment quality, temperature, turbidity, and/or TDG effects on Walleye survival
2.4 Increased competition with other fish species within Site C LAA
The composition of the fish community is consistent with EIS predictions.
Mon-2, T2a,b,c,d,e; Relative abundance of fish species
2.5 Reduced food available from upstream sources
Food resources within the Site C LAA are consistent with EIS predictions
Mon-1a, T2a; Mon-2, T2a,b,c,d,e;
Abundance of small fish
2.6 High daily flow fluctuations in lower tributary confluences leading to stranding
Stranding is an insignificant problem at tributary confluences Mon-12, T2b Number of Walleye stranded
Site C Fisheries and Aquatic Habitat Monitoring and Follow-up Program - Walleye Diagnostic Tool Summary 54

6.4 EVALUATION OF MONITORING PROGRAM NEEDS
Monitoring programs and associated tasks were assessed in terms of their relevance to Walleye biology to evaluate the comprehensiveness and rigour of the currently proposed Site C Fisheries and Aquatic Habitat Monitoring and Follow-up Program (Compass and ESSA 2015). Ten monitoring programs and twenty-two associated tasks are relevant to Walleye monitoring questions (Table 3).
The Site C FAHMFP addresses key uncertainties for Walleye within the Site C LAA, while providing information on trends in Walleye abundance and physical habitat. Within the Site C LAA, the Peace River Fish Community Monitoring Program (Mon-2) Large Fish Indexing Survey (Task 2a) will sample the Peace River from Site C downstream to the Many Islands area in Alberta, thereby sampling the entire Walleye summer distribution within the Site C LAA. Currently, the power to detect a change in Walleye abundance is hindered by limited baseline data (3 years of survey data) (Ma et al. 2014). Proposed monitoring will provide an index of relative adult Walleye abundance in the Peace River portion of the Site C LAA over time, which will be supplemented by creel survey information (Mon-2, T2c). Environmental conditions will be monitored by Mon-7 and Mon-9 in the Reservoir and the Peace River downstream of Site C, respectively. Monitoring environmental parameters will help diagnose causes of declines, should declines be detected, and can be used to identify causal mechanisms with assistance of the Diagnostic Tool. Data regarding juvenile fish habitats in the Beatton River are limited and there are no plans to monitor the upper reaches of the Beatton River under the Site C FAHMFP. Monitoring of adult habitats outside of the Site C LAA is not planned within the Site C FAHMFP. Mon-2, T2a includes PIT tagging and recapturing that will provide some evidence of the proportion of Walleye that spawn outside the Site C LAA. As part of the continued collection of baseline data, microchemistry analysis will be performed on stored fin rays or otoliths to determine the proportion of Walleye that originate outside the Site C LAA (Mon-2, T2a). Baseline microchemistry analyses suggest that the major source of recruitment for Walleye in the Site C LAA were tributaries to the Peace River downstream of Site C and outside of the Site C LAA 30F
31. If Walleye abundance declines, contingent analyses could occur to determine changes to the proportion of Walleye that originate from outside of the Site C LAA.
6.5 POSSIBLE MANAGEMENT ACTIONS
The Impact Pathways outlined in Table 3 would not necessarily trigger a mitigation or offsetting response by BC Hydro. A decline in Walleye abundance in the Site C LAA could be the result of a variety of causes, only some of which could relate directly to Site C operations. A separate process involving discussions with stakeholders will further develop management actions; this process has not been completed at the time of the development of this document.
31 EIS, Volume 2, Appendix O
Site C Fisheries and Aquatic Habitat Monitoring and Follow-up Program - Walleye Diagnostic Tool Summary 55

6.6 SUMMARY
This analysis, facilitated by the Walleye Diagnostic Tool, suggests that monitoring proposed in the Site C FAHMFP to monitor Walleye abundance within the Site C LAA provides some ability to diagnose likely causes for observed changes. Monitoring of spawning and juvenile rearing habitat in Peace River tributaries and in the Peace River downstream of the Many Islands area in Alberta is not proposed; this limits the tools ability to diagnose potential mechanisms that are not causally linked to Site C.
Site C Fisheries and Aquatic Habitat Monitoring and Follow-up Program - Walleye Diagnostic Tool Summary 56

7. RAINBOW TROUT SUMMARY
7.1 INTRODUCTION
This report provides an overview of the components of the Site C Fisheries and Aquatic Habitat Monitoring and Follow-up Program (FAHMFP) designed to monitor Rainbow Trout (Oncorhynchus mykiss) in the Site C Local Assessment Area (LAA). The objective of monitoring is to determine whether mitigation measures detailed in the EIS have been sufficient to maintain or enhance Rainbow Trout population status.
7.2 BACKGROUND
Rainbow Trout are an important indicator species for assessing the effects of the Site C Clean Energy Project because they are: a high value target for anglers, relatively well-studied within the lower Peace River (LPR) and elsewhere, representative of cool/coldwater fauna, not tolerant of turbidity, and are representative of Pacific and Beringia origins31F
32. Within the LLA, Rainbow Trout are present in the Peace River and many of its tributaries but are much less common downstream of Site C. With respect to passage sensitivity, agency policy states that “Rainbow Trout were considered by MFLNRO and MOE to have uncertainty as to their degree of sensitivity to fish passage technology alternatives, yet remained a high priority for assessment.”32F
33
In the Site C reservoir, Rainbow Trout are expected to be an important component of the fish community and angler catches. In Dinosaur Reservoir, Rainbow Trout were the second most common species in gillnet catches (Euchner 2011) and were the most common species captured by anglers (Cowie 2004). Rainbow Trout are a generalist species and occupy a wide range of habitats but typically spawn in smaller streams (McPhail 2007). There are three potential sources of Rainbow Trout recruitment to the current Peace River and future Site C reservoir: known juvenile rearing locations in Maurice, Lynx, and Farrell creeks, entrainment through Peace Canyon Dam and tributaries to the Halfway River.33F
34
The monitoring program for Rainbow Trout is based on clear performance measures for meeting management objectives for conservation at the species level (Government of BC 2008):
1. “Species distribution represents the broadest scale, and indicates the need to maintain a sufficiently large distribution to ensure healthy and viable populations that are resilient to natural perturbations. This includes maintaining or enhancing specific fisheries at traditional locations.
2. Population structure refers to the meta-population structure of a species within the LPR, and is intended to measure the structure and function and interactions among sub-populations. The measure is aimed at assessing population structure at the sub-population level, including dispersal and exchange among sub-populations, and to examine possible project-related changes.
32 EIS Vol. 2, App. O, Section 5.1.1, p65 33 EIS, Appendix Q2, Section 2.1.2, p19 34 EIS Appendix O, Section 6.4.1.1, p154
Site C Fisheries and Aquatic Habitat Monitoring and Follow-up Program – Rainbow Trout Diagnostic Tool Summary 57

3. The abundance/biomass measure assesses the status of populations relative to conservation and use targets for a species’ abundance in the LPR.
4. The size and age distribution measure assesses a population’s status relative to specific targets for size and age. “34F
35
Sustainable use measures are stated in terms of First Nations harvest (to be determined) and recreational fishery objective:
“Optimize recreational angling opportunities, participation and local benefits.— This sub-objective reflects the higher-level MOE objective related to resource use. The sub-objective addresses three topics: angler effort, regional catch rates and local participation rates. The primary measures in support of the sub-objectives are fairly typical for use of the fisheries resource: angler days, catch per unit effort (CPUE), and number of fishing licences sold in the region. The proposed targets in support of the sub-objectives are derived from MOE fisheries management analyses described in Johnston et al. (2002a, 2002b).”35F
36
In addition to the performance measures identified by management agencies, the monitoring plan provides supplementary information that will be used in diagnosing the cause of any change in status that is observed under the monitoring plan described in the EIS.
In the Peace River LAA, Rainbow Trout are at the eastern edge of their range. Observations of Rainbow Trout and Bull Trout in this area (Figure 18) are consistent with the habitat segregation observed in southern BC, where Bull Trout are in colder headwaters and Rainbow Trout are in warmer, lower elevation streams (Parkinson et al. 2016) but neither species is found in low gradient, turbid streams such as the Cameron, Beatton and Moberly. Both Bull Trout and Rainbow Trout can make extensive migrations in fluvial systems but the inter-specific segregation is most pronounced for juvenile fish.
35 Government of BC 2008, Section 4.2.2 36 Government of BC 2008, Section 4.2.2
Site C Fisheries and Aquatic Habitat Monitoring and Follow-up Program – Rainbow Trout Diagnostic Tool Summary 58

Figure 18. Observed occurrences of Rainbow Trout (red), Bull Trout (blue), and Arctic Grayling (grey) in the Peace River and adjacent drainages.
7.3 CONCEPTUAL MODEL
Rainbow Trout are assumed to reproduce in warmer tributaries of the Peace River and this pattern will likely persist in the future reservoir environment. Migrations between adult and juvenile habitat are common in freshwater salmonids, including Rainbow Trout (Northcote 1997). In the Peace River,
“Age 0 fish were recorded in fall suggesting that fish rear in tributaries before entering the Peace River. Age 0 and Age 1 Rainbow Trout were encountered most frequently upstream of the Site C dam location (Figure 6.4.5). Most fish were recorded at sites in Sections 1A, 1, 2, and 3, with a limited number of fish occurring at sites in Sections 5 and 7. The presence of young fish in Sections 1 and 2 correspond with tributaries that provide spawning and rearing habitats (Maurice Creek, Lynx Creek, and possibly Farrell Creek). The cluster of sites containing young fish in Section 3, suggests that Rainbow Trout may recruit from the Halfway River or disperse from upstream areas of the Peace River.”36F
37
Rainbow Trout densities are very low in turbid, low-gradient streams including the Cameron, Moberly and Beatton watersheds.
37 EIS Vol 2, App. O, Section 6.4.1.1 p154
Site C Fisheries and Aquatic Habitat Monitoring and Follow-up Program – Rainbow Trout Diagnostic Tool Summary 59

Although the general pattern of Rainbow Trout movements is probably correct, there are many streams that may be potential sources of recruitment for the meta-population of Peace River Rainbow Trout (
Figure 19). There is substantial uncertainty concerning the relative importance of these sources, which vary in quality, quantity, and connectivity of juvenile habitat. The EIS indicates that Rainbow Trout present in tributaries to the Pine River do not enter the Peace River37F
38. Otolith microchemistry data from 50 Peace River Rainbow Trout suggest that spawning and early rearing is widely dispersed and includes 12 fish (24% of sample) of unknown origin (Figure 20). As sub adults and adults, Rainbow Trout in the LAA occupy many of the larger tributaries (e.g. Halfway, Graham, Chowade) as well as the Peace River itself.
For the purpose of this document, life history stages (egg, juvenile, sub-adult, adult) are defined in terms the periods between:
- Eggs: Egg deposition to hatching
- Juvenile: Hatching to downstream migration to the Reservoir or large river, typically at 50-150 mm
- sub-Adult: End of juvenile period to the winter prior to first maturity
- Adults: End of sub-Adult period to death as an adult (including repeat spawning)
After Project completion, the pattern of Rainbow Trout distribution and movement is not expected to change substantially, with sub-adult and adult habitat in the Peace River being replaced by potentially suitable habitat in the reservoir (Figure 21). Some spawning tributaries (Maurice, Lynx, Farrell) will be partially inundated, but these losses are minor relative to the total available habitat, assuming that tributaries of the Halfway contribute substantially to total recruitment and support the same meta-population. Although few Rainbow Trout are currently found below Site C, a low rate of entrainment through the Site C dam is expected, but the actual rate is highly uncertain.
The stock structure of Rainbow Trout in the upper Halfway River Drainage (e.g., the Chowade River, Cypress Creek), the lower Halfway River Drainage (e.g., Kobes and Colt creeks), and the Peace River mainstem is not clear. During the summer (i.e., post-spawning), large Rainbow Trout are common in the Chowade River (R.L. & L. 1995), the lower Halfway River Drainage (Diversified 1997), and the Peace River mainstem (EIS App O).
38 EIS Vol 2, Table 12.8
Site C Fisheries and Aquatic Habitat Monitoring and Follow-up Program – Rainbow Trout Diagnostic Tool Summary 60

Figure 19. Schematic diagram of the potential sources of recruitment to the Peace River Rainbow Trout meta-population prior to the operation of the Site C Clean Energy Project.
Figure 20. First year habitat of 50 Rainbow Trout captured in the mainstem Peace River, expressed as a percent of total fish used in the otolith microchemistry study (adapted from Earth Tone 2013)
0% 5% 10% 15% 20% 25%
Dinosaur Lake: Reservoir 5: Gething Ck.: Johnson Ck.
Maurice Creek: Maurice Ck.Lynx Creek: Lynx Ck.
Farrell Creek: L. FarrellHalfway R.: Cameron R.
: Chowade R.: Cypress Ck.
: Fiddes Ck.: Graham R.
: Needham Ck.: Turnoff Ck.: L. Halfway: U. Halfway
Peace River: Peace R.Unknown :
Site C Fisheries and Aquatic Habitat Monitoring and Follow-up Program – Rainbow Trout Diagnostic Tool Summary 61
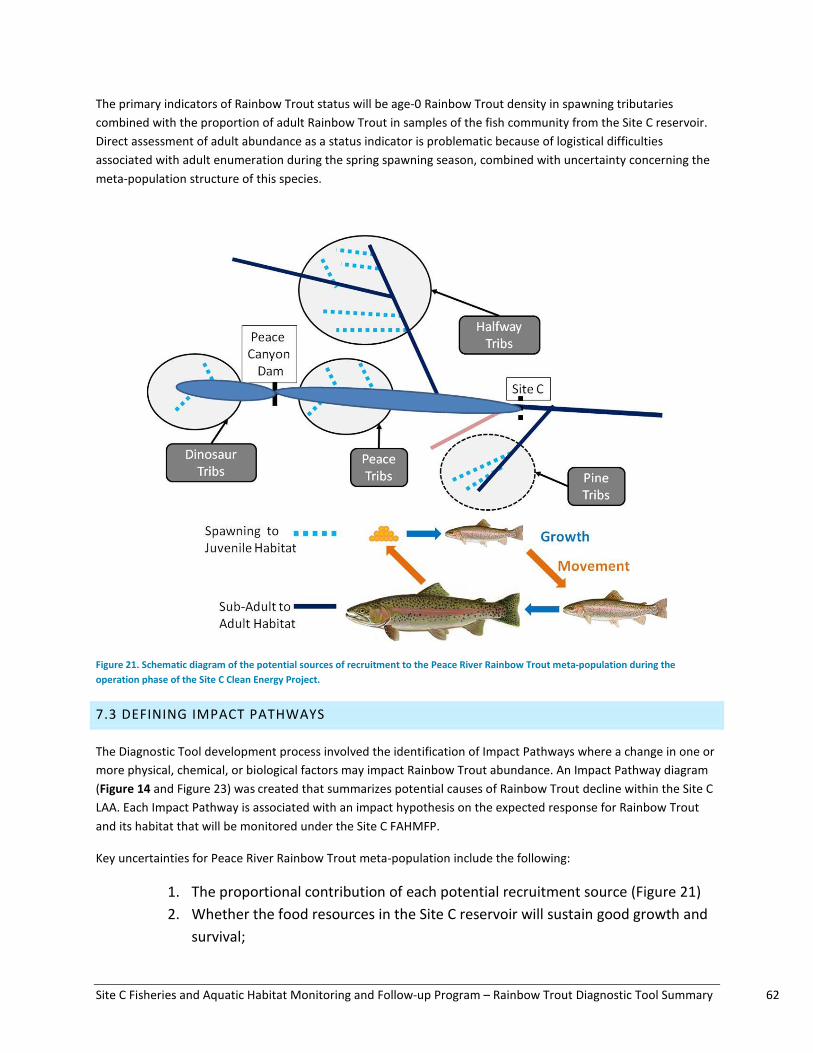
The primary indicators of Rainbow Trout status will be age-0 Rainbow Trout density in spawning tributaries combined with the proportion of adult Rainbow Trout in samples of the fish community from the Site C reservoir. Direct assessment of adult abundance as a status indicator is problematic because of logistical difficulties associated with adult enumeration during the spring spawning season, combined with uncertainty concerning the meta-population structure of this species.
Figure 21. Schematic diagram of the potential sources of recruitment to the Peace River Rainbow Trout meta-population during the operation phase of the Site C Clean Energy Project.
7.3 DEFINING IMPACT PATHWAYS
The Diagnostic Tool development process involved the identification of Impact Pathways where a change in one or more physical, chemical, or biological factors may impact Rainbow Trout abundance. An Impact Pathway diagram (Figure 14 and Figure 23) was created that summarizes potential causes of Rainbow Trout decline within the Site C LAA. Each Impact Pathway is associated with an impact hypothesis on the expected response for Rainbow Trout and its habitat that will be monitored under the Site C FAHMFP.
Key uncertainties for Peace River Rainbow Trout meta-population include the following:
1. The proportional contribution of each potential recruitment source (Figure 21) 2. Whether the food resources in the Site C reservoir will sustain good growth and
survival;
Site C Fisheries and Aquatic Habitat Monitoring and Follow-up Program – Rainbow Trout Diagnostic Tool Summary 62

3. Whether Rainbow Trout will successfully colonize the Peace River downstream of Site C;
4. Whether Rainbow Trout can be effectively moved upstream from downstream of the dam;
5. Whether overharvest will threaten the population.
Each Impact Pathway is associated with an impact hypothesis presented in Table 6 and discussed below. Each hypothesis outlined in Table 6 represents a mechanism-based, sub-hypothesis to the EIS predicted changes to Rainbow Trout. This level of detail extends beyond the EIS predictions.
Each of the bullets below corresponds to the six Rainbow Trout life history stages (below) and the corresponding impact pathways as outlined in Table 6, Figure 14 and Figure 23.
A) Egg to Juvenile Migration
Poor egg to juvenile survival and growth could result from habitat degradation in tributaries (caused by forestry, land and gas development, climate change), or loss of tributaries or rearing habitat to inundation (Maurice, Lynx, Farrell). Identification of factors that cause a decline in juveniles may be useful in identifying enhancement opportunities for mitigation or compensation for impacts at other stages in the life cycle. High densities of competitor species or high predation mortality may also lead to poor egg and/or juvenile survival.
B) Juveniles and Post-spawning adults: Downstream migration from tributaries
One impact pathway was identified that affects the downstream migration of juveniles into Site C reservoir. If reservoir habitat is unattractive and a higher than expected proportion of migrants refuse to enter the reservoir, then this may induce density-dependent reductions in growth and/or survival in riverine sub-adult and adult habitat in locations such as the lower Halfway River.
C) Sub-Adult and Adult in the Site C reservoir
Impact Pathways that could lead to poor sub-adult and adult survival in the Site C reservoir include high predation in the Site C reservoir due to high population of Lake Trout, Bull Trout, mammalian, or avian predators, or risky behaviour due to low food availability.
Low food abundance has been shown to result in behaviours that are associated with higher risks of predation in a variety of species, including some salmonids (Ahrens et al. 2012). This impact hypothesis is most applicable to juvenile fish that have lower energy demands and are vulnerable to a wider range of predators. Under this mechanism, low growth rates may not be observed if fish are able to fully compensate for lower food densities by engaging in riskier feeding behaviour. Site C reservoir is expected to be oligotrophic, but the pelagic food web is subsidized by zooplankton and fish entrained from upstream reservoirs. Rainbow Trout feed mostly on surface and benthic invertebrates and, therefore, are expected to be sensitive to low reservoir productivity.
Rainbow Trout are attractive to anglers and are therefore vulnerable to overharvest. Competition, predation and low food availability are all expected reduce resistance to overharvest (stock productivity) of Rainbow Trout in the Site C reservoir.
Site C Fisheries and Aquatic Habitat Monitoring and Follow-up Program – Rainbow Trout Diagnostic Tool Summary 63

D) Entrainment of Sub-Adults or Adults
The EIS predicts that the entrainment rate of Rainbow Trout will be low38F
39 but the monitoring program for the Peace River downstream of Site C is designed to detect the presence of Rainbow Trout from upstream locations. The mortality rate for entrained fish is size dependent and is expected to be in the range 10%-30%, given the expected size distribution of Rainbow Trout in the reservoir.
E) Sub-Adult and Adult in the Peace River downstream of Site C Dam
Impact pathways that affect Rainbow Trout growth and survival in the Peace River are similar to those in the Reservoir but sub-lethal effects of turbine passage and high TDG may also play a role. Given the prediction of low entrainment rates, downstream conditions are expected to have little impact on the meta-population that spawns in upstream tributaries.
G) Recruitment to the Peace River Downstream of Site C
In addition to entrainment from upstream populations, Rainbow Trout may also reproduce in the Peace River itself or colonize from the Pine River. Assuming that the Pine River population of Rainbow Trout remains healthy, the only impact pathway affecting colonization from the Pine River is poor migration behavior of Pine River Rainbow Trout. Impact pathways that result in poor in situ juvenile production in the Peace River include poor habitat quality, high densities of competitor species and high densities of predators.
Figure 22. Diagram of Impact Pathways that could potentially lead to decreased Rainbow Trout abundance in the Site C reservoir. The numbers in orange circles indicate the main branches (e.g., 1 and 2) and sub-branches (e.g., 1.1, 1.2, etc.) of the impact pathways.
39 EIS Vol. 2, App. Q2, Attachment A, p44,45
Site C Fisheries and Aquatic Habitat Monitoring and Follow-up Program – Rainbow Trout Diagnostic Tool Summary 64

Figure 23. Diagram of Impact Pathways (continued) that could potentially lead to decreased Rainbow Trout abundance in the Site C reservoir. The numbers in orange circles indicate the main branches (e.g., 1 and 2) and sub-branches (e.g., 1.1, 1.2, etc.) of the impact pathways.
Site C Fisheries and Aquatic Habitat Monitoring and Follow-up Program – Rainbow Trout Diagnostic Tool Summary 65

Table 6. Hypothesized impact pathways that lead to lower abundance of Rainbow Trout abundance in the Site C reservoir, including data collection and null hypotheses associated with each impact pathway. Null hypotheses are phrased in terms of their utility in demonstrating each impact pathway as a factor in the overall species decline. For Rainbow Trout, the Task numbers only include the task that is directly involved in the estimation of the Indicator. Deficiencies in our existing understanding of Rainbow Trout biology and uncertainties in the post-dam biology make it difficult to anticipate the details of the analysis model for the post-dam situation. As a result, the detailed use of ancillary information is difficult to specify.
Impact Pathways Null Hypotheses Mon ID #, Task #
Mon Program Title Task Title Performance Measure
A) Eggs to Juveniles: Migrant survival and growth in the tributaries
1. Poor egg to juvenile growth and survival in tributaries
The production of juvenile Rainbow Trout migrants is the same or higher than
pre-Project level
Mon 1b, Task 2c
Reservoir Tributaries Fish Community and Spawning
Reservoir and Tributaries Fish Population Indexing
Relative density in RB rearing tributaries
1.1 Habitat degradation in tributaries
Indicators of juvenile habitat quality and
quantity are the same or greater than pre-Project
values
Mon 18, Task 2c
Tributary mitigation opportunities evaluation
program
Identification of additional candidate watersheds
Watershed condition
1.1.1 Forestry Mon 18, Task 2c
Tributary mitigation opportunities evaluation
program
Identification of additional candidate watersheds
1.1.2 Land and gas development
Mon 18, Task 2c
Tributary mitigation opportunities evaluation
program
Identification of additional candidate watersheds
1.1.3 Climate change
Mon 8, Task 2b
Reservoir Water and Sediment Quality Monitoring
Program
Temperature Monitoring Reservoir temperature as index of local climate
Site C Fisheries and Aquatic Habitat Monitoring and Follow-up Program – Rainbow Trout Diagnostic Tool Summary 66

N/A Monitoring conducted outside of Site C FAHMFP
Land and water temperatures
1.1.4 Loss of tributaries/ rearing habitat to inundation
Mon 1b, Task 2c
Reservoir Tributaries Fish Community and Spawning
Reservoir and Tributaries Fish Population Indexing
Relative density in RB rearing tributaries
B) Juveniles and Post-spawning adults: Downstream migration from tributaries into Site C reservoir
2. Juveniles and/or adults residualize in the tributaries (fail to migrate into Site C reservoir)
The proportion of sub-adult and adult Rainbow Trout
that remain in the Halfway River watershed is the
same or lower than pre-Project levels
Mon 1b, Task 2c
Reservoir Tributaries Fish Community and Spawning
Reservoir and Tributaries Fish Population Indexing
Age structure of Rainbow Trout
Growth of sub-adult and adult Rainbow Trout in the Halfway River is the same or greater than pre-Project
levels
Mon 1b, Task 2c
Reservoir Tributaries Fish Community and Spawning
Reservoir and Tributaries Fish Population Indexing
Growth rate of sub-adult and adult Rainbow Trout
C) Juveniles to Adults: Survival and growth in Site C reservoir
3. Poor juvenile to adult survival in Site C reservoir
Growth and/or survival sub-adults and adults are the same or higher than pre-
Mon 1a, Task 2a
Reservoir Fish Community Site C Reservoir Hydroacoustic, Trawl, and
Gillnet Survey
RB abundance and spatial distribution
Site C Fisheries and Aquatic Habitat Monitoring and Follow-up Program – Rainbow Trout Diagnostic Tool Summary 67

Project levels Mon 1b, Task 2c
Reservoir Tributaries Fish Community and Spawning
Reservoir and Tributaries Fish Population Indexing
Survival of juveniles to adults (PIT tag as juveniles, detected in
Halfway River)
Mon 1b, Task 2d
Reservoir Tributaries Fish Community and Spawning
Site C Sonic Telemetry Array System
RB movement and survival in Site C reservoir
Mon 14, Task 2
Site C Trap and Haul Fish Release Location Monitoring
Program
Data collection - telemetry tracking
3.1 Low growth leads to risky behavior Risky behavior is measured indirectly in the following sub-tasks
3.1.1 Poor proximity of foraging habitat to refuge habitat
Foraging and refuge habitat as indicated by HSI are in
close proximity
Mon 16, Task 2a
Reservoir Constructed Shallow Water Habitat Areas
Sediment and Vegetation Monitoring Program
Substrate monitoring Reservoir shoreline composition and structure
NA FAHMFP RB trout habitat enhancement in the
reservoir
Location and amount of habitat provided; Effectiveness
monitoring utilization of enhanced habitat
Mon 16, Task 2b
Reservoir Constructed Shallow Water Habitat Areas
Sediment and Vegetation Monitoring Program
Aquatic plant monitoring Aquatic plant colonization
Site C Fisheries and Aquatic Habitat Monitoring and Follow-up Program – Rainbow Trout Diagnostic Tool Summary 68

3.1.2 Low productivity Indicators of reservoir productivity are same or
higher than predicted in the EIS
Mon 6, Task 2a
Reservoir Fish Food Organisms Monitoring
Program
Biomass and Production of Fish Food Organisms
Zooplankton and benthic invertebrate biomass production;
Water residence time
Mon 6, Task 2b
Reservoir Fish Food Organisms Monitoring
Program
Ecosystem Attributes Nutrients, algal production, temperature and oxygen profiles
Mon 8, Task 2a
Reservoir Water and Sediment Quality Monitoring
Program
General Water and Sediment Quality
Monitoring
pH, nitrogen, phosphorus, etc.
3.2 High predation in Site C reservoir
Predation rates of sub-adults and adults are the same or lower than pre-
Project levels
Mon 1a, Task 2a
Reservoir Fish Community Site C Reservoir Hydroacoustic, Trawl, and
Gillnet Survey
BT, LT abundance and spatial distribution
Mon 1a, Task 2b
Reservoir Fish Community Site C Reservoir Summer Profundal Index Netting
Survey
BT, LT catch rate
Mon 1b, Task 2b
Reservoir Tributaries Fish Community and Spawning
Peace River Bull Trout Spawning Assessment
BT spawning abundance
Mon 1b, Task 2c
Reservoir Tributaries Fish Community and Spawning
Reservoir and Tributaries Fish Population Indexing
Juvenile BT density in the upper Halfway River drainage
Mon 6, Task 2a
Reservoir Fish Food Organisms Monitoring
Program
Biomass and Production of Fish Food Organisms
stomach contents of piscivores
Site C Fisheries and Aquatic Habitat Monitoring and Follow-up Program – Rainbow Trout Diagnostic Tool Summary 69
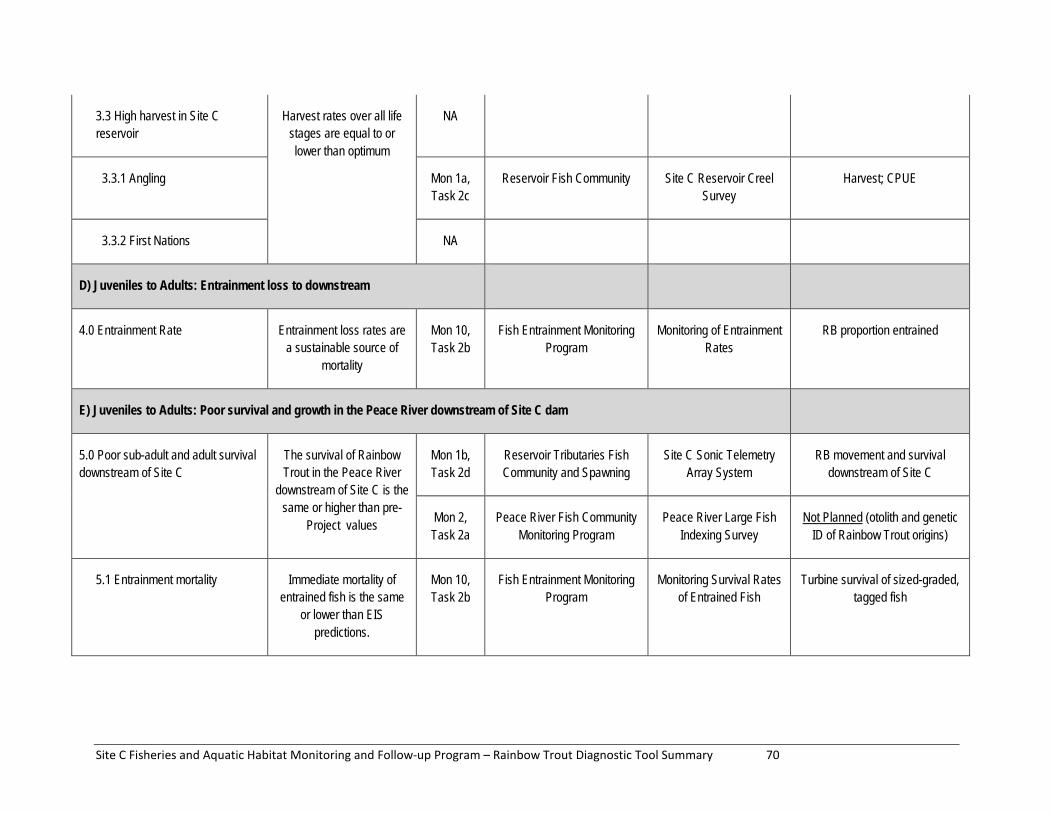
3.3 High harvest in Site C reservoir
Harvest rates over all life stages are equal to or lower than optimum
NA
3.3.1 Angling Mon 1a, Task 2c
Reservoir Fish Community Site C Reservoir Creel Survey
Harvest; CPUE
3.3.2 First Nations NA
D) Juveniles to Adults: Entrainment loss to downstream
4.0 Entrainment Rate Entrainment loss rates are a sustainable source of
mortality
Mon 10, Task 2b
Fish Entrainment Monitoring Program
Monitoring of Entrainment Rates
RB proportion entrained
E) Juveniles to Adults: Poor survival and growth in the Peace River downstream of Site C dam
5.0 Poor sub-adult and adult survival downstream of Site C
The survival of Rainbow Trout in the Peace River
downstream of Site C is the same or higher than pre-
Project values
Mon 1b, Task 2d
Reservoir Tributaries Fish Community and Spawning
Site C Sonic Telemetry Array System
RB movement and survival downstream of Site C
Mon 2, Task 2a
Peace River Fish Community Monitoring Program
Peace River Large Fish Indexing Survey
Not Planned (otolith and genetic ID of Rainbow Trout origins)
5.1 Entrainment mortality Immediate mortality of entrained fish is the same
or lower than EIS predictions.
Mon 10, Task 2b
Fish Entrainment Monitoring Program
Monitoring Survival Rates of Entrained Fish
Turbine survival of sized-graded, tagged fish
Site C Fisheries and Aquatic Habitat Monitoring and Follow-up Program – Rainbow Trout Diagnostic Tool Summary 70

5.2 High downstream mortality Mortality rates of Rainbow Trout that survive turbine
passage are similar to long-term residents of the Peace
River downstream of the Site C Dam
Mon 2, Task 2a
Peace River Fish Community Monitoring Program
Peace River Large Fish Indexing Survey
RB age and size structure
Mon 2, Task 2b
Peace River Fish Community Monitoring Program
Peace River Fish Composition and
Abundance Survey
RB abundance
5.3 Risky behaviour due to low food availability
Risky behavior is measured indirectly in the following sub-tasks
5.3.1 Low productivity
Growth and/or survival for adults and sub-adults is the
same or higher than pre-Project levels
Mon 7, Task 2a
Peace River Fish Food Organisms Monitoring
Program
Biomass and Production of Fish Food Organisms
Benthic invertebrate biomass and production
Mon 7, Task 2b
Peace River Fish Food Organisms Monitoring
Program
Ecosystem Attributes Habitat area, algal biomass and composition
Mon 9, Task 2a.
2b, 2c
Peace River Water and Sediment Quality Monitoring
Program
General Water and Sediment Quality,
Temperature, Turbidity Monitoring
pH, nitrogen, phosphorus, etc., temperature, turbidity, suspended
solids concentrations
5.3.2 Competition Densities of competitor species are the same or
less that pre-Project values
Mon 2, Task 2a
Peace River Fish Community Monitoring Program
Peace River Large Fish Indexing Survey
Fish density and community composition
Mon 2, Task 2b
Peace River Fish Community Monitoring Program
Peace River Fish Composition and
Abundance Survey
Site C Fisheries and Aquatic Habitat Monitoring and Follow-up Program – Rainbow Trout Diagnostic Tool Summary 71

5.3.3 Poor proximity of foraging habitat to refuge habitat
Foraging and refuge habitat as indicated by HSI are in
close proximity
Mon 2, Task 2d
Peace River Fish Community Monitoring Program
Offset Effectiveness Monitoring Program
Location and amount of habitat provided; Effectiveness
monitoring utilization of enhanced habitat
Mon 3, Task 2a
Peace River Physical Habitat Monitoring Program
Channel Morphology Location and amount of habitat available;
Mon 2, Task 2b
Peace River Fish Community Monitoring Program
Peace River Fish Composition and
Abundance Survey
Utilization of available habitat;
5.4 High predation downstream of Site C
Predator densities are the same or less than pre-
Project values
Mon 2, Task 2a
Peace River Fish Community Monitoring Program
Peace River Large Fish Indexing Survey
Piscivore abundance and distribution, and stomach
contents
5.5 High harvest downstream of Site C
Harvest rates over all life stages are equal to or lower than optimum
Mon 2, Task 2c
Peace River Fish Community Monitoring Program
Peace River Creel Survey Harvest; CPUE
5.5.1 Angling Mon 2, Task 2c
Peace River Fish Community Monitoring Program
5.5.2 First Nations N/A
5.6 Gas Bubble Disease TDG rates are not high enough to cause significant
mortality
Mon 11, Task 2a
TDG Monitoring Program TDG monitoring TDG >115%
Mon 11, Task 2b
TDG Monitoring Program TDG effects on fish Gas Bubble Disease incidence
Site C Fisheries and Aquatic Habitat Monitoring and Follow-up Program – Rainbow Trout Diagnostic Tool Summary 72

F) Mature Adults: Upstream passage
6.0 Poor upstream passage Upstream passage is sufficient to maintain pre project densities in the
Peace River
Mon 13, Task 2a
Site C Fishway Effectiveness Monitoring Program
Site C Tailrace and Fishway Telemetry
Assessment
Proportion of RB that move to the base of the dam
Mon 13, Task 2b
Site C Fishway Effectiveness Monitoring Program
Attraction Efficiency and Entrance Accessibility
Assessment
Proportion of RB that move to the base of the dam
G) Poor Recruitment From Downstream Sources
7 Poor non-Reservoir recruitment
7.1 Pine River Rainbow Trout do not colonize the Peace
Rainbow Trout do not recruit from downstream
tributaries
Mon 2, Task 2a
Peace River Fish Community Monitoring Program
Peace River Large Fish Indexing Survey
Not Planned (otolith and genetic ID of Rainbow Trout origins)
7.2 Low egg to fry survival (Peace River)
Fry abundance in the Peace River is sufficient to
maintain recruitment
Mon 2, Task 2b
Peace River Fish Community Monitoring Program
Peace River Fish Composition and
Abundance Survey
Rainbow Fry Abundance
7.2.1 Poor egg or fry habitat quality
Spawning habitat in the Peace River below Site C
meets or exceeds HSI standards
Mon 3, Task 2a,
2b
Peace River Physical Habitat Monitoring Program
Channel Morphology, Substrate Size
Location and amount of habitat available;
7.2.2 High egg or fry predation mortality
Predator abundance is not high enough to generate
Mon 2, Task 2a
Peace River Fish Community Monitoring Program
Peace River Large Fish Indexing Survey
Piscivore abundance
Site C Fisheries and Aquatic Habitat Monitoring and Follow-up Program – Rainbow Trout Diagnostic Tool Summary 73

unsustainable mortality rates Mon 2,
Task 2b Peace River Fish Community
Monitoring Program Peace River Fish Composition and
Abundance Survey
Piscivore abundance
Site C Fisheries and Aquatic Habitat Monitoring and Follow-up Program – Rainbow Trout Diagnostic Tool Summary 74

7.4 EVALUATION OF MONITORING PLAN NEEDS
Monitoring programs and associated tasks were assessed in terms of their relevance to Rainbow Trout biology to evaluate the comprehensiveness and rigor of the currently proposed Site C FAHMFP (Compass and ESSA 2015). Fourteen monitoring programs and 28 associated tasks are relevant to Rainbow Trout monitoring questions (Table 6).
Rainbow Trout sampling in tributaries focuses on age-0 habitat (Mon-1b, T2c) because high water and turbidity in the spring preclude capture and enumeration of spawning adults.
In Site C reservoir, the relative abundance, size and age of Rainbow Trout will be assessed under the Site C reservoir Hydroacoustic, Trawl, and Gillnet Survey (Mon-1a, T2a) and Summer Profundal Index Netting (SPIN; Mon-1a, T2b). These surveys will also provide relative abundance, size and age data for piscivores (Lake Trout, Bull Trout, Northern Pike, Northern Pike Minnow) and competitors (minnow spp., sculpin spp., sucker spp.) Rainbow Trout catch will be estimated in the Site C reservoir Creel Survey (Mon-1a, T2c), which will provide data to assess Rainbow Trout overharvest in the reservoir. Mon-6 and Mon-8 will measure primary productivity and environmental conditions in the reservoir, which will provide insight when interpreting the suitability of the reservoir for Rainbow Trout. Rainbow Trout abundance will be estimated indirectly based on models that factor in fry densities in spawning streams, harvest and catch rates in the fishery and movement data from PIT and CART tags.
In the Peace River, entrainment rates and entrainment survival of Rainbow Trout will be estimated using data collected under the Site C Fish Entrainment Monitoring Program (Mon-10, T2b and T2c). The relative abundance of Rainbow Trout downstream of Site C will be assessed under the Peace River Large Fish Indexing Survey (Mon-2, T2a) and the Peace River Fish Composition and Abundance Survey (Mon-2, T2b). The Peace River Creel Survey (Mon-2, T2c) will provide additional abundance estimates and also provide data to assess whether Rainbow Trout are overharvested downstream of Site C. Mon-7 and Mon-9 will measure primary productivity and environmental conditions downstream of the dam, which will provide insight when interpreting Rainbow Trout data downstream of the dam. In both Site C reservoir and the Peace River, monitoring environmental parameters will help diagnose causes of declines should declines be detected. Results also can be applied to the Diagnostic Tool.
The EIS summarizes evidence in favour of a low entrainment rate of Rainbow Trout, which implies that upstream passage may not be important. The need for upstream passage for Rainbow Trout in the Peace River downstream of Site C will be evaluated by comparing Rainbow Trout abundance in the Peace River (Mon-2) with the number of the Rainbow Trout from that attempt to use the fishway (Mon-13).
7.5 POSSIBLE MANAGEMENT ACTIONS
The Impact Pathways outlined in Table 6 would not necessarily trigger a mitigation or offsetting response by BC Hydro. A decline in Rainbow Trout abundance in the Site C LAA could be the result of a variety of causes, only some of which could relate directly to Site C operations. A separate process involving discussions with stakeholders will further develop management actions; this process has not been completed at the time of the development of this document.
7.6 SUMMARY
Site C Fisheries and Aquatic Habitat Monitoring and Follow-up Program – Arctic Grayling Diagnostic Tool Summary 75

This analysis suggests that monitoring proposed in the Site C FAHMFP is sufficient to detect changes to Rainbow Trout abundance within the Site C LAA, and provides some ability to diagnose likely causes for those changes.
8. ARCTIC GRAYLING SUMMARY
8.1 INTRODUCTION
This report provides an overview of the components of the Site C Fisheries and Aquatic Habitat Monitoring and Follow-up Program (FAHMFP) designed to monitor the status of Arctic Grayling (Thymallus arcticus) in the Site C Local Assessment Area (LAA). The objective of monitoring is to maintain or enhance the status of Arctic Grayling using monitoring activities and mitigation measures that are detailed in the Environmental Impact Statement (EIS).
8.2 BACKGROUND
The EIS uses B.C. Government (2011) to provide “guidance for the Site C EIS based on the province’s mandate to protect and manage fish and fish habitat”39F
40. Arctic Grayling (GR) are identified as an indicator species because they are “a high value target for anglers, sensitive to harvest pressure, relatively well-studied within LPRW and elsewhere, representative of cool/coldwater fauna, very sensitive to habitat degradation and representative of Beringia origins”40F
41.
The monitoring program for Arctic Grayling is based on clear management objectives (Government of BC 2011), which are reiterated in the EIS as follows: “conservation objectives and performance measures concerning: abundance, species distribution ……, population structure ….., size and age distribution”41F
42 measured in terms of “relative abundance (% of baseline population), mean age, meta-population (connectivity with upstream)”42F
43.
In addition to the performance measures identified in the EIS, the monitoring plan provides supplementary information that will be used in diagnosing the cause of any change in status that is observed under the monitoring plan described in the EIS.
8.3 CONCEPTUAL MODEL
Pre-Project Life History and Movement Patterns
Appendix Q3 of the EIS provides a summary of the interactions between Arctic Grayling life history events and the operation of Site C. As summarized in Appendix Q3, and illustrated here as Figure 24, historical movement patterns are complex and include movement past the Site C dam site:
“Evidence from radiotelemetry (AMEC 2008, AMEC 2009, AMEC 2010), genetic analysis (Taylor and Yau 2011), downstream trapping (Mainstream 2011b) and elemental signatures (Earthtone 2013) for Peace River Arctic Grayling suggests that spawning and early rearing takes place in the Moberly River but that adult habitat is concentrated in the Peace River. Movement of sub-adult Arctic Grayling from the Moberly River into the Peace River starts in their first summer (Mainstream 2011b; Earthtone 2012). Movements of adult Arctic Grayling include upstream feeding and spawning migrations in the spring, downstream post-
40 EIS, Vol. 2, Sec. 12.1.1 41 EIS, Vol. 2, App.O, Sec. 5.1.1 42 EIS, Appendix Q2, Section 2.1.2, p17 43 EIS, Appendix Q2, Section 2.1.2.1, p22
Site C Fisheries and Aquatic Habitat Monitoring and Follow-up Program – Arctic Grayling Diagnostic Tool Summary 76

spawning migrations in the spring and downstream migrations to overwintering areas in the fall (Buzby and Deegan 2000; Mainstream 2011b).”43F
44
Although most Arctic Grayling in the mainstem Peace reproduce in the Moberly River, genetic (Taylor and Yau 2012) and otolith microchemistry data (Earthtone 2013) indicate that about 5% of Arctic Grayling from the Peace River reproduce in the Pine, Beatton and Halfway rivers.
Figure 24. Historical life history and movement patterns of Peace River population of Arctic Grayling. Adults move from the Peace River to the Moberly to spawn and then return to the Peace River. Juveniles rear in the Moberly River and then move downstream to the Peace River as age-0 as well as older juveniles. Both adults and juveniles move upstream and downstream in the Peace River, including movements past Site C. Genetic (Taylor and Yau 2012) and otolith micro chemistry (Earthtone 2013) data suggest that some Arctic Grayling from the Beatton, Pine or Halfway rivers (dotted) can enter the Peace River. Pine and Halfway Arctic Grayling populations carried similar genetic markers and cannot be distinguished in the Peace River genetics sample. Beatton River Arctic Grayling had a unique genetic marker but none were recovered in the Peace River genetics sample.
For the purpose of this document, life history stages (fry, juveniles, adults) are defined in terms the periods between:
- Eggs: Egg deposition to hatching
- Fry: Hatching to the end of the first summer growing period
-Juveniles: End of Fry period to the winter prior to first maturity (includes “sub-adults”)
- Adults: End of Juvenile period to death as an adult (including repeat spawning)
44 EIS, Appendix Q3, Section 2.6, p27
Site C Fisheries and Aquatic Habitat Monitoring and Follow-up Program – Arctic Grayling Diagnostic Tool Summary 77

Post-Project Scenarios
Inundation of the lower Moberly River and the Peace River above Site C will separate the remaining adult Arctic Grayling habitat in the Peace River below Site C from reproductive habitat in the Moberly River. The EIS emphasizes the uncertainties associated with movement patterns in an environment that will include a reservoir and dam passage:
“A key uncertainty is the extent to which Arctic Grayling will use the proposed Site C reservoir as a migration corridor between the Moberly River and the Peace River downstream of Site C. Other studies suggest that reservoir habitats are unsuitable for Arctic Grayling. Arctic Grayling abundance has declined to the point where they are not found in Williston or Dinosaur reservoirs (Blackman et al. 2003; Murphy et al. 2004; Clarke et al. 2007). In natural lakes, Arctic Grayling populations tend to be restricted to small lakes with simple fish communities (Tonn et al. 2004; Stewart et al. 2007). …….
Key uncertainties in the Arctic Grayling model were:
1. The ability of Arctic Grayling to overwinter in the Moberly River; 2. The ability of Arctic Grayling to reproduce in the mainstem Peace River; and 3. The avoidance behavior of post-Project Arctic Grayling juvenile migrants moving down the
Moberly River that encounter the reservoir on their downstream migration.
Avoidance includes any behavior that results in downstream grayling migrants in the Moberly River surviving to move back upstream into appropriate rearing habitat. “44F
45
If fish passage mitigation is successful, then Arctic Grayling should persist in both the Moberly River and the Peace River below Site C with movement patterns similar to those in Figure 24. In this case, the monitoring program is designed to detect the presence of GR, along with information on growth, survival, density and movement patterns within and between the two locations (Moberly River, Peace River downstream of Site C).
If passage mitigation is not successful (Figure 25, Figure 26 Unc-1), then Arctic Grayling may still persist in either or both the Moberly River and Peace River below Site C. Persistence in the Moberly River will depend on the extent to which juvenile and adult Arctic Grayling can grow and survive in the Moberly River instead of the Peace River (Figure 25, Unc-2).
Persistence as part of the coldwater fish community in the Peace River below Site C (Figure 26) will depend on the extent to which recruitment from the Pine River (Figure 26, Unc-2), the mainstem Peace (Figure 26, Unc-3) or the Beatton River (Figure 26, Unc-4) can replace current recruitment from the Moberly River. Genetic and otolith micro chemistry data can be used to identify the origin of any Arctic Grayling in the lower Peace River.
45 EIS, Appendix Q3, Section 2.6, p27, 28
Site C Fisheries and Aquatic Habitat Monitoring and Follow-up Program – Arctic Grayling Diagnostic Tool Summary 78

Figure 25. Persistence of the Moberly River population of Arctic Grayling following the completion of the Site C dam, and assuming that passage mitigation is unsuccessful (Unc-1). Growth and survival processes that are not currently observed in the Moberly are identified as uncertainties (Unc-2) and dashed lines.
Site C Fisheries and Aquatic Habitat Monitoring and Follow-up Program – Arctic Grayling Diagnostic Tool Summary 79

Figure 26. Scenarios that would lead to post-dam persistence of Arctic Grayling as part of the coldwater fish community in the Peace RIver downstream of Site C. Uncertainties (Unc-1, Unc-2, Unc-3, Unc-4, dashed lines) indicate life history and movement patterns that may not be observed in the post-dam environment. If the Moberly River population does not occupy the Peace River (Unc-1), Arctic Grayling that are present in the Pine River or Beatton River may become more common in the Peace River (Unc-2, Unc-4) or Arctic Grayling may reproduce in the Peace River below Site C (Unc-3).
Adult Arctic Grayling abundance is expected to be lower under all post-project scenarios because of the conversion of large river habitat to reservoir habitat. The benchmark for Arctic Grayling status is assumed to be the pre-project adult abundance below Site C. If passage mitigation is not successful the benchmark for an independent Arctic Grayling population in the Moberly River is assumed to be an estimate of the carrying capacity of the remaining habitat in the Moberly River, based on observations of Arctic Grayling abundance in other systems.
Summary
Juveniles and adults can reside in two general locations, Moberly River upstream of the reservoir, and/or the Peace River downstream of Site C. Arctic Grayling may use the reservoir as a migration corridor, but growth and survival in the Reservoir is assumed to be negligible.
Key uncertainties include:
14. Whether Arctic Grayling will continue to move into Site C reservoir and downstream past the Site C Project;
15. Whether some juvenile Arctic Grayling will remain in the Moberly River and survive to adulthood
16. Whether recruitment from other sources can replace a decline in recruitment to the Peace River from the Moberly River
Site C Fisheries and Aquatic Habitat Monitoring and Follow-up Program – Arctic Grayling Diagnostic Tool Summary 80

17. The impact on Arctic Grayling survival of habitat changes in the Peace River below site C
The anticipated status of Arctic Grayling in the Moberly and Peace locations can be evaluated in terms of the uncertainties identified in Figure 24, Figure 25, and Figure 26 (as summarized in Table 7).
Table 7. Post-Project Scenarios assuming that passage mitigation is not successful.
Moberly Arctic Grayling Status
Poor Good
Peace River Arctic
Grayling Status
Poor
- Moberly River fry to adult survival is poor
- Peace River fry to adult survival is poor
- Non-Moberly reproduction is not successful
- Moberly River fry to adult survival is good
- Peace River fry to adult survival is poor
- Non-Moberly reproduction is not successful
Good
- Peace River fry to adult survival is good
- Moberly River fry to adult survival is poor
- Non-Moberly reproduction is successful
- Moberly River fry to adult survival is good
- Peace River fry to adult survival is good
- Non-Moberly reproduction is successful
In accordance with these conceptual models, this document reviews Arctic Grayling monitoring as it pertains to the following life history stages:
1. Egg and fry survival in the Moberly River watershed 2. Survival and Growth of juveniles and adults in the Moberly River 3. Fish Passage Failure
a. Migration of Juveniles and post-spawning adults into Site C reservoir b. Survival and Growth of Juveniles to Adults in the Site C Reservoir c. Entrainment of Juveniles and Adults d. Upstream Passage of mature Adults past the Site C dam
4. Survival and Growth of Juveniles to mature Adults downstream of the Site C dam 5. Recruitment of Arctic Grayling juveniles to the Peace River from areas downstream of the Site C
dam
The monitoring program is designed to identify both the movement and survival patterns of Arctic Grayling post-construction of the Site C dam as well as the reasons for any failure to meet management objectives.
Generalized Monitoring Outcomes
Status of Arctic Grayling in Moberly River
Monitoring task Mon-1b(2a) is designed to detect the presence of all Arctic Grayling life history stages in the Moberly River and, if present, compare their growth, survival and density to similar values based on the EIS and data from other populations. Declines in all measures of status are expected but the amount and time trajectory of these declines are key diagnostic indicators of the causes of these declines. These scenarios include;
Site C Fisheries and Aquatic Habitat Monitoring and Follow-up Program – Arctic Grayling Diagnostic Tool Summary 81

- A rapid decline in fry and spawner abundance, which is not accompanied by increases in juvenile and adult abundance in the Moberly River, indicates that passage provisions have failed, that reservoir survival is low and that juveniles and adults have failed to utilize the available habitat in the Moberly River.
- Rapid but modest increases in juvenile and adult density at the end of the growing season would suggest that a resident population may become established.
- Slow (>1 generation) declines in spawner and fry abundance, combined with a continuing absence of juveniles and adults in the Moberly River, suggests that pre-project juveniles are able to survive to maturity and are able migrate from the Peace River to the Moberly River, but that recruitment to the juvenile stage is failing.
Status of Arctic Grayling in the Peace River
Monitoring tasks Mon-2(2a, 2b, 2c, 2d) are designed to detect the presence of all Arctic Grayling life history stages in the Peace River and, if present, compare their growth, survival and density to pre-Project values. Several basic scenarios can be anticipated:
- Continued absence of age-0 GR, combined with low fishway passage and the presence of mature Arctic Grayling between Site C and the Pine River confluence suggests that local recruitment in the Peace River has failed
- Continued juvenile presence indicates that recruitment to the Peace River has been successful with genetic and otolith microchemistry being used to identify source populations
Upstream passage status measured by the ratio of fishway captures to spawner abundance downstream of Site C
8.3 DEFINING IMPACT PATHWAYS
The Diagnostic Tool development process involved the identification of impact pathways by which a change in one or more physical, chemical, or biological factors may lead to an impact on Arctic Grayling abundance. Impact pathway diagrams were created for 1) Moberly and other tributaries upstream of the Site C dam (Figure 27) and 2) the Peace River downstream of the Site C dam (Figure 28) to identify potential causes of Arctic Grayling decline in the Site C LAA should a decline occur.
Each impact pathway is associated with an impact hypothesis presented in Table 8 and discussed below. Each hypothesis outlined in Table 8 represents a mechanism-based sub-hypothesis to the EIS predicted changes to Arctic Grayling. This level of detail extends beyond the EIS predictions.
Site C Fisheries and Aquatic Habitat Monitoring and Follow-up Program – Arctic Grayling Diagnostic Tool Summary 82
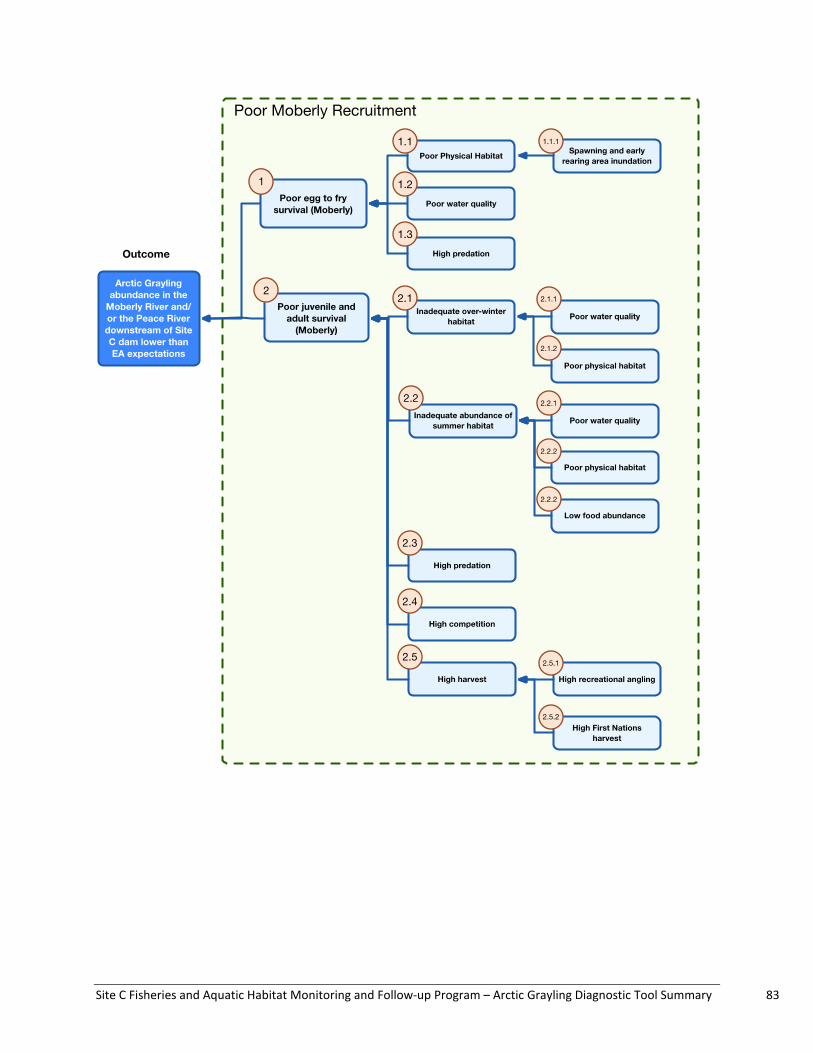
Site C Fisheries and Aquatic Habitat Monitoring and Follow-up Program – Arctic Grayling Diagnostic Tool Summary 83

Figure 27. Diagram of impact pathways that could lead to lower than expected Arctic Grayling abundance in the Moberly River. Habitat quality includes chemical and physical characteristics (e.g. temperature, stream morphology). The numbered orange circles indicate the main branches and sub-branches of the impact pathways. The number hierarchy for life stage and impact pathways in the figure is consistent with the numbering of impact pathways in Table 2.
Site C Fisheries and Aquatic Habitat Monitoring and Follow-up Program – Arctic Grayling Diagnostic Tool Summary 84

Figure 28. Diagram of impact pathways for Arctic Grayling recruitment downstream of the Site C dam that could potentially lead to lower than expected Arctic Grayling abundance in the Peace River downstream of Site C. The numbered orange circles indicate the main branches and sub-branches of the impact pathways. The number hierarchy for life stage and impact pathways is consistent with the numbering of impact pathways in Table 2
Moberly River
Each of the sections below corresponds to life history stages and associated potential impact pathways that could affect monitored abundances of Arctic Grayling in the Moberly River (Figure 27).
1. Egg and fry survival in the Moberly River
Arctic Grayling concurrently reproduce successfully in the Moberly River, but the project construction will inundate the lower river where most spawning and early rearing currently occurs. In addition, non-Project changes in Moberly River Arctic Grayling habitat, and fish community changes may affect first year survival of Arctic Grayling in the Moberly River. Egg and fry are grouped as a single life history stage because direct monitoring of hatchlings is difficult and has not been incorporated into the current monitoring program.
Impact pathways that directly affect survival of the egg and fry stage of Arctic Grayling in the Moberly River include habitat degradation, habitat loss ((including inundations), and predation. . Arctic Grayling spawn in the spring on gravel or cobble substrate and eggs lodge in interstices (McPhail 2007). Factors that are thought to affect egg survival include temperature, oxygen concentration, sediment deposition and discharge. Age-0 Arctic Grayling are common in the lower reaches of the Moberly River (Mainstream 2011) and therefore inundation by the Site C reservoir is likely to reduce the amount spawning and rearing habitat. Arctic Grayling are considered highly vulnerable at the time of emergence and can easily be killed by high water, turbulence, starvation, or stranding (BC MWLAP 2002). In some studies of Arctic Grayling it has been concluded that stream flows during early life explained levels of recruitment and populations of Arctic Grayling never reached thresholds for density-dependent
Site C Fisheries and Aquatic Habitat Monitoring and Follow-up Program – Arctic Grayling Diagnostic Tool Summary 85

recruitment, perhaps owing to severe floods in spring (Clark 1992 as cited in Naslund et al. 2005). Sculpins are an important predator of eggs and age-0 salmonids in other locations.
2. Juvenile and adult survival in the Moberly River
Juvenile and adult densities are currently very low in the Moberly River because most Arctic Grayling migrate downstream to the Peace River by the end of the fry stage. One post-project scenario is that juvenile and post-spawning, adult Arctic Grayling remain in the Moberly River rather than migrating to downstream locations. Juveniles and adults share most of the impact pathways and are therefore grouped as a single stage in Fig 4. Under this scenario, the abundance of spawning adults, which is a key performance indicator, are expected to be lower but, in the Moberly River, juvenile densities and adult densities outside of the spawning season will be higher than current densities.
Impact pathways that directly affect survival of juvenile and adult Arctic Grayling in the Moberly River include poor habitat quality, harvest and predation. Currently, most juveniles and adults rear in areas of the Peace and Moberly Rivers that will be inundated by the Site C Reservoir. The remaining portion of the Moberly River is expected to provide some juvenile and adult habitat at an abundance driven by density-dependent, intraspecific competition. Habitat quality includes physical and chemical characteristics that directly impact survival. Stream characteristics are important factors in the local distribution of Arctic Grayling (Hawkshaw et al. 2014) and winter ice conditions can limit survival of salmonids, including GR, in small northern streams (e.g. Linnansaari and Cunjak 2013, Barrineau et al 2005). High catchability means that Arctic Grayling are unusually vulnerable to overharvest (Northcote 1993). Arctic Grayling are present in a broad range of fish communities but a tendency to be restricted to small lakes with simple fish communities suggests that they are vulnerable to competition or predation from other species (Tonn et al. 2004; Stewart et al. 2007).
3. Fish Passage Failure
Several factors suggest that Site C fish passage provisions may not be successful in the case of Arctic Grayling (see Summary section above). There are several potential causes of passage failure (Figure 27) but only one (Poor Fishway Success) can potentially be mitigated Large scale failure to migrate into the reservoir (3.1,3.2) should be obvious from the distribution of fry, juveniles and adults upstream of the Moberly-reservoir confluence. Distinguishing between 3.3 (Juveniles don't survive in the Site C reservoir) and 3.4 (High entrainment mortality at the Site C reservoir) is probably irrelevant because meaningful mitigation of either mortality source is not possible. Estimating upstream fishway success is difficult because it involves comparisons of fishway counts to abundances of migrants downstream of Site C, which will be poorly defined.
Peace River Downstream of Site C
The section below corresponds to life history stage and associated potential impact pathways that could affect monitored abundances of Arctic Grayling in the Peace River below the Site C dam (Figure 28). Pathways 2, 3 and 4 in Figure 28 are identical to the same numbered pathways, including sub headings, described in Figure 27.
4) Juvenile and adult survival in the Peace River
Although Arctic Grayling survival and growth are adequate under current conditions in the Peace River, physical, biological and water quality changes in the river following dam construction may reduce the viability of Arctic Grayling in this location.
Site C Fisheries and Aquatic Habitat Monitoring and Follow-up Program – Arctic Grayling Diagnostic Tool Summary 86

5. Recruitment of Arctic Grayling juveniles to the Peace River from areas downstream of Site C
If fish passage fails, Arctic Grayling may still recruit to the Peace River downstream of Site C:
i) Downstream Tributary Recruitment: Genetic and otolith microchemistry data indicate that some Arctic Grayling in the Peace River recruit from the Pine, Beatton and other tributaries downstream of Site C. These recruits should still be present in the Peace. Densities of these fish from these sources is expected to be higher than current densities because competition from Moberly Arctic Grayling will be lower and the remaining Arctic Grayling will be concentrated in stream reaches downstream of Site C. The monitoring program is designed to detect these recruits.
i) Peace River Mainstem Recruitment: Arctic Grayling from large rivers typically spawn in clear, fast-flowing tributaries but mainstem spawning occurs in some systems (Northcote 1995, Stewart et al. 2007). While turbidity and fluctuating flows may preclude reproduction in the lower mainstem Peace River, the monitoring program is designed to detect age-0 Arctic Grayling at locations downstream of the Site C dam.
Site C Fisheries and Aquatic Habitat Monitoring and Follow-up Program – Arctic Grayling Diagnostic Tool Summary 87

Table 8. Hypothesized Impact Pathways that lead to lower abundance, growth, and survival of Arctic Grayling within the Site C LAA, associated monitoring tasks, and performance measures used to identify pathways. For Arctic Grayling, the Task numbers only include the task that is directly involved in the estimation of the Indicator. Deficiencies in our existing understanding of Arctic Grayling biology and uncertainties in the post-dam biology make it difficult to anticipate the details of the analysis model for the post-dam situation. As a result, the detailed use of ancillary information is difficult to specify.
Life Stage Impact Pathways Null Hypotheses Mon ID #, Task # Performance Measure
Eggs and fry in Moberly River
1 Poor egg and fry survival (Moberly River)
Egg to Juvenile survival is the same or higher than Pre-Project
Mon-1b, T2c Density of Fry in Moberly River
1.1 Poor physical habitat Indicators of egg and fry habitat quality are the same or greater than pre-Project values
Watershed Condition
1.1.1 Spawning and early rearing area inundation
Egg to Juvenile survival is the same or higher than Pre-Project
Mon-1b, T2c Location of Fry, pre- and post- inundation
1.2 Poor water quality Indicators of water quality are the same or greater than pre-Project values
Mon-8, T2a, 2b, 2c
Water chemistry, temperature, turbidity
1.3 High predation Predator abundance is the same or lower than pre-Project values
Mon-1b, T2c Piscivore Density in Moberly River
Juveniles to Adults: Survival and growth in Moberly R
2 Poor juvenile and adult survival (Moberly River)
Annual survivals of juveniles and adults are the same or higher than pre-Project levels
Mon-1b, T2c Age structure of juvenile and adult GR
2.1 Inadequate over-winter habitat Indicators of winter habitat quality are the same or greater than accepted standards from the literature
Mon-8, T2a, 2b, 2c
WUA* assessment (Water chemistry, turbidity, temperature)
Site C Fisheries and Aquatic Habitat Monitoring and Follow-up Program – Arctic Grayling Diagnostic Tool Summary 88

2.1.1 Poor water quality Indicators of winter water quality are the same or greater than accepted standards from the literature
Mon-8, T2a, 2b, 2c
WUA* assessment (Water chemistry, turbidity, temperature)
2.1.2 Poor physical habitat Indicators of winter physical habitat are the same or greater than accepted standards from the literature
**NA WUA* (Substrate depths and velocities), discharge
2.2 Inadequate abundance of summer habitat
Indicators of summer habitat are the same or greater than accepted standards from the literature
Mon-8, T2a, 2b, 2c
WUA* assessment (Water chemistry, turbidity, temperature)
2.2.1 Poor water quality Indicators of summer water quality are the same or greater than accepted standards from the literature
Mon-8, T2a, 2b, 2c
WUA* assessment (Water chemistry, turbidity, temperature)
2.2.2 Poor physical habitat Indicators of summer physical habitat are the same or greater than accepted standards from the literature
**NA WUA* (Substrate depths and velocities), discharge
2.2.3 Low food abundance Indicators of food abundance are the same or greater than accepted standards from the literature
**NA Invertebrate drift, surface insects (Moberly)
2.3 High predation Predator abundance is the same or lower than pre-Project values
Mon-1b, T2c Piscivore Density in Moberly River
2.4 High competition Competitor abundance is the same or lower than pre-Project values
Mon-1b, T2c Competitor Density in Moberly River
2.5 High harvest Harvest rates are not a significant fraction of lifetime mortality **NA Harvest or harvesting activity
2.5.1 High recreational harvest Recreational harvest rates are not a significant fraction of **NA Harvest or harvesting activity
Site C Fisheries and Aquatic Habitat Monitoring and Follow-up Program – Arctic Grayling Diagnostic Tool Summary 89

lifetime mortality
2.5.2 High First Nations harvest First Nations harvest rates are not a significant fraction of lifetime mortality
**NA Harvest or harvesting activity
Migrating Juveniles and Adults
3 Fish Passage Failure Density of Moberly Arctic Grayling in the Peace River below Site C is the same or higher than pre-Project values
Mon-2, T2a, 2b Density of Moberly River Arctic Grayling in Peace River
3.1 Poor downstream adult migration Adult abundance in Moberly River is the same or lower than pre-Project
Mon-1b, T2c Density of adult Arctic Grayling in the Moberly River
3.2 Poor downstream juvenile migration
Juvenile abundance in Moberly River is the same or lower than pre-Project
Mon-1b, T2c Density of juvenile Arctic Grayling in the Moberly River
3.3 Juvenile and adult Arctic Grayling do not survive in the Site C reservoir
Survival of tagged Arctic Grayling in the reservoir are the same or higher than expected
Mon-1a, T2a Density of juvenile Arctic Grayling reservoir
3.4 High entrainment mortality at the Site C reservoir
Survival of tagged, entrained fish is the same or higher than expected
Mon-10, T2b, 2c entrainment rate of tagged GR, survival of similar sized salmonids
3.5 Poor Fishway Success (Poor upstream adult migration)
Fishway abundance of maturing Arctic Grayling is similar to downstream abundance of mature Arctic Grayling in the Peace River
Mon-13, T2a,2b Proportion of AG that move to the base of the dam and enter the fishway
D) Juveniles to Adults (Peace
4 Poor Juvenile to Adult Survival Annual survivals of juveniles and adults are the same or higher than pre-Project levels
Mon-2, T2a, 2b Age structure of juveniles and adults
Site C Fisheries and Aquatic Habitat Monitoring and Follow-up Program – Arctic Grayling Diagnostic Tool Summary 90

River) 4.1 Inadequate over-winter habitat Indicators of winter habitat quality are the same or greater
than pre-Project levels Mon-3, Mon-9, T2a, 2b, 2c
WUA* (physical and water quality)
4.1.1 Poor water quality Indicators of winter water quality are the same or greater than pre-Project levels
Mon-9, T2a, 2b, 2c
WUA* assessment (Water chemistry, turbidity, temperature)
4.1.2 Poor physical habitat Indicators of winter physical habitat are the same or greater than pre-Project levels
Mon-3, T2a, 2b, 2c
WUA* (Substrate depths and velocities), discharge
4.2 Inadequate abundance of summer habitat
Indicators of summer habitat are the same or greater than pre-Project levels
Mon-3, Mon-9, T2a, 2b, 2c
WUA* (physical and water quality)
4.2.1 Poor water quality Indicators of summer water quality are the same or greater than pre-Project levels
Mon-9, T2a, 2b, 2c
WUA* (Water chemistry, turbidity, temperature)
4.2.2 Poor physical habitat Indicators of summer physical habitat are the same or greater than pre-Project levels
Mon-3, T2a, 2b, 2c
WUA* (Substrate depths and velocities), discharge
4.2.3 Low food abundance Indicators of food abundance are the same or greater than pre-Project levels
Mon-7, T2a Biomass and Production of Fish Food Organisms
4.3 High predation Predator abundance is the same or lower than pre-Project values
Mon-2, T2a, 2b Predator density in the Peace River
4.4 High competition Competitor abundance is the same or lower than pre-Project levels
Mon-2, T2a, 2b Competitor density in the Peace River
Site C Fisheries and Aquatic Habitat Monitoring and Follow-up Program – Arctic Grayling Diagnostic Tool Summary 91

4.5 High harvest Harvest rates are not a significant fraction of lifetime mortality Mon-2, T2c Harvest and harvesting activity
4.5.1 High recreational angling Recreational harvest rates are not a significant fraction of lifetime mortality
Mon-2, T2c Harvest and harvesting activity
4.5.2 High First Nations harvest First Nations harvest rates are not a significant fraction of lifetime mortality
Mon-2, T2c Harvest and harvesting activity
Eggs to fry (Peace River)
5 Poor non-Moberly recruitment Abundance of non-Moberly Arctic Grayling is the Peace River is same or higher than pre-Project values
Mon-2, T2a, 2b Non-Moberly Arctic Grayling abundance in the Peace River
5.1 Failure to migrate (Pine, Beatton) Abundance of non-Moberly Arctic Grayling is the Peace River is same or higher than pre-Project values
Mon-2, T2a, 2b Non-Moberly Arctic Grayling abundance in the Peace River
5.2 Population collapse (Pine, Beatton)
Abundances of non-Moberly Arctic Grayling is natal streams are the same or higher than pre-Project values
Mon-2, T2f Arctic Grayling density in Beatton
5.3 Failure to spawn (Peace River) Tagged, mature adults remain in the Peace River and exhibit spawning behavior in the spring spawning season
Mon-13, T2a,2b Proportion of Moberly AG that exhibit spawning instead of migrating behavior
5.4 Low egg to fry survival (Peace River)
Fry abundance is the same or higher than expected Mon-2, T2b Presence/absence, density fry in Peace River
5.4.1 Poor egg or fry habitat quality
Indicators of egg and fry habitat quality are the same or greater than expected
Mon-3, T2a, 2b, 2c
WUA* (Substrate depths and velocities), discharge
Site C Fisheries and Aquatic Habitat Monitoring and Follow-up Program – Arctic Grayling Diagnostic Tool Summary 92

5.4.2 High egg or fry predation mortality
Ratio of Arctic Grayling fry to egg deposition is the same or more than expected
Mon-2, T2a, 2b Egg deposition, fry abundance
* WUA (Weighted Usable Area), **None planned or No baseline for comparison
Site C Fisheries and Aquatic Habitat Monitoring and Follow-up Program – Arctic Grayling Diagnostic Tool Summary 93

8.4 EVALUATION OF MONITORING PLAN NEEDS
The Site C FAHMFP and associated tasks were assessed in terms of their relevance to Arctic Grayling biology. Nine monitoring programs and 20 associated tasks were identified as being relevant to Arctic Grayling monitoring questions (Table 8). Some Performance Indicators, such as survival, are ratios of other indicators and therefore will include a higher level of uncertainty.
In the Moberly River, Arctic Grayling will be sampled with a variety of using a variety of capture techniques (Mon-1b, T2c). This data will be used to estimate growth, density and age structure. PIT tags applied in the Moberly (Mon-1b, T2c) and the Peace (Mon-2, T2a, T2b) will provide recapture histories of individual fish. The PIT tag data will be supplemented by CART (Combined Acoustic/Radio Transmitter) tag data (Mon-1b, T2d). Density, growth and recapture data will be incorporated into a population model, which will be used to estimate demographic parameters, including abundance, survival and movement rates between locations.
In the Peace River, entrainment rates and entrainment survival of Arctic Grayling will be monitored under the Site C Fish Entrainment Monitoring Program (Mon-10, T2b and T2c). The relative abundance of Arctic Grayling downstream of Site C will be assessed under the Peace River Large Fish Indexing Survey (Mon-2, T2a) and the Peace River Fish Composition and Abundance Survey (Mon-2, T2b). The Peace River Creel Survey (Mon-2, T2c) will provide harvest estimates. Physical habitat conditions (Mon-3, T2a, 2b, 2c) and water quality data (Mon-9, T2a, 2b, 2c) will be incorporated into and evaluated using generalized WUA (Weighted Usable Area) models (e.g. Wilding et al. 2014). Fish food abundance data (Mon-7, T2a) will provide insight when interpreting conditions for Arctic Grayling growth and survival downstream of the dam. Distinguishing Moberly-origin Arctic Grayling from Arctic Grayling originating from downstream tributaries will require genetic or otolith microchemistry data; sampling is planned but processing of the samples will be contingent on the need for the data.
Arctic Grayling are not expected to be a significant component of the fish community of the Site C reservoir, but the relative abundance of Arctic Grayling will be assessed under the Site C reservoir Hydroacoustic, Trawl, and Gillnet Survey (Mon-1a, T2a). Arctic Grayling catch also will be included in the Site C reservoir Creel Survey (Mon-1a, T2c).
In both Site C reservoir and the Peace River, monitoring environmental parameters will help diagnose causes of declines should declines be detected. Results also can be applied to the Diagnostic Tool.
The efficacy of the trap and haul facility at capturing Arctic Grayling is assessed under the Site C Fishway Effectiveness Monitoring Program (Mon-13, T2a,2b), and the release location efficacy will be assessed under the Site C Trap and Haul Fish Release Location Monitoring Program (Mon-14, T2). The effect of the trap and haul facility on Arctic Grayling spawner abundance will depend on both trap and haul efficiency and actual entrainment rates. However, the number of Arctic Grayling captured in the trap and haul facility and the abundance of Arctic Grayling in the Peace River (Mon-2, T2a) will be compared annually.
8.5 POSSIBLE MANAGEMENT ACTIONS
The Impact Pathways outlined in Table 8 would not necessarily trigger a mitigation or offsetting response by BC Hydro. A decline in Bull Trout abundance in the Site C LAA could be the result of a variety of causes, only some of which could relate directly to Site C operations. A separate process involving discussions with stakeholders will further develop management actions; this process has not been completed at the time of the development of this document.
Site C Diagnostic Tool 94

8.6 SUMMARY
This analysis, facilitated by the Arctic Grayling Diagnostic Tool, suggests that monitoring proposed in the Site C FAHMFP is sufficient to detect changes to Arctic Grayling abundance within the Site C LAA, and provides some ability to diagnose likely causes for those changes.
Site C Diagnostic Tool 95

REFERENCES
Ahrens, RN, CJ Walters and V Christensen. 2012. Foraging arena theory. Fish and Fisheries 13: 41–59.
Barrineau, C.E., Hubert, W.A., Dey, P.D. and Annear, T.C., 2005. Winter ice processes and pool habitat associated with two types of constructed instream structures. North American Journal of Fisheries Management. 25:1022-1033.
BC Government. 2011. DRAFT Fish, Wildlife and Ecosystem resources and Objectives for the Lower Peace River Watershed – Site C Project Area. 25 p. + appendices.
B.C. Government. 2009. Ministry of Environment Fish and Wildlife Interim Objectives for Site C Project Area. 42 p.
Biro, P.A., M.V. Abrahams, J.R. Post and E.A. Parkinson. 2006. Behavioural trade-offs between growth and mortality explain evolution of submaximal growth rates. J. Anim. Ecol. 75: 1165–1171
British Columbia Government (B.C. Government). 2011. Draft Fish, Wildlife and 31 Ecosystem resources and Objectives for the Lower Peace River Watershed – 32 Site C Project Area.
Bustard, D. 2013. Kemess South Project Fish Monitoring Studies 2012. Report prepared for Aurico Gold Inc., Kemess Mine. Prepared By David Bustard And Associates Ltd.
Clark Jr., R.A. 1992. Influence of stream flow and stock size sized on recruitment of Arctic Grayling (Thymallus arcticus) in the Chena River, Alaska. Canadian Journal of Fisheries and Aquatic Sciences 49: 1027-1034.
Cowie, DM. 2004. Dinosaur Reservoir and Peace River Volunteer Creel Summary 2003. Peace/Williston Fish and Wildlife Compensation Program Report No. 292. 8pp.
Diversified Environmental Services. 1997. Canfor-Fort St. John Reconnaissance Level Stream Inventory 1996 – Halfway River-West Tributaries. Prepared for Canadian Forest Products Ltd., Fort St. John, B.C.
Earth Tone Environmental R&D and Mainstream Aquatics Ltd. 2013. Site C Fisheries Studies 2012 Elemental Signature Study - Final Report. Prepared for B.C. Hydro Site C Project, Corporate Affairs Report No. 12007F: 163 p. + appendices
Euchner, T. 2011. Site C Clean Energy Project Fisheries Studies: 2010 Dinosaur Reservoir Sampling And Literature Review. Prepared for: B.C. Hydro, Site C Project, Corporate Affairs, Prepared by: Diversified Environmental Services And Mainstream Aquatics Ltd.
Guy, C. S., McMahon, T. E., Fredenberg, W. A., Smith, C. J., Garfield, D. W., & Cox, B. S. (2011). Diet overlap of top-level predators in recent sympatry: Bull Trout and nonnative lake trout. Journal of Fish and Wildlife Management, 2(2), 183-189.
Hartman, G.F. 2009. A biological synopsis of Walleye (Sander vitreus). Can. Manuscr. Rep. Fish. Aquat. Sci. 2888: v + 48 p. Available at: http://www.dfo-mpo.gc.ca/Library/337847.pdf downloaded July 28, 2015.
Hawkshaw, S.C., Gillingham, M.P. and Shrimpton, J.M., 2014. Habitat characteristics affecting occurrence of a fluvial species in a watershed altered by a large reservoir. Ecology of freshwater fish. 23:383-394.
Site C Diagnostic Tool 96

Homel, K., & Budy, P. (2008). Temporal and spatial variability in the migration patterns of juvenile and subadult Bull Trout in northeastern oregon. Transactions of the American Fisheries Society, 137(3), 869-880.
Hume, J. ha. B. and E. A. Parkinson. 1987. Effect of stocking density on the survival, growth, and dispersal of steelhead trout fry (Saims gairdneri). Can. J. Fish. Aquat. Sci. 44: 271 -281.
Johnston, F.D. and J.R. Post 2009. Density-Dependent Life-History Compensation of an Iteroparous Salmonid. Ecological Applications 19: 449-467
Langston, A. R., and E. B. Murphy. 2008. The history of fish introductions (to 2005) in the Peace/Williston Fish and Wildlife Compensation Program Area. Peace/Williston Fish and Wildlife Compensation Program Report, No. 325.
Langston A.R. and R.J. Zemlak. 1998. Williston Reservoir Stocked Kokanee Spawning Assessment 1994. Peace/Williston Fish and Wildlife Compensation Program Report No. 176.
Linnansaari, T. and Cunjak, R.A., 2013. Effects of ice on behaviour of juvenile Atlantic salmon (Salmo salar). Canadian Journal of Fisheries and Aquatic Sciences 70:1488-1497.
Ma, B.O., E. Parkinson, E. Olson, D.C. Pickard, B. Connors, C. Schwarz, and D. Marmorek. 2014. Site C Monitoring Plan Power Analysis. Final report. Prepared for BC Hydro by ESSA Technologies Ltd. 74 pp + appendices.
Mainstream Aquatics Ltd. 2011. Site C fisheries studies – 2010 Peace River Fish Inventory. Prepared for B.C. Hydro Site C Project, Corporate Affairs Report No. 10005F: 102 p. + plates and appendices.
Mainstream Aquatics Ltd. 2011. Site C Fisheries Studies – 2010 Moberly River and Halfway River Summer Fish Inventory. Report No. 10006F: 59 p. + plates and appendices.
McPhail, J. D. 2007. The freshwater fishes of British Columbia. University of Alberta Press. 620 p.
Ministry of Water, Land and Air Protection (MWLAP). 2002. Williston Watershed Arctic Grayling. Biodiversity Branch, MWLAP, Victoria, BC.
Muhlfeld, C. C., Glutting, S., Hunt, R., Daniels, D., & Marotz, B. (2003). Winter diel habitat use and movement by subadult Bull Trout in the upper flathead river, montana. North American Journal of Fisheries Management, 23(1), 163-171.
Naslund, I., F. Nordwall, T. Eriksson, D.Hannersjo, L. Eriksson. 2005. Long-term responses of a stream dwelling grayling population to restrictive fishing regulations. Fisheries Research 72: 323-332.
Northcote, T.G., 1993. A review of management and enhancement options for the Arctic Grayling (Thymallus arcticus) with special reference to the Williston Reservoir Watershed in British Columbia (Vol. 69). Province of British Columbia, Ministry of Environment, Lands and Parks, Fisheries Branch.
Northcote, T.G. 1997. Potamodromy in salmonidae – living and moving in the fast lane. North American Journal of Fisheries Management 17: 1029–1045.
Parkinson, EA, EV Lea, MA Nelitz, JM Knudson, and RD Moore. 2016. Identifying Temperature Thresholds Associated with Fish Community Changes in British Columbia, Canada, to Support Identification of Temperature Sensitive Streams. River Research and Applications 32: 330-347.
Site C Diagnostic Tool 97

Post J.R., E. A. Parkinson, N. T. Johnston. 1999. Density-Dependent Processes In Structured Fish Populations: Interaction Strengths In Whole-Lake Experiments. Ecol. Mono. 69: 155–175.
Province of BC. 2008. Ministry of Environment, Fish and Wildlife, Interim Objectives for Site C Project Area. Report prepared by Compass Resource Management Ltd. for Ted Down, Fisheries Science Section, Ministry of Environment.
Province of BC. 2011. Recommended Fish, Wildlife and Ecosystem Valued Components and Objectives for the Lower Peace River, Site C Project Area, Draft for Discussion and Engagement.
R.L. & L. (R.L. & L. Environmental Services Ltd.). 1995. Fish migrations in the Chowade River, B.C. -Fall 1994. Prepared for B.C. Ministry of Environment, Lands and Parks, Fish and Wildlife Branch, Fort St. John, B.C. R.L. & L. Report No. 433a-F: 34 p. + 4 app.
Sebastian, D., G. Andrusak, G. Scholten and A. Langston. 2009. An index of fish distribution and abundance in Peace Arm of Williston Reservoir based on hydroacoustic and gillnet surveys, Study Period: July 15 – August 2, 2008. Peace Project Water Use Plan, Williston Fish Index,GMSMON #13.
Scott, W.B., and E.J. Crossman. 1973. Freshwater fishes of Canada. Fisheries Research Board of Canada Bulletin 184: 966 p.
Scrimgeour, Garry J; Tonn, William M; Jones, Nicholas E. 2014. Quantifying effective restoration: reassessing the productive capacity of a constructed stream 14 years after construction. Canadian Journal of Fisheries and Aquatic Sciences 71: 589-601.
Stewart, D.B., Mochnacz, N.J., Reist, J.D., Carmichael, T.J., and Sawatzky, C.D. 2007. Fish life history and habitat use in the Northwest Territories: Arctic Grayling (Thymallus arcticus). Can. Manuscr. Rep. Fish. Aquat. Sci. 2797: vi + 55 p.
Taylor, E.B. and M. Yau. 2012. Site C Clean Energy Project Fisheries Studies Microsatellite DNA analysis of Bull Trout (Salvelinus confluentus), Arctic Grayling (Thymallus arcticus), and mountain whitefish (Prosopium williamsoni) in the Peace River and tributaries near the proposed BC Hydro Site C hydroelectric development in northeastern British Columbia: 2006–2011. Prepared for BC Hydro.
Walters C.J. and F. Juanes. 1993. Recruitment Limitation as a Consequence of Natural Selection for Use of Restricted Feeding Habitats and Predation Risk Taking by Juvenile Fishes. Can. J. Fish. Aquat. Sci. 50: 2058-2070.
Wilding, T.K., B. Bledsoe, N.L. Poff, and J. Sanderson. 2014. Predicting Habitat Response to Flow Using Generalized Habitat Models for Trout in Rocky Mountain Streams. River Research and Applications 30: 805-824.
Site C Diagnostic Tool 98

Site C Diagnostic Tool 99