
Evaluation of FTIR Spectroscopy as a diagnostic tool for lung cancer using sputum
10
RESEARCH ARTICLE Open Access Evaluation of FTIR Spectroscopy as a diagnostic tool for lung cancer using sputum Paul D Lewis 1* , Keir E Lewis 1,2 , Robin Ghosal 2 , Sion Bayliss 1 , Amanda J Lloyd 3 , John Wills 1 , Ruth Godfrey 1 , Philip Kloer 2 , Luis AJ Mur 3 Abstract Background: Survival time for lung cancer is poor with over 90% of patients dying within five years of diagnosis primarily due to detection at late stage. The main objective of this study was to evaluate Fourier transform infrared spectroscopy (FTIR) as a high throughput and cost effective method for identifying biochemical changes in sputum as biomarkers for detection of lung cancer. Methods: Sputum was collected from 25 lung cancer patients in the Medlung observational study and 25 healthy controls. FTIR spectra were generated from sputum cell pellets using infrared wavenumbers within the 1800 to 950 cm -1 “fingerprint” region. Results: A panel of 92 infrared wavenumbers had absorbances significantly different between cancer and normal sputum spectra and were associated with putative changes in protein, nucleic acid and glycogen levels in tumours. Five prominent significant wavenumbers at 964 cm -1 , 1024 cm -1 , 1411 cm -1 , 1577 cm -1 and 1656 cm -1 separated cancer spectra from normal spectra into two distinct groups using multivariate analysis (group 1: 100% cancer cases; group 2: 92% normal cases). Principal components analysis revealed that these wavenumbers were also able to distinguish lung cancer patients who had previously been diagnosed with breast cancer. No patterns of spectra groupings were associated with inflammation or other diseases of the airways. Conclusions: Our results suggest that FTIR applied to sputum might have high sensitivity and specificity in diagnosing lung cancer with potential as a non-invasive, cost-effective and high-throughput method for screening. Trial Registration: ClinicalTrials.gov: NCT00899262 Background Lung cancer is the most common cancer in the world where 1.3 million deaths are recorded each year [1]. It is the second most common cancer in the UK and most common cause of cancer mortality with 34,500 deaths per annum [2]. Survival time is also poor with over 90% of patients dying within five years of diagnosis. Besides co-morbid conditions, poor survival rates primarily reflect the fact that over two thirds of patients are diag- nosed at a stage that is currently not amenable to potentially curative treatment. A number of reasons exist as to why so many lung cancers are diagnosed at late stage. The aetiology of lung cancer is well established with approximately 90% of tumours occurring in smokers [3]. Smoking is not just problematic in terms of the causation of lung can- cer as common symptoms of lung cancer such as coughing, dyspnoea or haemoptysis are frequently caused by smoking itself so are dismissed by long term smokers as simply being a consequence of smoking. Current diagnostic methods include chest X-ray, com- puterized tomography (CT) and bronchoscopy but despite these methods improving the ability to detect lung cancer they remain less effective for early stage detection [4]. In reality, the detection of lung cancer at an early stage would require a national screening pro- gramme. Targets for screening would be those at high risk including people over the age of 60 with a history of smoking, those with a previous history of cancer, and patients with chronic obstructive pulmonary disease (COPD). However, a screening programme would * Correspondence: [email protected] 1 School of Medicine, Swansea University, Swansea, SA2 8PP, UK Full list of author information is available at the end of the article Lewis et al. BMC Cancer 2010, 10:640 http://www.biomedcentral.com/1471-2407/10/640 © 2010 Lewis et al; licensee BioMed Central Ltd. This is an Open Access article distributed under the terms of the Creative Commons Attribution License (http://creativecommons.org/licenses/by/2.0), which permits unrestricted use, distribution, and reproduction in any medium, provided the original work is properly cited.
-
Upload
independent -
Category
Documents
-
view
0 -
download
0
Transcript of Evaluation of FTIR Spectroscopy as a diagnostic tool for lung cancer using sputum
RESEARCH ARTICLE Open Access
Evaluation of FTIR Spectroscopy as a diagnostictool for lung cancer using sputumPaul D Lewis1*, Keir E Lewis1,2, Robin Ghosal2, Sion Bayliss1, Amanda J Lloyd3, John Wills1, Ruth Godfrey1,Philip Kloer2, Luis AJ Mur3
Abstract
Background: Survival time for lung cancer is poor with over 90% of patients dying within five years of diagnosisprimarily due to detection at late stage. The main objective of this study was to evaluate Fourier transform infraredspectroscopy (FTIR) as a high throughput and cost effective method for identifying biochemical changes in sputumas biomarkers for detection of lung cancer.
Methods: Sputum was collected from 25 lung cancer patients in the Medlung observational study and 25 healthycontrols. FTIR spectra were generated from sputum cell pellets using infrared wavenumbers within the 1800 to 950cm-1 “fingerprint” region.
Results: A panel of 92 infrared wavenumbers had absorbances significantly different between cancer and normalsputum spectra and were associated with putative changes in protein, nucleic acid and glycogen levels in tumours.Five prominent significant wavenumbers at 964 cm-1, 1024 cm-1, 1411 cm-1, 1577 cm-1 and 1656 cm-1 separatedcancer spectra from normal spectra into two distinct groups using multivariate analysis (group 1: 100% cancercases; group 2: 92% normal cases). Principal components analysis revealed that these wavenumbers were also ableto distinguish lung cancer patients who had previously been diagnosed with breast cancer. No patterns of spectragroupings were associated with inflammation or other diseases of the airways.
Conclusions: Our results suggest that FTIR applied to sputum might have high sensitivity and specificity indiagnosing lung cancer with potential as a non-invasive, cost-effective and high-throughput method for screening.
Trial Registration: ClinicalTrials.gov: NCT00899262
BackgroundLung cancer is the most common cancer in the worldwhere 1.3 million deaths are recorded each year [1]. It isthe second most common cancer in the UK and mostcommon cause of cancer mortality with 34,500 deathsper annum [2]. Survival time is also poor with over 90%of patients dying within five years of diagnosis. Besidesco-morbid conditions, poor survival rates primarilyreflect the fact that over two thirds of patients are diag-nosed at a stage that is currently not amenable topotentially curative treatment.A number of reasons exist as to why so many lung
cancers are diagnosed at late stage. The aetiology oflung cancer is well established with approximately 90%
of tumours occurring in smokers [3]. Smoking is notjust problematic in terms of the causation of lung can-cer as common symptoms of lung cancer such ascoughing, dyspnoea or haemoptysis are frequentlycaused by smoking itself so are dismissed by long termsmokers as simply being a consequence of smoking.Current diagnostic methods include chest X-ray, com-puterized tomography (CT) and bronchoscopy butdespite these methods improving the ability to detectlung cancer they remain less effective for early stagedetection [4]. In reality, the detection of lung cancer atan early stage would require a national screening pro-gramme. Targets for screening would be those at highrisk including people over the age of 60 with a historyof smoking, those with a previous history of cancer, andpatients with chronic obstructive pulmonary disease(COPD). However, a screening programme would
* Correspondence: [email protected] of Medicine, Swansea University, Swansea, SA2 8PP, UKFull list of author information is available at the end of the article
Lewis et al. BMC Cancer 2010, 10:640http://www.biomedcentral.com/1471-2407/10/640
© 2010 Lewis et al; licensee BioMed Central Ltd. This is an Open Access article distributed under the terms of the Creative CommonsAttribution License (http://creativecommons.org/licenses/by/2.0), which permits unrestricted use, distribution, and reproduction inany medium, provided the original work is properly cited.
require a technology that is sensitive to early stage lungcancer and cost effective with the ultimate aim toreduce mortality.Recent randomized controlled trials have focused on
the evaluation of low dose computerised tomography(LDCT) [5]. It is estimated that, although having accep-table cost effectiveness, LDCT would still be an expen-sive screening method [6]. Furthermore, there is debateas to the sensitivity of LDCT for use on asymptomatichigh risk cases [7] and recent findings from the DANTEtrial suggest that mortality reduction using LDCT as ascreening tool might be smaller than anticipated [8].Molecular markers for early detection of lung cancer
hold much promise and possess a number of advantagesover existing methods. Indeed, markers such as DNAmethylation status of certain genes can be detected inbiofluids such as blood and sputum from people withlung cancer [9] as well as broncho-alveolar lavage (BAL)fluid [10]. As opposed to LDCT, technologies that candetect molecular biomarkers involve no radiation expo-sure, are relatively inexpensive and high throughput sosatisfying the need to have a screening process that iscost effective and rapid.Fourier transform infrared spectroscopy (FTIR) is a
non-invasive technology that can detect a change offunctional group in molecules from tissue or cells. Suchchanges can be visualized using a spectrum of wave-numbers usually taken from the mid infrared range(4000 to 400 cm-1). FTIR has shown promise as a sensi-tive diagnostic tool to distinguish neoplastic from nor-mal cells in cancers such as colon [11], prostate [12],breast [13], cervical [14], gastric [15], oral [16] and oeso-phageal [17]. In these and other studies, biochemicalchanges are often observed between tumour and normalcells within a wavenumber range known as the “finger-print region” (encompassing 1800 to 950 cm-1).There have been surprisingly few attempts to apply
FTIR for diagnostic purposes in lung cancer tissue. Thislikely reflects the fact that access to lung tissue is diffi-cult, highly invasive and most patients are diagnosed ata late stage. The few results that have emerged thoughare encouraging where FTIR wavenumbers in the finger-print region were interpreted to suggest that elevatedglycogen levels significantly discriminate both squamouscell carcinoma and adenocarcinoma tumours from nor-mal tissue [18,19]. A related infrared technique, Ramanspectroscopy, has also demonstrated success in distin-guishing lung tumour from normal bronchial tissue [20]and has more recently been combined with a broncho-scope for potentially diagnosing lung cancer ex vivo [21]FTIR has successfully been applied for diagnostic pur-
poses on sputum from COPD patients [22] and for bac-teria identification in cystic fibrosis [23]. However,despite success in detecting cancerous change in cells
from pleural fluid [24], to our knowledge FTIR hasnever successfully been applied to sputum for lung can-cer diagnosis. The aim of our study was to identifyinfrared wavenumbers that significantly discriminatecancer sputum from healthy control sputum and applymultivariate analysis to determine whether samples formsub-groups according to variation in wavenumber signal.This work lays the foundation for further studies toevaluate whether FTIR might be used as a cost effective,high throughput and non-invasive method for screeningbiochemical changes in sputum from lung cancer cases.
MethodsStudy Subjects and Sputum CollectionThis study had approval from the loco-regional ethicalcommittee (05/WMW01/75). Spontaneous sputum wascollected from 25 patients (mean age 66.5 ± 9.2 years; 15males, 10 females), for the majority,(23/25) it was takenjust prior to bronchoscopy for suspected lung cancer.Informed consent to provide a sputum sample wasobtained from each patient at a previous clinical appoint-ment. Lung cancer was subsequently confirmed throughfinal clinical diagnosis) as part of the Medlung observa-tional study (UKCRN ID 4682). Final histology wasrecorded where known (19 non-small cell lung cancer(NSCLC): 7 squamous cell carcinoma, 5 adenocarcinoma,7 unknown histological subtype, 3 small cell carcinoma; 1large cell carcinoma; 2 radiological diagnosis). The twopatients who had a radiological diagnosis based on clini-cal presentation and radiological findings were toounwell for further investigation to determine histologicalsubtype. Tumour location was also recorded for each ofthe 23 patients who underwent bronchoscopy: 11 normal(i.e. no tumour observed at bronchoscopy); 2 externalcompression of bronchus/trachea from the tumour/nodes; 4 abnormal mucosa; 6 tumour seen endobronchi-ally. Based on CT scans all patients had a centrallylocated tumour. In total, 12 cancer cases (48%) showedno evidence of a tumour at bronchoscopy although ran-dom bronchial washings were still taken on all. Smokingstatus and pack years (pky) were recorded for eachpatient: 11 current smokers (median pky = 40); 11 exsmokers (median pky = 40); 3 never smokers. Sputumwas also collected from 25 healthy donors (mean age62.5 ± 11.1 years; 15 males, 10 females) consisting of staffmembers at Swansea University with no previous historyof cancer or lung disease other than COPD or asthma.Smoking status and pack years recorded for controlswere: 12 current smokers (median pky = 30); 5 ex smo-kers (median pky = 27); 8 never smokers.
Sputum collection and processingAfter collection, sputum samples were kept frozen at-80°C. Prior to processing, sputa were defrosted at room
Lewis et al. BMC Cancer 2010, 10:640http://www.biomedcentral.com/1471-2407/10/640
Page 2 of 10
temperature for 12-24 hours. Sputum cells were isolatedby breaking down the mucus with a solution consistingof 2.5 g Dithiothreitol (DTT) in 31 mL Cytolyt (FlukaBiochemika Sigma-Aldrich Chemie GmbH Switzerland)which digested mucus in the specimen. Samples thenunderwent centrifugation at 3000 rpm for 10 min andsupernatant poured off leaving a cell pellet. An aliquotof cells was taken to create a second pellet that was sub-sequently formalin fixed and wax embedded prior tosectioning and staining with haemotoxylin and eosin(H&E). Residual pellets were freeze-dried over night,diluted in 200 μL of sterile distilled water, agitated for5 min and split into 20 μL aliquots, which were frozenimmediately in liquid nitrogen and stored at -80°C. Toconfirm samples were of bronchial origin, H&E stainedsections were assessed by a consultant histopathologistfor presence of bronchial epithelial cells.
FTIRA FTIR mid-infrared spectrometer instrument (BukerVERTEX 80/80 v, Ettlingen, Germany) was used toobtain spectra which comprised a KBr Beamsplitter, adiffuse reflectance absorbance scanning accessoryequipped with a mercury-cadmium telluride (MCT)detector and a sampling compartment fitted with a hori-zontal attenuated total reflectance (HATR) samplingaccessory. In this study, we used the MCT detector forreflectance IR measurements. To reduce noise, theMCT detector has to be operated at liquid nitrogentemperatures. Ninety-six well silicon plates (LNC Tech-nology Ltd., Ystrad Mynach, Hengoed, UK) werecleaned in warm 0.5% SDS, rinsed with dH2O, soakedovernight in 5 M nitric acid, rinsed again with dH2Oand air dried. Samples were applied randomly, in tripli-cate, across a plate, permitting possible variations withinor between plates to be taken into account during analy-sis. Loaded sample plates were oven dried at 50°C for 30min (Sanyo Gallenkamp plc., Loughborough, UK) toremove extraneous moisture prior to FTIR analysis. Pre-pared plates were allowed to cool and then insertedonto the motorized stage of the diffuse reflectanceabsorbance scanning accessory connected to the FTIRspectrometer. FTIR spectra were obtained in reflectancemode. Interference peaks in the mid-infrared region ofspectra were collected to minimise noise from CO2 andH2O vapour. The sampling compartments and micro-scope stage were purged with dry CO2 free air producedfrom a Peak Scientific compressor (Peak Scientific Ltd.Paisley, UK). Data points were collected at a resolutionof 2 cm-1 from the 4000 to 600 cm-1 wavenumberrange. Each spectrum represented the average of 256scans for improved signal to noise ratio. Sample absor-bance spectra were calculated from the ratio of IS/IR,where IS was the intensity of the IR beam after it has
been absorbed by the sample and IR was the intensity ofthe IR beam from the reference. The absorbance spec-trum was calculated as: -log10(IS/IR).
Data Processing and AnalysisAll data processing, analysis and visualization were per-formed using the R statistical computing environment[25] using in-built algorithms and code developed byour group. We were interested in assessing change inthe fingerprint spectral region so absorbance valuesbetween wavenumbers 950 and 1800 cm-1 (442 datapoints) were pre-processed prior to further analysis.Raw spectra were were pre-processed using a simpletwo point linear subtraction baseline correction method.Two points, 900 and 1850 cm-1 were selected outsidethe wavenumber region of interest that showed no var-iation across all samples. Spectra were then vector nor-malised. Second derivative spectra were then calculatedafter smoothing using the Savitzky-Golay algorithm withnine points. We applied the Shapiro-Wilk test to assesswhether second derivative absorbance values for eachnumber followed a normal distribution. As no wave-number was found to be normally distributed theMann-Whitney U test was used to determine wavenum-bers that were significantly different (P = 0.05) betweencancer and control spectra. Furthermore, due to multi-ple testing, a wavenumber p-value was only retained assignificant if it remained so after applying Holm’ssequential Bonferroni correction.Two different multivariate analysis approaches were
used to determine and visualize the pattern of similari-ties within and between cancer and normal spectra.Hierarchical cluster analysis (HCA) dendrograms wereproduced using the ‘hcluster’ function in the R ‘amap’package with a correlation distance matrix andunweighted pair-group tree building method. Principalcomponents analysis (PCA), via the R ‘prcomp’ package,allowed further visualization and interpretation of spec-tral groupings.
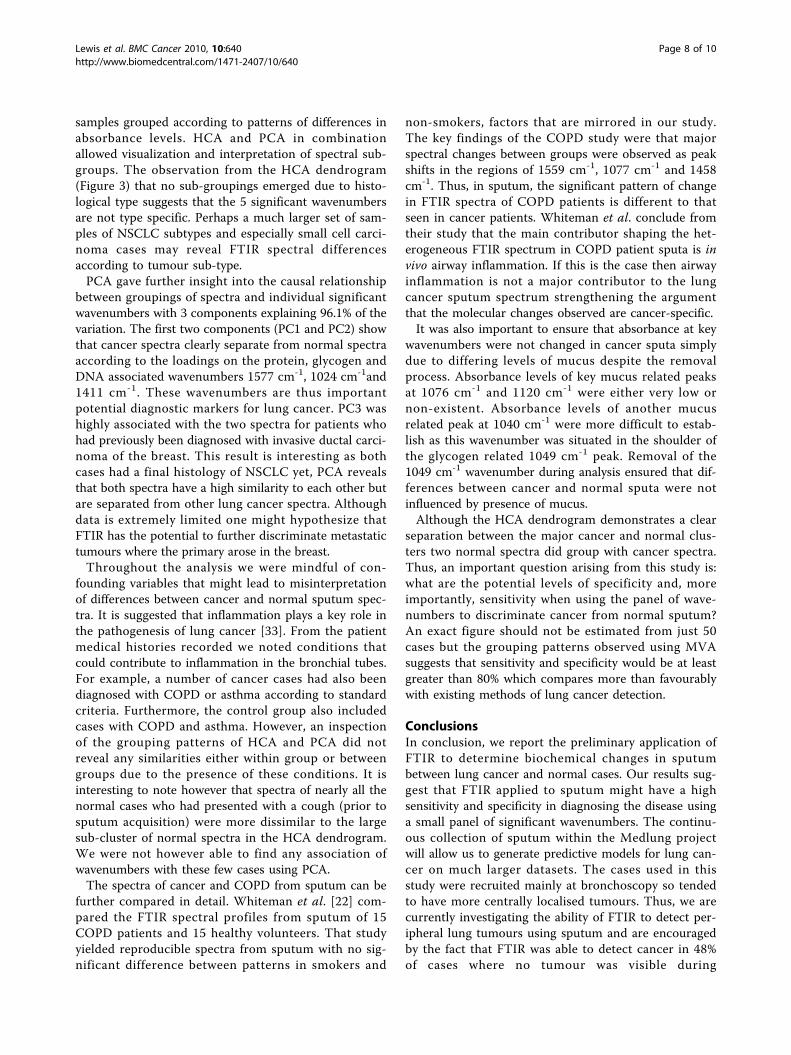
ResultsEvaluation of sputum cell pellet FTIR spectraFTIR was used to generate absorbance spectra in thefrequency region 950 to 1800 cm-1 to establish potentialmetabolic differences in cells extracted from sputumbetween 25 lung cancer and 25 normal control samples.Representative spectra for cancer and control samplesare shown in Figure 1 A-B. By repeating the proceduremultiple times (and on different dates) we found thatspectra generated for each sample were highly reprodu-cible. Normality tests revealed that none of the indivi-dual wavenumber absorbance levels followed a normaldistribution. Thus, for each wavenumber, median(ratherthan mean) absorbance levels were used for analysis.
Lewis et al. BMC Cancer 2010, 10:640http://www.biomedcentral.com/1471-2407/10/640
Page 3 of 10
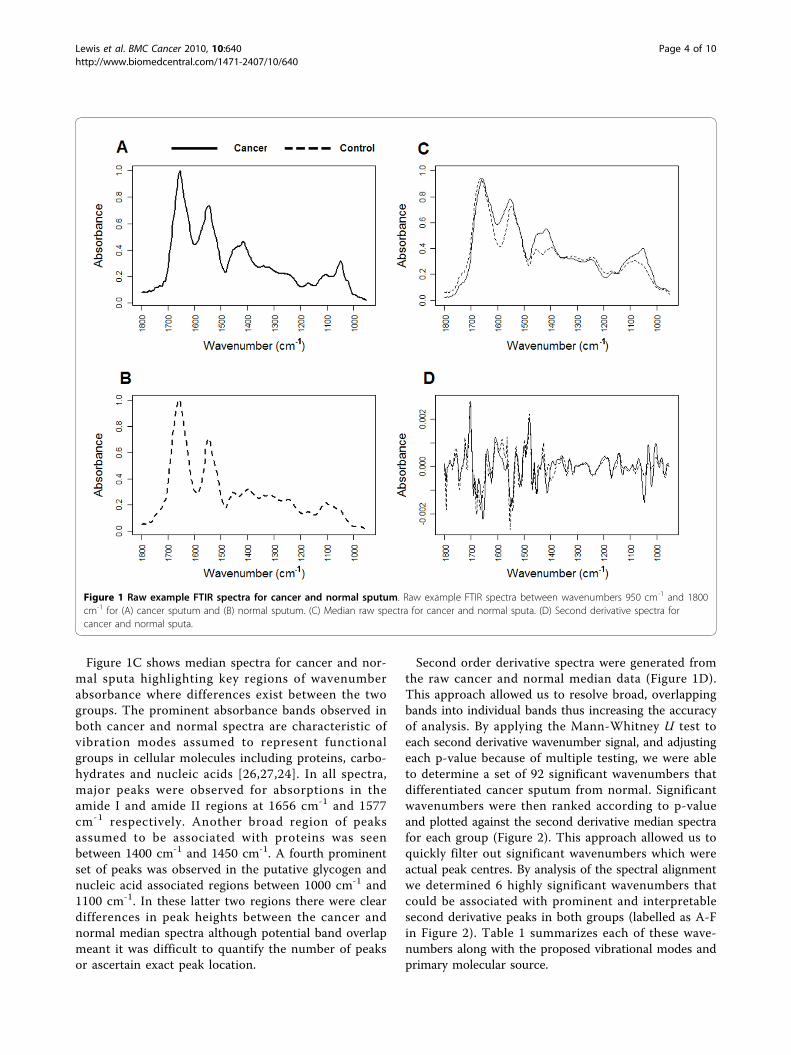
Figure 1C shows median spectra for cancer and nor-mal sputa highlighting key regions of wavenumberabsorbance where differences exist between the twogroups. The prominent absorbance bands observed inboth cancer and normal spectra are characteristic ofvibration modes assumed to represent functionalgroups in cellular molecules including proteins, carbo-hydrates and nucleic acids [26,27,24]. In all spectra,major peaks were observed for absorptions in theamide I and amide II regions at 1656 cm-1 and 1577cm-1 respectively. Another broad region of peaksassumed to be associated with proteins was seenbetween 1400 cm-1 and 1450 cm-1. A fourth prominentset of peaks was observed in the putative glycogen andnucleic acid associated regions between 1000 cm-1 and1100 cm-1. In these latter two regions there were cleardifferences in peak heights between the cancer andnormal median spectra although potential band overlapmeant it was difficult to quantify the number of peaksor ascertain exact peak location.
Second order derivative spectra were generated fromthe raw cancer and normal median data (Figure 1D).This approach allowed us to resolve broad, overlappingbands into individual bands thus increasing the accuracyof analysis. By applying the Mann-Whitney U test toeach second derivative wavenumber signal, and adjustingeach p-value because of multiple testing, we were ableto determine a set of 92 significant wavenumbers thatdifferentiated cancer sputum from normal. Significantwavenumbers were then ranked according to p-valueand plotted against the second derivative median spectrafor each group (Figure 2). This approach allowed us toquickly filter out significant wavenumbers which wereactual peak centres. By analysis of the spectral alignmentwe determined 6 highly significant wavenumbers thatcould be associated with prominent and interpretablesecond derivative peaks in both groups (labelled as A-Fin Figure 2). Table 1 summarizes each of these wave-numbers along with the proposed vibrational modes andprimary molecular source.
Figure 1 Raw example FTIR spectra for cancer and normal sputum. Raw example FTIR spectra between wavenumbers 950 cm-1 and 1800cm-1 for (A) cancer sputum and (B) normal sputum. (C) Median raw spectra for cancer and normal sputa. (D) Second derivative spectra forcancer and normal sputa.
Lewis et al. BMC Cancer 2010, 10:640http://www.biomedcentral.com/1471-2407/10/640
Page 4 of 10
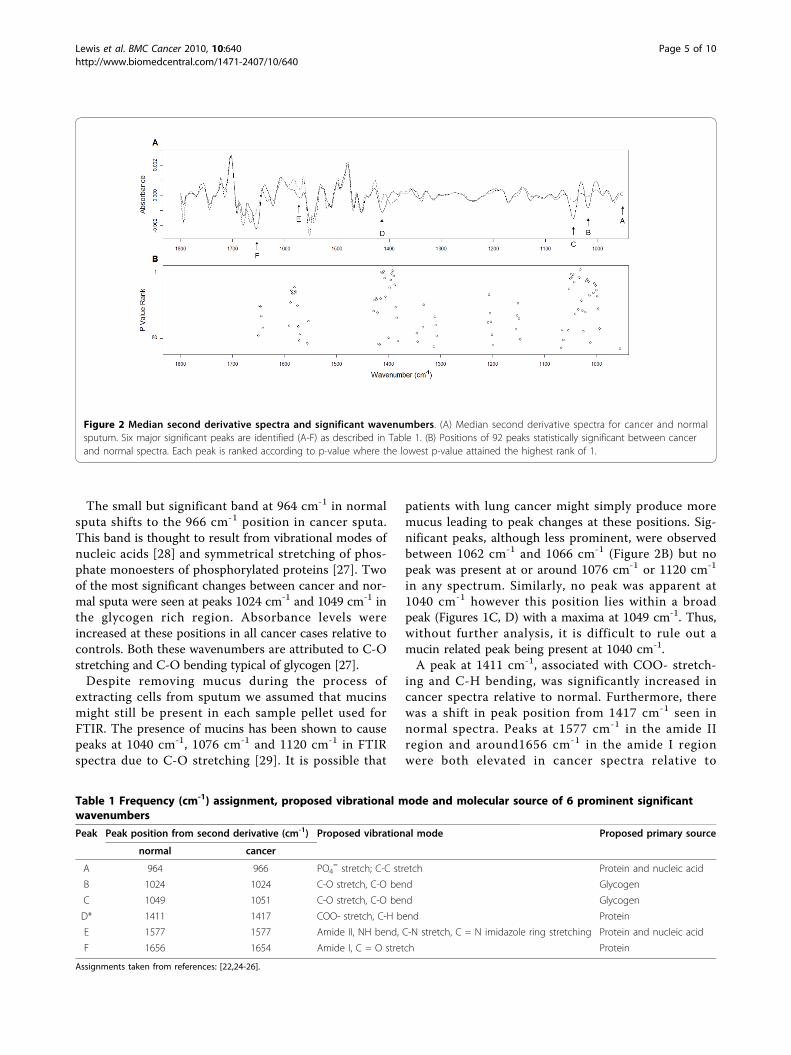
The small but significant band at 964 cm-1 in normalsputa shifts to the 966 cm-1 position in cancer sputa.This band is thought to result from vibrational modes ofnucleic acids [28] and symmetrical stretching of phos-phate monoesters of phosphorylated proteins [27]. Twoof the most significant changes between cancer and nor-mal sputa were seen at peaks 1024 cm-1 and 1049 cm-1 inthe glycogen rich region. Absorbance levels wereincreased at these positions in all cancer cases relative tocontrols. Both these wavenumbers are attributed to C-Ostretching and C-O bending typical of glycogen [27].Despite removing mucus during the process of
extracting cells from sputum we assumed that mucinsmight still be present in each sample pellet used forFTIR. The presence of mucins has been shown to causepeaks at 1040 cm-1, 1076 cm-1 and 1120 cm-1 in FTIRspectra due to C-O stretching [29]. It is possible that
patients with lung cancer might simply produce moremucus leading to peak changes at these positions. Sig-nificant peaks, although less prominent, were observedbetween 1062 cm-1 and 1066 cm-1 (Figure 2B) but nopeak was present at or around 1076 cm-1 or 1120 cm-1
in any spectrum. Similarly, no peak was apparent at1040 cm-1 however this position lies within a broadpeak (Figures 1C, D) with a maxima at 1049 cm-1. Thus,without further analysis, it is difficult to rule out amucin related peak being present at 1040 cm-1.A peak at 1411 cm-1, associated with COO- stretch-
ing and C-H bending, was significantly increased incancer spectra relative to normal. Furthermore, therewas a shift in peak position from 1417 cm-1 seen innormal spectra. Peaks at 1577 cm-1 in the amide IIregion and around1656 cm-1 in the amide I regionwere both elevated in cancer spectra relative to
Table 1 Frequency (cm-1) assignment, proposed vibrational mode and molecular source of 6 prominent significantwavenumbers
Peak Peak position from second derivative (cm-1) Proposed vibrational mode Proposed primary source
normal cancer
A 964 966 PO4= stretch; C-C stretch Protein and nucleic acid
B 1024 1024 C-O stretch, C-O bend Glycogen
C 1049 1051 C-O stretch, C-O bend Glycogen
D* 1411 1417 COO- stretch, C-H bend Protein
E 1577 1577 Amide II, NH bend, C-N stretch, C = N imidazole ring stretching Protein and nucleic acid
F 1656 1654 Amide I, C = O stretch Protein
Assignments taken from references: [22,24-26].
Figure 2 Median second derivative spectra and significant wavenumbers. (A) Median second derivative spectra for cancer and normalsputum. Six major significant peaks are identified (A-F) as described in Table 1. (B) Positions of 92 peaks statistically significant between cancerand normal spectra. Each peak is ranked according to p-value where the lowest p-value attained the highest rank of 1.
Lewis et al. BMC Cancer 2010, 10:640http://www.biomedcentral.com/1471-2407/10/640
Page 5 of 10
control. These bands characteristically reflect bendingof N-H bonds and stretching of C-N bonds as well asstretching of C = O bonds [27]. In cancer spectrathere was also a peak shift from 1656 cm-1 to 1654cm-1. Interestingly, none of these peaks were signifi-cantly different between adenocarcinoma and squa-mous cell carcinoma spectra
Multivariate analysis of sputum FTIR spectraThe second derivative absorbance values at 964 cm-1,1024 cm-1, 1411 cm-1, 1577 cm-1 and 1656 cm-1 werefurther subjected to multivariate analysis (MVA). The1049 cm-1peak was not considered due to the potentialassociation with mucin presence. We used two MVAmethods to determine the underlying structure of howcancer and normal sputa samples grouped according totheir spectra of significant wavenumbers. Application ofMVA performed in this way would allow us to visualizethe causal effects of significant wavenumbers on the pat-terns of differences existing both within and betweencancer and normal sputum groups. The first method,hierarchical cluster analysis (HCA) would allow visuali-zation of the overall grouping structure and conse-quently sub-groups of spectra. The second method,principal components analysis (PCA), would providefurther information on how spectra group indicatingwhich wavenumbers cause such groupings.The HCA dendrogram for all 25 cancer and 25 normal
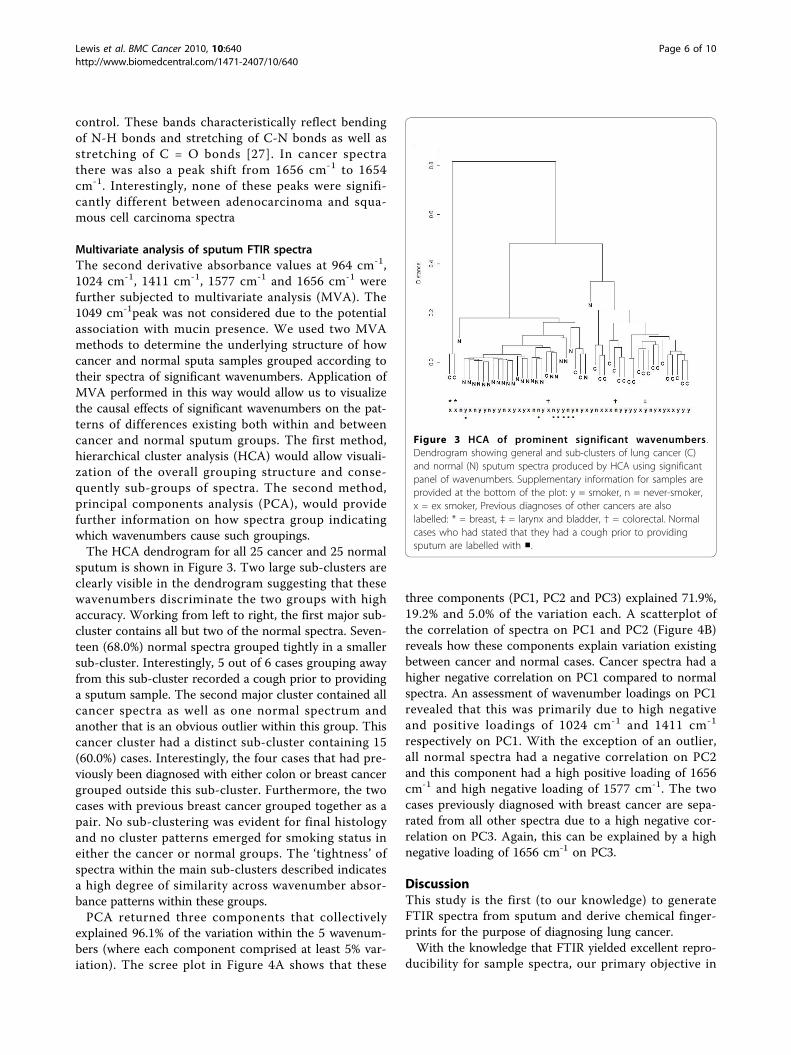
sputum is shown in Figure 3. Two large sub-clusters areclearly visible in the dendrogram suggesting that thesewavenumbers discriminate the two groups with highaccuracy. Working from left to right, the first major sub-cluster contains all but two of the normal spectra. Seven-teen (68.0%) normal spectra grouped tightly in a smallersub-cluster. Interestingly, 5 out of 6 cases grouping awayfrom this sub-cluster recorded a cough prior to providinga sputum sample. The second major cluster contained allcancer spectra as well as one normal spectrum andanother that is an obvious outlier within this group. Thiscancer cluster had a distinct sub-cluster containing 15(60.0%) cases. Interestingly, the four cases that had pre-viously been diagnosed with either colon or breast cancergrouped outside this sub-cluster. Furthermore, the twocases with previous breast cancer grouped together as apair. No sub-clustering was evident for final histologyand no cluster patterns emerged for smoking status ineither the cancer or normal groups. The ‘tightness’ ofspectra within the main sub-clusters described indicatesa high degree of similarity across wavenumber absor-bance patterns within these groups.PCA returned three components that collectively
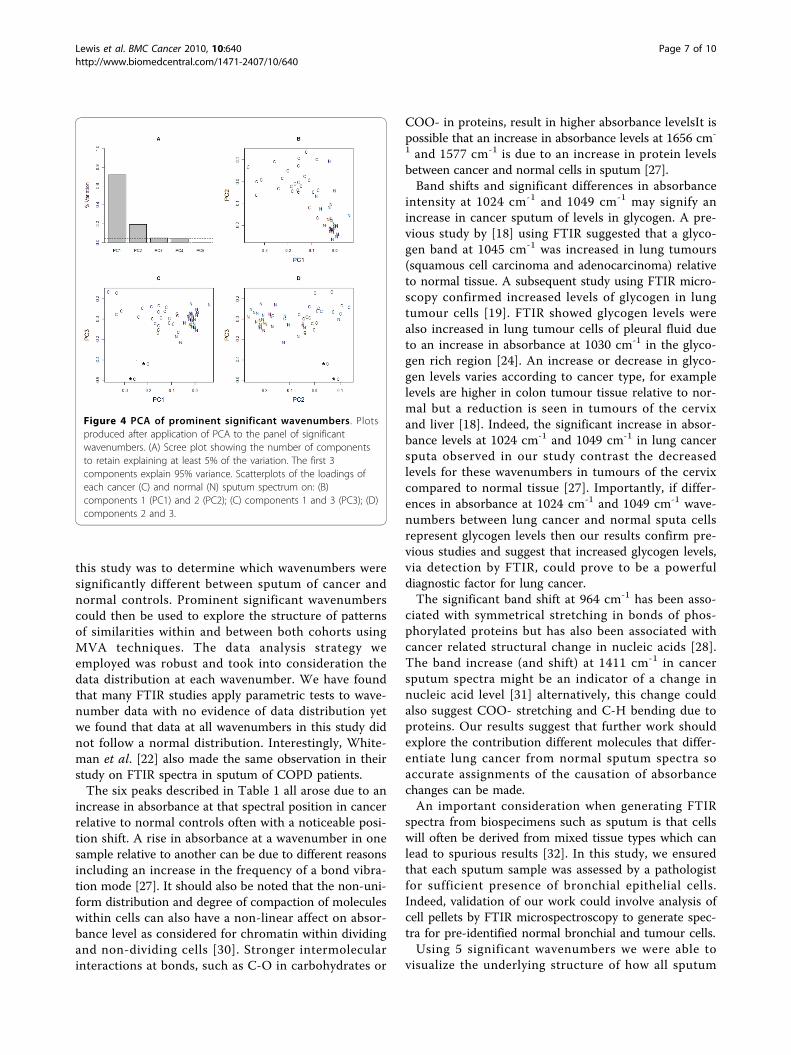
explained 96.1% of the variation within the 5 wavenum-bers (where each component comprised at least 5% var-iation). The scree plot in Figure 4A shows that these
three components (PC1, PC2 and PC3) explained 71.9%,19.2% and 5.0% of the variation each. A scatterplot ofthe correlation of spectra on PC1 and PC2 (Figure 4B)reveals how these components explain variation existingbetween cancer and normal cases. Cancer spectra had ahigher negative correlation on PC1 compared to normalspectra. An assessment of wavenumber loadings on PC1revealed that this was primarily due to high negativeand positive loadings of 1024 cm-1 and 1411 cm-1
respectively on PC1. With the exception of an outlier,all normal spectra had a negative correlation on PC2and this component had a high positive loading of 1656cm-1 and high negative loading of 1577 cm-1. The twocases previously diagnosed with breast cancer are sepa-rated from all other spectra due to a high negative cor-relation on PC3. Again, this can be explained by a highnegative loading of 1656 cm-1 on PC3.
DiscussionThis study is the first (to our knowledge) to generateFTIR spectra from sputum and derive chemical finger-prints for the purpose of diagnosing lung cancer.With the knowledge that FTIR yielded excellent repro-
ducibility for sample spectra, our primary objective in
Figure 3 HCA of prominent significant wavenumbers .Dendrogram showing general and sub-clusters of lung cancer (C)and normal (N) sputum spectra produced by HCA using significantpanel of wavenumbers. Supplementary information for samples areprovided at the bottom of the plot: y = smoker, n = never-smoker,x = ex smoker, Previous diagnoses of other cancers are alsolabelled: * = breast, ‡ = larynx and bladder, † = colorectal. Normalcases who had stated that they had a cough prior to providingsputum are labelled with ■.
Lewis et al. BMC Cancer 2010, 10:640http://www.biomedcentral.com/1471-2407/10/640
Page 6 of 10
this study was to determine which wavenumbers weresignificantly different between sputum of cancer andnormal controls. Prominent significant wavenumberscould then be used to explore the structure of patternsof similarities within and between both cohorts usingMVA techniques. The data analysis strategy weemployed was robust and took into consideration thedata distribution at each wavenumber. We have foundthat many FTIR studies apply parametric tests to wave-number data with no evidence of data distribution yetwe found that data at all wavenumbers in this study didnot follow a normal distribution. Interestingly, White-man et al. [22] also made the same observation in theirstudy on FTIR spectra in sputum of COPD patients.The six peaks described in Table 1 all arose due to an
increase in absorbance at that spectral position in cancerrelative to normal controls often with a noticeable posi-tion shift. A rise in absorbance at a wavenumber in onesample relative to another can be due to different reasonsincluding an increase in the frequency of a bond vibra-tion mode [27]. It should also be noted that the non-uni-form distribution and degree of compaction of moleculeswithin cells can also have a non-linear affect on absor-bance level as considered for chromatin within dividingand non-dividing cells [30]. Stronger intermolecularinteractions at bonds, such as C-O in carbohydrates or
COO- in proteins, result in higher absorbance levelsIt ispossible that an increase in absorbance levels at 1656 cm-
1 and 1577 cm-1 is due to an increase in protein levelsbetween cancer and normal cells in sputum [27].Band shifts and significant differences in absorbance
intensity at 1024 cm-1 and 1049 cm-1 may signify anincrease in cancer sputum of levels in glycogen. A pre-vious study by [18] using FTIR suggested that a glyco-gen band at 1045 cm-1 was increased in lung tumours(squamous cell carcinoma and adenocarcinoma) relativeto normal tissue. A subsequent study using FTIR micro-scopy confirmed increased levels of glycogen in lungtumour cells [19]. FTIR showed glycogen levels werealso increased in lung tumour cells of pleural fluid dueto an increase in absorbance at 1030 cm-1 in the glyco-gen rich region [24]. An increase or decrease in glyco-gen levels varies according to cancer type, for examplelevels are higher in colon tumour tissue relative to nor-mal but a reduction is seen in tumours of the cervixand liver [18]. Indeed, the significant increase in absor-bance levels at 1024 cm-1 and 1049 cm-1 in lung cancersputa observed in our study contrast the decreasedlevels for these wavenumbers in tumours of the cervixcompared to normal tissue [27]. Importantly, if differ-ences in absorbance at 1024 cm-1 and 1049 cm-1 wave-numbers between lung cancer and normal sputa cellsrepresent glycogen levels then our results confirm pre-vious studies and suggest that increased glycogen levels,via detection by FTIR, could prove to be a powerfuldiagnostic factor for lung cancer.The significant band shift at 964 cm-1 has been asso-
ciated with symmetrical stretching in bonds of phos-phorylated proteins but has also been associated withcancer related structural change in nucleic acids [28].The band increase (and shift) at 1411 cm-1 in cancersputum spectra might be an indicator of a change innucleic acid level [31] alternatively, this change couldalso suggest COO- stretching and C-H bending due toproteins. Our results suggest that further work shouldexplore the contribution different molecules that differ-entiate lung cancer from normal sputum spectra soaccurate assignments of the causation of absorbancechanges can be made.An important consideration when generating FTIR
spectra from biospecimens such as sputum is that cellswill often be derived from mixed tissue types which canlead to spurious results [32]. In this study, we ensuredthat each sputum sample was assessed by a pathologistfor sufficient presence of bronchial epithelial cells.Indeed, validation of our work could involve analysis ofcell pellets by FTIR microspectroscopy to generate spec-tra for pre-identified normal bronchial and tumour cells.Using 5 significant wavenumbers we were able to
visualize the underlying structure of how all sputum
Figure 4 PCA of prominent significant wavenumbers. Plotsproduced after application of PCA to the panel of significantwavenumbers. (A) Scree plot showing the number of componentsto retain explaining at least 5% of the variation. The first 3components explain 95% variance. Scatterplots of the loadings ofeach cancer (C) and normal (N) sputum spectrum on: (B)components 1 (PC1) and 2 (PC2); (C) components 1 and 3 (PC3); (D)components 2 and 3.
Lewis et al. BMC Cancer 2010, 10:640http://www.biomedcentral.com/1471-2407/10/640
Page 7 of 10
samples grouped according to patterns of differences inabsorbance levels. HCA and PCA in combinationallowed visualization and interpretation of spectral sub-groups. The observation from the HCA dendrogram(Figure 3) that no sub-groupings emerged due to histo-logical type suggests that the 5 significant wavenumbersare not type specific. Perhaps a much larger set of sam-ples of NSCLC subtypes and especially small cell carci-noma cases may reveal FTIR spectral differencesaccording to tumour sub-type.PCA gave further insight into the causal relationship
between groupings of spectra and individual significantwavenumbers with 3 components explaining 96.1% of thevariation. The first two components (PC1 and PC2) showthat cancer spectra clearly separate from normal spectraaccording to the loadings on the protein, glycogen andDNA associated wavenumbers 1577 cm-1, 1024 cm-1and1411 cm-1. These wavenumbers are thus importantpotential diagnostic markers for lung cancer. PC3 washighly associated with the two spectra for patients whohad previously been diagnosed with invasive ductal carci-noma of the breast. This result is interesting as bothcases had a final histology of NSCLC yet, PCA revealsthat both spectra have a high similarity to each other butare separated from other lung cancer spectra. Althoughdata is extremely limited one might hypothesize thatFTIR has the potential to further discriminate metastatictumours where the primary arose in the breast.Throughout the analysis we were mindful of con-
founding variables that might lead to misinterpretationof differences between cancer and normal sputum spec-tra. It is suggested that inflammation plays a key role inthe pathogenesis of lung cancer [33]. From the patientmedical histories recorded we noted conditions thatcould contribute to inflammation in the bronchial tubes.For example, a number of cancer cases had also beendiagnosed with COPD or asthma according to standardcriteria. Furthermore, the control group also includedcases with COPD and asthma. However, an inspectionof the grouping patterns of HCA and PCA did notreveal any similarities either within group or betweengroups due to the presence of these conditions. It isinteresting to note however that spectra of nearly all thenormal cases who had presented with a cough (prior tosputum acquisition) were more dissimilar to the largesub-cluster of normal spectra in the HCA dendrogram.We were not however able to find any association ofwavenumbers with these few cases using PCA.The spectra of cancer and COPD from sputum can be
further compared in detail. Whiteman et al. [22] com-pared the FTIR spectral profiles from sputum of 15COPD patients and 15 healthy volunteers. That studyyielded reproducible spectra from sputum with no sig-nificant difference between patterns in smokers and
non-smokers, factors that are mirrored in our study.The key findings of the COPD study were that majorspectral changes between groups were observed as peakshifts in the regions of 1559 cm-1, 1077 cm-1 and 1458cm-1. Thus, in sputum, the significant pattern of changein FTIR spectra of COPD patients is different to thatseen in cancer patients. Whiteman et al. conclude fromtheir study that the main contributor shaping the het-erogeneous FTIR spectrum in COPD patient sputa is invivo airway inflammation. If this is the case then airwayinflammation is not a major contributor to the lungcancer sputum spectrum strengthening the argumentthat the molecular changes observed are cancer-specific.It was also important to ensure that absorbance at key
wavenumbers were not changed in cancer sputa simplydue to differing levels of mucus despite the removalprocess. Absorbance levels of key mucus related peaksat 1076 cm-1 and 1120 cm-1 were either very low ornon-existent. Absorbance levels of another mucusrelated peak at 1040 cm-1 were more difficult to estab-lish as this wavenumber was situated in the shoulder ofthe glycogen related 1049 cm-1 peak. Removal of the1049 cm-1 wavenumber during analysis ensured that dif-ferences between cancer and normal sputa were notinfluenced by presence of mucus.Although the HCA dendrogram demonstrates a clear
separation between the major cancer and normal clus-ters two normal spectra did group with cancer spectra.Thus, an important question arising from this study is:what are the potential levels of specificity and, moreimportantly, sensitivity when using the panel of wave-numbers to discriminate cancer from normal sputum?An exact figure should not be estimated from just 50cases but the grouping patterns observed using MVAsuggests that sensitivity and specificity would be at leastgreater than 80% which compares more than favourablywith existing methods of lung cancer detection.
ConclusionsIn conclusion, we report the preliminary application ofFTIR to determine biochemical changes in sputumbetween lung cancer and normal cases. Our results sug-gest that FTIR applied to sputum might have a highsensitivity and specificity in diagnosing the disease usinga small panel of significant wavenumbers. The continu-ous collection of sputum within the Medlung projectwill allow us to generate predictive models for lung can-cer on much larger datasets. The cases used in thisstudy were recruited mainly at bronchoscopy so tendedto have more centrally localised tumours. Thus, we arecurrently investigating the ability of FTIR to detect per-ipheral lung tumours using sputum and are encouragedby the fact that FTIR was able to detect cancer in 48%of cases where no tumour was visible during
Lewis et al. BMC Cancer 2010, 10:640http://www.biomedcentral.com/1471-2407/10/640
Page 8 of 10
bronchoscopy. If biochemical changes in sputum canalso be detected by FTIR in the early stages of lung can-cer, then the technology might prove to be a non-inva-sive, cost-effective, high-throughput method for eventualscreening. With this goal in mind, we are also perform-ing a longitudinal study to determine whether the panelof infrared wavenumbers can also discriminate patientsdeemed at high-risk for lung cancer.
AcknowledgementsWe acknowledge the Welsh Assembly Government and Hywel Dda Healthboard for financial support. We would like to thank Dr Rohan Mehta, DrSarah Prior, Oliver Lyttleton, Claire Duggan and Sarah J Jones for theirassistance and advice during collection and processing of samples. Finally,we are extremely grateful to the three reviewers of this manuscript for theirexpert advice and helpful comments.
Author details1School of Medicine, Swansea University, Swansea, SA2 8PP, UK.2Department of Respiratory Medicine, Prince Phillip Hospital, Llanelli, SA148LY, UK. 3Institute of Biological, Environmental and Rural Sciences,Aberystwyth University, Aberystwyth, SY23 2AX, UK.
Authors’ contributionsPDL conceived the study, performed data analysis and participated in itsdesign and supervision. LUM participated in study design and coordinatedFTIR. KEL, RG and PK coordinated tissue and data collection and providedclinical input into the study. SB, AJL and JW performed FTIR. ARG providedintellectual input into the study and helped draft the manuscript. All authorsread and approved the final manuscript.
Competing interestsThe authors declare that they have no competing interests.
Received: 26 March 2010 Accepted: 23 November 2010Published: 23 November 2010
References1. Cancer, Fact Sheets, World Health Organization: 2009 [http://www.who.int/
mediacentre/factsheets/fs297/en/].2. Cancer Stats, Mortality-UK Cancer Research UK: 2006 [http://info.
cancerresearchuk.org/cancerstats/types/lung/].3. Peto R, Lopez AD, Boreham J, Thun M, Heath C Jr, Doll R: Mortality from
smoking in developed countries 1950-2000: Indirect estimates from NationalVital Statistics Oxford University Press; 2006.
4. Sutedja G: New techniques for early detection of lung cancer. Eur Respir J2003, 21:57S-66S.
5. Field JK, Duffy SW: Lung cancer screening: the way forward. Br J Cancer2008, 99:557-62.
6. Whynes DK: Could CT screening for lung cancer ever be cost effective inthe United Kingdom? Cost Eff resour Alloc 2008, 6:5.
7. Bach PB, Kelley MJ, Tate RC, McCrory DC: Screening for lung cancer: areview of the current literature. Chest 2003, 123:72S-82S.
8. Infante M, Cavuto S, Lutman FR, Brambilla G, Chiesa G, Ceresoli G, Passera E,Angeli E, Chiarenza M, Aranzulla G, Cariboni U, Errico V, Inzirillo F, Bottoni E,Voulaz E, Alloisio M, Destro A, Roncalli M, Santoro A, Ravasi G: DANTEStudy Group. A randomized study of lung cancer screening with spiralcomputed tomography: three-year results from the DANTE trial. Am JRespir Crit Care Med 2009, 180:445-53.
9. Belinsky SA, Grimes MJ, Casas E, Stidley CA, Franklin WA, Bocklage TJ,Johnson DH, Schiller JH: Predicting gene promoter methylation in non-small-cell lung cancer by evaluating sputum and serum. Br J Cancer2007, 96:1278-1283.
10. Topaloglu O, Hoque MO, Tokumaru Y, Lee J, Ratovitski E, Sidransky D,Moon CS: Detection of promoter hypermethylation of multiple genes inthe tumor and bronchoalveolar lavage of patients with lung cancer. ClinCancer Res 2004, 10:2284-2288.
11. Lasch P, Haensch W, Lewis N, Kidder LH, Naumann D: Characterization ofcolorectal adenocarcinoma sections by spatially resolved FT-IRmicrospectroscopy. Appl Spectrosc 2002, 48:1-10.
12. Baker MJ, Gazi E, Brown MD, Shanks JH, Clarke NW, Gardner P:Investigating FTIR based histopathology for the diagnosis of prostatecancer. J Biophotonics 2009, 2:104-13.
13. Gao T, Feng J, Ci Y: Human breast carcinomal tissues display distinctiveFT-IR spectra: implication for the histological characterization ofcarcinomas. Anal Cell Pathol 1999, 18:87-93.
14. El-Tawil SG, Adnan R, Muhamed ZN, Othman NH: Comparative studybetween Pap smear cytology and FTIR spectroscopy: a new tool forscreening for cervical cancer. Pathology 2008, 40:600-3.
15. Fujioka N, Morimoto Y, Arai T, Kikuchi M: Discrimination between normaland malignant human gastric tissues by Fourier transform infraredspectroscopy. Cancer Detect Prev 2004, 28:32-6.
16. Fukuyama Y, Yoshida S, Yanagisawa S, Shimizu M: A study on thedifferences between oral squamous cell carcinomas and normal oralmucosas measured by Fourier transform infrared spectroscopy.Biospectroscopy 1999, 5:117-26.
17. Wang JS, Shi JS, Xu YZ, Duan XY, Zhang L, Wang J, Yang LM, Weng SF,Wu JG: FT-IR spectroscopic analysis of normal and cancerous tissues ofesophagus. World J Gastroenterol 2003, 9:1897-9.
18. Yano K, Ohoshima S, Shimizu Y, Moriguchi T, Katayama H: Evaluation ofglycogen level in human lung carcinoma tissues by an infraredspectroscopic method. Cancer Lett 1996, 110:29-34.
19. Yano K, Ohoshima S, Gotou Y, Kumaido K, Moriguchi T, Katayama H: Directmeasurement of human lung cancerous and noncancerous tissues byfourier transform infrared microscopy: can an infrared microscope beused as a clinical tool? Anal Biochem 2000, 15:218-25.
20. Huang Z, McWilliams A, Lui H, McLean DI, Lam S, Zeng H: Near-infraredRaman spectroscopy for optical diagnosis of lung cancer. Int J Cancer2003, 20:1047-52.
21. Magee ND, Villaumie JS, Marple ET, Ennis M, Elborn JS, McGarvey JJ: Ex vivodiagnosis of lung cancer using a Raman miniprobe. J Phys Chem B 2009,11:8137-41.
22. Whiteman SC, Yang Y, Jones JM, Spiteri MA: FTIR spectroscopic analysis ofsputum: preliminary findings on a potential novel diagnostic marker forCOPD. Ther Adv Respir Dis 2008, 2:23-31.
23. Bosch A, Miñán A, Vescina C, Degrossi J, Gatti B, Montanaro P, Messina M,Franco M, Vay C, Schmitt J, Naumann D, Yantorno O: Fourier transforminfrared spectroscopy for rapid identification of nonfermenting gram-negative bacteria isolated from sputum samples from cystic fibrosispatients. J Clin Microbiol 2008, 46:2535-46.
24. Wang HP, Wang HC, Huang YJ: Microscopic FT-IR studies of lung cancercells in pleural fluid. Sci Total Environ 1997, 204:283-7.
25. R Development Core Team. R: A language and environment for statisticalcomputing. R Foundation for Statistical Computing, Vienna, Austria. 2009[http://www.R-project.org].
26. Stuart BH: Infrared Spectroscopy: Fundamentals and Applications John Wiley& Sons, Inc., New York; 2004.
27. Maziak DE, Do MT, Shamji FM, Sundaresan SR, Perkins DG, Wong PT:Fourier-transform infrared spectroscopic study of characteristicmolecular structure in cancer cells of esophagus: an exploratory study.Cancer Detect Prev 2007, 31:244-53.
28. Malins DC, Gilman NK, Green VM, Wheeler TM, Barker EA, Anderson KM: Acancer DNA phenotype in healthy prostates, conserved in tumors andadjacent normal cells, implies a relationship to carcinogenesis. Proc NatlAcad Sci USA 2005, 102:19093-6.
29. Chiriboga L, Xie P, Zhang W, Diem M: Infrared spectroscopy of humantissue. III. Spectral differences between squamous and columnar tissueand cells from the human cervix. Biospectroscopy 1997, 3:253-257.
30. Mohlenhoff B, Romeo M, Diem M, Wood BR: Mie-Type Scattering andNon-Beer-Lambert Absorption Behavior of Human Cells in InfraredMicrospectroscopy. Biophys J 2005, 88:3635-3640.
31. Kondepati VR, Heise HM, Oszinda T, Mueller R, Keese M, Backhaus J:Detection of structural disorders in colorectal cancer DNA with Fourier-transform infrared spectroscopy. Vibrational Spectroscopy 2008, 46:150-157.
32. Diem M, Romeo M, Boydston-White S, Miljkovic M, Matthaus C: A decadeof vibrational micro-spectroscopy of human cells and tissue (1994-2004).Analyst 2004, 129:880-5.
Lewis et al. BMC Cancer 2010, 10:640http://www.biomedcentral.com/1471-2407/10/640
Page 9 of 10
33. Walser T, Cui X, Yanagawa J, Lee JM, Heinrich E, Lee G, Sharma S,Dubinett SM: Smoking and lung cancer: the role of inflammation. ProcAm Thorac Soc 2008, 5:811-5.
Pre-publication historyThe pre-publication history for this paper can be accessed here:http://www.biomedcentral.com/1471-2407/10/640/prepub
doi:10.1186/1471-2407-10-640Cite this article as: Lewis et al.: Evaluation of FTIR Spectroscopy as adiagnostic tool for lung cancer using sputum. BMC Cancer 2010 10:640.
Submit your next manuscript to BioMed Centraland take full advantage of:
• Convenient online submission
• Thorough peer review
• No space constraints or color figure charges
• Immediate publication on acceptance
• Inclusion in PubMed, CAS, Scopus and Google Scholar
• Research which is freely available for redistribution
Submit your manuscript at www.biomedcentral.com/submit
Lewis et al. BMC Cancer 2010, 10:640http://www.biomedcentral.com/1471-2407/10/640
Page 10 of 10