A Portable Diagnostic Tool for Grinding Process - STIMS Institute
8
ELK Asia Pacific Journals – 978-93-85537-06-6 ARIMPIE -2017 Application of Grind-Trak TM A Portable Diagnostic Tool for Grinding Process Anant Jain Research & Development Micromatic Grinding Technologies Limited Bengaluru, India Mohamed Rizwan J Research & Development Micromatic Grinding Technologies Limited Bengaluru, India Rajesh S Research & Development Micromatic Grinding Technologies Limited Bengaluru, India Ramakrishna Nadig Research & Development Micromatic Grinding Technologies Limited Bengaluru, India Abstract: Grind-Trak TM is a diagnostic tool that captures the signature of a grinding process. Grinding process is associated with complex microscopic interactions and this paper presents an approach to analyze the signals from Grind-Trak TM to understand the grinding process. Examples in terms of controlled experiments have been provided to explain the approach. The effectiveness of the diagnostic tool and the analysis approach has been described with practical case studies. Keywords—Grinding, Process Monitoring, Microscopic Interactions, Grind-Trak TM I. INTRODUCTION Grinding is a machining process that employs an abrasive tool, generally a grinding wheel rotating at high speeds, to remove material from the work piece to achieve the components of required form, precision and functionality[1]. There is always a need for surface generation with every new or emerging technology, out of several surface generation processes, grinding is a desirable process as required tolerance, complex geometry and surface quality can be achieved without compromising the productivity or cost of manufacturing. Another advantage is that the work materials, which are frequently “difficult to machine” - hard, tough, heat treated, brittle, heat sensitive, delicate, expensive, large and/or Critical surface area to process, not easy to fixture, etc. can also be machined using Grinding [2].Nowadays, most of the industrialized countries nearly spend about 20–25% of its total expenditures of machining operations on grinding [3]. II. SYSTEMS APPROACH TO GRINDING PROCESS In brief, the entire grinding process can be classified as an input-transformation output system [4]. The Inputs include: Machine tool, work component, process parameters, and toolings and other consumables, such as coolant, abrasive etc. The Outputs include technical and systems output. Form dimension, finish and part integrity are technical output while productivity and cost of grinding are the system output.The transformation is the actual physical process or microscopic interactions taking place in the grinding zone[5]. A. Microscopic Interactions in Grinding Process: In any machining process, one can easily recognize the transformation as the resultant of the interference between the tool and the work material. In case of grinding process it would be the grinding wheel and the work material and the interference region is called the “Grinding zone” [6]. In grinding zone grinding wheel interacts with the component to remove work material in the form of chips. Normal and tangential forces are generated between the grinding wheel and workpiece [7].These forces will cause the abrasive grain of the grinding wheel to penetrate the workpiece. A grain that cuts deeply into the workpiece carves out a chip whereas a grain that rubs without penetration causes mild wear that may be hardly detectible. There is a third scenario where grains penetrate and plough the work materials causing ridges without removing material [8]. These interactions are classified as cutting, sliding and ploughing respectively. A grinding wheel is composed of thousands of small abrasive grains held together by a bonding material [9]. If this matrix material is not sufficiently recessed it remains close to the periphery of the wheel and is likely to slide against the work material. Finally, the chips that are produced in-situ at the grinding zone, are likely to be trapped between the adjacent grains in the grinding wheel and the work material. Hence they will be forced to slide against the bond material or work material until they are ejected out. As a result all interferences in the grinding zone can be visualized as a combination of the six interactions listed below.
-
Upload
khangminh22 -
Category
Documents
-
view
1 -
download
0
Transcript of A Portable Diagnostic Tool for Grinding Process - STIMS Institute

ELK Asia Pacific Journals – 978-93-85537-06-6
ARIMPIE -2017
Application of Grind-TrakTM
A Portable Diagnostic Tool for Grinding Process
Anant Jain
Research & Development
Micromatic Grinding Technologies Limited
Bengaluru, India
Mohamed Rizwan J
Research & Development
Micromatic Grinding Technologies Limited
Bengaluru, India
Rajesh S
Research & Development
Micromatic Grinding Technologies Limited
Bengaluru, India
Ramakrishna Nadig
Research & Development
Micromatic Grinding Technologies Limited
Bengaluru, India
Abstract: Grind-TrakTM is a diagnostic tool that captures the signature of a grinding process. Grinding process is associated with complex microscopic interactions and this paper presents an approach to analyze the signals from Grind-TrakTM to understand the grinding process. Examples in terms of controlled experiments have been provided to explain the approach. The effectiveness of the diagnostic tool and the analysis approach has been described with practical case studies.
Keywords—Grinding, Process Monitoring, Microscopic Interactions, Grind-TrakTM
I. INTRODUCTION
Grinding is a machining process that employs an abrasive tool, generally a grinding wheel rotating at high speeds, to remove material from the work piece to achieve the components of required form, precision and functionality[1]. There is always a need for surface generation with every new or emerging technology, out of several surface generation processes, grinding is a desirable process as required tolerance, complex geometry and surface quality can be achieved without compromising the productivity or cost of manufacturing. Another advantage is that the work materials, which are frequently “difficult to machine” - hard, tough, heat treated, brittle, heat sensitive, delicate, expensive, large and/or Critical surface area to process, not easy to fixture, etc. can also be machined using Grinding [2].Nowadays, most of the industrialized countries nearly spend about 20–25% of its total expenditures of machining operations on grinding [3].
II. SYSTEMS APPROACH TO GRINDING PROCESS
In brief, the entire grinding process can be classified as an input-transformation output system [4]. The Inputs include: Machine tool, work component, process parameters, and toolings and other consumables, such as coolant, abrasive etc. The Outputs include technical and systems output. Form dimension, finish and part integrity are technical output while productivity and cost of grinding are the system output.The
transformation is the actual physical process or microscopic interactions taking place in the grinding zone[5].
A. Microscopic Interactions in Grinding Process:
In any machining process, one can easily recognize the transformation as the resultant of the interference between the tool and the work material. In case of grinding process it would be the grinding wheel and the work material and the interference region is called the “Grinding zone” [6]. In grinding zone grinding wheel interacts with the component to remove work material in the form of chips. Normal and tangential forces are generated between the grinding wheel and workpiece [7].These forces will cause the abrasive grain of the grinding wheel to penetrate the workpiece.
A grain that cuts deeply into the workpiece carves out a chip whereas a grain that rubs without penetration causes mild wear that may be hardly detectible. There is a third scenario where grains penetrate and plough the work materials causing ridges without removing material [8]. These interactions are classified as cutting, sliding and ploughing respectively.
A grinding wheel is composed of thousands of small abrasive grains held together by a bonding material [9]. If this matrix material is not sufficiently recessed it remains close to the periphery of the wheel and is likely to slide against the work material.
Finally, the chips that are produced in-situ at the grinding zone, are likely to be trapped between the adjacent grains in the grinding wheel and the work material. Hence they will be forced to slide against the bond material or work material until they are ejected out.
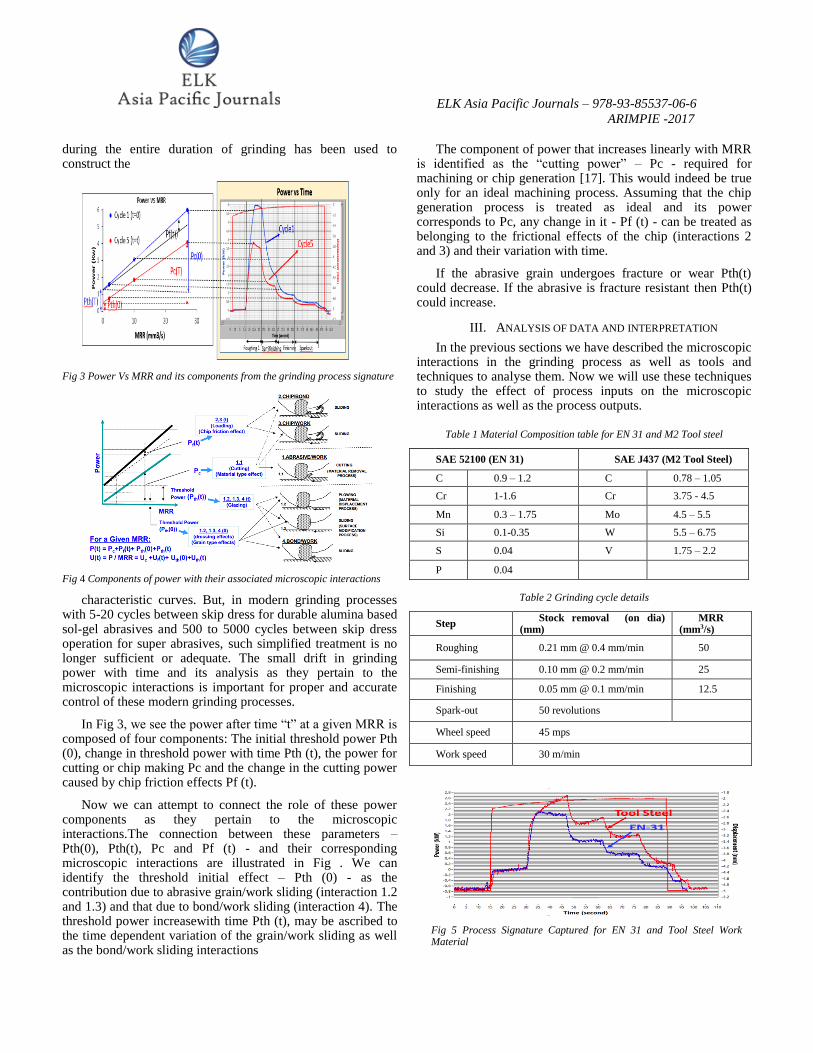
As a result all interferences in the grinding zone can be visualized as a combination of the six interactions listed below.

ELK Asia Pacific Journals – 978-93-85537-06-6
ARIMPIE -2017
1. Abrasive /work interaction:
1.1 Cutting Machining 1.2 PloughingDeformation
1.3 Sliding Sliding 2. Chip / Bond interaction Sliding 3. Chip / Work interaction Sliding 4. Bond/Work interaction Sliding
These interactions illustrated in Error! Reference source not found.[10] may be called as microscopic interactions.
B. Grind-TrakTM as a tool for measurement and analysis of in-process signals:
The mechanics of material removal in grinding is complex to visualize, as it is a combination of the six interactions mentioned above. Due to this reason the process has traditionally been treated as a black box known only to a few with many years of experience and specialized skill in the shop floor [11]. As, such individuals are very few, there is a requirement of an instrumentation system that can continuously monitor the grinding process signals and suggest suitable measures for process improvement.
Attempts have been made by monitoring the grinding process variables with different signals such as acoustic emission, force, pressure, temperature and power [4]. In comparison to measuring grinding force which is quite complex and expensive [12], monitoring the grinding power is far easier [13][14].This philosophy provided the base for developing a portable diagnostic tool for on-line monitoring of the grinding process. This power sensor along with an in-feed displacement sensor constitutes the diagnostic tool developed by the research work at IIT– M[5]. Micromatic Grinding Technologies (MGT) has adapted this basic work and developed it into a practical and commercially viable solution called Grind-TrakTM
Grind-TrakTMconsists of the following components:
Power cell which is connected to the grinding wheel
spindle to monitor the power drawn by wheel spindle
motor.
LVDT (i.e.) displacement transducer which is held in
a mount that provides a fixed reference point on bed.
The plunger of the LVDT senses the feed movement
of the grinding wheel-head.
Data Acquisition Unit (DAQ) which converts the
analog output from the two sensors into digital data
Grind-TrakTM Software, a LabVIEW based software
to visualize and analyze the process signals
Fig 2 shows a schematic diagram of the Grind TrakTM and the signals collected. Fig 3 shows further extraction of information from these signals. We shall discuss the use of such in-process derived data and information in the following sections.
C. Analysis of Grinding Process:
Many Grinding processes consist of a sequence of wheel/work interactions that are progressively reduced in intensity. This sequence is often referred to as the “Grinding cycle”[15]. Each level of grinding intensity is referred to as rough, semi-finish and finish grinding with its corresponding material removal rate (MRR). In Fig 3 we observe rough, semi-finish and finish grind corresponding to three MRR values from the data obtained in an external plunge cylindrical grinding process. We can use these process signals to construct the P vs. MRR graph for the grinding cycle. This is one of the characteristic curves well documented in literature used to understand the grinding process [16]. The intercept on the Y-axis is treated as the threshold component or Pth.
In Fig 3 we have also superimposed the power signal from the first and the fifth cycle corresponding to components 1 to 5. When we generate the P vs. MRR graph for the fifth cycle we find that the threshold power has changed as well as the slope of the P Vs. MRR graph. In classical analysis of the grinding process such variation in power with time has been ignored. Instead the average value of power at any MRR,
Fig 2 Schematic Diagram of Grind-TrakTM connected to cylindrical grinding machine
ELK Asia Pacific Journals – 978-93-85537-06-6
ARIMPIE -2017
during the entire duration of grinding has been used to construct the
Fig 3 Power Vs MRR and its components from the grinding process signature
Fig 4 Components of power with their associated microscopic interactions
characteristic curves. But, in modern grinding processes with 5-20 cycles between skip dress for durable alumina based sol-gel abrasives and 500 to 5000 cycles between skip dress operation for super abrasives, such simplified treatment is no longer sufficient or adequate. The small drift in grinding power with time and its analysis as they pertain to the microscopic interactions is important for proper and accurate control of these modern grinding processes.
In Fig 3, we see the power after time “t” at a given MRR is composed of four components: The initial threshold power Pth (0), change in threshold power with time Pth (t), the power for cutting or chip making Pc and the change in the cutting power caused by chip friction effects Pf (t).
Now we can attempt to connect the role of these power components as they pertain to the microscopic interactions.The connection between these parameters – Pth(0), Pth(t), Pc and Pf (t) - and their corresponding microscopic interactions are illustrated in Fig . We can identify the threshold initial effect – Pth (0) - as the contribution due to abrasive grain/work sliding (interaction 1.2 and 1.3) and that due to bond/work sliding (interaction 4). The threshold power increasewith time Pth (t), may be ascribed to the time dependent variation of the grain/work sliding as well as the bond/work sliding interactions
The component of power that increases linearly with MRR is identified as the “cutting power” – Pc - required for machining or chip generation [17]. This would indeed be true only for an ideal machining process. Assuming that the chip generation process is treated as ideal and its power corresponds to Pc, any change in it - Pf (t) - can be treated as belonging to the frictional effects of the chip (interactions 2 and 3) and their variation with time.
If the abrasive grain undergoes fracture or wear Pth(t) could decrease. If the abrasive is fracture resistant then Pth(t) could increase.
III. ANALYSIS OF DATA AND INTERPRETATION
In the previous sections we have described the microscopic interactions in the grinding process as well as tools and techniques to analyse them. Now we will use these techniques to study the effect of process inputs on the microscopic interactions as well as the process outputs.
Table 1 Material Composition table for EN 31 and M2 Tool steel
SAE 52100 (EN 31) SAE J437 (M2 Tool Steel)
C 0.9 – 1.2 C 0.78 – 1.05
Cr 1-1.6 Cr 3.75 - 4.5
Mn 0.3 – 1.75 Mo 4.5 – 5.5
Si 0.1-0.35 W 5.5 – 6.75
S 0.04 V 1.75 – 2.2
P 0.04
Table 2 Grinding cycle details
Step Stock removal (on dia)
(mm) MRR
(mm3/s)
Roughing 0.21 mm @ 0.4 mm/min 50
Semi-finishing 0.10 mm @ 0.2 mm/min 25
Finishing 0.05 mm @ 0.1 mm/min 12.5
Spark-out 50 revolutions
Wheel speed 45 mps
Work speed 30 m/min
Fig 5 Process Signature Captured for EN 31 and Tool Steel Work Material
ELK Asia Pacific Journals – 978-93-85537-06-6
ARIMPIE -2017
A. Effect of Work Material Types
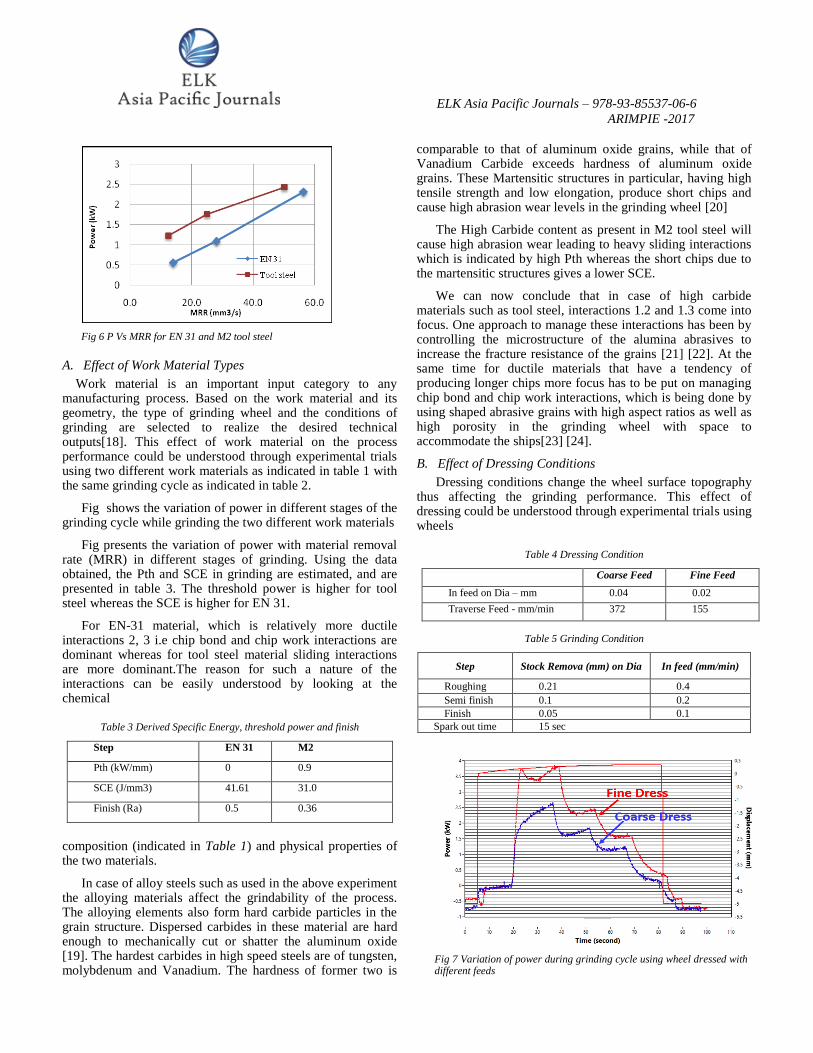
Work material is an important input category to any manufacturing process. Based on the work material and its geometry, the type of grinding wheel and the conditions of grinding are selected to realize the desired technical outputs[18]. This effect of work material on the process performance could be understood through experimental trials using two different work materials as indicated in table 1 with the same grinding cycle as indicated in table 2.
Fig shows the variation of power in different stages of the grinding cycle while grinding the two different work materials
Fig presents the variation of power with material removal rate (MRR) in different stages of grinding. Using the data obtained, the Pth and SCE in grinding are estimated, and are presented in table 3. The threshold power is higher for tool steel whereas the SCE is higher for EN 31.
For EN-31 material, which is relatively more ductile interactions 2, 3 i.e chip bond and chip work interactions are dominant whereas for tool steel material sliding interactions are more dominant.The reason for such a nature of the interactions can be easily understood by looking at the chemical
Table 3 Derived Specific Energy, threshold power and finish
Step EN 31 M2
Pth (kW/mm) 0 0.9
SCE (J/mm3) 41.61 31.0
Finish (Ra) 0.5 0.36
composition (indicated in Table 1) and physical properties of the two materials.
In case of alloy steels such as used in the above experiment the alloying materials affect the grindability of the process. The alloying elements also form hard carbide particles in the grain structure. Dispersed carbides in these material are hard enough to mechanically cut or shatter the aluminum oxide [19]. The hardest carbides in high speed steels are of tungsten, molybdenum and Vanadium. The hardness of former two is
comparable to that of aluminum oxide grains, while that of Vanadium Carbide exceeds hardness of aluminum oxide grains. These Martensitic structures in particular, having high tensile strength and low elongation, produce short chips and cause high abrasion wear levels in the grinding wheel [20]
The High Carbide content as present in M2 tool steel will cause high abrasion wear leading to heavy sliding interactions which is indicated by high Pth whereas the short chips due to the martensitic structures gives a lower SCE.
We can now conclude that in case of high carbide materials such as tool steel, interactions 1.2 and 1.3 come into focus. One approach to manage these interactions has been by controlling the microstructure of the alumina abrasives to increase the fracture resistance of the grains [21] [22]. At the same time for ductile materials that have a tendency of producing longer chips more focus has to be put on managing chip bond and chip work interactions, which is being done by using shaped abrasive grains with high aspect ratios as well as high porosity in the grinding wheel with space to accommodate the ships[23] [24].
B. Effect of Dressing Conditions
Dressing conditions change the wheel surface topography thus affecting the grinding performance. This effect of dressing could be understood through experimental trials using wheels
Table 4 Dressing Condition
Coarse Feed Fine Feed
In feed on Dia – mm 0.04 0.02
Traverse Feed - mm/min 372 155
Table 5 Grinding Condition
Step Stock Remova (mm) on Dia In feed (mm/min)
Roughing 0.21 0.4
Semi finish 0.1 0.2
Finish 0.05 0.1
Spark out time 15 sec
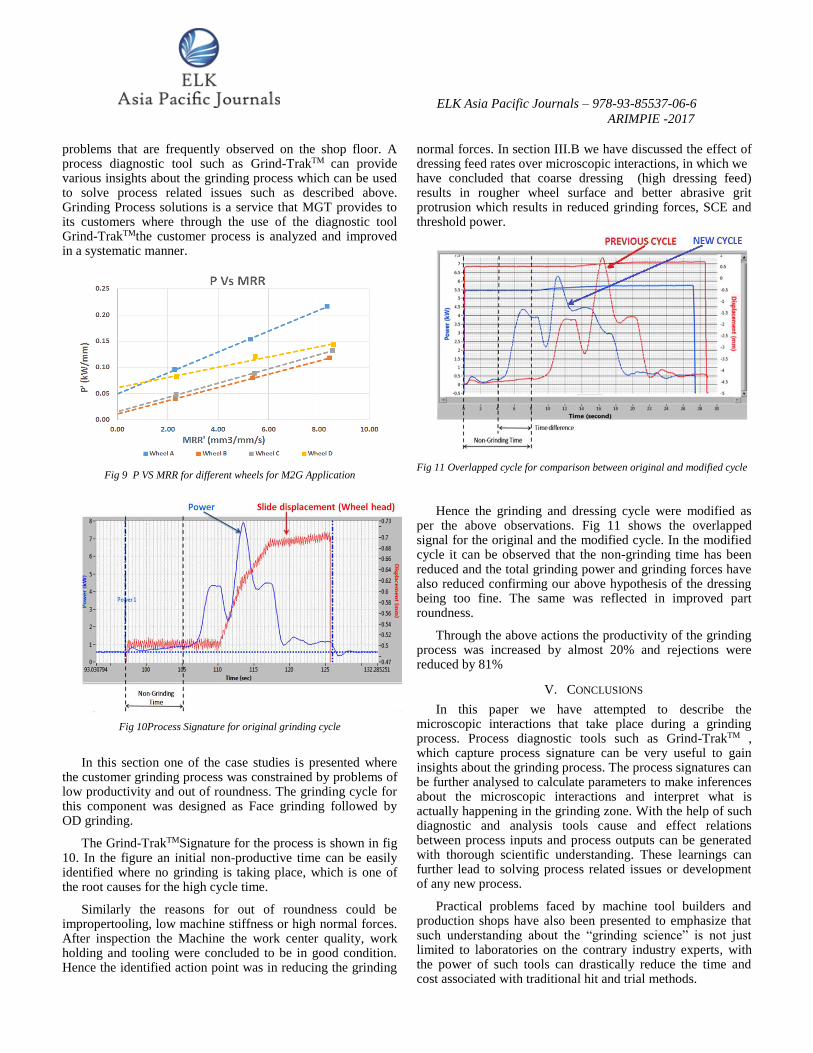
Fig 7 Variation of power during grinding cycle using wheel dressed with different feeds
Fig 6 P Vs MRR for EN 31 and M2 tool steel

ELK Asia Pacific Journals – 978-93-85537-06-6
ARIMPIE -2017
dressed with two different dressing conditions as indicated in Table 4, using the same grinding cycle as indicated in Table 5.
Fig 7shows the variation of grinding power during different stages of the grinding cycle. It can be seen that higher power is drawn in the grinding cycle with fine dressed wheel. The signals in Fig 7 can be processed to generate the PowerVs. Material Removal Rate graphs (Fig 8) and the derived parameters can be extracted from it and tabulated as noted in Table.6.
The Lower SCE in coarse dressing suggests bond fracture resulting in rougher wheel surface leading to larger chip space and consequently lower chip friction effects. It is also reflected in the associated poor surface finish as illustrated inTable 6. Higher SCE in case of fine dressing can be attributed to fine wheel topography, less chip space and consequently higher chip friction effects. Although fine dressing condition result in better surface finish (as indicated in Table 6) they also lead to higher grinding power and forces as can be seen inFig 7.
Table 6 Derived Specific cutting energy and Threshold Power
Coarse Feed Fine Feed
Pth –W/mm 0.9 1.030
SCE- J/mm3 31.08 50.55
Ra- μm 0.36 0.24
IV. POTENTIAL USES OF GRIND-TRAK
We have described Grind-TrakTM as a diagnostic tool and how it can be used to analyse the grinding process using controlled test conditions. Now we shall discuss its application in real world situations.
A. Develop a New Grinding Process
In this section we describe how the power signals obtained from Grind-TrakTM and the analysis of microscopic interactions have been used to implement an advanced grinding process known as Machining to Grinding (M2G).The interactions illustrated in Fig can be stated as: Grinding = Machining (Interactions 1.1) + Tribology (Interactions 1.2, 1.3,2,3 and 4).
Then could we think of: (Grinding – Tribology) = Machining (achieved using abrasive tools)
The tribological interactions may not be truly eliminated however for the M2G process to be viable we will need the energy consumed for chip making during grinding (SCE) to be comparable to that during machining operations. Experimental results have been reported that show the SCE in grinding processes comparable to that achieved in machining. This leads us to the possibility to conceive of Machining to Grinding (M2G) as a new process concept [25] to bring the best advantages of the principles of machining together with the flexibility of abrasive finishing processes.
Table 7Threshold power, G-ratio value for different wheels
Bonded abrasive tools with filamentary sol-gel abrasive grains [26] are suitable for such an application owing to their high hardness and toughness. “Ceramic” Grinding wheels with such abrasives, were collected from a number of manufacturers [27][28][29] to understand the wheel performance and further optimize the wheel specification in terms of type and percentage of abrasive, bond content etc. Super abrasives were deemed unsuitable for such heavy material removal due to high overall process cost. Each of the Grinding wheels has gone through a series of experiments to extract various derived parameters. Fig depicts the P Vs. MRR graph and. Values of Pth, SCE and G-Ratio extracted from these graphs is depicted in Table 7.Through table 7 we can observe that the SCE for all the wheels is low and within the desirable range for M2G [30].
With these tests we can conclude that for the success of this M2G process we require premium fracture resistant abrasives. With Reference to Section III.A, we can also conclude that since the tool steel is being used as the work material hence chip Friction interactions will not be dominant and there is a scope to increase the bond content to enhance the wheel’s capability to retain the abrasive grain.
Hence through the use of Grind-TrakTMprocess signature has been captured which is being used to further understand the microscopic interactions and how they need to be manipulated to develop novel a grinding process solutions.
B. Grinding Process Solutions (GPS)
Due to the complex nature of the interactions described in Section II.A, it is difficult to realize consistent results in grinding [31]. Problems such as high cycle time, size variations, burn, chatter marks, poor tool life are a few
Wheel A B C D
MRRl 8.5 8.5 8.5 8.5
Pth (kW) 0.05 0.01 0.02 0.06
SCE (J/mm3) 19.89 12.66 13.56 9.77
G- Ratio 0.97 0.68 1.31 5.44
Fig 8 P Vs MRR for different dressing conditions
ELK Asia Pacific Journals – 978-93-85537-06-6
ARIMPIE -2017
problems that are frequently observed on the shop floor. A process diagnostic tool such as Grind-TrakTM can provide various insights about the grinding process which can be used to solve process related issues such as described above. Grinding Process solutions is a service that MGT provides to its customers where through the use of the diagnostic tool Grind-TrakTMthe customer process is analyzed and improved in a systematic manner.
Fig 9 P VS MRR for different wheels for M2G Application
Fig 10Process Signature for original grinding cycle
In this section one of the case studies is presented where
the customer grinding process was constrained by problems of low productivity and out of roundness. The grinding cycle for this component was designed as Face grinding followed by OD grinding.
The Grind-TrakTMSignature for the process is shown in fig 10. In the figure an initial non-productive time can be easily identified where no grinding is taking place, which is one of the root causes for the high cycle time.
Similarly the reasons for out of roundness could be impropertooling, low machine stiffness or high normal forces. After inspection the Machine the work center quality, work holding and tooling were concluded to be in good condition. Hence the identified action point was in reducing the grinding
normal forces. In section III.B we have discussed the effect of dressing feed rates over microscopic interactions, in which we have concluded that coarse dressing (high dressing feed) results in rougher wheel surface and better abrasive grit protrusion which results in reduced grinding forces, SCE and threshold power.
Fig 11 Overlapped cycle for comparison between original and modified cycle
Hence the grinding and dressing cycle were modified as per the above observations. Fig 11 shows the overlapped signal for the original and the modified cycle. In the modified cycle it can be observed that the non-grinding time has been reduced and the total grinding power and grinding forces have also reduced confirming our above hypothesis of the dressing being too fine. The same was reflected in improved part roundness.
Through the above actions the productivity of the grinding process was increased by almost 20% and rejections were reduced by 81%
V. CONCLUSIONS
In this paper we have attempted to describe the microscopic interactions that take place during a grinding process. Process diagnostic tools such as Grind-TrakTM , which capture process signature can be very useful to gain insights about the grinding process. The process signatures can be further analysed to calculate parameters to make inferences about the microscopic interactions and interpret what is actually happening in the grinding zone. With the help of such diagnostic and analysis tools cause and effect relations between process inputs and process outputs can be generated with thorough scientific understanding. These learnings can further lead to solving process related issues or development of any new process.
Practical problems faced by machine tool builders and production shops have also been presented to emphasize that such understanding about the “grinding science” is not just limited to laboratories on the contrary industry experts, with the power of such tools can drastically reduce the time and cost associated with traditional hit and trial methods.

ELK Asia Pacific Journals – 978-93-85537-06-6
ARIMPIE -2017
We hope this methodology and understanding of the
microscopic interactions will lead to a more scientific approach while addressing any problems or new developments related to the grinding process.
VI. ACKNOWLEDGEMENT
The authors express their sincere thanks toDr. K (Subbu) Subramanian, President, STIMS Institute Inc. USA, for introducing us to this opportunity, for his continuous support, mentoring and feedback that made this paper possible. We are highly indebted to Mr. N.K.Dhand, Chairman, and Mr. Mahesh Samaria, General Manager, Micromatic Grinding Technologies Ltd for providing the support, resources and encouragement for writing this technical paper. The authors also wish to acknowledge the role of many colleagues, suppliers and customers’ whose collaboration was vital in generating the data presented in this paper.
References
[1] Lindsey R, King R and Hahn R, “Principles of Grinding.,” in Handbook of Modern Grinding Technologies, New york, chapman and Hill, 1986.
[2] Subramaniam K, “Application of system approach to precision grinding process,” GIAN Couse conducted at Indian Institute of Technologies Madras, Chennai, 2015.
[3] Malkin S and Guo C, Grinding Technologies, New york: Industrial Press, 2008.
[4] Tonshoff H K, Friemuth T and Becker J C, “Process Monitoring in Grinding,” CIRP Annals - Manufacturing Technology, vol. 51, no. 2, pp. 551-557, 2002.
[5] Vairamuthu R, Brij M Bhushan, Srikanth R and Ramesh Babu N, “Performance Analysis of Cylindrical Grinding Process with a Portable Diagnostic Tool,” AIMTDR’14, vol. 582, pp. 1-6, 2014.
[6] Subramaniam K, Anant Jain, Vairamuthu M and Brij M Bhushan, “Tribology as an Enabler for Innovation in Surface Generation Process,” IMECE'15, pp. 1-11, 2015.
[7] W. Brian Rowe, Principle of modern grinding technology, Burlington, MA 01803, USA: William Andrew, 2009.
[8] Hahn RS, “On the Mechanics of the Grinding Process under Plunge Cut Conditions,” Trans ASME, Journal of Engineering for Industry, pp. 72-80, 1966.
[9] S. George, “Cutting Tool Applications Chapter 16: Grinding Wheels and Operations,” American machinist, 27 Jan 2011. [Online]. Available: http://americanmachinist.com/machining-cutting/cutting-tool-applications-chapter-16-grinding-wheels-and-operations.
[10] K. Subramanian, “Finishing Using Multiple Cutting Edges,” ASM Handbook , p. 107, 1990.
[11] K. Subramanian , “Bringing the Science to Shop Floor Manufacturing,” Efficient Manufacturing , pp. 42-46,
Feburary 2016.
[12] Jermiah A Couey, Eric R Marsh, Byron R Knapp and Ryan Vallance R, “Monitoring Force in Precison Cylindrical Grinding,” Precision Engineering, 2005.
[13] Wei TIan, “Signature analysis of OD grinding process with application in monitoring and diagnosis,” Worcester Polytechnic Institute, MS thesis, 2009.
[14] Karpuschewski B, Wehmeier M and Inasaki l, “Grinding Monitoring System based on power and acoustic emission sensors,” CIRP Annals- Manufacturing Technology, vol. 49, no. 1, pp. 235-240, 2000.
[15] S. Malkin and C. Guo, in Grinding Technology: Theory and Application of Machining with Abrasives, New York, Industrial Press, pp. 319-321.
[16] R. P. Lindsay, “Principles of Grinding,” in Handbook of Mordern Grinding Technology, New York, King R and Hahn R., ed., Chapman and Hall, 1986.
[17] G. Xiao, S. Malkin and K. Danai, “Intelligent Control of Cylindrical Plunge Grinding,” American Control Conference, pp. 391 - 399, 1992.
[18] K. Subramanian, “Finishing Methods Using Multiple or Random cutting Edges,” Surface Engineering, Vols. Section 3C, Vol. 5, no. ,published by the American Society for Materials, 1995.
[19] S. Malkin and C. Guo, in Grinding Technology: Theory and Application of Machining with Abrasives , New York , Industrial Press , 2008, p. 303.
[20] I. D. Marinescu, M. Hitchiner, E. Uhlmann, W. B. Rowe and I. Inasaki, in Handbook of Machining with Grinding Wheels , Florida , CRC Press , 2007, p. 260.
[21] R. A. Rowse and G. R. Watson, “Zirconia-Alumina Abrasive Grain and Grinding Tools”. U.S. Patent 3891408, 1975.
[22] D. G. Haynes, “Alumina Bonded Abrasive for Cast Iron”. U.S. Patent 5139539, 1991.
[23] E. P. Vanstrum , J. R. Simons and S. R. Culler, “Precisely Shaped Grain (PSG): 3M's Innovation in Abrasive Grain Technology,” 3M Abrasive Systems Division. [Online].
[24] P. Braun , D. O. Yenner , J. H. Czerepinski, R. Bauer, K. Subramanian, R. M. Bright , A. Seth and G. G. Landford, “Shaped Abrasive Particle and Method of Forming Shape”. Patent 8840695, 2014.
[25] J. R. Besse, D. C. Graham, K. Subramanian , S. Ramanath and M. A. Lamourex, “Abrasive Tool and a Method for finishing complex shapes in Workpieces”. US Patent 8911283, 2014.
[26] I. D. Marinescu, M. Hitchiner, E. Uhlman, B. Rowe and I. Inasaki, “Seeded Gel Abrsaives,” in Handbook of Machining with Grinding Wheels , Boca Raton , CRC Press , 2007, p. 80.
[27] “Tyrolit CSS Ultra Product Information,” Tyrolit A company of the SWARVOSKI group , [Online].

ELK Asia Pacific Journals – 978-93-85537-06-6
ARIMPIE -2017
Available: http://www.tyrolit.at/fileadmin/products/doc/0b8dd0e833e7_20055196-gb-0115_css_ultra_rz_low.pdf.
[28] “3M Cubitron Precision Shaped Abrasive Grain,” 3M , [Online]. Available: http://solutions.3mindia.co.in/wps/portal/3M/en_IN/Abrasive_Systems/Home/Technologies/one/.
[29] B. Cole , “Saint-Gobain Abrasives Launches Breakthrough Vortex Technology for Creep Feed Grinding,” 11 April 2005 . [Online]. Available: http://www.businesswire.com/news/home/20050411005698/en/Saint-Gobain-Abrasives-Launches-Breakthrough-Vortex-Technology-Creepfeed.
[30] K. Subramanian, J. W. Webster and P. Caputa, “Method for Grinding Complex Shapes”. US Patent 7708619 B2, 2010.
[31] K. Subramanian and R. P. Lindsay, “A Systems Approach for the Use of Vitrified Bonded Superabrasive Wheels for Precision Production Grinding,” ASME Transactions, Journal of Engineering for Industry, vol. 114, pp. 41-52, 1992.
[32] R. P. Lindsay, “Principles of Grinding,” in Handbook of Mordern Grinding Technology, New York, King R. and Hahn R., ed., Chapman and Hall, chap 2, 1986.