PORTABLE VOLTAMMETRIC DEVICE FOR DETECTING ...
99
PORTABLE VOLTAMMETRIC DEVICE FOR DETECTING HEAVY METAL CONTAMINATION PHAKHAMON THIPNET A DISSERTATION SUBMITTED IN PARTIAL FULFILLMENT OF THE REQUIREMENTS FOR THE DOCTOR DEGREE OF PHILOSOPHY IN ENVIRONMENTAL SCIENCE FACULTY OF SCIENCE BURAPHA UNIVERSITY DECEMBER 2016 COPYRIGHT OF BURAPHA UNIVERSITY
-
Upload
khangminh22 -
Category
Documents
-
view
0 -
download
0
Transcript of PORTABLE VOLTAMMETRIC DEVICE FOR DETECTING ...

i
PORTABLE VOLTAMMETRIC DEVICE FOR DETECTING HEAVY
METAL CONTAMINATION
PHAKHAMON THIPNET
A DISSERTATION SUBMITTED IN PARTIAL FULFILLMENT OF
THE REQUIREMENTS FOR THE DOCTOR DEGREE OF
PHILOSOPHY IN ENVIRONMENTAL SCIENCE
FACULTY OF SCIENCE
BURAPHA UNIVERSITY
DECEMBER 2016
COPYRIGHT OF BURAPHA UNIVERSITY


iii
ACKNOWLEDGEMENT
This Ph.D. dissertation was written based on my research work carried out at
Graduate School Program in Environmental Science, Faculty of Science, Burapha
University. I would like to express my sincere gratitude and deep appreciation to my
major advisor, Asst. Prof. Dr. Pichan Sawangwong and and my Co-advisor,
Asst. Prof. Dr. Chaisak Issro, for all of their guidance and valuable advice throughout
this study.
I would also like to express my heartfelt gratitude to principal examiner
Dr. Palakorn Boonsai, Asst. Prof. Dr. Pichan Sawangwong, Asst. Prof. Dr. Chaisak
Issro, and Dr. Thanawee Chodjarusawad as examining committees for giving me
valuable guidance and expertise in research and taking up the examination job.
I would like to acknowledge all faculty staffs and friends at Burapha
University, Great appreciation is also given to Satit “Piboonbumpen” Burapha
University, my working organization, for giving me a chance to continue my study in
the Doctor Degree of Philosophy in Environmental Science at Burapha University.
For all of the lecturers, staffs, and friends in Graduate School Program in
Environmental Science, Burapha University, sincere thanks for your support,
attention, and motivation.
Finally, heartfelt thanks to my family, my husband Mr.Panitan Thipnet and
my two sons for persistent and endless support thorough my life and the long years of
study. Great respect to Asst. Prof. Dr. Pichan Sawangwon for your loving, patience,
caretaking, attention, and support throughout my study in both of Burapha University.
I offer special thanks to all my friends for your giving kindness, helping, solidarity,
and togetherness.
Phakhamon Thipnet
iv
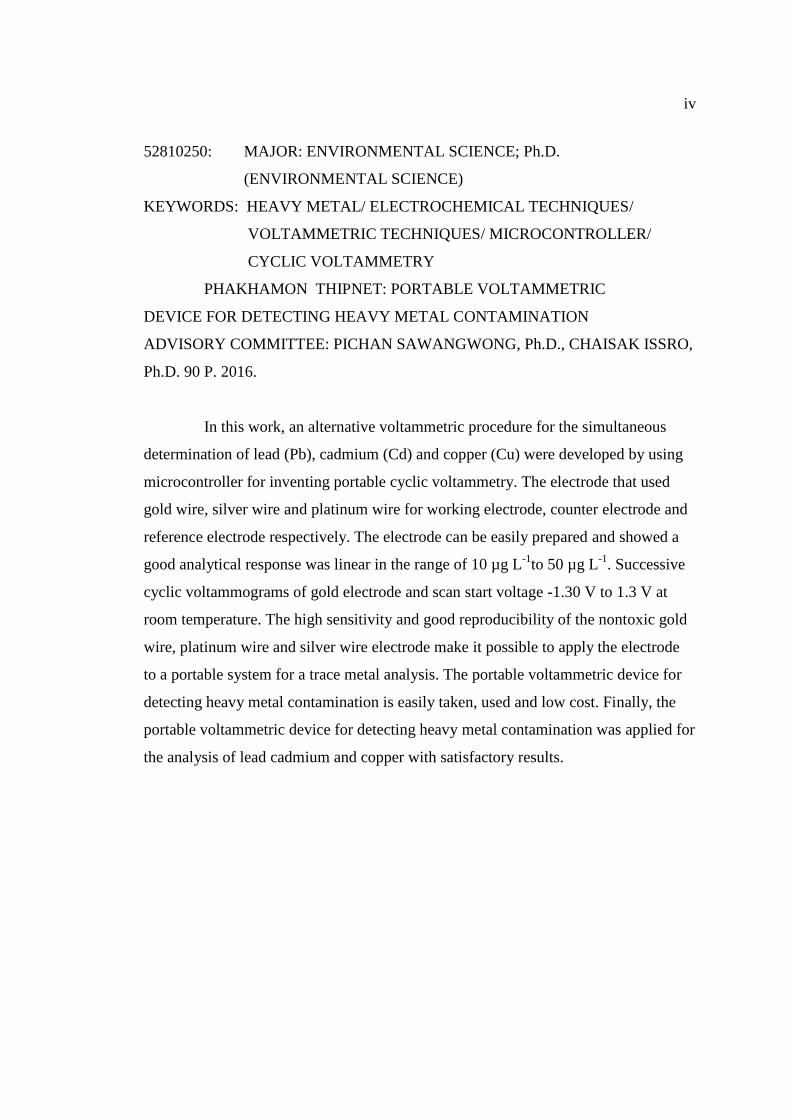
52810250: MAJOR: ENVIRONMENTAL SCIENCE; Ph.D.
(ENVIRONMENTAL SCIENCE)
KEYWORDS: HEAVY METAL/ ELECTROCHEMICAL TECHNIQUES/
VOLTAMMETRIC TECHNIQUES/ MICROCONTROLLER/
CYCLIC VOLTAMMETRY
PHAKHAMON THIPNET: PORTABLE VOLTAMMETRIC
DEVICE FOR DETECTING HEAVY METAL CONTAMINATION
ADVISORY COMMITTEE: PICHAN SAWANGWONG, Ph.D., CHAISAK ISSRO,
Ph.D. 90 P. 2016.
In this work, an alternative voltammetric procedure for the simultaneous
determination of lead (Pb), cadmium (Cd) and copper (Cu) were developed by using
microcontroller for inventing portable cyclic voltammetry. The electrode that used
gold wire, silver wire and platinum wire for working electrode, counter electrode and
reference electrode respectively. The electrode can be easily prepared and showed a
good analytical response was linear in the range of 10 µg L-1
to 50 µg L-1
. Successive
cyclic voltammograms of gold electrode and scan start voltage -1.30 V to 1.3 V at
room temperature. The high sensitivity and good reproducibility of the nontoxic gold
wire, platinum wire and silver wire electrode make it possible to apply the electrode
to a portable system for a trace metal analysis. The portable voltammetric device for
detecting heavy metal contamination is easily taken, used and low cost. Finally, the
portable voltammetric device for detecting heavy metal contamination was applied for
the analysis of lead cadmium and copper with satisfactory results.

v
CONTENTS
Page ABSTRACT ............................................................................................................. iv
CONTENTS .............................................................................................................. v
LIST OF TABLES .................................................................................................. vii
LIST OF FIGURES ............................................................................................... viii
CHAPTER
1 INTRODUCTION ............................................................................................. 1
Statements and significance of the problems ............................................ 1
Objectives ................................................................................................. 2
Conceptual Framework ............................................................................. 2
Scope of Research ..................................................................................... 2
Expected Results ....................................................................................... 3
Definition of terms .................................................................................... 3
2 LITERATURE REVIEWS ................................................................................ 6
Heavy metal Analysis ............................................................................... 6
The Electrodes and Cell ............................................................................ 13
Cyclic voltammetry (CV) ......................................................................... 14
Microcontroller Arduino UNO r3 ............................................................. 17
3 RESEARCH METHODOLOGY ..................................................................... 18
Equipment and Apparatus ........................................................................ 18
Electronic Equipment for Portable voltammetric device ......................... 18
Chemicals ................................................................................................. 19
Solution Preparation................................................................................. 19
Experimental design................................................................................. 21
Step for study electrode efficiency .......................................................... 35
Procedure for GFAAS.............................................................................. 38

vi
CONTENTS (CONTINUED)
Chapter Page
4 RESULTS ......................................................................................................... 39
5 CONCLUSION................................................................................................. 55
Discussions .............................................................................................. 55
Conclusion ............................................................................................... 57
REFERENCES ........................................................................................................ 58
APPENDIX .............................................................................................................. 62
APPENDIX A ................................................................................................... 63
APPENDIX B ................................................................................................... 85
BIOGRAPHY .......................................................................................................... 90
vii
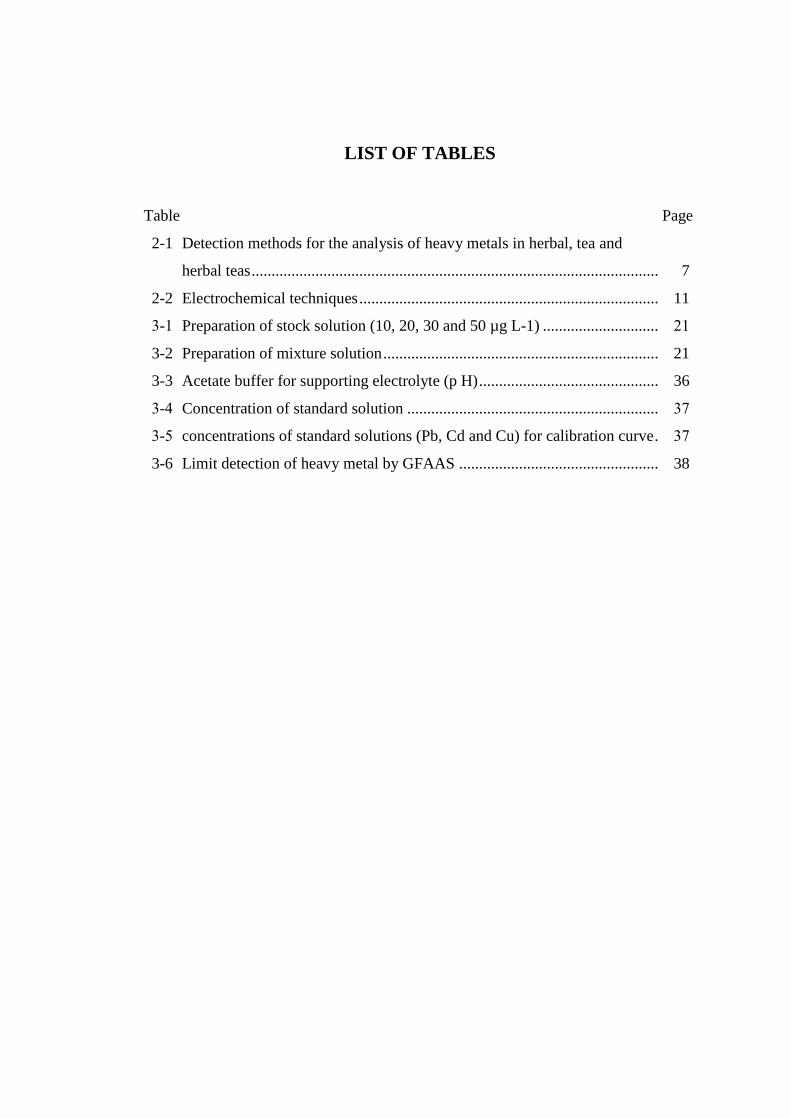
LIST OF TABLES
Table Page
2-1 Detection methods for the analysis of heavy metals in herbal, tea and
herbal teas ...................................................................................................... 7
2-2 Electrochemical techniques ........................................................................... 11
3-1 Preparation of stock solution (10, 20, 30 and 50 µg L-1) ............................. 21
3-2 Preparation of mixture solution ..................................................................... 21
3-3 Acetate buffer for supporting electrolyte (p H) ............................................. 36
3-4 Concentration of standard solution ............................................................... 37
3-5 concentrations of standard solutions (Pb, Cd and Cu) for calibration curve . 37
3-6 Limit detection of heavy metal by GFAAS .................................................. 38
viii
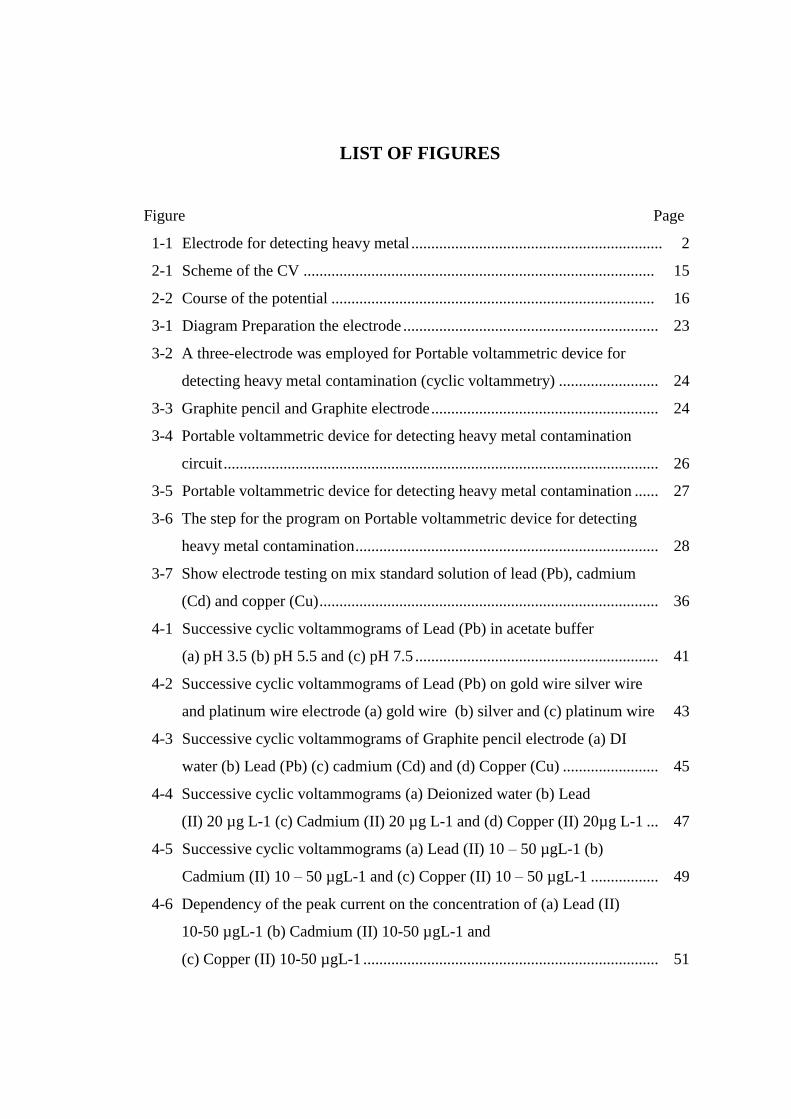
LIST OF FIGURES
Figure Page
1-1 Electrode for detecting heavy metal ............................................................... 2
2-1 Scheme of the CV ........................................................................................ 15
2-2 Course of the potential ................................................................................. 16
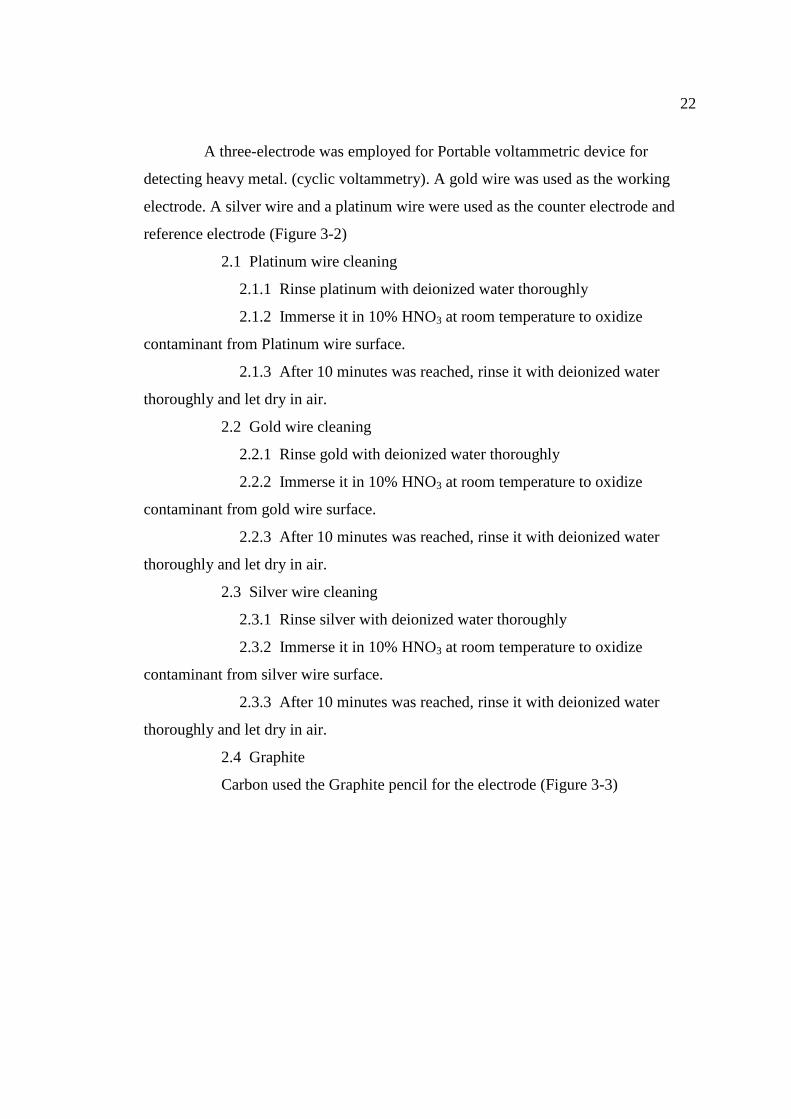
3-1 Diagram Preparation the electrode ................................................................ 23
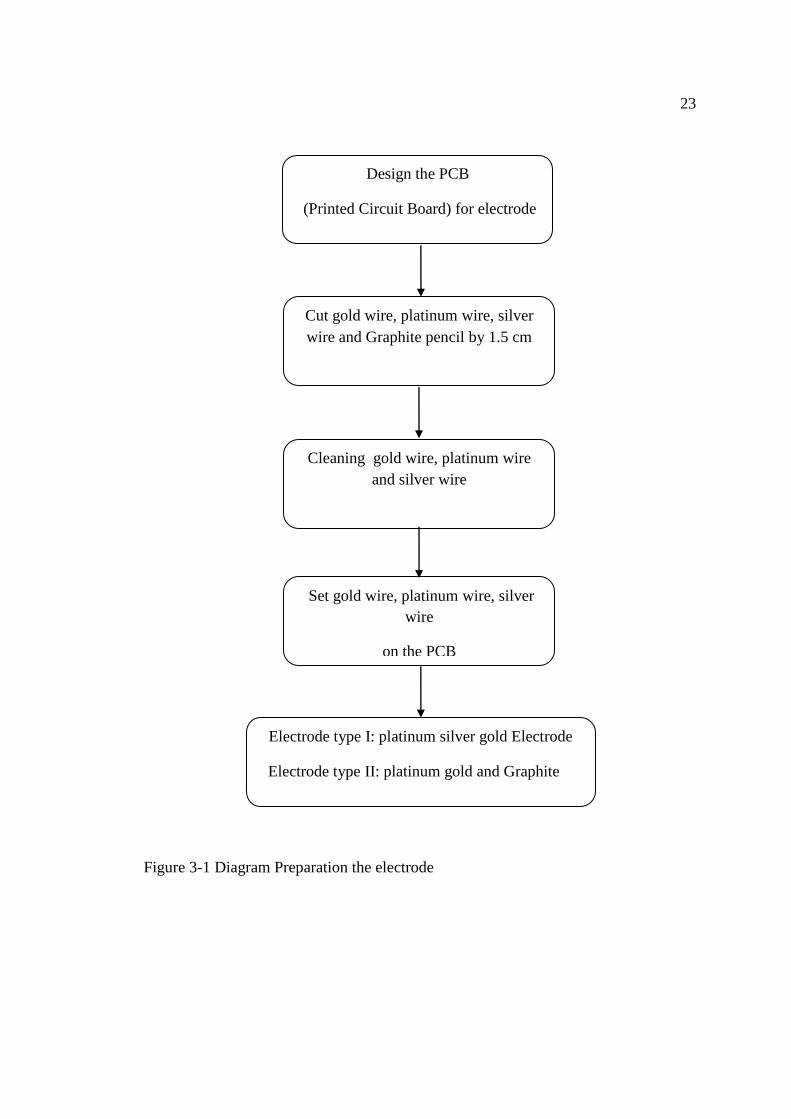
3-2 A three-electrode was employed for Portable voltammetric device for
detecting heavy metal contamination (cyclic voltammetry) ......................... 24
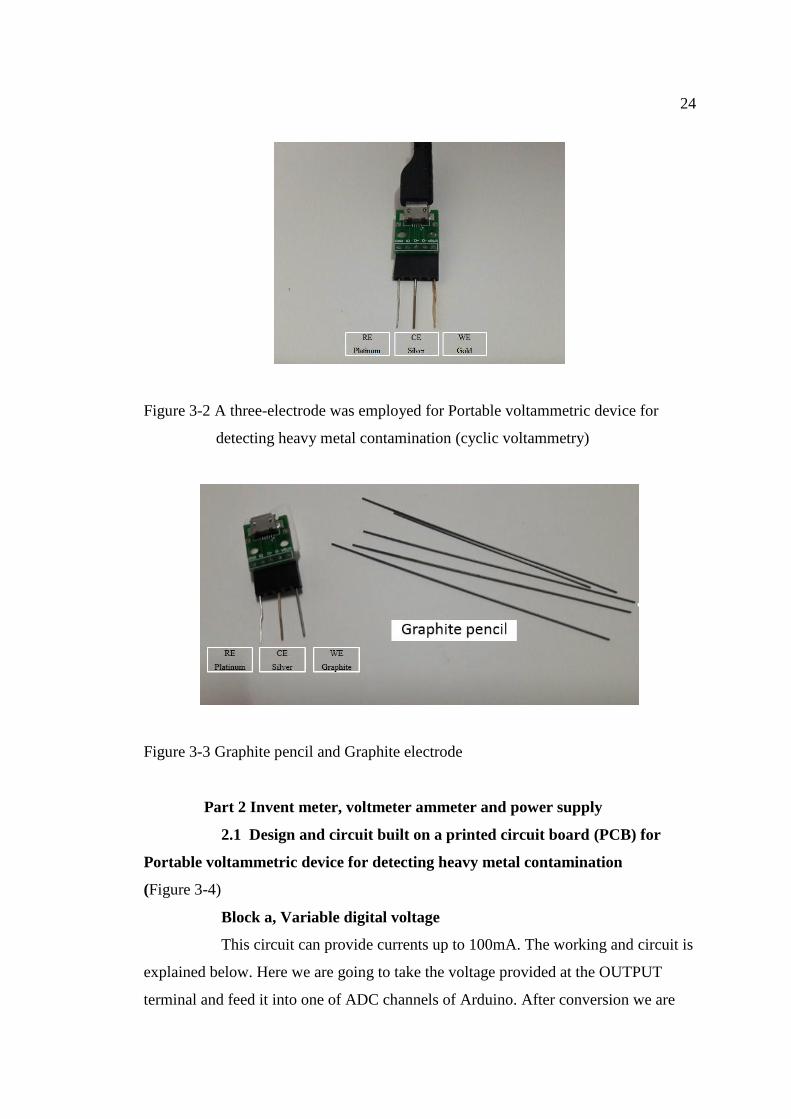
3-3 Graphite pencil and Graphite electrode ......................................................... 24
3-4 Portable voltammetric device for detecting heavy metal contamination
circuit ............................................................................................................. 26
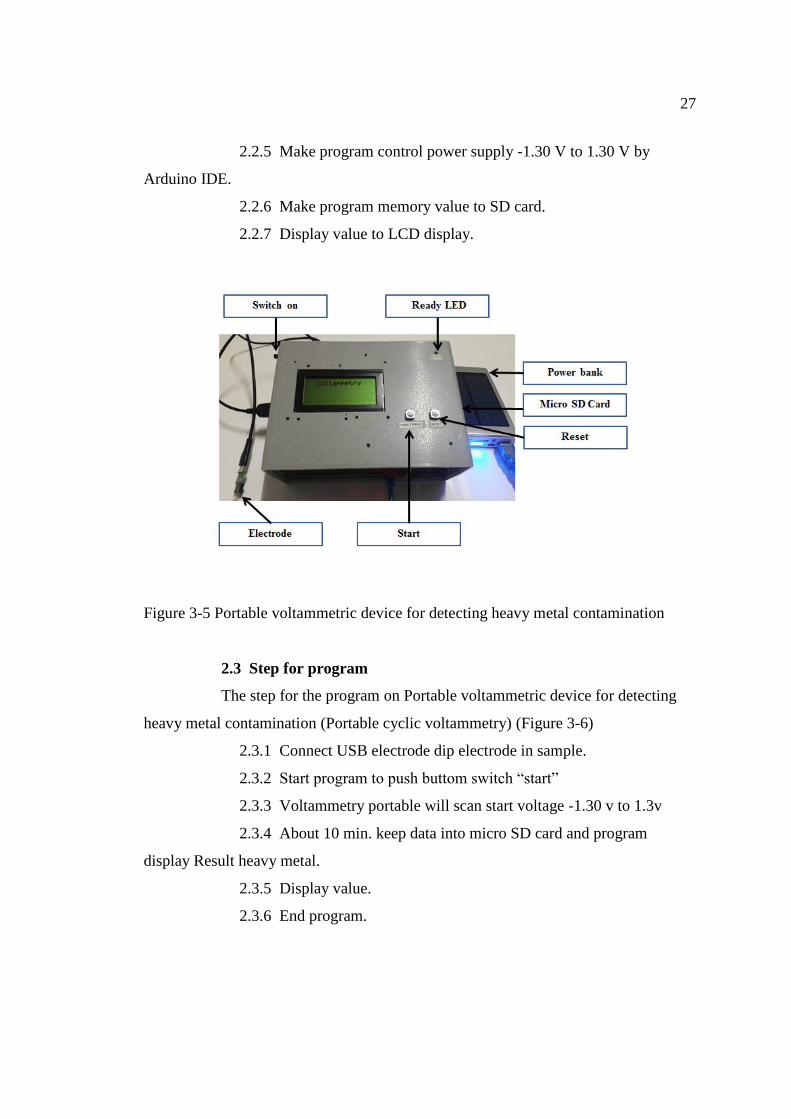
3-5 Portable voltammetric device for detecting heavy metal contamination ...... 27
3-6 The step for the program on Portable voltammetric device for detecting
heavy metal contamination ............................................................................ 28
3-7 Show electrode testing on mix standard solution of lead (Pb), cadmium
(Cd) and copper (Cu) ..................................................................................... 36
4-1 Successive cyclic voltammograms of Lead (Pb) in acetate buffer
(a) pH 3.5 (b) pH 5.5 and (c) pH 7.5 ............................................................. 41
4-2 Successive cyclic voltammograms of Lead (Pb) on gold wire silver wire
and platinum wire electrode (a) gold wire (b) silver and (c) platinum wire 43
4-3 Successive cyclic voltammograms of Graphite pencil electrode (a) DI
water (b) Lead (Pb) (c) cadmium (Cd) and (d) Copper (Cu) ........................ 45
4-4 Successive cyclic voltammograms (a) Deionized water (b) Lead
(II) 20 µg L-1 (c) Cadmium (II) 20 µg L-1 and (d) Copper (II) 20µg L-1 ... 47
4-5 Successive cyclic voltammograms (a) Lead (II) 10 – 50 µgL-1 (b)
Cadmium (II) 10 – 50 µgL-1 and (c) Copper (II) 10 – 50 µgL-1 ................. 49
4-6 Dependency of the peak current on the concentration of (a) Lead (II)
10-50 µgL-1 (b) Cadmium (II) 10-50 µgL-1 and
(c) Copper (II) 10-50 µgL-1 .......................................................................... 51

ix
LIST OF FIGURES (CONTINUED)
Figure Page
4-7 The results for the simultaneous detection of lead (Pb) cadmium (Cd) and
copper (Cu) in 5 sample water (a) sample water number 1 (b) sample water
number 2 (c) sample water number 3 (d) sample water number 4 (e)
sample water number 5 .................................................................................. 54
1
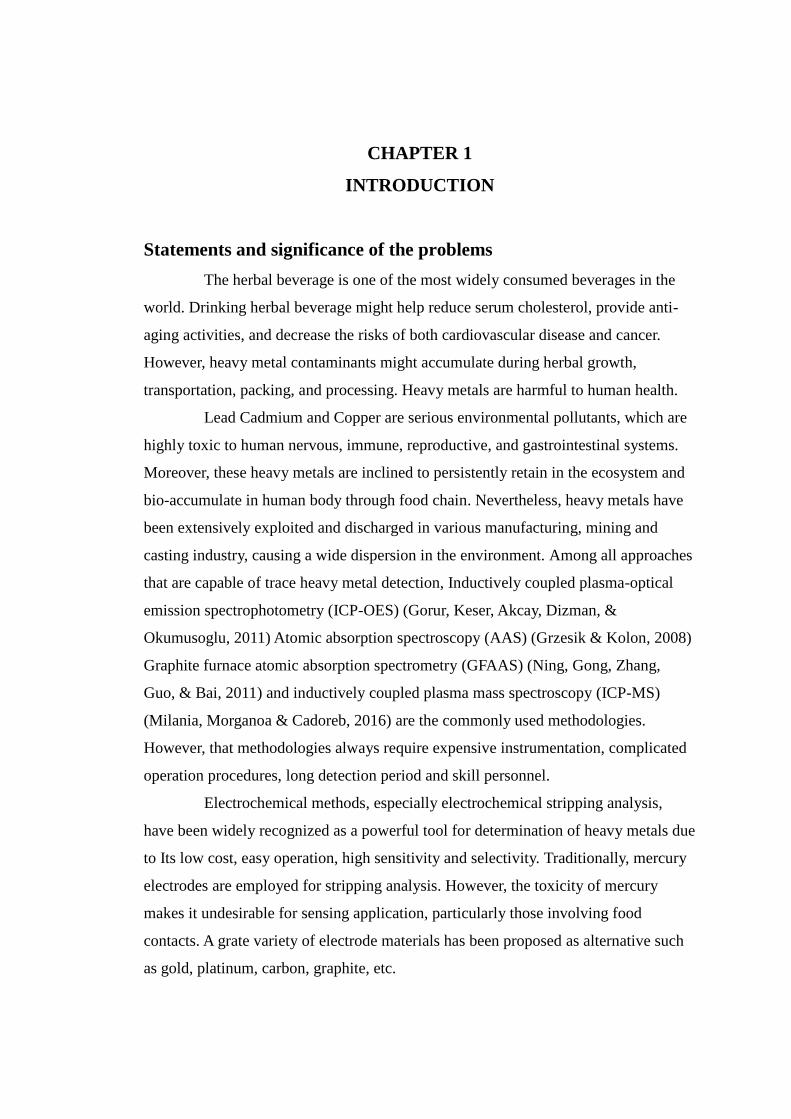
CHAPTER 1
INTRODUCTION
Statements and significance of the problems
The herbal beverage is one of the most widely consumed beverages in the
world. Drinking herbal beverage might help reduce serum cholesterol, provide anti-
aging activities, and decrease the risks of both cardiovascular disease and cancer.
However, heavy metal contaminants might accumulate during herbal growth,
transportation, packing, and processing. Heavy metals are harmful to human health.
Lead Cadmium and Copper are serious environmental pollutants, which are
highly toxic to human nervous, immune, reproductive, and gastrointestinal systems.
Moreover, these heavy metals are inclined to persistently retain in the ecosystem and
bio-accumulate in human body through food chain. Nevertheless, heavy metals have
been extensively exploited and discharged in various manufacturing, mining and
casting industry, causing a wide dispersion in the environment. Among all approaches
that are capable of trace heavy metal detection, Inductively coupled plasma-optical
emission spectrophotometry (ICP-OES) (Gorur, Keser, Akcay, Dizman, &
Okumusoglu, 2011) Atomic absorption spectroscopy (AAS) (Grzesik & Kolon, 2008)
Graphite furnace atomic absorption spectrometry (GFAAS) (Ning, Gong, Zhang,
Guo, & Bai, 2011) and inductively coupled plasma mass spectroscopy (ICP-MS)
(Milania, Morganoa & Cadoreb, 2016) are the commonly used methodologies.
However, that methodologies always require expensive instrumentation, complicated
operation procedures, long detection period and skill personnel.
Electrochemical methods, especially electrochemical stripping analysis,
have been widely recognized as a powerful tool for determination of heavy metals due
to Its low cost, easy operation, high sensitivity and selectivity. Traditionally, mercury
electrodes are employed for stripping analysis. However, the toxicity of mercury
makes it undesirable for sensing application, particularly those involving food
contacts. A grate variety of electrode materials has been proposed as alternative such
as gold, platinum, carbon, graphite, etc.
2
This research will be conducted to design and invent portable voltammetric
device for detecting heavy metal contamination.
Objectives
To design and invent portable voltammetric device for detecting heavy metal
contamination.
To study electrochemical techniques for detecting heavy metal.
To study successive cyclic voltammograms.
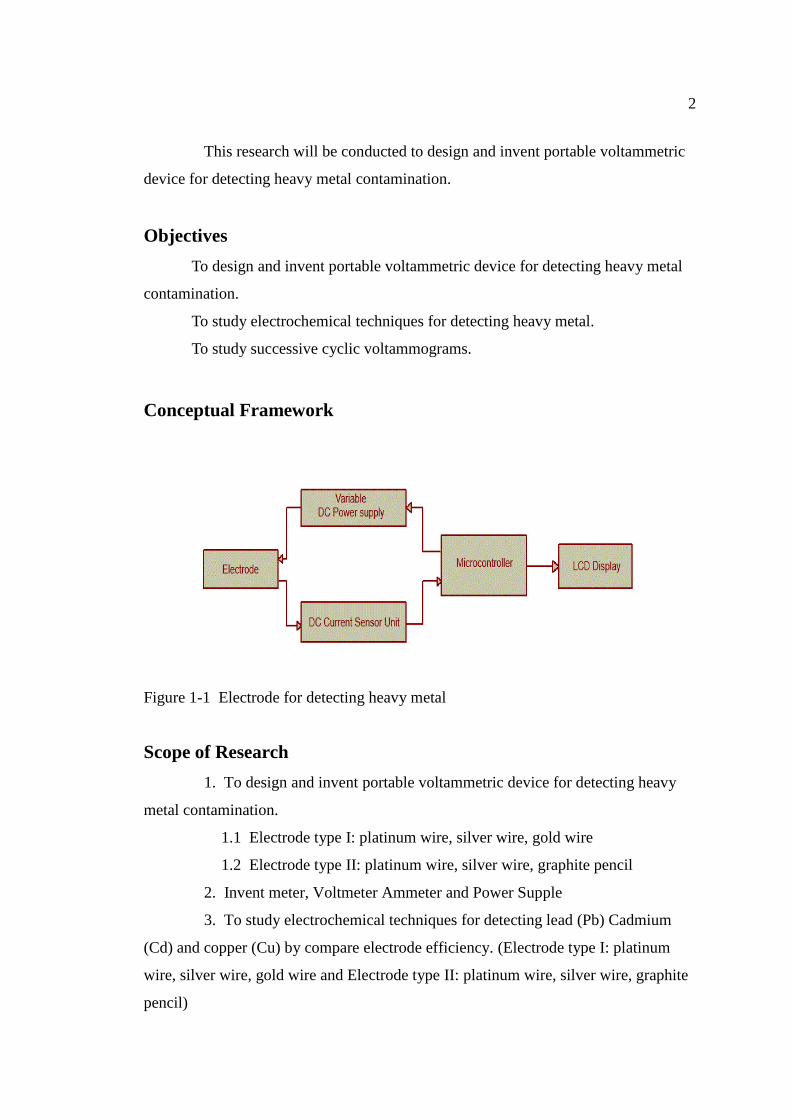
Conceptual Framework
Figure 1-1 Electrode for detecting heavy metal
Scope of Research
1. To design and invent portable voltammetric device for detecting heavy
metal contamination.
1.1 Electrode type I: platinum wire, silver wire, gold wire
1.2 Electrode type II: platinum wire, silver wire, graphite pencil
2. Invent meter, Voltmeter Ammeter and Power Supple
3. To study electrochemical techniques for detecting lead (Pb) Cadmium
(Cd) and copper (Cu) by compare electrode efficiency. (Electrode type I: platinum
wire, silver wire, gold wire and Electrode type II: platinum wire, silver wire, graphite
pencil)
3
3.1 Standard solution of lead (Pb), cadmium (Cd) and copper (Cu)
3.2 Mix standard solution of lead (Pb), cadmium (Cd) and copper (Cu)
3.3 Voltage -1.3 to 1.3 V
3.4 Successive cyclic voltammograms.
4. Testing for detect heavy metal in standard solution and sample water
compared GFAAS
Expected Results
1. The portable voltammetric device for detecting heavy metal
contamination.
2. Electrochemical techniques for detecting lead (Pb), Cadmium (Cd) and
copper (Cu) in sample water is easily taken, used and low cost.
Definition of terms
Heavy metal is the element with both value and toxicity of living things.
Metals can be toxic to biological systems. By definition, a heavy metal heavy metal is
a substance that has a specific gravity greater than 4 and 5, and considering the
position on the periodic table of elements included in the heavy metals. Atomic
number between 22-23 and between 40-52, including the rare earth elements, and
actinides and substances affect the biochemistry of plants and animals. There are 22
kinds of heavy metals such as Cu, Zn, Cd, Pb and Mn etc.
Electrochemical techniques give information on the processes taking place
when an electric potential is applied to the system under study. The Voltalab 40
equipment generates direct and alternate current. Thus, different electrochemical
methods can be applied such as determination of the corrosion potential, Tafel curves,
anodic polarization curves, electrochemical impedance spectroscopy, etc. All these
electrochemical analysis provide information of important parameters (corrosion rate,
polarization resistance, protection potential, repassivation potential, breakdown
potential). Depending on the electrochemical system, the most suitable method may
be applied with the aim of determining the corrosion behaviour of the material.
Similarly, the corrosion resistance can be evaluated before an after a protective

4
coating is grown on the material surface to verify the protective character of the outer
film.
Voltammetry is one of several important analytical techniques for the
analysis of trace metals in environmental samples, including groundwater, lakes,
rivers and streams, seawater, rain, and snow. Detection limits at the parts-per-billion
level are routine for many trace metals using differential pulse polarography, with
anodic stripping voltammetry providing parts-per-trillion detection limits for some
trace metals.
Voltammetric methods used only two electrodes, a modern voltammeter
makes use of a three-electrode potentiostat, In voltammetry we apply a time-
dependent potential excitation signal to the working electrode changing its potential
relative to the fixed potential of the reference electrode and measure the current that
flows between the working and auxiliary electrodes. The auxiliary electrode is
generally a platinum wire, and the reference electrode is usually a SCE or a Ag/AgCl
electrode.

5
CHAPTER 2
LITERATURE REVIEWS
Heavy metal Analysis
1. The techniques for analyze heavy metal
Numerous techniques have been employed to analyze the heavy metal
contents in herb, beverage and herbal tea, including atomic absorption spectrometry
(AAS), flame atomic absorption spectrometry (FAAS), graphite furnace atomic
absorption spectrometry (GFAAS), Inductive Coupled Plasma Spectrometer (ICPS),
inductively coupled plasma mass spectrometry (ICP-MS), inductively coupled plasma
optical emission spectrometry (ICP-OES), direct competitive enzyme-linked
immunosorbent assay (DC-ELISA) inductively coupled plasma atomic emission
spectroscopy (ICP-AES), and polarised X-rays fluorescence spectrometer (EDPXRF)
Soylak, Tuzen, Mendil, and Turkekul (2006) reported of copper (II), lead
(II) and zinc (II) on Aspergillus fumigatus immobilized Diaion HP-2MG resin from
tea and black tea. Analysed by FAAS. The detection limits were 0.30 µg/L for copper,
0.41 µg/L for zinc, 0.52 µg/L for lead.
Seenivasan, Manikandan, Muraleedharan, and Selvasundaram (2008)
presented of heavy metals in black tea were analyzed uanalyzed using FAAS and
GFAAS. The results of analysis showed that the mean level of Cu was 24.07 ± 2.25
mg/ kg, Cd 0.14 ± 0.06 mg/kg and 0.81 ± 0.32 mg/ kg
Karimi et al. (2008) studied the concentration of Cu and Pb were determined
by AAS on black tea. The results showed Cu content in investigated teas ranged from
17.59 to 32.80 µg/g and Pb 2.08 to 2.59 µg/g
Grzesik and Kolon (2008) reported the content of Cd and Pb in fruit tea was
analyzed by GFAAS. The maximum obtained values for leaching of cadmium from
fruit teas 8.6%. Lead is more easily leached from the studied materials than cadmium-
maximum values 35.2% for fruit teas have been found.
Tuzen, Soylak, and Elci (2005) reported an FAAS method with multi-
element preconcentration procedure for the determination of Cd, Pb and other metal
6
ions. The reusability of Chromosorb 108 was as high as 200 cycles without any loss in
its sorption behavior. LODs for Cd and Pb were 0.16-0.6 μg/L in black tea.
Duran, Ozdes, Sahin, Bulut, Gundogdu, and Soylak (2011) demonstrated a
sensitive and environmentally friendly separation and preconcentration procedure for
FAAS determination of Cu (II) and Cd (II). The samples were prepared based on the
carrier element free co-precipitation with an organic co-precipitant. The higher
preconcentration factor was 50 and the LODs for Cu (II) and Cd (II) were 1.49 and
0.45 μg/L, respectively.
Dasbas, Sacmac, Ulgen, and Kartalb (2015) presented for the determination
of cadmium (II) and lead (II) in various food and water samples. The detection limits
for Cd (II) and Pb (II) were found as 0.13 and 0.18 μg/L, respectively
Zhong, Ren, and Zhao (2016) studied the contents of Pb, Cd, Cr, Cu, and Ni
in tea produced and marketed in China were analyzed using high-resolution
continuum source graphite furnace atomic absorption spectrometry (HRCSG-FAAS).
The Pb, Cu, and Ni levels in green tea were much higher than those in the other types
of tea; the highest total content (76.47 mg/kg) was found in the Maojian tea.
Ning et al. (2011) studied the investigation of Pb, Cd, and Cu contents in 30
brands of Chinese Pu'er tea using GFAAS and observed that the Cu contents
(12.22- 22.22 mg/kg) were the highest.
Rubio et al. (2012) reported Pb Cd Cu concentrations in mentha herbal teas
by ICPS. Pb analyses revealed levels (0.65 ± 0.71 mg/kg), Cd 0.3 mg/kg and Cu
10.65 mg/kg
Arpadjan, Celik, Taskesen, and Gucer (2008) studied toxic elements were
present in the medicinal plants As 12–225 mg/kg, Cd 15–268 mg/kg and Pb 0.2-8.6
mg/kg by ICP-MS.
Malik et al. (2013) The determination of Al, B, Cu, Fe, Mn, Ni, P, Zn and
Ca, K, Mg by inductively coupled plasma optical emission spectrometry (ICP-OES)
and flame atomic absorption spectroscopy (FAAS)
Gorur et al. (2011) reported level determined the concentrations of Pb, Fe,
Mn, Zn and Cu in 29 black tea and one green tea samples from Turkey by using
7
ICP-OES. The results indicated that Pb content in these tea samples was below the
LOD (0.0119 mg/L) and the concentrations of all elements for daily intake were in
safety levels for human consumptions.
Liu et al. (2009) studied enzyme-linked immune sorbent assay (DC-ELISA)
based on a cadmium-chelate-specific monoclonal antibody has been developed. The
DC-ELISA showed an IC50 of 2.30 μg/L with a detection limit of 0.20 μg/L for
cadmium.
Desideri, Meli, Roselli, and Feduzi (2011) studied herbal tea and camomile
were determined by polarised X-rays fluorescence spectrometer (EDPXRF). The
results showed that Cd was below 0.5 mg/kg, Pb 0.5-4.3 mg/kg, Hg below 0.1 mg/kg
and Sn 1.1-1.5 mg/kg.
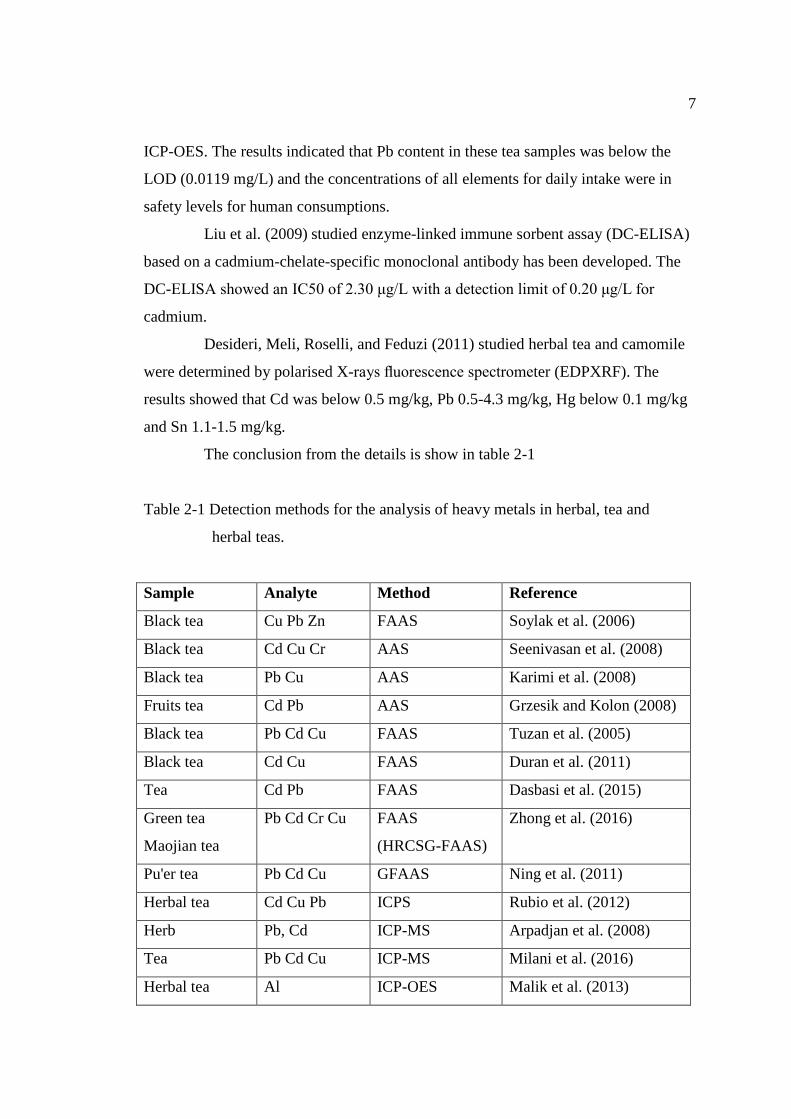
The conclusion from the details is show in table 2-1
Table 2-1 Detection methods for the analysis of heavy metals in herbal, tea and
herbal teas.
Sample Analyte Method Reference
Black tea Cu Pb Zn FAAS Soylak et al. (2006)
Black tea Cd Cu Cr AAS Seenivasan et al. (2008)
Black tea Pb Cu AAS Karimi et al. (2008)
Fruits tea Cd Pb AAS Grzesik and Kolon (2008)
Black tea Pb Cd Cu FAAS Tuzan et al. (2005)
Black tea Cd Cu FAAS Duran et al. (2011)
Tea Cd Pb FAAS Dasbasi et al. (2015)
Green tea
Maojian tea
Pb Cd Cr Cu FAAS
(HRCSG-FAAS)
Zhong et al. (2016)
Pu'er tea Pb Cd Cu GFAAS Ning et al. (2011)
Herbal tea Cd Cu Pb ICPS Rubio et al. (2012)
Herb Pb, Cd ICP-MS Arpadjan et al. (2008)
Tea Pb Cd Cu ICP-MS Milani et al. (2016)
Herbal tea Al ICP-OES Malik et al. (2013)
8
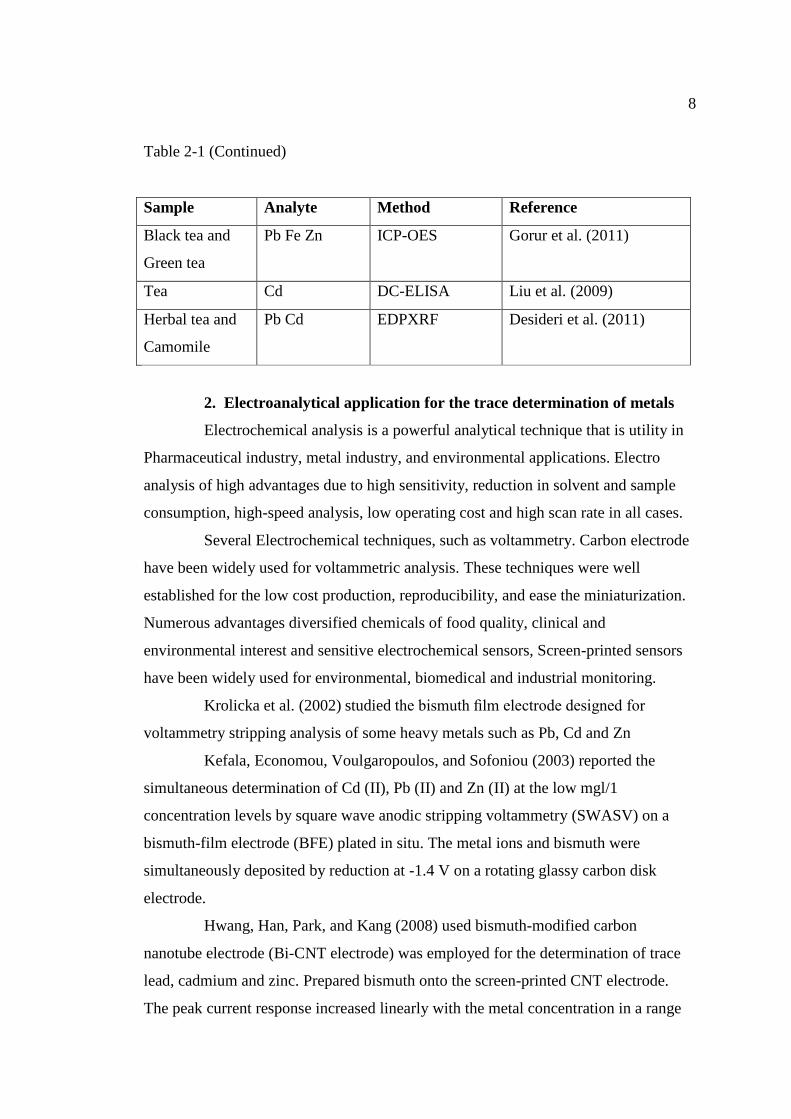
Table 2-1 (Continued)
Sample Analyte Method Reference
Black tea and
Green tea
Pb Fe Zn ICP-OES Gorur et al. (2011)
Tea Cd DC-ELISA Liu et al. (2009)
Herbal tea and
Camomile
Pb Cd EDPXRF Desideri et al. (2011)
2. Electroanalytical application for the trace determination of metals
Electrochemical analysis is a powerful analytical technique that is utility in
Pharmaceutical industry, metal industry, and environmental applications. Electro
analysis of high advantages due to high sensitivity, reduction in solvent and sample
consumption, high-speed analysis, low operating cost and high scan rate in all cases.
Several Electrochemical techniques, such as voltammetry. Carbon electrode
have been widely used for voltammetric analysis. These techniques were well
established for the low cost production, reproducibility, and ease the miniaturization.
Numerous advantages diversified chemicals of food quality, clinical and
environmental interest and sensitive electrochemical sensors, Screen-printed sensors
have been widely used for environmental, biomedical and industrial monitoring.
Krolicka et al. (2002) studied the bismuth film electrode designed for
voltammetry stripping analysis of some heavy metals such as Pb, Cd and Zn
Kefala, Economou, Voulgaropoulos, and Sofoniou (2003) reported the
simultaneous determination of Cd (II), Pb (II) and Zn (II) at the low mgl/1
concentration levels by square wave anodic stripping voltammetry (SWASV) on a
bismuth-film electrode (BFE) plated in situ. The metal ions and bismuth were
simultaneously deposited by reduction at -1.4 V on a rotating glassy carbon disk
electrode.
Hwang, Han, Park, and Kang (2008) used bismuth-modified carbon
nanotube electrode (Bi-CNT electrode) was employed for the determination of trace
lead, cadmium and zinc. Prepared bismuth onto the screen-printed CNT electrode.
The peak current response increased linearly with the metal concentration in a range

9
of 2-100 microg/L. The limit of detection was 1.3 microg/L for lead, 0.7 microg/L for
cadmium and 12 microg/L for zinc. The Bi-CNT electrode was successfully
applicable to analysis of trace metals in real environments.
Rehacek, Hotovy, Vojs, and Mika (2008) used graphite disc electrode
(0.5 mm in diameter) from a pencil-lead rod. The disc graphite was used for
simultaneous determination of Pb (II), Cd (II) and Zn (II) by square wave
voltammetry (SWV) in an aqueous solution. Detection limits 2.4 x 10⁻⁹
mol/L for Pb
(II), 2.9 x 10⁻⁹
mol/L for Cd (II) and 1.2 x 10⁻⁸
mol/L for Zn (II).
Tarleya, Santosa, Baêtaa, Pereirab, and Kubota (2009) reported a multiwall
carbon nanotube electrode on potentiometric stripping analysis at -1.3 V and The
limits of detection for Zn (II), Cd (II) and Pb (II) were found to be 28.0,8.4 and
6.6 µg/L,
Injanga, Noyroda, Siangprohb, Dungchaia, Motomizuc, and Chailapakulad
(2010) studied anodic stripping voltammetry (SIA-ASV) by using screen-printed
carbon. the linear ranges were found to be 2-100 µg/L for Pb (II) and Cd (II), and
12-100 µg/L for Zn (II). The limits of detection were 0.2 µg/L for Pb (II), 0.8 µg/L for
Cd (II) and 11 µg/L for Zn (II). The measurement frequency was found to be
10-15 stripping cycle for 60 sec.
Guo, Chai, Yuan, Song, and Zou (2011) reported the carbon paste electrode
response to Pb2+
ion ranging from 5.9×10⁻¹⁰
to 1.0×10⁻²
M with a detection limit of
3.2×10⁻¹⁰
M. The concentrations of Pb2+
ions were determined by the carbon paste
electrode and AAS.
Anandhakumar and Mathiyarasu (2012) reported bismuth film modified
carbon fiber detection of Cd (II) and Pb (II). As compared to the unmodified
electrode. Electro analysis using square ware anodic stripping voltammetry linear
response over the 50-500 nM range.
Jothimuthu et al. (2013) studied zinc in serum detection by ASV as
compared with the AAS and ICP-MS. The results show Zn detection in serum rage
5 µM to 50 µM.
Raj, Raina, Mohineesh, and Dogra (2013) direct determination of Zn, Cd, Pb
and Cu metal was carried out from tap water using differential pulse anodic stripping
Voltammeter. As a result the concentration observed in the tap water sample was

10
determined as 0.174 mg/L, 0.001 mg/L, 0.002 mg/L, 0.011 mg/L respectively.
The advantages of the proposed Voltammetric method over the other AAS, ICPOES
techniques.
Tufa, Sirajz, and Soreta (2013) Electrochemical application of bismuth film
modified glassy carbon electrode was studied with the objective of lead detection.
Three linear calibration plots in the range 7.5 nmol/L to 0.1 μmol/L, 0.25 to 1 μmol/L,
2.5 to 12.5 μmol/L. as compared with the AAS.
Wang, Wang, Zhang, and Liu (2014) studied determination of trace lead and
cadmium ions by square wave anodic stripping voltammetry (SWASV). the linear
range of electrode was from 1.0 to 80.0 µg/L for lead and cadmium. The electron
transfer kinetics of a redox probe at electrodes were tested by electrochemical
impedance spectroscopy (EIS).
Hevia, Arancibia, and Romo (2015) presented an adsorptive stripping
voltammetric method for the determination of Cu (II) at trace levels in sweeteners,
sugar and tea. The relationship between the peak current and copper concentration is
linear in the range 0.33-65.0 μg/L. The sensitivity with a short accumulation time is
better than that for AAS and ICP-AES
Salih, Ouarzane, and Rhazi (2015) studied new sensor based on carbon paste
electrode modified with Poly (1,8-diaminonaphthalene) and bismuth film (Bi-Poly1,
8-DAN/CPE) was prepared and characterized with cyclic voltammetry and
electrochemical impedance spectroscopy (EIP). The sensing of lead show linear range
was achieved over concentration range from 0.5 µg/L to 50 µg/L, with a detection
limit of 0.3 µg/L.
Wan et al. (2015) presented a fast and sensitive approach for simultaneous
electrochemical determination of lead and copper based on a commercial screen-
printed gold electrode (SPGE) with gold nanoparticles (GNPs) modification in cyclic
voltammetry (CV) and square wave anodic stripping voltammetry (SWASV).
Compared to that of merely activated SPGE. To detect lead and copper a sensitivity of
0.154 µA/ppb and 0.084 µA/ppb.
Birinci, Eren, Coldur, Coskun, and Andac (2016) studied a new solid contact
copper selective electrode with a poly (vinyl chloride) (PVC) electrode response to
11
Cu2+
activity from 10-1
to 10-6
mol/L. The studied compared favorably with those
obtained by the atomic absorption spectroscopy (AAS).
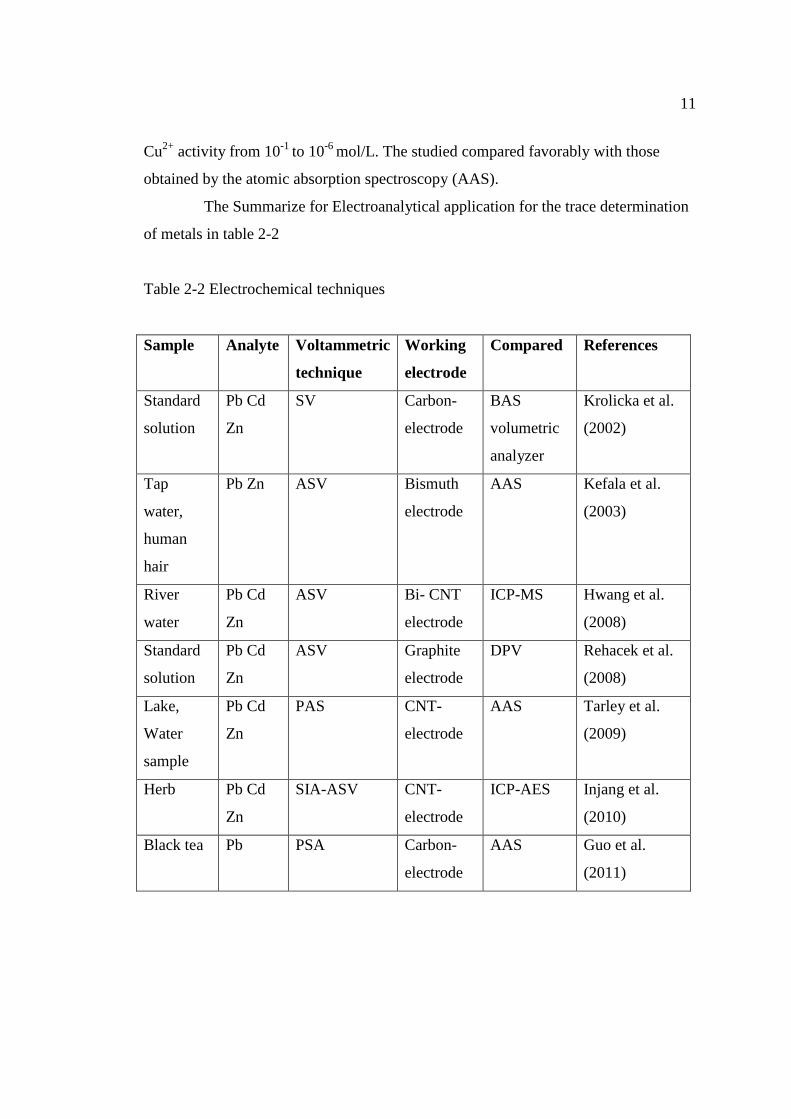
The Summarize for Electroanalytical application for the trace determination
of metals in table 2-2
Table 2-2 Electrochemical techniques
Sample Analyte Voltammetric
technique
Working
electrode
Compared References
Standard
solution
Pb Cd
Zn
SV Carbon-
electrode
BAS
volumetric
analyzer
Krolicka et al.
(2002)
Tap
water,
human
hair
Pb Zn ASV Bismuth
electrode
AAS Kefala et al.
(2003)
River
water
Pb Cd
Zn
ASV Bi- CNT
electrode
ICP-MS Hwang et al.
(2008)
Standard
solution
Pb Cd
Zn
ASV Graphite
electrode
DPV Rehacek et al.
(2008)
Lake,
Water
sample
Pb Cd
Zn
PAS CNT-
electrode
AAS Tarley et al.
(2009)
Herb Pb Cd
Zn
SIA-ASV CNT-
electrode
ICP-AES Injang et al.
(2010)
Black tea Pb PSA Carbon-
electrode
AAS Guo et al.
(2011)
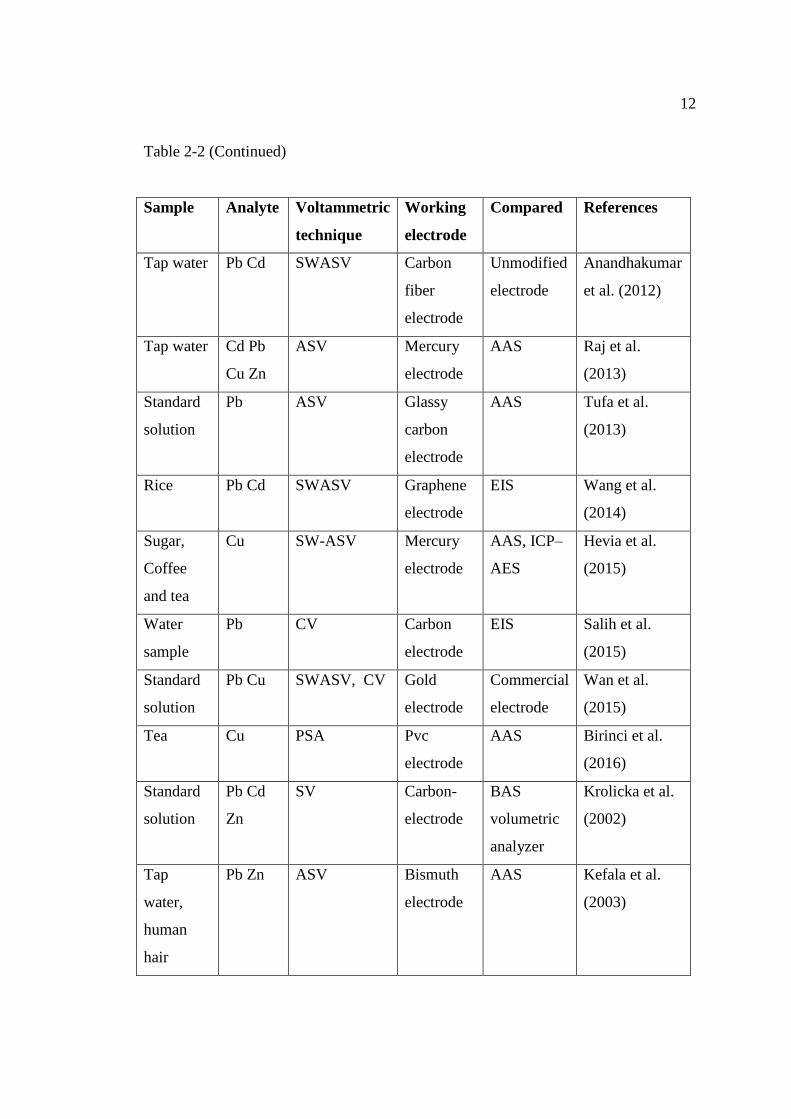
12
Table 2-2 (Continued)
Sample Analyte Voltammetric
technique
Working
electrode
Compared References
Tap water Pb Cd SWASV Carbon
fiber
electrode
Unmodified
electrode
Anandhakumar
et al. (2012)
Tap water Cd Pb
Cu Zn
ASV Mercury
electrode
AAS Raj et al.
(2013)
Standard
solution
Pb ASV Glassy
carbon
electrode
AAS Tufa et al.
(2013)
Rice Pb Cd SWASV Graphene
electrode
EIS Wang et al.
(2014)
Sugar,
Coffee
and tea
Cu SW-ASV Mercury
electrode
AAS, ICP–
AES
Hevia et al.
(2015)
Water
sample
Pb CV Carbon
electrode
EIS Salih et al.
(2015)
Standard
solution
Pb Cu SWASV, CV Gold
electrode
Commercial
electrode
Wan et al.
(2015)
Tea Cu PSA Pvc
electrode
AAS Birinci et al.
(2016)
Standard
solution
Pb Cd
Zn
SV Carbon-
electrode
BAS
volumetric
analyzer
Krolicka et al.
(2002)
Tap
water,
human
hair
Pb Zn ASV Bismuth
electrode
AAS Kefala et al.
(2003)

13
Table 2-2 (Continued)
Sample Analyte Voltammetric
technique
Working
electrode
Compared References
Tap water Pb Cd SWASV Carbon
fiber
electrode
Unmodified
electrode
Anandhakumar
et al. (2012)
Tap water Cd Pb
Cu Zn
ASV Mercury
electrode
AAS Raj et al.
(2013)
Standard
solution
Pb ASV Glassy
carbon
electrode
AAS Tufa et al.
(2013)
Rice Pb Cd SWASV Graphene
electrode
EIS Wang et al.
(2014)
Sugar,
Coffee
and tea
Cu SW-ASV Mercury
electrode
AAS, ICP–
AES
Hevia et al.
(2015)
Water
sample
Pb CV Carbon
electrode
EIS Salih et al.
(2015)
Standard
solution
Pb Cu SWASV, CV Gold
electrode
Commercial
electrode
Wan et al.
(2015)
Tea Cu PSA Pvc
electrode
AAS Birinci et al.
(2016)
The Electrodes and Cell
A typical electrochemical cell consists of the sample dissolved in a solvent,
an ionic electrolyte, and three (or sometimes two) electrodes. Cells (that is, sample
holders) come in a variety of sizes, shapes, and materials. working electrode; in some
cases, to avoid contamination, it may be necessary to place the reference electrode in
a separate compartment. The unique requirements for each of the voltammetric
techniques are described under the individual techniques.

14
Reference Electrodes The reference electrode should provide a reversible
halfreaction with Nernstian behavior, be constant over time, and be easy to assemble
and maintain. The most commonly used reference electrodes for aqueous solutions are
the calomel electrode. These electrodes are commercially available in a variety of
sizes and shapes.
Counter (auxiliary) Electrode In most voltammetric techniques the analytical
reactions at the electrode surfaces occur over very short time periods. Most often the
counter electrode consists of a thin Pt wire, although Au and sometimes graphite have
also been used.
Working Electrodes The working electrodes are of various geometries and
materials, its surface is readily regenerated by producing a new drop or film, and
many metal ions can be reversibly reduced into it. Other commonly used electrode
materials are gold, platinum, and glassy carbon.
Cyclic voltammetry (CV)
Cyclic voltammetry (CV) has becomes an important and widely used in
many areas of electro analytical chemistry. It is rarely used for the quantitative
determination but it is widely used for study of redox reactions and get much
information about the chemical reactions occurs. Cyclic voltammetry is a rapid
voltage scan technique in which the direction of voltage scan is reversed. While the
applied potential at working electrode in both forward and reverse directions the
resulting current is recorded. The scan rate in the forward and reverse direction is
normally the same. CV can be used in single cycle or multicycle modes.
The cyclic voltammetry is successor of method called polarography that was
awarded for the Nobel Prize Czech native Jaroslav Heyrosvky in 1959. The CV is
belonged to the group of potential-dynamic experimental methods. The investigated
surface is placed in electrolyte and creates the working electrode. The general schema
of setup is in Figure 2-1. Between the working electrode and the counter electrode
goes electric current. The voltage on working electrode is set according to the
reference electrode. The reference electrode is usually made from calomel or Ag-
AgCl. The counter electrode is made from Pt and working electrode is consisted

15
usually of glassy carbon, carbon paste, Au, Pt and crystals that are coated with
investigated catalytic powder.
Figure 2-1 Scheme of the CV.
The measurements are performed that the voltage at working electrode
related to the reference electrode is periodically cycled between two values
(see Figure 2-2) with using potentiostat. The first half of cycle is forward scan
and it is increasing and the second part of cycle is reverse scan and it is decreasing.
The sweep rate is generally from 10 to 200 mV/s. The results are plot current against
voltage an it is called voltammogram. The voltammogram of reversible process is
shown in Figure 2-3

16
Figure 2-2 Course of the potential.
Figure 2-3 The voltammogram of reversible process.

17
Microcontroller Arduino UNO r3
The Uno is a microcontroller board based on the ATmega328P (Figure 2-4).
It has 14 digital input/output pins (of which 6 can be used as PWM outputs), 6 analog
inputs, a 16 MHz quartz crystal, a USB connection, a power jack, an ICSP header and
a reset button. It contains everything needed to support the microcontroller; simply
connect it to a computer with a USB cable or power it with a AC-to-DC adapter or
battery to get started. You can tinker with your UNO without worrying too much
about doing something wrong, worst case scenario you can replace the chip for a few
dollars and start over again.
“Uno” means one in Italian and was chosen to mark the release of Arduino
Software (IDE) 1.0. The Uno board and version 1.0 of Arduino Software (IDE) were
the reference versions of Arduino, now evolved to newer releases. The Uno board is
the first in a series of USB Arduino boards, and the reference model for the Arduino
platform; for an extensive list of current, past or outdated boards see the Arduino
index of boards.
Figure 2-4 Microcontroller Arduino UNO r3
This research will be conducted to design and invent portable voltammetric
device for detecting heavy metal contamination (Portable cyclic voltammetry)
18
CHAPTER 3
RESEARCH METHODOLOGY
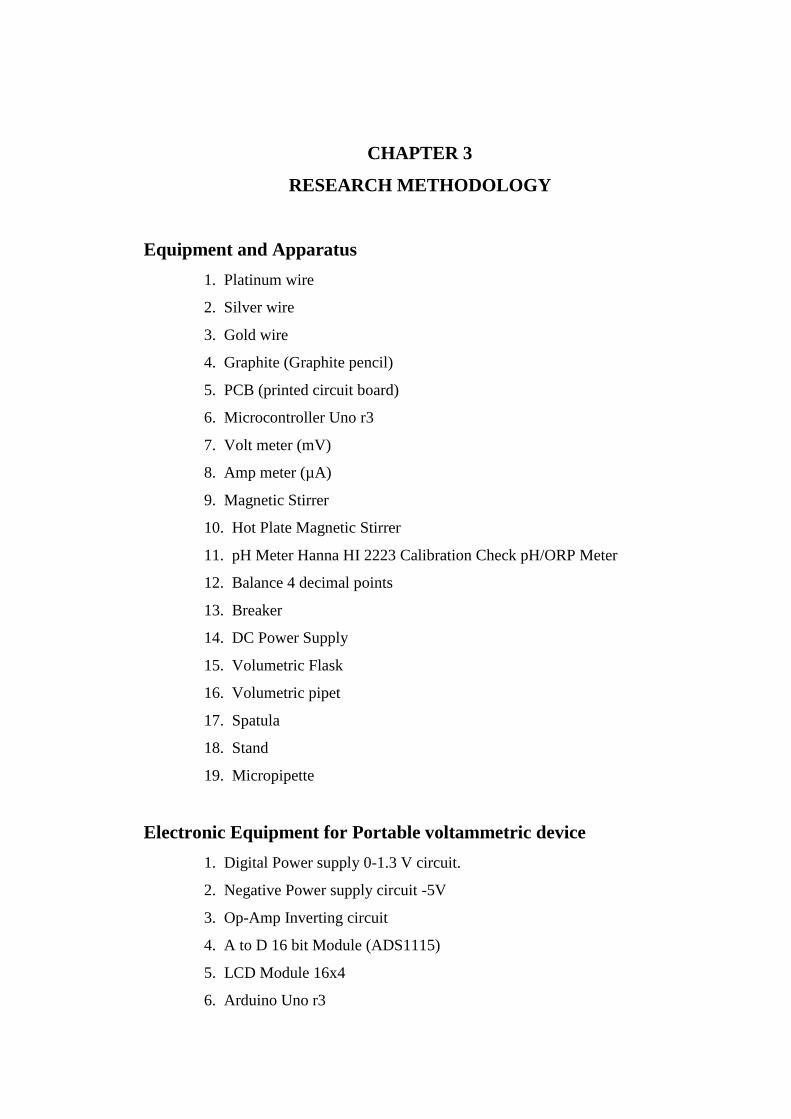
Equipment and Apparatus
1. Platinum wire
2. Silver wire
3. Gold wire
4. Graphite (Graphite pencil)
5. PCB (printed circuit board)
6. Microcontroller Uno r3
7. Volt meter (mV)
8. Amp meter (µA)
9. Magnetic Stirrer
10. Hot Plate Magnetic Stirrer
11. pH Meter Hanna HI 2223 Calibration Check pH/ORP Meter
12. Balance 4 decimal points
13. Breaker
14. DC Power Supply
15. Volumetric Flask
16. Volumetric pipet
17. Spatula
18. Stand
19. Micropipette
Electronic Equipment for Portable voltammetric device
1. Digital Power supply 0-1.3 V circuit.
2. Negative Power supply circuit -5V
3. Op-Amp Inverting circuit
4. A to D 16 bit Module (ADS1115)
5. LCD Module 16x4
6. Arduino Uno r3

19
7. SD card Module
Chemicals
1. Nitric acid (HNO3 Conc.) (AR Grade, Asia pacific specialty chemical,
Australia)
2. Stock standard solution Pb 1,000 mgL-1
(AR Grade, Merck Darmstadt,
Germany)
3. Stock standard solution Cu 1,000 mgL-1
(AR Grade, Merck Darmstadt,
Germany)
4. Stock standard solution Cd 1,000 mgL-1
(AR Grade, Merck Darmstadt,
Germany)
5. Acetic acid (AR Grade, Asia pacific specialty chemical, Australia)
6. Sodium acetate (AR Grade, Asia pacific specialty chemical, Australia)
Solution Preparation
1. General solution
HNO3 solution, 6M
Pour 39 ml conc.HNO3 from a graduated cylinder into a beaker with 40 ml
deionized water. Add more deionized water until the final volume was 100 ml
2. Electrolyte solution/acetate buffer
2.1 Electrolyte solution I, 50 Mm CH3COONa
2.1.1 Weigh 2.052 g CH3COONa in a beaker and dissolve it in
250 ml. deionized water. Adjust pH to 5.5
2.2 Solution II, 50 Mm CH3COOH
2.2.1 Pipet 0.6 ml. CH3COOH in a beaker and dissolve it in 100 ml.
deionized water.
2.3 Pour the mixture solution I in step 2.1.1 200 ml into 250 ml
volumetric flask and add 32 ml Solution II. (Acetate buffer)
3. Stock standard solution Pb, Cd and Cu
Stock standard solution Pb 1,000 mgL-1
(AR Grade, Merck Darmstadt,
Germany)

20
Stock standard solution Cd 1,000 mgL-1
(AR Grade, Merck Darmstadt,
Germany)
Stock standard solution Cu 1,000 mgL-1
(AR Grade, Merck Darmstadt,
Germany)
(Stock standard solution from Institute of Marine Science, Burapha
University
Transfer 10 ml in plastic tube and pack in safety box, keep in refrigerator for
solution)
3.1 Stock standard solution A
Stock standard solution A, volume 100 ml Pb, Cd and Cu 10 µg L-1
Pipet 1.0 ml Stock standard solution Pb in 250 volumetric flask Add more
deionized water until the final volume was 100 ml
Pipet 1.0 ml Stock standard solution Cd in 250 volumetric flask Add more
deionized water until the final volume was 100 ml
Pipet 1.0 ml Stock standard solution Cu in 250 volumetric flask Add more
deionized water until the final volume was 100 ml
3.2 Stock standard solution B, volume 100 ml Pb, Cd and Cu 10, 20, 30
and 50 µg L-1
3.2.1 Pipet 1,10, 20, and 50 ml Stock standard solution A of Pb in 250
volumetric flask Add more deionized water until the final volume was 100 ml
3.2.2 Pipet 1,10, 20, and 50 ml Stock standard solution A of Cd in 250
volumetric flask Add more deionized water until the final volume was 100 ml
3.2.3 Pipet 1,10, 20, and 50 ml Stock standard solution A of Cu in 250
volumetric flask Add more deionized water until the final volume was 100 ml
3.2.4 Follow preparation of stock solution (10, 20, 30 and 50 µg L-1
)
condition as show in Table 3-1

21
Table 3-1 Preparation of stock solution (10, 20, 30 and 50 µg L-1
)
Heavy
metal
Stock A
(ml)
Stock A
(ml)
Stock A (ml) Stock A
(ml)
Stock A
(ml)
Pb 100 1 10 20 50
Cd 100 1 10 20 50
Cu 100 1 10 20 50
Final
Stock B
100 mgL-1
10 mgL-1
20 mgL-1
30 gL-1
50 gL-1
4. Mixture solution
4.1 Mixture solution Stock standard solution Pb,Cd and Cu
4.2 Follow preparation condition as show in Table 3-2
Table 3-2 Preparation of mixture solution
Mixture Pb Cd Cu
Mixture 1 1.0 ml 10 mgL-1
1.0 ml 10 mgL-1
1.0 ml 10 mgL-1
Mixture 2 1.0ml 20 mgL-1
1.0 ml 20 mgL-1
1.0 ml 20 mgL-1
Mixture 3 1.0 ml 30 mgL-1
1.0 ml 30 mgL-1
1.0 ml 30 mgL-1
Mixture 4 1.0 ml 50 mgL-1
1.0 ml 50 mgL-1
1.0 ml 50 mgL-1
Experimental design
Part 1 Preparation the electrode (Figure 3-1)
Part 2 Invent meter, voltmeter ammeter and power supply
Part 3 Comparison of the electrode efficiency in blank and standard solution
Part 4 Testing for detect heavy metal in standard solution and water sample
Part 1 Preparation the electrode
1. Design the PCB (Printed Circuit Board) for electrode
2. Preparation the electrode
22
A three-electrode was employed for Portable voltammetric device for
detecting heavy metal. (cyclic voltammetry). A gold wire was used as the working
electrode. A silver wire and a platinum wire were used as the counter electrode and
reference electrode (Figure 3-2)
2.1 Platinum wire cleaning
2.1.1 Rinse platinum with deionized water thoroughly
2.1.2 Immerse it in 10% HNO3 at room temperature to oxidize
contaminant from Platinum wire surface.
2.1.3 After 10 minutes was reached, rinse it with deionized water
thoroughly and let dry in air.
2.2 Gold wire cleaning
2.2.1 Rinse gold with deionized water thoroughly
2.2.2 Immerse it in 10% HNO3 at room temperature to oxidize
contaminant from gold wire surface.
2.2.3 After 10 minutes was reached, rinse it with deionized water
thoroughly and let dry in air.
2.3 Silver wire cleaning
2.3.1 Rinse silver with deionized water thoroughly
2.3.2 Immerse it in 10% HNO3 at room temperature to oxidize
contaminant from silver wire surface.
2.3.3 After 10 minutes was reached, rinse it with deionized water
thoroughly and let dry in air.
2.4 Graphite
Carbon used the Graphite pencil for the electrode (Figure 3-3)
23
Figure 3-1 Diagram Preparation the electrode
Design the PCB
(Printed Circuit Board) for electrode
Cut gold wire, platinum wire, silver
wire and Graphite pencil by 1.5 cm
Cleaning gold wire, platinum wire
and silver wire
Electrode type I: platinum silver gold Electrode
Electrode type II: platinum gold and Graphite
Set gold wire, platinum wire, silver
wire
on the PCB
24
Figure 3-2 A three-electrode was employed for Portable voltammetric device for
detecting heavy metal contamination (cyclic voltammetry)
Figure 3-3 Graphite pencil and Graphite electrode
Part 2 Invent meter, voltmeter ammeter and power supply
2.1 Design and circuit built on a printed circuit board (PCB) for
Portable voltammetric device for detecting heavy metal contamination
(Figure 3-4)
Block a, Variable digital voltage
This circuit can provide currents up to 100mA. The working and circuit is
explained below. Here we are going to take the voltage provided at the OUTPUT
terminal and feed it into one of ADC channels of Arduino. After conversion we are

25
going to take that DIGITAL value and we will relate it to voltage and show the result
in 16*4 display. This value on display represents the variable voltage value.
The UNO ADC is of 10 bit resolution (so the integer values from (0- (2^10)
1023)).This means that it will map input voltages between 0 and 5 volts into integer
values between 0 and 1023. So for every (5/1024= 4.9mV) per unit.
Block b, Negative voltage and OP-Amp inverting
Simple Negative Voltage Converter The majority of applications will
undoubtedly utilize the ICL7660 for generation of negative supply voltages. Figure
below shows typical connections to provide a negative supply for Op-Amp inverting
circuit will make variable negative voltage
Block c, Switching pole circuit
In circuit use transistor make not gate circuit for Switching Positive
voltage and Negative voltage. Programing control at digital output pin
Block d, Current sensor circuit and ADC 16Bit I2C (MCP3425)
Use ic CA3130 This simple micro ampere meter circuit can help in
measuring small currents. The output voltage of the opamp CA3130 is proportional to
the measured current.
By feedback resistors through. Ic MCP3425 convert Analog signals to
Digital signals by I2C for Addition Arduino.
Block e, Microcontroller Arduino uno r3
Arduino Uno r3 is a microcontroller board based on the ATmega 328 P.
Arduino is easy to learn microcomputer system. Many engineering students are using
it in their projects and professionals also. Because it is ready to use board.
Block f, Display LCD 16X4 Module
Display LCD 16X4 Moduleare using a 16×4 Character LCD so we have
4 lines of 16 characters each available.The I2C LCD module is connected to 4 pin. Is
VCC, GND, SDA and SCLfrom the Arduino are connected to the breadboard.
Block g, Micro SD card Module
This is a Micro SD module. It is compatible with SD card (commonly
used in Mobile Phone) which is the most tiny card in the market. SD module has
various applications such as data logger, audio, video, graphics. This module will
greatly expand the capbility an Arduino can do with their poor limited memory.

26
This module has SPI interface and 5V power supply which is compatible with
Arduino UNO/Mega. The Pinout is fully compatible
Figure 3-4 Portable voltammetric device for detecting heavy metal contamination
circuit
2.2 Invent auto variable power supply and voltmeter ammeter keep
data to micro SD
Experiment step for Invent meter, voltmeter ammeter and power supply
(Portable voltammetric device for detecting heavy metal contamination, Figure 3-5)
2.2.1 Make variable power supply circuit 0-5V by Arduino IDE
(microcontroller).
2.2.2 Add A to D 16 bit module 16 Bit Analog to digital with I2c
(MCP3425)
2.2.3 Make negative power supply circuit -5V by IC ICL7660
2.2.4 Make inverting OP-AMP for variable negative power supply
27
2.2.5 Make program control power supply -1.30 V to 1.30 V by
Arduino IDE.
2.2.6 Make program memory value to SD card.
2.2.7 Display value to LCD display.
Figure 3-5 Portable voltammetric device for detecting heavy metal contamination
2.3 Step for program
The step for the program on Portable voltammetric device for detecting
heavy metal contamination (Portable cyclic voltammetry) (Figure 3-6)
2.3.1 Connect USB electrode dip electrode in sample.
2.3.2 Start program to push buttom switch “start”
2.3.3 Voltammetry portable will scan start voltage -1.30 v to 1.3v
2.3.4 About 10 min. keep data into micro SD card and program
display Result heavy metal.
2.3.5 Display value.
2.3.6 End program.

28
Figure 3-6 The step for the program on Portable voltammetric device for detecting
heavy metal contamination
2.4 Program Portable voltammetric device for detecting heavy metal
contamination
(Arduino IDE 1.6.8)
#include <MCP342X.h>
#include <Wire.h>
#include <LiquidCrystal_I2C.h>
#include <SD.h>

29
//MCP3425 I2C address is 0x68 (104)
#define Addr 0x68
LiquidCrystal_I2C lcd (0x3F,16, 4);
const int chipSelect = 2;
int dataString = 0;
//***** parameter voltage******//
int voltageadjust =44; //starting initial variable output
float volts = 0.0;
float Current = 0.0;
float tpb = 0.0;
float tcu = 0.0;
float tcd = 0.0;
//**** parameter voltage loop ******//
int a=0,i=0,j=0;
//***** parameter button switch pin 4 output pin 5 *******//
int buttonPin = 4;
int controlOut = 5;
int ledPin = 6;
int ledState = LOW;
int lastState = HIGH;
int StateOut = HIGH;
void setup ()
{
//Initialise I2C communication as MASTER
Wire.begin ();
//Start serial communication and set baud rate = 9600
Serial.begin (9600);
//Start I2C Transmission
Wire.beginTransmission (Addr);
//Send configuration command
//Continuous conversion mode, 12-bit resolution
Wire.write (0x10);
30
//Stop I2C Transmission
Wire.endTransmission ();
delay (300);
while (!Serial)
{ ; }
Serial.print ("Initializing SD card...");
//make sure that the default chip select pin is set to
//output, even if you don't use it:
pinMode (2, OUTPUT);
//see if the card is present and can be initialized:
if (!SD.begin (chipSelect)) {
Serial.println ("Card failed, or not present");
lcd.print (" Card failed ");
//don't do anything more:
return;
}
Serial.println ("card OK.");
pinMode (3,OUTPUT);//PWM output pin
pinMode (buttonPin,INPUT);//button Start
pinMode (controlOut,OUTPUT);//OUTPUT control PC817
pinMode (ledPin,OUTPUT);
lcd.begin ();//number of characters on LCD
//Print a logo message to the LCD.
lcd.print (" Voltammetry");
lcd.setCursor (0, 1);
delay (2000);
lcd.clear ();
lcd.print ("Volt= ");//printing name
lcd.setCursor (2, 1);
lcd.print ("I = ");//printing name
}
void loop ()
31
{
unsigned int data[2];
//Start I2C Transmission
Wire.beginTransmission (Addr);
//Select data register
Wire.write (0x00);
//Stop I2C Transmission
Wire.endTransmission ();
//Request 2 bytes of data
Wire.requestFrom (Addr, 2);
//Read 2 bytes of data
//raw_adc msb, raw_adc lsb
if (Wire.available () == 2)
{
data[0] = Wire.read ();
data[1] = Wire.read ();
}
//Convert the data to 12-bits
int raw_adc = (data[0] & 0x0F) * 256 + data[1];
if (raw_adc > 2047)
{
raw_adc -= 4096;
}
int buttonState = digitalRead (buttonPin);
if (buttonState == LOW && buttonState!=lastState)
{
if (StateOut==HIGH)
{
StateOut = LOW;
}
else
StateOut = HIGH;
32
}
}
digitalWrite (controlOut,StateOut);
lastState = buttonState;
delay (20);
float VOLTAGEVALUE = (analogRead (A0));//read ADC value at A0
if (ledState==LOW)
{
VOLTAGEVALUE = ((VOLTAGEVALUE*5)/1024);//converting
digital value to voltage
}
else
{
VOLTAGEVALUE = - ((VOLTAGEVALUE*5)/1024);//converting
digital value to voltage
}
float DCvalue = raw_adc;
volts = (DCvalue)-10;
Current = volts;
{
if (StateOut == LOW && dataString<1312)
{
File dataFile = SD.open ("datalog.txt", FILE_WRITE);
dataFile.print (dataString);
dataFile.print ("\t ");
dataFile.print (VOLTAGEVALUE, 4);
dataFile.print ("\t ");
dataFile.println (Current, 4);
dataFile.close ();
//print to the serial port too:
Serial.println (dataString);
dataString++;

33
//delay (30);
}
lcd.setCursor (5, 0);//go to position 9 on LCD
lcd.print (VOLTAGEVALUE);
lcd.setCursor (11, 0);
lcd.print ("V");
lcd.setCursor (-15,5);//go to position 9 on LCD
lcd.print (Current,4);
}
analogWrite (3,voltageadjust);//provide PWM at PIN3
if (StateOut == LOW)
{
if (i<65)
{
Serial.print ("Step No:")
Serial.println (i);
Serial.print ("AIN0: ");
Serial.print (analogRead (A0));
Serial.print (" \tVoltage: ");
Serial.print (VOLTAGEVALUE, 4);
Serial.print ("V");
Serial.print ("\tCurrent: ");
Serial.print (Current, 4);
Serial.println ("uA");
delay (300);
voltageadjust++;
i++;
//delay (300);
}
else if (j<65)
{
Serial.print ("Step No:")
34
Serial.println (j);
Serial.print ("AIN0: ");
Serial.print (analogRead (A0));
Serial.print (" \tVoltage: ");
Serial.print (VOLTAGEVALUE, 4);
Serial.print ("V");
Serial.print ("\tCurrent: ");
Serial.print (Current, 4);
Serial.println ("uA");
delay (300);
voltageadjust--;
j++;
//delay (3000);
// Serial.println ("********");
}
else if (a<9)
{
Serial.println ("--------------");
Serial.print ("a=");
Serial.println (a);
i=0;j=0;
//a++;
if (a>=0)
{
if (ledState == LOW)
{
ledState = HIGH;
}
else
{
ledState = LOW;
}
35
digitalWrite (ledPin,ledState)
}
a++;
}
if (a==9 && j==65)
{
lcd.clear ();
lcd.print ("Cyclic = 5 turn");
delay (1500);
}
}
delay (20);
}
********* END PROGRAM *********
Part 3 Comparison of the electrode efficiency in blank and standard
solution
Comparison of the electrode efficiency. (Electrode type I: platinum wire, silver wire,
gold wire and Electrode type II: platinum wire, silver wire, graphite pencil) for
detecting lead (Pb) cadmium (Cd) and copper (Cu)
Step for study electrode efficiency
1. Calibration Standard curve from stock standard solution of lead (Pb),
cadmium (Cd) and copper (Cu)
2. Testing electrode on standard solution of lead (Pb), cadmium (Cd) and
copper (Cu)
3. Testing electrode on mix standard solution of lead (Pb), cadmium (Cd)
and copper (Cu) (Figure 3-7)
4. Voltage -1.3 to 1.3 V
5. Record for current and Successive cyclic voltammograms
36
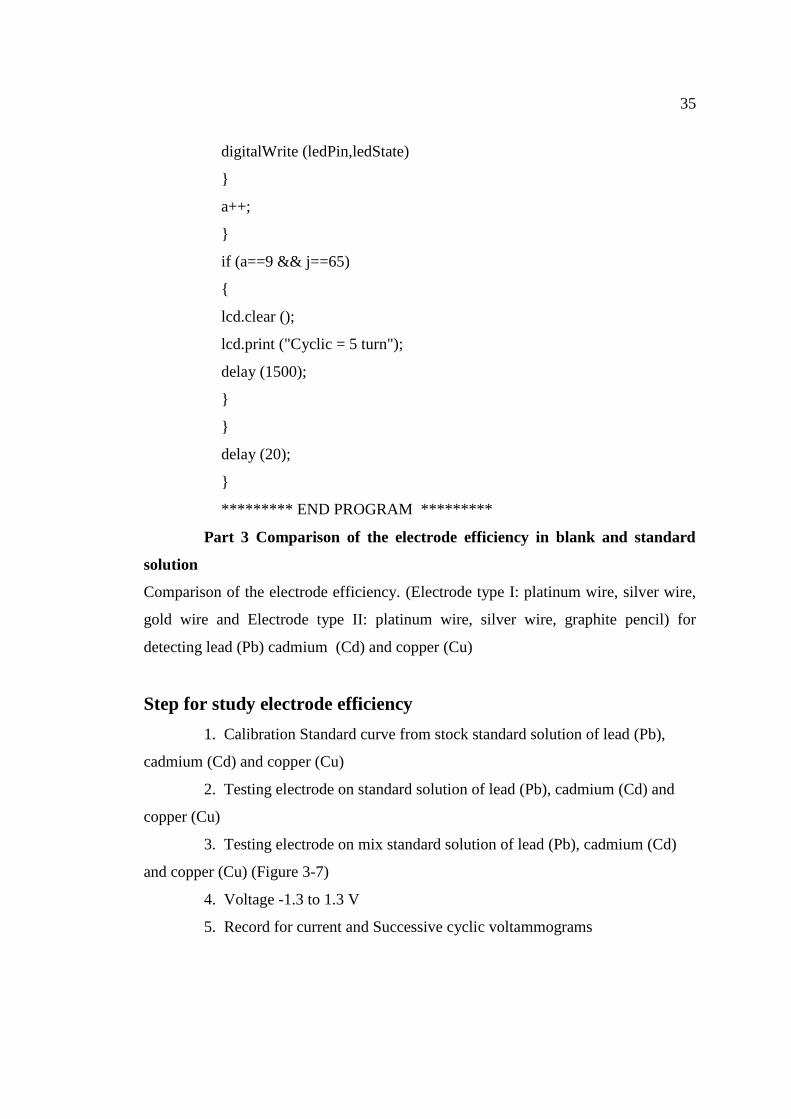
Figure 3-7 Show electrode testing on mix standard solution of lead (Pb), cadmium
(Cd) and copper (Cu)
Part 4 Testing for detect heavy metal in standard solution and water
sample
The experimental and analytical
1. Study Effect of the supporting electrolyte, pH and Successive cyclic
voltamogrames. Preparation the electrolyte used acetate buffer for testing (Table 3-3)
Table 3-3 Acetate buffer for supporting electrolyte (p H)
Acetate buffer (p H)
3.5 4.0 4.5 5.0 5.5 6.0 6.5 7.0 7.5
R1 3.5 4.0 4.5 5.0 5.5 6.0 6.5 7.0 7.5
R2 3.5 4.0 4.5 5.0 5.5 6.0 6.5 7.0 7.5
R3 3.5 4.0 4.5 5.0 5.5 6.0 6.5 7.0 7.5

37
2. Comparative study of the performance of the electrode
Comparative study of the performance of the electrode between gold wire,
silver wire, platinum wire and graphite electrode by good supporting electrolyte in 1
(Table 3-4)
Table 3-4 Concentration of standard solution
Standard solution (µg L-1)
add Acetate buffer (p H)
10 20 30 40 50 60 70 80 90 100
R1 10 20 30 40 50 60 70 80 90 100
R2 10 20 30 40 50 60 70 80 90 100
R3 10 20 30 40 50 60 70 80 90 100
3. Linearity
Prepared at six concentrations of standard solutions. Five replicates at each
concentration will be analyzed. (Table 3-5)
Table 3-5 concentrations of standard solutions (Pb, Cd and Cu) for calibration curve
Concentration (µg L-1
) of standard solution (Pb, Cd and Cu)
add acetate buffer p H 5.5
replication 10
20 30 40 50 100
Blank DI DI DI DI DI DI
R1 10 20 30 40 50 100
R2 10 20 30 40 50 100
R3 10 20 30 40 50 100
R4 10 20 30 40 50 100
R5 10 20 30 40 50 100
Test electrode in sample with Cyclic voltammetry and slope of the
calibration curve with current (I), µA on Axis y and concentrations of standard

38
solutions, µg L-1
on Axis X, for the linearity
Part 4 Testing for detect heavy metal in standard solution and sample water
To use the Portable voltammetric device for detecting heavy metal
contamination in sample water.
1. Preparation of water sample form tap water 5 sample (The water sample
collect form Chonburi province.)
2. Testing for detect heavy metal in sample water by the Portable
voltammetric device for detecting heavy metal contamination.
3. Comparison the study form Portable voltammetric device for detecting
heavy metal contamination and the result form graphite furnace atomic absorption
spectrometer (GFAAS), (GFAAS at Institute of Marine Science, Burapha University)
and limit detection for heavy metal show in Table 3-6
Table 3-6 Limit detection of heavy metal by GFAAS
heavy metal Limit detection (µgL-1
)
Pb 0.03
Cd 0.02
Cu 0.04
Procedure for GFAAS
1. Pipet DI water and sample (water sample) 10 ml in beaker
2. Add 0.05 ml HNO3 65% (w/w) digest on hot plate (in incubator) about 5 min.
3. Analysis blank (DI water) and sample with GFAAS
4. Calculation Pb, Cd and Cu
Calculation and expression of result
C = (C0 – CB) X F
When C = Concentration Pb, Cd and Cu in sample (mg/L)
C0 = Concentration Pb, Cd and Cu in solution sample (mg/L)
CB = Concentration Pb, Cd and Cu in methode blank (mg/L)
F = dilution factor
* Analysis blank before analyst sample or analyst standard solution

39
CHAPTER 4
RESULTS
In chapter 3, the experiments were designed to achieve the research
objectives mentioned in chapter 1. This research aims to an alternative voltammetric
procedure for the simultaneous determination of lead (Pb), cadmium (Cd) and copper
(Cu) were developed by using microcontroller for inventing portable voltammetry.
The experimental and analytical results are presented in this chapter.
1. Effect of the supporting electrolyte, pH and Successive cyclic
voltamogrames
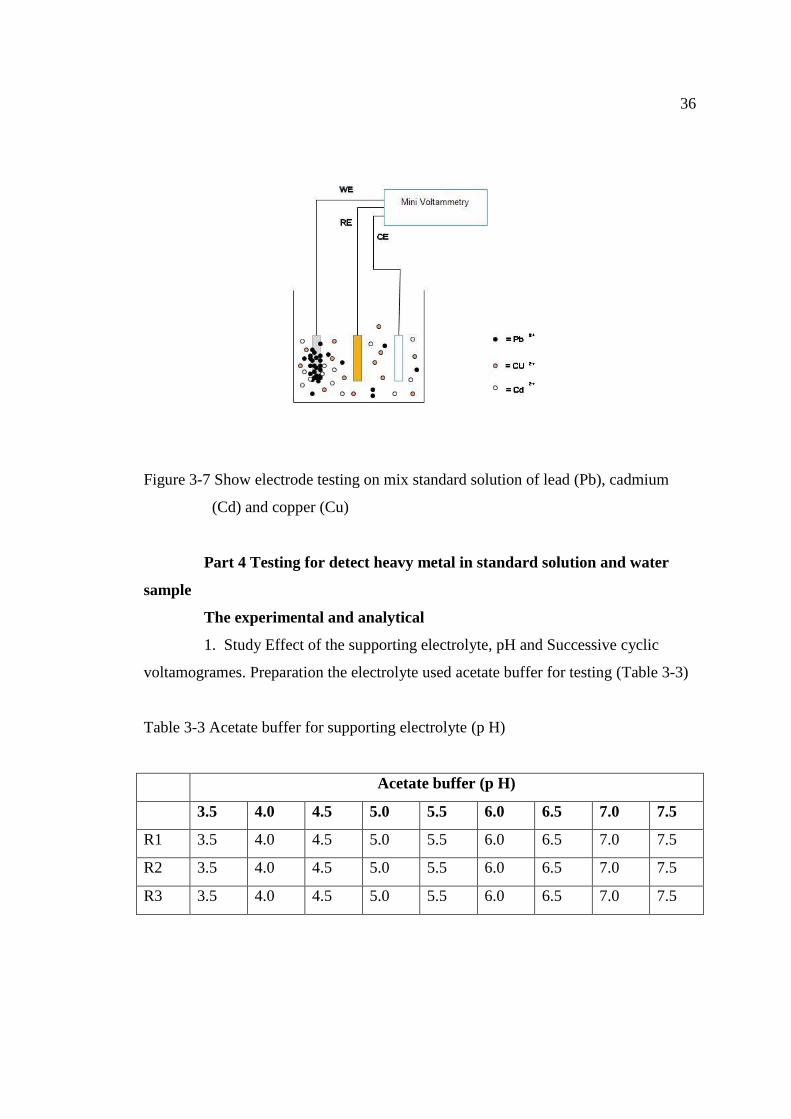
Influence of pH on the cyclic voltammogrames for 100 µgL-1
of Cd Pb and
Cu at The portable voltammetric device in buffer solution. The influence of pH on the
peak current of Cd Pb and Cu was studied in the pH range of 3.5 to 7.5 The results
obtained show that the oxidation peak current increased with increased in pH from 3.5
to 7.5; however, the currents decreased when the pH further increased from 3.5 to 7.5.
The decrease in peak current at higher pH values could be due to the formation of lead
(Pb), cadmium (Cd) and copper (Cu). Among the various electrolytes (such as acetate
buffer).The best results were obtained in acetate buffer media. Thus an electrode
voltammetry of pH 5.5 was adopted as support electrolyte in the further studies.
(Figure 4-1)
40
(a)
(b)

41
(c)
Figure 4-1 Successive cyclic voltammograms of Lead (Pb) in acetate buffer
(a) pH 3.5 (b) pH 5.5 and (c) pH 7.5
2. The electrode
Comparative study of the performance of the electrode between gold wire,
silver wire, platinum wire and graphite electrode by good supporting electrolyte
2.1 Compare gold wire, platinum and silver wire for working electrode
In 20 µg L-1
of standard solution of Pb, Cd and Cu we used the electrode
Working Electrode (WE) used silver wire, Reference Electrode (RE) used platinum
wire and Counter Electrode (CE) used silver wire electrode compare Working
Electrode (WE) used gold wire, Reference Electrode (RE) used silver wire and
Counter Electrode (CE) used platinum wire electrode and Working Electrode (WE)
used gold wire, Reference Electrode (RE) used platinum wire and Counter Electrode
(CE) used silver wire electrode (Figure 4-2)
42
(a)
(b)

43
(c)
Figure 4-2 Successive cyclic voltammograms of Lead (Pb) on gold wire silver wire
and platinum wire electrode (a) gold wire (b) silver and (c) platinum wire
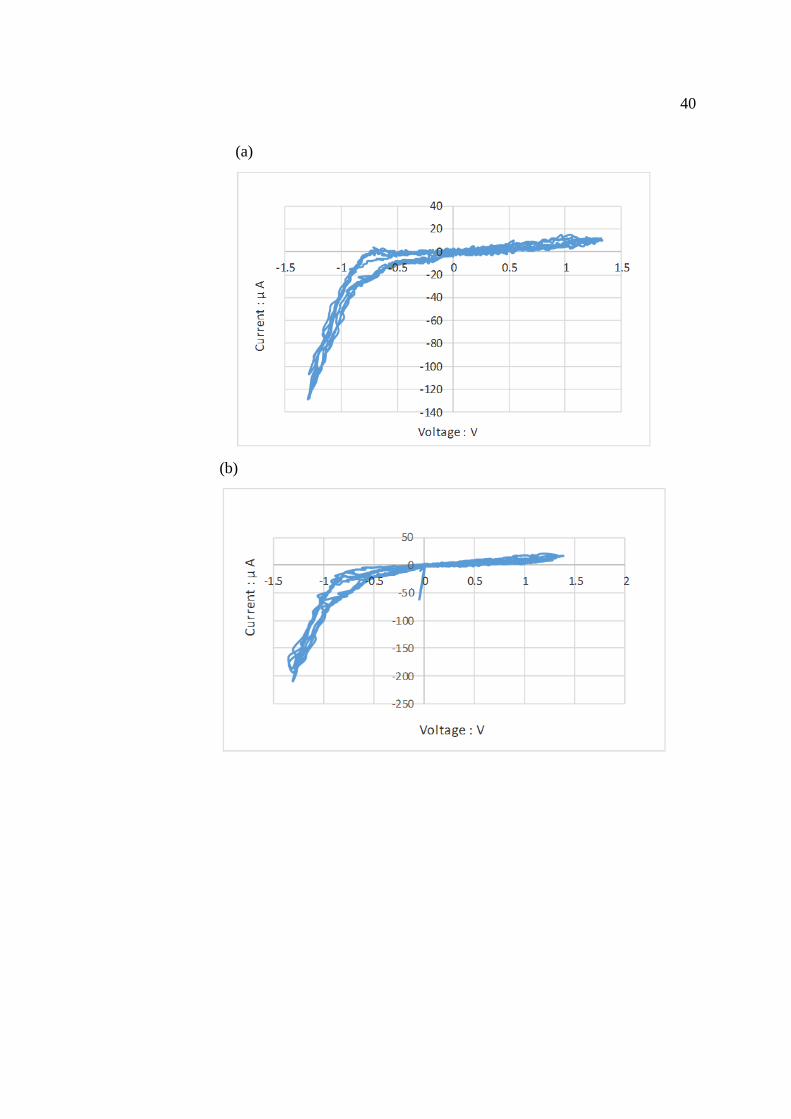
2.1 Compare gold wire electrode and graphite pencil electrode in DI
water and Standard solution 100 µgL-1
the result show successive cyclic
voltammograms (Figure 4-3)
(a)

44
(b)
(c)
45
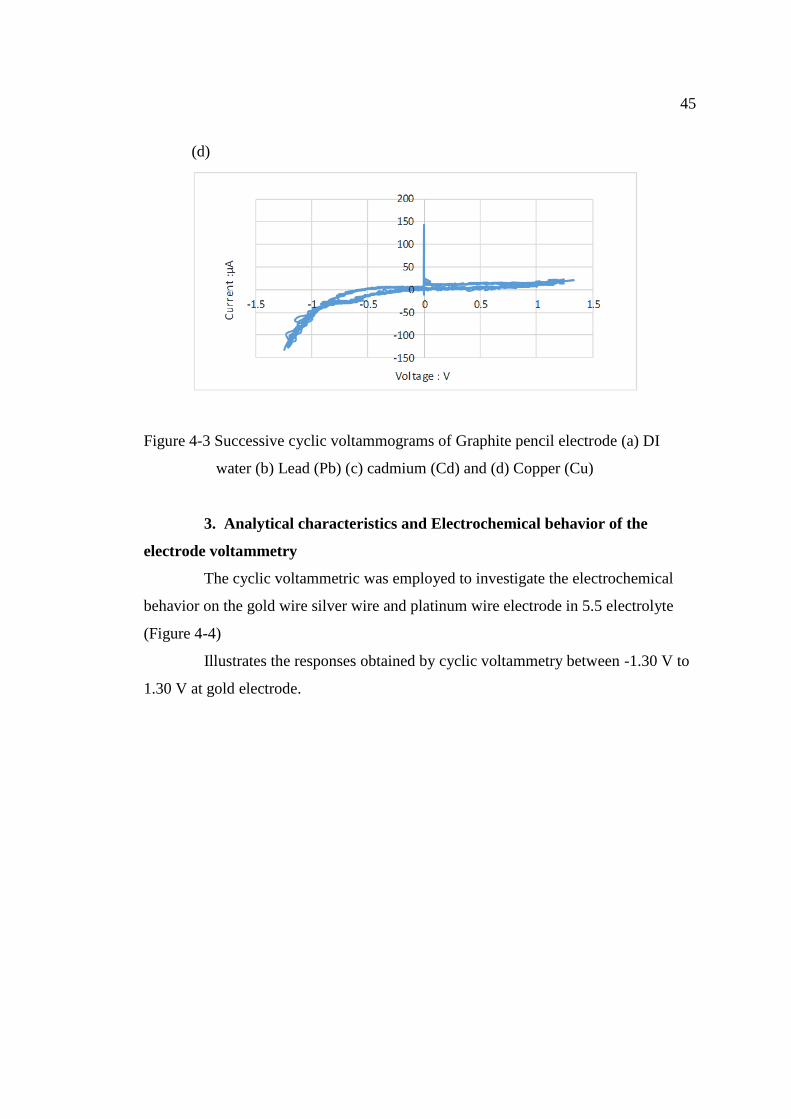
(d)
Figure 4-3 Successive cyclic voltammograms of Graphite pencil electrode (a) DI
water (b) Lead (Pb) (c) cadmium (Cd) and (d) Copper (Cu)
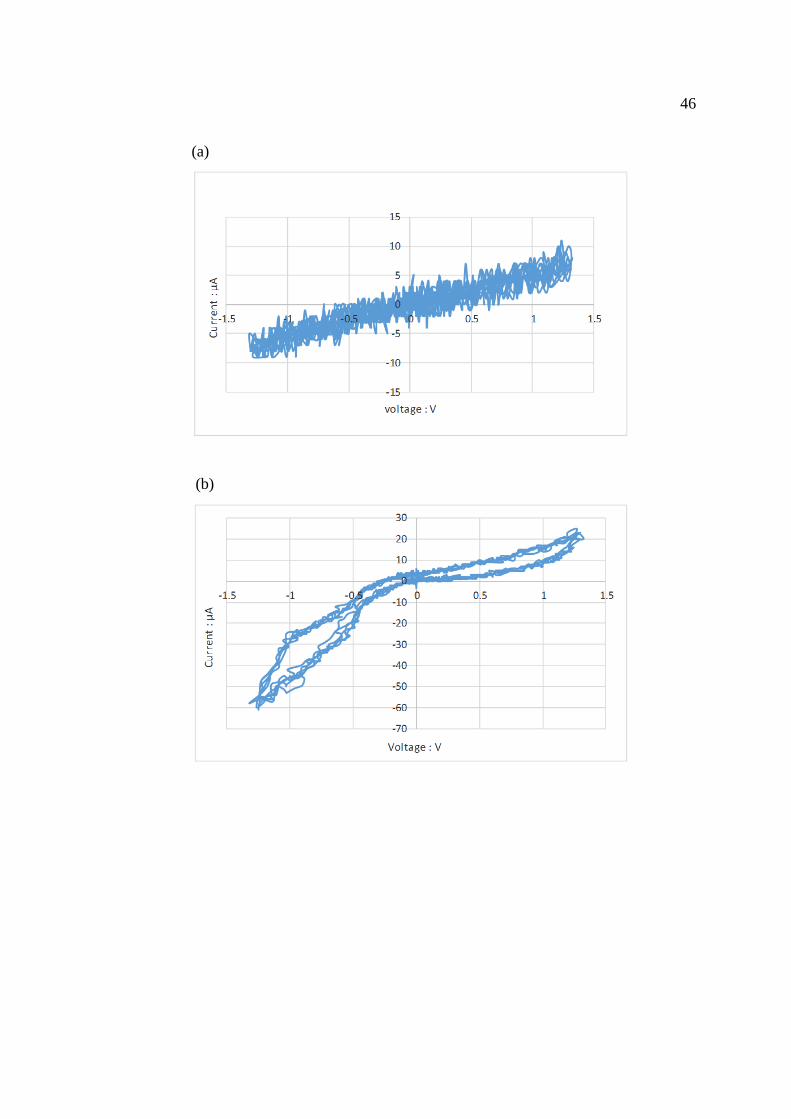
3. Analytical characteristics and Electrochemical behavior of the
electrode voltammetry
The cyclic voltammetric was employed to investigate the electrochemical
behavior on the gold wire silver wire and platinum wire electrode in 5.5 electrolyte
(Figure 4-4)
Illustrates the responses obtained by cyclic voltammetry between -1.30 V to
1.30 V at gold electrode.
46
(a)
(b)

47
(c)
(d)
Figure 4-4 Successive cyclic voltammograms (a) Deionized water (b) Lead
(II) 20 µg L-1
(c) Cadmium (II) 20 µg L-1
and (d) Copper (II) 20µg L-1

48
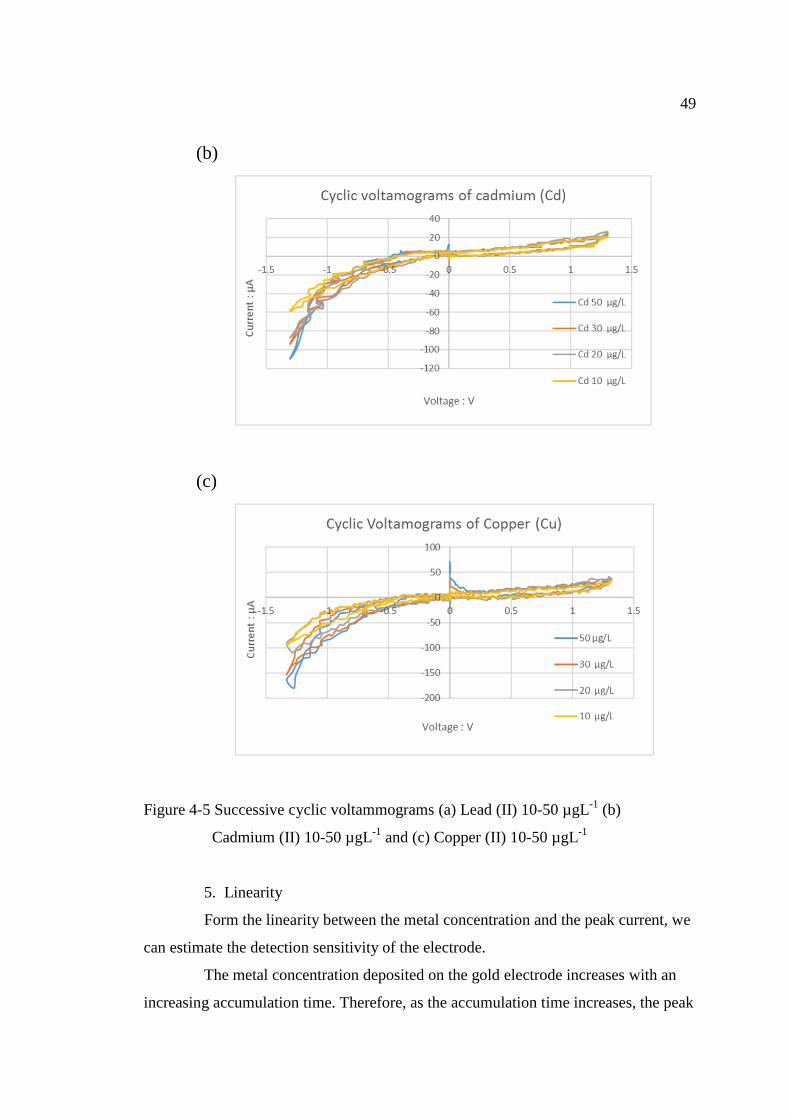
4. The portable voltammetric device for detecting heavy metal
contamination in standard solution and sample water
Successive cyclic voltammograms of following the potentionstatic recored at
room temperature. The electrode that used gold wire, silver wire and platinum wire
for working electrode, counter electrode and reference electrode respectively. The
electrode can be easily prepared and showed a good analytical response was linear in
the range of 10 µg L-1 to 50 µg L-1. Successive cyclic voltammograms of gold
electrode and scan start voltage -1.30 v to 1.3v at room temperature. The portable
voltammetric device for detecting Lead (Pb) cadmium (Cd) and copper (Cu)
contamination. (Figure 4-5)
(a)
49
(b)
(c)
Figure 4-5 Successive cyclic voltammograms (a) Lead (II) 10-50 µgL-1
(b)
Cadmium (II) 10-50 µgL-1
and (c) Copper (II) 10-50 µgL-1
5. Linearity
Form the linearity between the metal concentration and the peak current, we
can estimate the detection sensitivity of the electrode.
The metal concentration deposited on the gold electrode increases with an
increasing accumulation time. Therefore, as the accumulation time increases, the peak

50
current is enhanced, which leads to an increase in the slope of the linear relationship
between the peak current is significantly influenced by the portable voltammetric
device for detecting heavy metal contamination and show the peak current against the
Cd Pb and Cu concentrations. (Figure 4-6)
(a)
(b)

51
(c)
(d)
Figure 4-6 Dependency of the peak current on the concentration of (a) Lead (II)
10-50 µgL-1
(b) Cadmium (II) 10-50 µgL-1
and (c) Copper (II) 10-50 µgL-1

52
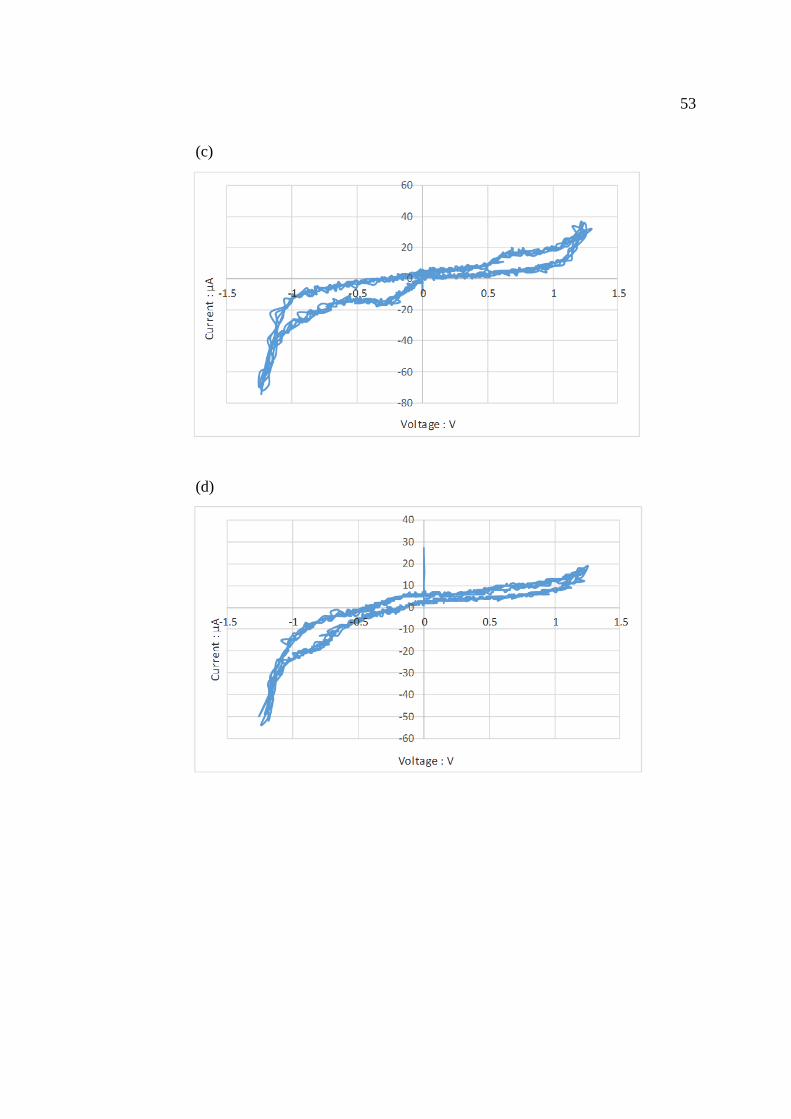
6. Analysis of sample water
In order to find out the applicability of gold wire, platinum wire and silver
wire electrode detecting as well as the validity of the developed procedure, the
electrode was utilized to detect trace amounts of Cd Pb and Cu in standard solution
and five water sample. The sample water was collected form Chonburi province. The
result shows the analytical characteristics and successive cyclic voltammograms in
Figure 4-7
(a)
(b)
53
(c)
(d)

54
(e)
Figure 4-7 The results for the simultaneous detection of lead (Pb) cadmium (Cd) and
copper (Cu) in 5 sample water (a) sample water number 1 (b) sample water
number 2 (c) sample water number 3 (d) sample water number 4 (e)
sample water number 5
55
CHAPTER 5
DISCUSSION AND CONCLUSION
In this chapter, the results in chapter 4 were discussed, and conclusions are
presented as the followings.
Discussions
Preliminary studies
The portable voltammetric device for detecting heavy metal contamination have been
prepared through electrode method in acetate buffer solution, p H 5.5
The results in Figure 4-1 show effect of the supporting electrolyte, pH and
Successive cyclic voltamogrames in acetate buffer media, p H 5.5 successive cyclic
voltammograms of lead (Pb) and high current 200-250 µA on 100 µgL-1
of Lead (Pb).
The results of the determination of Pb, Cd and Cu in Standard solution
sample and sample water in Figure 4-2 Show successive cyclic voltammograms of
Lead (Pb) on gold wire, silver wire and platinum wire electrode, The performance of
the electrode gold wire, silver wire, platinum wire is working electrode, reference
electrode and counter electrode respectively. The Figure 4-3 show graphite pencil
electrode for working electrode and successive cyclic voltammograms on DI water
standard solution of Lead (Pb) cadmium (Cd) and Copper (Cu) but all results show
the detecting low current than gold wire electrode at the same concentration.
The results in Figure 4-4 Analytical characteristics and Electrochemical
behavior of the electrode voltammetry. The cyclic voltammetric was employed to
investigate the electrochemical behavior on the gold wire silver wire and platinum
wire electrode in 5.5 electrolyte. Illustrates the responses obtained by cyclic
voltammetry between -1.30 V to 1.30 V at gold electrode. Show successive cyclic
voltammograms Deionized water show detecting current at -10 to 10 µA, -60 to 20
µA for Lead (II) 20µg L-1
, - 70 to 20 µA for Cadmium (II) 20µg L-1
and -130 to 20
µA for Copper (II) 20µg L-1
.
The results in Figure 4-5 show the portable voltammetric device for
detecting heavy metal contamination in standard solution and sample water.
56
Successive cyclic voltammograms of following the potentionstatic recorded at room
temperature. The electrode that used gold wire, silver wire and platinum wire for
working electrode, counter electrode and reference electrode respectively. The
electrode can be easily prepared and showed a good analytical response was linear in
the range of 10 µg L-1
to 50 µg L-1
. Successive cyclic voltammograms of gold
electrode and scan start voltage -1.30 v to 1.3v at room temperature. The portable
voltammetric device for detecting Lead (Pb) -40 to 20 µA, -50 to 20 µA, -65 to 20 µA
and -70 to 20 µA cadmium (Cd) -60 to 20 µA, -80 to 20 µA,-90 to 20 µA and -110 to
20 µA and copper (Cu) -90 to 20 µA, -110 to 20 µA,-150 to 20 µA and -180 to 20 µA
contamination at 10, 20, 30 and 50 µgL-1
of lead (Pb), cadmium (Cd) and copper
(Cu), respectively.
The results of Linearity, Form the linearity between the metal concentration
and the peak current, we can estimate the detection sensitivity of the electrode. The
metal concentration deposited on the gold electrode increases with an increasing
accumulation time. Therefore, as the accumulation time increases, the peak current is
enhanced, which leads to an increase in the slope of the linear relationship between
the peak current is significantly influenced by the portable voltammetric device for
detecting heavy metal contamination and show the peak current against the Cd Pb and
Cu concentrations.
The results in Figure 4-6 shows the peak current of Pb Cd and Cu
concentration, respectively. The slopes of the linearity were determined to be Lead
(Pb) y = -10.4x -35, R2 = 0.9555, cadmium (Cd) y = -16x -47.5, R
2 = 0.9405 and
copper (Cu) y = -32.3x -52, R2 = 0.9834
The results in Figure 4-7 shows analysis of sample water. In order to find
out the applicability of gold wire, platinum wire and silver wire electrode detecting as
well as the validity of the developed procedure, the electrode was utilized to detect
trace amounts of Cd Pb and Cu in standard solution and five water sample. The
sample water was collected form Chonburi province. The result shows the analytical
characteristics and successive cyclic voltammograms found heavy metal in sample
water 4 sample form 5 sample. The cyclic voltammograms in sample number 1 show
not detected, cyclic show current -6 to 12 µA. The cyclic voltammograms in sample
number 2 cyclic voltammogrames show current -42 to 20 µA. The cyclic

57
voltammograms in sample number 3 cyclic voltammogrames show current -50 to 40
µA. The cyclic voltammograms in sample number 4 cyclic voltammogrames show
current -55 to 20 µA. The cyclic voltammograms in sample number 5 cyclic
voltammogrames show current -85 to 20 µA. Finally, the same found form GFAAS,
found heave metal in 4 sample water form 5 sample water.
Conclusion
In this study, we demonstrated the portable voltammetry that used gold wire,
platinum wire and silver wire for working electrode, reference electrode and counter
electrode respectively. The electrode can be easily prepared and showed a good
analytical response for lead (Pb), Cadmium (Cd) and copper (Cu) in standard solution
and tap water. The portable heavy metal meter is easily taken, used and low cost,
which is a feature useful for monitoring the lead (Pb), Cadmium (Cd) and copper (Cu)
in sample water, tap water, waste water and drinking water.
In addition to its simplicity, low cost, low reagent consumption and
reusability, the gold wire, platinum wire, silver wire and graphite pencil electrode can
also be used with advantage for detecting other metal toxic ions in natural water
samples.
58
REFERENCES
Anandhakumar, S., & Mathiyarasu, J. (2012). In situ bismuth film modified carbon
fiber microelectrode for nanomolar detection of cadmium and lead.
Indian journal of chemistry, 51A, 699-703.
Arpadjan, S., Celik, G., Taskesen, S., & Gucer, S. (2008). Arsenic, cadmium and lead
in medicinal herbs and their fractionation. Food and Chemical Toxicology
46, 2871-2875.
Birinci, A., Eren, H., Coldur, F., Coskun, E., & Andac, M. (2016). Rapid
determination of trace level copper in tea infusion samples by solid contact
ion selective electrode. Food and drug analysis, Article in press
Dasbas, T., Sacmac, S., Ulgen, A., & Kartalb, S. (2015). A solid phase extraction
procedure for the determination of Cd (II) and Pb (II) ions in food and water
samples by flame atomic absorption spectrometry. Food Chemistry, 174,
591-596.
Desideri, D., Meli, M. A., Roselli, C., & Feduzi, L. (2011). Polarized X ray
fluorescence spectrometer (EDPXRF) for the determination of essential and
non essential elements in tea. Microchemical Journal, 98(2), 186-189.
Duran, C., Ozdes, D., Sahin, D., Bulut, V. N., Gundogdu, A., & Soylak, M. (2011).
Preconcentration of Cd (II) and Cu (II) ions by coprecipitation without any
carrier element in some food and water samples. Microchemical Journal,
98(2), 317-322.
Grzesik, E. B., & Kolon, A. J. (2008). Leaching of cadmium and lead from dried
fruits and fruit teas to infusions and decoctions. Food Composition and
Analysis Journal, 21, 326-331.
Gorur, F. K., Keser, R., Akcay, N., Dizman, S., & Okumusoglu, N. T. (2011).
Radionuclides and heavy metals concentrations in Turkish market tea.
Food control, 22(12), 2065-2070.

59
Guo, J., Chai, Y., Yuan, R., Song, Z., & Zou, Z. (2011). Lead (II) carbon paste
electrode based on derivatized multi-walled carbon nanotubes: Application
to lead content determination in environmental samples. Sensors and
Actuators B, 155, 639-645.
Hevia, K., Arancibia, V., & Romo, C.R. (2015). Levels of copper in sweeteners,
sugar, tea, coffee and mate infusions. Determination by adsorptive stripping
voltammetry in the presence of α-lipoic acid. Microchemical Journal, 119,
11-16.
Hwang, G. H., Han, W. K., Park, J. S., & Kang, S. G. (2008). Determination of trace
metals by anodic stripping voltammetry using a bismuth-modified carbon
nanotube electrode. Talanta ,76(2), 301-308.
Injanga, U., Noyroda, P., Siangprohb, W., Dungchaia, W., Motomizuc, S., &
Chailapakulad, O. (2010). Determination of trace heavy metals in herbs by
sequential injection analysis-anodic stripping voltammetry using screen-
printed carbonnanotubes electrodes. Analytica Chimica Acta, 668, 54-60.
Jothimuthu, P., Wison, R. A., Herren, J., Pei, X., Kang, W., Daniels, R., Wong, H.,
Beyette, F., Heineman, W. R., & Papautsky, I. (2013). Zinc detection in
Serum by Anodic stripping voltammetry on microfabricated bismuth
electrode. Electroanalysis, 25(2).
Karimi, G., Hasanzadeh, M. K., Nili, A., Khashayarmanesh, Z., Samiei, Z., Nazari,
F., & Teimuri, M. (2008). Concentrations and Health Risk of Heavy Metals
in Tea Samples Marketed in IRAN. Pharmacologyonline, 3, 164-174.
Kefala, G., Economou, A., Voulgaropoulos, A., & Sofoniou, M. (2003). A study of
bismuth-film electrodes for the detection of trace metals by anodic stripping
voltammetry and their application to the determination of Pb and Zn in
tapwater and human hair. Talanta, 61, 603-610.
Krolicka, A., Pauliukait, R., Svancara, I., Metelkac, R., Bobrowskia,A., Norkusb, A.,
Kalcherd, K., & Vytřas, K. (2002). Bismuth-film-plated carbon paste
electrodes. Electrochemistry Communications, 4, 193-196.
60
Liu, G. L.,Wang, J. F., Li, Z. Y., Liang, S. Z., Liu, J. H., &Wang, X. N. (2009).
Development of direct competitive enzyme-linked immunosorbent assay for
the determination cadmium residue in farm produce. Applied Biochemistry
and Biotechnology, 159(3), 708-717.
Milania, R. F., Morganoa, M. A., & Cadoreb, C. (2016). Trace elements in Camellia
sinensis marketed in southeastern Brazil: Extraction from tea leaves to
beverages and dietary exposure. LWT-Food Science and Technology,
68, 491-498.
Malik, J., Frankova, A., Drabek, O., Szakova, J., Asha, C., & Kokoska, L. (2013).
Aluminium and other elements in selected herbal tea plant species and their
infusions. Food Chemistry, 139, 728-734.
Ning, P. B., Gong, C. M., Zhang, Y. M., Guo, K. K., & Bai, J. A. (2011). Lead,
cadmium, arsenic, mercury and copper levels in Chinese Yunnan Pu'er tea.
Food Additives & Contaminants. Part B, Surveillance, 4(1), 28-33.
Raj, J., Raina, A. M., & Dogra, T. D. (2013). Direct Determination of Zinc,
Cadmium, Lead, Copper Metal in Tap Water of Delhi (India) by Anodic
Stripping Voltammetry Technique. EDP Sciences.
Rehacek, V., Hotovy, I., Vojs, M., & Mika, I. (2008). Bismuth film electrodes for
heavy metals determination. Microsyst Technol, 14, 491-498.
Rubio, C., Lucas, J. R. D., Gutiérrez, A. J., Glez-Weller, D., Pérez Marrero, B.,
Caballero, J. M., Revert, C. A., & Hardisson. (2012). Evaluation of metal
concentrations in mentha herbal teas (Mentha piperita, Mentha pulegium and
Mentha species) by inductively coupled plasma Spectrometry.
Pharmaceutical and Biomedical Analysis Journal, 71, 11-17.
Salih, F.E., Ouarzane, A., & Rhazi, M.E. (2015). Electrochemical detection of lead
(II) at bismuth/Poly (1,8-diaminonaphthalene) modified carbon paste
electrode. Arabian Journal of Chemistry, 11, 12-19.
Seenivasan, S., Manikandan, N., Muraleedharan, N. N., & Selvasundaram, R. (2008).
Heavy metal content of black teas from south India. Food Control, 19,
746-749.
Solidum, J. N. (2014). Lead Levels in Fresh Medicinal Herbs and Commercial Tea
Products from Manila, Philippines. APCBEE Procedia, 10, 281-285.

61
Soylak, M., Tuzen, M., Mendil, D., & Turkekul, I. (2006). Biosorption of heavy
metals on Aspergillus fumigatus immobilized Diaion HP-2MG resin for
their atomic absorption spectrometric determinations. Talanta, 70(5),
1129-1135.
Tarleya, C.R.T., Santosa, V.S., Baêtaa, B.E.L., Pereirab, A.C., & Kubota, L.T.
(2009). Simultaneous determination of zinc, cadmium and lead in
environmental water samples by potentiometric stripping analysis (PSA)
using multiwalled carbon nanotube electrode. Hazardous Materials, 169,
256-262.
Tokahoglu, S., & Kartal, S. (2004). Bioavailability of soil-extractable metals to tea
plant by BCR sequential extraction procedure. Instrumentation Science and
Technology, 32(4), 387-400.
Tufa, L.T., Sirajz, K., & Soreta, T. R. (2013). Electrochemical Determination of Lead
Using Bismuth Modified Glassy Carbon Electrode. Russian Journal of
Electrochemistry, 49(1), 59-66.
Tuzen, M., Soylak, M., & Elci, L. (2005). Multi-element pre-concentration of heavy
metal ions by solid phase extraction on Chromosorb 108. Analytica Chimica
Acta, 548(1-2), 101-108.
Wan,W., Sun, Q., Li, H., Sun, F., Hu, N., & Wang, P. (2015). Screen-printed gold
electrode with gold nanoparticles modificationfor simultaneous
electrochemical determination of lead and copper. Sensors and Actuators B,
209, 336-342.
Wang, Z., Wang, H., Zhang, Z., & Liu, G. (2014). Electrochemical determination of
lead and cadmium in rice by adisposable bismuth/electrochemically reduced
graphene/ionic liquidcomposite modified screen-printed electrode. Sensors
and Actuators B, 199, 7-14.
Zhong, W., Ren, T., & Zhao, L. (2016). Determination of Pb (Lead), Cd (Cadmium),
Cr (Chromium), Cu (Copper), and Ni (Nickel) in Chinese tea with
high-resolution continuum source graphite furnace atomic absorption
spectrometry. Food and drug Analysis, 46-55.

62
APPENDIX

63
APPENDIX A
Supplement data for figures
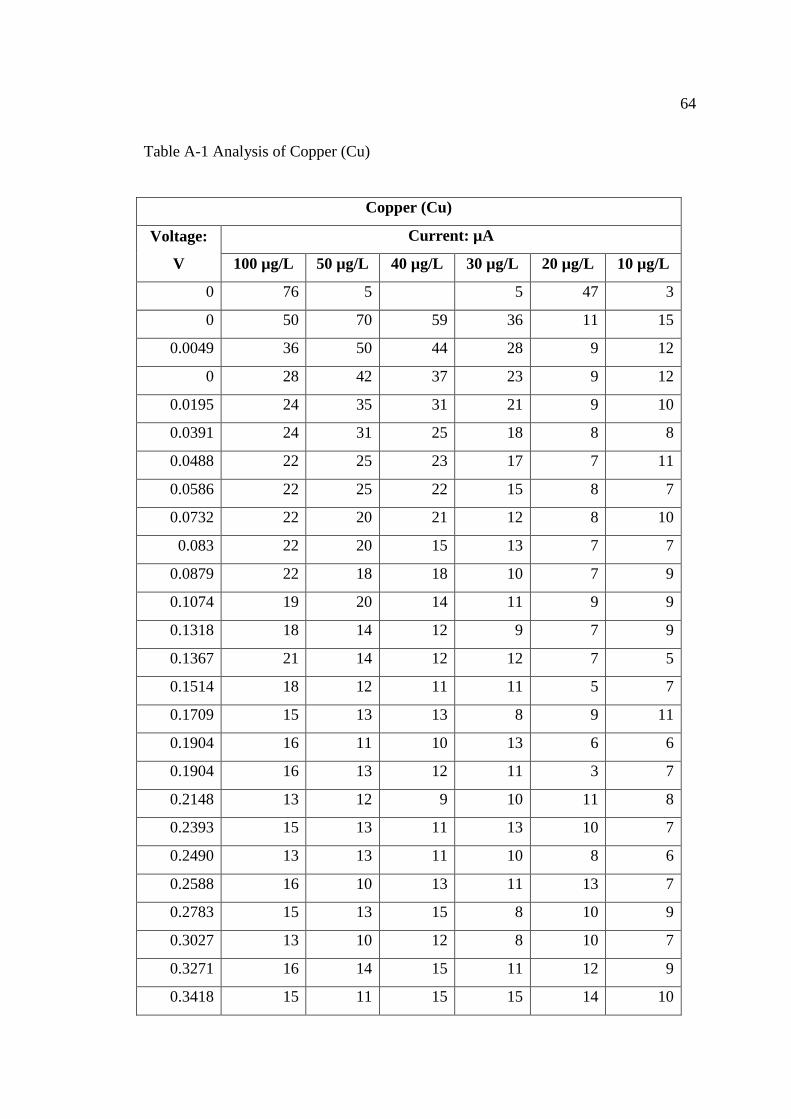
64
Table A-1 Analysis of Copper (Cu)
Copper (Cu)
Voltage:
V
Current: µA
100 µg/L 50 µg/L 40 µg/L 30 µg/L 20 µg/L 10 µg/L
0 76 5
5 47 3
0 50 70 59 36 11 15
0.0049 36 50 44 28 9 12
0 28 42 37 23 9 12
0.0195 24 35 31 21 9 10
0.0391 24 31 25 18 8 8
0.0488 22 25 23 17 7 11
0.0586 22 25 22 15 8 7
0.0732 22 20 21 12 8 10
0.083 22 20 15 13 7 7
0.0879 22 18 18 10 7 9
0.1074 19 20 14 11 9 9
0.1318 18 14 12 9 7 9
0.1367 21 14 12 12 7 5
0.1514 18 12 11 11 5 7
0.1709 15 13 13 8 9 11
0.1904 16 11 10 13 6 6
0.1904 16 13 12 11 3 7
0.2148 13 12 9 10 11 8
0.2393 15 13 11 13 10 7
0.2490 13 13 11 10 8 6
0.2588 16 10 13 11 13 7
0.2783 15 13 15 8 10 9
0.3027 13 10 12 8 10 7
0.3271 16 14 15 11 12 9
0.3418 15 11 15 15 14 10
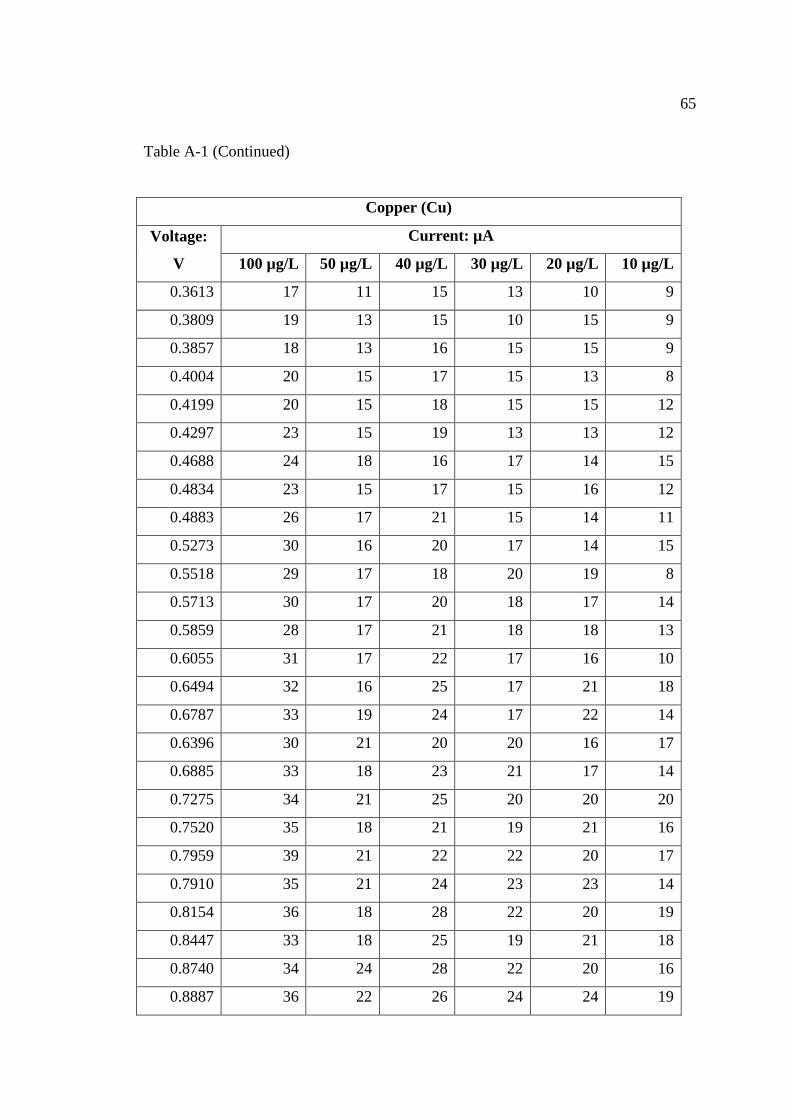
65
Table A-1 (Continued)
Copper (Cu)
Voltage:
V
Current: µA
100 µg/L 50 µg/L 40 µg/L 30 µg/L 20 µg/L 10 µg/L
0.3613 17 11 15 13 10 9
0.3809 19 13 15 10 15 9
0.3857 18 13 16 15 15 9
0.4004 20 15 17 15 13 8
0.4199 20 15 18 15 15 12
0.4297 23 15 19 13 13 12
0.4688 24 18 16 17 14 15
0.4834 23 15 17 15 16 12
0.4883 26 17 21 15 14 11
0.5273 30 16 20 17 14 15
0.5518 29 17 18 20 19 8
0.5713 30 17 20 18 17 14
0.5859 28 17 21 18 18 13
0.6055 31 17 22 17 16 10
0.6494 32 16 25 17 21 18
0.6787 33 19 24 17 22 14
0.6396 30 21 20 20 16 17
0.6885 33 18 23 21 17 14
0.7275 34 21 25 20 20 20
0.7520 35 18 21 19 21 16
0.7959 39 21 22 22 20 17
0.7910 35 21 24 23 23 14
0.8154 36 18 28 22 20 19
0.8447 33 18 25 19 21 18
0.8740 34 24 28 22 20 16
0.8887 36 22 26 24 24 19
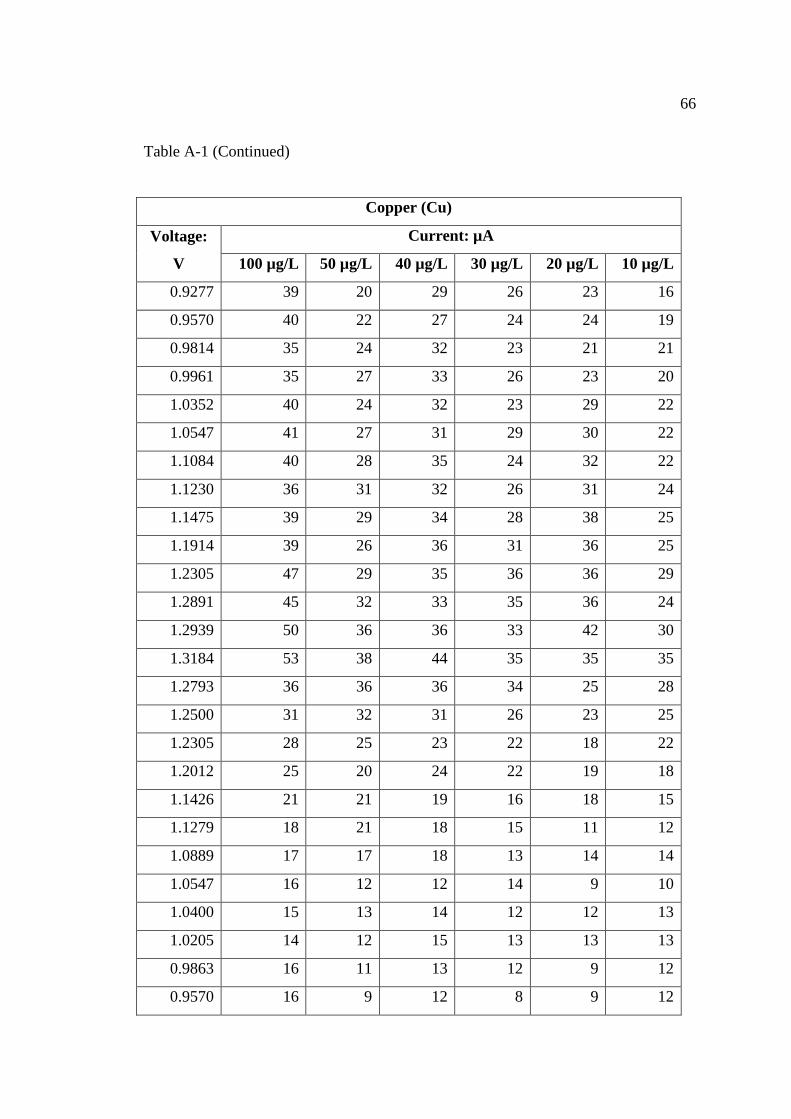
66
Table A-1 (Continued)
Copper (Cu)
Voltage:
V
Current: µA
100 µg/L 50 µg/L 40 µg/L 30 µg/L 20 µg/L 10 µg/L
0.9277 39 20 29 26 23 16
0.9570 40 22 27 24 24 19
0.9814 35 24 32 23 21 21
0.9961 35 27 33 26 23 20
1.0352 40 24 32 23 29 22
1.0547 41 27 31 29 30 22
1.1084 40 28 35 24 32 22
1.1230 36 31 32 26 31 24
1.1475 39 29 34 28 38 25
1.1914 39 26 36 31 36 25
1.2305 47 29 35 36 36 29
1.2891 45 32 33 35 36 24
1.2939 50 36 36 33 42 30
1.3184 53 38 44 35 35 35
1.2793 36 36 36 34 25 28
1.2500 31 32 31 26 23 25
1.2305 28 25 23 22 18 22
1.2012 25 20 24 22 19 18
1.1426 21 21 19 16 18 15
1.1279 18 21 18 15 11 12
1.0889 17 17 18 13 14 14
1.0547 16 12 12 14 9 10
1.0400 15 13 14 12 12 13
1.0205 14 12 15 13 13 13
0.9863 16 11 13 12 9 12
0.9570 16 9 12 8 9 12

67
Table A-1 (Continued)
Copper (Cu)
Voltage:
V
Current: µA
100 µg/L 50 µg/L 40 µg/L 30 µg/L 20 µg/L 10 µg/L
0.9326 11 12 13 8 11 7
0.8984 9 9 10 7 7 11
0.8789 11 12 8 7 6 7
0.8496 8 7 10 11 9 7
0.8252 9 7 12 9 5 8
0.8105 9 8 6 8 6 7
0.7813 7 7 7 6 7 7
0.7520 7 8 8 7 3 6
0.7129 6 7 5 5 2 5
0.7080 4 6 7 9 7 7
0.6787 2 7 3 3 4 7
0.6787 2 6 6 2 4 1
0.6299 2 6 5 7 -1 3
0.6201 0 7 4 4 -1 4
0.5957 2 6 5 2 3 4
0.5713 2 8 3 4 0 0
0.5127 2 6 4 2 -3 3
0.5322 -2 6 4 0 -2 0
0.5029 1 4 4 2 2 1
0.4736 2 4 4 1 2 2
0.4785 -2 5 3 2 0 1
0.4395 1 5 2 -1 -2 1
0.4248 -1 3 1 1 -2 0
0.4102 -1 4 0 -2 1 1
0.3906 0 2 1 1 -4 0
0.3857 0 -1 1 1 -1 1
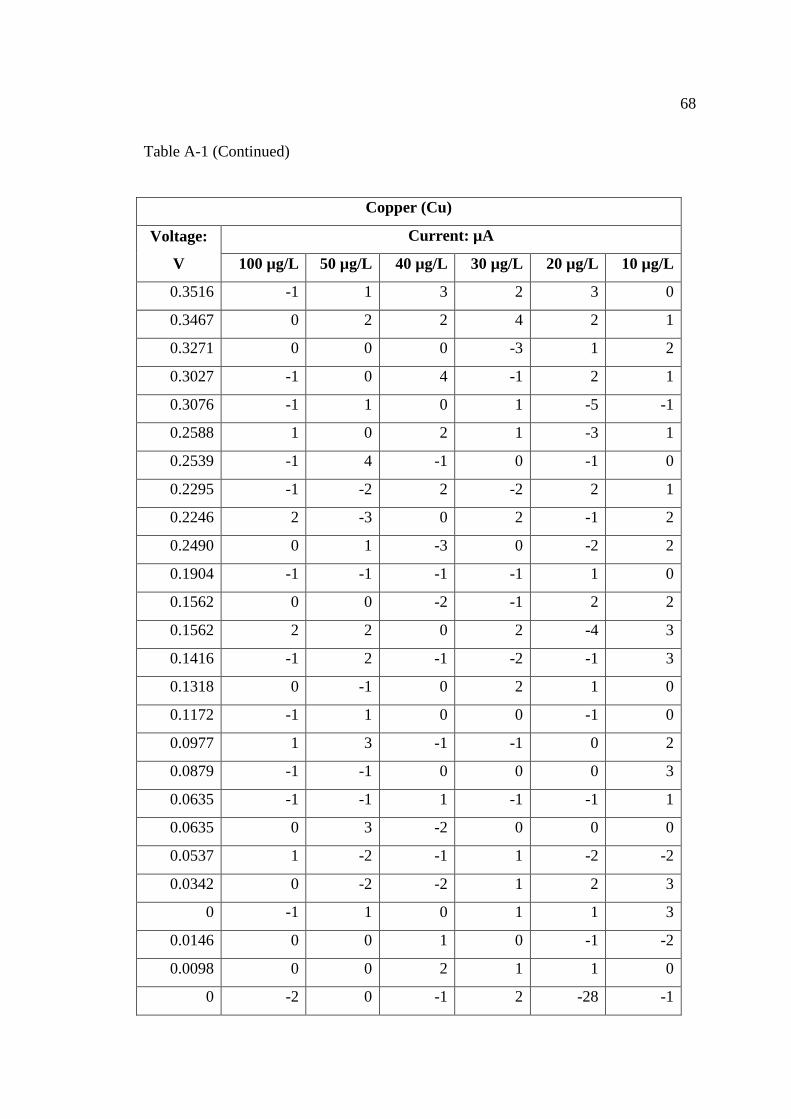
68
Table A-1 (Continued)
Copper (Cu)
Voltage:
V
Current: µA
100 µg/L 50 µg/L 40 µg/L 30 µg/L 20 µg/L 10 µg/L
0.3516 -1 1 3 2 3 0
0.3467 0 2 2 4 2 1
0.3271 0 0 0 -3 1 2
0.3027 -1 0 4 -1 2 1
0.3076 -1 1 0 1 -5 -1
0.2588 1 0 2 1 -3 1
0.2539 -1 4 -1 0 -1 0
0.2295 -1 -2 2 -2 2 1
0.2246 2 -3 0 2 -1 2
0.2490 0 1 -3 0 -2 2
0.1904 -1 -1 -1 -1 1 0
0.1562 0 0 -2 -1 2 2
0.1562 2 2 0 2 -4 3
0.1416 -1 2 -1 -2 -1 3
0.1318 0 -1 0 2 1 0
0.1172 -1 1 0 0 -1 0
0.0977 1 3 -1 -1 0 2
0.0879 -1 -1 0 0 0 3
0.0635 -1 -1 1 -1 -1 1
0.0635 0 3 -2 0 0 0
0.0537 1 -2 -1 1 -2 -2
0.0342 0 -2 -2 1 2 3
0 -1 1 0 1 1 3
0.0146 0 0 1 0 -1 -2
0.0098 0 0 2 1 1 0
0 -2 0 -1 2 -28 -1
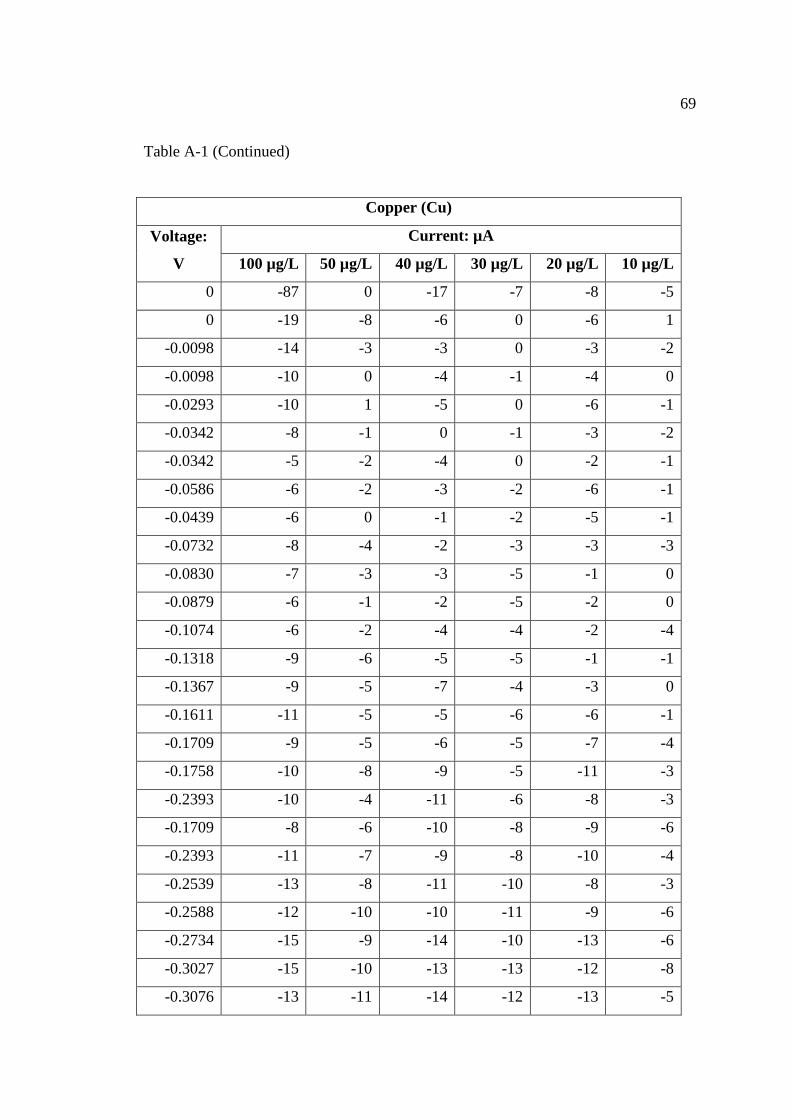
69
Table A-1 (Continued)
Copper (Cu)
Voltage:
V
Current: µA
100 µg/L 50 µg/L 40 µg/L 30 µg/L 20 µg/L 10 µg/L
0 -87 0 -17 -7 -8 -5
0 -19 -8 -6 0 -6 1
-0.0098 -14 -3 -3 0 -3 -2
-0.0098 -10 0 -4 -1 -4 0
-0.0293 -10 1 -5 0 -6 -1
-0.0342 -8 -1 0 -1 -3 -2
-0.0342 -5 -2 -4 0 -2 -1
-0.0586 -6 -2 -3 -2 -6 -1
-0.0439 -6 0 -1 -2 -5 -1
-0.0732 -8 -4 -2 -3 -3 -3
-0.0830 -7 -3 -3 -5 -1 0
-0.0879 -6 -1 -2 -5 -2 0
-0.1074 -6 -2 -4 -4 -2 -4
-0.1318 -9 -6 -5 -5 -1 -1
-0.1367 -9 -5 -7 -4 -3 0
-0.1611 -11 -5 -5 -6 -6 -1
-0.1709 -9 -5 -6 -5 -7 -4
-0.1758 -10 -8 -9 -5 -11 -3
-0.2393 -10 -4 -11 -6 -8 -3
-0.1709 -8 -6 -10 -8 -9 -6
-0.2393 -11 -7 -9 -8 -10 -4
-0.2539 -13 -8 -11 -10 -8 -3
-0.2588 -12 -10 -10 -11 -9 -6
-0.2734 -15 -9 -14 -10 -13 -6
-0.3027 -15 -10 -13 -13 -12 -8
-0.3076 -13 -11 -14 -12 -13 -5

70
Table A-1 (Continued)
Copper (Cu)
Voltage:
V
Current: µA
100 µg/L 50 µg/L 40 µg/L 30 µg/L 20 µg/L 10 µg/L
-0.3320 -16 -12 -11 -12 -12 -7
-0.3662 -16 -15 -18 -13 -12 -10
-0.3662 -18 -14 -19 -16 -12 -8
-0.3906 -21 -16 -20 -13 -12 -9
-0.4102 -21 -15 -18 -18 -17 -11
-0.4248 -20 -16 -18 -18 -16 -12
-0.4443 -21 -15 -21 -18 -20 -10
-0.4736 -24 -17 -24 -18 -18 -8
-0.5225 -22 -22 -21 -19 -23 -12
-0.5176 -26 -22 -26 -20 -18 -13
-0.5273 -27 -25 -29 -21 -22 -14
-0.5957 -30 -26 -32 -22 -22 -15
-0.5615 -32 -27 -29 -25 -27 -16
-0.5957 -37 -27 -32 -25 -28 -17
-0.6006 -39 -29 -39 -29 -28 -17
-0.6299 -48 -32 -40 -29 -25 -16
-0.7080 -60 -34 -43 -35 -27 -23
-0.6738 -75 -38 -43 -35 -29 -24
-0.6982 -89 -39 -43 -34 -29 -27
-0.7373 -99 -45 -51 -43 -34 -24
-0.7422 -116 -45 -56 -43 -37 -29
-0.7715 -138 -52 -59 -49 -40 -30
-0.8154 -158 -53 -65 -54 -41 -34
-0.8252 -178 -60 -70 -56 -48 -36
-0.8398 -200 -66 -74 -60 -49 -42
-0.8691 -229 -68 -76 -62 -55 -43
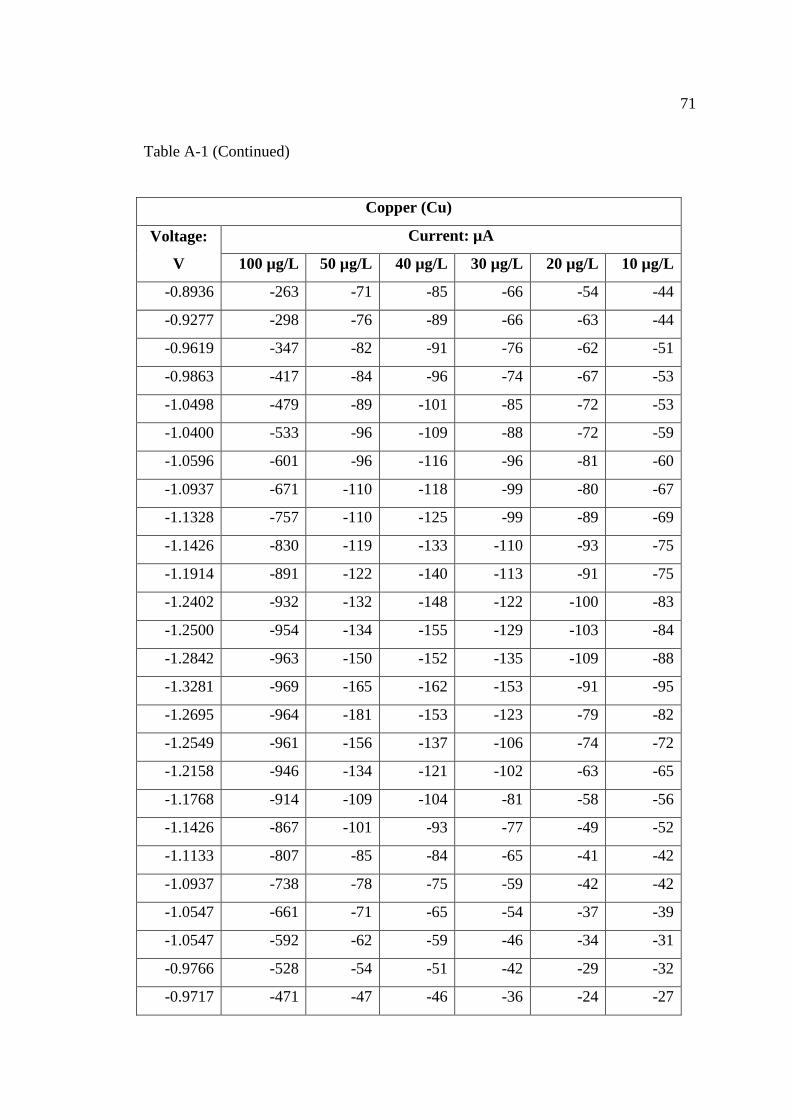
71
Table A-1 (Continued)
Copper (Cu)
Voltage:
V
Current: µA
100 µg/L 50 µg/L 40 µg/L 30 µg/L 20 µg/L 10 µg/L
-0.8936 -263 -71 -85 -66 -54 -44
-0.9277 -298 -76 -89 -66 -63 -44
-0.9619 -347 -82 -91 -76 -62 -51
-0.9863 -417 -84 -96 -74 -67 -53
-1.0498 -479 -89 -101 -85 -72 -53
-1.0400 -533 -96 -109 -88 -72 -59
-1.0596 -601 -96 -116 -96 -81 -60
-1.0937 -671 -110 -118 -99 -80 -67
-1.1328 -757 -110 -125 -99 -89 -69
-1.1426 -830 -119 -133 -110 -93 -75
-1.1914 -891 -122 -140 -113 -91 -75
-1.2402 -932 -132 -148 -122 -100 -83
-1.2500 -954 -134 -155 -129 -103 -84
-1.2842 -963 -150 -152 -135 -109 -88
-1.3281 -969 -165 -162 -153 -91 -95
-1.2695 -964 -181 -153 -123 -79 -82
-1.2549 -961 -156 -137 -106 -74 -72
-1.2158 -946 -134 -121 -102 -63 -65
-1.1768 -914 -109 -104 -81 -58 -56
-1.1426 -867 -101 -93 -77 -49 -52
-1.1133 -807 -85 -84 -65 -41 -42
-1.0937 -738 -78 -75 -59 -42 -42
-1.0547 -661 -71 -65 -54 -37 -39
-1.0547 -592 -62 -59 -46 -34 -31
-0.9766 -528 -54 -51 -42 -29 -32
-0.9717 -471 -47 -46 -36 -24 -27

72
Table A-1 (Continued)
Copper (Cu)
Voltage:
V
Current: µA
100 µg/L 50 µg/L 40 µg/L 30 µg/L 20 µg/L 10 µg/L
-0.9521 -418 -47 -36 -35 -27 -30
-0.9229 -369 -40 -37 -30 -28 -21
-0.9082 -324 -38 -30 -27 -21 -23
-0.8936 -284 -32 -31 -27 -18 -19
-0.8203 -241 -30 -26 -21 -19 -19
-0.8154 -206 -28 -24 -25 -21 -18
-0.7910 -183 -28 -23 -21 -18 -21
-0.7813 -153 -28 -23 -17 -13 -14
-0.7422 -132 -23 -27 -21 -14 -14
-0.7324 -116 -20 -21 -16 -15 -11
-0.6982 -99 -19 -23 -15 -15 -12
-0.6787 -91 -21 -16 -16 -14 -9
-0.6641 -83 -18 -15 -15 -7 -15
-0.6299 -72 -15 -14 -9 -10 -9
-0.6152 -63 -16 -15 -12 -5 -7
-0.5859 -53 -25 -14 -8 -10 -7
-0.5713 -46 -22 -10 -8 -3 -12
-0.5420 -33 -21 -8 -9 -5 -8
-0.5371 -25 -21 -8 -6 -3 -4
-0.5029 -18 -24 -8 -7 -2 -7
-0.5029 -14 -19 -7 -5 -4 -4
-0.4541 -5 -14 -4 -4 1 -4
-0.4395 -3 -10 -3 -2 2 0
-0.4297 1 -11 -1 0 -2 -2
-0.4102 3 -5 -1 1 2 1
-0.3857 2 -3 3 4 1 1
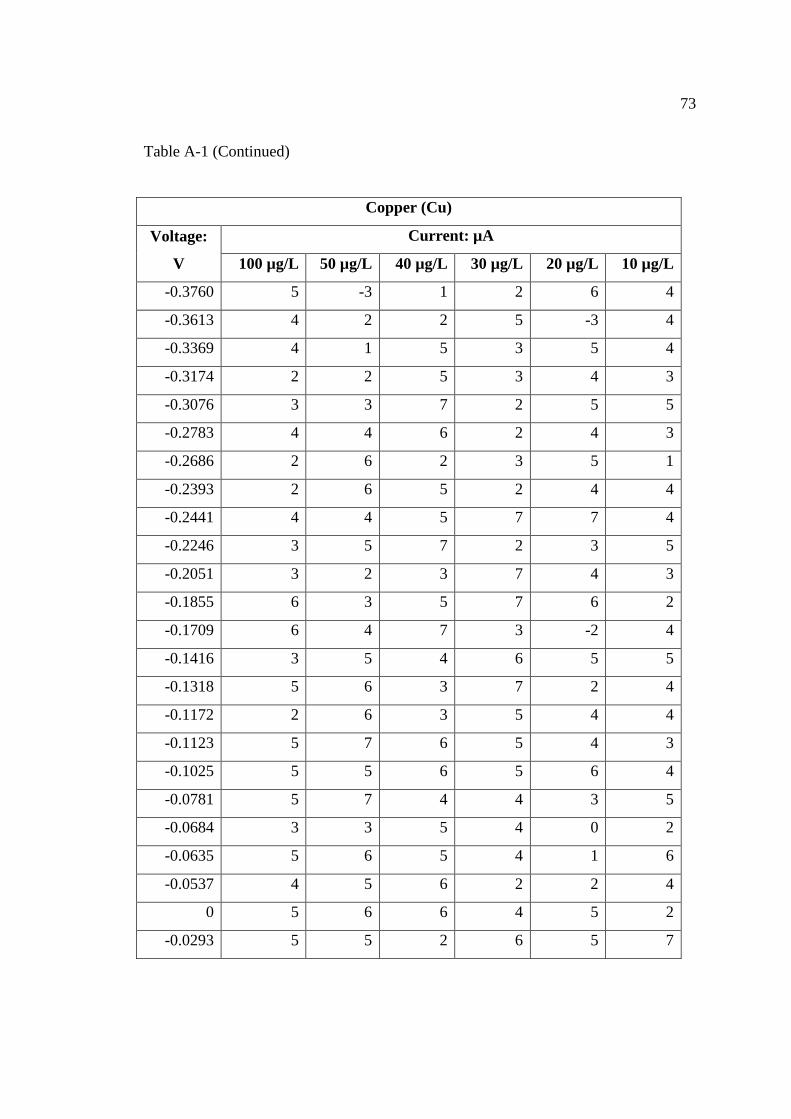
73
Table A-1 (Continued)
Copper (Cu)
Voltage:
V
Current: µA
100 µg/L 50 µg/L 40 µg/L 30 µg/L 20 µg/L 10 µg/L
-0.3760 5 -3 1 2 6 4
-0.3613 4 2 2 5 -3 4
-0.3369 4 1 5 3 5 4
-0.3174 2 2 5 3 4 3
-0.3076 3 3 7 2 5 5
-0.2783 4 4 6 2 4 3
-0.2686 2 6 2 3 5 1
-0.2393 2 6 5 2 4 4
-0.2441 4 4 5 7 7 4
-0.2246 3 5 7 2 3 5
-0.2051 3 2 3 7 4 3
-0.1855 6 3 5 7 6 2
-0.1709 6 4 7 3 -2 4
-0.1416 3 5 4 6 5 5
-0.1318 5 6 3 7 2 4
-0.1172 2 6 3 5 4 4
-0.1123 5 7 6 5 4 3
-0.1025 5 5 6 5 6 4
-0.0781 5 7 4 4 3 5
-0.0684 3 3 5 4 0 2
-0.0635 5 6 5 4 1 6
-0.0537 4 5 6 2 2 4
0 5 6 6 4 5 2
-0.0293 5 5 2 6 5 7
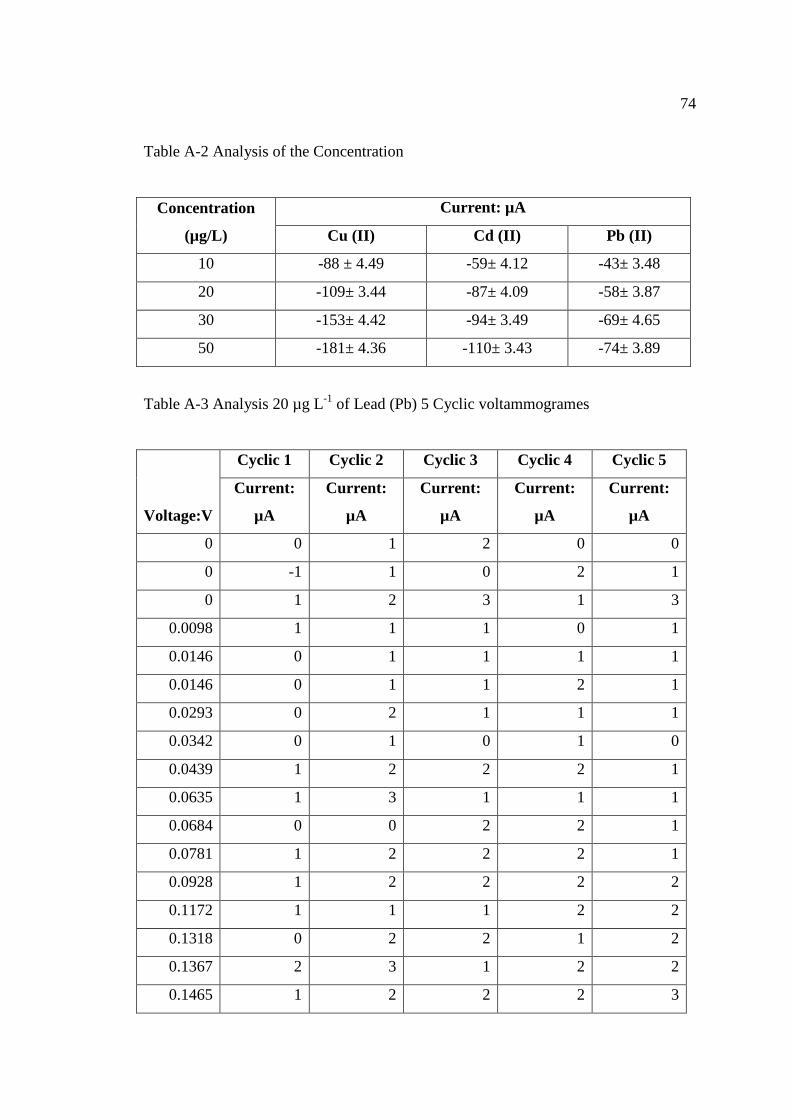
74
Table A-2 Analysis of the Concentration
Concentration
(µg/L)
Current: µA
Cu (II) Cd (II) Pb (II)
10 -88 ± 4.49 -59± 4.12 -43± 3.48
20 -109± 3.44 -87± 4.09 -58± 3.87
30 -153± 4.42 -94± 3.49 -69± 4.65
50 -181± 4.36 -110± 3.43 -74± 3.89
Table A-3 Analysis 20 µg L-1
of Lead (Pb) 5 Cyclic voltammogrames
Voltage:V
Cyclic 1 Cyclic 2 Cyclic 3 Cyclic 4 Cyclic 5
Current:
µA
Current:
µA
Current:
µA
Current:
µA
Current:
µA
0 0 1 2 0 0
0 -1 1 0 2 1
0 1 2 3 1 3
0.0098 1 1 1 0 1
0.0146 0 1 1 1 1
0.0146 0 1 1 2 1
0.0293 0 2 1 1 1
0.0342 0 1 0 1 0
0.0439 1 2 2 2 1
0.0635 1 3 1 1 1
0.0684 0 0 2 2 1
0.0781 1 2 2 2 1
0.0928 1 2 2 2 2
0.1172 1 1 1 2 2
0.1318 0 2 2 1 2
0.1367 2 3 1 2 2
0.1465 1 2 2 2 3
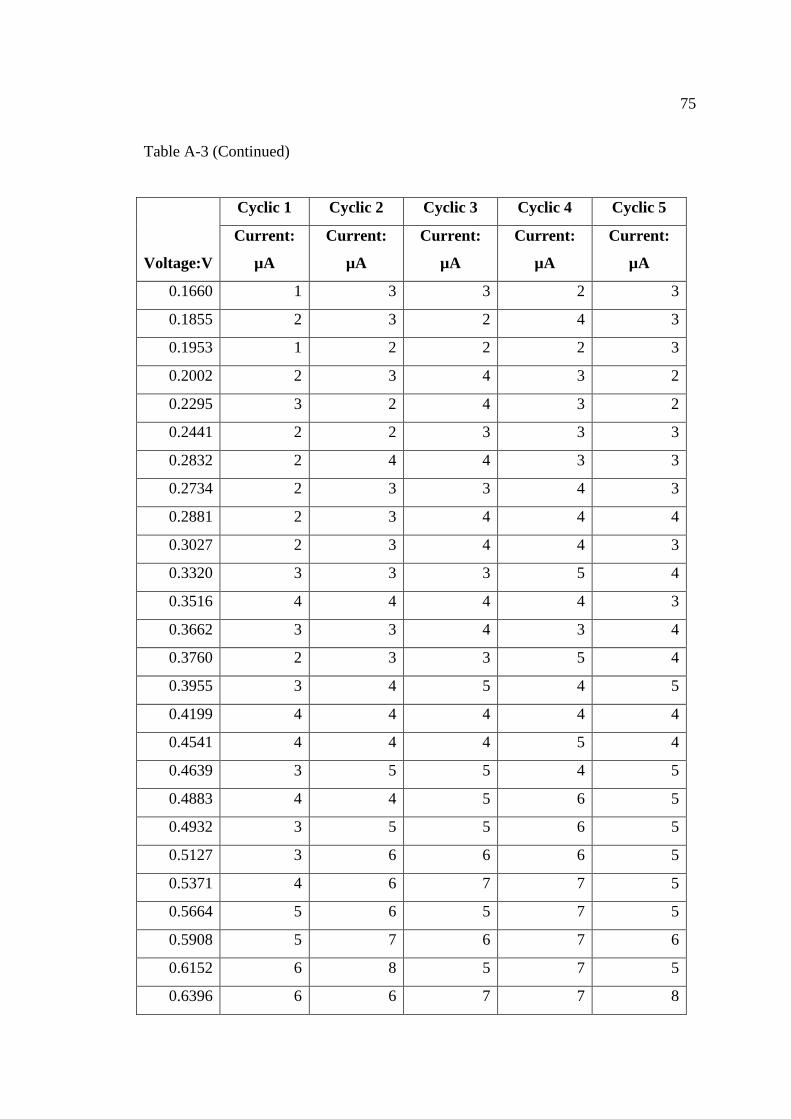
75
Table A-3 (Continued)
Voltage:V
Cyclic 1 Cyclic 2 Cyclic 3 Cyclic 4 Cyclic 5
Current:
µA
Current:
µA
Current:
µA
Current:
µA
Current:
µA
0.1660 1 3 3 2 3
0.1855 2 3 2 4 3
0.1953 1 2 2 2 3
0.2002 2 3 4 3 2
0.2295 3 2 4 3 2
0.2441 2 2 3 3 3
0.2832 2 4 4 3 3
0.2734 2 3 3 4 3
0.2881 2 3 4 4 4
0.3027 2 3 4 4 3
0.3320 3 3 3 5 4
0.3516 4 4 4 4 3
0.3662 3 3 4 3 4
0.3760 2 3 3 5 4
0.3955 3 4 5 4 5
0.4199 4 4 4 4 4
0.4541 4 4 4 5 4
0.4639 3 5 5 4 5
0.4883 4 4 5 6 5
0.4932 3 5 5 6 5
0.5127 3 6 6 6 5
0.5371 4 6 7 7 5
0.5664 5 6 5 7 5
0.5908 5 7 6 7 6
0.6152 6 8 5 7 5
0.6396 6 6 7 7 8
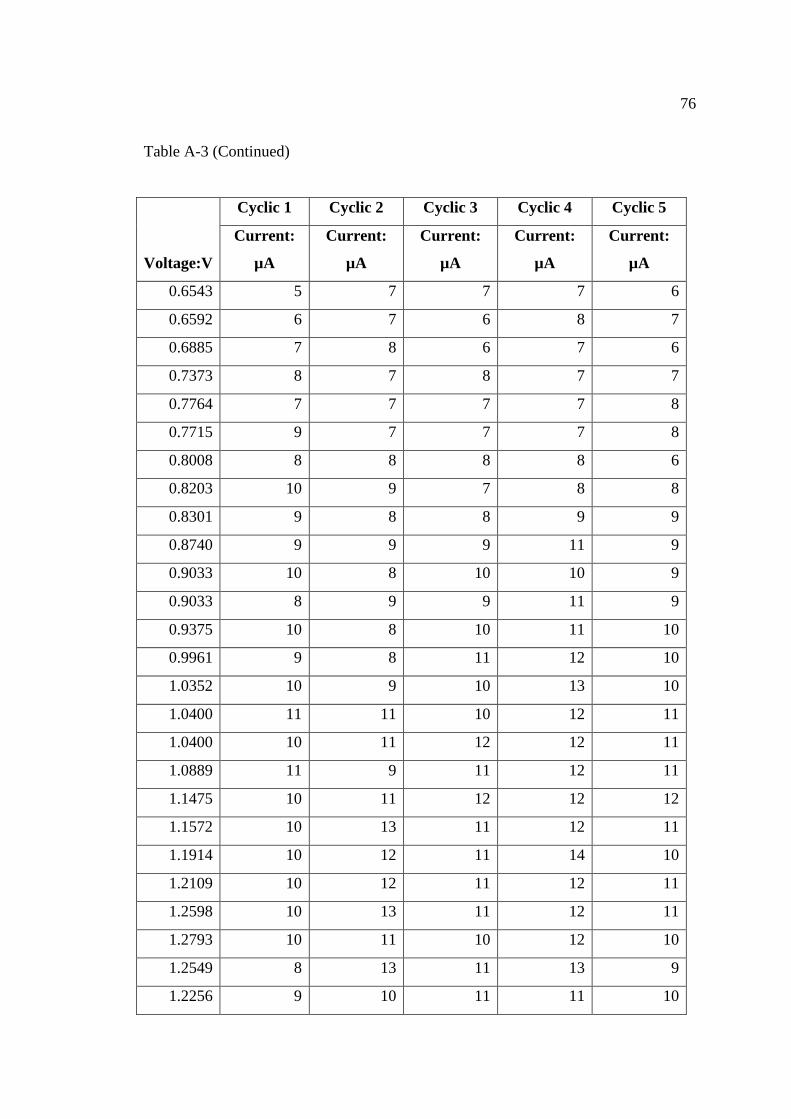
76
Table A-3 (Continued)
Voltage:V
Cyclic 1 Cyclic 2 Cyclic 3 Cyclic 4 Cyclic 5
Current:
µA
Current:
µA
Current:
µA
Current:
µA
Current:
µA
0.6543 5 7 7 7 6
0.6592 6 7 6 8 7
0.6885 7 8 6 7 6
0.7373 8 7 8 7 7
0.7764 7 7 7 7 8
0.7715 9 7 7 7 8
0.8008 8 8 8 8 6
0.8203 10 9 7 8 8
0.8301 9 8 8 9 9
0.8740 9 9 9 11 9
0.9033 10 8 10 10 9
0.9033 8 9 9 11 9
0.9375 10 8 10 11 10
0.9961 9 8 11 12 10
1.0352 10 9 10 13 10
1.0400 11 11 10 12 11
1.0400 10 11 12 12 11
1.0889 11 9 11 12 11
1.1475 10 11 12 12 12
1.1572 10 13 11 12 11
1.1914 10 12 11 14 10
1.2109 10 12 11 12 11
1.2598 10 13 11 12 11
1.2793 10 11 10 12 10
1.2549 8 13 11 13 9
1.2256 9 10 11 11 10

77
Table A-3 (Continued)
Voltage:V
Cyclic 1 Cyclic 2 Cyclic 3 Cyclic 4 Cyclic 5
Current:
µA
Current:
µA
Current:
µA
Current:
µA
Current:
µA
1.1914 7 8 8 9 8
1.1523 5 8 9 9 10
1.1133 6 7 7 9 7
1.0840 6 7 7 8 6
1.0693 6 6 8 7 7
1.0352 3 6 6 6 5
1.0400 4 6 7 7 6
0.9814 5 5 5 5 5
0.9717 3 5 5 5 6
0.9277 5 4 5 6 6
0.8984 4 5 5 5 5
0.8740 3 4 2 4 5
0.8496 2 5 5 4 5
0.8203 3 5 4 4 5
0.7471 3 3 3 4 4
0.7520 2 4 4 4 4
0.7422 2 3 4 3 4
0.7275 3 4 4 4 3
0.7080 2 2 3 3 2
0.6787 3 2 2 3 3
0.6641 2 3 3 4 2
0.6299 1 2 3 1 2
0.6006 2 3 2 3 2
0.5811 2 3 2 2 2
0.5615 2 2 2 1 2
0.5469 2 2 1 1 2

78
Table A-3 (Continued)
Voltage:V
Cyclic 1 Cyclic 2 Cyclic 3 Cyclic 4 Cyclic 5
Current:
µA
Current:
µA
Current:
µA
Current:
µA
Current:
µA
0.5322 0 1 1 3 1
0.5029 1 1 0 2 1
0.4883 0 1 1 1 1
0.4492 0 0 1 0 1
0.4443 0 -1 -1 -1 1
0.4199 1 1 0 0 0
0.3955 1 0 0 -1 0
0.3809 0 -2 -2 -2 -1
0.3711 1 -1 -2 -1 0
0.3516 0 -1 -2 -1 -1
0.3223 0 -1 0 -1 -2
0.3027 0 -1 -1 -1 -1
0.3027 0 -1 -2 -2 0
0.2930 0 -2 -1 -1 -2
0.2686 1 -2 -2 -1 -1
0.2490 0 0 -2 0 -2
0.2344 0 -3 -2 0 -2
0.1660 -1 -1 -1 -1 -1
0.2002 0 -1 -2 -1 1
0.1807 0 -1 -1 -1 -2
0.1660 -1 -1 -1 -1 -1
0.1514 0 -1 -2 -2 -1
0.1514 0 -2 0 -2 -2
0.1221 -1 -2 -1 -1 -1
0.1074 -1 0 -1 -2 -1
0.1025 0 -1 -1 -2 -1

79
Table A-3 (Continued)
Voltage:V
Cyclic 1 Cyclic 2 Cyclic 3 Cyclic 4 Cyclic 5
Current:
µA
Current:
µA
Current:
µA
Current:
µA
Current:
µA
0.0928 -1 -1 -1 -2 -1
0.0732 -1 -1 -2 -1 -1
0.0635 -1 -1 -1 -1 0
0 -1 0 0 -1 -2
0.0342 -2 0 -1 -1 -2
0.0781 -1 -2 0 -1 0
0.0195 -2 -1 0 -2 -1
0.0098 -1 -2 0 -1 -1
0 0 -2 -1 -2 0
0 -2 -2 -1 -1 -1
0 -5 -1 -1 -1 -1
0 -3 -1 -1 -7 -1
0 -3 -6 -5 -3 -5
-0.005 -3 -2 -3 -3 -3
-0.015 -2 -3 -2 -2 -2
-0.010 -2 -2 -2 -1 -3
-0.034 -3 -2 -2 -3 -3
-0.029 -2 -1 -3 -2 -2
-0.054 -3 -3 -3 -1 -3
-0.064 -3 -3 -3 -3 -3
-0.078 -5 -3 -3 -5 -3
-0.083 -4 -4 -3 -4 -4
-0.098 -4 -4 -4 -4 -3
-0.117 -4 -5 -5 -5 -5
-0.122 -5 -5 -6 -5 -6
-0.151 -6 -6 -6 -7 -6
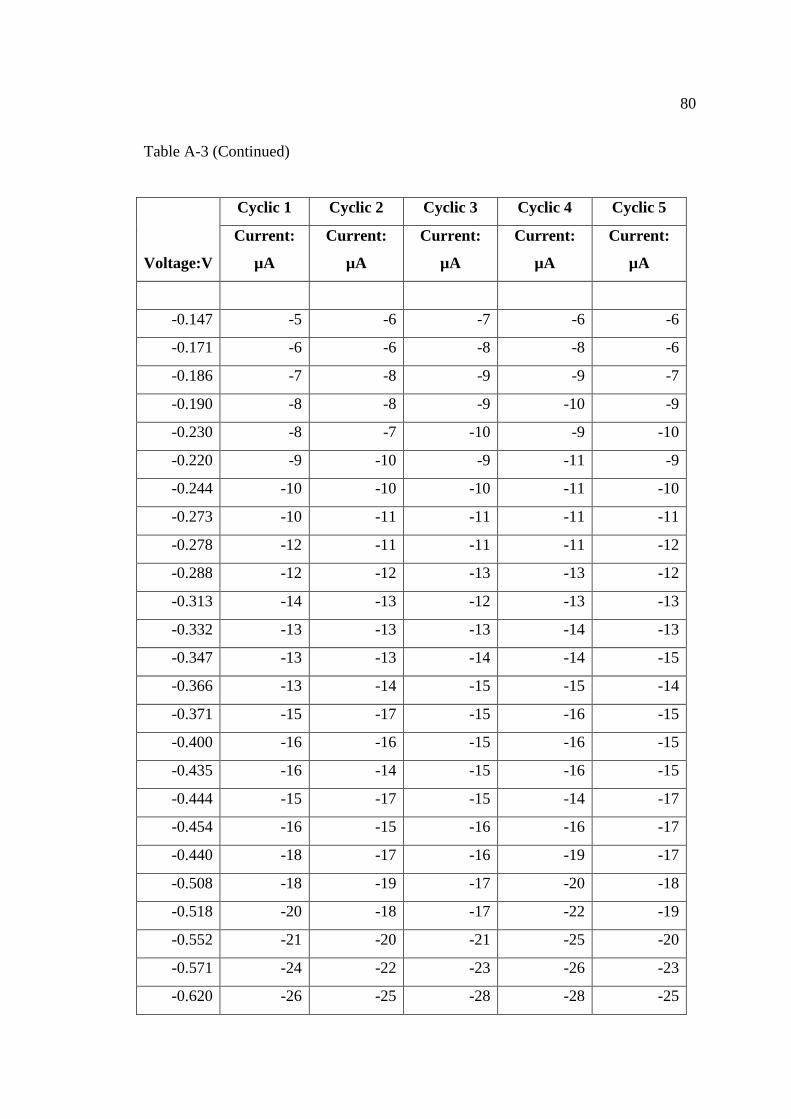
80
Table A-3 (Continued)
Voltage:V
Cyclic 1 Cyclic 2 Cyclic 3 Cyclic 4 Cyclic 5
Current:
µA
Current:
µA
Current:
µA
Current:
µA
Current:
µA
-0.147 -5 -6 -7 -6 -6
-0.171 -6 -6 -8 -8 -6
-0.186 -7 -8 -9 -9 -7
-0.190 -8 -8 -9 -10 -9
-0.230 -8 -7 -10 -9 -10
-0.220 -9 -10 -9 -11 -9
-0.244 -10 -10 -10 -11 -10
-0.273 -10 -11 -11 -11 -11
-0.278 -12 -11 -11 -11 -12
-0.288 -12 -12 -13 -13 -12
-0.313 -14 -13 -12 -13 -13
-0.332 -13 -13 -13 -14 -13
-0.347 -13 -13 -14 -14 -15
-0.366 -13 -14 -15 -15 -14
-0.371 -15 -17 -15 -16 -15
-0.400 -16 -16 -15 -16 -15
-0.435 -16 -14 -15 -16 -15
-0.444 -15 -17 -15 -14 -17
-0.454 -16 -15 -16 -16 -17
-0.440 -18 -17 -16 -19 -17
-0.508 -18 -19 -17 -20 -18
-0.518 -20 -18 -17 -22 -19
-0.552 -21 -20 -21 -25 -20
-0.571 -24 -22 -23 -26 -23
-0.620 -26 -25 -28 -28 -25

81
Table A-3 (Continued)
Voltage:V
Cyclic 1 Cyclic 2 Cyclic 3 Cyclic 4 Cyclic 5
Current:
µA
Current:
µA
Current:
µA
Current:
µA
Current:
µA
-0.615 -29 -29 -30 -31 -29
-0.625 -33 -31 -34 -35 -30
-0.649 -34 -33 -33 -37 -32
-0.669 -36 -34 -35 -39 -33
-0.703 -38 -37 -37 -39 -37
-0.728 -39 -39 -37 -39 -39
-0.776 -41 -41 -39 -40 -40
-0.772 -42 -41 -41 -41 -39
-0.796 -42 -40 -42 -42 -41
-0.815 -42 -40 -39 -42 -41
-0.835 -42 -40 -40 -41 -41
-0.850 -45 -41 -40 -40 -42
-0.908 -48 -40 -41 -44 -43
-0.933 -54 -42 -44 -46 -44
-0.977 -57 -47 -49 -52 -49
-0.991 -66 -53 -51 -56 -51
-1.006 -75 -56 -57 -65 -58
-1.021 -87 -64 -65 -75 -64
-1.060 -97 -75 -75 -85 -73
-1.099 -107 -85 -85 -94 -83
-1.123 -118 -95 -97 -106 -95
-1.157 -129 -105 -102 -115 -103
-1.182 -135 -117 -113 -123 -116
-1.216 -145 -121 -125 -134 -124
-1.260 -155 -134 -135 -139 -132

82
Table A-3 (Continued)
Voltage:V
Cyclic 1 Cyclic 2 Cyclic 3 Cyclic 4 Cyclic 5
Current:
µA
Current:
µA
Current:
µA
Current:
µA
Current:
µA
-1.299 -164 -142 -146 -150 -144
-1.255 -147 -154 -153 -159 -147
-1.216 -131 -164 -162 -142 -158
-1.162 -117 -145 -141 -125 -140
-1.128 -103 -129 -127 -113 -122
-1.113 -90 -115 -112 -98 -110
-1.079 -79 -101 -99 -86 -96
-1.074 -66 -89 -87 -77 -85
-1.040 -58 -77 -78 -67 -76
-1.006 -51 -68 -66 -57 -67
-0.996 -43 -57 -55 -48 -57
-0.957 -36 -47 -47 -40 -47
-0.913 -29 -41 -41 -34 -40
-0.889 -21 -34 -34 -28 -34
-0.864 -18 -29 -29 -23 -29
-0.845 -14 -22 -22 -17 -23
-0.811 -11 -18 -17 -13 -19
-0.796 -7 -13 -13 -9 -14
-0.776 -6 -8 -9 -6 -10
-0.747 -4 -6 -7 -5 -7
-0.732 -6 -4 -4 -3 -6
-0.689 -7 -2 -2 -2 -6
-0.742 -7 -1 -3 -2 -6
-0.640 -9 -2 -3 -4 -6
-0.635 -9 -3 -4 -7 -6
-0.606 -9 -3 -6 -8 -10

83
Table A-3 (Continued)
Voltage:V
Cyclic 1 Cyclic 2 Cyclic 3 Cyclic 4 Cyclic 5
Current:
µA
Current:
µA
Current:
µA
Current:
µA
Current:
µA
-0.591 -10 -5 -7 -8 -11
-0.571 -10 -7 -9 -9 -10
-0.542 -10 -7 -9 -10 -11
-0.518 -9 -9 -9 -9 -11
-0.508 -8 -8 -11 -11 -11
-0.493 -8 -9 -10 -10 -11
-0.469 -7 -8 -9 -8 -11
-0.435 -7 -7 -9 -8 -10
-0.444 -6 -5 -8 -6 -9
-0.396 -5 -6 -7 -5 -7
-0.386 -4 -4 -5 -4 -6
-0.366 -5 -3 -5 -4 -7
-0.347 -5 -4 -3 -4 -5
-0.327 -4 -4 -4 -4 -5
-0.317 -2 -3 -4 -3 -4
-0.293 -3 -2 -3 -3 -5
-0.337 -3 -4 -3 -3 -5
-0.254 -2 -3 -4 -4 -4
-0.244 -2 -3 -3 -3 -5
-0.234 -2 -1 -3 -2 -3
-0.205 -2 -3 -2 -2 -3
-0.205 -3 -2 -2 -2 -3
-0.181 -2 -2 -2 -3 -4
-0.156 -2 -1 -2 -2 -3
-0.205 -2 -1 -1 -2 -3
-0.137 0 -1 -1 0 -1
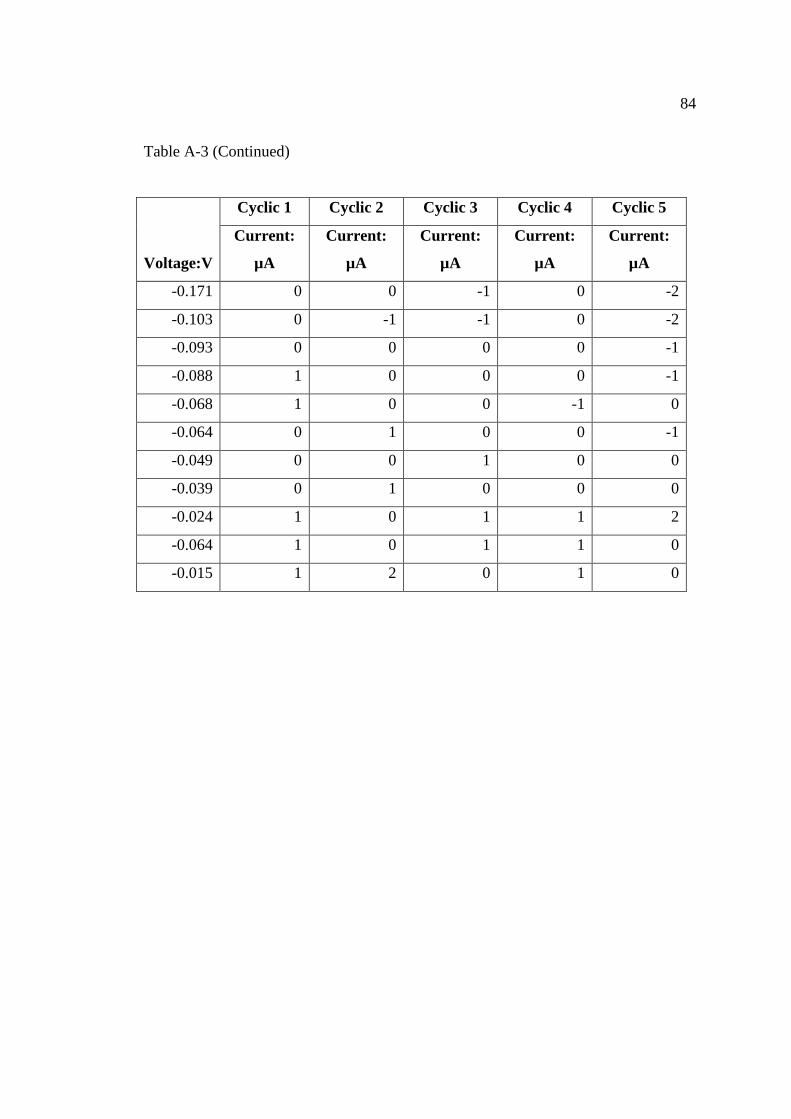
84
Table A-3 (Continued)
Voltage:V
Cyclic 1 Cyclic 2 Cyclic 3 Cyclic 4 Cyclic 5
Current:
µA
Current:
µA
Current:
µA
Current:
µA
Current:
µA
-0.171 0 0 -1 0 -2
-0.103 0 -1 -1 0 -2
-0.093 0 0 0 0 -1
-0.088 1 0 0 0 -1
-0.068 1 0 0 -1 0
-0.064 0 1 0 0 -1
-0.049 0 0 1 0 0
-0.039 0 1 0 0 0
-0.024 1 0 1 1 2
-0.064 1 0 1 1 0
-0.015 1 2 0 1 0

85
APPENDIX B
CIRCUIT

86
Figure B-1 Portable voltammetric device for detecting heavy metal contamination
circuit
(a)
Figure B-2 Variable digital voltage

87
(b)
Figure B-3 Negative voltage and OP-Amp inverting
(c)
Figure B-4 Switching pole circuit
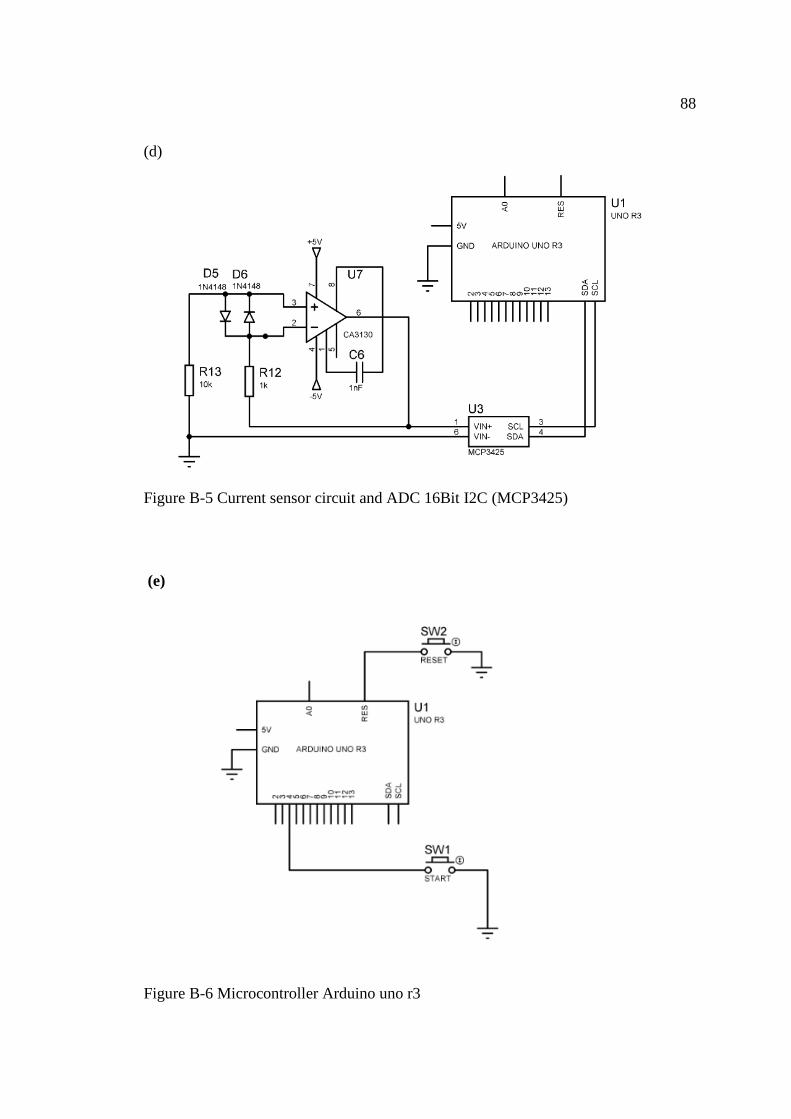
88
(d)
Figure B-5 Current sensor circuit and ADC 16Bit I2C (MCP3425)
(e)
Figure B-6 Microcontroller Arduino uno r3
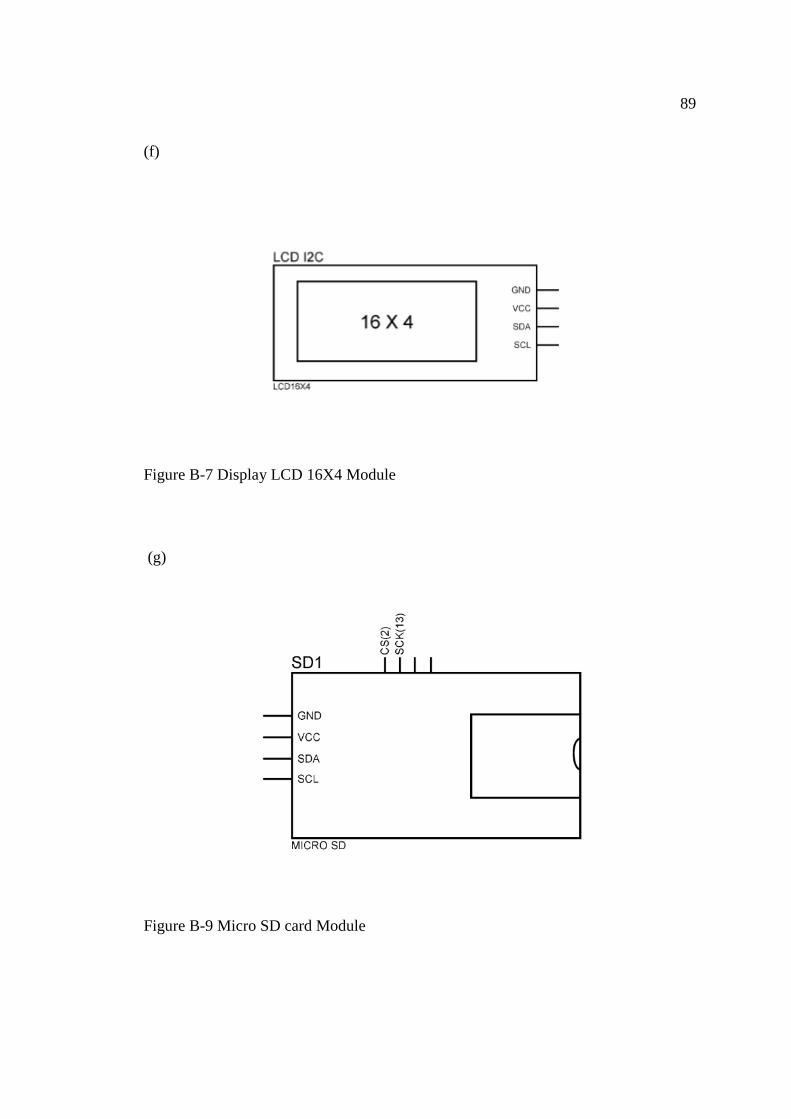
89
(f)
Figure B-7 Display LCD 16X4 Module
(g)
Figure B-9 Micro SD card Module

90
BIOGRAPHY
Name Mrs. Phakhamon Thipnet
Date of birth February 23, 1970
Pace of birth Khon Kaen, Thailand
Present address 22/18, Mabmayom Road, Bangsaen,
MuanChon buri, Chon buri, 20130,
Thailand
Education
1990-1994 Bachelor of Science (B.Sc.),
Faculty of Education,
Prince of Songkla University
Thailand
1995-1999 Master of Science (M.Sc.),
Faculty of Zoology,
Kasetsart University, Thailand
2010 2016 Doctor of Philosophy (Ph.D.),
Faculty of Science, Burapha University,
Chonburi, Thailand