Voltammetric and spectroscopic investigations of 4-nitrophenylferrocene interacting with DNA
6
Spectrochimica Acta Part A 75 (2010) 1082–1087 Contents lists available at ScienceDirect Spectrochimica Acta Part A: Molecular and Biomolecular Spectroscopy journal homepage: www.elsevier.com/locate/saa Voltammetric and spectroscopic investigations of 4-nitrophenylferrocene interacting with DNA Afzal Shah, Muhammad Zaheer, Rumana Qureshi ∗ , Zareen Akhter, Muhammad Faizan Nazar Department of Chemistry Quaid-i-Azam University, 45320 Islamabad, Pakistan article info Article history: Received 10 April 2009 Received in revised form 15 December 2009 Accepted 18 December 2009 Keywords: 4-Nitrophenylferrocene (NFC) DNA Binding constant Diffusion coefficient Binding site size Binding free energy abstract Cyclic voltammetry (CV) coupled with UV–vis and fluorescence spectroscopy were used to probe the interaction of potential anticancer drug, 4-nitrophenylferrocene (NFC) with DNA. The electrostatic inter- action of the positively charged NFC with the anionic phosphate of DNA was evidenced by the findings like negative formal potential shift in CV, ionic strength effect, smaller bathochromic shift in UV–vis spectroscopy, incomplete quenching in the emission spectra and decrease in viscosity. The diffusion coefficients of the free and DNA bound forms of the drug were evaluated from Randles–Sevcik equation. The binding parameters like binding constant, ratio of binding constants (K red /K ox ), binding site size and binding free energy were determined from voltammetric data. The binding constant was also determined from UV–vis and fluorescence spectroscopy with a value quite close to that obtained from CV. © 2009 Elsevier B.V. All rights reserved. 1. Introduction The clinical use of ‘cisplatin’ as antineoplastic agent and its nega- tive side effects stimulated the chemists to concentrate their efforts on the use of alternative transition metal based drugs as anti-tumor agents with positive, low or no side effects [1]. In their struggle for searching about such effective anticancer drugs, tremendous attention was paid to ferrocene and its derivatives in view of their potential applications in medical field [2,3]. It has been established that ferrocenes have appreciable antineoplastic activity [4–6] but the mechanism of their effectiveness in eliciting an anti-tumor effect is still to be explored [7]. The mode of interaction and binding extent of ferrocenes with DNA are matters of considerable interest due to the complexity of their sandwich like structures. Ferrocenes represent a hybrid area between organometallic chemistry and biochemistry. In these molecules, ferrocene moiety serves as spectroscopically active chromophore, biological marker and redox active site. They are the subject of intensive investi- gations due to their broad range properties such as variation in the substituents at the cyclopentadienyl rings, accessible poten- tial range, established antiproliferative effects, thermodynamic and kinetic characteristics [8,9]. Drug-DNA interactions have been studied by a variety of analyti- cal techniques such as luminescence [10], fluorescence [11], UV–vis ∗ Corresponding author. Tel.: +92 5190642142; fax: +92 512873869. E-mail address: r [email protected] (R. Qureshi). spectroscopy [12], and voltammetric methods [13–15]. Among these electrochemical methods are widely used in drug–DNA bind- ing studies due to their advantages like high sensitivity, efficient selectivity, cost affectivity, more reliability, extensive versatility and fast detection ability. The UV–vis spectroscopic technique is also best suited to ferrocenes owing to their intense colors. Spurred by the clinical use of anticancer ferrocifen [16], we synthesized 4- nitrophenylferrocene (Scheme 1), and studied its interaction with chicken blood DNA by electrochemical, spectroscopic and visco- metric techniques. Other factors behind the selection of this specific ferrocene derivative were its easy synthetic route, chemical stabil- ity and attractive electrochemistry. The aim of the present study is to provide useful insights in further understanding of the unre- solved mechanism of drug–DNA interactions. 2. Experimental 2.1. Materials 4-Nitrophenylferrocene (NFC) was synthesized according to the literature reported method [17]. Its 10 mM stock solution was pre- pared in 10% aqueous ethanol (10% H 2 O:90% ethanol). The system was buffered at pH 6 by phosphate buffer (0.1 M KH 2 PO 4 + 0.1 M NaOH) to avoid the decomposition of the ferrocenium state of the drug in a basic or even neutral solution [18] and protonation of the ferrocenyl group in strongly acidic conditions [19]. Tetrabutylam- monium perchlorate (TBAP) (Fluka, 99% purity) was further purified by recrystallization using methanol as a solvent. DNA was extracted 1386-1425/$ – see front matter © 2009 Elsevier B.V. All rights reserved. doi:10.1016/j.saa.2009.12.061
Transcript of Voltammetric and spectroscopic investigations of 4-nitrophenylferrocene interacting with DNA
Vi
AD
a
ARR1A
K4DBDBB
1
toafaptteed
csagttk
c
1d
Spectrochimica Acta Part A 75 (2010) 1082–1087
Contents lists available at ScienceDirect
Spectrochimica Acta Part A: Molecular andBiomolecular Spectroscopy
journa l homepage: www.e lsev ier .com/ locate /saa
oltammetric and spectroscopic investigations of 4-nitrophenylferrocenenteracting with DNA
fzal Shah, Muhammad Zaheer, Rumana Qureshi ∗, Zareen Akhter, Muhammad Faizan Nazarepartment of Chemistry Quaid-i-Azam University, 45320 Islamabad, Pakistan
r t i c l e i n f o
rticle history:eceived 10 April 2009eceived in revised form5 December 2009ccepted 18 December 2009
a b s t r a c t
Cyclic voltammetry (CV) coupled with UV–vis and fluorescence spectroscopy were used to probe theinteraction of potential anticancer drug, 4-nitrophenylferrocene (NFC) with DNA. The electrostatic inter-action of the positively charged NFC with the anionic phosphate of DNA was evidenced by the findingslike negative formal potential shift in CV, ionic strength effect, smaller bathochromic shift in UV–visspectroscopy, incomplete quenching in the emission spectra and decrease in viscosity. The diffusion
eywords:-Nitrophenylferrocene (NFC)NAinding constantiffusion coefficient
coefficients of the free and DNA bound forms of the drug were evaluated from Randles–Sevcik equation.The binding parameters like binding constant, ratio of binding constants (Kred/Kox), binding site size andbinding free energy were determined from voltammetric data. The binding constant was also determinedfrom UV–vis and fluorescence spectroscopy with a value quite close to that obtained from CV.
© 2009 Elsevier B.V. All rights reserved.
inding site sizeinding free energy. Introduction
The clinical use of ‘cisplatin’ as antineoplastic agent and its nega-ive side effects stimulated the chemists to concentrate their effortsn the use of alternative transition metal based drugs as anti-tumorgents with positive, low or no side effects [1]. In their struggleor searching about such effective anticancer drugs, tremendousttention was paid to ferrocene and its derivatives in view of theirotential applications in medical field [2,3]. It has been establishedhat ferrocenes have appreciable antineoplastic activity [4–6] buthe mechanism of their effectiveness in eliciting an anti-tumorffect is still to be explored [7]. The mode of interaction and bindingxtent of ferrocenes with DNA are matters of considerable interestue to the complexity of their sandwich like structures.
Ferrocenes represent a hybrid area between organometallichemistry and biochemistry. In these molecules, ferrocene moietyerves as spectroscopically active chromophore, biological markernd redox active site. They are the subject of intensive investi-ations due to their broad range properties such as variation inhe substituents at the cyclopentadienyl rings, accessible poten-
ial range, established antiproliferative effects, thermodynamic andinetic characteristics [8,9].Drug-DNA interactions have been studied by a variety of analyti-al techniques such as luminescence [10], fluorescence [11], UV–vis
∗ Corresponding author. Tel.: +92 5190642142; fax: +92 512873869.E-mail address: r [email protected] (R. Qureshi).
386-1425/$ – see front matter © 2009 Elsevier B.V. All rights reserved.oi:10.1016/j.saa.2009.12.061
spectroscopy [12], and voltammetric methods [13–15]. Amongthese electrochemical methods are widely used in drug–DNA bind-ing studies due to their advantages like high sensitivity, efficientselectivity, cost affectivity, more reliability, extensive versatilityand fast detection ability. The UV–vis spectroscopic technique isalso best suited to ferrocenes owing to their intense colors. Spurredby the clinical use of anticancer ferrocifen [16], we synthesized 4-nitrophenylferrocene (Scheme 1), and studied its interaction withchicken blood DNA by electrochemical, spectroscopic and visco-metric techniques. Other factors behind the selection of this specificferrocene derivative were its easy synthetic route, chemical stabil-ity and attractive electrochemistry. The aim of the present studyis to provide useful insights in further understanding of the unre-solved mechanism of drug–DNA interactions.
2. Experimental
2.1. Materials
4-Nitrophenylferrocene (NFC) was synthesized according to theliterature reported method [17]. Its 10 mM stock solution was pre-pared in 10% aqueous ethanol (10% H2O:90% ethanol). The systemwas buffered at pH 6 by phosphate buffer (0.1 M KH2PO4 + 0.1 M
NaOH) to avoid the decomposition of the ferrocenium state of thedrug in a basic or even neutral solution [18] and protonation of theferrocenyl group in strongly acidic conditions [19]. Tetrabutylam-monium perchlorate (TBAP) (Fluka, 99% purity) was further purifiedby recrystallization using methanol as a solvent. DNA was extracted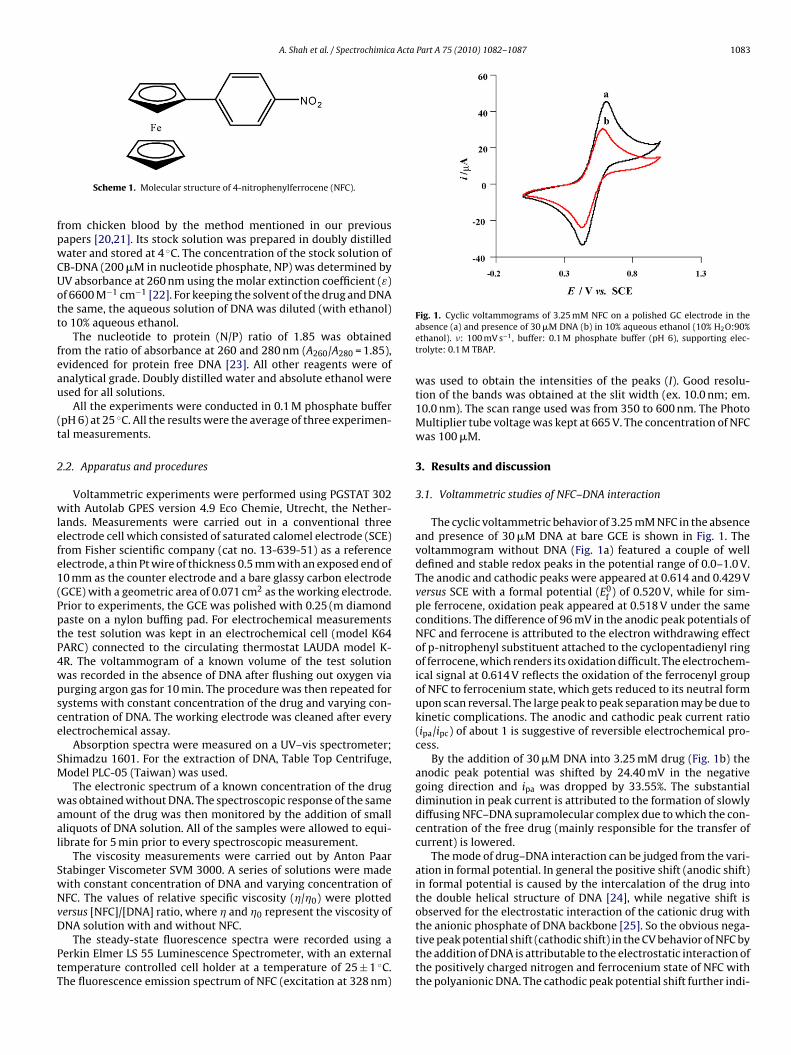
A. Shah et al. / Spectrochimica Acta Part A 75 (2010) 1082–1087 1083
fpwCUott
feau
(t
2
wlefe1(PptP4wpsce
SM
waal
SwNvD
PtT
the anionic phosphate of DNA backbone [25]. So the obvious nega-
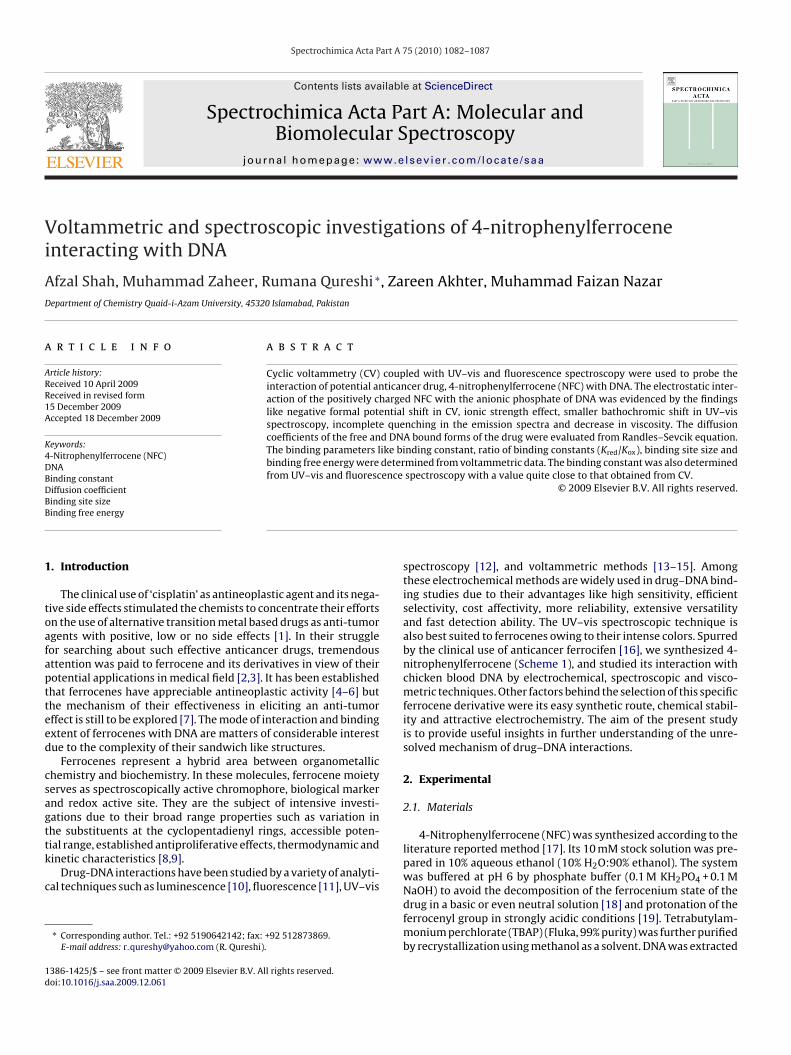
Scheme 1. Molecular structure of 4-nitrophenylferrocene (NFC).
rom chicken blood by the method mentioned in our previousapers [20,21]. Its stock solution was prepared in doubly distilledater and stored at 4 ◦C. The concentration of the stock solution ofB-DNA (200 �M in nucleotide phosphate, NP) was determined byV absorbance at 260 nm using the molar extinction coefficient (ε)f 6600 M−1 cm−1 [22]. For keeping the solvent of the drug and DNAhe same, the aqueous solution of DNA was diluted (with ethanol)o 10% aqueous ethanol.
The nucleotide to protein (N/P) ratio of 1.85 was obtainedrom the ratio of absorbance at 260 and 280 nm (A260/A280 = 1.85),videnced for protein free DNA [23]. All other reagents were ofnalytical grade. Doubly distilled water and absolute ethanol weresed for all solutions.
All the experiments were conducted in 0.1 M phosphate bufferpH 6) at 25 ◦C. All the results were the average of three experimen-al measurements.
.2. Apparatus and procedures
Voltammetric experiments were performed using PGSTAT 302ith Autolab GPES version 4.9 Eco Chemie, Utrecht, the Nether-
ands. Measurements were carried out in a conventional threelectrode cell which consisted of saturated calomel electrode (SCE)rom Fisher scientific company (cat no. 13-639-51) as a referencelectrode, a thin Pt wire of thickness 0.5 mm with an exposed end of0 mm as the counter electrode and a bare glassy carbon electrodeGCE) with a geometric area of 0.071 cm2 as the working electrode.rior to experiments, the GCE was polished with 0.25 (m diamondaste on a nylon buffing pad. For electrochemical measurementshe test solution was kept in an electrochemical cell (model K64ARC) connected to the circulating thermostat LAUDA model K-R. The voltammogram of a known volume of the test solutionas recorded in the absence of DNA after flushing out oxygen viaurging argon gas for 10 min. The procedure was then repeated forystems with constant concentration of the drug and varying con-entration of DNA. The working electrode was cleaned after everylectrochemical assay.
Absorption spectra were measured on a UV–vis spectrometer;himadzu 1601. For the extraction of DNA, Table Top Centrifuge,odel PLC-05 (Taiwan) was used.The electronic spectrum of a known concentration of the drug
as obtained without DNA. The spectroscopic response of the samemount of the drug was then monitored by the addition of smallliquots of DNA solution. All of the samples were allowed to equi-ibrate for 5 min prior to every spectroscopic measurement.
The viscosity measurements were carried out by Anton Paartabinger Viscometer SVM 3000. A series of solutions were madeith constant concentration of DNA and varying concentration ofFC. The values of relative specific viscosity (�/�0) were plottedersus [NFC]/[DNA] ratio, where � and �0 represent the viscosity ofNA solution with and without NFC.
The steady-state fluorescence spectra were recorded using aerkin Elmer LS 55 Luminescence Spectrometer, with an externalemperature controlled cell holder at a temperature of 25 ± 1 ◦C.he fluorescence emission spectrum of NFC (excitation at 328 nm)
Fig. 1. Cyclic voltammograms of 3.25 mM NFC on a polished GC electrode in theabsence (a) and presence of 30 �M DNA (b) in 10% aqueous ethanol (10% H2O:90%ethanol). �: 100 mV s−1, buffer: 0.1 M phosphate buffer (pH 6), supporting elec-trolyte: 0.1 M TBAP.
was used to obtain the intensities of the peaks (I). Good resolu-tion of the bands was obtained at the slit width (ex. 10.0 nm; em.10.0 nm). The scan range used was from 350 to 600 nm. The PhotoMultiplier tube voltage was kept at 665 V. The concentration of NFCwas 100 �M.
3. Results and discussion
3.1. Voltammetric studies of NFC–DNA interaction
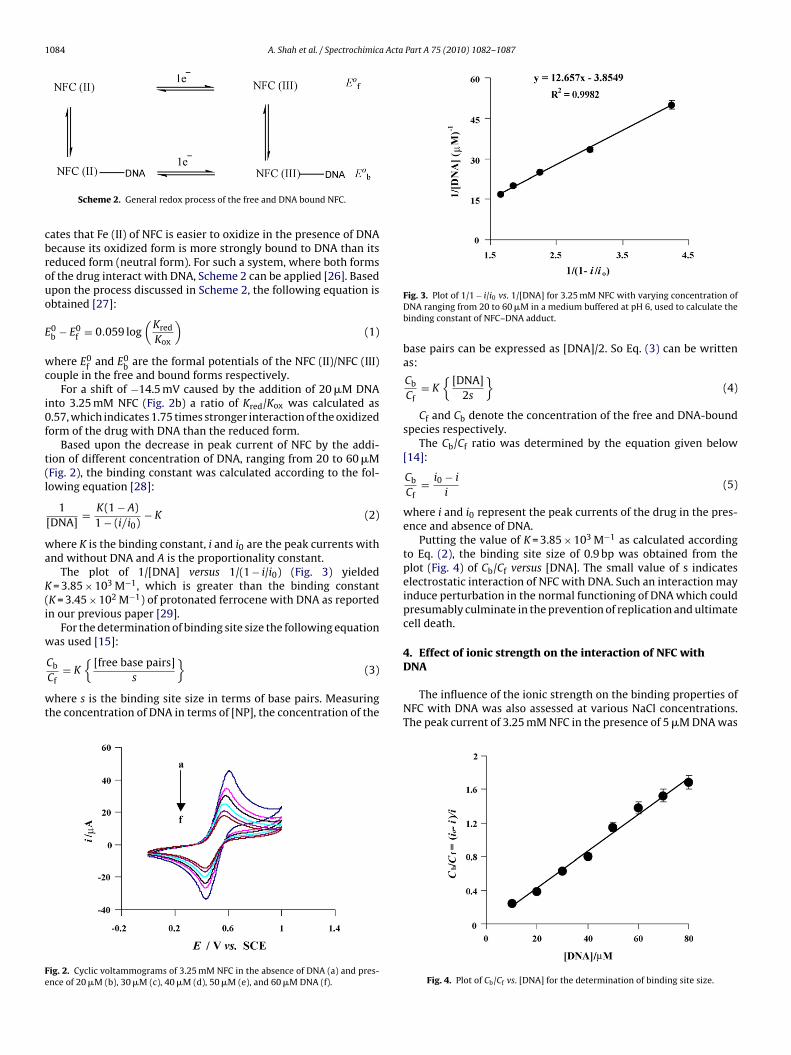
The cyclic voltammetric behavior of 3.25 mM NFC in the absenceand presence of 30 �M DNA at bare GCE is shown in Fig. 1. Thevoltammogram without DNA (Fig. 1a) featured a couple of welldefined and stable redox peaks in the potential range of 0.0–1.0 V.The anodic and cathodic peaks were appeared at 0.614 and 0.429 Vversus SCE with a formal potential (E0
f ) of 0.520 V, while for sim-ple ferrocene, oxidation peak appeared at 0.518 V under the sameconditions. The difference of 96 mV in the anodic peak potentials ofNFC and ferrocene is attributed to the electron withdrawing effectof p-nitrophenyl substituent attached to the cyclopentadienyl ringof ferrocene, which renders its oxidation difficult. The electrochem-ical signal at 0.614 V reflects the oxidation of the ferrocenyl groupof NFC to ferrocenium state, which gets reduced to its neutral formupon scan reversal. The large peak to peak separation may be due tokinetic complications. The anodic and cathodic peak current ratio(ipa/ipc) of about 1 is suggestive of reversible electrochemical pro-cess.
By the addition of 30 �M DNA into 3.25 mM drug (Fig. 1b) theanodic peak potential was shifted by 24.40 mV in the negativegoing direction and ipa was dropped by 33.55%. The substantialdiminution in peak current is attributed to the formation of slowlydiffusing NFC–DNA supramolecular complex due to which the con-centration of the free drug (mainly responsible for the transfer ofcurrent) is lowered.
The mode of drug–DNA interaction can be judged from the vari-ation in formal potential. In general the positive shift (anodic shift)in formal potential is caused by the intercalation of the drug intothe double helical structure of DNA [24], while negative shift isobserved for the electrostatic interaction of the cationic drug with
tive peak potential shift (cathodic shift) in the CV behavior of NFC bythe addition of DNA is attributable to the electrostatic interaction ofthe positively charged nitrogen and ferrocenium state of NFC withthe polyanionic DNA. The cathodic peak potential shift further indi-
1084 A. Shah et al. / Spectrochimica Acta Part A 75 (2010) 1082–1087
cbrouo
E
wc
i0f
t(l
wa
K(i
w
wt
Fe
Scheme 2. General redox process of the free and DNA bound NFC.
ates that Fe (II) of NFC is easier to oxidize in the presence of DNAecause its oxidized form is more strongly bound to DNA than itseduced form (neutral form). For such a system, where both formsf the drug interact with DNA, Scheme 2 can be applied [26]. Basedpon the process discussed in Scheme 2, the following equation isbtained [27]:
0b − E0
f = 0.059 log(
Kred
Kox
)(1)
here E0f and E0
b are the formal potentials of the NFC (II)/NFC (III)ouple in the free and bound forms respectively.
For a shift of −14.5 mV caused by the addition of 20 �M DNAnto 3.25 mM NFC (Fig. 2b) a ratio of Kred/Kox was calculated as.57, which indicates 1.75 times stronger interaction of the oxidizedorm of the drug with DNA than the reduced form.
Based upon the decrease in peak current of NFC by the addi-ion of different concentration of DNA, ranging from 20 to 60 �MFig. 2), the binding constant was calculated according to the fol-owing equation [28]:
1[DNA]
= K(1 − A)1 − (i/i0)
− K (2)
here K is the binding constant, i and i0 are the peak currents withnd without DNA and A is the proportionality constant.
The plot of 1/[DNA] versus 1/(1 − i/i0) (Fig. 3) yielded= 3.85 × 10³ M−1, which is greater than the binding constant
K = 3.45 × 10² M−1) of protonated ferrocene with DNA as reportedn our previous paper [29].
For the determination of binding site size the following equationas used [15]:
{ }
CbCf= K
[free base pairs]s
(3)
here s is the binding site size in terms of base pairs. Measuringhe concentration of DNA in terms of [NP], the concentration of the
ig. 2. Cyclic voltammograms of 3.25 mM NFC in the absence of DNA (a) and pres-nce of 20 �M (b), 30 �M (c), 40 �M (d), 50 �M (e), and 60 �M DNA (f).
Fig. 3. Plot of 1/1 − i/i0 vs. 1/[DNA] for 3.25 mM NFC with varying concentration ofDNA ranging from 20 to 60 �M in a medium buffered at pH 6, used to calculate thebinding constant of NFC–DNA adduct.
base pairs can be expressed as [DNA]/2. So Eq. (3) can be writtenas:
Cb
Cf= K
{[DNA]
2s
}(4)
Cf and Cb denote the concentration of the free and DNA-boundspecies respectively.
The Cb/Cf ratio was determined by the equation given below[14]:
Cb
Cf= i0 − i
i(5)
where i and i0 represent the peak currents of the drug in the pres-ence and absence of DNA.
Putting the value of K = 3.85 × 10³ M−1 as calculated accordingto Eq. (2), the binding site size of 0.9 bp was obtained from theplot (Fig. 4) of Cb/Cf versus [DNA]. The small value of s indicateselectrostatic interaction of NFC with DNA. Such an interaction mayinduce perturbation in the normal functioning of DNA which couldpresumably culminate in the prevention of replication and ultimatecell death.
4. Effect of ionic strength on the interaction of NFC with
DNAThe influence of the ionic strength on the binding properties ofNFC with DNA was also assessed at various NaCl concentrations.The peak current of 3.25 mM NFC in the presence of 5 �M DNA was
Fig. 4. Plot of Cb/Cf vs. [DNA] for the determination of binding site size.

A. Shah et al. / Spectrochimica Acta Part A 75 (2010) 1082–1087 1085
FiN
goitiptIcawtt
pu
i
w(s(
NtTa
F5c
ig. 5. Effect of ionic strength on NFC–DNA interaction, indicated by the decreasen ipa of 3.25 mM NFC containing 5 �M DNA with the increase in concentration ofaCl.
radually decreased with the increasing concentration (0–30 mM)f NaCl (Fig. 5). This behavior signifies the electrostatically drivennteraction of NFC with DNA as the ionic environment can affecthe electrochemical interactions by ionic screening effect. At lowonic strength, where the ions are less effectively shielded, largereak currents are expected. At high ionic strength, due to the effec-ive ionic shielding, the peak currents are expected to diminish.n the electrostatic mode of interaction, where the drug remains inontact with the medium, the effect of the ionic strength is conceiv-ble. While, in the intercalative mode of binding (in-binding mode),here the drug goes away from the solvent and inserts itself into
he base pair pockets, the ionic strength of the medium is less likelyo affect the voltammetric current signals.
To further ascertain the interaction of NFC with DNA, ipa waslotted versus �1/2 (Fig. 6) before and after the addition of DNA,sing Randles–Sevcik expression [30]:
= 2.69 × 10⁵n3/2AC∗0D1/2�1/2 (6)
here i is the peak current (A), A is the surface area of the electrodecm2), C∗
0 is the bulk concentration (mol cm−3) of the electroactivepecies, D is the diffusion coefficient (cm2 s−1) and � is the scan rateV s−1).
The linear dependence of the peak currents of both NFC and
FC–DNA on the square root of the scan rate suggests thathe redox process is kinetically controlled by the diffusion step.he diffusion coefficients of the free (Df = 1.03 × 10⁻⁵ cm2 s−1)nd DNA bound drug (Db = 7.51 × 10⁻⁶ cm2 s−1) were determined
ig. 6. i vs. �1/2 plots of 3.25 mM NFC in the absence of DNA (a) and presence of0 �M DNA (b) at scan rates ranging from 10 to 100 mV s−1 under the experimentalonditions of Fig. 1.
Fig. 7. UV–vis absorption spectra of 30 �M NFC in the absence of DNA (a) andpresence of 10–60 �M DNA (b–g) in 10% aqueous ethanol buffered at pH 6.
from the slopes of Randles–Sevcik plots. The lower diffusioncoefficient (Df = 1.03 × 10⁻⁵ cm2 s−1) of the free NFC than the Df(1.88 × 10⁻⁵ cm2 s−1) of ferrocene [31] is attributed to its compar-atively high molecular weight. Furthermore, the smaller ipa versus�1/2 slope of NFC in the presence of DNA as compared to free NFC issuggestive NFC–DNA adduct formation. The reason for the decreasein the apparent diffusion coefficient of NFC in the presence of DNAis the obviously large molecular weight of the adduct.
4.1. UV–vis absorption studies
The interaction of NFC with DNA was also studied by UV–visabsorption titration for getting further clues about the mode ofinteraction and binding strength. The effect of different concen-tration of DNA (10–60 �M) on the electronic absorption spectrumof 30 �M NFC is shown in Fig. 7. The rationale behind the band inthe UV region (328 nm) is the probable charge transfer betweenthe non-bonding or antibonding orbital of the cyclopentadienylring and the iron atom of NFC. The maximum absorption of thedrug at this wavelength exhibited slight bathochromic and pro-nounce hypochromic shifts by the incremental addition of DNA. Thebathochromic effect is associated with the decrease in the energygap between the highest (HUMO) and the lowest molecular orbitals(LUMO) after the interaction of NFC to DNA. The compactness in thestructure of either the drug alone and/or DNA after the formation ofdrug-DNA complex may result in hypochromism. Hypochromismdue to DNA contraction has also been reported by Li et al. [32].
Based upon the decrease in absorbance, the binding constantwas calculated according to the following equation (7) [33]:
A0
A − A0= εG
εH–G − εG+ εG
εH–G − εG.
1K [DNA]
(7)
where K is the binding constant, A0 and A are absorbance of thefree drug and the apparent one, εG and εH–G are their absorptioncoefficients respectively.
The slope to intercept ratio of the plot between A0/(A − A0) ver-sus 1/[DNA] yielded the binding constant, K = 2.02 × 10³ M−1, whichis close to the value of K (3.85 × 10³ M−1) obtained from CV. The
moderate binding constant is indicative of electrostatic interac-tion. The Gibbs energy change (�G = − RT ln K) of approximately−20.45 kJ/mol at 25 ◦C signifies the spontaneity of NFC–DNA inter-action.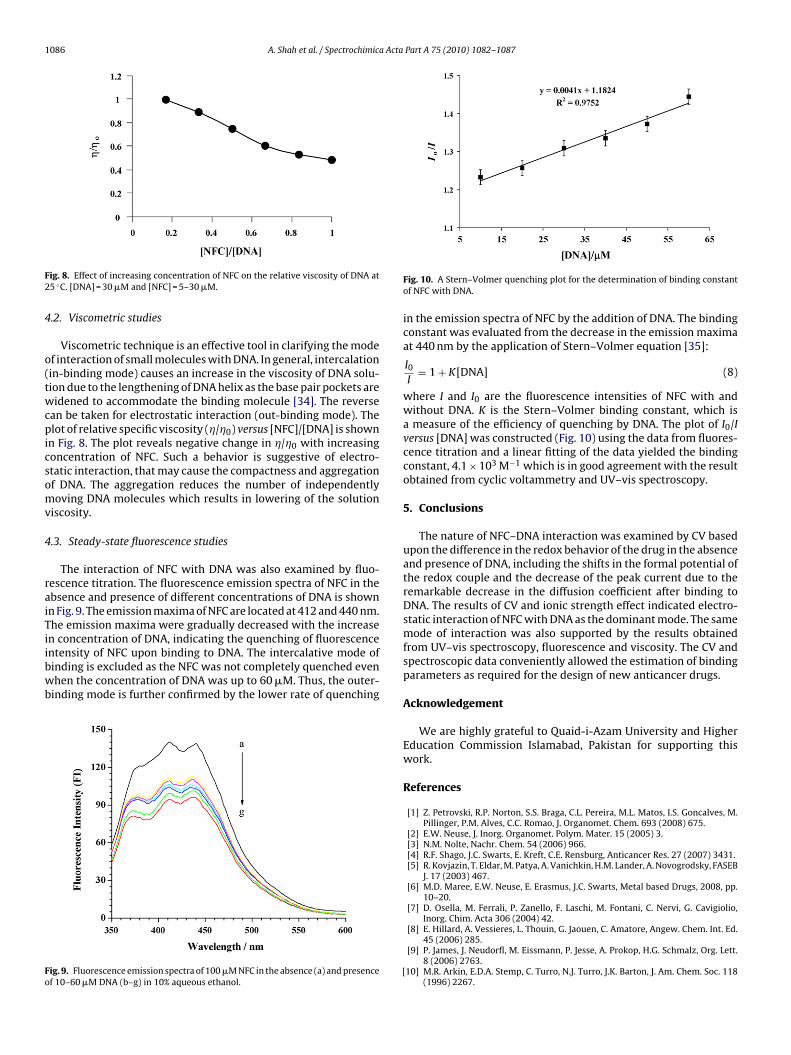
1086 A. Shah et al. / Spectrochimica Acta Part A 75 (2010) 1082–1087
F2
4
o(twcpicsomv
4
raiTiibwb
Fo
ig. 8. Effect of increasing concentration of NFC on the relative viscosity of DNA at5 ◦C. [DNA] = 30 �M and [NFC] = 5–30 �M.
.2. Viscometric studies
Viscometric technique is an effective tool in clarifying the modef interaction of small molecules with DNA. In general, intercalationin-binding mode) causes an increase in the viscosity of DNA solu-ion due to the lengthening of DNA helix as the base pair pockets areidened to accommodate the binding molecule [34]. The reverse
an be taken for electrostatic interaction (out-binding mode). Thelot of relative specific viscosity (�/�0) versus [NFC]/[DNA] is shown
n Fig. 8. The plot reveals negative change in �/�0 with increasingoncentration of NFC. Such a behavior is suggestive of electro-tatic interaction, that may cause the compactness and aggregationf DNA. The aggregation reduces the number of independentlyoving DNA molecules which results in lowering of the solution
iscosity.
.3. Steady-state fluorescence studies
The interaction of NFC with DNA was also examined by fluo-escence titration. The fluorescence emission spectra of NFC in thebsence and presence of different concentrations of DNA is shownn Fig. 9. The emission maxima of NFC are located at 412 and 440 nm.he emission maxima were gradually decreased with the increase
n concentration of DNA, indicating the quenching of fluorescencentensity of NFC upon binding to DNA. The intercalative mode ofinding is excluded as the NFC was not completely quenched evenhen the concentration of DNA was up to 60 �M. Thus, the outer-inding mode is further confirmed by the lower rate of quenching
ig. 9. Fluorescence emission spectra of 100 �M NFC in the absence (a) and presencef 10–60 �M DNA (b–g) in 10% aqueous ethanol.
[
Fig. 10. A Stern–Volmer quenching plot for the determination of binding constantof NFC with DNA.
in the emission spectra of NFC by the addition of DNA. The bindingconstant was evaluated from the decrease in the emission maximaat 440 nm by the application of Stern–Volmer equation [35]:
I0I
= 1 + K[DNA] (8)
where I and I0 are the fluorescence intensities of NFC with andwithout DNA. K is the Stern–Volmer binding constant, which isa measure of the efficiency of quenching by DNA. The plot of I0/Iversus [DNA] was constructed (Fig. 10) using the data from fluores-cence titration and a linear fitting of the data yielded the bindingconstant, 4.1 × 10³ M−1 which is in good agreement with the resultobtained from cyclic voltammetry and UV–vis spectroscopy.
5. Conclusions
The nature of NFC–DNA interaction was examined by CV basedupon the difference in the redox behavior of the drug in the absenceand presence of DNA, including the shifts in the formal potential ofthe redox couple and the decrease of the peak current due to theremarkable decrease in the diffusion coefficient after binding toDNA. The results of CV and ionic strength effect indicated electro-static interaction of NFC with DNA as the dominant mode. The samemode of interaction was also supported by the results obtainedfrom UV–vis spectroscopy, fluorescence and viscosity. The CV andspectroscopic data conveniently allowed the estimation of bindingparameters as required for the design of new anticancer drugs.
Acknowledgement
We are highly grateful to Quaid-i-Azam University and HigherEducation Commission Islamabad, Pakistan for supporting thiswork.
References
[1] Z. Petrovski, R.P. Norton, S.S. Braga, C.L. Pereira, M.L. Matos, I.S. Goncalves, M.Pillinger, P.M. Alves, C.C. Romao, J. Organomet. Chem. 693 (2008) 675.
[2] E.W. Neuse, J. Inorg. Organomet. Polym. Mater. 15 (2005) 3.[3] N.M. Nolte, Nachr. Chem. 54 (2006) 966.[4] R.F. Shago, J.C. Swarts, E. Kreft, C.E. Rensburg, Anticancer Res. 27 (2007) 3431.[5] R. Kovjazin, T. Eldar, M. Patya, A. Vanichkin, H.M. Lander, A. Novogrodsky, FASEB
J. 17 (2003) 467.[6] M.D. Maree, E.W. Neuse, E. Erasmus, J.C. Swarts, Metal based Drugs, 2008, pp.
10–20.[7] D. Osella, M. Ferrali, P. Zanello, F. Laschi, M. Fontani, C. Nervi, G. Cavigiolio,
Inorg. Chim. Acta 306 (2004) 42.
[8] E. Hillard, A. Vessieres, L. Thouin, G. Jaouen, C. Amatore, Angew. Chem. Int. Ed.45 (2006) 285.[9] P. James, J. Neudorfl, M. Eissmann, P. Jesse, A. Prokop, H.G. Schmalz, Org. Lett.
8 (2006) 2763.10] M.R. Arkin, E.D.A. Stemp, C. Turro, N.J. Turro, J.K. Barton, J. Am. Chem. Soc. 118
(1996) 2267.

Acta
[[[[[[[[[
[
[
[
[[[[
[[[[
A. Shah et al. / Spectrochimica
11] W. Zhong, J.H. Yu, Y. Liang, Spectrochim. Acta Part A 59 (2003) 1281.12] J. Lah, M. Bezan, G. Vesnaver, Acta Chim. Slov. 48 (2001) 289.13] M. Aslanoglu, N. Oge, Chem. Anal. (Warsaw) 49 (2004) 509.14] M. Aslanoglu, G. Ayne, Anal. Bioanal. Chem. 380 (2004) 658.15] M. Aslanoglu, N. Oge, Turk. J. Chem. 29 (2005) 477.16] P.C.A. Bruijnicnx, P.J. Sadler, Curr. Opin. Chem. Biol. 12 (2008) 197.17] P. Hu, K.Q. Zhao, H.B. Xu, Molecules 6 (2001) M249.18] C.S. Lu, X.M. Ren, C.J. Hu, H.Z. Zhu, Q.J. Meng, Chem. Pharm. Bull. 49 (2001) 818.19] J. Anthony, Pearson, Metallo-Organic Chemistry, John Wiley & Sons, 1985, pp.
313–315.
20] A. Shah, A.M. Khan, R. Qureshi, F.L. Ansari, M.F. Nazar, S.S. Shah, Int. J. Mol. Sci.9 (2008) 1424.21] Z. Rehman, A. Shah, N. Muhammad, S. Ali, R. Qureshi, I.S. Butler, J. Organomet.
Chem 694 (2009) 1998.22] M.E. Reichmann, S.A. Rice, C.A. Thomas, P. Doty, J. Am. Chem. Soc. 76 (1954)
3047.
[[[[[
Part A 75 (2010) 1082–1087 1087
23] S.S. Babkina, N.A. Ulakhovich, Anal. Chem. 77 (2005) 5678.24] M. Aslanoglu, Anal. Sci. 22 (2006) 439.25] N. Li, Y. Ma, C. Yang, L. Guo, X. Yan, Biophys. Chem. 116 (2005) 199.26] X. Chu, G.L. Shen, J.H. Jian, T.F. Kang, B. Xiong, R.Q. Yu, Anal. Chim. Acta 373
(1998) 29.27] M.T. Carter, M. Rodriguez, A.J. Bard, J. Am. Chem. Soc. 111 (1989) 8901.28] G.C. Zhao, J.J. Zhu, J.J. Zhang, H.Y. Chen, Anal. Chim. Acta 394 (1999) 337.29] A. Shah, R. Qureshi, N.K. Janjua, S. Haque, S. Ahmad, Anal. Sci. 24 (2008) 1437.30] C.M.A. Brett, A.M.O. Brett, Electrochemistry: Principles, Methods and Applica-
tions, Oxford Science University Publications, Oxford, 1993.
31] R. Feeney, S.P. Kounaves, Electrochem. Commun. 1 (1999) 453.32] Q.S. Li, H.F. Wang, M.L. Guo, J. Inorg. Biochem. 64 (1996) 181.33] M.Y. Ni, Y. Wang, H.L. Li, Pol. J. Chem. 71 (1997) 816.34] J.M. Veal, R.L. Rill, Biochemistry 30 (1991) 1132.35] A.M. Pyle, J.P. Rehmann, R. Meshoyrer, C.V. Kumar, N.J. Turro, J.K. Barton, J. Am.Chem. Soc. 111 (1989) 3051.