Sources of n-alkanes in an urbanized estuary: Insights from molecular distributions and...
12
This article appeared in a journal published by Elsevier. The attached copy is furnished to the author for internal non-commercial research and education use, including for instruction at the authors institution and sharing with colleagues. Other uses, including reproduction and distribution, or selling or licensing copies, or posting to personal, institutional or third party websites are prohibited. In most cases authors are permitted to post their version of the article (e.g. in Word or Tex form) to their personal website or institutional repository. Authors requiring further information regarding Elsevier’s archiving and manuscript policies are encouraged to visit: http://www.elsevier.com/copyright
Transcript of Sources of n-alkanes in an urbanized estuary: Insights from molecular distributions and...
This article appeared in a journal published by Elsevier. The attachedcopy is furnished to the author for internal non-commercial researchand education use, including for instruction at the authors institution
and sharing with colleagues.
Other uses, including reproduction and distribution, or selling orlicensing copies, or posting to personal, institutional or third party
websites are prohibited.
In most cases authors are permitted to post their version of thearticle (e.g. in Word or Tex form) to their personal website orinstitutional repository. Authors requiring further information
regarding Elsevier’s archiving and manuscript policies areencouraged to visit:
http://www.elsevier.com/copyright
Author's personal copy
Sources of n-alkanes in an urbanized estuary: Insights from molecular distributionsand compound-specific stable and radiocarbon isotopes
Jason M.E. Ahad a,⁎, Raja S. Ganeshram b, Charlotte L. Bryant c, Luz M. Cisneros-Dozal c, Philippa L. Ascough d,Anthony E. Fallick d, Greg F. Slater e
a Geological Survey of Canada, Natural Resources Canada, 490 rue de la Couronne, Québec, QC, G1K 9A9, Canadab School of GeoSciences, University of Edinburgh, Edinburgh, EH9 3JW, UKc NERC Radiocarbon Facility (Environment), East Kilbride, G75 0QF, UKd Scottish Universities Environmental Research Centre (SUERC), East Kilbride, G75 0QF, UKe School of Geography and Earth Sciences, McMaster University, Hamilton, ON, L8S 4K1, Canada
a b s t r a c ta r t i c l e i n f o
Article history:Received 31 January 2011Received in revised form 23 May 2011Accepted 3 June 2011Available online 12 June 2011
Keywords:RadiocarbonIsotopesCompound-specificn-alkanesHydrocarbonsOrganic matterBiomarkerEstuary
Diagnostic molecular ratios and compound-specific 13C and 14C analyses were used to identify n-alkanesources in surface sediments collected along a transect from an urbanized estuary draining a peat-richcatchment (Tyne, UK). The most abundant homologues were generally C29 or C31, and the carbon preferenceindex (CPI; 1.8 to 6.4) and average chain length (ACL; 28.5 to 29.5) of C25–C33 n-alkanes became progressivelylower in samples closer to the mouth of estuary. δ13C signatures of C19–C31 n-alkanes ranged from −37.1to−29.3‰ and in general became more depleted with increasing carbon number. Δ14C values for C21 (−945to −738‰) were significantly more depleted compared to C29 (−591 to −65‰) and C31 (−382 to −96‰),pointing to a much higher component of fossil (i.e., 14C-free) carbon in the shorter homologue. Theradiocarbon contents for these three n-alkanes decreased toward the North Sea, which in conjunction with anup to 4‰ seaward 13C-enrichment in C29 and C31 and seaward decreases in CPI and ACL pointed to petrogenichydrocarbon contamination in lower estuarine sediments. Independent 13C and 14C mass balances used tocalculate the relative proportions of modern (i.e., plant wax) and fossil (i.e., petrogenic) n-alkanes yieldedsimilar results and demonstrated that mixing with marine-derived organic matter (OM) or microbialdegradation during estuarine transport led to a seaward decline in modern, longer-chain homologues,resulting in an increasingly larger fossil carbon contribution toward themouth of estuary. The ability to clearlydistinguish anthropogenic from natural inputs suggests that compound-specific radiocarbon analysis cansuccessfully delineate the age of terrigenous OM delivered to the coastal zone even near historically pollutedsystems such as the Tyne.
Crown Copyright © 2011 Published by Elsevier B.V. All rights reserved.
1. Introduction
Straight chain, normal alkanes (n-alkanes) are relatively recalci-trant ubiquitous compounds found in freshwater, estuarine andmarine sediments that are routinely used to identify hydrocarbonprovenance. n-Alkanes derived from epicuticular leaf waxes –
typically the most abundant source in sediments – are dominatedby long, odd-numbered alkanes within the C24–C35 range (Bray andEvans, 1961; Eglinton and Eglinton, 2008), whereas, n-alkanes inthermally mature petrogenic sources (e.g., crude oil, high rank coal,thermally mature shale) generally show a destruction of the odd-carbon number preference with dominance in the C15–C25 range(Amijaya et al., 2006; Eseme et al., 2006; Harb et al., 2003; Petersenet al., 2007). These variations in homologue distributions are often
expressed using the carbon preference index (CPI), which is the ratioof the sums of odd- over even-numbered n-alkanes, usually calculatedwithin the C24–C35 range (i.e., Schefuβ et al., 2003). Terrestrial plantwaxes generally have high (N3) CPI values (Bi et al., 2005; Bray andEvans, 1961; Chikaraishi and Naraoka, 2003; Eglinton and Hamilton,1963; van Dongen et al., 2008a), whereas n-alkanes in fossil fuels haveCPI values close to 1.0 (Eseme et al., 2006; Farrington and Tripp, 1977;Harb et al., 2003; Jeng and Kao, 2002; Nishimura and Baker, 1986;Petersen et al., 2007). Shorter-chain n-alkane distributions (i.e., C15–C25) and lower CPI values may also reflect contributions frommacrophytes, algae and bacteria (Das et al., 2009; Ficken et al.,2000; Han and Calvin, 1969). Another parameter that can be usedto delineate n-alkanes sources is the average chain length (ACL),which describes the average number of carbon atoms per moleculebased on the abundance of the odd-numbered higher plant-derivedalkanes (Boot et al., 2006; Jeng, 2006; Poynter and Eglinton, 1990).Comparatively lower ACL values have been attributed to a greatercomponent of petroleum-derived n-alkanes in coastal marine versus
Marine Chemistry 126 (2011) 239–249
⁎ Corresponding author. Tel.: +1 418 654 3721; fax: +1 418 654 2615.E-mail address: [email protected] (J.M.E. Ahad).
0304-4203/$ – see front matter. Crown Copyright © 2011 Published by Elsevier B.V. All rights reserved.doi:10.1016/j.marchem.2011.06.002
Contents lists available at ScienceDirect
Marine Chemistry
j ourna l homepage: www.e lsev ie r.com/ locate /marchem
Author's personal copy
non-contaminated riverine sediments (Jeng, 2006). Though CPI, ACLand other concentration-based diagnostic parameters are routinelyapplied in hydrocarbon source apportionment studies, their useful-ness can be limited by n-alkane distributions that are not clearlysource-specific. Additional diagnostic tools may be required in orderto improve source discrimination in complex environmental samples.
Compound-specific carbon isotope analysis of n-alkanes providesan additional means to examine the origins of hydrocarbons in aquaticsediments. As a result of differences in the extent of isotopic frac-tionation during photosynthesis, δ13C signatures for C3 plants aresignificantly more depleted (~10 to 20‰) than those for C4 plants(Deines, 1980). While fractionation during biosynthesis leads to a13C-depletion of between ~0 and 10‰ in n-alkanes compared to bulkplant δ13C values, recent biodegradation and weathering does notsignificantly alter the δ13C signature of higher molecular weight(≥C19) alkanes (Li et al., 2009; Sun et al., 2005); therefore, the isotopicdifferences associated with initial carbon source and photosyntheticpathway are preserved in the δ13C signatures of the various alkanehomologues (Canuel et al., 1997; Chikaraishi and Naraoka, 2003;Ficken et al., 2000). Providing there are discrete isotopic fingerprintsassociated with different geological provenances (e.g., marine versusterrestrial), δ13C values for n-alkanes may also be used to delineatethe origins of thermally mature organic matter (OM) (Li and Xiong,2009; Odden et al., 2002; Sun et al., 2000; Xiong and Geng, 2000). Inconjunction with a slight 13C-enrichment in certain fractions of OMof around 1 to 2‰ during diagenesis (Galimov, 2006), differentia-tion between modern plant wax- and fossil fuel derived n-alkanes insoils and sediments may thus be possible (Ishiwatari et al., 1994;Jovancicevic et al., 1997; Lichtfouse and Eglinton, 1995; Rogers andSavard, 1999). However, as the potential variation in δ13C is oftensmall, in many situations n-alkane source discrimination based on 13Calone may not be possible.
Compound-specific radiocarbon analysis (CSRA) provides a rela-tively new investigative technique to evaluate n-alkane sources inaquatic sediments. This technique exploits the fact that petroleum,coal and other types of sedimentary fossil carbon are millions of yearsold and therefore contains undetectable levels of 14C (otherwisereferred to as “14C-dead”) compared to more recently biosynthesisedplant waxes. CSRA of long-chain n-alkanes in paleoclimatologicalstudies have demonstrated significant offsets between the ages ofmarine- and terrestrially-derived compounds in Holocene sediments(Eglinton et al., 1997; Smittenberg et al., 2004; Uchida et al., 2005). Instudies examining more recently deposited shelf and marine sedi-ments, combined δ13C and Δ14C signatures of long-chain n-alkaneshave been used to assess the relative contributions from petrogenicand plant wax sources. Pearson and Eglinton (2000) found that N80%of sedimentary n-alkanes in the Santa Monica Basin, CA, USA,originated from modern terrestrial plant waxes, whereas onlyapproximately 12% and 8% came from shale and petroleum,respectively, demonstrating only minor anthropogenic contributionsfrom the nearby greater metropolitan area of Los Angeles. Drenzeket al. (2007) reported that higher plant biomarkers in Beaufort Seasediments may have spent a considerable amount of time (i.e., 1000 sof years) sequestered in terrestrial reservoirs (e.g., soils, freshwa-ter sediments), a finding which would complicate the use of CSRAof n-alkanes in paleoclimatic reconstructions and perhaps lead tooverestimations of the importance of petrogenic organic carbonburial in marine sediments (Drenzek et al., 2009). Vonk et al. (2010)reported a substantial radiocarbon age difference between individualn-alkanes in surface water and sediment samples collected across alower estuarine transect from the Kalix River to adjacent BothnianBay, northern Baltic Sea. From these results Vonk et al. (2010)inferred the fluvial export of two distinct pools of soil organic carbon:a young surface peat component comprised of easily degradablehumic material, and an older, more recalcitrant deep mineral soilcomponent. Another interesting finding from this study was the
significant decrease of ~300‰ in theΔ14C value for combined C27 andC29 alkanes from estuarine to open bay sampling stations. Ifcompound-specific radiocarbon ages for plant wax derived-lipidsare to be used to accurately evaluate the quantity and quality ofterrigenous OM exported to near-shore environments, then thisobservation highlights the need for a better understanding intopotential shifts in biomarker 14C contents that may occur across anentire estuarine gradient.
In this study, we combine diagnostic concentration-based param-eters and compound-specific 13C and 14C analyses to examine thevariability in sources and ages of n-alkanes across an urbanizedtemperate estuary (Tyne, UK; Fig. 1). Tyneside (population ~900,000)has been an important industrial centre since the beginning of theIndustrial Revolution; consequently, a considerable amount ofanthropogenic hydrocarbon pollution has made its way into estuarinesediments over the centuries (Hale et al., 2010; Matthiessen et al.,1998; Woodhead et al., 1999). However, the River Tyne delivers aconsiderable amount of modern, terrigenous OM to the coastal NorthSea (Ahad et al., 2006a), and extensive coal seams and otherCarboniferous sedimentary rocks are abundant throughout the Tynebasin (Turner and Richardson, 2004), providing significant non-anthropogenic sources for both young and old n-alkanes, respectively.The main objectives of this study were twofold: 1) to investigate thepotential for CSRA as a tool to delineate the extent of anthropogenichydrocarbon contamination in historically polluted estuarine sedi-ments, and 2) to assess potential changes in stable and radiocarbonisotopic compositions of terrigenous n-alkanes across the full tidalrange of an estuary.
2. Materials and methods
2.1. Study site
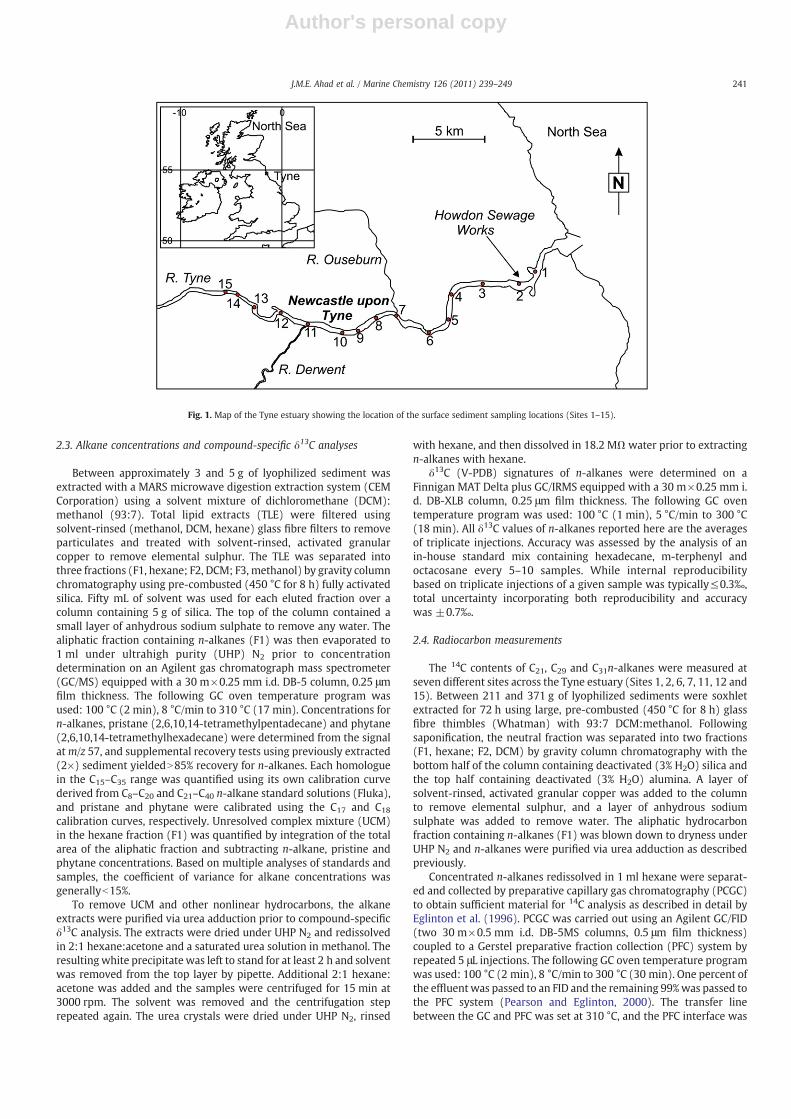
The River Tyne has a total drainage area of ~2900 km2 and anaverage freshwater flow of 48 m3 s-1. Its two main tributaries are theNorth Tyne, which receives humic-rich waters from blanket peatareas, and the South Tyne, which drains relatively pristine moorland.The maximum extent of the mesotidal Tyne estuary (Fig. 1) is around33 km and the freshwater residence time ranges between 5 and20 days. Although industrial fluxes to the lower part of the estuary arein decline, there is still significant deposition of urban waste,particularly from the Howdon sewage works (Ahad et al., 2006b) –
one of the UK's largest secondary treatment facilities (Fig. 1).
2.2. Sample collection and bulk sediment characteristics
Several kilograms of surface sediment (~0–4 cm depth) werecollected at fifteen sites along the Tyne estuary in March 2006 using astainless steel grab sampler lowered from a small inflatable ribbedboat. Sites were chosen to cover the full range of the tidal estuary andat areas close to potential “hot-spots” of anthropogenic contamination(Fig. 1). The sediment was allowed to settle for a few days in thedark at 5 °C before decanting to remove most of the water. Sampleswere then lyophilized, homogenized and stored in glass vials prior ton-alkane extraction. Percentages and δ13C (V-PDB) signatures(±0.3‰) of total organic carbon (% TOC) were determined using aCostech elemental analyzer coupled to a Finnigan Delta X isotope ratiomass spectrometer (IRMS) following decarbonation. Decarbonationwas carried out by repeated additions of small aliquots of 1 MHCl intosediment subsamples pre-weighed into silver capsules until efferves-cence had ceased. Surface sediments were also collected in March2003 close to three of the sites revisited in March 2006 using alightweight gravity corer. We report radiocarbon data for TOC fromthe top 0–2 cm layer from these cores.
240 J.M.E. Ahad et al. / Marine Chemistry 126 (2011) 239–249
Author's personal copy
2.3. Alkane concentrations and compound-specific δ13C analyses
Between approximately 3 and 5 g of lyophilized sediment wasextracted with a MARS microwave digestion extraction system (CEMCorporation) using a solvent mixture of dichloromethane (DCM):methanol (93:7). Total lipid extracts (TLE) were filtered usingsolvent-rinsed (methanol, DCM, hexane) glass fibre filters to removeparticulates and treated with solvent-rinsed, activated granularcopper to remove elemental sulphur. The TLE was separated intothree fractions (F1, hexane; F2, DCM; F3, methanol) by gravity columnchromatography using pre-combusted (450 °C for 8 h) fully activatedsilica. Fifty mL of solvent was used for each eluted fraction over acolumn containing 5 g of silica. The top of the column contained asmall layer of anhydrous sodium sulphate to remove any water. Thealiphatic fraction containing n-alkanes (F1) was then evaporated to1 ml under ultrahigh purity (UHP) N2 prior to concentrationdetermination on an Agilent gas chromatograph mass spectrometer(GC/MS) equipped with a 30 m×0.25 mm i.d. DB-5 column, 0.25 μmfilm thickness. The following GC oven temperature program wasused: 100 °C (2 min), 8 °C/min to 310 °C (17 min). Concentrations forn-alkanes, pristane (2,6,10,14-tetramethylpentadecane) and phytane(2,6,10,14-tetramethylhexadecane) were determined from the signalatm/z 57, and supplemental recovery tests using previously extracted(2×) sediment yieldedN85% recovery for n-alkanes. Each homologuein the C15–C35 range was quantified using its own calibration curvederived from C8–C20 and C21–C40 n-alkane standard solutions (Fluka),and pristane and phytane were calibrated using the C17 and C18calibration curves, respectively. Unresolved complex mixture (UCM)in the hexane fraction (F1) was quantified by integration of the totalarea of the aliphatic fraction and subtracting n-alkane, pristine andphytane concentrations. Based on multiple analyses of standards andsamples, the coefficient of variance for alkane concentrations wasgenerallyb15%.
To remove UCM and other nonlinear hydrocarbons, the alkaneextracts were purified via urea adduction prior to compound-specificδ13C analysis. The extracts were dried under UHP N2 and redissolvedin 2:1 hexane:acetone and a saturated urea solution in methanol. Theresultingwhite precipitate was left to stand for at least 2 h and solventwas removed from the top layer by pipette. Additional 2:1 hexane:acetone was added and the samples were centrifuged for 15 min at3000 rpm. The solvent was removed and the centrifugation steprepeated again. The urea crystals were dried under UHP N2, rinsed
with hexane, and then dissolved in 18.2 MΩ water prior to extractingn-alkanes with hexane.
δ13C (V-PDB) signatures of n-alkanes were determined on aFinnigan MAT Delta plus GC/IRMS equipped with a 30 m×0.25 mm i.d. DB-XLB column, 0.25 μm film thickness. The following GC oventemperature program was used: 100 °C (1 min), 5 °C/min to 300 °C(18 min). All δ13C values of n-alkanes reported here are the averagesof triplicate injections. Accuracy was assessed by the analysis of anin-house standard mix containing hexadecane, m-terphenyl andoctacosane every 5–10 samples. While internal reproducibilitybased on triplicate injections of a given sample was typically≤0.3‰,total uncertainty incorporating both reproducibility and accuracywas ±0.7‰.
2.4. Radiocarbon measurements
The 14C contents of C21, C29 and C31n-alkanes were measured atseven different sites across the Tyne estuary (Sites 1, 2, 6, 7, 11, 12 and15). Between 211 and 371 g of lyophilized sediments were soxhletextracted for 72 h using large, pre-combusted (450 °C for 8 h) glassfibre thimbles (Whatman) with 93:7 DCM:methanol. Followingsaponification, the neutral fraction was separated into two fractions(F1, hexane; F2, DCM) by gravity column chromatography with thebottom half of the column containing deactivated (3% H2O) silica andthe top half containing deactivated (3% H2O) alumina. A layer ofsolvent-rinsed, activated granular copper was added to the columnto remove elemental sulphur, and a layer of anhydrous sodiumsulphate was added to remove water. The aliphatic hydrocarbonfraction containing n-alkanes (F1) was blown down to dryness underUHP N2 and n-alkanes were purified via urea adduction as describedpreviously.
Concentrated n-alkanes redissolved in 1 ml hexane were separat-ed and collected by preparative capillary gas chromatography (PCGC)to obtain sufficient material for 14C analysis as described in detail byEglinton et al. (1996). PCGC was carried out using an Agilent GC/FID(two 30 m×0.5 mm i.d. DB-5MS columns, 0.5 μm film thickness)coupled to a Gerstel preparative fraction collection (PFC) system byrepeated 5 μL injections. The following GC oven temperature programwas used: 100 °C (2 min), 8 °C/min to 300 °C (30 min). One percent ofthe effluentwas passed to an FID and the remaining 99%was passed tothe PFC system (Pearson and Eglinton, 2000). The transfer linebetween the GC and PFC was set at 310 °C, and the PFC interface was
Fig. 1. Map of the Tyne estuary showing the location of the surface sediment sampling locations (Sites 1–15).
241J.M.E. Ahad et al. / Marine Chemistry 126 (2011) 239–249

Author's personal copy
set at 320 °C. Samples were collected cryogenically in glass U-trapsat −20 °C using chilled methanol to condense the target compounds.U-traps were eluted with hexane and transferred to 2 mL GC vials.
Radiocarbon measurements were determined by accelerator massspectrometry (AMS) at the NOSAMS facility at Woods Hole Oceano-graphic Institution, MA, USA (C21 and C29 n-alkanes), and at the SUERCAMS facility in East Kilbride, UK (C31 n-alkanes and TOC) aftercombustion in sealed quartz tubes and conversion of CO2 to graphite(Boutton et al., 1983; Slota et al., 1987). Radiocarbon measurementswere normalised to δ13C values of −25‰ and are reported as Δ14Caccording to international convention (Stuiver and Polach, 1977). Inthis context, petroleum and sedimentary rocks have a “14C-free”value of −1000‰ while recently photosynthesized carbon is more14C-enriched (~0 to 200‰) depending on when and where theorganism grew. The uncertainty for Δ14C measurements incorporatingboth accuracy and reproducibility was ±10‰ for TOC and ±20‰ forindividual n-alkanes. Large-scale process blanks extracted usingidentical solvent volumes, conditions, and procedures (i.e., soxhletextraction, saponification, column chromatography, urea adduction) assamples yielded no detectable amounts of n-alkanes. In addition, forsamples measured at SUERC, blanks containing an internal standardmaterial of known age and similar in mass to the individual n-alkaneextracts (75–250 μg C) demonstrated acceptable low levels of back-ground 14C contamination. To assess potential intra-laboratory vari-ability associated with radiocarbon analyses of small sample masses,one sample (C29, Site 6) was analysed at both NOSAMS and SUERCfacilities. The 1σ standard deviation between the two measurementswas within the total uncertainty reported here for CSRA of n-alkanes.
3. Results and discussion
3.1. Alkane distributions and diagnostic ratios
Total concentrations of C15–C35 n-alkanes in Tyne estuarysediments ranged from 6.5 to 26.6 μg/g (Table 1). The relativeabundances of n-alkanes in the upper and middle parts of the estuaryshowed a strong odd-over-even preference and were dominated byeither C29 or C31 homologues (Fig. 2). The odd-over-even preference
was less pronounced in the lower part of the estuary, and the relativeabundance of pristane (Pr) was substantially higher in thesesediments (Fig. 2). Normalised to TOC (Table 1) to take into accountslight variations in grain size, long-chain n-alkane concentrations(e.g., C29 and C31) showed a near linear decrease from the upper tolower estuary, whereas shorter-chain n-alkane concentrations (e.g.,C19 and C21) varied little across the entire tidal range (Fig. 3). Thesedata seem to indicate a significantly larger component of presumablyhigher plant wax derived n-alkanes in upper estuarine compared tolower estuarine sediments, and little riverine or estuarine input ofshorter-chain homologues.
Both CPI and ACL values showed pronounced seaward decreases(see Table 1 legend for parameter definitions). The highest CPI wasobserved at the most upriver site (Site 15, CPI 6.4), and the lowest CPI(Site 2, CPI 1.8) was found in sediments collected in close proximityto the Howdon sewage works and to a large riverside liquid hydro-carbon storage facility located adjacent to the sewage works in thedownstream direction (Fig. 1). Sediments collected at Site 2 alsoexhibited the lowest ACL (28.5). The highest ACL (29.5) was found atSite 14, locatedb1 km downriver from Site 15. The relatively higherCPI and ACL values found in the upper estuary are typical forsediments dominated by terrestrial vascular plants (Boot et al., 2006;Jeng, 2006; Tanner et al., 2010; Wang et al., 2003), whereas the lowerCPI and ACL values in the lower estuary suggest significant petrogenichydrocarbon input (Jeng, 2006; Jeng and Kao, 2002; Rogers andSavard, 1999; Tolosa et al., 2004).
UCM in the hexane fraction was present in all sediments samples(15.4 to 54.2 μg/g, Table 1) and showed a significant “hump” centredaround the C27 to C31 peaks (Fig. 4). Elevated UCM is generallyattributed to a large component of degraded petroleum hydrocarbonsand is often found in chronically polluted sediments (Hu et al., 2009;Le Dréau et al., 1997; Scarlett et al., 2007; Tolosa et al., 1996). However,UCM may also be associated with organic matter derived frombituminous and sub-bituminous coals and coaly shales (Fabianskaet al., 2008; Olivella et al., 2006). For example, the representative totalion current GC/MS chromatogram for the saturated hydrocarbonfraction in Tyne sediments (Fig. 4) is very similar to that observed ina coal solvent extract reported by Bojesen-Koefoed et al. (2001). It istherefore possible that hydrocarbon profiles ostensibly reflectingsignificant petroleum contribution were in fact the result of petrogenicinputs originating from along the urbanized stretch of the Tyne estuaryor within the Tyne watershed. The potential for aged, bedrock-derivedlipids to resemble petroleum contamination in sediments has beenpreviously documented (Jeng and Kao, 2002)
Ratios of pristane (Pr) to phytane (Ph) and heptadecane (C17) to Prcan also be used to assess relative contributions from petrogenichydrocarbons in sediments. Pr/Ph ratios≤1 are thought to reflectsignificant petroleum contamination, whereas high Pr/Ph ratiosindicate a biogenic source or possibly contributions from bituminouscoals and oils originating from higher plants (Brooks et al., 1969;Powell and McKirdy, 1973; Readman et al., 2002; Volkman et al.,1992). In uncontaminated sediments, Pr/Ph ratios are higher than 1,typically between 3 and 5 (Steinhauer and Boehm, 1992). High C17/Prratios (i.e., ≫2) are thought to reflect significant contributions fromalgae (Readman et al., 2002), whereas low C17/Pr ratios (b1) areindicative of highly weathered oil (Wang et al., 1995). In Tyne estuarysediments, Pr/Ph ratios (Table 1) showed a distinct seaward increase,ranging from 3.48 (Site 12) to 7.86 (Site 2), and C17/Pr ratios (Table 1)showed a seaward decrease, ranging from 0.42 (Site 15) to 0.14 (Site2). The generally low ratios and seaward decrease in C17/Pr thereforepoints to an increasingly larger contribution of heavily weatheredpetroleum in lower estuarine sediments. The seaward increase in Pr/Ph ratios may indicate substantial microbial reworking of organicmatter in the lower part of the estuary (Le Dréau et al., 1997),although mixing with a lower estuarine-derived petrogenic sourcecontaining a high Pr/Ph ratio could also account for this trend.
Table 1Site information and geochemical data for surficial sediments from the Tyne estuary.
Site km fromNorth Sea
% TOCa Σ n-alk(μg/g)b
UCMc
(μg/g)CPId ACLe Pr/Phf C17/Prg
1 2.8 7.8 9.4 15.8 1.9 28.8 6.36 0.162 4.6 10.5 13.1 15.4 1.8 28.5 7.86 0.143 7.1 7.1 9.0 26.6 1.9 28.5 7.28 0.204 8.9 5.9 6.5 30.9 2.6 28.7 5.55 0.275 10.5 5.4 11.3 43.8 2.9 29.4 3.52 0.276 12.6 6.9 7.9 28.4 3.2 29.3 5.23 0.367 15.1 6.3 10.5 31.6 3.5 29.3 5.08 0.278 16.0 6.9 15.4 39.3 4.6 29.5 4.26 0.339 17.5 8.2 12.3 31.2 4.5 29.4 5.34 0.3010 18.6 4.7 8.8 22.1 2.3 29.1 4.54 0.3611 21.4 8.6 23.8 54.2 4.4 29.4 4.18 0.3712 23.2 6.8 19.7 44.8 4.3 29.3 3.48 0.2913 25.4 8.5 26.6 50.9 5.1 29.2 3.88 0.3714 27.1 7.9 19.3 45.4 4.2 29.5 4.23 0.3015 27.8 5.5 17.6 16.0 6.4 29.5 4.92 0.42
a Percentage of total organic carbon (% TOC).b Σ n-alk (μg/g). The sum of C15 to C35 n-alkanes in dry weight of sediment.c Unresolved complex mixture (UCM). Determined in the hexane fraction (see text
for details).d Carbon preference index (CPI). CPI=0.5*Σ(Xi+Xi+2+…+Xn)/Σ(Xi-1+Xi+1+
…+Xn-1)+0.5*Σ(Xi+Xi+2+…+Xn)/Σ(Xi+1+Xi+3+…+Xn+1), where i=25 andn=33. Adapted from Schefuβ et al. (2003).
e Average chain length (ACL). ACL=(25*(C25)+27*(C27)+29*(C29)+31*(C31)+33*(C33)) / (C25+C27+C29+C31+C33). Adapted from Jeng (2006).
f Pristane to phytane ratio (Pr/Ph).g C17 n-alkane to pristane ratio (C17/Pr).
242 J.M.E. Ahad et al. / Marine Chemistry 126 (2011) 239–249

Author's personal copy
3.2. Stable and radiocarbon isotopes
δ13C signatures for n-alkanes (C19–C31) in the Tyne estuary rangedfrom−37.1 to−29.3‰ and for most samples became more depletedwith increasing carbon number (Table 2). The δ13C values found hereare typical for C3 plant and/or petrogenic n-alkanes found in soilsand sediments (Huang et al., 1996; Ishiwatari et al., 1994; Rogers andSavard, 1999). δ13C signatures for shorter odd-numbered n-alkanes(i.e., C19 and C21) ranged between −29.4 and −31.9‰ and showed a
slight (1.7–2.5‰) and variable downriver depletion in 13C. Converse-ly, the large odd-numbered n-alkanes (i.e., C27, C29 and C31) showed adownriver 13C-enrichment of up to around 3–4‰. The δ13C signaturesof odd-numbered mid-range (C23 and C25; −34.5 to −30.7‰) andeven-numbered n-alkanes (C20 to C30; −33.7 to −29.3‰) in generalfell within a slightly narrower range than odd-numbered long-chainn-alkanes and exhibited no discernible trends across the estuary.
On Fig. 5 are plotted the δ13C signatures for C19–C31 n-alkanes from5 sampling locations covering the full tidal range of the Tyne estuary
Fig. 2. The molecular distributions of C15–C35 n-alkanes and pristane (Pr) and phytane (Ph) at selected sampling locations across the Tyne estuary (Fig. 1) relative to the sum of C15–C35 n-alkanes+Pr+Ph concentrations at each site.
Fig. 3. Concentrations (μg/g dry weight of sediment normalized to TOC) of C19, C21, C29
and C31 n-alkanes across the Tyne estuary.Fig. 4. A representative total ion current GC/MS chromatogram for the saturatedhydrocarbon fraction in Tyne estuary sediments (Site 7).
243J.M.E. Ahad et al. / Marine Chemistry 126 (2011) 239–249

Author's personal copy
at sites where CSRA was carried out. In general, there was slightly lessvariation in δ13C among the individual homologues for samplesclosest to the North Sea compared to samples collected furtherupriver. Odd-numbered n-alkanes were typically more depleted thanadjacent even-numbered n-alkanes, displaying a distinct ‘zigzag’pattern. This zigzag pattern has been previously observed incontaminated sediments and was attributed to mixing betweenrelatively enriched fossil fuel-derived and depleted higher plant wax-derived sources (Ishiwatari et al., 1994; Lichtfouse and Eglinton,1995). In addition, compared to higher plant waxes, δ13C signatures ofindividual n-alkanes in the C20–C30 range in petroleum and coaltypically do not vary considerably between the different homologues
(McRae et al., 1998; Odden et al., 2002; Xiong and Geng, 2000). Theless pronounced zigzag pattern and relative 13C-enrichment in longerchain homologues thus points to a greater contribution frompetrogenic hydrocarbons in lower estuarine sediments.
Radiocarbon isotope ratios (Δ14C) for C21, C29 and C31 n-alkanehomologues weremeasured at 4 to 5 sites covering the full tidal rangeof the estuary (samples for CSRA were chosen amongst Sites 1, 2, 6, 7,11, 12 and 15). Δ14C values for C21 were all relatively depleted andshowed a near linear decrease toward the mouth of the estuary,ranging from −738 to −945‰ (Fig. 6). Δ14C values for C29 (−65 to−591‰) and C31 (−96 to−382‰) were also more depleted in lowerestuarine samples. However, in contrast to C21, the longer-chainhomologues contained a significantly greater component of moderncarbon. Δ14C values for TOC collected at sites along the estuary nearthose for CSRA samples were more enriched compared to C21 andmore depleted compared to C29 or C31 and also showed the samedownriver 14C-depletion as observed in n-alkanes, ranging from−554‰ to −801‰ (Fig. 6). The trend of increasingly 14C-depletedradiocarbon contents of n-alkanes and TOC with decreasing distanceto the North Sea supports the inferences made by diagnostic ratiosand compound-specific δ13C data indicating significant petrogenichydrocarbon contamination in the lower part of the Tyne estuary. Theclose agreement between diagnostic ratios and isotopic data isillustrated in Fig. 7, for which significantly positive linear relationshipswere found between ACL and Δ14C (C21 r2=0.88, n=5, Pb0.02; C29r2=0.97, n=5, Pb0.003; C31 r2=1.00, n=4, Pb0.002) and betweenCPI and Δ14C (C21 r2=0.97, n=5, Pb0.003; C29 r2=0.68, n=5,Pb0.09; C31 r2=0.69, n=4, Pb0.18). The stronger relationshipbetween ACL and Δ14C supports the argument made by Jeng (2006)for the application of ACL as a robust indicator of petrogenichydrocarbon contamination in aquatic sediments.
On Fig. 7 are also shown CPI, ACL and Δ14C of C27+C29 or C29+C31n-alkanes from previously published studies in which three or moredata pairs were reported. No noticeable trend was observed betweenΔ14C and ACL in surface sediment samples (trend line not shown;P=0.93) collected from the western Black Sea within ~200 km of themouth of the Danube River (Kusch et al., 2010). CPI and Δ14C showeda positive linear correlation in these same western Black Sea samples(r2=0.37, n=5, Pb0.28) and in surface sediments from the northernBaltic Sea (r2=0.91, n=5, Pb0.02; Vonk et al., 2008, 2010). The poorrelationships found in Black Sea sedimentsmay be partly attributed toa greater component of aeolian n-alkanes from a variety of aged andmodern sources, particularly for samples located further from themouth of the Danube (Kusch et al., 2010). While these preliminary
Table 2δ13C signatures (‰) for total organic carbon (TOC) and n-alkanes (C19–C31) in Tyneestuary surface sediments.
Site TOC C19 C20 C21 C22 C23 C24
1 −23.1 −31.4 −31.3 −31.8 −32.3 −32.8 −32.32 −23.1 −31.8 −31.9 −31.9 −31.9 −32.2 −32.03 −23.6 −30.9 −30.6 −31.4 −31.8 −32.8 −32.04 −24.0 −30.7 −30.1 −30.9 −30.2 −31.1 −30.05 −24.7 −30.6 −31.1 −31.9 −31.7 −32.6 −32.16 −25.7 −30.8 −30.1 −30.9 −30.2 −31.5 −30.07 −25.1 −30.1 −29.6 −30.3 −29.8 −30.7 −29.78 −25.6 −29.4 −31.5 −30.6 −29.8 −32.3 −32.19 −25.6 −29.7 −30.5 −30.6 −30.9 −32.3 −33.310 −24.5 −30.4 −30.6 −31.3 −30.8 −31.4 −30.511 −24.8 −30.0 −29.9 −30.5 −30.2 −31.3 −30.112 −25.8 −31.6 −31.5 −31.8 −31.4 −32.9 −32.513 −25.9 −29.5 −29.3 −30.5 −30.0 −31.6 −30.414 −25.3 −30.1 −29.9 −30.9 −31.2 −32.1 −31.715 −26.2 −30.1 −30.2 −31.2 −31.6 −33.5 −31.9
Site C25 C26 C27 C28 C29 C30 C31
1 −33.0 −32.5 −33.2 −32.9 −34.9 −32.4 −34.62 −32.8 −32.1 −32.6 −32.0 −33.4 −30.9 −32.53 −33.5 −31.0 −33.2 −32.6 −34.0 −32.1 −34.44 −31.9 −29.8 −32.6 −31.3 −34.5 −31.8 −34.95 −33.2 −32.3 −34.3 −31.0 −35.4 −31.2 −35.46 −32.1 −30.2 −33.0 −31.8 −34.9 −32.1 −35.17 −31.7 −29.7 −32.7 −31.2 −34.6 −31.6 −34.78 −33.8 −32.8 −34.8 −32.0 −36.7 −31.7 −36.69 −33.2 −32.5 −34.2 −32.5 −35.9 −31.9 −36.010 −31.7 −30.9 −33.6 −31.9 −35.6 −30.2 −36.011 −32.2 −30.5 −33.2 −32.0 −34.7 −32.1 −35.012 −34.5 −32.5 −35.8 −33.6 −37.1 −32.4 −35.813 −32.7 −30.9 −34.3 −32.5 −36.1 −32.4 −35.414 −33.8 −32.1 −35.3 −33.4 −36.1 −33.2 −36.315 −34.2 −32.4 −35.3 −33.7 −37.0 −33.5 −36.3
Fig. 5. δ13C signatures for C19–C31 n-alkanes from 5 sampling locations covering the fulltidal range of the Tyne estuary. Vertical error bars represent an accuracy and repro-ducibility of ±0.7‰.
Fig. 6. Δ14C values for total organic carbon (TOC), C21, C29 and C31 n-alkanes in Tyneestuary surface sediments versus distance from the North Sea. Vertical error barsrepresent an accuracy and reproducibility of ±20‰ for n-alkanes and ±10‰ for TOC.
244 J.M.E. Ahad et al. / Marine Chemistry 126 (2011) 239–249

Author's personal copy
trends are interesting, additional data are needed in order to betterinterpret the relationships between diagnostic molecular ratios andthe 14C contents of individual n-alkane homologues.
3.3. Sources of n-alkanes in the lower Tyne estuary
Potential sources for petrogenic hydrocarbons in lower Tyneestuary sediments include wastewater outflows and both recent andhistorical commercial and industrial activities (e.g., shipping, acci-dental spillage from onshore liquid hydrocarbon storage facilities,incomplete fossil OM combustion, coal mining, etc.). As previouslymentioned, one of the UK's largest secondary treatment plants(Howdon) is situated near the Site 2 sampling location. The relativelyhigh % TOC found at Site 2 and nearby locations perhaps reflected agreater component of sewage-derived OM in lower Tyne estuarysediments (Table 1). A significant contribution from petroleum-basedhousehold products such as detergents and pharmaceuticals insewage-derived OM would thus provide a constant source of fossilcarbon to the environment (Griffith et al., 2009). Coal particles arealso a possible major source of anthropogenic contamination to thesesediments. Although rarely considered in most studies, unburntbituminous coal often contains high levels of native petrogenichydrocarbons (Achten and Hofmann, 2009). Hundreds of collieriesand pits were in operation throughout the 18th, 19th and 20thcenturies within a roughly 10 km radius encircling the lower part ofthe Tyne estuary near Sites 3 and 4 (DurhamMining Museum, http://www.dmm.org.uk), providing ample possibilities for direct release ofa substantial amount of unburnt coal particles into the environmentthough mining and subsequent transportation. The widespread
occurrence of coal particles (up to 5% of total dry sediment weight)in Tyne estuary sediments was confirmed bymicroscopic examination(Ahad, 2005; Hale et al., 2010). However, as quantifying the relativeinputs of petroleum- versus coal-derived hydrocarbons poses asignificant analytical challenge due to source signal overlap (Achtenand Hofmann, 2009), the relative proportions of these two sourcesof n-alkanes in Tyne estuary sediments were not determined. Forinstance, the relatively enriched δ13C signatures for smaller-chainn-alkanes reported here are similar to those reported for n-alkanes inboth petroleum and coal (Clayton and Bjoroy, 1994; McRae et al.,1998), both of which are sources for 14C-free hydrocarbons.
In addition to petrogenic inputs, the alkane distributions foundin the lower part of the Tyne estuary may also reflect increasedcontributions from autotrophic and heterotrophic organisms. Sinceprimary production in the Tyne estuary is minimal (Ahad et al., 2008),and n-alkanes≥C21 are generally considered minor components inmarine autotrophs (Pearson and Eglinton, 2000; Sakata et al., 1997),macrophytic and algal organic matter are not considered significantsources of n-alkanes in these sediments. This is supported by theseaward decrease in C17/Pr ratios (Table 1), which would likely showthe opposite trend if a significant proportion of n-alkanes in the rangereported here were derived from algal sources (Readman et al., 2002).However, the seaward increase in Pr/Ph ratios may point tosubstantial microbial reworking of organic matter in the lower partof the estuary (Le Dréau et al., 1997) and hence a possible recentbacterial origin for smaller-chain n-alkanes in these sediments. If asignificant proportion of relatively shorter-chain n-alkanes (i.e.,≤C21)in lower estuarine sediments were bacterially derived then the 14Ccontents of these compounds should reflect the age of the carbonsubstrate being consumed. TheΔ14C values of C21n-alkanes found at thetwo sites closest to the North Seawere close to radiocarbon “dead” (Site1−939‰; Site 2−945‰); thus, whether microbially reworked or not,14C contents point to a fossil carbon source for shorter-chain n-alkanesin the lower part of the Tyne estuary.
3.4. Sources of n-alkanes in the upper Tyne estuary
The catchment of the River Tyne is dominated by large areasof open and afforested peatland that are significant sources ofmodern organic carbon to the river and estuary (Ahad et al., 2006a).Hentriacontane (C31) is often the most abundant n-alkane homologuefound in the sphagnum moss-dominated peat common across the UK(Ficken et al., 1998; Nott et al., 2000). The n-alkane distributions andhigher ACL values found in the most upriver sampling locations thusagree with a significant contribution from peat-derived OM.However, CPI values (~13 to 23) and δ13C signatures for C27, C29
and C31 n-alkanes (~−30 to −34‰) in recently accumulated peatfrom the north of the UK were significantly higher and more enriched(Ficken et al., 1998; Xie et al., 2004), respectively, than those found atSites 12–15 (CPI 4.3 to 6.4; δ13C−34.3 to−37.1‰), pointing to inputsfrom additional terrestrial sources or different δ13C signatures forpeat-derived n-alkanes in Tyne sediments. Furthermore, C23 and C25
n-alkanes in peat showed a slight 13C-depletion compared to C29 andC31 homologues (Xie et al., 2004). In Tyne estuary sediments theopposite trend was found, pointing to an enriched, petrogeniccontribution to mid-chain (C23 to C25) n-alkanes. Nonetheless, theΔ14C signatures of C29 (−65‰) and C31 (−96‰)measured at Site 15,the most upriver sampling location, pointed to a relatively modern(14C ages corresponding to ~500–800 yrs BP) source for long-chain,plant-wax-derived n-alkanes exported to the Tyne estuary fromwithin the catchment. This observation thus excludes a largecomponent of pre-aged vascular plant OM originating from deepersoil horizons or fossil n-alkanes originating from the erosion ofsedimentary rocks (i.e., coal seams). The relatively modern ages forplant wax-derived n-alkanes in the upper part of the Tyne suggeststhat vascular plant detritus in peat-rich catchments does not spend
Fig. 7. Δ14C values for C21, C29 and C31 n-alkanes in Tyne estuary surface sedimentsversus average chain length (ACL) and carbon preference index (CPI). ACL, CPI and Δ14Cof C29+C31 n-alkanes in western Black Sea surface sediments (Kusch et al., 2010) andCPI and Δ14C of C27+C29 n-alkanes in northern Baltic Sea surface sediments (Vonk etal., 2008; Vonk et al., 2010) are also plotted.
245J.M.E. Ahad et al. / Marine Chemistry 126 (2011) 239–249

Author's personal copy
thousands of years sequestered in intermediate reservoirs (e.g., soils,freshwater sediments), a finding opposite to that reported for smallmountainous rivers underlain by readily erodible soils (Drenzek etal., 2009).
Henicosane (C21) may comprise up to around 20% of the totaln-alkane distribution in sphagnum moss (Ficken et al., 1998; Nicholset al., 2006); therefore at least part of the lower molecular weightn-alkanes found in upper Tyne estuary sediments could haveoriginated from modern peat-derived OM exported from thecatchment. However, the relatively depleted Δ14C signature for C21
(−738‰) found at Site 15 indicated only a minor modern carboncomponent in watershed-derived smaller chain n-alkanes. Due to theclose to modern Δ14C values for C29 and C31 measured at Site 15, pre-aged plant wax OM from deeper soil horizons is also not considered asignificant component of C21, since there is no reason to suspect whythe smaller homologue would preferentially spend more timesequestered in intermediate reservoirs than the larger homologues,particularly since the microbial biodegradability of these twocompounds is roughly similar (Mazeas et al., 2002).
3.5. Mixing between fossil and modern n-alkanes
We consider n-alkanes in the Tyne estuary to be comprised ofmixtures between two principal sources; a fossil petrogenic carbonsource comprised of contributions from petroleum, coal, and otherforms of sedimentary organic carbon, and a modern carbon sourceoriginating from terrestrial plant waxes. The relative proportions ofthese two sources in n-alkanes can be quantitatively estimated usingeither a 14C or 13C isotope mass balance incorporating both end-members:
Δ14CA = fM Δ14CM
� �+ fF Δ14CF
� �ð1Þ
δ13CA = fM δ13CM
� �+ fF δ13CF
� �ð2Þ
where the subscripts A, M and F represent the Δ14C or δ13Csignatures of the individual n-alkane (C21, C29 and C31), modernplant wax, and fossil petrogenic carbon, respectively. The 13C or 14Ccontents of n-alkanes are comprised of contributions from bothmodern plant wax and fossil petrogenic carbon fractions (fM+fF=1).The Δ14C value for fossil carbon is assumed to be −1000‰ (i.e., 14C-free). Ahad et al. (2006a) reported a Δ14C signature of 120‰ for highmolecular weight dissolved organic carbon (HMW DOC) in thefreshwater part of the Tyne estuary. Although particulate organiccarbon (POC) is considered the main vector for hydrophobic n-alkaneexport, a study carried out by Tipping et al. (2007) reported similar 14Clevels (95–108 absolute % modern carbon) in both DOC and POC insamples collected from a stream in NW England draining organic-richsoils. We therefore assume the Δ14C of riverine HMW DOC in the Tyneestuary (120‰) is a close proxy for the 14C content of themodern plantwax end-member. The δ13C value for fossil carbon is −29.7‰, whichcorresponds to the most enriched δ13C value found for C24 in the Tyneestuary (Table 2). Tetracosane (C24) is assumed tohavea predominantlypetrogenic source (Pearson and Eglinton, 2000). Xie et al. (2004)reported little variation between δ13C signatures for C23 and C31 n-alkanes in the top 16 cm of a peat monolith collected from anombrotrophic mire in nearby Cumbria, UK. The most depleted δ13Cvalue found for n-alkanes in Tyne estuary sediments (−37.1‰; Site12 C29) was therefore chosen to represent the plant wax end-memberfor all three homologues in Eq. (2).
Rearranging Eq. (1) (14C) and solving for fF we found thatbetween 77–95%, 16–63% and 19–45% of the carbon in C21, C29 andC31 n-alkanes, respectively, was derived from fossil carbon sources.The fractions of fossil carbon in n-alkanes determined using the 13Cisotope mass balance (Eq. (2)) ranged from 70–92% (C21), 0–50%
(C29) and 7–62% (C31). The fractions of fossil carbon in C21, C29 andC31 n-alkanes across the Tyne estuary calculated using both Δ14C andδ13Cmass balances are illustrated on Fig. 8. As shown here, there wasexcellent agreement between the two approaches for the C29 and C31
homologues, providing two independent lines of evidence tosupport the mixing between two dominant end-member sources.Both isotope mass balances yielded almost identical seawardincreases in the proportion of petrogenic-derived (i.e., fossil) carbonin the two long-chain n-alkanes. In contrast, while calculated fFvalues for C21 were within the same range for both 14C (77–95%) and13C (70–92%) mass balances, slightly different trends were observedacross the estuary. The fraction of fossil carbon in C21 calculatedusing Eq. (1) became progressively larger toward the North Sea,whereas Eq. (2) resulted in a lower component of fossil carbon inlower estuarine sediments. This difference may be due to variationsin the δ13C signature of the dominant fossil carbon source for C21
along the estuarine transect (the δ13C of the modern end-member isnot expected to change along the estuary as the River Tyne is themain source for plant wax-derived n-alkanes). For instance, aslightly more depleted fossil carbon end-member in the upperestuary combined with a slightly more enriched fossil carbon end-member in the lower estuary could explain the difference in trendsshown in Fig. 8.
It is possible that the Δ14C value for modern plant wax-derivedn-alkanes is more positive that the value of 120‰ assigned here,reflecting photosynthesized plant material containing a bomb 14Ccomponent that corresponds more closely to the peak period ofaboveground testing of thermonuclear weapons during the late 1950sand early 1960s. For instance, Benner et al. (2004) reported a Δ14C of307‰ for DOC in the Ob' River discharging into the Kara Sea inNorthern Russia. Substituting a modern plant wax end-member of300‰ into Eq. (1) generates a 1–3% higher fossil carbon component inC21 and a 5–12% higher fossil carbon component in C29 and C31. In any
Fig. 8. The fractions of fossil carbon (fF) in C21, C29 and C31 n-alkanes across the Tyneestuary calculated using Δ14C (Eq. (1)) and δ13C (Eq. (2)) mass balances.
246 J.M.E. Ahad et al. / Marine Chemistry 126 (2011) 239–249
Author's personal copy
case, selecting a different modern plant-wax end-member for Eq. (1)will not affect the trends illustrated in Fig. 8.
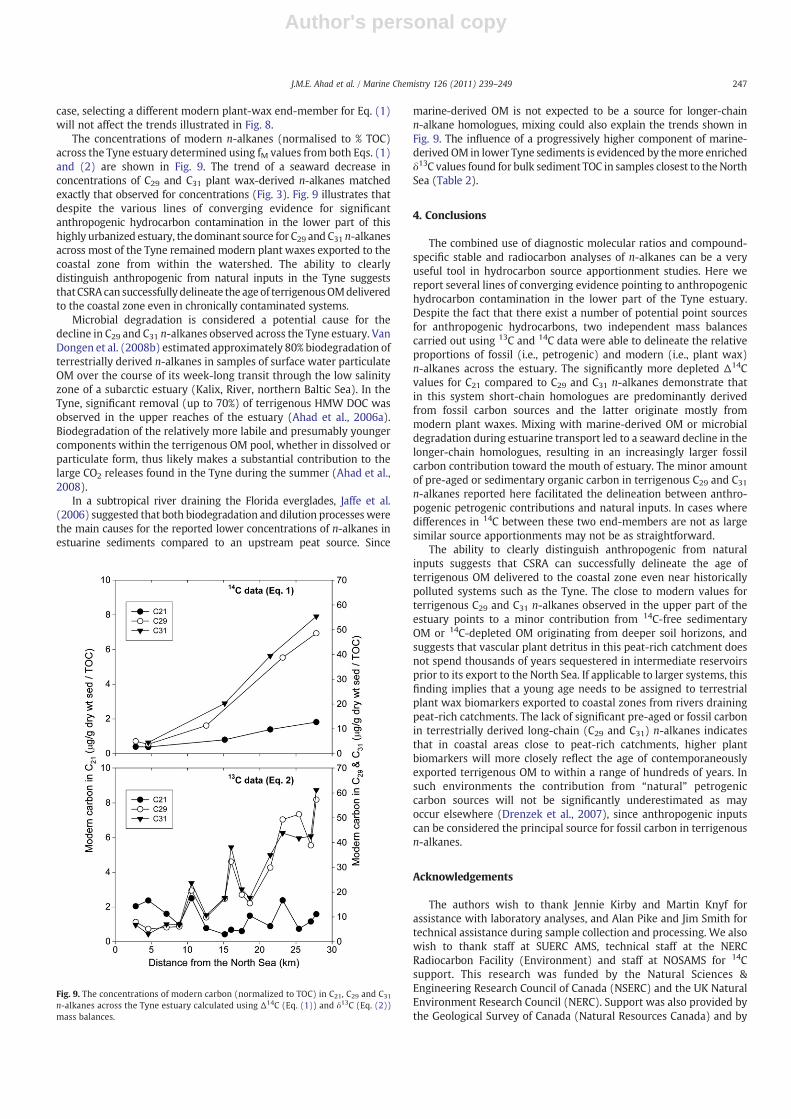
The concentrations of modern n-alkanes (normalised to % TOC)across the Tyne estuary determined using fM values from both Eqs. (1)and (2) are shown in Fig. 9. The trend of a seaward decrease inconcentrations of C29 and C31 plant wax-derived n-alkanes matchedexactly that observed for concentrations (Fig. 3). Fig. 9 illustrates thatdespite the various lines of converging evidence for significantanthropogenic hydrocarbon contamination in the lower part of thishighly urbanized estuary, the dominant source for C29 and C31 n-alkanesacross most of the Tyne remained modern plant waxes exported to thecoastal zone from within the watershed. The ability to clearlydistinguish anthropogenic from natural inputs in the Tyne suggeststhatCSRAcan successfully delineate the age of terrigenousOMdeliveredto the coastal zone even in chronically contaminated systems.
Microbial degradation is considered a potential cause for thedecline in C29 and C31 n-alkanes observed across the Tyne estuary. VanDongen et al. (2008b) estimated approximately 80% biodegradation ofterrestrially derived n-alkanes in samples of surface water particulateOM over the course of its week-long transit through the low salinityzone of a subarctic estuary (Kalix, River, northern Baltic Sea). In theTyne, significant removal (up to 70%) of terrigenous HMW DOC wasobserved in the upper reaches of the estuary (Ahad et al., 2006a).Biodegradation of the relatively more labile and presumably youngercomponents within the terrigenous OM pool, whether in dissolved orparticulate form, thus likely makes a substantial contribution to thelarge CO2 releases found in the Tyne during the summer (Ahad et al.,2008).
In a subtropical river draining the Florida everglades, Jaffe et al.(2006) suggested that both biodegradation and dilution processeswerethe main causes for the reported lower concentrations of n-alkanes inestuarine sediments compared to an upstream peat source. Since
marine-derived OM is not expected to be a source for longer-chainn-alkane homologues, mixing could also explain the trends shown inFig. 9. The influence of a progressively higher component of marine-derived OM in lower Tyne sediments is evidenced by themore enrichedδ13C values found for bulk sediment TOC in samples closest to the NorthSea (Table 2).
4. Conclusions
The combined use of diagnostic molecular ratios and compound-specific stable and radiocarbon analyses of n-alkanes can be a veryuseful tool in hydrocarbon source apportionment studies. Here wereport several lines of converging evidence pointing to anthropogenichydrocarbon contamination in the lower part of the Tyne estuary.Despite the fact that there exist a number of potential point sourcesfor anthropogenic hydrocarbons, two independent mass balancescarried out using 13C and 14C data were able to delineate the relativeproportions of fossil (i.e., petrogenic) and modern (i.e., plant wax)n-alkanes across the estuary. The significantly more depleted Δ14Cvalues for C21 compared to C29 and C31 n-alkanes demonstrate thatin this system short-chain homologues are predominantly derivedfrom fossil carbon sources and the latter originate mostly frommodern plant waxes. Mixing with marine-derived OM or microbialdegradation during estuarine transport led to a seaward decline in thelonger-chain homologues, resulting in an increasingly larger fossilcarbon contribution toward the mouth of estuary. The minor amountof pre-aged or sedimentary organic carbon in terrigenous C29 and C31n-alkanes reported here facilitated the delineation between anthro-pogenic petrogenic contributions and natural inputs. In cases wheredifferences in 14C between these two end-members are not as largesimilar source apportionments may not be as straightforward.
The ability to clearly distinguish anthropogenic from naturalinputs suggests that CSRA can successfully delineate the age ofterrigenous OM delivered to the coastal zone even near historicallypolluted systems such as the Tyne. The close to modern values forterrigenous C29 and C31 n-alkanes observed in the upper part of theestuary points to a minor contribution from 14C-free sedimentaryOM or 14C-depleted OM originating from deeper soil horizons, andsuggests that vascular plant detritus in this peat-rich catchment doesnot spend thousands of years sequestered in intermediate reservoirsprior to its export to the North Sea. If applicable to larger systems, thisfinding implies that a young age needs to be assigned to terrestrialplant wax biomarkers exported to coastal zones from rivers drainingpeat-rich catchments. The lack of significant pre-aged or fossil carbonin terrestrially derived long-chain (C29 and C31) n-alkanes indicatesthat in coastal areas close to peat-rich catchments, higher plantbiomarkers will more closely reflect the age of contemporaneouslyexported terrigenous OM to within a range of hundreds of years. Insuch environments the contribution from “natural” petrogeniccarbon sources will not be significantly underestimated as mayoccur elsewhere (Drenzek et al., 2007), since anthropogenic inputscan be considered the principal source for fossil carbon in terrigenousn-alkanes.
Acknowledgements
The authors wish to thank Jennie Kirby and Martin Knyf forassistance with laboratory analyses, and Alan Pike and Jim Smith fortechnical assistance during sample collection and processing. We alsowish to thank staff at SUERC AMS, technical staff at the NERCRadiocarbon Facility (Environment) and staff at NOSAMS for 14Csupport. This research was funded by the Natural Sciences &Engineering Research Council of Canada (NSERC) and the UK NaturalEnvironment Research Council (NERC). Support was also provided bythe Geological Survey of Canada (Natural Resources Canada) and by
Fig. 9. The concentrations of modern carbon (normalized to TOC) in C21, C29 and C31
n-alkanes across the Tyne estuary calculated using Δ14C (Eq. (1)) and δ13C (Eq. (2))mass balances.
247J.M.E. Ahad et al. / Marine Chemistry 126 (2011) 239–249
Author's personal copy
the School of GeoScience, University of Edinburgh. This is EarthSciences Sector contribution # 20100403.
References
Achten, C., Hofmann, T., 2009. Native polycyclic aromatic hydrocarbons (PAH) in coals –a hardly recognized source of environmental contamination. Science of the TotalEnvironment 407, 2461–2473.
Ahad, J.M.E., 2005. Evaluating the origins and transformations of organic matter anddissolved inorganic nitrogen in two contrasting North Sea estuaries. PhD Thesis,University of Edinburgh, Edinburgh.
Ahad, J.M.E., Ganeshram, R.S., Spencer, R.G.M., Uher, G., Gulliver, P., Bryant, C.L., 2006a.Evidence for anthropogenic 14C-enrichment in estuarine waters adjacent to theNorth Sea. Geophysical Research Letters 33, L08608. doi:10.1029/2006GL025991.
Ahad, J.M.E., Ganeshram, R.S., Spencer, R.G.M., Uher, G., Upstill-Goddard, R.C., Cowie,G.L., 2006b. Evaluating the sources and fate of anthropogenic dissolved inorganicnitrogen (DIN) in two contrasting North Sea estuaries. Science of the TotalEnvironment 372, 317–333.
Ahad, J.M.E., Barth, J.A.C., Ganeshram, R.S., Spencer, R.G.M., Uher, G., 2008. Controls oncarbon cycling in two contrasting temperate zone estuaries: the Tyne and Tweed,UK. Estuarine, Coastal and Shelf Science 78, 685–693.
Amijaya, H., Schwarzbauer, J., Littke, R., 2006. Organic geochemistry of the Lower Subancoal seam, South Sumatra Basin, Indonesia: palaeoecological and thermalmetamorphism implications. Organic Geochemistry 37, 261–279.
Benner, R., Benitez-Nelson, B., Kaiser, K., Amon, R.M.W., 2004. Export of youngterrigenous dissolved organic carbon from rivers to the Arctic Ocean. GeophysicalResearch Letters 31, 4.
Bi, X.H., Sheng, G.Y., Liu, X.H., Li, C., Fu, J.M., 2005. Molecular and carbon and hydrogenisotopic composition of n-alkanes in plant leaf waxes. Organic Geochemistry 36,1405–1417.
Bojesen-Koefoed, J.A., Dam, G., Nytoft, H.P., Pedersen, G.K., Petersen, H.I., 2001.Drowning of a nearshore peat-forming environment, Atane Formation (Creta-ceous) at Asuk, West Greenland: sedimentology, organic petrography andgeochemistry. Organic Geochemistry 32, 967–980.
Boot, C.S., Ettwein, V.J., Maslin, M.A., Weyhenmeyer, C.E., Pancost, R.D., 2006. A35,000 year record of terrigenous and marine lipids in Amazon Fan sediments.Organic Geochemistry 37, 208–219.
Boutton, T.W., Wong, W.W., Hachey, D.L., Lee, L.S., Cabrera, M.P., Klein, P.D., 1983.Comparison of quartz and pyrex tubes for combustion of organic samples for stablecarbon isotope analysis. Analytical Chemistry 55, 1832–1833.
Bray, E.E., Evans, E.D., 1961. Distribution of n-paraffins as a clue to recognition of sourcebeds. Geochimica et Cosmochimica Acta 22, 2–15.
Brooks, J.D., Gould, K., Smith, J.W., 1969. Isoprenoid hydrocarbons in coal andpetroleum. Nature 222, 257–259.
Canuel, E.A., Freeman, K.H., Wakeham, S.G., 1997. Isotopic compositions of lipidbiomarker compounds in estuarine plants and surface sediments. Limnology andOceanography 42, 1570–1583.
Chikaraishi, Y., Naraoka, H., 2003. Compound-specific delta D-delta C-13 analyses of n-alkanes extracted from terrestrial and aquatic plants. Phytochemistry 63, 361–371.
Clayton, C.J., Bjoroy, M., 1994. Effect of maturity on 13C/12C ratios of individualcompounds in North Sea oils. Organic Geochemistry 21, 737–750.
Das, S.K., Routh, J., Roychoudhury, A.N., 2009. Biomarker evidence of macrophyte andplankton community changes in Zeekoevlei, a shallow lake in South Africa. Journalof Paleolimnology 41, 507–521.
Deines, P., 1980. The isotopic composition of reduced organic carbon. In: Fritz, P.,Fontes, J.C. (Eds.), Handbook of Environmental Isotope Geochemistry. : TheTerrestrial Environment, 1. Elsevier, Amsterdam.
Drenzek, N.J., Montlucon, D.B., Yunker, M.B., Macdonald, R.W., Eglinton, T.I., 2007.Constraints on the origin of sedimentary organic carbon in the Beaufort Sea fromcoupled molecular 13C and 14C measurements. Marine Chemistry 103, 146–162.
Drenzek, N.J., Hughen, K.A., Montlucon, D.B., Southon, J.R., dos Santos, G.M., Druffel,E.R.M., Giosan, L., Eglinton, T.I., 2009. A new look at old carbon in active marginsediments. Geology 37, 239–242.
Durham Mining Museum. Available at http://www.dmm.org.uk.Eglinton, T.I., Eglinton, G., 2008. Molecular proxies for paleoclimatology. Earth and
Planetary Science Letters 275, 1–16.Eglinton, G., Hamilton, R.J., 1963. The distribution of n-alkanes. In: Swain, T. (Ed.),
Chemical Plant Taxonomy. Academic Press, London, pp. 187–217.Eglinton, T.I., Aluwihare, L.I., Bauer, J.E., Druffel, E.R.M., McNichol, A.P., 1996. Gas
chromatographic isolation of individual compounds from complex matrices forradiocarbon dating. Analytical Chemistry 68, 904–912.
Eglinton, T.I., BenitezNelson, B.C., Pearson, A., McNichol, A.P., Bauer, J.E., Druffel, E.R.M.,1997. Variability in radiocarbon ages of individual organic compounds frommarinesediments. Science 277, 796–799.
Eseme, E., Littke, R., Agyingi, C.M., 2006. Geochemical characterization of a Cretaceousblack shale from the Mamfe Basin, Cameroon. Petroleum Geoscience 12, 69–74.
Fabianska, M., Miotlinski, K., Kowalczyk, A., 2008. Geochemical features of re-depositedorganic matter occurring in fluvioglacial sediments in the Raciborz region(Poland): a case study. Chemical Geology 253, 151–161.
Farrington, J.W., Tripp, B.W., 1977. Hydrocarbons in Western North-Atlantic surfacesediments. Geochimica et Cosmochimica Acta 41, 1627–1641.
Ficken, K.J., Barber, K.E., Eglinton, G., 1998. Lipid biomarker, δ13C and plant macrofossilstratigraphy of a Scottish montane peat bog over the last two millennia. OrganicGeochemistry 28, 217–237.
Ficken, K.J., Li, B., Swain, D.L., Eglinton, G., 2000. An n-alkane proxy for the sedimentaryinput of submerged/floating freshwater aquatic macrophytes. Organic Geochem-istry 31, 745–749.
Galimov, E.M., 2006. Isotope organic geochemistry. Organic Geochemistry 37,1200–1262.
Griffith, D.R., Barnes, R.T., Raymond, P.A., 2009. Inputs of fossil carbon from wastewatertreatment plants to US rivers and oceans. Environmental Science & Technology 43,5647–5651.
Hale, S.E., Meynet, P., Davenport, R.J., Jones, D.M., Werner, D., 2010. Changes inpolycyclic aromatic hydrocarbon availability in River Tyne sediment followingbioremediation treatments or activated carbon amendment. Water Research 44,4529–4536.
Han, J., Calvin, M., 1969. Hydrocarbon distribution in algae and bacteria, andmicrobiological activity in sediments. Proceedings of the National Academy ofScience 64, 436–443.
Harb, F.S.D., El Nady, M.M., Basta, J.S., 2003. Oil:oil correlation for some oil fields in thenorth western part of the Western Desert, Egypt. Petroleum Science andTechnology 21, 1583–1600.
Hu, L.M., Guo, Z.G., Feng, J.L., Yang, Z.S., Fang, M., 2009. Distributions and sources of bulkorganic matter and aliphatic hydrocarbons in surface sediments of the Bohai Sea,China. Marine Chemistry 113, 197–211.
Huang, Y.S., Bol, R., Harkness, D.D., Ineson, P., Eglinton, G., 1996. Post-glacial variationsin distributions, C-13 and C-14 contents of aliphatic hydrocarbons and bulk organicmatter in three types of British acid upland soils. Organic Geochemistry 24,273–287.
Ishiwatari, R., Uzaki, M., Yamada, K., 1994. Carbon isotope composition of individual n-alkanes in recent sediments. Organic Geochemistry 21, 801–808.
Jaffe, R., Rushdi, A.I., Medeiros, P.M., Simoneit, B.R.T., 2006. Natural product biomarkersas indicators of sources and transport of sedimentary organic matter in asubtropical river. Chemosphere 64, 1870–1884.
Jeng, W.-L., 2006. Higher plant n-alkane average chain length as an indicator ofpetrogenic hydrocarbon contamination in marine sediments. Marine Chemistry102, 242–251.
Jeng, W.-L., Kao, S.J., 2002. Lipids in suspended matter from the human-disturbedLanyang River, northeastern Taiwan. Environmental Geology 43, 138–144.
Jovancicevic, B., Tasic, L., Wehner, H., Faber, E., Susic, N., Polic, P., 1997. Identification ofoil-type pollution in recent sediments. Fresenius Environmental Bulletin 6,667–673.
Kusch, S., Rethemeyer, J., Schefuβ, E., Mollenhauer, G., 2010. Controls on the age ofvascular plant biomarkers in Black Sea sediments. Geochimica et CosmochimicaActa 74, 7031–7047.
Le Dréau, Y., Jacquot, F., Doumenq, P., Guiliano, M., Bertrand, J.C., Mille, G., 1997.Hydrocarbon balance of a site which had been highly and chronically contaminatedby petroleum wastes of a refinery (from 1956 to 1992). Marine Pollution Bulletin34, 456–468.
Li, Y., Xiong, Y.Q., 2009. Identification and quantification of mixed sources of oil spillsbased on distributions and isotope profiles of long-chain n-alkanes. MarinePollution Bulletin 58, 1868–1873.
Li, Y., Xiong, Y.Q., Yang, W.Y., Xie, Y.L., Li, S.Y., Sun, Y.G., 2009. Compound-specific stablecarbon isotopic composition of petroleum hydrocarbons as a tool for tracing thesource of oil spills. Marine Pollution Bulletin 58, 114–117.
Lichtfouse, É., Eglinton, T.I., 1995. 13C and 14C evidence of pollution of a soil by fossil fueland reconstruction of the composition of the pollutant. Organic Geochemistry 23,969–973.
Matthiessen, P., Bifield, S., Jarrett, F., Kirby, M.F., Law, R.J., McMinn, W.R., Sheahan, D.A.,Thain, J.E., Whale, G.F., 1998. An assessment of sediment toxicity in the River TyneEstuary, UK by means of bioassays. Marine Environmental Research 45, 1–15.
Mazeas, L., Budzinski, H., Raymond, N., 2002. Absence of stable carbon isotopefractionation of saturated and polycyclic aromatic hydrocarbons during aerobicbacterial biodegradation. Organic Geochemistry 33, 1259–1272.
McRae, C., Snape, C.E., Fallick, A.E., 1998. Variations in the stable isotope ratios ofspecific aromatic and aliphatic hydrocarbons from coal conversion processes.Analyst 123, 1519–1523.
Nichols, J.E., Booth, R.K., Jackson, S.T., Pendall, E.G., Huang, Y.S., 2006. Paleohydrologicreconstruction based on n-alkane distributions in ombrotrophic peat. OrganicGeochemistry 37, 1505–1513.
Nishimura, M., Baker, E.W., 1986. Possible origin of n-alkanes with a remarkable even-to-odd predominance in recent marine-sediments. Geochimica et CosmochimicaActa 50, 299–305.
Nott, C.J., Xie, S.C., Avsejs, L.A., Maddy, D., Chambers, F.M., Evershed, R.P., 2000. n-Alkanedistributions in ombrotrophic mires as indicators of vegetation change related toclimatic variation. Organic Geochemistry 31, 231–235.
Odden, W., Barth, T., Talbot, M.R., 2002. Compound-specific carbon isotope analysis ofnatural and artificially generated hydrocarbons in source rocks and petroleumfluids from offshore Mid-Norway. Organic Geochemistry 33, 47–65.
Olivella, M.A., Gorchs, R., de las Heras, F.X.C., 2006. Origin and distribution ofbiomarkers in the sulphur rich Utrillas coal basin – Teruel mining district –
Spain. Organic Geochemistry 37, 1727–1735.Pearson, A., Eglinton, T.I., 2000. The origin of n-alkanes in Santa Monica Basin surface
sediment: a model based on compound-specific Δ14C and δ13C data. OrganicGeochemistry 31, 1103–1116.
Petersen, H.I., Nytoft, H.P., Ratanasthien, B., Foopatthanakamol, A., 2007. Oils fromCenozoic rift-basins in central and northern Thailand: source and thermal maturity.Journal of Petroleum Geology 30, 59–77.
Powell, T.G., McKirdy, D.M., 1973. Relationship between ratio of pristane to phytane,crude oil composition and geological environment in Australia. Nature 243, 37–39.
248 J.M.E. Ahad et al. / Marine Chemistry 126 (2011) 239–249

Author's personal copy
Poynter, J.G., Eglinton, G., 1990. Molecular composition of three sediments from hole717C: the Bengal Fan. In: Cochran, J.R., Stow, D.A.V. (Eds.), Proceedings of the OceanDrilling Program: Scientific Results, pp. 155–161.
Readman, J.W., Fillmann, G., Tolosa, I., Bartocci, J., Villeneuve, J.-P., Catinni, C., Mee, L.D.,2002. Petroleum and PAH contamination of the Black Sea. Marine Pollution Bulletin44, 48–62.
Rogers, K.M., Savard, M.M., 1999. Detection of petroleum contamination in riversediments from Quebec City region using GC-IRMS. Organic Geochemistry 30,1559–1569.
Sakata, S., Hayes, J.M., McTaggart, A.R., Evans, R.A., Leckrone, K.J., Togasaki, R.K., 1997.Carbon isotopic fractionation associated with lipid biosynthesis by a cyanobacte-rium: relevance for interpretation of biomarker records. Geochimica et Cosmochi-mica Acta 61, 5379–5389.
Scarlett, A., Galloway, T.S., Rowland, S.J., 2007. Chronic toxicity of unresolved complexmixtures (UCM) of hydrocarbons in marine sediments. Journal of Soils andSediments 7, 200–206.
Schefuβ, E., Ratmeyer, V., Stuut, J.-B.W., Jansen, J.H.F., Sinninghe Damsté, J.S., 2003.Carbon isotope analyses of n-alkanes in dust from the lower atmosphere over thecentral eastern Atlantic. Geochimica et Cosmochimica Acta 67, 1757–1767.
Slota, P.J., Jull, A.J.T., Linick, T.W., Toolin, L.J., 1987. Preparation of small samples for 14Caccelerator targets by catalytic reduction of CO2. Radiocarbon 29, 303–306.
Smittenberg, R.H., Hopmans, E.C., Schouten, S., Hayes, J.M., Eglinton, T.I., Damste, J.S.S.,2004. Compound-specific radiocarbon dating of the varved Holocene sedimentaryrecord of Saanich Inlet, Canada. Paleoceanography 19, 16.
Steinhauer, M.S., Boehm, P.D., 1992. The composition and distribution of saturated andaromatic-hydrocarbons in nearshore sediments, river sediments, and coastal peatof the Alaskan Beaufort Sea – implications for detecting anthropogenic hydrocar-bon inputs. Marine Environmental Research 33, 223–253.
Stuiver, M., Polach, H.A., 1977. Discussion: reporting of 14C data. Radiocarbon 19,355–363.
Sun, Y.G., Sheng, G.Y., Peng, P., Fu, J.M., 2000. Compound-specific stable carbon isotopeanalysis as a tool for correlating coal-sourced oils and interbedded shale-sourcedoils in coal measures: an example from Turpan basin, north-western China. OrganicGeochemistry 31, 1349–1362.
Sun, Y., Chen, Z., Xu, S., Cai, P., 2005. Stable carbon and hydrogen isotopic fractionationof individual n-alkanes accompanying biodegradation: evidence from a group ofprogressively biodegraded oils. Organic Geochemistry 36, 225–238.
Tanner, B.R., Uhle, M.E., Mora, C.I., Kelley, J.T., Schuneman, P.J., Lane, C.S., Allen, E.S.,2010. Comparison of bulk and compound-specific delta C-13 analyses anddetermination of carbon sources to salt marsh sediments using n-alkanedistributions (Maine, USA). Estuarine, Coastal and Shelf Science 86, 283–291.
Tipping, E., Smith, E.J., Bryant, C.L., Adamson, J.K., 2007. The organic carbon dynamics ofa moorland catchment in NW England. Biogeochemistry 84, 171–189.
Tolosa, I., Bayona, J.M., Albaiges, J., 1996. Aliphatic and polycyclic aromatic hydrocar-bons and sulfur/oxygen derivatives in northwestern Mediterranean sediments:
spatial and temporal variability, fluxes, and budgets. Environmental Science &Technology 30, 2495–2503.
Tolosa, I., de Mora, S., Sheikholeslami, M.R., Villeneuve, J.-P., Bartocci, J., Cattini, C., 2004.Aliphatic and aromatic hydrocarbons in coastal Caspian Sea sediments. MarinePollution Bulletin 48, 44–60.
Turner, B.R., Richardson, D., 2004. Geological controls on the sulphur content of coalseams in the Northumberland Coalfield, Northeast England. International Journal ofCoal Geology 60, 169–196.
Uchida, M., Shibata, Y., Ohkushi, K., Yoneda, M., Kawamura, K., Morita, M., 2005. Agediscrepancy between molecular biomarkers and calcareous foraminifera isolatedfrom the same horizons of Northwest Pacific sediments. Chemical Geology 218,73–89.
van Dongen, B.E., Semiletov, I., Weijers, J.W.H., Gustafsson, O.R., 2008a. Contrasting lipidbiomarker composition of terrestrial organic matter exported from across theEurasian Arctic by the five great Russian Arctic rivers. Global Biogeochemical Cycles22, 14.
van Dongen, B.E., Zencak, Z., Gustafsson, O., 2008b. Differential transport anddegradation of bulk organic carbon and specific terrestrial biomarkers in thesurface waters of a sub-arctic brackish bay mixing zone. Marine Chemistry 112,203–214.
Volkman, J.K., Holdsworth, D.G., Neill, G.P., Bavor, H.J., 1992. Identification of naturalanthropogenic and petroleum hydrocarbons in aquatic sediments. Science of theTotal Environment 112, 203–219.
Vonk, J.E., van Dongen, B.E., Gustafsson, O., 2008. Lipid biomarker investigation of theorigin and diagenetic state of sub-arctic terrestrial organic matter presentlyexported into the northern Bothnian Bay. Marine Chemistry 112, 1–10.
Vonk, J.E., van Dongen, B.E., Gustafsson, O., 2010. Selective preservation of old organiccarbon fluvially released from sub-Arctic soils. Geophysical Research Letters 37, 5.
Wang, Z., Fingas, M., Sergy, G., 1995. Chemical characterization of crude oil residuesfrom an arctic beach by GC/MS and GC/FID. Environmental Science & Technology29, 2622–2631.
Wang, X.-C., Chen, R.F., Berry, A., 2003. Sources and preservation of organic matter inPlum Island salt marsh sediments (MA, USA): long-chain n-alkanes and stablecarbon isotope compositions. Estuarine, Coastal and Shelf Science 58, 917–928.
Woodhead, R.J., Law, R.J., Matthiessen, P., 1999. Polycyclic aromatic hydrocarbons insurface sediments around England and Wales, and their possible biologicalsignificance. Marine Pollution Bulletin 38, 773–790.
Xie, S.C., Nott, C.J., Avsejs, L.A., Maddy, D., Chambers, F.M., Evershed, R.P., 2004.Molecular and isotopic stratigraphy in an ombrotrophic mire for paleoclimatereconstruction. Geochimica et Cosmochimica Acta 68, 2849–2862.
Xiong, X.Q., Geng, A.S., 2000. Carbon isotopic composition of individual n-alkanes inasphaltene pyrolysates of biodegraded crude oils from the Liaohe Basin, China.Organic Geochemistry 31, 1441–1449.
249J.M.E. Ahad et al. / Marine Chemistry 126 (2011) 239–249