
Terminal Oxidation of Long Linear Alkanes in Liquid Phase
200
Terminal Oxidation of Long Linear Alkanes in Liquid Phase By Edouard Huguet Thesis submitted to Cardiff University for the degree ofDoctor of Philosophy April 2009
-
Upload
khangminh22 -
Category
Documents
-
view
0 -
download
0
Transcript of Terminal Oxidation of Long Linear Alkanes in Liquid Phase

Terminal Oxidation of Long Linear Alkanes in Liquid Phase
By
Edouard Huguet
Thesis submitted to Cardiff University for the degree of Doctor ofPhilosophy
April 2009

UMI Number: U585341
All rights reserved
INFORMATION TO ALL USERS The quality of this reproduction is dependent upon the quality of the copy submitted.
In the unlikely event that the author did not send a complete manuscript and there are missing pages, these will be noted. Also, if material had to be removed,
a note will indicate the deletion.
Dissertation Publishing
UMI U585341Published by ProQuest LLC 2013. Copyright in the Dissertation held by the Author.
Microform Edition © ProQuest LLC.All rights reserved. This work is protected against
unauthorized copying under Title 17, United States Code.
ProQuest LLC 789 East Eisenhower Parkway
P.O. Box 1346 Ann Arbor, Ml 48106-1346

DECLARATION
This work has not previously been accepted in substance for any degree and is not concurrently submitted in candidature for any degree.
S igned ......................................... (candidate) Date
STATEMENT 1
This thesis is being submitted in partial fulfillment of the requirements for the degree o f (insert MCh, MD, MPhil, PhD etc, as appropriate)
Signed ......... ............................................ ....... (candidate) Date \3
STATEMENT 2
This thesis is the result of my own independent work/investigation, except where otherwise stated.Other sources are acknowledged by explicit references.
Signed j • (candidate) Date
STATEMENT 3
I hereby give consent for my thesis, if accepted, to be available for photocopying and for inter-library loan, and for the title and summary to be made available to outside organisations.
Signed ......................... (candidate) Date \5
STATEMENT 4: PREVIOUSLY APPROVED BAR ON ACCESS
I hereby give consent for my thesis, if accepted, to be available for photocopying and for inter-library loans after expiry of a bar on access previously approved by the Graduate Development Committee.
Signed J h& i ..................................... (candidate) Date |

ABSTRACT
The aim of this project is to investigate the terminal activation of long chain linear alkanes in
the liquid phase using the selective oxidation of w-decane to 1 -decanol as a model reaction.
Firstly the autoxidation of «-decane with oxygen was studied. The product distribution is a
mixture of Cio ketones and alcohols with shorter chain carboxylic acids. The radical
autoxidation mechanism promotes oxidation in the internal position and a very low terminal
selectivity is found in the product profile.
A range of VMgO catalysts were tested for the oxidation of w-decane with oxygen. Leached
vanadium from VMgO leads to an improvement to the conversion over the autoxidation while
the same terminal selectivity was observed.
Cobalt substituted zeolites catalysts were also investigated. The porous structure of the
different zeolites did not improve the terminal selectivity. No cobalt leaching was observed.
The silanation of the external surface of the zeolites before ion exchange with cobalt reduces
the conversion compared to the same cobalt zeolites without silanation, but does not improve
the terminal selectivity.
Finally, a comparison of the best results published in the literature for the oxidation of n-
hexane in the liquid phase has been carried out. Higher terminal selectivities for the
autoxidation were observed than those reported. Autoxidation terminal selectivities match
with the best catalysts reported in the literature.

ACKNOWLEDGEMENTS
Firstly thanks go to my academic supervisor Professor Graham Hutchings, who gave me the
opportunity for this PhD and invaluable guidance throughout the period of this investigation. I
would like to thank my second academic supervisor Dr. Jonathan Bartley, who has supervised
my work and for his availability to correct this thesis. I would like also thank my industrial
supervisors Mike Watson (Johnson Matthey), Xavier Baucherel (Johnson Matthey), Frans
Prinsloo (Sasol) and Chris Nicolaides (Sasol) whose support and help has been greatly
appreciated during all the teleconferences, face to face meeting and placement in the
company;
I also thank Professor Donald Bethel, Dr. Carley and Dr. Willock for their cooperation
and valuable support during the entire period. I would like to thank the help of Rob Jenkins
and Alun Davies for fixing everything that went wrong.
Thanks to my group, especially Peter, Sivaram, Salem, Raja, Yuan, Nishlan, Kieran, Laura,
Matt, Ferg, Jenny, Adrian, Tony, Nikos, Sankar, Nick and Dan.
Finally, I would like to thanks my family during the time of my PhD for their help and
support.
I dedicate this thesis to my Grandfather Pierre.

Contents
1. Introduction. 1
1.1. Definition of catalyst and catalytic cycle. 1
1.2. Categories of catalysis. 2
1.3. Aim of this thesis. 2
1.4. Motivation of this study. 2
1.5. Reactivity of saturated hydrocarbons. 3
1.6. Oxidations of alkanes to more valuable products. 4
1.7. Production of long linear alcohols in industry. 5
1.8. Chemical properties long linear alcohols. 6
1.9. Use of terminal long linear alcohols. 7
1.10. Catalysts used in this research. 7
1.10.1. Testing in Liquid Phase. 7
1.10.2. Different Catalysts investigated. 8
1.10.2.1. Supported vanadium oxide catalysts in heterogeneous
catalysis. 8
1.10.2.2. Zeolites. 8
1.10.2.2.1. Composition and structure. 8
1.10.2.2.2. Shape selectivity. 9
1.11. Literature review for the terminal functionalisation of linear alkanes. 10
1.11.1. Biochemical oxidation process. 10
1.11.2. Homogeneous catalysis. 11
1.11.3. Indirect methods for the selective oxidation: Two steps processes 12
1.11.4. Heterogeneous catalysis in liquid phase. 14

1.12. References. 18
2. Experimental Techniques. 22
2.1. Introduction. 22
2.2. Catalyst preparation. 22
2.2.1. Preparation of vanadium magnesium oxide catalyst. 22
2.2.2. Preparation of zeolites catalysts. 23
2.2.2.1. Method of calculation used for loading of metal by solid state ion
exchange (SSIE). 23
2.2.2.2. Preparation of cobalt ion exchange zeolites. 25
2.2.2.3. Preparation of silanated zeolites. 27
2.3. Catalysts characterisation. 27
2.3.1. X-ray powder diffraction (XRD). 27
2.3.2. Surface area method (BET) and micropore volume. 29
2.3.3. Inductively coupled plasma mass spectroscopy (ICP-MS). 30
2.3.4. Thermogravimetric analysis (TGA). 31
2.3.5. X-ray Photoelectron Spectroscopy (XPS). 32
2.4. Reactors used in the present work. 32
2.5. Purity of the reactants and radical initiators used in the present work. 34
2.6. Analysis of reactions solutions. 34
2.6.1. Gas chromatography (GC). 34
2.6.2. Internal standard. 38
2.6.3. Calculations of internal response factors of each compound and quantification of
the products after reactions.
2.7 Risk assessment 42

2.7. References. 43
3. Autoxidation of /i-decane. 44
3.1. Introduction. 44
3.2. Experimental. 45
3.3. Results. 46
3.3.1. Effect of the temperature on the autoxidation of it-decane. 46
3.3.2. Product profile at different temperature. 47
3.3.3. Analysis of the gas after reaction run. 50
3.3.4. Time on line studies for /i-decane autoxidation. 51
3.3.5. Presence of hydroperoxide in the reaction solution. 52
3.3.5.1. Introduction. 52
3.3.5.2. Method used to quantify the hydroperoxide. 52
3.3.5.3. Results. 53
3.3.6. Radical initiator. 54
3.3.6.1. Definition of a radical initiator. 54
3.3.6.2. Half lives with temperature of the radical initiator. 54
3.3.6.3. Activation of #f-decane at 80°C. 55
3.3.6.4. Time on line at 100°C. 58
3.3.7. Radical scavenger. 61
3.3.7.1. Definition. 61
3.3.7.2. 2,6-Di-tert-butyl-4-methylphenol as radical scavenger. 61
3.3.7.3. PS-tempo as radical scavenger. 62
3.3.8. Distillation and purification of /f-decane. 63
3.3.8.1. Introduction. 63

3.3.8.2. Method of purification. 63
3.3.8.3. Results. 64
3.4. Discussion. 66
3.5. Conclusion. 75
3.6. References. 76
4. Oxidation of if-decane over vanadium magnesium oxide catalysts. 78
4.1. Introduction. 79
4.2. Experimental. 79
4.2.1. Preparation of VMgO catalysts. 79
4.2.2. Characterisation of catalysts. 79
4.2.3. Catalysts testing. 79
4.3. Results. 80
4.3.1. Characterisation of VMgO catalysts. 80
4.3.1.1. BET analysis. 80
4.3.1.2. XRD Analysis. 81
4.3.1.2.1. Different phases in VMgO catalysts. 81
4.3.1.2.2. XRD patterns of VMgO catalysts. 82
4.3.2. Oxidation of w-decane at 80°C. 84
4.3.2.1. Effect of vanadium loading on the conversion of #t-decane. 84
4.3.2.2. Product profile with VMgO-70 and VMgO-60. 85
4.3.2.3. Time on line. 87
4.3.2.4. /f-decane oxidation over vanadium magnesium oxide
catalysts with a radical initiator. 88
4.3.2.5. Investigation of the role of the oxidant. 89

4.3.2.6. Test calcined and uncalcined catalysts (VMgO-70). 91
4.3.2.7. Leach test at 80 °C. 91
4.3.2.8. Recycling of VMgO-70 at 80°C. 93
4.3.3. Oxidation of #f-decane at 100°C. 93
4.3.3.1. Activity of VMgO-70. 93
4.3.3.1.1. Time on line. 94
4.3.3.1.2. Activity of VMgO-70 with a radical initiator. 95
4.3.3.1.3. Use a radical scavenger. 97
4.3.3.1.4. Recycling of VMgO catalyst. 98
4.3.3.1.5. Activity VMgO-70 precursor. 99
4.3.3.1.6. Effect of catalyst removal at different runtime. 99
4.3.3.1.7. ICP-MS of the filtrate at different runtimes. 100
4.3.3.2. Activity of a homogeneous vanadium catalyst. 101
4.3.3.2.1. Vanadium oxytriethoxide as homogeneous catalyst. 101
4.3.3.2.2. Radical scavenger with homogeneous
vanadium catalyst. 103
4.3.3.3. Comparative data. 103
4.4. Discussion. 104
4.5. Conclusion. 109
4.6. References. 110
5. Liquid phase oxidation of n -decane over zeolites catalysts. 112
5.1. Introduction. 112
5.2. Experimental. 113
5.2.1. Preparation of proton zeolites. 113

5.2.2. Preparation of cobalt zeolites. 113
5.2.3. Preparation of silanated zeolites. 114
5.3. Catalyst characterization. 114
5.3.1. X-ray diffraction. 115
5.3.1.1. Introduction. 115
5.3.1.2. Cobalt zeolites prepared by SSIE with a calcination rate
of 20°C per minute. 116
5.3.1.3. Cobalt zeolites prepared by SSIE with a calcination rate
of 3°C per minute. 125
5.3.2. Thermal gravimetric analysis (TGA). 126
5.3.3. BET and micropore volume. 127
5.3.4. Inductively coupled plasma mass spectrometry (ICPMS). 131
5.3.5. X-Ray photoelectron spectroscopy (XPS). 132
5.4. Catalysts testing. 133
5.4.1. Testing of acid zeolites. 133
5.4.2. Testing of cobalt zeolites. 135
5.4.2.1. Low loading of cobalt with a run time of 24 hours. 135
5.4.2.2. Higher loading of cobalt with a run time of 8 hours. 136
5.4.2.3. Higher loading of cobalt with a run time of 16 hours. 139
5.4.2.4. Higher loading of cobalt with a run time of 24 hours. 142
5.4.2.5. Relation between amount of cobalt and conversion. 144
5.4.3. Increase the mass of catalyst. 145
5.4.4. Use of PS-Tempo as radical scavenger with catalyst. 146
5.4.5. Use of both zeolites as catalyst. 147
5.4.6. Leaching test. 148

5.5. Discussion.
5.6. Conclusion.
5.7. References.
149
156
157
6. /i-hexane oxidation. 160
6.1. Introduction. 160
6.2. Data of the best results in the literature. 160
6.3. Experimental conditions for each study. 162
6.4. Catalysts. 165
6.4.1. Introduction. 165
6.4.2. ZSM-5 catalysts. 166
6.4.2.1. Solid state ion exchanged. 166
6.4.3. ALPO catalysts. 166
6.5. Autoxidation. 166
6.5.1. Results. 166
6.6. Catalyst testing. 174
6.7. Discussion. 177
6.8 Conclusion. 181
6.9. References. 182
7. Conclusion and future research. 183

CHAPTER 1
INTRODUCTION
1.1. Definition of catalyst and catalytic cycle.
Catalysts are substances that change the rate of a reaction without being used up during the
reaction and without itself being one of the reactants or products (in other words, without
being consumed) [1]. A catalyst does not change the thermodynamics of the reaction, but
simply provides a new and easier pathway by lowering the activation energy. A simple
catalytic cycle is described in Figure 1.1.
Reactant
Catalyst Catalyst-Reactant
Product
Figure 1.1 Simple catalytic cycle.
The reactants are bound to the catalyst during the reaction and the products are released,
regenerating the initial state of the catalyst. In theory, an ideal catalyst would not be
consumed. In practice the catalyst undergoes chemical changes and its activity becomes lower
(catalyst deactivation). A good catalyst has three virtues: activity, selectivity and lifetime.
1

1.2. Categories of catalysis.
Catalysis can be classified into two large groups: homogeneous catalysis and heterogeneous
catalysis. In homogeneous catalysis, the catalyst and reactants are in the same phase however
in heterogeneous catalysis, the catalyst and reactants are in different phases. With respect to
homogeneous catalysis, one advantage is that homogeneous catalysts exhibit a higher activity
per unit mass of metal than heterogeneous catalysts [2]. The major disadvantage for
homogeneous catalysis is that the catalyst and the product need to be separated after reaction.
The separation often involves distillation and makes catalyst recovery difficult. For
heterogeneous catalysis, the advantage is that there is little difficulty in separating and
recycling the catalyst.
1.3. Aim of this thesis.
The aim of this project is a fundamental investigation of liquid phase long linear «-alkane
terminal activation using the selective oxidation of «-decane to 1 -decanol as a model reaction
(Figure 1.2). The terminal catalytic functionalisation of long chain linear alkanes like
w-decane remains a challenging task because it is difficult to control the regioselectivity. This
project was funded and supervised by two companies, Sasol and Johnson Matthey.
3 Catalyst
OHI
,ch2
ff-decane ( C iq H22) 1- decanol (CjqH^O)
T erminal Alcohol
Figure 1.2 Objective of this thesis.
1.4. Motivation of this study.
The largest amount of saturated hydrocarbons is obtained from natural gas and petroleum [3].
Alkanes are a relatively cheap feedstock and are environmentally friendly. There is a large
2

production of alkanes in South Africa from Sasol’s Fischer Tropsch process [4]. This
abundance together with their low cost and low environmental impact makes them ideal
feedstock for conversion, in the presence of an oxidant, to valuable products. Selective
oxidation of hydrocarbons to produce oxygen-containing organic compounds, such as
alcohols, aldehydes, ketones, epoxides and acids, is of key importance for modem chemistry
processes, which is also a key goal of the work presented in this thesis. The oxygenated
products can be used as a starting point for further chemical functionalisation and can also be
used to produce many plasticizers and surfactants for detergents.
1.5. Reactivity of saturated hydrocarbons.
Alkanes are saturated and lack functional groups. There is no selective region of attack
(regioselectivity) and there is no preferred reaction site. Hydrocarbons can only undergo
reaction after cleavage of C-H or C-C bonds. The scope of primary reaction steps is
essentially limited to oxidative dehydrogenation, dehydrogenation, substitution and chain
cleavage. The terminal catalytic functionalisation of long chain linear alkanes like decane
remains a challenging task because it is difficult to control the regioselectivity which is
governed by the relative carbon hydrogen bond dissociation energies. The bond dissociation
energies decrease from 104 kcal mol' 1 to 94.6 kcal mol' 1 for the primary and secondary carbon
atoms respectively whereas the corresponding selectivities increase [5].
In tt-decane, there are 8 CH2 groups and 2 CH3 groups meaning 16 secondary hydrogens and
6 primary hydrogens (Figure 1.3), with the carbon hydrogen bond dissociation for CH3 9.6
kcal mol' 1 stronger than the carbon hydrogen bond dissociation for CH2 . This difference
explains the difficulty in selectively oxidising the terminal position of long linear alkanes.
3

Internal position will be oxygenated first along the chain resulting to a mixture of internal
alcohols and ketones.
ft-decane ( C10 H22) = 8 CH2 & 2 CH3
Figure 1.3 /t-decane.
Another problem which makes this reaction difficult in liquid phase is autoxidation, which is
the spontaneous reaction of oxygen with alkanes. The selectivity of the autoxidation is
governed by the energy of the C-H bond dissociation and favours the oxidation in the internal
positions of the linear alkanes. The autoxidation reaction will be detailed in Chapter 3 of this
thesis.
1.6. Oxidations of alkanes to more valuable products.
A large segment of the modem chemical industry is based on catalytic selective oxidation
described in Figure 1.4. More than 60 % of the chemicals and intermediates synthesized via
catalytic processes worldwide are products of oxidation [6 ].
I' "" 1 S e lec tiv e O x id a tio n c asg a T otal P ro d u c tio n
PacificBasin
Ja p a n
NorthA m erica
ProdyctiorWMiniorygna)
Figure 1.4 World organic chemical production in 1991 [6].
4

Figure 1.4 shows that the selective oxidation represents a large part in the market in 1991
over the world. 25% of the selective oxidation is performed by the use of heterogeneous
catalysts and one of the most important applications is the functionalisation of hydrocarbons.
1.7. Production of long linear alcohols in industry.
The most important industrial routes to produce terminal linear alcohols are the Ziegler
chemistry and the “oxo” process [7-8]. The Ziegler chemistry (Figure 1.5) is a five step
process: hydrogenation, ethylation, growth reaction, oxidation and hydrolysis. The starting
material is ethylene.
A1(C2H5) 3 + (x+y+z) C2H4
Triethylalumininum Ethylene
(CH2CH2)xCH2CH3
(CH2CH2)vCH2CH3
(CH2CH2)zCH2CH3
Growth Product
Oxidation
(CH2CH2)xCH2CH3
(CH2CH2)vCH2CH3
(CH2CH2)zCH2CH3
Growth Product
0(CH2CH2)xCH2CH3
0(CH2CH2)yCH2CH3
0(CH2CH2)zCH2CH3
Aluminum Alkoxide
0(CH2CH2)xCH2CH3
0(CH2CH2)yCH2CH3
0(CH2CH2)xCH2CH3
3 H20
CH3-CH2-(CH2CH2)xOHCH3-CH2-(CH2CH2)yOHCH3-CH2-(CH2CH2)zOH
linear Primary Alcohols
+ Al(OH) 3
AluminiumHydroxide
Figure 1.5 The basis of this Ziegler technology.
A120 3 is not recycled during the reaction so it is not a catalytic process.
5

The second industrial route is the hydroformylation or the so called “oxo” process (Figure
1.6). It is a heterogeneous catalytic process. A terminal olefin reacts with carbon monoxide
and hydrogen to produce the linear terminal alcohols [8 -1 1 ].
* R-CH2-CH2-CHOr - c h = c h 2 + CO + h 2
R-CH2-CH2-CHO + h 2 R-CH2-CH2-CH2-OH
Figure 1.6 The oxo-process.
The Ziegler process and the “oxo” process are multi step reactions and do not use linear
alkanes as feed, so to find a way to execute the hydroxylation at the end of the long linear
hydrocarbons heterogeneously with oxygen or air as oxidant will be more economic and a
cleaner process for industry.
1.8. Chemical properties long linear alcohols.
The industrial importance of long linear alcohols is based on the large number of reactions the
hydroxyl group may undergo (Figure 1.7 [8]).
Terminal Linear alcohol + Oxygen -> Aldehyde + carboxylic acid+ Alakali Melt —> carboxylic acid+ Alkali — ► Dimeric Alcohol+ Proton — ► Ether, Olefin+ Alkyne -► Vinyl Ether+ Carboxylic acid — > Ester+ Hydrogen Halide —► Alkyl Halide+ Ammonia/ Amine — ► Amine+ Aldehyde/ Ketone -► Acetal+ Sulfide — ► Thiol+ Alcoholate/H2S — ► Xanthate+ Metal — ► Metal alkoxide+ Ethylenoxide Ethoxilates/Ethersulfates
Figure 1.7 Lists of some typical examples of reactions can undergo terminal alcohol [8].
6

Many of the resulting derivatives are intermediates of commercial importance.
1.9. Use of terminal long linear alcohols.
Linear primary alcohols are used in the composition of plastics and cement, where they
increase the fluidity of the material. They are also widely used in the composition of
detergents [12-13]. Linear primary alcohols are amphiphiles, one part is polar (hydroxyl
group) and one part is apolar (alkane chain). The amphiphiles molecules can be used as
surfactants. These molecules have limited solubility in any solvent and will aggregate at the
interface between two phases to form micelles. Micelle can dissolved an organic compound
like grease in water, which would normally be insoluble. This property is the mechanism of
all the detergents.
1.10. Catalysts used in this research.
1.10.1. Testing in Liquid phase.
All the catalysts presented in this work have been tested in the liquid phase. Three phase
reactions between gaseous (oxygen) and liquid («-decane) and solid catalysts are often
encountered in industrial chemistry [15].
Advantages of the liquid phase process:
• Lower reaction temperatures than gas phases processes.
• Liquid-phase reactions generally give higher time -yields than gas phase process.
Disadvantages of the liquid-phase processes are:
• Separation and purification of the products is laborious.
• The intensive mixing of the compounds requires mechanically stable catalysts.
7

1.10.2. Different Catalysts investigated.
1.10.2.1. Supported vanadium oxide catalysts in heterogeneous catalysis.
The current level of the annual production of vanadium in the world is 38,000 tonnes. About
80%, of the vanadium produced is used as steel additive, as it makes steel shock and vibration
resistant [16]. The most dominant non-metallurgical use of vanadium is in catalysis, which
represents about 5% of the annual production of vanadium. It is the most widely used metal
oxide catalyst [17-20]. Some of the reactions catalyzed by vanadium oxides with alkanes are
shown in Table 1.1.
Table 1.1 Reaction of alkanes with vanadium based catalyst.
Catalytic reaction with alkanes References.
Selective oxidation of alkanes and alkenes [2 1 -2 2 ]
Selective oxidation of alkanes with peroxides [24]
Oxidative dehydrogenation of alkanes [25]
Partial oxidation of methane to formaldehyde [26-27]
Direct conversion of methane to aromatics [28]
There is no literature reported on the heterogeneous oxidation of long linear alkanes over
VMgO catalyst in liquid phase. Chapter 4 discusses the results of w-decane oxidation using
O2 over different VMgO catalysts in the liquid phase.
1.10.2.2. Zeolites.
1.10.2.2.1. Composition and structure.
Zeolites are microporous solid catalysts (Figure 1.8 [29]). They contain silicon, aluminium,
oxygen and cations in their framework. Silicon atoms and aluminium atoms are linked to four

oxygens atoms to form a tetrahedral (SiC>4 and AIO'4). These tetrahedres are linked together
by their comers to form the negative frameworks of the zeolites. The negative charges are
balanced with a mobile cation (NH4 + or Na+) to keep the framework neutral. These cations
^ 1 0 -4-
can be exchanged by oxidation centre as Co or Mn .133 different frameworks of zeolites
with different size of pores and different shape of channels are listed in the Atlas of zeolites
[30].
Figure 1.8 Model of catalytic reaction with zeolites [29].
1.10.2.2.2. Shape selectivity.
The structure of channels o f the zeolites is predetermined by the composition and type of the
zeolites. The accessibility of the pores for molecules is subject to definite geometric
restrictions. The shape selectivity of the zeolites is based on the interaction o f reactants with
the pore system. Only starting materials of a certain size and shape can penetrate into the
interior of the zeolites pores and undergoes reaction with the catalytic actives sites present in
the channel [31-32]. For the geometries constraints, three variants can overlap.
• Reactant selectivity occurs when some of the molecules in a reactant mixture are too
large to diffuse through the catalyst pores.
• Product selectivity. Bulky products can not diffuse out o f the pores.
9

• Restricted transition state selectivity. When there are multiple pathways in a reaction,
but one or more are suppressed because the transition state would require more space
than is available in the cavities or pores.
Table 1.2 compares the pore apertures of the zeolites used in this work with the kinetic
molecular diameters of some starting materials. Molecules are not rigid and the kinetic
diameter gives only a rough estimation of the molecular size.
Table 1.2 Pores apertures of zeolites and kinetics molecular diameter of n - hexane,
xylene and cyclohexane.
Molecule Kinetic diameter (nm) Zeolites pores size (nm)w-hexane 0.49 ZSM-5 (0.54)Xylene 0.57 Mordenite (0.67)
Cyclohexane 0.62 Y-Zeolites (0.74)
With these data, a preliminary choice of suitable zeolites for a particular starting material can
be made. Mordenite, Y-zeolites and ZSM-5 were investigated for the oxidation of «-decane in
liquid phase. The results are in Chapter 5.
1.11. Literature review for the terminal functionalisation of linear alkanes.
Most of the literature on alkane activation focuses on short chain linear alkanes ranging from
methane to butane or cyclic hydrocarbons (cyclohexane). Different catalytic approaches for
terminal functionalisation of long linear alkanes are presented in the following sections.
1.11.1. Biochemical oxidation process.
An enzyme is a protein, which has catalytic activity and is specific for its substrate. Enzymes
can oxidise the terminal group of linear alkane with oxygen [33]. These enzymes are the
mono-oxygenase class. The catalytic active metal centre of the mono-oxygenase (Fe) is
surrounded by a large protein structure, which controls the approach of the substrate to the
10
oxidation centre. These enzymes are very selective and they oxidise only at the terminal
position is observed. The problems associated with these biological oxidation processes are
the low rates of reactions, the high dilution of the feed, which will give the product recovery
difficult, the use of a co-oxidant (NADH), which is essential for the catalatityc activity of the
enzyme and storage. All these constraints limit their use for the industrial production of
terminal hydroxylated alkanes.
1.11.2. Homogeneous catalysis.
Homogeneous catalysts can hydroxylate the terminal position in alkanes. The first example of
a homogeneous catalyst is the metallophophyrin class of compounds [34]. They were
modelled on enzymatic mono-oxygenase with the metal centrally located in the porphyrin
macrocycle. Ligands around the active metal provide a selective route for the alkane to access
to oxidation centre, which is responsible for the selectivity. The metallophophyrin complex
use sacrificial oxidants such as iodosylbenzene. The primary selectivity using the
metallophophyrins for the activation of hydrocarbons is generally low, for example with
«-decane, 82% of the yield is mostly internal alcohols with only 18% of terminal selectivity.
^-Octane can be efficiently oxidized by hydrogen peroxide in acetonitrile using
tetra-«-butylammonium salts of vanadium-containing polyphosphomolybdates
[PM01 1VO40]4 and [PMogV5O39]12— as catalysts. The terminal selectivity is 8.2 % and 92%
of the product distribution is internal alcohols and ketones [35].
The disadvantages of these homogeneous catalysts are the difficult separation of the products,
the poor selectivity to a single oxygenated product (side reactions), organic ligands are often
unstable under oxidation conditions and very expensive, the use of sacrificial oxidant and the
11

use of a solvent. These homogeneous catalysts are also very difficult to recycle (quick
deactivation after catalytic cycles) and have a very low turnover. All these process are still far
from industrial utilization.
1.11.3. Indirect methods for the selective oxidation: Two steps processes.
Long chain alkanes can be converted to functionalised compounds via a two-step process. A
two step process can be a disadvantage as it will be more expensive but it can be more
regioselective than the direct oxidation and so will pay off the extra cost of this process.
Different strategies have been identified:
Terminal Dehydrogenation: This produces a terminal alkene and subsequent hydration of
this alkene gives the terminal alcohol.
VMgO has been reported as heterogeneous catalysts for the dehydrogenation of «-hexane in
gas phase [36]. The conversion is 5% with less than 2 % of terminal selectivity. Then a
hydroxylaton of ^-terminal alkene is needed. The most widely used methodology is a two
steps organic process. To obtain a terminal alcohol the first step is a regioselective
hydroboration with sodium perborate followed by oxidation over H2O2/ NaOH. Addition of
water with one equivalent of sulphuric acid obeys Markovnikov’s rule and will gives a
secondary alcohol (undesired product).
The major problems of this multi steps process are the low conversion, low selectivity to the
terminal alkene and also the high cracking for the first step.
Boronation [37]: Terminal functionalisation of linear alkanes with boron and deprotection of
this terminal organoboron compound by H2O2 to obtain the terminal alcohol. This is a
homogeneous process which leads to the formation of a single, terminal functionalization
product from linear alkanes using a transition metal-catalyst.
12

Bis(pinacolato)-diborane (B2pin2) or pinacolborane (HBpin) react with w-octane on Rh
complexes Cp*Rh(rt4-C6Me6) (Cp* = CsMes; Me = methyl) to give high-yields (65%) of
linear alkylboranes under thermal conditions (150°C). These reactions allow regiospecific
functionalization of alkanes under thermal conditions. The organoborane products (R-Bpin)
are intermediates that can serve as precursors to terminal alcohols. The boron at the end of the
alkane can be deprotected by hydrogen peroxide and be easily converted to a terminal alcohol
with a yield greater than 85 %.
This method is very selective with very good yield for each step but B2pin2 is very expensive
(£ 38.00 per g) and a large excess of catalyst would be needed to obtain a good yield and
selectivity so this is a very expensive process. Moreover this method is very slow 110 h to
obtain a yield of 64 % with 100 % selectivity to terminally activated alkanes.
Ammoxidation [38]: This process is particularly attractive and as it leads to a terminal
functionalisation of the alkane. Once the terminal functionalisation has been achieved the
nitrile group can be oxidised to give the primary alcohol.
The ammoxidation of alkanes is a good way to obtain terminal selectivity. The only way to
create a triple bond with an alkane is at the terminal position. The catalyst used is antimony-
vanadium phosphorous oxide/alumina (Sb-VP0 /Al2 0 3 ). For «-hexane (425°C), the
conversion is 15% with the selectivity of 30 % to the monosubstitued (hexanenitirle) and 40%
to the disubstitued (adiponitrile). Takahashi [39] have shown a catalytic method for the
reduction of the nitrile to the corresponding alcohol in one step. They report the reduction of
nitriles with 2-propanol over hydrous zirconium oxide at 300°C in the vapour phase. The
reaction was carried out in a glass flow reactor with a fixed-bed catalyst and a flow of
13

nitrogen. The reduction of aliphatic nitriles proceeded efficiently to give the corresponding
alcohols (Table 1.3).
Table 1.3 The reduction of nitriles with 2-propanol over hydrous zirconium at 300°C.
Nitrile Conversion (%) Selectivity (%) Terminal alcohol.
98 73%
89 78%
58 52%
The conversion and the yield were lowered by increasing carbon chain lengths but 58 % of
conversion with 52 % of selectivity was obtained for the undecane.
This multi step process is very interesting; the two steps are carried out by heterogeneous
catalysts and very high selectivity for each step. The only disadvantage can be the cracking of
the products and the use of ammonia for the first step (ammoxidation).
1.11.4. Heterogeneous catalysis in liquid phase.
Heterogeneous catalysts will be the most simple and economic methods for making terminal
linear alcohols directly from hydrocarbons with air or oxygen as oxidant. The heterogeneous
system was favoured by the industrial sponsor of this project.
Oxidation of w-octane in liquid phase was carried out by Singh [40]. The oxidation of
«-octane are catalysed by chromium silicate-1 (CrS-1) using tert-butyl hydroperoxide (alkane
/TBHP mole ratio 3) as oxidant.
14

Table 1.4 Results for /f-octane oxidation over CrS-1 and VS-1.
Catalyst Conversion (%) Total Terminal Selectivity (%)
CrS-1 7.7 9.4VS-1 8.7 7.3
The terminal selectivity is low and the ratio of alkane/TBHP used in this process is not
economic.
Liquid phase oxidation of «-decane using alkyl hydroperoxide as the oxygen donor in
presence of supported palladium catalysts [41] is also reported. The ratio of w-decane/TBHP
is 0.6 in this process for 13.6% conversion with 56.6% and 12.9% selectivity to decanones
and decanols, respectively. No detailed data for the terminal selectivity are shown.
Thomas [42-48] has reported best results of the literature for the heterogeneous terminal
oxidation of H-hexane in liquid phase. His results are presented in (Table 1.5). The terminal
selectivity is extremely high compared to the previous work [40] with air as oxidant, which is
a very economically favourable process.
Table 1.5 Thomas’s results for the oxidation of it-hexane with A1PO catalyst.
Catalyst Conversion (%) Total Terminal Selectivity (%)
Co-AlPO-5 2.4 8 . 6
Co-AlPO-5 7.2 61.3Co-AlPO-18 8.7 65.5
A very high terminal selectivity of 65.5 % is obtained with a majority of terminal acid in the
product distribution. No autoxidation results are presented in this study. These results are
unprecedented. Iglesia [48] tried to reproduce Thomas’s data with the same catalyst for the
15

oxidation of «-hexane using very close experimental conditions. The data is reported in Table
1.6.
Table 1.6 Iglesia’s results for oxidation of «-hexane with A1PO catalysts.
Catalyst Conversion (%) Total Terminal Selectivity(%)
Mn-AlPO-5 0.02-0.05 7Mn-AlPO-18
Very low conversion with very low terminal selectivity was found. The main conclusion of
Iglesia is that Mn-AlPO-18 did not lead to any preference for terminal oxidation of w-hexane
in contradiction with Thomas’s results. After this difference between the results of Thomas
and Iglesia, it is difficult to believe in Thomas’s results, but maybe Iglesia can not prepare the
right catalyst and some difference in experimental conditions use by Iglesia are present. These
differences are well detailed in Chapter 6.
The second best results for the terminal oxidation of «-hexane in liquid phase has been
published by Iglesia [50]. These results are presented in Table 1.7.
Table 1.7 Iglesia’s results for oxidation of /f-hexane with Mn-ZSM-5 catalysts
Time(hours)
Conversion(%)
Terminal selectivity (%) with Mn-ZSM-5
Terminal selectivity (%) Autoxidation
0.5 0.007 24 7
2.5 0.013 18 8
4 0.047 15 8
70 .1 1 0 7
16

Fisrtly compared to Thomas’s results with A1PO catalysts, there is a huge difference between
the conversion and terminal selectivity with the same substrate (w-hexane) in liquid phase.
Iglesia is showing data for the autoxidation reaction and demonstrate a clear difference in
terminal selectivity with a catalyst present, while conversion is unaffected. In the case of a
catalyst (Mn-ZSM-5) being present, the terminal selectivity is initially high (>20 %), but this
declines as the conversion increases (-10% terminal selectivity when conversion is 0.1 %). In
contrast the autoxidation has a steady terminal selectivity of around 8 % throughout the
conversion range tested. Two points are also not clear in these results, the autoxidation and
the reaction with Mn-ZSM-5 have the conversion for the same time and the stable terminal
selectivity of the autoxidation compared to the terminal selectivity for the catalyst, which
decrease versus conversion. A detailed comparative study will be presented in Chapter 6 .
17

1.12. References.
[1] The Basis and Application of Heterogeneous Catalysis, M. Bowker, Oxford Chemistry,
Primers, Oxford Science Publications, (1998).
[2] Industrial Catalysis, J. Hagen, Wiley-VCH, (2006).
[3] Selective Oxidation by Heterogeneous Catalysis, G. Centi, F. Cavani, F. Trifiro,
Academic, Plenum, (2001).
[4] M.E. Dry, Catalysis Today 71, (2002), 227.
[5] J.A. Kerr, Bond Dissociation Energies by Kinetic Methods, Chemical Reviews 6 6 , (1966),
465.
[6 ] S.T. Oyama, A.N. Desikan, J.W. Hightower, Catalytic Selective Oxidation, Symposium
Series 523, ACS, Washington DC, Chapter 1, (1993), 1.
[7] T. Mole, E.A. Jeffery, Organoaluminium Compounds, Elsevier, Amsterdam (1972).
[8 ] All about the Fatty Alcohols, Condea, (2000).
[9] Several New Surfactants, R. B. S. Georgeville, Quebec, Canada, (2004).
[10] Produkte aus der Oxosynthese, Ruhrchemie AG, Frankfurt (1969).
[11] J. Falbe, Synthesen mit Kohlenmonoxid, Springer-Verlag, Berlin (1967).
[12] H.J. Richter, J. Knaut, Journal of the American Oil Chemists’ Society, 61, (1984), 160.
[13] J. Knaut, H.J. Richtler, Journal of the American Oil Chemists’ Society, 62, (1985), 317.
[14] Introduction to Modem Colloid Science, R.J. Hunter, Oxford Science Publications,
(1993).
[15] Industrial Catalysis, J. Hagen, Willey-VCH, (2005).
[16] B.M. Weckhuysen, D.E. Keller, Catalysis Today, 78, (2003), 25.
[17] F. Trifiro, B. Grzybowska, Applied Catalysis A: General, 157, (1997).
[18] G.C. Bond, S.F. Tahir, Applied Catalysis A: General, 71, (1991), 1.
[19] G. Deo, I.E. Wachs, J. Haber, Critical Reviews in Surface Chemistry, 4, (1994), 141.
18

[20] G. Ertl, H. Knozinger, J. Weitkamp, Handbook of Heterogeneous Catalysis, Wiley-
VCH, Weinheim, (1997).
[21] J.M. Lopez Nieto, P. Concepcion, A. Dejoz, H. Knozinger, F. Melo, M.I. Vazquez,
Journal of Catalysis, 189, (2000), 147.
[22] K. Wada, H. Yamada, E. Watanabe, T. Mitsudo, Journal of the Chemistry Society,
Faraday Transactions 94, (1998), 1771.
[23] P. Rao, A.V. Ramaswamy, Journal Chemistry Society, Chemistry of the Communication,
(1992), 1245.
[24] A. Khodakov, B. Olthof, A.T. Bell, E. Iglesia, Journal of Catalysis, 181, (1999), 205.
[25] K. Chen, A. Khodakov, J. Yang, A.T. Bell, E. Iglesia, Journal of Catalysis 186, (1999),
325.
[26] M.A. Banares, L.J. Alemany, M.L. Granados, M. Faraldos, J.L.G. Fierro, Catalysis
Today 33, (1997), 73.
[27] A. Parmaliana, F. Fursteri, A. Mezzapica, M.S. Scurrell, N.Giordano, Journal of the
Chemistry Society 9, (1993), 751.
[28] B.M. Weckhuysen, D. Wang, M.P. Rosynek, J.H. Lunsford, Journal of Catalysis, 175,
(1998), 347.
[29] Web: database of zeolites.
[30] C. Baerlocher, W.M. Meier, D. Holson, Atlas of Zeolite Framework Types. Amsterdam:
Elsevier, (2001).
[31] J. Dwyer, Chemistry and Industry 7, (1984), 258.
[32] S.M. Csicsery, Zeolites 4, (1984), 202.
[33] M. Baik, M. Newcomb, R.A. Friesner, S.J. Lippard, Chemical Reviews 6 , 103, (2003),
2385.
19

[34] G. Suss-Fink, L. Gonzalez, G.B. Shul’pin, Applied Catalysis A: General, 217, (2001),
111 .
[35] B.R. Cook, T.J. Reinert, K.S. Suslick, Journal of the American Chemical Society, 108,
(1986), 7281.
[36] H.B. Friedrich, N. Govender, M.R. Mathebula, Applied Catalysis A: General 297,
(2006), 81.
[37] H.Y. Chen, S. Schlecht, T.C. Semple, J.F. Hartwig, Science 287, (2000), 1995.
[38] B.M. Reddy, B. Manohar, Journal of Chemical Society 3, (1993), 330.
[39] K. Takahashi, M. Shibagaki, H. Matsushita, Chemical Letters 1, (1990), 311.
[40] A.P. Singh, T. Selvam, Journal of Molecular Catalysis A: Chemical, 113, (1996), 489.
[41] Deshpande, R. Madhukar, Rane, V. Hari, R. Vitthal, U.S. Patent No. 976737, (2006).
[42] J.M.Thomas, R. Raja, G. Sankar, R.G. Bell, Nature, (1999), 227.
[43] R. Raja, J.M. Thomas, Chemistry Communication, 17, (1998), 1841.
[44] R. Raja, G. Sankar, J.M. Thomas, Journal of the American Chemistry Society, 121,
(1999), 119.
[45] J.M. Thomas, R. Raja, G. Sankar, R.G. Bell, Studies in Surface Science and Catalysis,
130, (2000), 887.
[46] R. Raja, G. Sankar, J.M. Thomas, Angewandte Chemistry International Edition, 39,
(2 0 0 0 ), 231.
[47] J.M.Thomas, R. Raja, G. Sankar, R.G. Bell, Accounts Chemical Research, 34, (2001),
191.
[48] R. Raja, J.M. Thomas, Journal of Molecular Catalysis A, 3, (2002), 181.
[49] B. Moden, B. Zhan, J. Dakka, J.G. Santiesteban, E. Iglesia, Journal of Physical
Chemistry C, 111, (2007), 1402.
20
[50] B. Zhan, B. Moden, J. Dakka, J.G. Santiesteban, E. Iglesia, Journal of Catalysis 2, 245,
(2007), 316.
21

Chapter two
Experimental Techniques
2.1. Introduction.
This chapter describes in detail the catalyst preparation, the basic principles of
characterisation techniques used to examine the catalyst, the experimental conditions used for
catalysts testing with a description of the reactor and finally the methods to analyse and
quantify the products after reaction.
2.2. Catalyst preparation.
2.2.1. Preparation of vanadium magnesium oxide catalyst.
Various VMgO catalysts were prepared via an impregnation method [1-2] with varying
vanadium loadings.
Table 2.1 Reagents for the preparation of a VMgO catalyst.
Reagent Molar mass (g.mol-1) Supplier Purity
MgO 40.29 Fisher scientific 98%
NH4VO3 116.98 Aldrich 99%
NH4OH 35.05 Aldrich 25% (in solution)
MgO forms MgCOs when exposed to CO2 in the atmosphere so it was calcined at 350°C for
12h in air to remove any carbonates and thus obtain only MgO. 10 ml of 25% (v/v) NH4OH
solution was added to 850 ml of deionised water (pH=12). VMgO catalysts were prepared by
22

dissolving appropriate amounts of NH4VO3 (Table 2.2) in this aqueous solution and were
heated to 70°C until all the NH4VO3 dissolved. MgO (6.7g) was added to the solution while
stirring and the suspension that was obtained was evaporated until it formed slurry. The slurry
was placed in an oven set at 110 °C for 2 h. The resulting solid was crushed and calcined for 6
h at 550 °C in air. Nine different vanadium-loaded VMgO catalysts were prepared with this
method (Table 2.2)
Table 2.2 Summary of the VMgO catalysts prepared by impregnation.
Catalyst name Theoretical mass percentage loadings, (wt % V 2 O 5 )
Amounts of N H 4 V O 3
(g)VMgO-O (blank) 0 0 . 0 0
VMgO-1 1 0.09VMgO-5 5 0.45
VMgO-10 1 0 0.95VMgO-20 2 0 2.14VMgO-33 33 4.31VMgO-5 0 50 8.56VMgO-60 60 12.84VMgO-70 70 19.97
2.2.2. Preparation of zeolites catalysts.
2.2.2.1. Method of calculation used for loading of metal by solid state ion exchange
(SSIE).
The following detailed calculation [3] before preparation allows the incorporate different
amount of Co2+ in the zeolites. The zeolites used in this work were manufactured by the
company Zeolyst International [4]. Each zeolite is given with (SiC^/AkC^) mole ratio. An
example of calculation is detailed below:
H-ZSM-5 with a ratio (Si0 2 /Al2 0 3 )= 30
(30 Si02/ AI2O3) * (AI2O3 /2A1) * (Si/ Si02) = (30 Si / 2A1) =30.
Si / A1 =15
23

The framework unit of the zeolites is [SiAlO'4]. It is assumed to be in Si02/A102' for the
calculation.
Si02/A102'=15
15 mol Si02 + 1 mol A102'
M Si02 = 60 g. mol' 1
M A102' = 59 g.mol' 1
1 mol of zeolites= 15*60 + 59 = 959 g.mol ’*
Weight (%) A102-=59/959 * 100 = 6.152
lOg of zeolites was exchanged.
lOg * 0.06152= 0.6152 g of A102'
0.6152 g of A102- * {27g (Al)/ (59g of A102')} =0.28 g A1
M Al=27 g.mol''
0.28 / 27=0.0103 mol Al for lOg of zeolites.
1 mol Al = V2 mol Co (charge balance for framework)
1 mol Co2+ for 1 mol Al => (use for the solid state ion exchange)
M CoC12 .6H20= 237.93 g.mol' 1
1 mol CoC12 .6H20 -> 1 mol Co2+ + 2 mol Cl' + 6 mol H20.
So need 0.0103 mol of Co2+
0.0103 mol * 237.93 = 2.45 g of CoC12 .6H20
Table 2.3 shows the mass of CoC12 .6H20 used at the beginning of the preparation for the
different Cobalt-zeolites prepared by solid state ion exchanged using the calculation above.
24

Table 2.3 Mass of C0 CI2.6 H2O used for each catalyst.
Zeolites Si02/Al20 3
Mole ratioCobalt loading for 1
AlMass of CoC12 .6H20
(g)Modemite 2 0 1 3.61Y-zeolites 80 1 0.97
ZSM-5 280 1 0.281ZSM-5 80 1 0.97ZSM-5 30 0 . 1 0.245ZSM-5 30 0 . 2 0.49ZSM-5 30 1 2.45ZSM-5 30 2 4.9ZSM-5 23 0 . 1 0.318ZSM-5 23 0 . 2 0.636ZSM-5 23 1 3.18ZSM-5 23 2 6.36
2.2.2.2. Preparation of cobalt ion exchange zeolites.
The zeolites was initially heated to 500°C for 3 h in air to remove organic templates used
during the synthesis of the zeolites and to obtain the proton form of the zeolites.The Solid
State Ion Exchange (SSIE) [5] was carried out by grinding the zeolites (lOg) together with
different mass of C0 CI2 .6 H2O (Table 2.3) for 5 minutes to obtain a pink homogeneous
physical mixture.
Table 2.4 Reagents for the preparation of a Co-zeolites.
Reagent Molar mass (g.mol'1) Supplier Purity
Zeolites - ZeolystInternational
Cobalt(II) chloride hexahydrate CoC12 .6H20 237.93 Aldrich >99%
25

A quartz tube was used to pack the crude Cobalt-zeolites mixture as described in Figure 2.1.
Glass Wool
n 2 ----------► .f AL
:arborundum Crude Mixture cobalt zeolites
Figure 2.1 Packing of cobalt-zeolites mixture in quartz tube.
Before heating the mixture was flushed with a stream of nitrogen for 3 hours and then heated
in inert gas stream nitrogen to remove volatile products such HC1 for 3 hours at 500°C and
left to cool down slowly at room temperature. A blue powder was obtained. The blue colour is
the proof that Co is bonded to Al otherwise a grey colour is observed [3].The catalyst was
washed slowly (Figure 2.2) with deionised water without vacuum to remove unreacted cobalt
and remove chloride ions.
Deionisedwater
Glass microfibre filter
Filtrate
Figure 2.2 Set up for the washing process.
26

At the start of the washing a slightly pink colour was obtained and a test with silver nitrate
(AgNC>3) has showed a cloudiness as a white precipitate (AgCl) is formed. This test was
repeated until no precipitate was observed. Up to 15 days washing was required to remove all
the chloride and prevent the leaching of cobalt during the testing of the catalyst in liquid
phase. After the intense washing, zeolites were dried in air at room temperature.
2.2.2.3. Preparation of silanated zeolites.
Silanated zeolites were prepared following the method described by Iglesia and co-workers
[6 ]. The modified zeolites were prepared by immersing zeolites (9.6 g) into an ethanol
solution (100ml) containing 3-aminopropyl triethoxylsilane (H2N(CH2)3Si(OC2H5)3) (1.46 g)
and subsequently evaporating the ethanol solvent at 333-393K. The sample was then treated
at 823 K for 16 h in dry air in order to decompose the organosilane precursors and to form the
silanated H-ZSM5.
Table 2.5 Reagents for the preparation of a Co-zeolites.
Reagent Molar mass (g.mol-1) Supplier Purity
Zeolites - ZeolystInternational
3-aminopropyl triethoxylsilane 221.37 Aldrich 99%
2.3. Catalysts characterisation.
2.3.1. X-ray powder diffraction (XRD).
X-ray powder diffraction (XRD) is a common method of determining the structure of a
material. To produce a powder XRD pattern, the sample must be crystalline and have long
range order. Bombarding a suitable target with electrons produces the X-rays. When the
electrons hit the target, they excite electrons which return to their normal state shell with a
consequent emission of X-rays [7]. The three-dimensional structure of crystalline materials
can be defined as regular repeating planes of atoms that form a crystal lattice (Figure 2.3).
27

When a focused X-ray beam interacts with these planes of atoms, part of it will be diffracted.
The diffracted X-rays will interfere constructively with and give a diffraction line for a
particular angle of incidence if the Bragg's law is satisfied. The wavelengths of the X-rays
produced by the powdered sample and diffracted by the analyzer crystal obey the Bragg
equation. The Bragg Law links the d-spacings on the powdered sample to the angle of
incident of the X-rays on the sample (Figure 2.3).
Crystal atoms
rik = 2 dsin0
0 = angle between the crystal plane and the diffracted beam.
X = wavelength of incident X-rays beam.
d = spacings between atomic layers in the powdered sample.
n = integer.
Figure 2.3 Bragg’s Law of diffraction.
The data obtained shows a series of lines of varying intensities at different 20 values, obtained
as the analyser crystal turns. A qualitative analysis of the sample is thus carried out.
28

DetectorSample y / / / / ,
Primary Collimator IT Secondary \ Collimator
X-ray tubeGoniometei
Analyser crystal
Figure 2.4 Schematic of an X-ray diffractometer.
The catalyst was ground up into a fine powder and then was placed on to a metal disc. It was
placed on to the rotating stage. XRD analysis was performed using a PW 3040/60
Pananalytical Xpert Pro diffraction system with a monochromatic Cu K«i source operated at
40 keV and 30 mA.
2.3.2. Surface area method (BET) and micropore volume.
Surface area measurement is widely used to characterize porous materials. Surface area
frequently plays a significant role in the reactivity of catalysts [8 ]. For example, for a catalyst,
the greater the amount of surface available to the reacting gas or liquid the better is the
conversion to products. BET is a rule to calculate the number of adsorbed gas molecules to
form a monolayer on the surface. This rule is used to determine the surface area of a material
at cryogenic temperatures (liquid nitrogen -196°C). The concept of BET theory is based on
the following hypotheses: gas molecules physically adsorb on a solid in layers infinitely; there
is no interaction between each adsorption layer and the Langmuir theory can be used for each
layer. The Langmuir theory relates the coverage or adsorption of molecules on a solid surface
29

to a gas pressure at a fixed temperature. Based on the BET method, the specific surface area
of a solid was calculated electronically using the BET equation [9].
P/[V(P0-P)] = 1/ (VmC) + (C-l)/(VmC) * P/ P0
where P= pressure
Po= saturation pressure of the gas
V= adsorbed gas quantify
Vm=volume of gas to form a monolayer adsorbed gas.
C=constant
The volumes of pores were determined using the BJH method, which depends on an increase
in pressure causing an increase of the thickness of the layer adsorbed on the pore walls [1 0 ].
Powder samples were analysed using the Quantachrome Autosorb-1. It is a fully automated
analyzer for surface area and pore size measurements. Before performing a surface area
analysis or pore size measurement, solid surfaces must be free from contaminants such as
water. Surface cleaning (degassing) is carried out by placing the catalyst (O.lg) in a glass cell
(12 mm diameter) and heating it under helium overnight at 300°C. Once clean, the sample
inside the glass cell is brought to a constant temperature using a dewar containing liquid
nitrogen. Then, small amounts of a gas (N2) are admitted in steps into the evacuated sample
chamber.
2.3.3. Inductively coupled plasma mass spectroscopy (ICP-MS).
The analysis by ICP-MS of a sample can be decomposed in four steps: Aerosol formation,
ionisation, mass discrimination and detection with analysis. Liquid samples are mixed with
argon to form a fine mist and then is vaporised in the plasma torch (6000°C) where the
30

sample is dried to a solid and then to a gas. The atoms in the plasma release one electron to
form a singly charged ion. The singly charged ions exit the plasma and enter the
discrimination region. A mass filter is made up of four metal rods aligned in a parallel
diamond pattern. When the voltages are set to certain values only one particular ion is able to
continue on a path between the rods and the others are forced out of this path. Many
combinations of voltages are chosen which allows an array of different m/z ratio ions to be
detected. The detector system will count the numbers of selected ions by the quadrupole. The
detection limit for vanadium, cobalt and aluminium is 1 - 1 0 parts per trillion.
ICP-MS was used to detect the leaching of vanadium of VMgO catalyst in «-decane after run
and also to determine the amount of Co/Al incorporated in the zeolites after solid state ion
exchange. Samples were analysed By Dr. Iain McDonald [11] using a JY Horiba Ultima
system.
2.3.4. Thermogravimetric analysis (TGA).
TGA can directly record the weight change with time or temperature due to dehydratation or
decomposition in an atmosphere of nitrogen, helium, air, other gas, or in vacuum. For TGA
the sample is continuously weighed as it is heated to elevated temperatures. Changes in
weight are a result of the rupture or the formation of various physical and chemical bonds at
elevated temperatures. All of the TGA analysis in the current work was carried out in a
SETARAM Labsys thermogravimetric analyzer. A typical procedure for obtaining a TGA
pattern is as follows. 50 mg of a sample of catalyst was placed into an aluminium oxide
crucible for analysis. The analysis was performed in air. The temperature programme that was
used was to have an isothermal time period at 25 °C for 30 minutes, then a temperature ramp
to 300°C at a ramp rate of 5°C/min.
31

2.3.5. X-ray Photoelectron Spectroscopy (XPS).
X-ray Photoelectron Spectroscopy (XPS) is used to determine the composition, the oxidation
state of the elements that exist on the surface of the catalyst. This technique is highly surface
specific with a depth 5 nm to 20 nm. When an atom absorbs a photon of energy hv, a core or
valence electron with binding energy Eb is ejected with kinetic energy Ek:
Ek = hv- Eb - cp
hv is the X-ray energy
Eb is the binding energy of the photoelectron
0 is the work function of the spectrometer (often ignored)
In this technique, the catalyst surface is irradiated with X-rays and the emitted photoelectrons
are measured. The energy of core electrons is very specific for each element, the spectrum is
able to provide information on the electronic state, elemental composition and chemical
species that exist on the surface of samples. XPS analysis was carried out with an ESCALAB
220 spectrometer using an achromatic AlKa source and an analyser pass energy of lOOeV.
2.4. Reactors used in the present work.
The Parr Series 5000 Multiple Reactor System (Figure 2.5) has been used to for the liquid
phase oxidation of w-decane and «-hexane with oxygen. Six reactions at different pressures
and temperatures can be run simultaneously, which allow catalytic data to be obtained
quickly.
32

-■■ajgasaMaa**8*
;y4«,H
Figure 2.5 Multi reactor system and control box.
The principle features o f the instrument include [12]:
• A system with 45 mL vessels.
• Six reactors with internal stirring.
• Operating pressures to 3000 psi.
• Operating temperatures to 275 °C.
• Individual temperature control.
• No autosample line.
All six vessels are stirred with a single magnetic stirrer and have the same stirring speed
during a single run. The activities of the catalysts were tested with «-decane (lOg) or «-hexane
(lOg). All the catalysts (0.05g) were tested with a stirring speed of 600 rpm. The reaction unit
was flushed once with O2 , after which the pressure was increased to 5 bar or 15 bar of oxygen
at room temperature, then the reactor was heated at desired temperature (80°C, 100°C, 110°C,
120°C or 130°C) for different runtimes. A small bucket o f ice was used to cool down the
reactor at the end of the reaction.
33

2.5. Purity of the reactants and radical initiators used in the present work.
Table 2.6 reports the purity and supplier of the linear alkanes used in this work («-decane and
tt-hexane) and also the purity and supplier of the two radical initiators used.
Table 2.6 Purity and supplier of #f-decane, /i-hexane and radical initiator.
Compound Supplier Purityw-decane Sigma-Aldrich > 99.0%«-hexane Fluka > 99.0%
T ert-buty lhydroperoxide (TBHP) Sigma-Aldrich ~ 80% in TBHP/ water
Benzoyl peroxide (BPO) Sigma-Aldrich 75% remainder water
2.6. Analysis of reactions solutions.
2.6.1. Gas Chromatography (GC).
The reaction solutions after reaction were analysed by gas chromathography (GC). The
sample is injected into a heating block (Injection Port) where it is immediately vaporized and
swept by the carrier gas into the column inlet. Each solute will travel at its own rate through
the column and enter to a detector attached to the column exit [7]. Analysis was carried out
using a Varian Star 3800 equipped with a Chrompack CP Wax 52CB, 25m, 0.53 mm, 2.0
microns capillary column. Stationary phases (Figure 2.6) with "wax" in their name are
polyethylene glycol.
POLYETHYLENE GLYCOLS:
Figure 2.6 Stationary Phase.
34

The oxygen group in the polymer backbone is capable of hydrogen bonding. Compounds with
the smallest hydrogen bond interaction with the column will elute from the column first
(lowest boiling point) and compounds with higher hydrogen bonding interaction with the
column (e.g. carboxylic acids) will elute last (highest boiling point). The higher the boiling
point of the compound, the higher the retention time on the column. (Table 2.7-2.8).
35

Table 2.7 Order of elution and retention for each product for n-decane reaction.
Order on the GC trace
Compounds Retention Time (min)
1 w-decane 3.44
2 5/4-decanone (5/4 one) 11.81
3 3-decanone (3 one) 12.54
4 2 -decanone ( 2 one) 13.45
5 5/4-decanol (5/4 ol) 16.26
6 3-decanol (3 ol) 16.94
7 2 -decanol ( 2 ol) 18.02
8 internal standard 20.44
9 pentanoic acid (C5OOH) 25.25
1 0 1 -decanol ( 1 ol) 25.65
1 1 hexanoic acid (CeOOH) 29.30
1 2 heptanoic acid (C7OOH) 32.69
13 octanoic acid (CgOOH) 35.66
14 nonanoic acid (C9OOH) 38.38
15 decanoic acid (C10OOH) 40.85
The column did not allow separation of 2-decanone and decanal and only one peak
observed.

Table 2.8 Order of elution and retention for each product for /t-hexane reaction.
Order on the GC trace
Compounds Retention Time (min)
1 w-hexane 0.842 3-hexanone (3 one) 8.303 2 -hexanone ( 2 one) 9.544 hexanal 9.545 3-hexanol (3 ol) 13.246 2 -hexanol ( 2 ol) 13.857 1 -hexanol ( 1 ol) 16.788 internal standard 22.199 hexanoic acid (C6 0 0 H) 25.12
The column did not allow separation of 2-hexanone and hexanal and only one peak was
observed.
The GC was fitted with a flame ionisation detector (FID). The detection principle is based on
the change in the electric conductivity of a hydrogen flame in an electric field when feeding
organic compounds [13]. The organic compounds escaping from the separation column are
burning for 99.97 % and 0.03% is fragmented. During subsequent oxidation by oxygen, which
is fed into the flame from outside, ions are formed according the following reaction:
CH* + O -► CHO+ + e
The flow of ions is recorded as a voltage drop across a collecting electrode.
The programmed-temperature chromatography is the procedure in which the temperature of
the column is changed systematically during a part or the whole of the separation. The oven
programme is a little complicated but allows for a good separation for the analysis after
H-decane reaction.
37

Start at 60°C hold for 7 min.
Ramp at 35°C/min to 115°C hold for 12 min.
Ramp at 4°C/min to 220°C hold for 1 min.
Ramp at 50°C/min to 240°C hold for 2 min.
The oven programme for the analysis and the separation after reaction with «-hexane reaction
is:
Start at 35°C hold for 7 min.
Ramp at 35°C/min to 220°C hold for 3 min.
Injection parameters used was a split ratio on the GC was 10:1 suitable for quantitative and
qualitative analysis (narrow peaks of analyte). 0 . 2 pi of sample was injected onto the column
using a 1 pi syringe.
2.6.2. Internal standard.
An internal standard was added to the reactions studied. The analyte chosen for the internal
standard has a predictable retention time and area, allowing it to be used to determine if
abnormalities have occurred. The standard chosen was 1,2,4-trichlorobenzene as that did not
interfere with the reaction and eluted from the column at different retention time to the
compounds studied (Table 2.7- 2.8). 0.15 ml of internal standard for ^-hexane solutions and
0.3 ml of tt-decane solutions were added to the crude mixture at the end of the reaction.
2.6.3. Calculations of internal response factors of each compound and quantification of
the products after reaction.
The internal response factor (K) of each product was calculated by finding the ratio of a
known amount of product over a constant amount of 1,2,4-trichlorobenzene (internal
standard). Four different solutions were made up with internal standards and all the different
38

products. For example, the first calibrated solution for «-decane calibration was containing n-
decane (lOg), each products (10 mg) and 1,2,4- trichlorobenzene (0.15 ml). The second
solution was containing the same mixture but with 30mg of each products. K was the average
found by 4 different calibration solutions (10 m g ,, 30 mg, 70 mg and 90 mg of each product)
using this equation.
K = [(Area IS) * (Amount SC)] / [(Amount IS * area SC)]
K = Internal Response Factor.IS = Internal Standard.SC = Specific compound of interest.
Before to prepare the etalons solutions, calculations have been carried out to be in the range of
masses of products made during the reaction. An example is detailed below for the
3-decanone.
Conversion= 3%
Selectivity 10%
Mass of 3-decanone produced= 33 mg
Table 2.9 describe an example of K (internal response factor) for 3-decanone for each solution
etalon.
Table 2.9 Internal reponse factor for each solution etalon
Solution etalon Masse of 3-decanone K
1 1 0 mg 0.64
2 30 mg 0.62
3 70 mg 0.63
4 90 mg 0 . 6 6
Average 0.64
A fresh known solution including standard and all the compounds in Table 2.7 and Table 2.8
were tested in this way on a regular basis to ensure results reported are accurate. The amount
39

of specific compound of interest added at the beginning to the fresh solution and the amount
calculated from the GC trace were checked by this formula.
Amount SC = (Amount IS * Area SC* K)/ (Area IS)
K = Internal Response Factor.IS = Internal Standard.SC = Specific Compound of interest.
Calculations of conversion, selectivity and yield have been made with these formulas:
K (Area of Product / Area I.S.) * mass I.SYield of each product (%) = * 100
(Mass of H-decane (10g)/ molar mass of decane * molar mass of product)
Conversion (%)= Total Yield (%) = Sum Yield of each product.
Product Selectivity (%) = (Yield of each product / Total Yield)
The calcul of conversion has been ccarried out for the desired products (Table 2.7) but other
products are present in the mixture after reaction. An example of GC trace for /7-decane is
shown in Figure 2.7.
40

Figure 2.7
GC tace
for the
autoxidation (130°C, 24
hours)
m Vo Its
COo
V 439
7 .652
9 .1 4 0
14.988
COCTl
_L_
CTlOI CJ1_L_
-<r] 7 mn
TD-<DOn>
-«d 5 /4 D ecan o n e (1 1 .6 4 8 )-< l 3 -d e c a n o n e (1 2 .4 4 9 ) «c] 2 -D ecan o n e (1 3 .3 7 6 )
-O 5 /4-D ecanol (1 6 .2 0 2 )<d 3-D ecanol (16 .927)
2-D eoanol (1 8 .2 7 4 )19.159
£ > < l 2 0 .8 0 6
2 2 .3 4 9
2 3 .3 6 0
1-D ecanol (2 6 .028)
iY .m2 8 .7 7 9
3 0 .0 9 5
3 2 .0 3 3
<3 P e n ta n o ic Acid (25 .1 3 2 )
H exanoic Acid (2 9 .5 1 3 )
H ep tano ic Acid (3 3 .1 5 3 ) 3 4 .0 6 9
3 5 .0 0 0
E L — < | D ecano ic Acid (41 .958)
3s.CDCO
r< *
*5 0 .5 9 3
i

2.7. Risk assessment
The experiments involve the three factors required for explosion: oxygen, fuel (w-decane) and
potential ignition sources (heat). Auto-ignition of organic solvents under air / oxygen is a well
known phenomena. The auto-ignition temperatures of w-decane and rc-hexane under air at
ambient pressure are given as 205 - 250°C. The lower temperature of 205°C was used for risk
assessments. Increasing pressure and moving from an air to oxygen atmosphere are known to
reduce the auto-ignition temperature and to account for this a 60°C margin was allowed to
estimate the safe operating temperatures under the experimental conditions. This resulted in a
modified safe operating temperature of approximately 140°C being assumed. The experiment
was set up at ambient conditions, pressurised (the oxygen supply was closed once the rig had
reached pressure) and then heated up to temperature using the automated control system. The
autoclave was placed in a cabinet with safety doors and no personnel would open the cabinet
doors during the heat up stage. The status of the vessels was checked via the PC controller
system.
42

2.7. References.
[1] H.B. Friedrich, N. Govender, M.R. Mathebula, Applied Catalysis A: General 297, (2006),
81.
[2] P.M. Michalakos, M.C. Kung, I. Jahan, H.H. Kung, Journal of Catalysis 140, (1993), 227.
[3] C. Nicolaides, Chief Scientist- Hydrocarbon transformation group- Sasol.
[4] Zeolyst International http://www.zeolyst.com/
[5] H.G. Karge, Studies in Surface Science and Catalysis 105, (1997), 1901.
[6 ] W. Ding, G.D. Meitzner, E. Iglesia, Journal of Catalysis 206, (2002), 14.
[7] Instrumental methods of analysis, L.L. Meritt, J.A. Dean, New York, (1974).
[8 ] J.M. Thomas, W.J. Thomas, Principles and Practice of Heterogeneous Catalysis, Wiley,
(1997).
[9] S. Brunauer, P. Emmet, E. Teller, Journal of American Chemistry Society, 60, (1938),
309.
[10] G. Leofanti, M. Padovan, G. Tozzola and B. Venturelli, Catalysis Today, 41, (1998),
207.
[11] Dr. Iain McDonald, School of Earth, Ocean and Planetary Sciences, Cardiff University.
[12] Par website http://www.parrinst.com.
[13] Analytical Chemistry, A Modem Approach to Analytical Science. Second Edition. R.
Kellner, J.M. Mermet, M. Otto, M. Valcarcel, H.M. Widmer, Springer Berlin, (2006).
43

Chapter 3
Autoxidation of /t-decane
3.1. Introduction.
Autoxidation or noncatalytic oxidation is the spontaneous reaction of oxygen with alkanes
without the intervention of a flame. Figure 3.1 shows the autoxidation reaction of w-decane.
H-decane + O2 —No catalyst
Oxygenated ProductsTemperature
Figure 3.1 Autoxidation of /i-decane.
The major products of the autoxidation are a mixture of alcohols, ketones and cracked acids.
The liquid-phase autoxidation of hydrocarbons is an important process in the petrochemical
value chain [1]. One of the major examples is the autoxidation of cyclohexane [1-2], which is
converted to cyclohexanol and cyclohexanone widely used as feedstock for nylon production.
Other industrially important autoxidation processes are the conversion of ethylbenzene to
ethylbenzene hydroperoxide, the conversion of p-xylene to terephatalic acid [3] and the
autoxidation of cumene which serves as feedstock for the production of phenol and acetone.
The autoxidation mechanism of alkanes proceeds by a radical mechanism as described by
reaction Figure 3.2 given in eq.1-5. In this mechanism [4] I represents Initiator, RH the
straight chain alkane, R* alkyl radical, ROO* the peroxyl radical or peroxide radical and
ROOH the hydroperoxide. Different sources (I) can initiate the autoxidation. It can be radical
44

initiator such as benzoyl peroxide (BPO) or terf-butylhydroperoxide (TBHP) added voluntary
at the beginning of the reaction or it can be impurities from the feed (ROOH, olefin), traces of
metal in the stainless steel autoclave or heat. [3-5]. It should be noted that the propagation
cycle is repeated many times before the termination reaction [6 ].
Initiation: I - » R* eq.l
Propagation; R* + O2—► RO2* eq.2
R 02* + H R —► R 02H +R* eq.3
Termination: R0 2 *+RC>2 *—<►non radical products eq.4
R* + R* —► R2 eq.5
Figure 3.2 Autoxidation mechanism [4].
A disadvantage of autoxidation chemistry is that the radical mechanism is not as selective as
desired [6 ].
3.2. Experimental.
The liquid phase experiments were carried out in a high-pressure autoclave with a nominal
volume of 45ml. w-decane (lOg) (anhydrous, >99% from Sigma Aldrich) was tested at
temperatures ranging from 80°C to 140°C for the desired time. The stirring speed was set to
600 rpm and the pot was flushed once with oxygen before charging with oxygen to a pressure
of 15 bar at room temperature. In addition, some reactions were performed with a small
amount of radical initiator added at the beginning of the reaction. Tert-butylhydroperoxide
(TBHP 70% in water from Aldrich) and benzoyl peroxide (75%, remainder water from
Aldrich) were used. At the end of the run, 150 pi of internal standard (1,2,4-trichlorobenzene)
was added to the crude mixture of products before analysis was performed using a gas
chromatograph (Varian Star 3800) fitted with a DB-WAX column and a flame ionization
45

detector (FID).
3.3. Results.
3.3.1. Effect of the temperature on the autoxidation of /f-decane.
In the liquid phase autoxidation of alkanes, temperature is an important factor. If the
temperature is too low there is no conversion however a high temperature will give a high
conversion. The effect of the temperature on the conversion of w-decane for a run of 24 hours
is shown in Table 3.1.
Table 3.1 Effect of the temperature on the conversion (%).
Temperature Conversion (%)
80°C 0
100°C 0.1< conversion (%) <0.4
110°C 1.58
120°C 6.1< conversion (%) <10.70
130°C 2 1
Reactions conditions: 80°C to 130°C, stirring speed 600 rpm, 15 bar O2 , decane (lOg) and runtime (24 hours).
For a run of 24 hours, a minimum temperature of 100°C is needed to promote the
autoxidation of w-decane. Increasing the temperature provides a major increase in the
conversion and greatly increases the number of products (e.g. 140 products for a reaction of
24 hours at 130°C) which makes the identification and analysis of all the products difficult.
The primary major products made by the radical autoxidation mechanism are more reactive
towards oxidation (oxidation of alcohols to ketones) [7]. The formation of ketone products
will weaken the carbon-carbon bond in the a-position along the w-decane chain which can
result in cleavage of the C-C bond to form two cracked products. It has to be considered as
46

well that w-decane is a long linear chain alkane with 1 0 carbons and can be fimctionalised in
more than one position by the radical autoxidation mechanism and after can undergo many
carbon-carbon bond cleavages. All these different reactions can explain the complexity of the
GC trace even at low conversion.
3.3.2. Product profile at different temperature.
The products of the autoxidation of w-decane at different temperature are listed in Table 3.2.
Table 3.2 Product distribution at different temperature.
Temp. Conv(%)
5/4one
3One
2
one5/4ol
3ol
2
ol1
olc 5
acidc 6
acidc 7
acidc 8
acidc 9
acidC10
acid
80°C 0 -
100°C 0.15 30.0 19.3 24.2 2 . 1 1 . 8 1 . 8 1 . 0 6.5 5.9 5.2 0 0 2 . 2
110°C 1.58 28.5 16.6 19.4 4.3 2.7 5.0 0 . 8 5.5 4.9 8.5 0 . 8 0.4 2 . 6
120°C 10.70 24.3 13.3 16.7 4.4 6.9 4.3 0.5 9.5 8 . 0 6.3 2.7 2.5 0 . 8
130°C 21,75 23.6 13.6 16.4 4.1 6.3 4.1 0.4 1 0 8.5 6 . 8 2.7 2 . 8 0 . 6
Reactions conditions: 80°C to 130°C, stirring speed 600 rpm, 15 bar O2, decane (lOg) and runtime (24 hours)
After a run of 24 hours, «-decane is oxidised to form several products including C10 alcohols,
C10 ketones and cracked monocarboxylic acids resulting from the cleavage of a C-C bond.
The C10 alcohols and C10 ketones are mainly in position 5, 4, 3, 2 and there is a very low
terminal selectivity to 1-decanol and decanoic acid. The radical mechanism is not selective for
the desired terminal products even at low conversion. The major positions of oxygenation
functionalisation of w-decane during the autoxidation are in position 5, 4, 3 and 2, which will
weaken the C-C bond along «-decane chain and can explain the presence of pentanoic acid,
hexanoic acid, heptanoic acid, octanoic acid and nonaic acid which occur as a result of
consecutive reactions. In such experiments reproducibility is poor because the autoxidation is
47

highly variable due to the quantity of impurities present in feedstock such as ROOH, olefins
or trace metals [8 ]. High amounts of impurities will initiate the autoxidation quicker than a
low level of impurities and will give a higher conversion with more products for the same
runtime using the same experimental conditions. Table 3.3 shows how the conversion and the
product distribution of the reaction can change for different runs. Three different runs at
100°C and 120°C have been repeated.
Table 3.3 Reproducibility of the reaction at 100°C and 120°C.
Temp. Conv(%)
5/4one
3one
2
one5/4ol
3ol
2
ol1
olc 5
acidc 6
acidc 7
acidc 8
acidc 9
acidC10
Acid
100°C 0.15 30 19.3 24.2 2 . 1 1 . 8 1 . 8 1 . 0 6.5 5.9 5.2 0 0 2 . 2
100°C 0.39 32.4 2 0 . 8 21.9 1 . 6 3.0 2 . 0 1 . 0 3.9 3.8 2.5 5.1 0 1.9
100°C 0.28 30.9 18.3 2 2 . 2 2.7 1.7 2 . 8 0 . 8 9.0 3.8 5.4 0.5 0.3 1 . 6
120°C 6 . 1 2 26.1 14.9 18.5 4.7 6.5 4.2 0.5 1 0 . 2 1 . 1 7.2 2 . 6 2.5 0.9
120°C 10.70 24.3 13.3 16.7 4.4 6.9 4.2 0.5 9.5 8 . 0 6.3 2.7 2.5 0 . 8
120°C 7.34 21.4 1 1 . 6 15.8 6 . 1 3.9 5.7 0.5 14.1 8.7 6 . 1 3.5 1 . 6 1 . 0
Reactions conditions: 100°C & 120°C, stirring speed 600 rpm, 15 bar O2 , decane (lOg) and runtime (24 hours)
Tables (3.4 and 3.5) have shown the range of the results at 100°C and 120°C.
Table 3.4 Range for the conversion (%), terminal selectivity (%) and cracked acids for arun of 24 hours at 100°C.
Conversion(%)
Selectivity (%) 1 -decanol
Selectivity (%) decanoic acid
Selectivity (%) cracked acids (C5 to C9)
0.15 to 0.39 0 . 8 to 1 . 0 1 . 6 to 2 . 2 15.3 to 19.0
The conversion can be multiplied by a factor of more than two for the same reaction with the
same experimental conditions. The terminal selectivity is also not stable but stays very at a
low level below 3.2 %.
48

Table 3.5: Range for the conversion (%), terminal selectivity and cracked acids for a run of 24 hours at 120°C.
Conversion(%)
Selectivity (%) 1 -decanol
Selectivity (%) decanoic acid
Selectivity (%) cracked acids ( C 5 to C 9 )
6.10 to 10.70 0.5 0 . 8 to 1 . 0 23.6 to 34.0
Increasing the temperature decreases the reproducibility under the same experimental
conditions. It can be noted that increasing the temperature will increase the number of
consecutive reactions resulting in overoxidation of the primary products and explains the
large amount cracked acids. Increasing the temperature will diminish the percentage of
terminal selectivity.
During this work many blank reactions (without catalyst) were performed. The blank reaction
reveals if the pot is clean after a reaction with a catalyst and whether there is any
contamination. Figure 3.3 is a summary of these results.
4 .5 1►
g*
» ♦ ♦
* ► ♦♦ """ ♦ .......
♦ ♦♦ ♦
%♦
♦ ♦ ♦
♦ # t ♦
S ♦ ♦ ♦ ♦* ♦
<b 1♦
♦
♦♦ ♦ ♦ ♦
♦
0.1 0.2 0.3 0.4
Conversion ( % )
0.5 0.6
Reactions conditions: 100°C, stirring speed 600 rpm, 15 bar O2, decane (lOg) and runtime (24 hours).
Figure 3.3 Conversion (%) and terminal selectivity (%) for autoxidation.
From these results, we can see the range of the conversion for the autoxidation reaction at
100°C is between 0.05% to 0.55%. So if a blank reaction was performed with a conversion
superior to 0.50% after use of a catalyst, it was assumed there is a contamination in the
autoclave pot and the pot was rewashed carefully and another blank reaction was set up until a
49

conversion below 0.50% was observed. The value 0.5% of conversion was arbitrary decided
as the maximum conversion after a run of 24h at 100°C without catalyst. This maximum
conversion (0.5%) was also agreed by another team working on the same project with the
same substrate and same type of autoclave at Johnson Matthey. Contamination is a major
problem for the liquid phase catalysis. Contamination can promote or inhibit the conversion
of the reaction, which result in wrong results and irreproducibility of data. The major cause of
contamination is traces of catalyst or radical scavenger from the previous run. The second
major keypoint of the Figure 3.3 is the terminal selectivity. It can be observed that the
terminal selectivity varies between 0.3% and 4.1%. These results are a very important
baseline, to compare against the catalyst performance. If a run is made with a catalyst and the
terminal selectivity is below 4%, it can be deduced that the catalyst does not influence the
terminal selectivity of the reaction. Some points of Figure 3.2 have been made by Yuan
Shang and Sivaram Pradhan, PhD students working on the same project [9].
3.3.3. Analysis of the gas after reaction run.
At the end of the run, a miniature gas sample cylinder was attached to the autoclave to collect
the gas after reaction. The gas sample was analysed using a GC fitted with a thermal
conductivity detector (TCD). The target of this experiment is to check if there is production of
carbon monoxide and carbon dioxide during the autoxidation.
Table 3.6 Gas analysis after run.
Analysis of the gas Detection with FID detectorCO 0
C 0 2 0
Reactions conditions: 100°C, stirring speed 600 rpm, 15 bar O2, decane (lOg) and runtime (24 hours)
No peaks corresponding to carbon monoxide Or carbon dioxide were observed in the
chromatogram. Only «-decane and oxygen were detected.
50

3.3.4. Time on line studies for if-decane autoxidation.
The autoxidation was studied for three different runtimes (8 h, 16h and 24h) and the results are
shown in Table 3.7. These runs were used to estimate the induction period of the reaction,
and the primary products made by the radical mechanism. Reaction sampling is not available
on the autoclave so each table entry is a different reaction rather than sampling the same
reaction over time.
Table 3.7 Time on line at 100°C.
Time Conv. 5/4 3 2 5/4 3 2 1 c 5 c 6 c 7 c 8 c 9 C10
Hours (%) one one one ol ol ol ol acid acid acid acid acid Acid
8h 0
16h 0.04 45.8 13.2 17.1 14.9 9.1 0 0 0 0 0 0 0 0
24h 0.39 32.4 20.8 21.9 1.6 3.0 2.0 1.0 3.9 3.8 2.5 5.1 0 1.9
Reactions conditions: 100°C, stirring speed 600 rpm, 15 bar O2, decane (lOg) and runtime (8 , 16 and 24hours)
The results show there is an initial period where very little oxidation occurs, known as
the induction period as observed in the literature by Ingold [5]. During the induction period,
there is a low concentration of radical, which explains the low conversion and the
concentration of radical builds up until it reaches a concentration which will allow a
propagation of the radical mechanism resulting in an increase in the rate The primary
products made by this autoxidation are the internal ketones and internal alcohols (positions 5,
4, 3, 2 ).
Table 3.8 shows the time on line of the autoxidation reaction at higher temperature(110°C).
51
Table 3.8 Time on line at 110°C.
Time Conv. 5/4 3 2 5/4 3 2 1 c 5 c 6 c 7 c 8 c 9 C10
Hours (%) one one one ol ol ol ol acid acid acid acid acid Acid
8h 0.1 25 16 19 3 2 3 1 13 5 6 0 0 1
16h 0.58 32 19 23 3 2 3 1 6 4 4 1 0 2
24h 1.58 28 16 19 4 2 5 1 5 5 9 1 0 2
Reactions conditions: 110°C, stirring speed 600 rpm, 15 bar O2 , decane (lOg) and runtime (8 , 16 and 24hours)
Increasing the temperature reduces the initiation period and a low conversion is observed after
8 h.
3.3.5. Presence of hydroperoxide (ROOH) in the reaction solution.
3.3.5.1. Introduction.
The initial products of the autoxidation of alkanes are the corresponding hydroperoxides [10]
formed by the free radical mechanism showed in Figure 3.2.
RH + 0 2 -> R02H
RH is a hydrocarbon and RO2H is the corresponding hydroperoxide. The reactivity of various
C-H bonds decrease in the order tertiary>secondary> primary [11]. So for /7-decane, the
formation of the hydroperoxide will be easier along the chain rather than in the terminal
positions.
3.3.5.2. Method used to quantify the hydroperoxide.
The concentration of hydroperoxides (ROOH) in the reaction cannot be determined directly
from the GC chromatograms, as these compounds decompose in the GC column with the
formation of approximately equal amounts of alcohol and ketone. If the sample of the reaction
solution is treated with an excess of solid PPI13 for 20 min at room temperature before GC
52

analysis, the hydroperoxide is reduced only to the corresponding alcohol [12-15]. Therefore,
the difference in alcohols in the GC traces of the reaction solution before and after
triphenylphosphine reductions allows to estimate the amount of hydroperoxide. If ROOH is
present in the solution, the alcohol/ketone ratio of the chromatogram prior to the reduction
with PPh3 and will be different after reduction with PPI13 (the alcohol peak will increase).
3.3.5.3. Results.
After reaction, the sample was injected twice, before treatment and after reduction with an
excess PPI13. If hydroperoxide is present, the ratio ketone/alcohol will be different between
analyses. Theses results are listed in Table 3.9
Table 3.9 Ketones/alcohols ratio before and after treatment with PPh3.
ReactionTime
(hours)
First Injection without PPh3
Second injection Treatment with PPI13
ROOH Selectivity (%)
16 Ketones/alcohols=76/24 Ketones/alcohols=3 7/45 33
24 Ketones/alcohols=7 5/7 Ketones/alcohols=68/22 2 2
Reactions conditions: 100°C, stirring speed 600 rpm, 15 bar O2, decane (lOg) and runtime (24 hours)
After these results, it can be concluded that hydroperoxide are present in the reaction at the
end of the run.
ROOH concentration was calculated by comparing the concentrations of the corresponding
alcohol (R-OH) and ketone (Rh= 0 ) in the chromatograms resulting from samples injected
directly (C 'r_oh and C 'rh=o) and from samples injected after 15 minutes of reaction with solid
triphenylphosphine (C" r-oh and C" rh=o). The alcohol/ketone ratio of the decomposition of
alkyl hydroperoxide was assumed to be 1. The real concentration of ketone in the reaction
(C rh=o) is equal to that calculated after reduction with PPh3 . The difference in ketone
concentration between both samples, AC rh=o = C'rh=o - C"rh=o, corresponds to the alkyl
53

hydroperoxide that is decomposed to ketone in the GC column. As we assumed that both
alcohol and ketone are formed in a 1:1 ratio in the GC, so the alcohol that comes from alkyl
hydroperoxide decomposition will be equal to A C r h = o , and its subtraction from the
concentration of alcohol in the sample injected directly gives the real concentration of alcohol
formed in the reaction, C r-oh . The concentration of alkyl hydroperoxide in the reaction is
calculated as the difference between the concentration of alcohol in the sample with PPh3 and
the real concentration of alcohol in the reaction [16].
c RH=0 = C"rh=0
c r-oh = C'r-OH -A C rh=o
C ROOH = C"r-oh - C r-oh
3.3.6. Radical Initiator.
3.3.6.1. Definition of radical initiator.
A lot of organic molecules are stable at elevated (>127°C) temperatures. Atoms of these
compounds are connected by strong chemical bonds with bond dissociation energy (BDE)
-350-500 kJ mol"1. Radical initiators are molecules bearing one weak bond with a low BDE
-100-200 kJ mol’ 1 for example a covalent bond between two oxygen atoms (O-O) [18]. When
the temperature of the reaction is sufficiently high, the weakest bond of the radical initiator
decomposes with homolysis and produces free radicals. These free radicals will initiate a
radical reaction.
3.3.6.2. Half lives with temperature of the radical initiator.
One of the most important parameters for the choice of a radical initiator is the temperature of
the reaction. The temperature determines the rate of decomposition (Figure 3.4) of the
weakest bond of the radical initiator, which initiates the radical mechanism of the reaction.
54

10 T
AIBNBP
TBHP
0,150 200 250100 150
Temperature (#C)
AIBN= Azobisisobutyronitrile, TBHP= t-Butyl hydroperoxide, CHP=cumylhydroperoxide,m-CPBA =m-Chloroperbenzoic acid,
BPO= Dibenzoyl peroxide, DTPB = Di-t-butyl peroxide.
Figure 3.4 Half life times of various initiators as function of temperature [19].
From the Figure 3.4, we can see that BPO will decompose to give radical species quicker
than TBHP at the reaction temperature of 100 °C. The two different radical initiators that were
tested in this work were TBHP in water (70% in water, MW=90.12) and dibenzoyl peroxide
(BPO), which gives a different type and size of radical.
3.3.6.3. Activation of /i-decane at 80°C.
The radicals initially formed by TBHP decomposition will go on to extract one hydrogen
from the alkane. TBHP was added at the beginning of the reaction to explore if a small
amount of radical initiator can activate w-decane at 80°C. Table 3.10 is the result of three
different reactions with runtimes of 8 h, 16h and 24h.
55
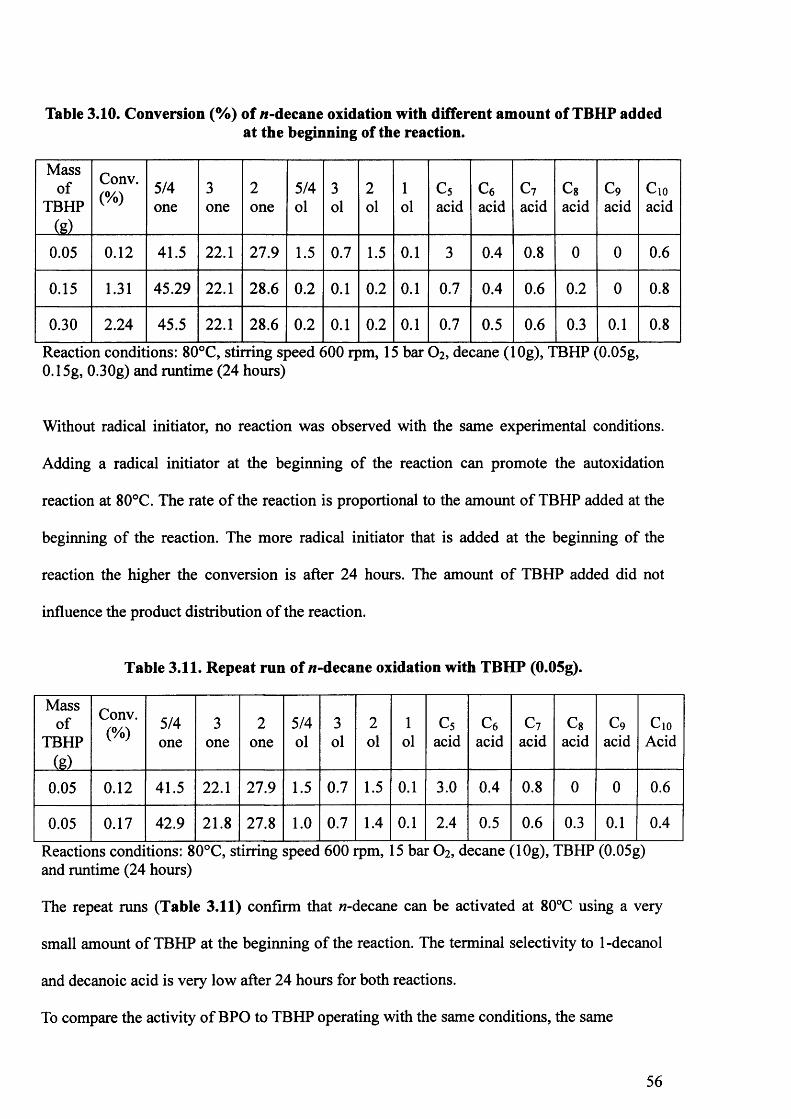
Table 3.10. Conversion (%) of it-decane oxidation with different amount of TBHP addedat the beginning of the reaction.
Massof
TBHP(g)
Conv.(%) 5/4
one3one
2one
5/4ol
3ol
2ol
1ol
C5acid
c 6acid
c 7acid
c 8acid
c 9acid
C10acid
0.05 0.12 41.5 22.1 27.9 1.5 0.7 1.5 0.1 3 0.4 0.8 0 0 0.6
0.15 1.31 45.29 22.1 28.6 0.2 0.1 0.2 0.1 0.7 0.4 0.6 0.2 0 0.8
0.30 2.24 45.5 22.1 28.6 0.2 0.1 0.2 0.1 0.7 0.5 0.6 0.3 0.1 0.8
Reaction conditions: 80°C, stirring speed 600 rpm, 15 bar O2, decane ( 0.15g, 0.30g) and runtime (24 hours)
Og), TBHP (0.05g,
Without radical initiator, no reaction was observed with the same experimental conditions.
Adding a radical initiator at the beginning of the reaction can promote the autoxidation
reaction at 80°C. The rate of the reaction is proportional to the amount of TBHP added at the
beginning of the reaction. The more radical initiator that is added at the beginning of the
reaction the higher the conversion is after 24 hours. The amount of TBHP added did not
influence the product distribution of the reaction.
Table 3.11. Repeat run of /t-decane oxidation with TBHP (0.05g).
Massof
TBHP(g)
Conv.(%)
5/4one
3one
2
one5/4ol
3ol
2
ol1
olC5
acidc 6
acidc 7
acidc 8
acidc 9
acidC10
Acid
0.05 0 . 1 2 41.5 2 2 . 1 27.9 1.5 0.7 1.5 0 . 1 3.0 0.4 0 . 8 0 0 0 . 6
0.05 0.17 42.9 2 1 . 8 27.8 1 . 0 0.7 1.4 0 . 1 2.4 0.5 0 . 6 0.3 0 . 1 0.4
Reactions conditions: 80°C, stirring speed 600 rpm, 15 bar O2 , decane (lOg), TBHP (0.05g) and runtime (24 hours)
The repeat runs (Table 3.11) confirm that w-decane can be activated at 80°C using a very
small amount of TBHP at the beginning of the reaction. The terminal selectivity to 1-decanol
and decanoic acid is very low after 24 hours for both reactions.
To compare the activity of BPO to TBHP operating with the same conditions, the same
56

number of moles of radical (Table 3.12) was added at the beginning of the reaction.
Table 3.12 Moles of TBHP & BPO used.
Features TBHP BPO
Molecular Weight 90.12 242.23
Purity 30% in water by mass 25% remainder water by mass
Mass used (g) 0.05 0.125
Mass used (g) 0.15 0.376
It has been shown in the Figure 3.4 that BPO decomposes quicker than TBHP, so a higher
conversion for the same runtime is expected.
Table 3.13 /f-decane oxidation with different amount of BPO.
Massof
BPO(8 )
Conv.(%) 5/4
one3
one2
one5/4ol
3ol
2
ol1
olc 5
acidc 6
acidc 7
acidc 8
acidc 9
acidC10
Acid
0.040 0.14 15.3 9.2 1 0 . 6 21.9 11.9 14.8 2 . 2 4.1 2 . 6 4.4 0.7 1.3 0 . 8
0.125 0.18 16.0 9.3 10.4 23.1 1 2 . 6 15.2 2.3 1 . 2 0.9 4.5 2 . 2 1.3 1 .1
0.376 0.79 16.2 9.2 9.9 23.8 13.2 14.6 3.3 1.3 1.7 3.7 0.3 1.4 1 . 2
Reactions conditions: 80°C, stirring speed 600 rpm, 15 bar O2, decane (lOg), BPO (0.04g, 0.125g, 0.376g) and runtime (24 hours)
As observed for TBHP, increasing the amount of BPO at the beginning of the reaction
increases the conversion of the reaction after a run of 24 hours. Lower conversion is observed
with the addition of BPO than with the addition of the same number of moles of TBHP
beginning of the reaction.
To confirm these results, two repeat run were performed at 80°C with BPO (0.125g)
57

Table 3.14 Repeat run of /t-decane oxidation with BPO (0.125g).
TimeHours
Conv.(%) 5/4
one3
one2
one5/4ol
3ol
2
ol1
olc 5
acidc 6
acidc 7
acidc 8
Acidc 9
acidCioacid
24 h 0.18 16.0 9.3 10.4 23.1 1 2 . 6 15.2 2.3 1.2 0.9 4.5 2 . 2 1.3 1 . 1
24 h 0 . 2 0 16.7 1 0 . 0 1 0 . 6 22.4 12.5 14.9 2.4 2 . 6 1 . 2 4.5 0.3 1 . 0 1.0
Reactions conditions: 80°C, stirring speec 600 rpm, 15 bar C>2, decane ( 1 ()g), BPO (0.125s)and runtime (24 hours)
A comparative table (Table 3.15) allows comparison of the conversion, the terminal
selectivity for 1-decanol, decanoic acid and the cracked product using TBHP or BPO as a
radical initiator.
Table 3.15 Comparison of the conversion (%), internal oxygenated products and terminal selectivity (%) between TBHP and BPO at 80°C.
Radicalinitiator
Conversion(%)
Selectivity (%) Decanone
Position 5/4/3/2
Selectivity (%) Decanol
Position 5/4/3/2
Terminal Selectivity(%) 1 -decanol&
Decanoic acidTBHP 0.12 to 0.17 91.5 to 92.5 3.1 to 3.7 0.5 to 0.7
BPO 0.18 to 0 . 2 0 35.7 to 37.3 49.8 to 50.9 3.4
Slightly higher conversion is observed for BPO, which can be explained by the quicker
formation of radicals in the reaction. However a major difference is observed in the products
profiles. More alcohol is produced using BPO as radical scavenger. So a radical initiator
influences the product distribution of the autoxidation reaction.
3.3.6.4. Time on line at 100°C.
At 100°C, without a radical initiator, a long initiation period (8 h) is observed. Using a radical
initiator, the time of the initiation period is reduced. Three different reactions with different
runtime were performed.
58

Table 3.16 Time on line using TBHP as radical initiator.
TimeHours
Conv.(%)
5/4one
3one
2
one5/4ol
3ol
2
ol1
olc 5
acidc 6
acidc 7
acidc 8
acidc 9
acidC,oacid
8 h 0.23 41.3 21.7 28.4 0.5 0.5 0 . 8 0.5 3.2 1 . 0 1 . 0 0.4 0.3 0 . 6
16h 0.38 37.2 20.4 26.1 1 . 1 0.7 1.4 0.3 4.5 2.5 3.1 0.3 0.4 1.9
24h 0.80 36.5 20.3 24.7 1 . 8 1 . 2 2.3 0.4 4.7 2.9 2 . 6 0.5 0 . 2 2 . 0
Reactions conditions: 100°C, stirring speed 600 rpm, 15 )ar O2, decane (lOg), TBHP (0.C>5g)and runtime (8 , 16, 24 hours)
Reactions, with the same reaction time were carried out with BPO as radical initiator.
Table 3.17: Time on line using BPO as radical initiator.
TimeHours
conv.(%)
5/4one
3one
2
one5/4ol
3ol
2
ol1
olc 5
acidc 6
acidc 7
acidc 8
acidc 9
acidC10
Acid
lh 0.27 13.7 8 . 0 9.5 25.6 14.1 15.9 3.4 1 . 0 0 . 6 4.0 1 . 8 2 . 0 0.5
8 h 0.35 14.2 8 . 1 9.3 25.0 14.0 16.2 3.0 1 . 6 1 . 0 4.2 0.3 1 . 6 1.4
8 h 0.33 13.7 7.8 9.2 25.6 14.4 16.8 3.2 1.7 1 . 1 3.8 0.3 1.7 0.7
16h 0.34 15.0 8.5 9.6 24.1 13.7 16.3 3.1 1 . 8 1 . 2 3.7 0.3 1.7 1 . 1
24h 0.39 15.9 9.1 10.4 23.6 13.3 16.0 3.1 2 . 0 1.4 3.1 0.3 0.9 1 . 1
Reactions cone itions: 100°C, stirring speed 60C rpm, 5 bar O2 , decane (lOg), BPO (0.125g)and runtime (1,8, 16, 24 hours).
After lhour of reaction the conversion is already 0.27%, showing BPO is decomposed very
quickly at 100°C.Repeat runs were performed with BPO to confirm the low conversion
obtained at 24hours, compared to the conversion obtained after lh.
59

Table 3.18 Repeat run of n-decane oxidation with BPO at 100°C.
TimeHours
Conv.(%)
5/4one
3one
2
one5/4ol
3ol
2
ol1
olc 5
acidc 6
acidC7
acidc 8
acidc 9
acidC10
Acid
24h 0.37 14.2 8 . 0 9.3 25.2 14.3 16.3 2.9 2 . 2 1.4 3.4 0.4 1.5 0.9
24h 0.39 15.9 9.1 10.4 23.6 13.3 16.0 3.1 2 . 0 1.4 3.1 0.3 0.9 1 . 1
Reactions conditions: 100°C, stirring speed 600 rpm, 5 bar O2 , decane (lOg), BPO (().125g)and runtime (24 hours).
Addition of radical initiator leads to a shorter initial induction period. BPO has a
decomposition temperature lower than TBHP which will give higher conversion at shorter
runtime (8 h) than TBHP. BPO also gave more alcohols in the products than TBHP. Figure
3.5 is a summary of the conversion versus time with the same molar amount of TBHP and
BPO at 100°C.
0.9
^ 0.6
§ 0.5
£ 0.4 -coo
0.2
0.1
0 2010 15 25 305Time (hour)
AutoxidationTBHP
Reactions conditions: 100°C, stirring speed 600 rpm, 15 bar O2 , decane (lOg), BPO (0.125g), TBHP (0.05g) and runtime (24 hours).
Figure 3.5 Time on line for autoxidation without radical initiator (blue curve), with TBHP (black curve) and with BPO (red curve).
60

3.3.7. Radical scavenger.
3.3.7.1. Definition.
Autoxidation can be inhibited or retarded by the addition of certain compounds known as
antioxidants or radical scavengers, which lengthen the induction period [5].
In the presence of a radical scavenger, the propagation reaction is stopped by the termination
step [20]. The phenyl ring will stabilise the radical.
R 0 2* + AH -> R 0 2H + A*
*AH is the antioxidant and A is the radical derived from the loss of phenolic hydrogen. Stable
nitroxide radicals, like 2,2,6,6-Tetramethylpiperidine-l-oxyl (PS tempo) have been also
known to scavenge carbon radicals [2 1 ].
3.3.7.2.2,6-Di-fer/-butyl-4-methylphenol as radical scavenger.
The data for the autoxidation of «-decane in presence of radical scavenger are showed in the
Table 3.19.
Table 3.19 Conversion with different amounts of 2,6-Di-tert-butyl-4-methylphenol.
Radical Scavenger conversion (%)None 0.1-0.4
0.050g 0
O.OlOg 0
Reaction conditions: 2,6-di-tert-butyl-4-methylphenol.Radical scavenger (0.0115g), 100°C, 600 rpm, 15 bar 0 2, decane (lOg), 24 hours
In the presence of 2,6-di-tert-butyl-4-methylphenol (BHT), the reaction was inhibited
indicating that a radical process is operative.
61

3.3.7.3. PS-tempo as radical scavenger.
PS-tempo is 2,2,6,6-Tetramethylpiperidine-l-oxyl (tempo) supported on a polymer
(polystyrene PS) prepared by Johnson Matthey. PS tempo is a bulky radical scavenger, which
was used in the presence of an ion exchanged zeolites to kill the autoxidation around the
catalyst but is too bulky to go inside zeolites channels to kill the reaction. So the desired target
is that only the products from the reaction inside the channels of the zeolites will be present at
the end of the reaction (Figure 3.10).
AutoxidationScavenges y r Radical reaction of metal on zeolites surface
Reaction of n -decane with oxidationcentre inside the zeolites channels
Products
PS Tempo
Figure 3.6 Desired action of PS-tempo with ion exchanged zeolites as catalyst
Table 3.20 Conversion (%) with different masses of PS-Tempo at different temperatures.
Conv. (%) Conv. (%) Conv. (%) Conv. (%)Temperature Mass
PS-tempo (50 mg)
Mass PS-tempo (20 mg)
Mass PS-tempo
(5 mg)
Mass PS-tempo
(2 mg)100°C 0 0 0 0
110°C 0 0 0 0
120°C 0 0 0 0 . 2
130°C 0 0.04 0 . 1 1.4Reactions conditions: 600 rpm, 15 bar O2 , decane (lOg), 24 hours, radical scavenger (50mg or
20 mg or 5 mg or 2 mg) is added at the beginning of the reaction.
Data shown in Table 3.20 demonstrate again that temperature is an important factor for the
autoxidation, and increase the temperature will result to increase the mass of radical
62

scavenger to inhibit the autoxidation. For example PS tempo is a very effective radical
scavenger, no conversion was observed at 130°C with the addition of 50 mg of PS-tempo.
The use of two different radical scavengers demonstrates that radical chemistry is involved in
the present reaction, which indicates that radical chemistry is the only mechanism responsible
for the autoxidation.
3.3.8. Distillation and Purification of /t-decane.
3.3.8.1. Introduction.
The initiation step of the autoxidation mechanism is highly dependant on impurities in the
reactants [3-5]. The possible effect of impurities within the w-decane on the autoxidation
reaction was investigated. The major concern was that hydroperoxide (ROOH) impurities
within the «-decane maybe responsible for the autoxidation reaction observed at temperatures
of > 100 °C. To remove these impurities «-decane was distilled and tested for autoxidation.
3.3.8.2. Method of purification.
Perrin and Armarego [22] were recommended for the method of purification of organic
chemicals. This method involves shaking w-decane with concentrated H2SO4, which acts as
hydroperoxide destroyer then washing with water, aqueous NaHCC>3, more water, then drying
with MgSC>4 , refluxing with molecular sieves distilling under pressure at 70°C under nitrogen
and passing through a column of silica gel which will reduce any peroxide formed.
Immediately after purification (no storage), blank test reactions at 100°C and 120°C were
carried out and compared to the same reactions with the as received /7-decane. A glass liner
was also used in some experiments to avoid contact of /2-decane with the stainless steel
autoclave walls as autoxidation can be initiated by traces of metallic species. Only a plastic
63

thermocouple and a magnetic bar stirrer are in contact with w-decane during the run. No metal
is in contact with the purified w-decane.
3.3.8.3. Results.
The same reaction was performed with purified and unpurified «-decane without a glass liner
at different temperatures (100°C & 120°C).
Table 3.21 Oxidation of purified and unpurified /i-decane at 100°C.
ioo°r Conv. 5/4 3 2 5/4 3 2 1 c 5 c 6 c 7 c 8 c 9 Cio1 Ul/ V/(%) one one one ol ol ol ol acid acid acid acid acid acid
Unpurified 0.15 30.0 19.3 24.2 2.1 1.8 1.8 1.0 6.5 5.9 5.2 0 0 2.2
Purified 0.17 34.8 19.9 25.1 2.0 1.3 2.7 0.5 6.5 2.5 2.8 0.4 0.3 1.1
Reactions conditions: Purified and unpurified w-decane at 100°C, 24h, 15 bar oxygen, 600 rpm, no glass liner.
Table 3.22 Oxidation of purified and unpurified it-decane at 120°C.
120°C Conv.(%)
5/4one
3one
2
one5/4ol
3ol
2
ol1
olc 5acid
c 6acid
c 7acid
c 8acid
c 9acid
C,oacid
Unpurified 10.70 24.3 13.3 16.7 4.4 6.9 4.2 0.5 9.5 8 . 0 6.3 2.7 2.5 0 . 8
Purified 1 0 . 1 0 26.1 15.3 13.0 3.6 4.1 4.9 0 . 6 10.9 8.7 6.3 3.1 2.7 0.7Reactions conditions: Purified and unpurified w-decane at 120°C, 24h, 15 bar oxygen, 600 rpm, no glass liner
These results indicate that there is no difference in the conversion and the product distribution
between purified and unpurified w-decane for a runtime of 24 hours.
64

Table 3.23 Difference between unpurified without liner and purifiedwith glass liner at 100°C.
100°C Conv.(%)
5/4one
3one
2
one5/4ol
3ol
2
ol1
olC5
acidc 6acid
c 7acid
c 8acid
c 9acid
Cioacid
Unpurified&
stainlesssteel
0.15 30.0 19.3 24.2 2 . 1 1 . 8 1 . 8 1 . 0 6.5 5.9 5.2 0 0 2 . 2
Purified&
glass liner0.29 30.4 2 2 . 8 21.9 1 . 6 3.0 2 . 0 1 . 0 3.9 3.8 2.5 3.1 2 . 0 1.9
Reactions conditions: Purified and unpurified w-decane at 100°C or 120°C, 24h, 15 bar oxygen, 600 rpm
Table 3.24 Difference between unpurified without liner and purifiedwith glass liner at 120°C.
120°C Conv.(%)
5/4one
3one
2
one5/4ol
3ol
2
ol1
olc 5acid
c 6acid
c 7acid
c 8acid
c 9acid
Cioacid
Unpurified&
stainlesssteel
10.70 24.3 13.3 16.7 4.4 6.9 4.2 0.5 9.5 8 . 0 6.3 2.7 2.5 0 . 8
Purified&
glass liner8 . 2 22.4 1 0 . 6 15.8 6 . 1 3.8 5.7 0 . 6 14.1 8.7 6 . 1 3.5 1 . 6 1 . 0
Reactions conditions: Purified and unpurified H-decane at 120°C, 24h, 15 bar oxygen,600rpm.
These results above suggest that the glass liner and purified w-decane do not prevent the self
initiating autoxidation mechanism.

3.4. Discussion.
In the literature different sources of initiator are proposed for the self-initiation of the
autoxidation.
• Small amount of impurities present in the feed as hydroperoxide (ROOH) or olefin
[3].• Trace of metal from the stainless steel autoclave [3].
• Heat [5]
Unless hydrocarbons are rigorously purified prior to use by the supplier, trace amounts of
impurities are present in the feedstock and can initiate the autoxidation. The first impurity,
which can be present in the feed are unsaturated substrates (olefins). By direct addition of
oxygen to the double bond, they will produce a hydroperoxide and acts as initiator for the
autoxidation [3]. This insertion is reported in Figure 3.7.
HO-— O
1DC
o i—
INIo
o-
H: -----o—
P4 ▼ *
—o II
—o
1
—O
-----
7}
H H H H H H
Figure 3.7 Insertion of oxygen with an olefin [3].
The second impurity which can be present in the feed are the hydroperoxide (ROOH) and can
also initiate the autoxidation [3]. The hydroperoxide present in the feed or formed by direct
reaction of the olefin with oxygen (Figure 3.7) will undergo a thermal homolytic
decomposition (eq. 6 ), which will generate radicals (oxidation initiators), which can initiate
the autoxidation reaction [3-4].
ROOH -► RO* + *OH eq. 6
66
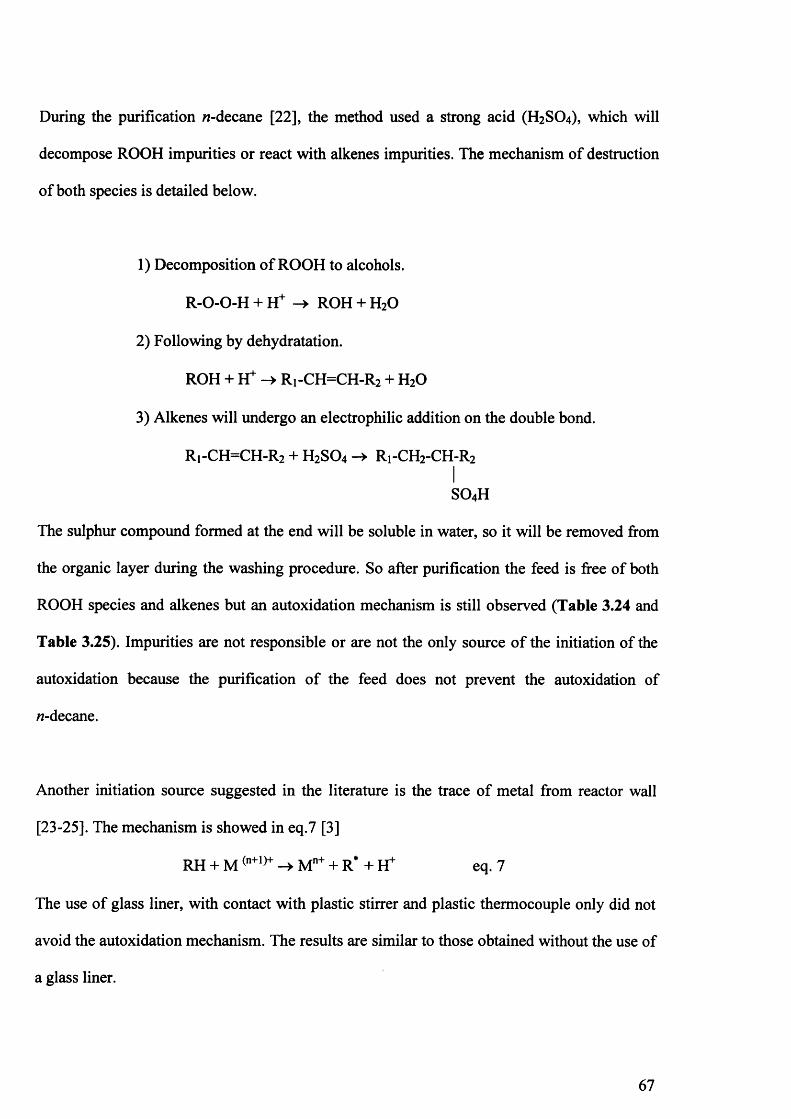
During the purification w-decane [22], the method used a strong acid (H2SO4), which will
decompose ROOH impurities or react with alkenes impurities. The mechanism of destruction
of both species is detailed below.
1) Decomposition of ROOH to alcohols.
R-O-O-H + H+ —> ROH + H20
2) Following by dehydratation.
ROH + H+ —► R,-CH=CH-R2 + H20
3) Alkenes will undergo an electrophilic addition on the double bond.
Ri-CH=CH-R2 + H2SO4 -> R1-CH2-CH-R2
SO4H
The sulphur compound formed at the end will be soluble in water, so it will be removed from
the organic layer during the washing procedure. So after purification the feed is free of both
ROOH species and alkenes but an autoxidation mechanism is still observed (Table 3.24 and
Table 3.25). Impurities are not responsible or are not the only source of the initiation of the
autoxidation because the purification of the feed does not prevent the autoxidation of
rc-decane.
Another initiation source suggested in the literature is the trace of metal from reactor wall
[23-25]. The mechanism is showed in eq.7 [3]
RH + M <n+l)+ -> Mn+ + R* + H4" eq.7
The use of glass liner, with contact with plastic stirrer and plastic thermocouple only did not
avoid the autoxidation mechanism. The results are similar to those obtained without the use of
a glass liner.
67

The last initiation source proposed in the literature is the direct radical-forming reaction
between hydrocarbon and molecular oxygen [26] in which the temperature of the reaction can
supply enough energy required for the formation of a radical [5]. In Table 3.1, conversion of
the autoxidation is widely influenced by the temperature. For example, no autoxidation at
80°C for a run of 24h but a conversion of 10% at 120°C for the same run time (Table 3.2).
Autoxidation can also be initiated deliberately by adding a radical initiator as terr-butyl
hydroperoxide (TBHP) or benzoylperoxide (BPO) at the beginning of the reaction. The use of
such radical initiator will decrease the time of the initiation step by increasing the formation
rates of hydroperoxide [28]. Two different radical initiators were used in this study. The first
one is terf-butylhydroperoxide (TBHP).The decomposition of ter/-butylhydroperoxide is
proposed in Figure 3.8 [29].
*
OH -------------- ► ^O *
s ' + O H
Homolysis
Figure 3.8 Thermal decomposition of TBHP.
The second radical initiator used is benzoyl peroxide (BPO). It is an unstable compound and
produces radicals by homolytic cleavage of weak bonds simply on heating [30].
Homolysis
Figure 3.9 Dibenzoylpoeroxide thermal decomposition
The radicals formed from this homolysis are unstable and can break down by cleavage of a
C-C bond generating CO2 and a phenyl radical (Figure 3.10).
68

CODecomposition
Figure 3.10 Radical elimination.
After homolytic decomposition of the radical initiator, the next step will be the abstraction by
the radical of H to form the radical alkane. Eq. 8 [31] describes the reaction between linear
alkane and alkoxy radical (TBHP).
RO* + RH -» R* + ROH eq. 8
The mechanism of the radical from dibenzoyl peroxide (BPO) decomposition with linear
alkane is proposed in eq.9 [29].
PhC02* + RH -> PhC(0)0H + R* eq. 9
It can be noticed that there is a formation of benzoic acid.
After formation of the radical alkane (R*), the second step is the oxygen insertion with
formation hydroperoxide [3] described in Figure 3.11.
Figure 3.11 Insertion of oxygen, formation of hydroperoxide withregeneration of radical
69

The experiments with triphenylphosphine confirm the presence of a large amount of ROOH at
the end of the reaction. The concentration of ROOH species builds up during the initiation
step until it reaches a concentration, which allows the propagation step.
Radical initiators were used to reduce the long period of induction of the reaction. Tert-butyl
hydroperoxide (TBHP) led to higher ROOH synthesis. Radical initiator will increase the
formation rate of ROOH and will explain a shorter induction period [28]. For example no
conversion is observed for the autoxidation without radical initiator after 8 hours; however the
conversion is 0.23% when TBHP is added at the beginning of the reaction or a conversion of
0.33% when BPO is added at the beginning of the reaction.
The hydroperoxide species will undergo a homolytic cleavage by heat to form the free radical
(RO* and OH*) [4]. In eq.10, ROOH is the hydroperoxide, RO* is the alkoxy radicals and
OH* is hydroxyl radical.
ROOH -» RO* + *OH eq. 10
Thermal decomposition of ROOH is influenced markedly by temperature and can explain the
difference of conversion between the different temperatures [4]. These radicals (RO* and
OH*) will act as oxidation initiators and will react further with alkanes or hydroperoxides or
with the different products present in the mixture [3-5]. The complexity of the product profile
can be explained as multi radical reactions can occur at the same time and is responsible of
the scission of the C-C bond (Figure 3.12). The other important factor is that the primary
oxygenated products made are more reactive than linear alkane. For example, alcohols or
hydroperoxides are more reactive than alkanes to the dehydrogenation by a radical (OH*,
RO*, R*, ROO*). Table 3.25 compares the hydrogen bond energy dissociation between an
alkane (C-H) an alcohol (RCO-H) and hydroperoxide (ROO-H).
70

Table 3.25 Hydrogen energy bond dissociation [32].
Hydrogen Energy bond dissociation
Energy (kcal mol'1)
Alkane Primary (C-H) 104
Alkane Secondary (C-H) 94.6
Alcohols(RCO-H) 8 6
Hydroperoxide(ROO-H) 90
The ways in which hydroperoxide decompose is summarized in Figure 3.12 [33].
Scheme 2 -racH ,C H ,/r
OH jR'CH + [C H .a v r j
M I
HOCOCHjM-^— [HOOCH.CHjM] H 0C07T
Products not in parentheses were directly identified
Figure 3.12 Decomposition of the secondary hydroperoxides [33].
In this scheme we can see the complexity of the radical mechanism. The first products formed
are ketones and alcohols as observed in Table 3.7 for a run of 16 hours at 100°C. Increasing
the reaction time will give a more complicated product profile. As described in Figure 3.12,
the formation of ketones will weaken the carbon-carbon bond and give C-C scission more
easily and will explain the large amount of cracked products for a run of 24h with a large
conversion. The terminal selectivity is very poor in each case. Under these homogeneous
71

conditions the regioselectivity is governed by the relative carbon hydrogen bond dissociation
energies [1 1 ], which favour the oxidation on the CH2 position on w-decane.
A major difference in the product profile and the conversion is observed by the use of BPO as
radical initiator. The product distribution contains more alcohols and there is no major
difference for the conversion after 1 hour and 24 hours runs. TBHP does not influence the
decomposition of the hydroperoxide; only participate in its formation [28]. The
decomposition of the ROOH will be a thermal homolytic cleavage and explain the same
product profile between autoxidation (without TBHP) and autoxidation initiated with TBHP.
However BPO must react with the ROOH. The explanation of these results is formation
benzoic acid by the use of BPO [34-35]. Acid can do a heterolytic decomposition of the
ROOH [4]. The ionic decomposition avoids the formation of the alkoxy (RO*) and hydroxyl
radicals (OH*) and explains why the conversion is stable versus time. The alkoxy (RO*) and
hydroxyl radicals (OH*) are also responsible for the conversion of alcohols (the hydrogen is
easier to abstract than for alkanes Table 3.25) to ketones and explain the difference in the
product profile.
The inhibitors of free radicals reduce the rate of the autoxidation [4]. The general mechanism
of a radical scavenger involves a hydrogen abstraction (eq. 3). In eq. 11, IH is the radical
scavenger.
Autoxidation: Initiation: I-» R * eq.l
Propagation: R* + O2—► RO2 * eq.2
Inhibition: RO2 * + IH —> ROOH + 1* eq.l 1
72
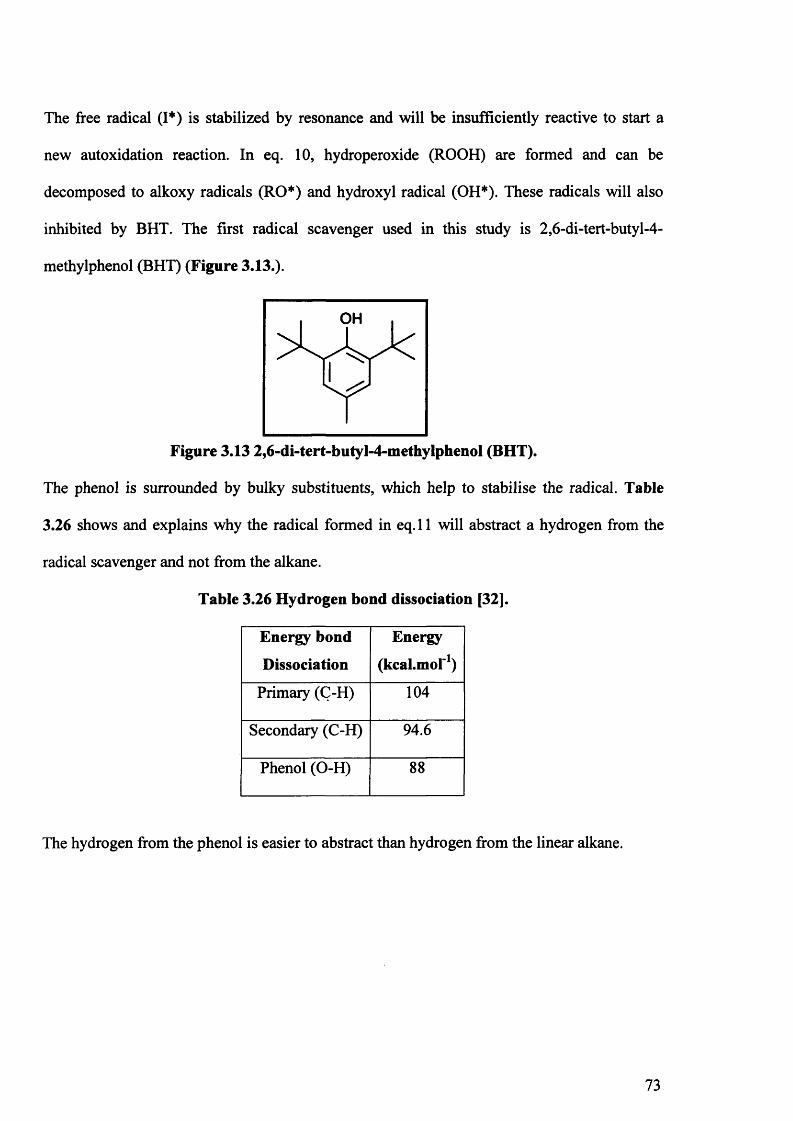
The free radical (I*) is stabilized by resonance and will be insufficiently reactive to start a
new autoxidation reaction. In eq. 10, hydroperoxide (ROOH) are formed and can be
decomposed to alkoxy radicals (RO*) and hydroxyl radical (OH*). These radicals will also
inhibited by BHT. The first radical scavenger used in this study is 2,6-di-tert-butyl-4-
methylphenol (BHT) (Figure 3.13.).
OH
Figure 3.13 2,6-di-tert-butyl-4-methylphenol (BHT).
The phenol is surrounded by bulky substituents, which help to stabilise the radical. Table
3.26 shows and explains why the radical formed in eq. 11 will abstract a hydrogen from the
radical scavenger and not from the alkane.
Table 3.26 Hydrogen bond dissociation [32].
Energy bond
Dissociation
Energy
(kcaLmor1)
Primary (C-H) 104
Secondary (C-H) 94.6
Phenol (O-H) 8 8
The hydrogen from the phenol is easier to abstract than hydrogen from the linear alkane.
73

The mechanism of stabilisation with peroxyl radical is proposed in Figure 3.14 [4J.
ROO*
ROO
Figure 3.14 2,6-di-tert-butyl-4-methylphenol (BHT) mechanism.
It can be notice that one mol of radical scavenger can stabilise two of radical.
The other radical scavenger used is this work is PS-tempo. The mechanism of PS- Tempo is
depicted in Figure 3.15. It scavenges the R* species and will also prevent the propagation of
the autoxidation.
Autoxidation: Initiation: I -> R* eq.l
The alkyl radical will be scavenged by PS-tempo (Figure 3.15.)
Figure 3.15 Trapping of alkyl radical by PS-tempo [36].
Autoxidation is an undesired reaction in our system because it is a radical reaction with a very
poor terminal selectivity and to know how to prevent it using radical scavengers is important.
For example, in the next chapters the use of a catalyst with a radical scavenger will prevent
74

the propagation of the autoxidation and allow the examination of only the heterogeneous
mechanism from the catalyst.
3.5. Conclusion.
In summary, it has been shown that w-decane can react with oxygen without the presence of a
catalyst via the radical mechanism of autoxidation. The products are a mixture of Cio
oxygenated products and cracked acids. The terminal selectivity of this radical mechanism is
very poor for the terminal products. The temperature does have an influence over the
conversion of the reaction.Purification by distillation of w-decane or use of a glass liner did
not avoid the autoxidation however addition of a radical scavenger can avoid the propagation
of the autoxidation by trapping the radical species. Radical initiator can enhance the reaction
and BPO can modify the product distribution giving more alcohols than TBHP.
75
3.6. References.
[1] I. Hermans, J. Peeters, P.A. Jacobs, Topics in Catalysis 48, (2008), 48.
[2] U. Schuchardt, D. Cardoso, R.Sercheli , R. Pereira , R.S. Da Cruz , M.C. Guerreiro, D.
Mandelli, E.V. Spinace, E.L. Pires, Applied Catalysis A: General, 211,(2001), 1.
[3] R.A. Sheldon, J.K. Kochi, Metal Catalyzed Oxidations of Organic Compounds, Academic
Press, New York (1981).
[4] C.E. Frank, Chemical Review 46, (1950), 155.
[5] K.U. Ingold, Inhibition of Autoxidation of Organic Substances in the Liquide Phase
Chemical Reviews, 61, (1961), 563.
[6] I. Hermans, J. Peeters, P.A. Jacobs, Topic in Catalysis 50, (2008), 124.
[7] I. Hermans, T.L. Nguyen, P.A. Jacobs, J. Peeters, European Journal of Chemical Physics
and Physical Chemistry, 6, (2005), 637.
[8] G.W. Burton, K.U. Ingold, Journal of the American Chemical Society, 103, (1981), 472.
[9] PhD students involved in this project, Y. Shang, S. Pradhan (2007).
[10] L.R. Mahoney, Angewandte Chemie International Edition, 8, (1969), 547.
[11] J.M. Thomas, R. Raja, G. Sankar, R.G. Bell, Letters to Nature, 398, (1999), 227.
[12] G.B. ShuPpin, A.N. Druzhinina, Bulletin of the Russian Academy of Sciences.41,
(1992), 346.
[13] G.B. ShuPpin, G.V. Nizova, Y.N. Kozlov, New Journal of Chemistry, 20, (1996), 1243.
[14] G.P. ShuPpin, G.V. Nizova, Reaction Kinetics and Catalysis Letters, 48, (1992), 333.
[15] A.E. Shilov, G.B. ShuPpin, Chemical Review, 97, (1997), 2879.
[16] L.G. Cuervo, Thesis, Institut de Chimie de PUniversite de Neuchatel, (2003).
[17] I.W.C.E. Arends, P. Mulder, K.B. Clark, D.D.M. Wayner, Journal of Physical Chemistry
,99, (1995), 8182.
76

[18] E.T. Denisov, T.G. denisova and T.S. Pokidova, Handbook of Free Radical Initiators,
Wiley-Interscience, (2003).
[19] J. Meijer, A. Hogt, Across Organic Review, (2006).
[21] J. Betts, The kinetics of Hydrocarbon Autoxidation in the liquid Phase, Quarterly
Reviews, Chemical Society 25, (2), (1971), 265.
[22] W.L.F. Armarego, D.D. Perrin, Purification of Laboratory Chemicals, Butterworth-
Heinemann, (1997).
[23] E.H. Bawnc, Discussions Faraday Society, 14, (1953), 181.
[24] A.J. Chalk, J.F. Smith, Transactions of the Faraday Society 53, (1957), 1214.
[25] V. Erofeevb, I. Sorokot, Zhumal Prikladnoi Khimii, 33, (1960), 903.
[26] D.J. Carlsson, J. C. Robb, Transactions of Faraday Society 62, (1966), 3403.
[28] B. Moden, B. Zhan, J. Dakka, J.G. Santiesteban, E. Iglesia, Journal of Physical
Chemistry C, 111, (2007), 1402.
[29] Handbook of Free Radical Initiators, E.T Denisov, T.G. Denisova, T.S. Pokidova, Wiley
& Sons (2003).
[30] J. Clayden, N. Greeves, S. Warren, P. Whothers, Organic Chemistry, Oxford, (2000),
1021.
[31] B. Moden , B. Zhan , J. Dakka, J.G. Santiesteban , E. Iglesia, Journal of Catalysis 239,
(2006), 390.
[32] J.A. Kerr, Bond Dissociation Energies by Kinetic Methods, Chemical Reviews 66,
(1966), 465.
[33] D.M. Brown, A. Fish, Royal Society, 308, (1969), 547.
[34] M.P. Doyle, W.J. Patrie, S.B. Williams, Journal Organic Chemistry, 16, (1979), 2955.
[35] W.E. Cass, Journal of the Chemical American Society, 69, (1947), 500.
77

[36] A.L.J. Beckwith, V.W. Bowry and K.U. Ingold, Journal of the American Chemical
Society, 114,(1992), 4983.
78

Chapter 4
Liquid phase oxidation of /t-decane over
vanadium magnesium oxide catalysts
4.1. Introduction.
The activation of alkanes is of fundamental importance as the activation of a CH bond allows
access to a great range of more useful products. About 5% of the annual production of
vanadium is used in catalysis, which is its most dominant non-metallurgical use [1].
Vanadium magnesium oxides are among the most selective and active heterogeneous
catalysts for the oxidative dehydrogenation of alkane in gas phase reaction. VMgO catalysts
have been broadly used for oxidative dehydrogenation of propane to propene [2-4] and butane
to butadiene [5-6]. On other hand, it should be noticed that homogeneous vanadium catalysts
can be efficient for long linear alkane oxidation in liquid phase to produce ketones and
alcohols [7]. No literature was found on the use of solid heterogeneous VMgO catalysts for
the activation of long linear alkanes in liquid phase. This chapter aims to look at the use of
hetero and homogenous based vanadium systems using molecular oxygen for partial «-decane
oxidation in liquid phase.
4.2. Experimental.
4.2.1 Preparation of VMgO catalysts.
A main method of catalyst preparation is impregnation. Impregnation occurs when the metal
attaches to the oxide. It is prepared by adsorption of an active phase solution, that is, by
79

adding the support to a solution of the active metal. Impregnation is the most simple and
widely used preparation technique for making supported vanadium oxides catalysts. Various
VMgO catalysts (Table 4.1) were prepared via an impregnation method [8 ] with varying
vanadium loadings.
Table 4.1 Different VMgO catalysts prepared.
Catalyst’s name Theoretical mass percentage loadings, (wt % V 2 O 5 )
VMgO-O (blank) 0VMgO-1 1VMgO-5 5
VMgO-10 10VMgO-20 20VMgO-33 33VMgO-5 0 50VMgO-60 60VMgO-70 70
4.2.2. Characterisation of catalysts.
The techniques of XRD, BET have been used to characterize the catalysts. In selected cases,
ICP-MS is used to detect if there is vanadium leaching after the reaction.
4.2.3. Catalysts testing
Reactions were carried out in a high-pressure autoclave with a nominal volume of 45ml and a
magnetic stirrer. VMgO solid catalyst (50 mg) and w-decane (lOg) was heated at 80°C or
100°C degrees with a stirring speed of 600 rpm. The reaction unit was flushed once with O2,
after which the pressure was increased to 15 bar at room temperature. In selected cases time
on-line studies were performed in order to explore the profile of the reaction vs. time.
Reaction sampling is not available on the autoclave so each table entry is a separate
experiment. In addition, some reactions were carried out with addition of radical initiator
(Tert-butylhydroperoxide, TBHP, 70% in water or benzoyl peroxide, BPO, 75%, remainder
80

water) at the beginning of the reaction. The products were analyzed using a gas
chromatograph (Varian Star 3800) fitted with a DB-WAX column. Samples were taken at the
end of reactions for quantification. Internal standard (0.150 ml of 1,2,4-trichlorobenzene) was
added to the product mixture before 0.2pl was injected into the GC.
4.3. Results
4.3.1. Characterisation of VMgO catalysts.
4.3.1.1. BET analysis.
The BET surface area was determined for the different VMgO catalysts. (Table 4.2).
Table 4.2 List the surface areas of the different vanadium loadedcalcined catalysts.
Theoretical loadingv2o5 (%)
Surface area (m2/g)
MgO (support no calcined) 68
VMgO-O (blank) 152
VMgO-1 147
VMgO-5 188
VMgO-10 151
VMgO-20 110
VMgO-33 81
VMgO-5 0 27
VMgO-60 13
VMgO-70 8
Large differences in the specific area of VMgO were obtained depending on the vanadium
content. These catalysts range from low surface area to high surface area. In agreement with
literature [9], the impregnation procedure led to an increase in the surface area (O-VMgO),
81

which increases when 5% V was added but then decreased with the increase of the V content.
188 m2/g for 5-VMgO, 13 m2/g for 60-VMgO while that the surface area of MgO support no
calcined is the 68 m2/g. Lower surface area than the support (MgO) that indicates blocking of
some of the pores of support by vanadia crystallites [10].
4.3.1.2. XRD Analysis.
4.3.1.2.1. Different phases in VMgO catalysts.
For the gas phase reaction the proposed active phases of VMgO catalyst are the orthovanadate
and pyrovanadate phases [11] (Figure 4.1 [12]). The active phase of the VMgO catalyst for
oxidative dehydrogenation of alkanes to alkenes is the orthovanadate phase. The other phase,
the pyrovanadate is more oxidising in nature due to coordination of the metal to more
oxygens. The pyrovanadate phase is commonly formed at calcination temperatures greater
than 500°C.
Figure 4.1 [12] Left: VO4 unit in Mg3(V04)2 (orthovanadate phase).Right: V2O7 unit in Mg2V2C>7 (pyrovanadate phase).
82

4.3.I.2.2. XRD patterns of VMgO catalysts.
Figure 4.2 displays the XRD patterns of MgO not calcined (a), VMgO-O calcined (b),
VMgO-1 (c), VMgO-5 (d), VMgO-10 (e), VMgO-20 (f) and VMgO-33 (g) respectively.
• MgO16000-
12000 -
3OO 8000 -
4000-
0-4020 60 80
2 e
Figure 4.2 XRD patterns: MgO not calcined (a), VMgO-O calcined (b), VMgO-1 (c),
VMgO-5 (d), VMgO-10 (e), VMgO-20 (f) and VMgO-33 (g) respectively.
The XRD patterns for the low vanadium loading catalysts indicate that only diffraction peaks
assigned to MgO were observed [13]. No orthovanadate phase and pyrovanadate phase are
visible on Figure 4.2 for a loading of vanadium below 33%. The intensity of the peak of
MgO peaks decreased with the loading of vanadium and could be explained by the formation
of amorphous or crystalline phases with small crystal sizes [14].
Figure 4.3 shows the XRD patterns of the high vanadium loading catalyst, of MgO
uncalcined (a), VMgO-50 calcined (b), VMgO-60 (c) and VMgO-70 (d) respectively
83

I Orthovanadate phase
MgO phase Pyrovanadate phase
6000 -
4000-</)c3oO
2000 -
8020 6040
2 0
Figure 4.3 XRD patterns: MgO uncalcined (a), VMgO-50 calcined (b), VMgO-60 (c) and
VMgO-70 (d) respectively.
Reflections in the XRD patterns were assigned using two references [15-16]. An only
orthovanadate phase was observed for VMgO-50. The presence of both orthovanadate and
pyrovanadate phase were observed for 60-VMgO and 70-VMgO. The orthovanadate phase is
the predominant phase for the high vanadium loading. The number and the intensity of the
peaks for each phase increase with the vanadium loading.
84

4.3.2. Oxidation of n-decane at 80°C.
4.3.2.1. Effect of vanadium loading on the conversion of /t-decane*
In Chapter 3, we have seen that there is no autoxidation of w-decane for a 24h run at 80°C, so
the target was to test the different catalysts using theses conditions to avoid the reaction of
autoxidation and to promote a heterogeneous mechanism from the catalyst. Table 4.4 is the
results of these different tests.
Table 4.4 Conversion obtained for the different vanadium loaded catalysts.
Catalysts Conversion(%)
None 0
Blank (MgO=support) 0
VMgO-1 0
VMgO-5 0
VMgO-10 0
VMgO-33 0
VMgO-50 0
VMgO-60 0.074
VMgO-70 0.1
Reactions conditions: 80°C, stirring speed 600 rpm, 15 bar O2 , decane (lOg),VMgO (50 mg) and runtime (24 hours)
Table 4.4 shows that the support of the catalyst is not active and the low loading of vanadium
until 50-VMgO did not show a conversion however a loading of 60% and 70% vanadium
allow observing a low conversion of «-decane at 80°C. So these catalysts are active for the
partial oxidation of «-decane at very low temperature (80°C).
85

4.3.2.2. Product profile with VMgO-70 and VMgO-60.
The products of the oxidation of w-decane with VMgO-70 and VMgO-60 are listed in Table
4.5.
Table 4.5 Product distribution using VMgO-70 and VMgO-60.
CatalystConv.(%)
5/4one
3one
2one
5/4ol
3ol
2ol
1ol
C5acid
c6acid
c7acid
c8acid
c9acid
Cioacid
None 0
VMgO-60 0.074 21.0 14.1 14.3 8.3 4.8 9.3 1.0 14.3 5.6 4.5 1.2 1.2 0.5
-j
<;°
l CfQ 0 1
0.1 21.2 13.6 13.8 7.5 4.7 8.4 1.0 13.6 5.9 4.4 3.5 0.8 1.4
Reactions conditions: 80°C, stirring speed 600 rpm, 15 bar O2, decane (lOg), VMgO-70 and VMgO-60 (50 mg) and runtime (24 hours).
31 peaks were detected on the GC traces for VMgO-70 at 80°C, but only Cio oxygenated
products and cracked terminal acids were used in this work. Gas sample were collecting at the
end of the reaction and analysed with a TCD detector, which showed no COx. Only decane
and oxygen were observed. A product distribution very similar to that observed for the
autoxidation mechanism, with a high level of ketones, internal alcohols in position 5, 4, 3 and
2 and cracked acids. Very low terminal selectivity is detected after 24h for both catalysts.
Vanadium catalyses the oxidation of w-decane because the conversion is higher than the
autoxidation (no conversion at 80°C). The product distribution of the autoxidation reaction
and reaction with VMgO-70 are noticeably the same. One of the major problems in liquid
phase is the reproducibility of the results, so repeats run were performed to confirm the
activity of VMgO-70 at 80°C.
86

Table 4.6 Repeat runs with VMgO-70.
Catalyst Conv. 5/4 3 2 5/4 3 2 1 c 5 c 6 c 7 c 8 c 9 Cio(%) one one one ol ol ol ol acid acid acid acid acid acid
VMgO-70 0.13 25.2 14.5 15.1 7.4 4.6 7.6 0.7 10.7 5.9 4.7 2.4 0.3 1.0
VMgO-70 0.11 21.2 13.6 13.8 7.5 4.7 8.4 1.0 13.6 5.9 4.4 3.5 0.8 1.4
Reactions conditions: 80°C, stirring speed 600 rpm, 15 bar O2, decane (lOg), VMgO-70 (50 mg) and runtime (24 hours)
These results confirm the activity of VMgO-70 for /7-decane activation at 80°C.
4.3.2.3. Time on line
Time-online studies were also performed in order to plot the product profile with time. Table
4.7 lists the data for these experiments.
Table 4.7. Product profile of the reaction versus time.
Time(h)
Conv.(%) 5/4
one3
one2
one5/4ol
3ol
2ol
1ol
c 5acid
c 6acid
c 7acid
c 8acid
c 9acid
Cioacid
6h 0
8h 0.008 32.2 20.5 23.4 8.9 6.0 9.1 0 0 0 0 0 0 0
16h 0.060 22.0 13.1 14.3 8.3 5.8 8.3 1.0 14.3 5.6 4.5 1.2 1.2 0.5
24h 0.11 21.2 13.6 13.8 7.5 4.7 8.4 1.0 13.6 5.9 4.4 3.5 0.8 1.4Reactions conditions: 80°C, stirring speed 600 rpm, 15 bar O2, decane (lOg),
VMgO-70 (50 mg) and runtime (8h, 16h, 24 h)
An induction period of 6 hours is needed before observing any conversion. A very low
conversion of 0.008% is observed after 8 hours. Ketones and internal alcohols are the first
products made. There is no conversion observed for the reaction without catalyst at 80°C after
24 hours, so it can be concluded that VMgO-70 promotes the oxidation of /2-decane in liquid
phase for a runtime of 24 hours.
87

4.3.2.4. n-decane oxidation over VMgO-70 catalysts with a radical initiator.
Deshpande and co-workers [17] have developed a process for the production of a mixture of
alcohols and ketones by the liquid phase oxidation of higher alkanes using a catalyst system
consisting of transition group metal such as palladium and support such as alumina, silica,
carbon, preferably carbon in the presence of alkyl hydroperoxide as oxygen carrier. It should
notice that the ratio of radical initiator to /7-decane by weight used in this patent [17] is 1.6 (A
mixture of 9.913 g TBHP in 6.247 g /7-decane). In this case radical initiator is acting as a
stochiometric oxidant (0.070 mol of /2-decane for 0.0.70 mol of TBHP). Radical initiator is an
expensive compound for the industry, so it was decided with the industrial sponsors of this
project to investigate the activity of VMgO-70 with a small amount of radical initiator.
88

Table 4.7: /t-decane oxidation in the presence of TBHP or BPO, VMgO-70 and TBHP or BPO with VMgO-70.
Cat. Conv.(%)
5/4one
3one
2one
5/4ol
3ol
2ol
1ol
c 5acid
c 6acid
c 7acid
c 8acid
c 9acid
C 10acid
OnlyTBHP 0.17 42.9 21.8 27.8 1.0 0.7 1.4 0.1 2.4 0.5 0.6 0.3 0.1 0.4
VMgO-70 0.11 21.2 13.6 13.8 7.5 4.7 8.4 1.0 13.6 5.9 4.4 3.5 0.8 1.4
VMgO-70+
TBHP
0.85 32.5 17.4 19.1 6.3 3.9 6.5 0.5 4.6 2.9 3.5 1.2 0.3 1.2
VMgO-70+
TBHP
0.70 30.0 16.4 17.1 8.0 5.1 7.8 0.6 5.3 3.2 3.5 1.2 0.5 1.2
OnlyBPO 0.28 16.0 9.3 10.4 23.1 12.6 15.2 2.3 1.2 0.9 4.5 2.2 1.3 1.1
VMgO-70+
BPO
0.36 15.8 9.2 10.3 24.2 13.6 15.4 2.7 1.3 0.8 4.4 0.2 1.3 1.0
VMgO-70+
BPO
0.30 15.9 10.5 10.1 21.1 11.7 14.4 2.4 4.6 2.0 4.1 0.5 1.4 1.3
Reactions conditions: 80°C, stirring speed 600 rpm, 15 bar O2 , decane (lOg), VMgO-70 (50 mg), 0.05g TBHP or 0.125 g BPO and runtime (24 hours)
The combination of catalyst and TBHP is a benefit for the conversion. For the terminal
selectivity, no improvement is achieved using TBHP with VMgO-70. With BPO, a large
amount of alcohols is observed in position 5, 4, 3, 2 which is not observed using TBHP. The
conversion obtained with BPO with and without catalyst for a run of 24 hours is very similar
indicating VMgO-70 is inactive with BPO present.
4.3.2.5. Investigation of the role of the oxidant.
Different experiments have been carried out to try to understand the origin of the oxygen in
the products at the end of the reaction. Three different sources are susceptible to give oxygen.
89

The first one is from the gas O2 , the second one is from the lattice of VMgO and the last one
is from the oxygen present in the radical initiator. Different experiments have been made with
inert atmosphere to asses the origin of the oxygen.
Table 4.8 Mechanism investigation.
ExperimentNumber
CatalystVMgO-70
Oxidant 15 bar TBHP (g) T
(°C)Conv.(%)
1 No He 0.015 80 0
2 0.05g He 0.05 80 0
3 0.05g He 0.012 80 0
4 Excess 0.5g He 0.15 80 0
Reactions conditions: 80°C, stirring speed 600 rpm, 15 bar O2 , decane (lOg), VMgO-70 (0.05g or 0.5g), TBHP (0.015, 0.05 and 0.012) and runtime (24 hours)
Entry 1 in Table 4.8 shows that without catalyst and oxygen, but with TBHP present, there is
no product, so radical initiator and alkane can not react together to give oxygenated products.
The role of TBHP [18] in the solution is to form the radical species
‘BuOO* + RH -» R* + 'BuOOH
This is normally followed by O2 insertion to give the hydroperoxide species (ROOH) but the
reaction was performed in an inert atmosphere so no oxygen available. So TBHP does not
supply oxygen to form the oxygenated products.
Entry 2 and 3 in Table 4.8 showed that with the presence of VMgO and TBHP without
oxygen, there still no conversion. An excess of catalyst (ten times the normal amount) was
tested in experiment 3 to give more oxygen available from the lattice of the catalyst, which
could react by direct docking with alkane and give a small amount of oxygenated products but
no conversion is observed. So we can conclude that the initiation step of the reaction is from
the reaction between oxygen gas with alkane or an alkyl radical to give hydroperoxide
90

(ROOH). No catalyst is needed for this initiation step. The limiting rate of the autoxidation
[19] is due to the production of a steady-state concentration of hydroperoxide (ROOH).
4.3.2.6. Test calcined and uncalcined catalysts (VMgO-70).
In order to determine if the phases present after calcination in VMgO-70 are responsible for
the activity of the catalyst at 80°C, the same reaction was performed with calcined and
uncalcined catalysts. The data for these results are shown in Table 4.9.
Table 4.9 Conversion and product profile with VMgO-70 calcined and uncalcined.
Cat.Conv.(%)
5/4one
3one
2one
5/4ol
3ol
2ol
1ol
c 5acid
c 6acid
c 7acid
c 8acid
c 9acid
C10
acid
calcined 0.10 21.2 13.6 13.8 7.5 4.7 8.4 1.0 13.6 5.9 4.4 3.5 0.8 1.4
Notcalcined 0.02 23.0 15.0 12.9 8.2 5.2 9.1 1.0 10.3 4.4 4.1 3.4 3.5 0
Reactions conditions: 80°C, stirring speed 600 rpm, 15 bar O2 , decane (lOg), VMgO-70 calcined and uncalcined (0.05g) and runtime (24 hours)
Calcined VMgO-70 gave higher conversion than uncalcined VMgO-70. It is a more active
catalyst after calcination for the oxidation of w-decane. The product distributions for both
catalysts are similar.
4.3.2.7. Leaching test at 80 °C.
Some experiments have been performed to determine if the observed catalysis of VMgO-70 at
80 °C is due to the leaching of vanadium into the solution generating an active homogeneous
catalyst. In order to test for the leaching, the solution was filtered off at the reaction
temperature after different runtime of reaction (lh and 8h) in order to prevent any soluble
vanadium from readsorbing onto the catalyst surface on cooling [20]. The filtrate was put
back in the autoclave to react further with any soluble vanadium present in the reaction
91

solution but no heterogeneous catalyst. The results are summarised in Table 4.10 and Table
4.11. After removal of the catalyst by filtration after lh or 8h, the filtrate was run for 23h or
16h respectively, which allow a comparison of conversion to a run with a catalyst during 24h.
Table 4.10 Removal of the catalyst by filtration after 1 h reaction.
Time(h)
Conv.(%)
5/4one
3one
2one
5/4ol
3ol
2ol
1ol
c 5acid
c 6acid
c 7acid
c 8acid
c 9acid
C10
acid
1 0 - -23 0.012 20.5 16.4 16.2 11.1 5.9 11.7 1.1 10.7 3.2 3.2 0 0 0
VMgO- 70
(24 h)0.13 25.2 14.5 15.1 7.4 4.6 7.6 0.7 10.7 5.9 4.7 2.4 0.3 1.0
Reactions conditions: 80°C, stirring speed 600 rpm, 15 bar O2 , decane (lOg), VMgO-70 (0.05g), filtration at 80°C after lh run and filtrate put back for 23h.
When the catalyst is removed after 1 hour, no conversion is observed. The conversion without
catalyst is lower than the conversion with catalyst.
Table 4.11 Removal of the catalyst by filtration after 8 h reaction.
Time00
Conv.(%)
5/4one
3one
2one
5/4ol
3ol
2ol
1ol
c 5acid
c 6acid
c 7acid
c 8acid
c 9acid
Qoacid
8 0.005 32.2 20.5 23.4 8.9 6.0 9.1 0 0 0 0 0 0 0
16 0.014 24.2 27.4 17.2 21.9 9.7 6.8 11.4 1.2 0 0 0 0 0VMgO-
70 (24 h)
0.13 25.2 25.2 14.5 15.1 7.4 4.6 7.6 0.7 10.7 5.9 4.7 2.4 0.3
Reactions conditions: 80°C, stirring speed 600 rpm, 15 bar O2, decane (lOg), VMgO-70 (0.05g), filtration at 80°C after 8h run and filtrate put back for 23h.
No autoxidation was detected using these experimental conditions and a conversion of 0.13%
is observed using VMgO-70 catalyst. The first leaching test (Table 4.10), corresponding to a
filtration of the catalyst after 1 hour, shows a conversion 10 times lower than the catalyst. One
of the reasons could be that a small amount of vanadium leaches into a solution, but it is not
92

enough to cause the observed catalysis. The second leaching test (Table 4.10) was done after
8hours. In Table 4.7, an induction period of 8 hours is needed before to see a very small
conversion. So the vanadium may take 8 hours to leach into the solution and this is
responsible for the conversion, but like it is observed in the second leaching test, the
conversion is 10 times lower than the conversion achieved by VMgO-70 after 24 hours. So
the induction period of 8 hours is not due to the times of the catalyst to leach in the solution.
4.3.2.8. Recycling of VMgO-70 at 80°C.
A first run with VMgO-70 was performed at 80°C during 24 hours. After the first reaction the
catalyst was recovered, by filtration and dried in air. A second run with the same catalyst was
performed.
Table 4.12 Conversion for the recycling experiments.
Catalyst Conversion(%)
Freshcatalyst 0.13
Recyclingcatalyst 0.11
The recycling experiment has showed that VMgO-70 catalyst does not lose its activity after a
second run and can be reused after reaction a second time.
4.3.3. Oxidation of /i-decane at 100°C.
4.3.3.1. Activity of VMgO-70.
After the interesting results obtained at 80°C, it was decided to see the effect of increasing the
temperature on the conversion and the product distribution. Increasing the temperature can
promote the activity of the catalyst but in this work it will promote as well the autoxidation of
93

«-decane described in chapter 3.
Table 4.13 Comparison of the activity of VMgO-70 to autoxidation at 100°C.
Cat.Conv.(%)
5/4one
3one
2one
5/4ol
3ol
2ol
1ol
c 5acid
c 6acid
c 7acid
c 8acid
c 9acid
C10
Acid
Blank 0.15 30.0 19.3 24.2 2.1 1.8 1.8 1.0 6.5 5.9 5.2 0 0 2.2
BlankRepeat 0.39 32.4 20.8 21.9 1.6 3.0 2.0 1.0 3.9 3.8 2.5 5.1 0 1.9
VMgO-70 3.90 24.4 13.1 16.6 4.4 2.6 4.4 0.5 14 8.2 5.6 4.2 0.4 1.6
VMgO-70
Repeatrun
5.0 24.0 12.8 16.0 4.6 3.0 4.6 0.4 13.8 8.0 6.2 4.3 0.5 1.5
Reactions conditions: 100°C, stirring speed 600 rpm, 15 bar O2 , decane (lOg), no catalyst or
VMgO-70 calcined (0.05g) and runtime (24 hours).
When no catalyst is present there is a limited autoxidation of the «-decane (0.15% of
conversion) while the effect of the vanadium loading in terms of catalytic performance is
immediately obvious with the VMgO-70 sample showing a conversion of 3.9 % to 5.0% over
a 24 hours period. It is interesting to note that the product distribution profile is the same for
all four reactions, which may indicate that the reaction mechanism or at least the controlling
factor for the regio-selectivity is the same in each case. The enhanced reaction rate for the
VMgO-70 must be controlled by the thermodynamics of the C-H bond dissociation as the
case for the autoxidation, which decrease from 104 kcal mol'1 to 94.6 kcal mol'1 in going from
primary to secondary carbon, the corresponding selectivity increase [21].
4.3.3.I.I. Time on line.
A time on line study for VMgO-70 (Table 4.14) shows an initiation period of at least 8 hours
while an active species is generated (This is also the case for the autoxidation reaction)
94

Table 4.14 Time on line study.
Time00
Conv.(%)
5/4one
3one
2one
5/4ol
3ol
2ol
1ol
c 5acid
c 6acid
c 7acid
c 8acid
c 9acid
C10
acid
4 0 1.1
8 0.20 23.3 13.9 14.5 7.3 4.7 8.5 1.2 9.3 5.8 7.3 2.6 0.4 1.1
16 1.32 23.5 14.4 15.1 5.7 3.7 5.4 0.6 12.1 7.3 6.4 3.8 0.4 1.6
24 5.0 24.0 12.8 16.0 4.6 3.0 4.6 0.4 13.8 8.0 6.2 4.3 0.5 1.5Reactions conditions: 100°C, stirring speed 600 rpm, 15 bar O2 , decane (lOg),
VMgO-70 calcined (0.05g) and runtime (24 hours).
The product profile for low conversion (8 hours run) is the same as observed at higher
conversion (5%) for ketones, alcohols and cracked acids. The nature of this induction period
could be due to the establishing of an active species.
4.3.3.I.2. Activity of VMgO-70 with a radical initiator.
The activity of VMgO-70 with the presence of a radical initiator was investigated at 100°C.
Results are summarised in Table 4.15 and 4.16.
95

Table 4.15 Activity of VMgO-70 with the presence of a radical initiator.
Cat. Conv.(%)
5/4one
3one
2one
5/4ol
3ol
2ol
1ol
c 5acid
c 6acid
c 7acid
c 8acid
c 9acid
C,oAcid
OnlyBPO 0.39 15.9 9.1 10.4 23.6 13.3 16.0 3.1 2.0 1.4 3.1 0.3 0.9 1.1
VMgO-70 5.0 24.0 12.8 16.0 4.6 3.0 4.6 0.4 13.8 8.0 6.2 4.3 0.5 1.5
VMgO-70+
BPO
0.36 14.7 8.5 9.4 23.8 13.6 15.7 2.7 2.9 1.8 3.4 0.5 1.8 1.2
VMgO-70+
BPO
0.39 14.6 8.4 9.6 23.7 13.7 16.3 3 2.8 1.7 3.0 0.5 1.8 0.9
OnlyTBHP 0.80 36.5 20.3 24.7 1.8 1.2 2.3 0.4 4.7 2.9 2.6 0.5 0.2 2.0
VMgO-70+
TBHP
4.82 25.2 13.3 16.5 4.6 2.8 4.4 0.4 13.6 0.4 7.5 5.8 3.9 0.5
VMgO-70+
TBHP
4.43 25.1 13.2 16.6 4.3 2.6 4.0 0.3 13.8 7.9 5.9 4.2 0.5 1.5
Reactions conditions: 100°C, stirring speed 600 rpm, 15 bar O2 , rc-decane (lOg), VMgO-70 (50 mg), 0.05g TBHP or 0.125 g BPO and runtime (24 hours)

Table 4.16 Product profile comparison.
Catalyst Ketones(%)
InternalAlcohols
(%)
Terminal Selectivity (%)
Cracked acids (%)
Only BPO 35.4 52.9 3.1 7.7
VMgO-70 52.8 12.2 1.9 32.8
VMgO-70+
BPO
32.6 53.1 3.9 10.4
Only TBHP 81.5 5.3 2.4 10.9
VMgO-70+
TBHP
55 11.8 1.8 32.3
The addition of TBHP at the beginning of the reaction showed an activity similar to VMgO
on its own. However no difference has been seen using VMgO-70 and BPO. It is interesting
to note that the products profile is different when BPO is used as radical initiator for the
reaction. With BPO more internal alcohols than ketones in the product profile. The reverse is
observed for VMgO-70 alone, VMgO-70 with TBHP. A very slight increase of the selectivity
of 1-decanol using BPO is also detected but still below the baseline described in Chapter 3
for the autoxidation at 100°C, which showed that the terminal selectivity can oscillate
between 0.3 to 4.1 %.
4.3.3.1.3. Use a radical scavenger.
The use of a radical scavenger (Table 4.17) can help identify whether radical species are kept
to the reaction mechanism. If there is conversion that means it is not a radical mechanism, if
there is an inhibition of the reaction that means the reaction occurs via a radical mechanism.
97
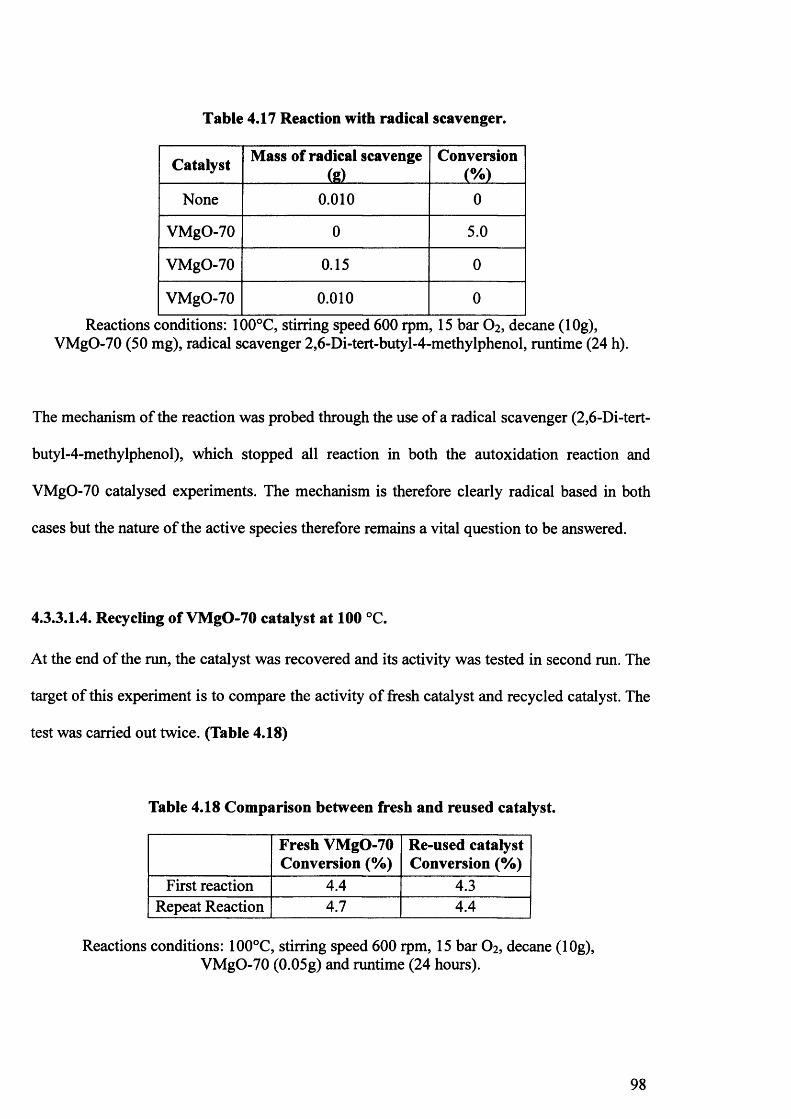
Table 4.17 Reaction with radical scavenger.
Catalyst Mass of radical scavenge (g)
Conversion(%)
None 0.010 0
VMgO-70 0 5.0
VMgO-70 0.15 0
VMgO-70 0.010 0
Reactions conditions: 100°C, stirring speed 600 rpm, 15 bar O2 , decane (lOg), VMgO-70 (50 mg), radical scavenger 2,6-Di-tert-butyl-4-methylphenol, runtime (24 h).
The mechanism of the reaction was probed through the use of a radical scavenger (2,6-Di-tert-
butyl-4-methylphenol), which stopped all reaction in both the autoxidation reaction and
VMgO-70 catalysed experiments. The mechanism is therefore clearly radical based in both
cases but the nature of the active species therefore remains a vital question to be answered.
4.3.3.I.4. Recycling of VMgO-70 catalyst at 100 °C.
At the end of the run, the catalyst was recovered and its activity was tested in second run. The
target of this experiment is to compare the activity of fresh catalyst and recycled catalyst. The
test was carried out twice. (Table 4.18)
Table 4.18 Comparison between fresh and reused catalyst.
Fresh VMgO-70 Conversion (%)
Re-used catalyst Conversion (%)
First reaction 4.4 4.3Repeat Reaction 4.7 4.4
Reactions conditions: 100°C, stirring speed 600 rpm, 15 bar O2 , decane (lOg), VMgO-70 (0.05g) and runtime (24 hours).
98
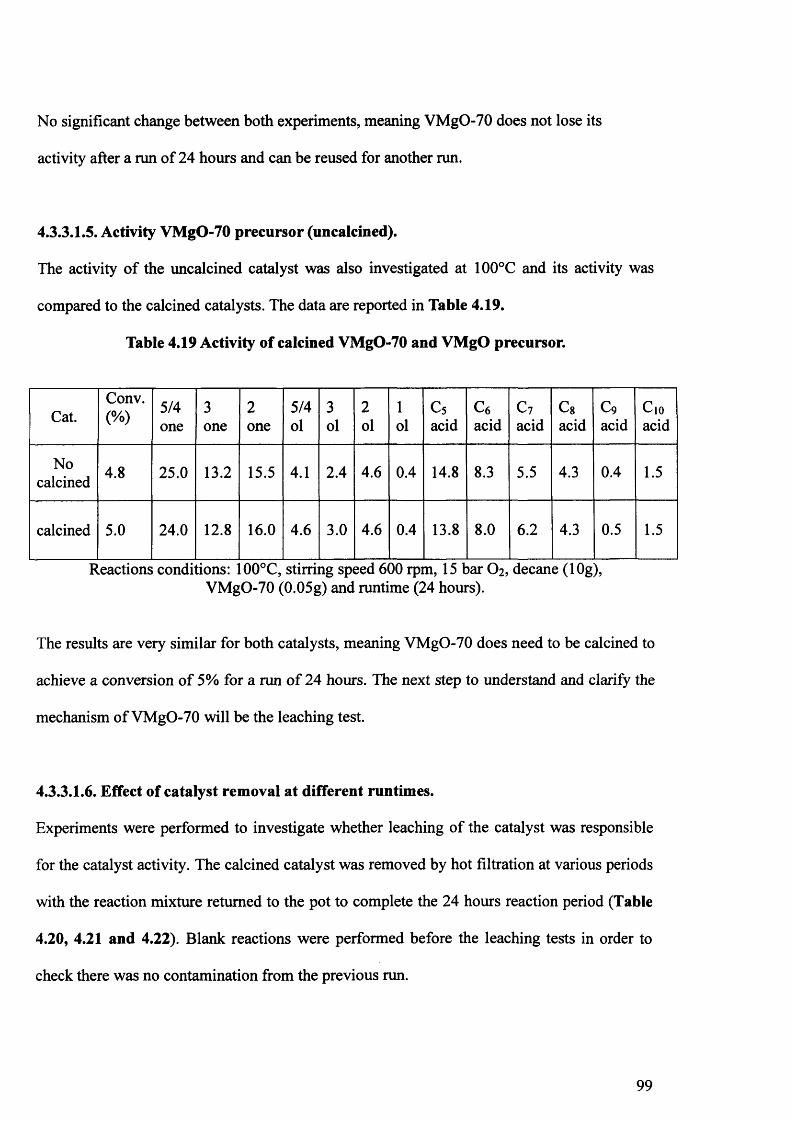
No significant change between both experiments, meaning VMgO-70 does not lose its
activity after a run of 24 hours and can be reused for another run.
4.3.3.1.5. Activity VMgO-70 precursor (uncalcined).
The activity of the uncalcined catalyst was also investigated at 100°C and its activity was
compared to the calcined catalysts. The data are reported in Table 4.19.
Table 4.19 Activity of calcined VMgO-70 and VMgO precursor.
Cat.Conv.(%)
5/4one
3one
2one
5/4ol
3ol
2ol
1ol
c 5acid
c 6acid
c 7acid
c 8acid
c 9acid
C10
acid
Nocalcined 4.8 25.0 13.2 15.5 4.1 2.4 4.6 0.4 14.8 8.3 5.5 4.3 0.4 1.5
calcined 5.0 24.0 12.8 16.0 4.6 3.0 4.6 0.4 13.8 8.0 6.2 4.3 0.5 1.5
Reactions conditions: 00°C, stirring speed 600 rpm, 15 bar O2 , decane (lOg),VMgO-70 (0.05g) and runtime (24 hours).
The results are very similar for both catalysts, meaning VMgO-70 does need to be calcined to
achieve a conversion of 5% for a run of 24 hours. The next step to understand and clarify the
mechanism of VMgO-70 will be the leaching test.
4.3.3.1.6. Effect of catalyst removal at different runtimes.
Experiments were performed to investigate whether leaching of the catalyst was responsible
for the catalyst activity. The calcined catalyst was removed by hot filtration at various periods
with the reaction mixture returned to the pot to complete the 24 hours reaction period (Table
4.20, 4.21 and 4.22). Blank reactions were performed before the leaching tests in order to
check there was no contamination from the previous run.
99

Table 4.20 Effect of catalyst removal after 15 minutes.
Time Conversion(%)
After 15 min 023h45 3.4
Filtration after 15 min of reaction at 100°C and put back the mixture (23h45 min) 100°C, 600rpm, 15 bar O2 , decane (lOg)
Table 4.21 Effect of catalyst removal after 8 hours.
Time Conversion(%)
After 8 h 0.0824h 2.08
Filtration after 8h of reaction at 100°C and put back the mixture 16h, 100°C,600 rpm, 15 bar O2
Table 4.22 Effect of catalyst removal after 16 hours.
Time Conversion(%)
After 16 h 1.0524h 3.50
Filtration after 16h of reaction at 100°C and put back the mixture 8h, 100°C,600 rpm, 15 bar O2
A level of conversion well above that recorded without catalyst were obtained even when the
mixture was exposed to the VMgO-70 catalyst for only 15 minutes, showing the process to be
homogeneous in nature rather than occurring on the surface of VMgO. Assuming it is the
leached vanadium that is active and then this shows the leaching of the material to be a fast
step (clearly happening to a large extent within the first 15 minutes).
4.3.3.1.7. ICP-MS of the filtrate at different runtimes.
In order to quantify the amount of V leaching from VMgO-70, sample of the organic layer
after different runtimes were submitted to ICP-MS. The data are reported in Table 4.23.
100

Table 4.23 Amount of vanadium detected by ICP -MS after different runtimes.
Runtime Vanadium Conversion(hours) (ppm) (%)
8 0.8 0.2016 <0.5 1.3224 <0.5 5.032 <0.5 8.1
Reactions conditions: 100°C, stirring speed 600 rpm, 15 bar O2, decane (lOg), VMgO-70 (0.05g) and runtime (8h, 16h, 24h and 32h).
Measurement of V content (ICP-MS) of the reaction mixture following removal of the solid
by filtration, showed the presence of vanadium in a concentration of <0.8 ppm in «-decane.
The leaching does not increase with the reaction time. A tiny amount of vanadium leached in
the solution and is responsible for the activity of the catalyst at 100°C. Less than 0.5 ppm of
homogeneous vanadium is responsible of the conversion. VMgO-70 is not a heterogeneous
catalyst at 100°C.
4.3.3.2. Activity of a homogeneous vanadium catalyst.
4.3.3.2.I. Vanadium oxytriethoxide as homogeneous catalyst.
In order to reproduce the leaching of VMgO-70, the activity of small amounts of
homogeneous vanadium was tested through the use of a homogeneous vanadium source V,
which is vanadium oxytriethoxide VO(OC2H5)3 (Figure 4.4) .
o11
CzHgQ" Y^CX^Hg OC2Hs
Figure 4.4 Vanadium oxytriethoxide (oxidation state + §).
101

A homogeneous vanadium catalyst has already been reported for the oxidation of linear
alkane in liquid phase [7]. Two different concentrations 0.1 ppm and 0.4 ppm of
homogeneous vanadium were tested as catalyst for the oxidation of w-decane at 100°C.
Table 4.24 Activity of 0.1 ppm of vanadium oxytriethoxide.
Time Conv. 5/4 3 2 5/4 3 2 1 c 5 c 6 c 7 c 8 c 9 C10
00 (%) one one one ol ol ol ol acid acid acid acid acid acid
8 0
16 0.07 23.5 14.4 16.1 5.7 3.7 5.4 0.6 12.1 7.3 5.4 3.8 0.4 1.6
24 0.64 23.0 14.5 16.6 4.4 2.6 4.4 0.5 10.0 8.2 5.6 4.2 4.4 1.6Reactions conditions: 100°C, stirring speed 600 rpm, 15 bar O2 , decane (lOg), 0.1 ppm of
vanadium oxytriethoxide and runtime (8h, 16h and 24h).
Table 4.25 Activity of 0.4 ppm of vanadium oxytriethoxide.
Time Conv. 5/4 3 2 5/4 3 2 1 c 5 c 6 c 7 c 8 c 9 C10
00 (%) one one one ol ol ol ol acid acid acid acid acid acid
8 0.16 22.2 12.6 13.8 7.5 4.7 8.4 1.0 13.6 5.9 4.4 3.5 0.8 1.4
16 1.9 24.4 13.1 16.6 4.4 3.6 3.4 0.5 14.0 8.2 5.6 4.4 0.3 1.5
24 3.71 24.3 13.2 16.6 4.5 2.8 4.4 0.5 14 8.2 5.6 3.9 0.4 1.6
Reactions conditions: 100°C, stirring speed 600 rpm, 15 bar O2 , decane (lOg), 0.1 ppm of vanadium oxytriethoxide and runtime (8h, 16h and 24h).
This homogeneous species in a concentration of 0.4 ppm shows good activity (3.71 %) over a
period of 24 hours. With a lower loading of 0.1 ppm, the conversion is reduced to 0.64 %. A
similar product distribution is observed with a majority of ketones, internal alcohols and
cracked acids.
102

4.3.3.2.2. Radical scavenger with homogeneous vanadium catalyst.
In order to elucidate if the mechanism of the homogeneous vanadium is a radical mechanism,
radical scavenger was added at the beginning of the reaction. This test has been carried out
twice (Table 4.26).
Table 4.26 Activity of vanadium salt with a radical scavenger.
Radical scavenger (g)
Time(h)
Conv.(%)
0.0115 24 0
0.0115 24 0
Reactions conditions: 24h,_100°C, 600 rpm, 15 bar O2, decane (lOg), 0.4 ppm V and 2, 6-Di-tert-butyl-4-methylphenol (C15H24O) (0.0115g) were added at the beginning of the
reaction.
No conversion after 24 hours with a radical scavenger, which demonstrates that the
mechanism is a radical mechanism.
4.3.3.3 Comparative data
A summary of the time on line at 100°C is presented in Table 4.27 for the autoxidation,
VMgO-70 and the homogeneous vanadium salt.
Table 4.27 Summary of time on line for autoxidation, VMgO-70 and the homogeneous vanadium salt.
Catalyst Conv. (%) at 8 hours
Conv. (%) at 16 hours
Conv (%) at 24 hours
0 .1 ppm 0 0.07 0.64
0.4 ppm 0.16 1.85 3.71
VMgo-70 0.06 1.5 3.4
Blank 0 0.04 0.18
It can be seen data for 0.4 ppm VO(C2H5)3 , map relatively well onto the data for VMgO-70,
with both showing a similar induction period of 8 hours.
103

4.4. Discussion.
At 80°C, no autoxidation is observed for a run of 24 hours (Table 4.4), meaning no
conversion of rc-decane without catalyst. Figure 4.3 showed that a minimum loading of 60%
is needed to observe in the XRD pattern the formation of active phases after calcination. A
loading of 60% of vanadium is also the minimum loading to see a conversion of w-decane at
80°C (Table 4.4). The conversion after 24 hours for uncalcined VMgO-70 is ten times lower
than VMgO-70 calcined (Table 4.9). From the literature [10] pyrovanadate (Mg2V2C>7) active
phase is common for calcination temperatures greater than 500°C [11]. The appearance of the
active phase on the XRD pattern matches with the appearance of activity of VMgO catalyst
for the oxidation of w-decane.
The question about the true nature of the catalytic reaction (homogeneous or heterogeneous)
is a serious one [21-22]. A heterogeneous catalyst which simply releases its active species
into solution is likely to have limited practical use [20]. Table 4.12-4.18 show that VMgO-70
does not lose its activity after recovering the catalyst from the first run and retesting for a
second time with the same experimental conditions. The conventional recycling of catalysts
several times without significant loss of activity is not a sufficient proof of heterogeneity [2 0 ].
The catalyst may act as reservoir, which slowly releases its active centres over the course of
several reactions.
Sheldon et al. [20] proposed three situations with the respect to leaching of a metal from a
catalyst into the solution. Firstly, the metal may leach but is not an active homogeneous
catalyst, secondly the metal leaches and does form an active homogeneous catalyst, and
thirdly the metal does not leach and the observed catalysis is truly heterogeneous.
104

Appropriate rigorous tests [20] for heterogeneity have been performed (Table 4.10-4.11 and
4.20-4.21-4.22). To test for leaching we filtered the catalyst and allowed the filtrate to react
further. Filtration was performed at the reaction temperature in order to avoid readsorption of
solubilized vanadium on cooling. Sheldon et al. [20] have found that after hot filtration, the
mother liquor (filtrate) reacted further at roughly the same rate as that observed when the
catalyst was not filtered. In contrast, if the mixture was allowed to cool to ambient
temperature prior to catalyst filtration, the procedure generally followed when testing for
leaching, little further reaction was observed. At 80°C the leaching tests (Table 4.10-4.11)
have showed that the filtration of the catalyst after lh or 8 h did not stop the conversion of n-
decane. The combination of these results is a strong indication that a heterogeneous
mechanism occurs at 80°C. This does not rule out a slow but practically insignificant
leaching.
The major difference between the reaction at 80°C and 100°C is the results of the leaching
test. At 100°C, the leached vanadium is responsible for the conversion. The leaching test after
15 min at 100°C showed that leaching is much more rapid than the catalysed reaction itself
(no conversion after 15 minutes), in which case there would be exclusively homogeneous
catalysis [20]. The test with homogeneous vanadium with the same concentration of
vanadium detected by ICP-MS is a strong indication that the leachate of vanadium is
responsible of the activity. The reaction profile (conversion and product distribution) was
almost identical which leads to the inevitable conclusion that all the observed activity can be
attributed to homogeneous vanadium leached from VMgO-70 at 100°C.
The addition of tert-butyl hydroperoxide (TBHP) led to a marked increase in rc-decane
oxidation, predominately because ROOH species are formed more rapidly by the use of
TBHP [18].
105

'BuO* + RH -> R* + ‘BuOOH
Following by O2 insertionR* + 0 2 -> ROO*
ROO* + RH -> ROOH + R*
However, the combination of benzoyl peroxide and VMgO-70 does not promote the
conversion of the reaction (Table 4.15). The same conversion is observed with and without
catalyst, which means that VMgO is inactive.
The first possibility is BPO is doing a deactivation of the catalyst and will explain this result.
BPO and TBHP give rise to very different intermediate free radicals. BPO undergoes
homolytic 0 -0 cleavage giving first to form benzoyloxy radicals [23] described in Chapter
3.
PhOCO-OCOPh — 2 PhCO-O*
The benzoyl peroxide may undergo a variety of reactions besides [23] including
decomposition to the phenyl radical and carbon dioxide and radical combination.
PhCO-O*—► Ph*+C02
PhCO-O* + Ph* -> PhCOOPh
The phenyl radical is classified as a rather nucleophilic free radical [BPO]. By contrast, TBHP
gives rise principally to t-Bu-O* and HO*, both are classified as electrophilic radicals [24].
Thus phenyl radical will attack centres of relatively low electron density, in inorganic
situations this often means binding to co-ordinatively unsaturated centres and this could mean
binding to active sites on oxidation catalysts (thereby killing the catalysis). Electrophilic
radicals such as t-Bu-O* will preferentially favour H-abstraction; in VMgO it may be difficult
for it to find a suitable site and so the effect on catalysis is invisible.
106

The second possibility is the formation of benzoic acid which performs an acid catalysed
decomposition of ROOH. After the homolytic cleavage, the benzoyl radical can react with n-
decane and remove a proton from the alkane to form benzoic acid [25]. ROOH is the first
species formed during the oxidation of alkane in liquid phase [18] and acid sites (acid
benzoic) will catalyse ROOH heterolytic decomposition and in the same time avoid the
propagation of the hydroxyl (OH*) and alkoxyl radical (RO*) the reaction [26-27] as
described in Chapter 2.
The mechanism study shows that the initiation step of the reaction is a reaction between
oxygen and w-decane. An initiation period of 6 hours is needed at 80°C and 4 hours at 100°C .
The induction period is the time needed with the experimental conditions used to reach the
minimum concentration of hydroperoxide (ROOH), which allows the propagation step of the
mechanism [19]. The initiation is a radical reaction between w-decane and oxygen and will
undergo the rules of the autoxidation reaction (CH2 easier to oxidise than CH3) [29] and will
explain the poor terminal selectivity. The time on line studies at 80°C and 100°C have showed
the poor activity of the catalyst during the first 8 hours of the reaction followed by an increase
in the rate. From the leaching test, it can be seen clearly that 8 hours is not the time needed by
VMgO-70 to leach in the solution. The reaction in inert atmosphere with an excess of catalyst
show no conversion so there is no direct docking of RH onto the VMgO-70 catalyst. The
metal catalysed decomposition of ROOH by V5+ [30] can involve homolotic pathways via
free radical intermediates and/or heterolytic oxygen transfer processes. V5+ can exhibit
acitivity for both reactions and the homolytic and heterolytic pathways give the same
products.
107

Figure 4.5 Homolytic and heterolytic decomposition of ROOH by vanadium [30].
Homolvtic Pathwavs
R02H ♦ Mn‘1 — ► RO* ♦ MnOH
R02H + Mn R02* + M^1 ♦ H+
2 R < v — 2 RO* + 0 2
RO + RH - - - - - - - — • > R* + ROM
R* + 0 2 - ► ro2*
R02* + RH - - - - - - - R* + R02H
HeteroMic Pathwavs
peroxometat
H+Mft + R02H — - - - - - - » Mn ° ^ 0^ R - A - » SO + MnOR
oxometalf
m " + ro2h : r P h . , Mn+2 — ► SO + Mi tI IO
S = substrate
The test (Table 4.17) with a radical scavenger indicates a free radical mechanism and the loss
of conversion using an inert gas (Table 4.8) suggest a homolytic pathway. The propagation of
the different radical from the homolytic decomposition of the hydroperoxide (ROOH) by
vanadium will act as oxidation initiators for further oxidative reaction.
108

4.5. Conclusion.
The target of the work is to find out a heterogeneous catalyst which can oxidise H-decane in
terminal position to form 1-decanol in liquid phase. These results of this chapter have showed
that VMgO catalyst with a minimum loading of vanadium can catalyse the oxidation of n-
decane at 80°C and 100°C with oxygen and give better conversion than the autoxidation but
did not increase the terminal selectivity. It can be conclude that vanadium is an active catalyst
for the oxidation of alkanes homogeneously and heterogeneously at low temperatures in
liquid phase but did not play a significant role in the product distribution, which is similar to
those observed for the autoxidation with a modest terminal selectivity.
109

4.6. References.
[1] B. M. Weckhuysen, D.E. Keller, Catalysis Today 78, (2003), 25.
[2] X. Gao, P. Ruiz, Q. Xin, X. Guo, B. Delmont, Journal of Catalysis 148, (1994), 56.
[3] P.M. Michalakos, M.C. Kung, H.H. Kung, Journal of American Chemical Society,
Division of Petroleum Chemistry 37, (1992), 1201.
[4] R. Burch, E.M. Crabb, Applied Catalysis A: General, 100 (1), (1993), 111.
[5] A.A. Lemonidou, Applied Catalysis A: General, 216, (2001), 277.
[6 ] M.A. Chaar, D. Patel, M.C. Kung, H.H. Kung, Journal of Catalysis 105, 2, (1987), 483.
[7] G. Suss-Fink, L. Gonzalez, G.B. Shul’pin, Applied Catalysis A: General, 217, (2001) 111.
[8 ] H. B. Friedrich, N. Govender, M. R. Mathebula, Applied Catalysis A: General, 297,
(2006), 81.
[9] R.X. Valenzuela, V. Cortes Corberan, Topics in Catalysis 11/12, (2000), 153.
[10]M.D. Argyle, K. Chen, A. T. Bell, E. Iglesia., Journal of Catalysis, 208, (2002) 139.
[11] M.A. Chaar, D. Patel, M.C. Kung, H.H. Kung, Journal of Catalysis, 105, (1987), 485.
[12] P.M. Michalakos, M.C. Kung, I. Jahan and H.H. Kung, Journal of Catalysis, 140, (1993),
226.
[13] A. Corma, J.M. Lopez Nieto, N. Parades, Journal of Catalysis, 144, (1993) 425.
[14] Y. Sakurai, T. Suzaki, K. Nakagawa, N. Ikenaga, H. Aota and T. Suzuki, Journal of
Catalysis 209, (2002), 16.
[15] B. Solsona, A. Dejoz, M.I. Vazquez, F. Marquez , J.M. Lopez Nieto, Applied Catalysis
A: General 208, (2001), 99.
[16] A. Burrows, C.J. Kiely , J. Perregaard , P.E. Hojlund-Nielsen , G. Vorbeck , Catalysis
Letters 57,(1999), 121.
[17] R. Deshpande, R. Madhukar, H. Vilas, V. Raghunath, U.S. Patent No. 976737, (2004).
110

[18] B. Moden, B. Zhan , J. Dakka, J.G. Santiesteban, E. Iglesia, Journal of Catalysis 239,
(2006), 390.
[19] Y. Kamiya, K.U. Ingold, Canadian Journal of Chemistry, 42, (1964), 242.
[20] R. A. Sheldon, M. Wallau, I.C.E. Arends and U. Schuchardt, Accounts of Chemical
Research, 31, (1998), 485.
[21] Y. Deng, C. Lettmann, W.F. Maier, Applied Catalysis A: General 214, (2001) 31.
[22] M. Besson, P. Gallezot, Catalysis Today 81, (2003), 547.
[23] Encyclopedia of polymer science and engineering, volume 11, Mark, Bikales,
Overberger, Menges, Wiley & Sons, New York, (1988).
[24] Personnal Communication: Professor Donald bethel, Emeritus Professor of Physical
Organic Chemistry, University of Liverpool.
[25] E.T. Denisov, T.G. denisova and T.S. Pokidova, Handbook of Free Radical Initiators,
Wiley-Interscience, (2003).
[26] H. Sun, F. Blatter, H. Frei, Journal of American Chemical Society, 118, (1996), 6873.
[27] N. Kuprowicz, J.S. Ervin, S. Zabamick, Fuel, 83, (2004), 1795.
[28] B.M. Weckhuysen, D.E. Keller, Catalysis Today, 78, (2003), 25.
[29] J. M. Thomas, R. Raja, G. Sankar, R.G. Bell, Nature, 398, (1999), 227.
[30] R.A. Sheldon, I.W.C.E. Arends, H.E.B. Lempers, Catalysis Today, 41, (1998), 387.
I l l

Chapter 5
Liquid phase oxidation of w-decane over
zeolite catalysts
5.1. Introduction.
Zeolites or molecular sieves are ideal catalytic materials for shape selective catalysis because
they contain channels of varying size and shape, which can influence selectivity in catalytic
reactions [1-4]. To assess the role of spatial constraints on regioselectivity, different sizes of
pores were used. The characteristics of the different zeolites used in this study are listed in
Table 5.1.
Table 5.1 Characteristics of selected zeolites.
Zeolites Nominal cation SKVAhOs mole ratio
Size of the pores (A) [51
Modemite Ammonium 20 7Y-zeolites Hydrogen 80 8
ZSM-5 Ammonium 23, 30, 80, 280 5
Mordenite, Y and ZSM-5 zeolites have different SiCVAkOs mole ratios, which allows
different loading of redox-active cations [6 ]. The kinetic diameter of a linear hydrocarbon is
4.3 A [7]. This indicates that «-decane has access to the micropore of all the zeolites
(ammonium or hydrogen form) tested. Silanation or ion exchange with cobalt of zeolites can
block the entrance of the pores and make it more difficult for w-decane to go inside the
channels. The geometric constraints of zeolites were used with the aim of controlling the
selective heterogeneous functionalisation of H-decane in liquid phase with oxygen.
112

5.2. Experimental.
5.2.1. Preparation of proton zeolites.
Zeolites have negatively charged frameworks [8 ], which is compensated by a nominal cation.
The zeolites were initially heated to 500°C for 3 h in air to remove organic templates left used
after the synthesis of the zeolites and to obtain the proton form of the zeolites [9].
5.2.2. Preparation of cobalt zeolites.
Co-zeolites were exchanged by solid state ion exchange (SSIE) [6 ]. Different Co/Al ratios
were prepared. Table 5.2 and 5.3 are a summary of the different theoretical cobalt loaded
zeolites. Two different rates of increasing the temperature (20°C per minute and 3°C per
minute) were investigated during the solid state ion exchange process. A long washing
process was used to prevent non exchanged metal being present, which can act as a
homogeneous catalyst in liquid phase (see Chapter 2). The oxidation state of cobalt is Co2+.
Table 5.2 List of different Co-zeolites prepared with a calcination rate of 20°C/min.
Zeolites SKV A120 3
mole ratioTheoretical Co/Al ratio
Modemite 2 0 1
Y-zeolites 80 1
ZSM-5 280 1
ZSM-5 80 1
ZSM-5 30 0 .1 , 0 .2 , 1 and 2
ZSM-5 23 0 .1 , 0 .2 , 1 and 2
Table 5.3 List of different Co-ZSM-5 prepared with a calcination rate of 3°C/min.
Zeolites SiOi/AhOa Mole ratio
Theoritical Co/Al ratio
ZSM-5 30 0.1-Co1-Co
113

The number before the catalyst is the ratio of cobalt/aluminium used in the physical mixture
at the beginning of the solid state ion exchange. (O.l-Co-ZSM-5 will be used for a catalyst,
which has been prepared with an initial physical mixture of Co/Al with a ratio of 0.1)
5.2.3. Preparation of silanated zeolites.
During the solid state ion exchange, cobalt can be deposited on the surface of the zeolites or
inside the channels. Cobalt on the surface will give an unselective reaction (no geometric
constraint). Silanation decreases the number of sites available to anchor cobalt on the
external surface of the zeolites and will favour the incorporation of cobalt inside the pores,
which may then give a selective reaction using the spatial constraints [10]. After silanation,
silanated zeolites were ion exchanged with a theoretical ratio Co/Al equal to one. The effect
of silanation on the structure and catalytic behaviour of ZSM-5 with a SiCV AI2O3 mole ratio
of 23, 30 and 80 has been investigated (Table 5.4).
Table 5.4 List of different silanated zeolites prepared.
Zeolites SiCV A I 2 O 3
Mole ratioTheoritical Co/Al loading
after silanationZSM-5 23 1
ZSM-5 30 1
ZSM-5 80 1
5.3. Catalyst characterization.
The techniques of XRD, BET, TGA and XPS have been used to characterize the catalysts.
ICP-MS was used to detect the cobalt loading after preparation.
114

5.3.1. X-ray diffraction.
5.3.1.1. Introduction.
The following section describes the analysis of the samples using XRD. The crystallinity
measured by XRD of the samples was calculated using the following formula [11-12].
Crystallinity (%)= [(sum of the 3 major peaks of Co-zeolites)/(sum of the 3 major peaks of H-zeolites)] X 100
The calculations are based on the three major peaks occurring at 23.06, 23.26 and 24.31
degrees 2 Theta on the XRD diffractogram. The proton form of the sample was considered as
a reference sample for these calculations. The proton form was run twice and a percentage of
crystallinity of 99% was found with repeat examinations showing a very low percentage error
for the sample. However there is a problem associated with this crystallinity measured by
XRD method in that the intensities of the peaks for ion exchanged zeolites are influenced by
the in-going cation [13-14]. The intensity of the reflections peaks of the exchanged zeolites
decrease compared to the zeolites framework XRD pattern.
115

5.3.1.2 Cobalt zeolites prepared by SSIE with a calcination rate of 20°C per minute.
The X-ray diffractograms of H-mordenite calcined and 1-Co-mordenite catalysts are shown in
Figure 5.1. The quantity of material used for each XRD diffractograme is 0.3g.
esoo
1600-
1400-
1200 -
1000 -
800-
600-
400-
200 -
B
T40
20 degrees
Figure 5.1 XRD patterns H-mordenite calcined (A) and 1-Co-mordenite (B) catalysts.
Crystallinity (%) = 69 %
This data indicated that the cobalt-modified samples did not exhibit detectable shifts of peaks
with respect to the parent zeolites (H-mordenite). However, a decrease of line intensities can
be seen. 31 % of the crystallinity measured by XRD is lost after solid state ion exchange with
cobalt.
116

3 0 0 0 -1
2 5 0 0 -
2000 -
1 5 0 0 -czZ3
81000 -
5 0 0 -
0-
20 4 0
2 e degrees
Figure 5.2 XRD patterns of H-Y zeolite (A) and 1-Co-Y-zeolite (B).
Crystallinity (%) = 65 %
For 1-Co-Y zeolites the diffraction peaks obtained are only attributed to zeolite structure, in
particular, no cobalt species could be identified. 35 % of the crystallinity measured by XRD is
lost after solid state ion exchange with cobalt.
117

2200 -
2000 -
1800 -
1600 -
1400■52tz38
1200-
1000 -
8 0 0 -
6 0 0 -
4 0 0 -
200 -
0 -20 40
2 0 d e g r e e s
Figure 5.3 The XRD patterns of H-ZSM-5 (Si02/ Al2O3=280) (A) and 1-Co- ZSM-5 (B) (SiCV Al2O3=280).
Crystallinity (%) = 95 %
Crystallinity measured by XRD is retained after ion exchange with a theoretical loading of 1-
Co/Al with a ZSM-5 which has a Si02/ AI2O3 molar ratio of 280. No additional reflections are
observed after preparation.
1 8 0 0 -
1 6 0 0 -
1 4 0 0 -
1200 -
</> 1 0 0 O -
8 8 0 0 -
6 0 0 -
4 0 0 -
200 -
O -
4 020
2 6 d e g r e e s
Figure 5.4 The XRD patterns of H-ZSM-5 (SiCV A120 3 =80) (A) and l-Co-ZSM-5 (B) (SiCV AI20 3 =80).
Crystallinity (%) = 81 %
118

A lower crystallinity measured by XRD for SiCVAbC^ molar ratio of 80 is observed after
ion exchange with a theoretical loading of 1-Co/Al than with H-ZSM-5 (SiCVAkCb =280). It
should be noted that the theoretical loading of cobalt (1-Co/Al) for both H-ZSM-5 (SiCV
AI2O3 =280 and SiCVAbC^ =80) is the same but the amount of cobalt loaded in H-ZSM-5
with a molar ratio of SiCVAfeOs =80 is higher than ZSM-5 with a molar ratio of SiCV AI2O3
=280.
1 8 0 0 -
1 6 0 0 -
1 4 0 0 -
1200 -
<2c= 1000 -
8 0 0 -
6 0 0 -
4 0 0 -
200 -
0-
20 4 0
2 0 degrees
Figure 5.5 The XRD patterns of Si-ZSM-5 (SiCV AI2O3 =280) (A) and 1-Co-silanated ZSM-5 (B) (SiCV A120 3 =280).
Crystallinity (%) = 80 %
The XRD of l-Co-silanated-ZSM-5 and silanated ZSM-5 are given for comparison (Figure
5.5). XRD measurements revealed the same structure and a decrease in crystallinity of 20%.
119

ZSM -5 (Silica/Alumina=30)
20000 - 2 Co
1 Co1 5 0 0 0 -
c3o<-> 10000 -
0.2 Co
0.1 Co5 0 0 0 -
0-
10 20 3 0 4 0 5 0
2 0°
F i g u r e 5 . 6 T h e X R D p a t t e r n s o f Z S M - 5 ( S i C V A I 2 O 3 = 3 0 ) o f t h e d i f f e r e n t l o a d i n g o f
c o b a l t , H - Z S M - 5 ( H ) , 0 . 1 c o b a l t l o a d i n g ( 0 . 1 - C o ) , 0 . 2 c o b a l t l o a d i n g ( 0 . 2 - C o ) , 1 c o b a l t
l o a d i n g ( 1 - C o ) , 2 c o b a l t ( 2 - C o ) l o a d i n g .
From the XRD analyses ( F i g u r e 5 . 6 ) , ZSM-5 was identified as the only crystalline phase. The
XRD patterns show that when the amount of cobalt is increased by solid state ion exchange a
greater loss of crystallinity is observed. The crystallinity of the samples, as determined by
XRD is shown in F i g u r e 5 . 8 for these samples.
120

20000 - ___L
ZSM-5 (Silica/Alumina=30)
- - T i n , - . r ~ Si 1Co
15000-
% 100003OO
5000-- J L I '— r niiM a~mi A A m ni ‘
Si
H
0 - - NK
T ”10
~T ~20
“ T~30
~r~ 40
~I50
2 6°
Figure 5.7 The XRD patterns of ZSM-5 (Si02/ A120 3 =30), NH4-ZSM-5 (NH4), H-ZSM-5 (H), silanated-ZSM-5 (Si), 1-Co/Al after silanation (Si-l-Co).
No changes were observed between the proton forms (H) and the silanated sample (Si)
meaning the silanation under these conditions does not affect the structure of the zeolites.
However the solid state ion exchange with cobalt decreases the crystallinity of the zeolites
although no additional peaks from the silanation and cobalt exchange were observed. From
Figure 5.7, it easy to see that the silanation decreases the crystallinity of the zeolites.
121

XRD- % crystallinity
NH4 H Si Si 1 Co 0,1 Co 0,2 Co 1 Co 2 Co
F i g u r e 5 . 8 P e r c e n t a g e o f c r y s t a l l i n i t y o f e a c h z e o l i t e s ( S i C V A I 2O 3 = 3 0 ) .
From the T a b l e 5 . 8 , it can be observed that the percentage crystallinity decreases gradually
with cobalt loading. This may due to the quick evolution of HCI/H2O during the calcination
step of the solid state ion exchange leading to the dealumination or the high temperature used
for its preparation [15]. It may also due to a distortion of the zeolites surface by insertion
cobalt incorporation in the pores.
122

ZSM-5 (Silica/Alumina=23)
20000- 2 cobalt
1 cobalt15000-
0.2 cobaltc=3Oo 10000 -
0.1 cobalt5000-
H-Formo-
10 3020 40 50
2e°
Figure 5.9 display the XRD patterns of ZSM-5 (SiCV AI2O3 =23) of the different loading of cobalt, H-ZSM-5 (H), 0.1 cobalt loading (0.1-Co), 0.2 cobalt loading (0.2-Co), 1 cobalt
loading (1-Co), 2 cobalt (2-Co) loading.
As observed for the ZSM-5 with a SiCVAfeOs = 30, when more cobalt is loaded in the
zeolites the intensity of the peaks decreases by a larger amount, indicating a greater loss of
crystallinity in the sample.
123
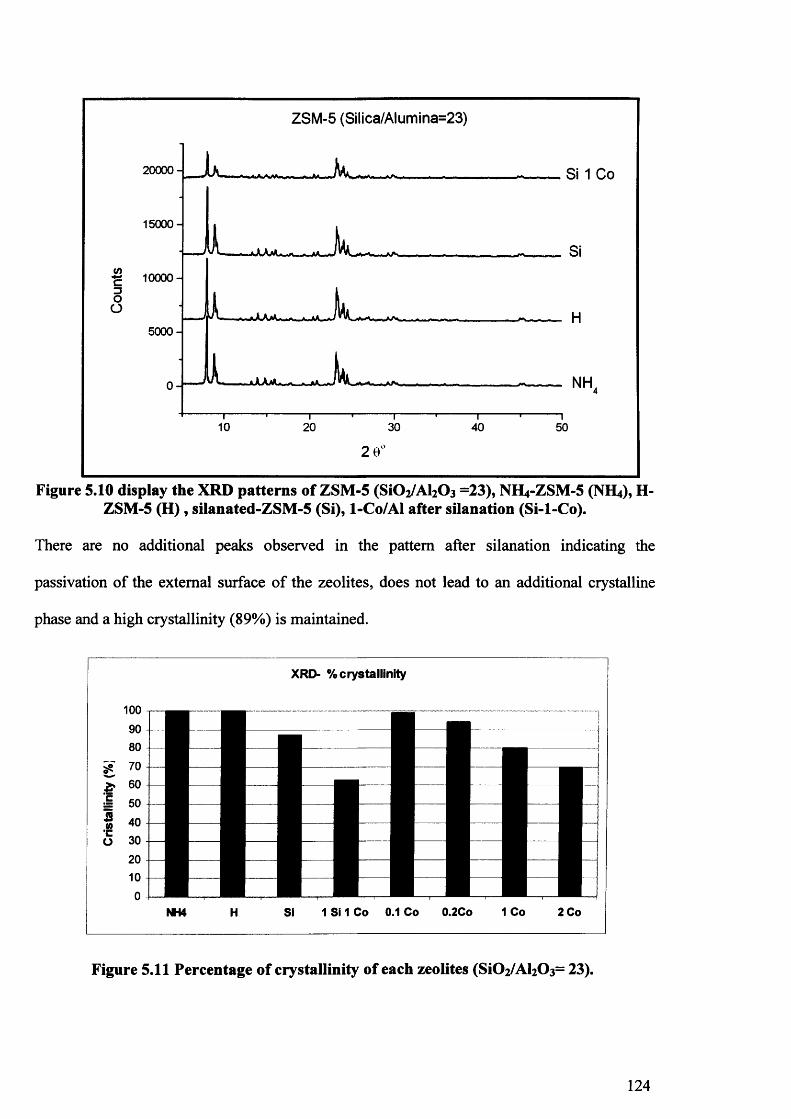
ZSM-5 (Silica/Alumina=23)
20000 - _ _ h _ n ifh ii * n Si 1 Co
15000-
10000-1D O O
5000-
0 -’
I I I >,AAM« .H w AA ■
^ L w V m A / V
-i A___
Si
H
NH
—i--------1--------f-20 30
2 0°
10 40 50
F i g u r e 5 . 1 0 d i s p l a y t h e X R D p a t t e r n s o f Z S M - 5 ( S i O i / A b O j = 2 3 ) , N H 4 - Z S M - 5 ( N H 4) , H -
Z S M - 5 ( H ) , s i l a n a t e d - Z S M - 5 ( S i ) , 1 - C o / A l a f t e r s i l a n a t i o n ( S i - l - C o ) .
There are no additional peaks observed in the pattern after silanation indicating the
passivation of the external surface of the zeolites, does not lead to an additional crystalline
phase and a high crystallinity (89%) is maintained.
XRD- % crystallinity
F i g u r e 5 . 1 1 P e r c e n t a g e o f c r y s t a l l i n i t y o f e a c h z e o l i t e s ( S i C V A h C ^ 2 3 ) .
124

When we compare the results for the crystallinity for the ZSM-5 with a silica ratio 23 and 30
(Table 5.7), it can be seen in both cases that the crystallinity measured by XRD decreases
with cobalt loading. Lower crystallinity is observed for the same loading of Co/Al for a
silanated zeolites than unsilanated.
5.3.1.3. Cobalt zeolites prepared by SSIE with a calcination rate of 3°C per minute.
During the calcination step of the solid state ion exchanged [16], C0 CI2 .6 H2O is melted with
the evolution of HCI/H2O , which can lead to dealumination of the zeolites and may be
responsible for the lose of crystallinity observed in the previous sample when cobalt loading
is increased. To try to eliminate this effect, a lower temperature rate (3°C /min) with a very
thin bed (~0.5 cm) was used (Figure 5.12).
12000 -11000 -10000 -9000 -
8000
7000 -
6000 -
5000 -
4000 -
3000 -
2000 -
1000 -
O -5030 402010
2 O d e g r e e s
Figure 5.12 display the XRD patterns of ZSM-5 (SiCV AI2O3 =30), H-ZSM-5 (A),O.l-Co ZSM-5 (B), l-Co-ZSM-5 (C).
Table 5.5 Comparison of the crystallinity.
Theoreticalloading
Crystallinity (%) (3°C / min)
Crystallinity (%) (20°C/ min)
0.1-Co 93 921-Co 83 78
125

Decreasing the heating rate of the calcination step of the solid state ion exchange with a very
thin bed does not improve the crystallinity of the sample after solid state ion exchanged. Very
similar results are observed for both rates used.
5.3.2. Thermal Gravimetric Analysis (TGA).
After the washing procedure of the solid state ion exchange, the zeolites were dried in air at
room temperature. Zeolites are hydrophilic and can adsorb water [17]. Before performing
BET and micropore analysis of the different zeolites, TGA was carried out in order to
determine the time and the temperature to outgas the samples for BET analysis to remove the
water from the pores. TGA was also used to determine the time to heat the zeolites before
catalyst testing.
Table 5.6 Percentage by mass of water lost for different zeolites.
Catalyst Water lost by masses (%)
NH4-ZSM- 5
(Si02/Al20 3 = 30) 5.6 %
NH4-ZSM- 5
(Si02/Al20 3 = 23) 8.2 %
l-Co-ZSM-5 (Si02/Al20 3 = 30) 7.4 %
2-Co-ZSM-5 (Si02/Al20 3 = 23) 11.5%
Table 5.6 shows that a large amount by mass of water can be retained by the zeolites from the
washing procedure or from the atmosphere. A maximum temperature of 300 °C was used to
avoid the decomposition of the ammonium ion to the proton form which occurs at 400 °C. To
126

ensure no residual moisture was present on the zeolite catalyst, they were transferred into the
reactor immediately after treatment in dry air at 300°C for 5h. Correct outgasing of the sample
before BET and micropore volume analysis is an important step. Following the TGA
experiments, the outgasing method used for BET and micropore volume analysis was
maintained at 300°C overnight before analysis.
5.3.3. BET and micropore volume.
BET analysis and porosity measurements were carried out using Autosorb apparatus at
-196 °C with liquid nitrogen. The internal surface of the zeolites is highly accessible and can
compose more than 98% of the total surface area [18].
Table 5.7 Surface area and micropore volume of the proton form zeolites.
H-Zeolites Surface Area (m2/g)
Pore Volume (cm3/g)
Modemite (Si02/ Al2O3=20)
457 0.152
Y-zeolites(Silica/Alumina=80)
809 0.253
ZSM-5 (Si02/ Al20 3=23)
529 0.145
ZSM-5(SiO2/A l2O3=30)
494 0.119
ZSM-5 (Si02/ Al2O3=80)
487 0.178
ZSM-5 (Si02/ Al2O3=280)
461 0.140
Zeolites have a very high surface area. To estimate the experimental error of these data on the
surface area and the pore volume, the same samples (ZSM-5 with a silica /alumina =280)
were run twice. The first surface area found was 461 m2/g and the second surface area found
is 447 m2/g, so a difference of 14 m2/g which gives an error percentage of 3 %. For the pore
volume the first result is 0.140 cm3/g and the second result is 0.136 cm3/g, so a difference of
0.004 cm3/g, which gives an error percentage of 2.9 %.
127

Table 5.8 Surface area and micropore volume after solid state ion exchange with aphysical mixture of 1-Co/Al.
1-Co-Zeolites Surface Area (m2/g)
Pore Volume (cm3/g)
Modemite (S i02/ Al2O3=20)
418(457) 0.133 (0.152)
Y-zeolites(SiO2/A l2O3=80)
717(809) 0.196 (0.253)
ZSM-5 (Si02/ Al20 3=23)
299 (529) 0.096 (0.145)
ZSM-5 (Si02/ Al2O3=30)
377 (494) 0.114(0.119)
ZSM-5(SiO2/A l2O3=80)
407 (487) 0.076 (0.178)
ZSM-5 (Si02/ Al2O3=280)
390(461) 0.098 (0.140)
Different surface area and micropore volumes were found compared to the start material
(number in the parentheses). BET indicates that cobalt incorporation decreases the surface
area and the micropore volume of the zeolites.
600 Y
500
\ 400
| 300s•g 2 0 0
j)
0 -INH4 H Si Si 1 Co 0.1 Co 0.2 Co 1 Co 2 Co
Cobalt loading
Figure 5.13 Surface area for ZSM-5 (SiCV Al2 0 3 =2 3 ).
128

The more cobalt that is loaded into the zeolites, the more the surface area decreases and
silanation of the sample followed by solid state ion exchange with 1 Co/Al means the surface
area is less than half that of the starting material.
Examining the XRD percentage crystallinity, the BET surface area measurement and the
micropore volume, the silanation followed by solid state ion exchange with 1-Co/Al appears
to block the pores. Increasing the number of sites exchanged with cobalt leads to a decrease in
the micropore volume, indicating cobalt can go inside the pores with the solid state ion
exchange method.
0.160
0.140
0.120
0.100
■= 0.080
c 0.060 o a.0 0.040
0.020
0.000NH4 Si Si 1 Co 0.1 Co
Cobalt Loading0.2 Co 1 Co 2 Co
Figure 5.14 M icropore volume for ZSM-5 (SiCV Al2(>3= 23).
The BET and micropore volumes for the ZSM-5 (silica/alumina = 30) are presented in Figure
5.15.
129

600
o>Te
3CO
NH4 H Si Si 1 Co 0,1 Co 0,2 Co 1 CoCobalt loading
2 Co
Figure 5.15 BET for ZSM-5 (SiO2/ AI2O3=30).
0.160
0.140
E 0.120
0.100
o 0.080
0.060
I
C 0.040
0.020
0.000H Si Si 1 Co 0,1 Co 0,2 Co
Cobalt Loading1 Co 2 Co
Figure 5.16 Micropore volume (cm3/g) for ZSM-5 (S i02/ Al2O3=30).
The lower the S i02/ AI2O3 mole ratio the more alumina is in the zeolite composition which
allows a higher cobalt loading. It can be seen that for the same sample of ZSM-5 a lower BET
and micropore volume when more cobalt is loaded. A sample with 0.1 Co/Al with a SiCV
AI2O3 ratio of 23 will contain more cobalt than a sample with 0.1-Co-Al for a SiCV AI2O3 of
130

30. Some pore blocking might have occurred due to cobalt species either dispersed in the
channel or deposited at the outer surface of the zeolite, leading to the observed surface area
and porous volume decrease [19].
5.3.4. Inductively coupled plasma mass spectrometry (ICPMS).
It is important to know the real cobalt loading of the zeolites, to know the amount of cobalt
that is unreacted or the loss of cobalt during the washing steps of the solid state ion exchange.
The data are reported in Table 5.9 and Table 5.10
Table 5.9 ICP-MS of Co-zeolites.
Catalyst Theoretical Co/ A1 ratio
Starting physical mixture
ICP-MS result
Co/Al ratio
Modemite (SiCV A120 3= 20) 1 0.60
Y-zeolites (SiCV Al2O3=80) 1 0.64
ZSM-5 (Si02/ Al2O3=280) 1 0.70
ZSM-5 (SiO2/A l2O3=80) 1 0.79
ZSM-5 (Si02/A l2O3=30) 0.1 0.06
ZSM-5 (SiO2/A l2O3=30) 0.2 0.11
ZSM-5 (Si02/ Al2O3=30) 1 0.72
ZSM-5 (Si02/ Al2O3=30) 2 0.81
ZSM-5 (Si02/ Al20 3=23) 0.1 0.04
ZSM-5 (Si02/A l20 3=23) 0.2 0.08
ZSM-5 (Si02/ Al20 3=23) 1 0.65
ZSM-5 (Si02/A l20 3=23) 2 0.75
131

Table 5.10 ICP-MS of silanated zeolites.
Zeolites Cobalt loading for 1 A1 After silanation
Starting physical mixture
ICP-MS result
Co/Al ratioZSM-5 (Si02/ Al20 3=23) 1 0.42ZSM-5 (Si02/ Al2O3=30) 1 0.30ZSM-5 (SiCV Al2O3=80) 1 0.25
The results of ICP-MS show that the loading was smaller that the physical mixture used at the
beginning of the solid state ion exchange. It can be concluded that solid state ion exchange
following by a long washing procedure does lead to a stoichiometric exchange. The silanation
decreases the overall amount of cobalt present in the zeolites.
5.3.5. X-Ray photoelectron spectroscopy (XPS).
XPS was used to identify the amount of cobalt on the surface after a long washing procedure.
It was also used to compare the amount of cobalt on the surface between silanated and
unsilanated.
Table 5.11 XPS results for a O.l-Co-ZSM-5 (SiCV AI2O3=30) and 2-Co-ZSM-5 (SiCV Al2O3=30).
Sample TheoreticalCo/Al
ICP-MSCo/Al
XPSCo/Al
0.1-Co-ZSM-5 (SiCV Al2O3=30)
0.1 0.06 0
2-Co-ZSM-5 (SiCV Al2O3=30)
2 0.81 0.9
No cobalt on the surface was detected with a 0.1-Co/Al ratio. ICP-MS for this catalyst
showed the presence of cobalt for this loading, so cobalt can be incorporated in the zeolite
channel and can not be detected by XPS. An experimental reason can also be responsible for
this result. ICP-MS was made with 0.5g of catalyst and XPS is performed with material
covering a double sided sticky tape disc of approximately 6_mm in diameter with powder. So
the amount of sample analysed by XPS is very low compared to the amount of sample
132

analysed by ICP-MS. So if cobalt is well dispersed in the sample it is more difficult to detect
it on the surface however when sample with high loading of Co/Al are analysed by XPS, a
large amount of cobalt on the surface of the zeolites is detected.
Table 5.12 XPS results for a l-Co-ZSM-5 (S i02/ Al20 3=23) and l-Co-silanated-ZSM-5 (SiCV Al20 3=23).
Sample TheoreticalCo/Al
ICP-MSCo/Al
XPSCo/Al
l-Co-ZSM-5 (Si02/ Al20 3=23)
1 0.65 1
1 -Co-silanated-ZSM-5 ( S i02/ Al20 3=23)
1 0.42 0.3
A large amount of cobalt has been detected on the surface of the zeolites. Silanation decreased
the amount of cobalt on the surface.
Table 5.13 XPS results for a l-Co-ZSM-5 (SKV Al20 3=23) and l-Co-silanated-ZSM-5 (SiCV Al20 3=23).
Sample TheroticalAl/Si
XPSAl/Si
1-Co- ZSM-5 (SiCV Al20 3=23)
11.5 14.9
1 -Co-silanated-ZSM-5 (Si02/ Al20 3=23)
- 22.9
The XPS results show an increase of Al/Si ratio after silanation meaning the silanation has
occurred.
5.4. Catalysts testing.
5.4.1. Testing of acid zeolites.
The protons which balance the negative charge of a zeolite framework (Figure 5.17) are not
strongly bound to the framework and are able to move and to react with molecules [20].
133

Si Al Si Ai SiA A A A A
Figure 5.17 Zeolites's Brdnsted acidity [20].
A protonated zeolite thus can act as a Brtinsted acid. Firstly, proton zeolites without cobalt
were investigated for the oxidation of «-decane in liquid phase. The proton forms of the
zeolites are well known to be heterogeneous acid catalysts [21-22]. Silanated zeolites were
also tested.
Table 5.14 Conversion for proton and silanated zeolites.
Catalyst Conversion (%)None 0.18
ZSM-5(Si02/A l20 3=23)
0
Si-ZSM-5 (Si02/ Al20 3=23)
0
ZSM-5(SiO2/A l2O3=30)
0
Si-ZSM-5 (S i02/ Al2O3=30)
0
ZSM-5(SiO2/A l2O3=80)
0
Si-ZSM-5(SiO2/A l2O3=80)
0
ZSM-5 (Si02/ Al2O3=280)
0
Y- zeolites (SiO2/A l2O3=80)
0
Mordenite (S i02/ Al2O3=20)
0
Reactions conditions: 100°C, stirring speed 600 rpm, 15 bar O2 , decane (lOg),H-zeolites (0.05g), 24 hours.
The liquid phase reaction using H-zeolites with accessible protons switches off the
autoxidation. The silanation of external sites in H-ZSM-5 using large organosilane molecules
decreases the density of such sites at the external surfaces [1 0 ] but enough protons are still
accessible to scavenge the autoxidation. So the acid zeolites prevent the propagation of the
134

autoxidation, which is a major problem of this reaction because autoxidation is an unselective
radical mechanism, which gives very low terminal selectivity.
5.4.2. Testing of cobalt zeolites.
5.4.2.1. Low loading of cobalt with 24 hours runtime.
Different loadings of cobalt have been prepared with different types of zeolites. Firstly, the
results for low loading of cobalt (0.1-Co/Al and 0.2-Co/Al) will be presented for a runtime of
24 hours.
Table 5.15 Conversion for low cobalt loading.
Catalyst Loading of cobalt for 1 A1 Conv. (%)
No catalyst - 0.4
ZSM-5 (Si02/A l20 3=23) 0.1-Co 0
ZSM-5 (Si02/ Al20 3=23) 0.2-Co 0
ZSM-5 (Si02/ Al2O3=30) 0.1-Co 0
ZSM-5 (Si02/ Al2O3=30) 0.2-Co 0
Reactions conditions: 100°C, stirring speed 600 rpm, 15 bar O2 , decane (lOg), catalyst (50 mg) and runtime (24 hours).
The best result of Iglesia [23] for the oxidation of w-hexane in liquid phase is with a ZSM-5
with a theoretical loading 0.1-Mn/Al (0.088-Mn/Al by ICPM-MS). For the oxidation of n-
decane, low cobalt loading did not promote the conversion after 24 h reaction. No conversion
has been observed, meaning the presence of protons available in the zeolites after solid state
ion exchange with 0.1 cobalt or 0.2cobalt can switch off the autoxidation. After these results, it
was decided to increase the amount of cobalt in the zeolites.
135

5.4.2.2. Higher loading of cobalt with a run time of 8 hours.
Different ratios of SiCV AI2O3 ZSM-5, which allow different loading of cobalt were tested
for a run of 8 hours. The lower the SiCV AI2O3 ratio the greater the loading of cobalt. Table
5.18 shows the conversion of w-decane related to the amount of cobalt present in the catalyst.
Table 5.16 Conversion and amount of cobalt for different SKVAhOj ratio of ZSM-5 exchanged with 1-Co/Al for a run of 8 hours.
Catalyst Amount of cobalt in the catalyst (mg)
Conv. (%)
Si0 2/Al20 3 =23 1.17 0.06Si0 2/Al20 3 =30 1 . 0 0 0.05SiCVAhOa =80 0.43 0
Si02/Al20 3 =280 0 . 1 1 0
Blank 0 0
;tions conditions: 1 ()0 °C, stirring speed 600 rpm, 15 bar O2 , decane ( 1
catalyst (50 mg) and runtime (24 hours).
Table 5.17 shows the product distribution related to the conversion for each Co-ZSM-5.
Table 5.17 Conversion and product profile for different SiCVAhOj mole ratio of ZSM-5 exchanged with 1 Co/Al for a run of 8 hours
Cat. Conv.(%)
5/4one
3one
2one
5/4ol
3ol
2ol
1ol
c 5acid
c 6acid
c 7acid
c 8acid
c 9acid
C , 0acid
Blank 0Si02/
ai2o3=23
0.06 25 17 10 14 16 13 0 5 0 0 0 0 0
Si02/ai2o3=
300.05 27 15 10 13 17 11 0 7 0 0 0 0 0
Si02/A120 3
800
Si02/A120 3
2800
Reactions conditions: 100°C, stirring speed 600 rpm, 15 bar O2 , decane (lOg), catalyst (50mg) and runtime ( 8 hours).
136

The high SiCVAhOs ratio did not show any activity. However low SiCVAbCb ratio which
contains more cobalt showed a small conversion of w-decane after 8 hours. During the ion
exchange process, cobalt replaces the proton, so there is less proton available (stop the
autoxidation) than the starting material and more cobalt available, which can do the homolytic
decomposition of ROOH and propagate the reaction. The conversion is higher than the blank
reaction, so it is due to more cobalt. The product profile at low conversion did not show
terminal products.
The previous results have shown that the amount of cobalt is very relevant to the catalytic
performance of the catalyst. To try to increase the amount of cobalt present in the catalyst, a
preparation of catalyst with a physical mixture of 2-Co/Al was made with ZSM-5 with
SiCVAbOa =23 and SiCVAhC^ =30. The ICP-MS result has showed a Co/Al ratio of 0.75
and 0.81. The ICP-MS result is higher than a catalyst prepared with a physical mixture of
1 -Co/Al (0.65). The long washing procedure may avoid the overexchange. The results for 2-
Co/Al ZSM-5 with SiCVAbOs =23 and SiCVAhOs =30 are listed in Table 5.20.
Table 5.18 Conversion and product profile for different SiC>2/ AI2O3 ratio of ZSM-5 exchanged with 2-Co/Al for a run of 8 hours.
Cat. Co(mg)
Conv.(%)
5/4one
3one
2
one5/4ol
3ol
2
ol1
olc 5
acidc 6
acidc 7
acidc 8
acidc 9
acidC 10
acid
Blank 0 0
Si02/Al20 3=23 1.3 0.14 29 14 1 2 1 1 1 1 9 1 7 3 2 0 1 0
Si02/Al2O3=30 1 . 1 0 . 1 2 2 2 16 14 15 6 6 1 9 4 4 2 0 1
Reactions conditions: 100°C, stirring speed 600 rpm, 15 bar O2 , decane (lOg), catalyst (50 mg) and runtime ( 8 hours).
137

Increasing the amount of cobalt in the zeolites will increase the conversion. However the
product profile looks similar to both autoxidation and VMgO catalyst with a poor terminal
selectivity and a high selectivity to internal oxygenated products.
Different zeolites with different shape of channels and different pore diameter than ZSM-5
(Table 5.1) were also tested to see if there is any change in the product distribution. Co-Y and
Co-mordenite were also tested for a run of 8 hours.
Table 5.19 Conversion and product profile for Y-zeolites and mordenite exchanged with1-Co/Al for a run of 8 hours
Catalyst Co(mg)
Conv.(%)
5/4one
3one
2one
5/4ol
3ol
2ol
1ol
c 5acid
c 6acid
c 7acid
c 8acid
c 9acid
C 10
acid
Blank 0 0 - -
1 -Co-Y 0.35 0.01 27 13 12 13 11 11 0 7 3 0 3 0 01-Co-
mordenite 1.2 0.07 19 15 12 13 17 12 0 7 2 2 0 1 0
Reactions conditions: 1CI0°C, stirring speed 600 rpm, 15 bar O2 , decane (1<3g),catalyst (50 mg) and runtime ( 8 hours).
No major difference is observed in the product profile after 8 hours for a very low conversion.
The change in the size of the pore (5 A for ZSM-5, 7 A for modemite and 8 A for Y-zeolites)
did not influence the product distribution. Only increasing the amount of cobalt increased the
conversion.
The activity of cobalt exchanged silanated ZSM-5 was also investigated for a short runtime of
8 hours. The aim of the silanation was to prevent the cobalt from anchoring on the external
surface of the zeolites during the solid state ion exchange, which would give an unselective
reaction (no spatial constraints). Firstly, the different ZSM-5 samples were silanated and then
ion exchanged with a physical mixture of 1-Co/Al.
138

Table 5.20 Conversion of l-Co-silanated-ZSM-5.
l-Co-ZSM-5 Conv. (%)
Blank 0
Si02/ Al20 3=23 0
SiO2/A l2O3=30 0
SiO2/A l2O3=80 0
Reactions conditions: 100°C, stirring speed 600 rpm, 15 bar O2 , decane (lOg), catalyst (50 mg) and runtime ( 8 hours).
Cobalt silanated zeolites did not show conversion after 8 hours o f run, which means BrOnsted
acidity is still available to inhibit the autoxidation.
5 .4.2.3. Higher loading of cobalt with a run time of 16 hours.
The same catalysts were used for a longer runtime (16 hours)
Table 5.21 Amount of colbat versus conversion for different ZSM-5
CatalystAmount of cobalt
in the catalyst(mg)
Conv. (%)
Si0 2/Al20 3 =23 1.17 0.40Si0 2/Al20 3 =30 1 . 0 0 0.32S i0 2/Al20 3 =80 0.43 0.35
Si0 2/Al20 3 =280 0 . 1 1 0.14Blank 0 0.04
139

Table 5.22 Product distribution of different l-Co-ZSM-5 for a run of 16 hours
Cat. Conv. 5/4 3 2 5/4 3 2 1 c 5 c 6 c 7 c 8 c 9 C 10
(%) one one one ol ol ol ol acid acid acid acid acid Acid
Blank 0.04 45 13 17 14 9 0 0 0 0 0 0 0 0
Si02/Al20 3=23 0.40 2 0 14 15 9 6 9 1 9 5 8 1 1 2
Si02/Al2C>3=30 0.32 2 2 2 0 19 1 0 8 2 1 4 4 3 5 0 2
Si02/Al2C>3=80 0.35 27 1 2 15 1 2 1 2 3 1 6 1 5 5 0 1
Si02/Al2O3=280 0.14 18 15 1 2 13 17 1 2 1 7 2 2 0 1 0
Reactions conditions: 100°C, stirring speed 600 rpm, 15 bar O2 , decane (lOg), catalyst (50 mg) and runtime (16 hours).
Table 5.23 Activity of 2-Co-ZSM-5.
Catalyst Co(mg)
Conv.(%)
5/4one
3one
2one
5/4ol
3ol
2ol
1ol
c5acid
c6acid
c7acid
c8acid
C9acid
Cjoacid
Blank 0 0.04 45.2 13.3 17.2 14.1 9.8 0 0 0 0 0 0 0 0Si02/
Al20 3=23 1.35 1 . 1 2 2 1 . 2 14.5 16.6 1 0 . 2 7.5 10.4 1.4 7.4 6.3 5.2 1 . 2 1 . 2 1 . 1
Si02/Al2C>3=30 1.13 0.80 27.2 1 2 . 2 14.7 12.3 11.4 5.1 1.3 6.5 1 . 8 5.2 5.2 0 1 . 1
Reactions conditions: 100°C, stirring speed 600 rpm, 15 bar O2 , decane (lOg), catalyst (50 mg) and runtime (16 hours).
As observed for a run of 8 hours, more cobalt in the zeolites will give higher conversion. For
example ZSM-5 (Si(V Al2C>3=23) gives a conversion of 1.12% whereas ZSM-5 (Si<V
Al2C>3=280) gives a conversion of 0.14 % for the same runtime. Increasing the conversion
increases the amount of cracked acids formed.
140

Table 5.24 Activity of 1-Co-Y and 1-Co-mordenite.
Catalyst Co(mg)
Conv.(%)
5/4one
3one
2one
5/4ol
3ol
2ol
1ol
c 5acid
c 6Acid
C7acid
c 8acid
c9acid
Cjoacid
Blank 0 0.04 45.5 13.7 17.3 14.6 9.2 0 0 0 0 0 0 0 0
1-Co-Y 0.35 0.18 28.5 1 2 . 6 7.3 17.6 11.3 14.2 1.7 6.8 0 2 . 2 1.3 1.1 0
1-Co-mordenite 1 . 2 1 . 2 0 29.8 15.3 11.3 15.4 8.2 6.4 1 . 2 7.4 3.3 1.8 3.6 0 1.5
Reactions conditions: 100°C, stirring speed 600 rpm, 15 bar O2 , decane (lOg), catalyst (50mg) and runtime (16 hours).
Replacing ZSM-5 zeolites by Y-zeolites or modemite did not improve the terminal
selectivity. Mordenite which has a low S i0 2/Al20 3 ratio, which allows a high loading of
cobalt shows the best conversion after 16 hours run.
Table 5.25 Silanated l-Co-ZSM-5.
1 Co-ZSM- 5
Co(mg)
Conv.(%)
5/4one
3one
2one
5/4ol
3ol
2ol
1ol
c5acid
C6acid
c 7acid
C,acid
c 9acid
Cioacid
Blank 0 0.04 45.2 13.1 17.2 14.3 9.4 0 0 0 0 0 0 0 0
Si02/Al20 3=23 0.75 0 . 2 2 24.3 16.1 10.3 14.1 1 1 . 1 14.2 1 . 1 6 . 2 0 2.4 1 . 1 1 . 2 0
Si02/Al2O3=30 0.42 0 . 2 0 22.9 13.7 7.7 18.6 11.3 16.5 1.7 8 . 6 0 2 . 2 1.4 1 . 1 0
Si02/Al2O3=80 0.14 0.07 26.3 17.3 18.4 10.5 9.6 9.7 0 8.3 1.3 1 . 6 1 . 6 0 0
Reactions conditions: 100°C, stirring speec 600 rpm, 15 bar C>2, decane ( lOg),catalyst (50 mg) and runtime (16 hours).
Cobalt silanated zeolites gave lower conversion than the non silanated cobalt zeolites.
No improvement of the terminal selectivity is observed, only a decrease in the conversion.
141
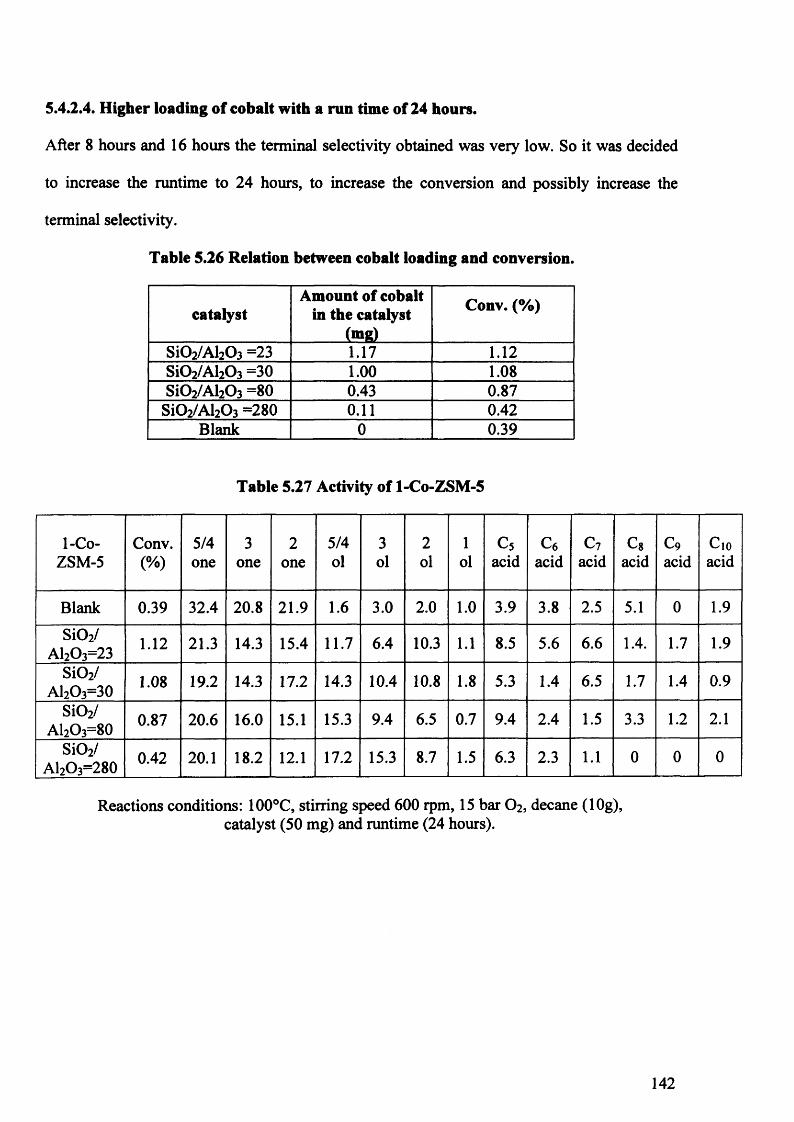
5.4.2.4. Higher loading of cobalt with a run time of 24 hours.
After 8 hours and 16 hours the terminal selectivity obtained was very low. So it was decided
to increase the runtime to 24 hours, to increase the conversion and possibly increase the
terminal selectivity.
Table 5.26 Relation between cobalt loading and conversion.
catalystAmount of cobalt
in the catalyst (mg)
Conv. (%)
Si0 2/Al20 3 =23 1.17 1 . 1 2
Si0 2/Al20 3 =30 1 . 0 0 1.08SiCVAhOs =80 0.43 0.87
Si0 2/Al20 3 =280 0 . 1 1 0.42Blank 0 0.39
Table 5.27 Activity of l-Co-ZSM-5
1-Co- Conv. 5/4 3 2 5/4 3 2 1 c 5 c 6 c 7 c 8 c 9 C 10
ZSM-5 <%) one one one ol ol ol ol acid acid acid acid acid acid
Blank 0.39 32.4 2 0 . 8 21.9 1 . 6 3.0 2 . 0 1 . 0 3.9 3.8 2.5 5.1 0 1.9
Si02/Al20 3=23 1 . 1 2 21.3 14.3 15.4 11.7 6.4 10.3 1 . 1 8.5 5.6 6 . 6 1.4. 1.7 1.9
Si02/Al2O3=30 1.08 19.2 14.3 17.2 14.3 10.4 1 0 . 8 1 . 8 5.3 1.4 6.5 1.7 1.4 0.9
Si02/Al2O3=80 0.87 2 0 . 6 16.0 15.1 15.3 9.4 6.5 0.7 9.4 2.4 1.5 3.3 1 . 2 2 . 1
Si02/Al2O3=280 0.42 2 0 . 1 18.2 1 2 . 1 17.2 15.3 8.7 1.5 6.3 2.3 1 . 1 0 0 0
Reactions conditions: 100°C, stirring speed 600 rpm, 15 bar O2 , decane (lOg), catalyst (50 mg) and runtime (24 hours).
142

Table 5.28 Activity of 2-Co- ZSM-5.
2-Co-ZSM-5
Co(mg)
Conv.(%)
5/4one
3one
2one
5/4ol
3ol
2ol
1ol
c 5acid
c 6acid
c 7acid
C8acid
c 9acid
C10Acid
Blank 0 0.39 32.2 21.2 22.7 2.7 3.8 2.3 1.6 4.2 4.5 3.7 5.8 0 1.7Si02/
Al20 3=23 1.35 2.20 21.4 13.4 14.3 7.8 5.7 9.5 1.3 13.6 4.4 6.5 5.4 1.4 1.8
Si02/ A I 2 O 3 —30 1.13 1.60 25.4 14.2 15.2 8 5.5 8.7 1.4 10.8 6.3 5.3 2.3 0 1.5
Reactions conditions: 100°C, stirring speed 600 rpm, 15 bar 0 2, decane (lOg), catalyst (50mg) and runtime (24 hours).
Table 5.29 Activity of 1-Co-Y and 1-Co-mordenite.
Catalyst Co(mg)
Conv.(%)
5/4one
3one
2one
5/4ol
3ol
2ol
1ol
c5acid
c6acid
c7acid
c8acid
c9acid
Ci,aci<
Blank 0 0.39 32.2 2 1 . 2 22.7 2.7 3.8 2.3 1 . 6 4.2 4.5 3.7 5.8 0 1.'1-Co-Y 0.35 0.73 20.4 16.4 14.6 15.4 14.5 8 . 2 1 . 2 8 . 2 2 . 2 1 . 2 0 . 2 0 . 2 1 .:1-Co-
mordenite 1 . 2 1.56 19.1 13.2 15.4 14.3 10.5 8.3 1.7 7.5 2 . 6 2 . 6 7.8 1.4 uReactions conditions: 100°C, stirring speed 600 rpm, 15 bar O2, decane (lOg),
catalyst (50 mg) and runtime (24 hours).
Table 5.30 Activity silanated l-Co-Z§M-5.
Catalyst Co(mg)
Conv.(%)
5/4one
3one
2one
5/4ol
3ol
2ol
1ol
c 5acid
c6acid
c7acid
c 8acid
c9acid
Cjoacid
Blank 0 0.39 32.2 21.3 2 2 . 2 2 . 6 3.7 2 . 1 1 . 1 4.1 4.4 3.4 5.3 0 1.9Si02/
Al20 3=23 0.75 0.35 27.2 20.3 15.1 15.4 5.7 6.3 1.4 7.1 1.3 2 . 2 0 0 1 . 2
Si02/Al2O3=30 0.42 0.45 23.2 15.9 1 1 . 1 12.4 9.3 8.4 1 . 2 8.3 6.3 2 . 6 3.8 1 . 2 1 . 2
Si02/Al2O3=80 0.14 0.137 35.3 15.3 4.5 2.7 9.3 1 0 . 2 1 . 2 5.6 0 0 7.3 2.3 0 . 8
Reactions conditions: 100°C, stirring speed 600 rpm, 15 bar O2 , decane (lOg), catalyst (50 mg) and runtime (24 hours).
The silanation of ZSM-5 reduces the activity of the catalyst, to the level of the blank and no
more terminal product is observed. This suggests that the reaction is mainly occurring on the
external surface of the zeolites, because once the surface sites are removed, conversion is
143

considerably decreased. Spatial constraints around the catalytic sites did not lead to a
preference for terminal oxidation after 24 hours.
Co-zeolites are active catalyst at 100°C without radical initiator for the oxidation of /7-decane.
The rate of n-decane reaction with O2 increased with the loading of cobalt in the zeolites.
Cobalt mordenite has the lowest silica alumina ratio (SiO2/Al2O3=2 0 ), so has the highest
amount of cobalt (1-Co/Al has been used for the solid state ion exchange), and shows the
highest conversion for a run of 24 hours. The best example of the improved conversion with
higher Co loading is given by the two ZSM-5 catalysts where the zeolite structure is the same
but with a SiCVAhOaratio of 80, a conversion of 0.87 % is reached after 24 hours, while with
a ratio of 280, it is only half this at 0.42 %.
5.4.2.5. Relationship between amount of cobalt and conversion.
Table 5.32 relates the performance of different Co-zeolites with the amount of cobalt detected
by ICP-MS to the conversion for a run of 24 h.
144

Table 5.32 Relation between conversion and cobalt loading.
Zeolites Si02/A l20 3Amount of cobalt
(mg)Conv(%)
None - 0 0.39
1-Co-Mordenite 20 1.20 1.56
l-Co-ZSM-5 23 1.17 1.12
2-Co-ZSM-5 23 1.35 2.20
l-Co-ZSM-5 30 1.00 1.08
2-CO-ZSM-5 30 1.13 1.60
l-Co-ZSM-5 80 0.43 0.87
1-Co-Y 80 0.35 0.73
l-Co-ZSM-5 280 0.11 0.42
From the Table 5.32, it is easy to conclude that the amount of cobalt is relevant for the
performance of the catalyst. More cobalt loaded gives a higher conversion for the same
runtime.
5.4.3. Increase the mass of catalyst.
The work by Iglesia [23] for w-hexane showed a difference in selectivity when a large amount
of Mn-ZSM-5 (lg) is loaded for a short period of time at low conversions. As a check of the
autoxidation mechanism versus heterogeneous catalytic mechanisms, reactions were carried
out in a similar way using the l-Co-ZSM-5 with w-decane. Different amount of catalysts
(0.05g, 0.5g and lg) were tested. During the ion exchanged process, cobalt can go on the
surface of the zeolites or inside the channels. Chapter 3 has shows that w-decane and oxygen
can react together via autoxidation which give a low terminal selectivity. Cobalt on the
145

surface of the catalyst can catalyse the decomposition of the ROOH species from the
autoxidation, which results in a poor terminal selectivity. These two mechanisms,
autoxidation and decomposition of ROOH by cobalt on the surface of the catalyst can hide or
dilute a third mechanism, which is the activity of the cobalt inside the channel, which should
be regioselective. Increasing the mass of catalyst increased the numbers of channels available
and may help to perform the third mechanism inside the pores which would be expected to
increase the terminal selectivity .
Table 5.33 Conversion and product profile with different masses of l-Co-ZSM-5.
l-Co-ZSM-5
Conv.(%)
5/4one
3one
2
one5/4ol
3ol
2
ol1
olc 5
acidc 6
acidc 7
acidc 8
acidc 9
acidC10
Acid
Blank 0.39 32.2 21.3 2 2 . 2 2 . 6 3.7 2 . 1 1 . 1 4.1 4.4 3.4 5.3 0 1.9
lg 2.56 2 1 . 8 14.4 15.3 10.4 6.4 8.9 1.5 7.2 5.2 4.2 2.3 2.7 1.4
0 . 5 g 1.36 19.3 16.3 15.3 8 . 6 6 . 6 9.6 1.4 7.3 4.3 8.3 1.3 1.5 1.5
0 . 0 5 g 1 . 1 21.3 13.3 15.1 9.6 6.5 9.5 1.3 6.3 5.5 8.5 1.3 1.4 2.4
Reactions conditions: l-Co-ZSM-5 (Si0 2 / Al2 0 3 =2 3 ) 24h, 100°C, 600 rpm, 15 bar O2,«-decane (lOg).
Different masses of catalyst (l-Co-ZSM-5 (Si0 2 / Al2C>3=23)) have been investigated. The
selectivity of 1-decanol did not change. Increasing the amount of catalyst by a factor of 20
increased the conversion from 1.1 % to 2.56 %.
5.4.4. Use of PS-Tempo as radical scavenger with catalyst.
Acid zeolites promote an ionic decomposition of the ROOH which prevents the generation of
radicals and avoid the autoxidation mechanism. The use of a different radical scavenger such
as PS-tempo allows the determination of whether the reaction with Co-zeolites proceeds via a
radical mechanism. If there is no conversion with the use of a radical scavenger the
146

mechanism of the reaction is a radical mechanism with Co-zeolites [24]. The target of this test
is to scavenge the autoxidation, which as has already be demonstrated in Chapter 3 proceeds
via a radical mechanism and also to scavenge the radical reaction performed by the cobalt on
the surface of the zeolites. So only the reaction inside the channels of the zeolites will be
detected and may show a higher terminal selectivity.
Table 5.34 Activity of l-Co-ZSM-5 (Si02/Al2C>3=23) with radical scavenger.
Temperature Mass used of PS-Tempo (mg)
Conversion(% )
100°C 50 0
110°C 50 0
120°C 50 0
130°C 50 0
Reactions conditions: Radical scavenger (0.50mg), l-Co-ZSM-5 (0.05g), 100°C,600 rpm, 15 bar O2 , decane (lOg), 24 hours.
The addition of a radical scavenger inhibits the reaction which indicates that the reaction
proceeds via a radical mechanism. The size PS-tempo is large (described in Chapter 3)
meaning it is unable to penetrate the pores of the zeolites. This must mean the reaction being
scavenged, either occurs on the external sites of the zeolite, or in the liquid phase.
5.4.5. Use of both zeolites as catalyst.
The target of this reaction is to use an acid zeolites H-ZSM-5 (SiCV Al2C>3=23) to inhibit the
autoxidation in the liquid phase and to promote the activity of l-Co-ZSM-5 as a
heterogeneous catalyst to see if there is any difference in the product distribution profile.
147
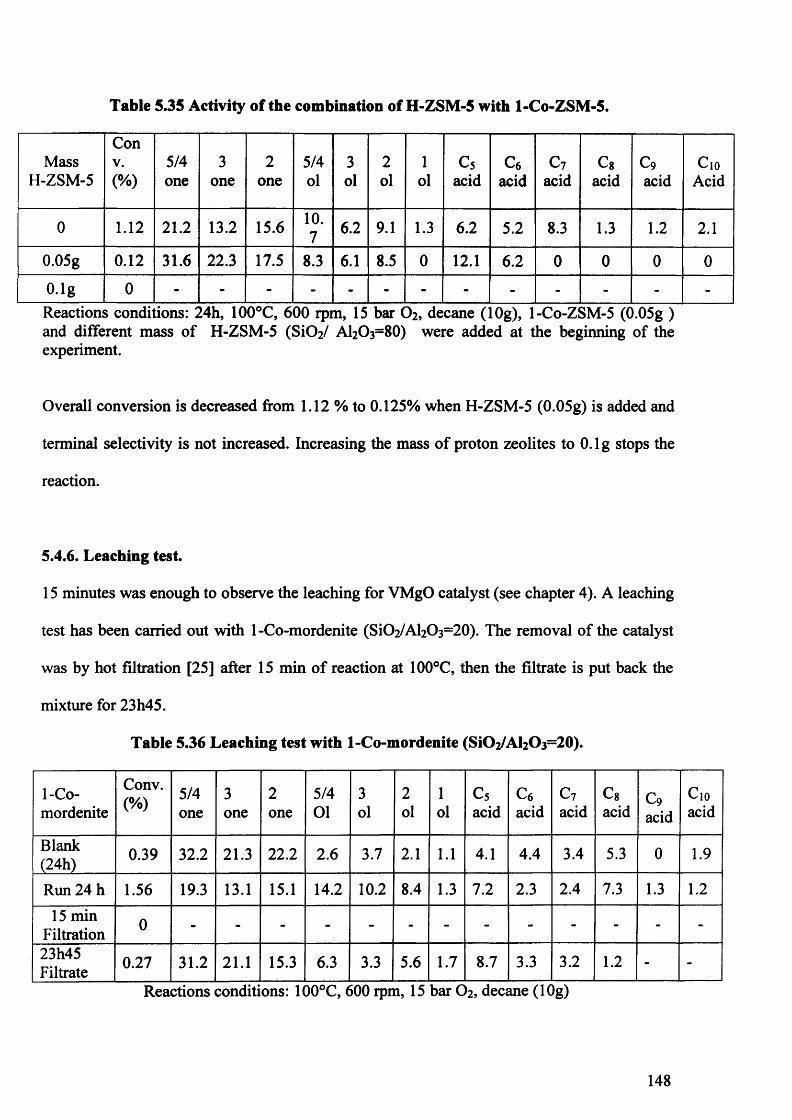
Table 5.35 Activity of the combination of H-ZSM-5 with l-Co-ZSM-5.
MassH-ZSM-5
ConV.<%)
5/4one
3one
2
one5/4ol
3ol
2
ol1
olc 5
acidc 6
acidc 7
acidc 8
acidc 9acid
C 10
Acid
0 1 . 1 2 2 1 . 2 13.2 15.6 1 0 .7 6 . 2 9.1 1.3 6 . 2 5.2 8.3 1.3 1 . 2 2 . 1
0.05g 0 . 1 2 31.6 22.3 17.5 8.3 6 . 1 8.5 0 1 2 . 1 6 . 2 0 0 0 0
O.lg 0 - - - - - - - - - - - - -Reactions conditions: 24h, 100°C, 600 rpm, 15 bar O2 , decane (1lOg), l-Co-ZSM-5 (C>.05g )and different mass of H-ZSM-5 (SiCV Al2O3=80) were added at the beginning of the experiment.
Overall conversion is decreased from 1.12 % to 0.125% when H-ZSM-5 (0.05g) is added and
terminal selectivity is not increased. Increasing the mass of proton zeolites to 0.1 g stops the
reaction.
5.4.6. Leaching test.
15 minutes was enough to observe the leaching for VMgO catalyst (see chapter 4). A leaching
test has been carried out with 1-Co-mordenite (SiO2/Al2O3=2 0 ). The removal of the catalyst
was by hot filtration [25] after 15 min of reaction at 100°C, then the filtrate is put back the
mixture for 23h45.
Table 5.36 Leaching test with 1-Co-mordenite (SiCVAhOj^O).
1-Co-mordenite
Conv.(%)
5/4one
3one
2
one5/4Ol
3ol
2
ol1
olc 5acid
c 6acid
c 7acid
c 8acid
c 9acid
C10
acid
Blank(24h) 0.39 32.2 21.3 2 2 . 2 2 . 6 3.7 2 . 1 1 . 1 4.1 4.4 3.4 5.3 0 1.9
Run 24 h 1.56 19.3 13.1 15.1 14.2 1 0 . 2 8.4 1.3 7.2 2.3 2.4 7.3 1.3 1 . 2
15 min Filtration 0 -
23h45Filtrate 0.27 31.2 2 1 . 1 15.3 6.3 3.3 5.6 1.7 8.7 3.3 3.2 1 . 2 - -
Reactions conditions: 1()0°C, 600 rpm, 15 bar C>2, decane ( 1 C>g)
148

The conversion after the filtration is 0.27%, which is below the conversion of the autoxidation
(blank), which has a conversion of 0.39%. Co-zeolites prepared by solid state solid ion
exchange with long washing at the end of the preparation prevents the leaching of cobalt from
the catalyst when exposed to the solution for 15 minutes. 15 minutes is perhaps too short for
cobalt to leach into the solution, so another test has been performed after 8 hours of reactions
using the same procedure with another catalyst (l-Co-ZSM-5 S i02/ Al2C>3(=23)).
Table 5.37 leaching test with l-Co-ZSM-5 (Si02/Al20 3=23).
Co-ZSM-5
Conv.(%)
5/4one
3one
2one
5/4Ol
3ol
2ol
1ol
c 5acid
c 6acid
c 7acid
c 8acid c 9
acid
CioAcid
Blank(24h) 0.39 32.2 21.3 22.2 2.6 3.7 2.1 1.1 4.1 4.4 3.4 5.3 0 1.9
Run 24h 1.12 21.2 14.1 15.2 11.4 6.4 10.2 1.1 8.2 5.9 6.4 1.4 1.3 1.38h
Filtration 0.08 35.5 14.5 12.6 14.4 12.2 8.3 0 5.3 0 0 0 0 0
16hFiltrate 0.12 23.3 19.2 24.2 12.5 8.6 6.1 1.1 6.8 0 0 0 0 0
Reactions conditions: 100°C, 600 rpm, 15 bar 0 2, w-decane (lOg)
When the l-Co-ZSM-5 catalyst is removed from the autoclave after 8 hours, the conversion
of the filtrate after 16 hours is still below the maximum conversion (0.39%) observed for the
autoxidation using these conditions. So it can be concluded that Co from l-Co-ZSM-5 does
not leach into the solution. Both tests after 15 minutes and 8 hours have showed that the
catalysts do not leach in the solution.
5.5. Discussion.
Catalysts have been characterised by XRD, BET, TGA, ICP-MS and XPS. Firstly, the XRD
of the different catalysts have showed only reflections of the framework of the zeolites. No
additional reflections, no shifting of the reflections and no cobalt cluster has been observed
for the different loading. Only a decrease of the intensity of the reflections is observed when
149

cobalt is loaded or passivation of the external surface is performed. Different reasons can
induce the lowering of the XRD reflections.
• The presence of cobalt inside the pores induces a local distortion of the zeolites
surface [26].
• Cobalt on the zeolites surface.
• The evolution of HC1 during the preparation can also affect the structure. [6 ]
The distortion of the lattice when cobalt is loaded in the pores can be responsible for the
decrease in crystallinity and can explain the results in Figure 5.8 and 5.11. When the amount
of cobalt loaded is increased, the crystallinity decreases for the different zeolites. More cobalt
in the pores and more distortion of the lattice means a decrease in crystallinity. After
passivation, a larger amount of cobalt is loaded inside the channel and can explain the
difference of crystallinity between silanated (% crystallinity =60%) and unsilanated (%
crystallinity=80%) for the same 1-Co/Al ratio. Passivation of the external surface of the
zeolites produces an amorphous silica layer, which can also be responsible for the decrease in
the crystallinity measured by XRD.
Cobalt on the zeolite surface can also decrease the intensity of reflections. Cobalt has been
detected in high amounts (1-Co/Al detected) on the surface by XPS analysis. Passivation of
the external surface prevents the cobalt from anchoring on the zeolites surface but XPS has
showed that a small amount of cobalt is present after silanation. The amount of cobalt
detected by XPS is lower for a silanated zeolite (Co/Al=0.3) than an unsilanated (Co/Al=l)
zeolite for the same amount of Co/Al loaded.
The evolution of HC1 during the preparation can lead to the alteration of the zeolites’ structure
and lead to a lower crystallinity. The more C0 CI2 .6 H2O is loaded the more HC1 is generated
150

during the calcination step, which lead to more dealumination and can also explain the loss of
crystallinity when cobalt loading is increased. Lowering the heating ramp, which slows down
the evolution of HC1 gas, which can then be flushed away more easily by the flow of nitrogen
used during the calcination steps did not improve the crystallinity of the sample.
The BET and micropore volume analyses showed that the surface area of the catalyst and the
micropore volume are dependent on the amount of cobalt loaded in the zeolites. The more
cobalt that is loaded, the more the pore volume is decreased gradually. Some pore blocking
has occurred due to cobalt species either dispersed in the channel or deposited at the outer
surface of the zeolite, leading to the observed surface area and porous volume decrease [27].
It can be concluded that the distribution of cobalt in the zeolites is on the surface of the
zeolites (XPS results) and inside the channels of the zeolites (decrease of the pore volume).
The most important secondary effect of passivation of the external surface of zeolites is to
promote the shape-selective reactions is narrowing or blocking entrances of the pores [28-31]
and can explain the decrease o f pore volume after silanation.
The data from XPS analysis showed that cobalt was not detected and may due to a very high
dispersion for the low Co/Al loading however the cobalt was detected by ICP-MS meaning
that the cobalt goes inside the channel. Higher Co/Al ratios show a large amount of cobalt on
the surface. XPS also demonstrated that silanation does not prevent the cobalt from anchoring
on the surface.
Thomas [4] has reported very high terminal selectivity with Co-AlPO-18 and Mn- A1PO-18
but one of the major disadvantages of these catalysts is the leaching of the metal by polar
products. The different leach tests have showed that the leaching of the metal from the
151

zeolites is not responsible for the conversion, which is an interesting point for a catalyst in
liquid phase.
Different mechanisms can occur during the reaction, which make the study very difficult. The
first one is the autoxidation, which is the reaction between «-decane and oxygen without
catalyst [32] (see Chapter 3).
Initiation: I —> R*
Propagation: R* + O2—► RO2*
R 0 2* + H R —► ROOH +R*
The first products made from this mechanism are the hydroperoxide species (ROOH), which
can take part in different mechanisms.
The first possible mechanism is the reaction of the acid sites of the zeolites with
hydroperoxide. Acid sites will cause an ionic decomposition of the ROOH [33]. This
mechanism avoids the propagation of the radical in the solution, which is responsible for the
conversion.
Acid decomposition ROOH —> RO+ + OH’
The autoxidation is an undesired radical reaction with poor terminal selectivity, so proton
zeolites can scavenge this reaction, which is an advantage. Silanated zeolites decrease the
number of acid sites, but still enough acid sites can scavenge the autoxidation reaction after
silanation.
Metalic ions can have a dual function. Metal can promote the hydroperoxide decomposition
or can initiate the autoxidation. Cobalt catalysts have been proposed to act via Haber-Weiss
152

mechanisms in liquid phase [34 -35]. This mechanism involves a free radical mechanism for
the hydroperoxide decomposition.
Initiation:
Co2+ + ROOH -> Co3+ + RO* + OH ’
Co3+ + ROOH — Co2+ + ROO’ + H+
Propagation:
RO* + RH —► ROH + R*
R*+ 0 2 -> ROO*
ROO* + RH —► ROOH + R*
This mechanism can be applied to the cobalt on the surface of the zeolites (no spatial
constraint on zeolites surface). In this mechanism above there is no direct docking of the
alkane with the oxidation centre. Cobalt induces an unselective radical mechanism by
homolytic decomposition of the hydroperoxide. Homolytic decomposition gives radicals,
which can react further on the alkane chain and can explain the difference of conversion for
the different loadings of cobalt. The use a radical scavenger can stop this radical mechanism.
In the absence of steric constraint it will be easier to remove a proton from a CH2 than CH3
and explain the low terminal selectivity of this mechanism. External sites are easily accessed
by reactants and are not protected against undesired side reactions by the shape-selective
environment within zeolite channels [36-38]. This mechanism, which is independent of the
different shape and size zeolites channels, can explain the different results obtained for 8 h, 16
h and 24 h runs for the different Co-zeolites. The more cobalt on the surface, the higher is the
conversion of «-decane for the same runtime. This mechanism increases the rate of ROOH
decomposition compared to the autoxidation and explains the higher conversion with the
153

same runtime. The silanation decreases the amount of cobalt on the surface (XPS results) and
a lower conversion is observed than the unsilanated sample for the same runtime, which
confirm the activity of cobalt on the surface of the catalyst. With zeolites wich have a low
loading of cobalt, there is no conversion. ICP-MS results have showed that cobalt is present in
the catalyst and XPS results have showed that no cobalt is present in the surface of the
catalyst. That can be explained by the protons available on the surface which scavenge the
formation of radicals and so no reaction occurs inside the channel with cobalt.
Metal can also react directly with alkane to form radical species [38].
RH + M (n+1)4' -> Mn+ + R* + H*
This step will be followed by oxygen insertion to give ROOH species (see mechanism in
Chapter 3). In the third case, ROOH formation on the external Co-zeolite channels (reaction
6) lead to nonselective oxygen insertion along the alkane chain. This mechanism can be
responsible for the initiation of the autoxidation by cobalt on the zeolite surface, which is an
unselective mechanism. The metal on the surface of the zeolites is only involved in the
initiation and can explain the results in table 5.19 where the initiation period is shorter with
Co-zeolites than the autoxidation.
Another mechanism is proposed by Iglesia [3] for the decomposition of ROOH in the zeolite
channels. In this mechanism, an oxidation centre inside the channels can induce terminal
selectivity. The key point of this mechanism described below is the direct bonding of the
linear alkanes to the metal (step II, Figure 5.18), which can induce terminal selectivity.
154

Mn
ROOHROHOH
MnMn
ROOI RHR(-H)=0
OOR RHROOH
HI Mn-OR
ROH
IVMn-OOR
Mn-R
Figure 5.18 Proposed mechanism for ROOH decomposition mechanism on zeolites-confined Mn sites [3].
In Figure 5.19, ROOH is the hydroperoxide, ROH is hexanol, R-(-H)=0 is hexanone or
hexanal and Mn-OOR, Mn-OR and Mn-R are Mn-bound reactive intermediates. In this
mechanism, oxygen insertion can be influenced by spatial constraints that orient alkanes via
step II, III, and V. This mechanism explains the high terminal selectivity found by Iglesia [3].
The experiments with PS-tempo were carried out to try and promote this mechanism. PS-
tempo is a bulky radical scavenger which can stop the autoxidation and can also stop the
radical mechanism of cobalt on the surface of the zeolites and just allow the reaction inside
the channel. This reaction gave no conversion which suggests that no heterogeneous reaction
occurs in the pores of the Co-zeolites and explains the lack of regioselectivity in the product
profile. Increasing the mass of catalyst to prevent the dilution of any prevalent effects of
spatial constraints on regioselectivity did not show better terminal selectivity. Spatial
155

constraints did not lead to any preference for terminal oxidation with w-decane with all the
different zeolites tested with different loading of cobalt.
5.6. Conclusion.
Based on the results described above, the following main conclusions can be drawn. During
the preparation, cobalt can be anchored randomly onto the surface sites or in the pores. The
low loading of cobalt does not have enough cobalt to promote the reaction with ROOH
species and a lot of acid sites are still available in the zeolites to scavenge the autoxidation
and explain the lack of conversion. However, higher cobalt loadings have enough cobalt to
catalyse the reaction. Passivation does not completely prevent cobalt from anchoring on the
surface of the zeolites and also narrowing the pore size. The attempt to come in the spatial
constraint of zeolites with an oxidation centre did not help to improve the terminal selectivity
of the reaction. Different loading of oxidation centre and silanation of the zeolites did show a
difference of terminal selectivity for the oxidation of w-decane in liquid phase. A similar
product distribution is observed for the autoxidation (Chapter 3) and VMgO (Chapter 4).
Conversion was proportional to amount of cobalt loaded in the zeolites, suggesting that the
relevant step involves decomposition of hydroperoxides on cobalt redox sites on the zeolites
surface.
156

5.7. References.
[1] A. Corma, Chemical Reviews, 95, (1995), 559.
[2] R. Szostak, Molecular Sieves: Principles of Synthesis and Identification, Van Nostrand
Reinhold, New York, (1989).
[3] B. Zhan, B. Mod&i, J. Dakka, J.G. Santiesteban, E. Iglesia, Journal of Catalysis 245,
(2007), 316.
[4] J.M.Thomas, R. Raja, G. Sankar, R.G. Bell, Nature, (1999), 227.
[5] Handbook of Zeolites Sciences and Technology, S.M. Auerbach, K.A. Carrado, P.K.
Dutta, New York, (2003).
[6] H.G. Karge, Studies in Surface Science and Catalysis, 5, (1997), 1901.
[7] F.M. Bobonich, Theoretical and Experimental Chemistry 36, (2000), 117.
[8] P. Sazama, J. Dedecek, V. Gabova, B. Wichterlova, G. Spotob, S. Bordiga, Journal of
Catalysis 254, (2008), 180.
[9] H.S. Lacheen, E. Iglesia, Journal Physical Chemistry B, 110, (2006), 5462.
[10] W. Ding, G.D. Meitzner, E. Iglesia, Journal of Catalysis 206, (2002), 14.
[11] D.J. Kim, H.S. Chung, Applied Clay Science 24, (2003), 69.
[12] T.A.J. Hardenberg, L. Mertens, P. Mesman, H.C. Muller, C.P. Nicolaides, Zeolites, 12,
(1992), 685.
[13] S.E. Axon, J. Klinowski, Applied Catalysis 56, (1989), L9.
[14] E.L. Wu, S.L. Lawton, D.H. Olson, A.C. Rohrman, G.T. Kokotailo, Journal of Physical
Chemistry, 83 , (1979), 2777.
[15] X. Wang, H. Chen, W.M.H. Sachtler, Applied Catalysis B: Environmental 26, (2000),
227.
[16] H.K. beyer, H.G. Karge, G. Boebely, Zeolites 8, (1998), 79.
157

[17] I.W.C.E. Arends, R.A. Sheldon, M. Wallau, U. Schuchardt, Angewandte Chemie
International Edition, 36, (1997), 1114.
[18] Handbook of Zeolites Sciences and Technology, S.M. Auerbach, K A. Carrado, Prabir K.
Dutta, (2003).
[19] M. Mhamdi, S. Khaddar-Zine, A. Ghorbel, Reaction Kinetics and Catalysis Letters, 88,
(2006), 149.
[20] W. Schmidt, Max-Planck-Institut ftir Kohlenforschung, (2008).
[21] S. Wuyts, K. De Temmerman, D.E. De Vos, P.A. Jacobs, Chemical European Journal
11,(2005), 386.
[22] N. Katada, M. Niwa, Catalysis Surveys from Asia 8, (2004), 161.
[23] B. Zhan, B. Mod6n, J. Dakka, J.G. Santiesteban, E. Iglesia, Journal of Catalysis 245,
(2007), 316.
[24] A.L.J. Beckwith, V. W. Bowry, K.U. Ingold, Journal of American Chemistry Society 1,
114,(1992), 4983.
[25] R.A. Sheldon, M. Wallau, I.C.E. Arends, U. Schuchardt, Accounts of Chemical
Research, 31, (1998), 485.
[26] K. Pierloot, A. Delabie, and C. Ribbing Journal of Physical Chemistry B, 102, (1998),
1789.
[27] M. Mhamdi, S. Khaddar-Zine, A. Ghorbel, Reaction Kinetics and Catalysis Letters 88,
(2006), 149.
[28] C.T. O’Connor, K.P. MOller and H. Manstein, KONA 25, (2007), 230.
[29] F. Bauer, W.H. Chenb, E. B ilz , A. Freyer, V. Sauerlandc, S.B. Liub,Journal of
Catalysis 251, (2007), 258.
[30] C.T. O’Connor, K.P. Moller, H. Manstein, Journal of Molecular Catalysis A: Chemical,
181,(2002), 15.
158

[31] E. Klemm, M. Seitz, H. Scheidat, G. Emig, Journal Catalysis, 173, (1998), 177.
[32] N. Kuprowicz, J. S. Ervin, S. Zabamick, Fuel 83, (2004), 1795.
[33] C.E. Frank, Chemical Review 46, (1950), 155.
[34] R.A. Sheldon, J.K. Kochi, Metal-Catalyzed Oxidations of Organic Compounds,
Academic Press, New York, 1981.
[35] C.L. Hill, Activation and Functionalization of Alkanes, Wiley, NewYork, 1989.
[36] Y.S. Bhat, J. Das, K.V. Rao, A.B. Halgeri, Journal of Catalysis 159, (1996), 368.
[37] T. Kunieda, J.H. Kim, M. Niwa, Journal of Catalysis 188, (1999), 431.
[38] K.U. Ingold, Inhibition of the Autoxidation of Organic Substances in the Liquid Phase,
Chemical Reviews, 61, (1961), 563.
159

Chapter Six
H-hexane oxidation
6.1. Introduction.
w-hexane (C6H 14) with a boiling point of 69°C is the second linear alkane liquid at room
temperature after «-pentane (boiling point 39°C). w-hexane is a shorter alkane than «-decane
and it is easier to see the effect on the terminal selectivity of a catalyst with shorter chain
(Table 6.1).
Table 6.1 Comparison between n-decane and #f-hexane.
Alkanes Number of CH2 Number of CH3 Ratio CH3 /C H 2
H-hexane 4 2 1 / 2
w-decane 8 2 1/4
The use of «-hexane will also allow the comparison to the best heterogeneous catalysts
reported in the literature [1 , 2 ] for oxidation of «-hexane in liquid phase.
6.2. Data of the best results in the literature.
Thomas [2-5] has reported the best results in the literature for the terminal oxidation of n-
hexane in the liquid phase. Iglesia [6 ] tried to reproduce Thomas's data with the same catalyst
for the oxidation of w-hexane. The comparison of the results from these two studies are
reported in Table 6.2.
160

Table 6.2 Thomas’s and Iglesia’s results with A1PO catalyst.
Author Temperature(°C) Catalyst Conversion
(%)Total Terminal Selectivity (%)
Thomas 100
Co-AlPO-5 2.4 8.6
Co-AlPO-18 7.2 61.3
Mn-AlPO-18 8.7 65.5
Iglesia 100Mn-AlPO-5
&Mn-AlPO-18
0.02-0.05 7
Iglesia 130Mn-AlPO-5 0.5 4.1
Mn-AlPO-18 1.4 3.76
«-Hexane conversions (0.02-0.05% at 100°C) measured by Iglesia [6] on MnAlPO-5 and
MnAlPO-18 were 100 times smaller than reported previously on MnAlPO-18 (7.2%) by
Thomas [2]. The terminal selectivity measured by Iglesia [6] is 10 times smaller than the
terminal selectivity measured by Thomas. Increasing the temperature to 130°C increased a
little bit the conversion but decreases the terminal selectivity from 7% to 4.1% or 3.76 %.
The next best results for the terminal oxidation of «-hexane in liquid phase has been reported
by Iglesia [1].
161

Table 6.3 Details of Iglesia conversion and selectivity.
Time (hours)Conversion
<%)
Terminal selectivity (%)
with Mn-ZSM-5
Terminal selectivity (%)
Autoxidation
0.5 0.005-0.007 24 7
2.5 0.013 18.5 8
4 0.047 15 8
7 0.1 10 7
Table 6.3 demonstrates a clear difference in terminal selectivity when a catalyst (>20 %) is
present in contrast with the autoxidation reaction (8 %) at similar conversions. In the case of a
catalyst being present, the terminal selectivity is initially high, but this declines as the
conversion increases (-10% terminal selectivity when conversion is 0.1 %).
6.3. Experimental conditions for each study.
Before moving on to compare these results to those obtained at Cardiff, Table 6.4 it is helpful
to explain the different reactors used, the different experimental conditions and the different
methods of analysis used for each team.
162

Table 6.4 Comparison for the experimental conditions for each team.
TeamThomas
[2 ]
Iglesia
[1 ]
Cardiff
Catalyst
tested A1PO-18 A1PO-18 ZSM-5 ZSM-5 & A1PO- 18
Autoclavehigh pressure stainless-steel catalytic reactor
high pressure glass reactor
high pressure glass reactor
high pressure stainless-steel catalytic reactor
Monitor
the reaction
Small aliquots of the sample were removed
extracting a sample periodically (0.50 ml)
extracting a sampleperiodically (0.50 ml)
each point on the plot is one reaction
Pressure
Dry air was fed under
pressure into the reaction vessel
15 bar ambient
temperature
constant bar by adding O2
periodically
5.5 bar ambient
temperature
constant 5 bar by adding O2
periodically
3 bar ambient
temperature
Reactor pressurised
with O2
5 bar ambient
temperature
Temperature
(°C)100-130°C 100-130°C 130°C 130°C
w-hexane 50 g (76 ml) 25 ml 25 ml 1 0 g(15 ml)
Stirring 400 rpm - - 600 rpm
Catalyst 0.5g 0 .2 g lg0.6g Zeolites
0.12g A1PO
GC column
BPX5capillarycolumn(25m, 0,32mm)
DB-wax column (60 m, 0.32 m m , 0.5 pm)
Hewlett-Packard5890)
DBWAX capillary column (60 m,0.25 mm,0.5 pm)
AgilentJ&W Scientific)
CP Wax 52CB, (25m, 0.53 mm, 2 . 0 pm)
Chrompack
Linerlined with
poly ether ketone. Glass reactor Glass reactor None or Glass liner
Internalstandard
4.8 g dichlorobenzene
0 . 2 ml dichlorobenzene
0 . 2 0 ml Dichlorobenzene
0.150 ml trichlorobenzene
163

For Iglesia, The ratio of w-hexane (ml) over A1PO (g) is 125 and the ratio of «-hexane (ml)
over ZSM-5 (g) is 25. Cardiff has kept the same volume ratio of w-hexane (ml)/ catalyst (mg)
for the testing of the A1PO and zeolites. The second point to note is the way the hexanal
selectivity is calculated by Iglesia [1]. Shown below (Figure 6.1), is a typical GC trace
provided in the supplementary information [1]. As can be seen there are two overlapping
peaks, these are 2-hexanone with a retention time of 42.32 and hexanal with a retention time
of 42.45. The calculation for the production of hexanal is made by separating the peak tailing
of the 2-hexanone as shown by the red lines (Figure 6.1, lines added by authors).
2-Hexanone
1 -Hexanal
Figure 6.1 [1] Separation between 2-hexanone and hexanal on Iglesia GC trace
Only one peak is present in GC traces obtained at Cardiff for 2-hexanone and hexanal.
Therefore, for the literature results the terminal selectivity refers to hexanal, hexanol and
hexanoic acid, while at Cardiff terminal selectivity will be reported only for 1-hexanol and
hexanoic acid. Importantly, when discussing his results Iglesia only reports terminal
selectivity and does not give details about the contribution of 1 -hexanal in his calculation.
From the GC trace available, it was estimated at 10%.
164

6.4. Catalysts.
6.4.1 Introduction.
Kinetic diameter of n-hexane is 4.3 A [7] and the spatial constraints imposed by A1PO and
ZSM-5 catalysts were examined in Figure 6.2.
ALPO-18n-hexane
Figure 6.2 Comparison of the pore diameter of the catalyst to the diameter /f-hexane.
Thomas [2] reports his best results for the oxidation of n-hexane in liquid phase with an
A1PO-18, which has a pore size of 3.8 A. Iglesia [6 ] referenced to Breck [7] showed that the
kinetic diameter of n-hexane is 4.3 A, i.e. larger than the pores within A1PO-18 window,
which suggests than n-hexane can not enter the pore and suggests that steric control of n-
hexane oxidation by A1PO-18 is not credible, however ZSM-5 and A1PO-5 are large enough
to admit n-hexane inside their channels.
165

6.4.2. ZSM-5 catalysts.
6.4.2.1 Solid state ion exchanged
Three different loadings of cobalt have been incorporated in ZSM-5 (Si<V AI2O3 mole ratio
23). Two low theoritical loadings of 0.1 Co/Al (ICP-MS 0.06 Co/Al) and 0.2 Co/Al (ICP-MS
0.11 Co/Al) similar to the Iglesia Theoritical loading 0.1 Mn/Al (ICP-MS 0.088) in ZSM-5
(SiCV AI2O3 mole ratio 24). Higher theoritical loading with 1 Co/Al (ICP-MS 0.65) were
also prepared and tested. These catalysts were already characterised and tested for the
oxidation of «-decane in Chapter 5.
6.4.3. A1PO catalysts.
Co-AlPO-18, Mn-AlPO-18 and Co-AlPO-5 were synthesised by Michelle Gilhespy at
Johnson Matthey [8 ], who was informed of the methodology by Gopinathan Sankar , an
author on the Thomas publication [2]. These materials were also tested in Cardiff for the
oxidation of w-hexane.
6.5. Autoxidation.
Before the catalysts were tested, it was decided to investigate the conversion and the terminal
selectivity of autoxidation, which will be the baseline to compare the activity of the tested
catalysts.
6.5.1. Results.
Thomas reported the performance of two aluminophosphates containing cobalt or manganese
substituted into the framework, as regioselective catalysts for the oxidation of «-hexane, but
did not report the results for the autoxidation in his paper [2]. For Iglesia [1], the autoxidation
has a steady terminal selectivity of around 8 % throughout the conversion range tested.
166

♦ Cardiff autoxidation * - Iglesia Autoxidation ■Af Igiaaia Mn-ZSM-6
0 0.02 0.04 0.06 0.08 0.1 0.12
convaraion (%)
Figure 6.3 Comparison of Cardiff s autoxidation results with Iglesia results.
A higher terminal selectivity has been found for the autoxidation results at Cardiff compared
to those presented by Iglesia [1]. Some of the points obtained in Cardiff autoxidation overlap
with Iglesia’s results with a catalyst. Some control experiments have been performed to
examine possible effects o f impurities by adding branched alkanes to «-hexane during
autoxidation reactions. Basic calculations have been carried out to find out the amount of
impurities present at the start of the reaction when 25 ml of w-hexane (the volume used by
Iglesia) is used. This amount of impurity was compared to the amount of terminal products
formed when a conversion of 0.007% is reached with a selectivity of 25 % (best results
obtained by Iglesia for the oxidation of w-hexane).
rt-Hexane purity (99%) from Fluka.
Volume used by Iglesia =25 ml, purity (%)= 99%
Density=0.6548 g/ml
Mass=0.6548g/ml*25ml=16.37g
Mass of impurity at the start= 16.37g* 0.01 = 164 mg of impurities at the beginning.
Conversion 0.007 % & selectivity (25%) = 0.37 mg of Terminal products made
167

From these simple calculations it is easy to see that terminal products made may come from
the impurities present at the beginning of the reaction. Additions of further quantities of the
impurities were added at the start of the reaction to see if the amount of terminal product
detected could be increased. The same purity of w-hexane (99%) from the same supplier
(Fluka) is being used in Cardiff as was used by Iglesia [1]. It should be noted that in his paper
Iglesia makes no reference to extra purification. Fluka were emailed with regards to the 1% of
impurities present, with the three major impurities present in the batch used by Cardiff being.
• 2-metyhylpentane (0.005%)
CH3
3-methylpentane (0.253%)
HaC
Methylcyclopentane (0.294%)
The total percentage of the impurity disclosed by Fluka is equal to 0.552 %, while the quoted
total level of impurities is <1 %. Two other impurities, 1-hexene and 2-hexene, were also
investigated as promotors for the autoxidation of w-hexane.
The first impurity tested was 3-methylpentane (Figure 6.4). Different masses were added at
the beginning of the reaction to see the effect of this impurity on the terminal selectivity at
low conversion (0.003 to 0.007). In each case the results are compared at 2 blank reactions
(without impurity) performed with /7-hexane from the same bottle.
168

40
7 mg 27 mg 70 mg 90 mg 150 mg Blank 1-0 Blank 2- 0mg mg
Mass of 3 methylpentane (mg)
Figure 6.4 Terminal selectivity with different masses of 3-methylpentane.
Adding different masses of 3-methylpentane at the beginning of the reaction does not
improve terminal selectivity. Very high terminal selectivity is still observed for the short runs
with low conversion.
The same test has been carried out with methylcyclopentane (Figure 6.5) as impurity added at
the beginning of the reaction.
169

25
5mg 100mg Blank 1- 0 mg Blank 2- 0 mg
Mass of methylcyclopentane (mg)
Figure 6.5 Terminal selectivity with different masses of methylcyclopentane.
Adding methylcyclopentane at the start o f the reaction gives results very close to the blank
reaction, with the terminal selectivity remaining very high at the short run times with low
conversion (0.003 to 0.007).
2-methylcyclopentane as impurity was also added at the beginning of the reaction to
investigate its effect on the terminal selectivity (Figure 6.6).
170
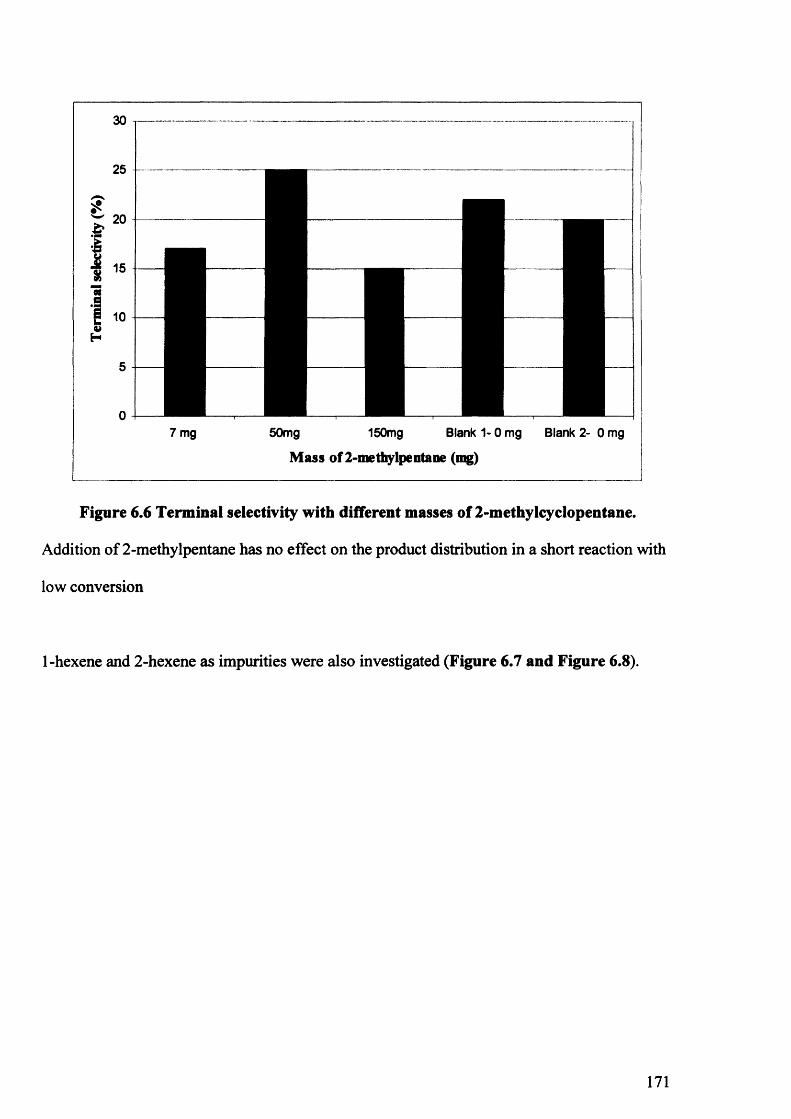
£
a
4)H
30
25
20
15
10
7 mg 50mg 150mg Blank 1- 0 mg Blank 2- 0 mg
Mass of 2-methylpentane (mg)
Figure 6.6 Terminal selectivity with different masses of 2-methylcyclopentane.
Addition of 2-methylpentane has no effect on the product distribution in a short reaction with
low conversion
1-hexene and 2-hexene as impurities were also investigated (Figure 6.7 and Figure 6.8).
171

25
10 mg 55mg 100mg 150 mg Blank 1-0 Blank 2 -0mg mg
M a s s 1 - h e x e n e (m g )
Figure 6.7 Terminal selectivity with different masses of 1-hexene.
120mg Blank 1- 0 mg Blank 2- 0 mg
Mass of 2-hexene (mg)
Figure 6.8 Terminal selectivity with different masses of 2-hexene.
Adding an alkene does not improve the terminal selectivity.
172

Other tests have been carried out with a fresh bottle o f «-hexane under a nitrogen atmosphere.
The aim o f this was to check if the terminal selectivity changes with the age o f the reactants.
Air and w-hexane may react together slowly to form impurities that have an effect on the
autooxidation reaction.
Table 6.5 Terminal selectivity with fresh feed at low conversion.
Conversion (%) Terminal selectivity(%)
0.005 210.007 210.005 17
High terminal selectivity is found with fresh feed. The evolution o f the terminal selectivity
after two o f three months was not tested with this fresh bottle (end o f my PhD).
35
♦ 3 m ethylpentane■ m ethy lcyclopentane A 1 hexene■ 2 m ethylpentane■ 2 hexene
Iglesia autoxidation - • - Ig le s ia ca ta lyst A New bottle n-hexane
25
15
« 10
0.02 0.0250.015
con v ers io n (%)
0.005 0.01
Figure 6.9 Summary of the results.
Adding an impurity at the beginning o f the reaction does not improve significantly the
terminal selectivity at low conversion. Terminal selectivity found at Cardiff is higher than the
terminal selectivity found by Iglesia [1] for autoxidation. With an opened bottle, «-hexane and
air can react together at room temperature and may give peroxide or other products, which
may be responsible for the high terminal selectivity but high terminal selectivity was found
173

with a new bottle o f n-hexane under nitrogen atmosphere meaning high terminal selectivity is
not due to a slow reaction occurring between hexane and air over time.
The catalytic effect o f the autoclave stainless steel walls were investigated by executing the
same reaction with a glass liner.
30
25
& 20 >
Vo9o 15 </>flj•i 10
0)
0 .02 0 .0 4 0 .06
conversion (%)0.08 0.1
♦ Glass liner ■ Iglesia autoxidation A Iglesia catalyst
Figure 6.10 Investigation of the wall effect, conversion vs. selectivity.
The glass liner does not prevent the autoxidation reaction. Higher terminal selectivity at low
conversion with glass liner was found than Iglesia [1]. Terminal selectivity decreases when
the conversion increases.
6.6. Catalyst testing.
The ZSM-5 used by Iglesia [1] had a SiCVAfeOa mole ratio o f 24. The ZSM-5 used at Cardiff
has SiCV AI2 O3 mole ratio of 23. Iglesia [1 ] shows his best results with a low theoretical
loading o f manganese (0.1 Mn/Al). Similar loading were prepared by solid state ion exchange
with cobalt and tested.
174

Table 6.6 Conversion versus time for the low loading (Co-ZSM-5).
Co/Al Time Conversion (%)0.1 lh 00.1 2h 00.1 3h 00.2 lh 00.2 2h 00.2 3h 0
Experimental conditions: 130°C, «-hexane (lOg), 5 bar O2 , 0.6 g of catalyst with glass liner.
No conversion was observed with a low cobalt exchange, meaning enough acid sites are still
available to avoid the propagation of the autoxidation and not enough Co2+ can promote a
heterogeneous oxidation mechanism.
Co-AlPO-18 and Mn-AlPO-18 were also investigated. The main target of these experiments
is to check if there is a different mechanism with manganese and cobalt and if this leads to a
difference in the product distribution of the reaction.
Table 6.7 Comparison between Co-AlPO-18 and Mn-AlPO-18.
Co-AlPO-18 Mn-AlPO-18Conversion Terminal Conversion Terminal
(%) selectivity (%) (%) selectivity (%)0.017 20 0.019 170.099 10 0.109 101.54 4 1.54 4
Similar terminal selectivity and total yields for the same runtime were observed for these
catalysts. No difference between the chemistry of cobalt and manganese even at low
conversion. Increasing the conversion decreases the terminal selectivity in both cases.
The target of these reactions was to investigate the influence of different porous supports were
also investigated (Co-AlPO-5, Co-AlPO-18 and Co-ZSM-5) on the product distribution with
the same redox cation (cobalt).
175

Table 6.8 Comparison between l-Co-AIPO-5, Co-AlPO-18 and Co-ZSM-5.
Co-A IPO-5 Co-AI PO-18 l-Co-ZSM-5Total Yield
(%)Terminalselectivity
<%)
Total Yield(%)
Terminalselectivity
(%)
Total Yield(%)
Total Yield(%)
0.021 18 0.017 20 0.014 160.079 11 0.099 10 0.1 81.34 4.1 1.54 4 1.8 6
No difference in the terminal selectivity has been observed for these different catalysts for
similar conversions. In each case, terminal selectivity is decreasing when conversion is
increasing. The product distribution is not affected by spatial constraints o f the pores.
All the data for autoxidation and activity o f different catalysts have been plotted on the graph
(Figure 6.11) to allow a simple comparison between the different systems.
—A— Iglesia- autoxidation —■— Iglesia- Mn-ZSM-5
▲ Cardiff autoxidation — ♦— Cardiff-Co-ALPO-5 — Cardiff- Co-ZSM-5 —• - Cardiff-Co-ALPO-18 - -■ - Cardiff- Mn-ALPQ-18
0 0.02 0.04 0.06 0.08 0.1 0.12
C onversion (%)
Figure 6.11 Conversion versus. Selectivity for a number of systems used in/i-hexane oxidation
No improvement in the terminal selectivity was found for the oxidation of «-hexane with a
catalyst over Cardiff autoxidation. The plot for Mn-zeolites, different A1PO and Cardiff
25
20
15
10
5
176

autoxidation are very similar for the terminal selectivity obtained. Iglesia autoxidation results
are lower than the results obtained at Cardiff for the autoxidation reaction.
6.7. Discussion.
The chain length of w-hexane is shorter than w-decane. In «-hexane, 6 hydrogen atoms are
primary and 8 are secondary compared to w-decane which also has 6 primary hydrogens but
16 secondary hydrogens. For w-hexane, the ratio primary/secondary hydrogen is 0.75
compared to «-decane, which is 0.37.
The initiation of liquid phase autoxidation of hydrocarbons proceeds via a free radical chain
mechanism described in equation 1. The two main possible activating agents of the
autoxidation are heat and impurities in the feed, which decompose to give radical species [9].
Heat will supply enough energy for the direct radical-forming reaction between hydrocarbon
and molecular oxygen [10].
RH—► R* + H* Equation 1
R* + O2 —» RO2 * Equation 2
The difference in C-H bond dissociation energy between a primary hydrogen and a secondary
hydrogen is 9.4 kcal.mol'1 [2] but the probability of breaking a primary hydrogen rather than a
secondary hydrogen during the initiation steps is very high for «-hexane (H primary/H
secondary =0.75). Then this radical (R*) will insert oxygen to form primary hydroperoxide
(ROOH) in a case of C-H primary bond is broken or a secondary hydroperoxide (ROOH) is
formed in a case of C-H secondary bond is broken (more easily). Our results (Figure 6.3) for
the autoxidation are related to the C-H bond energy dissociations with 75 % internal oxidation
products (secondary carbon) and 25% terminal selectivity (primary carbon) at low conversion.
177

The test with the different masses of impurities and the glass liner did not influence the
terminal selectivity at low conversion compared to the spread of results obtained at Cardiff for
the autoxidation reaction.
The general sequences for the autoxidation reaction are initiation propagation and termination
[9]
Initiation RH—► R* + H*
Propagation R* + O2 —► R 0 2*
r o 2* + r h - > r o 2h + r *
Termination R* + R* —► RH + R(-H)
R 02* + OH * -> ROH + 0 2
R* + R* —► R-R
From the mechanism above, it can be observed that the first stable products made from the
autoxidation are the alcohols. Primary R 02*or ROOH will decompose to the primary
alcohols. The second phase of the reaction is the hydroperoxide decomposition.
Hydroperoxides can break down by thermal scission to give free radicals [9].
ROOH -► RO* + *OH
The thermal decomposition of hydroperoxide promotes the generation of radicals which will
initiate further attack on the hydrocarbon. In the same time over oxidation will occur on the
first oxygenated products formed. All these reactions occur in the same time and give a
difficult product distribution when conversion increases. The further oxidation reactions will
be described below.
The results with a catalyst at low conversion can be separated into two sections. Firstly,
zeolites with low loading of cobalt (Table 6.6) are acid catalysts (high H+ content) with only a
small amount oxidation centre (Co2+). Acid zeolites have already been shown to inhibit the
178

autoxidation by preventing the propagation ROOH species [1]. Acid catalysts are promoting
an ionic decomposition of the ROOH which prevents the generation of radicals or metal
catalysed decomposition of ROOH which supply radical species by homolytic hydroperoxide
decomposition.
Acid decomposition ROOH —► RO+ + OH’
No conversion is observed with the low loading of cobalt meaning the oxidation centre does
not participate in the initiation step and there is no direct docking by the alkane to oxidation
centre.
Secondly, catalysts with a higher loading of cobalt or A1PO with cobalt or manganese (Table
6.7 and Table 6.8) show a conversion because the acidic proton has been replaced by Co2+.
No acid sites, means there is no ionic decomposition of the ROOH. No differences have been
observed for the zeolites and A1PO with different sizes of pores (Table 6.8) meaning that the
steric constraints do not influence the oxygen insertion and shows that the catalyst is doing a
decomposition of the ROOH but does not participate in its formation.
Cobalt and manganese containing compounds are known to be highly efficient catalysts for
the liquid-phase decomposition of ROOH via free radicals [11]. Intermediates along this
reaction path are alkoxy and alkylperoxy radicals:
ROOH + Me" ->• RO* + MelnOH
ROOH + MemOH -► ROO* + Me" + H20
RO* + RH —*• R* + ROH
The main role of the metal ions is to catalyze the homolytic decomposition of the intermediate
hydroperoxide (ROOH) according to equations above. As a result of this decomposition,
179

metal ions generate chain initiating radicals, which form alcohols as oxidation first products
according to last equation.
The alcohols and ketones formed as the primary products of alkane oxidations can be oxidised
further to carboxylic acids by cleavage of C-C bonds, as shown in the simplified reaction
sequence below [12].
R 1-CH2-CH2-R2 — Ri-CH2-CH-(OH)-R2 -> Ri-CH2-C(=0)-R2 -> R 1-CO2H
+ R2-CO2H
So at low conversion, the first products formed are alcohols. The numbers of cracked
products increase with the conversion, so the terminal selectivity (C6) must decrease because
the number products as cracked products increase, so terminal selectivity (C6) can not be
stable versus conversion, in contradiction with Iglesia, where the terminal selectivity is stable
(8%) versus conversion for the autoxidation (meaning the autoxidation is very selective to
terminal C6 products because the number of products increase with conversion) and decrease
when a catalyst is used. This increase of the number of cracked products will dilute the initial
terminal selectivity. It has to be also considered that «-hexane can be functionalise in more
than one position and cleave to more than 2 products. The other contradiction is the same
conversion for the same time with and without catalyst but the metal is doing the catalytic
decomposition of the ROOH, so there is an increase in the rate of the reaction. So for the
same runtime, the conversion must be higher than the autoxidation.
180

6.8. Conclusion.
The Cardiff results show that autoxidation is responsible for high terminal selectivity at low
conversion for the oxidation of H-hexane in liquid phase. These results have been repeated
many times at Cardiff. The use of a glass liner to mimic Iglesia’s glass reactor does not
change the high terminal selectivity. The test with the different impurities added at the
beginning of the reaction did not decrease or increase significantly the terminal selectivity of
the autoxidation. The same purity o f «-hexane was used for the work at Cardiff and by Iglesia.
The Cardiff autoxidation results are similar to Iglesia terminal selectivity with a catalyst. No
results are presented by Thomas for the autoxidation. Cardiff catalysts do not improve the
terminal selectivity and similar results for the terminal selectivity are obtained to the
autoxidation. No difference for the product distribution has been observed between the
different sizes of pores used or the different oxidation centre (Mn or Co). The results show
that catalyst is only participating to decompose the ROOH. Iglesia can not reproduce Thomas
data with A1PO and Cardiff can not reproduce Thomas and Iglesia’s autoxidation data for the
liquid phase oxidation of «-hexane.
181
6.9. References.
[1] B. Zhan, B. Mod6n, J. Dakka, J.G. Santiesteban, E. Iglesia, Journal of Catalysis 245,
(2007), 316.
[2] J.M.Thomas, R. Raja, G. Sankar, R.G. Bell, Nature, (1999), 227.
[4] R. Raja, J.M. Thomas, Chemical Communications, (1998), 1841.
[5] R. Raja, G. Sankar, J.M. Thomas, Journal of the American Chemical Society, 121, (1999),
119.
[6] B. Mod6n, B. Zhan, J. Dakka, J.G. Santiesteban and E. Iglesia, Journal Physical Chemistry
C, 111,(2007), 1402.
[7] D.W. Breck, Zeolite Molecular Sieves; Wiley: New York, (1974).
[8] M. Gilhespy, Johnson Matthey, Billingham.
[9] C.E. Frank, Chemical Reviews 46, (1950), 155.
[10] K.U. Ingold, Inhibition of the autoxidation of organic substances in the liquid phase,
(1961), 563.
[11] M. Hartmann, S. Ernst, Angewandte Chemie International Edition, 5, 39, (2000), 888.
[12] R.A. Sheldon and J.A. Kochi, Metal Catalyzed Oxidations of Organic Compounds,
Academic Press, New York, (1981).
182

Chapter Seven
Conclusion and Future Research
This thesis describes the preparation, characterization and catalytic evaluation of VMgO and
cobalt ion exchanged zeolites for the liquid phase oxidation of alkanes. The reaction studied
was terminal oxidation of long chain linear alkanes using the selective oxidation of w-decane
to 1-decanol as a model reaction. Based on the work carried out to date, the main conclusions
that can be drawn are as follows.
Firstly the present work attempts to summarize the status of liquid phase autoxidation and to
point out the difficult problem of controlled hydrocarbon autoxidation. The initiation step or
activation of the autoxidation is mainly accomplished by heat, which can supply enough
energy for the direct radical-forming reaction between hydrocarbon and molecular oxygen or
by impurities, which decompose to give free radicals under reactions conditions. Direct
reaction of radicals with oxygen result in the formation of hydroperoxide (ROOH). The
hydroperoxide is unstable and breaks down by thermal scission to form radical fragments for
further oxidative attack on the hydrocarbon. This fact complicates enormously the study of
the autoxidation. The radical species can be stabilised by the use of a radical scavenger and
prevent the autoxidation reaction. The product distribution of the autoxidation has a poor
terminal selectivity. Increasing the temperature leads to higher conversion but results in more
cracked products and less selectivity for oxygenated Cio products.
183

Catalysts did not show considerable activity for this reaction with low conversion and very
poor terminal selectivity. The use of a mixed metal oxide catalyst (VMgO) improved the
conversion compared to the autoxidation for the same runtime with the same conditions.
Unfortunately, this activity is due to the leaching of the catalyst after 15 min of reaction,
which can be use in homogeneous catalysis (detailed below).
The steric constraints around the oxidation centre with zeolites did not change the position of
insertion of oxygen in the alkane chain resulting by a similar terminal selectivity compared to
the autoxidation results. By catalysing the decomposition of the hydroperoxide, the catalyst
promotes the generation of radicals which will initiate further attack on the hydrocarbon. The
result of this hydroperoxide decomposition by catalysts is an increase in the conversion
compared to the autoxidation for the same runtime with the same experimental conditions.
Cobalt leaching was not responsible for the activity, which is an interesting point for a
heterogeneous catalyst in the liquid phase.
Finally, the contradiction should be noted in the autoxidation data between Cardiff and the
best results available in the literature published by Iglesia [1] and Thomas [2] for the
oxidation of «-hexane in liquid phase. No data on the autoxidation is available from Thomas.
For Iglesia the terminal selectivity is stable versus conversion in contradiction with the use of
catalyst (terminal selectivity decrease versus time). Cardiff results for the autoxidation of n-
hexane at low conversion gave the same terminal selectivity as observed by Iglesia. These
results cast doubt on heterogeneous mechanism proposed by Iglesia to justify the
heterogeneous activity of Mn-ZSM-5 in the liquid phase. The common agreement between
both teams is to work at very low conversion to examine the activity of a catalyst for
oxidation of a linear alkane in liquid phase. The results found at Cardiff during this thesis and
184

by Iglesia confirm that the results published by Thomas are extremely high and can not be
reproduced. All the catalyst tested in this study for «-hexane and w-decane did not influence
the product distribution of the reaction. Only conversion was affected by the use of a catalyst.
The first suggestion for the future work in the liquid phase is to carefully study the ability of
catalyst to initiate autoxidation because it is during this step the oxygen is inserted into the
alkane chain to give a hydroperoxide. It can be done by working at very low conversion, but
isolating and working with these unstable products (radicals and ROOH) will be another
challenge, then following by a study o f hydroperoxide decomposition by various catalysts.
Hydroperoxide are the first products made by the alkane oxidation in the liquid phase with
and without catalyst, and the fragments formed by the decomposition of the peroxide serve as
initiators for further oxidative attack on the hydrocarbon and complicates enormously the
study of the oxidation process giving a large product distribution, so the importance of
working at very low conversion to avoid these further reactions is clear. It should be kept in
mind that decomposition of the peroxy radical (ROO*) may occur before the formation of the
hydroperoxide (ROOH). Promoting selective hydroperoxide formation and decomposition
with a catalyst will allow a better control over oxidative process, so a better control of the
product profile of the reaction.
Zeolites have shown a dual function during this study. Zeolites can act as radical scavengers
and kill the autoxidation, which is an advantage and can also by the incorporation of metal in
the framework promote the first step of the autoxidation (removal of hydrogen from the
alkane) to form the radical species or promote the decomposition of the ROOH species. It
would be interesting to find a way to protect the external surface of the zeolites to prevent the
in a metal anchor during ion exchange and at the same time leave enough acid sites to stop
185

the autoxidation. To investigate different loadings of metal with different sizes of channels
will also be an interesting research topic. Another thing to be done is the use of an excess of
catalyst and to extract the product from the channels to check if more terminal products are
present but trapped within the pores of the zeolites.
It has been shown that many parameters can be manipulated to control the reaction. A deeper
investigation of temperature, pressure, stirring speed on the product profile of reaction would
be interesting. Repeat reactions with glass reactor to compare to Iglesia results have also to be
done. It will be also interesting to change the kind of reactor and use a fixed bed in liquid
phase with porous catalyst will may give better terminal selectivity than a batch reactor.
Another parameter which can be varied is the oxidant. For example, the use of N2O for the
oxidation of linear alkanes in liquid phase has not been reported. A mild oxidant may make
the autoxidation reaction more difficult and will improve the activity of the catalyst.
A new design of a new catalyst can be envisaged. A few ppm of homogeneous vanadium has
showed to be very active for the oxidation of «-decane with oxygen without solvent. Ligands
around vanadium may provide a good homogeneous catalyst and a selective route to access to
the oxidation centre and form 1-decanol. For a heterogeneous catalyst, different aspects have
to be considered. The first one is some inhibiting sites to prevent the autoxidation and the
second one is the spacial constraint with a very oxidative metal to induce terminal selectivity.
Tea bag technology or carbon nanotubes with active metal could provide this dual function
and have never been reported in the literature for the oxidation of long linear alkanes in liquid
phase.
Another suggestion for future work is an indirect method presented in the introduction with
two steps for selective terminal oxidation of long linear alkane. It is a gas phase process with
heterogeneous catalysts. A multi step process can be a disadvantage as it will be more
186

expensive but if the two step process can be more regioselective than the direct oxidation, a
higher yield can be obtained offsetting the cost of the process. The suggestion is
ammoxidation followed by an oxidation of the nitrile group. Ammoxidation is particularly
attractive and as it leads to a terminal functionalisation of the alkane with guaranteed C=N
functionality. Once the terminal functionalisation has been achieved the nitrile group can be
oxidised to give the primary alcohol. As an example, it has been shown that w-hexane can be
converted to hexanenitirle (monosubstitution) with a selectivity of 30 % and to adiponitile
(disubstitution) with the selectivity o f (40%) [3]. The conversion of this vapour phase
ammoxidation is 15%. This is not necessarily a disadvantage to have dinitrile substitution
because the terminally activated products are of high value. Takahashi et al. [4] have shown a
heterogeneous catalytic method for the oxidation of the nitrile to the corresponding alcohol in
one step. The oxidation over hydrous zirconium oxide can be carried out heterogeneously and
the products are easily isolated. The reduction of aliphatic nitriles proceeds efficiently to give
the corresponding alcohols.
It will be interesting to investigate this method with long linear alkanes and may study the
feasibility to carry out the terminal functionalisation of linear alkanes reaction in one step by
passing the feed over the two different catalysts.
187

References.
[1] B. Zhan, B. Mod6n, J. Dakka, J. G. Santiesteban, E. Iglesia, Journal of Catalysis 245,
(2007), 316.
[2] J. M.Thomas, R. Raja, G. Sankar, R.G. Bell, Nature, (1999), 227.
[3] B.M. Reddy, B. Manohar, Journal of Chemical Society, (1993), 330.
[4] K. Takahashi, M. Shibagaki, H. Matsushita, Chemical Letters, 1, (1990), 311.
188


![Oxidations by the system “hydrogen peroxide–[Mn 2L 2O 3][PF 6] 2 (L = 1,4,7-trimethyl-1,4,7-triazacyclononane)–oxalic acid”. Part 6. Oxidation of methane and other alkanes](https://static.fdokumen.com/doc/165x107/632307aa078ed8e56c0aabd9/oxidations-by-the-system-hydrogen-peroxidemn-2l-2o-3pf-6-2-l-147-trimethyl-147-triazacyclononaneoxalic.jpg)


