Planning for Lincoln and Spruce Feeder Patterns
73
STUDENT AND FAMILY RESOURCE CENTERS: Planning for Lincoln and Spruce Feeder Patterns OCTOBER 2020
-
Upload
khangminh22 -
Category
Documents
-
view
3 -
download
0
Transcript of Planning for Lincoln and Spruce Feeder Patterns
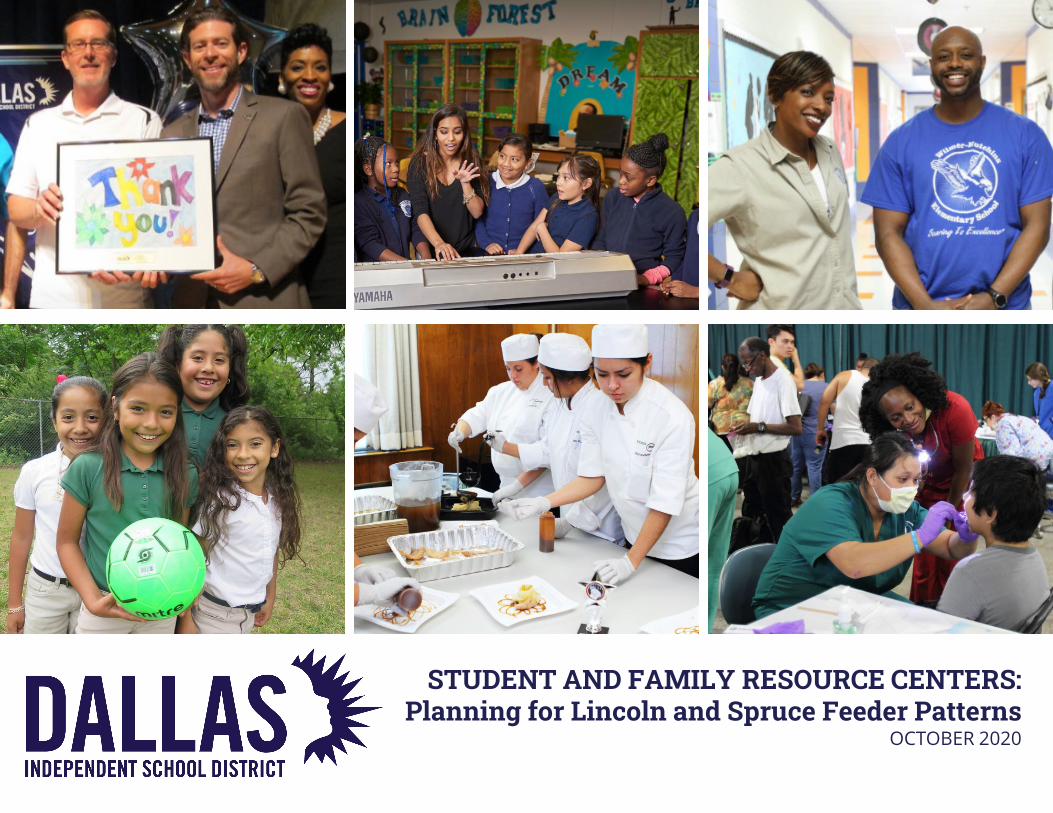
STUDENT AND FAMILY RESOURCE CENTERS:Planning for Lincoln and Spruce Feeder Patterns
OCTOBER 2020

Equity in Bond Planning is a project led by the Dallas Independent SchoolDistrict’s Racial Equity Office to develop concepts for Student and FamilyResource Centers within the Lincoln, Roosevelt, Pinkston, and Sprucefeeder patterns. The resource centers will be new or renovated facilitiesthat can host programs to improve student performance and addresscommunity needs. The District recognizes that students face many out-of-school factors that impact their education and is collaborating with thecommunity to address these areas. Funding for the resource centers hasbeen identified as part of the 2020 Bond Program.
The Child Poverty Action Lab (CPAL) supported the Racial Equity Officewith data analysis and community engagement for this project. Other keycollaborators include HR&A Advisors, Concordia, and bcWORKSHOP. Thereport that follows was written under the direction of HR&A with input byDallas ISD, CPAL, Concordia, and bcWORKSHOP.
2

The 2020 Bond Program, guided by the inspiring leadership of the Dallas ISD Board of Trustees,presents an unprecedented opportunity to rethink how we invest in our children’s futures,acknowledging the impact of our past decisions. Our historical policies and investments hadresounding impacts on our city: perpetuating segregation by prioritizing and providing resources towhite neighborhoods at the expense of Black and Brown neighborhoods. We can begin to reshape thecity, and even the playing field, by reinvesting in the communities we’ve let down.
One avenue for this reinvestment is the 2020 Bond Program. The Racial Equity Office has been leadingan initiative called Equity in Bond Planning, where through data analysis and community engagement,we are identifying facility investments Dallas ISD can make beyond traditional school buildings tosupport the well-being of the whole child, removing barriers that prevent them from achieving theirfull potential. We know that we cannot do this alone and will need committed and creative programpartners from other public agencies and community organizations.
Extensive research shows the impact of community resources, neighborhood environment, and otherout-of-school factors on student achievement, and we have looked to precedents from across thecountry that show how school districts can intentionally support the well-being of the whole child, theirparents, and their community. From this foundation, we are developing concepts for unique,neighborhood specific Student and Family Resource Centers that will help our children thrive. We haveleveraged a data tool, the Community Resource Index, and engaged with hundreds of communitymembers, key campus leaders, elected officials, and other public agencies to identify emerging themesthat are data driven and grounded in community. We believe that we will see a meaningful return onthis investment from the 2020 Bond: healthy families and flourishing students.
This is a meaningful step for our district, but we have not reached the finish line. We must continue todemonstrate our commitment to equity in future investments and ensure that our parents, students,and community leaders continue to steward the Student and Family Resource Centers to fruition. Withthe support of the Board of Trustees, and the people of Dallas, we’re confident in what we can achieve.
Dr. Sharon QuinnDeputy Chief, Racial
Equity OfficeDallas Independent
School District
A Note from the Chief of Staff and Deputy Chief of the Racial Equity Office
DISD EQUITY IN BOND PLANNING | INTRODUCTION
3
Dr. Pamela LearChief of Staff and
Racial Equity OfficerDallas Independent
School District
Table of ContentsTABLE OF CONTENTSExecutive Summary
Process
Spruce Feeder Pattern
Lincoln Feeder Pattern
Next Steps
5
19
23
35
47
4
Appendix 50

EXECUTIVE SUMMARY
5

Equity in Bond Planning: Student and Family Resource Centers isan effort of the Dallas Independent School District’s Racial EquityOffice to improve student achievement through developingfacilities that will support the whole child in communities that havebeen historically and systematically oppressed by Dallas ISD andother governmental institutions. This report summarizes the firstphase of the project and is informed by two concurrent workstreams, aimed at defining a series of emerging themes forinvesting 2020 bond dollars in the Lincoln and Spruce feederpatterns:
• Data Analysis & Research: The Community Resource Index,developed for Dallas ISD by the Child Poverty Action Lab,analyzes available resources in school-based geographies toidentify gaps in services across five categories: Community,Economics, Education, Family, and Health.
• Community Engagement: Campus leadership, elected officials,community members, students and parents participated in aseries of interviews, focus groups, a survey, and publicworkshops to identify assets and needs, prioritize focus areasfor the Resource Centers, and brainstorm requisite facilities.
This report summarizes the analyses and community engagementto date, highlighting emerging themes for each feeder pattern andgeneral recommendations. This report does not prescribe whichprogrammatic and facility recommendations to implement, butreports on emerging community themes and associated next stepsfor the Dallas ISD to undertake.
Pursuing Equity in Dallas ISD
Over the past seven years, Dallas ISD has designed and launchedsystem-wide efforts to work towards equity across schools and forall students. Notable efforts include: the Teacher ExcellenceInitiative (TEI), a best-in-class evaluation system that rewards high-performing teachers; Accelerating Campus Excellence (ACE), anapproach to transform struggling schools through strong
leadership, effective teaching, and high expectations; Funds forAchievement and Racial Equity (FARE), additional funding forschools that need it; Achieving in the Middle (AIM), strategies formiddle schools to improve student performance; and Public SchoolChoice (PSC), in-district opportunities for best-fit learningenvironments.
Equity Resolution & Racial Equity Office
The Racial Equity Office was launched in 2018 with the purpose ofeliminating systemic disparities and building equity across DallasISD. In less than two years, the Racial Equity Office developed thefirst-ever African American Studies course for implementationacross Texas, designed and facilitated professional developmentopportunities to support teachers in culturally responsive teachingpractices, and worked with both campus and central staff toanalyze their own biases and build mindsets that fully value andinclude students of color and English Language Learners. In 2019,REO also collaborated with Education Resource Strategies toconduct a districtwide racial equity audit to uncover systemicinequities. The audit revealed early progress that Dallas ISD hasmade as well as ways to sustain, expand, and explore new work toadvance equity for all students.
Student and Family Resource Centers are an important expansionof REO's early work and a manifestation of the Resolution onRacial, Socio-Economic, and Educational Equity passed by theBoard of Trustees in 2017. The Resolution states, in part:
BACKGROUND
“We recognize that Dallas ISD students face many out-of-school factors that impact their education including but not limited to poverty, housing, transportation, and health care, and in these areas we must engage in robust collaboration with private entities, nonprofits, philanthropy, and municipal institutions including the City of Dallas, Dallas County, the Dallas Housing Authority, and Dallas Area Rapid Transit to alleviate the symptoms of these factors.”
DISD EQUITY IN BOND PLANNING | EXECUTIVE SUMMARY
6

2020 Bond Program
Voters will be asked in November of 2020 to approve a $3.7 billionbond program for investing in new and renovated facilities acrossthe Dallas Independent School District. A portion of this funding isearmarked for investment to build racial equity, conceived of asfour Student and Family Resource Centers.
Legally, these investments must be made in facilities andequipment, not programming or staff, and must be primarily forstudent benefit. The themes and case studies outlined in thisreport may suggest future programs for the Student and FamilyResource Centers, but the District’s bond funding investmentwould be restricted to the construction or renovation of facilitiesand related equipment. Each of the emerging community themesfor the two feeder patterns detailed in this report are intimatelytied to student achievement, directly or indirectly, as influenced byout-of-school factors.
DISD EQUITY IN BOND PLANNING | EXECUTIVE SUMMARY
7
Item Amount
Safety/Security $114,700,000
Facilities (New/Replacement) $1,145,400,000
Facilities Renovations $1,906,200,000
Athletics $124,900,000
Technology $270,000,000
Student & Family Resource Centers $41,300,000
Joint Participation $25,000,000
Green Building Fund $10,000,000
Property Acquisition $25,000,000
Contingency $32,000,000
Total $3,694,500,000

SELECTING LOCATIONSThe Dallas ISD Administration selected four Equity in BondPlanning feeder patterns based on (1) the intersection of fourdatasets: the Community Resource Index, the Intensity of PovertyIndex, the Facility Condition Index, and campus utilization, as wellas (2) the history of segregation and redlining in Dallas. Althoughneed exists across Dallas ISD, the Administration recognized thatneed is particularly acute in neighborhoods that have faceddecades of disinvestment and unfair distribution of financial,educational, and material resources. Consequently, the Lincoln,Spruce, Roosevelt, and Pinkston feeder patterns were selected forStudent and Family Resource Centers to address myriad inequitiesthat exist outside of school but impact students’ experiences inschool.
DISD EQUITY IN BOND PLANNING | EXECUTIVE SUMMARY
History of Segregation
Segregation in Dallas is a direct consequence of a century ofracist urban planning decisions made by public and privateactors. These policies and practices have included exclusionaryzoning, racially restrictive covenants in affluent neighborhoods,block-busting, the building of I-345, I-45, I-30, and WoodallRogers Freeway to the destruction of historic Black and Latinx
8
communities, the intentional concentration of low-incomehousing developments in poor communities of color, and thelegalization of discrimination against voucher-holders. Perhapsone of the most visible legacies of racism in Dallas is themodern-day state of neighborhoods that were redlined by thefederal Home Owners Loan Corporation in the 1940s: it is noaccident that the redlining map corresponds with present-dayconcentrations of poverty, high levels of asthma, and fooddeserts. In short, government institutions, both locally andnationally, have actively designed systems to significantly restrictopportunity for Black and Brown residents. Dallas ISD, at timesduring its 100-plus year history, has also participated indecisions that continue to hurt communities of color today. Infact, Dallas ISD was a perpetrator of segregation, fighting ChiefJustice Earl Warren’s “all deliberate speed” order to integrateuntil 1983, nearly 30 years after Brown vs. Board of Education.
Map of the Lincoln, Spruce, Roosevelt, and Pinkston feeder patterns that were selected for Student and Family Resource Centers.
Map of the 1940s redlining in the City of Dallas, which continues to negatively impact students, their families, and their communities today.

Community Resource IndexMany feeder patterns are in neighborhoods that experience a lack of investment due to systemic racism, so to narrow Equity in BondPlanning communities to just four, Dallas ISD also considered several datasets. The Community Resource Index (CRI) represents astatistical approach that summarizes a collection of neighborhood-level indicators into values for comparison. There are five categoriesrepresented in the CRI - Education, Health, Community, Family, and Economics - and there are indicators associated with each (e.g.,median household income in Economics, number of afterschool program seats in Education, and number of nearby grocery stores inHealth). Every Dallas ISD neighborhood school has one overall index value that represents a combination of all five categories as well as asub-index value for each category. Put simply, the CRI illustrates how resources are allocated in neighborhoods around Dallas ISDschools and helps institutions and individuals act on relevant, specific data at the neighborhood level.
DISD EQUITY IN BOND PLANNING | EXECUTIVE SUMMARY
9
19 55 62 23Community
13 32 40 8Economics
74 44 64 71Education
36 71 73 62Family
8 21 32 6Health
12 32 44 13Overall CRI
CRI CategoryLincoln Feeder Pattern
Spruce Feeder Pattern
Pinkston Feeder Pattern
Roosevelt Feeder Pattern

Intensity of Poverty IndexDallas ISD also considered an in-house Intensity of Poverty Index(IPI) to determine the four feeder patterns for the ResourceCenters. The IPI is a more sophisticated and specific measure ofpoverty than Free-and-Reduced-Price Lunch, as it generates aSocioeconomic Block Score for each census block using data onmedian household income, owner-occupied homes, single-parenthomes, and educational attainment. An IPI value of 1 indicates themost socioeconomically disadvantaged census block, whereas anIPI value of 0 indicates the least socioeconomically disadvantagedcensus block.
Facility Condition Index and UtilizationWhile the Community Resource Index and Intensity of PovertyIndex measure what’s going on in the neighborhood around aschool, the Facility Condition Index (FCI) and utilization ratemeasure what’s going on at the actual school facility. The FCIprovides a benchmark to compare the relative condition of onecampus facility to all campus facilities. It is an industry-standardmeasurement that is the ratio of the cost to correct a facility’sdeficiencies to the Current Replacement Value (CRV) of the facility.The lower the FCI, the better the condition of the building and thelower the need for remediation.
Utilization is calculated by dividing a school’s enrollment by itscapacity, revealing how full the school is. Campuses with highutilization (over 86%) are considered quite full and don’t havemuch room for anything else. Campuses with lower utilizationmight have extra space on site that can be used for otherpurposes, like running supportive services for students and theirfamilies.
For Equity in Bond Planning purposes, Dallas ISD also consideredutilization and FCI to identify feeder patterns and schools with aneed for facility upgrades and extra space.
0.860.69
0.77
0.51
Lincoln Pinkston Roosevelt Spruce
Intensity of Poverty Index
DISD EQUITY IN BOND PLANNING | EXECUTIVE SUMMARY
10
All data reflects high school level information, not feeder patterns
43% 43%
69%
32%
Lincoln Pinkston Roosevelt Spruce
FCI
34%
62%
38%
73%
Lincoln Pinkston Roosevelt Spruce
Utilization

Conduct interviews and focus groups
Workshop 1:Assess
community needs, assets, and
opportunities
Workshops 2 & 3:Identify and
prioritize programs; conduct design
workshop
Review research on national best
practices for school-community
hubs
Connect best practices, impacts, and opportunities with community
input
Refine concepts based on potential partners, costs, and
design factors
Dallas ISD, with support from the project team, initiated the Equity in Bond Planning process with the Spruce and Lincoln FeederPatterns. Focusing on the Spruce and Lincoln Feeder Patterns, this report is grounded in research and data analysis, and a robustcommunity engagement process. Data analysis and research quantified the impacts of inequitable systems on communities and inspiredcommunity participants to imagine the possibilities at the Resource Centers. Spruce and Lincoln community members provided context,nuance, and “ground truth” only possible through lived experience. The Pinkston and Roosevelt Feeder Patterns are following a similarprocess, which started in late summer.
TIMELINE
DISD EQUITY IN BOND PLANNING | EXECUTIVE SUMMARY
11
Conduct interviews and focus groups
Workshop 1:Assess community needs, assets, and
opportunities
Workshops 2 & 3:Identify and
prioritize programs; conduct design workshop
Review research on national best practices for
school-community hubs
Connect best practices, impacts, and opportunities with community
input
Refine concepts based on potential partners, costs, and
design factors
Community priorities
and emerging themes
Community priorities
and emerging themes
May 2020 June 2020 July 2020 August 2020
September 2020
October 2020April 2020
Spruce & Lincoln Feeder Patterns
Pinkston &
Roosevelt Feeder
Patterns
November2020

Dallas ISD recognizes that, for many communities, the school is the anchor public institution, the conduit between families and criticalresources, information, and support in times of crisis. Although schools are in the primary business of teaching and learning, they do farmore. Nationally, 7.3 billion meals are served at schools annually, more than two million children access healthcare from 2,500+ school-based health clinics in 48 states, and 10.2 million students attend after-school programs. Schools aren’t just for children, either: adultstake literacy and English classes, vote, and access services and job training programs at public schools.
Covid-19 has laid bare how important the local school is for students and their families. School staff have not only providedlearning opportunities, but also regular meals, counseling on where to access testing, how to apply for rental assistance, and social-emotional support to weather the storm. Schools are trusted institutions for families and go-to places for far more than just education.
Locally, Dallas ISD schools exemplify the notion of trusted anchor institutions that serve a range of needs for students andtheir families. In support of its core mission of educating all students for success, Dallas ISD runs 11 Youth and Family Centers atschool-based clinics to offer mental, behavioral, and physical health services to over 5,000 students annually. In the 2020-21 budget,Dallas ISD Trustees also approved 57 new positions - including 53 clinicians - as part of the Mental Health Services Department to betteraddress the behavioral, emotional, and social issues that students experience. Dallas ISD also supports Frazier House, a collaborationwith community nonprofits and service organizations to provide Adult Basic Education, career development and skills training, jobplacement, legal counsel, and more, as well as the Fannie C. Harris Youth Center for students experiencing homelessness. Almost allDallas ISD schools also maintain community liaisons, counselors, and school psychologists who are tasked with supporting the myriadneeds of students.
COMMUNITY & STUDENT ACHIEVMENT
DISD EQUITY IN BOND PLANNING | EXECUTIVE SUMMARY
12Source: School Nutrition Association; National School-Based Health Care Census; Afterschool Alliance

Dallas ISD and districts nationwide go above and beyond the call toeducate students because so many out-of-school-time factors impactwhether a student comes to school ready to learn and thrive. Out-of-school-time factors such as housing and neighborhoods, food and nutrition,healthcare, and poverty all relate to student success in school. Housingquality, stability, and affordability, for example, weigh heavily on students:
• Children in substandard housing have worse academic outcomes inmath and reading and are more likely to experience behavioralproblems. Substandard housing and nearby environmental hazards(that are disproportionately located in low-income communities ofcolor) also impact children’s health through asthma and respiratoryillness, lead poisoning, and accidental injury.
• Students who are highly mobile (i.e., who move from school-to-schoolfrequently) perform approximately one year behind non-mobile peerson reading and mathematics tests. The affordable housing crisis is amajor source of housing instability for low-income families, as rents riseand wages can’t keep pace, forcing families out of their homes.
• Families who are housing cost-burdened - meaning they pay 30% or more of their income on housing expenses - have to make difficult tradeoffs. Housing affordability, for example, can impact the cognitive achievement of children, in part due to a lack of disposable income available to invest in child development experiences.
DISD EQUITY IN BOND PLANNING | EXECUTIVE SUMMARY
13
Source: MacArthur Foundation, Poor Quality Housing is Tied to Children’s Emotional and Behavioral Problems; Temple, J., Reynolds, A. School Mobility and Achievement: Longitudinal Findings From an Urban Cohort; Newman, S., Holupka, C. Housing Affordability And Children’s Cognitive Achievement.

Access to nutritious food and regular meals are also critical for students’ overall wellbeing and achievement inschool:
• It’s hard to focus on schoolwork when you’re hungry. Students who are experiencing hunger and food insecurity aremore likely to be tardy or absent from school and also show decreased motivation in the classroom. Chronic stress thatstems from food insecurity and poverty can also lead to delays in brain development and produce anxiety in children.
• Students who participate in school breakfast programs show improved behavior and mental health, attendance, andacademic performance as well as decreased tardiness.
• High school students who engage in healthy eating habits (e.g., eating fruits and vegetables), and physical activity self-report higher letter grades.
Poverty and parental access to education and employment opportunities also impact students’ educationaloutcomes:
• Poor children with parents who have more than a high school education are 30% more likely to complete high school andalmost five times more likely to complete college than poor children whose parents did not complete high school.
• Children living in poverty tend to score lower on standardized tests, have lower grades in school, and realize lesseducational attainment, which ultimately impacts wages in adulthood.
• Children in neighborhoods of concentrated poverty experience greater exposure to crime, tend to access low-performingschools with higher dropout rates, and face weak employment opportunities and greater financial insecurity. The longer achild is in a high-poverty neighborhood, the harder it is to realize upward economic mobility.
As does access to healthcare:
• Issues like vision and oral health problems, asthma, obesity, and chronic stress, as well as risk-taking behavior likesubstance abuse, are associated with low academic achievement.
• School-based preventative healthcare is positivity related to students’ educational outcomes, including a higher GPA,lower odds of failing a class, and higher odds of graduating high school.
These out-of-school-time factors (and many more) impact student success in school. Students who have their basic needs met are moreprepared to show up to school ready to learn and thrive. School-based wraparound services and the community schools model embracethe idea that a student’s academic needs cannot be fully met without also meeting their basic needs. Early evidence in support of thisapproach is promising, and Dallas ISD stands to better serve historically marginalized communities through Student and Family ResourceCenters that consider and respond to the needs of the whole child.
DISD EQUITY IN BOND PLANNING | EXECUTIVE SUMMARY
14Source: Food Research & Action Center, Breakfast for Learning; Food Research & Action Center, Breakfast for Behavior; National School-Based Health Alliance
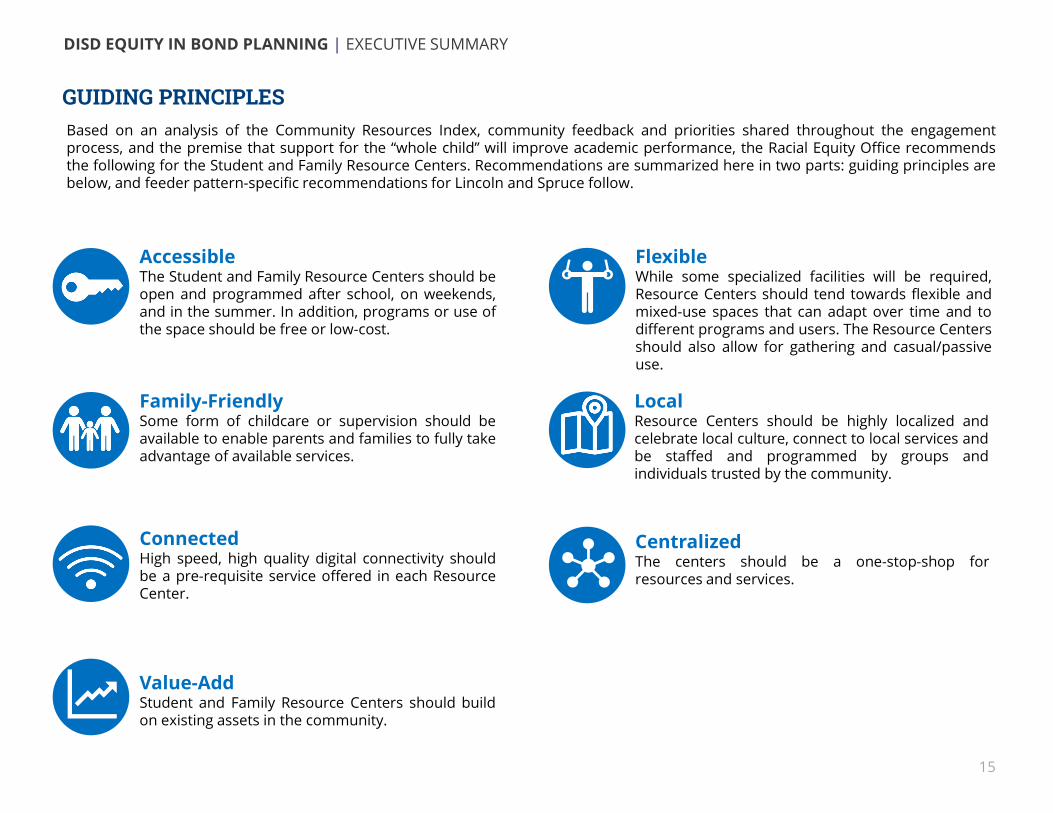
AccessibleThe Student and Family Resource Centers should beopen and programmed after school, on weekends,and in the summer. In addition, programs or use ofthe space should be free or low-cost.
Based on an analysis of the Community Resources Index, community feedback and priorities shared throughout the engagementprocess, and the premise that support for the “whole child” will improve academic performance, the Racial Equity Office recommendsthe following for the Student and Family Resource Centers. Recommendations are summarized here in two parts: guiding principles arebelow, and feeder pattern-specific recommendations for Lincoln and Spruce follow.
Family-FriendlySome form of childcare or supervision should beavailable to enable parents and families to fully takeadvantage of available services.
ConnectedHigh speed, high quality digital connectivity shouldbe a pre-requisite service offered in each ResourceCenter.
FlexibleWhile some specialized facilities will be required,Resource Centers should tend towards flexible andmixed-use spaces that can adapt over time and todifferent programs and users. The Resource Centersshould also allow for gathering and casual/passiveuse.
LocalResource Centers should be highly localized andcelebrate local culture, connect to local services andbe staffed and programmed by groups andindividuals trusted by the community.
CentralizedThe centers should be a one-stop-shop forresources and services.
GUIDING PRINCIPLES
Value-AddStudent and Family Resource Centers should buildon existing assets in the community.
DISD EQUITY IN BOND PLANNING | EXECUTIVE SUMMARY
15

“Those parents could use so much help, and they don’t often feel comfortable at school.” – Workshop 1 participant“So I’ve thought of how to empower parents and how can they play a role. Do our parents know the trajectory of courses to be college ready? If they aren’t informed, then they don’t necessarily feel like they have a role to play.” – Workshop 1 participant
There are 609 afterschool programseats per 10,000 children,
compared to a maximum of 4,065 afterschool program seats per
10,000 children.
“We need better funding of afterschool programs, an extra school person or teacher to sponsor afterschool programs to be there for the kids.” - Workshop 1 participant
“Health services need to be accessible and affordable to folks in the community.” – Workshop 1 participant
There are .47 clinics per 10,000 residents within a two-mile radius
of Spruce High School, compared to a maximum of 4.59 clinics per
10,000 residents.
There are .233 libraries and .47 community and rec centers per 10,000 residents, compared to a
maximum of 1.342 libraries and 4.41 community and rec centers per
10,000 residents.
“In our area, there isn’t a whole lot. One of the issues is lack of facilities for exercise or even trees and sidewalks to make it possible to do that outside safely.” -Pleasant Grove community member
Access to Primary
Care
Safe Streets
and Public Spaces
Family Counseling
& Resources
After School & Summer Programs
The data tells us… The community tells us…
EMERGING THEMES FOR SPRUCE FEEDER PATTERN
Source: Community Resource Explorer
DISD EQUITY IN BOND PLANNING | EXECUTIVE SUMMARY
16
The Emerging Themes below represent the cumulative findings of an extensive community engagement process and analysis of key indicators in each community. Depending on the approval of the 2020 Bond, available resources, and alignment to other work underway, Dallas ISD will begin to address some or all of these themes through the Student and Family Resource Centers. The fullreport details the methodology behind these findings.
There are 6.68 licensed childcare centers per 10,000 children under age 5, compared to a maximum of 36.35; 1,804 adults reported poor mental health for 14 days or more per 10,000, compared to a minimum
of 602.

1,876 adults reported poor mental health for 14 days or more, per
10,000 residents, compared to just 602 adults per 10,000 in the most
well-resourced community.
“It’s important to incorporate wellness into the community as a form of pro-activity for Black folks, for POC with proximity to trauma and deploy cultural responsive mindfulness. Therapists who come into the community need experience with trauma. What are the needs in the community, so we can be proactive in anticipating children's needs?” – Workshop 2 participant
“Healthcare starts with food and we live in a food desert.” –Interview participant
“Job trainings – Parents and students need all of this”-Workshop 1 participant
“Connecting students to growing industries”-Workshop 2 participant
There are 1.2 grocery stores per 10,000 residents in the
neighborhood, compared to a maximum of 2.27 and $244 avg. spending on fresh fruits and
vegetables monthly, compared to a maximum of $535.
Within a two-mile radius of Lincoln High School, there are 5,355 jobs, compared to maximum of 209,962
and a youth unemployment rate of 29.8% compared to a minimum of
4%.
There are .401 libraries per 10,000 residents, compared to a maximum
of 1.342 libraries per 10,000 residents and 1,119 juvenile-
committed crime incidents per 10,000 residents between ages 16-24, compared to a minimum of 0.
“Not having to worry about getting hurt or what other people are doing or being cautious . . . just being able to go outside freely without feeling scared or anything.” – Student Focus Group participant
Access to Healthy
Food
Safe Streets
and Public Spaces
Job Training
Access to Mental Health Care
The data tells us… The community tells us…
Source: Community Resource Explorer
DISD EQUITY IN BOND PLANNING | EXECUTIVE SUMMARY
17
EMERGING THEMES FOR LINCOLN FEEDER PATTERNThe Emerging Themes below represent the cumulative findings of an extensive community engagement process and analysis of key indicators in each community. Depending on the approval of the 2020 Bond, available resources, and alignment to other work underway, Dallas ISD will begin to address some or all of these themes through the Student and Family Resource Centers. The fullreport details the methodology behind these findings.

These concepts will need to be refined, partnerships developed, and facilities designed. Implementation of the Student and FamilyResource Center will require ongoing community engagement and the inclusion of community leadership directly in the decision-makingprocess. Ongoing planning for partnership, programming, and facilities design will need to progress in concert. Dallas ISD will set animplementation timeline for issuing solicitations to identify qualified and interested parties with a focus on leveraging additionalresources to expand impact, elevate community-based partners, and apply equitable contracting practices. The chart below indicateshigh-level next steps for carrying the project forward.
NEXT STEPS
DISD EQUITY IN BOND PLANNING | EXECUTIVE SUMMARY
IMPLEMENTATION
Partnerships &Programming
Facilities Planning &
Design
Community Engagement
18
Establish a steering committee per feeder
and engage community members to refine
program and facility concepts once sites are
selected.
Solicit interest from community-based
providers and assess capacity for
participation in Center.
Continue public engagement
throughout the design process and work with
community-based service providers to
build capacity.
Select sites for Resource
Centers by assessing assets,
capacity, and facilities/site
potential.
Refine programs based on data, site constraints
and opportunities,
local codes, and community
input.
Initiate design solicitation.
Select design partners and begin design.
Convene other public agencies to share
findings of this report. Collectively brainstorm
how other agencies might help address identified
needs.
Establish an internal district infrastructure
(e.g., a dedicated team) to manage the design
and implementation of the Resource Centers
long-term.
Develop an operational model for the Resource
Centers (including funding,
partnerships, evaluation, etc.).

PROCESS
19

Community members fromeach feeder pattern sharedassets, needs, and programideas that would help ResourceCenters make theirneighborhoods more equitableand improve studentachievement.
The project team codedcommunity input by CRI Sub-Category, and analyzed needsand programs based onemphasis and frequency todetermine priorities.
The project team uncoveredemerging themes and relatedprogram ideas.
Glossary of Terms
Community Resource Index (CRI) - The Community ResourceIndex is a data analysis tool used to help identify school feederpatterns facing disinvestment and a resulting lack ofinstitutional resources and services through examiningindicators in five categories (Community, Economics,Education, Family, Health).
Community Resource Index Sub-Categories – The project teamestablished a set of sub-categories used throughout thecommunity engagement process to group ideas for facilitiesand services for the Student and Family Resource Centers.
Community Assets – Community members identified people,places, services, organizations, and qualities that benefit theirneighborhoods.
Community Needs – Community members identified services,resources, or institutions that were missing from orunderdeveloped in their neighborhoods.
Program Ideas – Community members generated ideas forprograms and activities that they desired to see in the Studentand Family Resource Centers.
Emerging Themes – Throughout the process of communityengagement and data analysis, certain priorities were expressedmore frequently than others. Repeated priorities that weresupported by quantitative data became Emerging Themes, i.e.leading needs that should be addressed in the Resource Centers.
Methodology
METHODOLOGY & GLOSSARY
DISD EQUITY IN BOND PLANNING | PROCESS
20

COMMUNITY ENGAGEMENTThe process was driven by community engagement - we learned about community assets and needs, identified and prioritized areasfor investment, and brainstormed concepts for the Student and Family Resource Centers.
DISD EQUITY IN BOND PLANNING | PROCESS
21
WORKSHOP 1 WORKSHOP 2 WORKSHOP 3
Developed a shared understanding of equity and identified community assets and needs
Prioritized areas for investment
Co-designed Student and Family Resource Center concepts
Conducted interviews and focus groups with community, campus leadership, and elected officials on their vision for equity in the community, and assets and needs
INTERVIEWS & FOCUS GROUPS SURVEYS
Collected data from the community regarding local assets and needs

“Save the Date” mailers were sent to addresses in
Lincoln and Spruce zip codes, advertising
website and workshops
Color flyers w/ surveys and website were
distributed at Grab and Go meal distribution sites
Email list contacted stakeholders advertising
workshops
1,000
4,000
5,000
Individuals reached with social media posts about
engagement effort20,000
Together, Dallas ISD Communications staff and the Racial Equity Office led a comprehensive effort to communicate the intentions,parameters, and opportunities to get involved in planning for the Student and Family Resource Centers. The project team pivoted publicengagement efforts to include virtual online engagement in place of in-person community workshops due to the COVID-19 pandemic,while distributing and collecting information in-person through venues such as food distribution sites to reach community members withinadequate internet access. To reach a broad spectrum of community members, outreach was done both digitally through emails, virtualinterviews and focus groups, and in-person, through the distribution of flyers and paper surveys.
OUTREACH
DISD EQUITY IN BOND PLANNING | PROCESS
22
Unique individuals participated in workshops, surveys, focus groups, or interviews
320+
Spruce Feeder Pattern
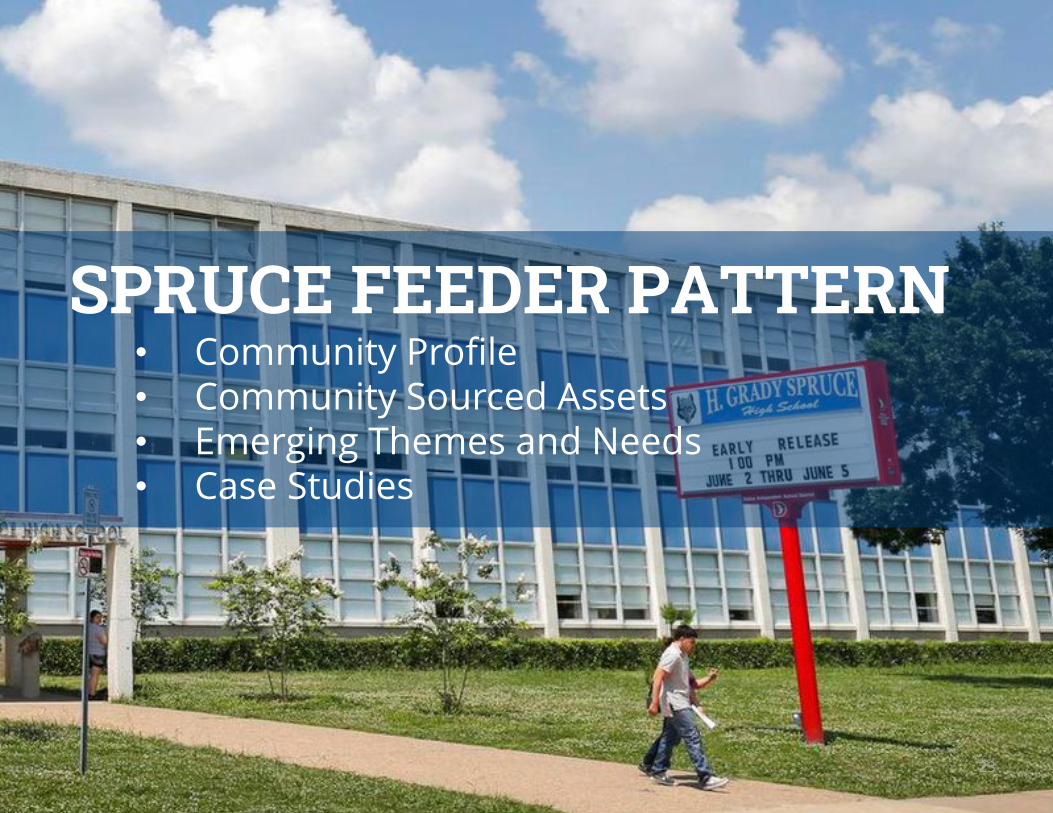
SPRUCE FEEDER PATTERN • Community Profile• Community Sourced Assets• Emerging Themes and Needs• Case Studies
23

The Spruce feeder pattern is located in Pleasant Grove, southeast of Downtown Dallas. Pleasant Grove is a young community with anentrepreneurial spirit and home to many small business owners and budding entrepreneurs. Churches are also important to the fabricof the community, as are the bazaars, local restaurants, and local institutions (like Eastfield College and the Southeast Dallas Chamber ofCommerce). The Salvation Army on Elam, the branch libraries off Lake June Road, and the Great Trinity Forest are other local assets.
DISD EQUITY IN BOND PLANNING | SPRUCE FEEDER PATTERN
COMMUNITY PROFILE
0
COMMUNITY RESOURCE INDEX
24
55Community
32Economics
44Education
71Family
21Health
32
1000
The Spruce Feeder Pattern has an overall CRI score of 32.
Structural and historical barriers have led to a lack of investment and limited access to resources in the neighborhood, including Pleasant Grove’s physical distance and separation by the Trinity River and interstate highways from areas with greater opportunity; the neighborhood’s late annexation into the City of Dallas in the 1950s and 1960s; white flight and subsequent environmental injustice, and ongoing surrounding industrial zoning. Despite these, the Spruce feeder pattern and Pleasant Grove, in general, have developed a strong community identity and local assets.

As part of the engagement process, we asked interviewees and focus group members to list local assets. We intentionally definedassets broadly, ranging from local stores, churches, community centers, or a general sense of pride so that residents could speakto parts of their community that they value. During the data analysis phase, we coded different assets to account for both theirfrequency and their CRI category. While the assets on the map are representative of community engagement, they are notrepresentative of all the assets that exist in the area. The size of the bubble represents the frequency that an establishment wasmentioned. Overall, small businesses and libraries were tied for the most mentioned asset in the community. A sense ofcommunity and family were tied for number two alongside churches. Asset mapping begins to form our understanding of whereresidents are shopping or enjoy spending their time. It also sets a baseline for potential partners down the line.
COMMUNITY SOURCED ASSETS
1
2
3
3
3
4
4
5
6
6
6
11
11
61 Mentioned Once
15 Mentioned Twice
Spruce Career Institute
Parks
Grocery stores
DISD Staff
Salvation Army
Recreation Centers
Community
Churches
Family
Library
Local businesses
Assets by Frequency Mentioned
DISD EQUITY IN BOND PLANNING | SPRUCE FEEDER PATTERN
Community Family/ EducationEconomics Health
25

“For my family, it’s our church in PG. It’s the church I grew up with, and my parents are very active members in the church,
so that’s a really important institution”
DISD EQUITY IN BOND PLANNING | SPRUCE FEEDER PATTERN
26
“Strong family ties”
“Our greatest asset is our voice, it’s important to share our stories, stories of success.”
“Salvation Army on Elam was a big pillar in the community - a place for recreation and learning.”
“The Mom and Pop shops.”
“The Lake June library -they put on a lot of
programs”
“Bazaars/festivals are a huge center and the livelihood of a
lot of families”
COMMUNITY SOURCED ASSETS
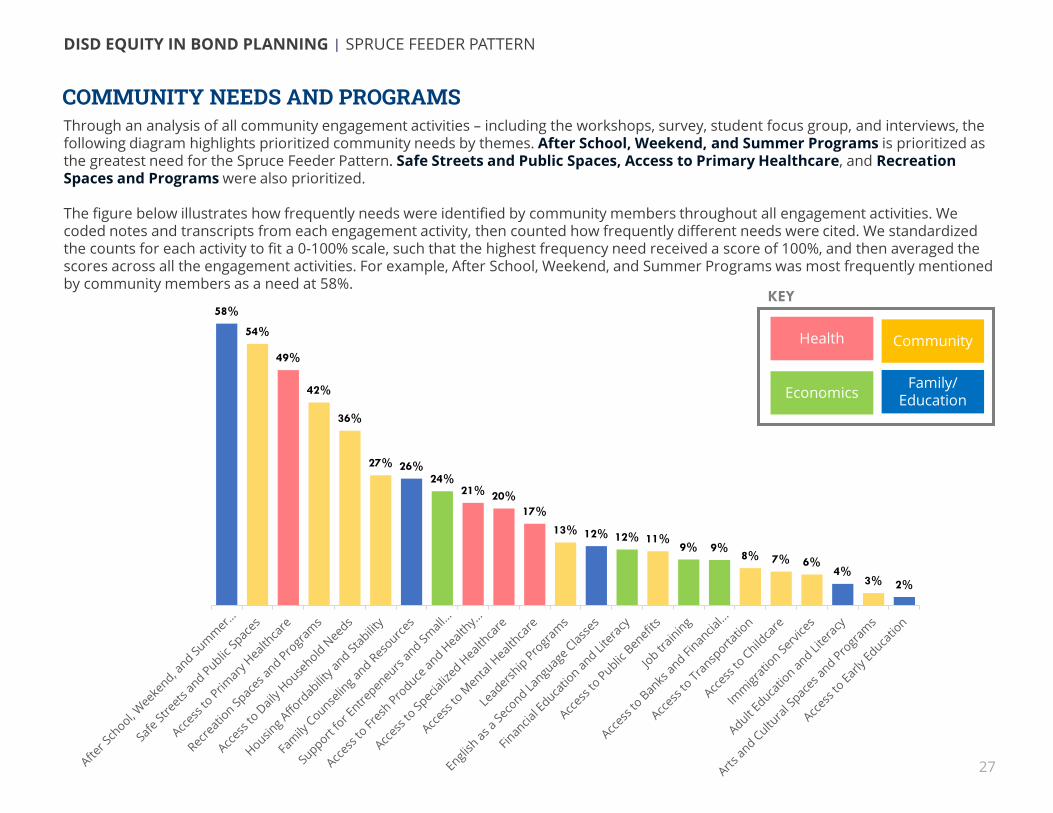
Through an analysis of all community engagement activities – including the workshops, survey, student focus group, and interviews, the following diagram highlights prioritized community needs by themes. After School, Weekend, and Summer Programs is prioritized as the greatest need for the Spruce Feeder Pattern. Safe Streets and Public Spaces, Access to Primary Healthcare, and Recreation Spaces and Programs were also prioritized.
The figure below illustrates how frequently needs were identified by community members throughout all engagement activities. We coded notes and transcripts from each engagement activity, then counted how frequently different needs were cited. We standardized the counts for each activity to fit a 0-100% scale, such that the highest frequency need received a score of 100%, and then averaged the scores across all the engagement activities. For example, After School, Weekend, and Summer Programs was most frequently mentioned by community members as a need at 58%.
COMMUNITY NEEDS AND PROGRAMS
DISD EQUITY IN BOND PLANNING | SPRUCE FEEDER PATTERN
27
Health
Economics
Community
Family/Education
KEY58%
54%
49%
42%
36%
27% 26%24%
21% 20%17%
13% 12% 12% 11%9% 9%
8% 7% 6%4%
3% 2%

67%
50%47% 46%
33%
24%19% 18% 17% 16% 15%
11%8% 8% 8%
6%3% 3% 3%
0% 0% 0% 0%
Needs Total Score - CRI Sub Category
Throughout the community engagement activities, community members proposed solutions to build on existing assets and address needs. The following diagram illustrates prioritized program ideas by themes in comparison to prioritized community needs. This overlay illustrates the degree of alignment between community-identified “needs” and what community members would like to see within theStudent and Family Resource Centers. Community members prioritized Family Counseling and Resources program ideas. Similar to the prioritized community needs, community members prioritized program ideas addressing After School, Weekend, and Summer Programs and Safe Streets and Public Spaces.
The figure below illustrates the frequency various program ideas were elevated by community members in comparison to the needs. For example, community members most frequently mentioned Family Counseling and Resources program ideas at 67%, but less frequently raised them as a need (26%).
COMMUNITY NEEDS AND PROGRAMS
DISD EQUITY IN BOND PLANNING | SPRUCE FEEDER PATTERN
28Community Needs
Health
Economics
Community
Family/Education
KEY

“Those parents could use so much help, and they don’t often feel comfortable at school.” – Workshop 1 participant“So I’ve thought of how to empower parents and how can they play a role. Do our parents know the trajectory of courses to be college ready? If they aren’t informed, then they don’t necessarily feel like they have a role to play.” – Workshop 1 participant
There are 609 afterschool programseats per 10,000 children,
compared to a maximum of 4,065 afterschool program seats per
10,000 children.
“We need better funding of afterschool programs, an extra school person or teacher to sponsor afterschool programs to be there for the kids.” - Workshop 1 participant
“Health services need to be accessible and affordable to folks in the community.” – Workshop 1 participant
There are .47 clinics per 10,000 residents within a two-mile radius
of Spruce High School, compared to a maximum of 4.59 clinics per
10,000 residents.
There are .233 libraries and .47 community and rec centers per 10,000 residents, compared to a
maximum of 1.342 libraries and 4.41 community and rec centers per
10,000 residents.
“In our area, there isn’t a whole lot. One of the issues is lack of facilities for exercise or even trees and sidewalks to make it possible to do that outside safely.” -Pleasant Grove community member
Access to Primary
Care
Safe Streets
and Public Spaces
Family Counseling
& Resources
After School & Summer Programs
The data tells us… The community tells us…
EMERGING THEMES FOR SPRUCE FEEDER PATTERN
Source: Community Resource Explorer 29
The Emerging Themes below represent the cumulative findings of an extensive community engagement process and analysis of key indicators in each community. Depending on the approval of the 2020 Bond, available resources, and alignment to other work underway, Dallas ISD will begin to address some or all of these themes through the Student and Family Resource Centers.
There are 6.68 licensed childcare centers per 10,000 children under age 5, compared to a maximum of 36.35; 1,804 adults reported poor mental health for 14 days or more per 10,000, compared to a minimum
of 602.
DISD EQUITY IN BOND PLANNING | SPRUCE FEEDER PATTERN
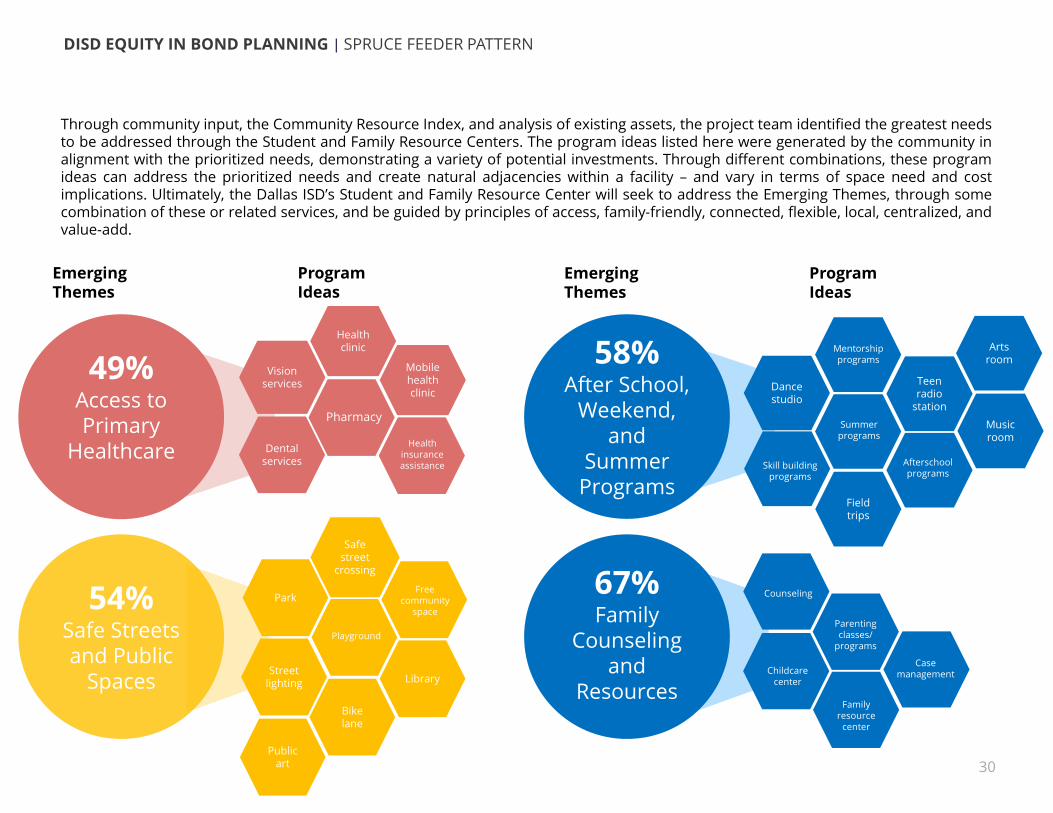
67%Family
Counseling and
Resources
49%Access to Primary
Healthcare
54%Safe Streets and Public
Spaces
58%After School,
Weekend, and
Summer Programs
Through community input, the Community Resource Index, and analysis of existing assets, the project team identified the greatest needsto be addressed through the Student and Family Resource Centers. The program ideas listed here were generated by the community inalignment with the prioritized needs, demonstrating a variety of potential investments. Through different combinations, these programideas can address the prioritized needs and create natural adjacencies within a facility – and vary in terms of space need and costimplications. Ultimately, the Dallas ISD’s Student and Family Resource Center will seek to address the Emerging Themes, through somecombination of these or related services, and be guided by principles of access, family-friendly, connected, flexible, local, centralized, andvalue-add.
Health clinic
Vision services
Mobile health clinic
Dental services
Park
Safe street
crossing
Public art
LibraryStreet
lighting
Bike lane
Music room
Teen radio
station
Arts room
Dance studio
Field trips
Emerging Themes
Program Ideas
Emerging Themes
Program Ideas
DISD EQUITY IN BOND PLANNING | SPRUCE FEEDER PATTERN
Case management
Parenting classes/
programs
Counseling
Childcare center
Family resource
center
Health insurance assistance
Playground
Free community
space
Mentorship programs
Afterschool programs
Skill building programs
Summer programs
30
Pharmacy

Case Study: Sun Valley Health Center Location: Los Angeles, CACRI Category: HealthPartners: Los Angeles County, Los Angeles Unified School District, UCLA, and Northeast Valley Health Corporation
Program DriversThe Sun Valley community has significantly higher asthma,diabetes, and obesity rates than the rest of the County. The areareceived a medically under-served designation with a healthprofessional shortage for primary care. In addition, one-third ofSun Valley residents are uninsured with over 80 percent of itschildren living in households at or below 200 percent of poverty.Health challenges are further reinforced at Sun Valley MiddleSchool, where there are 3,000 enrolled students with only one full-time nurse.
Design And Program FeaturesLos Angeles County and University of California Los Angeles(UCLA) identified the Sun Valley community as having the greatestneed for a health center. Partnering with Los Angeles UnifiedSchool District (LAUSD) and Northeast Valley Health Corporation(nonprofit healthcare provider), they opened a health center in2008 on the Sun Valley Middle School campus to provide free andlow-cost healthcare to the students and community. As the largestschool-based community health center in the country, the centerprovides free and low-cost adult and pediatric care includingpreventive care, chronic disease management, dental care, andmental healthcare.
The Sun Valley Health Center is located on the Sun Valley MiddleSchool campus and provides free and low-cost healthcare tostudents and community members.
The health center was the outcome of a cross-jurisdiction conversation about how to best serve the community. The partnership among Los Angeles County, LAUSD, UCLA, and Northeast Valley Health Corporation unlocked multiple funding sources to construct and operate the center.
DISD EQUITY IN BOND PLANNING | SPRUCE FEEDER PATTERN
31
Health clinic
Dental services
Mental health care
Health education program

Lessons LearnedThe health center project did not start as a school-specific project.As a result, it took a long time to coordinate among the County andthe School District to identify an available site to locate the center.
The success of the project is attributed to a cross-jurisdictionalconversation about the needs of the Sun Valley community, whichled to a supportive partnership among the County, LAUSD,Northeast Valley Corporation, and UCLA. The partnership has aclear vision to leverage assets – real estate, federal funds,community assets – to address community needs. Leaders withinLA County and LAUSD championed the health center and itsimplementation, enabling the project to happen.
Following the success of the health center, LAUSD and NortheastValley Corporation partnered to expand the center and convertan old agriculture building on the campus to a new dedicateddental clinic. The dental center holds six dental chairs, a lab,restrooms, offices, waiting rooms, and a health education room. Itis open six days a week and staffed by two to three dentists and10 assistants. The majority of the health and dental center’spatients are students.
CollaborationThe School District owns the land - which was previously unused –and granted the County free use for 40 years. In exchange, theCounty agreed to build the health center – which cost around $7million. As a federally qualified healthcare provider, NortheastValley Corporation receives federal funds to operate the clinic. Inaddition, UCLA Geffen School of Medicine provides free asthmascreenings for students and families. The Sun Valley DentalCenter was funded through a local bond measure.
Land Ownership LAUSD
Capital/ Construction Expenses Los Angeles County
Operations & Maintenance Northeast Valley Corporation via federal funding
ProgrammingNortheast Valley Corporation, UCLA Geffen School of Medicine
“In the case of libraries or other facilities for which there is bond money, the assets are there. So as long as you're in the business of acquiring land and building schools, it doesn't take that much more effort—and not even that much more money—to make the school site a broader community-based site with all kinds of community-based assets. And in this community, no asset is more valuable than this health clinic.” – L.A. County Supervisor Zev Yaroslavsky
Safe Streets
and Public Spaces
Access to Primary Health care
After School
Programs
Family Counseling
Case Study: Sun Valley Health Center
DISD EQUITY IN BOND PLANNING | SPRUCE FEEDER PATTERN
32
Case Study Alignment to Emerging Themes
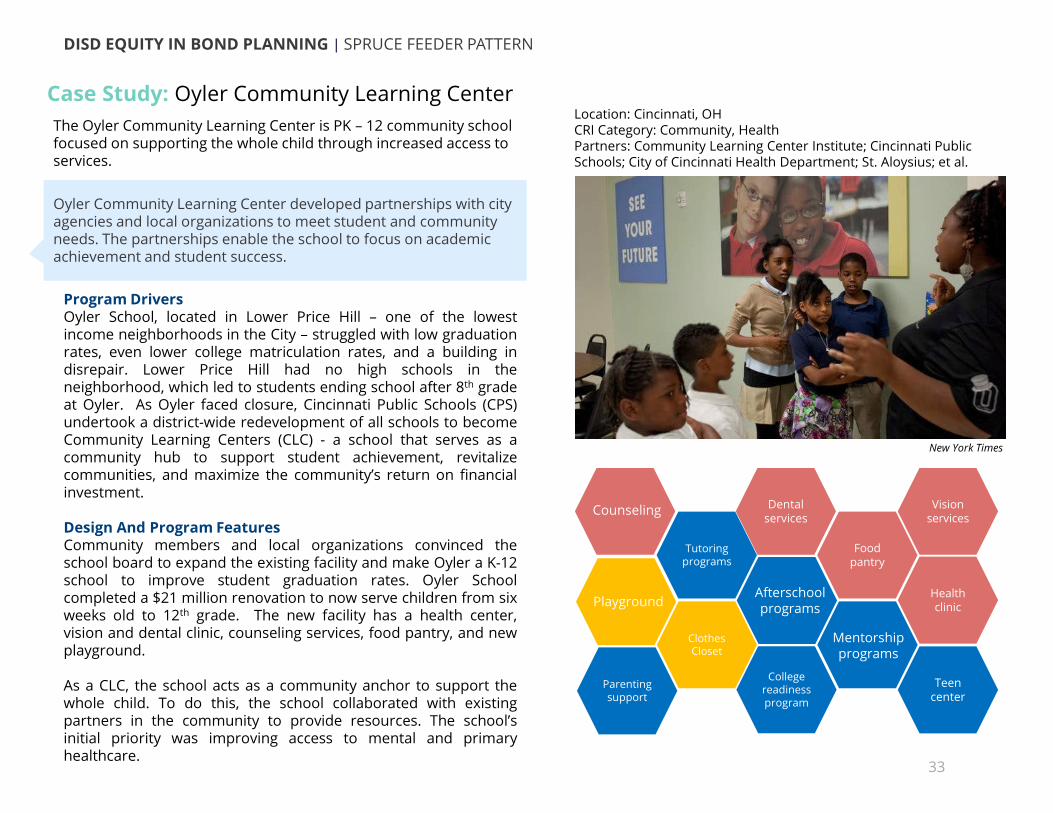
Program DriversOyler School, located in Lower Price Hill – one of the lowestincome neighborhoods in the City – struggled with low graduationrates, even lower college matriculation rates, and a building indisrepair. Lower Price Hill had no high schools in theneighborhood, which led to students ending school after 8th gradeat Oyler. As Oyler faced closure, Cincinnati Public Schools (CPS)undertook a district-wide redevelopment of all schools to becomeCommunity Learning Centers (CLC) - a school that serves as acommunity hub to support student achievement, revitalizecommunities, and maximize the community’s return on financialinvestment.
Design And Program FeaturesCommunity members and local organizations convinced theschool board to expand the existing facility and make Oyler a K-12school to improve student graduation rates. Oyler Schoolcompleted a $21 million renovation to now serve children from sixweeks old to 12th grade. The new facility has a health center,vision and dental clinic, counseling services, food pantry, and newplayground.
As a CLC, the school acts as a community anchor to support thewhole child. To do this, the school collaborated with existingpartners in the community to provide resources. The school’sinitial priority was improving access to mental and primaryhealthcare.
Health clinic
College readiness program
Food pantry
Dental services
Clothes Closet
Tutoring programs
Case Study: Oyler Community Learning Center
DISD EQUITY IN BOND PLANNING | SPRUCE FEEDER PATTERN
Location: Cincinnati, OHCRI Category: Community, HealthPartners: Community Learning Center Institute; Cincinnati Public Schools; City of Cincinnati Health Department; St. Aloysius; et al.
Oyler Community Learning Center developed partnerships with city agencies and local organizations to meet student and community needs. The partnerships enable the school to focus on academic achievement and student success.
33
Vision services
Parenting support
Teen center
New York Times
Playground
Counseling
Mentorship programs
Afterschool programs
The Oyler Community Learning Center is PK – 12 community school focused on supporting the whole child through increased access to services.

The initial investment in Oyler School also catalyzed additionalinvestments in the community. To address the large number ofstudents experiencing homelessness and housing insecurity, theCommunity Learning Center Institute and Habitat for Humanityare rebuilding 130 rental units and improving the streetscape inthe neighborhood with a $35 million investment.
They partnered with a social services agency, St. AloysiusOrphanage, which provides a team of on-site mental healthprofessionals and a physician.
PartnershipsOyler School has many partnerships that are self-sustaining. Theschool provides the space, and the organizations providefunding or bill to Medicaid for their services. The school’ssuccess is largely attributed to its full-time resource coordinator,which is funded by the Cincinnati Public Schools’ CommunityLearning Center Institute. The Institute and local YWCA operateafterschool and evening programs for students and adults. TheCincinnati Youth Collaborative helps students prepare forcollege. A school-based health clinic is operated by theCincinnati Health Department, providing health, dental, andvision care. Students are now able to receive free eye examsand glasses; have free breakfast, lunch, and dinner and bringmeals home on the weekends; and participate in mentoring andtutoring programs.
Safe Streets
and Public Spaces
Access to Primary Health care
After School
Programs
Family Counseling
34
Case Study: Oyler Community Learning Center
Lessons LearnedAfter adopting the community school model and facilityrenovation, the school’s enrollment and graduation rates havesteadily increased. Oyler School graduated more neighborhoodstudents in the initial 3 years following this investment than thecollective 85 years prior. The coordinated support for studentsand their parents supported student achievement, serving as amodel for other schools across the country.
“Before they brought outside providers into the school, Principal Hockenberry and his teachers had spent considerable time addressing problems associated with the lack of care. ’Now we can focus more time on academics while our partners spend time on what they specialize in,’ he said.”
(Community Schools)
Source: Mutual Support: The Community School Strategy
Case Study Alignment to Emerging Themes

35
LINCOLN FEEDER PATTERN• Community Profile• Community Sourced Assets• Emerging Themes and Needs • Case Studies

The Lincoln feeder pattern is located in South Dallas. The community is rich in history, tradition, and generational pride, exemplified byLincoln High School being the second high school built for Black students in Dallas in the late 1930s. South Dallas was home to some ofthe earliest Black professionals in Dallas, including Dr. Watts, Dr. Pinkston, and Pearl C. Anderson. Other points of pride and strength inthe neighborhood are the churches, Black Greek Row, the South Dallas Cultural Center, Martin Luther King, Jr. Community Center, long-time childcare centers, and neighborhood associations, to name a few.
COMMUNITY DATA PROFILE
DISD EQUITY IN BOND PLANNING | LINCOLN FEEDER PATTERN
COMMUNITY RESOURCE INDEX
0 100
12
36
0 19Community
13Economics
74Education
36Family
8Health
The Lincoln Feeder Pattern’s overall CRI score is 12.
The Community Resource Index underscores the decades of adversity and systemic oppression perpetrated against South Dallas. Much of the area was red-lined in maps by the Home Owners’ Loan Corporation, restricting access to credit because of its segregated Black neighborhoods. South Dallas has forged its distinctive community while fighting to overcome racial violence, destructive highway construction, racist zoning, and inadequate flood protection.

COMMUNITY SOURCED ASSETS
1
2
3
4
5
5
5
5
5
8
8
9
10
12
76 Mentioned Once
14 Mentioned Twice
9 Mentioned 3 Times
5 Mentioned 4 Times
Good Street Childcare
South Dallas Cultural Center
CitySquare
DISD Schools
TR Hoover Center
Parks
Baylor Health Center
Community
Local businesses
Churches
Assets by Frequency Mentioned
DISD EQUITY IN BOND PLANNING | LINCOLN FEEDER PATTERN
Community Family/ EducationEconomics Health
37
As part of the engagement process, we asked interviewees and focus group members to list local assets. We intentionally definedassets broadly, ranging from local stores, churches, community centers, or a general sense of pride so that residents could speakto parts of their community that they value. During the data analysis phase we coded different assets to account for both theirfrequency and their CRI category. While the assets on the map are representative of community engagement, they are notrepresentative of all the assets that exist in the area. The size of the bubble represents the frequency that an establishment wasmentioned. Overall, small businesses and libraries were tied for the most mentioned asset in the community. A sense ofcommunity and family were tied for number two alongside churches. Mapping the assets begins to form our understanding ofwhere residents are shopping or enjoy spending their time. It also sets a baseline for potential partners down the line.

38
DISD EQUITY IN BOND PLANNING | LINCOLN FEEDER PATTERN
“There are wonderful neighbors - we have 22 active neighborhood associations.”
“South Dallas Cultural Center - this has been a jewel for our family.”
“MLK, the Black Greek Row - the 2500 block of MLK are all African American owned businesses and sororities. There is a lot of pride. That area is gorgeous and well-maintained.”
“Lincoln HS has a strong alumni base that supports the school.”
“I utilized Good Street Childcare for all of my children. They had a great program and set-up”
“People have a lot of grit and are resourceful. The community works together to solve challenges”
“A lot of the churches provide resources for children or youth.”
“People, culture, my community”
COMMUNITY SOURCED ASSETS

Through an analysis of all community engagement activities – including the workshops, survey, student focus group, and interviews, thefollowing diagram highlights prioritized community needs by themes. Access to Fresh Produce and Healthy Food is prioritized as thegreatest need for the Lincoln Feeder Pattern. Housing Affordability and Stability, Access to Mental Healthcare, Safe Streets andPublic Spaces were also prioritized.
The figure below illustrates how frequently needs were identified by community members throughout all engagement activities. We coded notes and transcripts from each engagement activity, then counted how frequently different needs were cited. We standardized the counts for each activity to fit a 0-100% scale, such that the highest frequency need received a score of 100%, then averaged the scores across all the engagement activities. For example, Access to Fresh Produce and Healthy Food was most frequently mentioned by community members as a need at 62%.
COMMUNITY NEEDS AND PROGRAMS
DISD EQUITY IN BOND PLANNING | LINCOLN FEEDER PATTERN
39
62%
45% 45% 45%
37%
22% 21% 19% 17% 17% 16% 15% 13% 12% 10% 9% 8% 8% 7% 6%3% 3% 3% 3% 3% 1%
Health
Economics
Community
Family/Education
KEY

50%47% 47% 47%
40% 40%37%
30%27%
23% 23%20%
13%10% 10%
7% 7% 7% 7%3% 3% 3% 3%
Health
Economics
Community
Family/Education
Throughout the community engagement activities, community members proposed solutions to build on existing assets and address needs. The following diagram illustrates prioritized program ideas by themes in comparison to prioritized community needs. This overlay illustrates the degree of alignment between community-identified “needs” and what community members would like to see within theStudent and Family Resource Centers. Community members prioritized Job Training, Recreation Spaces, and Access to Primary Healthcare program ideas. Similar to the prioritized community needs, community members prioritized program ideas addressing Access to Mental Healthcare.
The figure below illustrates the frequency various program ideas were elevated by community members in comparison to the needs. For example, community members most frequently mentioned Job Training program ideas at 50%, but it was raised as a need with 17% frequency.
Community Needs
COMMUNITY NEEDS AND PROGRAMS
DISD EQUITY IN BOND PLANNING | LINCOLN FEEDER PATTERN
40
KEY

1,876 adults reported poor mental health for 14 days or more, per
10,000 residents, compared to just 602 adults per 10,000 in the most
well-resourced community.
“It’s important to incorporate wellness into the community as a form of pro-activity for Black folks, for POC with proximity to trauma and deploy cultural responsive mindfulness. Therapists who come into the community need experience with trauma. What are the needs in the community, so we can be proactive in anticipating children's needs?” – Workshop 2 participant
“Healthcare starts with food and we live in a food desert.” –Interview participant
“Job trainings – Parents and students need all of this”-Workshop 1 participant
“Connecting students to growing industries”-Workshop 2 participant
There are 1.2 grocery stores per 10,000 residents in the
neighborhood, compared to a maximum of 2.27 per 10,000
residents and $244 avg. spending on fresh fruits and vegetables
monthly, compared to a maximum of $535.
Within a two-mile radius of Lincoln High School, there are 5,355 jobs, compared to maximum of 209,962
and a youth unemployment rate of 29.8% compared to a minimum of
4%.
There are .401 libraries per 10,000 residents, compared to a maximum
of 1.342 libraries per 10,000 residents and 1,119 juvenile-
committed crime incidents per 10,000 residents between ages 16-24, compared to a minimum of 0.
“Not having to worry about getting hurt or what other people are doing or being cautious . . . just being able to go outside freely without feeling scared or anything.” – Student Focus Group participant
Access to Healthy
Food
Safe Streets
and Public Spaces
Job Training
Access to Mental Health Care
The data tells us… The community tells us…
Source: Community Resource Explorer 41
EMERGING THEMES FOR LINCOLN FEEDER PATTERNThe Emerging Themes below represent the cumulative findings of an extensive community engagement process and analysis of key indicators in each community. Depending on the approval of the 2020 Bond, available resources, and alignment to other work underway, Dallas ISD will begin to address some or all of these themes through the Student and Family Resource Centers.
DISD EQUITY IN BOND PLANNING | LINCOLN FEEDER PATTERN

Based on community input, the Community Resource Index, and existing assets, the project team identified the greatest needs to beaddressed through the Student and Family Resource Centers. The program ideas listed here were generated by the community inalignment with the prioritized needs, demonstrating a variety of potential investments. Through different combinations, program ideascan address the prioritized needs and create natural adjacencies within facilities – and vary in terms of space need and cost implications.Ultimately, the Dallas ISD’s Student and Family Resource Center will seek to address the Emerging Themes, through some combinationof these or related services, and be guided by principles of access, family-friendly, connected, flexible, local, centralized, and value-add.
50%Job
Training
62%Access to Healthy
Food
45%Safe
Streets and Public
Spaces
45%Access to
Mental Healthcare
Prioritized Needs
Program Ideas
Prioritized Needs
Program Ideas
Grocery store
Food pantry
Food co-op
Wellness / Yogastudio
Trauma care
Health clinic
Public art
Park
Safe street
crossing
Library
Street lighting
Bike lane
Culinary training
DISD EQUITY IN BOND PLANNING | LINCOLN FEEDER PATTERN
42
Industrial kitchen
Nutrition program
Community garden
Restaurant
Playground
Free community
space
InternshipsVocational center
Career counselor
Certification classes
Youth employment
programs
Guidance counselors
Counseling center
Mindfulness training
Resume and
interview coaching

Location: Houston, TXCRI Category: CommunityPartners: Neighborhood Centers Inc; Project for Public Space; Concordia; Houston Community College; Houston Food Bank; Community Health Choice; Family Services of Greater Houston; Children’s Museum of Houston; among others.
Case Study: BakerRipley Neighborhood Center
Program DriversThe Gulfton neighborhood is a diverse neighborhood in southwestHouston with residents from over 80 different countries – many ofwhom are undocumented. Between 1980 and 2000, Gulfton’spopulation doubled, becoming the densest neighborhood inHouston. The community is highly transitional with 90 percent ofresidents renting; the highest juvenile crime rate of any zip code inthe country; and low high school graduation rates. Theneighborhood lacks public amenities like libraries, recreationcenters, and public spaces.
Design And Program FeaturesThe BakerRipley Gulfton Sharpstown Campus is part of a largerstrategy led by Houston nonprofit Neighborhood Centers Inc. (NCI),to increase access to opportunity for all Houstonians. NCI has beenworking in the neighborhood since the 1980s and saw anopportunity to create a local space for social services. In 2005, theyinitiated a community planning process called AppreciativeCommunity Building to identify local assets and define a potentialcommunity investment. In partnership with Concordia and Projectfor Public Space, NCI hosted interviews, focus groups, andengagement events to understand the community and its assets.Community members were asked to provide input on the physicaldesign and programming of the campus. The intensive communityengagement process generated community ownership to create atrue community center.
The BakerRipley Neighborhood Center campus includes a K-5elementary school, public library, business incubator, communityhealth center, arts center, farmers market, children’s water park,outdoor amphitheater, and public park.
The extensive community engagement process fostered community ownership of the BakerRipley Neighborhood Center. Through this process, the center was designed to have multipurpose space to allow for space and programming to adapt as needs change within the community.
Health clinic
Adult Education
Meeting and
event space
Industrial kitchen
ESL Classes
Credit union
Water feature
Farmers market
Library
Public park
Tax Prep Center
DISD EQUITY IN BOND PLANNING | LINCOLN FEEDER PATTERN
43
Afterschool program
Immigration services
Business incubator

ResponsibilitiesThe construction of the BakerRipley center cost $25M and wasfunded by an extensive fundraising effort. The center is home to arange of organizations including Houston Community College,Houston Food Bank, Community Health Choice, Family Services ofGreater Houston, Children’s Museum of Houston, Pro Salud,Planned Parenthood, Watermill Express, ABC Dental, Alley Theater,Society of Performing Arts, Houston Grand Opera, among others.Since its opening, Gulfton was awarded a Promise Neighborhoodplanning grant, which awarded $500k to BakerRipley and its 12partners.
Lessons LearnedThe partners learned that to be responsive to the community’sneeds, the center must remain flexible. To that end, all the spacesare designed to serve multiple purposes. This includes the healthclinic, school, event spaces, and meeting rooms. In addition, theyhave moved spaces like the credit union and childcare facility toother nearby buildings to improve communication channelsbetween residents and local nonprofits. BakerRipley also conductsthe Appreciative Community Building process every three to fouryears to assess current community needs and how the center isworking. The center is then able to respond to emerging needssuch as expanding accommodation and services to addresshomelessness. BakerRipley has found that the flexibility buildscommunity ownership over the campus to influence the design andprogram. Due to the success of BakerRipley Center in Gulfton-Sharpstown, BakerRipley replicated the process in other Houstonneighborhoods.
Case Study: BakerRipley Neighborhood CenterThrough the inclusive planning process, the community andpartners designed a five-building campus over four acres to createa village-like feel. Each building has a different use, which includeseducation, art, business and entrepreneurial activities, recreation,and health care. Public spaces around the community are dividedinto three zones: the park zone with a playground and walkingpath, plaza zone for special events and programming, and a zonefor a food market and local entrepreneurs. Opening in 2010, thecenter works to foster socio-economic mobility through access toresources, training, and building community capacity. The campusoffers a multitude of services, including: Head Start program,community school, tax services, credit union, meeting and eventspace, afterschool programs, adult education classes, businessincubator center, library, day care, food distribution, communitygarden, and immigration services.
Safe Streets
and Public Spaces
Access to
Healthy Food
Access to
Mental Care
Job Training
DISD EQUITY IN BOND PLANNING | LINCOLN FEEDER PATTERN
44
Case Study Alignment to Emerging Themes

Case Study: San Pablo Community Center at Helm Location: San Pablo, CACRI Category: Education, Community, HealthPartners: : City of San Pablo, West Contra Costa Unified School District, Helms Community Project, PLUS Leadership Initiative of the Center for Cities and Schools
Program DriversSan Pablo, California has high crime rates, high levels of poverty, andlow educational attainment. In addition, the West Contra CostaUnified School District (WCCUSD) had some of lowest academicoutcomes in the state. Students were encountering challenges inand outside the classroom - such as poverty, transiency,unaddressed health needs, and language barriers which limitedtheir ability to succeed in school.
Design And Program FeaturesIn 2011, the City of San Pablo’s City Council passed a resolution todevelop and implement the San Pablo Full Service CommunitySchools (FSCS) Initiative, to transform all schools in the City to FullService Community Schools. Walter T. Helms Middle School is at thecenter of the initiative, creating stronger ties to the elementaryschools and high school in its feeder pattern. In this model,WCCUSD, City, County, local businesses, community-basedorganizations, and families form partnerships to comprehensivelyaddress the needs of students, families, and the community,grounded in the idea that schools need to focus on the whole childto create conditions for success and academic achievement. A bondresolution funded a new Helms Middle School campus, which wasconstructed to replace the former facility and includes three two-story classroom buildings, administration offices, a library,gymnasium, computer labs, and a multipurpose/cafeteria building.The City and WCCUSD also developed a joint use agreement toenable San Pablo community members to use the new fields andgymnasium outside of school hours.
On the campus of Helms Middle School, the San Pablo Community Center offers free or low-cost services to students, families, and community members.
The City identified and leveraged a variety of funding sources to construct the community center. Through a joint use agreement, the City and School District formalized the partnership and established institutional support for the community center.
Industrial kitchen
Fitness room
Art room
Teen lounge
Mobile health clinic
ESL Classes
DISD EQUITY IN BOND PLANNING | LINCOLN FEEDER PATTERN
45
Afterschool program
Community center
Community garden
Playground
Computer room

Case Study: San Pablo Community Center at Helm
OutcomesThe Helms Community Partnership has supported the reduction inbehavioral referrals and increase in parental participation,attendance, and in both reading and math test scores.
City leaders were involved in the development and design of thecommunity center. However, their involvement was based off ofrelationships and not institutional support or formal agreements.Because of this, changes in key positions can significantly changesupport. Those advancing this project learned it’s important toinvest in mayor and city council buy-in, which takes time butenables stronger partnerships. The center has a wide variety ofprograms and activities, but needs to effectively organize andpackage the information to improve accessibility andunderstanding. The center’s communication must account fordifferent audiences with an appropriate level of detail.
WCCUSD granted land to the City of San Pablo to build acommunity center on the school campus. The 10,000 SFcommunity center features a large multipurpose room with acommercial kitchen for cooking classes and wifi, two smallermeeting/classrooms, a computer room, fitness room, art roomwith a kiln, and a teen lounge with a music recording room. Inaddition, the center has outdoor space with a playground, ediblegarden, and terraced amphitheater. The Helms CommunityPartnership (HCP) operates the center and partners with over 30organizations to provide a number of wraparound services forstudents and families. Programs include literacy and mentorshipprograms, afterschool programs, parent university, adult ESLclasses, behavioral and mental health services, mobile healthclinic, among others. There is no cost to enter the center or usethe facilities, however, some programs have a small fee. Thecenter regularly receives 6,000 to 8,000 visitors per month,providing recreation and programming to all residents of SanPablo with a focus on youth.
ResponsibilitiesThe bond resolution’s local 10-year sales tax increase funded therebuilding of the school and field construction. The totalCommunity Center cost was almost $10 million, which requiredthe City to identity various sources of capital funding forconstruction, including:
• California Department of Parks: $3M
• New Markets Tax Credit program: $2.1M
• City of San Pablo: $1.6M
• East Bay Regional Park District: $1M
Safe Streets
and Public Spaces
Access to
Healthy Food
Access to
Mental Care
Job Training
Land Ownership WCCUSD
Capital/ Construction Expenses City of San Pablo
Operations & Maintenance City funding, operated by the Helms Community Partnership
ProgrammingOver 30 organizations provide services at the community center
DISD EQUITY IN BOND PLANNING | LINCOLN FEEDER PATTERN
46
Case Study Alignment to Emerging Themes

NEXT STEPS
47

These concepts will need to be refined, partnerships developed, and facilities designed. Implementation of the Student and FamilyResource Center will require ongoing community engagement and the inclusion of community leadership directly in the decision-makingprocess. Ongoing planning for partnership, programming, and facilities design will need to progress in concert. Dallas ISD will set animplementation timeline for issuing solicitations to identify qualified and interested parties with a focus on leveraging additionalresources to expand impact, elevate community-based partners, and apply equitable contracting practices. The chart below indicateshigh-level next steps for carrying the project forward.
NEXT STEPS
IMPLEMENTATION
Partnerships &Programming
Facilities Planning &
Design
Community Engagement
48
Establish a steering committee per feeder
and engage community members to refine
program and facility concepts once sites are
selected.
Solicit interest from community-based
providers and assess capacity for
participation in Center.
Continue public engagement
throughout the design process and work with
community-based service providers to
build capacity.
Select sites for Resource
Centers by assessing assets,
capacity, and facilities/site
potential.
Refine programs based on data, site constraints
and opportunities,
local codes, and community
input.
Initiate design solicitation.
Select design partners and begin design.
Convene other public agencies to share
findings of this report. Collectively brainstorm
how other agencies might help address identified
needs.
Establish an internal district infrastructure
(e.g., a dedicated team) to manage the design
and implementation of the Resource Centers
long-term.
Develop an operational model for the Resource
Centers (including funding,
partnerships, evaluation, etc.).
DISD EQUITY IN BOND PLANNING | NEXT STEPS

Dallas ISD's next step is to work with the community and service providers to scope what types of programs will be most responsive tothe Emerging Themes identified for each feeder pattern. The following program elements guide may serve as a resource to refineprogram recommendations and identify program adjacencies, scale investment to inform site selection, and develop project concepts.
DISD EQUITY IN BOND PLANNING | NEXT STEPS
49
PROGRAM ELEMENT DESCRIPTION SPACE TYPOLOGY AREA (SF)
COST/SF($)
COST($)
Workforce Lab/Vocational Center
Center that provides career and technical education and instruction to students and family members. Studio + Classroom 1800 400 720,000
Makerspace Collaborative workspace for building, learning, and exploring to foster entrepreneurship. Workshop 1800 400 720,000
Computer Lab Classroom for students and family members to have access to computers and learn computer skills. Classroom 1000 350 350,000
Childcare Center Center that provides childcare services. Classrooms 2500 200 500,000Playground/ Outdoor Recreation
Programmed outdoor space that includes a playground and recreation path. Outdoor 4000 50 200,000
Family Resource CenterOffers individual and group-based family support to access appropriate services, mental health resources, and skill development programs.
Offices + Meeting Rooms 800 250 200,000
Art Studios & Gallery Space that provides art classes and programs, exhibit, and art therapy. Studio + Classroom 1800 250 450,000
Trauma & Therapy Center Center that offers counseling and trauma care to students, families, and community members. Offices 700 350 245,000
Health Clinic Drop-in health clinic for immunizations and primary care. Exam Rooms + Lobby 500 450 225,000
Wellness Center Center that offers counseling, nutrition programs, and fitness spaces.
Fitness Studios + Classrooms 1600 250 400,000
Pharmacy Offers pharmacy services and prescription delivery. Retail 300 450 135,000
Yoga & Meditation Studios Dedicated space for yoga, meditation, and mindfulness practices. Fitness Studios 1600 250 400,000
Community Closet & Food Pantry Food and clothes storage and distribution space. Storage 200 200 40,000
Housing Resource Center Center that offers housing navigation and case management support. Offices, Meeting Rooms 750 250 187,500
Legal Offices Space for legal consultations and services. Offices + Lobby 600 300 180,000
Laundry & Shower Facilities Space for public use of laundry machines and showers. Utility Room + Showers 500 150 75,000
Public Auditorium Multi-purpose space for large format events and gatherings. Assembly 9000 200 1,800,000
Note: The cost estimates provided here are based on 2020 valuations. Source: RSMeans

APPENDIX
50

ANALYSIS: The chart below represents the frequency of each mentioned need in the neighborhood, scaled so that the most frequently mentioned need is scored 100%, then coded to CRI- Subcategories.
DESCRIPTIONInterviews played a key role in the engagement process. The project team interviewed Trustee Karla Garcia, City Councilperson Jaime Resendez, Trustee Appointed Advisory Council representative Alicia Serrato, and school leadership and staff from across the Spruce Feeder Pattern. Interviewees provided insight on assets, needs, and equity issues inside Dallas ISD schools and throughout Pleasant Grove.
interviews
WHAT WE HEARD:
Top CRI-Subcategories: Access to Public Benefits, Job Training, and Access to Specialized Care
From the quotes, we pulled out
generalized text to analyze patterns across
interviews
Civic engagement 50%
Homeless services 50%
Internet access 50%
Public transportation 50%
Recreation spaces50%
Safety 100%
Living wages75%
Afterschool programs
50%
ESL classes50%
Exposure to career and other post-high school options 50%
Affordable healthy food
75%
Medical facilities75%
Mental health services 50%
Sex education50%
“I don’t get that sense of pride in the students that we have; their
sense of understanding of pride in Spruce- I don’t see it as much
today.”
“Not a lot of experiences, or opportunities when you look at after school. Community centers are few
and far between. Churches take on a large load of what is provided.”
“For the most part community is supportive, but we have to dedicate
resources to pulling them in.”
DISD EQUITY IN BOND PLANNING | APPENDIX
SPRUCE INTERVIEWS
51
What does the community need?

Beautification, 100%
Gas Station, 50%
Homeless services, 25%
Safety, 50%
Shopping center , 75%
School choices, 25%
School programs, 25%
Grocery stores, 25%
Mental health services, 25%
Pharmacy, 25%
DESCRIPTIONThe project team conducted 33 bilingual online surveys shared widely through email and social media, and bilingual paper surveys distributed at food distribution sites within the Spruce Feeder Pattern. Survey respondents, primarily residents and parents, identified assets, needs, and program ideas for the Student and Family Resource Centers.
interviews
WHAT WE HEARD:
From the quotes, we pulled out
generalized text to analyze patterns across
interviews
ANALYSIS:
Top CRI-Subcategories: Safe Streets and Public Spaces, Access to Basic Household Needs, After School, Weekend, and Summer Programs
“A destination for the families, places where the students and families can have after school and
extra curricular activities, as well as, better stores and a more robust support for our minority
businesses.”
“Grocery stores with healthy food choices.”
DISD EQUITY IN BOND PLANNING | APPENDIX
SPRUCE SURVEYS
52
What does the community need?
The chart below represents the frequency of each mentioned need in the neighborhood, scaled so that the most frequently mentioned need is scored 100%, then coded to CRI- Subcategories.

ANALYSIS:
DESCRIPTIONThe project team conducted focus groups of students and additional campus staff to identify community assets, needs, and program ideas, and discuss how Student and Family Resource Centers could increase equity in the Feeder Pattern. The team also held a focus group of community leaders convened by the Trustee Appointed Advisory Council representative.
interviews
WHAT WE HEARD:
From the quotes, we pulled out
generalized text to analyze patterns across
interviews
Top CRI-Subcategories: Safe Streets and Public Spaces, Recreation Spaces and Programs, and Access to Primary Healthcare
Affordable housing, 33.33%
Internet access, 33.33%
Local restaurants,
33.33%
Park and field lighting , 33.33%
Pedestrian safety, 33.33%
Recreation spaces, 100.00%
Safety , 33.33%
Living wages, 33.33%
Afterschool programs ,
33.33%
Medical facilities, 33.33%
“We need more technology, more access to computers to help study, and to write essays
for college.”
“More affordable homes for low-income.”
“Something else we need are speed bumps since most kids are driving to school but
folks don’t really care. Younger kids crossing the street and going home by
themselves and need safety precautions.”
“I think we need health clinics”
DISD EQUITY IN BOND PLANNING | APPENDIX
SPRUCE FOCUS GROUPS
53
What does the community need?
The chart below represents the frequency of each mentioned need in the neighborhood, scaled so that the most frequently mentioned need is scored 100%, then coded to CRI- Subcategories.

GOALS:
1. Create a shared understanding of project purpose, goals, and process;
2. Create a common definition of equity for the stakeholders and broader community;
3. Understand how CRI categories align with stakeholders’ lived experience;
4. Identify what the assets and needs are to help bridge vision of what equity looks like and what current conditions are, and identify actions needed to address issues of inequity.
ACTIVITIES:
A presentation from REO staff on the DISD 2020 Bond to share the origins of this project, and the overall project
process and goals.
Participants split-up into breakout groups
where they were asked through a
facilitated conversation to share the assets and needs of their community.
Participants were then asked to reflect on what should be
included in the Student and Family Resource Centers toaddress needs and
build on assets.
DISD EQUITY IN BOND PLANNING | APPENDIX
SPRUCE WORKSHOP ONE
54

“Not knowing what to do after high school - while schools are pushing for everyone to go to college, students need to know that there are other options. If they have a really great idea that should go somewhere, they should pursue that. Students should be aware that there are other opportunities available. “
“There are not a lot of opportunities for youth to explore, build a good career, job training, etc”
“For the parents that I have that are working, the daycare opportunities are not great opportunities for the children, and that is often what takes parents out of those jobs.”
“I know a lot of parents buy their groceries, their entire household at Family Dollar. A lot of the food is processed.”
“Most of the families we have are undocumented, so they can’t really go for any good jobs, so they go for menial jobs. They are not getting much.”
NEEDSParticipants expressed that students aren’t aware of opportunities or options outside of Pleasant Grove - people expressed a need forexposure, to different types of jobs, to alternatives to college to new places and people. People expressed that there have been daycarecenters in the area in the past, but there is currently not enough, especially ones that are affordable. While people listed area grocerystores as assets, people also expressed a need for more grocery stores, citing that the quality of fresh food currently available in theneighborhood wasn’t high. While some folks expressed a need for more programs - especially afterschool and summer programs -others said the issue isn’t a lack of programs but a lack of understanding how to access existing programs, or even knowing that theyexist. Language barriers were given as another reason for trouble accessing programs. People expressed concern about a lack of spaceswhere youth feel safe being emotionally vulnerable. Job opportunities were also a high priority. Internet, though considered a basicneed, is not available to everyone. People want to see the culture and history of Pleasant Grove celebrated and reflected in current andfuture facility. The below diagram illustrates the frequency of needs mentioned by community members.
Safe Streets and Public
Spaces, 35%
Access to Public Benefits, 35%
Internet Access and Digital
Literacy, 25%
Job Training , 40%
Access to Early
Education, 20%
After School, Weekend,
and Summer Programs,
100%
English as a Second
Language Classes, 40%
Family Counseling
and Resource Center, 65%
Access to Primary
Healthcare, 50%
Access to Fresh Produce and Healthy Food, 45%
DISD EQUITY IN BOND PLANNING | APPENDIX
SPRUCE WORKSHOP ONE
55
The chart above represents the frequency of each mentioned need in the neighborhood, scaled so that the most frequently mentioned need is scored 100%, then coded to CRI- Subcategories.

ASSETSParticipants noted the strong presence of local businesses,including many locally-owned restaurants, as well as theimportance of local churches. People expressed that localCity facilities, like libraries, parks, and recreation centers, arevery important to the community, as are the EastfieldCampus of Dallas College and DISD programs. People rely onfamily and community for support.
“For my family, it’s our church in PG. It’s the church I grew up with, and my parents are very active members in the church, so that’s a really important institution for a lot of our families within the community.”
“Incredible community to help one another out - frequently happens through church or neighborhood based.”
PROGRAM IDEASParticipants proposed a wide range of ideas for activities oractions that might address community needs. Many of themwere related to vocational or other forms of training thatmight address students’ post-college path, includingcosmetology classes, culinary training, and entrepreneurshipprograms. A few folks felt that education on healthy eatingwould help community health outcomes, and that educationon local history would help instill pride in students. A fewpeople suggested adult education classes and a desire to seenew businesses in the neighborhood.
Although it was not explicitly part of the activities, manypeople had very specific ideas about the physical building orspaces that will result from this project. Ideas includedhaving community gardens on-site, including a dedicatedarea where parents feel they belong and can spend time,and a dedicated place to share and celebrate the history ofthe school and neighborhood.
GENERAL PROJECT FEEDBACKIn addition to the feedback asked for from the activities,participants had thoughts and questions about the overallEquity in Bond Planning project. People expressed that therehas been a history of broken promises to Pleasant Groveresidents, making it hard for them to trust people. They havefelt neglected. Folks wondered how to make sure residentsare really being heard in this process, and possibly moreinvolved in driving it.
“As a community it is important to share our community stories and many of our students don’t know these stories/histories of where they live. People move around a lot now, most kids don’t know things like the significance of the name of school. Establishing a connection of students and people to place through programs and education is crucial.”
“I would like to see more businesses in PG, more economic development to improve the community.“
“The school that I worked at in Houston, there was a place on campus for parents. They came, they drank their coffee, and they stayed. When we brought the kids to lunch at 10:15, the kids saw the parents and waved. There was a place for the parents, and they felt like they belonged, and we had a positive, daily relationship with them.”
“Their voices may not have been heard - they want their voices to be heard in the same way that other parts of the city. In terms of programming and in terms of decision making in the school district.”
“Community empowerment, a lot of times when we look for ways to counteract historic disinvestment, often the community voices are not listened to. My partner is a historic resident of SD, and we wonder what it would look like if PG residents had a place to come together and gather. How can the community really drive this initiative and the changes they want to see in their community rather than have it decided for them.”
DISD EQUITY IN BOND PLANNING | APPENDIX
SPRUCE WORKSHOP ONE
56

ACTIVITIES:Workshop 2 began with a presentation and recap of Workshop 1. We reviewed the assets and needs that had previously been identified.Participants were then broken up into small groups based on the CRI categories - health, family/education, economics, and community,which was broken up into two groups - to do a deeper dive into the potential activities. We started off reviewing the categories - forexample “access to public benefits” or “senior programming”. Participants were then asked to prioritize their top 3 categories. Onceeveryone had picked and prioritized their categories, everyone was asked to imagine what their top choice would look like in a Studentand Family Resource Center. For instance, if someone selected “job training” for their top choice, what would that entail? What kind ofprograms would they want to see under the umbrella of “job training”?
Priority #1 (Top) Priority #2 Priority #3
Participant #1 Access to Primary Healthcare
Access to mental health services Access to healthy food
Participant #2 Mental health Primary health Specialized health
Participant #3 Primary Specialized Mental health
Participant #4 Specialized health Mental health Primary Health
Participant #5 Primary Mental health Specialized (also food)
GOALS:
1. Verify and get feedback on the assets and needs that have been gathered so far;
2. Understand community priorities;
3. Develop an understanding of community “vision” for prioritized activity categories.
EXAMPLE OF PRIORITIZATION ACTIVITY:
DISD EQUITY IN BOND PLANNING | APPENDIX
SPRUCE WORKSHOP TWO
57

What We Heard:
Health
“I want to see more community health clinics like the Barrios Unidos model. We need culturally competent healthcare to the community. Medical care is alone not going to do it.”
“Patient navigators - people who know how things work and support folks to navigate the mess.”
“We need to also focus on prevention.”
Community
“We had a connection with Teatro en el Barrio, and the young men would build the stage, do the lighting, and do the play. And this gives people a tiny glimpse of their lives. The City of Dallas Recreation Department was connected to the work of the neighborhood - there’s a lack of connectivity between the juvenile department and the City and the schools. The kids I worked with needed a place to be.”
“Access to daily household needs - specifically, food desert. Most of the stores tax you up - price gouging. Maybe having a community garden that could be used as a teaching opportunity - to teach food science, etc.”
Economics
“Small business and entrepreneurship provides an opportunity to address the wealth gap. You can’t name a co-working space in PG, the resources are not there.”
“Educating students about jobs that are projected to grow in the future and where they may be. Help students explore what careers connect to their interest and aptitude.”
Safe Streets and Public Spaces,
35%Access to Public Benefits, 35%
Internet Access and Digital
Literacy, 25%
Job Training , 40%
Access to Early Education, 20%
After School, Weekend, and
Summer Programs,
100%
English as a Second
Language Classes, 40%
Family Counseling and
Resource Center, 65%
Access to Primary
Healthcare, 50%
Access to Fresh Produce and Healthy Food,
45%
DISD EQUITY IN BOND PLANNING | APPENDIX
SPRUCE WORKSHOP TWO
58
Most Frequently Cited Community Needs :
The chart above represents the frequency of each mentioned need in the neighborhood, scaled so that the most frequently mentioned need is scored 100%, then coded to CRI-Subcategories.

Goals: The third workshop for the Spruce Feeder Patternconsisted of 48 meeting participants. The purpose of the meetingwas to gain a deeper understanding of the community’s vision forthe DISD bond spending by having participants discuss how theywould invest the money to best support students and theirfamilies.
Activity One: The first activity centered around allocation ofbond spending for programs and facilities. These potentialinvestments emerged from priorities and needs defined in theearlier workshops. They were arranged using the four CRIcategories of Health, Community, Economics, andFamily/Education. Each category was broken into more specificsubcategories, such as “Access to Primary Healthcare” and“Access to Mental Healthcare.” The investment options were thenarranged in an order of cost magnitude, comprising small,medium, and large investments.
How can potential programs best serve
students? The community?
How do these programs
complement each other?
Activity Two: Participants were tasked with reaching aconsensus about how they would spend their limited “budget”to achieve their goals for their feeder pattern. Each group wasgiven 10 green squares to spend collectively, with the smallinvestments costing 1 square, and large investments 3 squares.They also had the option to add a new program if it was notlisted on the activity and allocate one to three squares to it.
The second part of the activity asked participants to describehow the investments they selected could be developed to bestbenefit students and their families. Then each groupsummarized their selections into one overarching vision. Lastly,participants had the opportunity to propose potentialcommunity partners to help bring their overarching vision tolife.
Process:
DISD EQUITY IN BOND PLANNING | APPENDIX
SPRUCE WORKSHOP THREE
59

Health and wellness were top concerns for meetingparticipants. From mental health to reproductive health, all 5groups noted access to primary healthcare as a priority.Participants described the need for free and reduced servicesfor undocumented students and those unable to pay, citingillness as a major hindrance in student attendance andperformance. Creating an accessible space that can serve thewhole family’s health needs would save community memberstime and money. In addition to a health clinic, counseling roomswere a top-rated investment. Also contributing to health andwellness, the community closet and food pantry was selected byover half of the groups. Several participants discussed the factthat Pleasant Grove is a food desert and noted that the foodpantry is an inexpensive program that could have a lastingimpact on the health and quality of life for students and theirfamilies.
Flexibility was the second biggest priority for participants inworkshop 3, with three of the types of spaces invested in(counseling rooms, classrooms for financial coaching, andrentable offices) being easily adaptable to serve otherpurposes later. Most groups remarked on the need for thesespaces to serve multiple uses now and to continue to serve theSpruce community as their needs change.
Meeting participants reiterated the importance of servicesthat support the whole family, describing the communitycloset as an asset to help students get interview clothes to beable to get afterschool jobs to support their families, anddescribing services to provide parents with skills to help theirstudents with literacy and study habits. The groups emphasizedhow supporting one member of the family can have far-reachingimpacts through the rest of the family. To meet the needs of thefull family, participants noted that childcare and translationservices should be integrated into all other programming so thateveryone can take advantage of the provided services.
Access to Daily
Household Needs, 30%
Recreation Spaces &
Programs, 30%
Financial Education & Literacy, 30%
Small Business/Entrepreneurial Supt., 20%
After …
Family Counseling &
Resources, 100%
Access to Primary
Healthcare, 50%
DISD EQUITY IN BOND PLANNING | APPENDIX
SPRUCE WORKSHOP THREE
60
The chart below represents the frequency of each mentioned need in the neighborhood, scaled so that the most frequently mentioned need is scored 100%, then coded to CRI- Subcategories.

DISD EQUITY IN BOND PLANNING | APPENDIX
FamilyResource
Ctr.
ChildcareCenter
Makerspace
Health Clinic
Counseling Rooms
Co-Working Space
FinancialCoachingClassrooms
HealthClinic Family
Resource Ctr.
Childcare Center
Health Clinic
Financial Coaching
Art Studios & Gallery Family
Resource Ctr.
ClassroomsCounseling
Rooms
Community Closet & Food Pantry
Art Studios & Gallery
Childcare Center
Multi-Activity Science Center
Counseling Rooms
Health Clinic
Community Closet & Food Pantry
GROUP 1OVERACRCHING VISION: “Building community, fostering generations of healthy community by developing young Pleasant Grove families with capacities. All about the next generations of DISD students. Each generation is building a more healing community. Multigenerational community.”
GROUP 3OVERARCHING VISION: “Flexible spaces that are adaptable to multiple uses to serve the greatest number of needs of the community. These spaces should be able to transform at any given time due to changing needs.”
GROUP 2OVERARCHING VISION: “One-stop shop to combine all program investments - clinics (primary care), recreation center (basketball and indoor pool), childcare (for those who use the amenities within the center) and enrichment classrooms - [different buildings on one property] - Reference MLK Center as a model”
GROUP 4OVERARCHING VISION: “Our overarching vision is striving for workforce readiness; mental, physical, and financial wellness for students and families.”
SPRUCE WORKSHOP THREE
61
Each workshop group brainstormed different concepts for the Student and Family Resource Center.

ANALYSIS: The chart below represents the frequency of each mentioned need in the neighborhood, scaled so that the most frequently mentioned need is scored 100%, then coded to CRI- Subcategories.
Public transporation,
50%
Quality housing, 50%
Career assistance/access
to jobs, 50%Youth
employmen…
Parenting support,
50%
Access to healthy
food , 100%
Mental health
services , 75%
DESCRIPTIONInterviews played a key role in our engagement process. The project team interviewed Trustee Justin Henry, City CouncilpersonAdam Bazaldua, Trustee Appointed Advisory Council representative Amber Sims, and school leadership and staff from across the Lincoln Feeder Pattern. Interviewees provided insight on assets, needs, and equity issues inside Dallas ISD schools and throughout South Dallas.
interviews
WHAT WE HEARD:
Top CRI-Subcategories: Access to Mental Healthcare, Healthy Food, and Job TrainingFrequency of needs mentioned by the community:
From the quotes, we pulled out
generalized text to analyze
patterns across interviews
“So many kids do not have access to the internet and technology and wifi access is
priority number one.”
“A lot of students are dealing with trauma and we need trauma care - destigmatized trauma,
trauma informed learning.”
“Most of the buildings look or are condemned and houses need restructuring/work.”
“ We need sustainable jobs that provide a livable wage. A lot of parents are working but work multiple jobs. They work really hard for not
much money.”
DISD EQUITY IN BOND PLANNING | APPENDIX
LINCOLN INTERVIEWS
62
What does the community need?

ANALYSIS: The chart below represents the frequency of each mentioned need in the neighborhood, scaled so that the most frequently mentioned need is scored 100%, then coded to CRI- Subcategories.
Store, 30%
Safety, 100%
Restaraunt, 20%
Parks, 20%
Library, 30%
Community spirit , 20%
Beautification, 40%
Healthcare, 20%
Grocery Stores, 60%
DESCRIPTIONThe project team conducted 23 bilingual online surveys shared widely through email and social media, and bilingual paper surveysdistributed at food distribution sites within the Lincoln Feeder Pattern. Survey respondents, primarily residents and parents, identified assets, needs, and program ideas for the Student and Family Resource Center.
interviews
WHAT WE HEARD:
From the quotes, we pulled out
generalized text to analyze patterns across
interviews
Top CRI-Subcategories: Safe Streets and Public Spaces, Access to Basic Household Needs, Healthy FoodFrequency of needs mentioned by the community:“Quality health care, quality schools,
and an accessible library.”
“We need more parks and places of recreation to open.”
“There are not enough local businesses that are friendly and for the community, with a focus
on safety for all residents.”
“There is not a nice park for kids to play, a grocery store with healthy affordable
options.”
DISD EQUITY IN BOND PLANNING | APPENDIX
LINCOLN SURVEYS
63
What does the community need?

ANALYSIS: The chart below represents the frequency of each mentioned need in the neighborhood, scaled so that the most frequently mentioned need is scored 100%, then coded to CRI- Subcategories.
Business attraction,
50%
Homeless shelter , 50%
Movie theater, 50%
Safe streets, 50%
Grocery stores , 50%
Quality Restaurant,
100%
Quality School Food , 50%
DESCRIPTIONThe program team conducted a focus group with students who attend Lincoln High School to identify community assets, needs, and program ideas, and to discuss how Student and Family Resource Centers could increase equity in the Feeder Pattern.
interviews
WHAT WE HEARD:
From the quotes, we pulled out
generalized text to analyze patterns across
interviews
Top CRI-Subcategories: Safe Streets and Public Spaces, Access to Basic Household Needs, Healthy FoodFrequency of needs mentioned by the community:
“Safety is like the main thing that they would change.”
“I think we should have shelter for men and women because there are too many of them left on the street.”
“There are many fast food restaurants. They should put healthier options. People get tired of eating fast food
everyday.”
DISD EQUITY IN BOND PLANNING | APPENDIX
LINCOLN STUDENT FOCUS GROUP
64
What does the community need?

GOALS:
1. Create a shared understanding of project purpose, goals, and process;
2. Create a common definition of equity for the stakeholders and broader community;
3. Understand how CRI categories align with stakeholders’ lived experience;
4. Identify what the assets and needs are to help bridge vision of what equity looks like and what current conditions are, and identify actions needed to address issues of inequity.
ACTIVITIES:
A presentation from REO staff on the DISD 2020 Bond to share the origins of this project, and the overall project
process and goals.
Participants split-up into breakout groups
where they were asked through a
facilitated conversation to share the assets and needs of their community.
Participants were then asked to reflect on what should be
included in the Student and Family Resource Centers toaddress those needs and build on those
assets.
DISD EQUITY IN BOND PLANNING | APPENDIX
LINCOLN WORKSHOP ONE
65

Housing Affordability and Stability, 100%
Internet Access and Digital Literacy, 53%
Leadership Programs, 33%
Recreation Spaces and Programs, 53%
Safe Streets and Public spaces, 67%
Access to Public Benefits, 53%Job Training, 87%
Access to Childcare, 27%
After School, Weekend, and Summar Programs,
53%
Access to Fresh Produce and Healthy Food,
100%
Access to Mental Healthcare, 67%
NeedsInternet access was the need most frequently described; however, it was also described as a basic right - it should be a given, notsomething to be requested. The second most mentioned need was safety, followed by affordable housing, childcare, general housingsupport, information on existing programs, and transportation. People discussed various needs for food - affordable food, healthy food,food in general - participants noted a lack of grocery stores.
“Limited wifi and internet services - there’s a great gap in the access there. When the district had to shut down, a lot of kids went home with tablets but they have no wifi. If we are going to make the community whole, we need to bring forth more wifi access. This is the driving force of our workforce.”
“South Dallas needs a better grocery. At the end of the day, a large percentage of folks shop outside of the community. There’s limited access to fresh fruit and veggies. The grocery store is our priority.”
“Childcare support - families rely on very intricate networks of family/friends (grandparents, aunts, uncles, etc.) to juggle the needs of family and work, to make sure the children get to school, get fed, get to practice, and allow the parent to get to work and home.”
DISD EQUITY IN BOND PLANNING | APPENDIX
LINCOLN WORKSHOP ONE
66
The chart above represents the frequency of each mentioned need in the neighborhood, scaled so that the most frequently mentioned need is scored 100%, then coded to CRI- Subcategories.

PROGRAM IDEASParticipants had a number of ideas for classes and trainingprograms that could address community needs, includingculinary school, coding classes, astronomy classes. Two peopleexpressed a desire to emphasize the “hub” aspect of the project,making it a one-stop-shop for all community needs. There werenot as many ideas expressed for the design of the facility in theLincoln feeder pattern, however a few very specific ideas cameup. Throughout the activities, people brought up the history ofLincoln, and someone suggested physically being able to depictand celebrate the history of Lincoln through murals.
“Just bringing businesses in. I know the area probably doesn’t produce enough income right now to pay for product, but if you could get companies to come in and set up shop and lower their prices a little bit, that would help the economics.”
“One stop for resources. Be literal community hubs - in the past, schools were our meeting places. We have to get back to this idea that the school is the center of the community. We need to ask the community what they need.”
“I hear that a lot of people don’t know where any of these things are. What if there was someone you could go to whose job it is to know where all these things are (at the school), like access to healthcare, programs for kids and families?”
“We need to be included in instead of handed to -- there’s history ofthis - need to come into neighborhood groups. The community hasworked very hard to build sustaining communities within the familyunits. We are looking for the economic development side. We all haveto be good care takers. That’s not enough.”
“Kids are missing from these dialogues.”
ASSETSIn general, churches were brought up the most as assets.Health facilities like Baylor Scott & White Health and WellnessCenter and Parkland at Hatcher Station were both brought upfrequently, as were local nonprofits like Bonton Farms and TRHoover CDC. The culture of South Dallas, including places likethe South Dallas Cultural Center, and the rich history of thearea, including that of Lincoln High School, were celebrated. Cityresources that were identified included local parks and the MLKCommunity Center. A number of people mentioned the BlackFraternities and Sororities on MLK as organizations alreadydoing a lot for the community and as potential partners.
“Our churches are welcoming - our schools could be more welcoming -our community centers are very welcoming, but they need to be fully staffed”
“MLK center is one of the primary location for people to access to doctors, but there needs to be more locations.
DISD EQUITY IN BOND PLANNING | APPENDIX
LINCOLN WORKHSOP ONE
67
GENERAL PROJECT FEEDBACKSimilar to the workshop in Spruce, concern was expressed about community engagement. People want to make sure South Dallas residents are part of the process. This was reinforced because a number of participants in the workshop were service providers to the area and not necessarily residents. It was also noted there were very few students in attendance.
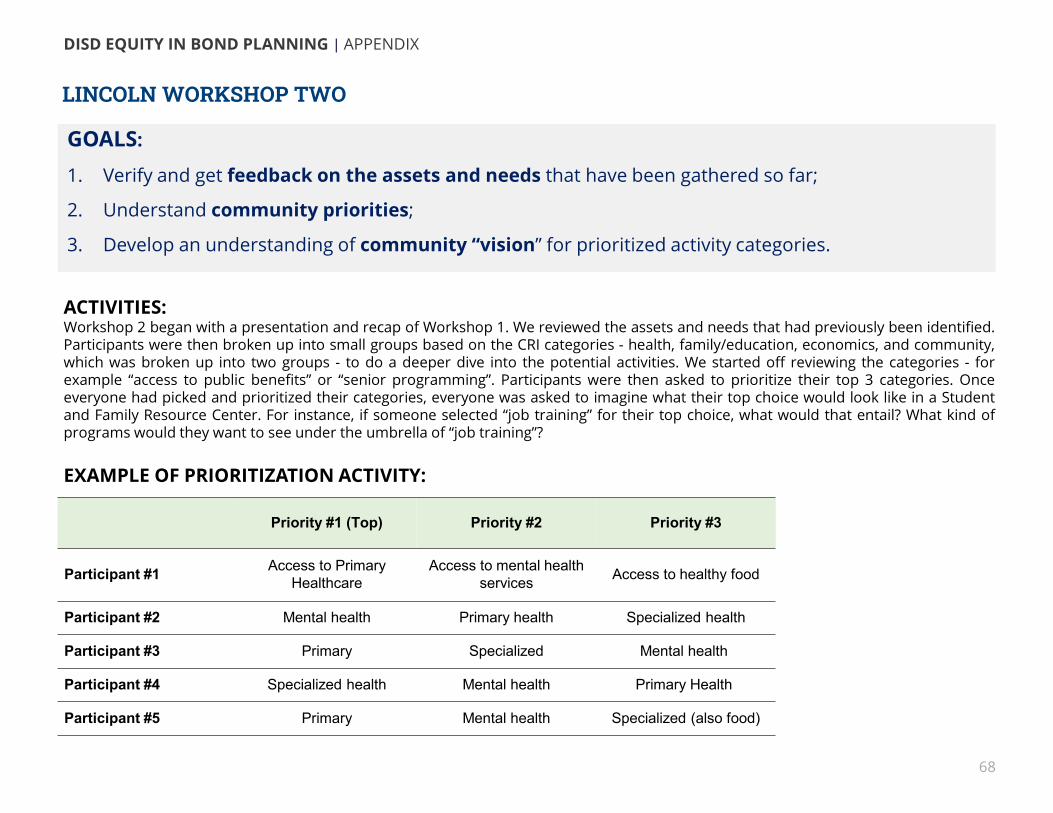
ACTIVITIES:Workshop 2 began with a presentation and recap of Workshop 1. We reviewed the assets and needs that had previously been identified.Participants were then broken up into small groups based on the CRI categories - health, family/education, economics, and community,which was broken up into two groups - to do a deeper dive into the potential activities. We started off reviewing the categories - forexample “access to public benefits” or “senior programming”. Participants were then asked to prioritize their top 3 categories. Onceeveryone had picked and prioritized their categories, everyone was asked to imagine what their top choice would look like in a Studentand Family Resource Center. For instance, if someone selected “job training” for their top choice, what would that entail? What kind ofprograms would they want to see under the umbrella of “job training”?
GOALS:
1. Verify and get feedback on the assets and needs that have been gathered so far;
2. Understand community priorities;
3. Develop an understanding of community “vision” for prioritized activity categories.
EXAMPLE OF PRIORITIZATION ACTIVITY:
DISD EQUITY IN BOND PLANNING | APPENDIX
LINCOLN WORKSHOP TWO
68
Priority #1 (Top) Priority #2 Priority #3
Participant #1 Access to Primary Healthcare
Access to mental health services Access to healthy food
Participant #2 Mental health Primary health Specialized health
Participant #3 Primary Specialized Mental health
Participant #4 Specialized health Mental health Primary Health
Participant #5 Primary Mental health Specialized (also food)

Health
“The suicide rate in high school is high - we try to talk through this with the students and work them, but it’s hard. They get tired of the elements they are dealing with it inside the neighborhoods. For no reason, kids get guns pulled on them. Students have PTSD. Students are acting up because enough is enough. Sometimes we need to stop and ask what’s wrong.”
Community
“Can I wash my children’s clothes when they go to school? Can I afford deodorant, so my kids aren’t being bullied. Or even with adults, they can be bullied. So many things we need on a daily basis. We know food is a need. Household needs are what we need to preserve a house, and keep it healthy. People have to make difficult decisions everyday.”
“When I think about cultural arts, thinking about it from a cultural history perspective or cultural geography perspective - people who have shaped these neighborhoods to what they are, there are stories about what that entails. As you look to reshape the school, it’s important to preserve and display that history so that students can embrace it and use it.”
Economics
“I wanted the community to have more ownership & when you have entrepreneurial support you have more people owning small businesses. You also need financial literacy and job training.”
Family/education
“We need to deal with the issues outside of school that still affect school, parent education is important, tools available for those parents that need the support.”
Internet Access and Digital
Literacy, 60%
Recreation Spaces and
Programs, 40%
Job Training, 60%
Access to Banks and Finacial
Institutions, 40%
Support for Entrepeneurs
and Small Businesses, 40%
After School, Weekend, and
Summar Programs, 40%
Family Counseling and Resources, 40%
Access to Fresh Produce and Healthy Food,
40%
Access to Mental
Healthcare, 100%
DISD EQUITY IN BOND PLANNING | APPENDIX
LINCOLN WORKSHOP TWO
69
What we heard:
The chart below represents the frequency of each mentioned need in the neighborhood, scaled so that the most frequently mentioned need is scored 100%, then coded to CRI- Subcategories.

Goals: The third workshop for the Lincoln FeederPattern consisted of 48 meeting participants. The purpose ofthe meeting was to gain a deeper understanding of thecommunity’s vision for the DISD bond spending by havingparticipants discuss how they would invest the money to bestsupport students and their families.
Activity One: The first activity centered around allocation ofbond spending for programs and facilities. These potentialinvestments emerged from priorities and needs defined in theearlier workshops. They were arranged using the four CRIcategories of Health, Community, Economics, andFamily/Education. Each category was broken into more specificsubcategories, such as “Access to Primary Healthcare” and“Access to Mental Healthcare.” The investment options werethen arranged in an order of cost magnitude, comprising small,medium, and large investments.
Activity Two: Participants were tasked with reaching aconsensus about how they would spend their limited “budget”to achieve their goals for their feeder pattern. Each group wasgiven 10 green squares to spend collectively, with the smallinvestments costing 1 square, and large investments 3squares, giving. They also had the option to add a newprogram if it was not listed on the activity and allocate one tothree squares to it. The second part of the activity askedparticipants to describe how the investments they selectedcould be developed to best benefit students and their families.Then each group summarized their selections into oneoverarching vision. Lastly, participants had the opportunity topropose potential community partners to help bring theiroverarching vision to life.
How can potential programs best serve
students? The community?
How do these programs
complement each other?
Process:
DISD EQUITY IN BOND PLANNING | APPENDIX
LINCOLN WORKSHOP THREE
70

Access to Daily Household Needs,
40%
Housing Affordability & Stability, 80%
Job Training, 100%Family Counseling & Resources, 80%
Access to Mental Healthcare, 80%
Access to Primary Healthcare, 80%
The investment with the largest number of votes (3 out of 5groups) was the health clinic. One meeting attendee notedthat even though there are four healthcare facilities in the area,demand is still not being met. The second most popularinvestment was the Trauma and Therapy Center. These results,combined with the votes for a wellness center and yoga andmeditation studios, support the conversations that there is areal need for mental healthcare. Groups noted that familiesneed safe space for coping with the potential trauma from bothlearning and socio-emotional disabilities. Even seeminglyunrelated investments were sometimes chosen for their mentalhealth benefits. For example, one group noted that the ArtStudio & Gallery could provide preventative and therapeuticsupport for students facing trauma. Another group noted theneed for mental health resources to be provided in a way thathelps address stigma around the topic.
DISD EQUITY IN BOND PLANNING | APPENDIX
LINCOLN WORKSHOP THREE
71
Wellness was described by most groups as the biggestpriority. From financial health to learning healthy habits tobuilding healthier lifestyles, participants reiterated theimportance of framing programing and services around howthey improve the health of the students and families.
The chart below represents the frequency of each mentioned need in the neighborhood, scaled so that the most frequently mentioned need is scored 100%, then coded to CRI- Subcategories.

DISD EQUITY IN BOND PLANNING | APPENDIX
LINCOLN WORKSHOP THREE
72
Each workshop group brainstormed different concepts for the Student and Family Resource Center.
Family Resource
Ctr.
Childcare Center
Industry/ Workforce
Lab
Wellness Center
Housing Resource
Ctr.
Community Closet & Food Pantry
LegalOffices
VocationalCenter
Health Clinic
Trauma Therapy
Ctr.
Yoga & Meditation
Studios
Childcare Center
Computer Lab
LegalOffices
Pharm.
Public Auditorium
Laundry/ Shower
TraumaTherapy
Ctr. Art Studios & Gallery
VocationalCenter
Computer Lab
HealthHousing ClinicResource
Ctr.
GROUP 1OVERARCHING VISION: “Safely developed communities, bridge the gap in order to prevent future despair and build an economic foundation that will provide jobs and other necessary resources”
GROUP 3OVERARCHING VISION: “Spaces for access to services, organizing, planning and historic preservation, and development of cultural competence. Must be a welcoming place steeped in cultural experiences, historical memory & imagination.”
GROUP 2OVERARCHING VISION: “For families to have a place in their neighborhood with comprehensive services, so they don’t have to hop on buses across town. Have things in reach to them. Make it convenient and make it work. Make sure this community has agency and a voice in how the center meets their needs. Overcoming adversity. Ensure problems are really getting solved.”
GROUP 4OVERARCHING VISION: “Our overarching vision is graduating young people with a solid foundation of who they are, basic job skills, and healthy habits.”
Trauma therapy
Ctr.
Health clinic

DISD EQUITY IN BOND PLANNING | APPENDIX
REFERENCES
73
Case Studies
Sun Valley Middle School • NSBN (link)• City and Schools (link)Baker Ripley • Brookings (link)• Rice (link)Oyler School• Community Schools (link) PBS (link) • Partners (link)San Pablo Community Center at Helm • New Markets Community Capital (link)• Baker Villar Architects (link)• City and Schools (link)
Student Achievement Research• Research Brief: Breakfast for Learning (link)• Research Brief: The connection between food insecurity, the federal nutrition programs and student behaviors (link)• The Heckman Equation (link)• Feeding America (link)• School Nutrition (link)• Afterschool Alliance (link)• Health Affairs (link)• University of MN (link)• School Based Health Centers Alliance (link)• MacArthur Foundation (link)