azo dyes removal by bacteria isolated from industrial wastewater
197
AZO DYES REMOVAL BY BACTERIA ISOLATED FROM INDUSTRIAL WASTEWATER Mehvish Ajaz M.Phil (Punjab) Department of Microbiology and Molecular Genetics University of the Punjab, Lahore, Pakistan
-
Upload
khangminh22 -
Category
Documents
-
view
1 -
download
0
Transcript of azo dyes removal by bacteria isolated from industrial wastewater

AZO DYES REMOVAL BY BACTERIA ISOLATED FROM
INDUSTRIAL WASTEWATER
Mehvish Ajaz
M.Phil (Punjab)
Department of Microbiology and Molecular Genetics
University of the Punjab, Lahore,
Pakistan

AZO DYES REMOVAL BY BACTERIA ISOLATED FROM INDUSTRIAL WASTEWATER
A Thesis Submitted to the University of the Punjab, in Partial Fulfillment
of the Requirements of the Degree of
Doctor of Philosophy
By
Mehvish Ajaz
JANUARY, 2019
Department of Microbiology and Molecular Genetics
University of the Punjab, Lahore,
Pakistan

Dedicated To
MY PARENTS
for the love and untiring efforts to make my life successful

Acknowledgement
Praise to the grace of ALLAH ALMIGHTY, The Gracious, and The Merciful. He bestowed
man with intellectual power and understanding and gave him spiritual insight enabling him to
discover his “Self” know his Creator through His wonders and conquer nature. I bow in
obedience before my Lord Who bestowed upon me His love and Blessings and made it possible
for me to accomplish this task and get a drop of experience from already existing ocean of
knowledge with label of being called as a “Student of Research”.
Next to all His Messenger HAZRAT MUHAMMAD (PEACE BE UPON HIM) who is an
eternal torch of guidance and knowledge for humanity.
It is indeed a pleasure and honor for me to express my deepest gratitude towards my
research supervisor Dr. Abdul Rehman, Assistant professor, Department of Microbiology and
Molecular Genetics, University of the Punjab, Lahore. What to say about his knowledge, advices,
guidance and patience throughout my work. His intellectual, hard work, patience and caring
nature are just few of many qualities which had motivated me to complete this research task. I
regard myself lucky to be under the supervision of such a humble and nice person from which I
learned a lot as a researcher and more as a human.
I also want to say word of thanks and deepest appreciation to Prof. Dr. Shahida Hasnian,
(Former Chairperson MMG) and Dr. Anjum Nasim Sabri (Chairperson, Department of
Microbiology and Molecular Genetics, University of the Punjab, Lahore) for providing me an
opportunity to work in the department and for her invaluable guidance and motivation which
made this research project possible.

I also want to say thanks to all the teachers of the department for their cooperation and
help in the completion of this research work. I would like to express special word of thanks to
my seniors Ms. Amina Elahi and Dr Sidra Ilyas for their supreme support, help and making my
time so special, and all the research fellows Ms Hafsa Shahbaz, Ms Wajiha Kanwal, Ms Asma
Akhtar, whose kind behavior and guidance offered great help and encouragement throughout
my research work
I am also extremely thankful to the technical staff MMG, our lab attendant, Mr Nadeem,
Mr. Shehbaz, Mr Mazhar and Mr Saif for their incredible support and cooperation.
Last but not least, I must acknowledge the most important persons in my life, which are,
my family members. I would like to thanks to my entire family for their support and inspiration
they have given me throughout my life. My sincere thanks to all those not mentioned here but
who contributed in one way or other throughout my life.
MEHVISH AJAZ
\

CONTENTS
Title Page No.
List of Tables i
List of Figures ii
Summary vii
Introduction 1
Dyes 3
Classification of dyes(s) 6
Azo dyes 8
Mechanisms of azo dye decolorization by microorganisms 10
1. Biosorption 10
2.Enzymatic degradation 11
Parameters influencing dye degradation 13
1.Structure of azo dyes 14
2. Carbon and nitrogen source 15
3. Salinity, dye concentration, pH, temperature and oxygen 16
Biological systems involved in the decolorization of azo dyes 17
Azo dyes degradation by algae 18
Azo dyes degradation by yeast 19
Azo dyes degradation by filamentous fungi 20
Azo dyes degradation by bacteria 21
Azo dyes degradation by using genetically modified microorganisms and enzymes 22
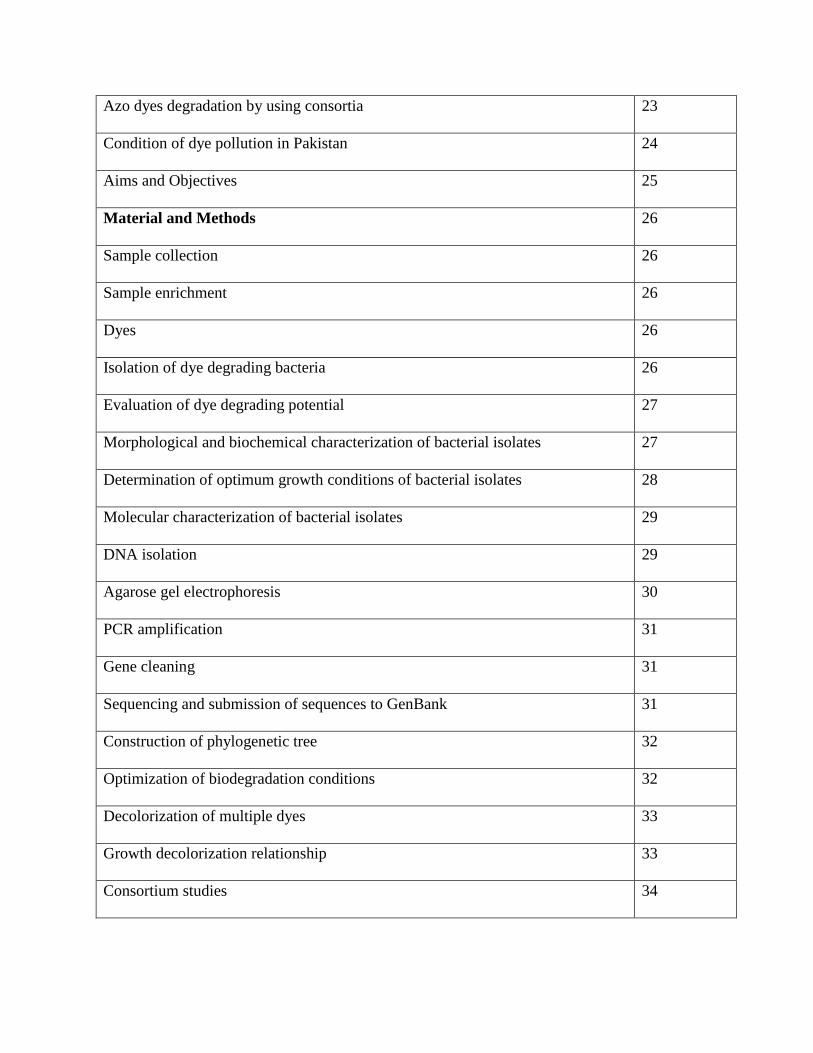
Azo dyes degradation by using consortia 23
Condition of dye pollution in Pakistan 24
Aims and Objectives 25
Material and Methods 26
Sample collection 26
Sample enrichment 26
Dyes 26
Isolation of dye degrading bacteria 26
Evaluation of dye degrading potential 27
Morphological and biochemical characterization of bacterial isolates
27
Determination of optimum growth conditions of bacterial isolates 28
Molecular characterization of bacterial isolates 29
DNA isolation 29
Agarose gel electrophoresis 30
PCR amplification 31
Gene cleaning 31
Sequencing and submission of sequences to GenBank 31
Construction of phylogenetic tree 32
Optimization of biodegradation conditions 32
Decolorization of multiple dyes 33
Growth decolorization relationship 33
Consortium studies 34

Development of consortium 34
Aerobic consortium 34
Anaerobic consortium 34
Mixed consortium 34
Analysis of dye degraded products 35
Sample Preparation 35
Thin layer chromatography (TLC) 35
High performance liquid chromatography (HPLC) 35
Fourier transform infrared spectrometer (FTIR) 36
Gas Chromatography Mass Spectrometry (GC-MS) 36
Dye degradation at large scale 36
Microbial toxicity 37
Phytotoxicity 37
Statistical analysis 37
Results 38
Physiochemical characteristics of wastewater samples 38
Isolation and evaluation of azo dye degrading potential of bacteria 39
Morphological and biochemical characterization of bacterial isolates 39
Determination of optimum growth conditions of bacterial isolates 43
Optimum temperature 43
Optimum pH 43
Growth curves 43
Molecular characterization of bacterial isolates 49

Optimization of bio decolorization conditions 54
Decolorization of multiple dyes 55
Growth Decolorization relationship 55
Consortium studies 66
Analysis of dye degraded products 67
TLC 67
HPLC 68
FTIR 68
GC-MS 75
Dye degradation at large scale 79
Microbial toxicity 83
Phytotoxicity 85
Discussion 89
References 103
Publications Annex I
HPLC chromatograms Annex II

i
LIST OF TABLES
Table No. Description Page No.
Table 1 Physiochemical parameters (temperature, pH) of wastewater collected
from industrial area of Sheikhupura and Lahore.
38
Table 2 Decolorization (%) of bacterial isolates, isolated from 9 samples. 40
Table 3 Morphological and biochemical characteristics of bacterial isolates. 42
Table 4 The nearest homolog and their percentage homology with the azo dye
degrading bacterial strains after 16S rRNA sequencing.
51

ii
LIST OF FIGURES
Figure No. Description Page No.
Figure 1 Schematic diagram showing various treatment methods for textile
effluents.
3
Figure 2 Structure of Synozol Red HF-6BN (CI Reactive Red 195). 4
Figure 3 Chemical structure and some characteristics features of major textile
dyes.
5
Figure 4 Classification scheme of dyes. 7
Figure 5 Proposed mechanism for degradation of azo dyes by azo reductase. 13
Figure 6 Change in color of Synazol Red HF-6BN and Sumifex Tourqi blue as
compared to the control in flask containing culture of bacterial strain
(a) 1b (b) 1m (c) 2p (d) 4v (e) 3c (f) 3d (g) CBL-2 isolated from the dye
contaminated wastewater.
41
Figure 7 Growth of bacterial strains at various temperatures after incubation of
16 hours (a) anaerobic and (b) aerobic conditions.
44
Figure 8 Growth of bacterial isolates at various pH after incubation of 16 hours
in (a) anaerobic and (b) aerobic conditions.
45
Figure 9 Growth curves of bacterial isolates (a) 1b, (b) 1m, (c) 2p, (d) 4v, (e) 3c,
(f) 3d and (g) CBL-2 in LB medium at their respective optimum
temperatures. Optical densities were taken at 600 nm after regular time
interval.
49
Figure 10 Lane M, DNA marker (GeneRuler 100bp DNA ladder #SM0323
Fermentas); Lanes 1b, 1m, 2p, 4v, 3c, 3d, and CBL-2 represent bacterial
isolates. The gel is 1% agarose and stained with ethidium bromide.
50
Figure 11 Lane M, DNA marker (GeneRuler 100bp DNA ladder #SM0323
Fermentas); Lanes 1b, 1m, 2p, 4v, 3c, 3d, and CBL-2 represent
bacterial isolates. The gel is 1% agarose and stained with ethidium
bromide.
50

iii
Figure 12 Phylogenetic tree of all the selected bacterial isolates based on neighbor
joining method (a) S. lentus 1b, (b) S. lentus 1m, (c) B. subtilis, (d) S.
lentus 4v, (e) A. aquatilis and (f) A. faecalis.
53
Figure 13 Phylogenetic tree of all the selected bacterial isolates based on neighbor
joining method in combined form.
53
Figure 14 Optimization of decolorization condition for S. lentus 1b (a)
temperature, (b) pH, (c) incubation condition, (d) inoculum percentage,
(e) carbon source, (f) nitrogen source and (g) dye concentration.
56
Figure 15 Optimization of decolorization condition for S. lentus 1m (a)
temperature, (b) pH, (c) incubation condition, (d) inoculum percentage,
(e) carbon source, (f) nitrogen source and (g) dye concentration.
57
Figure 16 Optimization of decolorization condition for B. subtilis (a) temperature,
(b) pH, (c) incubation condition, (d) inoculum percentage, (e) carbon
source, (f) nitrogen source and (g) dye concentration.
58
Figure 17 Optimization of decolorization condition for S. lentus 4v (a)
temperature, (b) pH, (c) incubation condition, (d) inoculum percentage,
(e) carbon source, (f) nitrogen source and (g) dye concentration.
59
Figure 18 Optimization of decolorization condition for A. aquatilis 1b (a)
temperature, (b) pH, (c) incubation condition, (d) inoculum percentage,
(e) carbon source, (f) nitrogen source and (g) dye concentration.
60
Figure 19 Optimization of decolorization condition for A. faecalis 1b (a)
temperature, (b) pH, (c) incubation condition, (d) inoculum percentage,
(e) carbon source, (f) nitrogen source and (g) dye concentration.
61
Figure 20 Potential of (a) S. lentus 1b, (b) S. lentus 1m, (c) B. subtilis, (d) S. lentus
4v, (e) A. aquatilis and (f) A. faecalis to decolorize multiple dyes
incubated at 37°C after suitable time interval.
63
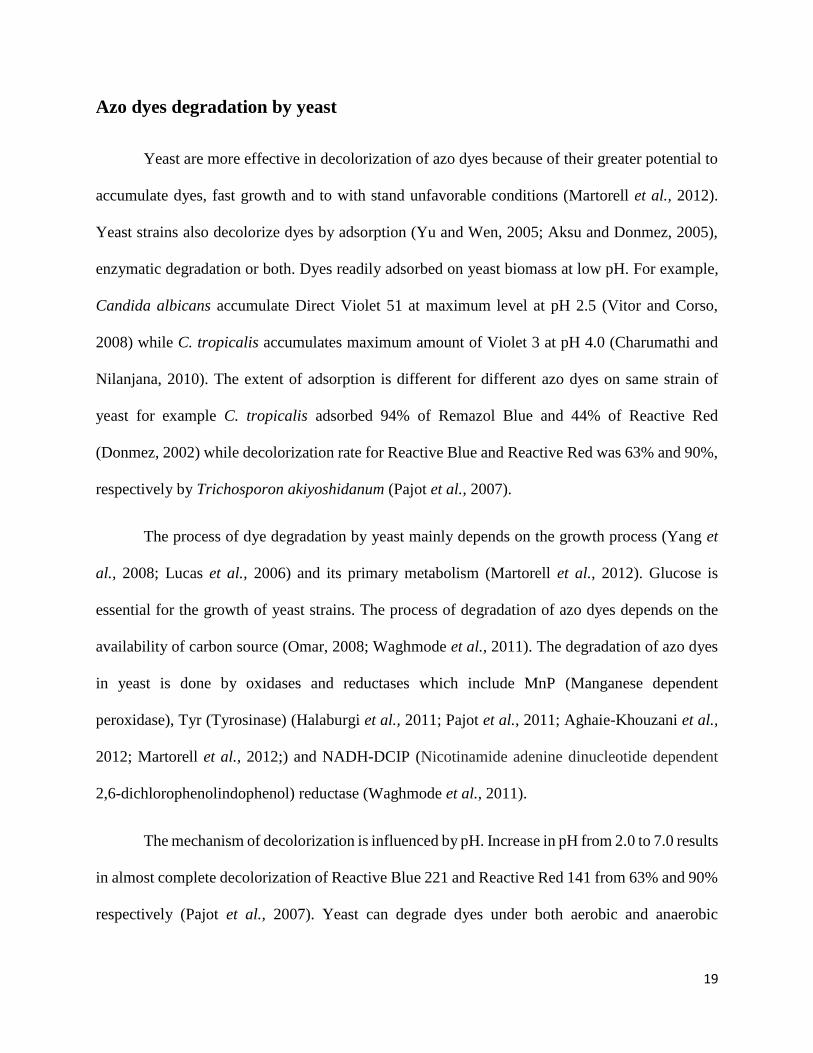
Figure 21 Effect of decolorization on growth of (a) S. lentus 1b, (b) S. lentus 1m,
(c) B. subtilis, (d) S. lentus 4v, (e) A. aquatilis and (f) A. faecalis under
optimum growth conditions.
65

iv
Figure 22 Effect of (a) Aerobic, (b) Anaerobic and (c) Mixed consortium on
degradation of dye.
66
Figure 23 TLC chromatogram of extracted metabolites of (a) S. lentus 1b, (b) S.
lentus strain 1m, (c) B. subtilis, (d) S. lentus strain 4v, (e) A. aquatilis
and (f) A. faecalis decolorized dye sample visualized under UV range
of 254nm.
67
Figure 24 HPLC analysis of reactive Synazol red HF-6BN with a mobile phase of
profile of methanol at 1.0 mL/min. The column was C-18 (250×4.6
mm) (a) represents dye chromatogram while (b) represents S. lentus 1b,
(c) S. lentus strain 1m, (d) B. subtilis, (e) S. lentus strain 4v, (f) A.
aquatilis and (g) A. faecalis degraded dye products extracted after 4
days of incubation at 37°C.
72
Figure 25 FTIR spectrum of control dye (Synazol red HF-6BN) with (a) S. lentus
1b, (b) S. lentus 1m, (c) B. subtilis, (2p) (d) S. lentus 4v, (e) A. aquatilis
(3c) and (f) A. faecalis (3d).
75
Figure 26 GC-MS chromatograms of (a) control dye (b) S. lentus 1b, (c) S. lentus
1m, (d) B. subtilis, (2p) (e) S. lentus 4v, (f) A. aquatilis (3c) and (g) A.
faecalis (3d).
79
Figure 27 Change in color of dye with respect to control in flasks containing
culture of bacterial isolates (a) S. lentus 1b, (b) S. lentus strain 1m, (c)
B. subtilis (2p), (d) S. lentus strain 4v, (e) A. aquatilis (3c) and (f) A.
faecalis (3d) from the original industrial wastewater.
80
Figure 28 Decolorization of dye (Synazol red HF-6BN) by bacterial isolates (a) S.
lentus 1b (b) S. lentus strain 1m, (c) B. subtilis (2p), (d) S. lentus strain
4v, (e) A. aquatilis (3c) and (f) A. faecalis (3d) from industrial
wastewater after incubation of 2, 4, 6 and 8days of incubation at room
temperature.
82

v
Figure 29 The broth decolorized by S. lentus 1b used for incubation of (a) B.
megatarium, (b) B. subtilis and (c) B. cereus at 37°C for 48 hours. No
zone of inhibition was appeared in any case.
83
Figure 30 The broth decolorized by S. lentus 1m used for incubation of (a) B.
megatarium, (b) B. subtilis and (c) B. cereus at 37°C for 48 hours. No
zone of inhibition was appeared in any case.
83
Figure 31 The broth decolorized by B. subtilis used for incubation of (a) B.
megatarium, (b) B. subtilis and (c) B. cereus at 37°C for 48 hours. No
zone of inhibition was appeared in any case.
84
Figure 32 The broth decolorized by S. lentus 4v used for incubation of (a) B.
megatarium, (b) B. subtilis and (c) B. cereus at 37°C for 48 hours. No
zone of inhibition was appeared in any case.
84
Figure 33 The broth decolorized by A. aquatilis used for incubation of (a) B.
megatarium, (b) B. subtilis and (c) B. cereus at 37°C for 48 hours. No
zone of inhibition was appeared in any case.
84
Figure 34 The broth decolorized by A. faecalis used for incubation of (a) B.
megatarium, (b) B. subtilis and (c) B. cereus at 37°C for 48 hours. No
zone of inhibition was appeared in any case.
85
Figure 35 The broth decolorized by Alishwanella sp. used for incubation of (a) B.
megatarium, (b) B. subtilis and (c) B. cereus at 37°C for 48 hours. No
zone of inhibition was appeared in any case.
85
Figure 36 Use of treated wastewater by (a) S. lentus 1b, (b) S. lentus strain 1m, (c)
B. subtilis (2p), (d) S. lentus strain 4v, (e) A. aquatilis (3c) and (f) A.
faecalis (3d)., tap water and untreated wastewater for growth of Vigna
radiata (mung beans) for a 10 days incubation period under 1:1 light
and dark conditions.
88
Figure 37 Synazol Red HF 6BN dye enters into the cell (A. aquatilis 3c) by
unknown mechanism. Upon entrance into the cell the dye is
enzymatically processed into various end products. Most probably, azo
group (-N=N-) is reduced, followed by cleavage reaction and different
100

vi
end products are produced. Secondly, desulfonation and oxidative
deamination results in synthesis of pyrrolo[1,2-a]pyrazine-1,4-dione
derivative which can be used as substrates in amino acid metabolism.
The amino acid catabolism can synthesize pyruvate (3C compound)
which can be converted into acetyl-CoA. The acetyl-CoA undergoes
Krebs cycle to produce NADH2 and FADH2 (substrates of electron
transport chain). Moreover, dye desulfonation, oxidative deamination
and carboxylation lead to produce phthalate derivatives, which can be
transformed into different fatty acids and aldehydes. The phthalate,
fatty acids and aldehydes can directly/indirectly enter into fatty acid
oxidation reactions (β-oxidation) to produce acetyl-CoA, NADH2 and
FADH2.
Figure 38 Synazol Red HF 6BN dye enters into the cell (Staphyloccocus lentus 1M) by
unknown mechanism. Upon entrance into the cell the dye is enzymatically
processed into various end products. Most probably, azo group (-N=N-) is
reduced, followed by cleavage reaction and different end products are
produced. Secondly, desulfonation and oxidative deamination eventually
results in synthesis of 4-guanidinobutanoic acid derivative which can be used
as substrates in amino acid metabolism. The amino acid catabolism can
synthesize pyruvate (3C compound) which can be converted into acetyl-CoA.
The acetyl-CoA undergoes Krebs cycle to produce NADH2 and FADH2
(substrates of electron transport chain). Moreover, dye desulfonation,
oxidative deamination and carboxylation lead to produce phthalate
derivatives, which can be transformed into different fatty acids and aldehydes.
The phthalate, fatty acids and aldehydes can directly/indirectly enter into fatty
acid oxidation reactions (β-oxidation) to produce acetyl-CoA, NADH2 and
FADH2.
101
Figure 39 Flow diagram demonstrating the microbial treatment of textile effluent
for dye degradation and use of treated wastewater for the growth of
plants.
102

vii
SUMMARY
The present study deals with the isolation and characterization of dye degrading bacteria
from industrial effluent. Based on dye decolorization percentage seven bacterial isolates i.e., 4
anaerobic (1b, 1m, 2p and 4v) and 3 aerobic (3c, 3d and CBL-2) were selected for further study.
The isolates were recognized as Staphylococcus lentus 1b (KX950707), Staphylococcus lentus 1m
(KX950708), Bacillus subtilis (KX950709), Staphylococcus lentus 4v (KX950710), Alcaligenes
aquatilis (KY009932), Alcaligenes faecalis (KY009933) and Alishwanella sp. (JN546609) on the
basis of morphology, biochemical characterization and 16S rRNA ribotyping.
All the bacterial isolated had varying ability to decolorize dye. The dye degrading
percentage of S. lentus 1b, S. lentus 1m, B. subtilis, S. lentus 4v, A. aquatilis, A. faecalis and
Aliswanella sp. were 71, 70, 73,79,82, 78 and 76 respectively. All the isolates showed optimal
growth at 37 oC and pH7.
The dye decolorizing conditions of the isolates were optimized in order to get optimum
rate of decolorization. All the strains showed maximum decolorization rate at 37 oC and pH 7. The
shaking anaerobic conditions were best to decolorize dye for aerobic isolates while anaerobic one
decolorize dye optimally at static conditions. S. lentus 1b, S. lentus 1m and S. lentus 4v gave
maximum decolorization rate when wheat bran was used as carbon source while B. subtilis
decolorize dye optimally in the presence of sugarcane baggase. A. aquatilis and A. faecalis relied
more on saw dust as carbon source. As nitrogen source yeast extract was utilized by all the strains
to decolrize dye at maximum rate. S. lentus 1b, B. subtilis, A. aquatilis and A. faecalis decolrized
dye efficiently when inoculum percentage was 6 while S. lentus 1m and S. lentus 4v at 4 percent.
All the strains gave maximum decolorization rate when dye concentration was 10 mg/L except S.
lentus 4v whose optimum dye concentration was 20 mg/L.

viii
The potential of the strains to degrade multiple dyes was also evaluated. S. lentus 1b, S.
lentus 1m and S. lentus 4v, A. aquatilis and A. faecalis decolorized mixture of multiple dyes
(Congo Red, Methyl Red, Phenol Red, Brilliant Black and Navy Blue) at a rate of 81, 79, 82, 87,
86 and 82 percent respectively. The effect of dye decolorization was also monitored on the growth
of bacteria. It was observed that the dye decolorization process did not affect the bacterial growth
as bacteria prosper to grow.
Dye degrading potential of bacteria was also evaluated in the form of consortium. The rate
of decolorization was increased upto 8-15% when aerobic consortium was used in comparison to
aerobic bacteria while an increase of 10-14% was observed in decolorization rate when consortium
of anaerobic strains was utilized for degradation. When aerobic and anaerobic consortia were used
in combination an increase of 8-10% was observed in decolorization rate in comparison to
individual aerobic and anaerobic consortium.
The analysis of dye degrading products was done by using various techniques. TLC was
done in order to confirm that the dye was degraded into its products. The results showed that the
Rf value of bands of obtained in the dye degraded products (0.89, 0.90, 0.94, 0.95, 0.98) were
different to that of control dye (0.94)
HPLC was also performed to confirm the degradation of dye into its metabolites. Peaks of
different retention time were observed in the control and dye degraded samples. The retention time
of peaks in control sample were 1.80, 2.88 and 5.00 while the retention time of peaks given by
degraded sample of S. lentus 1b (1.97 and 2.92), S. lentus 1m (3.01), B. subtilis (1.92, 2.89 and
4.86), S. lentus 4v (1.94, 2.91, 4.92 and 6.37), A. aquatilis (1.99, 2.30, 2.95 and 3.76) and A.
faecalis (1.93, 2.09 and 2.95).
ix
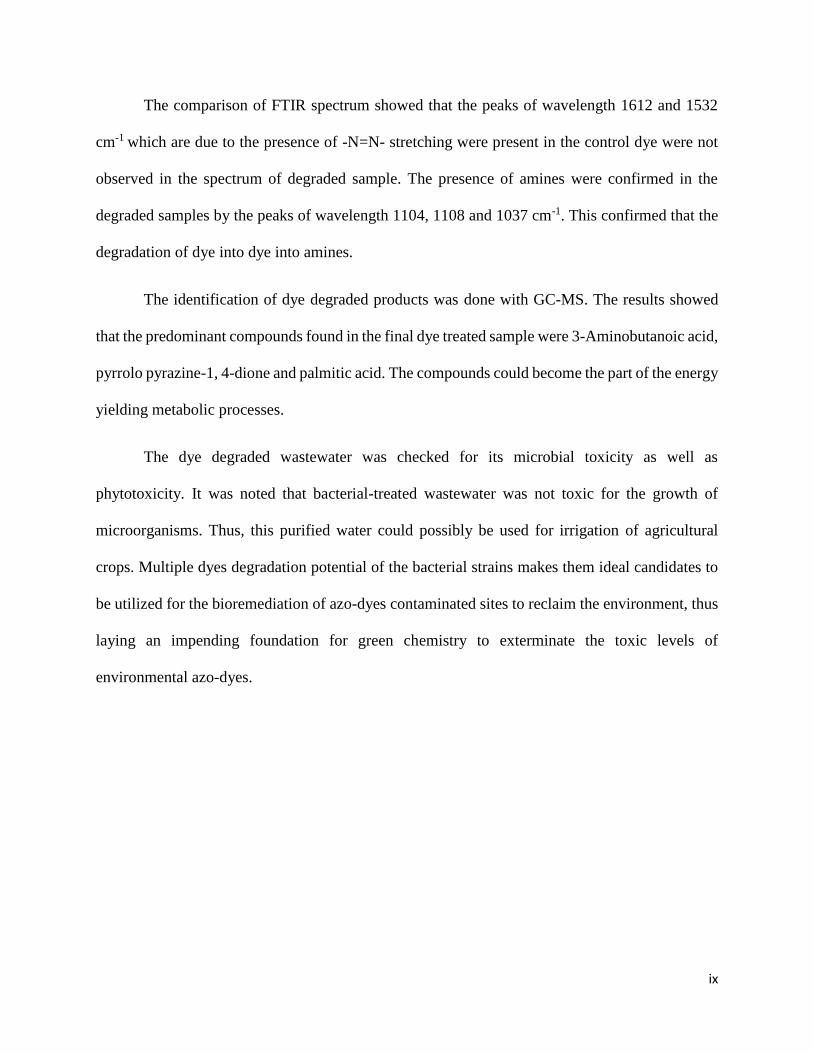
The comparison of FTIR spectrum showed that the peaks of wavelength 1612 and 1532
cm-1 which are due to the presence of -N=N- stretching were present in the control dye were not
observed in the spectrum of degraded sample. The presence of amines were confirmed in the
degraded samples by the peaks of wavelength 1104, 1108 and 1037 cm-1. This confirmed that the
degradation of dye into dye into amines.
The identification of dye degraded products was done with GC-MS. The results showed
that the predominant compounds found in the final dye treated sample were 3-Aminobutanoic acid,
pyrrolo pyrazine-1, 4-dione and palmitic acid. The compounds could become the part of the energy
yielding metabolic processes.
The dye degraded wastewater was checked for its microbial toxicity as well as
phytotoxicity. It was noted that bacterial-treated wastewater was not toxic for the growth of
microorganisms. Thus, this purified water could possibly be used for irrigation of agricultural
crops. Multiple dyes degradation potential of the bacterial strains makes them ideal candidates to
be utilized for the bioremediation of azo-dyes contaminated sites to reclaim the environment, thus
laying an impending foundation for green chemistry to exterminate the toxic levels of
environmental azo-dyes.

x

1
INTRODUCTION
Industrialization acts as a backbone for the growth and development of a country. This
rapid increase in industrialization enhances the production and utilization of various chemicals in
day to day life (Sathiya et al., 2007; Saharan and Ranga, 2011). It increases the standard of living
but despite of all its beneficial effects it imposes hazardous effects on the environment as well.
The discharge of toxic effluents from the industries becomes a source of causing environmental
pollution. It contaminates the aquatic as well as terrestrial ecosystem.
The industrial pollutants mainly include organochloride-based water pesticides, heavy
metals (lead, mercury, cadmium, chromium etc.) insecticides, herbicides, oil, cosmetics, fertilizers,
chemical wastes, chlorinated solvents, hydrocarbons, colors and dyes. Synthetic dyes are
extensively used in textile, paper production, leather tanning, agriculture, food technology, light
harvesting array, pharmaceuticals and coloring which make them an important class of industrial
chemicals (Dafale et al., 2010). The annual production of synthetic dyes is 0.7 million tonnes
worldwide and 10,000 various pigments and dyes are used in industries. (Rafi et al., 1990).
The wastewater that is discharged from textile industries becomes a source of pollution due
to presence of dye content in it. About 10-15% of dyestuff is lost directly into wastewater due to
inefficiency in dyeing process. (Spadarry et al., 1994). The wastewater is appeared colored even
when the concentration of dye is 1 mg / L, while the concentration of dye is 10 – 200 mg/ L in
textile processing wastewater which results in decrease in water quality. (O ’Neil et al., 1999). The
removal of dyes from textile effluent is very difficult and thus it becomes a major source of
pollution (Oh et al., 2004; Meerbergen et al., 2018).
The most widely used classes of synthetic dyes in industry include azo, anthraquinone and
triarylmethane dyes. Azo dyes are the most widely used group among these classes and their usage

2
is about 70% of all the organic dyes (Stolz, 2001). They make up the vast majority of the dyes
discharged by textile processing industries. Azo dyes are xenobiotic in nature and are resistant to
process of biodegradation. They pose toxicity, genotoxicity, mutagenecity and carcinogenicity to
aquatic organisms (algae, fish, and bacteria) as well as for animals (Ollgaard et al., 1999; Stolz,
2001). Elevated levels of azo dyes accumulated in the environment and this is because of resistant
nature of azo bond present in these dyes. They have the potential to stabilize in both acidic and
alkaline environments as well as in extreme temperature conditions.
Most of the dyes are toxic in nature and carcinogenic as well (Acuner and Dilek, 2004).
Their disposal into water bodies poses severe damage to hydrophytes by decreasing their
photosynthetic activity as light is unable to pass through from colored content (Aksu et al., 2007)
and their breakdown products poses a serious threat to aquatic organisms (Hao et al., 2000).
Physical and chemical methods such as adsorption, coagulation- flocculation, oxidation and
electrochemical methods can be used for the elimination of dyes from wastewater (Fig. 1) (Lin
and Peng, 1994, 1996). But these processes are very expensive and produce by products which
need further processing. These defects can be removed by using bio processing techniques as they
are cost effective and environmental friendly as well.
Many microorganisms have ability to degrade dyes such as fungi, algae, yeast,
actinomycetes and bacteria (Chen et al., 2003). Bacteria can degrade dyes both under aerobic and
anaerobic conditions (Banat et al., 1996). Many bacteria and fungi such as Aeromonas,
Pseudomonas, Bacillus, Rhodococcus, Shigella, Klebsiella, Rhizopus oryzae, Penicillium
oxalicum and Phanerochaete chrysosporium have the ability to biodegrade azo dyes efficiently
(Chung et al., 1993; Banat et al., 1996; Wong and Yuen, 1996; Zissi et al., 1997; Chang et al.,

3
2001). Bacteria biodegrade azo dyes by producing enzymes such as azo reductase and laccase
while fungi tolerate dyes by absorption.
Figure 1: Schematic diagram showing various treatment methods for textile effluents.
Dyes
The organic compounds which are used for giving color to different products such as paper,
textile, cosmetics, waxes, plastics, pharmaceuticals, and so on are called dyes. Colorants are of
two types i.e., dyes and pigments. The differ in two properties i.e., solubility and interaction with
the substrate. Dyes are soluble in water while pigments are not. Dyes diffuse into the material
while pigments do not interact with the substrate. Dyes are usually prepared by the addition of
different functional groups such as nitro, chloro, amino, bromo etc. to basic organic chemicals e.g.,
benzene, anthracene (Fig. 2 and 3) (Ramanath, 2005).
Dyes have been used by mankind for centuries and the earliest evidence of dye utilization
is thought to be about 1,80,000 years ago by Neanderthal man (Christie, 2001). All the dyes were
more or less natural, till the late nineteenth century, with chief sources like leaves, vegetable
extracts, twigs, berries, roots, flowers of several plants, mollusks insects. Natural dyes did not have
a wide range of colors were usually produced on a small scale (Gupta, 2009).

4
Nevertheless, in 1856 mauve dye being the world’s first commercially effective synthetic
dye was discovered by W.H. Perkin coincidentally (Hunger, 2003). We can define such dyes as
colored substances that give a permanent color to fibers when applied and resist to disappearing
upon revelation to light, perspiration, water, various chemicals, plus oxidizing agents as well as
microbes’ attack (Rai et al., 2005). Synthetic dyes, due to their cost effectiveness and vast variety
of novel colors, have substituted the natural dyes (Gabriel and Hong, 2008).
Electromagnetic energy is absorbed by all aromatic compounds, but those compounds
appear colored which absorb energy in visible wavelength region i.e., 350-700nm. There are two
groups in dyes. First one is chromophoric group in which conjugated double bonds are present and
it is decolorized electron system. Second group is called auxochromes which is responsible to
enhance the color of chromophoric group. Chromophores include functional group –C=C–, –
C=N–, –C=O, –N=N–, –NO2 and quinonoid rings while in auxochromes –NH2, –SO3H, –COOH
and –OH (Christie, 2001). Classification of dye is mainly based on the type of chromophore
present in them or on their use. There are 20-30 different types of dyes depending on their structure.
The production of dyes is in million tonnnes used for dyeing and printing.
Figure 2: Structure of Synozol Red HF-6BN (CI Reactive Red 195)

5
Figure 3: Chemical structure and some characteristics features of major textile dyes (Suteu et al.,
2011).

6
Classification of dye(s)
The basis of classification of dyes includes their chemical structure and color index (CI).
The mono-azo, di-azo, tri-azo, anthroquinone, triarylmethane, and phthalocyanines are the
common classes of dyes. They may be anionic, cationic, and non-ionic on the base of their use in
industry (Fig. 4). They can also be subclassified on the base of color into yellow, orange, red,
violet, blue, green, and black (Ramanath, 2005). Kirk-Othmer (1979), classified dyes into
following categories:
Acid dyes: These are anionic dyes which are soluble in water. They have one or more sulphonic
and carboxylic acid group in their structure and chemically constituted by compound azo,
anthraquinones and triarylmethanes, iminoacetone, nitro, nitrous and quinoline. They are widely
used to dye nylon, silk, modified acrylic, wool, paper, food and cosmetics.
Basic dyes: They are cationic dyes which are also soluble in water and produce cationic
compounds. These are chemically constituted by compounds azo, anthraquinone, triarylmethane,
methane, thiazine, oxazine, acridine and quinoline. They are used to dye modified acrylic,
modified nylon, modified polyesters and papers. They have some biological activity as well as
they are used in medicines and antiseptics.
Direct dyes: They are anionic compounds which are soluble in water when electrolytes are present
in the solution. These are chemically composed of azo compounds, with thiazoles, phtalocyanines
and oxazines. They are usually used in dyeing of cotton, regeneration of cellulose, for dyeing
paper, leather, and nylon.
Fluorescent dyes (group of the xanthenes): They are actually colorless compounds and appeared
fluorescent due to absorbtion of incident UV light and re-emittance in the visible region (blue) of

7
the spectrum. They are not actually dyes in nature but due to their wide use in fabrics and other
materials they are classified under the heading of dyes by Color Index.
Reactive dyes: They have a simple chemical structure. They are constituted chemically by azo
compounds, anthraquinones and phtalocyanines. They have high fixing property due to the
formation of covalent bridges with the hydroxyl group of cellulose within the fiber.
Sulphurous dyes: This is usually a small group of dyes with low cost and good fixing nature.
They are usually used to dye cotton after alkaline reduction bath with sodium sulphite.
Vat dyes: They are usually insoluble in water and mostly used to dye cellulosic fibers after the
treatment of alkaline bath with sodium hydrosulphite. They are chemically anthraquinones and
indigo in nature.
Dye precursors: These are the dyes which are obtained from raw materials. They are cyclic
aromatic compounds having benzene ring in their structure and develop color by chemical
reactions.
Figure 4: Classification scheme of dyes (Uday et al., 2016).

8
Azo dyes
The simple synthesis method of azo dyes makes them the biggest and most widely used
group of dyes in industry. A German scientist P. Gries started their production in 1858 when the
reaction mechanism of diazotization for the production of azo compounds was discovered by him.
Out of the total global production of dyes, which was nearly 1,000,000 tons in 1994 estimations,
over fifty percent were azo dyes (Ollgaard et al., 1999; Stolz, 2001). Based on the azo dyes’
chemical configuration, which is described via one to many (–N=N–) azo groups, in the visible
spectrum light absorption occur (Chang and Kuo, 2000). Azo compounds establish the major as
well as the utmost miscellaneous collection of synthetic dyes which have been extensively utilized
in several industries like food, textile, paper printing and cosmetics (Pandey et al., 2007). Recently
Rajaguru et al. (2002) as well as Umbuzeiro et al. (2005) in their studies publicized that the
addition of azo colorants to surface and ground water through contaminated textile effluents made
them potent mutagens. Their expulsion into surface water harmfully distress the natural assets, soil
fecundity, aquatic organisms as well as disrupt ecosystem legitimacy (Mester and Tien 2000;
Puvaneswari et al., 2006; Zhao et al., 2011) via altering pH, swelling the biochemical oxygen
demand plus chemical oxygen demand, as well as critically upset water quality. Roughly 280,000
tonnes of textile dyes, in a year, are dispensed into the atmosphere globally (Jin et al., 2007)
maximum of which finish up into the aquatic environment. So, the deduction of color from textile
effluents has been a chief anxiety.
Large work has been done on the utilizing physical plus chemical approaches for color
removal of from dyes holding effluents (Swaminathan et al., 2003; Behnajady et al., 2004; Chen
et al., 2010; Malik et al., 2017). Though, employment of physical/chemical approaches have the
innate hitches of being sparingly impractical (demanding extra energy plus chemicals), being

9
incapable to fully eliminate the recalcitrant and obstinate azo colorants either or both their organic
metabolites, making a considerable quantity of sludge that might produce secondary contamination
difficulties, as well as comprising complex processes (Forgacs et al., 2004; Zhang et al., 2004).
Nevertheless, biodegradation is a cost-competitive eco-friendly substitute to chemical decay
procedure which may aid diminish water intake likened with physiochemical approaches i.e.,
adsorption, precipitation, photocatalysis, reduction, reverse osmosis, membrane filtration and
desalination (Verma and Madamwar 2003; Rai et al., 2005).
Bioremediation is a process which is mostly in use these days to either degrade the
environmental pollutants completely or to transform them into less toxic forms. This process is
done by using living organisms or microorganisms. Degraded organic components are mostly
converted into carbon dioxide, water and other inorganic compounds which are usually taken up
by other microorganisms as their source of nutrition. Bioremediation usually involves the role of
microbial enzymes to transform the pollutants into less toxic forms. Therefore, it is very important
that environmental conditions should be optimized to run this process efficiently.
The large amount of dyes used in textile industry lost in wastewater as they do not
completely bind with the fabric. The loss of dye in the wastewater depends upon the class of the
dye and application. It may range from 2% in case of basic dyes while it could be upto 50% for
reactive dyes. This loss of dyes becomes a cause of contaminating surface as well as ground waters
in the surrounding of industries (Ganesh et al., 1994; O’Neill et al., 1999). Many dyes are visible
in water even at a low concentration of 1 mg/L. The wastewater from textile industries is highly
colored having dye concentration between 10–200 mg/L. The discharge of wastewater into water
bodies affects aquatic industry by causing aesthetic problems, causes obstruction of light and

10
oxygen in water bodies (Vandevivere et al., 1998; Weisburger 2002; Öztürk and Abdullah 2006).
It is being reported that colored discharge of textile and other industries where dye is used is more
toxic in nature as compared to discharge of other industries (Houk 1992). The effluent of textile
industry contaminated with azo dyes is responsible for causing mutagenic activity in surface and
ground waters (Rajaguru et al., 2002; Umbuzeiro et al., 2005). Thus, the removal of color from
textile effluents is critical issue these days.
Dyes are stable to degrade in presence of light and therefore can survive in environment.
A dye called Reactive Blue (RB 19) has half-life of 46 years at 25◦C and pH 7 (Hao et al., 2000).
Moreover, they have xenobiotic nature as well for example 4–40 dihydroxy azo benzene (Gill and
Strauch, 1984) so they are resistant to biodegradation. The use of conventional methods of their
treatment or their dilution with domestic wastewater is not sufficient to degrade dyes. There is a
need of alternative methods to degrade these dyes in wastewater.
Mechanisms of azo dye decolorization by microorganisms
Microorganisms degrade azo dyes by two different mechanism i.e., biosorption or
enzymatic degradation or by both (Phugare et al., 2010; Wu et al., 2012).
1. Biosorption
The biomass of various microorganisms such as algae, yeast, filamentous fungi and
bacteria is used in this mechanism to degrade azo dyes (Bhatnagar and Sillanpaa, 2010). Different
functional groups such as amino, carboxyl, hydroxyl, phosphate and other charged groups present
in the heteropolysaccharide and lipid component of cell wall of microorganisms are responsible
for causing strong attractive forces between azo dyes and cell wall (Aksu and Donmez, 2003; Vitor
and Corso, 2008; Srinivasan and Viraraghavan, 2010; Charumathi and Das, 2012). Several

11
pretreatment processes are responsible for increasing adsorption capacity of cell biomass. This
includes autoclaving which ruptures the cell wall and results in an increase surface area (Fu and
Viraraghavan, 2001), treatment with different chemicals such as acids (Srinivasan and
Viraraghavan, 2010), formaldehyde, NaOH (Ambrosio et al., 2012), NaHCO3 and CaCl2 (Fu and
Viraghavan, 2000; Vijayraghavan and Yun, 2007) causes a change in the surface and alters the
binding capacity of various sites. The use of dead cells for biosorption has various advantages over
use of living cells as they have no nutritional requirement, their storage time is greater and can be
regenerated by the use of organic solvents and surfactants (Fu and Viraraghavan, 2001). The
efficiency of biosorption depends on various factors such as temperature, pH, time of contact, ionic
strength, dye concentration, adsorbent and dye concentration, and type of microorganism (Fu and
Viraghavan, 2000; Bakshi et al., 2006; Iqbal and Saeed, 2007; Renganathan et al., 2007;
Vijayraghavan and Yun, 2007; Kaushik and Malik, 2009; Latif et al., 2010; Erden et al., 2011;
Ambrosio et al., 2012).
2. Enzymatic Degradation
The presence of azo linkage (-N=N-) in azo dyes make them an electron deficient
component. The presence of sulphonic (SO3-) or other electron withdrawing groups in their
structure decreases their susceptibility of degradation by microorganisms (Barragan et al., 2007;
Hsueh et al., 2009; Enayatizamir et al., 2011; Kuberan et al., 2011; Kurade et al., 2011).
Microorganisms have reductases for degradation of azo dyes under favorable conditions (Stolz,
2001; Majeau et al., 2010; Chacko and Subramaniam, 2011; Misal et al., 2011, Saratale et al.,
2011; Sugumar and Thangam, 2012). Azo bond is cleaved under anaerobic conditions by anaerobic
azoreductase followed by the transfer of electron between dye molecule and intracellular enzyme
(Fig. 5). As a result, corresponding amines are formed (McMullan et al., 2001; Ramalho et al.,

12
2002; Kodam et al., 2005; Chacko and Subramanian, 2011). Azoreducatases require redox
mediators such as FADH, NADH and NADPH for their proper functioning (dos Santos et al.,
2007; Van der Zee and Cervantes, 2009; Chacko and Subramanian, 2011). The reduction of dye
does not depend on its intracellular uptake due to presence of high molecular weight sulphonate
substituent groups (Robinson et al., 2001; Pearce et al., 2003; Pandey et al., 2007; Chacko and
Subramanian, 2011)
Azo linkages have been reduced by different enzymes which include FMN-dependent
reductases (dos Santos et al., 2007; Burger and Stolz, 2010), FMN-independent reductases (Burger
and Stolz, 2010), NADH-dependent reductases (Ooi et al., 2007; Matsumoto et al., 2010; Misal et
al., 2011), NADPH-dependent reductases (Liu et al., 2007; Misal et al., 2011; Mendes et al., 2011)
and NADH-DCIP reductases (Dhanve et al., 2008; Jadhav et al., 2010; Phugare et al., 2010;
Saratale et al., 2011; Waghmode et al., 2011). The microorganisms which have azoreductases
include bacteria (Vitor and Corso, 2008), algae (El-Sheek et al., 2009) and yeast (Jadhav et al.,
2007).
The azo dyes are degraded aerobically by peroxidases and phenoloxidases which includes
manganese peroxidase (MnP), lignin peroxidase (LiP), laccase (Lac), tyrosinase (Tyr), N-
demethylase (Duran and Esposito, 2000; Baldrian, 2006; Husain, 2010; Jadhav et al., 2011;
Oturkar et al., 2011; Saratale et al., 2011) dye-decolorising peroxidases (Liers et al., 2010) and
cellobiose dehydrogenase (Tilli et al., 2011). These oxidative enzymes are generally present in
filamentous fungi (Majeau et al., 2010), bacteria (Waghmode et al., 2011) and yeast (Martorell et
al., 2012). The non-specific nature of laccases, their effectiveness without cofactor and
dependence on oxygen as electron acceptor make them best option for bioremediation (Telke et
al., 2011; Kalyani et al., 2012). Laccases are able to degrade several complex compounds for

13
example non-phenolic compounds and dye pollutants in the presence of specific mediators such
as 1-hydroxybenzotriazol (Khlifi et al., 2010) or 2, 2ʹ-azinobis (3-ethylthiazoline-6-sulphonic acid)
(ABTS) (Fang et al., 2011). Some reactive radicals such as ABTS are formed when oxidation of
mediators is done by Lac. These radicals are used for oxidation of some dyes like indigo blue,
brilliant blue G, Coomassie blue and Orange 7 without involving enzymes (Solis -Oba et al., 2007).
The Lac oxidation of phenolic azo dyes also results in the production of redox mediators (Soares
et al., 2001; Camarero et al., 2005).
Figure 5: Proposed mechanism for degradation of azo dyes by azo reductase (Keck et al., 1997).
Parameters influencing dye decolorization
The growth of microorganisms is affected by various factors such as presence of chemical
substances, such as dyes, variations in pH, high salinity, and high content of organic compounds
(Dua and Singh, 2002; Ang et al., 2005; Megharaj et al., 2011). Most suitable microorganisms for

14
dye decolorization are those which are isolated from the vicinity of dye contaminated
environments such as soil, wastewater and sludge obtained from treatment of wastewater (Yang et
al., 2009; Ola et al., 2010; Ayed et al., 2011). The following factors affects the biodegradation of
azo dyes.
1. Structure of azo dyes
The structure of azo dyes highly influences their biodegradation (Pasti-Grigsby et al., 1992;
Sawhney et al., 2011; Rajee and Patterson, 2011). The presence of electron withdrawing groups
such as SO3- in their structure aids in their biodegradation as compared to electron releasing groups
such as -NH- triazine. The presence of these electron withdrawing group at ortho and para position
to the azo bond further aids in biodecolorization as compared to meta position because of increased
resonance effect. This makes the dye molecule a strong electrophile which results in an increased
rate of decolorization (Pricelius et al., 2007; Tauber et al., 2008). Azo dyes molecules having less
steric hindrance decolorize easily by microorganisms (Chen et al., 2011). The induction of enzyme
is done by increasing concentration of dye and this induction is dye specific which is maximum at
the end of biotransformation process (Khehra et al., 2005; Moosvi et al., 2007; Ayed et al., 2010).
For example, MnP activity is induced in Debaryomyces polymorphus (Yang et al., 2005) and
Trichosporon akiyoshidainum in the presence of Reactive Black 5 while azoreductase activity in
Chlorella vulgaris and Nostoc linckia in the presence of G-Red and Methyl Red respectively (El-
Sheekh et al., 2009).
The biotransformation of azo dyes is done by both oxidases and reductases. The induction of
different enzymes can take place in the same microorganism for the different dyes depending upon
the structure of azo dye. The activity of Lac is induced in Galactomyces geotricum in the presence

15
of GYHER (Golden Yellow HER) while activity of both Lac (Laccase) and azoreductase is
observed in the presence of Remazol Red (Waghmode et al., 2012).
2. Carbon and nitrogen source
There is a deficiency of carbon in molecule of dyes, so presence of carbon source is essential
for decolorization process (Khelifi et al., 2009; Tony et al., 2009). The addition of carbon source
plays two important role firstly it provides energy for the growth and survival of microorganisms
and secondly, they provide electrons for the reduction of azo bond (Perumal et al., 2007; Gonzalez-
Gutierrez and Escamilla-Silva, 2009). Microorganisms behave differently to different carbon
sources. A consortium of Paenibacillus polymyxa, Micrococcus luteus and Micrococcus sp. has
decolorized Reactive Voilet 5 more efficiently in the presence of glucose (Moosvi et al., 2007)
whereas a combination of different carbon sources is required by some microorganisms to enhance
rate of decolorization for example Staphylococcus arlettae show greater than 90% decolorization
of Reactive Yellow 107 and Reactive Red when glucose and yeast extract is added while when
these sources are substituted with sodium pyruvate less than 50% decolorization is observed
(Elisangela et al., 2009). Microorganisms which use starch as a carbon source render the process
of biodegradation more economical as it is used as an additive in textile finishing process (Babu
et al., 2007) for example, consortium of Paenibacillus polymyxa, M.luteus and Micrococcus sp.
decolorize Reactive Voilet 5 to a greater extent in the presence of starch (Moosvi et al., 2007). The
use of several cheaper carbon sources such molasses, sucrose (Gonen and Aksu, 2009) and
sugarcane baggase (Charumathi and Nilanjan, 2010; Das et al., 2010; Das et al., 2011) for dye
removal renders this process more economical.
On the contaray, the rate of decolorization is decreased by the presence of carbon source for
example Brevibacillus laterosporus does not decolorize dye in the presence of carbon source while

16
decolorzation is increased in the presence of nitrogen source like peptone and yeast (Kurade et al.,
2011). The amount of carbon source is also crucial. It should not be too much high that
microorganisms totally rely on it and ignore dye and also to reduce biomass (Mohana et al., 2008).
Researches have been done to make it possible that microorganisms completely rely on
dyes as carbon and nitrogen source. This is done through the process of acclimatization which
involves a slow increase and decrease in concentration of dye and carbon source respectively until
microorganisms completely rely on dye alone. The example includes the growth of Saccharomyces
cerevisiae (Jadhav et al., 2007) Sphingomonas paucimobilis (Ayed et al., 2011) and consortium
of Pseudomonas, Arthrobacter and Rhizobium (Ruiz-Arias et al., 2010) in the presence of Methyl
Red and Acid Orange 7.
The presence of nitrogen source also plays a key role in the process of decolorization as
their metabolism regenerates NADH (Saratale et al., 2009a). Microorganisms rely on different
nitrogen sources to increase rate of decolorization. A consortium of P. polymyxa, M. luteus and
Micrococcus sp. utilize yeast extract as nitrogen source to decolorize Reactive Voilet 5 (Moosvi
et al., 2007). Consortium of Proteus vulgaris and M. glutamicus utilized agricultural by-products
such as rice husk, rice straw in place of pure substrates like peptone and beef extract to enhance
decolorization rate of Scarlet R (Saratale et al., 2009a).
3. Salinity, dye concentration, pH, temperature and oxygen
The decolorization ability of microorganisms decreases under saline environments as they do
not grow well above 3000 mg/L concentration of sodium (Anjaneya et al., 2011). Some
halotolerant bacteria are reported who degrade dye under high salt concentrations (Meng et al.,
2012). Decolorization of Reactive Black 5 is done by Exiguobacterium acetylicum,

17
Exiguobacterium indicum and Staphylococcus gallinarum in a culture with 60,000 mg/L
concentration of NaCl (Chen et al., 2012).
The decolorization of dye is also affected by the concentration of dye. A decrease in the
decolorization rate of Metanil Yellow by Lysinibacillus sp. from 100% to 62% occurs with an
increase in dye concentration from 200 to 1000 mg/L (Anjaneya et al., 2011).
Enzymatic activity and adsorption is affected by change in pH. It also affects the solubility
of the dye and color of the solution. A variation in the adsorption capacity of Candida tropicalis
of Basic Violet 3 occurred from 45%, 85%, and 33% at pH 3, 4, and 9 respectively (Das et al.,
2011).
Microbial growth and enzyme production is affected by temperature and consequently the
rate of decolorization. A variation in the decolorization rate of 300 mg/L Orange MR by
Micrococcus sp. was observed from 60%, 80%, and 42% at 30, 35, and 45◦C respectively (Rajee
and Patterson, 2011).
The biodegradation of azo dyes is either favored or inhibited by the presence of oxygen.
Mass and oxygen transfer is increased between the cell and medium because of shaking and for
aerobic mechanism of degradation, enzymatic activity is dependent on the presence of oxygen. A
decrease in the decolorization time of Methyl Red by Micrococcus sp from 24 to 6 hours occurred
due to presence of oxygen (Olukanni et al., 2009).
Biological systems involved in the decolorization of azo dyes
A variety of microorganisms have been used for decolorization and mineralization of azo
dyes which includes algae, yeast, filamentous fungi, and bacteria. Consortia of microorganisms
has also been utilized for this purpose.

18
Azo dyes degradation by algae
Azo dyes present in water bodies do not affect algal growth and algae grow efficiently over
industrial effluents (Acuner and Dilek, 2004; Dubey et al., 2011). Thus, they can be used to
degrade azo dyes. Algae do not need additional carbon source like bacteria and fungi (Omar, 2008)
as they use sunlight as energy source and obtain carbon and nitrogen from air. Algae degrade dyes
either by enzymatic degradation, adsorption or both. They can also degrade dyes by induced
azoreductase resulting in the breakage of azo bond and aromatic amines are produced (Omar, 2008;
El-Sheek et al., 2009; Priya et al., 2011). Decolorization process sometimes may also involves
oxidative enzymes (Priya et al., 2011).
The effectiveness of adsorption mainly relies on structure of dye, the specie of algae (Omar,
2008) and pH (Mohan, 2008). Both living and non-viable form of algae can be used for
discoloration of azo dyes (Sivarajasekar et al., 2009; Lim et al., 2010). High uptake of dye
molecules occurs at low pH because of electrostatic forces of attraction between positively charged
biomass and negatively charged dye anions (Srinivasan and Viraraghavan, 2010). Scenedesmus
quadricoda (Ergene et al., 2009), Chlorella vulgaris (Aksu and Tezer, 2005) and non-viable
Spirogyra sp. (Sivarajasekar et al., 2009) showed high adsorption capacity at pH 2. Immobilized
microalgae can also be used for decolorization of azo dyes. In comparison to suspended algae, C.
vulgaris (Chu et al., 2009) and S. quadricoda (Ergene et al., 2009) immobilized on alginate can
remove high percentage of dyes from textile effluent (Ergene et al., 2009).
19
Azo dyes degradation by yeast
Yeast are more effective in decolorization of azo dyes because of their greater potential to
accumulate dyes, fast growth and to with stand unfavorable conditions (Martorell et al., 2012).
Yeast strains also decolorize dyes by adsorption (Yu and Wen, 2005; Aksu and Donmez, 2005),
enzymatic degradation or both. Dyes readily adsorbed on yeast biomass at low pH. For example,
Candida albicans accumulate Direct Violet 51 at maximum level at pH 2.5 (Vitor and Corso,
2008) while C. tropicalis accumulates maximum amount of Violet 3 at pH 4.0 (Charumathi and
Nilanjana, 2010). The extent of adsorption is different for different azo dyes on same strain of
yeast for example C. tropicalis adsorbed 94% of Remazol Blue and 44% of Reactive Red
(Donmez, 2002) while decolorization rate for Reactive Blue and Reactive Red was 63% and 90%,
respectively by Trichosporon akiyoshidanum (Pajot et al., 2007).
The process of dye degradation by yeast mainly depends on the growth process (Yang et
al., 2008; Lucas et al., 2006) and its primary metabolism (Martorell et al., 2012). Glucose is
essential for the growth of yeast strains. The process of degradation of azo dyes depends on the
availability of carbon source (Omar, 2008; Waghmode et al., 2011). The degradation of azo dyes
in yeast is done by oxidases and reductases which include MnP (Manganese dependent
peroxidase), Tyr (Tyrosinase) (Halaburgi et al., 2011; Pajot et al., 2011; Aghaie-Khouzani et al.,
2012; Martorell et al., 2012;) and NADH-DCIP (Nicotinamide adenine dinucleotide dependent
2,6-dichlorophenolindophenol) reductase (Waghmode et al., 2011).
The mechanism of decolorization is influenced by pH. Increase in pH from 2.0 to 7.0 results
in almost complete decolorization of Reactive Blue 221 and Reactive Red 141 from 63% and 90%
respectively (Pajot et al., 2007). Yeast can degrade dyes under both aerobic and anaerobic

20
conditions. The decolorization of a mixture of various dyes which includes Remazol Red, Golden
Yellow HER, Rubine GFL, Scarlet RR, Methyl Red, Brown 3 REL and Brilliant Blue by
Galactomyces geotrichum was higher under aerobic condition as compared to the anaerobic and
anoxic condition (Waghmode et al., 2011) while decolorization of Reactive Blue by C. tropicalis
was done better under static condition (Liu et al., 2011).
Azo dyes degradation by filamentous fungi
Filamentous fungi found in every habitat and they can easily grow on every carbon and
nitrogen source. Due to low cost and their ability to completely mineralize dye they become an
attractive option to degrade dye (Husain and Husain, 2007; Asgher et al., 2008). They usually
decolorize dye by adsorption or enzymatic degradation. Low pH favors the mechanism of
adsorption (Erden et al., 2011). Increase in temperature increases the adsorption capacity of fungal
cells which is due to increased surface activity and kinetic energy of dye molecules (Bakshi et al.,
2006; Kaushik and Malik, 2009). However, at very high temperature decolorization is decreased
due to deactivation of some active sites or deactivation of absorbent surface (Iqbal and Saeed,
2007; Erden et al., 2011).
The enzymes used by filamentous fungi to degrade azo dyes include peroxidases and
phenoloxidases which avoid the production of amines during reduction of dye (Pazarlioglu et al.,
2005; Svobodova et al., 2007; Erkurt et al., 2007; Husain and Ulber, 2011). They decolorize dye
well under aerobic conditions as compared to the anaerobic condition. Better oxygen transfer takes
place at high shaking speed due to greater transfer of oxygen for example degradation of Drimaren
Brilliant Blue by Tramates villosa and Pleurotus sanguineus (Machado et al., 2006).

21
The addition of carbon and nitrogen affects the process of decolorization. The study of
decolorization process of Phanerochaete chrysosporium (Urek and Pazarligolu, 2005; Karimi et
al., 2006) and Bjerkandera sp (Axelsson et al., 2006) indicated that higher rate of decolorization
was achieved when they grow in media where concentration of nitrogen is limited.
Azo dyes degradation by bacteria
Bacteria are more rapidly used to degrade dye because they are easily cultured, grow well
under both anaerobic and aerobic conditions and facultative in nature as well. They can withstand
extreme conditions of temperature and salinity and have a great variety of oxidoreductases. The
reduction of azo bond by bacteria is generally tough under aerobic conditions (Dafale et al., 2009).
However, some bacterial strains are able to degrade dye under aerobic conditions by using oxygen
insensitive or aerobic azoreductases (Nachiyar and Rajakumar, 2005; Lin and Leu, 2008). A
reduction in the decolorization time of reactive dyes by Micrococcus sp. from 24 hours to 6 hours
was reported when the condition was changed from anaerobic to aerobic respectively (Olukanni
et al., 2009). The synthesis of aromatic amines does take place by the degradation of dyes under
aerobic conditions as compared to the microaerophilic conditions which means the cleavage of azo
bond is followed by complete mineralization of amines into less products by oxidation (Wang et
al., 2012).
Bacteria degrade azo dyes with the help of three oxidative enzymes which include Laccase,
Tyrosinase and veratryl alcohol peroxidases. The isolation of laccases generally takes place from
plants and fungi, but fungal laccases are mostly used for various biotechnological processes. As
fungal laccases show sensitivity towards high pH (Xio et al., 2003) and chlorides (Jimenez-Juarez
et al., 2005) bacterial laccases are mostly used because of their stability at high temperature, pH
and salinity (Van Bloois et al., 2010; Santhanam et al., 2011).

22
The industrial effluents usually have high salt concentrations and temperature as well, so
application of extremophiles is a better option for the process of bioremediation (Ertugrul et al.,
2009; Gao et al., 2010; Amoozegar et al., 2011). The halotolerant strains which are able to degrade
dye under high salt concentrations include Staphylococcus, Exiguobacterium (Chaen et al., 2011)
Bacillus firmus and A. hydrophila (Ogugbue et al., 2011).
Azo dyes degradation by using genetically modified microorganisms and
enzymes
The ecofriendly methodology for the degradation of azo dyes in wastewater i.e.,
bioremediation is more economical but different parameters of wastewater such as temperature,
pH, presence of various salts and organic compounds results in damaging the microbial cells and
their enzymes. There is a need to develop such microorganisms and enzymes which are highly
stable and economical as well. Various techniques of molecular biology such as cloning,
heterologous expression, random mutagenesis, site directed mutagenesis, gene recombination
techniques, directed evolution, rational design and metagenomics are helpful in this regard.
Moreover, advances in the field of genetic engineering and microbial genetics make it possible to
express any gene of interest in a suitable host.
Cloning of Lac gene (lac48424-1) of white rot fungi Trametes sp. 48424 was done in Pichia
pastoris. The purified product (rLAC48424-1) decolorizes Methyl Orange and Bromophenol Blue
with greater efficiency in comparison to other laccases (Fan et al., 2011).
The site directed mutagenesis of bacterial dye decolorizing peroxidase from
cyanobacterium Anabena sp. strain PCC7120 (AnaPX) which is sensitive to H2O2 was done. The
resulting product was more stable in presence of H2O2 and have increased dye degrading ability
which was 96% in case of Reactive Black 5 (Ogola et al., 2011).

23
Azo dyes degradation by using consortia
The degrading product of dye by single microbial strain are aromatic amines which are
more toxic and difficult to degrade as compared to the original dye. Each microbial strain is
specific for a dye. So, by building microbial consortia complete degradation of azo dyes will occur
by the combination of various enzymatic processes (Asgher et al., 2007; Joshi et al., 2010). The
dye can be attacked by different sites when different strains are used, and degradation products
synthesized by one strain can be used by other strain results in the complete mineralization of the
dye (Saratale et al., 2009). The presence of other microorganisms influences the enzymatic activity
of a single strain and degradation ability of consortia is greater than its constituent strains.
A consortium of Pseudomonas sp. SUK1, Pseudomonas sp. LBC2, and LBC3, decolorizes
dyes efficiently in comparison to Pseudomonas sp. SUK1 alone while Pseudomonas sp. LBC2 and
LBC3 have no biodegrading ability alone (Jadhav et al., 2010).
In order to obtain an effective system to decolorize dyes the proportion of every
microorganism is very important in the construction of consortium. For example, a consortium
comprising of 0.023% S. paucimobilis, 0.459% Bacillus sp. and 0.516% S. epidermidis was able
to decolorize Congo Red completely and with 95% COD removal (Ayed et al., 2010).
The combination of aerobic and anaerobic systems in the form of a consortium makes a
promising system for decolorization of azo dyes. The anaerobic strains cleave the azo bond by
reduction which is shown by decolorization (Yemashova et al., 2009) while aerobic strains play
their role in the complete mineralization of aromatic amines (Forss and Welandar, 2011; Jonstrup
et al., 2011; Koupaie et al., 2011). A consortium comprising of Enterococcus casseliflavus,
Enterobacter clocae (NAR-1) degrade Orange II under microaerophilic conditions into sulphanilic
acid while individual strains are not able to degrade acid even after 5 days (Chan et al., 2011).

24
Condition of dye pollution in Pakistan
Textile industry is the major industry in Pakistan and we earn major revenue by exporting
the products of this industry. But apart from its major contribution to our growing economy it
becomes a source of causing water pollution. Wastewater that is generated at various steps in
textile industry have high pH, temperature, detergents, suspended and dissolved solids, leveling
agents, toxic colors and alkalinity. The major pollutants produced by the textile industry includes
recalcitrant organics, toxic colors, toxicants, surfactants and chlorinated compounds (AOX). In
Pakistan, this problem of water pollution is severely high due to lack of wastewater management
system by industries as well as the ignorant behavior of concerning industries i.e., environment
and sanitation (Noreen et al., 2019).
Untreated textile effluent, is being discharged into rivers and canals which pose toxic
effects to humans, plants and animals. Hepatitis is major problem caused by water pollution since
last two decades. According to recent reports every third individual is suffered from this fatal
disease in Pakistan. Moreover, a major problem that arise these days is the use of this wastewater
for the cultivation of crops which has serious impact on human health (Azizullah et al., 2010).
As the various physiochemical methodologies used to treat textile effluent are costly and
less efficient and produced secondary waste which is toxic as well so there is need of time to treat
such effluents with bioprocessing which employs the use of various microorganisms to degrade
pollutants. These processes are cost effective and environment friendly as well.

25
Aims and objectives
The main aims of this study are
• To isolate and characterize azo dye degrading bacteria.
• To culture and maintain the microorganisms in laboratory conditions.
• To determine the optimal growth conditions of the isolated bacteria.
• To identify the isolated bacteria.
• To determine the optimal conditions for degradation of azo dyes.
• To ascertain the potential of isolated bacteria to degrade multiple dyes.
• To study the effect of decolorization on the growth of bacteria.
• To study how consortium of bacteria affects decolorization rate.
• To analyze dye degrading products through TLC, HPLC, FTIR and GC-MS.
• To study biodecolorization at large scale.
• To determine the microbial toxicity and phytotoxicity of biodecolorized effluent.

26
MATERIALS AND METHODS
Sample collection
Industrial wastewater samples were collected from Kot Lakhpat industrial estate, Lahore.
The samples were collected in autoclaved screw capped bottles. Physiochemical parameters such
as temperature, pH, as well as color of samples were also noted at the time of sample collection.
Sample enrichment
Wastewater samples were enriched by adding 1 ml of each sample to 100 ml of L-broth
prepared in 250 ml Erlenmeyer flasks and then incubated at 37oC in the shaker at 150 rpm for 24
hours. L-broth was prepared by dissolving tryptone (10g), yeast extract (5g) and NaCl (5g) in 1000
ml of distilled water. The pH of the medium was adjusted to 7. The autoclaving was done at 121oC
for 15 minutes at 15 psi.
Dyes
The dyes used in the recent research worked were named Synazol Red HF-6BN and
Sumifex Tourqi blue obtained from a textile industry and decolorization was measured by
measuring the absorbance of decolorized medium at 465 nm (Ilyas and Rehman, 2013).
Isolation of azo dyes degrading bacteria
In order to isolate azo dye degrading bacteria serial dilutions of the enriched samples were
made i.e., 10-1, 10-2, 10-3 and 10-4. The bacteria were isolated by plating 50 µl of each dilution on
the L-agar plates. Each dilution was plated twice, and plates were then incubated under aerobic
and anaerobic (by using anaerobic jar along with anaerobic sachet) conditions to isolate respective

27
bacteria. L-agar medium was prepared by dissolving tryptone (10g), yeast extract (5g), NaCl (5g)
and agar (15g) in 1000 ml of distilled water. The pH of the medium was adjusted to 7.
Evaluation of dye degrading potential
The bacterial isolates were cultured in 100 ml of mineral salt medium (MSM) prepared in
250 ml Erlenmeyer flask and incubated for 4 days at 37 oC. The composition of MSM is (g/L):
(NH4
)SO4
, 0.28; NH4
Cl, 0.23; KH2
PO4
, 0.067; MgSO4
·7H2 O, 0.04; CaCl2
·2H2
O, 0.022;
FeCl3
·6H2 O, 0.005; yeast extract, 0.2; NaCl, 0.15; NaHCO3
, 1.0 and 1ml/L of a trace element
solution containing (g/L): ZnSO4
·7H2
O, 0.01; MnCl2
·4H2 O, 0.1; CuSO4
·5H2 O, 0.392;
CoCl2
·6H2
O, 0.248; NaB4
O7
·10 H2
O, 0.177; and NiCl2
·6H2
O, 0.02 (Parshetti et al., 2006) with
glucose and yeast extract (1% each) used as carbon and nitrogen source respectively. The medium
was supplemented with dye at a concentration of 50 mg/L.
Aliquot was taken at the time of
incubation and after 4 days of incubation, centrifuged at 3000 rpm and optical density was
measured at 465nm to record initial and final absorbance respectively. The percentage
decolorization of azo dyes in the sample was calculated by the following formula
Decolorization (%) = Initial absorbance - Final absorbance/Initial absorbance
Morphological and biochemical characterization of bacterial isolates
The identification of bacterial isolates was done on the basis of different morphological
parameters such as colony shape, colony size, margin, elevation, and light transparency and
biochemical tests such as Gram staining, spore staining, catalase test etc (Cappuccino et al., 1996).

28
Determination of optimum growth conditions of bacterial isolates
The optimum growth conditions i.e., temperature and pH of the selected bacterial isolates
were determined.
Optimum temperature
To determine the optimal temperature, bacterial isolates were grown on four different
temperatures. They were cultured in 10 ml L-broth taken in a test tube which was then autoclaved
and cooled at room temperature. An inoculation of the medium was done with 50 µl of bacterial
cells which were in their log phase. The tubes were incubated at different temperature i.e., 20oC,
30oC, 37oC, and 45oC after inoculation. After 24 hours of incubation optical density was taken at
600 nm by using spectrophotometer. To plot a graph temperature was taken on X- axis with their
respective cell densities on Y- axis.
Optimum pH
To determine the optimal pH, bacterial isolates were grown on six different pH. They were
cultured in 10 ml L-broth taken in a test tube whose pH was adjusted to 5, 6, 7, 8, 9 and 10 and
was then autoclaved and cooled at room temperature. An inoculation of the medium was done with
50 µl of bacterial cells which were in their log phase. The tubes were incubated at respective
optimal temperature of bacterial isolate after inoculation. After 24 hours of incubation optical
density was taken at 600 nm by using spectrophotometer. To plot a graph pH was taken on X- axis
with their respective optical densities on Y- axis.

29
Growth curves
To determine the growth curves of bacterial isolates they were grown in L-broth. It was
prepared in 250 ml Erlenmeyer flasks for this purpose. The autoclaving of the medium was done,
and it was cooled at room temperature. About 1 ml log phase bacterial culture was used to inoculate
this medium. The optical density was measured at the time of inoculation and after every 4 hours
up to 28 hours at 600 nm by using spectrophotometer. To plot a graph, time interval was taken at
X-axis with respective optical densities on Y-axis.
Molecular characterization of bacterial isolates
DNA isolation (Masneuf-Pomarade et al., 2007)
The following protocol was followed for DNA extraction of bacterial isolates. The growth
of bacterial cultures was made in 50 ml L-broth at 37oC on a rotary shaker at 130 rpm for about
24 hours. The pellet was obtained by centrifugation of the entire medium at 6,000 rpm for 10
minutes. The washing of the pellet was done with 1.5 ml of sterile distilled water and was again
centrifuged on the same speed. The pellet was then dissolved in 300 µl of lysis buffer (1% SDS
and 0.1% mercaptoethanol) and incubated at 37oC for 1 hour. After that, disruption of the cells
was made with vigorous vortexing. Then centrifugation was done at 14,000 rpm for 10 minutes to
separate the disrupted cells and supernatant. The supernatant was then taken in a fresh eppendorf,
mixed with 500 µl phenol-chloroform-isoamylalcohol (25:24:1) by vortexing of 3 minutes and
again centrifuged at 14,000 rpm for 5 minutes. About 500 µl of chloroform-isoamylalcohol (24:1)
was then added, vortexed and centrifuged at 14,000 rpm for 5 minutes. The supernatant was then
taken in a new eppendorf and double amount of absolute ethanol (100%) was added to precipitate

30
out DNA. The pellet of DNA was then washed with 70% ethanol after a centrifugation of 10
minutes at 14,000 rpm. The pellet obtained was then dried at room temperature, then suspended in
50 µl sterile distilled and stored at -20oC till further use.
Agarose gel electrophoresis
To make 1% agarose gel solution, 1 g of agarose was dissolved in 20 ml of 5X tris-borate-
EDTA buffer (10.0g tris base, 1.48g boric acid, 1.08 ml of 0.5 M EDTA and distilled water making
volume up to 200 ml, pH 8.0) and make up the volume up to 100 ml by using distilled water. The
solution was then boiled to make it clear. An addition of 2 µl of ethidium bromide (10 mg/ml) was
made to the gel and then it was poured into gel casting tray and comb was inserted to make wells.
The comb was removed when the gel was solidified. The gel tray was then placed in gel tank and
tris-EDTA buffer (160 ml of tris borate-EDTA buffer in 40 ml distilled water) was added in it.
About 5 µl of isolated genomic DNA was then mixed with 3 µl of gel loading dye (0.25%
bromophenol blue and 40% w/v sucrose dissolved in distilled water) and was loaded into the wells
made on the gel. The DNA marker (GeneRuler 100bp DNA ladder #SM0323 Fermentas) was also
loaded to estimate the size of DNA. A voltage of 100 volts for the gel to run. The power supply
was switched off after tracking dye reached the end of gel. The gel was then visualized by using
UV transilluminator (WAEL TEC UV transilluminator) and DNA appeared as pink fluorescent
bands. A Gel Doc System (WAEL TEC Dolphin-Doc) was used to make picture of DNA bands.

31
PCR amplification
The amplification 16S ribosomal DNA region was done by using universal bacterial
primers 8F (5-AGAGTTTGATCCTGGCTCAG-3) and 1492R (5-
GGTTACCTTGTTACGACTT-3) (Turner et al., 1999). A reaction mixture of 25 µl of distilled
water containing 2.5 µl of each primer (20 pmol), 6 µl of genomic DNA (5 µg/ml) (Amersham
Pharmacia, Piscataway, NJ, USA) was used to perform amplification reactions. PCR was
performed by initial denaturation at 95oC for 5 minutes, followed by 35 cycles of denaturation at
95oC for 1 minute, annealing at 55oC for 1 minute and extension at 72oC for 1 minute, with a final
extension at 72oC for 10 minutes.
Gene cleaning
Gene cleaning of PCR products was done with Fermentas Gene Jet Gel Extraction
kit (#K0691) according to manufacturer’s instructions (Khan et al., 2015).
Sequencing and submission of sequences to GenBank
The amplified and gene clean products of DNA were submitted at 1st Base, Malaysia for
sequencing. Nucleotide BLAST search program at the NCBI website
http://ncbi.nlm.nih.gov/BLAST/ was used to analyze 16S rRNA gene sequence. The submission
of sequenced data was done to GenBank to obtain accession numbers of the respective bacterial
isolates.

32
Construction of phylogenetic tree
The sequences showing similarity were aligned and phylogenetic tree were constructed
with the help of neighbor joining method in MEGA 7 software (Kumar et al., 2016) taking 1000
as bootstrap value.
Optimization of biodegradation conditions
The ability of selected bacterial strains to biodegrade azo dye was checked at different
temperatures i.e., 20, 30, 37, and 45° C and pH i.e., 5, 6, 7, 8, 9, and 10 in MSM broth. Moreover,
the effect of incubation condition (static and shaking), carbon (saw dust, sugarcane bagasse and
wheat bran) and nitrogen sources (yeast extract, beef extract and peptone), inoculum percentage
(2%, 4%, 6%, 8% and 10%) and dye concentration (3, 5, 7, 10, 20, and 50 mg/L) was also checked.
In order to observe the effect of temperature and pH, three sets of 100 ml Erlenmeyer flasks
were prepared for each bacterial strain in which 50 ml of MSM was dispensed and labelled for
respective temperature and pH. Flasks were then inoculated with almost equal number of cells of
respective bacterial strain and then incubated at labelled temperature and pH for 4 days. The
percentage decolorization of the dye was calculated after 4 days with the formula mentioned above.
To find the optimum incubation condition for maximum decolorization the cultured flasks
were incubated at static and shaking conditions and after 4 days decolorization percentage was
calculated. The MSM medium was supplemented with 1% of given carbon and nitrogen source to
find out which carbon and nitrogen source gives the maximum percentage of decolorization.

33
To check the effect of inoculum percentage on dye decolorization the inoculum percentage
was slightly increased in comparison to the volume of the medium. The effect of dye concentration
was also monitored to find out the minimum inhibitory concentration of the dye for bacterial
strains. The various concentration of the dye used were 3, 5, 7, 10, 20, and 50 mg/L.
Decolorization of multiple dyes
The bacterial strains were checked for their ability to degrade a mixture of dyes as textile
effluents contain various dyes. For this purpose, bacterial strains were grown in 100 ml of MSM
medium in 250 ml Erlenmeyer flask containing a mixture of various dyes and incubated at
respective optimum dye decolorizing temperature. The mixture of dyes contains Congo Red,
Methyl Red, Phenol Red, Brilliant Black and Navy Blue at a concentration of 50 mg/L. The
decolorization percentage was calculated after 5 days of incubation.
Growth Decolorization relationship
The effect of decolorization was also monitored on the growth of bacterial strains. For this
purpose, bacterial strains were grown in 100 ml of MSM medium in 250 ml Erlenmeyer flask and
incubated at respective optimum dye decolorizing temperature. The dye concentration was kept
constant at 50 mg/L. An aliquot of sample was taken after every day till 5 days and optical density
was calculated at 600 nm to find out a growth ratio. Decolorization was calculated by measuring
the optical density of supernatant at 465 nm.

34
Consortium studies
Development of consortium
Each bacterial isolate was inoculated in 10 ml of LB broth in a test tube and incubated at
their respective optimum temperature for 24 hours. The optical density of each culture was
adjusted to 0.5 after 24 hours with autoclaved water. Then 100 ml of LB broth prepared in 250 ml
Erlenmeyer flasks was inoculated with 0.5 ml of optical density adjusted culture of those bacteria
whose consortium was desired to be made and then incubated at 37 oC.
Aerobic consortium
The consortium of aerobic isolates was developed as mentioned above and 1 ml of this
consortium was used to inoculate 100 ml of MSM medium which was supplemented with dye at
a concentration of 50 mg/L. The medium was then incubated at 37 oC for 5 days. Aerobic strains
were also grown individually to compare the dye decolorization rate.
Anaerobic consortium
The consortium of anaerobic isolates was also developed as mentioned above and 1 ml of
this consortium was used to inoculate 100 ml of MSM medium which was supplemented with dye
at a concentration of 50 mg/L. The medium was then incubated at 37 oC for 5 days under anaerobic
conditions. Anaerobic strains were also grown individually to compare the dye decolorization rate.
Mixed consortium
The consortia of aerobic and anaerobic isolates were developed as mentioned above.
Firstly, 100 ml of MSM medium which was supplemented with dye at a concentration of 50 mg/L

35
was inoculated with 1 ml of culture from anaerobic consortium incubated at 37oC for 2.5 days
under anaerobic conditions. After this period, the medium was further inoculated with 1 ml of
culture from aerobic consortium and then incubated at 37oC for further 2.5 days under aerobic
conditions. Dye decolorization rate of mixed consortium was compared with that of aerobic and
anaerobic consortium.
Analysis of dye degraded products
Sample preparation
In order to extract metabolites for analysis, 100 ml of dye degraded medium was mixed
with an equal volume of ethyl acetate and organic phase was dried over anhydrous rated Na2SO4
and concentrated in rotary evaporator at 4°C. The concentrated sample was then mixed with 1ml
to 2 ml of HPLC grade methanol.
Thin layer chromatography (TLC)
In order to analyze the biodegraded products of dye, TLC was performed. Silica gel F-254
TLC aluminum sheet (MERCK) which was 0.2 mm gel thick was used in this experiment. The
solvent system comprising of n-propanol, methanol, ethyl acetate, water, and glacial acetic acid in
the ratio 3:2:2:1:0.5 (Kalyani et al., 2008) was used to perform TLC. The results were visualized
under UV illuminator at wavelength of 254 and 366 nm.
High performance liquid chromatography (HPLC)
HPLC was performed to analyze the dye and its biodegraded products. HPLC (Waters
model no 2690) was performed with C18 column having symmetry 250 x 4.6 mm using methanol

36
as mobile phase with a flow rate of 1.0 ml/minute for 15 min and UV detector at 254 nm (Telke et
al., 2009).
Fourier transform infrared spectroscopy (FTIR)
In order to observe the difference in the structure of dye before and after decolorization
FTIR was performed. The FTIR analysis was done in the mid IRF region of 400-4000 /cm. Prior
to analysis sample was mixed with pure KBr in the ratio of 5:95 and pellet were then fixed in the
holder for analysis (Saratale et al., 2009b).
Gass Chromatography/Mass Spectrometry (GC/MS)
Dye degraded products were extracted with ethyl acetate from inoculated and un-
inoculated dye augmented MS broth for GC-MS analysis. A gas chromatograph system (GCMS-
QP2010 Ultra, Shimadzu) equipped with capillary column (DB-5ms) was used to analyze products
before and after bacterial treatment. The samples were diluted 1:100 and injected 1.0 µl sample
into GC-MS in split mode with injector temperature of 290°C. Helium was used as a carrier gas
with flow rate of 1.02 ml/min under 54.9 KPa inlet pressure. The column temperature was set to
50°C and hold for 1 min with subsequent increase to 280°C with ramp rate of 30°C/min without
holding and finally to 310°C with ramp rate of 15°C/min by holding it for 8 min. The peaks were
identified by comparing with NIST27.LIB mass spectra library of GC-MS database.
Dye degradation on large scale
An experiment was designed to check the degradation of azo dyes on large scale. For this
purpose, three plastic containers were used. In the first container there was 10 L of tap water along
with dye used as negative control, second container have 10 L of industrial wastewater along with
dye used as positive control while in the third container there was 10 L of industrial wastewater

37
along with 1.5 L of bacterial culture and dye. The experiment was conducted at room temperature
and concentration of the dye was maintained at 50mg/L. The samples were taken from these
containers with an interval of 2 days up to 8 days and percentage decolorization of dye was
calculated with the mentioned formula.
Microbial toxicity
The decolorized dye sample was checked for its toxic effects on soil microflora which have
importance in agriculture i.e., B. subtilis, B. megaterium and B. cereus (Mali et al., 2000). For this
purpose, L-agar plates were prepared on which these bacteria were swabbed. A well of 2 mm was
made in the center of plates which was then filled with dye decolorized broth. An incubation of 24
hours was given to plates at 37°C. The index of toxicity of decolorized sample was measured by
the zone surrounding the well.
Phytotoxicity
To analyze the effect of treated wastewater on the growth of plants, the six seeds of Vigna
radiata (mung beans) were cultivated in autoclaved soil on lab scale. The control pots (n=2) were
those which were watered with tap water and untreated wastewater while experimental pots (n=2)
were those which were watered with bacterially treated wastewater. The plants were grown for
about a period of 10 days at room temperature under 1:1 light and dark period. The comparison of
control and experimental plants were made after 10 days to record the effect of dye on plant
growth.
Statistical analysis
Every experiment was repeated three times for result authentication. The results were subjected
to standard deviation, mean and analysis of variance (ANOVA).

38
RESULTS
Physiochemical characteristics of wastewater samples
The physiochemical characteristics of wastewater collected from industrial area of Sheikhupura
and Lahore have been summarized in Table 1.
Table 1: Physiochemical parameters (temperature, pH) of wastewater collected from industrial
area of Sheikhupura and Lahore.
Sample Location Temperature °C pH Color Smell
CPL-1 ICI Industrial
effluents (Lahore)
32 8 Light yellow No smell
CPL-2 Sewage sample-A
Sheikhupura road
36 7 Black muddy Foul smell
CPL-3 Ghee industry
Sheikhupura road
34 6 Blackish No smell
CPL-4 Paper Mills
Sheikhupura road
28 6 Transparent,
Black particles
No smell
CPL-5 Bata leather
processing plant
Sheikhupura road
30 9 Reddish pink Rotten egg
smell
CPL-6 Sewage sample-B
Sheikhupura road
34 7 Muddy Muddy smell
CPL-7 Steel industry
(Lahore)
28 10 Black No smell
CPL-8 Paint industry
(Lahore)
26 10 Blue No smell
CPL-9 Textile industry
(Lahore)
36 8 Maroon No smell

39
Isolation and evaluation of azo dye degrading potential of bacteria
For the isolation of dye degrading bacteria, the samples collected from industrial area of
Sheikhupura and Lahore were enriched, serially diluted and 50µl of each sample were spread on
L-agar plates in duplicate. After incubation at 37oC for 24-48 hours under aerobic and anaerobic
conditions, different bacterial colonies obtained were then grown in MSM at dye concentration of
50mg/L to evaluate their dye degrading potential. A total of 7 isolates i.e., 4 anaerobic and 3
aerobic were selected for further studies on the basis of their dye degrading potential (Table 2)
(Fig. 6).
Morphological and biochemical characterization of bacterial isolates
The different morphological characteristics of the bacterial isolates e.g., size, shape and
color of the colonies along with elevation, margin and texture were noted on L-agar plates. The
morphological and biochemical characteristics of bacterial isolates are mentioned in Table 3.

40
Table 2: Decolorization (%) of bacterial isolates, isolated from 9 samples.
S. No. Bacterial isolate Decolorization (%)
Anareobic
1. 1b 71
2. 1m 70
3. 1p 42
4. 4e 49
5. 1f 57
6. 2p 73
7. 3h 45
8. 3i 34
9. 3j 47
10. 4m 76
11. 3g 55
12. 4v 79
13. 1c 21
14. 2i 62
Aerobic
1. 1g 23
2. 2f 32
3. 3c 82
4. 3d 78
5. 4k 59
6. CBL-2 83
7. CBL-4 64

41
Figure 6: Change in color of Synazol Red HF-6BN and Sumifex Tourqi blue as compared to the
control in flask containing culture of bacterial strain (a) 1b (b) 1m (c) 2p (d) 4v (e) 3c (f) 3d (g)
CBL-2 isolated from the dye contaminated wastewater.
(a) (b)
(c)
(g) (e)
(e) (d)
(f)
(c)

42
Table 3: Morphological and biochemical characteristics of bacterial isolates. Isolate Size Shape Color Elevatio
-n
Edges Texture Gram
staining
Spore
staining
Cat Ma-
n
Pig Fru Ind VP MR Cit Nit
Ure
1b 1
mm
Round Cream Flat Smooth Mucoid + cocci NA + - - + NA NA NA NA NA NA
1m 1
mm
Round Cream Flat Smooth Mucoid + cocci NA + - - + NA NA NA NA NA NA
2p 4mm Round Off
white
Elevated Smooth Dry + rods + NA + NA NA NA + NA NA NA NA
4v 3
mm
Round Cream Flat Smooth Mucoid + cocci NA + - - + NA NA NA NA NA NA
3c 1
mm
Round Pale
yellow
Flat Smooth Mucoid - rods NA NA NA NA NA - - - + - -
3d 1
mm
Round Pale
yellow
Flat Smooth Mucoid - rods NA NA NA NA NA - - - + - -
CBL-2 1
mm
Round Yellow Raised Smooth Mucoid - rods NA NA NA NA NA - - - - - -
Cat=Catalase, Man=Mannitol, Pig= Pigment ptoduction, Fru=Fructose fermentation, Ind=Indole production, VP = Voges Proskauer,
MR=Methyl Red, Cit= Citrate utilization, Nit=Nitrate reduction, Ure=Urease, += Positive, - = Negative, + No result, NA=not applicable

43
Determination of optimum growth conditions of bacterial isolates
The optimum temperature, pH, and growth pattern of bacterial isolates were determined
to find out the conditions at which organisms grow at their full potential.
Optimum temperature
The selected bacterial isolates were grown at various temperatures and pH of was adjusted
at 7.0 for the optimization of growth conditions. The growth of all the six bacterial isolates i.e., 1b,
1m, 2p, 4v, 3c, 3d and CBL-2 was determined at different temperature i.e., 20oC, 30oC, 37oC and
45oC. A fair growth of bacterial isolated was observed on all temperatures but they grow optimally
at 37oC (Fig. 7 a and b).
Optimum pH
The isolates 1b, 1m, 2p, 4v, 3c, 3d and CBL-2 were grown on their optimum temperature
with different pH’s to determine the optimal pH. The pH of L-broth medium was adjusted to 5, 6,
7, 8, 9 and 10. All isolates grow optimally on neutral pH i.e., 7 (Fig. 8 a and b).
Growth pattern of bacterial isolates
In order to study the growth pattern of bacterial isolates i.e., 1b, 1m, 2p,4v, 3c, 3d and
CBL-2 L-broth medium was used, and optical density was recorded after every 4 hours till 28
hours (Fig 9 a to f.).
The growth of isolates 1b, 1m and 3d had a rise till 24 hours after that it became stable. The isolates
2p ,4v and CBL-2 clearly showed rise in growth until 20 hours and after that fall in growth pattern

44
was observed. The bacterial isolate 3c showed rise in growth till 16 hours before adopting a
stability in growth pattern.
Figure 7: Growth of bacterial strains at various temperatures after incubation of 16 hours (a) static
and (b) agitated conditions.
0
0.1
0.2
0.3
0.4
0.5
0.6
0.7
0.8
0.9
1
20 30 37 45
Op
tica
l d
ensi
ty a
t 6
00
nm
Temperature (◦C)
(a)1b
1m
2p
4v
0
0.2
0.4
0.6
0.8
1
1.2
1.4
1.6
20 30 37 45
Op
tica
l d
ensi
ty a
t 6
00
nm
Temperature (◦C)
(b) 3c
3d
CBL
-2

45
Figure 8: Growth of bacterial isolates at various pH after incubation of 16 hours in (a) static and
(b) agitated conditions.
0
0.1
0.2
0.3
0.4
0.5
0.6
0.7
0.8
0.9
5 6 7 8 9 10
Op
tica
l d
ensi
ty a
t 6
00
nm
pH
(a) 1b
1m
2p
4v
0
0.2
0.4
0.6
0.8
1
1.2
1.4
1.6
1.8
5 6 7 8 9 10
Op
tica
l d
ensi
ty a
t 6
00
nm
pH
(b)3c
3d
CBL-
2

46
0
0.05
0.1
0.15
0.2
0.25
0.3
0.35
4 8 12 16 20 24 28
Op
tica
l d
ensi
ty a
t 6
00
nm
Time (hours)
(a)
0
0.05
0.1
0.15
0.2
0.25
4 8 12 16 20 24 28
Op
tica
l d
ensi
ty a
t 6
00
nm
Time (hours)
(b)

47
0
0.02
0.04
0.06
0.08
0.1
0.12
4 8 12 16 20 24 28
Op
tica
l d
ensi
ty a
t 6
00
nm
Time (hours)
(c)
0
0.05
0.1
0.15
0.2
0.25
4 8 12 16 20 24 28
Op
tica
l d
ensi
ty a
t 6
00
nm
Time (hours)
(d)

48
0
0.2
0.4
0.6
0.8
1
1.2
1.4
1.6
1.8
2
4 8 12 16 20 24 28
Op
tica
l d
ensi
ty a
t 6
00
nm
Time (hours)
(f)
0
0.2
0.4
0.6
0.8
1
1.2
1.4
1.6
1.8
4 8 12 16 20 24 28
Op
tica
l d
ensi
ty a
t 6
00
nm
Time (hours)
(e)

49
Figure 9: Growth curves of bacterial isolates (a) 1b, (b) 1m, (c) 2p, (d) 4v, (e) 3c, (f) 3d and (g)
CBL-2 in LB medium at their respective optimum temperatures. Optical densities were taken at
600 nm after regular time interval.
Molecular characterization of bacterial isolates
The genomic DNA of the bacteria was isolated (Fig. 10) and amplified by using PCR (Fig.
11) with the help of general bacterial primers for molecular characterization. All the dye degrading
strains 1b, 1m, 2p, 4v, 3c, and 3d were identified with 16S rRNA gene sequencing. Three isolates
showed close homology with genus of Staphylococcus. The highest homology had been observed
with Staphylococcus lentus (1b, 1m and 4v) whereas another isolate was found to be homologous
to Bacillus subtilis (2p). Two strain showed close homology with genus Alcaligenes and they are
Alcaligenes aquatilis (3c) and Alcaligenes faecalis (3d). One specie showed homology with
Alishewanella sp. (CBL-2). The nucleotide sequences coding for the 16S rRNA gene of all the
isolates have been submitted to the GenBank database to obtain accession numbers which are
given in the Table 4 and phylogenetic tree were also constructed (Fig. 12 a to g and Fig. 13).
-0.2
0
0.2
0.4
0.6
0.8
1
1.2
1.4
1.6
1.8
4 8 12 16 20 24 28
Op
tica
l d
ensi
ty a
t 6
00
nm
Time (hours)
(g)

50
Figure 10: Lane M, DNA marker (GeneRuler 100bp DNA ladder #SM0323 Fermentas); Lanes
1b, 1m, 2p, 4v, 3c, 3d, and CBL-2 represent genomic DNA of bacterial isolates. The gel is 1%
agarose and stained with ethidium bromide.
Figure 11: Lane M, DNA marker (GeneRuler 100bp DNA ladder #SM0323 Fermentas); Lanes
1b, 1m, 2p, 4v, 3c, 3d, and CBL-2 represent PCR product of 16S rRNA gene of bacterial
isolates. The gel is 1% agarose and stained with ethidium bromide.
1b 1m 2p 4v 3c 3d CBL-2 M
bp
3000
2000
1500
1200
1000
900
800
700
600
500
400
300
200
100
1b M 1m 2p 4v 3c 3d CBL-2

51
Table 4: The nearest homolog and their percentage homology with the azo dye degrading bacterial
strains after 16S rRNA sequencing.
Bacterial isolate Nearest homolog % Homology Accession
numbers
1b Staphylococcus lentus 99% KX950707
1m Staphylococcus lentus 99% KX950708
2p Bacillus subtilis 97% KX950709
4v Staphylococcus lentus 95% KX950710
3c Alcaligenes aquatilis 98% KY009932
3d Alcaligenes faecalis 97% KY009933
CBL-2 Alishewanella sp. 88% JN546609
KC951997.1 Staphylococcus sp. SC1 16S ribosomal RNA gene partial sequence
LC383925.1 Staphylococcus lentus JCM 2426 gene for 16S ribosomal RNA partial sequence
KX525724.1 Staphylococcus sp. strain 82584 16S ribosomal RNA gene partial sequence
MH569456.1 Bacterium strain GIm45 16S ribosomal RNA gene partial sequence
KM378611.1 Staphylococcus lentus strain BGZ-7 16S ribosomal RNA gene partial sequence
KM010146.1 Staphylococcus lentus strain muzyellow 16S ribosomal RNA gene partial sequence
HQ437165.1 Staphylococcus sp. CSA7(2011) 16S ribosomal RNA gene partial sequence
KX950708.1 Staphylococcus lentus strain 1b 16S ribosomal RNA gene partial sequence11
10
10
9
1
(a)

52
KM010139.1 Staphylococcus lentus strain muzorange 16S ribosomal RNA gene partial sequence
MH491955.1 Staphylococcus lentus strain 3-4 16S ribosomal RNA gene partial sequence
KT260750.1 Staphylococcus lentus strain RCB538 16S ribosomal RNA gene partial sequence
KT261255.1 Staphylococcus lentus strain RCB1043 16S ribosomal RNA gene partial sequence
KP789167.1 Staphylococcus sp. MRSA222B1_13_3E 16S ribosomal RNA gene partial sequence
MF948914.1 Staphylococcus lentus strain PSB295 16S ribosomal RNA gene partial sequence
LN999936.1 Staphylococcus lentus partial 16S rRNA gene isolate SLKr1
KX950707.1 Staphylococcus lentus strain 1m 16S ribosomal RNA gene partial sequence12
12
11
9
2
MG651202.1 Bacillus halotolerans strain FJAT-47799 16S ribosomal RNA gene partial sequence
KY575587.1 Bacillus subtilis strain Bs_Pg1 16S ribosomal RNA gene partial sequence
KT986121.1 Bacillus tequilensis strain Lmb056 16S ribosomal RNA gene partial sequence
KT986166.1 Bacillus amyloliquefaciens strain Xmb038 16S ribosomal RNA gene partial sequence
KT986156.1 Bacillus axarquiensis strain Xmb027 16S ribosomal RNA gene partial sequence
KT986083.1 Geobacillus stearothermophilus strain Lmb010 16S ribosomal RNA gene partial sequence
KT986187.1 Bacillus subtilis strain Xmb062 16S ribosomal RNA gene partial sequence
KX950709.1 Bacillus subtilis strain 2p 16S ribosomal RNA gene partial sequence12
11
10
9
2
KC951997.1 Staphylococcus sp. SC1 16S ribosomal RNA gene partial sequence
KY653102.1 Staphylococcus lentus strain FJAT-hcl-24 16S ribosomal RNA gene partial sequence
KR364789.1 Staphylococcus sp. WCA-CC-3-1 16S ribosomal RNA gene partial sequence
NR_043418.1 Staphylococcus lentus strain MAFF 911385 16S ribosomal RNA gene partial sequence
AY161045.1 Staphylococcus lentus strain PLC-6 16S ribosomal RNA gene partial sequence
DQ819132.1 Uncultured bacterium clone aab26c04 16S ribosomal RNA gene partial sequence
KX950710.1 Staphylococcus lentus strain 4v 16S ribosomal RNA gene partial sequence
KT261104.1 Staphylococcus lentus strain RCB892 16S ribosomal RNA gene partial sequence
72
17
13
7
6
KT748639.1 Alcaligenes aquatilis strain C_6 16S ribosomal RNA gene partial sequence(2)
KJ513379.1 Alcaligenes faecalis strain E5.Zn 4 16S ribosomal RNA gene partial sequence
AB694007.1 Rhodobacter sphaeroides gene for 16S rRNA partial sequence strain: AMT-08
KT748636.1 Alcaligenes aquatilis strain C_11 16S ribosomal RNA gene partial sequence
KP274847.1 Alcaligenes sp. SAD2 16S ribosomal RNA gene partial sequence(2)
KU860464.1 Alcaligenes sp. AG3 16S ribosomal RNA gene partial sequence
KT808882.1 Alcaligenes aquatilis strain C_7 16S ribosomal RNA gene partial sequence
KY009932.1 Alcaligenes aquatilis strain 3c 16S ribosomal RNA gene partial sequence
11
10
10
9
2
(b)
(e)
(d)
(c)

53
Figure 12: Phylogenetic tree of all the selected bacterial isolates based on neighbor joining method
(a) S. lentus 1b, (b) S. lentus 1m, (c) B. subtilis, (d) S. lentus 4v, (e) A. aquatilis and (f) A. faecalis
(g) Alishwanella sp.
Figure 13: Phylogenetic tree of all the selected bacterial isolates based on neighbor joining method
in combined form.
AY994311.1 Alcaligenes sp. PAOAC171 16S ribosomal RNA gene partial sequence
KF054926.1 Rhodobacter sphaeroides strain IARI-NIAW1-7 16S ribosomal RNA gene partial sequence
AY346138.1 Alcaligenes sp. IS-17 16S ribosomal RNA gene complete sequence
KF383272.1 Alcaligenes faecalis strain Fa1.3 16S ribosomal RNA gene partial sequence
JX843599.1 Uncultured bacterium clone B171 16S ribosomal RNA gene partial sequence
KX118706.1 Alcaligenes faecalis strain O1R4 16S ribosomal RNA gene partial sequence
KX118704.1 Alcaligenes faecalis strain DEP8 16S ribosomal RNA gene partial sequence
KY009933.1 Alcaligenes faecalis strain 3d 16S ribosomal RNA gene complete sequence73
100
53
25
1
JQ012976.1 Alishewanella sp. 199 16S ribosomal RNA gene partial sequence
NR_125524.1 Alishewanella solinquinati strain NCIM 5295 16S ribosomal RNA gene partial sequence
GQ280101.1 Alishewanella sp. JS-31 16S ribosomal RNA gene partial sequence
HM104373.1 Alishewanella sp. AMP-7 16S ribosomal RNA gene partial sequence
JQ012977.1 Alishewanella sp. 197 16S ribosomal RNA gene partial sequence
JQ245619.1 Uncultured bacterium clone SYNH02_C3-18B-154 16S ribosomal RNA gene partial sequence
KM362999.1 Rheinheimera sp. AE24 16S ribosomal RNA gene partial sequence
JN546609.1 Alishewanella sp. SE-R 16S ribosomal RNA gene partial sequence45
45
8
8
7
KY009933.1 Alcaligenes faecalis strain 3d 16S ribosomal RNA gene complete sequence
KY009932.1 Alcaligenes aquatilis strain 3c 16S ribosomal RNA gene partial sequence
JN546609.1 Alishewanella sp. SE-R 16S ribosomal RNA gene partial sequence
KX950709.1 Bacillus subtilis strain 2p 16S ribosomal RNA gene partial sequence
KX950707.1 Staphylococcus lentus strain 1m 16S ribosomal RNA gene partial sequence
KX950710.1 Staphylococcus lentus strain 4v 16S ribosomal RNA gene partial sequence
KX950708.1 Staphylococcus lentus strain 1b 16S ribosomal RNA gene partial sequence
100
93
100
64
(g)
(f)

54
Optimization of bio decolorization conditions
The biodecolorization of azo dye by bacterial strains was checked under various conditions
i.e., temperature, pH, incubation condition, carbon and nitrogen source, inoculum size and dye
concentration to find out optimum conditions for dye decolorization.
S. lentus 1b showed maximum decolorization at 37 oC, pH 7 and under static condition. It
efficiently utilized wheat bran and yeast extract as carbon and nitrogen source respectively to show
optimum decolorization. The percentage of decolorization was maximum when inoculum size was
6% and dye concentration was 10 mg/L (Fig.14 a to g).
S. lentus 1m showed maximum decolorization percentage when grow statically at 37 oC
and pH 7. The rate of decolorization was maximum when wheat bran and yeast extract were used
as carbon and nitrogen source respectively. It efficiently decolorized dye when inoculum size was
4% and concentration of dye was 10 mg/L (Fig. 15 to g).
B. subtilis decolorized dye efficiently at 37 oC, pH 7 and under static condition. The rate of
decolorization was quite high when sugarcane bagasse and yeast extract were used as carbon and
nitrogen source respectively for its growth. The maximum rate of decolorization was determined
when inoculum size was 6% and dye concentration was 10 mg/L (Fig. 16 a to g).
S. lentus 4v decolorized dye efficiently at 37°C, pH 7 and under static condition. The rate
of decolorization was high when wheat bran and yeast extract were used as carbon and nitrogen
source respectively. It showed maximum decolorization when inoculum size was 4% and dye
concentration was 20 mg/L (Fig. 17 a to g).
A. aquatilis showed maximum decolorization at 37°C, pH 7 and at static condition. The
bacterium efficiently utilized saw dust and yeast extract as carbon and nitrogen source,
respectively to show maximum percentage decolorization ability. Moreover, efficient

55
decolorization was determined when inoculum percentage was 6 and dye concentration was 10
mg/L (Fig.18 a to g).
A. faecalis showed maximum decolorization rate at 37°C, pH 7 and at static condition. The
strain efficiently utilized saw dust and yeast extract as carbon and nitrogen source to show
optimum rate of decolorization. The percentage of decolorization was maximized when inoculum
size was 6% and dye concentration was 10mg/L (Fig. 19 a to g).
Decolorization of multiple dyes
The bacterial strains were grown in a medium containing multiple azo dye i.e., Congo Red,
Methyl Red, Phenol Red, Brilliant Black and Navy Blue in order to check their potential to degrade
multiple dyes at the same time.
S. lentus 1b decolorized 81% of these dyes within a period of 5 days (Fig. 21a) while S.
lentus 1m showed a decolorization percentage of 79 (Fig. 21b). B. subtilis decolorized 82% percent
of the dye mixture (Fig. 21c) while S. lentus 4v showed a decolorization percentage of 87
(Fig.21d). A. aquatilis was able to decolorize mixture of dyes to a percentage of 86 (Fig. 21 e)
while A. faecalis was able to decolorize upto 82% (Fig.21 f).
Growth Decolorization relationship
It was observed that decolorization had a postive effect on the growth of the bacteria.
Inspite of the fact that decolorization suppressed the growth of bacteria it played its role in
increasing cell growth which is evident from the figure (Fig. 22 a to f ).

56
Figure 14: Optimization of decolorization condition for S. lentus 1b (a) temperature, (b) pH, (c)
incubation condition, (d) inoculum percentage, (e) carbon source, (f) nitrogen source and (g) dye
concentration.
0
20
40
60
80
25 30 37 45 50
Dec
olo
riza
tio
n (
%)
Temperature (◦C)
(a)
0
20
40
60
80
5 6 7 8 9 10
Dec
olo
riza
tio
n(%
)
pH
(b)
0
20
40
60
80
Static Shaking
Dec
olo
riza
tio
n (
%)
Incubation condition
(c)
0
20
40
60
80
2 4 6 8 10
Dec
olo
riza
tio
n (
%)
Innoculum size (%)
(d)
0
20
40
60
80
S.B S.D W.B
Dec
olo
riza
tio
n (
%)
Carbon source
(e)
0
20
40
60
80
B.extract Peptone Y.extract
Dec
olo
riza
tio
n (
%)
Nitrogen source
(f)
0
20
40
60
80
3 5 7 10 20 50
Dec
olo
riza
tio
n (
%)
Dye concentration (mg/L)
(g)

57
Figure 15: Optimization of decolorization condition for S. lentus 1m (a) temperature, (b) pH, (c)
incubation condition, (d) inoculum percentage, (e) carbon source, (f) nitrogen source and (g) dye
concentration.
0
20
40
60
80
5 6 7 8 9 10
Dec
olo
riza
tio
n (
%)
pH
(b)
0
20
40
60
80
Static Shaking
Dec
olo
riza
tio
n (
%)
Incubation condition
(c)
0
20
40
60
80
2 4 6 8 10
Dec
olo
riza
tio
n (
%)
Innoculum size (%)
(d)
0
20
40
60
80
S.B S.D W.B
Dec
olo
riza
tio
n (
%)
Carbon source
(e)
0
20
40
60
80
B.extract Peptone Y.extract
Dec
olo
riza
tio
n (
%)
Nitrogen source
(f)
0
20
40
60
80
25 30 37 45 50
Dec
olo
riza
tio
n (
%)
Temperature (◦C)
(a)
0
20
40
60
80
3 5 7 10 20 50
Dec
olo
riza
tio
n (
%)
Dye concentration (mg/L)
(g)

58
Figure 16: Optimization of decolorization condition for B. subtilis (a) temperature, (b) pH, (c)
incubation condition, (d) inoculum percentage, (e) carbon source, (f) nitrogen source and (g) dye
concentration.
0
20
40
60
80
Static Shaking
Dec
olo
riza
tio
n (
%)
Incubation condition
(c)
0
20
40
60
80
S.B S.D W.B
Dec
olo
riza
tio
n (
%)
Carbon source
(e)
0
20
40
60
80
B.extract Peptone Y.extract
Dec
olo
riza
tio
n (
%)
Nitrogen source
(f)
0
20
40
60
80
3 5 7 10 20 50
Dec
olo
riza
tio
n (
%)
Dye concentration (mg/L)
(g)
0
20
40
60
80
5 6 7 8 9 10
Dec
olo
riza
tio
n (
%)
pH
(b)
0
20
40
60
80
25 30 37 45 50
Dec
olo
riza
tio
n (
%)
Temperature (◦C)
(a)
0
20
40
60
80
2 4 6 8 10
Dec
olo
riza
tio
n (
%)
Innoculum size (%)
(d)

59
Figure 17: Optimization of decolorization condition for S. lentus 4v (a) temperature, (b) pH, (c)
incubation condition, (d) inoculum percentage, (e) carbon source, (f) nitrogen source and (g) dye
concentration.
0
20
40
60
80
5 6 7 8 9 10
Dec
olo
riza
tio
n (
%)
pH
(b)
0
20
40
60
80
Static Shaking
Dec
olo
riza
tio
n (
%)
Incubation condition
(c)
0
20
40
60
80
2 4 6 8 10
Dec
olo
riza
tio
n (
%)
Innoculum size (%)
(d)
0
50
100
S.B S.D W.B
Dec
olo
riza
tio
n (
%)
Carbon source
(e)
0
20
40
60
80
3 5 7 10 20 50
Dec
olo
riza
tio
n (
%)
Dye concentration (mg/L)
(g)
0
20
40
60
80
25 30 37 45 50
Dec
olo
riza
tio
n (
%)
Temperature (◦C)
(a)
0
20
40
60
80
B.extract Peptone Y.extract
Dec
olo
riza
tio
n (
%)
Nitrogen source
(f)

60
Figure 18: Optimization of decolorization condition for A. aquatilis (a) temperature, (b) pH, (c)
incubation condition, (d) inoculum percentage, (e) carbon source, (f) nitrogen source and (g) dye
concentration.
0
20
40
60
80
25 30 37 45 50
Dec
olo
riza
tio
n (
%)
Temperature (◦C)
(a)
0
20
40
60
80
5 6 7 8 9 10
Dec
olo
riza
tio
n (
%)
pH
(b)
0
50
100
Static Shaking
Dec
olo
riza
tio
n (
%)
Incubation condition
(c)
0
50
100
2 4 6 8 10D
eco
lori
zati
on
(%
)
Innoculum size (%)
(d)
0
20
40
60
80
S.B S.D W.B
Dec
olo
riza
tio
n (
%)
Carbon source
(e)
0
20
40
60
80
B.extract Peptone Y.extract
Dec
olo
riza
tio
n (
%)
Nitrogen source
(f)
0
20
40
60
80
3 5 7 10 20 50
Dec
olo
riza
tio
n (
%)
Dye concentration (mg/L)
(g)

61
Figure 19: Optimization of decolorization condition for A. faecalis (a) temperature, (b) pH, (c)
incubation condition, (d) inoculum percentage, (e) carbon source, (f) nitrogen source and (g) dye
concentration.
0
20
40
60
80
25 30 37 45 50
Dec
olo
riza
tio
n (
%)
Temperature (◦C)
(a)
0
20
40
60
80
5 6 7 8 9 10
Dec
olo
riza
tio
n (
%)
pH
(b)
0
20
40
60
80
Static Shaking
Dec
olo
riza
tio
n (
%)
Incubation condition
(c)
0
20
40
60
80
2 4 6 8 10D
eco
lori
zati
on
(%
)
Innoculum size (%)
(d)
0
20
40
60
80
S.B S.D W.B
Dec
olo
riza
tio
n (
%)
Carbon source
(e)
0
20
40
60
80
B.extract Peptone Y.extractDec
olo
riza
tio
n (
%)
Nitrogen source
(f)
0
20
40
60
80
3 5 7 10 20 50
Dec
olo
riza
tio
n (
%)
Dye concentration (mg/L)
(g)

62
0
20
40
60
80
100
1 2 3 4 5
Dec
olo
riza
tio
n (
%)
Time (Days)
(a)
0
20
40
60
80
100
1 2 3 4 5
Dec
olo
riza
tio
n (
%)
Time (Days)
(b)
0102030405060708090
1 2 3 4 5
Dec
olo
riza
tio
n (
%)
Time (Days)
(c)

63
Figure 20: Potential of (a) S. lentus 1b, (b) S. lentus 1m, (c) B. subtilis, (d) S. lentus 4v, (e) A.
aquatilis and (f) A. faecalis to decolorize multiple dyes incubated at 37°C after suitable time
interval.
0
20
40
60
80
100
1 2 3 4 5
Dec
olo
riza
tio
n (
%)
Time (Days)
(d)
0
20
40
60
80
100
1 2 3 4 5
Dec
olo
riza
tio
n (
%)
Time (Days)
(e)
0
20
40
60
80
100
1 2 3 4 5
Dec
olo
riza
tio
n (
%)
Time (Days)
(f)

64
0
20
40
60
80
100
0
0.5
1
1.5
2
1 2 3 4 5
Dec
olo
riza
tio
n (
%)
Op
tica
l d
ensi
ty a
t 6
00
nm
Days
(a)
Growth
Decolorization
0
20
40
60
80
100
0
0.5
1
1.5
2
1 2 3 4 5
Dec
olo
riza
tio
n (
%)
Op
tica
l d
ensi
ty a
t 6
00
nm
Days
(b)
Growth
Decolorization
0
10
20
30
40
50
60
70
80
0
0.5
1
1.5
2
2.5
1 2 3 4 5
Dec
olo
riza
tio
n (
%)
Op
tica
l d
ensi
ty a
t 6
00
nm
Days
(c)
Growth
Decolorization
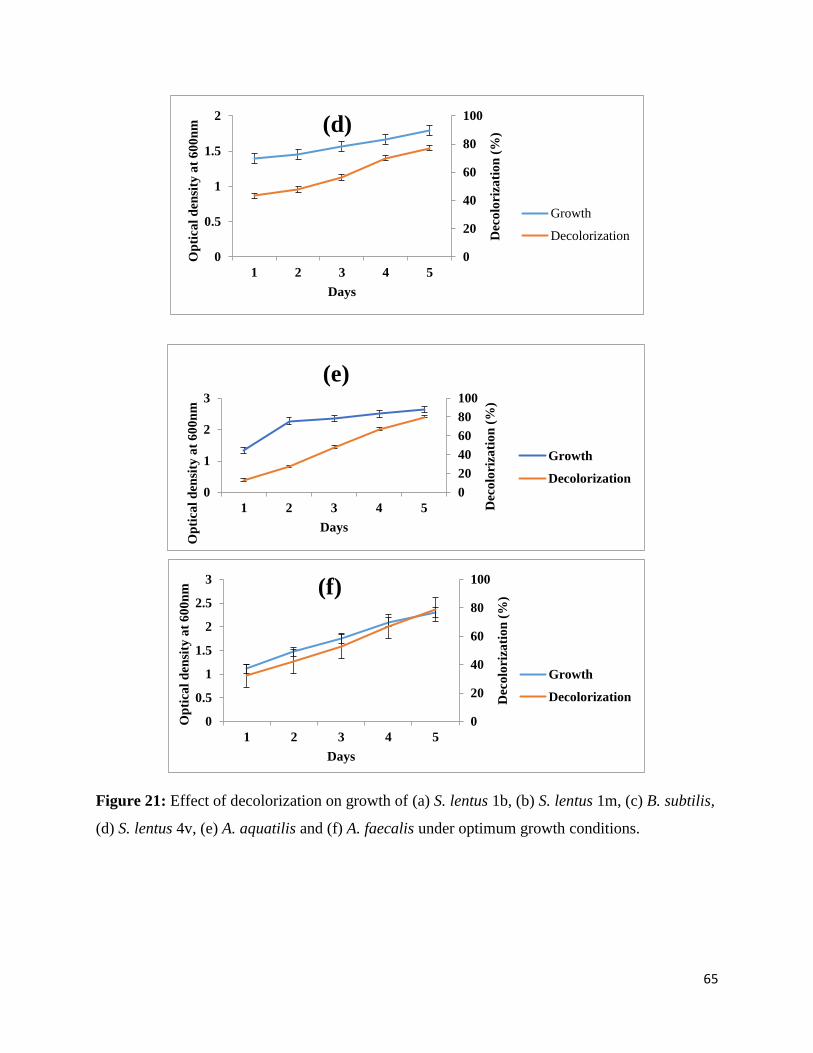
65
Figure 21: Effect of decolorization on growth of (a) S. lentus 1b, (b) S. lentus 1m, (c) B. subtilis,
(d) S. lentus 4v, (e) A. aquatilis and (f) A. faecalis under optimum growth conditions.
0
20
40
60
80
100
0
0.5
1
1.5
2
1 2 3 4 5
Dec
olo
riza
tio
n (
%)
Op
tica
l d
ensi
ty a
t 6
00
nm
Days
(d)
Growth
Decolorization
0
20
40
60
80
100
0
0.5
1
1.5
2
2.5
3
1 2 3 4 5
Dec
olo
riza
tio
n (
%)
Op
tica
l d
ensi
ty a
t 6
00
nm
Days
(f)
Growth
Decolorization
0
20
40
60
80
100
0
1
2
3
1 2 3 4 5 Dec
olo
riza
tio
n (
%)
Op
tica
l d
ensi
ty a
t 6
00
nm
Days
(e)
Growth
Decolorization

66
Consortium studies
Aerobic and anaerobic isolates were grown together, in the form of consortium, to study
their effect on dye degradation. Figure 22 a and b is showing that rate of decolorization was
increased by 8-15% (aerobic) and 10-14% (anaerobic) when dye containing sample was inoculated
with the consortium of bacterial isolates. Moreover, the mixed consortium (anaerobic and aerobic)
was more effective in decolorization of dye i.e., 8-10% as compared to the aerobic and anaerobic
consortium (Fig. 22c).
Figure 22: Effect of (a) Aerobic, (b) Anaerobic and (c) Mixed consortium on degradation of
dye.
0
50
100
1 2 3 4 5
Dec
olo
riza
tio
n (
%)
Time (Days)
(a)A. aquatilis
A. faecalis
Consortium
0
20
40
60
80
100
1 2 3 4 5
Dec
olo
riza
tio
n (
%)
Time (Days)
(b)S. lentus1b
S. lentus1m
B. subtilis
S. lentus4v
Consortium
0
50
100
1 2 3 4 5
Dec
olo
riza
tio
n (
%)
Time (Days)
(c)Aerobic
Anaerobic
Mixed

67
Analysis of dye degraded products
TLC
TLC was performed to analyze the dye degraded products. Bands of different Rf values
were observed in dye treated cultures when observed under UV light of 254nm. The control (dye)
band was observed with a Rf value of 0.94. In case of S. lentus 1b, Rf value of two bands were
0.89 and 0.95 (Fig. 23a) while in chromatogram of S. lentus 1m treated dye sample a band of Rf
value of single band was 0.89 (Fig.23b). The chromatogram of B. subtilis treated dye sample
showed two bands of Rf value 0.92 and 0.98 (Fig.23c) while S. lentus 4v showed two bands of Rf
value 0.90 and 0.96 (Fig.23d). The chromatograms of A. aquatilis and A. faecalis treated dye
sample showed bands of Rf value 0.95 (Fig. 23e) and 0.93 (Fig.23f) respectively.
Figure 23: TLC chromatogram of extracted metabolites of (a) S. lentus 1b, (b) S. lentus 1m, (c)
B. subtilis, (d) S. lentus 4v, (e) A. aquatilis and (f) A. faecalis decolorized dye sample visualized
under UV range of 254nm.
(C) (T) (C) (T) (C) (T) (C) (T) (C) (T) (C) (T)
(a) (b) (c) (e) (d) (f)

68
HPLC
The chromatogram of the dye sample showed three detectable peaks at retention time of
1.80, 2.88 and 5.00 min (Fig. 24a) while chromatogram of S.lentus strain 1b has two detectable
peaks of retention time 1.97 and 2.92 min (Fig. 24b) The chromatogram of dye sample treated with
S.lentus strain 1m has a detectable of retention time 3.01 min (Fig. 24c) while that of which treated
with B. subtilis has three peaks of retention time 1.92, 2.89 and 4.86 min (Fig. 24d). The
chromatogram of dye sample which was treated with S.lentus strain 4v showed four prominent
peaks of retention time 1.94, 2.91, 4.92 and 6.37 min (Fig. 24e). The chromatogram of dye sample
treated with A. aquatilis showed peaks at retention time of 1.99, 2.30, 2.95 and 3.76 min (Fig. 24f)
and that treated with A. faecalis has three detectable peaks of retention time 1.93, 2.09 and 2.95
min (Fig. 24g). The dye sample was incubated with these strains for a period of 4 days in order to
obtain maximum decolorization.
FTIR
A comparison between the FTIR spectrum of control dye and extracted metabolites is given in
figure 25 a to f. Two specific peaks of wavelength 1612 and 1532 cm-1 are shown in FTIR spectrum
of control dye which are due to the presence of -N=N- stretching. The peak with wavelength 1395
cm-1 indicates C-O-H bending. The peak with a wavelength 1037 cm-1 is due to C-O stretching.
There is a variation in peaks in the FTIR spectrum of metabolites extracted from bacterial
decolorized sample of dye when compared to the control dye spectrum. The absence of peaks with
wavelength 1612 and 1532 cm-1 indicates the reductive cleavage of azo bond. The peaks with
wavelength 2850 and 2923 cm-1 in S. lentus 1b, B. subtilis, S. lentus 4v and A. aquatlis, 2852 and
2926 cm-1 S. lentus 1m and 2923 cm-1 in A. faecalis is due to stretching of alkanes. The peaks with
1755 and 1717 cm-1 wavelength in above mentioned organisms indicate the presence of C=O

69
group. A peak of wavelength 1289 cm-1 depicts the presence of carboxyl group. The peaks with
wavelength 1104, 1108 and 1037 cm-1 show the presence of amines (C-N). The presence of peak
with wavelength 769 cm-1 indicates the presence of conjugated C=C.
(a)
(b)
)

70
(c)
(d)

71
(e)
(f)

72
Figure 24: HPLC analysis of reactive Synazol red HF-6BN with a mobile phase of profile of
methanol at 1.0 mL/min. The column was C-18 (250×4.6 mm) (a) represents dye chromatogram
while (b) represents S. lentus 1b, (c) S. lentus strain 1m, (d) B. subtilis, (e) S. lentus strain 4v, (f)
A. aquatilis and (g) A. faecalis degraded dye products extracted after 4 days of incubation at 37°C.
(g)
(a)
(g)

73
(b)
(c)

74
(d)
(e)

75
Figure 25: FTIR spectrum of control dye (Synazol red HF-6BN) with (a) S. lentus 1b, (b) S. lentus
1m, (c) B. subtilis, (2p) (d) S. lentus 4v, (e) A. aquatilis (3c) and (f) A. faecalis (3d).
GC-MS
GC-MS was performed to identify the degraded products of the dye. The results
showed that the predominant compounds found in the final dye treated sample were 3-
Aminobutanoic acid, pyrrolo pyrazine-1, 4-dione and palmitic acid. The chromatogram of all the
organisms were given in the figure (Fig. 26 a to g).
(f)

76
(a)
(b)

77
(c)
(d)

78
(e)
(f)

79
Figure 26: GC-MS chromatograms of (a) control dye (b) S. lentus 1b, (c) S. lentus 1m, (d) B.
subtilis, (2p) (e) S. lentus 4v, (f) A. aquatilis (3c) and (g) A. faecalis (3d).
Dye degradation at large scale
The bacterial isolates efficiently degraded dye in industrial effluent when estimated after
2, 4, 6 and 8 days of incubation at room temperature. The dye decolorization was also visible by
change in color of experimental flasks when compared with the control containing no bacterial
culture (Fig. 27 a to f). S. lentus 1b decolorized dye by 77% within a period of 8 days (Fig. 28a)
while S. lentus 1m by 71% (Fig. 28b). B. subtilis efficiently decolorized dye by 70% (Fig.28c) and
S. lentus 4v by 71% (Fig.28d). A. aquatilis and A. faecalis decolorized dye to a percentage of 72
and 68, respectively (Fig. 28 e and f).
(g)

80
aaaaa
Figure 27: Change in color of dye with respect to control in flasks containing culture of bacterial
isolates (a) S. lentus 1b, (b) S. lentus 1m, (c) B. subtilis (2p), (d) S. lentus 4v, (e) A. aquatilis (3c)
and (f) A. faecalis (3d) from the original industrial wastewater.
(a) (b)
(c)
(d)
(c)
(f)
(e)

81
0
20
40
60
80
100
2 4 6 8
Dec
olo
riza
tio
n (
%)
Time (days)
(a)
negative control
positive control
S. lentus1b
0
10
20
30
40
50
60
70
80
2 4 6 8
Dec
olo
riza
tio
n %
Time (days)
(b)
negative control
positive control
S. lentus strain 1m
0
20
40
60
80
2 4 6 8
Dec
olo
riza
tio
n (
%)
Time (days)
(c)
negative control
positive control
B. subtilis

82
Figure 28: Decolorization of Synazol red HF-6BN by bacterial isolates (a) S. lentus 1b (b) S.
lentus strain 1m, (c) B. subtilis (2p), (d) S. lentus strain 4v, (e) A. aquatilis (3c) and (f)
A. faecalis (3d) from industrial wastewater after incubation of 2, 4, 6 and 8 days of
incubation at room temperature.
0
20
40
60
80
100
2 4 6 8
Dec
olo
riza
tio
n (
%)
Time (days)
(d)
negative control
positive control
S. lentus strain 4v
0
20
40
60
80
2 4 6 8
Dec
olo
riza
tio
n (
%)
Time (days)
(e)
negative control
positive control
A. aquatilis
0
20
40
60
80
2 4 6 8
Dec
olo
riza
tio
n (
%)
Time (days)
(f)
negative control
positive control
A. faecalis

83
Microbial toxicity
The bio decolorized dye sample was checked for its effect on microbial flora. There was
no zone of inhibition found around the well having decolorized dye sample which clearly indicated
that the biodegraded wastewater is not harmful for the growth of microbial species (Fig. 29 to 35).
Figure 29: The broth decolorized by S. lentus 1b used for incubation of (a) B. megaterium, (b) B.
subtilis and (c) B. cereus at 37°C for 48 hours. No zone of inhibition was appeared in any case.
Figure 30: The broth decolorized by S. lentus 1m used for incubation of (a) B. megaterium, (b) B.
subtilis and (c) B. cereus at 37°C for 48 hours. No zone of inhibition was appeared in any case.
(a)
B. megaterium
(c)
B. cereus
(b)
B. subtilis
(a)
B. megaterium
(b)
B. subtilis
(c)
B. cereus

84
Figure 31: The broth decolorized by B. subtilis used for incubation of (a) B. megaterium, (b) B.
subtilis and (c) B. cereus at 37°C for 48 hours. No zone of inhibition was appeared in any case.
Figure 32: The broth decolorized by S. lentus 4v used for incubation of (a) B. megaterium, (b) B.
subtilis and (c) B. cereus at 37°C for 48 hours. No zone of inhibition was appeared in any case.
Figure 33: The broth decolorized by A.aquatilis used for incubation of (a) B. megaterium, (b) B.
subtilis and (c) B. cereus at 37°C for 48 hours. No zone of inhibition was appeared in any case.
(a)
B. megaterium
(b)
B. subtilis
(c)
B. cereus
(a)
B. megaterium
(b)
B. subtilis
(c)
B. cereus
(a)
B. megaterium
(b)
B. subtilis
(c)
B. cereus

85
Figure 34: The broth decolorized by A. faecalis used for incubation of (a) B. megaterium, (b) B.
subtilis and (c) B. cereus at 37°C for 48 hours. No zone of inhibition was appeared in any case.
Figure 35: Alishewanella sp. decolorized broth used for incubation of (a) B. megaterium, (b) B.
subtilis and (c) B. cereus at 37°C for 48 h. No zone of inhibition was observed in any case.
Phytoxicity
A clear difference in growth of control and experimental plants was observed (Fig. 36 a
to f). Experimental pots showed fair growth as they watered with wastewater in which dye was
graded by the action of bacteria. Those pots watered with untreated wastewater showed less
growth.
(a)
B. megaterium
(b)
B. subtilis
(c)
B. cereus
(a)
B. megaterium
(b)
B. subtilis
(c)
B. cereus

86
(a)
(b)

87
(c)
(d)

88
Figure 36: Use of treated wastewater by (a) S. lentus 1b, (b) S. lentus strain 1m, (c) B. subtilis
(2p), (d) S. lentus strain 4v, (e) A. aquatilis (3c) and (f) A. faecalis (3d)., tap water and untreated
wastewater for growth of Vigna radiata (mung beans) for a 10 days incubation period under 1:1
light and dark conditions. Two pots were used for each treatment (n=2).
(e)
(f)

89
DISCUSSION
Variations in natural and anthropogenic activities causes global pollution which
contaminates various terrestrial and aquatic ecosystems with heavy metals, inorganic and organic
compounds and radionuclide. The controlled and uncontrolled solid and liquid discharge from
industries, accidental spillages, use of agricultural fertilizers, herbicides, insecticides and
pesticides, sewage disposal mainly contributes to increase pollution at an alarming rate.
The discharge produced by textile industries is a major issue of today’s world as it become
a major source of pollution in water bodies. Several types of dyes are used in textile industries and
among them azo dyes are the most toxic ones because of their complex structure which mainly
involves aromatic rings, azo bonds and amino groups. Moreover, their degradation products are
also toxic in nature. The physiochemical techniques used to degrade these dyes such as adsorption,
coagulation- flocculation, oxidation and electrochemical methods are unable to degrade dyes
completely (Lin and Peng, 1994). Therefore, processing of these dyes using microorganisms is a
modern-day approach to deal with this problem.
The present research deals with the isolation and characterization of dye degrading bacteria
and their potential in the bioremediation of dye contaminated environment. For the isolation of
dye degrading microorganisms, wastewater samples were collected from the industrial area of
Sheikhupura road and Lahore. Microorganisms which efficiently decolorize dyes are the ones
which are isolated from dye contaminated sites such as textile effluents, soil nearby the
contaminated sites and sludge obtained after the treatment of wastewater (Yang et al., 2009; Ola
et al., 2010; Ayed et al., 2011).

90
A total of 7 isolates which degrade dye efficiently were finalized for further study. Four of
them are anaerobic while the rest of three are aerobic. Both aerobic and anaerobic bacterial strains
can decolorize dyes, but dyes are resistant to degradation under aerobic environment as the
presence of oxygen inhibits the reduction of azo bond (Solis et al., 2012). The isolate 1b, 1m and
4v were Gram positive cocci, 2p was Gram positive rod while 3c, 3d and CBL-2 were Gram
negative rods. Various groups of bacteria are studied to investigate their dye degrading ability.
Both Gram positive and negative bacteria are equally efficient in degrading dyes (Sani and
Banerjee 1999; Kodam et al., 2005; Moosvi et al., 2005).
Optimization of bio decolorization conditions
The process of degradation of azo dyes is a complex one which relies on numerous factors.
The limitation of these factors greatly influences the rate of decolorization. In the present study
numerous factors were evaluated to optimize the rate of decolorization by the isolated bacteria.
These factors include temperature, pH, incubation condition, carbon and nitrogen source, inoculum
percentage and dye concentration.
The growth as well as enzymatic activity of microorganisms is influenced by temperature.
Therefore, biodegradation of azo dyes is also affected by temperature. All the bacterial isolates
used in this study decolorized dye at optimum rate at 37oC. Guadie et al. (2017) reported a Bacillus
sp. strain CH12 which decolorized dye at optimum rate between 25 to 35oC. Micrococccus strain
R3 was able to decolorize methyl red at 37oC (Olukanni et al., 2009).
The extent of decolorization is also influenced by the pH of the medium. It also effects the
solubility and color of the dye. All the bacterial isolates used in this study decolorized dye at
optimum rate at pH 7. An increase in the rate of decolorization was noted from pH 5-7 while it

91
was decreased with further increase in pH from 8-10. The decolorization rate of methyl red by
Micrococcus strain R3 within a pH range of 6-8 was 84.6%, 94.19%, and 93.94%, respectively
(Olukanni et al., 2009). Pseudomonas sp. SUK 1 was able to decolorize a mixture of azo dyes
(Remazol Orange 3R, Scarlet RR, Brown 3REL, Golden yellow HER, Remazol Red, Cotton Blue,
Amaranth, Orange 2RX) efficiently at pH 7 (Chougule et al., 2014).
The incubation condition i.e., static or shaking greatly effects the rate of decolorization as
the presence of oxygen competes with nitrogen for the process of reduction. In the present case,
aerobic strains i.e., A. aquatilis and A. faecalis showed optimum decolorization under shaking
conditions while anaerobic strains i.e., S. lentus 1b, S. lentus 1m, B. subtilis and S lentus 4v
decolorized well under static condition. Pseudomonas sp. SUK 1 was able to decolorize a mixture
of azo dyes (Remazol Orange 3R, Scarlet RR, Brown 3REL, Golden yellow HER, Remazol Red,
Cotton Blue, Amaranth, Orange 2RX) efficiently under static conditions (Chougule et al., 2014).
Carbon and nitrogen source also plays a vital role in the process of decolorization. They
not only provide the energy but also serves as an electron donor for the reduction of azo bond.
Furthermore, the size of the inoculum also effects the rate of decolorization. The studied bacteria
showed increased rate of decolorization by the addition of carbon and nitrogen source.
Shah et al. (2013) reported that Bacillus species i.e., B. cereus and B. megaterium having
95% and 98% dye decolorizing potential respectively under optimum conditions. Optimal
condition for B. cereus was found to be 37 oC, pH 7, 1% sucrose, 0.25% peptone and 8% inoculum
and that for B. megaterium was found to be 37°C, pH 6, glucose 1%, 0.25% yeast extract and 10%
inoculum.
The concentration of dyes in the textile effluent ranges from 16-20 mg/L (Banat et al.,
1996). The dye concentration influences the rate of decolorization as well. The bacteria isolated

92
in the present study can decolorize dye within the range of 20 -50 mg/L. Bacillus sp. strain CH12
had the ability to decolorize lower dye concentrations (50-100mg/L) with ≥ 96% decolorization
rate while higher concentrations (150-250mg/L) with 84-95% decolorization rate (Guadie et al.,
2017). Saha et al. (2017) reported two Alcaligenes faecalis species namely A. faecalis E5.Cd and
A. faecalis Fal.3 which decolorize upto 93% of Blue H/C and Red 3B dye at pH 7 and 94% of
yellow 3R at pH 8 within a period of 96 h. Both the strains decolorize upto 91% of dye at 35°C,
92% with 50 mg/L initial dye concentration and 93% with 20% inoculum size and supplementation
of 1% co-substrate, respectively.
Decolorization of multiple dyes
The current study revealed that the anaerobic strains have the potential to degrade mixture
of multiple dyes uptil 87% while that of aerobic strains is 86%. Chougule et al. (2014) reported a
strain named Pseudomonas sp. SUK1 which was able to decolorize the mixture of various dyes
(Remazol Orange 3R, Scarlet RR, Brown 3REL, Golden yellow HER, Remazol Red, Cotton Blue,
Amaranth, Orange 2RX) by 94.3%. Shah (2014) reported three bacteria namely P. putida, P.
aeruginosa and B. subtilis capable of degrading multiple dyes i.e, Blue RR, Black B, Red RR,
Yellow RR and Navy blue. P. putida showed maximum decolorization of Blue RR (95%), P.
aeruginosa of Black B (93%) and Navy Blue (70.58%) and B. subtilis of Yellow RR (65%) and
Red RR (91%). A bacterium Clostridium biofermentans which was able to decolorize different
dyes such as Reactive red 3B-A, Reactive black 5, and Reactive yellow 3B-A, by over 90% within
a period of 36 hours (Joe et al., 2008).
Growth decolorization relationship
The azo dye molecules are deficient in carbon (Levin et al., 2010; Asgher et al., 2008)
which serves as source of energy for growth of microorganisms as well as an electron donor for

93
the reduction of azo bond (Yemendzhiev et al., 2009; Yang et al., 2009). However, some
researches have been done to make it possible that microorganisms would rely on dye as a sole
source of carbon to make this process of biodegradation more economical. In the present study we
tried the same thing and it was observed that the bacterial growth flourish as the biodegradation
process proceeded. Saratale et al., (2009a) demonstrated that M. glutamicus was able to grow by
using Navy Blue HE2R and its reaction intermediates as sole source of carbon.
Consortium studies
The azo dyes are generally degraded into aromatic amines by the action of microorganisms.
These amines are more toxic and difficult to degrade as compared to their parent molecule.
Moreover, a single microorganism is specific for a single dye. There is a need of complex
enzymatic system to degrade the by-products of dyes. So there arises the need of development of
microbial consortium to completely mineralize the dye (Phugare et al., 2011).
In the present study consortium of aerobic as well as anaerobic strains was created in order
to observe the difference in decolorization efficiency of individual strains and their consortium.
About 8-15% increase in decolorization rate was observed by aerobic consortium as compared to
the individual aerobic strains. Anaerobic consortium showed 10-14% increase in decolorization
rate in comparison to individual anaerobic strains.
Bose and Rajasekaran (2016) developed a bacterial consortium comprising of Klebsiella
sp1and sp2, S. aureus, B. cereus and P. fluorescence which was able to decolorize various dyes at
different rates. The degraded yellow, green, orange blue and black dye by 63%, 92%, 40%, 65%
and 96% respectively. The increased decolorization rate was due to the synergistic effect of

94
microorganisms. The biocatalytic activity of microorganisms is enhanced when they are present
in the form of a consortium.
The combination of anaerobic and aerobic consortium makes a perfect system for the
degradation of azo dyes as reductive cleavage of azo bone is done under anaerobic conditions
(Yemashova et al., 2009) and resulting aromatic amines are completely mineralized under aerobic
conditions (Forss and Welandar, 2011; Koupaie et al., 2011; Jonstrup et al., 2011).
In the present study anaerobic and aerobic consortium were simultaneously applied for
complete mineralization of azo dye. An increase of 8-10% in the final decolorization rate was
observed in comparison to individual anaerobic and aerobic consortium. Another consortium
reported by Lade et al., (2015) comprising of Providencia rettgeri strain HSL1 and Pseudomonas
sp. SUK1 was able to decolorize structurally different azo dyes under microaerophilic and aerobic
conditions. It was able to decolorize 98-99% of various dyes including Reactive Black 5, Reactive
Orange 16, Disperse Red 78 and Direct Red 81 at concentration of 100 mg/L within a period of 12
to 30 hours.
The degradation of Acid Red 18 was done by using anaerobic system followed by aerobic
system. This results in the 98% decolorization rate and more than 80% COD reduction which
occurred under anaerobic conditions. Upto 80% removal of by-product of anaerobic process (1-
naphthylamine-4-sulphonate) was done under aerobic process confirmed through HPLC (Koupaie
et al., 2011).

95
Analysis of dye degraded products
TLC
The analysis of degraded products of dye was done by using various techniques. Firstly,
this was done by thin layer chromatography. Rf value of the control band and dye band was
different in case of each bacterium. These results predict that original dye was broken down into
some other products when treated with bacterial strains. M. luteus strain SSN2 was used to degrade
Direct Orange 16 and when the degraded sample was analyzed through TLC two bands of Rf value
0.63 and 0.965 were detected under UV light of 254 nm while in control dye there is only one band
with Rf value 0.74 (Singh et al., 2015). The TLC chromatogram of degraded sample of Direct Red
by Enterococcus faecalis YZ66 had a band with Rf value of 0.71 while in control dye the Rf value
of band was 0.97 (Sahasrabudhe et al., 2014). Ghodake et al. (2011) reported three bands of Rf
value 0.93, 0.82 and 0.79 in TLC chromatogram of degraded sample of mono azo dye Amarnath
by Acinetobacter calcoaceticus NCIM 2890 but only a single band of Rf value 0.83 was produced
by control dye. Ajaz et al. (2018) reported the degraded of Sumifex Tourqi blue as new bands of
different Rf value was appeared in chromatogram of treated sample.
HPLC
To further confirm that the dye was degraded into its respective metabolites, HPLC was
performed. HPLC worked on the principal of relative affinity for mobile phase and stationary
phase. The compounds having greater affinity for stationary phase take longer time to pass through
the column or vice versa. The peaks of different retention time were observed in control and dye
sample treated with bacteria. This confirms the breakdown of parent dye into by products.

96
The degraded sample of three of anaerobic strains i.e., S. lentus 1b, B. subtilis and S. lentus
4v gave major peaks with retention time of comparable values i.e., 2.92, 2.89 and 2.91 respectively.
One anaerobic strain which was S. lentus strain 1m, its degraded sample gave the major peak with
retention time of 3.01. The major peaks of degraded sample of two aerobic strains i.e., A. aquatilis
and A. faecalis were of same retention time i.e.,2.95.
Lade et al. (2015) observed three major peaks with retention time 2.521, 3.241 and 3.564
and two minor peaks of retention time 3.123 and 3.910 when extracted metabolites from
Provedencia rettgeri decolorized C.I reactive blue 172 were analyzed through HPLC. The HPLC
analysis of the control dye results in the presence of one major peak with retention time of 2.702
min three minor peaks at retention time of 2.125, 2.801 and 3.394 min. HPLC analysis
demonstrated the presence of two major peaks at retention time 2.45 and 2.68 and two minor peaks
at retention time 3.50 and 6.50 min when B. halodurans decolorized Acid black- 24. The
chromatogram of original dye had only one peak at retention time of 2.81 min (Prasad and Rao.,
2014).
FTIR
In order to detect the presence of various groups in the degraded products of the dye FTIR
was performed. FTIR works on the principle that molecules have the capacity to absorb light at
various frequencies of infra-red region of spectrum of light. Each bond present in the molecule has
the capacity to absorb light of specific frequency. The measure of frequency is done in form of
wave number. The measure of frequency is usually done between the range of 4000 – 600 cm-1.
The spectrum obtained as result of absorption of light in the infra-red region describes the presence
of different functional groups and chemical bonds in the analyzing sample.

97
A comparison between the FTIR spectrum of control dye and extracted metabolites was
given in figure 25. The presence of specific peaks of wavelength 1612 and 1532 cm-1 in the
spectrum of dye which indicates the presence of -N=N- stretching in the control dye are not seen
in the spectrum of degraded metabolites which reflects the breakdown of azo bond.
Devi et al. (2018) reported a bacterium B. cereus isolated from contaminated soil present
near the vicinity of textile effluent. It was involved in the biodegradation of azo dye called Remazol
Red RB. FTIR spectrum before and after the degradation process showed a marked difference.
Stretching of C-N amine and alkene group was confirmed by the presence of peaks at 1040.44 cm-
1 and 954.80 cm-1. Moreover, O-H stretching of acids was confirmed by a peak at 2929.13 cm-1.
The degradation of disperse textile dye Brown 3REL by another Bacillus sp. was further
confirmed by FTIR spectrum (Dawker et al., 2008). The presence of a peak at 1458 cm-1 in the
spectrum degraded metabolites showed the C-H asymmetric deformation of alkane while the peak
at the frequency of 1667 cm-1 represented the C=N stretching which results the release of amine
group.
S. saprophyticus BHUSS X3 a bacterium isolated from the soil found in the vicinity of
carpet industry was efficiently able to decolorize a widely used acidic azo dye in the carpet industry
Navy N5RL1 (Kumari et al., 2015). The absence of peak with frequency of 1598.93 cm-1 which is
due to presence of aromatic nitrogen compound in azo dye spectrum clearly represents the
degradation of azo bond. The O-H stretching was confirmed by the presence of peak at frequency
of 3230 cm-1. The peak with the frequency of 1667 cm-1 represented the C=N stretching. The peak
with the frequency of 1455 cm-1 indicated the asymmetric deformation in the structure of alkanes
which usually results in the formation of oximes and amines or nitroso compounds by the
rearrangement of oximes.

98
The absence of peak of wavelength 1631 cm-1 in FTIR spectrum of Marinobacter sp. strain
HBRA treated Direct Blue-1 sample as compared to the spectrum of control dye clearly
demonstrated the decolorization of azo bond (Prasad et al., 2013). Shyamala et al., 2014 reported
the breakdown of Methyl Orange by halotolerant Bacillus sp. as peaks of wavelength 1567 and
1424 cm-1 which were present in FTIR spectrum of control dye were absent in spectrum of
bacterially treated sample.
GC-MS
It is a combination of two techniques i.e., gas chromatography and mass spectroscopy. It
is used for the identification of different substances within a sample at molecular level. The heating
of a testing substance degrades it into its products which is then mixed with an inert gas (helium).
Then they flow into MS where their identification is done on the basis of their mass.
Hungerer et al. (1996) reported that the azo-dye degraded compound 1,2- benzene dicarboxylic
acid, butyl 8-methylnonyl ester was cleaved to form phthalic acid and palmitic acid. Yang et al.,
(2018) reported the identification of degradation products of Direct Blue 15 dye by GC-MS. The
products were identified as 1- amino-8-napthol, 3, 3ʹ-dimethylbenzidine, anti-pentenoic acid, 2-
amino phenol and phenol.
Our findings are similar with other studies that reported that the predominant compounds found
in the final dye treated sample were 3-Aminobutanoic acid, pyrrolo pyrazine-1, 4-dione and
palmitic acid (Harwood and Parales, 1996; Walker and Van der, 2016; Shanmugam et al., 2017).
In the current research, it is confirmed through GC-MS analysis that azo dye enzymatically
converted into various end products which may be involved in the synthesis of energy yielding
processes.

99
The proposed metabolic pathway demonstrating the degradation of Synazol Red HF-6BN into
metabolites by A. faecalis and S. lentus 1m is given in the figure 37and 38 respectively.
Microbial Toxicity
The textile effluent is discharged into water bodies, so it also become a cause of damaging
agriculturally important microbial flora. The biodegraded products of azo dyes were checked for
their toxicity for agriculturally important microbial flora. The results showed that the biodegraded
products were not harmful for various tested agriculturally important microorganisms.
Ilyas and Rehman (2013) reported two fungal species i.e., Aspergillus niger and Nigrospora
sp. whose decolorized sample was proved safe for the microbial species. The microbial toxicity of
dye degraded products was also checked by Gomaa (2016). The degraded products of various dyes
produced by B. subtilis, B. cereus, B. licheniformis and Pseudomonas sp. were proved safe
for microbial flora as no zone of inhibition was observed in microbial toxicity plate assay.
The degradation products of Sudan 1 by B. circulans BWL1061 and S. putrefaciens CN32 showed
a decreased toxicity to E. coli BL21 and B. subtilis 168 (Liu et al., 2018).
Phytotoxicity
We are living in a country which is having depleted water resources. The need of
time is that not only to conserve natural water resources but also make it possible to bring
in use the microbially treated wastewater. For this purpose, the toxicity of treated
wastewater was checked for plants. The plants watered with treated waste water showed
efficient growth as compared to those watered with untreated wastewater (Fig. 39).
Nair et al. (2017) produced the same results as they used the B. megaterium treated
wastewater for growing Vigna radiata. The plants watered with treated wastewater showed fair
growth in comparison to those watered with untreated wastewater.

100
Figure 37: Synazol Red HF 6BN dye enters into the cell (A. aquatilis 3c) by unknown mechanism.
Upon entrance into the cell the dye is enzymatically processed into various end products. Most
probably, azo group (-N=N-) is reduced, followed by cleavage reaction and different end products
are produced. Secondly, desulfonation and oxidative deamination results in synthesis of
pyrrolo[1,2-a] pyrazine-1,4-dione derivative which can be used as substrates in amino acid
metabolism. The amino acid catabolism can synthesize pyruvate (3C compound) which can be
converted into acetyl-CoA. The acetyl-CoA undergoes Krebs cycle to produce NADH2 and
FADH2 (substrates of electron transport chain). Moreover, dye desulfonation, oxidative
deamination and carboxylation lead to produce phthalate derivatives, which can be transformed
into different fatty acids and aldehydes. The phthalate, fatty acids and aldehydes can
directly/indirectly enter into fatty acid oxidation reactions (β-oxidation) to produce acetyl-CoA,
NADH2 and FADH2 (Sarkar et al., 2017).

101
Figure 38: Synazol Red HF 6BN dye enters into the cell (Staphyloccocus lentus 1M) by unknown
mechanism. Upon entrance into the cell the dye is enzymatically processed into various end
products. Most probably, azo group (-N=N-) is reduced, followed by cleavage reaction and
different end products are produced. Secondly, desulfonation and oxidative deamination
eventually results in synthesis of 4-guanidinobutanoic acid derivative which can be used as
substrates in amino acid metabolism. The amino acid catabolism can synthesize pyruvate (3C
compound) which can be converted into acetyl-CoA. The acetyl-CoA undergoes Krebs cycle to
produce NADH2 and FADH2 (substrates of electron transport chain). Moreover, dye desulfonation,
oxidative deamination and carboxylation lead to produce phthalate derivatives, which can be
transformed into different fatty acids and aldehydes. The phthalate, fatty acids and aldehydes can
directly/indirectly enter into fatty acid oxidation reactions (β-oxidation) to produce acetyl-CoA,
NADH2 and FADH2 (Parmar and Shukla, 2018).

102
Figure 39: Flow diagram demonstrating the microbial treatment of textile effluent for dye
degradation and its use of treated for the growth of plants.
Textile
effluent
(Lahore)

103
REFERENCES
Acuner, E. and Dilek, F. B., 2004. Treatment of tectilon yellow 2G by Chlorella vulgaris. Process
aBiochem., 39: 623-631.
Aghaie-Khouzani, M., Forootanfar, H., Moshfegh, M., Khoshayand, M. R. and Faramarzi, M. A.,
2012. Decoloration of some synthetic dyes using optimized culture broth of laccase
producing ascomycete Paraconiothyrium variabile. Biochem. Eng. J., 60: 9–15.
Ajaz, M., Elahi, A. and Rehman, A., 2018. Degradation of azo dye by bacterium, Alishewanella
sp. CBL-2 isolated from industrial effluent and its potential use in decontamination of
wastewater. J. Water Reuse Desalination, 8(4): 507-515.
Aksu, Z. and Donmez, G. A., 2003. Comparative study on the biosorption characteristics of some
yeast for Remazol blue reactive dye. Chemosphere, 50: 1075–1083.
Aksu, Z. and Donmez, G., 2005. Combined effects of molasses sucrose and reactive dye on the
growth and dye bioaccumulation properties of Candida tropicalis. Process Biochem., 40:
2443-2454.
Aksu, Z., Kilic, N. K., Ertugrul, S. and Donmez, G., 2007. Inhibitory effects of chromium (VI)
and dyestuff removal by Trametes versicolor. Enzyme Microbiol. Technol., 40: 1167 -
1174.
Ambrosio, S. T., Vilar, Junior, J. C., da Silva, C. A. A., Okada, K., Nascimento, A. E., Longo, R.
L, Campos-Takaki, G. M., 2012. A biosorption isotherm model for the removal of reactive
azo dyes by inactivated mycelia of Cunninghamella elegans UCP542. Molecules, 17: 452–
462.

104
Amoozegar, M. A., Hajighasemi, M., Hamedi, J., Asad, S. and Ventosa, A., 2011. Azo dye
decolorization by halophilic and halotolerant microorganisms. Ann. Microbiol., 61: 217–
230.
Ang, E. L., Zhao, H. and Obbard, J. P., 2005. Recent advances in the bioremediation of persistent
organic pollutants via biomolecular engineering. Enzyme Microbiol. Technol., 37: 487–
496.
Anjaneya, O., Souche, S. Y., Santoshkumar, M. and Karegoudar, T. B., 2011. Decolorization of
sulfonated azo dye Metanil Yellow by newly isolated bacterial strains: Bacillus sp. strain
AK1 and Lysinibacillus sp. strain AK2. J. Hazard. Mater., 190: 351–358.
Asgher, M., Bhatti, H. N., Ashraf, M. and Legge, R. L., 2008. Recent developments in
biodegadation of industrial pollutants by white rot fungi and their enzyme system.
Biodegrad., 19: 771–783.
Asgher, M., Bhatti, H. N., Shah, S. A. H., Asad, M. J. and Legge, R. L., 2007. Decolorization
potential of mixed microbial consortia for reactive and disperse textile dyestuffs.
Biodegrad., 18: 311–316.
Asgher, M., Kausar, S., Bhatti, H. N., Shah, S. A. H. and Ali, M., 2008. Optimization of medium
for decolorization of Solar golden yellow R direct textile dye by Schizophyllum commune
IBL-06. Int. Biodeter. Biodegrad., 61: 189–193.
Axelsson, J., Nilsson, U., Terrazas, E., Alvarez, T. and Welander, U., 2006. Decolorization of the
Ayed, L., Khelifi, E., Jannet, H. B, Miladi, H., Cheref, A., Achour, S. and Bakhrouf, A., 2010.
Response surface methodology for decolorization of azo dye Methyl Orange by bacterial
consortium: produced enzymes and metabolites characterization. Chem. Eng. J., 165: 200–
208.

105
Ayed, L., Mahdhi, A., Cheref, A. and Bakhrouf, A., 2011. Decolorization and degradation of azo
dye Methyl Red by an isolated Sphingomonas paucimobilis: biotoxicity and metabolites
characterization. Desalination, 274: 272–277.
Azizullah, A., Khattak, M. N. K., Richter, P. and Häder, D., 2010. Water pollution in Pakistan and
its impact on public health — A review. aa 37: 479-497.
Babu, B. R., Parande, A. K., Raghu, S., and Kumar, T. P., 2007. Cotton textile processing: waste
generation and effluent treatment. J. Cotton Sci., 11: 141–153.
Bakshi, D. K., Saha, S., Sindhu, I. and Sharma, P., 2006. Use of Phanerochaete chrysosporium
biomass for the removal of textile dyes from a synthetic effluent. World J. Microbiol.
Biotech., 22: 835–839.
Baldrian, P., 2006. Fungal laccases – occurrence and properties. FEMS Microbiol, Rev., 30: 215–
242.
Banat, I. M., Nigam, P., Singh, D. and Merchant, R., 1996. Microbial decolorization of textile-dye
containing effluent: A review. Bioreour. Technol., 58(3): 217-227.
Barragan, B. E., Costa, C. and Marquez, M. C., 2007. Biodegradation of azo dyes by bacteria
inoculated on solid media. Dyes Pigments, 75: 73–81.
Behnajady, M. A., Modirshahla, N. and Shokri, M., 2004. Photodestruction of acid orange 7 (AO7)
in aqueous solutions by UV/H2O2: influence of operational parameters. Chemosphere, 55:
129-134.
Bhatnagar, A. and Sillanpaa, M., 2010. Utilization of agro-industrial and municipal waste
materials as potential adsorbents for water treatment: a review. Chem. Eng. J., 157: 277–
296.
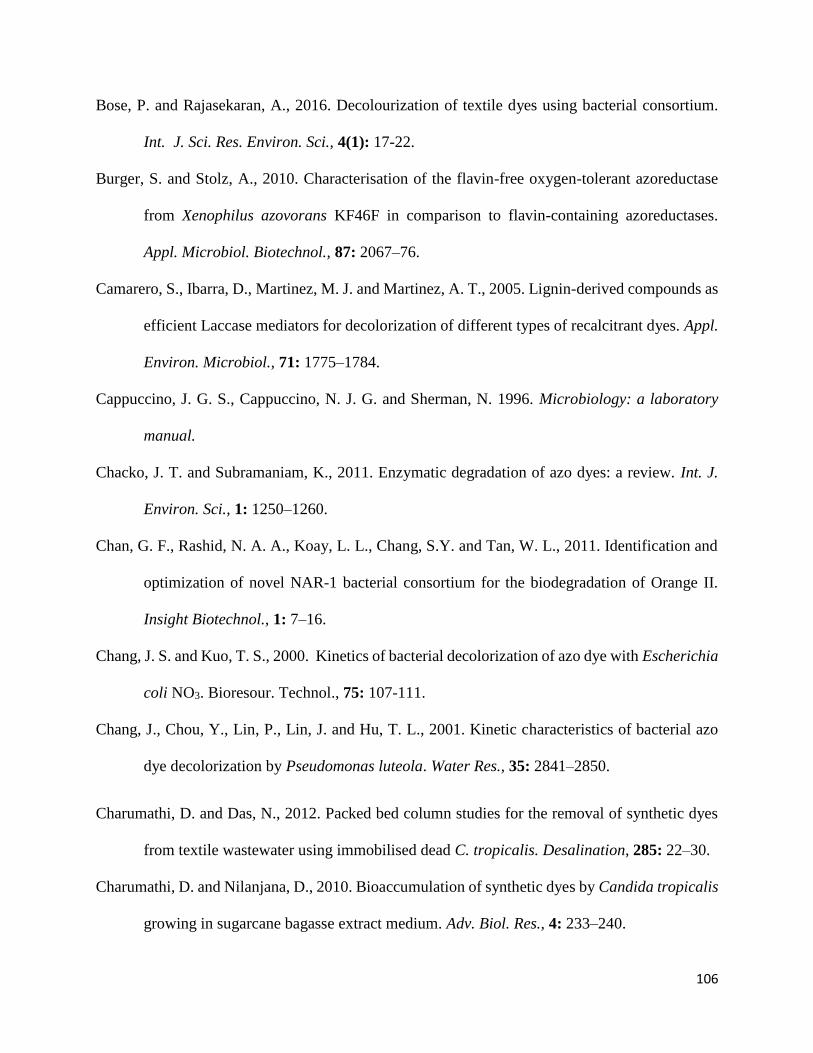
106
Bose, P. and Rajasekaran, A., 2016. Decolourization of textile dyes using bacterial consortium.
Int. J. Sci. Res. Environ. Sci., 4(1): 17-22.
Burger, S. and Stolz, A., 2010. Characterisation of the flavin-free oxygen-tolerant azoreductase
from Xenophilus azovorans KF46F in comparison to flavin-containing azoreductases.
Appl. Microbiol. Biotechnol., 87: 2067–76.
Camarero, S., Ibarra, D., Martinez, M. J. and Martinez, A. T., 2005. Lignin-derived compounds as
efficient Laccase mediators for decolorization of different types of recalcitrant dyes. Appl.
Environ. Microbiol., 71: 1775–1784.
Cappuccino, J. G. S., Cappuccino, N. J. G. and Sherman, N. 1996. Microbiology: a laboratory
manual.
Chacko, J. T. and Subramaniam, K., 2011. Enzymatic degradation of azo dyes: a review. Int. J.
Environ. Sci., 1: 1250–1260.
Chan, G. F., Rashid, N. A. A., Koay, L. L., Chang, S.Y. and Tan, W. L., 2011. Identification and
optimization of novel NAR-1 bacterial consortium for the biodegradation of Orange II.
Insight Biotechnol., 1: 7–16.
Chang, J. S. and Kuo, T. S., 2000. Kinetics of bacterial decolorization of azo dye with Escherichia
coli NO3. Bioresour. Technol., 75: 107-111.
Chang, J., Chou, Y., Lin, P., Lin, J. and Hu, T. L., 2001. Kinetic characteristics of bacterial azo
dye decolorization by Pseudomonas luteola. Water Res., 35: 2841–2850.
Charumathi, D. and Das, N., 2012. Packed bed column studies for the removal of synthetic dyes
from textile wastewater using immobilised dead C. tropicalis. Desalination, 285: 22–30.
Charumathi, D. and Nilanjana, D., 2010. Bioaccumulation of synthetic dyes by Candida tropicalis
growing in sugarcane bagasse extract medium. Adv. Biol. Res., 4: 233–240.

107
Chen, B.Y., Hsueh, C. C, Chen, W. M. and Li, W. D., 2011. Exploring decolorization and
halotolerance characteristics by indigenous acclimatized bacteria: chemical structure of
azo dyes and dose–response assessment. J. Taiwan Inst. Chem. Eng. 42: 816–825.
Chen, B.Y., Zhang, M. M., Chang, C. T., Ding, Y., Chen, W. M., Hsueh, C. C., 2011. Deciphering
azo dye decolorization characteristics by indigenous Proteus hauseri: chemical structure.
J. Taiwan Inst. Chem. Eng., 42: 327–333.
Chen, K. C., Wu, J. Y., Liou, D. J. and Hwang, S. C. J., 2003. Decolorization of the textile dyes
by newly isolated bacterial strains. J. Biotechnol., 101: 57-68.
Chen, T., Gao, B. and Yue, Q., 2010. Effect of dosing method and pH on color removal
performance and floc aggregation of polyferric chloride–polyamine dual-coagulant in
synthetic dyeing wastewater treatment. Colloids Surf A: Physicochem. Eng. Asp., 355:
121-129.
Chougule, A. S., Jadhav, S. B. and Jadhav, J. P., 2014. Microbial degradation and detoxification
of synthetic dye mixture by Pseudomonas sp. SUK 1. Pro. Nation. Acad. Sci. Ind. Sec. B:
Bio. Sci., 84(4): 1059-1068.
Christie, R. M., 2007. Environmental aspects of textile dyeing. Elsevier.
Chung, K.T. and Stevens, S. E., 1993. Decolorization of azo dyes by environmental
microorganisms and helminths. Environ. Toxicol. Chem., 12: 2121-2132.
Dafale N., Wate, S. R., Meshram S. U. and Rao, N. N., 2010. Bioremediation of wastewater
containing azo dyes through sequential anaerobic-aerobic bioreactor system and its
biodiversity. Environ. Rev., 18: 21–36.

108
Dafale, N., Rao, N. N., Meshram, S. U. and Wate, S. R., 2008. Decolorization of azo dyes and
simulated dye bath wastewater using acclimatized microbial consortium: biostimulation
and halo tolerance. Bioresour. Technol., 99: 2552–2558.
Das, D., Charumathi, D. and Das, N., 2010. Combined effects of sugarcane bagasse extract and
synthetic dyes on the growth and bioaccumulation properties of Pichia fermentans MTCC
189. J. Hazard. Mater., 183: 497–505.
Das, D., Charumathi, D. and Das, N., 2011. Bioaccumulation of the synthetic dye Basic Violet 3
and heavy metals in single and binary systems by Candida tropicalis grown in a sugarcane
bagasse extract medium: modelling optimal conditions using response surface
methodology (RSM) and inhibition kinetics. J. Hazard. Mater., 186:1541–1552.
Dawkar, V. V., Jadhav, U. U., Jadhav, S. U. and Govindwar, S. P., 2008. Biodegradation of
disperse textile dye Brown 3REL by newly isolated Bacillus sp. VUS. J. Appl. Microbiol.,
105(1): 14-24.
Devi, P. S., Madhuri, T. and Indrani V., 2018. Analytical biodegradation of azo dye (Remazol Red
RB) by Bacillus cereus. J. Chem. Pharma. Res., 10(4): 74-80.
Dhanve, R. S., Shedbalkar, U. U. and Jadhav, J. P., 2008. Biodegradation of diazo Reactive dye
Navy blue HE2R (Reactive blue 172) by an isolated Exiguobacterium sp. RD3. Biotechnol.
Bioprocess. Eng., 13: 53–60.
dos Santos, A. B., Cervantes, F. J. and Van Lier, J. B., 2007. Review paper on current technologies
for decolourisation of textile wastewaters: perspectives for anaerobic biotechnology.
Bioresour. Technol., 98: 2369–2385.
Dua, M., Singh, A., Sethunathan, N. and Johri, A. K., 2002. Biotechnology and bioremediation:
successes and limitations. Appl. Microbiol. Biotechnol., 59: 143–152.

109
Dubey, S. K., Dubey, J., Viswas, A. J. and Tiwari, P., 2011. Studies on Cyanobacterial biodiversity
in paper mill and pharmaceutical industrial effluents. Br. Biotechnol. J. 1: 61–70.
Duran, N. and Esposito, E., 2000. Potential applications of oxidative enzymes and phenoloxidase-
like compounds in wastewater and soil treatment: a review. Appl. Catal. B: Environ., 28:
83–99.
El-Sheekh, M. M., Gharieb, M. M. and Abou-El-Souod, G. W., 2009. Biodegradation of dyes by
some green algae and cyanobacteria. Int. Biodeter. Biodegrad., 63: 699–704.
Enayatizamir, N., Tabandeh, F., Rodriˇıguez Couto, S., Yakhchali, B., Alikhani, H. A.,
Mohammadi, L., 2011. Biodegradation pathway and detoxification of the diazo dye
Reactive Black 5 by Phanerochaete chrysosporium. Bioresour. Technol., 102: 10359–
10362.
Erden, E., Kaymaz, Y. and Pazarlioglu, N. K., 2011. Biosorption kinetics of a direct azo dye Sirius
Blue K-CFN by Trametes versicolor. Electron J. Biotechnol., 14: 1–10.
Ergene, A., Ada, K., Tan, S. and Katırcıoglu, H., 2009. Removal of Remazol Brilliant Blue R dye
from aqueous solutions by adsorption onto immobilized Scenedesmus quadricauda:
equilibrium and kinetic modeling studies. Desalination, 249: 1308–1314.
Erkurt, A. E., Unyayar, A. and Kumbur, H., 2007. Decolorization of synthetic dyes by white rot
fungi, involving laccase enzyme in the process. Process Biochem., 42: 1429–1435.
Ertu˘grul, S., San, N. O. and Donmez, G., 2009. Treatment of dye (Remazol Blue) and heavy
metals using yeast cells with the purpose of managing polluted textile wastewaters. Ecol.
Eng., 35: 128–134.
Ertugrul, S., Bakır, M. and Donmez, G., 2008. Treatment of dye-rich wastewater by an
immobilized thermophilic cyanobacterial strain: Phormidium sp. Ecol. Eng., 32: 244–248.

110
Fan, F., Zhuo, R., Sun, S., Wan, X., Jiang, M., Zhang, X. and Yang, Y., 2011. Cloning and
functional analysis of a new laccase gene from Trametes sp. 48424 which had the high
yield of laccase and strong ability for decolorizing different dyes. Bioresour. Technol., 102:
3126–3137.
Fang, Z., Li, T., Wang, Q., Zhang, X., Peng, H, Fang, W., Hong, Y., Ge, H. and Xiao, Y., 2011. A
bacterial laccase from marine microbial metagenome exhibiting chloride tolerance and dye
decolorization ability. Appl. Microbiol. Biotechnol., 89: 1103–1110.
Forgacs, E., Cserhati, T. and Oros, G., 2004. Removal of synthetic dyes from wastewaters: a
review. Environ. Int. 30: 953–971.
Forss, J. and Welander, U., 2011. Biodegradation of azo and anthraquinone dyes in continuous
systems. Int. Biodeter. Biodegrad., 65: 227–237.
Fu, F. and Viraraghavan, T., 2001. Fungal decolorization of dye wastewaters: a review. Bioresour.
Technol., 79: 251–262.
Fu, Y. and Viraraghavan, T., 2000. Removal dye from an aqueous solution by fungus Aspergillus
niger. Water Qual. Res. J. Can., 35: 95–111.
Gabriel, H. and Hong, J., 2008. Decolouration of reactive blue dye KN-R. Res. J. Appl. Sci., 3:
216-224.
Ganesh, R., Boardman, G. D. and Michelson, D., 1994. Fate of azo dyes in sludges. Water Res.,
28: 1367–1376.
Gao, S., Tao, F., Wu, L., Huang, M. and Chen, C., 2010. Evaluation of the damage by dyestuffs
and NaCl on Phanerochaete chrysosporium. Environ. Prog. Sustainable Energy, 29: 428–
434.

111
Ghodake, G., Jadhav, U., Tamboli, D., Kagalkar, A. and Govindwar, S., 2011. Decolorization of
textile dyes and degradation of mono-azo dye Amaranth by Acinetobacter
calcoaceticus NCIM 2890. Ind. J. Microbiol., 51: 501–508.
Gill, M. and Strauch, R. J., 1984.Constituents of Agaricus xanthodermus Genevier: the first
naturally endogenous azo compound and toxic phenolic metabolites. Zeitschrift fur
Naturforschung C: J. Biosci., 39c: 1027 -1029.
Gomaa, E. Z., 2016. Biodegradation and detoxification of azo dyes by some bacterial strains. J.
Microbiol., 6(1-2): 15-24.
Gonen, F. and Aksu, Z.,2009. Predictive expressions of growth and Remazol Turquoise Blue-G
reactive dye bioaccumulation properties of Candida utilis. Enzyme Microbiol. Technol.,
45: 15-21.
Gonzalez-Gutierrez, L. V. and Escamilla-Silva, E.M., 2009. Reactive red azo dye degradation in
a UASB bioreactor: mechanism and kinetics. Eng. Life Sci., 9: 311–316.
Guadie, A., Tizazua, S., Meleseb, M., Guoc, W., Ngo, H. H., Xiad, S., 2017. Biodecolorization of
textile azo dye using Bacillus sp. strain CH12 isolated from alkaline lake. Biotechnol.
Reports, 15: 92-100.
Gupta, V. K., 2009. Application of low-cost adsorbents for dye removal-A review. J Environ.
Manage., 90: 2313-2342.
Halaburgi, V., Sharma, S., Sinha, M., Singh, T, P. and Karegoudar, T. B., 2011. Purification and
characterization of a thermostable laccase from the ascomycetes Cladosporium
cladosporioides and its applications. Process Biochem., 46: 1146–1152.
Hao, O. J., Kim, H. C and Hiang, P. C., 2000. Decolorization of wastewater. Critical reviews.
Environ. Sci. Technol., 30: 449 -505.

112
Hao, O. J., Kim, H. C. and Hiang, P. C., 2000. Decolorization of wastewater. Critical reviews.
Environ. Sci. Technol., 30: 449 -505.
Harwood, C. S., Parales, R. E., 1996. The beta-ketoadipate pathway and the biology of self
identity. Annu. Rev. Microbiol., 50: 553-590.
Houk, V. S., 1992. The genotoxicity of industrial wastes and effluents: A review. Mutat. Res., 277:
91–138.
Hsueh, C. C., Chen, B. Y. and Yen, C. Y., 2009. Understanding effects of chemical structure on
azo dye decolorization characteristics by Aeromonas hydrophila. J. Hazard. Mater., 167:
995–1001.
Hunger, K., (Ed.), 2003. Industrial dyes: chemistry, properties, applications. John Wiley & Sons.
Hungerer, C., Troup, B., Römling, U. and Jahn, U. D., 1996. Regulation of the hemA gene during
5-aminolevulinic acid formation in Pseudomonas aeruginosa. J. Bacteriol. 177: 1435-43.
Husain, M. and Husain, Q., 2007. Applications of redox mediators in the treatment of organic
pollutants by using oxidoreductive enzymes: a review. Crit. Rev. Env. Sci. Technol., 38:
1–42.
Husain, Q. and Ulber, R., 2011. Immobilized peroxidase as a valuable tool in the remediation of
aromatic pollutants and xenobiotic compounds: a review. Crit. Rev. Env. Sci. Technol., 41:
770-804.
Husain, Q., 2010. Peroxidase mediated decolorization and remediation of wastewater containing
industrial dyes: a review. Rev. Environ. Sci. Biotechnol., 9: 117–140.
Ilyas, S. and Rehman, A., 2013. Decolorization and detoxification of Synozol red HF-6BN azo
dye, by Aspergillus niger and Nigrospora sp. Iranian J. Environ. Health Sci. Eng., 10: 12.

113
Iqbal, M. and Saeed, A., 2007. Biosorption of reactive dye by loofa sponge-immobilized fungal
biomass of Phanerochaete chrysosporium. Process Biochem., 42: 1160–1164.
Jadhav, J. P., Kalyani, D. C., Telke, A. A., Phugare, S. S. and Govindwar, S. P., 2010. Evaluation
of the efficacy of a bacterial consortium for the removal of color, reduction of heavy metals
and toxicity from textile dye effluent. Bioresour. Technol., 101: 165–173.
Jadhav, J. P., Parshetti, G. K., Kalme, S. D. and Govindwar, S. P., 2007. Decolourization of azo
dye Methyl Red by Saccharomyces cerevisiae MTCC 463. Chemosphere, 68: 394–400.
Jadhav, J. P., Phugare, S. S., Dhanve, R. S. and Jadhav, S. B., 2010. Rapid biodegradation and
decolorization of Direct Orange 39 (Orange TGLL) by an isolated bacterium strain BCH.
Biodegrad., 21: 453–463.
Jadhav, S. B., Phugare, S. S., Patil, P. S. and Jadhav, J. P., 2011. Biochemical degradation pathway
of textile dye Remazol Red and subsequent toxicological evaluation by cytotoxicity,
genotoxicity and oxidative stress studies. Int. Biodeter. Biodegrad., 65: 733–743.
Jimenez-Juarez, N., Roman-Miranda, R., Baeza, A., Sanchez-Amat, A., Vazquez-Duhalt, R. and
Valderrama, B., 2005. Alkali and halide-resistant catalysis by the multipotent oxidase from
Marinomonas mediterranea. J. Biotechnol., 117: 73–82.
Jin, X. C., Liu, G. Q., Xu, Z. H., Tao, W. Y., 2007. Decolorization of a dye industry effluent by
Aspergillus fumigatus XC6. Appl. Microbiol. Biotechnol., 74: 239-243.
Joe, M., Lim, S. Y., Kim, D. H. and Lee, I. S., 2008. Decolorization of textile dyes by Clostridium
bifermentans SL186 isolated from contaminated soil. World J. Microbiol. Biotechnol., 24:
2221–2226.

114
Joshi, S. M., Inamdar, S. A., Telke, A. A., Tamboli, D. P. and Govindwar, S. P., 2010. Exploring
the potential of natural bacterial consortium to degrade mixture of dyes and textile effluent.
Int. Biodeter. Biodegrad., 64: 622–628.
Kalyani, D. C., Telke, A. A., Dhanve, R. S. and Jadhav, J. P., 2008. Ecofriendly biodecolorization
and detoxification of reactive red 2 textile dye by newly isolated Pseudomonas sp. SUK1.
J. Hazard. Mater., 163: 735.
Kalyani, D., Dhiman, S. S., Kim, H., Jeya, M., Kim, I. W. and Lee, J. K., 2012. Characterization
of a novel laccase from the isolated Coltricia perennis and its application to detoxification
of biomass. Process Biochem., 47(4): 671-678.
Karimi, A., Vahabzadeh, F. and Bonakdarpour, B., 2006. Use of Phanerochaete chrysosporium
immobilized on kissiris for synthetic dye decolourization: involvement of manganese
peroxidase. World J. Microbiol. Biotech., 22: 1251–1257.
Kaushik, P. and Malik, A., 2009. Fungal dye decolourization: recent advances and future potential
review article. Environ. Int., 35: 127–141.
Keck, A., Klein, J., Kudlich, M., Stolz, A., Knackmuss, H. J., Mattes, R., 1997. Reduction of azo
dyes by redox mediators originating in the naphthalenesulfonic acid degradation pathway
of Sphingomonas sp. strain BN6. Appl. Enviro. Microbiol., 63(9): 3684–3690.
Khan, Z., Nisar, M. A., Hussain, Z. H., Arshad, M. N. and Rehman, A., 2015. Cadmium resistance
mechanism in Escherichia coli P4 and its potential use to bioremediate environmental
cadmium. Appl. Microbiol. Biotechnol., 99(24): 10745-10757.
Khelifi, E., Ayed, L., Bouallagui, H., Touhami, Y. and Hamdi, M., 2009. Effect of nitrogen and
carbon sources on Indigo and Congo red decolourization by Aspergillus alliaceus strain
121C. J. Hazard. Mater., 163: 1056–1062.

115
Khlifi, R., Belbahri, L., Woodward, S., Ellouz, M., Dhouib, A., Sayadi, S. and Mechichi, T., 2010.
Decolorization and detoxification of textile industry wastewater by the laccase-mediator
system. J. Hazard. Mater., 175: 802–808.
Kirk-Othmer, 1979. Encyclopedia of Chemical Technology. 3rd Ed, pp. 1-172, New York: Wiley-
Inter Science.
Kodam, K. M., Soojhawon, I., Lohande, P.D. and Gawai, K.R., 2005. Microbial decolorization of
reactive azo dyes under aerobic conditions. World J. Microbiol. Biotechnol., 21: 367–370.
Kumari, L., Verma, A. K., Tiwary, D., Giri, D. D., Nath, G. and Mishra, P. K., 2015.
Biodegradation of Navy N5RL1 carpet dye by Staphylococcus saprophyticus strain
BHUSS X3. Biotech., 5: 775–782.
Kurade, M. B., Waghmode, T. R. and Govindwar, S. P., 2011. Preferential biodegradation of
structurally dissimilar dyes from a mixture by Brevibacillus laterosporus. J. Hazard.
Mater., 192: 1746–1755.
Lade, H. S., Kadam, A. A., Paul, D. and Govindwar, S., 2015. Biodegradation and detoxification
of textile azo dyes by bacterial consortium under sequential microaerophilic/aerobic
processes. EXCLI J., 14: 158-174.
Lade, H., Govindwar, S. and Paul, D., 2015. Low-cost biodegradation and detoxification of textile
azo dye C.I. Reactive blue 172 by Providencia rettgeri strain HSL1. J. Chem., 2015: 10.
Latif, A., Noor, S., Sharif, Q. M. and Najeebullah, M., 2010. Different techniques recently used
for the treatment of textile dyeing effluents: a review. J. Chem. Soc. Pak., 32: 115–124.
Levin, L., Melignani, E. and Ramos, A. M., 2010. Effect of nitrogen sources and vitamins on
ligninolytic enzyme production by some white-rot fungi. Dye decolorization by selected
culture filtrates. Bioresour. Technol., 101: 4554–4563.

116
Liers, C., Bobeth, C., Pecyna, M., Ullrich, R. and Hofrichter, M., 2010. DyP-like peroxidases of
the jelly fungus Auricularia auricula-judae oxidize nonphenolic lignin model compounds
and high-redox potential dyes. Appl. Microbiol Biotechnol., 85:1869–1879.
Lim, S. L., Chu, W. L. and Phang, S. M., 2010. Use of Chlorella vulgaris for bioremediation of
textile wastewater. Bioresour. Technol., 101: 7314–7322.
Lin, S. H. and Peng, C. F., 1994. Treatment of textile wastewater by electrochemical method.
Water Res., 28: 277-282.
Lin, S. H. and Peng, C. F., 1996. Continuous treatment of textile wastewater by combined
coagulation, electrochemical oxidation and activated sludge. Water Res., 30: 587 -592.
Lin, Y. H. and Leu, J.Y., 2008. Kinetics of reactive azo-dye decolorization by Pseudomonas
luteola in a biological activated carbon process. Biochem. Eng. J., 39: 457–467.
Liu, G., Zhou, J., Lv, H., Xiang, X., Wang, J. and Qv, Y., 2007. Azoreductase from Rhodobacter
sphaeroides AS1.1737 is a flavodoxin that also functions as nitroreductase and flavin
mononucleotide reductase. Appl. Microbiol. Biotechnol., 76: 1271–1279.
Liu, W., You, Y., Sun, D. and Wang, S., 2018. Decolorization and detoxification of water insoluble
Sudan dye by Shewanella putrefaciens CN32 co-cultured with Bacillus circulans
BWL1061. Ecotoxicol. Environ. Safety, 166: 11-17.
Liu, X., Zhang, J., Jiang, J., Li, R., Xie, Z. and Li, S., 2011. Biochemical degradation pathway of
reactive blue 13 by Candida rugopelliculosa HXL-2. Int. Biodeter. Biodegrad., 65: 135–
141.
Lucas, M. S., Amaral, C., Sampaio, A., Peres, J. A. and Dias, A. A., 2006. Biodegradation of the
diazo dye Reactive Black 5 by a wild isolate of Candida oleophila. Enzyme Microbiol.
Technol., 39: 51–55.

117
Machado, K. M. G., Compart, L. C. A., Morais, R. O., Rosa, L. H. and Santos, M. H., 2006.
Biodegradation of reactive textile dyes by basidiomycetous fungi from Brazilian
ecosystems. Braz. J. Microbiol., 37: 481–487.
Majeau, J. A., Brar, S. K. and Tyagi, R. D., 2010. Laccases for removal of recalcitrant and
emerging pollutants. Bioresour. Technol., 101: 2331–2350.
Mali, P. L., Mahajan, M. M., Patil, D. P. and Kulkarni, M. V., 2000. Bio-decolorization of
members of triphenyl methane and azo group of dyes. J. Sci. Ind. Res., 59: 221-224.
Malik, S. N., Ghosh, P. C., Vaidya, A. N., Waindeskar, V., Das, S. and Mudliar, S. N., 2017.
Comparison of coagulation, ozone and ferrate treatment processes for color, COD and
toxicity removal from complex textile wastewater. Water Sci. Technol., 76: 1001-1010.
Martorell, M. M., Pajot, H. F. and de Figueroa, L. I. C., 2012. Dye-decolourizing yeasts isolated
from Las Yungas rainforest Dye assimilation and removal used as selection criteria. Int.
Biodeter. Biodegrad., 66: 25–32.
Masneuf-Pomarade, I., Jeuneb, C. L., Durrensc, P., Lollierb, M., Aigled, M. and Dubourdieu, D.,
2007. Molecular typing of wine yeast strains Saccharomyces bayanus var. uvarum using
microsatellite markers. Sys. Appl. Microbiol., 30: 75-82.
Matsumoto, K., Mukai, Y., Ogata, D., Shozui, F., Nduko, J. M. and Taguchi, S. and Ooi, T., 2010.
Characterization of thermostable FMN-dependent NADH azoreductase from the moderate
thermophile Geobacillus stearothermophilus. Appl. Microbiol. Biotechnol., 86: 1431–
1438.
McMullan, G., Meehan, C., Conneely, A., Kirby, N., Robinson, T. and Nigam, P., Banat, I.,
Merchant, R. and Smyth, W., 2001. Microbial decolourisation and degradation of textile
dyes. Appl. Microbiol. Biotechnol., 56: 81–87.

118
Meerbergen, K., Willims, K. A., Dewil, F., Impe, J. V., Appels, L. and Lievens, B., 2018. Isolation
and screening of bacterial isolates from wastewater treatment plants to decolorize azo dyes.
J. Biosci. Bioengineer., 125(4): 448-456.
Megharaj, M., Ramakrishnan, B., Venkateswarlu, K., Sethunathan, N. and Naidu, R., 2011.
Bioremediation approaches for organic pollutants: a critical perspective. Environ. Int., 37:
1362–1375.
Mendes, S., Pereira, L., Batista, C. and Martins, L. O., 2011. Molecular determinants of
azoreduction activity in the strain Pseudomonas putida MET94. Appl. Microbiol.
Biotechnol., 92: 393–405.
Meng, X., Liu, G., Zhou, J., Fu, Q. S. and Wanga, G., 2012. Azo dye decolorization by Shewanella
aquimarina under saline conditions. Bioresour, Technol., 114: 95–101.
Mester, T. and Tien, M., 2000. Oxidation mechanism of ligninolytic enzymes involved in the
degradation of environmental pollutants. Int. Biodeter. Biodegrad., 46: 51-59.
Misal, S. A., Lingojwar, D. P., Shinde, R. M. and Gawai, K. R., 2011. Purification and
characterization of azoreductase from alkaliphilic strain Bacillus badius. Process
Biochem., 46: 1264–1269.
Mohan, S. V., Ramanaiah, S.V. and Sarma, P. N., 2008. Biosorption of direct azo dye from
aqueous phase onto Spirogyra sp I02: evaluation of kinetics and mechanistic aspects.
Biochem. Eng. J. 38: 61–69.
Mohana, S.V., Shrivastav, S., Divecha, J. and Madamwar, D., 2008. Response surface
methodology for optimization of medium for decolorization of textile dye Direct Black 22
by a novel bacterial consortium. Bioresour. Technol., 99: 562–569.
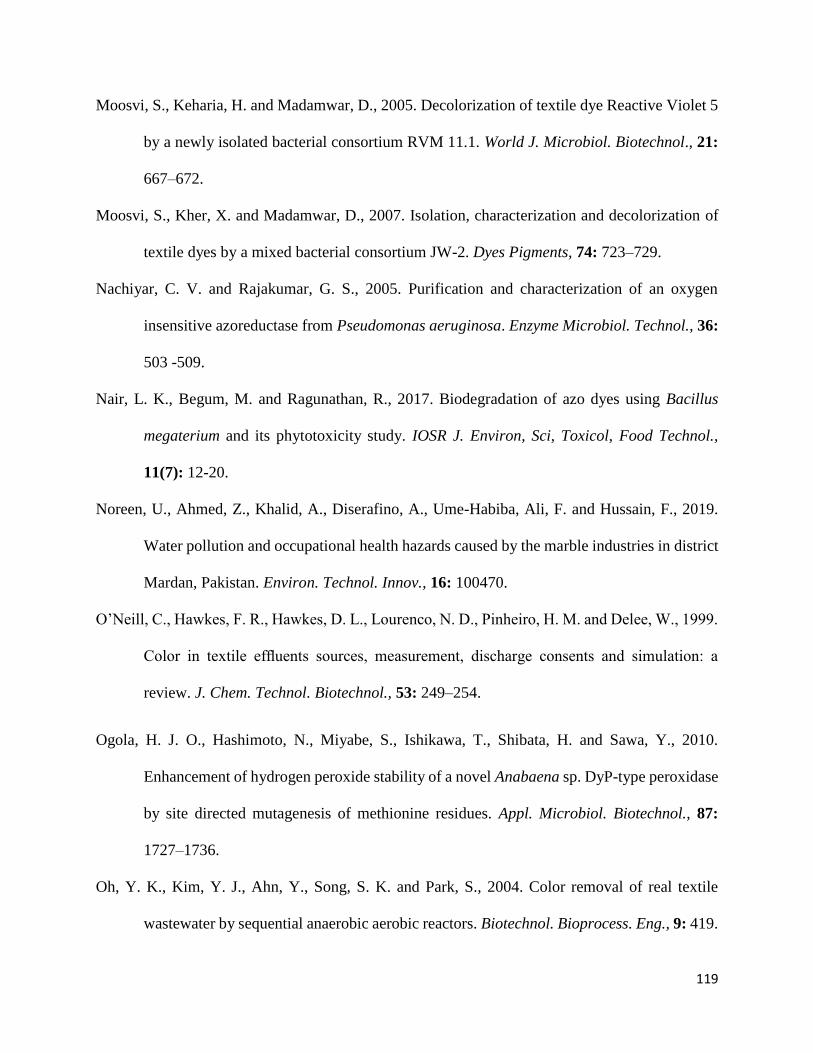
119
Moosvi, S., Keharia, H. and Madamwar, D., 2005. Decolorization of textile dye Reactive Violet 5
by a newly isolated bacterial consortium RVM 11.1. World J. Microbiol. Biotechnol., 21:
667–672.
Moosvi, S., Kher, X. and Madamwar, D., 2007. Isolation, characterization and decolorization of
textile dyes by a mixed bacterial consortium JW-2. Dyes Pigments, 74: 723–729.
Nachiyar, C. V. and Rajakumar, G. S., 2005. Purification and characterization of an oxygen
insensitive azoreductase from Pseudomonas aeruginosa. Enzyme Microbiol. Technol., 36:
503 -509.
Nair, L. K., Begum, M. and Ragunathan, R., 2017. Biodegradation of azo dyes using Bacillus
megaterium and its phytotoxicity study. IOSR J. Environ, Sci, Toxicol, Food Technol.,
11(7): 12-20.
Noreen, U., Ahmed, Z., Khalid, A., Diserafino, A., Ume-Habiba, Ali, F. and Hussain, F., 2019.
Water pollution and occupational health hazards caused by the marble industries in district
Mardan, Pakistan. Environ. Technol. Innov., 16: 100470.
O’Neill, C., Hawkes, F. R., Hawkes, D. L., Lourenco, N. D., Pinheiro, H. M. and Delee, W., 1999.
Color in textile effluents sources, measurement, discharge consents and simulation: a
review. J. Chem. Technol. Biotechnol., 53: 249–254.
Ogola, H. J. O., Hashimoto, N., Miyabe, S., Ishikawa, T., Shibata, H. and Sawa, Y., 2010.
Enhancement of hydrogen peroxide stability of a novel Anabaena sp. DyP-type peroxidase
by site directed mutagenesis of methionine residues. Appl. Microbiol. Biotechnol., 87:
1727–1736.
Oh, Y. K., Kim, Y. J., Ahn, Y., Song, S. K. and Park, S., 2004. Color removal of real textile
wastewater by sequential anaerobic aerobic reactors. Biotechnol. Bioprocess. Eng., 9: 419.

120
Ola, I. O., Akintokun, A. K., Akpan, I., Omomowo, I. O. and Areo, V. O., 2010. Aerobic
decolourization of two reactive azo dyes under varying carbon and nitrogen source by
Bacillus cereus. Afr. J. Biotechnol., 9: 672–677.
Ollgaard, H., Frost, L., Galster, J. and Hensen, O. C., 1999. Survey of azo-colorants on Denmark:
Milgoproject 509, Danish Environmental Protection Agency.
Olukanni, O. D., Osuntoki, A. A. and Gbenle, G. O., 2009. Decolorization of azo dyed by a starin
of Micrococcus isolated from refuse dump soil. Biotechnol., 8(4): 442-448.
Olukanni, O. D., Osuntoki, A. A. and Gbenle, G. O., 2009. Decolourizatioin of azo dyes by a strain
of Micrococcus isolated from a refuse dump soil. Biotechnol., 8: 442–448.
O'Neil, C., Hawkes, F. R., Hawkes, D. L., Lourenco, N. D., Pinheiro, H. M. and Delee, W., 1999.
Color in textile effluents sources, measurements, discharge contents and simulation: a
review. J. Chem. Technol. Biotechnol., 74: 1009-1018.
Ooi, T., Shibata, T., Sato, R., Ohno, H., Kinoshita, S., Thuoc, T. L. and Taguchi, S., 2007. An
azoreductase, aerobic NADH-dependent flavoprotein discovered from Bacillus sp.:
functional expression and enzymatic characterization. Appl. Microbiol. Biotechnol., 75:
377–386.
Oturkar, C. C., Nemade, H. N., Mulik, P. M., Patole, M. S., Hawaldar, R. R. and Gawai, K. R.,
2011. Mechanistic investigation of decolorization and degradation of Reactive Red 120 by
Bacillus lentus BI377. Bioresour. Technol., 102: 758–764.
Öztürk, A. and Abdullah, M. I., 2006. Toxicological effect of indole and its azo dye derivatives on
some microorganisms under aerobic conditions. Sci. Total Environ., 358: 137–142

121
Pajot, H. F., de Figueroa, L. I. C., Farina, J. I., 2007. Dye-decolorizing activity in isolated yeasts
from the ecoregion of Las Yungas (Tucuman Argentina). Enzyme Microbiol. Technol., 40:
1503-1511.
Pandey, A., Singh, P. and Iyengar, L., 2007. Bacterial decolorization and degradation of azo dyes.
Int. Biodeter. Biodegrad., 59: 73-84.
Pandey, A., Singh, P. and Lyengar, L., 2007. Review Bacterial decolorization and degradation of
azo dyes. Int. Biodeter. Biodegrad., 59: 73–84.
Parmar, N. D. and Shukla, S. R., 2018. Biodegradation of anthraquinone based dye using an
isolated strain Staphylococcus hominis subsp. hominis DSM 20328. Environ. Progress
Sustainable Energy, 37(1): 203-214.
Parshetti, G., Kalme, S., Saratale, G., and Govindwar, S., 2006. Biodecolorization of malachite
green by Kocuria rosea MTCC 1532. Acta. Chim. Slov., 53: 492-498.
Pasti-Grigsby, M. B., Paszczynski, A., Goszczynski, S., Crawford, D. L. and Crawford, R. L.,
1992. Influence of aromatic substitution patterns on azo dye degradability by Streptomyces
sp. and Phanerochaete chrysosporium. Appl. Environ. Microbiol., 58: 3605–3613.
Pazarlioglu, N. K., Urek, R. O. and Ergun, F., 2005. Biodecolourization of Direct Blue 15 by
immobilized Phanerochaete chrysosporium. Process Biochem., 40: 1923–1929.
Pearce, C. I., Lloyd, J. R. and Guthrie, J. T., 2003. The removal of colour from textile wastewater
using whole bacterial cells: a review. Dyes Pigments, 58: 179–196.
Perumal, S. M., Munuswamy, D., Sellamuthu, P. S., Kandasamy, M. and Thangavelu, K. P., 2007.
Biosorption of textile dyes and effluents by Pleurotus florida and Trametes hirsuta with
evaluation of their laccase activity. Iran J Biotechnol. 5:114–118.

122
Phugare, S. S., Kalyani, D. C., Patil, A. V. and Jadhav, J. P., 2011. Textile dye degradation by
bacterial consortium and subsequent toxicological analysis of dye and dye metabolites
using cytotoxicity, genotoxicity and oxidative stress studies. J. Hazard. Mater., 186: 713–
723.
Phugare, S., Patil, P., Govindwar, S. and Jadhav, J., 2010. Exploitation of yeast biomass generated
as a waste product of distillery industry for remediation of textile industry effluent. Int.
Biodeter.Biodegrad., 64: 716–726.
Prasad, A. S. A. and Rao, K. V. B., 2014. Aerobic biodegradation of azo dye Acid Black-24 by
Bacillus halodurans. J. Environ. Bio., 35: 549-554.
Prasad, A. S. A., Satyanarayana, V. S. V. and Rao, K.V. B., 2013. Biotransformation of Direct
blue 1 by a moderately halophilic bacterium Marinobacter sp. strain HBRA and toxicity
assessment of degraded metabolites. J. Hazard. Mater., 262: 674-684.
Pricelius, S., Held, C., Sollner, S., Deller, S., Murkovic, M., Ullrich, R., et al 2007. Enzymatic
reduction and oxidation of fibre-bound azo-dyes. Enzyme Microbiol. Technol., 40: 1732–
1738.
Puvaneswari, N., Muthukrishnan, J. and Gunasekaran, P., 2006. Toxicity assessment and microbial
degradation of azo dyes. Ind. J. Exp. Biol., 44: 618-26.
Rafii, F., Franklin, W. and Cerniglia, C. E., 1990. Azoreductase activity of anaerobic bacteria
isolated from human intestinal microflora. Appl. Environ. Microbiol., 56: 2146-2151.
Rai, H. S., Bhattacharyya, M. S., Singh, J., Bansal, T. K., Vats, P. and Banerjee, U. C., 2005.
Removal of dyes from the effluent of textile and dyestuff manufacturing industry: a review
of emerging techniques with reference to biological treatment. Crit. Rev. Environ. Sci.
Technol., 35: 219-238.

123
Rai, H. S., Bhattacharyya, M. S., Singh, J., Bansal, T. K., Vats, P. and Banerjee, U. C., 2005.
Removal of dyes from the effluent of textile and dyestuff manufacturing industry: a review
of emerging techniques with reference to biological treatment. Crit. Rev. Environ. Sci.
Technol., 35: 219-238.
Rajaguru, P., Vidya, L., Baskarasethupathi, B., Kumar, P. A., Palanivel, M. and Kalaiselvi, K.,
2002. Genotoxicity evaluation of polluted ground water in human peripheral blood
lymphocytes using the comet assay. Mutat. Res.Genet. Toxicol. Environ. Mutagen. 517:
29-37
Rajaguru, P., Vidya, L., Baskarasethupathi, B., Kumar, P. A., Palanivel, M. and Kalaiselvi, K.,
2002. Genotoxicity evaluation of polluted ground water in human peripheral blood
lymphocytes using the comet assay. Mutat. Res., 517: 29–37.
Rajee, O. and Patterson, J., 2011. Decolorization of azo dye (Orange MR) by an autochthonous
bacterium Micrococcus sp. DBS 2. Ind. J. Microbiol., 51: 159–163.
Ramalho, P. A., Scholze, H., Cardoso, M. H. and Ramalho, M. T. and Oliveira-Campos, A. M.,
2002. Improved conditions for the aerobic reductive decolourisation of azo dyes by
Candida zeylanoides. Enzyme Microbiol. Technol., 31: 848–854.
Ramanath, R., 2005. Color: An Introduction to Practice and Principles. Wiley Online Library,
USA.
Renganathan, S., Thilagaraj, W. R., Miranda, L. R., Gautam, P. and Velan, M. 2006. Accumulation
of Acid Orange 7 Acid Red 18 and Reactive Black 5 by growing Schizophyllum commune.
Bioresour. Technol., 97: 2189–2193.

124
Robinson, T., McMullan, G., Marchant, R. and Nigam, P., 2001. Remediation of dyes in textile
effluent: a critical review on current treatment technologies with a proposed alternative.
Bioresour. Technol., 77: 247–255.
Ruiz-Arias, A., Juarez-Ramirez, C., de los Cobos-Vasconcelos, D., Ruiz-Ordaz, N., Salmeron-
Alcocer, A., Ahuatzi, C. D. and Galindz-Mayer, J., 2010. Aerobic biodegradation of a
sulfonated phenylazonaphthol dye by a bacterial community immobilized in a multistage
packed-bed BAC reactor. Appl. Biochem. Biotechnol., 162: 1689–1707.
Saha, A. K., Sultana, N., Mohanta, M. K., Mandald, A. and Haquee, M., 2017. Identification and
characterization of azo dye decolourizing bacterial strains, Alcaligenes faecalis E5.Cd and
A. faecalis Fal.3 isolated from textile effluents. Am. Sci. Res. J. Eng. Technol. Sci., 3: 163-
175.
Saharan, B. S. and Ranga, P., 2011. Optimization of cultural conditions for decolourization of
textile azo dyes by Bacillus subtilis spr42 under submerged fermentation, Int. J. Adv.
Biotechnol. Res., 2: 148-153.
Sahasrabudhe, M. M., Saratale, R. G., Saratale, G. D. and Pathade, G. R., 2014. Decolorization
and detoxification of sulfonated toxic diazo dye C.I. Direct red 81 by Enterococcus
faecalis YZ 66. J. Environ. Health Sci. Eng., 12: 151.
Sani, K. R. and Banerjee, U. C., 1999. Decolorization of triphenylmethane dyes and textile and
dyestuff effluent by Kurthia sp. Enzyme Microbiol. Technol. 24: 433–437.
Santhanam, N., Vivanco, J. M., Decker, S. R. and Reardon, K. F., 2011. Expression of industrially
relevant laccases: prokaryotic style. Trends Biotechnol., 29: 480–489.

125
Saratale, G. D., Saratale, R. G., Chang, J. S. and Govindwar, S. P., 2011. Fixed-bed decolorization
of Reactive Blue 172 NCIM-2027 immobilized on Luffa cylindrica sponge. Int. Biodeter.
Biodegrad., 65: 494–503.
Saratale, R. G., Saratale, G. D., Chang, J. S. and Govindwar, S. P., 2009a. Ecofriendly degradation
of sulfonated diazo dye C.I Reactive Green 19A using Micrococcus glutamicus NCIM-
2168. Bioresour. Technol., 100: 3897–3905.
Saratale, R. G., Saratale, G. D., Chang, J. S. and Govindwar, S. P., 2009b. Decolorization and
biodecolorization of textile dye Navy Blue HER by Trichosporon beigelii NCIM-3326. J.
Hazard. Mater., 166: 1421.
Sarkar, S., Banerjee, A., Halder, U., Biswas, R. and Bandopadhyay, R., 2017. Degradation of
synthetic azo dyes of textile industry: a sustainable approach using microbial enzymes.
Water Conserv. Sci. Eng., 2: 121–131.
Sathiya, M., Periyar, S., Sasikalaveni, A., Murugesan, K. and Kalaichelvan, P., T., 2007.
Decolorization of textile dyes and their effluents using white rot fungi. Afr. J. Biotechnol.,
6: 424-429.
Sawhney, R. and Kumar, A., 2011. Congo Red (azo dye) decolorization by local isolate VTII
inhabiting dye effluent exposed soil. Int. J. Environ. Sci., 1: 1261–1267.
Shah, M. P., 2014. Biodegradation of azo dyes by three isolated bacterial strains: an environmental
bioremedial approach. J. Microbial. Biochem. Technol., S3, 007.
Shah, M. P., Patel, K. A., Nair, S. S and Darji, A. M., 2103. Potential effect of two Bacillus sp.
on decolorization of azo dye. J. Bioremed. Biodegrad., 4: 199.

126
Shanmugam, B. K., Easwaran, S. N, Lakra, R., Deepa, P. R. and Mahadevan, S., 2017. Metabolic
pathway and role of individual species in the bacterial consortium for biodegradation of
azo dye: A biocalorimetric investigation. Chemosphere, 188: 81-89.
Shyamala, A., Hemapriya, J., Vadakkan. K. and Vijayanand, S., 2014. Bioremediation of Methyl
orange, a synthetic textile azo dye by a halotolerant bacterial strain. Int. J. Curr. Res. Acad.
Rev., 2: 373-381.
Singh, S., Chatterji, S., Nandini, P. T., Prasad, A. S. A. and Rao, K. V. B., 2015. Biodegradation
of azo dye Direct Orange 16 by Micrococcus luteus strain SSN2. Int. J. Environ. Sci.
Technol., 12: 2161-2168.
Sivarajasekar, N., Baskar, R. and Balakrishnan, V., 2009. Biosorption of an azo dye from aqueous
solutions onto Spirogyra. J. Univ. Chem. Technol. Metall., 44: 157–164.
Soares, G. M. B., Costa-Ferreira, M. and de Amorim, M. T. P., 2001. Decolorization of an
anthraquinone-type dye using a laccase formulation. Bioresour. Technol., 79: 171–177.
Solis, M., Solis, A., Perez, H. I., Manjarrez, N. and Flores, M., 2012. Microbial decolouration of
azo dyes: a review. Process Biochem., 47: 1723-1748.
Solis-Oba, M., Barzana, E., Garcia-Garibay, M. and Viniegra-Gonzalez, G., 2007. The ABTS: an
oxidant agent of different chemical compounds and its recycling process between laccase
and substrate. Rev. Mex. Ing. Quim., 6: 275–281.
Spadarry, J. T., Isabelle, L. and Renganathan, V., 1994. Hydroxyl radical mediated degradation of
azo dyes: evidence for benzene generation. Environ. Sci. Technol., 28: 1389-1393
Srinivasan, A. and Viraraghavan, T., 2010. Decolorization of dye wastewaters by biosorbents: a
review. J. Environ. Manage., 91: 1915–1929.

127
Stolz, A., 2001. Basic and applied aspects in the microbial degradation of azo dyes. Appl.
Microbiol. Biotechnol., 56: 69 –80.
Sugumar, S. and Thangam, B., 2012. BiodEnz: a database of biodegrading enzymes.
Bioinformation, 8: 40–42.
Sumathi, S. and Phatak, V., 1999. Fungal treatment of bagasse based pulp and paper mill wastes.
Environ. Technol., 19: 93–98.
Suteu, D., Zaharia, C. and Malutan, T., 2011. Biosorbents Based On Lignin Used. In Biosorption
Processes From Wastewater Treatment (chapter 7). In: Lignin: Properties and Applications
in Biotechnology and Bioenergy, Ryan J. Paterson (Ed.), pp. 27, Nova Science Publishers,
ISBN 978-1-61122-907-3, New York, U.S.A.
Svobodova, K., Senholdt, M., Novotny, C. and Rehorek, A., 2007. Mechanism of Reactive Orange
16 degradation with the white rot fungus Irpex lacteus. Process Biochem., 42: 1279–1284.
Swaminathan, K., Sandhya, S., Sophia, A. C., Pachhade, K., Subrahmanyam, Y. V., 2003.
Decolorization and degradation of H-acid and other dyes using ferrous-hydrogen peroxide
system. Chemosphere, 50: 619-625.
Tauber, M. M., Gubitz, G. M. and Rehorek, A., 2008. Degradation of azo dyes by oxidative
processes: Laccase and ultrasound treatment. Bioresour. Technol., 99: 4213–4220.
Telke, A. A., Ghodake, G. S., Kalyani, D. C., Dhanve, R. S and Govindwar, S. P., 2011.
Biochemical characteristics of a textile dye degrading extracellular laccase from a Bacillus
sp. ADR. Bioresour. Technol., 102: 1752–1756.
Telke, A. A., Kalyani, D., Dawkar, V. and Govindwar, S., 2009. Influence of organic and inorganic
compounds on oxidoreductive decolourization of sulfonated azo dye C.I.Reactive Orange
16. J. Hazard. Mater., 172: 298-309.

128
textile dyes Reactive Red 2 and Reactive Blue 4 using Bjerkandera sp Strain BOL 13 in a
continuous rotating biological contactor reactor. Enzyme Microbiol. Technol., 9: 32–37.
Tilli, S., Ciullini, I., Scozzafava, A. and Briganti, F., 2011. Differential decolorization of textile
dyes in mixtures and the joint effect of laccase and cellobiose dehydrogenase activities
present in extracellular extracts from Funalia trogii. Enzyme Microbiol, Technol., 49: 465–
471.
Tony, B. D., Goyal, D. and Khanna, S., 2009. Decolorization of textile azo dyes by aerobic
bacterial consortium. Int. Biodeter. Biodegrad., 63: 462–469.
Uday, U. S., Choudhury, P., Bandyopadhyay, T. K. and Bhunia, B., 2016. Classification, mode of
action and production strategy of xylanase and its application for biofuel production from
water hyacinth. Int. J. Bio. Macromolecules, 82: 1041–1054.
Umbuzeiro, G. A., Freeman, H., Warren, S. H., Oliveira, D, P., Terao, Y., Watanabe, T., Claxton,
L. D., 2005. The contribution of azo dyes to the mutagenic activity of the Cristais River.
Chemosphere., 60: 55–64.
Umbuzeiro, G. A., Freeman, H., Warren, S. H., Oliveira, D. P., Terao, Y., Watanabe, T. and
Claxton, L. D., 2005. The contribution of azo dyes to the mutagenic activity of the Cristais
River. Chemosphere, 60: 55–64.
Urek, R. O. and Pazarlioglu, N. K., 2005. Production and stimulation of manganese peroxidase by
immobilized Phanerochaete chrysosporium. Process Biochem., 40: 83–87.
Van Bloois, E., Torres Pazmino, D. E., Winter, R. T. and Fraaije, M. W., 2010. A robust and
extracellular heme-containing peroxidase from Thermobifida fusca as prototype of a
bacterial peroxidase superfamily. Appl. Microbiol. Biotechnol., 86: 1419–1430.

129
Van der Zee, F. P. and Cervantes, F. J., 2009. Impact and application of electron shuttles on the
redox (bio) transformation of contaminants: a review. Biotechnol. Adv., 27: 256–277.
Vandevivere, P. C., Bianchi, R. and Verstraete, W., 1998. Treatment and reuse of wastewater from
the textile wet-processing industry. Rev. Emerging Technologies. J. Chem. Technol.
Biotechnol., 72: 289-302.
Verma, P. and Madamwar, D., 2003. Decolorization of synthetic dyes by a newly isolated strain
of Serratia maerascens. World J. Microbiol. Biotechnol., 19: 615-618.
Vijayaraghavan, K. and Yun, Y. S., 2007. Utilization of fermentation waste (Corynebacterium
glutamicum) for biosorption of Reactive Black 5 from aqueous solution. J. Hazard. Mater.,
141: 45–52.
Vitor, V. and Corso, C. R., 2008. Decolorization of textile dye by Candida albicans isolated from
industrial effluents. J. Ind. Microbiol. Biotechnol., 35: 1353–1357.
Waghmode, T. R., Kurade, M, B., Kabra, A. N. and Govindwar, S. P., 2012. Degradation of
Remazol Red Dye by Galactomyces geotrichum MTCC 1360 leading to increased iron
uptake in Sorghum vulgare and Phaseolus mungo from soil. Biotechnol. Bioeng., 17: 117–
126.
Waghmode, T. R., Kurade, M. B., Khandare, R. V. and Govindwar, S. P., 2011. A sequential
aerobic/microaerophilic decolorization of sulfonated mono azo dye Golden Yellow HER
by microbial consortium GG–BL. Int. Biodeter. Biodegrad., 65: 1024–1034.
Walker, M. C., Van der Donk, W. A., 2016. The many roles of glutamate in metabolism. J. Ind.
Microbiol. Biotechnol., 43: 419–430.

130
Wang, J., Liu, G. F., Lu, H., Jin, R. F., Zhou, J. T. and Lei, T. M., 2012. Biodegradation of Acid
Orange 7 and its auto-oxidative decolorization product in membrane-aerated biofilm
reaction. Int. Biodeter. Biodegrad., 67: 73–77.
Weisburger, J. H., 2002. Comments on the history and importance of aromatic and heterocyclic
amines in public health. Mutat. Res., 30: 506–507.
Wong, P. K. and Yuen, P. Y., 1996. Decolorization and biodegradation of Methyl Red by
Klebsiella pneumoniae RS-13. Water Res., 30: 1736-1744.
Wu, Y., Li, T. and Yang, L., 2012. Mechanisms of removing pollutants from aqueous solutions
by microorganisms and their aggregates: a review. Bioresour. Technol., 107: 10–18.
Xiao, Y. Z., Tu, X. M., Wang, J., Zhang, M., Cheng, Q., Zeng, W. Y. and Shi, Y. Y., 2003.
Purification, molecular characterization and reactivity with aromatic compounds of a
laccase from basidiomycete Trametes sp. strain AH28-2. Appl. Microbiol. Biotechnol., 60:
700–707.
Yang, B., Gao, Y., Yan, Y., Xu, H., and Wang, J., 2018. Degradation characteristics of color index
direct blue 15 dye using iron-carbon micro-electrolysis coupled with H2O2. Int. J. Environ.
Res. Public Health, 15(7): 1523.
Yang, Q., Li, C., Li, H., Li, Y. and Yu, N., 2009. Degradation of synthetic reactive azo dyes and
treatment of textile wastewater by a fungi consortium reactor. Biochem. Eng. J., 43: 225–
230.
Yang, Q., Tao, L., Yang, M. and Zhang, H., 2008. Effects of glucose on the decolorization of
Reactive Black 5 by yeast isolates. J. Environ. Sci., 20: 105–108.

131
Yang, Q., Yediler, A., Yang, M. and Kettrup, A., 2005. Decolorization of an azo dye Reactive
Black 5 and MnP production by yeast isolate: Debaryomyces polymorphus. Biochem. Eng.
J., 24: 249–253.
Yemashova, N. A., Kotova, I. B., Netrusov, A. I. and Kalyuzhnyi, S. V., 2009. Special traits of
decomposition of azo dyes by anaerobic microbial communities. Appl. Biochem.
Microbiol., 45: 176–181.
Yemendzhiev, H., Alexieva, Z. and Krastanov, A., 2009. Decolorization of synthetic dye Reactive
Blue 4 by mycelial culture of white-rot fungi Trametes versicolor 1. Biotechnol. Biotech.
Eq., 23: 1337–1339.
Yu, Z. and Wen, X., 2005. Screening and identification of yeasts for decolorizing synthetic dyes
in industrial wastewater. Int. Biodeter. Biodegrad., 56: 109–114.
Zhang, F., Yediler, A., Liang, X., Kettrup, A., 2004. Effects of dye additives on the ozonation
process and oxidation by products: a comparative study using hydrolysed CI Reactive red
120. Dyes Pigments, 60: 1–7.
Zhao, G., Jiang, L., He, Y., Li, J., Dong, H., Wang, X., Hu, W., 2011. Sulfonated graphene for
persistent aromatic pollutant management. Adv. Mater., 23: 3959–3963.
Zissi, U., Lyberatos, G. and Pavlou, S., 1997. Biodegradation of p-amino benzene by Bacillus
subtilus under aerobic conditions. J. Ind. Microbiol. Biotechnol., 19: 49 -55.

132

507 © 2018 The Authors Journal of Water Reuse and Desalination | 08.4 | 2018
Downloaded from httpby gueston 21 October 2018
Degradation of azo dye by bacterium, Alishewanella sp.
CBL-2 isolated from industrial effluent and its potential
use in decontamination of wastewater
Mehvish Ajaz, Amina Elahi and Abdul Rehman
ABSTRACT
In the present study, Alishewanella sp. CBL-2 was characterized on the basis of biochemical and 16S
rRNA sequencing. The bacterium was found to decolorize 83% Sumifex Tourqi blue within a period of
6 days at 37 �C and pH 7. The predominant form of the enzyme was found to be extracellular (78%) as
compared to intracellular (16%). The breakdown of azo bond was confirmed through thin layer
chromatography (TLC) analysis as new bands and peaks were observed in chromatograms of
extracted metabolites of decolorized samples. Growth of beneficial microbial fauna in the presence
of bacterial decolorized wastewater indicates that this wastewater is safe for the survival of
microorganisms. High bioremediation potential makes Alishewanella sp. CBL-2 an impending
foundation for green chemistry to remove azo dyes from industrial wastewater.
This is an Open Access article distributed under the terms of the Creative
Commons Attribution Licence (CC BY-NC-ND 4.0), which permits copying
and redistribution for non-commercial purposes with no derivatives,
provided the original work is properly cited (http://creativecommons.org/
licenses/by-nc-nd/4.0/)
doi: 10.2166/wrd.2018.065
s://iwaponline.com/jwrd/article-pdf/8/4/507/482391/jwrd0080507.pdf
Mehvish AjazAmina ElahiAbdul Rehman (corresponding author)Department of Microbiology and MolecularGenetics,
University of the Punjab,New Campus, Lahore 54590,PakistanE-mail: [email protected]
Key words | Alishewanella sp. CBL-2, azo dye, decolorization, TLC
INTRODUCTION
Among industrial wastewaters, dye wastewater from textile
and dyestuff industries is one of the most difficult to treat.
This is because dyes usually have a synthetic origin and com-
plex aromatic molecular structures which make them more
stable and more difficult to biodegrade (Seshadri et al. ).
Azo dyes, which are aromatic compounds with one or more
–N¼N– groups, constitute the largest class of synthetic dyes
used in commercial applications (Zollinger ). It is
reported that there are over 100,000 commercially available
dyes with a production of over 7 × 10⁵ metric tons per year
(Mishra & Tripathy ).
Azo dyes are used in different industries, including tex-
tiles, cosmetics, paper, leather, pharmaceuticals, and food,
with an annual consumption of about 0.7 million ton
(Chen et al. ). The two major sources of release of
dyes into the environment are the effluents from textile
processing units and dyestuff manufacturing industries
(O’Neill et al. ). Discharge of highly colored dye con-
taining effluents from textile and dyestuff industries to
neighboring water bodies is causing significant health con-
cerns (Martins et al. ). During the past two decades,
several physico-chemical decolorization techniques have
been reported; few, however, have been accepted by the tex-
tile industries (Okazaki et al. ; da Silva & Faria ).
Their lack of implementation has been largely due to high
cost, low efficiency, and generation of toxic by-products
(Selvam et al. ).
The ability of microorganisms to carry out dye decolor-
ization has recently received much attention. Microbial
decolorization of dyes is a cost-effective method to remove
them from the environment (Moosvi et al. ; Aftab

508 M. Ajaz et al. | Degradation of azo dye by bacterium, Alishewanella sp. CBL-2 Journal of Water Reuse and Desalination | 08.4 | 2018
Downloaded frby gueston 21 October
et al. ). The present day bioremediation relies upon the
pollutant degrading capacities of naturally occurring
microbial consortia in which bacteria play a central role
(O’Neill et al. ). Microbial consortia are usually used
without analyzing the constituent microbial populations
for environmental remediation and complexity of the
microbial consortium enables them to act on a variety of
pollutants (Watanabe & Baker ). Recently, the aerobic
decolorization of azo dyes has been reported by a number
of investigators (Adedayo et al. ; Aftab et al. ).
A wide variety of microorganisms is capable of decolor-
ization of a wide range of dyes including fungi: Aspergillus
niger (Fu & Viraraghavan ), Phanerochaete chrysospor-
ium, Aspergillus terricola (Saikia & Gopal ),
P. chrysosporium (Fournier et al. ); yeasts: Saccharo-
myces cerevisiae, Candida tropicalis, C. lipolytica (Aksu &
Dönmez ); algae: Spirogyra species (Gupta et al. ),
Chlorella vulgaris (Acuner & Dilek ), C. sorokiniana
(de-Bashan et al. ), Lemna minuscula (Valderama
et al. ), Scenedesmus obliquus, C. pyrenoidosa and
Closterium lunula (Yan & Pan ), and bacteria:
Escherichia coli NO3 (Chang & Kuo ), Aeromonas
hydrophila (Chen et al. ), Kurthia species (Sani &
Banerjee ).
The present study was aimed at isolating and character-
izing potent bacterium from industrial wastes able to
decolorize azo dyes. Decolorization products were tested
against beneficial microbial flora and dye degraded products
were also analyzed through thin layer chromatography
(TLC).
EXPERIMENTAL
Wastewater sample collection
Wastewater samples were collected in sterilized (autoclaved
at 121 �C, 15 lb/inch2 pressure for 15 min) screw capped
bottles. Some physiochemical parameters of wastewater,
i.e., temperature, pH, color, and smell were also measured.
About six wastewater samples were collected and brought
to the laboratory and then proceeded to bacterial isolation.
For isolation of azo dyes degrading bacteria, 100 μL of
wastewater sample was spread on Luria-Bertani (LB) agar
om https://iwaponline.com/jwrd/article-pdf/8/4/507/482391/jwrd0080507.pdf
2018
plates containing 100 μL of dye stress in the medium. LB
agar plates were prepared by dissolving 1 g NaCl, 1 g Tryp-
tone and 0.5 g yeast extract in 100 mL distilled water, pH
adjusted to 7.0–7.2 and then agar was added in 250 mL
flasks. The medium was autoclaved at 121 �C and 15 lb/
inch2 for 15 min. The growth of bacterial colonies was
observed after 24 h of incubation at 37 �C.
Isolation of azo dye degrading bacteria
Effect of dye on the growth of bacterial isolates was deter-
mined in minimum salt medium (MSM) which contained
(g L�1): KH2PO4, 0.2 g; MgSO4.7H2O, 0.02 g; Na2CO3 1 g;
yeast extract, 0.5 g; in 100 mL distilled water (pH 7.0), then
agar 1.5 g was added, autoclaved, and supplemented with
azo dyes when the temperature reached 50–55 �C. Medium
was poured in autoclaved dried Petri plates under sterilized
conditions. Plates were left to solidify, inoculated with bac-
terial isolates and then incubated again at 37 �C for 24 h.
This experiment was repeated with successfully higher
concentration of dye until the minimum inhibitory concen-
tration (MIC) of the bacterial isolates was obtained.
Morphological, biochemical, and molecular
characterization
The morphological parameters which were checked for bac-
terial isolates include size, shape, color, margin, elevation,
motility, etc. Gram staining and various biochemical tests
were performed according to the scheme given in Cappu-
cino & Sherman (). For molecular characterization,
DNA was isolated (Masneuf-Pomarade et al. ) and
16S rRNA gene was amplified through polymerase chain
reaction (PCR) by using universal bacterial primers 8F
(5-AGAGTTTGATCCTGGCTCAG-3) and 1492R (5-
GGTTACCTTGTTACGACTT-3) (Turner et al. ). PCR
was performed by initial denaturation at 95 �C for 5 min, fol-
lowed by 35 cycles of denaturation at 95 �C for 1 min,
annealing at 55 �C for 1 min and extension at 72 �C for
1 min, with a final extension at 72 �C for 10 min. Fermentas
Gene Jet Gel Extraction kit (#K0691) was used for gene
cleaning of PCR product and then sequenced from 1st
Base, Malaysia. The sequence was then submitted to Gen-
Bank to obtain accession numbers.

509 M. Ajaz et al. | Degradation of azo dye by bacterium, Alishewanella sp. CBL-2 Journal of Water Reuse and Desalination | 08.4 | 2018
Downloaded from httpby gueston 21 October 2018
Determinations of optimum growth conditions
For optimum growth of bacterial isolate two parameters, i.e.,
temperature and pH were considered. For determination of
optimum temperature, LB broth was prepared in 100 mL
distilled water. Five milliliters of LB broth was added in
four sets, each of three sets of test tubes autoclaved and
inoculated with 50 μL of freshly prepared culture of bac-
terial isolate. Tubes were incubated at 20 �C, 30 �C, 37 �C,
and 45 �C for overnight incubation of 24 h. Absorbance
was measured at 600 nm using UV/Vic spectrophotometer
(PerkinElmer, USA).
For optimum pH, test tubes having 5 mL LB broth were
prepared in six sets, each containing three test tubes and
their pH was adjusted to 5.0, 6.0, 7.0, 8.0, 9.0, and 10.0 by
using 0.1 M NaOH and 0.1 M HCl and then autoclaved.
The tubes were inoculated with 50 μL freshly prepared cul-
ture of bacterial isolate and were incubated at 37 �C for
24 h and their absorbance was measured at 600 nm using
spectrophotometer.
Effect of dye on bacterial growth
Growth curves of bacterial isolate were determined by using
MSM. The flasks containing 100 μL of dye were designated
as ‘treated’ and flasks without dye were designated as ‘con-
trol’. In this way, 100 mL MSM was taken into 250 mL
flasks, autoclaved and then inoculated with 50 μL of freshly
prepared bacterial culture. The cultures were incubated at
37 �C in a shaker at 100 rpm. An aliquot of culture was
taken out in an oven sterilized test tube at regular intervals
of 0, 4, 8, 12, 16, 20, and 24 h.
Dye decolorization
Decolorization experiment was performed in 250 mL
Erlenmeyer flasks containing 100 mL of MSM and was
inoculated with 100 μL of freshly prepared bacterial culture.
The dye was added to the culturing medium 100 μL and
200 μL from stock solution after 24 h of growth and the
flask containing no bacterial culture was used as control.
The flasks were incubated at 37 �C, 3 ml culture medium
was withdrawn after 1, 2, 3, 4, 5, and 6 days and centrifuged
at 10,000 rpm for 15 min to separate the bacterial cell mass.
s://iwaponline.com/jwrd/article-pdf/8/4/507/482391/jwrd0080507.pdf
Decolorization was determined by measuring the absor-
bance of decolorization medium at 465 nm (Kalyani et al.
). Percentage decolorization was calculated as follows:
Decolorization(%)
¼ Initial absorbance�Observed absorbanceInitial absorbance
× 100
Enzyme assay
To prepare the crude cell-free extract, the bacterial cultures
were grown with azo dyes (100 μL from stock solution of
dye) in 100 mL MSM for 96 h at 37 �C. Cells were harvested
by centrifugation at 6,000 × g for 15 min. For intracellular
enzyme assay, pellet was washed with lysis buffer (Mercap-
toethanol; SDS) and was suspended in 1 mL of the same
buffer. Cells were disrupted by sonication for 15 s with
60 s interval (5 cycles) in cold conditions. The resultant
homogenate was centrifuged at 10,000 × g for 5 min. The
supernatant was used as intracellular crude extract. While
for extracellular crude extract, the supernatant was mixed
with 60% ammonium salt, and the mixture was incubated
overnight in a refrigerator at 4 �C. The overnight chilled mix-
ture was then centrifuged at 10,000 rpm for 15 min. The
aliquot was then used as extracellular crude enzyme. The
activity of azoreductase was determined by a slightly modi-
fied method of Moutaouakkil et al. (). The reaction
mixture consisted of: sodium acetate, 500 μL (pH 5); auto-
claved water, 500 μL; ABTS, 100 μL; and crude enzyme
100 μL. The reaction was allowed to proceed for 30 min at
30 �C and optical density was measured at 465 nm. For con-
trol reaction, distilled water was used instead of crude
enzyme.
Thin layer chromatography
After the enzyme reaction the products were used for TLC.
For this purpose, a silica plate was used. The spotting was
done with the help of a Pasteur pipette. The spots were
dried and then allowed to run into a chromatographic
tank through a mobile phase (chloroform, 30 mL; ethyl acet-
ate, 30 mL; acetic acid, 0.6 mL). The silica plate was then
observed under UV illuminator at wavelength 254 and
366 nm.

Figure 1 | Change in color of Sumifex Tourqi blue as compared to the control in flask
containing culture of Alishewanella sp. CBL-2.
510 M. Ajaz et al. | Degradation of azo dye by bacterium, Alishewanella sp. CBL-2 Journal of Water Reuse and Desalination | 08.4 | 2018
Downloaded frby gueston 21 October
Microbial toxicity
The toxic effect of decolorized dye sample was checked on
agriculturally important soil microflora, i.e., Bacillus subti-
lis (z-66), Pseudomonas aeruginosa (PA1), and Bacillus
cereus (T358-2) (Mali et al. ). L-agar plates were
swabbed with these bacteria and then a well of 2 mm was
made which was filled by centrifuged decolorized broth.
The plates were then incubated at 37 �C for 24 h. The
zone surrounding the well showed the index of toxicity of
the decolorized sample.
Statistical analysis
Observations were made and all the experiments run in tri-
plicate. At least three separate flasks were usually
maintained for one treatment. Each time three readings
were taken, their mean, and standard error of the mean
were calculated.
RESULTS AND DISCUSSION
Sampling and screening of dye decolorizing bacteria
A total of six wastewater samples with physiochemical par-
ameters was collected (Table S1, available with the online
version of this paper). Bacterial cultures were isolated, pur-
ified, and screened for the decolorization of azo dye. Of
all the cultures tested, one bacterial isolate (CBL-2) was
selected on the basis of dye tolerance, i.e., resistance in
MSM containing 1% of reactive azo dye Sumifex Tourqi
Blue (Figure 1).
Bioremediation is becoming important because it is cost-
effective and environmentally friendly, and produces less
sludge (Robinson et al. ; Chen et al. ). Microbial
decolorization of dyes is a cost-effective procedure to
remove them from the environment (Moosvi et al. ).
The biodegradation ability of bacteria is assumed to be
associated with the production of lignolytic enzymes such
as lignin peroxidase and laccase. The presence of laccase-
like enzymes has been reported in bacteria (Givaudan
et al. ). The ability of bacteria to metabolize azo dyes
has been investigated by a number of research groups.
om https://iwaponline.com/jwrd/article-pdf/8/4/507/482391/jwrd0080507.pdf
2018
Many microorganisms are capable of decolorizing the azo
dyes, including Gram-positive and Gram-negative bacteria
(Sani & Banerjee ; Kodam et al. ; Moosvi et al.
).
Biochemical and molecular characterization of
bacterial isolate
Initially, the bacterial isolate was identified on the basis
of morphological and biochemical characteristics
(Table 1). The sequence of 16S rRNA gene of bacterial
isolate showed 95% homology with the sequence of 16S
rRNA gene of Alishewanella sp. The sequence was
then submitted to GenBank under accession number
JN546609.
Determination of growth conditions
The most suitable temperature and pH of bacterial isolate
were found to be 37 �C and 7 (Figure S1, available online).
The strain CBL-2 showed continuous increase in growth
rate until the stationary phase was reached, while the con-
trol showed a steady increase in the growth. The control
was without dye and for the treated Turqi blue dye plus
inoculum was used (Figure 2). Asada et al. () isolated

Table 1 | Morphological and biochemical characteristics of Alishewanella sp. CBL-2
Alishewanella sp. CBL-2
Morphological characteristics
Shape Rod
Motility Non-motile
Color Yellowish
Elevation Raised
Size 2 μm
Margin Smooth
Gram staining Gram negative
Biochemical characteristics
Indole production �ve
Methyl red reaction �ve
Voges Proskauer reaction �ve
Citrate use �ve
MacConkey agar �ve
Catalase activity þve
Oxidase activity þve
EMB agar �ve
þve: positive, �ve: negative.
511 M. Ajaz et al. | Degradation of azo dye by bacterium, Alishewanella sp. CBL-2 Journal of Water Reuse and Desalination | 08.4 | 2018
Downloaded from httpby gueston 21 October 2018
the azo dye decolorizing bacteria which were Gram-nega-
tive and showed maximum growth at 34 �C–37 �C. Banat
et al. () also observed that various textile and other
dye effluents are produced at relatively high temperatures
(50–60 �C), so temperature will be an important factor in
the real application of biosorption by biomass in the
future.
Figure 2 | Effect of Sumifex Tourqi blue on the growth (OD) of Alishewanella sp. CBL-2
incubated at 37 �C for a period of 24 h.
s://iwaponline.com/jwrd/article-pdf/8/4/507/482391/jwrd0080507.pdf
Dye decolorization
The efficient removal of dye is necessary and significant
for the protection of the environment. In the present
study, bacterial strain CBL-2 was able to decolorize 80
and 83% of 100 and 200 μL mL�1 dye stress, respectively
(Figure 3). Sheth & Dave () reported P. aeruginosa
exhibited 91% decolorization of azo dye. Wu et al.
() reported that Shewanella oneidensis WL-7 was
capable of decolorizing the Reactive Black 5 from the
medium containing 100 μM after 12 h. Decolorization of
azo dyes by bacterial isolates has been reported by
many researchers (Hong et al. ; Xu et al. ;
Khalid et al. ).
Enzyme assay
Bacterial degradation of azo dyes is generally considered
a specific reaction by azo reductase under aerobic
condition or a nonspecific reduction process under
anaerobic conditions. In the present study, both extra-
and intracellular enzyme activities were determined by
ABTS method. Alishewanella sp. CBL-2 showed high
extracellular enzyme activity (78%) as opposed to intra-
cellular enzyme activity (16%), so the predominant form
of the enzyme was extracellular (Figure 4). Maier et al.
() reported that a thermoalkalophilic Bacillus sp.
was able to reduce a large structural variety of azo dyes.
Kolekar et al. () reported that Alishewanella sp.
Figure 3 | Alishewanella sp. CBL-2 potential to decolorize Sumifex Tourqi blue incubated
at 37 �C for a period of 6 days.

Figure 4 | Comparison between extra- and intracellular enzyme (azoreductase) activities
of Alishewanella sp. CBL-2 using ABTS as a substrate.
512 M. Ajaz et al. | Degradation of azo dye by bacterium, Alishewanella sp. CBL-2 Journal of Water Reuse and Desalination | 08.4 | 2018
Downloaded frby gueston 21 October
strain KMK6 was able to degrade efficiently a mixture of
textile dyes (0.5–2.0 g L�1) within 8 h. An initial 28%
reduction in COD was observed immediately after deco-
lorization at static anoxic conditions, which on further
incubation at shaking conditions, reduced by 90%.
Figure 5 | TLC chromatogram of extracted metabolites of Alishewanella sp. CBL-2
decolorized dye sample visualizes UV range of 254 and 366 nm.
om https://iwaponline.com/jwrd/article-pdf/8/4/507/482391/jwrd0080507.pdf
2018
Partially purified azoreductase was able to utilize different
azo dyes as substrates.
Dye degraded products analysis
The presence of bands with different Rf value in the control
and treated sample clearly revealed that dye was degraded
into its products (Figure 5). Another study from this labora-
tory showed the presence of bands with Rf value of 0.96 and
0.94 when observed under UV range of 254 and 366 nm
while the Rf value of control dye was 0.83 (unpublished
data). Singh et al. () reported that two additional
bands of Rf value 0.63 and 0.965 were observed in the
TLC chromatogram of a decolorized sample of Direct
orange 16 by Micrococcus luteus strain SSN2 when
observed under UV range of 254 nm while the dye had a
band of Rf value 0.74. Similarly, Sahasrabudhe et al. ()
reported a band of Rf value 0.71 in the TLC chromatogram
of extracted metabolites from a decolorized sample of Direct
red by Enterococcus faecalis YZ66 while the original dye
had a band of Rf value 0.97. Likewise, a single band of Rf
value 0.83 was observed in TLC chromatogram of mono
azo dye Amarnath while the extracted metabolites from Aci-
netobacter calcoaceticus NCIM 2890 decolorized sample
had three bands of Rf value 0.93, 0.82, and 0.79 (Ghodake
et al. ).
Microbial toxicity
There was no zone of inhibition found around the well
which was a clear indication that the biodegraded waste-
water is safe for the growth of microbial species (Figure 6).
Ilyas & Rehman () reported two fungal species, i.e.,
Aspergillus niger and Nigrospora sp. whose decolorized
sample was proved safe for the microbial species. Similarly,
the dye degradation products by Alishewanella sp. strain
KMK6 were non-toxic compared to the dye mixture in gen-
otoxicity assessment assay (Kolekar et al. ).
CONCLUSIONS
Alishewanella sp. CBL-2, characterized on the basis of bio-
chemical tests and 16S rRNA sequencing, has promising

Figure 6 | Bacterial decolorized broth used for incubation of (a) B. cereus (T358-2), (b) P. aeruginosa (PA1), and (c) B. subtilis (z-66) at 37 �C for 48 h. No zone of inhibition was observed in
any case.
513 M. Ajaz et al. | Degradation of azo dye by bacterium, Alishewanella sp. CBL-2 Journal of Water Reuse and Desalination | 08.4 | 2018
Downloaded from httpby gueston 21 October 2018
potential to decolorize Sumifex Tourqi blue (83%) after 6
days of incubation at 37 �C and pH 7. Alishewanella sp.
CBL-2 had shown maximum enzyme activity in extracellu-
lar assay (78%) as compared to the intracellular assay
(16%). This degradation was confirmed through TLC. It
was also proved that microbially treated dye wastewater is
safe for growth of beneficial microbial flora. Alishewanella
sp. CBL-2 can be used to ameliorate wastewater containing
azo dyes by utilizing the decolorization potential ability of
the bacterium.
ACKNOWLEDGEMENTS
This work was supported by the Research Cell, Quaid-e-
Azam Campus, Punjab University, Lahore-54590, Pakistan
s://iwaponline.com/jwrd/article-pdf/8/4/507/482391/jwrd0080507.pdf
(Research grant number, 34/2014-15) which is gratefully
acknowledged. The authors have declared that no
competing interests exist.
REFERENCES
Acuner, E. & Dilek, F. B. Treatment of tectilon yellow 2G byChlorella vulgaris. Process. Biochem., 39, 623–631.
Adedayo, O., Javadpour, S., Taylor, C., Anderson, W. A. & Moo-Young, M. Decolorization and detoxification of methylred by aerobic bacteria from a wastewater treatment plant.World J. Microbiol. Biotechnol. 20, 545–550.
Aftab, U., Khan, M. R., Mahfooz, M., Ali, M., Hassan, S. H. &Rehman, A. Decolorization and degradation of textileazo dyes by Corynebacterium sp. isolated from industrialeffluent. Pakistan J. Zool. 43, 1–8.

514 M. Ajaz et al. | Degradation of azo dye by bacterium, Alishewanella sp. CBL-2 Journal of Water Reuse and Desalination | 08.4 | 2018
Downloaded frby gueston 21 October
Aksu, Z. & Dönmez, G. A comparative study on thebiosorption characteristics of some yeasts for Remozal Bluereactive dye. Chemosphere 50, 1075–1083.
Asada, S., Amoozegarb, M. A., Pourbabaeec, A. A., Sarboloukic,M. N. & Dastgheib, S. M. M. Decolorization of textileazo dyes by newly isolated halophilic and halotolerantbacteria. Bioresour. Technol. 98 (11), 2082–2088.
Banat, I. M., Nigam, P., Singh, D. & Marchant, R. Microbialdecolorization of textile-dye-containing effluents: a review.Bioresour. Technol. 58, 217–227.
Cappucino, J. G. & Sherman, N. Microbiology. A LaboratoryManual, 6th edn. Pearson Education, Benjamin Cummings,San Francisco.
Chang, J. S. & Kuo, T. S. Kinetics of bacterial decolorizationof azo dye with Escherichia coliNO3. Bioresour. Technol. 75,107–111.
Chen, K. C., Wu, J. Y., Liou, D. J. & Hwang, S. C. J. Decolorization of the textile azo dyes by newly isolatedbacterial strains. J. Biotechnol. 101, 57–68.
da Silva, C. G. & Faria, J. L. Photochemical andphotocatalytic degradation of an azo dye in aqueous solutionby UV irradiation. Photochem. Photobiol. A: Chem. 155,133–143.
de-Bashan, L. E., Moreno Hernandez, J. P. & Bashan, Y. Removal of ammonium and phosphorus ions from syntheticwastewater by the microalgae Chlorella vulgariscoimmobilized in alginate beads with the microalgae growth-promoting bacterium Azospirillum brasilense. Water Res. 36,2941–2948.
Fournier, D., Halasz, A., Thiboutot, S., Ampleman, G., Dominic,M. & Hawari, J. Biodegradation of octahydro-1,3,5,7-tetranitro-1,3,5,7-tetrazocine (HMX) by Phnerochaetechrysosporium. New insight into the degradation pathway.Environ. Sci. Technol. 38, 4130–4133.
Fu, Y. & Viraraghavan, T. Dye biosorption sites in Aspergillusniger. Bioresour. Technol. 82, 139–145.
Ghodake, G., Jadhav, U., Tamboli, D., Kagalkar, A. & Govindwar,S. Decolorization of textile dyes and degradation ofmono-azo dye Amaranth by Acinetobacter calcoaceticusNCIM 2890. Indian J. Microbiol. 51, 501–508.
Givaudan, A., Effosse, A., Faure, D., Potier, P., Bouillant, M. L. &Bally, R. Polyphenol oxidase in Azospirillum lipoferumisolated from rice rhizosphere: evidence for laccase activityin non-motile strains of Azospirillum lipoferum. FEMSMicrobiol. Lett. 108, 205–210.
Gupta, V. K., Rastogi, A., Saini, V. K. & Jain, N. Biosorptionof copper(II) from aqueous solutions by Spirogyra species.J. Colloid Interf. Sci. 296, 59–63.
Hong, Y., Guo, J., Xu, Z., Chen, X. & Sun, G. Respirationand growth Sheanella oneidensis S12 with an azocompound as the sole electron. Appl. Environ. Microbiol. 99,4635–4641.
Ilyas, S. & Rehman, A. Decolorization and detoxification ofSynozol red HF-6BN azo dye, by Aspergillus niger andNigrospora sp. Iranian J. Environ. Health Sci. Eng. 10, 12.
om https://iwaponline.com/jwrd/article-pdf/8/4/507/482391/jwrd0080507.pdf
2018
Kalyani, D. C., Patil, P. S., Jadhhav, J. P. & Govindwar, S. P. Biodegradation of reactive textile dye Red BL1 by an isolatedbacterium Pseudomonas sp. SUKI. Bioresour. Technol., 99,4635–4641.
Khalid, A., Arshad, M. & Crowley, D. E. Accelerateddecolourization of structurally different azo dyes by newlyisolated bacterial strains. Appl. Microbiol. Biotechnol. 78,1838–1852.
Kodam, K. M., Soojhawon, I., Lohande, P. D. & Gawai, K. R. Microbial decolorization of reactive azo dyes under aerobicconditions. Word J. Microbiol. Biotechnol. 21, 367–370.
Kolekar, Y. M., Konde, P. D., Markad, V. L., Kulkarni, S. V.,Chaudhari, A. U. & Kodam, K. M. Effective bioremovaland detoxification of textile dye mixture by Alishewanella sp.KMK6. Appl. Microbiol. Biotechnol. 97 (2), 881–889.
Maier, J., Kandelbauer, A., Erlacher, A., Cavaco-Paulo, A. &Gubits, G. A new alkali thermostable azoreductase fromBacillus sp. strain SF. Appl. Environ. Microbiol. 70, 837–844.
Mali, P. L., Mahajan, M. M., Patil, D. P. & Kulkarni, M. V. Biodecolorization of members of triphenyl methane and azogroup of dyes. J. Sci. Ind. Res. 59, 221–224.
Martins, M. A. M., Queiroz, M. J., Silvestre, A. J. D. & Lima, N. Relationship of chemical structure of textile dye on thepreadaptation medium and the potentialities of theirbiodegradation by Phanerochaete chrysosporium. Res.Microbiol. 153, 361–368.
Masneuf-Pomarade, I., Jeuneb, C. L., Durrensc, P., Lollierb, M.,Aigled, M. & Dubourdieu, D. Molecular typing of wineyeast strains Saccharomyces bayanus var. uvarum usingmicrosatellite markers. Syst. Appl. Microbiol. 30, 75–82.
Mishra, G. & Tripathy, M. A critical review of the treatmentsfor decolorization of textile effluent. Colourage 40, 35–38.
Moosvi, S., Keharia, H. & Madamwar, D. Decolorization oftextile dye Reactive Violet 5 by a newly isolated bacterialconsortium RVM 11.1. World J. Microbiol. Biotechnol. 21,667–672.
Moutaouakkil, A., Zeroual, Y., Dzayri, F. Z., Talbi, M., Lee, K. &Blaghen, M. Purification and partial characterization ofazoreductase from Enterobacter agglomerans. Arch.Biochem. Biophys. 413, 139–146.
O’Neill, C., Hawkes, F. R., Hawkes, D. L., Lourenco, N. D.,Pinheiro, H. M. & Delee, W. Color in textile effluents:sources, measurement, discharge consents and simulation: areview. Chem. Technol. Biotechnol. 74, 1009–1018.
O’Neill, C., Lopez, A., Esteves, S., Hawkes, F. R., Hawkes, D. L. &Wilcox, S. Azo-dye degradation in an anaerobic–aerobictreatment system operating on simulated textile effluent.Appl. Microbiol. Biotechnol. 53, 249–254.
Okazaki, S., Nagasawa, S., Goto, M., Furusaki, S., Wariishi, H. &Tanaka, H. Decolorization of azo dye andanthraquinone dye in hydrophobic organic media usingmicroperoxidase-11 entrapped in reverse micelles. Biochem.Engin. 12, 237–241.
Robinson, T., McMullan, G., Marchant, R. & Nigam, P. Remediation of dyes in textile effluent: a critical review on

515 M. Ajaz et al. | Degradation of azo dye by bacterium, Alishewanella sp. CBL-2 Journal of Water Reuse and Desalination | 08.4 | 2018
Downloaded from httpby gueston 21 October 2018
current treatment technologies with a proposed alternative.Bioresour. Technol. 77, 247–255.
Sahasrabudhe, M. M., Saratale, R. G., Saratale, G. D. & Pathade,G. R. Decolorization and detoxification of sulfonatedtoxic diazo dye C.I. Direct red 81 by Enterococcus faecalisYZ 66. J. Environ. Health Sci. Eng. 12, 151.
Saikia, N. & Gopal, M. Biodegradation of β-cyfluthrin byfungi. J. Agr. Food Chem. 52, 1220–1223.
Sani, K. R. & Banerjee, U. C. Decolorization oftriphenylmethane dyes and textile and dyestuff effluent byKurthia sp. Enzyme Microb. Technol. 24, 433–437.
Selvam, K., Swaminathan, K. & Keo-Sang, C. Decolorizationof azo dyes and a dye industry effluent by a white rot fungusThelephora sp. Bioresour. Technol. 88, 115–119.
Seshadri, S., Bishop, P. L. & Agha, A. M. Anaerobic/aerobictreatment of selected azo dyes in wastewater. Waste Manage.15, 127–137.
Sheth, N. T. & Dave, S. R. Optimization for enhanceddecolorization of Reactive Red BS C.I. 111 by Pseudomonasaeruginosa NGKCTS. Biodegradation 20, 827–836.
Singh, S., Chatterji, S., Nandini, P. T., Prasad, A. S. A. & Rao,K. V. B. Biodegradation of azo dye Direct Orange 16 byMicrococcus luteus strain SSN2. Int. J. Environ. Sci. Technol.12, 2161–2168.
s://iwaponline.com/jwrd/article-pdf/8/4/507/482391/jwrd0080507.pdf
Turner, S., Pryer, K. M., Miao, V. P. W. & Palmer, J. D. Investigating deep phylogenetic relationships amongcyanobacteria and plastids by small subunit rRNA sequenceanalysis. J. Eukar. Microbiol. 46, 327–338.
Valderama, L. T., Del Campo, C. M., Rodriguez, C. M., de-Bashan,L. E. & Bashan, Y. Treatment of recalcitrant wastewaterfrom ethanol and citric acid production using the microalgaChlorella vulgaris and the macrophyte Lemna minuscule.Water Res. 36, 4185–4192.
Watanabe, K. & Baker, P. W. Environmentally relevantmicroorganisms. Biosci. Bioeng. 89, 1–11.
Wu, J., Kim, K.-S., Sung, N.-C., Kim, C.-H. & Lee, Y. C. Isolation and characterization of Shewanella oneidensis WL-7 capable of decolorizing azo dye Reactive Black 5. J. Gen.Appl. Microbiol. 55, 51–55.
Xu, M., Guo, J., Xu, Z., Chen, X. & Sun, G. Respiration andgrowth Shewanella oneidensis S12 with an azo compound asthe sole electron. Appl. Environ. Microbiol. 73, 64–72.
Yan, H. & Pan, G. Increase in biodegradation of dimethylphthalate by Closterium lunula using inorganic carbon.Chemosphere, 55, 1281–1285.
Zollinger, H. Colour Chemistry Synthesis Properties andApplication of Organic Dyes and Pigments. VCH, New York,pp. 92–102.
First received 11 November 2017; accepted in revised form 29 January 2018. Available online 20 March 2018

Ajaz et al. AMB Expr (2019) 9:64 https://doi.org/10.1186/s13568-019-0788-3
ORIGINAL ARTICLE
Degradation of azo dyes by Alcaligenes aquatilis 3c and its potential use in the wastewater treatmentMehvish Ajaz1, Abdul Rehman1*, Zaman Khan2, Muhammad Atif Nisar3 and Syed Hussain4
Abstract
In the present study, Alcaligenes aquatilis was found to decolorize 82% Synazol red 6HBN after incubation of 4 days at 37 °C and pH 7. Maximum decolorization was found under static conditions by using saw dust and yeast extract as carbon and nitrogen source. It also showed promising potential to decolorize mixture of multiple dyes at a rate of more than 86% in 5 days. Decolorization of dye had positive influence on the growth of bacterium as growth rate was increased along with decolorization. The cleavage of azo bond was confirmed through TLC, HPLC and GC–MS analysis. The dye metabolites produced during bacterial treatment are linked to various pathways including ATP synthesis pro-cess. The absence of peaks of wavelength 1612/cm and 1532/cm in bacterially treated FTIR sample demonstrated the cleavage of azo bond. Microbial growth in decolorized dye wastewater shows that bacterially decolorized wastewater is unharmful for the growth of micro-flora. The high decolorization ability of A. aquatilis 3c to convert toxic azo dyes into useful end products may find potential applications in the environmental biotechnology.
Keywords: Azo dyes, Decolorization, A. aquatilis 3c, HPLC, FTIR, GC–MS
© The Author(s) 2019. This article is distributed under the terms of the Creative Commons Attribution 4.0 International License (http://creat iveco mmons .org/licen ses/by/4.0/), which permits unrestricted use, distribution, and reproduction in any medium, provided you give appropriate credit to the original author(s) and the source, provide a link to the Creative Commons license, and indicate if changes were made.
IntroductionIndustrialization is the backbone for the welfare and development of a country. Apart from its beneficial effects on the economy of a country it also exerts harmful effect on the environment and organisms. The discharge of wastewater from various industries becomes a contin-uous source of environmental pollution. Synthetic dyes, which are widely used in such industries, are a major por-tion of this discharged wastewater. These dyes are even more harmful for the organisms in comparison to other pollutants because of their resistance potential (de Souza et al. 2010).
Azo dyes are the largest class of synthetic dyes which are aromatic in nature structurally having one or more –N=N– bond. These dyes are rapidly used in various industries like textile, cosmetics, paper, food and phar-maceutical industry while the textile industry is its largest
consumer (Alalewi and Jiang 2012). Their extensive com-mercial use is because of the reason that they are easily synthesized and economical for the users (Saratale et al. 2009a).
The loss of dyes from fabrics ranges from 2% for basic dyes to as high as 50% for reactive dyes as all the dye does not bind to the fabric (O’Neil et al. 1999; Pandey et al. 2007). The discharge of dye contaminated wastewater in aquatic ecosystems arises many serious problems. It causes obstruction in light penetration; oxygen transfer is reduced in water bodies, poses acute toxic effects on aquatic flora and fauna and also causes severe environ-mental problems (Solis et al. 2012).
There is an extensive use of physicochemical tech-niques like coagulation and flocculation worldwide to treat industrial effluents (Verma et al. 2012). Certain dis-advantages are associated with the use of such techniques like usage of chemicals, sludge production which serve as source of secondary pollution, production of by products and high cost (Jadhav et al. 2007). In comparison to these physiochemical processes, use of variety of microorgan-isms including yeast, fungi and bacteria is more feasible
Open Access
*Correspondence: [email protected] 1 Department of Microbiology and Molecular Genetics, University of the Punjab, New Campus, Lahore 54590, PakistanFull list of author information is available at the end of the article

Page 2 of 12Ajaz et al. AMB Expr (2019) 9:64
as they are environmental friendly and their use result in the cleavage of azo bond which leads to formation of colorless aromatic amines (Kaushik and Malik 2010; Das and Mishra 2016; Meerbergen et al. 2018). The resulting products such as aromatic amines are further degraded to simpler non-toxic forms by multiple-step bioconver-sion occurring aerobically or anaerobically (Shah et al. 2012; Singh et al. 2014).
The current study was aimed at to isolate and char-acterize bacterium from industrial effluents capable to decolorize azo dyes. Optimum growth conditions of the organism were determined and bacterially degraded dye products were also analysed through TLC, HPLC, FTIR and GC–MS.
Materials and methodsSample collection and bacterial isolationIndustrial effluent samples were collected in autoclaved screw-capped bottles from Kot Lakhpat industrial estate, Lahore, Pakistan. Physicochemical parameters such as pH, temperature, as well as color of the samples were also noted at the time of sample collection. The samples were serially diluted and plated on the L-agar plates. L-agar medium was prepared by dissolving tryptone (10 g), yeast extract (5 g), NaCl (5 g) and agar (15 g) in 1000 ml of dis-tilled water. pH of the medium was adjusted to 7.
Evaluation of dye degrading potentialDye degrading potential was determined by inoculating the bacterial isolate in 250 ml Erlenmeyer flask having 100 ml of mineral salt medium (MSM) whose composi-tion is (g/l): (NH4)SO4, 0.28; MgSO4·7H2O, 0.04;NH4Cl, 0.23; KH2PO4, 0.067; FeCl3·6H2O, 0.005; CaCl2·2H2O, 0.022; yeast extract, 0.2; NaCl, 0.15; NaHCO3, 1.0 and 1 ml/l of a trace element solution containing (g/l): MnCl2·4H2O, 0.1;ZnSO4·7H2O, 0.01; CuSO4·5H2O, 0.392; NaB4O7·10 H2O, 0.177; CoCl2·6H2O, 0.248 and NiCl2·6H2O, 0.02 (Parshetti et al. 2006) with glucose and yeast extract (1% each) used as carbon and nitrogen source respectively. The medium was supplemented with dye (Synazol red 6HBN) at a concentration of 50 mg/l for 4 days of incubation at 37 °C. Synazol red 6HBN, Congo red, Methyl red, Phenol red, Brilliant black and Navy blue were purchased from Sigma-Aldrich. All other chemicals were of analytical grade purity.
Bacterial characterizationThe bacterial morphological parameters and biochemi-cal tests were performed according to protocols given in Cappucino and Sherman (2008). For 16S rRNA ribotyp-ing, DNA was isolated (Masneuf-Pomarade et al. 2007)
and 16S rRNA gene was amplified through PCR by using universal bacterial primers (Turner et al. 1999). PCR was performed according to Rehman et al. (2007) and PCR product was purified by Fermentas Gene Jet Gel Extrac-tion kit (#K0691). The purified product was sequenced and submitted to GenBank for obtaining accession numbers. Phylogenetic analysis was done using MEGA7 (Kumar et al. 2016). Phylogenetic tree was constructed using neighbor joining method with 1000 replicates.
Determination of optimal growth conditionsThe physical parameters which were favorable for the bacterial growth i.e., temperature and pH were analyzed by growing bacterium at different temperature and pH. For optimum temperature determination, bacterial iso-late was grown in LB broth and incubated at different temperature i.e., 20, 30, 37 and 45 °C and for optimum pH, the bacterial isolate was grown in LB broth with pH values i.e., 5, 6, 7, 8, 9 and 10. After 24 h of incubation, absorbance was recorded at 600 nm by using spectropho-tometer. In order to determine growth pattern of bacte-rial isolate, LB medium was inoculated with log phase grown bacterial culture (1 ml). Optical density was deter-mined by spectrophotometer at 600 nm at the time of inoculation and then after regular interval of 4 h up to 28 h of growth at optimum temperature and pH.
Decolorization experimentsIn order to optimize the decolorization conditions decol-orization experiments were performed at various condi-tions i.e., temperature (20, 30, 37, 45 and 50 °C), pH (5, 6, 7, 8, 9, 10), incubation condition (static and shaking), carbon sources (saw dust, sugarcane baggase and wheat bran) and nitrogen source (yeast extract, beef extract and peptone) source, inoculum percentage (2%, 4%,6%, 8% and 10%) and dye concentration (3, 5, 7, 10, 20 and 50 mg/l). A volume of 100 ml of MSM was taken in 250 ml of Erlenmeyer flask which was then inoculated with 2% of bacterial suspension and incubated at respec-tive condition. The stock solution of dye was added into the MSM to obtain a final dye concentration of 50 mg/l. Aliquot was taken out at 0 h and after 3 days in order to measure initial and final absorbance, respectively. The aliquot was centrifuged before measuring the opti-cal density at 465 nm. Decolorization percentage of the sample was measured by using following formula. All the treatments and controls were carried out in triplicates.
Decolorization (%)
=
Initial absorbance− Final absorbance
Initial absorbance× 100

Page 3 of 12Ajaz et al. AMB Expr (2019) 9:64
Effect of decolorization on growth of bacterial isolateIn order to check the effect of decolorization on growth of bacterial isolate, the bacterium was grown in MSM containing dye concentration of 50 mg/l. The aliquot was obtained after every day up to 5 days and optical den-sity was measured at 600 nm in order to find out growth ratio. Decolorization was also calculated by measuring the optical density of supernatant at 465 nm after centrif-ugation of the sample.
Decolorization of multiple dyesThe bacterial isolate was checked for its ability to decol-orize a mixture of azo dyes i.e., Congo red, Methyl red, Phenol red, Brilliant black and Navy blue. The initial con-centration of each dye was maintained at 50 mg/l. The optical density of centrifuged sample (supernatant) was taken and finally percent decolorization was calculated by using above mentioned formula (Kalyani et al. 2008).
Analysis of dye degraded productsHPLC, TLC and FTIRThe analysis of dye degraded products was done by thin layer chromatography (TLC), high performance liquid chromatography (HPLC) and Fourier transform infra-red spectroscopy (FTIR). The metabolites were extracted from dye degraded sample (100 ml, 5 days) by mixing it with an equal volume of ethyl acetate. The extracts were then dried on anhydrous Na2SO4 and evaporated in rotary evaporator. The dried powder thus obtained was dissolved in HPLC grade methanol and used for analysis.
TLC was performed to analyze the degraded products on silica gel using mobile phase solvent system n-pro-panol, methanol, ethyl acetate, water and glacial ace-tic acid in the ratio 3:2:2:1:0.5 (Kalyani et al. 2008) and the results were visualized under UV illuminator at 254 and 366 nm. HPLC was performed at (Waters model no 2690) C18 column having symmetry 250 × 4.6 mm using methanol as mobile phase with a flow rate of 1.0 ml/min for 15 min and UV detector at 254 nm (Telke et al. 2009).
FTIR (Bruker, alpha-P) was performed to observe the change in structure of dye before and after decoloriza-tion. The FTIR analysis was done in the mid IRF region of 400–4000/cm. Prior to analysis sample was mixed with pure KBr in the ratio of 5:95 and pellet were then fixed in the holder for analysis (Saratale et al. 2009b).
Gas chromatography mass spectrometryThe collected samples were centrifuged for 10 min at 4 °C and the supernatant collected were extracted thrice with an equal volume of ethyl acetate, dried with Na2SO4 and further concentrated in the rotatory evaporator. GC–MS analysis of metabolites was carried out using gas chro-matograph system (GCMS-QP2010 Ultra, Shimadzu)
equipped with capillary column (DB-5 ms). The sam-ples were diluted 1:100 and injected 1.0 µl sample into GC–MS in split mode with injector temperature of 290 °C. Helium was used as a carrier gas with flow rate of 1.02 ml/min under 54.9 kPa inlet pressure. The column temperature was set to 50 °C and hold for 1 min with sub-sequent increase to 280 °C with ramp rate of 30 °C/min without holding and finally to 310 °C with ramp rate of 15 °C/min by holding it for 8 min. The peaks were identi-fied by comparing with NIST27.LIB mass spectra library of GC–MS database.
Effect of decolorized dye wastewater on microbial growthThe extent of bacterially treated wastewater effect was determined on some useful micro-flora including Bacil-lus megatarium (z-28), Bacillus cereus (T358-2) and Bacillus subtilis (z-66) according to Mali et al. (2000). The plates (L-agar) were swabbed by bacteria; a 2 mm well was made and filled with decolorized dye wastewater. The plate’s incubation was done at 37 °C for 24 h and the zone surrounded the well indicating the toxicity index of degraded dye sample.
ResultsPhysicochemical parameters and isolation of dye degrading bacteriumThe temperature of wastewater samples ranged from 28 to 36 °C while the pH ranged between 8 to10. The color of the samples was black, navy blue and maroon. A total of 14 bacteria were isolated from 3 wastewater samples. On the basis of dye degrading potential, one bacterial isolate designated as 3c, showing 82% decolorization after 4 days of incubation at 37 °C, was selected for further research work (Additional file 1: Table S1). The significant visual difference between control and dye containing wastewa-ter is shown in Fig. 1.
Fig. 1 Change in color of Synazol red 6HBN as compared to control in flask containing culture of bacterial isolate 3c from the dye contaminated wastewater

Page 4 of 12Ajaz et al. AMB Expr (2019) 9:64
Bacterial identificationThe morphological and biochemical characteristics are given in Table 1. The optimum growth conditions of the bacterium were 37 °C and pH 7 (Additional file 1: Fig. S1). The organism showed maximum growth (O.D) after 16 h of incubation in LB medium (Additional file 1: Fig. S2). The 16S rRNA gene sequence of bacte-rial isolate showed 95% homology with 16S rRNA gene sequence of Alcaligenes aquatilis. Then this 16S rRNA gene sequence was submitted to GenBank under acces-sion number of KY009932. The bacterial strain has also been deposited at First Fungal Culture Bank of Pakistan and has been assigned accession number FCBP-B-728. The phylogenetic tree (Additional file 1: Fig. S3) which was constructed through MEGA7 shows the homol-ogy of A. aquatilis 3c with members of Alcaligenes sp. The frequency of appearance of completely identical sequence among the strains was indicated by number in the parenthesis.
Optimization of dye decolorizationThe result showed that the A. aquatilis 3c showed maxi-mum decolorization at 37 °C (Fig. 2a), pH 7 (Fig. 2b) and
at static condition (Fig. 2c). The bacterium efficiently uti-lized saw dust and yeast extract as carbon and nitrogen sources, respectively (Fig. 2d, e) to show maximum per-centage of decolorization. Moreover, efficient decoloriza-tion was determined when inoculum percentage was 6 and dye concentration was 10 mg/l (Fig. 2f, g).
Effect of decolorization on growth of bacterial isolateIt was determined that with the passage of time growth rate of A. aquatilis 3c was also increased along with the increase in decolorization percentage (Fig. 3a).
Multiple dyes decolorizationWhen A. aquatilis 3c was grown in the medium contain-ing multiple dyes, it showed 27, 38, 62, 80 and 86% decol-orization after incubation of 1, 2, 3, 4 and 5 days (Fig. 3b).
Dye degraded products analysisTLCTLC analysis showed two bands with Rf value of 0.96 and 0.94 as compared to the control (original dye) band with Rf value of 0.83 when visualized under UV range of 254 and 366 nm (Additional file 1: Fig. S4).
HPLCThe chromatogram of the untreated dye sample showed three detectable peaks at retention time of 1.80, 2.88 and 5.00 min (Fig. 4a) while A. aquatilis 3c treated dye sam-ple showed peaks at retention time of 1.99, 2.30, 2.95 and 3.76 min after 5 days of incubation (Fig. 4b).
FTIRA comparison between the FTIR spectrum of control dye and extracted metabolites was given in Fig. 5. Two specific peaks of wavelength 1612/cm and 1532/cm are shown in FTIR spectrum of control dye which are due to the presence of –N=N– stretching. The peak with wave-length 1395/cm indicates C–O–H bending. The peak with a wavelength 1037/cm is due to C–O stretching. There is a variation in the peaks in the FTIR spectrum of metabolites extracted from bacterial decolorized sample of dye when compared to the control dye spectrum. The absence of peaks with wavelength 1612/cm and 1532/cm indicates the reductive cleavage of azo bond. The peak with wavelength 2850/cm and 2923/cm is due to stretch-ing of alkanes. The peaks with 1755/cm and 1717/cm wavelength indicate the presence of C=O group. A peak of wavelength 1289/cm depicts the presence of carboxyl group. Two peaks with wavelength 1104/cm and 1037/cm show the presence of amines (C–N). The presence of peak with wavelength 769/cm indicates the presence of conjugated C=C.
Table 1 Morphological and biochemical characteristics of A. aquatilis 3c
+ve: positive, –ve: negative
Morphological characteristics A. aquatilis 3c
Shape Spherical
Size 1 mm
Color Pale yellow
Elevation Non elevated
Edges Smooth
Texture Sticky
Gram’s staining Gram negative
Biochemical characteristics
Fermentation
Lactose –ve
Sucrose –ve
Dextrose –ve
H2S production –ve
Nitrate reduction –ve
Indole production –ve
Methl red reaction –ve
Voges Proskauer reaction –ve
Citrate use ± Urease activity –ve
Catalase activity +ve
Oxidase activity +ve

Page 5 of 12Ajaz et al. AMB Expr (2019) 9:64
a b
cd
e f
0
10
20
30
40
50
60
70
25 30 37 45 50
Dec
olor
izat
ion
(%)
Temperature (°C)
0
10
20
30
40
50
60
70
5 6 7 8 9 10
Dec
olor
izat
ion
(%)
pH
0
10
20
30
40
50
60
70
80
Static Shaking
Dec
olor
izat
ion
(%)
Incubation condition
01020304050607080
S.B S.D W.B
Dec
olor
izat
ion
(%)
Carbon source
0102030405060708090
B.extract Peptone Y.extract
Dec
olor
izat
ion
(%)
Nitrogen source
0
10
20
30
40
50
60
70
80
2 4 6 8 10
Dec
olor
izat
ion
(%)
Innoculum size (%)
g
01020304050607080
3 5 7 10 20 50
Dec
olor
izat
ion
(%)
Dye concntration (mg/l)Fig. 2 Optimization of decolorization conditions for A. aquatilis 3c a temperature, b pH, c incubation condition, d carbon source, e nitrogen source, f inoculum percentage, and g dye concentration

Page 6 of 12Ajaz et al. AMB Expr (2019) 9:64
GC–MS analysisAccording to GC–MS analysis, various end prod-ucts of azo dye were found including pentadecanal, 2-acetyl-3-methylhexahydropyrrolo[1,2-a]pyrazine-1,4-dione, [Z]-hexadec-9-enoic acid, palmitic acid, 3-isobutylhexahydropyrrolo[1,2-a]pyrazine-1,4-dione, 3-benzylhexahydropyrrolo[1,2-a]pyrazine-1,4-dione, bis(6 methylheptyl) phthalate, chlorobenzene, and N′-(3,6-dichloro-2,7-bis(2-(ethyl(methyl)amino) ethoxy-9H-flu-oren-9 ylidene) pivalohydrazide (Additional file 1: Fig. S5).
In the present study, it is confirmed through GC–MS analysis that azo dye enzymatically converted into various end products. These metabolites are used in different pathways for example pyrrolo[1,2-a]pyrazine-1,4-dione derivative can be used as a substrate in amino acid metabolism. The amino acid catabolism can synthe-size 3C compound (pyruvate) which can be converted into acetyl-CoA. The acetyl-CoA further undergoes Krebs cycle to generate reduced molecules (NADH2 and FADH2). Moreover, another end product, phthalate
derivative can be changed into different fatty acids and aldehydes and these molecules can directly/indirectly enter into fatty acid β-oxidation reactions to produce NADH2 and FADH2. These reduced molecules may be used in the process of ATP synthesis (Fig. 6).
Impact of decolorized dye wastewater on microbial growthThe plates were overlaid with microbial growth showing no inhibition zones and indicating that the decolorized dye wastewater is unharmful for the microbial growth (Fig. 7). Likewise, A. aquatilis 3c treated dye wastewater was tested for microbial toxicity assessment and was also found unharmful for microbial growth.
DiscussionNumerous microbes, counting fungi, yeasts, bacteria as well as algae, may decolourize and even cause whole mineralization of several azo colorants underneath sure ecological circumstances. Several assessments are acces-sible on the physiochemical as well as microbiological approaches for azo dyes decolourization (Kaushik and Malik 2010, 2011; Singh et al. 2014; Das and Mishra 2016; Liu et al., 2018; Meerbergen et al. 2018). Aftab et al. (2011) reported a Corynebacterium sp. which decolorizes Reactive black 5 up to 60% and Reactive yellow 15 up to 76% within a period of 4 days when the initial concentra-tion was 100 µg/ml.
Shah (2014) reported three bacteria namely Pseu-domonas putida, P. aeruginosa and B. subtilis capable of degrading multiple dyes i.e., Blue RR, Black B, Red RR, Yellow RR and Navy blue. P. putida showed maximum decolorization of Blue RR (95%), P. aeruginosa of Black B (93%) and Navy blue (70.58%) and B. subtilis of Yellow RR (65%) and Red RR (91%). Joe et al. (2008) reported a bacterium, Clostridium biofermentans, which was able to decolorize dyes Reactive red 3B-A, Reactive black 5, and Reactive yellow 3B-A, by over 90% within a period of 36 h. Likewise, Kaushik and Malik (2011) reported that the high dye removal efficiency (99.97%) and high uptake capacity (97.54 mg/g) of Aspergillus lentulus FJ172995 in 24 h using optimum process variables.
In the current study, A. aquatilis was found to decolor-ize 82% Synazol red 6HBN after incubation of 4 days at 37 °C and pH 7. Saha et al. (2017) reported two A. faeca-lis species namely A. faecalis E5.Cd and A. faecalis Fal.3 which decolorize up to 93% of Blue H/C and Red 3B dye at pH 7 and 94% of Yellow 3R at pH 8 within a period of 96 h. Both the strains decolorize up to 91% of dye at 35 °C, 92% with 50 ppm initial dye concentration and 93% with 20% inoculum size and supplementation of 1% co-substrate respectively. Shah et al. (2013) reported that Bacillus species i.e., B. cereus and B. megatarium hav-ing 95% and 98% dye decolorizing potential respectively
0
10
20
30
40
50
60
70
80
90
0
0.5
1
1.5
2
2.5
3
1 2 3 4 5
Dec
olor
izat
ion
(%)
Opt
ical
den
sity
at 6
00nm
Time (days)
GrowthDecolorization
0102030405060708090
100
1 2 3 4 5
Dec
olor
izat
ion
(%)
Time (days)
a
b
Fig. 3 a Effect of growth (O.D) on decolorization (%) of A. aquatilis 3c incubated for 5 days. b A. aquatilis 3c potential to decolorize multiple dyes incubated at 37 °C for a period of 5 days

Page 7 of 12Ajaz et al. AMB Expr (2019) 9:64
under optimum conditions. Optimal condition for B. cereus was found to be 37 °C, pH 7, 1% sucrose, 0.25% peptone and 8% inoculum and that for B. megaterium was found to be 37 °C, pH 6, glucose 1%, 0.25% yeast extract and 10% inoculum.
Different bands with Rf value were visualized in Direct orange 16 treated with Micrococcus luteus strain SSN2 and untreated samples when visualized under UV range of 254 nm (Singh et al. 2015). Likewise, a band with Rf value of 0.71 was visualized in the TLC chromatogram of decolorized sample of Direct red by Enterococcus faeca-lis YZ66 as compared to the untreated original dye which had a band with Rf value of 0.97 (Sahasrabudhe et al.
2014). Similar results were obtained against Amarnath mono azo dye decolorized by Acinetobacter calcoaceticus NCIM 2890 (Ghodake et al. 2011). In the present investi-gation, TLC analysis showed two bands with Rf value of 0.96 and 0.94 as compared to the control dye band with Rf value of 0.83 when visualized under UV range of 254 and 366 nm.
Lade et al. (2015) observed three major peaks with retention time 2.521, 3.241 and 3.564 and two minor peaks of retention time 3.123 and 3.910 when extracted metabolites from Provedencia rettgeri decolorized C.I reactive blue 172 were analyzed through HPLC. The HPLC analysis of the control dye results in the presence
Fig. 4 HPLC analysis of reactive Synazol red 6HBN with a mobile phase of profile of methanol at 1.0 mL/min. The column was C-18 (250 × 4.6 mm) a represents dye chromatogram while b represents A. aquatilis 3c degraded dye products extracted after 5 days of incubation at 37 °C

Page 8 of 12Ajaz et al. AMB Expr (2019) 9:64
of one major peak with retention time of 2.702 min three minor peaks at retention time of 2.125, 2.801 and 3.394 min. HPLC analysis demonstrated the presence of two major peaks at retention time 2.45 and 2.68 and two minor peaks at retention time 3.50 and 6.50 min when B. halodurans decolorized Acid black-24. The chromato-gram of original dye had only one peak at retention time of 2.81 min (Prasad and Rao 2014). In this study, A. aqua-tilis 3c treated dye sample showed peaks at retention time of 1.99, 2.30, 2.95 and 3.76 min after 16 days of incu-bation (Fig. 4b) while dye sample showed three detect-able peaks at retention time of 1.80, 2.88 and 5.00 min.
In the present study, two specific peaks of wavelength 1612 and 1532/cm are shown in FTIR spectrum of con-trol dye while such peaks are absent in bacterium treated dye sample indicates the reductive cleavage of azo bond. The absence of peak of wavelength 1631/cm in FTIR spectrum of Marinobacter sp. strain HBRA treated
Direct blue-1 sample as compared to the spectrum of control dye clearly demonstrated the degradation of azo bond (Prasad et al. 2013). Shyamala et al. (2014) reported the breakdown of Methyl orange by halotolerant Bacillus sp. as peaks of wavelength 1567/cm and 1424/cm which were present in FTIR spectrum of control dye were absent in spectrum of bacterially treated sample.
Hungerer et al. (1996) reported that the azo-dye degraded compound 1,2-benzene dicarboxylic acid, butyl 8-methylnonyl ester was cleaved to form phthalic acid and palmitic acid. Our findings are similar with other studies that reported that the predominant compounds found in the final dye treated sample were 3-Aminobu-tanoic acid, pyrrolo pyrazine-1, 4-dione and palmitic acid (Harwood and Parales 1996; Walker and Van der Donk 2016; Shanmugam et al. 2017). In the current research, it is confirmed through GC–MS analysis that azo dye
Fig. 5 FTIR spectrum of control dye (Synazol red 6HBN) and A. aquatilis 3c treated sample
Fig. 6 Synazol red 6HBN dye enters into the cell (A. aquatilis 3c) by unknown mechanism. Upon entrance into the cell the dye is enzymatically processed into various end products. Most probably, azo group (–N=N–) is reduced, followed by cleavage reaction and different end products are produced. Secondly, desulfonation and oxidative deamination results in synthesis of pyrrolo[1,2-a]pyrazine-1,4-dione derivative which can be used as substrates in amino acid metabolism. The amino acid catabolism can synthesize pyruvate (3C compound) which can be converted into acetyl-CoA. The acetyl-CoA undergoes Krebs cycle to produce NADH2 and FADH2 (substrates of electron transport chain). Moreover, dye desulfonation, oxidative deamination and carboxylation lead to produce phthalate derivatives, which can be transformed into different fatty acids and aldehydes. The phthalate, fatty acids and aldehydes can directly/indirectly enter into fatty acid oxidation reactions (β-oxidation) to produce acetyl-CoA, NADH2 and FADH2
(See figure on next page.)

Page 9 of 12Ajaz et al. AMB Expr (2019) 9:64

Page 10 of 12Ajaz et al. AMB Expr (2019) 9:64
enzymatically converted into various end products which may be involved in the synthesis of energy yielding processes.
In the current work, A. aquatilis 3c treated dye waste-water was tested for microbial toxicity assessment and was also found unharmful for microbial growth. Aspergil-lus niger and Nigrospora sp. degraded dye end products containing wastewater was found safe for the growth of soil micro-flora (Ilyas and Rehman 2013). The degrada-tion products of Sudan 1 by B. circulans BWL1061 and S. putrefaciens CN32 showed a decreased toxicity to E. coli BL21 and B. subtilis 168 (Liu et al. 2018). Similarly, Shah et al. (2012) reported the degradation of Reactive Orange 13 through enzyme assay and GC–MS analysis. The final products, naphthalene and 6-[(4-chloro-1,3,5-triazin-2-yl) amino]-2-iminonaphthalen-1(2H)-one were non-toxic revealed by phytotoxicity study.
In conclusion, A. aquatilis 3c has a promising potential to decolorize Synazol red 6HBN (82%) after incubation of 4 days at its optimum growth conditions. The maximum dye decolorization was found under static conditions by using saw dust and yeast extract as carbon and nitrogen source. The bacterium also showed promising poten-tial to decolorize multiple dyes at a rate of 86% in 5 days and dye degradation had positive effect on the growth of organism. This degradation was confirmed through TLC, HPLC, FTIR and GC–MS analysis and the end products are used in various metabolic pathways including ATP synthesis process. It was tested that bacterially decolor-ized dye wastewater is safe and sound for useful micro-bial flora. By using this promising decolorization ability of A. aquatilis 3c wastewater can be ameliorated and used at least for crops irrigation.
Fig. 7 Bacterial decolorized broth used for incubation of a B. subtilis (z-66), b B. megatarium (z-28) and c B. cereus (T358-2) at 37 °C for 48 h. No zone of inhibition was observed in any case

Page 11 of 12Ajaz et al. AMB Expr (2019) 9:64
Additional file
Additional file 1: Table S1. Decolorization (%) of bacteria isolated from 3 industrial samples. Figure S1. Growth of A. aquatilis 3c at various (a) temperature and (b) pH after incubation of 16 h. Figure S2. Growth of A. aquatilis 3c in LB medium. Optical density was taken at 600 nm after regular time interval. Figure S3. Phylogenetic tree constructed through MEGA7 to show homology of A. aqualitis 3c with Alcaligenes sp. Figure S4. TLC chromatogram of extracted metabolites of A. aquatilis 3c decolor-ized dye samples visualize UV range of (a) 254 and (b) 366 nm. Figure S5. Chromatograms of extracted metabolites of A. aquatilis 3c decolorized dye sample through GC-MS analysis.
AcknowledgementsNot applicable.
Authors’ contributionsMA performed experiments and analyzed the results. AR designed and supervised the study and helped in manuscript preparation. SZH helped in conducting experiments. ZK and MAN helped in analyzing the data and manuscript preparation. All authors read and approved the final manuscript.
FundingThis is to acknowledge the support of University of the Punjab (Grant no. Env-67), Lahore, Pakistan to accomplish this research work.
Availability of data and materialsPlease contact author for data requests.
Ethics approval and consent to participateNot applicable.
Consent for publicationNot applicable.
Competing interestsThe authors declare that they have no competing interests.
Author details1 Department of Microbiology and Molecular Genetics, University of the Pun-jab, New Campus, Lahore 54590, Pakistan. 2 University, Institute of Medical Laboratory Technology (UIMLT), Faculty of Allied Health Sciences (FAHS), The University of Lahore, Lahore, Pakistan. 3 Department of Microbiology, Govern-ment College University Faisalabad (GCUF), Faisalabad, Pakistan. 4 Department of Chemistry, SBA School of Sciences and Engineering (SBASSE) Lahore, Uni-versity of Management Sciences (LUMS), DHA, Cantt, Lahore 54792, Pakistan.
Received: 10 December 2018 Accepted: 30 April 2019
ReferencesAftab U, Khan MR, Mahfooz M, Ali M, Hassan SH, Rehman A (2011) Decoloriza-
tion and degradation of textile azo dyes by Corynebacterium sp. isolated from industrial effluent. Pakistan J Zool 43:1–8
Alalewi A, Jiang C (2012) Bacterial influence on textile wastewater decoloriza-tion. J Environ Protect 3:889–901
Cappuccino JG, Sherman N (2008) Microbiology: a laboratory manual, vol 9. Pearson/Benjamin Cummings, Boston
Das A, Mishra S (2016) Decolorization of different textile azo dyes using an isolated bacterium Enterococcus durans GM13. Int J Curr Microbiol Appl Sci 5:675–686
de Souza SM, Bonilla KA, de Souza AA (2010) Removal of COD and color from hydrolyzed textile azo dye by combined ozonation and biological treat-ment. J Hazard Mater 179:35–42
Ghodake G, Jadhav U, Tamboli D, Kagalkar A, Govindwar S (2011) Decoloriza-tion of textile dyes and degradation of mono-azo dye Amaranth by Acinetobacter calcoaceticus NCIM 2890. Indian J Microbiol 51:501–508
Harwood CS, Parales RE (1996) The beta-ketoadipate pathway and the biology of self-identity. Annu Rev Microbiol 50:553–590
Hungerer C, Troup B, Römling U, Jahn UD (1996) Regulation of the hemA gene during 5-aminolevulinic acid formation in Pseudomonas aeruginosa. J Bacteriol 177:1435–1443
Ilyas S, Rehman A (2013) Decolorization and detoxification of Synozol red HF-6BN azo dye, by Aspergillus niger and Nigrospora sp. Iranian J Environ Health Sci Eng 10:12
Jadhav JP, Parshetti GK, Kalme SD, Govindwar SP (2007) Decolorization of azo dye methyl red by Saccharomyces cerevisiae MTCC 463. Chemosphere 68:394–400
Joe MH, Lim SY, Kim DH, Lee S (2008) Decolourization of reactive dyes by Clostridium bifermentans SL186 isolated from contaminated soil. World J Microbiol Biotechnol 24:117–121
Kalyani DC, Telke AA, Dhanve RS, Jadhav JP (2008) Ecofriendly biodegrada-tion and detoxification of reactive red 2 textile dye by newly isolated Pseudomonas sp. SUK1. J Hazard Mater 163:735–742
Kaushik P, Malik A (2010) Effect of nutritional conditions on dye removal from textile effluent by Aspergillus lentulus. World J Microbiol Biotechnol 26:1957–1964
Kaushik P, Malik A (2011) Process optimization for efficient dye removal by Aspergillus lentulus FJ172995. J Hazard Mater 185(2–3):837–843
Kumar S, Stecher G, Tamura K (2016) MEGA7: molecular evolutionary genetics analysis version 7.0. Mol Biol Evol 33:1870–1874
Lade H, Govindwar S, Paul D (2015) Low-cost biodegradation and detoxifica-tion of textile azo dye C.I. Reactive blue 172 by Providencia rettgeri strain HSL1. J Chem 2015:1–10. https ://doi.org/10.1155/2015/89410 9
Liu W, You Y, Sun D, Wang S, Zhu J, Liu C (2018) Decolorization and detoxifi-cation of water-insoluble Sudan dye by Shewanella putrefaciens CN32 co-cultured with Bacillus circulans BWL1061. Ecotoxicol Environ Saf 166:11–17
Mali PL, Mahajan MM, Patil DP, Kulkarni MV (2000) Biodecolorization of members of triphenyl methane and azo group of dyes. J Sci Ind Res 59:221–224
Masneuf-Pomarade I, Jeuneb CL, Durrensc P, Lollierb M, Aigled M, Dubourdieu D (2007) Molecular typing of wine yeast strains Saccharomyces bayanus var. uvarum using microsatellite markers. Syst Appl Microbiol 30:75–82
Meerbergen K, Willems KA, Dewil R, Van Impe J, Appels L, Lievens B (2018) Isolation and screening of bacterial isolates from wastewater treatment plants to decolorize azo dyes. J Biosci Bioeng 125(4):448–456
O’Neil C, Hawkes FR, Hawkes DL, Lourenco ND, Pinheiro HM, Delee W (1999) Colour in textile effluents-sources, measurement, discharge consents and simulation: a review. J Chem Technol Biotechnol 74:1009–1018
Pandey A, Singh P, Iyengar L (2007) Bacterial decolorization and degradation of azo dyes. Int Biodeterior Biodegradation 59:73–84
Parshetti G, Kalme S, Saratale G, Govindwar S (2006) Biodegradation of mala-chite green by Kocuria rosea MTCC 1532. Acta Chim Slov 53:492–498
Prasad ASA, Rao KVB (2014) Aerobic biodegradation of azo dye Acid Black-24 by Bacillus halodurans. J Environ Biol 35:549–554
Prasad ASA, Satyanarayana VSV, Rao KVB (2013) Biotransformation of direct blue 1 by a moderately halophilic bacterium Marinobacter sp. strain HBRA and toxicity assessment of degraded metabolites. J Hazard Mater 262:674–684
Rehman A, Ali A, Muneer B, Shakoori AR (2007) Resistance and biosorption of mercury by bacteria isolated from industrial effluents. Pakistan J Zool 39:137–146
Saha AK, Sultana N, Mohanta MK, Mandald A, Haquee M (2017) Identification and characterization of azo dye decolourizing bacterial strains, Alcaligenes faecalis E5.Cd and A. faecalis Fal. 3 isolated from textile effluents. Am Sci Res J Eng Technol Sci 3:163–175
Sahasrabudhe MM, Saratale RG, Saratale GD, Pathade GR (2014) Decoloriza-tion and detoxification of sulfonated toxic diazo dye C.I. Direct red 81 by Enterococcus faecalis YZ 66. J Environ Health Sci Eng 12:151
Saratale RG, Saratale GD, Kalyani DC, Chang JS, Govindwar SP (2009a) Enhanced decolorization and biodegradation of textile azo dye Scarlet R by using developed microbial consortium-GR. Bioresour Technol 100:2493–2500
Saratale RG, Saratale GD, Chang JS, Govindwar SP (2009b) Decolorization and biodegradation of textile dye navy blue HER by Trichosporon beigelii NCIM-3326. J Hazard Mater 166:1421–1428

Page 12 of 12Ajaz et al. AMB Expr (2019) 9:64
Shah MP (2014) Biodegradation of azo dyes by three isolated bacterial strains: an environmental bioremedial approach. J Microbial Biochem Technol S 3:007
Shah PD, Dave SR, Rao MS (2012) Enzymatic degradation of textile dye reactive orange 13 by newly isolated bacterial strain Alcaligenes faecalis PMS-1. Int Biodeterior Biodegradation 69:41–50
Shah MP, Patel KA, Nair SS, Darji AM (2013) Potential effect of two Bacillus sp. on decolorization of azo dye. J Bioremed Biodegrad 4:199
Shanmugam BK, Easwaran SN, Lakra R, Deepa PR, Mahadevan S (2017) Meta-bolic pathway and role of individual species in the bacterial consortium for biodegradation of azo dye: a biocalorimetric investigation. Chemos-phere 188:81–89
Shyamala A, Hemapriya J, Vadakkan K, Vijayanand S (2014) Bioremediation of Methyl orange, a synthetic textile azo dye by a halotolerant bacterial strain. Int J Curr Res Acad Rev 2:373–381
Singh RP, Singh PK, Singh RL (2014) Bacterial decolorization of textile azo dye acid orange by Staphylococcus hominis RMLRT03. Toxicol Int 21:160–166
Singh S, Chatterji S, Nandini PT, Prasad ASA, Rao KVB (2015) Biodegradation of azo dye Direct Orange 16 by Micrococcus luteus strain SSN2. Int J Environ Sci Technol 12:2161–2168
Solis M, Solis A, Perez HI, Manjarrez N, Flores M (2012) Microbial decolouration of azo dyes: a review. Process Biochem 47:1723–1748
Telke AA, Kalyani D, Dawkar V, Govindwar S (2009) Influence of organic and inorganic compounds on oxidoreductive decolourization of sulfonated azo dye C.I. Reactive Orange 16. J Hazard Mater 172:298–309
Turner S, Pryer KM, Miao VPW, Palmer JD (1999) Investigating deep phyloge-netic relationships among cyanobacteria and plastids by small subunit rRNA sequence analysis. J Eukar Microbiol 46:327–338
Verma AK, Dash RR, Bhunia P (2012) A review on chemical coagulation floc-culation technologies for removal of colour from textile wastewaters. J Environ Manage 93:154–168
Walker MC, Van der Donk WA (2016) The many roles of glutamate in metabo-lism. J Ind Microbiol Biotechnol 43:419–430
Publisher’s NoteSpringer Nature remains neutral with regard to jurisdictional claims in pub-lished maps and institutional affiliations.
REVIEW
Microbial use for azo dye degradation—a strategyfor dye bioremediation
Mehvish Ajaz1 & Sana Shakeel1 & Abdul Rehman1
Received: 27 April 2019 /Revised: 8 October 2019 /Accepted: 17 October 2019# Springer Nature Switzerland AG 2019
AbstractAzo dyes are aromatic compounds with one to many –N=N– groups as well as the leading class of synthetic dyes utilised incommercial solicitations. Azo dyes, released in the environment through textile effluents, have hazardous effects on the aquatic aswell as human life. Their persistence and discharge into the environment are becoming a global concern; thus, the remediation ofthese contaminants has acquired great attention. The current review comprehensively discusses some of the main aspects ofbiodegradation of azo dyes. A variety of physicochemical approaches has already been utilised for treatment of textile effluentscounting filtration, coagulation and chemical flocculation. Though these conventional techniques are effective, yet they are lavishand also comprise formation of concentrated sludge that makes a secondary disposal problem. In this regard, microbial usage isan effective, economical, bio-friendly and ecologically benign approach.
Keywords Azo dyes .Microorganisms . Decolourisation . Degradation . Bioremediation
Introduction
For centuries, mankind had been using dyes and byNeanderthal man the very first proof of dye use came about180,000 years back (Christie 2007). Without exception, thedyes utilised, until the late nineteenth century, were roughlyobtained from the raw materials such as leaves, roots, vegetalextracts, branches, berries, blossoms of numerous plants, mol-luscs and insects, and were usually have limited range of col-ours (Gupta 2009).
Yet, pale purple dye in 1856 as a world’s first commercialsynthetic colourant was exposed via W.H. Perkin unexpected-ly (Hunger 2007). These dyes could be delineated as colouredconstituents giving an everlasting colour to fibres whensmeared plus retain itself even on exposure to light, water,perspiration and several chemicals, including oxidising prox-ies in addition to by the bout of microorganisms (Rai et al.2005). Synthetic colourants have largely substituted the natu-ral dyes, due to the huge range of unique colours as well astheir cost effectiveness (Gabriel and Hong 2008).
In 1994, it was estimated that from the entire worldwidefabrication of colourants, that was approximately 1,000,000tons, more than 50% were azo dyes (Olligaard et al. 1999;Stolz 2001). Azo dyes, named on the basis of their chemicalconfiguration, characteristically contain single to countless (–N=N–) azo groups (Chang and Kuo 2000). Azo complexeshave been established as one of the major and most versatileassortments of man-made colourants that are widely used innumerous trades such as foodstuff, paper printing, textile andcosmetic manufacturing (Pandey et al. 2007). Latest interpre-tations conducted via Rajaguru et al. (2002) and de AragaoUmbuzeiro et al. (2005) report the azo colourants causing anincrease in mutagenic bustle of surface and ground waterwhen filthy by textile effluvium whose discharge into surfacewater poses serious harm to the soil prolificacy, natural chat-tels and aquatic creatures, and also upsets legitimacy of eco-system (Mester and Tien 2000; Puvaneswari et al. 2006; Zhaoet al. 2011) by altering pH, increasing the BOD and COD andnegatively affect quality of water. Approximately 280,000tons of textile colourants are given out in the atmosphereworldwide per year (Jin et al. 2007), most of it get mixed intothe aquatic environment. Accordingly, elimination of dyesfrom the textile effluvium is becoming a serious problem.
Extensive work had been done on utilising physical andchemical techniques to eradicate colourants from sewage(Swaminathan et al. 2003; Behnajady et al. 2004; Golab
* Abdul [email protected]
1 Department of Microbiology and Molecular Genetics, University ofthe Punjab, New Campus, Lahore 54590, Pakistan
International Microbiologyhttps://doi.org/10.1007/s10123-019-00103-2

et al. 2005; Chen et al. 2010; Malik et al. 2017). However,these approaches are impractical and ineffective as they arenot only complex processes but also demand large quantitiesof chemicals and energy. These are incapable of fully elimi-nate either the recalcitrant azo dyes or both dyes with theirorganic metabolites, and the use of chemicals has led to pro-duction of huge quantities of sludge which cause secondarycontamination problems (Forgacs et al. 2004; Zhang et al.2004). In contrast, biodegradation is a cheap, eco-friendlyand innovative approach that could clean the water systemby eliminating dyes through the processes such as desalina-tion, adsorption, reduction precipitation, reverse osmosis,photocatalysis and membrane filtration (Verma andMadamwar 2003; Rai et al. 2005; Rafatullah et al.2010; Mishra and Maiti 2018). In the present paper, we woulddiscuss some of the biodegradation approaches to treat thetextile effluents comprising azo colourants.
Bioremediation strategies
Bioremediation approach is based on the use of native micro-organisms’ degradation ability. As xenobiotic azo dyes arecomplex and their degradation is not easy (Mohana et al.2008), azo dyes are degraded by both aerobic and anaerobicpathway; aerobic degradation is greatly favoured; however,anaerobic degradation yields by-products like aromaticamines that are not only hazardous but also have cancinogenicpotential (Senan and Abraham 2004).
In physiochemical methods, the extensively used floccula-tion/coagulation, adsorption and membrane filtrationmethods, all yield huge amounts of sludge, which further re-quire safe dumping (Maier et al. 2004; Ramya et al. 2007).However, the biological approaches are generally regarded asenvironmental friendly, as they can mineralise organic con-taminants without producing secondary toxic sludge(Jirasripongpun et al. 2007). This is usually observed thatcolourants (dyes, pigments) repel biodegradation inorthodox-activated sludge treatment process (Stolz 2001).Numerous microbes, such as fungi, yeasts, bacteria and algae,could not only decolourise several azo dyes but also complete-ly degrade them under certain ecological circumstances.Several investigations have been reported on the physiochem-ical as well as microbiological approaches for azo dyedecolourisation (McMullan et al. 2001; Stolz 2001; Rai et al.2005; Van der Zee and Villaverde 2005; Mani et al. 2019).
Fungal degradation of azo dyes
Being an economical, eco-friendly, less sludge producing pro-cess, fungal treatment is very advantageous process used byresearchers to find a new way for remediation. Contrary to bac-teria, fungi robustly degrade multifaceted organic complexes by
utilising methods such as production of extracellular ligninolyticenzymes comprising manganese peroxidase, laccase and ligninperoxidase; thus, scientists are more interested in using fungi inthe current scenario (He et al. 2018; Guo et al. 2019; Mani et al.2019; Zahran et al. 2019). For the dye decolourisation, the po-tential of ligninolytic fungi is extensively explored (Bumpus2004). Numerous investigations validate the white rot fungi po-tential for degrading and decolourising contaminants via extra-cellular ligninolytic enzymes (Champagne and Ramsay 2010;Kunjadia et al. 2012). In relation to azo dye degradation anddecolourisation, white rot fungus Phanerochaete chrysosporiumis extensively studied; however, some others too have gainedsignificant attention, such as Aspergillus ochraceus, Trametesversicolor, species of Pleurotus and Phlebia (Pointing andVrijmoed 2000; Saratale et al. 2006; Humnabadkar et al. 2008;Sen et al. 2016; Kunjadia et al. 2016). Gahlout et al. (2013)testified that Ganoderma cupreum AG-1 has the potential fordecolourising numerous azo colourants. Though, solicitation ofwhite rot fungus to eliminate dye from textile wastewater has afew disadvantages, for example, the lengthy growth cycle andthe requisition for N2 restraining situations. However, white rotfungus is naturally absent in wastewaters; therefore, enzyme fab-rication for the degradation of dyes is an independent phenome-non (Robinson et al. 2001). Furthermore, the lengthy hydraulicretention period mandatory to completely decolourise likewiseconfines the function of the fungal decolourisation scheme(Banat et al. 1996; Chang et al. 2004), as well as themaintenanceof fungus, in bioreactors, is a problem of consideration as well(Stolz 2001).
Azo dye degradation via yeasts
To ascertain the decolourising potential of yeasts, minor workhas been done, especially focussing on the bio-sorption in-stead. Few ascomycetes yeast species, for instance, Candidatropicalis, C. zeylanoides Debaryomyces polymorphus (Yanget al. 2003) and Issatchenkia occidentalis (Ramalho et al.2004), are utilised for assessing the enzymatic biodegradationaccompanied with the decolourisation of various azocolourants. Lately, S. cerevisiae MTCC-463 had testified fordecolourising Methyl Red as well as Malachite Green (Jadhavand Govindwar 2006; Jadhav et al. 2007). GalactomycesgeotrichumMTCC 1360 may degrade azo, triphenyl methaneand the reactive highly used textile colourants (Jadhav et al.2008a). Via Trichosporon beigelii NCIM-3326, Navy BlueHER decolourisation could also be carried out with the enzy-matic mechanism (Saratale et al. 2009c). Lucas et al. (2007)reported that presence of Candida oleophila decolourised theazo dye Reactive black 5 dye in an assay containing Fenton’sreagent. More recently, a thorough study revealed thatCyberlindnera samutprakarnensis could decolourise AcidRed B (ARB) within 18 h with the efficiency of 97% underoptimal conditions (Song et al. 2018).
Int Microbiol

Algal remediation of azo dyes
Photosynthetic organisms, like algae and cyanobacteria, areubiquitous in nature and also have been studied for theirdecolourisation potential of wastewater and it has been pro-posed that algae are proficient in degradation of azo dyes byutilising its azoreductases (Omar 2008; Vijayaraghavan andYun 2008). Azo dyes can be removed by algae through threediverse mechanisms of assimilative chromophores usage: (1)for the creation of algal biomass, (2) H2O as well as CO2
alteration from coloured to non-coloured molecules, (3) chro-mophores adsorption on algal biomass (Acuner and Dilek2004; Mahalakshmi et al. 2015). The decolourisation to bio-sorption trailed through bio-coagulation as well as bioconver-sion by utilising algae is characterised byMohan et al. (2002).More than 30 azo complexes and basic aromatic amines havebeen reported to get degraded completely via Chlorellavulgaris, C. pyrenoidosa and Oscillateria sp. (Yan and Pan2004). Therefore, algae might play a vital part for eliminationof azo colourants as well as aromatic amines from steadypools. Furthermore, present bio-sorption procedure is accept-ed as a profitable, active method for possible utilisation indecolourising the effluents, substituting the much costlier sup-plies (Banat et al. 1996; Daeshwar et al. 2007).
Azo dye degradation utilising plants
Patil et al. (2009) stated that azo dye decolourisation via plantsis an emerging practice ensuring the effective and cheap wayto remediate the soils and groundwater which were pollutedwith organic contaminants and heavy metals. The key advan-tage associated with the remediation by plants is that beingautotrophic, plants require only petite input of nutrients andare generally accepted by the community due to its ecologicalpracticability (Ghodake et al. 2009a; Kagalkar et al. 2009).Significant decline (72–77%) in colour intensity was observedwhen the wetlands were surrounded by coco yam vegetation(Mbuligwe 2005). Besides, the decolourisation potential ofvarious plant species such as Sorghum vulgare, Brassicajuncea and Phaseolus mungo was assessed against the reac-tive group of azo dyes from the industrial effluents. S. vulgare,B. juncea and P. mungo could effectively decolourise indus-trial effluent with the efficiency of 57%, 79% and 53%, cor-respondingly (Ghodake et al. 2009a) (Table 1). Likewise, anherb Blumea malcommi is used for the degradation ofReactive Red 5B textile dye (Kagalkar et al. 2009). ReactiveRed 198 was found to be degrade via the hirsute root culture ofTagetes patula (Marigold) (Patil et al. 2009). Though, plantsplay a major role in the azo dye bioremediation; however,there are problems which limit their use in this scenario suchas the level of contaminants tolerated by plant, the bio-available portion of pollutants, evapotranspiration of unstableorganic contaminants and necessitating great zones for
grafting the approach (Ghodake et al. 2009b). The two speciesof plants, Sesbania cannabina Pers and Medicago sativa,have been proved to tolerate the poisonousness and salinityof the azo dye wastewater as well as involve in bio-decolourisation of the wastewater (Zhou and Xiang 2013).
Enzymes in azo dye degradation
Azo reductase facilitates the azo cleavage in the presence ofreducing agents such as FADH and NADH. Azo reductaseshave been recognised in numerous anaerobic bacteria and inthe microflora of human intestine. The earliest azo reductasesrecognised from the anaerobic microbes were oxygen sensi-tive; however, currently designated as E. gallinarum strain,obtained from the textile industry wastewater treatment plant,is able to decolourise DB38 azo dye via azoreductase enzymewhich acts optimally underneath aerobic circumstances(Bafana et al. (2008); Fu et al. 2019). Similarly, azoreductasegene from Bacillus latrosporus RRK1 produces azoreductasecapable of decolourising numerous azo colourants underneathaerobic circumstances, when replicated and articulated inE. coli, could decolourise Remazol Red only when a specificamount of dissolved oxygen (0.8 mg/L) had been provided(Sandhya et al. 2008). Duran et al. (2002) reported that fungifrequently destroy colourants via exoenzymes similar to theperoxidases. Kalsoom et al. (2013) reported that SoybeanPeroxidase may proficiently degrade a diazo dye, TrypanBlue, and it is also an eco-friendlier approach.
The Lacasses, catalysing the reduction of 4e− of O2 to H2O,are mostly obtained via fungus causing lignin degradation forinstance T. versicolor, T.villoa, Cladospora cladosporioidesand Fusarium soloni (Abedin 2008; Pandi et al. 2019).
Bacterial degradation and decolourisation of azo dyes
Usually, azo dye decolourisation happens under tradition-al aerobic, anaerobic also facultative anaerobic circum-stances via diverse bacteria. In eliminating colour, anaer-obic microbial approach could be considered as success-ful, chiefly via azo reductases slicing −N=N− giving re-sultant amines, which are not only lethal nonetheless like-wise oncogenic as well as mutagenic, and above repelfurther decolourisation under anaerobic environment(O’neill et al. 2000; Van der Zee et al. 2001; Gottliebet al. 2003; Pinheiro et al. 2004; Van der Zee andVillaverde 2005; Sarkar et al. 2017; Fu et al. 2019; deSouza et al. 2019). Under anaerobic respiratory oxidationof carbon sources, the azo dyes act as a terminal e− ac-ceptor (Carliell et al. 1995; Ryan et al. 2010; de Souzaet al. 2019). Contrastly, activated sludge processes beingaerobic in nature, such bio-approaches, proved to be inef-fective for the treatment of textile wastewaters as theycause minute or no colour elimination from azo dye
Int Microbiol

(Chern and Chien 2003; Brik et al. 2006; Singh et al.2007; Roy et al. 2018). Bacteria having capacity of aero-bic decolourisation of colourants, especially sulfonatedazo dye, are hard to sequester (McMullan et al. 2001;Pearce et al. 2003‚ Lin et al. 2010). Though, pure inaddition to mixed bacterial culture have been exposed todyes capable of aerobic degradation and cause detoxifica-t ion of aromat ic amines formed via anaerobicdecolourisation of azo colourants (Khalid et al. 2009;Mishra and Maiti 2018).
In one of the studies from this laboratory (Ajaz et al. 2019),via GC-MS examination, it has been long established that en-zymatically azo colurant is transformed into numerous endproducts by using Staphylococcus lentus 1 M. These metabo-lites are used in different pathways; for example, during aminoacid metabolism, 4-guanidinobutyric acid is utilised as a sub-strate. The amino acid catabolism may produce pyruvate that istransformed into acetyl coenzyme Awhich further go throughTCA cycle to generate reduced molecules. Moreover, anotherend product, phthalate derivative, can be changed into differentfatty acids as well as aldehydes and these molecules may movein a direct or indirect way into fatty acid β-oxidation reactionsyielding NADH2 also FADH2. These reduced molecules maybe used in the process of ATP synthesis (Fig. 1).
Because of recalcitrant nature of azo dyes to highly aerobiccircumstances as well as the production and accumulation ofecologically harmful amines under anaerobic circumstancesfor the whole mineralisation of azo dyes, successiveanaerobic–aerobic biological approach has been establishedas the utmost effective and economical methods.
Anaerobic decolourisation via reductive cleavage of azodye’s linkages consequently produces colourless, hazardousaromatic amines which could be degraded in the aerobic stage(Popli and Patel 2015). Furthermore, the high salinity and pHbeing the attributes of textile dye wastewaters were exposed toconstraining azo colourant decolourisation via wastewater mi-crobial populations representing that tolerance to such hostilecircumstances is likely to be a vital limit for the effective bio-transformation of azo colourant left-over watercourses (Manuand Chauhari 2003; Şen and Demirer 2003; Asad et al. 2007).Thus, it is vital to isolate appropriate microbial strains and also
determine the factors indispensable for the efficient bio-treatment of azo colourants (Franciscon et al. 2012).
Utilising co-culture as well as mixed bacterial cultures
Azo dye decolourisation with pure cultures of bacterial strainsis effective; however, distinct bacterial isolates frequentlycould not be able to decolourise azo dyes entirely and alsoare responsible for the production of carcinogenic aromaticamines as the transitional products, which needs further deg-radation (Joshi et al. 2008). Therefore, the treatment schemesusually consist of mixed microbial communities which attainan advanced level of mineralisation and biodegradation ma-jorly because of the synergistic metabolic actions of the mi-crobial communities, also these are significantly beneficial ascompared with the use of pure cultures (Khehra et al. 2005;Chen and Chang 2007; Saratale et al. 2010).
To aid the decomposition process, different isolates mightsecrete the colourant molecule, in a microbial consortium, atdiverse locations or might utilise metabolites made through theco-existing isolates (Chang et al. 2004; Forgacs et al. 2004;Jadhav et al. 2008b; Saratale et al. 2009b; Vikrant et al. 2018).Under aerobic conditions, at ambient temperature (28 ± 2 °C)and basic pH (9–10.5), when the salinity ranges between 0.9 and3.68 g/L, bacterial consortium containing two isolates (BF1,BF2) and a Pseudomonas putida (MTCC1194) strain effectivelydegrade a combination of textile azo dyes (Senan and Abraham2004). Das and Mishra (2017) reported that the bacterial consor-tium of Bacillus pumilus HKG212 and Zobellella taiwanensisAT1–3 could eliminate the reactive green-19 dye underoptimised static conditions; however, after the addition of yeastextract, the removal efficacy of consortium was reached up to97%within 24 h of incubation when the initial conc. of colourantwas 100 mg/L. Moreover, Waghmode et al. (2011) determinedthat the bacterial consortium consisting of Brevibacilluslaterosporus (NCIM2298) and GG-BL Galactomycesgeotrichum (MTCC 1360) could decolourise the golden yellowHER under aerobic-microaerophilic conditions. The authors’findings revealed that the rigorous action of isolatesmay substan-tially diminish the COD (84%), TOC (63%) and also colour(100%) within 24 h from aq. solution loaded with dye. Inside
Table 1 Dye decolourisation potential (%) in bacterial and fungal strains
Sr. no. Organism Dye used Dye decolourisationpotential (%)
Reference
1 P. aeruginosa Reactive Red BS C.I. 111 91 Sheth and Dave (2009)
2 Aspergillus niger Synazol red 6HBN 88 Ilyas and Rehman (2013)
3 Nigrospora sp. Synazol red 6HBN 96 Ilyas and Rehman (2013)
4 A. faecalis E5.Cd Red 3B 93 Saha et al. (2017)
5 Alishewanella sp. CBL-2 Sumifex Tourqi blue 83 Ajaz et al. (2018)
6 Alcaligenes aquatilis 3C Synazol red 6HBN 82 Ajaz et al. (2019)
Int Microbiol

the microbial consortium, the initial breakdown of azo dyes re-sulted in the aromatic amines, which further get broken via cor-responding entities present; thus, the practice becomes extra ef-ficient as well as effective (Moosvi et al. 2005, 2007; Sarataleet al. 2009a, b; Tony et al. 2009a, b; Verma et al. 2019).
Using pure bacterial culture
The mixed cultures merely offer an ordinary macroscopic ap-proach to what is going on within the system, as well as the
outcomes are not simply represented. In the 1970s, laboursisolated pure bacterial cultures of Aeromonas hydrophila,Bacillus cereus and Bacillus subtilis able to degrade azo dyes(Wuhrmann et al. 1980). Lately, extensive studies on the dyedegradation have been investigated by utilising single bacte-rial cultures for instance Proteus mirabilis and Pseudomonasluteola which showed very promising outcomes underneathanoxic situations (Chang et al. 2001; Yu et al. 2001; Kalyaniet al. 2008). Navitan Fast Blue S5R, a marketable colourant,has been decolourised by Pseudomonas aeruginosa when
Fig. 1 Synazol Red HF 6BN dye enters into the cell (Staphylococcuslentus 1 M) by unknown mechanism. Upon entrance into the cell, thedye is enzymatically processed into various end products. Most probably,azo group (–N=N–) is reduced, followed by cleavage reaction anddifferent end products are produced. Secondly, desulfonation andoxidative deamination eventually result in synthesis of 4-guanidinobutanoic acid derivative which can be used as substrates inamino acid metabolism. The amino acid catabolism can synthesise
pyruvate (3C compound) which can be converted into acetyl-CoA. Theacetyl-CoA undergoes Krebs cycle to produce NADH2 and FADH2 (sub-strates of electron transport chain). Moreover, dye desulfonation, oxida-tive deamination and carboxylation lead to produce phthalate derivatives,which can be transformed into different fatty acids and aldehydes. Thephthalate, fatty acids and aldehydes can directly/indirectly enter into fattyacid oxidation reactions (β-oxidation) to produce acetyl-CoA, NADH2
and FADH2
Int Microbiol

supplementedwith glucose under aerobic circumstances and itmay also degrade many different azo colourants as well(Nachiyar and Rajkumar 2005).
In 2008, from dye-contaminated soil, Kalyani et al. seclud-ed a facultative anaerobic bacterium Pseudomonas sp. SUK1for biodegradation studies of reactive red-BLI dye under staticanaerobic circumstance. Investigators found the bacterial iso-late displaying decolourisation efficacy up to 99.28% within1-h incubation when the initial concentration was l50 mg/Ldye, where the bacterial strain degrades poisonous dye intoharmless products. The decolourisation of reactive black-5dye utilising Bacillus sp. YZU1, isolated by dye-polluted soil,has been studied byWang et al. (2013) in static condition. Theinvestigators found that azoreductase enzyme formed by thestrain catalysed the degradation (95% degradation, within 120h, of 100 mg colourant/L) of dye. Enterococcus faecalis YZ66 strain showed the capability of degrading manyindustrialised dyes amongst which, it displayed whole degra-dation of Direct Red 81 diazo dye within incubation period of1.5 h under static anoxic circumstances (Sahasrabudhe et al.2014). For the decolourisation of reactive sulfonated azocolourants, Brevibacterium sp. may be utilised in a sequentialstatic/aerobic procedure which was sequestered from one tex-tile dye wastewater treatment plant (Franciscon et al. 2012).Also, in a study, decolourisation of the azo dye Acid Orange51 from Trametes trogii using rudimentary laccase has beenproved (Daâssi et al. 2013).
In the recent past for the decolourisation of the combinationof reactive dyes, several bacterial species were examined (Dasand Mishra 2017; Perumal et al. 2017; Meerbergen et al.2018). Lucious et al. (2014) have treated the liquid wastesupplemented with the mixture of dyes acid blue and acidred with the Pseudomonas aeruginosa under aerobic condi-tions. Scientists stated that bacteria exhibiting decolourisationability maximally remove 90% of dye, which seemed im-proved as compared with the reference strain, i.e. Bacillussubtilis. Under anaerobic–aerobic system, the reductivedecolourisation of azo colourants (acid red-88, direct red-88as well as reactive black-5) via Shewanella sp. IFN4 fromsynthetic wastewater with efficiency of 90% has been reported(Imran et al. 2014; de Souza et al. 2019).
Using whole bacterial cells
Specifically, the capability of whole bacterial cells has beenbroadly examined for metabolising azo dyes. Underneath aer-obic situations, azo dye could not freely metabolise (Robinsonet al. 2001). Though, in anaerobic situations, several bacteriacould shrink the extremely e− loving azo bond in the dyemolecule, seemingly via the action of short specificity cyto-plasmic azo reductases, to yield colourless aromatic amines.Such amines are impervious for more degradation; thus, an-aerobic mineralisation may be mutagenic otherwise lethal for
the faunas. Luckily, after the removal of xenobiotic azo ele-ment of the colourant molecule, the resulting amino com-plexes can be easily aerobically biodegrade. Amines may un-dergo mineralisation under aerobic circumstances, hiring asuccessive anaerobic–aerobic scheme to treat the wastewater,via a hydroxylation trail comprising a ring opening system(Lourenco et al. 2000). The utilisation of whole cells incoloured wastewater (containing dyes) is beneficial relativelyto the isolated enzymes, since expenses allied with purifica-tion of enzymes are annulled as well as the cells may too offerdefence to the enzymes from the severe environment process(Pearce et al. 2003; Sandesh et al. 2019).
In situ and ex situ bioremediation
Both strategies are being used for the treatment of industrialwastewater containing toxic pollutants including azo dyes. Exsitu bioremediation involves the removal of contaminated soilfrom ground and land farming is one of the techniques in whichcontaminated soil is excavated. It then spread over a preparedbed and periodically tilled until pollutants are degraded.Usually, this practice is limited to the treatment of superficial10–35 cm in soil (Shah 2014). Wang et al. (2018) reported thatthe in situ generated bio-Pd by Klebsiella oxytoca strain isefficient for azo dye reduction without complex preparationprocesses. This is of great importance for the removal and sub-sequent safe disposal of toxic metal ions and azo dyes.
Factors influencing bacterial decolourisation
During biotic treatment procedures, various physicochemicalworking limits, for instance the agitation level, temperature,oxygen, pH, concentration and structure of dye, electron do-nor and redox mediator, provision of various nitrogen andcarbon sources, sprightly affect the bacterial decolourisationof azo colourants (Krishnan et al. 2017). Therefore, for mak-ing the procedure super effective, earlier determination of theoutcome of individual feature on the bacterial decolourisationof azo colourants is crucial.
Usually to degrade dyes biologically the inert state isdesirable, where the low oxygen level is retained in thereaction medium (Bouraie and Din 2016). In 2003,Pearce et al . c la imed that for achieving worthydecolourisation, the optimal pH of 6.0–10.0 is requisitewhile 25–35 °C temperature range could stay appropriateaimed at bacterial cell growth within the decolourisationmedium. Though, azoreductase enzyme formed via bacte-ria has been seen to be thermostable at 60 °C, being ener-getic for short interval (Misal et al. 2011). For bio-treatment of the dye-polluted wastewater, accessibility ofa particular electron donor is essential (Al-Amrani et al.
Int Microbiol

2014). Dyes having low molecular weight and unpreten-tious construction are seen to degrade simply, althoughdecolourisation rate declines with dyes having e− with-drawing substitution groups at the p-position in the phenylring (Pandey et al. 2007).
Mechanisms of microbial dye degradation
Azo complexes stand vulnerable to aerobic as well as anaerobicbiodegradation (Khehra et al. 2005). Generally, remediation ofazo colourants by microbes encompasses breakdown of the azobonds by azoreductase enzyme (EC 1.7.1.6) in anaerobic condi-tions, also involving transference of four electrons. Then at theazo linkage there are two stages involved, each stage involvingtransfer of two electrons to the azo dyes (acting as an ultimateelectron acceptor), causing dye degradation and formingcolourless mixtures (Chang and Kuo 2000). The degradation ofresultant transitional metabolites, including aromatic amines, iscarried out anaerobically/aerobically (Bromley-Challenor et al.2000; Chang et al. 2004; Pandey et al. 2007) (Fig. 2).
Azoreductase is a reducing enzyme that degrades azo dyethrough reductive cleavage process into colourless amines. Itneeds low molecular weight reducing equivalent like FADHorNADH as the electron donor in the form of a redox reaction.Azoreductase is categorised into three types on the basis ofcoenzyme use: using NADH only, using NADPH only orusing both. This enzyme can be either cytoplasmic or mem-brane bound. It has gained importance due to its use in waste-water treatment containing azo dyes (Sarkar et al. 2017).
Few researchers proposed that the occurrence of O2 custom-arily impedes the action of azo bond reduction, as aerobic res-piration might tower over the NADH use, consequently ham-pering the transference of electron towards azo bond from
NADH (Chang et al. 2001). Otherwise, decolourisation maybe attributed to unspecified extracellular responses happeningamid reduced composites produced via the anoxygenic fuel(Van der Zee et al. 2001). Currently, only in anoxygenic set-tings, the mechanism of azo dye decolourisation is well ac-knowledged (Singh et al. 2015). Considerable investigationscovering the anaerobic decolourisation of colours (mainly azodyes) were piloted utilising monocultures. The infusion of azodyes in anaerobic conditions in the microbial cells from biolog-ical membrane is stated to be the major rate-limiting feature ofdecolourisation (Kodam et al. 2005). In aerobic environments,amalgamation of O2 in the aromatic ring of carbon-based com-plexes from O2 is catalysed by mono- as well as di-oxygenaseenzymes earlier to ring fission (Sarayu and Sandhya 2010). In2010, Lin et al. stated the few oxygenic bacteria reducing azocomplexes with oxygen catalysed azoreductases yielding aro-matic amines. The aerobic azo reductases were reported to uti-lise equally NADH as well as NAD(P)H as cofactors causingreductive cleavage of the bacterial carboxylated growth sub-strates and the sulfonated structural equivalents too (Kecket al. 1997; Nachiyar and Rajkumar 2005). Furthermore, fewbacteria are capable of growing on azo complexes by way ofsingle carbon source. Such bacteria after reductively cleavingazo bonds use amines as carbon source as well as energy togrow. Pigmentiphaga kullae K24 and Xenophilus azovoransKF 46 are instances of bacterial strains having this attribute,which may aerobically breed upon carboxy-orange II as wellas I, correspondingly (McMullan et al. 2001). Merely, a smallnumber of bacteria having specific enzymes capable of reduc-ing azo dye are seen for breaking azo dyes underneath entirelyaerobic circumstances (Zimmermann et al. 1984; Nachiyar andRajkumar 2003). In 2003, Blümel and Stolz (2003) also repli-cated as well as described the triplet code, from Pagmentiphagakullae K24, of the aerobic azo reductase.
Fig. 2 Suggested mechanism ofutilising whole bacterial cells forreduction of azo dyes with somemodification (Pearce et al. 2003)
Int Microbiol

Conclusions
Dyes discharged into the environment have negative effects tothe biosphere and biota. The chemical treatment of dyes is notrecommended by many researchers due to the generation ofsecondary pollutants. Microbial degradation of azo dyes hasnoteworthy prospective to discourse this problem because oftheir cheap and eco-friendlier nature. Amongst microbes, bac-teria are extensively used to degrade dyes because of theirrapidly growing ability and extraordinary hydraulic retentionperiod; hence, they may be effective in treatment high-forteorganic wastewater. Microbial consortium, mixture of definedmicrobial population, releases a variety of enzymes that attackon the chemical structure in different ways to rapidly degradethe complex chemical molecules/compounds as wastewatercontains complex mixture of various chemicals. The use ofmicrobes is, therefore, recommended for the treatment ofwastewater containing azo dyes.
Compliance with ethical standards
Conflict of interest The authors declare that they have no conflict ofinterest.
Research involving human participants and/or animals This articledoes not contain any studies with human participants or animals per-formed by any of the author.
Informed consent N/A
References
Acuner E, Dilek FB (2004) Treatment of tectilon yellow 2G by Chlorellavulgaris. Process Biochem 39:623–631
Abedin MAR (2008) Decolorization and biodegradation of crystal Violetand Malachite Green by Fusarium solani (Martius) Saccardo, acomparative study on biosorption of dyes by the dead fungal bio-mass. Am-Euras J Bot 12:17–31
AjazM, Elahi A, RehmanA (2018) Degradation of azo dye by bacterium,Alishewanella sp. CBL-2 isolated from industrial effluent and itspotential use in decontamination of wastewater. J Water ReuseDesalination 8:507–515
AjazM, RehmanA, Khan Z, NisarMA,Hussain S (2019)Degradation ofazo dyes by Alcaligenes aquatilis 3c and its potential use in thewastewater treatment. AMB Express 9:64
Al-Amrani WA, Lim PE, Seng CE, Ngah WSW (2014) Factors affectingbio-decolorization of azo dyes and COD removal in anoxic–aerobicREACToperated sequencing batch reactor. J Taiwan Inst Chem Eng45:609–616
Asad S, Amoozegar MA, Pourbabaee A, Sarbolouki MN, DastgheibSMM (2007) Decolorization of textile azo dyes by newly isolatedhalophilic and halotolerant bacteria. Bioresour Technol 98:2082–2088
Bafana A, Chakrabarti T, Muthal P, Kanade G (2008) Detoxification ofbenzidine-based azo dye by E. gallinarum: time-course study.Ecotoxicol Environ Saf 72(3):960–964
Banat IM, Nigam P, Singh D, Marchant R (1996) Microbial decoloriza-tion of textile-dye-containing effluents: a review. Bioresour Technol58:217
Behnajady MA, Modirshahla N, Shokri M (2004) Photodestruction ofacid orange 7 (AO7) in aqueous solutions by UV/H2O2: influenceof operational parameters. Chemosphere 55:129–134
Blümel S, Stolz A (2003) Cloning and characterization of the gene codingfor the aerobic azoreductase from Pigmentiphaga kullae K24. ApplMicrobiol Biotechnol 62:186
Bouraie ME, Din WSE (2016) Biodegradation of reactive black 5 byAeromonas hydrophila strain isolated from dye-contaminated textilewastewater. Sustain Environ Res 26:209–216
Brik M, Schoeberl P, Chamam B, Braun R, Fuchs W (2006) Advancedtreatment of textile wastewater towards reuse using amembrane bio-reactor. Process Biochem 41:1751–1757
Bromley-Challenor CA, Knapp JS, Zhang Z, Gray NC, Hetheridge MJ,Evans MR (2000) Decolorization of an azo dye by unacclimatedactivated sludge under anaerobic conditions. Water Res 34(18):4410–4418
Bumpus JA (2004) Biodegradation of azo dyes by fungi. In: Arora DK(ed) Fungal biotechnology in agricultural, food and environmentalapplications. Marcel Dekker, New York, pp 457–480
Carliell CM, Barclay SJ, NaidooN, Buckley CA,Mulholland DA, SeniorE (1995) Microbial decolourization of a reactive azo dye underanaerobic conditions. Water SA 21:61–61
Champagne PP, Ramsay JA (2010) Dye decolorization and detoxificationby laccase immobilized on porous glass beads. Bioresour Technol101:2230–2235
Chang JS, Kuo TS (2000) Kinetics of bacterial decolorization of azo dyewith Escherichia coli NO3. Bioresour Technol 75:107–111
Chang JS, Chou C, Lin YC, Lin PJ, Ho JY, Hu TL (2001) Kinetic char-acteristics of bacterial azo-dye decolorization by Pseudomonasluteola. Water Res 35:2841–2850
Chang JS, Chen BY, Lin YS (2004) Stimulation of bacterial decoloriza-tion of an azo dye by extracellular metabolites from Escherichia colistrain NO3. Bioresour Technol 91:243–248
Chen BY, Chang JS (2007) Assessment upon species evolution of mixedconsortia for azo dye decolorization. J Chin Inst Chem Eng 38:259–266
Chen T, Gao B, Yue Q (2010) Effect of dosing method and pH on colorremoval performance and floc aggregation of polyferric chloride–polyamine dual-coagulant in synthetic dyeing wastewater treatment.Colloids Surf A Physicochem Eng Asp 355:121–129
Chern JM, Chien YW (2003) Competitive adsorption of benzoic acid andp-nitrophenol onto activated carbon: isotherm and breakthroughcurves. Water Res 37:2347–2356
Christie RM (2007) Environmental aspects of textile dyeing. ElsevierDaâssi D, Zouari-Mechichi H, Frikha F, Martinez MJ, Nasri M, Mechichi
T (2013) Decolorization of the azo dye acid orange 51 by laccaseproduced in solid culture of a newly isolated Trametes trogii strain. 3Biotech 3:115–125
Daeshwar N, Ayazloo M, Khataee AR, Pourhassan M (2007) Biologicaldecolorization of dye solution containing malachite green bymicroalgae Cosmarium sp. Bioresour Technol 98:1176
Das A, Mishra S (2017) Removal of textile dye reactive green-19 usingbacterial consortium: process optimization using response surfacemethodology and kinetics study. J Environ Chem Eng 5:612–627
de Aragao Umbuzeiro G, Freeman HS, Warren SH, De Oliveira DP,Terao Y, Watanabe T, Claxton LD (2005) The contribution of azodyes to the mutagenic activity of the Cristais River. Chemosphere60:55–64
de Souza NA, Ramaiah N, Damare S, Furtado B, Mohandass C, Patil A,De Lima M (2019) Differential protein expression in Shewanellaseohaensis decolorizing azo dyes. Curr Proteomics 16:156–164
Int Microbiol

Duran N, Rosa MA, D’Annibale A, Gianfreda L (2002) Applications oflaccases and tyrosinases (phenoloxidases) immobilized on differentsupports: a review. Enzym Microb Technol 31:907
Forgacs E, Cserhati T, Oros G (2004) Removal of synthetic dyes fromwastewaters: a review. Environ Int 30:953–971
Franciscon E, Grossman MJ, Paschoal JAR, Reyes FGR, Durrant LR(2012) Decolorization and biodegradation of reactive sulfonatedazo dyes by a newly isolated Brevibacterium sp. strain VN-15.SpringerPlus 1:37
Fu L, Bai YN, Lu YZ, Ding J, Zhou D, Zeng RJ (2019) Degradation oforganic pollutants by anaerobic methane-oxidizing microorganismsusing methyl orange as example. J Hazard Mater 364:264–271
Gabriel H, Hong J (2008)Decolouration of reactive blue dye KN-R. Res JAppl Sci 3:216–224
Gahlout M, Gupte S, Gupte A (2013) Optimization of culture conditionfor enhanced decolorization and degradation of azo dye reactiveviolet 1 with concomitant production of ligninolytic enzymes byGanoderma cupreum AG-1. 3 Biotech 3:143–152
Ghodake GS, Talke AA, Jadhav JP, Govindwar SP (2009a) Potential ofBrassica juncea in order to treat textile-effluent-contaminated sites.Int J Phytoremed 11(4):297–312
Ghodake G, Jadhav S, Dawkar VS, Govindwar S (2009b)Biodegradation of Diazo dye Direct Brown MR by Acinetobactercalcoaceticus NCIM 2890. Int Biodeterior Biodegradation 63:433
Golab V, Vinder A, Simonic M (2005) Efficiency of the coagulation/flocculation method for the treatment of dye bath effluent. DyesPigments 67:93–97
Gottlieb A, Shaw C, Smith A, Wheatley A, Forsythe S (2003) The tox-icity of textile reactive azo dyes after hydrolysis and decolourisation.J Biotechnol 101:49–56
Guo G, Tian F, Zhang C, Liu T, Yang F, Hu Z, Liu C, Wang S, Ding K(2019) Performance of a newly enriched bacterial consortium fordegrading and detoxifying azo dyes. Water Sci Technol 79:2036–2045
Gupta VK (2009) Application of low-cost adsorbents for dye removal-areview. J Environ Manag 90:2313–2342
He XL, Song C, Li YY, Wang N, Xu L, Han X, Wei DS (2018) Efficientdegradation of azo dyes by a newly isolated fungus Trichodermatomentosum under non-sterile conditions. Ecotoxicol Environ Saf150:232–239
Humnabadkar RP, Saratale GD, Govindwar SP (2008) Decolorization ofpurple 2R by Aspergillus ochraceus (NCIM-1146). Asian JMicrobiol Biotechnol Environ 10:693–697
Hunger K (2007) Industrial dyes: chemistry, properties, applications.Wiley
Ilyas S, Rehman A (2013) Decolorization and detoxification of Synozolred HF-6BN azo dye, by Aspergillus niger and Nigrospora sp.Iranian J Environ Health Sci Eng 10:12
Imran M, Arshad M, Asghar HN, Asghar M, Crowley DE (2014)Potential of Shewanella sp. strain IFN4 to decolourize azo dyesunder optimal conditions. Int J Agric Biol 16:578–584
Jadhav JP, Govindwar SP (2006) Biotransformation of malachite greenby Saccharomyces cerevisiaeMTCC 463. Yeast 23:315–323
Jadhav JP, Parshetti GK, Kalme SD, Govindwar SP (2007)Decolourization of azo dye methyl red by Saccharomyces cerevisiaeMTCC 463. Chemosphere 68:394–400
Jadhav SU, Jadhav MU, Kagalkar AN, Govindwar SP (2008a)Decolorization of Brilliant Blue G dye mediated by degradation ofthe microbial consortium of Galactomyces geotrichum and Bacillussp. J Chin Inst Chem Eng 39:563
Jadhav SU, Jadhav UU, Dawkar VV, Govindwar SP (2008b)Biodegradation of Disperse dye brown 3REL by microbial consor-tium of Galactomyces geotrichum MTCC 1360 and Bacillus sp.VUS. Biotechnol Bioprocess Eng 13:232
Jin XC, Liu GQ, XuZH, TaoWY (2007) Decolorization of a dye industryeffluent by Aspergillus fumigatus XC6. Appl Microbiol Biotechnol74:239–243
Jirasripongpun K, Nasanit R, Niruntasook J, Chotikasatian B (2007)Decolorization and degradation of CI Reactive Red 195 byEnterobacter sp. Thammasat Int J Sci Technol 12:6–11
Joshi T, Iyengar L, Singh K, Garg S (2008) Isolation, identification andapplication of novel bacterial consortium TJ-1 for thedecolourization of structurally different azo dyes. BioresourTechnol 99:7115–7121
Kagalkar AN, Jagtap UB, Jadhav JP, Bapat VA, Govindwar SP (2009)Biotechnological strategies for phytoremediation of the sulfonatedazo dye Direct Red 5B using Blumea malcolmii Hook. BioresourTechnol 100:4104–4110
Kalsoom U, Ashraf SS, Meetani MA, Rauf MA, Bhatti HN (2013)Mechanistic study of a diazo dye degradation by SoybeanPeroxidase. Chem Cent J 7:93
Kalyani DC, Telke AA, Dhanve RS, Jadhav JP (2008) Ecofriendly bio-degradation and detoxification of Reactive Red 2 textile dye bynewly isolated Pseudomonas sp. SUK1. J Hazard Mater 163:735–742
Keck A, Klein J, Kudlich M, Stolz A, Knackmuss H-J, Mattes R (1997)Reduction of azo dyes by redox mediators originating in the naph-thalene sulfonic acid degradation pathway of Sphingomonas sp.strain BN6. Appl Environ Microbiol 63(9):3684–3690
Khalid A, Arshad M, Crowley DE (2009) Biodegradation potential ofpure and mixed bacterial cultures for removal of 4-nitroaniline fromtextile dye wastewater. Water Res 43:1110–1116
Khehra MS, Saini HS, Sharma DK, Chadha BS, Chimni SS (2005)Comparative studies on potential of consortium and constituent purebacterial isolates to decolorize azo dyes. Water Res 39:5135–5141
Kodam KM, Soojhawon I, Lokhande PD, Gawai KR (2005) Microbialdecolorization of reactive azo dyes under aerobic conditions. WorldJ Microbiol Biotechnol 21:367–370
Krishnan J, Kishore AA, Suresh A, Madhumeetha B, Prakash DG (2017)Effect of pH, inoculum dose and initial dye concentration on theremoval of azo dye mixture under aerobic conditions. IntBiodeterior Biodegrad 119:16–27
Kunjadia PD, Patel FD, Nagee A, Mukhopadhyaya PN, Dave GS (2012)Crystal violet (triphenylmethane dye) decolorization potential ofPleurotus ostreatus (MTCC 142). BioResources 7:1189–1199
Kunjadia PD, Sanghvi GV, Kunjadia AP, Mukhopadhyay PN, Dave GS(2016) Role of ligninolytic enzymes of white rot fungi (Pleurotusspp.) grown with azo dyes. SpringerPlus 5:1487
Lin J, Zhang X, Li Z, Lei L (2010) Biodegradation of Reactive Blue 13 ina two-stage anaerobic/aerobic fluidized beds system with aPseudomonas sp. isolate. Bioresour Technol 101:34
Lourenco ND, Novais JM, Pinheiro HM (2000) Reactive textile dyecolour removal in a sequencing batch reactor. Water Sci Technol42:321–328
LucasMS, Dias AA, SampaioA, Amaral C, Peres JA (2007) Degradationof a textile reactive azo dye by a combined chemical–biologicalprocess: Fenton’s reagent-yeast. Water Res 41:1103–1109
Lucious S, Reddy ES, Anuradha V, Yogananth N, Ali MYS, Vijaya P,Rajan R, Parveen PMK (2014) Decolorization of acid dyes byB. cereus and P. aeruginosa isolated from effluent of dyeing indus-try. Int J Pure Appl Biosci 2(3):23–29
Mahalakshmi S, Lakshmi D, Menaga U (2015) Biodegradation of differ-ent concentration of dye (Congo red dye) by using green and bluegreen algae. Int J Environ Res 9:735–744
Maier J, Kandelbauer A, Erlacher A, Cavaco-Paulo A, Gübitz GM (2004)A new alkali-thermostable azoreductase from Bacillus sp. strain SF.Appl Environ Microbiol 70:837–844
Malik SN, Ghosh PC, Vaidya AN, Waindeskar V, Das S, Mudliar SN(2017) Comparison of coagulation, ozone and ferrate treatment
Int Microbiol

processes for color, COD and toxicity removal from complex textilewastewater. Water Sci Technol 76:1001–1010
Mani S, Chowdhary P, Bharagava RN (2019) Textile wastewater dyes:toxicity profile and treatment approaches. In: Emerging and eco-friendly approaches for waste management. Springer, Singapore,pp 219–244
Manu B, Chauhari S (2003) Decolorization of indigo and azo dyes insemicontinuous reactors with long hydraulic retention time. ProcessBiochem 38:1213–1221
Mbuligwe SE (2005) Comparative treatment of dye-rich wastewater inengineered wetland systems (EWSs) vegetated with different plants.Water Res 39:271–280
McMullan G, Meehan C, Conneely A, Kirby N, Robinson T, Nigam P,Smyth WF (2001) Microbial decolourisation and degradation oftextile dyes. Appl Microbiol Biotechnol 56:81–87
Meerbergen K, Willems KA, Dewil R, Van Impe J, Appels L, Lievens B(2018) Isolation and screening of bacterial isolates from wastewatertreatment plants to decolorize azo dyes. J Biosci Bioeng 125:448–456
Mester T, Tien M (2000) Oxidation mechanism of ligninolytic enzymesinvolved in the degradation of environmental pollutants. IntBiodeterior Biodegrad 46:51–59
Misal SA, Lingojwar DP, Shinde RM, Gawai KR (2011) Purification andcharacterization of azoreductase from alkaliphilic strain Bacillusbadius. Process Biochem 46(6):1264–1269
Mishra S, Maiti A (2018) The efficacy of bacterial species to decolourisereactive azo, anthroquinone and triphenylmethane dyes from waste-water: a review. Environ Sci Pollut Res 5:8286–8314
Mohan SV, Rao NC, Prasad KK, Karthikeyan J (2002) Treatment ofsimulated reactive yellow 22 (Azo) dye effluents using Spirogyraspecies. Waste Manag 22:575–582
Mohana S, Shrivastava S, Divecha J, Madamwar D (2008) Responsesurface methodology for optimization of medium for decolorizationof textile dye Direct Black 22 by a novel bacterial consortium.Bioresour Technol 99:562–569
Moosvi S, Keharia H, Madamwar D (2005) Decolourization of textiledye reactive violet 5 by a newly isolated bacterial consortium RVM11.1. World J Microbiol Biotechnol 21:667–672
Moosvi S, Kher X, Madamwar D (2007) Isolation, characterization anddecolorization of textile dyes by a mixed bacterial consortium JW-2.Dyes Pigments 74:723–729
Nachiyar CV, Rajkumar GS (2003) Degradation of tannery and textiledye, Navian Fast Blue S5R by Pseudomonas aerugenosa. World JMicrobiol Biotechnol 19:609
Nachiyar CV, Rajkumar GS (2005) Purification and characterization of anoxygen insensitive azoreductase from Pseudomonas aeruginosa.Enzym Microb Technol 36:503–509
O’neill C, Lopez A, Esteves S, Hawkes FR, Hawkes DL, Wilcox S(2000) Azo-dye degradation in an anaerobic-aerobic treatment sys-tem operating on simulated textile effluent. Appl MicrobiolBiotechnol 53:249–254
Olligaard H, Frost L, Gaister J, Hansen OC (1999) Survey of azocolourant in Denmark. Miljoproject. 509 Danish EPA
Omar HH (2008) Algal decolorization and degradation of monoazo anddiazo dyes. Pak J Biol Sci 11:1310–1316
Pandey A, Singh P, Iyengar L (2007) Bacterial decolorization and degra-dation of azo dyes. Int Biodeterior Biodegrad 59:73–84
Pandi A, Kuppuswami GM, Ramudu KN, Palanivel S (2019) A sustain-able approach for degradation of leather dyes by a new fungallaccase. J Clean Prod 211:590–597
Patil P, Desai N, Govindwar S, Jadhav JP, Bapat V (2009) Degradationanalysis of reactive red 198 by hairy roots of Tagetes patulaL.(Marigold). Planta 230:725–735
Pearce CI, Lloyd JR, Guthrie JT (2003) The removal of colour fromtextile wastewater using whole bacterial cells: a review. DyesPigments 58:179–196
Perumal K, Malleswari RB, Catherin A, Moorthy TS (2017)Decolourization of Congo red dye by bacterial consortium isolatedfrom dye contaminated soil, Paramakudi, Tamil Nadu. J MicrobiolBiotechnol Res 2:475–480
Pinheiro HM, Touraud E, Thomas O (2004) Aromatic amines from azodye reduction: status review with emphasis on direct UV spectro-photometric detection in textile industry wastewaters. DyesPigments 61:121–139
Pointing SB, Vrijmoed LLP (2000) Decolorization of azo and triphenyl-methane dyes by Pycnoporus sanguineus producing laccase as thesole phenoloxidase. World J Microbiol Biotechnol 16:317–318
Popli S, Patel UD (2015) Destruction of azo dyes by anaerobic–aerobicsequential biological treatment: a review. Int J Environ Sci Technol12:405–420
Puvaneswari N,Muthukrishnan J, Gunasekaran P (2006) Toxicity assess-ment and microbial degradation of azo dyes. Indian J Exp Biol 44:618–626
Rafatullah M, Sulaiman O, Hashim R, Ahmad A (2010) Adsorption ofmethylene blue on low-cost adsorbents: a review. J Hazard Mater177:70–80
Rai HS, Bhattacharyya MS, Singh J, Bansal TK, Vats P, Banerjee UC(2005) Removal of dyes from the effluent of textile and dyestuffmanufacturing industry: a review of emerging techniques with ref-erence to biological treatment. Crit Rev Environ Sci Technol 35:219–238
Rajaguru P, Vidya L, Baskarasethupathi B, Kumar PA, Palanivel M,Kalaiselvi K (2002) Genotoxicity evaluation of polluted groundwater in human peripheral blood lymphocytes using the comet as-say. Mutat Res/Genet Toxicol Environm Mutagen 517:29–37
Ramalho PA, Cardoso MH, Cavaco-Paulo A, Ramalho MT (2004)Characterization of azo reduction activity in a novel ascomyceteyeast strain. Appl Environ Microbiol 70:2279–2288
Ramya M, Anusha B, Kalavathy S, Devilaksmi S (2007)Biodecolorization and biodegradation of reactive blue byAspergillus sp. Afr J Biotechnol 6:1441–1445
Robinson T, McMullan G, Marchant R, Nigam P (2001) Remediation ofdyes in textile effluent: a critical review on current treatment tech-nologies with a proposed alternative. Bioresour Technol 77:247–255
Roy U,Manna S, Sengupta S, Das P, Datta S, Mukhopadhyay A, BhowalA (2018) Dye removal using microbial biosorbents. In: Green ad-sorbents for pollutant removal. Springer, pp 253–280
Ryan A, Wang CJ, Laurieri N, Westwood I, Sim E (2010) Reactionmechanism of azoreductases suggests convergent evolution withquinone oxidoreductases. Protein Cell 1:780–790
Saha AK, Sultana N, Mohanta MK, Mandald A, Haquee M (2017)Identification and characterization of azo dye decolourizing bacterialstrains, Alcaligenes faecalis E5.Cd and A. faecalis Fal.3 isolatedfrom textile effluents. Am Sci Res J Eng Technol Sci 3:163–175
Sahasrabudhe MM, Saratale RG, Saratale GD, Pathade GR (2014)Decolorization and detoxification of sulfonated toxic diazo dye CIdirect red 81 by Enterococcus faecalis YZ 66. J Environ Health SciEng 12:151
Sandesh K, Kumar G, Chidananda B, Ujwal P (2019) Optimization ofdirect blue-14 dye degradation by Bacillus fermus (Kx898362) analkaliphilic plant endophyte and assessment of degraded metabolitetoxicity. J Hazard Mater 364:742–751
Sandhya S, Sarayu K, Swaminathan K (2008) Determination of kineticconstants of hybrid textile wastewater treatment system. BioresourTechnol 99:5793–5797
Saratale GD, Kalme SD, Govindwar SP (2006) Decolorisation of textiledyes byAspergillus ochraceus (NCIM-1146). Indian J Biotechnol 5:407–410
Saratale RG, Saratale GD, Chang JS, Govindwar SP (2009a) Ecofriendlydegradation of sulphonated diazo dye reactive green 19A using
Int Microbiol

Micrococcus glutamicus NCIM 2168. Bioresour Technol 100:3897–3905
Saratale RG, Saratale GD, Kalyani DC, Chang JS, Govindwar SP(2009b) Enhanced decolorization and biodegradation of textile azodye scarlet R by using developed microbial consortium-GR.Bioresour Technol 100:2493
Saratale RG, Saratale GD, Chang JS, Govindwar SP (2009c)Decolorization and biodegradation of textile dye navy blue HERby Trichosporon beigelii NCIM-3326. J Hazard Mater 166:1421
Saratale RG, Saratale GD, Chang JS, Govindwar SP (2010)Decolorization and biodegradation of reactive dyes and dye waste-water by a developed bacterial consortium. Biodegradation 21:999–1015
Sarayu K, Sandhya S (2010) Aerobic biodegradation pathway forremazol orange by Pseudomonas aeruginosa. Appl BiochemBiotechnol 160:1241–1253
Sarkar S, Banerjee A, Halder U, Biswas R, Bandopadhyay R (2017)Degradation of synthetic azo dyes of textile industry: a sustainableapproach using microbial enzymes. Water Conserv Sci Eng 2:121–131
Şen S, Demirer GN (2003) Anaerobic treatment of real textile wastewaterwith a fluidized bed reactor. Water Res 37:1868–1878
Sen SK, Raut S, Bandyopadhyay P, Raut S (2016) Fungal decolourationand degradation of azo dyes: a review. Fungal Biol Rev 30:112–133
Senan RC, Abraham TE (2004) Bioremediation of textile azo dyes byaerobic bacterial consortium aerobic degradation of selected azodyes by bacterial consortium. Biodegradation 15:275–280
Shah MP (2014) Environmental bioremediation: a low cost nature’s nat-ural biotechnology for environmental clean-up. J Pet EnvironBiotechnol 5:1–12
Sheth NT, Dave SR (2009) Optimization for enhanced decolorization ofReactive Red BS C.I. 111 by Pseudomonas aeruginosa NGKCTS.Biodegradation 20:827–836
Singh P, Sanghi R, Pandey A, Iyengar L (2007) Decolourization andpartial degradation of monoazo dyes in sequential fixed film anaer-obic batch reactor (SFABR). Bioresour Technol 98:2053–2056
Singh S, Chatterji S, Nandini PT, Prasad ASA, Rao KVB (2015)Biodegradation of azo dye Direct Orange 16 byMicrococcus luteusstrain SSN2. Int J Environ Sci Technol 12:2161–2168
Song Z, Song L, Shao Y, Tan L (2018) Degradation and detoxification ofazo dyes by a salt-tolerant yeast Cyberlindnera samutprakarnensisS4 under high-salt conditions. World J Microbiol Biotechnol 34:131
Stolz A (2001) Basic and applied aspects in the microbial degradation ofazo dyes. Appl Microbiol Biotechnol 56:69–80
Swaminathan K, Sandhya S, Sophia AC, Pachhade K, SubrahmanyamYV (2003) Decolorization and degradation of H-acid and other dyesusing ferrous-hydrogen peroxide system. Chemosphere 50:619–625
Tony BD, Goyal D, Khanna S (2009a) Decolorization of textile azo dyesby aerobic bacterial consortium. Int Biodeterior Biodegradation 63:462
Tony BD, Goyal D, Khanna S (2009b) Decolorization of direct red 28 bymixed bacterial culture in an Up-Flow immobilized bioreactor. J IndMicrobiol Biotechnol 36:955
Van der Zee FP, Villaverde S (2005) Combined anaerobic-aerobic treat-ment of azo dyes-a short review of bioreactor studies. Water Res 39:1425–1440
Van der Zee FP, Lettinga G, Field JA (2001) Azo dye decolourisation byanaerobic granular sludge. Chemosphere 44:1169–1176
Verma P, Madamwar D (2003) Decolorization of synthetic dyes by anewly isolated strain of Serratia maerascens. World J MicrobiolBiotechnol 19:615–618
Verma K, Saha G, Kundu LM, Dubey VK (2019) Biochemical charac-terization of a stable azoreductase enzyme from Chromobacteriumviolaceum: application in industrial effluent dye degradation. Int JBiol Macromol 121:1011–1018
Vijayaraghavan K, Yun YS (2008) Biosorption of CI reactive black 5from aqueous solution using acid-treated biomass of brown seaweedLaminaria sp. Dyes Pigments 76:726–732
Vikrant K, Giri BS, Raza N, Roy K, Kim KH, Rai BN, Singh RS (2018)Recent advancements in bioremediation of dye: current status andchallenges. Bioresour Technol 253:355–367
Waghmode TR, Kurade MB, Khandare RV, Govindwar SP (2011) Asequential aerobic/microaerophilic decolorization of sulfonatedmono azo dye Golden Yellow HER by microbial consortium GG–BL. Int Biodeter Biodegrad 65:1024–1034
Wang ZW, Liang JS, Liang Y (2013) Decolorization of reactive black 5by a newly isolated bacterium Bacillus sp. YZU1. Int BiodeteriorBiodegrad 76:41–48
Wang P-T, Song Y-H, Fan H-C, Yu L (2018) Bioreduction of azo dyeswas enhanced by in-situ biogenic palladium nanoparticles.Bioresour Technol 266:176–180
Wuhrmann K, Mechsner K, Kappeler TH (1980) Investigation on ratedetermining factors in the microbial reduction of azo dyes. ApplMicrobiol Biotechnol 9:325–338
Yan H, Pan G (2004) Increase in biodegradation of dimethyl phthalate byClosterium lunula using inorganic carbon. Chemosphere 55:1281–1285
Yang Q, Yang M, Pritsch K, Yediler A, Hagn A, Schloter M, Kettrup A(2003) Decolorization of synthetic dyes and production ofmanganese-dependent peroxidase by new fungal isolates.Biotechnol Lett 25:709–713
Yu J, Wang X, Yue PL (2001) Optimal decolorization and kinetic model-ing of synthetic dyes by Pseudomonas strains. Water Res 35:3579–3586
Zahran SA, Ali-Tammam M, Hashem AM, Aziz RK, Ali AE (2019)Azoreductase activity of dye-decolorizing bacteria isolated fromthe human gut microbiota. Sci Rep 9:5508
Zhang F, Yediler A, Liang X, Kettrup A (2004) Effects of dye additiveson the ozonation process and oxidation by products: a comparativestudy using hydrolysed CI Reactive red 120. Dyes Pigments 60:1–7
Zhao G, Jiang L, He Y, Li J, Dong H, Wang X, Hu W (2011) Sulfonatedgraphene for persistent aromatic pollutant management. Adv Mater23:3959–3963
Zhou X, Xiang X (2013) Effect of different plants on azo-dye wastewaterbio-decolorization. Procedia Environ Sci 18:540–546
Zimmermann T, Gasser F, Kulla H, Leisinger T (1984) Comparison oftwo bacterial azoreductases acquired during adaptation to growth onazo dyes. Arch Microbiol 138:37
Publisher’s note Springer Nature remains neutral with regard to jurisdic-tional claims in published maps and institutional affiliations.
Int Microbiol

Clarity - Chromatography SWDataApex 2006
www.dataapex.com
Chromatogram Info:
File Name : C:\CLARITY\WORK1\DATA\C1.PRM File Created : 6/5/2017 3:14:57 PM
Origin : Acquired Acquired Date : 6/5/2017 3:14:57 PM
Project : c:\Clarity\Projects\Work1.PRJ By : Administrator
Printed Version Info:
Printed Version : 6/5/2017 3:14:57 PM Printed Date : 6/5/2017 3:15:57 PM
Report Sty le : c:\Clarity\Common\Chromatogram.sty By : Administrator
Calibration File : None
Sample Info:
Sample ID : c1 Amount : 0
Sample : secondary metabolite ISTD Amount : 0
Inj. Volume [ml] : 20 Dilution : 1
Method : Bioactive secondary metabolite By : Administrator
Description : Bioactive secondary metabolites
Created : 1/17/2013 10:08 PM Modified : 6/5/2017 3:14 PM
Column : RPC18 Detection : UV254
Mobile Phase : Methanol Temperature : Ambiant
Flow Rate : 1 ml/min Pressure :
Note :
Autostop : 15.00 min External Start : Start - Stop, Down
Detector 1 : Signal 1 Range 1 : Bipolar, 1250 mV, 12.5 Samp. per Sec.
Subtraction Chromatogram : (None) Matching : No Change
Base : Not Used Calibration File : None Calculation : Uncal
Scale Factor : Not Used Units After Scaling : Not Used Uncal. Response : 0
Unretained Time : 0.00 min Column Length : 50.00 mm Column Calc. : From Width at 50% of Height
Result Table Reports : All Peaks Hide ISTD Peak : Enabled
[min.]Time
0 2 4 6 8 10 12 14
[mV]
Volta
ge
0
50
100
150
[%]
Components
0
20
40
60
80
100
0.72
1.22
1.
39
1.80
2.60
2.
88
5.00
6.70
7.17
7.
52
9.65
10.3
2
13.0
8
13.6
2
14.1
1 14
.38
14.4
6
6/5/2017 3:15 PM Page 1 of 2Chromatogram C:\CLARITY\WORK1\DATA\C1.PRM

Result Table (Uncal - C1)
Reten. Time[min]
Area[mV.s]
Height[mV]
Area[%]
Height[%]
W05[min]
1 0.720 41.554 1.313 0.8 0.5 0.72
2 1.224 12.926 1.366 0.2 0.6 0.17
3 1.388 24.998 1.720 0.5 0.7 0.28
4 1.804 519.123 22.770 9.8 9.4 0.31
5 2.596 73.253 6.446 1.4 2.7 0.20
6 2.876 2990.816 154.332 56.2 63.6 0.22
7 4.996 901.448 38.401 16.9 15.8 0.21
8 6.696 36.854 2.595 0.7 1.1 0.27
9 7.168 44.532 2.561 0.8 1.1 0.35
10 7.524 183.586 3.115 3.4 1.3 1.25
11 9.648 146.977 2.329 2.8 1.0 1.27
12 10.324 307.997 2.609 5.8 1.1 2.73
13 13.080 7.618 0.542 0.1 0.2 0.13
14 13.624 2.008 0.152 0.0 0.1 0.02
15 14.112 14.342 0.882 0.3 0.4 0.25
16 14.380 6.662 0.702 0.1 0.3 0.18
17 14.460 7.273 0.727 0.1 0.3 0.21
Total 5321.967 242.562 100.0 100.0
6/5/2017 3:15 PM Page 2 of 2Chromatogram C:\CLARITY\WORK1\DATA\C1.PRM

Clarity - Chromatography SWDataApex 2006
www.dataapex.com
Chromatogram Info:
File Name : C:\CLARITY\WORK1\DATA\1B(AGAIN).PRM File Created : 6/5/2017 1:37:08 PM
Origin : Acquired Acquired Date : 6/5/2017 1:37:08 PM
Project : c:\Clarity\Projects\Work1.PRJ By : Administrator
Printed Version Info:
Printed Version : 6/5/2017 1:37:08 PM Printed Date : 6/5/2017 1:38:24 PM
Report Sty le : c:\Clarity\Common\Chromatogram.sty By : Administrator
Calibration File : None
Sample Info:
Sample ID : 1b(again) Amount : 0
Sample : secondary metabolite ISTD Amount : 0
Inj. Volume [ml] : 20 Dilution : 1
Method : Bioactive secondary metabolite By : Administrator
Description : Bioactive secondary metabolites
Created : 1/17/2013 10:08 PM Modified : 6/5/2017 1:37 PM
Column : RPC18 Detection : UV254
Mobile Phase : Methanol Temperature : Ambiant
Flow Rate : 1 ml/min Pressure :
Note :
Autostop : 15.00 min External Start : Start - Stop, Down
Detector 1 : Signal 1 Range 1 : Bipolar, 1250 mV, 12.5 Samp. per Sec.
Subtraction Chromatogram : (None) Matching : No Change
Base : Not Used Calibration File : None Calculation : Uncal
Scale Factor : Not Used Units After Scaling : Not Used Uncal. Response : 0
Unretained Time : 0.00 min Column Length : 50.00 mm Column Calc. : From Width at 50% of Height
Result Table Reports : All Peaks Hide ISTD Peak : Enabled
[min.]Time
0 2 4 6 8 10 12 14
[mV]
Volta
ge
0
200
400
600
800
[%]
Components
0
20
40
60
80
100
0.76
1.97
2.92
4.99
5.39
7.62
7.
93
8.23
8.89
9.77
11.3
5
11.7
4 12
.05
12.6
7
13.3
8
14.9
6
6/5/2017 1:38 PM Page 1 of 2Chromatogram C:\CLARITY\WORK1\DATA\1B(AGAIN).PRM

Result Table (Uncal - 1B(AGAIN))
Reten. Time[min]
Area[mV.s]
Height[mV]
Area[%]
Height[%]
W05[min]
1 0.760 29.637 1.278 0.2 0.1 0.43
2 1.972 1034.413 47.013 5.9 5.1 0.37
3 2.916 14192.904 774.317 80.4 84.7 0.24
4 4.988 137.866 6.807 0.8 0.7 0.43
5 5.392 195.871 3.930 1.1 0.4 1.00
6 7.620 230.357 4.166 1.3 0.5 1.32
7 7.928 105.543 4.666 0.6 0.5 0.41
8 8.228 214.134 16.786 1.2 1.8 0.21
9 8.888 600.227 23.048 3.4 2.5 0.48
10 9.772 599.731 23.076 3.4 2.5 0.45
11 11.348 144.130 2.287 0.8 0.3 1.18
12 11.736 55.870 2.390 0.3 0.3 0.47
13 12.052 39.800 2.134 0.2 0.2 0.36
14 12.672 32.671 1.570 0.2 0.2 0.42
15 13.384 33.119 0.934 0.2 0.1 0.51
16 14.964 0.317 0.100 0.0 0.0 0.02
Total 17646.591 914.503 100.0 100.0
6/5/2017 1:38 PM Page 2 of 2Chromatogram C:\CLARITY\WORK1\DATA\1B(AGAIN).PRM

Clarity - Chromatography SWDataApex 2006
www.dataapex.com
Chromatogram Info:
File Name : c:\Clarity\Work1\DATA\00000003.PRM File Created : 3/15/2018 3:45:01 PM
Origin : Acquired Acquired Date : 3/15/2018 3:45:01 PM
Project : c:\Clarity\Projects\Work1.PRJ By : Administrator
Printed Version Info:
Printed Version : 3/15/2018 3:45:01 PM Printed Date : 3/15/2018 3:54:22 PM
Report Sty le : c:\Clarity\Common\Chromatogram.sty By : Administrator
Calibration File : None
Sample Info:
Sample ID : c1 Amount : 0
Sample : Secondary metbolites ISTD Amount : 0
Inj. Volume [ml] : 20 Dilution : 1
Method : Bioactive secondary metabolite By : Administrator
Description : Bioactive secondary metabolites
Created : 1/17/2013 10:08 PM Modified : 3/15/2018 3:45 PM
Column : RPC18 Detection : UV254
Mobile Phase : Methanol Temperature : Ambiant
Flow Rate : 1 ml/min Pressure :
Note :
Autostop : 15.00 min External Start : Start - Stop, Down
Detector 1 : Signal 1 Range 1 : Bipolar, 1250 mV, 12.5 Samp. per Sec.
Subtraction Chromatogram : (None) Matching : No Change
Base : Not Used Calibration File : None Calculation : Uncal
Scale Factor : Not Used Units After Scaling : Not Used Uncal. Response : 0
Unretained Time : 0.00 min Column Length : 50.00 mm Column Calc. : From Width at 50% of Height
Result Table Reports : All Peaks Hide ISTD Peak : Enabled
[min.]Time
0 2 4 6 8 10 12 14
[V]
Volta
ge
-1.2
-1.1
-1.0
-0.9
-0.8[%]
Components
0
20
40
60
80
100
0.19
0.
42
0.57
0.
72
0.85
0.
98
1.17
1.
34
1.70
2.11
3.01
4.32
4.
61
4.75
4.
98
5.32
5.
68
5.94
6.
27
6.39
6.78
7.
03
7.18
7.64
7.
93
8.21
8.
45
8.58
8.
82
9.00
9.
09
9.41
9.
57
9.79
10
.11
10.2
5 10
.36
10.5
6 10
.68
10.9
3 11
.09
11.2
6 11
.40
11.7
0 11
.97
12.0
6 12
.29
12.4
2 12
.65
12.8
1 13
.00
13.2
5 13
.40
13.6
6 13
.91
14.2
0 14
.34
14.5
1 14
.64
14.8
6
3/15/2018 3:54 PM Page 1 of 2Chromatogram c:\Clarity\Work1\DATA\00000003.PRM

Result Table (Uncal - 00000003)
Reten. Time[min]
Area[mV.s]
Height[mV]
Area[%]
Height[%]
W05[min]
1 0.092 4.156 0.913 0.0 0.1 0.08
2 0.188 3.362 0.777 0.0 0.1 0.08
3 0.416 21.076 2.393 0.2 0.4 0.10
4 0.568 9.349 1.724 0.1 0.3 0.11
5 0.724 3.944 0.792 0.0 0.1 0.10
6 0.848 4.724 1.012 0.0 0.2 0.09
7 0.984 13.676 1.757 0.1 0.3 0.14
8 1.168 10.305 1.890 0.1 0.3 0.09
9 1.336 15.821 1.699 0.1 0.3 0.17
10 1.700 47.680 4.475 0.4 0.7 0.20
11 2.108 1095.653 44.010 8.4 7.1 0.32
12 3.008 10337.866 420.250 79.7 68.0 0.31
13 4.324 158.295 10.878 1.2 1.8 0.28
14 4.608 75.943 8.285 0.6 1.3 0.18
15 4.748 69.444 6.924 0.5 1.1 0.20
16 4.976 45.506 5.066 0.4 0.8 0.16
17 5.316 137.392 6.902 1.1 1.1 0.39
18 5.684 26.921 4.054 0.2 0.7 0.13
19 5.936 76.910 4.839 0.6 0.8 0.30
20 6.268 10.467 1.851 0.1 0.3 0.12
21 6.388 47.338 2.979 0.4 0.5 0.34
22 6.776 33.193 2.809 0.3 0.5 0.23
23 7.028 15.066 2.817 0.1 0.5 0.10
24 7.184 43.185 3.336 0.3 0.5 0.27
25 7.636 55.355 2.885 0.4 0.5 0.42
26 7.928 30.346 2.726 0.2 0.4 0.22
27 8.212 36.556 3.382 0.3 0.5 0.21
28 8.448 13.708 2.200 0.1 0.4 0.12
29 8.584 15.529 2.335 0.1 0.4 0.13
30 8.824 25.314 2.911 0.2 0.5 0.17
31 9.004 13.891 2.387 0.1 0.4 0.11
32 9.092 26.553 2.917 0.2 0.5 0.18
33 9.412 27.437 2.252 0.2 0.4 0.24
34 9.568 14.008 2.134 0.1 0.3 0.13
35 9.792 20.859 2.317 0.2 0.4 0.18
36 10.108 19.996 1.398 0.2 0.2 0.29
37 10.252 7.522 1.380 0.1 0.2 0.10
38 10.360 12.742 1.697 0.1 0.3 0.14
39 10.564 7.284 1.474 0.1 0.2 0.09
40 10.684 26.651 2.100 0.2 0.3 0.23
41 10.932 5.740 1.074 0.0 0.2 0.10
42 11.092 16.340 2.554 0.1 0.4 0.11
43 11.260 6.892 1.314 0.1 0.2 0.09
44 11.400 25.747 2.508 0.2 0.4 0.19
45 11.704 17.646 1.684 0.1 0.3 0.17
46 11.968 7.621 1.287 0.1 0.2 0.11
47 12.060 13.091 1.966 0.1 0.3 0.12
48 12.292 9.039 1.226 0.1 0.2 0.12
49 12.420 13.665 1.631 0.1 0.3 0.16
50 12.652 15.619 2.301 0.1 0.4 0.12
51 12.812 14.150 1.840 0.1 0.3 0.15
52 13.004 13.133 1.990 0.1 0.3 0.11
53 13.248 15.762 2.297 0.1 0.4 0.12
54 13.404 13.476 1.752 0.1 0.3 0.15
55 13.660 28.255 2.659 0.2 0.4 0.20
56 13.908 36.171 2.542 0.3 0.4 0.28
57 14.204 11.600 1.647 0.1 0.3 0.14
58 14.336 9.066 1.318 0.1 0.2 0.14
59 14.508 12.811 2.007 0.1 0.3 0.12
60 14.644 18.821 1.785 0.1 0.3 0.20
61 14.856 12.511 1.954 0.1 0.3 0.10
Total 12978.180 618.262 100.0 100.0
3/15/2018 3:54 PM Page 2 of 2Chromatogram c:\Clarity\Work1\DATA\00000003.PRM

Clarity - Chromatography SWDataApex 2006
www.dataapex.com
Chromatogram Info:
File Name : C:\CLARITY\WORK1\DATA\2P.PRM File Created : 6/5/2017 2:05:22 PM
Origin : Acquired Acquired Date : 6/5/2017 2:05:22 PM
Project : c:\Clarity\Projects\Work1.PRJ By : Administrator
Printed Version Info:
Printed Version : 6/5/2017 2:05:22 PM Printed Date : 6/5/2017 3:16:20 PM
Report Sty le : c:\Clarity\Common\Chromatogram.sty By : Administrator
Calibration File : None
Sample Info:
Sample ID : 2p Amount : 0
Sample : secondary metabolite ISTD Amount : 0
Inj. Volume [ml] : 20 Dilution : 1
Method : Bioactive secondary metabolite By : Administrator
Description : Bioactive secondary metabolites
Created : 1/17/2013 10:08 PM Modified : 6/5/2017 2:05 PM
Column : RPC18 Detection : UV254
Mobile Phase : Methanol Temperature : Ambiant
Flow Rate : 1 ml/min Pressure :
Note :
Autostop : 15.00 min External Start : Start - Stop, Down
Detector 1 : Signal 1 Range 1 : Bipolar, 1250 mV, 12.5 Samp. per Sec.
Subtraction Chromatogram : (None) Matching : No Change
Base : Not Used Calibration File : None Calculation : Uncal
Scale Factor : Not Used Units After Scaling : Not Used Uncal. Response : 0
Unretained Time : 0.00 min Column Length : 50.00 mm Column Calc. : From Width at 50% of Height
Result Table Reports : All Peaks Hide ISTD Peak : Enabled
[min.]Time
0 2 4 6 8 10 12 14
[mV]
Volta
ge
0
50
100
150
200
250
300
[%]
Components
0
20
40
60
80
100
0.36
0.82
1.75
1.92
2.61
2.
89
4.62
4.86
6.72
7.70
8.48
10.2
6
10.8
4 10
.95
12.7
2
13.2
2
14.0
7 14
.38
14.9
6
6/5/2017 3:16 PM Page 1 of 2Chromatogram C:\CLARITY\WORK1\DATA\2P.PRM

Result Table (Uncal - 2P)
Reten. Time[min]
Area[mV.s]
Height[mV]
Area[%]
Height[%]
W05[min]
1 0.364 6.867 0.515 0.1 0.1 0.07
2 0.820 4.026 0.640 0.1 0.2 0.08
3 1.748 42.660 1.135 0.8 0.3 0.59
4 1.916 318.113 19.911 6.0 5.5 0.17
5 2.612 46.247 4.104 0.9 1.1 0.21
6 2.892 4224.109 294.905 79.1 81.7 0.17
7 4.624 13.761 2.068 0.3 0.6 0.13
8 4.864 492.202 29.676 9.2 8.2 0.19
9 6.724 8.834 0.586 0.2 0.2 0.15
10 7.696 33.966 0.968 0.6 0.3 0.48
11 8.476 10.858 0.581 0.2 0.2 0.14
12 10.260 45.171 0.993 0.8 0.3 0.95
13 10.844 15.934 1.170 0.3 0.3 0.23
14 10.952 28.129 0.943 0.5 0.3 0.16
15 12.716 10.088 0.744 0.2 0.2 0.22
16 13.224 2.844 0.579 0.1 0.2 0.08
17 14.072 25.697 0.572 0.5 0.2 0.07
18 14.384 9.862 0.529 0.2 0.1 0.23
19 14.960 3.128 0.190 0.1 0.1 0.04
Total 5342.497 360.810 100.0 100.0
6/5/2017 3:16 PM Page 2 of 2Chromatogram C:\CLARITY\WORK1\DATA\2P.PRM

Clarity - Chromatography SWDataApex 2006
www.dataapex.com
Chromatogram Info:
File Name : C:\CLARITY\WORK1\DATA\4V.PRM File Created : 6/5/2017 2:48:21 PM
Origin : Acquired Acquired Date : 6/5/2017 2:48:21 PM
Project : c:\Clarity\Projects\Work1.PRJ By : Administrator
Printed Version Info:
Printed Version : 6/5/2017 2:48:21 PM Printed Date : 6/5/2017 3:16:08 PM
Report Sty le : c:\Clarity\Common\Chromatogram.sty By : Administrator
Calibration File : None
Sample Info:
Sample ID : 4 Amount : 0
Sample : secondary metabolite ISTD Amount : 0
Inj. Volume [ml] : 20 Dilution : 1
Method : Bioactive secondary metabolite By : Administrator
Description : Bioactive secondary metabolites
Created : 1/17/2013 10:08 PM Modified : 6/5/2017 2:48 PM
Column : RPC18 Detection : UV254
Mobile Phase : Methanol Temperature : Ambiant
Flow Rate : 1 ml/min Pressure :
Note :
Autostop : 15.00 min External Start : Start - Stop, Down
Detector 1 : Signal 1 Range 1 : Bipolar, 1250 mV, 12.5 Samp. per Sec.
Subtraction Chromatogram : (None) Matching : No Change
Base : Not Used Calibration File : None Calculation : Uncal
Scale Factor : Not Used Units After Scaling : Not Used Uncal. Response : 0
Unretained Time : 0.00 min Column Length : 50.00 mm Column Calc. : From Width at 50% of Height
Result Table Reports : All Peaks Hide ISTD Peak : Enabled
[min.]Time
0 2 4 6 8 10 12 14
[mV]
Volta
ge
0
100
200
300
400
500
[%]
Components
0
20
40
60
80
100
0.24
0.90
1.50
1.
56
1.94
2.91
4.92
6.37
6.95
7.
30
8.27
9.29
10.3
1 10
.51
10.6
3 10
.80
11.3
2
12.0
3
12.5
3
13.7
3
6/5/2017 3:16 PM Page 1 of 2Chromatogram C:\CLARITY\WORK1\DATA\4V.PRM

Result Table (Uncal - 4V)
Reten. Time[min]
Area[mV.s]
Height[mV]
Area[%]
Height[%]
W05[min]
1 0.244 3.514 0.863 0.0 0.1 0.07
2 0.896 48.174 1.822 0.4 0.3 0.24
3 1.496 33.227 1.778 0.3 0.3 0.38
4 1.556 17.976 2.042 0.2 0.3 0.16
5 1.940 560.499 27.988 4.8 4.0 0.26
6 2.912 8506.937 521.400 72.2 75.1 0.20
7 4.916 1337.122 78.881 11.3 11.4 0.19
8 6.368 266.880 18.990 2.3 2.7 0.23
9 6.952 34.779 1.713 0.3 0.2 0.35
10 7.304 18.994 1.226 0.2 0.2 0.12
11 8.268 45.738 1.212 0.4 0.2 0.61
12 9.292 17.250 1.196 0.1 0.2 0.12
13 10.312 35.784 1.112 0.3 0.2 0.64
14 10.508 15.214 1.504 0.1 0.2 0.19
15 10.628 17.161 1.735 0.1 0.2 0.20
16 10.800 46.550 2.939 0.4 0.4 0.13
17 11.320 23.207 1.937 0.2 0.3 0.14
18 12.028 70.256 1.733 0.6 0.2 0.81
19 12.532 63.801 2.204 0.5 0.3 0.75
20 13.732 619.199 21.935 5.3 3.2 0.50
Total 11782.264 694.211 100.0 100.0
6/5/2017 3:16 PM Page 2 of 2Chromatogram C:\CLARITY\WORK1\DATA\4V.PRM

Clarity - Chromatography SWDataApex 2006
www.dataapex.com
Chromatogram Info:
File Name : C:\CLARITY\WORK1\DATA\3C.PRM File Created : 2/23/2017 1:24:21 PM
Origin : Acquired Acquired Date : 2/23/2017 1:24:21 PM
Project : c:\Clarity\Projects\Work1.PRJ By : Administrator
Printed Version Info:
Printed Version : 2/23/2017 1:24:21 PM Printed Date : 2/24/2017 3:17:29 PM
Report Sty le : c:\Clarity\Common\Chromatogram.sty By : Administrator
Calibration File : None
Sample Info:
Sample ID : 3c Amount : 0
Sample : Bioactive Secondary Metabolites ISTD Amount : 0
Inj. Volume [ml] : 20 Dilution : 1
Method : Bioactive secondary metabolite By : Administrator
Description : Bioactive secondary metabolites
Created : 1/17/2013 10:08 PM Modified : 2/23/2017 1:24 PM
Column : RPC18 Detection : UV254
Mobile Phase : Methanol Temperature : Ambiant
Flow Rate : 1 ml/min Pressure :
Note :
Autostop : 15.00 min External Start : Start - Stop, Down
Detector 1 : Signal 1 Range 1 : Bipolar, 1250 mV, 12.5 Samp. per Sec.
Subtraction Chromatogram : (None) Matching : No Change
Base : Not Used Calibration File : None Calculation : Uncal
Scale Factor : Not Used Units After Scaling : Not Used Uncal. Response : 0
Unretained Time : 0.00 min Column Length : 50.00 mm Column Calc. : From Width at 50% of Height
Result Table Reports : All Peaks Hide ISTD Peak : Enabled
[min.]Time
0 2 4 6 8 10 12 14
[V]
Volta
ge
0.0
0.2
0.4
0.6
0.8
1.0
[%]
Components
0
20
40
60
80
100
0.44
0.
72
1.90
1.
99
2.30
2.95
3.76
4.22
5.03
5.
18
5.53
5.
84
6.72
7.32
7.
40
7.65
7.
98
8.24
8.
50
10.5
2 10
.62
12.8
0
13.6
9 13
.82
14.7
2
2/24/2017 3:17 PM Page 1 of 2Chromatogram C:\CLARITY\WORK1\DATA\3C.PRM

Result Table (Uncal - 3C)
Reten. Time[min]
Area[mV.s]
Height[mV]
Area[%]
Height[%]
W05[min]
1 0.128 4.506 0.382 0.0 0.0 0.13
2 0.436 2.318 0.362 0.0 0.0 0.13
3 0.716 24.661 1.246 0.2 0.1 0.30
4 1.896 35.679 4.975 0.3 0.5 0.12
5 1.992 243.322 27.524 2.3 2.6 0.14
6 2.300 292.056 17.784 2.7 1.7 0.27
7 2.948 9384.845 976.853 88.2 91.9 0.14
8 3.756 191.200 12.755 1.8 1.2 0.15
9 4.224 68.468 3.468 0.6 0.3 0.31
10 5.032 24.811 1.623 0.2 0.2 0.34
11 5.184 25.318 1.786 0.2 0.2 0.27
12 5.532 27.882 1.443 0.3 0.1 0.36
13 5.836 53.809 1.818 0.5 0.2 0.47
14 6.720 40.995 1.674 0.4 0.2 0.35
15 7.320 2.265 0.365 0.0 0.0 0.05
16 7.396 3.440 0.591 0.0 0.1 0.09
17 7.648 3.034 0.384 0.0 0.0 0.08
18 7.976 7.823 0.769 0.1 0.1 0.20
19 8.240 13.618 0.905 0.1 0.1 0.30
20 8.504 96.406 1.689 0.9 0.2 0.44
21 10.524 3.199 0.357 0.0 0.0 0.06
22 10.624 15.876 1.118 0.1 0.1 0.11
23 12.804 13.699 0.350 0.1 0.0 0.42
24 13.688 4.042 0.397 0.0 0.0 0.23
25 13.824 9.248 1.428 0.1 0.1 0.09
26 14.720 41.933 1.313 0.4 0.1 0.56
Total 10634.453 1063.358 100.0 100.0
2/24/2017 3:17 PM Page 2 of 2Chromatogram C:\CLARITY\WORK1\DATA\3C.PRM

Clarity - Chromatography SWDataApex 2006
www.dataapex.com
Chromatogram Info:
File Name : C:\CLARITY\WORK1\DATA\3D.PRM File Created : 2/23/2017 1:03:59 PM
Origin : Acquired Acquired Date : 2/23/2017 1:03:58 PM
Project : c:\Clarity\Projects\Work1.PRJ By : Administrator
Printed Version Info:
Printed Version : 2/23/2017 1:03:59 PM Printed Date : 2/24/2017 3:17:58 PM
Report Sty le : c:\Clarity\Common\Chromatogram.sty By : Administrator
Calibration File : None
Sample Info:
Sample ID : 3d Amount : 0
Sample : Bioactive Secondary Metabolites ISTD Amount : 0
Inj. Volume [ml] : 20 Dilution : 1
Method : Bioactive secondary metabolite By : Administrator
Description : Bioactive secondary metabolites
Created : 1/17/2013 10:08 PM Modified : 2/23/2017 1:03 PM
Column : RPC18 Detection : UV254
Mobile Phase : Methanol Temperature : Ambiant
Flow Rate : 1 ml/min Pressure :
Note :
Autostop : 15.00 min External Start : Start - Stop, Down
Detector 1 : Signal 1 Range 1 : Bipolar, 1250 mV, 12.5 Samp. per Sec.
Subtraction Chromatogram : (None) Matching : No Change
Base : Not Used Calibration File : None Calculation : Uncal
Scale Factor : Not Used Units After Scaling : Not Used Uncal. Response : 0
Unretained Time : 0.00 min Column Length : 50.00 mm Column Calc. : From Width at 50% of Height
Result Table Reports : All Peaks Hide ISTD Peak : Enabled
[min.]Time
0 2 4 6 8 10 12 14
[mV]
Volta
ge
0
100
200
300
400
500
600
700[%]
Components
0
20
40
60
80
100
0.99
1.93
2.
09
2.95
3.75
4.70
5.18
7.28
7.91
8.65
9.32
12.1
7
13.7
4
14.6
8
2/24/2017 3:17 PM Page 1 of 2Chromatogram C:\CLARITY\WORK1\DATA\3D.PRM

Result Table (Uncal - 3D)
Reten. Time[min]
Area[mV.s]
Height[mV]
Area[%]
Height[%]
W05[min]
1 0.992 5.022 0.950 0.0 0.1 0.09
2 1.928 142.454 13.261 1.3 1.6 0.18
3 2.092 1378.844 122.456 13.0 15.0 0.10
4 2.952 8328.501 654.345 78.3 80.2 0.18
5 3.748 279.502 10.351 2.6 1.3 0.25
6 4.700 51.554 2.939 0.5 0.4 0.40
7 5.176 67.574 3.389 0.6 0.4 0.26
8 7.276 50.320 1.418 0.5 0.2 0.88
9 7.912 58.751 1.479 0.6 0.2 0.77
10 8.648 52.843 1.714 0.5 0.2 0.62
11 9.324 96.503 1.713 0.9 0.2 0.66
12 12.172 73.807 0.933 0.7 0.1 0.70
13 13.736 31.109 0.920 0.3 0.1 0.43
14 14.684 17.389 0.496 0.2 0.1 0.50
Total 10634.175 816.364 100.0 100.0
2/24/2017 3:17 PM Page 2 of 2Chromatogram C:\CLARITY\WORK1\DATA\3D.PRM